Cytotoxic T-Lymphocyte Associated Antigen 4 Gene Polymorphisms and Autoimmune Thyroid Disease: A...
54
Cytotoxic T-Lymphocyte Associated Antigen 4 Gene Polymorphisms and Autoimmune Thyroid Disease: A Meta-Analysis Fotini K. Kavvoura, Takashi Akamizu, Takuya Awata, Yoshiyuki Ban, Dimitry A. Chistiakov, Irena Frydecka, Abbas Ghaderi, Stephen C. Gough, Yuji Hiromatsu, Rafal Ploski, Pei-Wen Wang, Yoshio Ban, Tomasz Bednarczuk, Emma I. Chistiakova, Marcin Chojm, Joanne M. Heward, Hitomi Hiratani, Suh-Hang Hank Juo, Lidia Karabon, Shigehiro Katayama, Susumu Kurihara, Rue-Tsuan Liu, Ikuyo Miyake, Gholam-Hossein R. Omrani, Edyta Pawlak, Matsuo Taniyama, Teruaki Tozaki, and John P. A. Ioannidis Clinical and Molecular Epidemiology Unit (F.K.K., J.P.A.I.), Department of Hygiene and Epidemiology, University of Ioannina School of Medicine, Ioannina 45110, Greece; Translational Research Center (T.Ak., H.H.), Kyoto University Hospital, Kyoto University School of Medicine, Kyoto, Japan; Division of Endocrinology and Diabetes (T.Aw., S.Ka., S.Ku.), Department of Medicine, Saitama Medical University, Saitama, Japan; Third Department of Internal Medicine (Yoshiy.B., Yoshio.B.), Showa University School of Medicine, Tokyo, Japan; Department of Pathology (D.A.C.), University of Pittsburgh Medical Center, Pittsburgh, Pennsylvania; Department of Hematology (I.F.), Bone Marrow Transplantation and Blood Neoplastic Diseases, Medical Academy, Wroclaw, Poland; Institute of Immunology and Experimental Therapy (I.F., L.K., E.P.), Polish Academy of Sciences, Wroclaw, Poland; Shiraz Institute for Cancer Research (A.G.), Medical School, Shiraz University of Medical Sciences, Shiraz, Iran; Institute of Biomedical Research (S.C.G., J.M.H.), Division of Medical Sciences, The Medical School, University of Birmingham, Birmingham, United Kingdom; Department of Endocrinology (Y.H., I.M.), Kurume University School of Medicine, Kurume, Fukuoka, Japan; Human Molecular Genetics Laboratory of the Department of Forensic Medicine (R.P., M.C.), Departments of Diabetology, Newborn Pathology and Birth Defects, of Medical Genetics, and of Endocrinology (T.B.), Medical University of Warsaw, Warsaw, Poland; Department of Internal Medicine (P.-W.W., R.- T.L.), Chang Gung Memorial Hospital-Kaohsiung Medical Center, Chang Gung University College of Medicine, Kaohsiung, Taiwan; Department of Endocrinology (T.B.), Medical Research Center, Polish Academy of Science, Warsaw, Poland; Department of Molecular Diagnostics (E.I.C.), National Research Center GosNIIgenetika, Moscow, Russia; Graduate Institute of Medical Genetics and Department of Clinical Research (S.-H.H.J.), Kaohsiung Medical University Hospital, Kaohsiung, Taiwan; Endocrine and Metabolism Research Center (G.-H.R.O.), Namazee Hospital, Shiraz, Iran; Division of Endocrinology and Metabolism (M.T.), Showa University Fujigaoka Hospital, Yokohama, Kanagawa-ken, Japan; Department of Medical Information (T.T.), Showa University School of Pharmaceutical Science, Tokyo, Japan; Biomedical Research Institute (J.P.A.I.), Foundation for Research and Technology-Hellas, Ioannina, Greece; and Institute for Clinical Research and Health Policy Studies (J.P.A.I.), Department of Medicine, Tufts-New England Medical Center, Tufts University School of Medicine, Boston, Massachusetts Context: Cytotoxic T-lymphocyte associated antigen 4 (CTLA-4) polymorphisms have been widely examined for their associations with autoimmune thyroid diseases [Graves’ disease (GD) and Hashimoto thyroiditis (HT)], but their relative population effect remains unclear. Objective: The aim was to generate large-scale evidence on whether the CTLA-4 polymorphisms (A49G and CT60) and haplotypes thereof increase the susceptibility to GD and/or HT. Design, Setting, and Participants: Meta-analyses of group-level data were reviewed from 32 (11,019 subjects) and 12 (4,479) published and unpublished studies for the association of the A49G polymor- phism with GD and HT, respectively (PubMed and HuGeNet search until July 2006). There were 15 (n 7246) and six (n 3086) studies available for the CT60 polymorphism, respectively. Meta-analyses of individual-level data from 10 (4906 subjects) and five (2386) collab- orating teams for GD and HT, respectively, were also reviewed. Main Outcome Measures: Association of gene variants and hap- lotypes with GD and HT was measured. Results: Group-level data suggested significant associations with GD and HT for both A49G [odds ratios 1.49 (P 6 10 14 ) and 1.29 (P 0.001) per G allele, respectively] and CT60 [1.45 (P 2 10 9 ) and 1.64 (P 0.003) per G allele, respectively]. Results were consistent between Asian and Caucasian descent subjects. Individual-level data showed that compared with the AA haplotype, the risk conferred by the GG haplotype was 1.49 (95% confidence interval 1.31,1.70) and 1.36 (95% confidence interval 1.16,1.59) for GD and HT, respectively. Data were consistent with a dose-response effect for the G allele of CT60. Conclusion: The CT60 polymorphism of CTLA-4 maps an important genetic determinant for the risk of both GD and HT across diverse populations. (J Clin Endocrinol Metab 92: 3162–3170, 2007) A UTOIMMUNE THYROID DISEASES (AITDs) are the most prevalent autoimmune disorders (1), affecting up to 5% of the general population (2). Graves’ disease (GD) and Hashimoto thyroiditis (HT), the two most common forms of AITD, and other autoimmune disorders such as type 1 diabetes mellitus and rheumatoid arthritis commonly cluster in the same families, and, thus, they may share some genetic background (3). Several genes have been proposed to be linked and/or associated with AITDs, but the extent of replication of these claims has been variable. The cytotoxic T-lymphocyte associated antigen 4 (CTLA-4) gene has been one of the most extensively studied loci in this regard, and considerable genetic and immunological evidence suggests that it may be important for autoimmunity. CTLA-4 is an First Published Online May 15, 2007 Abbreviations: AF, Attributable fraction; AITD, autoimmune thyroid disease; CI, confidence interval; CTLA-4, cytotoxic T-lymphocyte associated antigen 4; GD, Graves’ disease; HT, Hashimoto thyroiditis; HWE, Hardy- Weinberg equilibrium; LD, linkage disequilibrium; OR, odds ratio; SNP, single nucleotide polymorphism. JCEM is published monthly by The Endocrine Society (http://www. endo-society.org), the foremost professional society serving the endo- crine community. 0021-972X/07/$15.00/0 The Journal of Clinical Endocrinology & Metabolism 92(8):3162–3170 Printed in U.S.A. Copyright © 2007 by The Endocrine Society doi: 10.1210/jc.2007-0147 3162 at Univ of Ioannina Central Lib on September 12, 2007 jcem.endojournals.org Downloaded from
Transcript of Cytotoxic T-Lymphocyte Associated Antigen 4 Gene Polymorphisms and Autoimmune Thyroid Disease: A...

Cytotoxic T-Lymphocyte Associated Antigen 4 GenePolymorphisms and Autoimmune Thyroid Disease:A Meta-AnalysisFotini K. Kavvoura, Takashi Akamizu, Takuya Awata, Yoshiyuki Ban, Dimitry A. Chistiakov, Irena Frydecka,Abbas Ghaderi, Stephen C. Gough, Yuji Hiromatsu, Rafal Ploski, Pei-Wen Wang, Yoshio Ban,Tomasz Bednarczuk, Emma I. Chistiakova, Marcin Chojm, Joanne M. Heward, Hitomi Hiratani,Suh-Hang Hank Juo, Lidia Karabon, Shigehiro Katayama, Susumu Kurihara, Rue-Tsuan Liu, Ikuyo Miyake,Gholam-Hossein R. Omrani, Edyta Pawlak, Matsuo Taniyama, Teruaki Tozaki, and John P. A. IoannidisClinical and Molecular Epidemiology Unit (F.K.K., J.P.A.I.), Department of Hygiene and Epidemiology, University of Ioannina Schoolof Medicine, Ioannina 45110, Greece; Translational Research Center (T.Ak., H.H.), Kyoto University Hospital, Kyoto University Schoolof Medicine, Kyoto, Japan; Division of Endocrinology and Diabetes (T.Aw., S.Ka., S.Ku.), Department of Medicine, Saitama MedicalUniversity, Saitama, Japan; Third Department of Internal Medicine (Yoshiy.B., Yoshio.B.), Showa University School of Medicine,Tokyo, Japan; Department of Pathology (D.A.C.), University of Pittsburgh Medical Center, Pittsburgh, Pennsylvania; Department ofHematology (I.F.), Bone Marrow Transplantation and Blood Neoplastic Diseases, Medical Academy, Wroclaw, Poland; Institute ofImmunology and Experimental Therapy (I.F., L.K., E.P.), Polish Academy of Sciences, Wroclaw, Poland; Shiraz Institute for CancerResearch (A.G.), Medical School, Shiraz University of Medical Sciences, Shiraz, Iran; Institute of Biomedical Research (S.C.G., J.M.H.),Division of Medical Sciences, The Medical School, University of Birmingham, Birmingham, United Kingdom; Department ofEndocrinology (Y.H., I.M.), Kurume University School of Medicine, Kurume, Fukuoka, Japan; Human Molecular Genetics Laboratoryof the Department of Forensic Medicine (R.P., M.C.), Departments of Diabetology, Newborn Pathology and Birth Defects, of MedicalGenetics, and of Endocrinology (T.B.), Medical University of Warsaw, Warsaw, Poland; Department of Internal Medicine (P.-W.W., R.-T.L.), Chang Gung Memorial Hospital-Kaohsiung Medical Center, Chang Gung University College of Medicine, Kaohsiung, Taiwan;Department of Endocrinology (T.B.), Medical Research Center, Polish Academy of Science, Warsaw, Poland; Department of MolecularDiagnostics (E.I.C.), National Research Center GosNIIgenetika, Moscow, Russia; Graduate Institute of Medical Genetics andDepartment of Clinical Research (S.-H.H.J.), Kaohsiung Medical University Hospital, Kaohsiung, Taiwan; Endocrine and MetabolismResearch Center (G.-H.R.O.), Namazee Hospital, Shiraz, Iran; Division of Endocrinology and Metabolism (M.T.), Showa UniversityFujigaoka Hospital, Yokohama, Kanagawa-ken, Japan; Department of Medical Information (T.T.), Showa University School ofPharmaceutical Science, Tokyo, Japan; Biomedical Research Institute (J.P.A.I.), Foundation for Research and Technology-Hellas,Ioannina, Greece; and Institute for Clinical Research and Health Policy Studies (J.P.A.I.), Department of Medicine, Tufts-New EnglandMedical Center, Tufts University School of Medicine, Boston, Massachusetts
Context: Cytotoxic T-lymphocyte associated antigen 4 (CTLA-4)polymorphisms have been widely examined for their associations withautoimmune thyroid diseases [Graves’ disease (GD) and Hashimotothyroiditis (HT)], but their relative population effect remains unclear.
Objective: The aim was to generate large-scale evidence on whetherthe CTLA-4 polymorphisms (A49G and CT60) and haplotypes thereofincrease the susceptibility to GD and/or HT.
Design, Setting, and Participants: Meta-analyses of group-leveldata were reviewed from 32 (11,019 subjects) and 12 (4,479) publishedand unpublished studies for the association of the A49G polymor-phism with GD and HT, respectively (PubMed and HuGeNet searchuntil July 2006). There were 15 (n � 7246) and six (n � 3086) studiesavailable for the CT60 polymorphism, respectively. Meta-analyses ofindividual-level data from 10 (4906 subjects) and five (2386) collab-orating teams for GD and HT, respectively, were also reviewed.
Main Outcome Measures: Association of gene variants and hap-lotypes with GD and HT was measured.
Results: Group-level data suggested significant associations with GDand HT for both A49G [odds ratios 1.49 (P � 6 � 10�14) and 1.29 (P �0.001) per G allele, respectively] and CT60 [1.45 (P � 2 � 10�9) and 1.64(P � 0.003) per G allele, respectively]. Results were consistent betweenAsian and Caucasian descent subjects. Individual-level data showedthat compared with the AA haplotype, the risk conferred by the GGhaplotype was 1.49 (95% confidence interval 1.31,1.70) and 1.36 (95%confidence interval 1.16,1.59) for GD and HT, respectively. Data wereconsistent with a dose-response effect for the G allele of CT60.
Conclusion: The CT60 polymorphism of CTLA-4 maps an importantgenetic determinant for the risk of both GD and HT across diversepopulations. (J Clin Endocrinol Metab 92: 3162–3170, 2007)
AUTOIMMUNE THYROID DISEASES (AITDs) are themost prevalent autoimmune disorders (1), affecting
up to 5% of the general population (2). Graves’ disease (GD)
and Hashimoto thyroiditis (HT), the two most commonforms of AITD, and other autoimmune disorders such astype 1 diabetes mellitus and rheumatoid arthritis commonlycluster in the same families, and, thus, they may share somegenetic background (3). Several genes have been proposed tobe linked and/or associated with AITDs, but the extentof replication of these claims has been variable. The cytotoxicT-lymphocyte associated antigen 4 (CTLA-4) gene has beenone of the most extensively studied loci in this regard, andconsiderable genetic and immunological evidence suggeststhat it may be important for autoimmunity. CTLA-4 is an
First Published Online May 15, 2007Abbreviations: AF, Attributable fraction; AITD, autoimmune thyroid
disease; CI, confidence interval; CTLA-4, cytotoxic T-lymphocyte associatedantigen 4; GD, Graves’ disease; HT, Hashimoto thyroiditis; HWE, Hardy-Weinberg equilibrium; LD, linkage disequilibrium; OR, odds ratio; SNP,single nucleotide polymorphism.JCEM is published monthly by The Endocrine Society (http://www.endo-society.org), the foremost professional society serving the endo-crine community.
0021-972X/07/$15.00/0 The Journal of Clinical Endocrinology & Metabolism 92(8):3162–3170Printed in U.S.A. Copyright © 2007 by The Endocrine Society
doi: 10.1210/jc.2007-0147
3162
at Univ of Ioannina Central Lib on September 12, 2007 jcem.endojournals.orgDownloaded from

immune regulatory molecule expressed on the surface ofactivated T lymphocytes and a key inhibitor of T cell acti-vation (4, 5). CTLA-4 knockout mice develop a lymphopro-liferative disorder resulting in death from autoimmunitywithin 3–4 wk postpartum (6, 7).
Human CTLA-4 gene consists of four exons and threeintrons (8). Many studies conducted over the last decadehave claimed associations of AITDs with an adenine to gua-nine transition at position 49 of exon 1 (A49G) (9), but severalother polymorphisms of the same gene have also been eval-uated. The results have not always been consistent. A de-tailed genomic analysis of CTLA-4 in GD, HT, and type 1diabetes mellitus involving 108 single nucleotide polymor-phisms (SNPs) was published in Nature in 2003 (3). The Gallele of the �6230G�A (CT60) polymorphism showed verystrong association to GD. Other polymorphisms in additionto CT60, such as JO31, JO30, and JO27_1, were also highlyassociated and found to be in strong linkage disequilibrium(LD) (i.e. they tend to exist together), making it very difficultto map disease susceptibility to a single SNP. In an attemptto gain a greater understanding of the effects of individualCTLA-4 variants and address some of the published incon-sistencies, we performed a collaborative international meta-analysis. We have included both published and unpublisheddata from a network of investigators working in the field.Investigators provided individual-level information fromtheir databases, which allowed more detailed haplotypeanalyses.
Materials and MethodsIdentification and eligibility of relevant studies and data
We first identified all published studies that examined the associationof any CTLA-4 gene polymorphism with AITDs. Sources included MED-LINE, EMBASE, and HuGeNet (last search update performed in June2006). The search strategy was based on combinations of “CTLA4,”“CTLA-4,” “cytotoxic T-cell lymphocyte associated antigen 4,”“CD152,” “CD28,” “thyroid,*” “Graves,*” and “Hashimoto,*” limited tohumans without language restriction. References of retrieved articleswere also screened.
Studies were eligible if they had determined the distribution of allelesand/or genotypes for any of these polymorphisms in unrelated caseswith one or more types of AITD and in unrelated controls withoutAITDs. We did not consider family-based studies of pedigrees withseveral affected cases per family. We also excluded studies that did notdiscriminate between the various types of AITD because all analyseswere to be performed separately for GD and HT.
When the published literature was accumulated, the meta-analysiscoordinators (F.K.K. and J.P.A.I.) communicated with the correspondinginvestigators of all eligible studies, seeking their participation in a col-laborative meta-analysis of individual-level data. The prerequisite forparticipation was that investigators should be able to supply individual-level genotype data on GD and/or HT cases and controls for both A49Gand CT60 polymorphisms on their study populations. Participating in-vestigators were also encouraged to provide individual-level data onadditional CTLA-4 SNPs, whenever available.
Databases
For published articles, two investigators (F.K.K. and J.P.A.I.) inde-pendently extracted data and reached consensus on potential disagree-ments. The following information was sought from each report: authors;journal and year of publication; country of origin; selection and char-acteristics of cases and controls; demographics; “racial” descent of thestudy population (Asian, Caucasian, African-American, and other); el-igible and genotyped cases and controls; and genotype distributions.
Whenever a study team included two or more “racial” descent sub-groups, these were treated as separate studies in all analyses.
Furthermore, we examined whether matching of cases and controlshad been performed, there was specific mention of blinding of thepersonnel that performed the genotyping to the clinical status of thesubjects, the genotyping method had been validated, and genotypefrequencies in control groups were in Hardy-Weinberg equilibrium(HWE) according to an exact test.
Individual-level data were sent to the coordinators, and checked forlogical errors, inconsistencies, and potential deviations from HWEamong controls. Queries were sent back to the primary investigators forclarification and resolution.
Statistical analyses
Group-level data. Analyses of group-level data were performed using allpublished information, as well as any additional unpublished data re-trieved from the investigators. Whenever investigators provided up-dated information besides the published data, we kept only the updateddata to avoid double counting. Primary analyses compared allele fre-quencies for each polymorphism. We also addressed recessive and dom-inant models.
The odds ratio (OR) was used as the metric of choice. Heterogeneityacross all eligible comparisons was tested using the �2-based Cochran’sQ statistic (significant for P � 0.10) (10) and the I2 statistics (consideredvery large for I2 � 75% and large for values of 50–74%) (11). Data werecombined using both fixed effects [Mantel-Haenszel (12)] and randomeffects [DerSimonian and Laird (13)] models. Unless stated otherwise,random effects estimates are reported. Subgroup analyses estimatedORs per “racial” descent subgroup.
We also performed recursive cumulative meta-analysis to evaluatewhether the summary OR for the allele contrast changed as more dataaccumulate (14, 15). We used the nonparametric � correlation coefficient(16) to evaluate whether the magnitude of the observed association isrelated to the variance of each study (“small-study effects”).
Individual-level data. Analyses of individual-level data focused on theA49G and CT60 polymorphisms for which meaningful amounts of datawere available to be examined as haplotypes across a large number ofstudies. First, we examined whether analyses using group-level datafrom the studies with individual-level information gave similar resultsfor each polymorphism as those obtained from the group-level analyses,including all studies. Then, the main analyses of individual-level dataused haplotypes.
Haplotype reconstruction of the A49G and CT60 polymorphisms wasperformed using the population genotypic data separately for each casegroup (GD or HT) and controls of each participating team. The possiblehaplotypes are GG, GA, AG, and AA (the first allele corresponds to theA49G and the second one to the CT60 polymorphism, respectively).Haplotypes were inferred performing 100 iterations and using 100 in-dividuals (randomly chosen) in each input file; 96.2% of the haplotypeswere inferred with a probability exceeding 90%. Presented analyses usedthe most likely inferred haplotype for each subject. Analyses weightingeach haplotype by its probability of inference yielded very similar results(data not shown).
Primary analyses used logistic regression to calculate in each studythe OR per haplotype copy using the AA haplotype as reference. We thencombined the natural logarithms of the ORs for each haplotype using aninverse variance random effects model. Between-study heterogeneitywas measured with the Q and I2 statistics. Secondary analyses consid-ered for each haplotype two variables instead of one (having one or twocopies).
Individual-level data were used to calculate separately for each “ra-cial” descent the attributable fraction (AF) (the complete list of data canbe found in supplemental Appendix 1, which is published as supple-mental data on The Endocrine Society’s Journals Online web site athttp://jcem.endojournals.org).
Analyses were conducted in Intercooled Stata 8.2 (Stata Corp., Col-lege Park, TX) using the meta and the metan module. Haplotype re-construction was performed in PHASE 2.1 (17, 18) using the -T option.P values were two-tailed.
Kavvoura et al. • CTLA-4 Polymorphisms and AITD J Clin Endocrinol Metab, August 2007, 92(8):3162–3170 3163
at Univ of Ioannina Central Lib on September 12, 2007 jcem.endojournals.orgDownloaded from

ResultsEligible studies
The electronic search yielded 157 articles. Of those, 114were excluded (Fig. A1, published as supplemental data onThe Endocrine Society’s Journals Online web site at http://jcem.endojournals.org). A total of 43 articles examining therelation of AITD and the CTLA-4 polymorphisms were eli-gible (3, 9, 19–59) (the complete list of articles can be foundin supplemental Table A1, which is published as supple-mental data on The Endocrine Society’s Journals Online website at http://jcem.endojournals.org). There were 27 andnine studies that contained data on the A49G polymorphismand GD (3, 9, 21, 23, 25–27, 29–33, 36–39, 42–44, 46, 47, 49–53,57) and HT (3, 26, 30, 31, 35, 41, 48, 58, 59), respectively. Oneof the eligible articles included subjects from two differentracial descent groups (37). Therefore, a total of 28 compar-isons of published studies were considered for the A49Gpolymorphism and GD. Seven and three studies reporteddata for the CT60 polymorphisms and GD (3, 43, 48, 50,52–54) and HT (3, 48, 54), respectively. There was consider-able diversity of ethnic groups and eligibility criteria (thecomplete list of results can be found in supplemental TableA1, which is published as supplemental data on The Endo-crine Society’s Journals Online web site at http://jcem.endojournals.org). For controls, varying details were pre-sented regarding the extent of testing that had beenperformed to exclude controls with disturbed thyroid func-tion. There were 19 studies (3, 9, 19–22, 25, 29, 31–33, 35, 36,38, 41, 46–48, 50–53, 55–57, 59, 60) that excluded subjectswith a family history of AITD and/or other autoimmunedisorders from controls.
Seven studies matched for age (9, 38, 39, 43, 44, 48, 50), sixfor gender (9, 38, 43, 44, 48, 50), four for geographic region(32, 35, 42, 52), one for age, gender, and geographic region(50), one for ethnical descent, age, and gender (9), and five
for ethnical descent (3, 19, 42, 52, 59). PCR methods were usedfor genotyping. No articles mentioned explicit blinding of thepersonnel that performed the genotyping. In three studies(two for A49G polymorphism and one for CT60), the distri-bution of genotypes in the control group deviated signifi-cantly from HWE (36, 38, 41).
There were 10 teams of investigators that provided indi-vidual-level genotyping data for both A49G and CT60 poly-morphisms, all teams provided data for GD and five of themprovided data for HT, as well. Four teams were from Europeand six from Asia. Nine teams had already published data onA49G polymorphism (3, 26, 28, 29, 37, 38, 43, 44, 47), but onlytwo on CT60 polymorphism (3, 48). Three teams providedgenotyping data from different cohorts than those previouslypublished (29, 38, 48). Seven teams clarified that they hadused blinding of personnel in genotyping.
Data on other CTLA-4 polymorphisms were more limited(the complete list of data can be found in supplementalTables A17–A23, which are published as supplemental dataon The Endocrine Society’s Journals Online web site athttp://jcem.endojournals.org).
Group-level data
A49G polymorphism. The analyses included a total of 4848cases with GD, 866 with HT, and 7314 controls (Table 1) (thecomplete list of cases can be found in supplemental Table A2,which is published as supplemental data on The EndocrineSociety’s Journals Online web site at http://jcem.endojournals.org). The frequency of the G allele was 48.9% among controlsubjects (62.0% and 36.9% among Asian and Caucasian descent,respectively). The overall prevalence was 26.5% (40.5% and14.0%, respectively) for G/G homozygosity and 42.0% (40.2%and 42.7%, respectively) for G/A heterozygosity.
The summary OR of published and unpublished data sug-gested a 1.49-fold increase in susceptibility to GD among
TABLE 1. Meta-analyses of group-level data for various contrasts of A49G and CT60 polymorphism in the CTLA-4 gene andsusceptibility to GD and HT
Contrast and racialdescent group
GD HT
No. ofstudies
Totalsamplesize (n)
Randomeffects
95% CI I2 (%) No. ofstudies
Totalsamplesize (n)
Randomeffects
95% CI I2 (%)
A49G: G vs. A alleleAll 32 22,038a 1.49 1.34–1.66 64 12 8,958a 1.29 1.11–1.50 54Asians 15 9,800a 1.54 1.36–1.75 38 7 4,530a 1.31 1.02–1.68 71Caucasians 11 10,210a 1.55 1.33–1.80 66 4 4,158a 1.30 1.11–1.52 0
G/G vs. A/A genotype 30 5,778b 2.13 1.72–2.62 51 12 2,447b 1.95 1.50–2.52 19G/G vs. G/A and A/A
genotypes30 10,338b 1.70 1.43–2.01 64 12 4,490b 1.29 1.01–1.64 58
G/G and G/A vs. A/Agenotype
30 10,338b 1.62 1.36–1.92 55 12 4,560b 1.64 1.25–2.15 47
CT60: G vs. A alleleAll 15 14,492a 1.45 1.28–1.64 56 6 6,172a 1.64 1.18–2.26 83Asians 8 7,588a 1.60 1.27–2.00 72 4 3,780a 1.54 1.24–1.92 39Caucasians 6 6,620a 1.44 1.31–1.60 0 1 2,124a 2.83 2.28–3.52 –
G/G vs. A/A genotype 14 4,192b 2.24 1.68–3.00 47 6 1,763b 2.83 1.42–5.66 76G/G vs. G/A and A/A
genotypes14 6,948b 1.62 1.35–1.94 64 6 3,087b 1.87 1.22–2.88 82
G/G and G/A vs. A/Agenotype
14 6,948b 1.84 1.46–2.32 33 6 3,087b 2.18 1.34–3.54 59
a Total sample size refers to the total number of alleles for cases (GD or HT) and controls.b Total sample size refers to the total numbers of cases (GD or HT) and control.
3164 J Clin Endocrinol Metab, August 2007, 92(8):3162–3170 Kavvoura et al. • CTLA-4 Polymorphisms and AITD
at Univ of Ioannina Central Lib on September 12, 2007 jcem.endojournals.orgDownloaded from

subjects with the G allele (P � 6 � 10�14) but with evidenceof significant between-study heterogeneity (Q � 85.6; P �0.001 for heterogeneity; I2 � 64%) (Table 1 and Fig. 1A). Effectsizes were consistent across subgroups of different racialdescent (Table 1)
When the analysis was limited to studies in which pub-lished or unpublished data were available for both A49Gand CT60 polymorphisms, the summary OR for A49G be-came 1.40 (I2 � 74%). When the two studies that deviatedsignificantly from HWE (36, 38) were also excluded, therandom-effects OR remained 1.49 (I2 � 66%). A sensitivityanalysis limited to published data yielded a summary ORof 1.45 (I2 � 50%).
The G allele conferred an almost 1.3-fold increase in thesusceptibility of HT that was significant (P � 0.001), andthere was substantial between-study heterogeneity (I2 �54%; Table 1 and Fig. 1B). Similar effects were found fordifferent ethnic groups (Table 1), with heterogeneity only in
the Asian studies. When the analysis was limited to studiesin which published or unpublished data were available forboth A49G and CT60 polymorphisms, the summary OR forthe G allele was still 1.31 (I2 � 0%). Sensitivity analysisexcluding studies with unpublished data yielded similar re-sults (OR 1.28; I2 � 65%). No studies had significant devi-ations from HWE in their control groups.
The magnitude of the overall OR diminished modestlyover time for GD (from 1.64 in 1996, to 1.49 in the finalanalysis) and HT (from 1.57 in 1997, to 1.29 in the finalanalysis). There was no evidence that more precise studiesshowed more conservative results for the association of theG allele with GD or HT either, than less precise studies (P �0.24 and P � 0.68 for GD and HT, respectively).
CT60 polymorphism. Group-level data included 3047 GDcases, 839 HT cases, and 3741 healthy controls (Table 1) (thecomplete list of cases can be found in supplemental Table A5,
FIG. 1. Odds ratios for the association between the G allele of the A49G (A and B) and the CT60 (C and D) polymorphisms in the CTLA-4 geneand susceptibility to GD (upper panel) and HT (lower panel). Individual studies [published and unpublished (un)] (boxes) are listed by increasingsample size from top to bottom. The diamond shows the summary random-effects OR estimate from a meta-analysis. Horizontal lines indicate95% CI.
Kavvoura et al. • CTLA-4 Polymorphisms and AITD J Clin Endocrinol Metab, August 2007, 92(8):3162–3170 3165
at Univ of Ioannina Central Lib on September 12, 2007 jcem.endojournals.orgDownloaded from

which is published as supplemental data on The EndocrineSociety’s Journals Online web site at http://jcem.endojour-nals.org). The G allele frequency was 64.3% in controls (76.0%in subjects of Asian descent and 52.7% in those of Caucasiandescent), G/G homozygosity had a frequency of 44% (57.6and 29.3%, respectively), while G/A heterozygotes were41.9% (36.8 and 47.3%, respectively) of the controls.
The G allele increased 1.45-fold the odds of GD (P � 2 �10�9); there was large heterogeneity (I2 � 56%) (Table 1 andFig. 1C). The results were similar in subjects of Asian andCaucasian descent (Table 1), with between-study heteroge-neity only in the Asian descent studies. Analyses limited tostudies in which both A49G and CT60 had been genotypedyielded an OR of 1.45 (I2 � 56%) per allele. A sensitivityanalysis including only previously published studies yieldedsimilar results (OR 1.40; I2 � 57%). After excluding one study(52) that significantly deviated from HWE, neither the effectsize (OR 1.43) nor the heterogeneity (I2 � 58%) changed.
For HT, the G allele of the CT60 polymorphism increasedthe odds 1.64-fold (P � 0.003) with very large heterogeneity(I2 � 83%) (Table 1 and Fig. 1D). The data came from Asiandescent studies, with the exception of a single study onCaucasian descent subjects, in which a very strong effect wasseen (OR 2.83). A sensitivity analysis including only previ-ously published studies yielded similar results (OR 1.68 perG allele; I2 � 91%). All studies conformed to HWE.
Compared with the first study, the magnitude of the ORdiminished slightly for GD (from 1.53 in 2003, to 1.45 in thelast analysis) and more prominently for HT (from 2.83 in2003, to 1.64 in the last analysis). No evidence was found thatmore precise studies showed more conservative results thanless precise studies (P � 0.40 and P�0.19 for GD and HT,respectively).
Individual-level database
Individual-level data were available for 2306 GD cases, 657HT cases, and 2530 controls for the A49G, and 2276 GD cases,662 HT cases, and 2469 controls for the CT60 polymorphism.The allele and genotype frequency for each polymorphism
were similar to those of the larger group-level database (thecomplete list of results can be found in supplemental TablesA8–A11, which are published as supplemental data on TheEndocrine Society’s Journals Online web site at http://jcem.endojournals.org). Controls did not deviate significantlyfrom HWE in any study teams. Moreover, the summaryeffect using group-level information from these studies oneach polymorphism was similar to the aforementioned anal-yses, including all studies (the complete list of results can befound in supplemental Tables A12 and A13, which are pub-lished as supplemental data on The Endocrine Society’s Jour-nals Online web site at http://jcem.endojournals.org).
The database included a total of 5586 subjects: GD, 2334;HT, 680; and controls, 2572. The haplotype frequenciesamong controls for the: GG haplotype was 47.9% (63.1% inAsian descent controls, 38.4% in Caucasian descent, and29.5% in Iranian descent, respectively); AG was 14.3% (11.7,16.0, and 16.0%, respectively); GA was 1.6% (1.4, 1.6, and2.0%, respectively); and AA was 36.2% (23.8, 44.0, and 52.5%,respectively) (the complete list of frequencies can be foundin supplemental Tables A14 and A15, which are published assupplemental data on The Endocrine Society’s Journals On-line web site at http://jcem.endojournals.org).
For GD (Table 2 and Fig. 2A), the GG haplotype increased theodds by 1.49-fold per copy [95% confidence interval (CI) 1.31–1.70; P � 2 � 10�9; I2 � 48%)] compared with the AA haplotype.The result was consistent in Asian and Caucasian descent sub-jects (1.57 and 1.52, respectively). The AG haplotype also in-creased the odds of GD by 1.35-fold (Table 2 and Fig. 2B). Nodifferences were found for Asian and Caucasian descent sub-groups (1.30 and 1.42, respectively). The GA haplotype did notdiffer significantly in the GD risk overall (OR 0.78; Table 2 andFig. 2C). After stratifying for CT60, the OR per copy of G alleleof A49G was 1.13 (95% CI 0.98–1.31).
The GG haplotype increased the odds of HT by 1.36-fold(OR 1.36; 95% CI 1.16–1.59; P � 0.001; I2 � 0%; Table 2 andFig. 3A). No effect was shown for the AG haplotype, but theCIs cannot exclude a modest effect (OR 1.02; Table 2 and Fig.3B). For both GG and AG, the effects were stronger in the
TABLE 2. Meta-analyses of individual-level data for the association of different haplotypes reconstructed of the A49G and CT60polymorphisms of the CTLA-4 gene with GD and HT patients
Disease,polymorphism,and contrast
GD HT
No. ofteams
Totalsamplesize (n)a
Randomeffects
95% CI I2 (%) No. ofteams
Totalsamplesize (n)a
Randomeffects
95% CI I2 (%)
GG haplotypeAll 10 5,128 1.49 1.31–1.70 48 5 2,419 1.36 1.16–1.59 0Asians 5 2,819 1.57 1.33–1.85 0 3 1,516 1.26 1.01–1.57 0Caucasians 4 2,229 1.52 1.24–1.85 68 1 819 1.59 1.22–1.98 –
GA haplotypeAll 6 122 0.78 0.48–1.27 12 2 47 4.62 0.05–404.7 93Asians 3 39 0.51 0.21–1.23 12 – – – – –Caucasians 3 79 0.97 0.58–1.63 53 – – – – –
AG haplotypeAll 10 1,426 1.35 1.16–1.55 9 5 666 1.02 0.71–1.47 35Asians 5 473 1.30 1.00–1.69 13 3 266 0.86 0.62–1.21 0Caucasians 4 906 1.42 1.20–1.69 6 1 358 1.62 1.21–2.16 –
All analyses represent contrasts of the respective haplotype vs. the AA haplotype.a Total sample sizes comprise both cases’ (GD and HT, respectively) and controls’ total number of chromosomes with the respective haplotype.
One study had subjects of Iranian descent having different haplotype frequencies from both Asian and Caucasian descent subjects, and, thus,are not shown in the racial subgroup analyses.
3166 J Clin Endocrinol Metab, August 2007, 92(8):3162–3170 Kavvoura et al. • CTLA-4 Polymorphisms and AITD
at Univ of Ioannina Central Lib on September 12, 2007 jcem.endojournals.orgDownloaded from

subjects of Caucasian descent than in subjects of Asian de-scent (1.59 vs. 1.26 and 1.62 vs. 0.86, respectively). The GAhaplotype had a nonsignificant effect, but data were verysparse (only 14 HT cases and 33 controls had the GAhaplotype).
The secondary analyses were consistent with a dose-re-sponse effect for the GG haplotype. With one copy, the OR was1.29 for GD (95% CI 1.07–1.55; P � 0.007; I2 � 18%), while withtwo copies, the OR became 1.97 (95% CI 1.48–2.63; P � 3 � 10�6;I2 � 48%) (the complete list of ORs can be found in supple-mental Table A16, which is published as supplemental data onThe Endocrine Society’s Journals Online web site at http://jcem.endojournals.org). The respective effects for HT were 1.48(95% CI 1.15–1.91; P � 2 � 10�3; I2 � 0%) and 1.71 (95% CI1.25–2.33; P � 10�3; I2 � 0%). The data were also consistent witha dose-response for the AG haplotype in GD (OR 1.06 and 1.39with one and two copies, respectively), while data were sparseto examine this for HT (only 12 HT subjects and 43 controls hadtwo copies of AG in the entire database).
The AF according to the primary analysis was 32% forAsian descent and 29% for Caucasian descent subjects forGD, and 19 and 28%, respectively, for HT. Results weresimilar in the secondary analysis (AF � 24–39%).
FIG. 2. Odds ratios derived for the association among the GG (A), AG(B), and GA (C) haplotypes of the A49G and CT60 polymorphisms inthe CTLA-4 gene and susceptibility to GD. The AA haplotype is thereference. Individual studies (boxes) are listed by increasing samplesize from top to bottom. The diamond shows the summary randomeffects (RE) OR estimate from a meta-analysis of individual partic-ipant data. Horizontal lines indicate 95% CI.
FIG. 3. Odds ratios derived for the association between the GG (A)and AG (B) haplotypes of the A49G and CT60 polymorphisms in theCTLA-4 gene and susceptibility to HT. The AA haplotype is the ref-erence. Individual studies (boxes) are listed by increasing sample sizefrom top to bottom. The diamond shows the summary random effects(RE) OR estimate from a meta-analysis of individual participant data.Horizontal lines indicate 95% CI.
Kavvoura et al. • CTLA-4 Polymorphisms and AITD J Clin Endocrinol Metab, August 2007, 92(8):3162–3170 3167
at Univ of Ioannina Central Lib on September 12, 2007 jcem.endojournals.orgDownloaded from

Other polymorphisms
No formally significant results were seen overall for the104-bp allele of the (AT)n microsatellite, the C(-318)T poly-morphism, or the JO27_1 polymorphism, either for GD or HT(the complete list of results can be found in supplementalAppendix Tables A15–A17, A20, and A21, which are pub-lished as supplemental data on The Endocrine Society’s Jour-nals Online web site at http://jcem.endojournals.org). The Gallele of the JO31 polymorphism [four studies (5412 alleles)]and the G allele of the JO30 polymorphism [three studies[2796 alleles)] showed a possible association to GD, but theeffects were modest (OR 1.40, 95% CI 1.15–1.72, P � 0.01,I2 � 57%; and OR 1.25, 95% CI 0.99–1.59, P � 0.06, I2 � 68%,respectively) (the complete list of results can be found in sup-plemental Tables A20, A21, and A23, which are published assupplemental data on The Endocrine Society’s Journals Onlineweb site at http://jcem.endojournals.org). Moreover, JO31and JO30 were in LD with the CT60 polymorphism (r2 � 0.65and 0.79, respectively) and among themselves (r2 � 0.55).
Discussion
This meta-analysis examined the association of CTLA-4polymorphisms with AITD (GD and HT), and includedgroup-level data from more than 13,000 subjects and indi-vidual-level data from more than 5,000 subjects. The group-level data clearly showed highly significant associationsof both GD and HT with each polymorphism separately,with P values in the range of 10�3 to 10�16 in the mainanalyses. The individual-level data allowed the consider-ation of haplotypes, including both polymorphisms. The as-sociation with A49G polymorphism is probably mostly theresult of LD with CT60. The G allele of the CT60 polymor-phism increases the odds of both GD and HT by 1.4-fold. Adose-effect association was also demonstrated as the pres-ence of two copies of the susceptible haplotype GG almostdoubled the odds compared with one copy of GG.
Although environmental agents are undoubtedly impor-tant for the development of AITD in susceptible individuals,it has been estimated in twin studies that almost 80% of thepredisposition to GD is due to genetic factors (60). The geneticsdo not represent a simple Mendelian model (61). Several genesmay be associated with AITD. The human leukocyte antigenregion, CTLA-4 gene, and PTPN22 gene have shown the stron-gest results to date (62–65). Given the observed OR and highallele frequencies in the examined populations, the AF for CT60is in the range of 20–30%. We should acknowledge that geneticeffects may occasionally be overestimated due to biases, how-ever, this is one of the largest AFs ever shown in the geneticsof complex diseases (66).
Functional evidence supports the role of CTLA-4 in au-toimmunity. CTLA-4 was recently described as a gatekeeperof conjugation timing (67). Reduced conjugation might pro-tect against prolonged contact periods of cytotoxic T lym-phocytes with autoantigen-defined targets. CT60 G haplo-types produce less soluble CT60 transcript than A haplotypes(3). However, the disease-implicated haplotypes may extendover the long costimulatory receptor region of chromosome2 consisting of CD28, CTLA-4, and ICOS (68). The CTLA-4CT60 A protective allele haplotype goes with the most com-
mon extended haplotype (15-2-4) in Caucasians. The relativerole of other polymorphisms and extended haplotypes maybe further clarified in additional large-scale studies.
Some caveats should be discussed. Most of the group-leveldata showed large between-study heterogeneity. This couldbe due to bias, chance, or genuine diversity of genetic effects.We found no evidence of differences according to racialdescent, even though the allele frequencies differed acrossracial subgroups. The smaller published studies did notshow different results compared with the larger ones. How-ever, there was a suggestion that the first studies may haveyielded somewhat stronger effects (15). This is consistentwith a “winner’s curse phenomenon” in which early datashow exaggerated effects. Thus, the group-level derived es-timates may be modestly inflated, as suggested also by thetrend for relatively smaller effects sizes for the G allele ofCT60 in the individual-level data. The latter may providemore reliable estimators and more options for decipheringthe relative contribution of each polymorphism, but they arealso not necessarily devoid from potential biases. Practicalconsiderations did not allow shipping of specimens for re-genotyping at a central facility. Nevertheless, genotypingerror for SNPs should be low at experienced facilities. Allcontrol genotype frequencies were consistent with HWE inthe individual-level database, but this was not so in thegroup-level data. However, some analyses have significantbetween-study heterogeneity, even in the individual-leveldata. Besides biases, this could be attributed to differences interms of disease phenotype (e.g. presence of ophthalmopathyand/or of other autoimmune diseases) among AITD cases.AITD is rare in men to allow evaluation of gender differ-ences. Moreover, data on age of onset were not sufficientlystandardized across studies to allow meaningful investiga-tion of age-related effect modification.
In conclusion, despite these caveats, our collaborativeanalysis shows consistent associations between GD and HTwith CT60. This association crosses ethnic barriers, and wecan make a reasonable estimate of the implicated OR. Al-though we still cannot identify a single etiological polymor-phism, our study confirms the important role of the CTLA-4locus in determining the risk of AITD.
Glossary of statistical terms
Effect size: The magnitude of the association (e.g. oddsratio).
“Fixed effects” model: Considers that the variability of theresults between studies of the meta-analysis is exclusivelydue to random variation (chance). Therefore, if all the studieswere infinitely large they would give identical results.
“Random effects” model: Assumes a different underlyingeffect for each study of the meta-analysis and takes this intoconsideration as an additional source of variation, leading towider confidence intervals than the fixed effects model. Themodel tries to measure the mean and dispersion of thesestudy-specific effects.
Heterogeneity: Denotes the diversity in a meta-analysisdue to clinical differences (participants, interventions, out-comes) or methodological differences (study design, quality,analysis) among the included studies.
3168 J Clin Endocrinol Metab, August 2007, 92(8):3162–3170 Kavvoura et al. • CTLA-4 Polymorphisms and AITD
at Univ of Ioannina Central Lib on September 12, 2007 jcem.endojournals.orgDownloaded from

I2 (I-square): Describes the percentage of total variationacross studies included in a meta-analysis that is due toheterogeneity rather than chance. I2 lies between 0% and100%. A value of 0% indicates no observed heterogeneity,and larger values show increasing heterogeneity.
Attributable fraction: Denotes the proportion of a disease(or other outcome of interest) in the community that can beexplained by the presence of a risk factor. It is mainly influ-enced by the prevalence of the risk factor, thus common riskfactors can have high attributable fractions even when theeffect size is not large.
Acknowledgments
Received January 22, 2007. Accepted May 9, 2007.Address all correspondence and requests for reprints to: John P. A.
Ioannidis, M.D., Professor and Chairman, Department of Hygiene andEpidemiology, University of Ioannina School of Medicine, Ioannina45110, Greece. E-mail: [email protected].
This work was co-financed by E.U.-European Social Fund (75%) andthe Greek Ministry of Development-General Secretariat of Research andTechnology (25%); the Ministry of Education, Culture, Sports, Scienceand Technology and the Ministry of Health, Labour and Welfare ofJapan; the Russian Foundation for Basic Research (Grant 448-03); theState Committee for Scientific Research of Poland (Grants 2PO5B05529and 4PO5B13119); the Medical University of Warsaw (Grant 1WY/N/2007); the Shiraz Institute for Cancer Research (Iran); and the NationalScience Council (Republic of China) of Taiwan (Grants NSC 91-2314-B-182A-132 and NSC 93-2314-B-182A-112).
Authors’ contributions: F.K.K. and J.P.A.I. organized and coordinatedthe meta-analysis. All other authors were responsible for the design andconduct of individual-level studies and contributed their databases inthe meta-analysis. F.K.K. and J.P.A.I. performed the statistical analyses,and F.K.K. wrote the first draft of the manuscript. All authors interpretedthe results and commented on the manuscript.
Disclosure Statement: The authors have nothing to disclose.Conflict of interest and source of funding: All authors declare that
they have no conflict of interest.Role of the funding source: The funding sources had no role in the
study design, data collection, data analysis, results interpretation, andpreparation of the manuscript or decision to publish.
References
1. Szyper-Kravitz M, Marai I, Shoenfeld Y 2005 Coexistence of thyroid auto-immunity with other autoimmune diseases: friend or foe? Additional aspectson the mosaic of autoimmunity. Autoimmunity 38:247–255
2. Wang C, Crapo LM 1997 The epidemiology of thyroid disease and implicationsfor screening. Endocrinol Metab Clin North Am 26:189–218
3. Ueda H, Howson JM, Esposito L, Heward J, Snook H, Chamberlain G,Rainbow DB, Hunter KM, Smith AN, Di Genova G, Herr MH, Dahlman I,Payne F, Smyth D, Lowe C, Twells, RC, Howlett S, Healy B, Nutland S, RanceHE, Everett V, Smink LJ, Lam AC, Cordell HJ, Walker NM, Bordin C, HulmeJ, Motzo C, Cucca F, Hess JF, Metzker ML, Rogers J, Gregory S, AllahabadiaA, Nithiyananthan R, Tuomilehto-Wolf E, Tuomilehto J, Bingley P,Gillespie KM, Undlien DE, Ronningen KS, Guja C, Ionescu-Tirgoviste C,Savage DA, Maxwell AP, Carson DJ, Patterson CC, Franklyn JA, ClaytonDG, Peterson LB, Wicker LS, Todd JA, Gough SC 2003 Association of theT-cell regulatory gene CTLA4 with susceptibility to autoimmune disease.Nature 423:506–511
4. Scheipers P, Reiser H 1998 Fas-independent death of activated CD4(�) T-lymphocytes induced by CTLA-4 crosslinking. Proc Natl Acad Sci USA 95:10083–10088
5. Gribben JG, Freeman GJ, Boussiotis VA, Rennert P, Jellis CL, Greenfield E,Barber M, Restivo Jr VA, Ke X, Gray GS 1995 CTLA4 mediates antigen-specific apoptosis of human T cells. Proc Natl Acad Sci USA 92:811–815
6. Waterhouse P, Penninger JM, Timms E, Wakeham A, Shahinian A, Lee KP,Thompson CB, Griesser H, Mak TW 1995 Lymphoproliferative disorders withearly lethality in mice deficient in CTLA-4. Science 270:985–988
7. Tivol EA, Borriello F, Schweitzer AN, Lynch WP, Bluestone JA, Sharpe AH1995 Loss of CTLA-4 leads to massive lymphoproliferation and fatal multi-organ tissue destruction, revealing a critical negative regulatory role ofCTLA-4. Immunity 3:541–547
8. Dariavach P, Mattei MG, Golstein P, Lefranc MP 1988 Human Ig superfamilyCTLA-4 gene: chromosomal localization and identity of protein sequencebetween murine and human CTLA-4 cytoplasmic domains. Eur J Immunol18:1901–1905
9. Nistico L, Buzzetti R, Pritchard LE, Van der Auwera B, Giovannini C, BosiE, Larrad MT, Rios MS, Chow CC, Cockram CS, Jacobs K, Mijovic C, BainSC, Barnett AH, Vandewalle CL, Schuit F, Gorus FK, Tosi R, Pozzilli P, ToddJA 1996 The CTLA-4 gene region of chromosome 2q33 is linked to, andassociated with, type 1 diabetes. Belgian Diabetes Registry. Hum Mol Genet5:1075–1080
10. Lau J, Ioannidis JP, Schmid CH 1997 Quantitative synthesis in systematicreviews. Ann Intern Med 127:820–826
11. Higgins JP, Thompson SG 2002 Quantifying heterogeneity in a meta-analysis.Stat Med 21:1539–1558
12. Mantel N, Haenzel W 1959 Statistical aspects of the analysis of data fromretrospective studies of disease. J Natl Cancer Inst 22:719–748
13. DerSimonian R, Laird N 1986 Meta-analysis in clinical trials. Control ClinTrials 7:177–188
14. Ioannidis JP, Contopoulos-Ioannidis DG, Lau J 1999 Recursive cumulativemeta-analysis: a diagnostic for the evolution of total randomized evidencefrom group and individual patient data. J Clin Epidemiol 52:281–291
15. Ioannidis JP, Ntzani EE, Trikalinos TA, Contopoulos-Ioannidis DG 2001Replication validity of genetic association studies. Nat Genet 29:306–309
16. Begg CB, Mazumdar M 1994 Operating characteristics of a rank correlationtest for publication bias. Biometrics 50:1088–1101
17. Stephens M, Smith NJ, Donnelly P 2001 A new statistical method for hap-lotype reconstruction from population data. Am J Hum Genet 68:978–989
18. Stephens M, Scheet P 2005 Accounting for decay of linkage disequilibrium inhaplotype inference and missing data imputation. Am J Hum Genet 76:449–462
19. Heward JM, Allahabadia A, Armitage M, Hattersley A, Dodson PM, Ma-cleod K, Carr-Smith J, Daykin J, Daly A, Sheppard MC, Holder RL, BarnettAH, Franklyn JA, Gough SC 1999 The development of Graves’ disease andthe CTLA-4 gene on chromosome 2q33. J Clin Endocrinol Metab 84:2398–2401
20. Yanagawa T, Hidaka Y, Guimaraes V, Soliman M, DeGroot LJ 1995 CTLA-4gene polymorphism associated with Graves’ disease in a Caucasian popula-tion. J Clin Endocrinol Metab 80:41–45
21. Donner H, Rau H, Walfish PG, Braun J, Siegmund T, Finke R, Herwig J,Usadel KH, Badenhoop K 1997 CTLA4 alanine-17 confers genetic suscepti-bility to Graves’ disease and to type 1 diabetes mellitus. J Clin EndocrinolMetab 82:143–146
22. Kotsa K, Watson PF, Weetman AP 1997 A CTLA-4 gene polymorphism isassociated with both Graves disease and autoimmune hypothyroidism. ClinEndocrinol (Oxf) 46:551–554
23. Marron MP, Raffel LJ, Garchon HJ, Jacob CO, Serrano-Rios M MartinezLarrad MT, Teng WP, Park Y, Zhang ZX, Goldstein DR, Tao YW, BeaurainG, Bach JF, Huang HS, Luo DF, Zeidler A, Rotter JI, Yang MC, ModilevskyT, Maclaren NK, She JX 1997 Insulin-dependent diabetes mellitus (IDDM) isassociated with CTLA4 polymorphisms in multiple ethnic groups. Hum MolGenet 6:1275–1282
24. Sale MM, Akamizu T, Howard TD, Yokota T, Nakao K, Mori T, Iwasaki H,Rich SS, Jennings-Gee JE, Yamada M, Bowden DW 1997 Association ofautoimmune thyroid disease with a microsatellite marker for the thyrotropinreceptor gene and CTLA-4 in a Japanese population. Proc Assoc Am Physicians109:453–461
25. Yanagawa T, Taniyama M, Enomoto S, Gomi K, Maruyama H, Ban Y, SarutaT 1997 CTLA4 gene polymorphism confers susceptibility to Graves’ disease inJapanese. Thyroid 7:843–846
26. Awata T, Kurihara S, Iitaka M, Takei S, Inoue I Ishii C, Negishi K, IzumidaT, Yoshida Y, Hagura R, Kuzuya N, Kanazawa Y, Katayama S 1998 Associ-ation of CTLA-4 gene A-G polymorphism (IDDM12 locus) with acute-onsetand insulin-depleted IDDM as well as autoimmune thyroid disease (Graves’disease and Hashimoto’s thyroiditis) in the Japanese population. Diabetes47:128–129
27. Djilali-Saiah I, Larger E, Harfouch-Hammoud E, Timsit J, Clerc J, Bertin E,Assan R, Boitard C, Bach JF, Caillat-Zucman S 1998 No major role for theCTLA-4 gene in the association of autoimmune thyroid disease with IDDM.Diabetes 47:125–127
28. Akamizu T, Sale MM, Rich SS, Hiratani H, Noh JY, Kanamoto N, Saijo M,Miyamoto Y, Saito Y, Nakao K, Bowden DW 2000 Association of autoimmunethyroid disease with microsatellite markers for the thyrotropin receptor geneand CTLA-4 in Japanese patients. Thyroid 10:851–858
29. Chistyakov DA, Savost’anov KV, Turakulov RI, Petunina NA, Trukhina LV,Kudinova AV, Balabolkin MI, Nosikov VV 2000 Complex association anal-ysis of Graves disease using a set of polymorphic markers. Mol Genet Metab70:214–218
30. Kouki T, Sawai Y, Gardine CA, Fisfalen ME, Alegre ML, DeGroot LJ 2000CTLA-4 gene polymorphism at position 49 in exon 1 reduces the inhibitoryfunction of CTLA-4 and contributes to the pathogenesis of Graves’ disease.J Immunol 165:6606–6611
31. Park YJ, Chung HK, Park DJ, Kim WB, Kim SW, Koh JJ, Cho BY 2000Polymorphism in the promoter and exon 1 of the cytotoxic T lymphocyte
Kavvoura et al. • CTLA-4 Polymorphisms and AITD J Clin Endocrinol Metab, August 2007, 92(8):3162–3170 3169
at Univ of Ioannina Central Lib on September 12, 2007 jcem.endojournals.orgDownloaded from

antigen-4 gene associated with autoimmune thyroid disease in Koreans. Thy-roid 10:453–459
32. Hadj Kacem H, Bellassoued M, Bougacha-Elleuch N, Abid M, Ayadi H 2001CTLA-4 gene polymorphisms in Tunisian patients with Graves’ disease. ClinImmunol 101:361–365
33. Kinjo Y, Takasu N, Komiya I, Tomoyose T, Takara M, Kouki T, ShimajiriY, Yabiku K, Yoshimura H 2002 Remission of Graves’ hyperthyroidism andA/G polymorphism at position 49 in exon 1 of cytotoxic T lymphocyte-asso-ciated molecule-4 gene. J Clin Endocrinol Metab 87:2593–2596
34. Kouki T, Gardine CA, Yanagawa T, Degroot LJ 2002 Relation of three poly-morphisms of the CTLA-4 gene in patients with Graves’ disease. J EndocrinolInvest 25:208–213
35. Tomoyose T, Komiya I, Takara M, Yabiku K, Kinjo Y 2002 Cytotoxic T-lymphocyte antigen-4 gene polymorphisms and human T-cell lymphotrophicvirus-1 infection: their associations with Hashimoto’s thyroiditis in Japanesepatients. Thyroid 12:673–677
36. Yung E, Cheng PS, Fok TF, Wong GW 2002 CTLA-4 gene A-G polymorphismand childhood Graves’ disease. Clin Endocrinol (Oxf) 56:649–653
37. Bednarczuk T, Hiromatsu Y, Fukutani T, Jazdzewski K, Miskiewicz P, Os-ikowska M, Nauman J 2003 Association of cytotoxic T-lymphocyte-associatedantigen-4 (CTLA-4) gene polymorphism and non-genetic factors with Graves’ophthalmopathy in European and Japanese populations. Eur J Endocrinol148:13–18
38. Kalantari T, Mostafavi H, Pezeshki AM, Farjadian S, Doroudchi M, YeganehF, Ghaderi A 2003 Exon-1 polymorphism of ctla-4 gene in Iranian patients withGraves’ disease. Autoimmunity 36:313–316
39. Mochizuki M, Amemiya S, Kobayashi K, Kobayashi K, Shimura Y, IshiharaT, Nakagomi Y, Onigata K, Tamai S, Kasuga A, Nanazawa S 2003 Associationof the CTLA-4 gene 49 A/G polymorphism with type 1 diabetes and auto-immune thyroid disease in Japanese children. Diabetes Care 26:843–847
40. Takara M, Kouki T, DeGroot LJ 2003 CTLA-4 AT-repeat polymorphismreduces the inhibitory function of CTLA-4 in Graves’ disease. Thyroid 13:1083–1089
41. Terauchi M, Yanagawa T, Ishikawa N, Ito K, Fukazawa T, Maruyama H,Saruta T 2003 Interactions of HLA-DRB4 and CTLA-4 genes influence thyroidfunction in Hashimoto’s thyroiditis in Japanese population. J Endocrinol Invest26:1208–1212
42. Vaidya B, Oakes EJ, Imrie H, Dickinson AJ, Perros P, Kendall-Taylor P,Pearce SH 2003 CTLA4 gene and Graves’ disease: association of Graves’disease with the CTLA4 exon 1 and intron 1 polymorphisms, but not with thepromoter polymorphism. Clin Endocrinol (Oxf) 58:732–735
43. Ban Y, Concepcion ES, Villanueva R, Greenberg DA, Davies TF, Tomer Y2004 Analysis of immune regulatory genes in familial and sporadic Graves’disease. J Clin Endocrinol Metab 89:4562–4568
44. Frydecka I, Daroszewski J, Suwalska K, Zoledziowska M, Tutak A, SlowikM, Potoczek S, Dobosz T 2004 CTLA-4 (CD152) gene polymorphism at po-sition 49 in exon 1 in Graves’ disease in a Polish population of the LowerSilesian region. Arch Immunol Ther Exp (Warsz) 52:369–374
45. Furugaki K, Shirasawa S, Ishikawa N, Ito K, Ito K, Kubota S, Kuma K. TamaiH, Akamizu T, Hiratani H, Tanaka M, Sasazuki T 2004 Association of theT-cell regulatory gene CTLA4 with Graves’ disease and autoimmune thyroiddisease in the Japanese. J Hum Genet 49:166–168
46. Nakkash-Chmaisse H, Makki RF, Abdelhamid E, Fakhoury H, Salti NN,Salti I 2004 CTLA-4 gene polymorphism and its association with Graves’disease in the Lebanese population. Eur J Immunogenet 31:141–143
47. Wang PW, Liu RT, Juo SH, Wang ST, Hu YH, Hsieh CJ, Chen MH, Chen IY,Wu CL 2004 Cytotoxic T lymphocyte-associated molecule-4 polymorphismand relapse of Graves’ hyperthyroidism after antithyroid withdrawal. J ClinEndocrinol Metab 89:169–173
48. Ban Y, Tozaki T, Taniyama M, Tomita M, Ban Y 2005 Association of a CTLA-43� untranslated region (CT60) single nucleotide polymorphism with autoim-mune thyroid disease in the Japanese population. Autoimmunity 38:151–153
49. Iwama S, Ikezaki A, Kikuoka N, Kim HS, Matsuoka H, Yanagawa T, SatoH, Hoshi M, Sakamaki T, Sugihara S 2005 Association of HLA-DR, DQgenotype and CTLA-4 gene polymorphism with Graves’ disease in Japanesechildren. Horm Res 63:55–60
50. Petrone A, Giorgi G, Galgani A, Alemanno I, Corsello SM, Signore A, DiMario U, Nistico L, Cascino I, Buzzetti R 2005 CT60 single nucleotide poly-morphisms of the cytotoxic T-lymphocyte-associated antigen-4 gene region isassociated with Graves’ disease in an Italian population. Thyroid 15:232–238
51. Sahin M, Erdogan MF, Erdogan G 2005 Cytotoxic T lymphocyte-associated
molecule-4 polymorphisms in Turkish Graves’ disease patients and associationwith probability of remission after antithyroid therapy. Eur J Intern Med16:352–355
52. Weng YC, Wu MJ, Lin WS 2005 CT60 single nucleotide polymorphism of theCTLA-4 gene is associated with susceptibility to Graves’ disease in the Tai-wanese population. Ann Clin Lab Sci 35:259–264
53. Cho HJ CJ, Kim IS, Kim HJ, Cho SH, Ki CS, Kim JW 2006 Lack of a geneticassociation between the CTLA-4 gene and Grave’s disease in Koreans. Thyroid16:237–241
54. Ikegami H, Awata T, Kawasaki E, Kobayashi T, Maruyama T, Nakanishi K,Shimada A, Amemiya S, Kawabata Y, Kurihara S, Tanaka S, Kanazawa Y,Mochizuki M, Ogihara T 2006 The association of CTLA4 polymorphism withtype 1 diabetes is concentrated in patients complicated with autoimmunethyroid disease: a multicenter collaborative study in Japan. J Clin EndocrinolMetab 91:1087–1092
55. Braun J, Donner H, Siegmund T, Walfish PG, Usadel KH, Badenhoop K 1998CTLA-4 promoter variants in patients with Graves’ disease and Hashimoto’sthyroiditis. Tissue Antigens 51:563–566
56. Heward JM, Allahabadia A, Carr-Smith J, Daykin J, Cockram CS, GordonC, Barnett AH, Franklyn JA, Gough SC 1998 No evidence for allelic associ-ation of a human CTLA-4 promoter polymorphism with autoimmune thyroiddisease in either population-based case-control or family-based studies. ClinEndocrinol (Oxf) 49:331–334
57. Chen QY, Nadell D, Zhang XY, Kukreja A, Huang YJ, Wise J, Svec F,Richards R, Friday KE, Vargas A, Gomez R, Chalew S, Lan MS, Tomer Y,Maclaren NK 2000 The human leukocyte antigen HLA DRB3*020/DQA1*0501haplotype is associated with Graves’ disease in African Americans. J ClinEndocrinol Metab 85:1545–1549
58. Donner H, Braun J, Seidl C, Rau H, Finke R, Huang YJ, Wise J, Svec F,Richards R, Friday KE, Vargas A, Gomez R, Chalew S, Lan MS, Tomer Y,Maclaren NK 1997 Codon 17 polymorphism of the cytotoxic T lymphocyteantigen 4 gene in Hashimoto’s thyroiditis and Addison’s disease. J Clin En-docrinol Metab 82:4130–4132
59. Petrone A, Giorgi G, Mesturino CA, Capizzi M, Cascino I, Nistico L, OsbornJ, Di Mario U, Buzzetti R 2001 Association of DRB1*04-DQB1*0301 haplotypeand lack of association of two polymorphic sites at CTLA-4 gene with Hashi-moto’s thyroiditis in an Italian population. Thyroid 11:171–175
60. Brix TH, Kyvik KO, Christensen K, Hegedus L 2001 Evidence for a major roleof heredity in Graves’ disease: a population-based study of two Danish twincohorts. J Clin Endocrinol Metab 86:930–934
61. Tomer Y BG, Greenberg DA, Concepcion E, Davies TF 1999 Mapping themajor susceptibility loci for familial Graves’ and Hashimoto’s diseases: evi-dence for genetic heterogeneity and gene interactions. J Clin Endocrinol Metab84:4656–4664
62. Simmonds MJ, Gough SC 2004 Unravelling the genetic complexity of auto-immune thyroid disease: HLA,CTLA-4 and beyond. Clin Exp Immunol 136:1–10
63. Smyth D, Cooper JD, Collins JE, Heward JM, Franklyn JA, Howson JM,Vella A, Nutland S, Rance HE, Maier L, Barratt BJ, Guja C, Ionescu-Tirgo-viste C, Savage DA, Dunger DB, Widmer B, Strachan DP, Ring SM, WalkerN, Clayton DG, Twells RC, Gough SC, Todd JA 2004 Replication of anassociation between the lymphoid tyrosine phosphatase locus (LYP/PTPN22)with type 1 diabetes, and evidence for its role as a general autoimmunity locus.Diabetes 53:3020–3023
64. Bottini N, Musumeci L, Alonso A, Rahmouni S, Nika K, Rostamkhani M,MacMurray J, Meloni GF, Lucarelli P, Pellecchia M, Eisenbarth GS, ComingsD, Mustelin T 2004 A functional variant of lymphoid tyrosine phosphatase isassociated with type I diabetes. Nat Genet 36:337–338
65. Ayadi H, Hadj Kacem H, Rebai A, Farid NR 2004 The genetics of autoimmunethyroid disease. Trends Endocrinol Metab 15:234–239
66. Ioannidis JP, Trikalinos TA, Khoury MJ 2006 Implications of small effect sizesof individual genetic variants on the design and interpretation of geneticassociation studies of complex diseases. Am J Epidemiol 164:609–614
67. Schneider H, Downey J, Smith A, Zinselmeyer BH, Rush C, Brewer JM, WeiB, Hogg N, Garside P, Rudd CE 2006 Reversal of the TCR stop signal byCTLA-4. Science 313:1972–1975
68. Butty V, Roy M, Sabeti P, Besse W, Benoist C, Mathis D 2007 Signatures ofstrong population differentiation shape extended haplotypes across the humanCD28, CTLA4, and ICOS costimulatory genes. Proc Natl Acad Sci USA104:570–575
JCEM is published monthly by The Endocrine Society (http://www.endo-society.org), the foremost professional society serving theendocrine community.
3170 J Clin Endocrinol Metab, August 2007, 92(8):3162–3170 Kavvoura et al. • CTLA-4 Polymorphisms and AITD
at Univ of Ioannina Central Lib on September 12, 2007 jcem.endojournals.orgDownloaded from

APPENDIX 1
Equation for the calculation of the attributable fraction
∑Previ (OR-1)AF= ⎯⎯⎯⎯⎯⎯⎯⎯⎯ 1+∑Previ (OR-1)
i1=1 copy of the GG haplotype,
i2 =2 copies of the GG haplotype,
i3=1 copy of the AG haplotype,
i4 =2 copies of the AG haplotype
1

FIGURE A1: Flow diagram for studies included or excluded from the meta-analysis according to
eligibility criteria.
2

Table A1. Characteristics of studies included in the meta-analyses
Country Racial
descent
Selection/characteristics of cases and controls
(age range ) [mean]
Eligible subjects First author,
year
USA Caucasians Unrelated GD patients per clinical and laboratory evidence of thyrotoxicosis, palpable diffuse goitre, and absence of other causes of thyrotoxicosis, such as multinodular goitre. Most patients had ≥1 of the following, exophthalmos, positive antimicrosomal or anti-TG Abs, or diffuse isotope distribution on scan. [male:19.5%]
Unrelated local subjects without clinical evidence or family history of autoimmune thyroid diseases. Subjects positive for antimicrosomal or anti-TG Abs were excluded.
133 85 Yanagawa, 1995 20
China Asians GD patients not otherwise specified. One patient had myasthenia gravis
Ethnically-, age- and sex matched healthy controls with no family history of autoimmune disease
129 124 Nistico, 1996 19
Canada, Germany
Caucasians GD patients not otherwise specified. Random healthy controls with no family history of DM, GD, or other autoimmune disorders.
305 325 Donner, 1997a 21
Canada, Germany
Caucasians HT patients defined by the presence of goitre, hypothyroidism, and elevated anti-MS or anti-TPO Abs
Healthy controls randomly collected from Germany and Canada, with no family history of T1DM, GD, HT, or AD.
73 466 Donner, 1997b 58
UK Caucasians GD patients defined by the presence of anti-Tg and/or anti-TPO Abs and eye signs when present [male: 46.4%]. Patients with autoimmune hypothyroidism diagnosed by the need for T4 replacement and anti-TG and/or anti-TPO Abs [male: 6.8%]
Healthy local controls with no clinical evidence or family history of thyroid disease [male: 49.5%].
GD:112, HT: 44
91 Kotsa, 1997 22
China Asians GD patients not otherwise specified Local controls not otherwise specified 28 94 Marron, 1997 23
Japan Asians Unrelated Japanese AITD patients as following:
GD, HT, primary hypothyroidism with TBII or idiopathic myxedema without TBII)
Unaffected, unrelated Japanese individuals, [male: 44.2%].
GD: 21, HT: 18, PH: 20, IM: 14
113 Sale, 1997 24
Japan Asians Unrelated Japanese GD patients per clinical and laboratory evidence of thyrotoxicosis, positive anti-TR Abs, palpable diffuse goiter
Unrelated Japanese subjects without family history or clinical evidence or family history of any autoimmune disease
153 200 Yanagawa, 1997 25
Japan Asians GD and HT patients per clinical findings, thyroid function (thyroid hormones and TSH, levels of thyroidal Abs, U/S examination, and thyroidal 123I uptake, mean age at onset 36.9yrs(12-72)[GD], 43.1 yrs (12-73) [HT]
Healthy subjects randomly selected GD: 108 HT:88
344 Awata, 1998 26
Germany Canada
Caucasians German and Canadian GD patients with hyperthyroidism and endocrine opthalmopathy or
German and Canadian healthy subjects with no family history of GD, HT, IDDM or
GD:125 HT: 64
173 Braun, 1998 55
3

4
elevated anti TR Abs. German and Canadian HT patients with hypoithyroidism, elevated anti MS or anti TPO Absamd low echogenicity in thyroid US
other autoimmune disease
France Caucasians GD patients per clinical, immunological and biological criteria and not solely on the presence of thyroid auto-Abs [male: 19.2%]
Healthy blood donors 73 100 Djilali-Saiah, 1998 27
UK Caucasians GD patients recruited from thyroid clinics in Birmingham and Hong-Kong, per the presence of positive anti-TPO and/or anti-TG Abs, a diffuse goitre and biochemical evidence of thyrotoxicosis.
Asians
Patients with autoimmune hypothyroidism per the presence of positive anti-TPO and/or anti-TG Abs and biochemical evidence of hypothyroidism.
Random, healthy Caucasian contols recruited from the Blood Transfusion Centre, Birmingham and from hospital staff, none with family history of these autoimmune diseases and Chinese controls from the University of Hong-Kong.
GD Cauc: 192 Chin: 98 AH: Cauc: 92
355 Heward, 199856
UK Caucasians GD patients per the presence of biochemical hyperthyroidism and 2 of the following: diffuse goitre; positive anti-TPo, anti-Tg, or anti-TR Abs; and dysthyroid eyes.
Ethnically matched controls with no history of autoimmune disease recruited from the Blood Transfusion Service, Birmingham
379 363 Heward, 1999 19
Japan
Asians Unrelated individuals with AITD (GD, HT, primary hypothyroidism with TBII or hypothyroidism without TBII)
Unaffected unrelated controls GD:235 HT: 106
239 Akamizu, 2000 28
USA AfricanAmericans
GD patients per clinical presentation , histories, physical findings(diffuse goitre, proptosis and/or exophthalmos) and laboratory findings of hyperthyroidism and anti-TR Abs, mean age at onset 49 ± 12yrs(17-73)
Healthy laboratory staff, hospital volunteers, subjects with multinodular goitre with no exophthalmos, no family history of GD, no anti-TSHR Abs (47.2±12.3 yrs)
49 47 Chen, 2000 60
Russia Caucasians GD patients not otherwise specified, [male: 17.9%], (39.3± 11.6 yrs)
Healthy controls with no autoimmune, cardiovascular, or other disorders [male: 32.3%], (36.5±12.5yrs)
78 93 Chistyakov, 2000 29
USA Caucasians GD patients per clinical and laboratory evidence of hyperthyroidism and diffuse goitre, and presence of anti-Tg and/or anti-TPO Abs, or exophthalmos. HT patients per presence of hypothyroidism, goitre, and anti-TG and /or anti-TPO Abs.
Healthy donors not otherwise specified GD: 45, HT: 18
43 Kouki, 2000 30
Korea Asians GD patients per clinical and laboratory criteria (elevated serum T4, T3 levels, undetecTable TSH, and diffuse goitre with increased 99mTcO4
thyroidal uptake
HT patients per presence of anti-TG and/or anti-TPO Abs in euthyroid or hypothyroid subjects with diffuse goitre
Healthy controls with no clinical evidence or family history of T1DM, autoimmune thyroiditis, or other autoimmune disorders, negative anti- TG, TPO, TBII Abs
GD: 97 HT: 110
199 Park, 2000 31
Tunisia NorthernAfricans
GD patients per clinical and laboratory evidence of thyrotoxicosis, palpable diffuse goiter, high thyroid hormonal rates, positive anti-TRA, anti-TPO, and/or anti-TG Abs [male:20.1%]
Unrelated healthy subjects from the same area with no clinical evidence or family history of AITD and inflammatory JOint disease [male: 48.8%]
144 205 Hadj-Kacem, 2001 32
Italy Caucasians HT patients per clinical and laboratory evidence of hypothyroidism and with two of the following criteria: palpable diffuse goiter,
Ethnically matched controls with no history of autoimmune disease collected at Blood Transfusion Service of University
126 301 Petrone, 2001 59

high titer of anti-MS Abs, anti-Tg Abs, or anti-TPOAb, age of onset 14 - 63 yrs, 36% had goiter, 88% were positive for anti-TPO Abs, 89% for anti-TG Abs, 92% for anti-MS Abs.
of Rome “La Sapienza.
Japan Asians GD patients per the history and signs of hyperthyroidism with diffuse goiter and the laboratory findings, (elevated serum T4 and T3 concentrations, undetecTable serum TSH, and positive TRAb [TBII or TSAb])
Healthy control subjects with no clinical evidence of autoimmune thyroid disease or other autoimmune disorders.
144 110 Kinjo, 2002 33
USA Caucasians GD patients per clinical and laboratory evidence of hyperthyroidism, diffuse goiter and supported by the presence of thyroglobulin and/or anti-TPO-Abs, or exopthalmos
Healthy donors 120 80 Kouki, 2002 34
Japan Asians HT patients per positive thyroid autoantibodies, anti-TPOAb and/or TgAb and at least 1 or 2 additional criteria (hypothyroidism and/or goiter) [male: 11.9%]
Randomly selected control subjects with no family history of T1DM, GD, or other autoimmune diseases, all living in Okinawa, Japan.
143 199 Tomoyose, 2002 35
China Chinese Unrelated consecutive patients with GD from the Paediatric Endocrine Clinic, all <15 yrs of age at diagnosis, per clinical and laboratory criteria. Transient neonatal hyperthyroid cases were excluded, [male: 15.4%]
Unrelated healthy children <15 yrs of age without clinical evidence or family history of any autoimmune thyroid disease, all negative for thyroid auto-Abs, [male: 50%]
123 158 Yung, 2002 36
Poland Caucasians
Unrelated, consecutive GD patients, subgrouped by the presence of TAO per NOSPECS classification, per the presence of hyperthyroidism, diffuse goitre, positive TRAb and/or increased 131I uptake, [male: 20.4%] (13-78 yrs [43]).
Randomly selected anonymous healthy Polish from the Blood Transfusion Centre, Medical University of Warsaw.
301
309
Bednarczuk, 2003 37
Japan Asians Unrelated, consecutive GD patients, subgrouped by the presence of TAO per NOSPECS classification, per presence of hyperthyroidism, diffuse goitre, positive TRAb and/or increased 131I uptake, [male: 22.8%] (13-78 yrs [38]).
Unrelated healthy subjects from hospital staff at Kurume University School of Medicine, with no personal or family history of thyroid or other autoimmune disorders.
287 95 Bednarczuk, 2003 37
(extended)
Iran Iranians Unrelated GD patients per clinical examination (diffuse goitre), laboratory evaluation (T4, T3, TSH), CT scan of the orbit, or elevated 131I uptake.
Age/sex matched healthy blood donors, with no clinical evidence or family history of autoimmune diseases.
90 90 Kalantari, 2003 38
Japan Asians AITD patients (16 with positive TR Ab hyperthyroidism), < 16 yrs at onset.
Nondiabetic, non-AITD age- matched control subjects
AITD=20 GD=16
60 Mochizuki, 2003 39
USA Caucasians GD patients per clinical and laboratory evidence of hyperthyroidism, diffuse goitre, positive tests for antithyroid Abs, and often TAO.
Normal controls not otherwise specified. 37 34 Takara, 2003 40
Japan Asians Japanese HT patients with anti-TPO Abs,and palpable diffuse goiter. Males were excluded due to small numbers
Japanese subjects with no clinical evidence or a family history of autoimmune diseases
70 105 Terauchi, 2003 41
UK Caucasians Unrelated GD patients subgrouped by the presence of TAO per NOSPECS classification [male: 21.3%]
Ethnically matched healthy local controls. GD=301 TAO=124
349 Vaidya, 2003 42
UK Caucasians UK-born GD patients recruited from thyroid Ethnically matched controls with no history 672 844 Ueda, 2003 3
5

clinics on Exeter, Birmingham, and Bournemouth of autoimmune diseases from various sites (Blood Transfusion Service, Birmingham, Heartlands and Queen Elisabeth Hospital, Birmingham)
USA Caucasians GD patients per documented clinical and biochemical evidence of past or present hyperthyroidism requiring treatment and presence of at least one: positive TR Abs, exophthalmos, and/ or diffuse thyroid scan.
Age- and sex-matched healthy controls. 160 150 Ban, 2004 43
Poland Caucasians Unrelated, randomly selected GD patients per presence of hyperthyroidism diffuse goitre, detectable TR Abs and /or increased 131I uptake. TAO was considered as having proptosis, extraocular-muscle dysfunction, exposure keratitis, and optic neuropathy (NOSPECS class III or higher) (20-82[50±11yrs]).
Age- and sex – matched healthy subjects from the same area.
98 136 Frydecka, 2004 44
Japan Asians HT and GD patients per clinical findings and results of routine examinations: T3, T4 and TSH concentrations, serum levels of anti-TR anti-anti- Tg and anti-S- Abs, U/S, 99mTCO4- (or 123I) uptake and thyroid scintigraphy. Patients with atrophic thyroiditis diagnosed by the existence of blocking-type, anti-TSH receptor antibodies were excluded.
Unrelated healthy controls not otherwise specified
GD=235 HT=173 AITD=380
266 Furugaki, 2004 45
Lebanon Lebanese Unrelated GD patients from the American University of Beirut Medical School, per WHO criteria (biochemical hyperthyroidism with one of the following: diffuse goitre and/or TAO and presence of anti-TG AB and/or anti-TPO Abs).
Normal individuals with no clinical evidence or family history of thyroid or other autoimmune disease.
34 38 Nakkash-Chmaisse,2004 46
Taiwan Asians GD patients from the Endocrine Clinic with elevated serum T4 and/or T3 and suppressed TSH levels, diffusely increased thyroidal uptake of 99mTc or 131I, and the presence of TR Abs and/or anti-MS Abs. Only patients who completed a treatment course of at least 1 yr and had adequate follow-up after drug withdrawal were included. Patients with a history of radioiodine therapy or previous thyroid surgery were excluded, [male: 17.6%] (38±13yrs).
Healthy subjects without clinical evidence or family history of any autoimmune disease, in euthyroid state according to the laboratory tests and with no obvious goitre as examined by one of the authors, [males: 54.4%] (53±11yrs)
148 171 Wang, 2004 47
Japan Asians GD patients per clinical and biochemical confirmation of hyperthyroidism (diffuse goitre, elevated 131I uptake and elevated T3 and T4. HT patients with clinical hypothyroidism requiring thyroid hormone replacement therapy and anti-TPO Abs with or without anti-TG Abs.
Age- and sex-matched healthy Japanese volunteers, with no personal or family history of autoimmune disease
GD=131 HT=133
179 Ban, 2005 48
Japan Asians Unrelated childhood onset GD patients per presence or TRAb, palpable diffuse goitre, exophthalmos, tachycardia, and absence of other
Controls not otherwise specified 43 200 Iwama, 2005 49
6

cause or hyperthyroidism, age at onset 3-16yrs (median: 11.4), [male:23.3%]
Italy Caucasians Consecutive series of GD cases per clinical and laboratory evidence of thyrotoxicosis, with two of the following: palpable diffuse goitre, diffuse 131I uptake and a significant title of anti-MS, anti-Tg, and anti-TR Abs. TAO per NOSPEC classification [males:14%] mean age at onset: 41±13yrs
Sex- age- matched controls from the same geographical area, with no history of autoimmune disease from the Blood Tranfusion Service of the University of Rome “La Sapienza”
150 301 Petrone, 2005 50
Turkey Caucasians GD patients per clinical and laboratory evidence of hyperthyroidism and diffuse goitre, presence of TRAb, increased 131I uptake, and/or exophthalmos [male:27.3%] (42.27±13.43yrs)
Healthy controls with no goitre, no clinical evidence of GD, and no family history of any autoimmune disease, euthyroids according to laboratory tests. Only 13 controls had anti-TPO Abs, [male:35.7%] (41.92±14.4yrs).
77 98 Sahin, 2005 51
Taiwan Asians Unrelated Taiwanese GD patients randomly selected from a series of patients, per clinical and laboratory results including diffuse enlargement of thyroid gland, raised T4 or T3, levels, suppressed TSH levels, opthalmopathy and presence of anti-MS Abs and/or anti-TG Abs, [male:27.7%], (34.0±11.8yrs)
Geographically and ethnically matched healthy controls with negative family history of T1DM, autoimmune thyroid disease, or other autoimmune disorders.
107 101 Weng, 2005 52
Korea Asians Unrelated Koreans with GD per clinical and laboratory criteria [male:32%] (38.8±12.9yrs)
Healthy subjects with no clinical evidence or family history of T1DM, autoimmune thyroid disease, or other autoimmune disorders [male:22.7%] (40.6±9.9yrs)
278 472 Cho, 2006 53
Japan Asians AITD patients defined as GD, HT, or positivity for anti-TPO and/or anti-Tg Abs. GD and HT were diagnosed by endocrinologists clinically and confirmed by laboratory findings [male:16.8%](age at onset:40.8.±14.1yrs)
Controls not otherwise specified [male:42.6] (36.7±13.5)
GD:213 HT:132
723 Ikegami, 2006 54
Japan Asians GD patients per clinical and biochemical confirmation of hyperthyroidism (diffuse goitre, elevated 131I uptake and elevated T3 and T4. HT patients with clinical hypothyroidism requiring thyroid hormone replacement therapy and anti-TPO Abs with or without anti-TG Abs.
Age- and sex-matched healthy Japanese volunteers, with no personal or family history of autoimmune disease
GD:302 HT:183
179 Ban (unpublished)
Russia Caucasians Unrelated GD patients randomly selected from Moscow and Moscow area, diagnosed through detection of the thyroid enlargement per US and palpation, immunological tests (presence of anti-TSHR, anti-Tg and anti-TPO Abs) and biochemical measurements (elevated T3 and T4). patients, [males: 18.7%] [36.6±12.9 yrs]
Unrelated random control subjects from Moscow and Moscow area, sex- and ethnically matched, no personal or family history of any autoimmune disease (AITD, type 1 diabetes and others) [males 19.4%] [34.1±11.7 yrs] .
139 155 Chistyakov(unpublished)
Iran Iranians Unrelated GD patients per clinical examination, laboratory evaluation (T4, T3, TSH), CT scan of the orbit, or elevated 131I uptake. Unrelated HT patients with clinical hypothyroidism requiring
Sex matched healthy blood donors, with no clinical evidence or family history of autoimmune disorders.
GD:44 HT:38
100 Ghaderi, (unpublished)
7

thyroid hormone replacement therapy, positive for anti-TPO Ab and/or anti-Tg Ab.
8

Table A2. Meta-analyses of group-level data for various contrasts of A49G polymorphism in the cytotoxic T-lymphocyte associated antigen-4 (CTLA-
4) gene and susceptibility to Graves ’ disease and Hashimoto thyroiditis
G R A V E S’ D I S E A S E H A S H I M O T O T H Y R O I D I T I S
Contrast and racial
descent group
No. of
studies
Total sample
size (n)*
Random
effects 95 % CI
I2
(%)
No. of
studies
Total sample
size (n)*
Random
effects 95% CI
I2
(%)
G vs. A allele
All
32
22038
1.49
1.34-1.66
64
12
8958
1.29
1.11-1.50
54
Asians 15
9800 1.54 1.36-1.75 38 7 4530 1.31 1.02-1.68 71
Caucasians 11 10210 1.55 1.33-1.80 66 4 4158 1.30 1.11-1.52 0
G/G vs. A/A genotype
All
30
5778
2.13
1.72-2.62
51
12
2447
1.95
1.50-2.52
19
Asian 14 2696 2.17 1.72-2.74 0 7 1287 2.16 1.37-3.40 50
Caucasian 10 2550 2.28 1.72-3.03 55 4 1083 1.76 1.25-2.47 0
G/G vs. other genotypes
All
30
10338
1.70
1.43-2.01
64
12
4490
1.29
1.01-1.64
58
Asian 14 4557 1.67 1.32-2.14 70 7 2276 1.19 0.84-1.70 75
Caucasian 10 4767 1.83 1.46-2.29 47 4 2079 1.40 1.04-1.90 0
9

Other vs. A/A genotype
All
30
10338
1.62
1.36-1.92
55
12
4560
1.64
1.25-2.15
47
Asian 14
4557 1.77 1.37-2.30 22 7 2346 2.12 1.52-2.96 17
Caucasian 12 4767 1.68 1.38-2.05 51 4 2079 1.40 0.97-2.00 50
* Total sample sizes comprise both cases (GD or HT, respectively) and controls. Two studies had no genotype-level data. Beside the studies of Asian and Caucasian ‘racial’ descent, one study had
African American subjects,one Northern African descent subjects, one Turkish descent subjects, one Lebanese descent subjects and two Iranian descent subjects and these have not been included in
either the Asian or the Caucasian descent subgroup.
10

Table A3: Distribution of CTLA-4 genotypes in GD patients – A49G polymorphism
Author, year Racial
descent
G/
GD
(%)
G
Controls
(%)
G/
GD
(%)
A
Controls
(%)
A/
GD
(%)
A
Controls
(%)
G allele frequency
GD Controls
(%) (%)
Nistico, 1996 Asians - - - - - - 36.4 31.0
Yanagawa, 1997 Asians 78/153
(51.0)
78/200
(39.0)
64/153
(41.8)
88/200
(44.0)
11/153
(7.2)
34/200
(17.0)
71.9
61.0
Donner, 1997 a Caucasians 63/305
(20.6)
41/325
(12.6)
161/305
(52.8)
149/325
(45.9)
81/305
(26.6)
135/325
(41.5)
37.8 49.7
Marron, 1997 Asians 16/28
(57.1)
49/94
(52.1)
11/28
(39.3)
39/94
(41.5)
1/28
(3.6)
6/94
(6.4)
76.8 72.8
Djilali-Saiah, 1998 Caucasians 13/73
(17.8)
16/100
(16.0)
37/73
(50.7)
37/100
(37.0)
23/73
(31.5)
47/100
(47.0)
43.2 34.5
Awata, 1998 Asians 57/107
(50.0)
137/344
(39.8)
43/108
(39.8)
163/344
(47.4)
11/108
(10.2)
44/344
(12.8)
69.9 63.5
Park, 2000 Asians 57/97
(58.7)
98/199
(49.2)
35/97
(36.1)
75/199
(37.7)
5/97
(5.2)
26/199
(13.1)
76.8 68.1
11

Kouki, 2000 Caucasians 8/45
(17.8)
5/43
(11.6)
29/45
(64.4)
23/43
(53.5)
8/45
(17.8)
15/43
(34.9)
50.0
38.4
Chen, 2000 African
American
4/49
(8.2)
5/47
(10.6)
25/49
(51.0)
19/47
(40.4)
20/49
(40.8)
23/47
(49.0)
33.7 30.9
Chistyakov, 2000
Chistyakov, 2006
(unpublished)
Caucasians
50/78
(64.1)
68/139
(48.9)
30/93
(32.2)
39/155
(25.2)
22/78
(28.2)
49/139
(35.3)
38/93
(40.9)
60/155
(38.7)
6/78
(7.7)
22/139
(15.8)
25/93
(26.9)
56/155
(36.1)
78.2
66.5
52.7
44.5
Hadj-Kacem, 2001 Northern
Africans
50/144
(34.7)
85/205
(41.5)
63/144
(43.8)
94/205
(45.8)
31/144
(21.5)
26/205
(12.7)
56.6 64.4
Kinjo, 2002 Asians 50/144
(34.7)
26/110
(23.6)
62/144
(43.1)
46/110
(41.8)
32/144
(22.2)
38/110
(34.6)
56.3 44.5
Yung, 2002 Asians 66/123
(53.7)
76/158
(48.1)
54/123
(43.9)
59/158
(37.3))
3/123
(2.4)
23/158
(14.6)
75.6 66.8
Kalantari, 2003
Iranians 20/90
(22.2)
7/90
(7.8)
49/90
(54.5)
53/90
(58.9)
21/90
(23.3)
30/90
(33.3)
49.4
37.2
Vaidya, 2003 Caucasians 74/301 45/158 139/301 158/349 88/301 146/349 47.6 78.5
12

(24.6)
(12.9) (46.2) (45.2) (29.2) (41.8)
Bednarczuk, 2003
Caucasians
80/301
(26.6)
60/307
(19.5)
134/301
(44.5)
139/307
(45.3)
87/301
(28.9)
108/307
(35.2)
48.8 42.2
Bednarczuk, 2003
(extended)
Asians
134/287
(46.7)
31/95
(32.6)
128/287
(44.6)
51/95
(53.7)
25/287
(8.7)
13/95
(13.7)
68.9 59.5
Mochizuki, 2003 Asians 10/16
(62.5)
21/60
(35.0)
5/16
(31.3)
27/60
(45.0)
1/16
(6.3)
12/60
(20.0)
78.1 57.5
Ueda, 2003 Caucasians 123/657
(18.7)
111/842
(13.2)
332/657
(50.5)
402/842
(47.7)
202/657
(30.7)
329/842
(39.1)
44.0 37.1
Frydecka, 2004 Caucasians 17/98
(17.3)
20/105
(14.7)
49/98
(50.0)
53/105
(39.0)
32/99
(32.7)
32/105
(23.5)
42.3 44.3
Wang, 2004 Asians 87/148
(58.8)
81/171
(47.4)
50/148
(33.8)
72/171
(42.1)
11/148
(7.4)
18/171
(10.5)
75.7 68.4
Nakkash-
Chmaisse, 2004
Lebanese 3/34
(8.8)
0/38
(0.0)
23/34
(67.6)
14/38
(36.8)
8/34
(23.5)
24/38
(63.2)
42.6 18.4
Ban, 2004 Caucasians - - - - - - 40.6 30.0
Iwama, 2005 Asians 17/43
(39.5)
78/200
(39.0)
25/43
(58.2)
88/200
(44.0)
1/43
(2.3)
34/200
(17.0)
68.6 61.0
13

Petrone, 2005 Caucasians 23/150
(15.3)
24/301
(8.0)
68/150
(45.4)
138/301
(45.8)
59/150
(39.3)
139/301
(46.2)
38.0
30.1
Weng, 2005 Asians 78/107
(72.9)
54/101
(53.4)
27/107
(25.2)
45/101
(44.6)
2/107
(1.9)
2/101
(2.0)
85.5 75.7
Sahin, 2005 Turkish 15/77
(19.5)
7/98
(7.1)
33/77
(42.8)
48/98
(49.0)
29/77
(37.7)
43/98
(43.9)
40.9 31.6
Cho, 2006 Asians 155/278
(55.8)
245/472
(51.9)
108/278
(38.8)
197/472
(41.7)
15/278
(5.4)
30/472
(6.4)
75.2 72.8
Ban, 2006
(unpublished)
Asians 147/302
(48.7)
69/179
(38.5)
12/302
(42.4)
85/179
(47.5)
27/302
(8.9)
25/179
(14.0)
50.7 62.3
Akamizu, 2006
(unpublished)
Asians 112/222
(47.7)
103/234
(44.0)
98/222
(41.7)
104/234
(44.4)
12/222
(5.1)
27/234
(11.3)
72.5 66.2
Ghaderi, 2006
(unpublished)
Iranians 3/44
(6.8)
8/98
(8.2)
15/44
(34.1)
46/98
(46.9)
26/44
(59.1)
44/98
(44.9)
23.9 31.6
Genotype data were available for 4,562 GD cases and 5,960 controls, because two studies 19,43 provided only allele frequencies.
14

Table A4: Distribution of CTLA-4 genotypes in HT patients – A49G polymorphism
Author, year Racial
descent
G/
HT
(%)
G
Controls
(%)
G/
HT
(%)
A
Controls
(%)
A/
HT
(%)
A
Controls
(%)
G allele frequency
HT Controls
(%) (%)
Donner, 1997 b Caucasians 16/73
(21.9)
68/466
(14.6)
39/73
(53.4)
215/466
(46.1)
18/73
(24.7)
183/466
(39.3)
48.6
37.7
Awata, 1998 Asians 45/88
(51.1)
170/425
(40.0)
37/88
(42.1)
197/425
(46.4)
6/88
(6.8)
58/425
(13.6)
73.8 63.2
Park, 2000 Asians
45/110
(40.9)
98/199
(49.2)
52/110
(49.3)
35/199
(37.7)
13/110
(11.8)
26/199
(13.1)
64.6 58.0
Kouki, 2000 Caucasians
3/18
(16.7)
5/43
(11.6)
8/18
(44.4)
23/43
(53.5)
7/18
(38.9)
15/43
(34.9)
38.9 38.4
Petrone, 2001 Caucasians 16/126
(12.7)
25/301
(8.4)
52/126
(41.3)
138/301
(45.8)
58/126
(46.0)
138/301
(45.8)
33.3 31.2
Tomoyose, 2002 Asians 62/143
(43.3)
62/199
(31.2)
69/143
(48.3)
87/199
(43.7)
12/143
(8.4)
50/199
(25.1)
67.5 53.0
Terauchi, 2003 Asians 30/70 36/105 37/70 48/105 3/70 21/105 69.3 57.1
15

(42.9)
(34.3) (52.9) (45.7) (4.3) (20.0)
Ueda, 2003 Caucasians 33/210
(15.7)
111/842
(13.2)
119/210
(56.7)
402/842
(47.7)
58/210
(27.6)
329/842
(39.1)
44.0 37.1
Ban, 2005 Asians 77/133
(57.9)
95/179
(53.1)
49/133
(36.8)
70/179
(39.1)
7/133
(5.3)
14/179
(7.8)
76.3 72.6
Akamizu, 2006
(unpublished)
Asians 69/139
(49.6)
103/234
(44.0)
61/139
(43.9)
104/234
(44.4)
9/139
(6.3)
27/234
(11.5)
71.6 66.2
Ban, 2006
(unpublished)
Asians 74/183
(40.4)
69/179
(38.5)
92/183
(50.3)
85/179
(47.5)
17/183
(9.3)
25/179
(14.0)
65.6 62.3
Ghaderi, 2006
(unpublished)
Iranians 6/37
(16.2)
8/98
(8.2)
12/37
(32.4)
46/98
(46.9)
19/37
(51.4)
44/98
(44.9)
32.4 31.6
16

Table A5. Meta-analyses of group-level data for various contrasts of the CT60 polymorphism in the cytotoxic T-lymphocyte associated antigen-4
(CTLA-4) gene and susceptibility to Graves’ disease and Hashimoto thyroiditis
G R A V E S’ D I S E A S E H A S H I M O T O T H Y R O I D I T I S
Contrast and racial
descent group
No. of
studies
Total sample
size (n)*
Random
effects 95% CI
I2
(%)
No. of
studies
Total sample
size (n)*
Random
effects 95% CI
I2
(%)
G vs. A allele
All
15
14492
1.45
1.28-1.64
56
6
6172
1.64
1.18-2.26
83
Asians 8 7588 1.60 1.27-2.00 72 4 3780 1.54 1.24-1.92 39
Caucasians 6 6620 1.44 1.31-1.60 0 1 2124 2.83 2.28-3.52 -
G/G vs. A/A genotype
All
14 4192 2.24 1.68-3.00 47 6
1763
2.83
1.42-5.66
76
Asians 8 2505 2.48 1.48-4.14 51 4 1140 2.62 1.67-4.13 -
Caucasians 5 1616 2.38 1.80-3.12 25 1 555 8.40 5.26-13.42 -
G/G vs. other genotypes
All
14 6948 1.62 1.35-1.94 64 6
3087
1.87
1.22-2.88
82
Asians 8 3794 1.70 1.30-2.21 70 4 1890 1.64 1.26-2.14 38
Caucasians 5 2712 1.61 1.22-2.12 61 1 1062 4.15 2.96-5.81 -
17
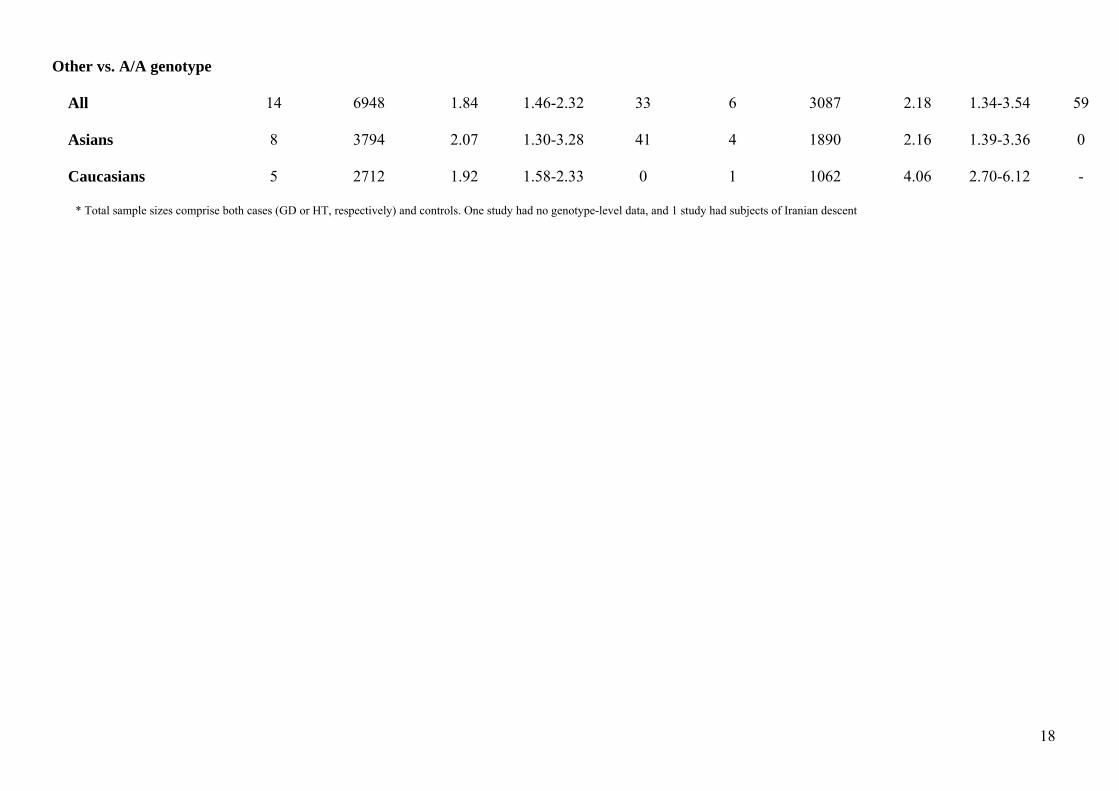
Other vs. A/A genotype
All
14 6948 1.84 1.46-2.32 33 6
3087
2.18
1.34-3.54
59
Asians 8 3794 2.07 1.30-3.28 41 4 1890 2.16 1.39-3.36 0
Caucasians 5 2712 1.92 1.58-2.33 0 1 1062 4.06 2.70-6.12 -
* Total sample sizes comprise both cases (GD or HT, respectively) and controls. One study had no genotype-level data, and 1 study had subjects of Iranian descent
18
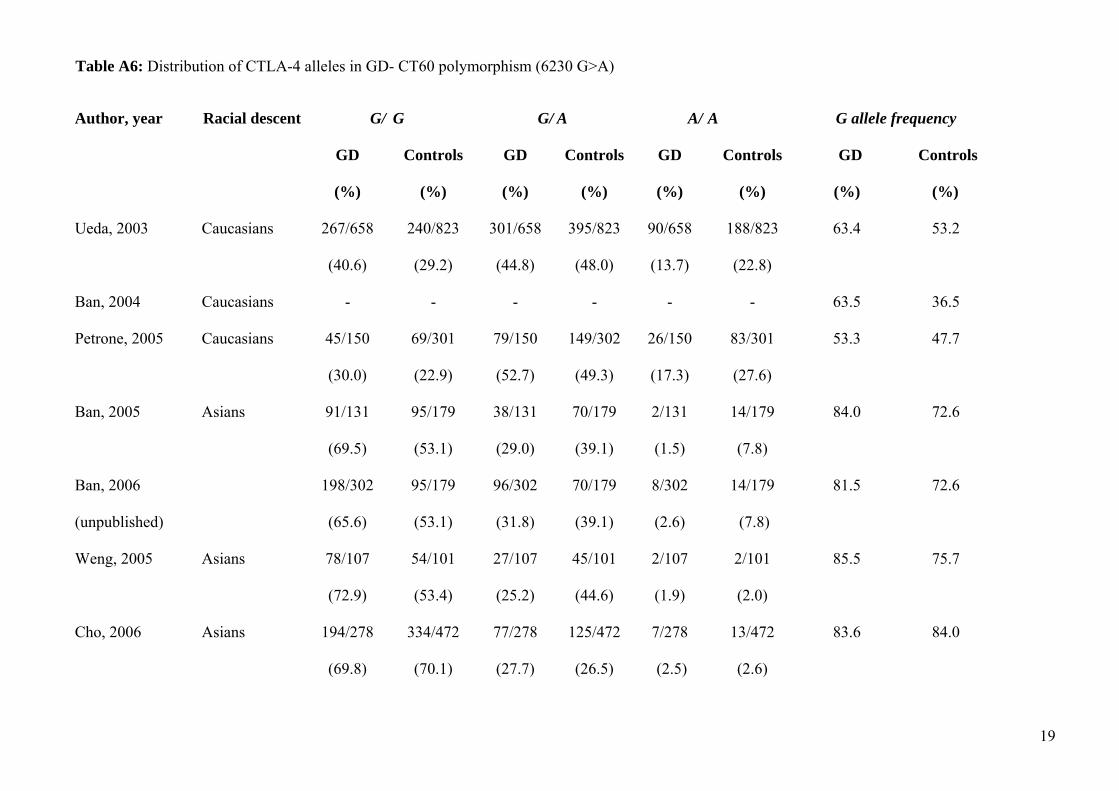
Table A6: Distribution of CTLA-4 alleles in GD- CT60 polymorphism (6230 G>A) Author, year Racial descent G/
GD
(%)
G
Controls
(%)
G/
GD
(%)
A
Controls
(%)
A/
GD
(%)
A
Controls
(%)
G allele frequency
GD Controls
(%) (%)
Ueda, 2003 Caucasians 267/658
(40.6)
240/823
(29.2)
301/658
(44.8)
395/823
(48.0)
90/658
(13.7)
188/823
(22.8)
63.4
53.2
Ban, 2004 Caucasians - - - - - - 63.5 36.5
Petrone, 2005 Caucasians 45/150
(30.0)
69/301
(22.9)
79/150
(52.7)
149/302
(49.3)
26/150
(17.3)
83/301
(27.6)
53.3 47.7
Ban, 2005
Ban, 2006
(unpublished)
Asians 91/131
(69.5)
95/179
(53.1)
198/302
(65.6)
95/179
(53.1)
38/131
(29.0)
96/302
(31.8)
70/179
(39.1)
70/179
(39.1)
2/131
(1.5)
8/302
(2.6)
14/179
(7.8)
14/179
(7.8)
84.0
81.5
72.6
72.6
Weng, 2005 Asians 78/107
(72.9)
54/101
(53.4)
27/107
(25.2)
45/101
(44.6)
2/107
(1.9)
2/101
(2.0)
85.5 75.7
Cho, 2006 Asians 194/278
(69.8)
334/472
(70.1)
77/278
(27.7)
125/472
(26.5)
7/278
(2.5)
13/472
(2.6)
83.6 84.0
19

Ikegami, 2006 Asians 130/213
(61.8)
395/715
(55.2)
71/213
(33.3)
283/715
(39.6)
12/213
(5.6)
37/715
(5.2)
77.6
75.0
Akamizu, 2006
(unpublished)
Asians 140/215
(49.3)
113/207
(54.6)
70/215
(29.8)
79/207
(33.1)
5/215
(2.1)
15/207
(7.2)
81.4 73.7
Bednarczuk, 2006
(unpublished)
Caucasians 140/284
(49.3)
110/298
(36.9)
117/284
(38.9)
146/298
(47.2)
27/284
(9.5)
42/298
(14.1)
69.9 61.4
Chistiakov, 2006
(unpublished)
Caucasians 61/139
(43.9)
33/155
(21.3)
52/139
(37.4)
59/155
(38.1)
26/139
(18.7)
63/155
(40.6)
62.6 40.3
Hiromatsu, 2006
(unpublished)
Asians 180/287
(62.7)
45/95
(47.4)
96/287
(33.5)
40/95
(42.1)
11/287
(3.8)
10/95
(10.5)
79.4 68.4
Frydecka, 2006
(unpublished)
Caucasians 37/98
(37.8)
41/98
(41.8)
51/98
(37.5)
39/98
(39.8)
10/98
(10.2)
18/98
(18.4)
63.8 61.7
Ghaderi, 2006
(unpublished)
Iranians 7/43
(16.3)
20/99
(20.2)
21/43
(48.9)
50/99
(50.5)
15/43
(34.9)
29/99
(29.3)
40.7 45.5
Wang, 2006
(unpublished)
Asians 106/142
(74.7)
81/171
(47.4)
30/142
(21.1)
72/171
(42.1)
6/142
(4.2)
18/171
(10.5)
85.2 68.4
Genotyping data were available for 3155 GD and 4066 healthy subjects, because Ban et al 43 provided data only on the allele frequencies
20

Table A7: Distribution of CTLA-4 alleles in HT- CT60 polymorphism (6230 G>A)
Author, year Racial
descent
G/
HT
(%)
G
Controls
(%)
G/
HT
(%)
A
Controls
(%)
A/
HT
(%)
A
Controls
(%)
G allele frequency
HT Controls
(%) (%)
Ueda, 2003 Caucasians 85/220
(38.6)
111/842
(13.2)
105/220
(46.1)
402/842
(47.7)
30/220
(13.6)
329/842
(39.1)
62.5
37.1
Ban, 2005
Ban, 2006
(unpublished)
Asians 77/133
(57.9)
95/179
103/183
(56.3)
(53.1)
95/179
(53.1)
49/133
(36.8)
70/183
(38.3)
70/179
(39.1)
70/179
(39.1)
7/133
(5.3)
10/183
(5.5)
14/179
(7.8)
14/179
(7.8)
76.3
75.4
72.6
72.6
Ikegami, 2006 Asians 83/132
(62.9)
395/715
(50.2)
45/132
(34.1)
283/715
(39.6)
4/132
(3.0)
37/132
(28.0)
80.5 75.0
Akamizu, 2006
(unpublished)
Asians 84/135
(62.2)
103/234
(44.0)
44/135
(32.6)
104/234
(44.4)
7/135
(5.2)
27/234
(11.5)
78.5 66.2
Ghaderi, 2006
(unpublished)
Iranians 8/36
(22.2)
20/99
(20.2)
17/36
(47.2)
50/99
(50.5)
11/36
(30.6)
29/98
(29.3)
45.8 45.5
21

Table A8: Distribution of CTLA-4 alleles in GD- A49G polymorphism –group-level data of studies where individual-level data are available
Team
(country)
Racial
descent
G/
GD
(%)
G
Controls
(%)
G/
GD
(%)
A
Controls
(%)
A/
GD
(%)
A
Controls
(%)
G allele frequency
GD Controls
(%) (%)
Chistyakov
(Russia)
Caucasians
68/139
(48.9)
39/155
(25.2)
49/139
(35.3
60/155
(38.7)
22/139
(15.8)
56/155
(36.1)
66.5 44.5
Awata
(Japan)
Asians 54/108 137/344
(50.0) (39.8)
43/108
(39.8)
163/344
(47.4)
11/108
(10.2)
44//344
(12.8)
69.9 63.5
Ban
(Japan)
Asians 147/186 69/179
(79.0) (38.5)
12/186
(6.5)
85/179
(47.5)
27/186
(14.5)
25/179
(14.0)
82.3 62.3
Frydecka
(Poland)
Caucasians 17/98
(17.3)
20/105
(19.0)
49/98
(50.5)
53/105
(50.5)
32/98
(32.7)
32/105
(30.5)
42.3 34.2
Bednarczuk
(Poland)
Caucasians 80/301
(26.6)
60/307
(19.5)
134/301
(44.5)
139/307
(45.3)
87/301
(28.9)
108/307
(35.2)
48.8 42.2
Akamizu Asians 112/222 103/234 98/222 104/234 12/222 27/234 72.5 66.2
22

(Japan)
(50.5) (44.0) (44.1) (44.5) (5.4) (11.5)
Hiromatsu
(Japan)
Asians 134/287 31/95
(46.7) (32.6)
128/287
(44.6)
51/95
(53.7)
25/287
(8.7)
13/95
(13.7)
69.0 59.5
Ghaderi
(Iran)
Iranians 3/44
(6.8)
8/98
(8.2)
15/44
(34.1)
46/98
(46.9)
26/44
(59.1)
44/98
(44.9)
23.9 31.6
Wang
(Taiwan)
Asians 87/148 81/171
(58.8) (47.4)
50/148
(33.8)
72/171
(42.1)
11/148
(7.4)
18/171
(10.5)
75.7 68.4
Gough
(UK)
Caucasians 123/657
(18.7)
111/842
(13.2)
332/657
(50.5)
402/842
(47.7)
202/657
(30.8)
329/842
(39.1)
44.0 37.1
23

Table A9: Distribution of CTLA-4 alleles in GD- CT60 polymorphism –group-level data of studies where individual-level data are available
Author, year Racial
descent
G/
GD
(%)
G
Controls
(%)
G/
GD
(%)
A
Controls
(%)
A/
GD
(%)
A
Controls
(%)
G allele frequency
GD Controls
(%) (%)
Chistyakov,
(Russia)
Caucasians
61/139
(43.9)
33/155
(21.3)
52/139
(37.4)
59/155
(38.1)
26/139
(18.7)
63/155
(40.6)
62.6 40.3
Awata,
(Japan)
Asians 71/108 195/344
(65.7) (56.7)
33/108
(30.6)
134/344
(39.0)
4/108
(3.7)
15/344
(4.4)
81.0 76.2
Ban
(Japan)
Asians 198/302
(65.6)
95/179
(53.1)
96/302
(31.8)
70/179
(39.1)
8/302
(2.6)
14/179
(7.8)
81.5 72.6
Frydecka
(Poland)
Caucasians 41/98
(41.8)
37/98
(37.8)
39/98
(39.8)
51/98
(37.5)
18/98
(18.4)
10/98
(10.2)
61.7 63.8
Bednarczuk,
(Poland)
Caucasians 140/284
(49.3)
110/298
(36.9)
117/284
(38.9)
146/298
(47.2)
27/284
(9.5)
42/298
(14.1)
69.9 61.4
Akamizu,
(Japan)
Asians 140/215
(49.3)
113/207
(54.6)
70/215
(29.8)
79/207
(33.1)
5/215
(2.1)
15/207
(7.2)
81.4 73.7
Hiromatsu Asians 180/287 45/95 96/287 40/95 11/287 10/95 79.4 68.4
24

(Japan)
(62.7) (47.4) (33.5) (42.1) (3.8) (10.5)
Ghaderi,
(Iran)
Iranians 7/43
(16.3)
20/99
(20.2)
21/43
(48.9)
50/99
(50.5)
15/43
(34.9)
29/99
(29.3)
40.7 45.5
Wang,
(Taiwan)
Asians 106/142
(74.7)
81/171
(47.4)
30/142
(21.1)
72/171
(42.1)
6/142
(4.2)
18/171
(10.5)
85.2 68.4
Gough
(UK)
Caucasians 267/658
(40.6)
240/823
(29.2)
301/658
(44.8)
395/823
(48.0)
90/658
(13.7)
188/823
(22.8)
63.4 53.2
25

Table A10: Distribution of CTLA-4 alleles in HT- A49G polymorphism –group-level data of studies where individual-level data are available
Team
(country)
Racial
descent
G/
HT
(%)
G
Controls
(%)
G/
HT
(%)
A
Controls
(%)
A/
HT
(%)
A
Controls
(%)
G allele frequency
HT Controls
(%) (%)
Awata,
(Japan)
Asians
45/88 137/344
(51.1) (39.8)
37/88
(42.0))
163/344
(47.4)
6/88
(6.8)
44/344
(12.8)
72.2 63.5
Ban,
(Japan)
Asians 74/183
(40.4)
69/179
(38.5)
92/183
(50.3)
85/179
(47.5)
17/183
(9.3)
25/179
(14.0)
65.6 62.3
Akamizu,
(Japan)
Asians 69/139
(49.6)
103/234
(44.0)
61/139 (43.9) 104/234
(44.4)
9/139
6.3)
27/234
(11.5)
71.6 66.2
Ghaderi,
(Iran)
Iranians 6/37
(16.2)
8/98
(8.2)
12/37
(32.4)
46/98
(46.9)
19/37
(51.4)
44/98
(44.9)
32.4 31.6
Gough,
(UK)
Caucasians 33/210
(15.7)
111/842
(13.2)
119/210
(56.7)
402/842
(47.7)
58/210
(27.6)
329/842
(39.1)
44.0 37.1
26

Table A11: Distribution of CTLA-4 alleles in HT- CT60 polymorphism –group-level data of studies where individual-level data are available
Team
(country)
Racial
descent
G/
HT
(%)
G
Controls
(%)
G/
HT
(%)
A
Controls
(%)
A/
HT
(%)
A
Controls
(%)
G allele frequency
HT Controls
(%) (%)
Awata,
(Japan)
Asians
56/88 195/344
(51.1) (56.7)
30/88
(42.0)
134/344
(39.0)
2/88
(6.8)
15/344
(4.4)
80.7 76.2
Ban,
(Japan)
Asians 103/183
(56.3)
95/179
(53.1)
70/183
(38.3)
70/179
(39.1)
10/183
(5.5)
14/179
(7.8)
75.4 72.6
Akamizu,
(Japan)
Asians 84/135
(62.2)
103/234
(44.0)
44/135
(32.6)
104/234
(44.4)
7/135
(5.2)
27/234
(11.5)
78.5 66.2
Ghaderi,
(Iran)
Iranians 8/36
(22.2)
20/99
(20.2)
17/36
(47.2)
50/99
(50.5)
11/36
(30.6)
29/99
(29.3)
45.8 45.5
Gough
(UK)
Caucasians 85/220
(38.6)
111/842
(13.2)
105/220
(46.1)
402/842
(47.7)
30/220
(13.6)
329/842
(39.1)
62.5 37.1
27

Table A12. Summary odds ratios from a meta-analysis of group data of studies where individual-level data were available for various contrasts of the
A49G polymorphism in the cytotoxic T-lymphocyte associated antigen-4 (CTLA-4) gene and susceptibility to Graves’ disease AND Hashimoto
thyroiditis
G R A V E S’ D I S E A S E H A S H I M O T O T H Y R O I D I T I S
Contrast and racial
descent group
No. of
studies
Total sample
size (n)
Random
effects
95% CI I2
(%)
No. of
studies
Total sample
size (n)
Random
effects
95% CI I2
(%)
G vs. A allele
All
10
9,440
1.47
1.22-1.78
75
5
4,708
1.32
1.15-1.52
0
Asians 5 3,948 1.52 1.10-2.10 79
2,635
3 2,334 1.35 1.07-1.71
36
Caucasians 4 5,208 1.42 1.06-1.90 81 1 2,104 1.34 1.08-1.66 -
G/G vs. A/A genotype
All
10 1.94 1.59-2.36 8
5
1,244
1.84
1.34-2.53
0
Asians 5 1,168 1.98 1.43-2.73 0 3 636 2.01 1.27-3.17 0
Caucasians 4 1,386 2.00 1.29-3.07 66 1 531 1.69 1.05-2.72 -
G/G vs. other genotypes
All
10 4,720 1.85 1.39-2.46 76
5
2,354
1.36
1.08-1.71
15
Asians 5 1,974 2.01 1.18-3.41 87 3 1,167 1.38 0.97-1.74 48
28

Caucasians 4 2,604 1.69 1.24-2.29 50
1 1,052 1.23 0.81-1.87 -
Other vs. A/A genotype
All
10 4,720 1.47 1.19-1.79 31 5
2,354
1.58
1.20-2.08
9
Asians 5 1,974 2.07 1.30-3.28 41 3 1,167 1.83 1.18-2.83 0
Caucasians 5 2,604 1.42 1.04-1.93 0 1 1,052 1.68 1.21-2.34 -
29

Table A13. Summary odds ratios from a meta-analysis of group data of studies where individual-level data were available for various contrasts of the
CT60 polymorphism in the cytotoxic T-lymphocyte associated antigen-4 (CTLA-4) gene and susceptibility to Graves’ disease and Hashimoto thyroiditis
G R A V E S’ D I S E A S E H A S H I M O T O T H Y R O I D I T I S
Contrast and racial
descent group
No. of
studies
Total sample
size (n)
Random
effects
95% CI I2
(%)
No. of
studies
Total sample
size (n)
Random
effects
95% CI I2
(%)
G vs. A allele
All
10
9,440
1.49
1.30-1.72
49
5
4,718
1.73
1.12-2.66
88
Asians 5 3,948 1.73 1.41-2.12 40
3 2,326 1.42 0.84-2.39 0
Europeans 4 5,208 1.45 1.30-1.62 0 1 2,124 2.83 2.28-3.52 -
G/G vs. A/A genotype
All
10 2,635 2.48 1.83-3.35 39
5
1,315
3.10
1.27-7.53
83
Asians 5 1,168 3.21 2.07-4.97 0 3 689 1.96 0.65-5.88 78
Caucasians 4 1,386 2.45 1.72-3.48 41 1 555 8.40 5.26-13.4 -
G/G vs. other genotypes
All
10 4,720 1.73 1.38-2.16 60
5
2,359
2.11
1.16-3.83
88
Asians 5 1,974 1.95 1.43-2.66 52 3 1,163 1.52 0.83-2.78 82
Caucasians 4 2,604 1.64 1.17-2.32 70 1 1,062 4.15 2.96-5.81 -
30

Other vs. A/A genotype
All
10 4,720 2.01 1.56-2.60 29
4
2,359
2.16
1.19-3.92
70
Asian 5 1,974 2.99 1.87-4.77 0
1 1,163 1.68 0.70-4.05 68
European 5 2,604 1.94 1.56-2.40 0 1 1,062 4.06 2.70-6.12 -
31

Table A14: Distributions of the haplotype of the A49G and CT60 polymorphism in GD
Team
(country)
Racial
descent
G
GD
(%)
G
Controls
(%)
G
GD
(%)
A
Controls
(%)
A
GD
(%)
G
Controls
(%)
A
GD
(%)
A
Controls
(%)
Chistyakov
(Russia)
Caucasians
162/278
(58.3)
111/310
(35.8)
23/278
(8.3)
36/310
(11.6)
12/278
(4.3)
22/310
(7.1)
81/278
(29.1)
141/310
(45.5)
Awata
(Japan)
Asians 149/216 432/688
(69.0) (62.8)
2/216
(0.9)
5/688
(0.7)
26/216
(12.0)
92/688
(13.4)
39/216
(18.1)
159/688
(23.1)
Ban
(Japan)
Asians 421/604 221/358
(69.7) (61.7)
1/604
(0.2)
2/358
(0.6)
71/604
(11.8)
39/358
(10.9)
111/604
(18.4)
96/358
(26.8)
Frydecka
(Poland)
Caucasians 76/196
(38.8)
117/272
(43.0)
7/196
(3.6)
7/272
(2.6)
45/196
(23.0)
48/272
(17.6)
68/196
(34.7)
100/272
(36.8)
Bedanrczuk
(Poland)
Caucasians 293/602
(48.7)
256/618
(41.4)
1/602
(0.2)
4/618
(0.6)
126/602
(20.9)
122/618
(19.7)
182/602
(30.2)
236/618
(38.2)
Akamizu
(Japan)
Asians 336/470
(71.5)
297/478
(62.1)
6/470
(1.3)
21/478
(4.4)
43/470
(9.1)
58/478
(12.1)
85/470
(18.1)
102/478
(21.4)
Hiromatsu Asians 394/574 113/190 0/574 0/190 64/574 17/190 116/574 60/190
32
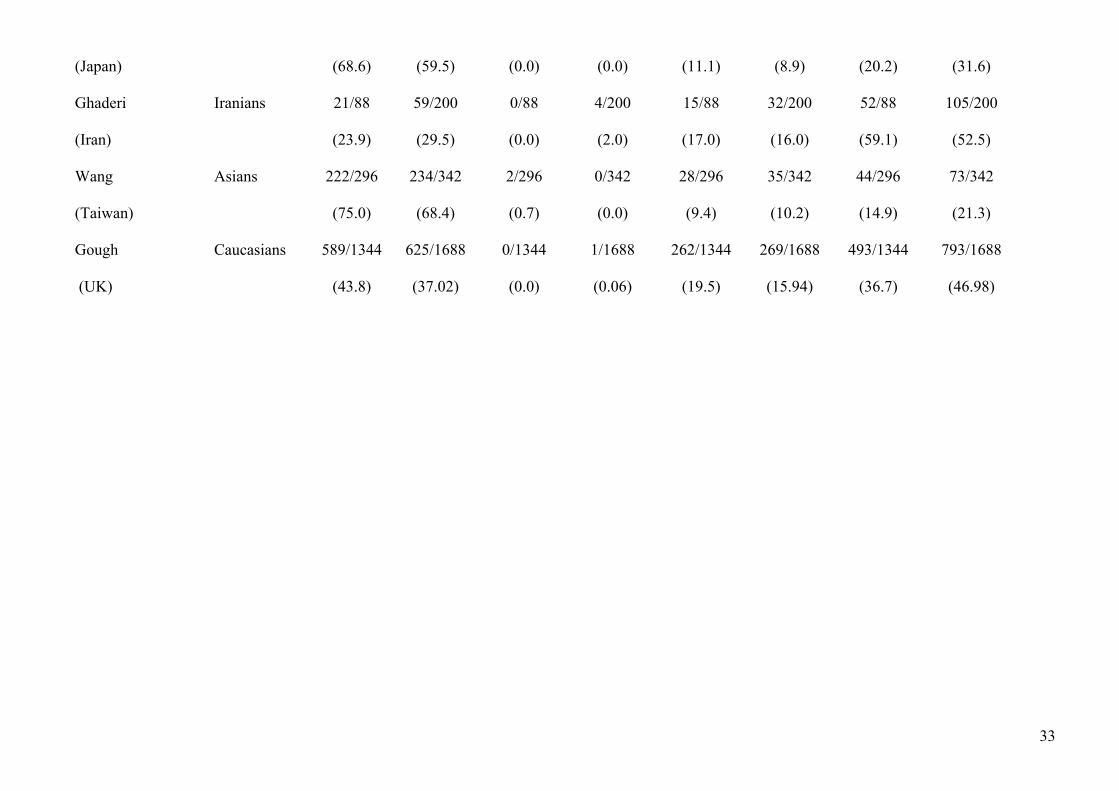
(Japan)
(68.6) (59.5) (0.0) (0.0) (11.1) (8.9) (20.2) (31.6)
Ghaderi
(Iran)
Iranians 21/88
(23.9)
59/200
(29.5)
0/88
(0.0)
4/200
(2.0)
15/88
(17.0)
32/200
(16.0)
52/88
(59.1)
105/200
(52.5)
Wang
(Taiwan)
Asians 222/296 234/342
(75.0) (68.4)
2/296
(0.7)
0/342
(0.0)
28/296
(9.4)
35/342
(10.2)
44/296
(14.9)
73/342
(21.3)
Gough
(UK)
Caucasians 589/1344
(43.8)
625/1688
(37.02)
0/1344
(0.0)
1/1688
(0.06)
262/1344
(19.5)
269/1688
(15.94)
493/1344
(36.7)
793/1688
(46.98)
33

Table A15: Distributions of the haplotype combinations of the A49G and CT60 polymorphism in HT
Team
(country)
Racial
descent
G
HT
(%)
G
Controls
(%)
G
HT
(%)
A
Controls
(%)
A
HT
(%)
G
Controls
(%)
A
HT
(%)
A
Controls
(%)
Awata
(Japan)
Asians
127/176
(72.2)
432/688
(62.8)
0/176
(0.0)
5/688
(0.7)
15/176
(8.5)
92/688
(13.4)
34/176
(19.3)
159/688
(23.1)
Ban
(Japan)
Asians 240/366
(65.6)
221/358
(61.7)
0/366
(0.0)
2/358
(0.6)
36/366
(9.8)
39/358
(10.9)
90/366
(24.6)
96/358
(26.8)
Akamizu
(Japan)
Asians 199/286
(69.6)
297/478
(62.1)
6/286
(2.1)
21/478
(4.4)
26/286
(9.1)
58/478
(12.1)
55/286
(19.2)
102/478
(21.4)
Ghaderi
(Iran)
Iranians 25/76
(32.9)
59/200
(29.5)
0/76
(0.0)
4/200
(2.0)
10/76
(13.2)
32/200
(16.0)
41/76
(53.9)
105/200
(52.5)
Gough
(UK)
Caucasians 194/456
(42.5)
625/1688
(37.02)
8/456
(1.8)
1/1688
(0.06)
89/456
(19.5)
269/1688
(15.94)
165/456
(36.2)
793/1688
(46.98)
34

Table A16: Summary odds ratios from a meta-analysis of the Odds Ratios derived from regression analyses including the different number of copies of
haplotypes (none copy is the reference) in the haplotypes reconstructed of A49G and CT60 polymorphisms of the CTLA-4 gene in GD and HT patients
and healthy subjects
G R A V E S’ D I S E A S E H A S H I M O T O T H Y R O I D I T I S
Contrast
and racial descent group
No. of
studies
Total sample
size (n)*
Random
effects
95% CI I2
(%)
No. of
studies
Total sample
size (n)
Random
effects
95% CI I2
(%)
GG haplotype- 1 copy
All
10
2,302
1.29
1.07-1.55
18
5
1,153
1.48
1.15-1.91
0
Asians 5
957 1.42 1.03-1.95 0 3 564 1.27 0.83-1.94 0
Caucasians 4 1,287 1.30 1.00-1.68 39 1 533 1.61 1.16-2.24 -
GG haplotype- 2 copies
All
10 1,413 1.97 1.48-2.63 48
5
633
1.71
1.25-2.33
0
Asians 5 931 2.10 1.53-2.90 0 3 476 1.82 1.15-2.90 0
Caucasians 4 471 2.00 1.17-3.44 76 1 143 1.44 0.90-2.32 0
AG haplotype-1 copy
All
10 1,176 1.06 0.92-1.22 0
5
556
0.95
068-1.33
46
Asians 5 421 0.95 0.74-1.22 0 3 234 0.92 0.65-1.31 0
35

Caucasians 4
720 1.06 0.83-1.35 31 1 292 1.36 0.99-1.86 -
AG haplotype-2 copies
All
6 125 1.39 0.94-2.06 0 4
55
0.99
0.51-1.93
0
Asians 2 26 1.07 0.34-3.35 0 2 16 0.49 0.13-1.89 0
Caucasians 3 93 1.50 0.99-2.29 0 1 33 1.31 0.58-2.96 -
AA haplotype-1 copy
All
10
2,016
0.67
0.59-0.76
2
5
1,024
0.87
0.71-1.06
0
Asians 5 705 0.70 0.57-0.85 3 3 424 0.91 0.68-1.22 0
Caucasians 4 1,234 0.63 0.52-0.76 8 1 526 0.83 0.60-1.14 -
AA haplotype-2 copies
All
10
560
0.52
0.37-0.73
49
5
308
0.55
0.34-0.88
27
Asians 5 90 0.38 0.24-0.61 0 3 56 0.81 0.46-1.44 0
Caucasians 4 430 0.54 0.33-0.87 66 1 216 0.34 0.21-0.56 -
*Total sample size corresponds to the total number of cases (GD or HT) and controls that have the corresponding copies of the respective haplotype
36

Data on other polymorphisms
Seven and 3 studies contained data for the (AT)n repeats and GD 3,20,22,28,32,34 and HT,22,24,28 respectively; six for the C(-318)T polymorphism and
GD 3,32,34,42, 55,56; Three published studies contained data for the JO31 3,45,53 and two participating teams (Chistyakov et al. and Frydecka et al.) provided
individual-level data, 2 published studies and one collaborating team (Chistyakov et al.) provided data for the JO303,53 and JO27_13,53 polymorphisms.
Table A17: Distribution of CTLA-4 alleles in GD – (AT)n polymorphism
Author, year Racial
descent
88
GD
(%)
bp
controls
(%)
104
GD
(%)
bp
controls
(%)
106
GD
(%)
bp
Controls
(%)
108
GD
(%)
bp
Controls
(%)
Yanagawa, 1995 Caucasians 94/266
(35.3)
84/170
(49.4)
7/266
(2.6)
5/170
(2.9)
17/266
(26.7)
23/170
(13.5)
17/266
(6.4 )
10/170
(5.9)
Kotsa, 1997 Caucasians 90/224
(40.2)
85/182
(46.7)
9/224
(4.0)
15/182
(8.2)
52/224
(23.2)
23/182
(12.6)
16/224
(7.1)
7/182
(3.8)
Akamizu, 2000 Asians 86/358
(23.9)
104/340
(30.6)
99/358
(27.7)
73/340
(21.5)
31/358
(8.6)
53/340
(15.6)
24/358
(6.7)
29/340
(8.5)
Hadj-Kacem, 2001 Northern
Africans
127/274
(46.4)
183/320
(57.2)
12/274
(4.4)
4/320
(1.3)
23/274
(8.39)
22/320
(6.88)
17/274
(6.2)
19/320
(5.9)
Kouki, 2002 Caucasians 72/240 63/160 - - 62/240 18/160 - -
37
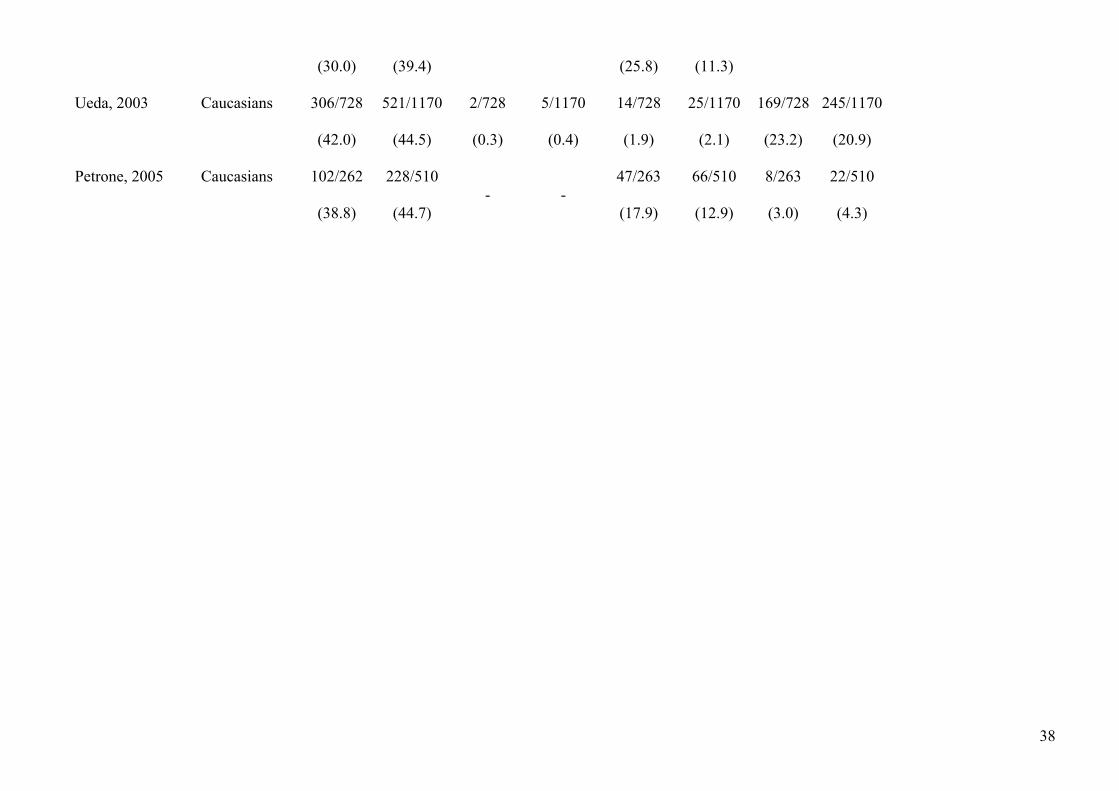
(30.0)
(39.4) (25.8) (11.3)
Ueda, 2003 Caucasians 306/728
(42.0)
521/1170
(44.5)
2/728
(0.3)
5/1170
(0.4)
14/728
(1.9)
25/1170
(2.1)
169/728
(23.2)
245/1170
(20.9)
Petrone, 2005 Caucasians 102/262
(38.8)
228/510
(44.7) - -
47/263
(17.9)
66/510
(12.9)
8/263
(3.0)
22/510
(4.3)
38

Table A18: Distribution of CTLA-4 alleles in HT – (AT)n polymorphism
Author, year Racial
descent
88
HT
(%)
bp
controls
(%)
104
HT
(%)
bp
controls
(%)
106
HT
(%)
bp
Controls
(%)
108
HT
(%)
bp
Controls
(%)
Kotsa, 1997 Caucasians 36/88
(40.9)
85/182
(46.7)
3/88
(3.4)
15/182
(8.2)
21/88
(23.8)
23/182
(12.6)
4/88
(4.5)
7/182
(3.8)
Sale, 1997 Asians 10/30
(34.5)
54/194
(27.8)
6/30
(20.7)
43/194
(22.2)
8/30
(27.6)
59/194
(30.4)
1/30
(3.4)
11/194
(5.7)
Akamizu,
2000
Asians 43/180
(24.1)
104/340
(30.6)
50/180
(27.8)
73/340
(21.5)
17/180
(9.6)
53/340
(15.6)
14/180
(7.9)
29/340
(8.5)
39

Table A19: Distribution of CTLA-4 genotypes in GD patients – (-318) CT polymorphism
Author, year Racial
descent
C
GD
(%)
allele
Controls
(%)
T
GD
(%)
allele
Controls
(%)
Braun, 1998 Caucasians 232/250
(92.8)
298/346
(86.1)
18/250
(7.2)
48/346
(13.9)
Heward,1998 Asians 180/196
(91.8)
136/164
(82.9)
16/196
(8.2)
28/164
(17.1)
Hadj-Kacem, 2001 Northern
Africans
396/410
(96.6)
275/288
(95.5)
14/410
(3.4)
13/288
(4.5)
Kouki, 2002 Asians 217/240
(90.4)
148/160
(92.5)
23/80
(9.6)
12/160
(7.5)
Vaidya, 2003 Caucasians 542/584
(92.8)
538/580
(92.8)
42/584
(7.2)
42/580
(7.2)
Ueda, 2003 Caucasians 677/758
(89.3)
1157/1274
(90.8)
81/758
(10.7)
117/1274
(9.2)
40

Table A20: Distribution of CTLA-4 alleles in GD- JO31 polymorphism
Author, year Racial
descent
G/
GD
(%)
G
Controls
(%)
G/
GD
(%)
T
Controls
(%)
T/
GD
(%)
T
Controls
(%)
Ueda, 2003 Caucasians 240/657
(35.7)
214/784
(24.4)
321/657
(47.8)
370/784
(43.8)
96/657
(14.3)
200/784
(23.7)
Furugaki, 2004 Asians
* * * * * *
Cho, 2006 Asians 183/278
(65.8)
293/472
(62.1)
89/278
(32.0)
156/472
(33.1)
6/278
(2.2)
23/472
(4.8)
Chistyakov, 2006
(unpublished)
Caucasians 49/139
(35.3)
31/155
(20.0)
62/139
(44.6)
68/155
(43.9)
28/139
(20.1)
56/155
(36.1)
Frydecka, 2006
(unpublished)
Caucasians 35/96
(36.5)
40/125
(32.0)
41/96
(42.7)
62/125
(49.6)
20/96
(20.8)
23/125
(18.4)
*only allele frequencies available
41

Table A21: Distribution of CTLA-4 alleles in GD- JO30 polymorphism
Author, year Racial
descent
G/
GD
(%)
G
Controls
(%)
G/ A
GD
(%)
Controls
(%)
A/
GD
(%)
A
Controls
(%)
Ueda, 2003 Caucasians 244/658
(37.1)
220/812
(27.1)
317/658
(48.2)
391/812
(48.2)
97/658
(14.7)
201/812
(24.8)
Cho, 2006 Asians 169/278
(61.8)
283/472
(60.0)
103/278
(37.1)
169/472
(35.8)
6/278
(2.1)
20/472
(4.2)
Chistyakov, 2006
(unpublished)
Caucasians 48/139
(34.5)
37/155
(23.9)
56/139
(40.3)
58/155
(37.4)
60/139
(38.7)
56/155
(36.1)
42
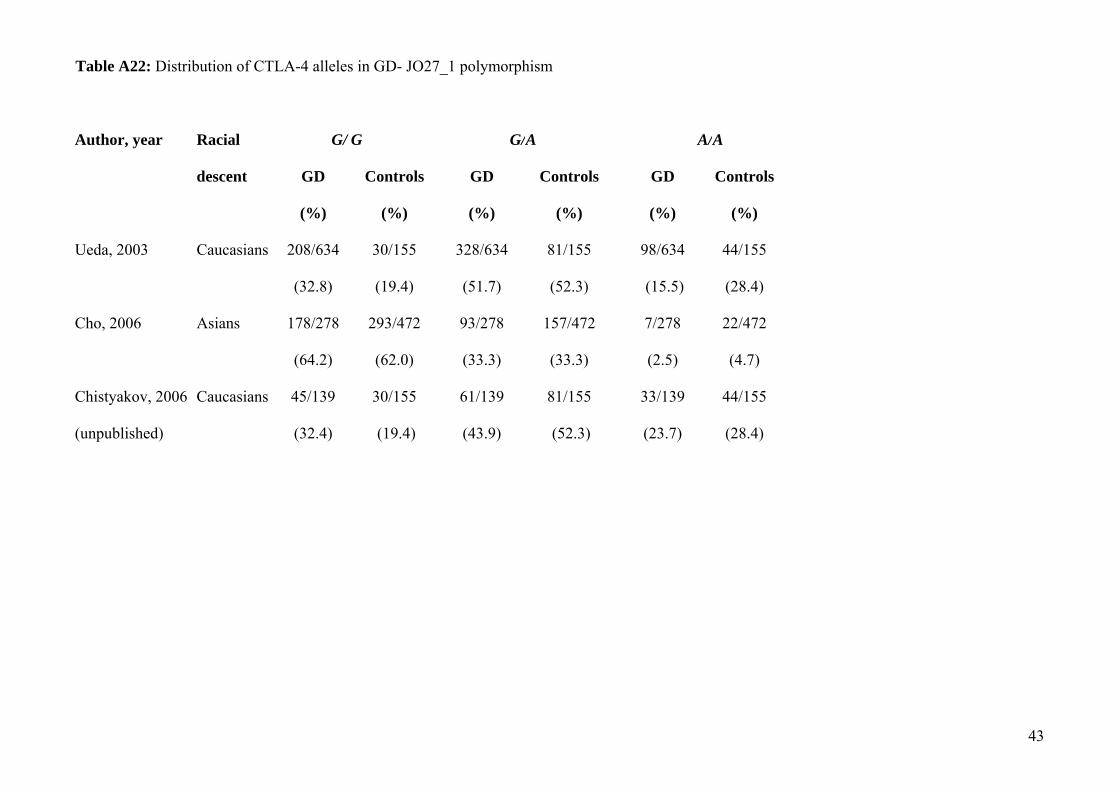
Table A22: Distribution of CTLA-4 alleles in GD- JO27_1 polymorphism
Author, year Racial
descent
G/
GD
(%)
G
Controls
(%)
G/ A
GD
(%)
Controls
(%)
A/
GD
(%)
A
Controls
(%)
Ueda, 2003 Caucasians 208/634
(32.8)
30/155
(19.4)
328/634
(51.7)
81/155
(52.3)
98/634
(15.5)
44/155
(28.4)
Cho, 2006 Asians 178/278
(64.2)
293/472
(62.0)
93/278
(33.3)
157/472
(33.3)
7/278
(2.5)
22/472
(4.7)
Chistyakov, 2006
(unpublished)
Caucasians 45/139
(32.4)
30/155
(19.4)
61/139
(43.9)
81/155
(52.3)
33/139
(23.7)
44/155
(28.4)
43

Table A23: Meta-analyses of group-level data for various contrasts for various contrasts of the (AT)n, (-318) C>T, JO31G>T, JO30 A>G and JO27_1
C>T polymorphisms in the cytotoxic T-lymphocyte associated antigen-4 (CTLA-4) gene and susceptibility to Graves’ disease and Hashimoto
thyroiditis
G R A V E S’ D I S E A S E H A S H I M O T O T H Y R O I D I T I S
Contrast and racial descent
group
No. of
studies
Total sample
size (n)
Random
effects
95% CI I2
(%)
No. of
studies
Total sample
size (n)
Random
effects
95% CI I2
(%)
(AT)n polymorphism:
106 vs. 88 bp allele
7
2621
1.32
0.89-2.00
71
3
424
1.10
0.54-2.26
62
104 vs. 88 bp allele 5 1911 1.33 0.70-2.51 56 3 522 1.00 0.46-2.17 52.
108 vs. 88 bp allele 6 2593 1.19 0.98-1.45 0 3 398 1.13 0.61-2.07 0
(-318) C>T polymorphism
C vs. T. allele
6
5250
1.23
0.85-1.78
65
-
-
-
-
-
JO31 polymorphism
G vs. T allele
5
6414
1.44
1.23-1.69
46
-
-
-
-
-
JO30 polymorphism
G vs. A allele
3
2796
1.25
0.99-1.59
68
-
-
-
-
-
JO27_1 polymorphism
44

C vs. T allele 3 4454 1.44 0.47-4.42 98 - - - - -
45