Anti B-Cell Maturation Antigen CAR T-cell and Antibody Drug ... - ICER
209
©Institute for Clinical and Economic Review, 2021 Anti B-Cell Maturation Antigen CAR T-cell and Antibody Drug Conjugate Therapy for Heavily Pre-Treated Relapsed and Refractory Multiple Myeloma Final Report May 11, 2021 Updated July 9, 2021 Prepared for New evidence regarding treatments and therapies gets published on an ongoing basis. ICER reached out to key stakeholders included in this review 12 months after the publication of this report giving them an opportunity to submit public comments regarding new relevant evidence or information on coverage that they wish to highlight. Their statements can be found here. ICER has launched ICER Analytics to provide stakeholders an opportunity to work directly with ICER models and examine how changes in parameters would affect results. You can learn more about ICER Analytics here.
-
Upload
khangminh22 -
Category
Documents
-
view
0 -
download
0
Transcript of Anti B-Cell Maturation Antigen CAR T-cell and Antibody Drug ... - ICER

©Institute for Clinical and Economic Review, 2021
Anti B-Cell Maturation Antigen CAR T-cell and Antibody Drug Conjugate Therapy for Heavily Pre-Treated Relapsed and Refractory Multiple
Myeloma
Final Report
May 11, 2021 Updated July 9, 2021
Prepared for
New evidence regarding treatments and therapies gets published on an ongoing basis. ICER reached out to key stakeholders included in this review 12 months after the publication of this report giving
them an opportunity to submit public comments regarding new relevant evidence or information on coverage that they wish to highlight. Their statements can be found here. ICER has launched ICER
Analytics to provide stakeholders an opportunity to work directly with ICER models and examine how changes in parameters would affect results. You can learn more about ICER Analytics here.

©Institute for Clinical and Economic Review, 2021 Final Report- Multiple Myeloma Return to Table of Contents
DATE OF PUBLICATION: May 11, 2021 (Updated July 9, 2021) How to cite this document: Lee SJ, McQueen RB, Beinfeld M, Fluetsch N, Whittington MD, Pearson SD, Ollendorf DA. Anti B-Cell Maturation Antigen CAR T-cell and Antibody Drug Conjugate Therapy for Heavily Pre-Treated Relapsed and Refractory Multiple Myeloma; Final Evidence Report. Institute for Clinical and Economic Review, May 11, 2021. https://icer.org/assessment/multiple-myeloma-2021/#timeline
Sei Lee served as the lead author for the report and wrote the background, other benefits, and contextual considerations sections. Molly Beinfeld led the systematic review and wrote the clinical effectiveness section of the report in collaboration with Noemi Fluetsch and Belén Herce-Hagiwara. Brett McQueen, Eric Gutierrez, and Sue Kwon developed the cost-effectiveness model and authored the corresponding sections of the report. Melanie Whittington provided methods guidance for the cost-effectiveness modeling effort and conducted the potential budget impact analysis. Daniel Ollendorf and Steven Pearson provided methodologic guidance on the clinical and economic evaluations. We would also like to thank Monica Frederick and Liis Shea for their contributions to this report.
ICER Staff and Consultants Modeling Team
Sei J. Lee, MD, MAS Professor of Medicine University of California, San Francisco Molly Beinfeld, MPH Research Lead, Evidence Synthesis ICER Noemi Fluetsch, MPH Research Assistant, Health Economics and Outcomes Research ICER Melanie D. Whittington, PhD, MS Associate Director of Health Economics ICER Steven D. Pearson, MD, MSc President ICER Daniel A. Ollendorf, PhD Director, Value Measurement & Global Health Initiatives Tufts Medical Center
R. Brett McQueen, PhD Assistant Professor, University of Colorado Anschutz Medical Campus Eric Gutierrez, MPH Statistical Analyst, University of Colorado Anschutz Medical Campus Sue Kwon, BS Graduate Research Assistant, University of Colorado Anschutz Medical Campus The University of Colorado was responsible for the development of the cost-effectiveness model, interpretation of results, and drafting of the economic sections of this report; the resulting ICER reports do not necessarily represent the views of the University of Colorado.

©Institute for Clinical and Economic Review, 2021 Final Report- Multiple Myeloma Return to Table of Contents
About ICER
The Institute for Clinical and Economic Review (ICER) is an independent non-profit research organization that evaluates medical evidence and convenes public deliberative bodies to help stakeholders interpret and apply evidence to improve patient outcomes and control costs. Through all its work, ICER seeks to help create a future in which collaborative efforts to move evidence into action provide the foundation for a more effective, efficient, and just health care system. More information about ICER is available at http://www.icer.org. The funding for this report comes from government grants and non-profit foundations, with the largest single funder being the Arnold Ventures. No funding for this work comes from health insurers, pharmacy benefit managers, or life science companies. ICER receives approximately 21% of its overall revenue from these health industry organizations to run a separate Policy Summit program, with funding approximately equally split between insurers/PBMs and life science companies. Life science companies relevant to this review who participate in this program include: GlaxoSmithKline. For a complete list of funders and for more information on ICER's support, please visit http://www.icer-review.org/about/support/. For drug topics, in addition to receiving recommendations from the public, ICER scans publicly available information and also benefits from a collaboration with IPD Analytics, an independent organization that performs analyses of the emerging drug pipeline for a diverse group of industry stakeholders, including payers, pharmaceutical manufacturers, providers, and wholesalers. IPD provides a tailored report on the drug pipeline on a courtesy basis to ICER but does not prioritize topics for specific ICER assessments.
About Midwest CEPAC
The Midwest Comparative Effectiveness Public Advisory Council (Midwest CEPAC) – a core program of ICER – provides a public venue in which the evidence on the effectiveness and value of health care services can be discussed with the input of all stakeholders. Midwest CEPAC seeks to help patients, clinicians, insurers, and policymakers interpret and use evidence to improve the quality and value of health care.
The Midwest CEPAC is an independent committee of medical evidence experts from across the Midwest, with a mix of practicing clinicians, methodologists, and leaders in patient engagement and advocacy. All Council members meet strict conflict of interest guidelines and are convened to discuss the evidence summarized in ICER reports and vote on the comparative clinical effectiveness and value of medical interventions. More information about Midwest CEPAC is available at https://icer.org/who-we-are/people/independent-appraisal-committees/midwest-comparative-effectiveness-public-advisory-council-m-cepac/.
The findings contained within this report are current as of the date of publication. Readers should be aware that new evidence may emerge following the publication of this report that could potentially influence the results. ICER may revisit its analyses in a formal update to this report in the future. The economic models used in ICER reports are intended to compare the clinical outcomes, expected costs, and cost-effectiveness of different care pathways for broad groups of patients. Model results therefore represent average findings across patients and should not be presumed to represent the clinical or cost outcomes for any specific patient. In addition, data inputs to ICER models often come from clinical trials; patients in these trials may differ in real-world practice settings.

©Institute for Clinical and Economic Review, 2021 Final Report- Multiple Myeloma Return to Table of Contents
In the development of this report, ICER’s researchers consulted with several clinical experts, patients, manufacturers, and other stakeholders. The following experts provided input that helped guide the ICER team as we shaped our scope and report. It is possible that expert reviewers may not have had the opportunity to review all portions of this report. None of these individuals is responsible for the final contents of this report, nor should it be assumed that they support any part of it. The report should be viewed as attributable solely to the ICER team and its affiliated researchers.
The Expert Reviewers listed below have not reviewed the updated version of this report which was published on July 9th.
For a complete list of stakeholders from whom we requested input, please visit: http://icerorg.wpengine.com/wp-content/uploads/2020/10/ICER_MM_Key_Stakeholders_092720.pdf
Expert Reviewers
Elizabeth Franklin, PhD, MSW President Cancer Support Community The Cancer Support Community receives funding from various pharmaceutical, foundation, and corporate partners. All work is done under CSC's corporate support policy.
S. Vincent Rajkumar, MD Edward W. and Betty Knight Scripps Professor of Medicine Associate Editor, Mayo Clinic Proceedings Mayo Clinic Dr. S. Vincent Rajkumar has held a position as a member of the Board of Directors for the International Myeloma Foundation.
Ravi Vij, MD, MBA Professor, Department of Medicine Oncology Division, Bone Marrow Transplantation & Leukemia Washington University School of Medicine in St. Louis Dr. Ravi Vij has served on Advisory boards for BMS, GSK and Sanofi. Dr. Vij has also received support for investigator initiated clinical trials for BMS, Sanofi and Takeda.

©Institute for Clinical and Economic Review, 2021 Final Report- Multiple Myeloma Return to Table of Contents
Table of Contents Executive Summary ............................................................................................................................ ES1
1. Background ........................................................................................................................................ 1
2. Patient and Caregiver Perspectives ................................................................................................... 3
3. Comparative Clinical Effectiveness .................................................................................................... 5
3.1. Methods Overview ...................................................................................................................... 5
3.2. Results ......................................................................................................................................... 9
3.3. Summary and Comment ........................................................................................................... 17
4. Long-Term Cost-Effectiveness.......................................................................................................... 19
4.1. Methods Overview .................................................................................................................... 19
4.2. Key Model Assumptions and Inputs ......................................................................................... 21
4.3. Results ....................................................................................................................................... 25
4.4. Summary and Comment ........................................................................................................... 33
5. Potential Other Benefits and Contextual Considerations ................................................................ 34
6. Health Benefit Price Benchmarks .................................................................................................... 36
7. Potential Budget Impact .................................................................................................................. 37
7.1. Overview of Key Assumptions .................................................................................................. 37
7.2. Results ....................................................................................................................................... 38
7.3. Affordability and Access Alert ................................................................................................... 42
8. Summary of the Votes and Considerations for Policy ..................................................................... 43
8.1 About the Midwest CEPAC Process ........................................................................................... 43
8.2 Voting Results ............................................................................................................................ 45
8.3 Roundtable Discussion and Key Policy Implications .................................................................. 50
All Stakeholders ............................................................................................................................... 52
Manufacturers ................................................................................................................................. 53
Clinical Specialty Societies ............................................................................................................... 54
Payers ............................................................................................................................................... 54
Clinical Research Community ........................................................................................................... 57
Supplemental Materials ............................................................................................................. 59
A. Background: Supplemental Information ......................................................................................... 60

©Institute for Clinical and Economic Review, 2021 Final Report- Multiple Myeloma Return to Table of Contents
A1. Definitions ................................................................................................................................. 60
B. Patient Perspectives: Supplemental Information ............................................................................ 63
B1. Methods .................................................................................................................................... 63
B2. Cancer Support Community Myeloma Registry Survey ............................................................ 64
C. Clinical Guidelines ............................................................................................................................ 67
D. Comparative Clinical Effectiveness: Supplemental Information ..................................................... 69
D1. Detailed Methods ..................................................................................................................... 69
D2. Additional Clinical Evidence ...................................................................................................... 79
D3. Evidence Tables ........................................................................................................................ 87
D4. Ongoing Studies ...................................................................................................................... 127
D5. Previous Systematic Reviews and Technology Assessments ................................................. 140
E. Long-Term Cost-Effectiveness: Supplemental Information ........................................................... 142
E1. Detailed Methods .................................................................................................................... 142
E2. Model Inputs ........................................................................................................................... 144
E3. Undiscounted Results .............................................................................................................. 161
E4. Sensitivity Analyses ................................................................................................................. 162
E5. Scenario Analyses .................................................................................................................... 172
E6. Heterogeneity and Subgroups ................................................................................................ 173
E7. Model Validation ..................................................................................................................... 174
E8. Prior Economic Models ........................................................................................................... 174
F. Potential Budget Impact: Supplemental Information .................................................................... 176
Results ............................................................................................................................................ 177
G. Public Comments ........................................................................................................................... 178
H. Conflict of Interest Disclosures ...................................................................................................... 184
References ......................................................................................................................................... 187

©Institute for Clinical and Economic Review, 2021 Final Report- Multiple Myeloma Return to Table of Contents
List of Acronyms and Abbreviations Used in this Report
95%CI 95% Confidence Interval ADC Antibody drug conjugate AE Adverse event AHRQ Agency for Healthcare Research and Quality AIC Academic in confidence BCMA B-cell maturation antigen BP Bendamustine + prednisone CAR Chimeric antigen receptor CR Complete response CRAB Calcium, renal, anemia, and bone CRS Cytokine release syndrome D/C Discontinuation DCEP Dexamethasone + cyclophosphamide + etoposide + cisplatin DOR Duration of response EMD Extramedullary disease EORTC European Organization for Research and Treatment of Cancer EPd Elotuzumab + pomalidomide + dexamethasone HR Hazard ratio HRQoL Health-related quality of life IMiD Immunomodulatory drug IQR Interquartile range ISS Idiopathic subglottic stenosis ITT Intention to treat KCd Carfilzomib + cyclophosphamide + dexamethasone Kg Kilogram KPd Carfilzomib + pomalidomide + dexamethasone Mg Milligram MM Multiple Myeloma MRD Minimal residual disease n Number N Total number N/A Not applicable NE Not estimable NICE National Institute for Health and Care Excellence NR Not reported NT Neurotoxicity OR Odds ratio ORR Overall response rate OS Overall survival OSDI Ocular Surface Disease Index PCd Pomalidomide + cyclophosphamide + dexamethasone PFS Progression free survival PI Proteasome inhibitor QLQ-C30 Quality of Life Questionnaire C30 RRMM Relapsed or refractory multiple myeloma SEER Survey, Epidemiology, and End Results Program TCRMM Triple-class refractory multiple myeloma TTNT Time to next treatment

©Institute for Clinical and Economic Review, 2021 Final Report- Multiple Myeloma Return to Table of Contents
Executive Summary Update (Added July 9, 2021)
The final evidence report, which contained the full set of analyses, voting summary, and policy roundtable recommendations, was posted on May 11, 2021, following the public meeting of the Midwest CEPAC on April 16, 2021. At the time, the extremely limited evidence available for cilta-cel (i.e., median follow-up of 12 months) was characterized as “preliminary”, and the economic model results described as “optimistic.”
Since the publication of the final report, new evidence has been reported for cilta-cel, based on a median follow-up of 18 months. Data from this longer period of follow-up indicated some worsening of both progression-free and overall survival, which has translated to less favorable findings for cilta-cel’s cost-effectiveness. In fact, the revised results now exceed ICER’s typical thresholds for fair pricing.
We felt that it was critically important to provide these updated findings as a resource to decision-makers and other interested stakeholders, and also as an illustration of the challenges associated with data extrapolations when the evidence available is so limited.
The following sections of the report have been updated as of July 9, 2021:
• Table ES1 18-month ORR have been added
• Section 3.2 Cilta-cel outcomes have been updated
• Table 3.3 has been updated
• Section 4.3 – base-case results have been updated for cilta-cel
• Section 7 – budget impact results for cilta-cel have been updated
• Uncertainties and Controversies include updated ORR
• Supplement table E.2.5 and all sensitivity analyses ranging from Figure E.4.3 – E.4.4 have been updated; Tables E.4.4 – E.5.1 have been updated
• Supplement Table D3.4 detailed outcomes for cilta-cel have been updated

©Institute for Clinical and Economic Review, 2021 Final Report- Multiple Myeloma Return to Table of Contents
Multiple myeloma (MM) is a hematologic cancer of plasma cells, currently estimated to afflict approximately 150,000 Americans. The mainstays of current MM treatment include immunomodulatory agents, proteasome inhibitors and anti-CD38 monoclonal antibodies.1 Most patients eventually relapse; these patients with relapsed or refractory multiple myeloma (RRMM) often cycle through different combinations of agents. When a patient’s disease is no longer responsive to agents in each of the three classes, the disease is referred to as “triple-class refractory” MM (TCRMM).2
ICER reviewed three new treatments targeting the B-cell maturation antigen (BCMA) for heavily pre-treated patients with RRMM who have cycled through numerous previous lines of therapy. Belantamab mafodotin blmf (Blenrep®, GlaxoSmithKline) is an antibody drug conjugate, with a monoclonal antibody to BCMA linked to a cytotoxic drug. Belantamab was studied in patients with heavily pre-treated (6-7 previous lines of therapy) TCRMM (majority quad- and penta-refractory, usually defined as refractory to 4 or 5 agents across all 3 drug classes outlined above). Idecabtagene vicleucel (”ide-cel”, Abecma®, Bristol Myers Squibb and bluebird bio) and ciltacabtagene autoleucel (“cilta-cel”, Janssen and Legend biotech) are chimeric antigen receptor (CAR) T-cell therapies, involving engineering a patient’s own T cells to target BCMA, and were studied in patients who were mostly TCRMM (majority triple- or quad-refractory patients).
Patients spoke about the burden of symptoms from both MM and its available treatments. Common symptoms of disease include fatigue, which can be overwhelming, and bony pain. Symptoms of the current treatments vary by medication, but frequently mentioned bothersome side effects include neuropathy as well as insomnia and psychosis from dexamethasone. Patients also noted substantial financial burden with annual out-of-pocket costs exceeding $10,000 leading one patient to remark that one had to be a “mathematician” to navigate the costs of being a myeloma patient.
Response rates and survival statistics are presented in Table ES1. The CAR T-cell therapies (ide-cel and cilta-cel) appear to be superior to currently available treatment regimens for TCRMM, as estimated from the recent MAMMOTH observational study. In contrast, belantamab appears to be equivalent or slightly superior to the most relevant comparative set from MAMMOTH.

©Institute for Clinical and Economic Review, 2021 Final Report- Multiple Myeloma Return to Table of Contents
Table ES1. Response Rates and Median PFS for Anti-BCMA Therapies
Intervention Study Follow-
Up Duration
As Treated
ORR ITT ORR
Median PFS or OS*
Toxicity
CAR T Population (Triple- or Quad- Refractory, 3+ prior lines of treatment) Ide-cel KarMMa 13.3
months 73% 63% As-treated PFS
= 8.6 months 51% CRS Grade 2+
Cilta-cel CARTITUDE-1
18 months
98% 75% As-treated PFS >18 months
44% CRS Grade 2+ 6% Treatment-related deaths
Usual Care MAMMOTH 10.6 months
-- 31% PFS = 3.4 months
Variable
Belantamab Population (Triple-, Quad- or Penta- Refractory MM, 4+ prior lines of treatment) Belantamab DREAMM-2 13
months -- 32% ITT OS = 13.8
months 18 – 46% Meaningful to moderate reversible visual decline (duration 22-33 days)
Usual Care MAMMOTH subcohort†
10.6 months
-- 28% Triple/quad OS = 9.2 months Penta OS = 5.6 months
Variable
BCVA: Best Corrected Visual Acuity, CRS: cytokine release syndrome, ITT: intention-to-treat, ORR: overall response rate, OS: overall survival, PFS: progression free survival * Ide-cel and cilta-cel PFS is as-treated. All other PFS and OS data are ITT † MAMMOTH comparator subcohort was defined by weighting the MAMMOTH triple/quad- and penta- refractory cohort proportions to the DREAMM-2 triple/quad- and penta- refractory proportions Toxicities were common with both CAR T-cell therapies and belantamab. For CAR T-cell therapies, Grade 2+ cytokine release syndrome (usually requiring hospitalization) occurred in 51% of patients who received ide-cel and 44% of patients who received cilta-cel. In addition, 6% of patients who received cilta-cel died of treatment-related complications. For belantamab, 18-46% experienced meaningful to moderate decline in vision lasting 22-33 days.
Table ES2. ICER Evidence Ratings for Anti-BCMA Therapies
Treatment Comparator Evidence Rating Triple- or Quad- Refractory MM (3+ prior lines of treatment)
Ide-cel Usual Care B+ Cilta-cel Usual Care B+ Ide-cel Cilta-cel I
Triple-, Quad- or Penta- Refractory MM (4+ prior lines of treatment) Belantamab Usual Care P/I*
MM: multiple myeloma.*Compared to current treatments, belantamab appears to be comparable to slightly superior. There is a small but nonzero likelihood of slight net harm. Current evidence does not support belantamab being substantially superior to current treatments.

©Institute for Clinical and Economic Review, 2021 Final Report- Multiple Myeloma Return to Table of Contents
ICER also performed cost-effectiveness modeling and analyses of the new therapies. The base-case findings from our analysis suggest that CAR-T therapies provide clinical benefit in terms of gains in both quality-adjusted and overall survival over current treatment options for triple- or quad-refractory MM patients exposed to three or more lines of therapy. The incremental cost-effectiveness ratios for ide-cel versus the triple- or quad-refractory MM comparator market basket were approximately $319,000 per QALY gained, $250,000 per LY gained, $280,000 per evLYG gained, and $35,000 per additional PFS month gained. Threshold pricing suggests ide-cel would meet the $100,000 per QALY threshold at a price of around $200,000 or a >50% discount from the current list price. Cilta-cel would meet this threshold at a price of around $230,000, but this finding is preliminary and an optimistic estimate given the extremely limited evidence currently available. Base-case findings for belantamab suggest current list pricing is within commonly cited cost-effectiveness thresholds when compared to a triple-, quad-, or penta-refractory MM market basket. However, given uncertainties with the PFS-OS relationship and other parameters in the belantamab model, updated data should be generated and incorporated into future modeling analyses. Small changes in any of the key drivers changed belantamab model findings to a significant extent. Key drivers across all model findings included comparator market basket prices, progression-free survival for the active interventions, and utility of PFS (on or off treatment).
Several potential benefits and contextual considerations not fully captured in the economic modeling include the limited treatment options for patients with TCRMM. Since anti-BCMA treatments represent a novel mechanism of action, these treatments may provide efficacy for patients who currently have few alternatives. However, CAR-T therapies are complex and high-cost with significant side effects. Treatments with these characteristics have been underutilized by disadvantaged populations, suggesting that disparities may be worsened.
Approximately 43% (ide-cel) and 50% (cilta-cel) of eligible triple- or quad-refractory multiple myeloma patients could be treated within five years before crossing the ICER potential budget impact threshold of $819 million per year. Testimony from clinical experts at the public meeting suggested that the ideal clinical uptake of the CAR-Ts would include the chance for nearly every eligible patient to receive one or the other. Given that efforts to reach this clinical target would create a short-term potential budget impact that exceeds ICER’s threshold, ICER is issuing an access and affordability alert for ide-cel and cilta-cel. ICER is not issuing an access and affordability alert for belantamab, because all eligible patients could be treated within five years at its current wholesale acquisition cost. Appraisal committee votes on questions of comparative effectiveness and value, along with key policy recommendations regarding pricing, access, and future research are included in the main report under Summary of the Votes and Considerations for Policy.

©Institute for Clinical and Economic Review, 2021 Page 1 Final Report - Multiple Myeloma Return to Table of Contents
1. Background Multiple Myeloma (MM) is a hematologic cancer of plasma cells.3 Uncontrolled proliferation of plasma cells can lead to a variety of clinical presentations, including:
• Bone pain and fractures due to lytic lesions from plasma cell proliferation in the marrow; • Increased total or monoclonal protein, which can have direct toxic effects on the kidney,
resulting in worsening renal function; • Hypercalcemia; • Anemia, due in part to plasma cells suppressing other hematopoietic cell lines and kidney
disease. MM is most often diagnosed through a bone marrow biopsy showing ≥10% plasma cells.4
MM is a relatively rare cancer, with an annual incidence of approximately 7 in 100,000 Americans. It is estimated that 32,270 new cases of MM were diagnosed in 2020 and 150,000 Americans are currently living with MM.3 It is primarily a disease of older adults, with a median age at diagnosis of 69. African-Americans appear to be at approximately twice the risk of white Americans, while Asian-Americans appear to be at lower risk.3 The rates of MM have been stable without evidence of increasing incidence over six decades.5 The direct medical costs of MM are substantial. A recent analysis of commercial and Medicare claims found that average costs exceeded $250,000 over a 21-month period, and that 60% of these costs were medication-related.6
The last 15 years have seen a proliferation of new, approved therapies for MM, resulting in substantial improvements in survival.1 In 2000, data from the Survey, Epidemiology, and End Results Program (SEER) suggested that 36% of MM patients achieved 5-year survival while in 2017, SEER models indicated that 56% of patients with MM will survive 5 years.3
Unfortunately, currently-approved therapies are not curative for most patients with MM. While modern combination treatments and autologous stem cell transplant can often lead to effective control with decreased signs and symptoms of MM, over time, most patients will relapse, showing signs and symptoms of renewed, active disease. Patients whose disease does not respond to treatment, or initially respond but are no longer responding to line of treatment are considered refractory. These patients with relapsed or refractory multiple myeloma (RRMM) often cycle through different combinations of agents, which may increase both their clinical and economic burden. Patients with MM whose disease has progressed through three common classes of anti-myeloma medications (monoclonal antibodies such as daratumumab or isatuximab; immunomodulatory drugs or IMiD’s such as thalidomide, lenalidomide or pomalidomide; and proteasome inhibitors or PI’s such as bortezomib, carfilzomib or ixazomib) are termed “triple class refractory” (TCR) MM.

©Institute for Clinical and Economic Review, 2021 Page 2 Final Report - Multiple Myeloma Return to Table of Contents
Currently, there is no widely accepted preferred ordering of lines of therapy for patients with TCRMM. General principles that guide treatment choice include previous treatments, how patient’s disease responded to these previous treatments, comorbidities, and risk stratification. One major consideration is incorporating as many new agents as possible (medications to which the patient has not been previously exposed) into each new line of treatment.1 This often results in regimens incorporating newer agents in one of the three major classes of anti-myeloma medications (such as pomalidomide or carfilzomib) as well as agents in other classes such elotuzumab or alkylator based treatments. Even with these treatments, patients with TCRMM unfortunately have limited survival, with overall survival <1 year.7 These patients with TCRMM represent the population that may potentially benefit from the three medications in this review. For our review, we focused on agents commonly used in the TCR population; thus, some agents, such as Selinexor, were not included as a component of usual care (and comparator to new treatments) due to low rates of use in these patients.
Three new treatments, idecabtagene vicleucel (”ide-cel”, Abecma®, Bristol Myers Squibb and bluebird bio), ciltacabtagene autoleucel (”cilta-cel”, Janssen and Legend Biotech) and belantamab mafodotin-blmf (Blenrep®, GlaxoSmithKline, referred to as belantamab for the remainder of the report) are proposed as the focus for this review. All three treatments target the B-cell maturation antigen (BCMA), which is overexpressed on plasma cells, but appears to be minimally expressed on other cells. In addition, BCMA appears to be essential for the survival of long-lived plasma cells, making BCMA an attractive therapeutic target.8 Blenrep is an antibody-drug conjugate, with a monoclonal antibody specific for BCMA that is linked to a cytotoxic drug. Belantamab is given as an intravenous infusion every 3 weeks. Belantamab received FDA approval in August 2020 for adult patients with relapsed or refractory MM who have received 4 prior lines of therapy including an anti-CD38 monoclonal antibody, a PI and an IMiD.
Ide-cel and cilta-cel are chimeric antigen receptor T (CAR-T) cell therapies, requiring a patient’s own T lymphocytes to be obtained via leukapheresis and transduced in the lab with a gene to encode an anti-BCMA antibody. Ide-cel uses a mouse-derived CAR with a single BCMA recognition domain. Cilta-cel uses a camelid CAR with 2 BCMA recognition domains, which theoretically may strengthen the interaction between the CAR and target cells. These genetically modified CAR-T cells are expanded and then infused back into the patient intravenously. Ide-cel received FDA approval in March 2021 for the treatment of adult patients with relapsed or refractory multiple myeloma who previously received four prior lines of treatment, including an IMiD, a PI and an anti-CD38 monoclonal antibody.9 The biologic license application for cilta-cel was submitted December 21, 2020.

©Institute for Clinical and Economic Review, 2021 Page 3 Final Report - Multiple Myeloma Return to Table of Contents
2. Patient and Caregiver Perspectives ICER engaged with patients with MM (including those treated with anti-BCMA medications), representatives from advocacy organizations, and clinical experts to understand the patient perspective of living with MM. We also spoke with two patient advocacy groups who helped us identify patients who could speak to their experiences. We spoke with five patients over five calls. Finally, we also conducted a focus group with four patients, where we heard in depth about their lived experiences. Additional details, including the semi-structured interview guide and questions, are available in the Supplement. Additional details of the patient perspective from a survey of myeloma patients from the Cancer Support Community is available in the Supplement Section B.
Patients spoke about the importance of quality of life beyond survival. One patient noted, “I don’t want to lie in my bed. I want to meet with friends, go places.” In addition, patients mentioned the negative impact of being continually tethered to the health care system. Another patient mentioned, “it’s a burden to wake up early, go to the hospital, wait (there’s always a delay), then get infused, and not get back home [until after dark].” A second patient summarized, “Visiting the doctor every week or two gets old.” Thus, patients reported wanting low side effect treatments that would not require frequent returns to the clinic or hospital.
One of the most frequent side effects that patients mentioned was fatigue and weakness. Seventy percent of patients in the Cancer Support Community’s (CSC) Myeloma registry reported fatigue within the past week. While some spoke of fatigue as a symptom of poorly controlled MM, for others, it was clearly a side effect of treatment. One patient mentioned, “The fatigue is bad—I find it more on POM [pomalidomide]. I have to take a break from cutting veggies.” Others noted, “The weakness is the worst thing...it interferes with your ability to exercise and take care of yourself.”
Patients also mentioned the impact their disease had on their loved ones and caregivers. One patient mentioned, “My wife was greatly impacted. I couldn’t do the grocery shopping anymore and I had to sleep in an office chair because of the pain.” One patient mentioned that the irritability caused by dexamethasone led to “a temporary estrangement with my spouse because of my short temper.” Thus, MM and its treatments have profound effects on families and caregivers as well as the patients.
Several patients reported tremendous financial strain due to MM treatments. One patient stated, “My drugs were about $250,000 a year. That first year I went into debt and had to refinance my home. I was 3 years from paying off my house and I had to start over.” Another patient noted, “on top of being filled with cancer, you have to deal with all of these bills.” Clinicians noted, “We still see cases where patients decline to take their drugs because the out-of-pocket expenses are so high that they'd have to choose between meds and food/housing.” Data from the Cancer Support Community’s Multiple Myeloma Specialty Registry indicate that nearly two-thirds of MM patients

©Institute for Clinical and Economic Review, 2021 Page 4 Final Report - Multiple Myeloma Return to Table of Contents
are concerned about the cost of their cancer care and 42% are often or always upset about the cost of their myeloma care.
Patients and clinicians mentioned that African American MM patients face additional barriers to effective treatment. One patient noted, “there’s a mistrust of medical community [in the African American community] and is a real thing, and not as much awareness and understanding of MM. [African Americans] are wary in participating in trials and refuse stem cell transplant when its offered.” A patient advocacy group mentioned, “navigating newer therapies can be like a maze...African Americans and patients with lower socioeconomic status are more like to get lost in that maze.” These comments suggest that newer treatments must proactively engage with historically disadvantaged populations; otherwise, these treatments, because of their complexity, may worsen disparities.
We spoke with 2 patients who had received CAR T-cell therapies as part of a clinical trial. Both patients described the infusion and subsequent hospitalization as relatively easy (“a piece of cake”) but long and monotonous. One patient described CAR-T therapies as “very liberating”, since his doctors did not feel like he needed maintenance medications after CAR-T therapies. Thus, the frequency of doctors’ visits and laboratory tests have decreased, and he noted, “if it wasn’t for COVID [I could] travel to New York or Italy.” A second CAR-T therapy patient had a different experience, since he required continued maintenance medications after CAR-T therapy. We also solicited responses from patients who were considering or had been treated with belantamab, but did not receive any replies.
We spoke with several patients who were considering CAR T-cell therapies. One patient stated, “I’m afraid of CAR-T.” When asked what she was afraid of, she talked about how intensive it sounded and that it “only lasts for about a year.” A second patient was more interested in CAR-T therapy, stating that he is currently responding to treatment, but that he would consider it for a future line of therapy. Even a patient who had undergone CAR-T therapy stated that he did so because he felt he had no other options. All patients spoke about the importance of having CAR-T therapy as an option saying, “At some point, we’re all going to need this because all combinations eventually seem to stop working.” CAR-T therapies appear to be primarily coordinated in larger cancer centers; this was a key consideration for patients, since it would require more frequent, longer drives to doctors’ appointments.
Our conversations with patients informed our review by reinforcing the importance of specific symptoms including fatigue and weakness. In addition, patient perspectives helped focus our review on the side effects of both current treatments as well as the side effects of the new interventions. Finally, all these issues reinforced the importance of considering health-related quality of life as a primary outcome for our review.

©Institute for Clinical and Economic Review, 2021 Page 5 Final Report - Multiple Myeloma Return to Table of Contents
3. Comparative Clinical Effectiveness 3.1. Methods Overview
Procedures for the systematic review assessing the evidence on ide-cel, cilta-cel, and belantamab for heavily pre-treated relapsed and refractory multiple myeloma are described in the Detailed Methods section of the Report Supplement.
Scope of Review
This review compares the clinical effectiveness of ide-cel and cilta-cel for the treatment of adults with TCRMM (majority with triple- or quad-refractory disease) who have received at least three prior lines of therapy, as well as belantamab for adults with triple-, quad- or penta-refractory multiple myeloma who have received at least four prior lines of therapy in comparison with usual care (i.e., commonly used regimens for those exposed to ≥3 and ≥4 prior lines of therapy respectively). The primary patient-important outcomes included OS, PFS, ORR, and health-related quality of life (HRQoL). The full scope of the review is detailed in the Data Sources and Searches section of the Report Supplement.
Evidence Base
The clinical evidence is summarized qualitatively for each intervention separately because the key trials were all single arm studies, so quantitative comparisons were not possible. Details of key studies are described below and summarized in Table 3.1.
Ide-cel
A total of 12 references relating to two single-arm (one Phase I, one Phase II), open label trials of ide-cel met our inclusion criteria. Data from both trials were obtained from publications, conference abstracts, press releases, and information provided by the manufacturers (Table 3.1). In this report, we will report on the Phase II trial (KarMMa), but additional details of both trials are included in the Additional Clinical Evidence section of the Report Supplement.
KarMMa
The KarMMa trial is an ongoing Phase II multi-center, open-label, single-arm trial being conducted at 24 locations worldwide, including North America, Europe, and Japan.10,11 The trial screened 158 adults who had previously been exposed to an immunomodulatory drug (IMiD), a proteasome inhibitor (PI), an anti-CD38 antibody, and were refractory to the last prior therapy and enrolled 149 patients.12 140 patients underwent leukapheresis and most (88%) received bridging therapy during the manufacturing process, before lymphodepletion with fludarabine and cyclophosphamide five

©Institute for Clinical and Economic Review, 2021 Page 6 Final Report - Multiple Myeloma Return to Table of Contents
days prior to infusion (a total of 128 patients, or 86% of the enrolled population, were analyzed)11. Retreatment with ide-cel was allowed among those who had a recurrence. The primary outcome was ORR. Secondary outcomes were complete response (CR), safety, duration of response (DoR), PFS, OS, pharmacokinetics, and HRQoL (Table 3.1).
Cilta-cel
A total of 10 references relating to two open-label, single arm trials (one Phase I and one Phase Ib/II) of cilta-cel met our inclusion criteria. At the time of this report, only results from selected sites from the Phase I trial (LEGEND-2) had been published.13 Data from both trials were therefore obtained from a combination of publications, conference abstracts, and press releases (Table 3.1). In this report, we focus attention on the Phase Ib/II trial (CARTITUDE-1), but additional details of both trials are included in the Additional Clinical Evidence section of the Report Supplement.
CARTITUDE-1
CARTITUDE-1 is an ongoing Phase Ib/II single-arm trial of cilta-cel being conducted in 21 sites in the United States and Japan.14,15 The trial enrolled 126 adults with TCRMM who had progressive disease after at least three prior therapies (including a PI, an IMiD, and anti-CD38 antibody), who are double refractory to an IMiD and PI.16 A total of 113 patients underwent leukapheresis (90% of the enrolled population), 101 underwent lymphodepletion with fludarabine and cyclophosphamide five days prior to infusion (80%), and 97 patients (77% of the enrolled population) were included in the analysis. The primary outcomes were adverse events (AEs) and ORR. Secondary outcomes were OS, PFS, and minimal residual disease (MRD) (Table 3.1).
Belantamab
A total of eight references pertaining to one open-label Phase II clinical trial (DREAMM-2), one conference abstract relating to a pooled post-hoc analysis, and one conference abstract relating to an expanded access program met our inclusion criteria. At the time of this report, two published manuscripts were available for the DREAMM-2 trial,17,18 which were supplemented with conference abstracts and information provided by the manufacturer. Additional details are available in the Supplement.
DREAMM-2
DREAMM-2 is an ongoing Phase II, open-label, global, multicenter trial comparing the efficacy and safety of two doses of belantamab (2.5 mg/kg and 3.4 mg/kg) in adults with TCRMM.17 In total, 196 patients (97 in the 2.5 mg/arm and 99 in the 3.4 mg/kg arm) who had been treated with at least three prior lines of treatment and who were refractory to an IMiD, a PI, and refractory to and/or were not able to tolerate an anti-CD38 monoclonal antibody were enrolled in the trial.17 At the time of this report, information on the proportion of patients who are classified as penta-refractory was

©Institute for Clinical and Economic Review, 2021 Page 7 Final Report - Multiple Myeloma Return to Table of Contents
not publicly available (submitted as academic in confidence). In August 2020, the FDA granted accelerated approval to belantamab for the treatment of patients with RRMM with progressive disease after having been treated with four prior lines of therapy. For the purpose of this review, we only present data for the FDA approved dose of 2.5 mg/kg (N=97). The primary outcome assessed was ORR, and secondary outcomes assessed included DoR, time to response, PFS, OS, and safety. All patients who received at least one dose of belantamab were included in the evaluation of efficacy outcomes (ITT population, N=97).
See Supplement for detailed inclusion and exclusion criteria, and definitions of measurable disease and outcomes reported.
Table 3.1. Overview of Key Studies of Ide-cel, Cilta-cel, and Belantamab
Intervention & Trial Inclusion/Exclusion Criteria Outcomes Baseline Characteristics‡ Ide-cel KarMMa11,12 Phase II, open-label single-arm N=149†
Inclusion: − Received at least 2 cycles of ≥3
prior treatment regimens (incl. PI, IMiD, anti-CD38 antibody) and refractory to last regimen
Exclusion: − Previous allogeneic SCT
Primary: ORR Secondary: CR, OS, PFS, AEs, HRQoL
− Age, median (range): 61 (33-78)
− Prior lines of therapy, median (range): 6 (3-16)
− Triple-refractory: 84% − Penta-refractory: 26% − EMD: 39% − High-risk cytogenetics: 35%
Cilta-cel CARTITUDE-116,19 Phase II, open-label single-arm N=126†
Inclusion: − Received ≥3 prior treatment
regimens (incl. PI, IMiD, anti-CD38 antibody) or are double refractory to a PI and IMiD
Exclusion: − Allogeneic SCT within 6 months or
autologous SCT within 4 months
Primary: AEs, ORR Secondary: OS, PFS, MRD
− Age, median (range): 61 (43-78)
− Prior lines of therapy, median (range): 6 (3-18)
− Triple-refractory: 88% − Penta-refractory: 42% − EMD: 13% − High-risk cytogenetics: 23%
Belantamab DREAMM-217 Phase II, open-label, two-arm N=97*
Inclusion: − Received ≥3 previous lines of
treatments − Refractory to IMiD and PI, and
refractory/intolerant to an anti-CD38 therapy
Exclusion: − Received allogeneic SCT − Current corneal epithelial disease
Primary: ORR Secondary: DoR, time to response, PFS, AEs
− Age, median (IQR): 65.0 (60.0-70.0)
− Prior lines of therapy, median (range): 7 (3-21)
− Triple-refractory: 100% − Penta-refractory:
REDACTED − EMD: 23% − High-risk cytogenetics: 42%
AEs: Adverse events, CR: Complete response, DoR: Duration of response, EMD: Extramedullary disease, HRQoL: Health-related quality of life, IQR: interquartile range, MRD: Minimal residual disease, N: total number, ORR: Overall response rate, OS: Overall survival, PFS: Progression free survival, SCT: stem cell transplant. *2.5 mg/kg arm only. † Sample sizes are based on the intention-to-treat population ‡ Baseline characteristics from KarMMa and CARTITUDE-1 are based on the as-treated population

©Institute for Clinical and Economic Review, 2021 Page 8 Final Report - Multiple Myeloma Return to Table of Contents
Usual Care
Our systematic literature review did not reveal any prospective studies evaluating the effectiveness of usual care (defined as commonly-used combination regimens described in our research protocol (https://osf.io/3dtr4/) in triple-class refractory patients. The most relevant evidence to support the clinical effectiveness of usual care for triple-class refractory patients to compare with CAR T-cell treatments came from a retrospective observational study (Table 3.2).7
The MAMMOTH study was a multi-center US-based retrospective analysis of 275 multiple myeloma patients (data were collected between January 2017 and June 2018), of whom 218 were refractory to at least three lines of therapy (PI, IMiD, and anti-CD38 monoclonal antibody).7 70 (25%) were “penta-refractory” (refractory to two PIs, two IMiDs, and an anti-CD38 monoclonal antibody). Primary outcomes were OS, PFS, and ORR. Two additional retrospective studies were identified and are described in the Additional Clinical Evidence Section of the Report Supplement.
Table 3.2. Overview of MAMMOTH Study
Study Inclusion/Exclusion Criteria Outcomes Patient Characteristics MAMMOTH7 Retrospective chart review N=275 (54% triple/ quad-refractory, 25% penta-refractory)
Inclusion: − Refractory to at least 1 PI, 1
IMiD, and 1 anti-CD38 Exclusion: NR
Primary: OS, PFS, ORR
− Age, median (range): 65 (27-90) − Prior lines of therapy, median
(range): 4 (1-16) − Triple- and quad-refractory: 75% − Penta-refractory: 25% − High-risk cytogenetics: 29%
IMiD: Immunomodulatory drug, N: total number, NR: not reported, PI: Proteasome inhibitor, ORR: Overall response rate, OS: Overall survival, PFS: Progression free survival Key Differences Across Studies
See the Report Supplement Table D3.2 for details on baseline characteristics of the key trials of the interventions. Key differences are summarized below.
Although the study participants in KarMMa and CARTITUDE-1 were of similar ages (median age 61 in both) and had received a similar amount of pre-treatment (median of 6 prior lines of therapy), patients in the CARTITUDE-1 trial were more likely to be penta-refractory than patients in the KarMMa trial (42% vs 26%), but less likely to have extramedullary disease (EMD, the presence of plasma cells outside the bone marrow, a marker of more aggressive disease) (13% vs 39%), and high-risk cytogenetics (23.7% vs 35.2%).11,20 In KarMMa, 28 patients (22% of the treated population) were retreated with ide-cel after disease progression. At the time of this report, retreatment was not reported in CARTITUDE-1. In DREAMM-2, the patients undergoing treatment with belantamab were typically older (median age 65), had undergone more pre-treatment (median of seven prior lines of therapy), and were more likely to have high-risk cytogenetics (42.3%);17 the percentage of penta-refractory patients was provided to us as academic in confidence (REDACTED).

©Institute for Clinical and Economic Review, 2021 Page 9 Final Report - Multiple Myeloma Return to Table of Contents
A key difference between the pivotal CAR-T therapy trials and DREAMM-2 was the approach for inclusion in the outcomes analysis. KarMMa and CARTITUDE-1 both only included patients who were infused in the analysis (86% and 77% of enrolled and 91% and 86% of leukapheresed patients, respectively) in an as-treated approach, whereas DREAMM-2 reports on the full intention-to-treat (ITT) population.
The study populations in MAMMOTH were of similar age (median 60 years) to those in KarMMa and CARTITUDE-1 (median 61 years), but appeared to have received less pre-treatment overall (median of four prior lines of therapy versus six or seven).7 For this reason, we report the outcomes for triple and quad-penta-refractory patients separately. Furthermore, the exclusion criteria for MAMMOTH were not reported, making it difficult to interpret differences in study populations relative to the key studies of the interventions. See the Report Supplement Table D3.19 for details on baseline characteristics of the studies of usual care.
3.2. Results
Clinical Benefits
The primary outcomes that are used in the economic model are PFS and OS as defined in the clinical trials. The key clinical benefits of ide-cel are described first, followed by cilta-cel and belantamab. Additional outcomes are described in the Report Supplement.
Ide-cel
In the KarMMa trial, with a median follow-up time of 13.3 months (range 0.2-21.2 months) the as-treated median PFS across all target CAR-T therapy doses was 8.8 months, and the as-treated median OS was 19.4 months. Twelve-month as-treated OS and PFS was 78% and 38%, respectively. 11 The as-treated median PFS varied by dose, with the highest dose (450x106 CAR-T cells) achieving the longest median PFS (12.1 months). The as-treated ORR was 73% (94 out of 128 infused patients) and the as-treated stringent complete or complete response rate (sCR or CR) was 33% (42 out of 128) across all doses. The reported outcomes from KarMMa likely represents an optimistic estimate of the results since they are based on patients who received infusion of CAR-T cells, excluding patients who did not receive the therapy due to death prior to infusion, disease progression, or AEs. When calculated on an ITT (that is, including all enrolled patients, including those who were enrolled, leukapheresed but not infused), however, ORR was 63% (94 out of 149 enrolled patients) and sCR or CR was 28% (42 out of 149) (Table 3.3).16 33 patients (26% of the treated population) had MRD-negative status.
Importantly, 28 patients (22% of the treated population) were retreated with ide-cel after disease progression, a statistic that was not available until publication of the trial results. Limited data were

©Institute for Clinical and Economic Review, 2021 Page 10 Final Report - Multiple Myeloma Return to Table of Contents
available on the characteristics of these patients and their associated outcomes; however, PFS in these patients was generally poor, with a median of one month following retreatment.11
In the KarMMa trial, HRQoL was assessed using the EQ-5D, EORTC QLQ-C30, and MY20 scales (details on these cancer-specific instruments are available at https://qol.eortc.org/) prior to induction and at day one and nine months post-infusion with ide-cel. Physical functioning, fatigue, pain, and global health sub-scales all improved at nine months compared to baseline (Table 3.4); however data on only 59 of 111 (53%) patients assessed at day one were available at nine months.21 More details on patient-reported outcomes for ide-cel are available in Table D3.10 of the Report Supplement.
Cilta-cel
At the time of this report, as-treated median PFS and OS were not reached with a median of 18 months of follow-up (range 1.5-30.5 months) in the CARTITUDE-1 trial. Eighteen-month as-treated OS and PFS was 81% and 66%, respectively, a decline from 89% and 77% at 12 months. 15,20 Using an as-treated approach, ORR was 98% (95 out of 97 infused patients) and sCR was 80% (78 out of 97 infused patients had an sCR). However, in an ITT analysis, using the overall enrolled population, ORR was 75% (95 out of 126 enrolled patients) and sCR was 62% (78 out of 126) (Table 3.3).16 56 patients (58% of the treated population) had MRD negative status. No data were available on whether any patients receiving cilta-cel required retreatment. More details on outcomes data for cilta-cel are available in Table D3.4 of the Report Supplement.
In CARTITUDE-1 the EORTC QLQ-C30 was administered prior to induction and at various time points post-treatment. At the time of the report, only data on fatigue and pain sub-domains were available. At 184 days, both fatigue and pain scores improved relative to baseline (Table 3.4), however data were available for only 30 out of the 68 (44%) patients who were assessed at baseline.22 More details on patient-reported outcomes for cilta-cel are available in Table D3.10 of the Report Supplement.
Belantamab
At the 13-month follow-up (data cut-off date: January 14 2020), patients treated with 2.5 mg/kg belantamab had a median PFS of 2.8 months and median OS of 13.7 months.23 Please refer to the Report Supplement for OS rates at three, six, nine, and 12 months. PFS rates at three to 12 months were submitted as academic in confidence (REDACTED, REDACTED, REDACTED, REDACTED). Thirty-one out of 97 participants (32%) achieved an overall response, with five and two patients achieving CR and sCR, respectively.
In DREAMM-2 HRQoL was assessed by means of the EORTC-QLQ-C30, EORTC-QLQ-MY20, and Ocular Surface Disease Index (OSDI) scales. Between weeks 0 to 25, patients’ HRQoL was stable

©Institute for Clinical and Economic Review, 2021 Page 11 Final Report - Multiple Myeloma Return to Table of Contents
across all domains (disease symptoms, pain, fatigue, role functional, physical functioning, global health status, social functioning, and future perspective). For the 25% of patients who responded to treatment and remained on treatment beyond 25 weeks, there was a trend toward improvement in some of these HRQoL domains.24 However, this trend toward improvement is only applicable to the small minority of patients who remain on therapy beyond 25 weeks.
Additional data on HRQoL data for belantamab can be found in Table D3.10 of the Report Supplement.
Table 3.3. Key Trial Results of Ide-cel, Cilta-cel, and Belantamab
Intervention Trial (N) Median Follow-Up Duration
As-treated PFS, Median Months
(95% CI)
As-treated OS, Median Months
(95% CI)
ITT ORR, n (%);
[95% CI] Ide-cel KarMMa11,12
(N=149)‡ 13.3 months§ 8.8 (5.6, 11.6)§ 19.4 (18.2, NE)§ 94 (63.0);
[NR] Cilta-cel CARTITUDE-
115,16,20 (N=126)‡
18 months§ Not reached at 18 months§
Not reached at 18 months§
95 (75.0); [NR]
Belantamab DREAMM-217 (N=97*)
13 months 2.8 (1.6, 3.6) ‡ 13.7 (9.9, not reached)‡
31 (32.0); [97.5%CI: 21.7, 43.6]
95%CI: 95% confidence interval, 97.5%CI: 97.5% confidence interval, NE: not estimable, NR: not reported, n: number, ORR: Overall response rate, OS: Overall survival, PFS: progression free survival *2.5 mg/kg arm only ‡ Intention-to-treat § Median Follow-up duration, PFS and OS for KarMMa and CARTITUDE-1 are based on the as-treated population
Table 3.4. Change from Baseline in Health-Related Quality of Life (Selected EORTC QLQ-C30* Sub-Domains)
Intervention (Trial)
Time from Baseline (N)
Physical Functioning,
Mean (95% CI)
Fatigue, Mean (95% CI)†
Pain, Mean (95% CI)†
Global Health, Mean (95% CI)
Ide-cel‡ (KarMMa)21
9 months (N=59)
13.2 (7.9, 17.9)
-22.8 (-29.1, -17.1)
-23.8 (-30.2, -18.3)
15.4 (9.8, 20.9)
Cilta-cel‡ (CARTITUDE-1)22
6 months (N=30)
NR -9.2 (-16.4, -2.0)
-8.9 (-17.6, -0.3)
NR
Belantamab ‡ (DREAMM-2)24,25
6 months (N=19)
-0.1 (-5.3, 5.3)
3.6 (-7.6, 14.6)
2.6 (-6.5, 11.4)
-4.7 (-12.1, 2.8)
95%CI: 95% confidence interval, N: total number, NR: not reported, ORR: Overall response rate. *EORTC QLQ-C30: European Organization for Research and Treatment of Cancer Quality of Life Questionnaire for Cancer Patients †Negative changes indicate a reduction in pain or fatigue ‡Mean changes from baseline have been digitized and should be interpreted with caution

©Institute for Clinical and Economic Review, 2021 Page 12 Final Report - Multiple Myeloma Return to Table of Contents
Usual Care
We identified three retrospective observational studies to inform our comparison of usual care to the interventions.7,26,27 In this report, we present outcomes from the MAMMOTH study because outcomes are available across various lines of therapy as well as on an overall basis.7 The majority of patients in the MAMMOTH study were refractory to daratumumab (93%), lenalidomide (77%), bortezomib (68%), and pomalidomide (65%) and a minority were refractory to carfilzomib (47%), ixazomib (12%), and thalidomide (8%). Median PFS was 3.4 months in the overall population but was not separately reported in the triple-quad and penta-refractory populations. Median OS was 9.3 months in the overall population, 9.2 months in the triple-quad population, and 5.6 months in the penta-refractory population. Overall response was 29-31% (Table 3.5). Additional details on the outcomes from MAMMOTH and the additional retrospective studies are provided in Tables D3.15 and D3.16 in the Report Supplement.
Table 3.5. Key Results MAMMOTH Study
Study Population (N) PFS, Median Months, (95% CI)
OS, Median Months (95% CI) ORR, n (%)
MAMMOTH7
Overall (N=275) 3.4† (2.8-4.0) 9.3† (8.1, 10.6) 85 (31.0)* Triple- and quad-refractory (N=148)
NR 9.2 (7.1, 11.2) 80 (29.0)*
Penta-refractory (N=70) NR 5.6 (3.5, 7.8) 21 (30.0)* 95%CI: 95% confidence interval, N: total number, n: number, ORR: Overall response rate, OS: overall survival, PFS: progression-free survival. * ORR calculated based on first line of therapy. † PFS and OS on next line after T0.
Harms
Harms of ide-cel, cilta-cel, and belantamab are presented based on the number of study participants who were actually infused/treated (“safety population”).
Ide-cel
In the KarMMa trial, cytokine release syndrome (CRS) was the most commonly-reported AE, reported by 84% of patients (48% Grade 1; 31% Grade 2) and lasting a median of 5 days.11 Of 107 patients who had CRS with or without neurotoxicity, 19 (17.8%) required intensive care unit admission.28 CRS was most likely to be managed with tocilizumab (52%), followed by corticosteroids (15%). Risk of CRS appeared to be dose-related, reported by 96% of patients in the 450x106 dose compared to 76% in the 300x106 dose. Patients in the 450x106 dose were also more likely to require tocilizumab to manage their CRS than patients in the 300x106 dose (67% vs 43%). Older patients were also more likely to experience CRS; all 20 patients ≥70 reported CRS across all doses. Other important AEs included neurotoxicity (18%), thrombocytopenia (63%), and

©Institute for Clinical and Economic Review, 2021 Page 13 Final Report - Multiple Myeloma Return to Table of Contents
neutropenia (91%) (Table 3.6). Forty-four (34%) patients died during the study, with 27 (21%) due to progressive disease. Three deaths (2%) were treatment-related AEs within 8 weeks of infusion (CRS, pneumonia, gastrointestinal hemorrhage). An additional treatment-related death from pneumonia was reported within 6 months of infusion.11 More information on harms of ide-cel are available in Table D3.11 of the Report Supplement.
Cilta-cel
In CARTITUDE-1, 95% of patients reported CRS, with most 95% experiencing low to moderate CRS (51% Grade 1 and 39% Grade 2).20 Median time to onset of CRS was seven days (range 1-12) and lasted a median of four days (range 1-97). CRS was most likely to be managed with tocilizumab (69%), followed by corticosteroids (22%) and anakinra (19%). Other important AEs included neurotoxicity (21%), thrombocytopenia (79%), and neutropenia (96%) (Table 3.6). A total of 14 deaths (14.4%) were reported during the study, five due to progressive disease, three due to AEs unrelated to treatment (pneumonia and other cancers), and six due to AEs related to treatment (sepsis, CRS, lung abscess, respiratory failure, neurotoxicity).20 More information on harms of cilta-cel are available in Table D3.12 of the Report Supplement.
Belantamab
In DREAMM-2, AEs were reported by 97.9% of patients treated with belantamab 2.5 mg/g (N=95).23 The vast majority of AEs were considered to be related to the study treatment (88.4%). Three patients (3.2%) died during the study due to AEs (myocardial infarction (n=2), sepsis (n=1)), with one death being treatment related (sepsis).23 At 6.3 months of follow-up, over three-quarters of the enrolled participants had discontinued study treatment, mainly due to disease progression or death (60.8% and 32.6%, respectively).17 Nine patients (10%) discontinued study treatment due to AEs (one due to keratopathy and one due to blurred vision).23 AEs frequently led to dosing modifications, with over half (54%) experiencing dose delays and over a third (35%) requiring dose reductions. Keratopathy, defined as changes to the corneal epithelium, was reported by 72% of patients; however at 13 months follow-up, 77% had recovered from their first, and 48% from their last corneal event.17,18 Forty-six percent of patients experienced a moderate decline in vision (Grade 2 toxicity, Best Corrected Visual Acuity), which resolved in most patients at the end of study follow-up. A decline in vision in their better-seeing eye to 20/50 or worse was reported by 18% of patients. The majority, 82%, recovered (improved to 20/40 or better) by the end of the follow-up period. No patients reported permanent vision loss. More information on harms of belantamab are available in Table D3.13 of the Report Supplement.

©Institute for Clinical and Economic Review, 2021 Page 14 Final Report - Multiple Myeloma Return to Table of Contents
Table 3.6. Key Harms of Ide-cel, Cilta-cel, and Belantamab
Intervention Trial (N) Treatment-related SAEs Important AEs D/C due to
AEs
Overall Mortality at
Median Follow-Up
Time Ide-cel KarMMa11
(N=128) 3.1% - CRS: 84%
- NT: 18% - Thrombocytopenia: 63%
NR 34% at 13.3 months (range 0.2-21.2)
Cilta-cel CARTITUDE-120 (N=97)
NR - CRS: 95% - NT: 21% - Thrombocytopenia: 79%
NR 14% at 12.4 months (range 1.5-24.9)
Belantamab DREAMM-217,23 (N=95)†
11.6% - CRS: 0% - NT: 0% - Thrombocytopenia: 38% - Moderate decline in vision in more affected eye (BCVA Grade 2+): 46% - Meaningful decline in vision (20/50 or worse in better eye): 18%
10% 33% at 6.3 months (IQR 3.7-7.7)
AE: adverse event, CRS: cytokine release syndrome, D/C: discontinuation, N: total number, NT: neurotoxicity, SAE: serious adverse event, BCVA: Best Corrected Visual Acuity, IQR: interquartile range * Xi’an site only. † safety population (2.5 mg/kg).
Usual Care
The retrospective observational studies we selected to represent the effectiveness of usual care did not provide sufficient or consistent information on the harms of the treatment regimens. Therefore, we selected representative prospective trials of commonly used treatments for TCRMM (Elo-Pom-Dex: elotuzumab-pomalidomide-dexamethasone, Car-Cy-Dex: carfilzomib-cyclophosphamide-dexamethasone, Ixa-Len-Dex: ixazomib-lenalidomide-dexamethasone).29-31 Serious AEs were common, reported by roughly half of the participants. The most commonly reported grade 3 or 4 AEs included neutropenia, anemia, infection, and thrombocytopenia. Discontinuation rates due to AEs varied from 14 to 18% (Table 3.7). Differences in harms between these regimens and that of the interventions should be interpreted with caution, however, as the trials were generally conducted in less heavily pre-treated populations.

©Institute for Clinical and Economic Review, 2021 Page 15 Final Report - Multiple Myeloma Return to Table of Contents
Table 3.7. Harms of Selected Commonly-Used Usual Care Regimens
Treatment Trial (N) Serious AEs Important Grade 3/4 AEs Deaths (all) Discontinuation
Due to AEs Elo-Pom-Dex ELOQUENT-331
(N=60) 53% − Neutropenia: 13%
− Anemia: 10% − Infection: 13%
22% 18%
Car-Cy-Dex Bringhen 201430 (N=56)
NR − Neutropenia: 20% − Anemia: 11% − Infection: 5%
13% 14%
Ixa-Len-Dex TOURMALINE-MM129 (N=361)
46.5% − Neutropenia: 22% − Anemia: 9% − Infection: <1%
4% 17%
AE: adverse events, Car: carfilzomib, Cy: cyclophosphamide, Dex: dexamethasone, Elo: elotuzumab, Ixa: Ixazomib, Len: lenalidomide, n: number, N: total number, Pom: pomalidomide.
Subgroup Analyses and Heterogeneity
Data on efficacy outcomes by subgroups of patients (such as by age, high risk cytogenetics, race/ethnicity, etc.) were not consistently reported. In the KarMMa trial, as-treated median PFS for ide-cel was 8.6 months for patients 65 years or older (n=45) and 10.2 months for 70 or older (n=20), compared to 8.8 months for the overall population.32 As-treated median PFS for the 50 patients in the KarMMa trial who had EMD was 7.9 months, and for the 45 patients with high cytogenetic risk was 8.2 months.33 At the time of this report, efficacy data by subgroups was not available for the CARTITUDE-1 trial.
In DREAMM-2, ITT median PFS for belantamab was 2.9 months for patients who had previously been unsuccessfully treated with three to six therapies and 2.2 months for those who had received seven lines of treatment or more.34 ITT median PFS for patients with high cytogenetic risk factors was 2.1 months.35 For those with mild to moderate renal impairment, ITT median PFS was 2.2 and 3.7 months, respectively.36 At 6.3 months of follow up, 43.6% of patients aged 65 to < 75 years achieved an overall response, while only one patient (7.7%) in the age group 75 and above achieved an overall response. 31.6% of White, and 37.5% of Black patients achieved an overall response at 6.3 months of follow-up. ORR at 13 months of follow-up was submitted to ICER as academic in confidence (REDACTED). Similar to other studies, substantially fewer Black patients were enrolled in this study compared to White patients (16 and 72 patients, respectively).17
Uncertainty and Controversies
Several important uncertainties remain in our evaluation of CAR T-cell therapies. First, 9% of the ide-cel patients who were leukapheresed did not receive treatment (14% for cilta-cel) and were not included in the published ORR and PFS estimates. Since manufacturing failures (i.e., inability to successfully encode the patients’ T-cells) are now rare, most patients who were enrolled but not

©Institute for Clinical and Economic Review, 2021 Page 16 Final Report - Multiple Myeloma Return to Table of Contents
able to receive treatment likely had more severe or more aggressive disease. Thus, it is likely that accounting for these patients would diminish the benefits seen with ide-cel and cilta-cel; future studies should publish an ITT analysis incorporating these patients. Our calculated ITT analysis decreased the ORR from 73% to 63% for KarMMa and from 98% to 75% for CARTITUDE-1. Second, additional follow-up data are needed for ide-cel and cilta-cel to quantify the median PFS and OS; outcomes data are particularly limited for cilta-cel, as no comprehensive presentations or peer-reviewed publications are available, and the manufacturer did not respond to requests for additional data. Longer-term data may also allow us to definitively determine whether a small minority of patients are able to achieve a long-term, durable response, and to understand whether retreatment with CAR-T therapy might be necessary in others. Third, additional information is needed regarding the specific nature and potential causes of cilta-cel treatment-related deaths (6% in CARTITUDE-1). Fourth, while there is interest in utilizing CAR T-cell therapies earlier in the MM disease course, studies are needed to determine whether these therapies are superior to current therapies for first or second relapse of MM.
Uncertainties also remain in our evaluation of belantamab. First, additional studies should examine the median OS with belantamab. Across 22 RCTs in relapsed and refractory patients MM, a meta-analysis found that the ratio between PFS and OS was approximately 3.137; previous meta-analyses have generated comparable results.38 However, in the pivotal DREAMM-2 study, the 2.5mg/kg arm had a median PFS of 2.8 months and a median OS of 13.7 months, for a 4.9 ratio. While it is possible that the OS/PFS ratio would differ substantially for belantamab compared to all other treatments for MM, further studies are needed to confirm or refute the current OS/PFS ratio seen for belantamab. Second, while belantamab was approved as a single-agent treatment, other MM treatments are most effective as doublet or triplet therapies. We await the results of ongoing studies combining belantamab with other treatments to determine whether belantamab would be helpful as a component of novel combination therapies. Lastly, more research is needed to determine a treatment approach best suited for the management of keratopathy, and ultimately to reduce the burden of ocular toxicities on patients, improve patient outcomes and reduce the need for dose adjustments or treatment discontinuation.18

©Institute for Clinical and Economic Review, 2021 Page 17 Final Report - Multiple Myeloma Return to Table of Contents
3.3. Summary and Comment
An explanation of the ICER Evidence Rating Matrix (Figure 3.1) is provided in the Supplement.
Figure 3.1. ICER Evidence Rating Matrix

©Institute for Clinical and Economic Review, 2021 Page 18 Final Report - Multiple Myeloma Return to Table of Contents
Our systematic review of the evidence suggests that CAR T-cell therapies for patients with triple-or quad- refractory MM likely provides small to substantial net health benefits over current usual care. Benefits included longer survival as well as improved quality of life. Counterbalancing these benefits were the harms, including CRS, which is temporary but often requires hospitalization and intensive care unit level care.
Our systematic review of cilta-cel and ide-cel suggests that the evidence is insufficient to determine whether one agent is superior to the other. There are no studies comparing these agents directly, nor sufficient data to perform quantitative indirect comparisons. We conclude that belantamab is promising but inconclusive compared to usual care for patients with triple-, quad- and penta- refractory MM exposed to 4+ prior lines of treatment. The ORR and OS suggests a possible small net benefit. However, the frequency and severity of visual impairment and lack of demonstrated improvement in HRQoL suggests that any net benefits are likely to be modest. The current evidence precludes a substantial benefit; additional data is required to preclude small overall net harm.
Table 3.8. Evidence Ratings
Treatment Comparator Evidence Rating Triple- or quad- refractory MM (3+ prior lines of treatment) Ide-cel Usual Care B+ Cilta-cel Usual Care B+ Ide-cel Cilta-cel I Triple-, quad- or penta- refractory MM (4+ prior lines of treatment) Belantamab Usual Care P/I
MM: multiple myeloma

©Institute for Clinical and Economic Review, 2021 Page 19 Final Report - Multiple Myeloma Return to Table of Contents
4. Long-Term Cost-Effectiveness 4.1. Methods Overview
The primary aim of this section of the review was to assess the lifetime cost-effectiveness of ide-cel, cilta-cel, and belantamab as compared to relevant comparator treatments. We developed a de novo decision analytic model for this evaluation, informed by key clinical trials and prior relevant economic models.39,40
Specific to CAR-T therapies, an initial decision tree was used to calculate the costs and consequences from treatment initiation (i.e., leukapheresis) to T-cell infusion. We note this differs somewhat from our reporting of “intent to treat” results based on all enrolled trial patients, but better fits the purpose of the model, which is to reflect costs and outcomes following the initiation of the CAR-T therapy process. The decision tree included patients who were eligible for CAR-T therapy and who had undergone leukapheresis. After initiating leukapheresis, patients could continue to receive the infusion of the engineered T-cells; discontinue (before infusion but after leukapheresis) because of disease progression, adverse events, or manufacturing failures; or die before receiving the infusion. Those who discontinued prior to T-cell infusion received the costs, benefits, and risks of the market basket of triple- or quad-refractory comparators.
The cohort of patients were assigned to three mutually exclusive and exhaustive health states in a partitioned survival model (Figure 4.1). Health states included 1) alive and progression free or responding to therapy, 2) alive and not responding to therapy/subsequent relapse, and 3) dead from multiple myeloma-related complications or other causes. We accounted for on/off therapy through application of differential utilities within a health state. At the end of each cycle, patients in the alive and progression free or responding to therapy health states did not transition treatments. Those in the alive and not responding to therapy/subsequent relapse health state transitioned to a progressed state that included a market basket of subsequent therapies. Patients remained in the model until they died. Health state occupancy was derived using partitioned survival techniques that included the direct extrapolation of progression-free survival (PFS) and overall survival (OS) Kaplan-Meier curves. A detailed description of curve digitization is available in Supplement Section E2.
Model outcomes included total life years (LYs) gained, quality-adjusted life years (QALYs) gained, equal-value life years gained (evLYG), time progression free/responding to treatment, and total costs for each intervention over a lifetime time horizon discounted at 3% per annum. Supplement Table E.3.1-E.3.3 present undiscounted results.

©Institute for Clinical and Economic Review, 2021 Page 20 Final Report - Multiple Myeloma Return to Table of Contents
Figure 4.1. Model Structure
*Includes up-front decision tree to account for patient disposition from leukapheresis and through CAR-T infusion.
Target Population
The model focused on an intention-to-treat analysis, with a hypothetical cohort of heavily pre-treated patients with MM beginning at age 60. The CAR-T trials’ enrollment criteria required patients to have been treated with at least 3 previous lines of therapy. However, enrolled patients had received a median of 6 previous lines of therapy and were 84% – 88% TCRMM. For belantamab, 100% were at least triple class-refractory and enrolled patients had received a median of 7 previous lines of therapy. Cohort characteristics for each treatment group are described in Supplemental Table E.1.2 and E.1.3.
Treatment Strategies
Interventions
The list of interventions was developed with input from patient organizations, clinicians, manufacturers, and payers on which treatments to include. The full list of interventions is as follows:
• Idecabtagene vicleucel (Abecma®, Bristol Myers Squibb, bluebird bio, Inc.) • Ciltacabtagene autoleucel (Janssen, Legend Biotech) • Belantamab mafodotin-blmf (Blenrep®, GlaxoSmithKline)

©Institute for Clinical and Economic Review, 2021 Page 21 Final Report - Multiple Myeloma Return to Table of Contents
Comparator Treatments
Given the numerous available therapies used by clinicians at various lines of therapy, a market basket approach was used to compare to each intervention based on level of pretreatment using the MAMMOTH study and a recent conference proceeding that estimated the distribution of treatments by line of therapy.7,27 The market basket composition was approximated by both broad-therapy and specific-therapy estimations. PFS and OS curves were either directly informed by the MAMMOTH study or derived as described in the model structure section.7 Supplement Tables E.2.3 and E.2.4 provide dosing, administration schedules, and unit costs for each market basket of comparators.
4.2. Key Model Assumptions and Inputs
Our model includes several key assumptions described in Table 4.1.
Table 4.1. Key Model Assumptions
Assumption Rationale For CAR-T therapies, patients received at least one full single course of therapy. A proportion of patients were re-treated and assigned the full costs associated with CAR-T, including infusion and other resource utilization.
A proportion of patients in the KarMMa trial were re-treated and we assume the cost of re-treatment would be incurred for the infusion and other resources during and after infusion. In the absence of data from CARTITUDE-1 on retreatment, we assumed the same percentage across CAR-Ts and tested this in a scenario analysis.
Subsequent treatments received after progression are uniform within each population/line of therapy.
Patients progressing but still alive are assumed to receive subsequent therapy consistent with the line of therapy by population.
Parametric curve functions were fit separately for each population/treatment and used to extrapolate the data over a lifetime horizon.
Given different populations and lines of treatment, an indirect treatment comparison with the same baseline comparator across populations/treatments was not feasible.
Recent observational evidence on patients using a mix of therapies was used to estimate PFS and OS of relevant comparators.
There is wide variation in therapies used by line of therapy; we used a population with a mix of the most recently used therapies to reflect survival under conditions of current practice in RRMM.
In cases with immature survival data, calibration methods were used to adjust the relationship between PFS and OS based on prior evidence in multiple myeloma.
In some cases, OS data were immature and to calculate health outcomes, we used calibration methods to adjust relationships between PFS and OS.
Patients who discontinue CAR-T therapy due to an AE, or manufacturing failure before receiving the T-cell infusion received comparator treatment benefits, risks, and costs; those who died were accounted for prior to CAR-T infusion.
Patients with MM often receive some level of therapy or intervention until death and therefore patients that discontinued received a market basket of subsequent therapies consistent between each arm of the model.

©Institute for Clinical and Economic Review, 2021 Page 22 Final Report - Multiple Myeloma Return to Table of Contents
The model included only grade 3/4 adverse events and specific toxicities as well as all grades of cytokine release syndrome.
Less severe adverse events are not expected to significantly impact patient health outcomes or costs, although there is evidence to suggest an impact of cytokine release syndrome and keratopathy on outcomes and cost across all grades.
95%CI: 95% confidence interval, CAR-T: chimeric antigen receptor T-cell, MM: multiple myeloma, OS: overall survival, PFS: progression-free survival
Model inputs were estimated from the clinical review, published literature, and information from expert stakeholders. Model inputs included PFS, OS, occurrence of adverse events, quality-of-life utility values, and health care costs. We note that data on PFS are extremely limited for cilta-cel; we used reported data for PFS from CARTITUDE-1 and used prior estimates of the relationship between PFS and OS to estimate the median OS. Probabilities, costs, and other inputs differed between treatments to reflect varying effectiveness between interventions. Health state utility values were consistent across interventions within the same disease, although different utilities were applied for patients in the progression-free state depending on whether they were on or off therapy. Key model inputs are described in Tables 4.2 and 4.3 for interventions in the triple- or quad-refractory population and for interventions in the triple-, quad-, or penta-refractory population, respectively.

©Institute for Clinical and Economic Review, 2021 Page 23 Final Report - Multiple Myeloma Return to Table of Contents
Table 4.2. Key Model Inputs for Population with Triple- or Quad-Refractory MM (3+ prior lines of treatment)
Parameter Ide-Cel Cilta-Cel CAR-T
Comparator Market Basket
Progression-Free Survival, Median
8.8 Months Not reached; 12 and 18 month % PFS used
3.4 Months
Overall Survival, Median 19.4 Months NR; 18 month % OS used
9.2 Months
Progression-Free on Therapy and Responding Utility
0.78
Progression-Free Off Therapy and Responding Utility
0.82 0.82 N/A
Progressed Disease/Not Responding to Therapy Utility
0.71
Proportion of patients infused (CAR-T specific)
91% 86% N/A
Proportion of patients re-treated (CAR-T specific)
22% of those initially infused 22% of those initially infused
N/A
Treatment Acquisition Price* $419,500 $419,500 (assumption based on ide-cel list price)
$24,829 per cycle applied until progression
Administration, Monitoring, and Adverse Event Management Costs Applied in First Model Cycle†
$18,500 (CRS grade 1) - $121,500 (CRS grade 4); other AE costs and monitoring included in decision tree
$18,500 (CRS grade 1) - $121,500 (CRS grade 4); other AE costs and monitoring included in decision tree
$4,661
Other Management-Related Costs per Model Cycle
$540
Key Sources (see inputs section and supplement for all sources)
Delforge et al 202041;Hari et al, 202028;Munshi et al, 202111
Delforge et al 202042;Hari et al, 202028;Madduri et al, 202015,20
Gandhi et al, 201942;Gandhi et al, 20197;Mehra et al, 202027
CAR-T: chimeric antigen receptor T-cells, N/A: not applicable, NR: not reported. *Comparator market basket price assumes 15% discount for oral therapies based on Federal Supply Schedule pricing † For ide-cel approximately 80% had a grade 1-4 CRS event, whereas for cilta-cel approximately 95% had a grade 1-4 CRS event
Table 4.3. Key Model Inputs for Population with Triple-, Quad-, or Penta- Refractory MM (4+ prior lines of treatment)

©Institute for Clinical and Economic Review, 2021 Page 24 Final Report - Multiple Myeloma Return to Table of Contents
Parameter Belantamab Belantamab Comparator Market Basket
Progression-Free Survival, Median 2.8 Months 2.6 Months Overall Survival, Median 13.7 Months 7.7 Months Progression-Free on Therapy and Responding Utility 0.78 Progressed Disease/Not Responding to Therapy Utility 0.71 WAC Price per Treatment Cycle* $8,277 per vial $20,434 Administration and Monitoring Costs per Model Cycle $355 $1,301 Adverse Event Management Costs for First Two Model Cycles
$2,565 $1,259
Other Management-Related Costs per Model Cycle $540 Key Sources (see inputs section and supplement for all sources)
Delforge et al,202042;Lonial et al, 202043
Gandhi et al, 201942;Gandhi et al, 20197;Mehra et al, 202027
*Belantamab dosing based on weight distribution from trial with proportion of patients receiving 2 or 3 vials (proportion redacted); comparator market basket price assumes 15% discount for oral therapies based on Federal Supply Schedule pricing
Clinical Inputs
Base-case survival was derived from parametric fits to each intervention’s available PFS and OS Kaplan-Meier curves.14,43,44 Tables E.2.5 and E.2.6 delineate the evidence that was used to calculate transition probabilities. The model included any grade 3/4 adverse event that occurred in at least 5% of patients for any of the treatments and comparators. Given the potentially significant impact of cytokine release syndrome on health care resource utilization and quality of life, we included all grades 1-4 for these adverse events and adjusted costs and quality of life estimates accordingly. The costs and disutility of adverse events were applied to the first two model cycles for each intervention and comparator. After cycle 2 of the model, we applied a dose adjustment factor, assuming adverse events would be resolved with lower dosing of each therapy. Supplement Table E.2.8 lists the adverse events considered. Health state utilities were applied for each model health state to adjust for quality-of-life changes over time. Utilities were derived from publicly available sources.42 Tables 4.2 and 4.3 show health utility values by line of therapy. Supplement Table E.2.9 describes the adverse event disutilities.
Economic Inputs
All costs used in the model were updated to 2020 US dollars using methods following the ICER reference case. The unit cost for each treatment is reported in Supplement Table E.2.10. The regimens used for each comparator treatment can be found in Supplement Table E.2.3 and E.2.4. We used the list price for ide-cel and, in the absence of any available market projection or other data, assumed the same price for cilta-cel. The wholesale acquisition cost for belantamab was used.45 Comparator therapy pricing was based on WAC pricing with 15% discounts on oral therapies based on the Federal Supply Schedule. Costs associated with additional health care utilization that occurred from administration and monitoring, and post-treatment were included in

©Institute for Clinical and Economic Review, 2021 Page 25 Final Report - Multiple Myeloma Return to Table of Contents
the model. Supplement Table E.2.12 details the health care utilization unit costs used in the model and the evidence sources. AE costs were derived from reasonable treatment assumptions used in previous analyses mentioned as evidence sources in Supplement Table E.2.14.
4.3. Results
Base-Case Results
The total discounted costs, life years (LYs), quality-adjusted life years (QALYs), and equal value of life years gained (evLYG) over the lifetime time horizon are detailed in Tables 4.4, 4.5, and 4.6. In the triple- or quad- refractory cohort of patients treated with three or more lines of therapy, ide-cel had a total discounted cost of $646,000 with discounted LYs, QALYs, and evLYG gained of 2.97, 2.24, and 2.40, respectively. Cilta-cel had a total discounted cost of $609,000 with discounted LYs, QALYs, and evLYGs gained of 3.10, 2.39, and 2.54, respectively. The CAR-T therapy comparator market basket cohort had a total discounted cost of $276,000 with discounted LYs, QALYs, and evLYGs gained of 1.50, 1.08, and 1.08, respectively. In the triple-, quad-, or penta-refractory cohort of patients treated with four or more lines of therapy, the belantamab arm had a total discounted cost of approximately $254,000 with discounted LYs, QALYs, and evLYGs gained of 1.60, 1.15, 1.19, respectively. The belantamab comparator market basket had a total discounted cost of $218,000 with discounted LYs, QALYs, and evLYGs gained of 1.08, 0.78, and 0.79, respectively. We note that cost differences between belantamab and its comparator were mitigated by dose reduction and/or discontinuation due to adverse events for belantamab.
Table 4.4. Results for the Base-Case for Ide-cel Compared to Triple- or Quad- Refractory MM Comparator Market Basket (3+ prior lines of treatment)
Treatment Intervention Cost
Other non-intervention
costs* Total Cost
Time Spent in PFS State (months)
QALYs Life Years evLYGs
Ide-Cel $466,000 $180,000 $646,000 16.24 2.24 2.97 2.40 CAR-T Comparator Market Basket
$153,000 $123,000 $276,000 5.75 1.08 1.50 1.08
CAR-T: chimeric antigen receptor T-cells, evLYG: equal-value of life years gained, QALYs: quality-adjusted life years gained, PFS: progression-free survival. *Other non-intervention costs include costs for monitoring, progressed treatment costs, physician visits, adverse event management (first two cycles only) and monthly laboratory costs for complete blood count and liver testing

©Institute for Clinical and Economic Review, 2021 Page 26 Final Report - Multiple Myeloma Return to Table of Contents
Table 4.5. Preliminary Base-Case Results for Cilta-cel Compared to Triple- or Quad- Refractory MM Comparator Market Basket (3+ prior lines of treatment)
Treatment Intervention Cost
Other non-intervention
costs* Total Cost
Time spent in PFS State
(months) QALYs Life
Years evLYGs
Cilta-Cel†
(preliminary) $445,000 $164,000 $609,000 25.82 2.39 3.10 2.54
CAR-T Comparator Market Basket
$153,000 $123,000 $276,000 5.75 1.08 1.50 1.08
CAR-T: chimeric antigen receptor T-cells, evLYG: equal-value of life years gained, QALYs: quality-adjusted life years gained, PFS: progression-free survival. *Other non-intervention costs include costs for monitoring, progressed treatment costs, physician visits, adverse event management (first two cycles only) and monthly laboratory costs for complete blood count and liver testing †Using placeholder price for cilta-cel Table 4.6. Results for the Base-Case for Belantamab Compared to Triple-, Quad-, or Penta-Refractory MM Comparator Market Basket (4+ prior lines of treatment)
Treatment Intervention Cost
Other non-intervention
costs*
Total Cost
Time Spent in PFS State (months)
QALYs Life Years evLYGs
Belantamab $152,000 $102,000 $254,000 REDACTED 1.15 1.60 1.19 Belantamab Comparator Market Basket
$118,000 $99,000 $218,000 REDACTED 0.78 1.08 0.79
evLYG: equal-value of life years gained, QALYs: quality-adjusted life years gained, PFS: progression-free survival. *Other non-intervention costs include costs for monitoring, progressed treatment costs, physician visits, adverse event management (first two cycles only) and monthly laboratory costs for complete blood count and liver testing
Table 4.7 presents the incremental results from the base-case analysis, which include incremental cost-effectiveness ratios for the incremental cost per LY gained, incremental cost per QALY gained, and incremental cost per evLYG gained. In the triple- or quad- refractory cohort of patients treated with three or more lines of therapy, total costs for ide-cel were approximately $370,000 greater than total costs for the comparator arm; gains in LYs, QALYs, and evLYGs were 1.47, 1.16, and 1.32 in relation to the comparator arm. This resulted in an incremental cost-effectiveness ratio of approximately $319,000 per QALY gained, $250,000 per LY gained, $280,000 per evLYG gained, and $35,000 per additional PFS month gained for ide-cel versus the comparator arm. In the triple- or quad- refractory cohort of patients treated with three or more lines of therapy, total costs for cilta-cel were approximately $332,000 greater than total costs for the comparator arm; gains in LYs, QALYs, and evLYGs were 1.60, 1.31, and 1.46, respectively. This resulted in an incremental cost-effectiveness ratio of approximately $253,000 per QALY gained, $207,000 per LY gained, $228,000 per evLYG gained, and $17,000 per additional PFS month gained for cilta-cel versus the comparator

©Institute for Clinical and Economic Review, 2021 Page 27 Final Report - Multiple Myeloma Return to Table of Contents
arm. However, we note results for cilta-cel are based on very limited clinical and economic evidence and should be considered preliminary for the purposes of this analysis. Among other key inputs missing, there was no publicly available overall survival curve to inform survival extrapolations and the price of cilta-cel is a placeholder based on the price of ide-cel. In the triple-, quad-, or penta-refractory cohort treated with four or more lines of therapy, total costs for the belantamab arm were approximately $36,000 greater than total costs for the comparator arm; gains in LYs, QALYs, and evLYGs were more than 0.52, 0.37, and 0.40 than that of the comparator arm. This resulted in an incremental cost-effectiveness ratio of approximately $98,000 per QALY gained, $70,000 per LY gained, $93,000 per evLYG gained, and $18,000 per additional PFS month gained for belantamab versus the comparator arm. As mentioned above, cost differences are relatively low for this comparison due to high rates of discontinuation in the belantamab arm.

©Institute for Clinical and Economic Review, 2021 Page 28 Final Report - Multiple Myeloma Return to Table of Contents
Table 4.7. Incremental Cost-Effectiveness Ratios for the Base Case
Treatment Comparator Cost per QALY Gained
Cost per Life Year Gained
Cost per evLYG gained
Cost per additional PFS month gained
Ide-Cel CAR-T Comparator Market Basket
$319,000 $250,000 $280,000 $35,000
Cilta-cel (preliminary)*
CAR-T Comparator Market Basket
$253,000 $207,000 $228,000 $17,000
Belantamab Belantamab Comparator Market Basket
$98,000 $70,000 $93,000 $18,000
evLYG: equal-value of life years gained, QALY: quality-adjusted life year, LY: life years. *Using placeholder price for cilta-cel
Threshold Analyses
Tables 4.8 and 4.9 present the unit price needed for each therapy to reach commonly cited cost-effectiveness thresholds. The price needed to achieve these thresholds would be inclusive of both the manufacturer price and any potential hospital mark-up that may be applied. As above, we note that threshold prices differ substantially between the CAR-T therapies in part because of a paucity of available data on PFS and OS for cilta-cel.
Table 4.8. QALY-Based Threshold Analysis Results
WAC per Unit
Net Price per Unit
Unit Price to Achieve
$50,000 per QALY
Unit Price to Achieve
$100,000 per QALY
Unit Price to Achieve
$150,000 per QALY
Unit Price to Achieve
$200,000 per QALY
Ide-Cel $419,500 N/A $140,000 $192,000 $245,000 $295,000 Cilta-cel (preliminary)*
N/A N/A $168,000 $230,000 $292,000 $354,000
Belantamab $8,277 Redacted $7,300 $8,300 $9,300 $10,400 N/A: not available, evLYG: equal-value life years gained, QALY: quality-adjusted life years gained, WAC: wholesale acquisition cost. *Using placeholder price for cilta-cel

©Institute for Clinical and Economic Review, 2021 Page 29 Final Report - Multiple Myeloma Return to Table of Contents
Table 4.9. evLYG-Based Threshold Analysis Results
WAC per Unit
Net Price per Unit
Unit Price to Achieve
$50,000 per evLYG
Unit Price to Achieve
$100,000 per evLYG
Unit Price to Achieve
$150,000 per evLYG
Unit Price to Achieve
$200,000 per evLYG
Ide-Cel $419,500 N/A $146,000 $206,000 $265,000 $324,000 Cilta-cel (preliminary)*
N/A N/A $175,000 $244,000 $312,000 $381,000
Belantamab mafodotin
$8,277 Redacted $7,300 $8,400 $9,500 $10,600
N/A: not available, evLYG: equal-value life years gained, QALY: quality-adjusted life years gained, WAC: wholesale acquisition cost. *Using placeholder price for cilta-cel
Sensitivity Analyses
To demonstrate effects of uncertainty on both costs and health outcomes, we varied input parameters using available measures of parameter uncertainty (i.e., standard errors or plausible parameter ranges). Figure 4.2 presents an example tornado diagram resulting from the one-way sensitivity analysis for ide-cel versus the triple- or quad-refractory comparator market basket. When varying PFS, we assumed the same proportional relationship in terms of gains in OS. At lower PFS (6 months) the ICER was well above commonly cited cost-effectiveness thresholds while the upper PFS (12 months) generated an ICER of approximately $212,500. Key drivers across all model findings included the unit price of the comparator market basket of therapies, progression-free survival for the active interventions, and utility of PFS (on or off treatment). The belantamab model in particular was extraordinarily sensitive. Small changes in any of the key drivers listed above changed model findings to a significant extent. Please see Supplement Section E4 for additional results from the one-way sensitivity analyses, including tornado diagrams for cilta-cel and belantamab .
Figure 4.2. Tornado Diagram for Ide-Cel

©Institute for Clinical and Economic Review, 2021 Page 30 Final Report - Multiple Myeloma Return to Table of Contents
With noted uncertainty outside of that modeled, a probabilistic sensitivity analysis was conducted to assess variation across all model inputs with quantified uncertainty simultaneously and to vary the results over 5,000 iterations. Tables 4.10 and 4.11 present the probability of reaching certain willingness-to-pay thresholds for ide-cel. A total of 3% of the iterations for ide-cel versus the comparator were beneath a threshold of $150,000 per QALY gained. Similarly, 6% of the iterations for ide-cel versus the comparator were beneath a threshold of $150,000 per evLYG gained. Sensitivity analyses for cilta-cel and belantamab are available in Supplement Section E4.
Table 4.10. Probabilistic Sensitivity Analysis Cost per QALY Gained Results: Ide-Cel versus Triple- or Quad- Refractory MM Comparator Market Basket (3+ prior lines of treatment)
Cost Effective at $50,000 per
QALY
Cost Effective at $100,000 per
QALY
Cost Effective at $150,000 per
QALY
Cost Effective at $200,000 per
QALY Ide-cel <1% <1% 3% 15%
Table 4.11. Probabilistic Sensitivity Analysis Cost per evLYG Gained Results: Ide-Cel versus Triple-or Quad- Refractory MM Comparator Market Basket (3+ prior lines of treatment)
Cost Effective at $50,000 per
evLYG
Cost Effective at $100,000 per
evLYG
Cost Effective at $150,000 per
evLYG
Cost Effective at $200,000 per
evLYG Ide-cel <1% <1% 6% 24%
Scenario Analyses
We ran three main scenario analyses: 1) a scenario that assumes no retreatment costs for each CAR-T product; 2) a modified societal perspective (results presented in supplement section E5); and 3) a scenario analysis that adjusts the proportional relationship between PFS and OS for belantamab to be within a similar range to that suggested by a recent synthesis of the evidence (results presented in supplement section E5).
The base-case model assumed 22% of patients were re-treated with CAR-T as reported in KarMMa.11 In this scenario analysis, we assume no additional retreatment charge for each CAR-T product. We include all other costs related to re-treatment for the 22% re-treated, including adverse events (i.e., hospitalizations) and monitoring. This scenario suggests re-treatment as a driver of the model results with, reductions in the incremental cost-effectiveness ratio of approximately -25% (Table 4.12).

©Institute for Clinical and Economic Review, 2021 Page 31 Final Report - Multiple Myeloma Return to Table of Contents
Table 4.12. Incremental Cost-Effectiveness Ratios for Scenario Analysis 1
Treatment Comparator Cost per QALY Gained
Cost per Life Year Gained
Cost per evLYG
Cost per Month of PFS
Gained Ide-cel CAR-T
Comparator Market Basket
$247,000 $194,000 $217,000 $27,000
Cilta-cel (preliminary)*
CAR-T Comparator Market Basket
$189,000 $155,000 $170,000 $12,000
evLYG: equal-value of life years gained, QALY: quality-adjusted life year, LY: life years *Using placeholder price for cilta-cel
Model Validation
We used several approaches to validate the model. First, we attempted multiple survival extrapolation techniques and compared estimates to findings from each intervention’s most recent published paper or abstract to ensure outcomes were consistent with clinical evidence. Second, we presented preliminary results to manufacturers and clinical experts, and based on feedback from these groups, we refined data inputs or extrapolations as needed. During the model transparency process, manufacturers noted we underestimated survival for ide-cel and the CAR-T comparator market basket (which also impacted a percentage of the comparator to belantamab). These changes were reflected in the final model calculations. Third, we varied model input parameters to evaluate face validity of changes in results. Finally, we compared model results to other cost-effectiveness findings in this therapy area.
Uncertainty and Controversies
There were important uncertainties relevant to generating model outcomes. Given that evidence was abstracted from single-arm studies, there were challenges when selecting the most appropriate comparator. In order to calculate incremental costs, risks, and benefits, we compared each therapy to a contemporaneous population of RRMM patients within the MAMMOTH observational study, i.e., a triple-/quad-refractory cohort as a comparator to CAR-T therapies and a weighted average cohort of triple-, quad-, and penta-refractory treated patients as a comparator to belantamab. Advantages of using the MAMMOTH population as a comparator include generalizability to the academic medical center setting and use of currently-recommended regimens; these settings are likely to be the same ones that will provide CAR-T and belantamab therapy. This allowed us to include not only survival evidence but also the mix of therapies used to estimate a monthly cost for each comparator. However, given that the treatment landscape changes dramatically over short time periods in RRMM, and the lack of a quantitative indirect treatment comparison to inform these analyses, caution should be used when interpreting cost-effectiveness estimates. A further complication in identifying a relevant comparator to belantamab was the mix of patients exposed to

©Institute for Clinical and Economic Review, 2021 Page 32 Final Report - Multiple Myeloma Return to Table of Contents
three or more lines of therapy and four or more lines of therapy, respectively. To address this limitation, we assumed a population mix from MAMMOTH to estimate weighted average outcomes and costs. Moreover, comparisons across the interventions of interest were not feasible given differences in populations from each single-arm study.
We acknowledge the challenge of interpreting incremental cost-effectiveness ratios for recently approved or investigational therapies when they are compared to existing high-cost comparators. Model outcomes were sensitive to the price of comparators as well as future health care costs for survivors. In sensitivity analyses, we varied the price of the market basket by the minimum and maximum estimated combination regimen in the market basket (which varied from approximately $17,000 to $37,000 per cycle of therapy). Therefore, interpretation of the cost-effectiveness of each therapy should include review of the one-way sensitivity analyses. Not surprisingly, we generally found that lower comparator prices led to less favorable cost-effectiveness estimates for the interventions.
The relationship between PFS and OS for each therapy was fairly consistent with prior meta-analysis evidence that suggests for every one month in PFS, patients gain approximately 2.5-3 months of OS.37,38 However, we observed a different pattern in the DREAMM-2 belantamab trial. The single arm study suggested that relationship was closer to a 5-month gain in OS for every 1-month gain in PFS. The resulting model was quite sensitive; small changes in this relationship as well as other key parameters resulted in relatively large swings in our cost-effectiveness estimates. To address this limitation and the uncertainty around these estimates, we adjusted the relationship between PFS and OS for the belantamab arm to be consistent with the most recent meta-analysis evidence in a scenario analysis.37 In this scenario, belantamab was dominated (i.e., more costly, less effective) by the market basket of comparators. This suggests that as new evidence emerges, cost-effectiveness findings should be updated.
After our draft report was published, new data emerged in a recent publication of the results of the KarMMa trial, suggesting that >20% of ide-cel patients received a second CAR-T infusion. While these patients were treated with T cells that had already been harvested and engineered, there is uncertainty around whether there would be a second “charge” for retreatment; it is certainly the case that hospitals delivering a second infusion would incur costs of infusion, monitoring, and management of side effects. We assumed that a second charge would be levied in our base-case analyses (for both ide-cel and cilta-cel) and removed this second charge this in a scenario analysis. Our findings suggested that this would have a significant impact on the price that could be charged to achieve a $100,000 per QALY threshold (e.g., $191,000 vs. $233,000 for ide-cel with and without a second charge, respectively). In addition, one of the CAR-T recipients we spoke with indicated that he was receiving high-priced maintenance medication after his infusion even though he remained in response to CAR-T, suggesting that other treatment decisions following an initial CAR-T infusion may have a significant impact on the estimated cost-effectiveness of these therapies.

©Institute for Clinical and Economic Review, 2021 Page 33 Final Report - Multiple Myeloma Return to Table of Contents
Specific to cilta-cel, interpretation of the cost-effectiveness findings should be noted as a very preliminary and somewhat optimistic scenario. The evidence used in the model relies on limited clinical study evidence with a PFS estimate that has yet to reach its median and OS evidence based on 18 months of follow-up. The only study with longer follow-up data available to us was the Phase 1 LEGEND-2 study, which focused on a younger population with fewer previous lines of treatment. Therefore, extrapolations of survival are likely overestimates of the benefit of cilta-cel. We found through sensitivity analyses that at lower PFS and OS levels, the incremental cost-effectiveness ratios became less favorable. In addition, while dosing of cilta-cel ranged in the CARTITUDE-1 study, there have been no reports of whether retreatment was necessary. In the absence of any reported data, a study publication, or input from the manufacturer, we assumed the same rate of retreatment as observed in the ide-cel KarMMa study. Finally, we found no indication of the likely price of cilta-cel and relied instead on the ide-cel price as a placeholder.
Survival curve fitting relies on assumptions that may differ substantially between parametric models (see Figures E.2.1 to E.2.4 for modeled survival extrapolations). Scenario analyses around alternative extrapolations found large variation in incremental cost-effectiveness ratios. There are further limitations to piecewise modeling approaches, such as seemingly arbitrary cut-point intervals and modeled “jumps” in the hazard that may appear clinically unjustifiable.46 We ensured our assumptions did not lead to invalid and unrealistic survival estimates, for example the tail of the extrapolated PFS curve crossing the tail of the OS curve. We relied on reported estimates of percentage alive and in PFS and OS states in addition to fit statistics. Survival estimates were sensitive to base-case findings as shown in the one-way sensitivity analyses.
4.4. Summary and Comment
The base-case findings from our analysis suggest that CAR-T therapies provide clinical benefit in terms of gains in QALYs and LYs over current treatment options for patients exposed to three or more lines of therapy. However, the benefits of ide-cel and cilta-cel should be reviewed separately given that evidence is still emerging. Threshold pricing suggests ide-cel would meet the $100,000 per QALY threshold at a price of around $200,000, which represents a discount of >50% from the list price of $419,500. Cilta-cel would meet this threshold at a price of around $230,000, but as noted above this is likely an optimistic estimate given the limited evidence currently available. Base-case findings for belantamab suggest current list pricing is within commonly cited cost-effectiveness thresholds. However, given uncertainties with the PFS-OS relationship and other parameters in the belantamab model, updated data should be generated and incorporated into future modeling analyses. Model findings across all interventions were sensitive to the cost of comparators, PFS and OS estimates, utility of PFS (on and off treatment), and overall health care costs for multiple myeloma patients.

©Institute for Clinical and Economic Review, 2021 Page 34 Final Report - Multiple Myeloma Return to Table of Contents
5. Potential Other Benefits and Contextual Considerations Our reviews seek to provide information on potential other benefits offered by the intervention to the individual patient, caregivers, the delivery system, other patients, or the public that was not available in the evidence base nor could be adequately estimated within the cost-effectiveness model. These elements are listed in the table below, with related information gathered from patients and other stakeholders. Following the public deliberation on this report the appraisal committee will vote on the degree to which each of these factors should affect overall judgments of long-term value for money of the intervention(s) in this review.
Table 5.1. Categories of Contextual Considerations
Contextual Considerations Relevant Information Acuity of need for treatment of individual patients based on the severity of the condition being treated
The acuity of need for treatment is high. Patients with heavily pre-treated MM have relatively short life expectancy without treatment, and their treatment options are currently limited.
Magnitude of the lifetime impact on individual patients of the condition being treated
MM has a moderate lifetime impact on individual patients. The disease has a tremendous effect on the quality and quantity of life for affected patients. However, the median age at diagnosis is 69; thus, most patients diagnosed with MM have lived many decades without myeloma. Thus, unlike diseases such as cystic fibrosis which has a large effect on a patient’s entire lifespan, MM has a large effect on a proportion of a patient’s lifespan, leading to our assessment of moderate lifetime impact.
New mechanism of action may provide benefits for patients who are unresponsive to current therapies
Anti-BCMA activity of both CAR-T therapies and belantamab suggests that these treatments may be efficacious for patients who are unresponsive to other treatments.

©Institute for Clinical and Economic Review, 2021 Page 35 Final Report - Multiple Myeloma Return to Table of Contents
Table 5.2. Categories of Potential Other Benefits
Patients’ ability to achieve major life goals related to education, work, or family life
For CAR-T therapy, suppressing the symptoms of MM appears to support patients’ ability to achieve life goals. For belantamab, substantial side effects of treatment balance the decrease in disease effects, making it less clear whether belantamab supports patients’ ability to achieve life goals.
Caregivers’ quality of life and/or ability to achieve major life goals related to education, work, or family life
For CAR-T therapy, suppressing the symptoms of MM appears to support caregivers’ ability to achieve life goals. For belantamab, substantial side effects of treatment balance the decrease in disease effects, making it less clear whether belantamab supports caregivers’ ability to achieve life goals.
Patients’ ability to manage and sustain treatment given the complexity of regimen
For CAR-T therapy, patient burden may be substantially less since much of the monitoring is done immediately after infusion and many patients appear to need no maintenance therapy. For belantamab, patient burden may be less since the studies focused on monotherapy. However, studies are underway focusing on combining belantamab with other treatments, which may negate patient burden advantages with belantamab.
Society’s goal of reducing health inequities
Anti-BCMA therapies have the potential to worsen existing disparities. Therapies with high cost or high side effect burden (such as the current anti-BCMA therapies), as well as those requiring treatment at specialized centers, are often utilized at lower rates among historically disadvantaged populations.

©Institute for Clinical and Economic Review, 2021 Page 36 Final Report - Multiple Myeloma Return to Table of Contents
6. Health Benefit Price Benchmarks The ICER health benefit price benchmark (HBPB) is a price range suggesting the highest price a manufacturer should charge for a treatment, based on the amount of improvement in overall health patients receive from that treatment, when a higher price would cause disproportionately greater losses in health among other patients due to rising overall costs of health care and health insurance. In short, it is the top price range at which a health system can reward innovation and better health for patients without doing more harm than good. Unit prices for ide-cel, cilta-cel, and belantamab that would achieve incremental cost-effectiveness ratios of $100,000 and $150,000 per QALY or evLYG are presented in Table 6.1. We arrive at a range of HBPB of approximately $192,000 - $265,000 for ide-cel, $230,000 - $312,000 for cilta-cel, and $8,300 - $9,500 for belantamab.
Table 6.1. Cost-Effectiveness Threshold Prices for Ide-cel, Cilta-cel, and Belantamab
WAC per Unit Unit Price at
$100,000 Threshold
Unit Price at $150,000 Threshold
Discount from WAC to Reach
Threshold Prices Ide-cel QALYs Gained $419,500 $192,000 $245,000 42%-54% evLYG $419,500 $206,000 $265,000 37%-51% Cilta-cel (preliminary) QALYs Gained $419,500
(placeholder) $230,000 $292,000 30% – 45%
evLYG $419,500 (placeholder)
$244,000 $312,000 26% – 42%
Belantamab QALYs Gained $8,277 per vial $8,300 $9,300 No discount evLYG $8,277 per vial $8,400 $9,500 No discount
QALY: quality-adjusted life year, WAC: wholesale acquisition cost *WAC as of March 2021

©Institute for Clinical and Economic Review, 2021 Page 37 Final Report - Multiple Myeloma Return to Table of Contents
7. Potential Budget Impact 7.1. Overview of Key Assumptions
Using results from the cost-effectiveness model, we estimated the potential budgetary impact of each B-cell maturation antigen CAR-T cell and antibody drug conjugate therapy for refractory multiple myeloma. We used the price from the base-case analysis and three threshold prices (at $50,000, $100,000, and $150,000 per QALY) for each intervention. Potential budget impact is defined as the total differential cost of using each new therapy rather than the relevant existing therapy for the treated population, calculated as differential health care costs (including intervention costs) minus any offsets in these costs from averted health care events. All costs were undiscounted and estimated over a five-year time horizon.
The analysis included the estimated number of individuals in the US who would be eligible for each treatment. To estimate the size of the potential candidate populations for each intervention, we used the total number of adults 18 years and older with at a minimum triple-class refractory multiple myeloma. It is estimated that 140,000 Americans are living with MM.3 Patients with MM are treated with CD38-targeting antibodies which are generally well tolerated and result in a response in approximately 30% of patients with MM. Thus, we assumed that 70% of patients with MM are refractory to CD38-targeted antibodies. Further, among MM patient’s refractory to CD38-targeting antibodies, 54% are triple and quad-refractory and 25% are at least penta-refractory.7 Therefore, we estimated approximately 98,000 MM patients are refractory to CD38-targeting antibodies, with approximately 52,900 classified as triple or quad-refractory and 24,500 classified as at least penta-refractory in the US. We assumed that 20% of these patients would initiate treatment in each of the five years, or approximately 10,580 patients eligible for CAR-T therapy and 4,900 eligible for belantamab each year. Because the CAR-T therapies will be launched (if cilta-cel is approved) within a short period of each other, the eligible population of approximately 10,580 triple or quad-refractory patients per year was split in half between the two interventions (approximately 5,290 per year per CAR-T therapy).
The aim of the potential budgetary impact analysis was to document the percentage of patients who could be treated at select prices within 5 years without crossing a potential budget impact threshold that is aligned with overall growth in the US economy. For reports begun in 2019-2020, the five-year annualized ICER potential budget impact threshold that should trigger policy actions to manage access and affordability is approximately $819 million per year for new drugs. More detail on these methods can be found in the Section F of the Report Supplement.

©Institute for Clinical and Economic Review, 2021 Page 38 Final Report - Multiple Myeloma Return to Table of Contents
7.2. Results
Belantamab
Figure 7.1 depicts the cumulative per-patient potential budget impact calculations for belantamab as compared to the market basket comparator, based on the wholesale acquisition cost. The average potential budgetary impact for belantamab was approximately $5,610 per patient in year one, with cumulative net cost increasing in years two and three and beginning to plateau at year four, reaching approximately $39,210 per patient in year five.
Figure 7.1. Cumulative Net Cost per Patient Treated with Belantamab at Wholesale Acquisition Cost
Assuming the wholesale acquisition cost (unit price of approximately $8,280), all eligible patients could be treated within five years (assuming 20% uptake each year), reaching 18% of the ICER budget impact threshold of $819 million per year over five years. Similarly using the prices to reach $150,000, $100,000, and $50,000 per QALY (unit prices of approximately $9,340, $8,310, and $7,290, respectively), all eligible patients could be treated within five years (assuming 20% uptake each year) without crossing the ICER budget impact threshold.
Idecabtagene vicleucel
Figure 7.2 depicts the cumulative per-patient potential budget impact calculations for ide-cel as compared to the market basket comparator, assuming the list price of $419,500. The average potential budgetary impact was approximately $354,340 per patient in year one, which remained relatively constant through year five where it reached approximately $364,120 per patient.
$0
$5,000
$10,000
$15,000
$20,000
$25,000
$30,000
$35,000
$40,000
$45,000
1 2 3 4 5

©Institute for Clinical and Economic Review, 2021 Page 39 Final Report - Multiple Myeloma Return to Table of Contents
Figure 7.2. Cumulative Net Cost per Patient Treated with Ide-cel at List Price
Assuming the list price ($419,500), only 43% of the eligible patients could be treated within five years (assuming 20% uptake each year), before crossing the ICER budget impact threshold of $819 million per year. Similarly using the price to reach $150,000 per QALY (price of approximately $245,000), 95% of the eligible patients could be treated within five years (assuming 20% uptake each year) before crossing the ICER budget impact threshold. All eligible patients could be treated within five years without crossing the ICER budget impact threshold at the price to reach either $100,000/QALY and $50,000/QALY. Figure 7.3 depicts the potential budgetary impact of idecabtagene vicleucel.
$0
$50,000
$100,000
$150,000
$200,000
$250,000
$300,000
$350,000
$400,000
1 2 3 4 5

©Institute for Clinical and Economic Review, 2021 Page 40 Final Report - Multiple Myeloma Return to Table of Contents
Figure 7.3. Potential Budgetary Impact of Ide-Cel in Triple- or Quad-Refractory Multiple Myeloma
Ciltacabtagene autoleucel
Figure 7.4 depicts the preliminary cumulative per-patient potential budget impact calculations for cilta-cel as compared to the market basket comparator, assuming the placeholder price of $419,500. The average potential budgetary impact was approximately $289,700 per patient in year one, with a small increase each year to approximately $330,300 per patient in year five.
Base Case
$150,000/QALY
$0
$50,000
$100,000
$150,000
$200,000
$250,000
$300,000
$350,000
$400,000
$450,000
0% 10% 20% 30% 40% 50% 60% 70% 80% 90% 100%
Annu
al P
rice
Percentage of Eligible Patients Treated by Year 5 Without Crossing BI Threshold

©Institute for Clinical and Economic Review, 2021 Page 41 Final Report - Multiple Myeloma Return to Table of Contents
Figure 7.4. Cumulative Net Cost per Patient Treated with Cilta-cel at Placeholder Price (Preliminary)
Assuming the placeholder price of $419,500, only 50% of the eligible population could be treated within five years (assuming 20% uptake each year) before reaching the ICER potential budget impact threshold of $819 million per year. At the price to achieve a threshold of $150,000/QALY (approximately $290,000), only 90% of the eligible population could be treated within five years (assuming 20% uptake each year) before reaching the ICER potential budget impact threshold of $819 million per year. All eligible patients could be treated at the price to reach a threshold of $100,000/QALY and $50,000/QALY without reaching the ICER potential budget impact threshold. Figure 7.5 depicts the potential budgetary impact of ciltacabtagene autoleucel.
$0
$50,000
$100,000
$150,000
$200,000
$250,000
$300,000
$350,000
1 2 3 4 5

©Institute for Clinical and Economic Review, 2021 Page 42 Final Report - Multiple Myeloma Return to Table of Contents
Figure 7.5. Potential Budgetary Impact of Cilta-Cel in Triple- or Quad-Refractory Multiple Myeloma (Preliminary)
Additional net costs per year are presented along with cumulative net costs in Section F of the supplement for each of the three treatments.
7.3. Affordability and Access Alert
Approximately 43% (ide-cel) and 50% (cilta-cel) of eligible triple- or quad-refractory multiple myeloma patients could be treated within five years before crossing the ICER potential budget impact threshold of $819 million per year. Testimony from clinical experts at the public meeting suggested that the ideal clinical uptake of the CAR-Ts would include the chance for nearly every eligible patient to receive one or the other. Given that efforts to reach this clinical target would create a short-term potential budget impact that exceeds ICER’s threshold, ICER is issuing an access and affordability alert for ide-cel and cilta-cel. The purpose of an ICER access and affordability alert is to signal to stakeholders and policy makers that the amount of added health care costs associated with a new service may be difficult for the health system to absorb over the short term without displacing other needed services, creating pressure on payers to sharply restrict access, or causing rapid growth in health care insurance costs that would threaten sustainable access to high-value care for all patients. ICER is not issuing an access and affordability alert for belantamab, because all eligible patients could be treated within five years (assuming 20% uptake each year) at the wholesale acquisition cost for belantamab.
Base Case
$150,000/QALY
$0
$50,000
$100,000
$150,000
$200,000
$250,000
$300,000
$350,000
$400,000
$450,000
0% 10% 20% 30% 40% 50% 60% 70% 80% 90% 100%
Annu
al P
rice
Percentage of Eligible Patients Treated by Year 5 Without Crossing BI Threshold

©Institute for Clinical and Economic Review, 2021 Page 43 Final Report - Multiple Myeloma Return to Table of Contents
8. Summary of the Votes and Considerations for Policy 8.1 About the Midwest CEPAC Process
During Midwest CEPAC public meetings, the Midwest CEPAC Panel deliberates and votes on key questions related to the systematic review of the clinical evidence, an economic analysis of the applications of treatments under examination, and the supplementary information presented. Panel members are not pre-selected based on the topic being addressed and are intentionally selected to represent a range of expertise and diverse perspectives.
Acknowledging that any judgment of evidence is strengthened by real-life clinical and patient perspectives, subject matter experts are recruited for each meeting topic and provide input to Midwest CEPAC Panel members before the meeting to help clarify their understanding of the different interventions being analyzed in the evidence review. The same clinical experts serve as a resource to the Midwest CEPAC Panel during their deliberation, and help to shape recommendations on ways the evidence can apply to policy and practice.
After the Midwest CEPAC Panel votes, a policy roundtable discussion is held with the Midwest CEPAC Panel, clinical experts, patient advocates, payers, and when feasible, manufacturers. The goal of this discussion is to bring stakeholders together to apply the evidence to guide patient education, clinical practice, and coverage and public policies. Participants on policy roundtables are selected for their expertise on the specific meeting topic, are different for each meeting, and do not vote on any questions.
At the April 16, 2021 meeting, the Midwest CEPAC Panel discussed issues regarding the application of the available evidence to help patients, clinicians, and payers address important questions related to the use of belantamab, ide-cel and cilta-cel for multiple myeloma. Following the evidence presentation and public comments (public comments from the meeting can be accessed here, the Midwest CEPAC Panel voted on key questions concerning the comparative clinical effectiveness, comparative value, and potential other benefits and contextual considerations related to belantamab, ide-cel and cilta-cel. These questions are developed by the ICER research team for each assessment to ensure that the questions are framed to address the issues that are most important in applying the evidence to support clinical practice, medical policy decisions, and patient decision-making. The voting results are presented below, along with specific considerations mentioned by the Midwest CEPAC Panel members during the voting process.

©Institute for Clinical and Economic Review, 2021 Page 44 Final Report - Multiple Myeloma Return to Table of Contents
In its deliberations and votes related to value, the Midwest CEPAC Panel considered the individual patient benefits, and incremental costs to achieve such benefits, from a given intervention over the long term.
There are four elements to consider when deliberating on long-term value for money (see Figure 8.1 below):
1. Comparative clinical effectiveness is a judgment of the overall difference in clinical outcomes between two interventions (or between an intervention and placebo), tempered by the level of certainty possible given the strengths and weaknesses of the body of evidence. Midwest CEPAC uses the ICER Evidence Rating Matrix as its conceptual framework for considering comparative clinical effectiveness.
2. Estimated incremental cost-effectiveness is the average incremental cost per patient of one intervention compared to another to achieve a desired “health gain,” such as an additional stroke prevented, case of cancer diagnosed, or gain of a year of life. Alternative interventions are compared in terms of cost per unit of effectiveness, and the resulting comparison is presented as a cost-effectiveness ratio. Relative certainty in the cost and outcome estimates continues to be a consideration. As a measure of cost-effectiveness, the Midwest CEPAC voting panel follows common academic and health technology assessment standards by using cost per quality-adjusted life year (QALY), with formal voting on “long-term value for money”.
3. Potential other benefits refer to any significant benefits or disadvantages offered by the intervention to the individual patient, caregivers, the delivery system, other patients, or the public that would not have been considered as part of the evidence on comparative clinical effectiveness. Examples of potential other benefits include better access to treatment centers, mechanisms of treatment delivery that require fewer visits to the clinician’s office, treatments that reduce disparities across various patient groups, and new potential mechanisms of action for treating clinical conditions that have demonstrated low rates of response to currently available therapies. Other disadvantages could include increased burden of treatment on patients or their caregivers. For each intervention evaluated, it will be open to discussion whether potential other benefits or disadvantages such as these are important enough to factor into the overall judgment of long-term value for money. There is no quantitative measure for potential other benefits or disadvantages.

©Institute for Clinical and Economic Review, 2021 Page 45 Final Report - Multiple Myeloma Return to Table of Contents
4. Contextual considerations include ethical, legal, or other issues (but not cost) that influence the relative priority of illnesses and interventions. Examples of contextual considerations include whether there are currently any existing treatments for the condition, whether the condition severely affects quality of life or not, and whether there is significant uncertainty about the magnitude of benefit or risk of an intervention over the long term. There is no quantitative measure for contextual considerations.
Figure 8.1. Conceptual Structure of Long Term Value for Money
8.2 Voting Results
1. Given the currently available evidence, is the evidence adequate to demonstrate that the net health benefit of belantamab mafodotin is superior to that provided by usual care?
Yes: 5 votes No: 10 votes
Comments: The panel concluded that further evidence, including on the relationship between progression-free and overall survival as well as ocular toxicity, is required to demonstrate superiority of belantamab over standard treatments in the target population.

©Institute for Clinical and Economic Review, 2021 Page 46 Final Report - Multiple Myeloma Return to Table of Contents
2. Given the currently available evidence, is the evidence adequate to demonstrate that the net health benefit of idecabtagene vicleucel (ide-cel) is superior to usual care?
Yes: 15 votes No: 0 votes
Comments: The panel found that the evidence suggests that ide-cel provides a net health benefit over current usual care. The panel emphasized benefits such as improved survival and quality of life. There is uncertainty, however, in whether the benefit is small or substantial.
3. Given the currently available evidence, is the evidence adequate to demonstrate that the net health benefit of ciltacabtagene autoleucel (cilta-cel) is superior to usual care?
Yes: 13 votes No: 2 votes
Comments: Similar to ide-cel, the panel found that cilta-cel could potentially provide a net health benefit over current usual care. In this case, however, a greater level of concern was raised on the immaturity of the available data, particularly on survival, and the lack of published evidence.
4. Is the evidence adequate to distinguish the net health benefit of idecabtagene vicleucel (ide-cel) from ciltacabtagene autoleucel (cilta-cel)?
Yes: 0 votes No: 15 votes
Comments: The panel found that current evidence is insufficient to determine whether one CAR-T therapy is superior to the other. Panel members highlighted that there are no studies comparing these agents directly, nor sufficient data to perform quantitative indirect comparisons.
5. When making judgments of overall long-term value for money, what is the relative priority that should be given to any effective treatment for triple-class refractory multiple myeloma, on the basis of the following contextual considerations: Acuity of need for treatment based on the severity of the condition being treated
Very low priority: 0 votes
Low priority: 0 votes
Average priority: 2 votes
High priority: 9 votes
Very high priority: 4 votes
Comments: The panel found that high priority should be given to any new treatments since the acuity of need for treatment in these specific populations is high. Patients with heavily pre-treated MM have relatively short life expectancy without treatment, and their treatment options are currently limited.

©Institute for Clinical and Economic Review, 2021 Page 47 Final Report - Multiple Myeloma Return to Table of Contents
6. When making judgments of overall long-term value for money, what is the relative priority that should be given to any effective treatment for triple-class refractory multiple myeloma, on the basis of the following contextual considerations: Magnitude of the lifetime impact of the condition being treated
Very low priority: 0 votes
Low priority: 0 votes
Average priority: 8 votes
High priority: 7 votes
Very high priority: 0 votes
Comments: Based on the report findings and the patient testimonies presented at the public meeting, the panel voted that based on the magnitude of the lifetime impact of myeloma, average or high priority should be given to any effective treatment. During the public meeting, patient testimonies highlighted that even though the median diagnosis is at age 69, once diagnosed with multiple myeloma, the disease has a tremendous effect on the quality and quantity of life for patients.
7. What are the relative effects of belantamab mafodotin versus usual care* on the following outcomes that inform judgment of the overall long-term value for money of belantamab mafodotin? Patients’ ability to achieve major life goals related to education, work, or family life
Major negative effect: 0 votes
Minor negative effect: 1 vote
No difference: 11 votes
Minor positive effect: 3 votes
Major positive effect: 0 votes
Comments: Since for belantamab the potential substantial side effects of treatment balance the clinical improvement, it is less clear whether belantamab supports patients’ ability to achieve life goals. Therefore, the panel voted that belantamab would have no difference in patients’ ability to achieve major life goals, compared to usual care.
8. What are the relative effects of belantamab mafodotin versus usual care* on the following outcomes that inform judgment of the overall long-term value for money of belantamab mafodotin? Caregivers’ quality of life and/or ability to achieve major life goals related to education, work, or family life
Major negative effect: 0 votes
Minor negative effect: 6 votes
No difference: 8 votes
Minor positive effect: 1 vote
Major positive effect: 0 votes

©Institute for Clinical and Economic Review, 2021 Page 48 Final Report - Multiple Myeloma Return to Table of Contents
Comments: Based on similar reasoning as the previous voting question, the panel voted that belantamab would have either no difference or potentially a minor negative effect in caregivers’ ability to achieve major life goals, compared to usual care.
9. What are the relative effects of belantamab mafodotin versus usual care* on the following outcomes that inform judgment of the overall long-term value for money of belantamab mafodotin? Society’s goal of reducing health inequities
Major negative effect: 2 votes
Minor negative effect: 5 votes
No difference: 8 votes
Minor positive effect: 0 votes
Major positive effect: 0 votes
Comments: Anti-BCMA therapies (which include belantamab) have the potential to worsen existing health disparities. Therapies with high cost or high side effect burden are often utilized at lower rates among historically disadvantaged populations. Therefore, the panel voted that belantamab would have either no difference or a minor negative effect to society’s goal of reducing health inequities.
10. What are the relative effects of idecabtagene vicleucel (ide-cel) and ciltacabtagene autoleucel (cilta-cel) versus usual care* on the following outcomes that inform judgment of the overall long-term value for money of ide-cel and cilta-cel? Patients’ ability to achieve major life goals related to education, work, or family life
Major negative effect: 0 votes
Minor negative effect: 0 votes
No difference: 1 vote
Minor positive effect: 8 votes
Major positive effect: 6 votes
Comments: Based on the report findings and patient testimonies, the panel voted that the CAR-T therapies would have a minor or major positive effect on the patients’ ability to achieve major life goals based on how the therapies suppress the symptoms of MM and offer potential for a substantial period of time free from maintenance treatment.

©Institute for Clinical and Economic Review, 2021 Page 49 Final Report - Multiple Myeloma Return to Table of Contents
11. What are the relative effects of idecabtagene vicleucel (ide-cel) and ciltacabtagene autoleucel (cilta-cel) versus usual care* on the following outcomes that inform judgment of the overall long-term value for money of ide-cel and cilta-cel? Caregivers’ quality of life and/or ability to achieve major life goals related to education, work, or family life
Major negative effect: 0 votes
Minor negative effect: 0 votes
No difference: 0 votes
Minor positive effect: 13 votes
Major positive effect: 2 votes
Comments: Based on the report findings and patient testimonies, the panel voted that the CAR-T therapies would have a minor positive effect on the caregivers’ quality of life based on how the therapies suppress the symptoms of MM and offer potential for a substantial period of time free from maintenance treatment.
12. What are the relative effects of idecabtagene vicleucel (ide-cel) and ciltacabtagene autoleucel (cilta-cel) versus usual care* on the following outcomes that inform judgment of the overall long-term value for money of ide-cel and cilta-cel? Patients’ ability to manage and sustain treatment given the complexity of regimen
Major negative effect: 0 votes
Minor negative effect: 0 votes
No difference: 1 vote
Minor positive effect: 12 votes
Major positive effect: 2 votes
Comments: Based on patient testimonies and the evidence presentation, the panel voted that CAR-T therapies would have a minor positive effect on the patients’ ability to manage and sustain treatment. For CAR-T therapies, monitoring is done immediately after infusion and many patients appear to need no maintenance therapy.
13. What are the relative effects of idecabtagene vicleucel (ide-cel) and ciltacabtagene autoleucel (cilta-cel) versus usual care* on the following outcomes that inform judgment of the overall long-term value for money of ide-cel and cilta-cel? Society’s goal of reducing health inequities
Major negative effect: 5 votes
Minor negative effect: 9 votes
No difference: 1 vote
Minor positive effect: 0 votes
Major positive effect: 0 votes
Comments: The panel voted that the CAR-T therapies could have a minor or major negative effect on reducing health inequities due to these being therapies with high cost and a high side effect burden. Furthermore, CAR-T therapies require treatment at specialized academic medical centers which are often utilized at lower rates among historically disadvantaged populations.

©Institute for Clinical and Economic Review, 2021 Page 50 Final Report - Multiple Myeloma Return to Table of Contents
14. Given the available evidence on comparative effectiveness and incremental cost-effectiveness, and considering other benefits, disadvantages, and contextual considerations, what is the long-term value for money of treatment at current pricing with belantamab mafodotin versus usual care*?
Low long-term value for money at current prices: 8
votes
Intermediate long-term value for money at current prices: 6
votes
High long-term value for money at current prices: 1
vote
Comments: The majority of the panel voted that belantamab represents “low” long-term value for money. The incremental cost-effectiveness ratio for belantamab using the base case was $98,000 per QALY. Although the cost-effectiveness results for belantamab were relatively favorable, the panel found that these results could have been impacted by patients discontinuing therapy because of side effects, as well as the high prices for the three-drug alternative regimens.
15. Given the available evidence on comparative effectiveness and incremental cost-effectiveness, and considering other benefits, disadvantages, and contextual considerations, what is the long-term value for money of treatment at current pricing with idecabtagene vicleucel (ide-cel) versus usual care*?
Low long-term value for money at current prices: 9
votes
Intermediate long-term value for money at current prices: 5
votes
High long-term value for money at current prices: 0
votes
Comments: The majority of the panel voted that ide-cel represents “low” long-term value for money. The incremental cost-effectiveness ratio for ide-cel using the base case was $319,000 per QALY. ICER’s recommended health-benefit price benchmark (HBPB) range for ide-cel is between $192,000-$265,000 per dose, which would require a 37-54% discount off the treatment’s recently announced wholesale acquisition cost (WAC) of $419,500.
8.3 Roundtable Discussion and Key Policy Implications
Following its deliberation on the evidence, the Midwest CEPAC Panel engaged in a moderated discussion with a policy roundtable about how best to apply the evidence on CAR-Therapies and belantamab for TCRMM to policy and practice. The policy roundtable members included two patients, two clinical experts, two payers and one representative from a pharmaceutical manufacturer. The discussion reflected multiple perspectives and opinions, and therefore, none of the statements below should be taken as a consensus view held by all participants. The names of the Policy Roundtable participants are shown below, and conflict of interest disclosures for all meeting participants can be found in Supplement G.

©Institute for Clinical and Economic Review, 2021 Page 51 Final Report - Multiple Myeloma Return to Table of Contents
Table 8.1 Policy Roundtable Members
Policy Roundtable Member Conflicts of Interest Tom Bellfort, Patient Expert No conflicts to disclose. Harold Carter, PharmD, Vice President, Pharma Contracting, Strategy & Wholesale Markets, Express Scripts
Harold Carter is a full-time employee of Express Scripts.
Anita D’Souza, MD, MS, Associate Professor of Medicine, Medical College of Wisconsin
Anita D’Souza has received institutional research funding from Sanofi, TeneoBio, Takeda, and Caelum. D’Souza reports advisory board roles with Akcea, Imbrium Therapeutics and Pfizer and received consulting honoraria from Janssen.
Ira Gupta, MD, Vice President & Medicine Development Leader, GlaxoSmithKline R&D, Oncology
Ira Gupta is a full-time employee of GSK.
David Mitchell, Patient Expert Founder, Patients For Affordable Drugs
David Mitchell is on the Board of Directors of Friends of Cancer Research which receives grants from BMS, bluebird Bio, and Janssen. He received honoraria from the FDA for his service on the Oncologic Drugs Advisory Committee and was part of a class action suit against Celgene to which he received a service award.
S. Vincent Rajkumar, MD, Edward W. and Betty Knight Scripps Professor of Medicine, Mayo Clinic, Rochester, MN
S. Vincent Rajkumar has held a position as a member of the Board of Directors for the International Myeloma Foundation.
Melissa Pozotrigo, PharmD, BCOP Senior Clinical Oncology Pharmacist, Oncology Analytics Inc.
Melissa Pozotrigo is a full-time employee of Oncology Analytics.
The following policy recommendations reflect the main themes and points made during the Policy Roundtable discussion at the April 16, 2021 Midwest CEPAC public meeting on the use of anti-BCMA therapies for the treatment of heavily pre-treated multiple myeloma. At the meeting, ICER presented the findings of its revised report on these treatments and the Midwest CEPAC voting council deliberated on key questions related to their comparative clinical effectiveness, potential other benefits and contextual considerations, and long-term value for money at current prices. Following the votes, ICER convened a Policy Roundtable of two patients, two clinical experts, two payers, and one representative from a pharmaceutical manufacturer to discuss how best to apply the evidence and votes to real-world practice and policy. The discussion reflected multiple perspectives and opinions, and therefore, none of the statements below should be taken as a consensus view held by all participants.
A recording of the conversation can be accessed here, and a recording of the voting portion of the meeting can be accessed here. More information on Policy Roundtable participants, including conflict of interest disclosures, can be found in the appendix of this document. ICER’s report on these treatments, which includes the same policy recommendations, can be found here.

©Institute for Clinical and Economic Review, 2021 Page 52 Final Report - Multiple Myeloma Return to Table of Contents
The roundtable discussion was facilitated by Dr. Steven Pearson, MD, MSc, President of ICER. The main themes and recommendations from the discussion are organized by audience and summarized below.
All Stakeholders
All stakeholders have a responsibility and an important role to play in ensuring that effective new treatment options for patients with multiple myeloma are introduced in a way that will help reduce health inequities.
African Americans are at a higher risk of developing multiple myeloma. Unfortunately, these individuals are also at a higher risk of not receiving adequate education about their condition, face a longer time between diagnosis to initiation of any therapy, are often late to receive guidance regarding new treatment options, and may have trouble accessing highly specialized therapies such as those that are the focus of this review. All stakeholders should accept and act upon their responsibility to address these disparities.
• Manufacturers should engage with a variety of people from diverse communities to help inform the design and implementation of clinical trials, ensure that patients enrolled in pivotal trials are fully representative of people of color and those from less advantaged backgrounds. Relying solely on patient organizations and representatives already engaged in ASH and ASCO meetings may provide a skewed view of the diversity of patient perspectives. Active and broad outreach should be conducted to historically underserved patient populations. In addition, manufacturers should moderate new treatment pricing. Even with insurance coverage, cost is a tremendous driver of health inequities; thus, pricing that exceeds reasonable proportions to the added clinical and contextual benefits for patients will likely exacerbate health inequities, while pricing that is viewed as responsible may provide opportunities for improved access to patients facing financial barriers to care.
• Payers should recognize that, in addition to often steep out-of-pocket costs for the treatments themselves, there are often ancillary costs which can become real barriers to care and exacerbate inequities. Specifically, these treatments may require travel to specialized centers, with the attendant travel costs and lost wages for accompanying caregivers. Payers should develop coverage that creates a broader package of benefits so that patients who face financial or logistical hurdles can have equal access to specialized care at Centers of Excellence, if desired. Another way to accomplish this goal is by expanding telemedicine coverage and creating parity (e.g., in out-of-pocket costs) between in-person and remote care, which can help patients receive care in their own communities while receiving input and second opinions from leading experts in other locations. Through one or multiple mechanisms, patients from rural and inner-city neighborhoods need broader benefit designs to give them the equal access they deserve.

©Institute for Clinical and Economic Review, 2021 Page 53 Final Report - Multiple Myeloma Return to Table of Contents
• Clinicians and clinical societies should conduct (or continue to conduct) active outreach and education to underserved communities and the general oncologists and other members of the health care team serving those communities to get new, effective treatments to those patients who would benefit most. Given the difficult trade-off decisions necessary in the choices for multiple myeloma treatment, clinicians should actively engage in and encourage shared decision-making to ensure that the values of patients with diverse needs and perspectives on risks and benefits of different treatments are at the heart of all treatment decisions.
• Patient organizations for people with multiple myeloma should seek (or continue to seek) to represent diverse perspectives, requiring outreach to patients who may not be engaged by academic health systems, manufacturers, payers, policymakers, or other stakeholders. Patient groups should collaborate with organizations and people in diverse communities to build lasting relationships and trust. Patient organizations should also embrace their responsibility to address the impact of pricing of new treatment options on the ability of patients to access care. The patient voice should always be present as society wrestles with how to find the difficult balance between incentives for innovation and affordability.
• We propose that these principles and individual considerations, explored throughout the ICER public meeting, should be the focus of a more comprehensive Multiple Myeloma Therapy Access Summit. With all stakeholders at the table, this Summit would develop these goals and specific actions further and forge them into a coordinated action plan for improvement. One element of such a plan should be transparent targets for improvement by which manufacturers, payers, clinical specialty groups, and patient advocacy groups would hold themselves and each other accountable in addressing the substantial inequities that our current health care system – and society – have allowed to persist.
Manufacturers
Manufacturers should seek to set prices that will foster affordability and good access for all patients by aligning prices with the patient-centered therapeutic value of their treatments. In the setting of these new interventions for multiple myeloma, while there is considerable hope associated with the promise of the therapies, there also remains substantial uncertainty regarding their longer-term safety and effectiveness, and the platform on which they are based has been funded in part with taxpayer money. Manufacturer pricing should also reflect these considerations in moderating launch pricing.
Drug prices that are set well beyond the cost-effective range cause not only financial toxicity for patients and families using the treatments, but also contribute to general health care cost growth

©Institute for Clinical and Economic Review, 2021 Page 54 Final Report - Multiple Myeloma Return to Table of Contents
that pushes families out of the insurance pool, and that causes others to ration their own care in ways that can be harmful.
Manufacturers should therefore price novel treatments in accordance with the demonstrated benefits to patients. In settings of substantial uncertainty, initial pricing should err on the side of being more affordable. This would allow more patients access, generating additional data on the real-world effectiveness of novel treatments that could be used in future assessment updates. With accumulation of evidence of substantial patient benefit, manufacturers should be allowed to increase pricing in accordance with benefit.
The initial developmental science underpinning anti-BCMA chimeric antigen receptor T-cells was conducted at the National Cancer Institute. Manufacturers should propose lower prices, particularly for public payers, in situations when a substantial part of the initial risk of drug development is borne by taxpayers.
Clinical Specialty Societies
Clinical specialty societies should advance education, policy, and practice mechanisms that facilitate awareness of treatment costs and financial burdens for patients as part of shared decision-making for individual patients.
Given the huge impact of treatment costs on both society and patients, clinicians should be aware of the costs of the treatment options they are recommending to patients and develop the tools to incorporate patients’ own financial considerations into transparent shared decision-making. As a general principle, when efficacy is similar between two treatment options, and patient preferences for different side effect profiles has been fully discussed, clinicians should recommend the less expensive option.
Payers
Payers should use the FDA label as the guide to coverage policy and engage clinical experts and diverse patient representatives in considering how to address coverage issues for which there is limited or no evidence at the current time.
Given the significant uncertainty that remains about anti-BCMA therapy, it is reasonable for payers to use prior authorization as a component of coverage. Prior authorization criteria should be based on the FDA label, clinical evidence, specialty society guidelines, and input from clinical experts and patient groups. The process for authorization should be clear and efficient for providers and patients. Options for specific elements of coverage criteria within insurance coverage policy are discussed below.

©Institute for Clinical and Economic Review, 2021 Page 55 Final Report - Multiple Myeloma Return to Table of Contents
Coverage Criteria: General
• Payers should offer alternatives to prior authorization protocols such as programs that give feedback on prescribing patterns to clinicians or exempt them from prior authorization requirements (“gold carding”) if they demonstrate high fidelity to evidence-based prescribing. Patients should be provided information on the incentives and guidelines that clinicians consider when recommending a course of treatment.
• Payers should document at least once annually that clinical eligibility criteria are based on high quality, up-to-date evidence, with input from clinicians with experience in the same or similar clinical specialty.
• Clinical eligibility criteria should be developed with explicit mechanisms that require payer staff to document using an open and transparent process that is readily accessible to the public that they have:
o Considered limitations of evidence due to systemic under-representation of minority populations and sought input from clinical experts on whether there are distinctive benefits and harms of treatment that may arise for biological, cultural, or social reasons across different communities;
o Confirmed that clinical eligibility criteria have not gone beyond reasonable use of clinical trial inclusion/exclusion criteria to interpret or narrow the FDA label language in a way that disadvantages patients with underlying disabilities unrelated to the condition being treated.
Drug-Specific Considerations: belantamab
FDA Label: Adult patients with relapsed or refractory multiple myeloma who have received at least 4 prior therapies, including an anti-CD38 monoclonal antibody, a proteasome inhibitor, and an immunomodulatory agent.
Coverage Criteria:
• Diagnosis: Per clinician attestation
• Patient Eligibility Criteria: As per the FDA label, with no need for definition of clinical terms. Key inclusion criteria in pivotal trials included ECOG status of 0-2, and ineligibility for autologous stem cell transplantation or transplantation > 100 days prior. Clinical experts did not feel these criteria were needed for inclusion in coverage language in order to prevent inappropriate use.

©Institute for Clinical and Economic Review, 2021 Page 56 Final Report - Multiple Myeloma Return to Table of Contents
• Step Therapy: Besides the FDA label clinical requirements, there is no other treatment that could be considered a first-step treatment prior to eligibility for belantamab.
• Exclusion Criteria: Pivotal trials excluded patients with prior BCMA therapies or those who are on systemic high-dose corticosteroids, and those who have received allogeneic SCT. There is no evidence on the use of belantamab in patients who have had inadequate response or have recurrence following CAR-T treatment. Many payers are likely to restrict coverage pending clinical research on the risks and benefits of retreatment with anti-BCMA therapies.
• Duration of Therapy and Renewal of Coverage: N/A
• Provider Criteria: The therapy should be prescribed by an oncologist.
Drug-Specific Considerations: CAR-T (ide-cel)
FDA Label: Adult patients with relapsed or refractory multiple myeloma after 4 or more prior lines of therapy, including an anti-CD38 monoclonal antibody, a proteasome inhibitor, and an immunomodulatory agent.
Coverage Criteria:
• Diagnosis: Per clinician attestation
• Patient Eligibility Criteria: As per the FDA label, with no need for definition of clinical terms. Key inclusion criteria in pivotal trials included ECOG status of 0-1. Clinical experts did not feel these criteria were needed for inclusion in coverage language in order to prevent inappropriate use.
• Step Therapy: Besides the FDA label clinical requirements, there is no other relevant treatment that could be considered a first-step treatment requirement prior to eligibility for CAR-T. The risks and benefits of belantamab are so different from those of CAR-T that it does not meet criteria for reasonable consideration of step therapy.
• Exclusion Criteria: Pivotal trials excluded patients who have received allogeneic SCT. There is no evidence on the use of CAR-T in patients who have had inadequate response or have recurrence following an anti-BCMA therapy such as belantamab. Many payers are likely to restrict coverage pending clinical research on the risks and benefits of retreatment with anti-BCMA therapies. Similarly, until further evidence is developed, payers are likely to restrict coverage to repeat CAR-T, whether a second round with the same CAR-T or a trial of

©Institute for Clinical and Economic Review, 2021 Page 57 Final Report - Multiple Myeloma Return to Table of Contents
a different CAR-T. Clinical experts suggested, however, that requests for consideration of repeat CAR-T are likely and will require case-by-case consideration.
• Duration of Therapy and Renewal of Coverage: N/A
• Provider Criteria: The therapy should be prescribed by an oncologist.
Medicare should consider new reimbursement strategies, including enhanced new technology add-on payments or demonstration projects that carve out pricing and payment for cell and gene therapy, to improve the chances that hospitals and clinics can provide the necessary services to deliver these novel therapies to patients safely.
The early experience with CAR-T for lymphoma demonstrated the inefficiency of the existing Medicare payment structures for novel one-time therapies with high costs. Hospitals struggled to provide CAR-T without adequate reimbursement, leading to barriers to access for many patients. Medicare should consider changes to its reimbursement system to avoid such bottlenecks in the future. Approaches that should be considered include:
a. Increasing the new technology add-on payment to 80% b. Consider a new demonstration project where cell and gene therapies are carved out,
allowing CMS to buy directly from manufacturers and negotiate a value-based payment that includes outcomes-based measures.
Clinical Research Community
The clinical research community should move rapidly to address key gaps in evidence for treatments for multiple myeloma. These gaps include whether patients can stop therapy while in response, how well the clinical trial populations reflect the target populations for treatment, data on preferences and patient-reported outcomes in historically disadvantaged populations, and the clinical characteristics of the disease and its affected populations that may be predictive of response.
Numerous important research questions remain regarding treatment options for multiple myeloma. First, nearly all studies conducted to date focus on continuing treatment until progression. Thus, it is unclear whether patients can safely stop therapy. Since therapies often expose patients to side effects and impose substantial financial costs, non-inferiority studies comparing a fixed duration of treatment to indefinite treatment until progression should be conducted. Since these studies will provide the evidence base for less drug use, manufacturers will not support these studies and public funding through entities such as the NIH will be necessary.

©Institute for Clinical and Economic Review, 2021 Page 58 Final Report - Multiple Myeloma Return to Table of Contents
Second, the FDA should work with manufacturers to ensure that the studied population for any disease is representative of the population with disease. For example, the anti-BCMA studies were conducted in populations that were substantially younger and which included fewer African Americans than the US population of multiple myeloma patients, injecting additional uncertainty on whether the benefits seen in the studies will be replicated when these therapies are used in clinical practice.
Third, additional research needs to be conducted regarding patient preferences and patient-reported outcomes in African American and other historically disadvantaged populations, to better inform accurate characterization of the impact of multiple myeloma in these groups and the potential benefits of new treatments.
Finally, additional research is needed to determine which patient characteristics predict response, so that these costly, high side effect therapies can ideally be targeted to those patients most likely to benefit.

©Institute for Clinical and Economic Review, 2021 Page 59 Final Report - Multiple Myeloma Return to Table of Contents
Supplemental Materials

©Institute for Clinical and Economic Review, 2021 Page 60 Final Report - Multiple Myeloma Return to Table of Contents
A. Background: Supplemental Information A1. Definitions
Disease Definitions:
Triple-Class Refractory Multiple Myeloma: Multiple myeloma that has become refractory to the three common classes of myeloma medications: immunomodulators (I.e., lenalidomide), proteasome inhibitors (I.e., bortezomib) and a monoclonal antibody (I.e., daratumumab).
Quad Refractory Multiple Myeloma: Multiple myeloma that has become refractory to 4 commonly used myeloma medications. Most commonly, quad-refractory disease is refractory to: 1 anti-CD38 monoclonal antibody (most often daratumumab), 1 or 2 immunomodulators (most often lenalidomide +/- pomalidomide) and 1 or 2 proteasome inhibitors (most often bortezomib +/- carfilzomib).
Penta Refractory Multiple Myeloma: Multiple myeloma that has become refractory to 5 commonly used myeloma medications. Most commonly, penta-refractory disease is refractory to 2 immunomodulators (most often lenalidomide and pomalidomide), 2 proteasome inhibitors (most often bortezomib and carfilzomib) and an anti CD38 monoclonal antibody (most often daratumumab).
Extramedullary disease: Multiple myeloma in which plasma cells form tumors outside of the bone marrow. Extramedullary disease is a sign of more aggressive myeloma and portends a worse prognosis.
High-risk Cytogenetics: A chromosomal abnormality which has been shown to increase the risk of more aggressive disease.
Intervention Definitions:
CAR T-cell therapy: Chimeric antigen receptors (CARs) are artificial fusion proteins constructed to recognize specific antigens. CAR T-cells are T-cell lymphocytes that have been genetically modified to express these CAR’s, so that these T-cells can identify and to marshal an immune response against cancer cells that produce these antigens. The focus of this review, ide-cel and cilta-cel utilize CAR T-cells that recognize the B-cell Maturation Antigen which appears to be expressed on most malignant plasma cells. CAR T-cell therapy starts with 1) harvesting of the patient’s lymphocytes with leukapheresis. 2) Lymphocytes are then modified in the laboratory to express the CAR protein. 3) These modified lymphocytes are expanded to sufficient numbers and 4) the modified, expanded lymphocytes are reinfused back into the patient.

©Institute for Clinical and Economic Review, 2021 Page 61 Final Report - Multiple Myeloma Return to Table of Contents
Ide-cel: Idecabtagene vicleucel is a chimeric antigen receptor (CAR) T-cell therapy based on the first anti-BCMA CAR developed at the National Cancer Institute (11D5-3-CD828Z), using a mouse origin anti-BCMA moiety. CARs are artificial fusion proteins that combine a BCMA-recognition domain with a costimulatory domain47. When reinfused into the patient, the genetically modified lymphocytes with the CAR proteins triggers a multi-pronged immune response, resulting in the destruction of cancer cells.
Cilta-cel: Ciltacabtagene autoleucel is a chimeric antigen receptor (CAR) T-cell therapy based on the camelid heavy chain only anti-BCMA CAR. The camelid heavy chain (LCAR-B38M) incorporates 2 BCMA recognition domains, which theoretically should increase the specificity for BCMA. Otherwise, cilta-cel has a similar mechanism of action and treatment logistics to ide-cel.47
Belantamab mafodotin: a first-in-class, antibody-drug immunoconjugate consisting of an anti-BCMA monoclonal antibody and an anti-cancer drug. Belantamab mafodotin (referred to as belantamab for the remainder of the supplement) binds to BCMA-antigens and kills multiple myeloma cells via a multimodal mechanism. Belantamab induces cell apoptosis in addition to antibody-dependent cellular cytotoxicity (ADCC).48,49
Outcome definitions: Studies rely on the International Myeloma Working Group (IMWG) Uniform Response Criteria definitions for outcomes.50
Complete Response (CR): Negative immunofixation on serum and urine AND disappearance of any soft tissue plasmacytomas AND <5% plasma cells in the bone marrow.
Stringent Complete Response (sCR): Meets CR criteria AND normal free light chain ratio AND absence of clonal cells in bone marrow by immunohistochemistry or immunofluorescence.
Partial Response (PR):
≥ 50% reduction of serum M-protein AND reduction in 24-hour urinary M-protein by ≥ 90% or to < 200 mg/24 h
If the serum and urine M-protein are unmeasurable, a ≥ 50% decrease in the difference between involved and uninvolved free light chain levels is required in place of the M-protein criteria.
If serum and urine M-protein are not measurable and serum free light chain assay is also not measurable, ≥ 50% reduction in plasma cells is required in place of M-protein, provided baseline bone marrow plasma cell percentage was ≥ 30%.
In addition to the above criteria, if present at baseline, a ≥ 50% reduction in the size of soft tissue plasmacytomas is also required.

©Institute for Clinical and Economic Review, 2021 Page 62 Final Report - Multiple Myeloma Return to Table of Contents
Very Good Partial Response (vgPR): Serum and urine M-protein detectable by immunofixation but not on electrophoresis or ≥ 90% reduction in serum M-protein plus urine M-protein level < 100 mg/24 h
Overall Response Rate (ORR): Proportion of patients treated who had a partial response to treatment or better (PR + vgPR + CR + sCR)
Minimal Residual Disease (MRD): Small number of cancer cells that can remain after treatment. MRD status predicts relapse. In MM, MRD is assessed in patients with CR, via sensitive techniques such as next-generation flow cytometry or next-generation sequencing.51

©Institute for Clinical and Economic Review, 2021 Page 63 Final Report - Multiple Myeloma Return to Table of Contents
B. Patient Perspectives: Supplemental Information B1. Methods
ICER conducted a wide-ranging effort to engage patients and advocacy groups to develop an understanding of perspectives of patients with MM. We drew on experience from the prior ICER review of MM therapies in 2016, reaching out to patient advocacy groups and individual patients engaged in the previous review. Specifically, we had a series of conversations with the Cancer Support Community, who were able to provide us with invaluable insights into the experience of MM patients within their community. They also helped us engage with individual patients who were able and willing to speak with us. We also engaged with Patients for Affordable Drugs, who also helped us identify patients we could speak to about their experience. We purposefully tried to engage African American patients to elicit their experiences, since they are overrepresented in the MM population and may face disparities in diagnosis and access to care. We contacted the International Myeloma Foundation and the Black Women’s Health Imperative for further guidance on reaching out to specific myeloma patients and advice on any relevant data resources to assess racial disparities in myeloma care. We connected with the Association of Community Cancer Centers and spoke with an expert who commented on the differences in access to new myeloma treatments between large academic medical centers and community cancer centers.
We had a series of conversations with individual patients with MM, as well as one focus group discussion. Conversations were informed by a semi-structured interview guide which focused the conversation on several themes, including:
1. What is your experience with different treatments that you have tried?
o What has worked, what has not? o Side-effects o Impact on daily life, family, work
2. What are the financial aspects of the treatments you have tried?
o Any issues with insurance, paying for the treatment
3. Where have you received care (in what type of hospital), what doctors have you seen?
4. What are you hoping to get from any new treatments that become available?

©Institute for Clinical and Economic Review, 2021 Page 64 Final Report - Multiple Myeloma Return to Table of Contents
5. What do you think are some key issues about patients’ experience with multiple myeloma that are not being captured in major clinical studies or trials, including:
o Symptoms and complications of disease o Impact of disease on function and quality of life o Side effects of treatment o Effects on caregivers and family members o Any other issues
6. For patients who have experience with CAR-T therapies:
o How well did it work for you? o What were the side effects? o What was the impact like on daily life, family, work? o How was it like finding these treatments, how available or accessible do you think these
are for patients? o Compared to other treatments you have received for multiple myeloma, what was your
experience like? Specifically, how did it feel to be “off” treatment after you received the CAR-T infusion?
o Have you required any follow-up after CAR-T infusion? If so, is this routine follow-up or for complications of treatment?
We had an iterative process, where emerging themes were incorporated into subsequent conversations to determine whether these themes were universally felt by all (or most) patients or were idiosyncratic to a single (or few) patient(s). Furthermore, patients submitted individual feedback and shared their experiences via the Patient Input Questionnaire on ICER’s website.
After each of these conversations, patient comments were transcribed, collated, organized, and summarized. We drew upon the themes that emerged from our conversations and our summaries for the patient perspective sections of this report.
B2. Cancer Support Community Myeloma Registry Survey
Cancer Support Community (CSC) is an international nonprofit organization that provides support, education and hope to people impacted by cancer. CSC has conducted surveys of over 14,000 cancer patients across a wide variety of cancers, including multiple myeloma. We believe that these responses provide additional insight into the patient experience with myeloma and complement the qualitative responses provided in the report. We are indebted to the CSC for allowing us access to the following data.
Table B1 highlights that side effects may be even more common than reported, as 25% of respondents reported not mentioning side effects because they didn’t believe anything could be done.

©Institute for Clinical and Economic Review, 2021 Page 65 Final Report - Multiple Myeloma Return to Table of Contents
Table B1. CSC Multiple Myeloma Specialty Registry Findings: Physical Symptoms and Side Effects
Physical Symptoms and Side Effects Concerns Findings Respondents who did not report side effects because they didn’t believe anything could be done about their side effects 25%
Comfort level with speaking to their doctor about side effects and symptoms >99% positive
Side effects impacted patients’ decisions about treatments… Always: 5% Often: 9% Sometimes: 28%
How well respondents felt their health care team prepared them to manage side effects
Very much: 33% Quite a bit: 26% Somewhat: 22%
Table B2 highlights the high prevalence of fatigue in multiple myeloma. Over half of survey respondents experience fatigue often or always and for over one-third of respondents, fatigue interfered with their daily lives “quite a bit” or “very much”.
Table B2. CSC Multiple Myeloma Specialty Registry Findings: Fatigue
Fatigue Concerns Findings
Respondents experiencing fatigue in the past 7 days 70%
Respondents experienced fatigue… Always: 20% Often: 32% Sometimes: 29%
Pain interfered with their daily lives… Very much: 16% Quite a bit: 21% Somewhat: 26%
Pain interfered with respondents’ ability to participate in social activities… Very much: 8% Quite a bit: 19% Somewhat: 25%
Table B3 shows that pain is also a significant concern. One-third of respondents had pain often or always and 23% reported pain interfering with their daily lives “quite a bit” or “very much”.
Table B3. CSC Multiple Myeloma Specialty Registry Findings: Pain & Bone Pain
Pain & Bone Pain Concerns Findings
Respondents experiencing bone pain in the past 7 days 48%
Respondents experienced pain… Always: 19% Often: 15% Sometimes: 25%
Pain interfered with their daily lives… Very much: 13% Quite a bit: 10% Somewhat: 18%
Pain interfered with respondents’ ability to participate in social activities…
Very much: 8% Quite a bit: 11% Somewhat: 12%

©Institute for Clinical and Economic Review, 2021 Page 66 Final Report - Multiple Myeloma Return to Table of Contents
Table B4 highlights to importance of financial concerns to patients. Forty-two percent of respondents were always or often upset about the cost of care. Fifty-six percent of respondents felt overwhelmed by the demands of paying for care at least some of the time.
Table B4. CSC Multiple Myeloma Specialty Registry Findings: Financial Concerns
Financial Concerns Findings Respondents received financial assistance related to their multiple myeloma 63%
Respondents felt upset about money and the cost of care… Always: 19% Often: 23% Sometimes: 21%
Respondents felt overwhelmed by the demands of paying for medical care… Always: 8% Often: 19% Sometimes: 29%
Respondents worried they won’t be able to leave assets to their families Always: 9% Often: 13% Sometimes: 22%

©Institute for Clinical and Economic Review, 2021 Page 67 Final Report - Multiple Myeloma Return to Table of Contents
C. Clinical Guidelines Due to the number of treatments that have recently become available, we focus on guidelines that have been published in the last 2 years.
National Comprehensive Cancer Network (NCCN) Multiple Myeloma, V5, March 202152
The NCCN convened a panel of nationally recognized expert clinicians in the care of MM to develop a consensus statement on currently accepted approaches to treatment. While there are not specific recommendations for the triple/quad/penta refractory population that is the focus of our current review, they do provide recommendations on relapsed or refractory MM.
Recommendation 1 (MYEL-7): For relapsed patients, consider a) treatments for previously treated myeloma, b) clinical trial and c) allogeneic stem cell transplant.
Recommendation 2 (MYEL-7): For patients with refractory disease and lack of treatment options, refer to palliative care.
Recommendation 3 (MYEL-F, 3 of 3): The NCCN listed a wide range of therapeutic options for patients with relapsed, previously treated MM, representing the lack of clear evidence on the preferred ordering of treatments. Specifically, they listed 9 preferred regimens, 19 other recommended regimens and 17 regimens listed as “useful in certain circumstances”. Most were triplet regimens and nearly all regimens included dexamethasone. In addition, bortezomib, pomalidomide, carfilzomib, daratumumab, ixazomib, elotuzumab, selinexor and panobinostat were common components of listed regimens.
American Society of Clinical Oncology (ASCO) and Cancer Care Ontario (CCO) Joint Clinical Practice Guideline for Multiple Myeloma, Apr 201953
The American Society of Clinical Oncology and Cancer Care Ontario convened an expert panel of medical oncologists, surgeons, radiation oncologists, and patient advocates to conduct a review of the literature to develop evidence-based guidelines. While they did not address triple-class refractory patients, they did produce recommendations for myeloma patients with a first relapse.
Recommendation 7.3: Triplet therapy (3 agents including a steroid, and 2 of the following 3 classes: proteasome inhibitor, immunomodulator and monoclonal antibody) is preferred. While toxicity appears to be increased with triplet vs doublet therapy, triplet therapy leads to improved PFS, ORR and OS, even in older adults.

©Institute for Clinical and Economic Review, 2021 Page 68 Final Report - Multiple Myeloma Return to Table of Contents
Recommendation 7.5: Prior therapies should be taken into consideration when selecting the treatment in patient with relapsed multiple myeloma. Patients who have been off of a particular medication for >1 year are likely to respond to a repeat course of that medication. However, patients who relapse <1 year after exposure to a medication are less likely to respond; thus, novel medications are recommended in these situations.

©Institute for Clinical and Economic Review, 2021 Page 69 Final Report - Multiple Myeloma Return to Table of Contents
D. Comparative Clinical Effectiveness: Supplemental Information D1. Detailed Methods
PICOTS
Population
The population of focus for the review is patients who have at a minimum triple-class refractory MM, defined as disease that has progressed while on an anti-CD38 antibody (e.g., daratumumab), immunomodulatory drugs (e.g., lenalidomide), and a proteasome inhibitor (e.g., bortezomib). The indication for belantamab involves a population subset with somewhat more advanced disease (at least four prior lines of treatment, triple-, quad-, or penta-refractory patients) than those in the current Ide-cel and Cilta-cel trials (at least three prior lines, mostly triple- or quad-refractory). (Ide-cel was recently approved for patients with 4+ prior lines of therapy.) We therefore did not make any explicit comparisons between belantamab and Idecabtagene vicleucel and Ciltacabtagene autoleucel, and we summarized evidence on relevant comparator therapies to match these population differences (see below). Data permitting, we included evidence across relevant subgroups, such as patients with genetic factors that put them at particularly high risk as well as subgroups defined by race.
Interventions
The full list of interventions is as follows:
• Idecabtagene Vicleucel (Ide-cel, Abecma®, Bristol Myers Squibb and bluebird bio) • Ciltacabtagene Autoleucel (Cilta-cel, Janssen and Legend biotech) • Belantamab mafodotin (Blenrep®, GlaxoSmithKline)
Comparators
We used the characteristics of patients enrolled in each of the pivotal studies of the drugs under consideration to guide the most appropriate comparator treatments (i.e., the regimens patients would have received if the drugs under consideration were not an option). Since the belantamab study focused on a more heavily pre-treated population, the comparator cohort for belantamab differs from the comparator cohort for Ide-cel and Cilta-cel.

©Institute for Clinical and Economic Review, 2021 Page 70 Final Report - Multiple Myeloma Return to Table of Contents
We compared the selected interventions to commonly used regimens in triple-class refractory populations as well as to palliative care (no active anti-cancer therapy). The comparator regimens include:
• Carfilzomib + cyclophosphamide + dexamethasone (KCd) • Pomalidomide + cyclophosphamide + dexamethasone (PCd) • Carfilzomib + pomalidomide + dexamethasone (KPd) • Elotuzumab + pomalidomide + dexamethasone (EPd)
Outcomes
The outcomes of interest are described in the list below.
− Patient-Important Outcomes o Overall survival (OS) o Quality of life o Complete response rate o Progression-free survival (PFS) o Durability of response o Pain and function o Treatment burden o Bone fractures o Adverse events including:
cytokine response syndrome fatigue/sleep disturbance infection peripheral neuropathy ocular toxicity anemia gastrointestinal toxicity thromboembolism death
• Other Outcomes
o Overall response rate o Partial response rate o Minimal residual disease o Blood and urine markers of disease

©Institute for Clinical and Economic Review, 2021 Page 71 Final Report - Multiple Myeloma Return to Table of Contents
Timing
Evidence on intervention effectiveness and harm was derived from studies of any duration.
Settings
Evidence from all relevant settings were considered.

©Institute for Clinical and Economic Review, 2021 Page 72 Final Report – Multiple Myeloma Return to Table of Contents
Table D1.1 PRISMA 2009 Checklist
Checklist Items TITLE Title 1 Identify the report as a systematic review, meta-analysis, or both. ABSTRACT Structured summary 2 Provide a structured summary including, as applicable: background; objectives; data sources; study eligibility criteria,
participants, and interventions; study appraisal and synthesis methods; results; limitations; conclusions and implications of key findings; systematic review registration number.
INTRODUCTION Rationale 3 Describe the rationale for the review in the context of what is already known. Objectives 4 Provide an explicit statement of questions being addressed with reference to participants, interventions, comparisons,
outcomes, and study design (PICOS). METHODS Protocol and registration
5 Indicate if a review protocol exists, if and where it can be accessed (e.g., Web address), and, if available, provide registration information including registration number.
Eligibility criteria 6 Specify study characteristics (e.g., PICOS, length of follow-up) and report characteristics (e.g., years considered, language, publication status) used as criteria for eligibility, giving rationale.
Information sources 7 Describe all information sources (e.g., databases with dates of coverage, contact with study authors to identify additional studies) in the search and date last searched.
Search 8 Present full electronic search strategy for at least one database, including any limits used, such that it could be repeated. Study selection 9 State the process for selecting studies (i.e., screening, eligibility, included in systematic review, and, if applicable, included
in the meta-analysis). Data collection process 10 Describe method of data extraction from reports (e.g., piloted forms, independently, in duplicate) and any processes for
obtaining and confirming data from investigators. Data items 11 List and define all variables for which data were sought (e.g., PICOS, funding sources) and any assumptions and
simplifications made. Risk of bias in individual studies
12 Describe methods used for assessing risk of bias of individual studies (including specification of whether this was done at the study or outcome level), and how this information is to be used in any data synthesis.
Summary measures 13 State the principal summary measures (e.g., risk ratio, difference in means). Synthesis of results 14 Describe the methods of handling data and combining results of studies, if done, including measures of consistency (e.g.,
I2) for each meta-analysis. Risk of bias across studies
15 Specify any assessment of risk of bias that may affect the cumulative evidence (e.g., publication bias, selective reporting within studies).
Additional analyses 16 Describe methods of additional analyses (e.g., sensitivity or subgroup analyses, meta-regression), if done, indicating which were pre-specified.
RESULTS

©Institute for Clinical and Economic Review, 2021 Page 73 Final Report – Multiple Myeloma Return to Table of Contents
Study selection 17 Give numbers of studies screened, assessed for eligibility, and included in the review, with reasons for exclusions at each stage, ideally with a flow diagram.
Study characteristics 18 For each study, present characteristics for which data were extracted (e.g., study size, PICOS, follow-up period) and provide the citations.
Risk of bias within studies
19 Present data on risk of bias of each study and, if available, any outcome level assessment (see item 12).
Results of individual studies
20 For all outcomes considered (benefits or harms), present, for each study: (a) simple summary data for each intervention group (b) effect estimates and confidence intervals, ideally with a forest plot.
Synthesis of results 21 Present results of each meta-analysis done, including confidence intervals and measures of consistency. Risk of bias across studies
22 Present results of any assessment of risk of bias across studies (see Item 15).
Additional analysis 23 Give results of additional analyses, if done (e.g., sensitivity or subgroup analyses, meta-regression [see Item 16]). DISCUSSION Summary of evidence 24 Summarize the main findings including the strength of evidence for each main outcome; consider their relevance to key
groups (e.g., health care providers, users, and policy makers). Limitations 25 Discuss limitations at study and outcome level (e.g., risk of bias), and at review-level (e.g., incomplete retrieval of identified
research, reporting bias). Conclusions 26 Provide a general interpretation of the results in the context of other evidence, and implications for future research. FUNDING Funding 27 Describe sources of funding for the systematic review and other support (e.g., supply of data); role of funders for the
systematic review. From: Moher D, Liberati A, Tetzlaff J, Altman DG. The PRISMA Group (2009). Preferred Reporting Items for Systematic Reviews and Meta-Analyses: The PRISMA Statement. PLoS Med 6(6): e1000097. doi:10.1371/journal.pmed1000097

©Institute for Clinical and Economic Review, 2021 Page 74 Final Report – Multiple Myeloma Return to Table of Contents
Data Sources and Searches
Procedures for the systematic literature review assessing the evidence on new therapies for relapsed and refractory multiple myeloma followed established best research methods.54,55 We conducted the review in accordance with the Preferred Reporting Items for Systematic Reviews and Meta-Analyses (PRISMA) guidelines.56 The PRISMA guidelines include a checklist of 27 items, which are described further in Supplemental Table D1.1.
We searched MEDLINE and EMBASE. Each search was limited to English-language studies of human subjects and excluded articles indexed as guidelines, letters, editorials, narrative reviews, case reports, or news items. We included abstracts from conference proceedings identified from the systematic literature search. All search strategies were generated utilizing the Population, Intervention, Comparator, and Study Design elements described above. The proposed search strategies included a combination of indexing terms (MeSH terms in MEDLINE and EMTREE terms in EMBASE), as well as free-text terms.
To supplement the database searches, we performed manual checks of the reference lists of included trials and systematic reviews and invited key stakeholders to share references germane to the scope of this project. We also supplemented our review of published studies with data from conference proceedings, regulatory documents, information submitted by manufacturers, and other grey literature when the evidence met ICER standards (for more information, see https://icer.org/policy-on-inclusion-of-grey-literature-in-evidence-reviews/) Where feasible and deemed necessary, we also accepted data submitted by manufacturers “in-confidence,” in accordance with ICER’s published guidelines on acceptance and use of such data https://icer.org/guidelines-on-icers-acceptance-and-use-of-in-confidence-data-from-manufacturers-of-pharmaceuticals-devices-and-other-health-interventions/)

©Institute for Clinical and Economic Review, 2021 Page 75 Final Report – Multiple Myeloma Return to Table of Contents
Table D1.2. Search Strategies for Ovid MEDLINE(R) Epub Ahead of Print, In-Process & Other Non-Indexed Citations, Ovid MEDLINE(R) Daily, Ovid MEDLINE and Versions(R) 1946 to Present*
# Search Term
1 Exp Multiple Myeloma/
2
("Multiple Myeloma" or "Multiple Myelomas" or "Myeloma, Multiple" or "Myeloma, Plasma cell" or "Plasma cell myeloma" or "Plasma cell myelomas" or "Myelomatosis" or "Kahler Disease" or "Myeloma" or "Myelomas").ti,ab OR (("relapsed" or "refractory" or "pretreated" or "high risk") and ("multiple myeloma")).ti,ab
3 1 or 2
4 ("CAR T" or "CAR-T" or "chimeric antigen receptor" or "CAR-T cell" OR "Anti BCMA" or "anti-BCMA" or "CMA CAR-T" or "b-cell maturation antigen" OR "anti b-cell maturation antigen" OR "CD269").ti,ab
5 ("blenrep" or "belantamab" or "belantamab mafodotin" OR "belantamab mafodotin-blmf" or "GSK2857916" or "GSK 2857916" OR "GSK-2857916" OR "gsk916" OR "gsk 916" or "gsk-916").ti,ab.
6 ("bb2121" or "bb-2121" OR "bb 2121" or "idecabtagene vicleucel" or "ide-cel" OR "ide cel").ti,ab.
7 ("JNJ-68284528" OR "JNJ68284528" OR "JNJ 68284528" OR "JNJ4528" OR "JNJ 4528" OR "LCAR-B38M" OR "cilta-cel" OR "cilta cel" OR "ciltacabtagene autoleucel").ti,ab.
((("pomalidomide" or "pomalyst") and ("Cyclophosphamide" or "Cytoxan") and ("dexamethasone" or "decadron" or "Dexamethasone Intensol" or "Dexpak Taperpak" or "prednisone")) or (("Carfilzomib" or "Kyprolis") and ("pomalidomide" or "pomalyst") and ("dexamethasone" or "decadron" or "Dexamethasone Intensol" or "Dexpak Taperpak" or "prednisone")) OR (("Elotuzumab" OR "Empliciti") AND ("pomalidomide" OR "pomalyst") AND ("dexamethasone" OR "decadron" OR "Dexamethasone Intensol" OR "Dexpak Taperpak" or "prednisone")) OR (("Carfilzomib" OR "Kyprolis") AND ("Cyclophosphamide" OR "Cytoxan") AND ("dexamethasone" OR "decadron" OR "Dexamethasone Intensol" OR "Dexpak Taperpak" or "prednisone"))).ti,ab.
9 4 or 5 or 6 or 7 or 8
10 3 and 9
11 animals not (humans and animals).sh.
12 10 not 11
13 limit 12 to English language
14 13 and ("chapter" OR "comment" OR "editorial" OR "letter" OR "note" OR "short survey" OR "review" OR "opinion").pt
15 13 not 14 * Search last updated on March 08, 2021.

©Institute for Clinical and Economic Review, 2021 Page 76 Final Report – Multiple Myeloma Return to Table of Contents
Table D1.3. Search Strategy for EMBASE*
# Search Term
#1 'multiple myeloma'/exp
#2
('multiple myeloma' OR ‘refractory multiple myeloma’ OR ‘relapsed multiple myeloma’ OR 'Kahler disease' OR 'morbus Kahler' OR 'myeloma multiplex' OR 'Myelomatosis' OR 'Myeloma' OR 'Myelomas' OR ‘plasma cell myeloma’ OR (('relapsed' OR 'refractory' OR 'pretreated' OR 'high risk') and 'multiple myeloma')):ti,ab
#3 #1 or #2
#4 ('car t' OR ‘CAR-T’ OR 'chimeric antigen receptor' OR 'anti-BCMA' OR ‘anti bcma’ OR 'b cell maturation antigen' OR 'anti b-cell maturation antigen' OR 'CD269'):ti,ab
#5 'belantamab mafodotin'/exp OR ‘belantamab’/exp
#6 ('gsk2857916' OR 'gsk 2857916' or 'gsk-2857916' or ‘gsk916’ or ‘gsk 916’ OR ‘gsk-916’ OR 'belantamab' or ‘belantamab mafodotin’ or ‘belantamab mafodotin-blmf’ or ‘blenrep’):ti,ab
#7 #5 OR #6
#8 'idecabtagene vicleucel'/exp
#9 ('bb2121' OR 'bb 2121' OR 'bb-2121’ OR 'ide-cel' OR 'idecabtagene vicleucel' OR 'ide cel'):ti,ab
#10 #8 OR #9
#11 'jnj 68284528'/exp or 'ciltacabtagene autoleucel'/exp
#12 ('jnj 4528' OR 'jnj68284528' OR 'lcar-b38m' or ‘cilta-cel’ or ‘cilta cel’ or 'ciltacabtagene autoleucel'):ti,ab
#13 #11 OR #12
#14
((('pomalidomide') AND ('cyclophosphamide') AND ('dexamethasone' OR 'prednisone')) OR ('carfilzomib' AND 'pomalidomide' AND ('dexamethasone' OR ‘prednisone’)) OR ('elotuzumab' AND ' pomalidomide' AND ('dexamethasone' or ‘prednisone’)) OR ('carfilzomib' AND 'cyclophosphamide' AND ('dexamethasone' OR ‘prednisone’))):ti,ab
#15 #3 AND (#4 OR #7 OR #10 OR #13 OR #14)
#16 (‘animal’/exp OR ‘nonhuman’/exp OR ‘animal experiment’/exp OR 'animal model'/exp) NOT ‘human’/exp
#17 #15 NOT #16
#18 #17 AND [English]/lim
#19 #18 AND (‘chapter’/it or ‘comment’/it OR ‘editorial’/it OR ‘letter’/it OR ‘note’/it OR ‘short survey’/it OR ‘review’/it OR ‘opinion’/it)
#20 #18 NOT #19 * Search last updated on March 08, 2021.

©Institute for Clinical and Economic Review, 2021 Page 77 Final Report – Multiple Myeloma Return to Table of Contents
Figure D1. PRISMA flow Chart Showing Results of Literature Search for Idecabtagene vicleucel, Ciltacabtagene autoleucel, and Belantamab mafodotin
18 references identified through other sources
966 references after duplicate removal
110 references assessed for eligibility in full text
979 references identified through literature search
856 citations excluded 966 references screened
75 citations excluded 29 Duplicates
15 Intervention 14 Outcomes
9 Study Design 8 Population
35 total references 0 RCTs

©Institute for Clinical and Economic Review, 2021 Page 78 Final Report – Multiple Myeloma Return to Table of Contents
Study Selection
We performed screening at both the abstract and full-text level. Two investigators screened all abstracts identified through electronic searches according to the inclusion and exclusion criteria described earlier. We did not exclude any study at abstract-level screening due to insufficient information. For example, an abstract that did not report an outcome of interest would be accepted for further review in full text. We retrieved the citations that were accepted during abstract-level screening for full text appraisal. Two investigators reviewed full papers and provided justification for exclusion of each excluded study.
We also included FDA documents related to belantamab and ide-cel. These included the manufacturer’s submission to the agency, internal FDA review documents, and the transcript of Advisory Committee deliberations and discussions. All literature that did not undergo a formal peer review process is described separately.
Data Extraction and Quality Assessment
Because we did not identify any comparative trials of the interventions, we did not assess the quality of the individual trials.
Assessment of Level of Certainty in Evidence
We used the ICER Evidence Rating Matrix to evaluate the level of certainty in the available evidence of a net health benefit among each of the interventions of focus (see Figure 3.1 of the main report).57,58
Assessment of Bias
As part of our quality assessment, we evaluated the evidence base for the presence of potential publication bias. We performed an assessment of publication bias for Ide-cel, Cilta-cel and belantamab using the clinicaltrials.gov. We scanned the site to identify studies completed more than two years ago that would have met our inclusion criteria and for which no findings have been published and did not find any evidence of publication bias. The primary concern is the lack of peer-reviewed, published data for the KarMMa and CARTITUDE-1 trials as well as the lack of head-to-head trials of the interventions compared to usual care.
Data Synthesis and Statistical Analyses
Data on relevant outcomes were summarized in evidence tables (See Supplement D3) and synthesized qualitatively in the body of the review. Due to differences in study populations and limitations of study design (single-arm trials), outcomes are described for each trial separately.

©Institute for Clinical and Economic Review, 2021 Page 79 Final Report – Multiple Myeloma Return to Table of Contents
D2. Additional Clinical Evidence
Evidence Base
Ide-cel
In addition to the pivotal phase II KarMMa trial described in the main report, we also identified a phase I trial of bb2121 (ide-cel), CRB-401.59,60 CRB-401 was a phase 1 open-label single-arm dose-escalation and dose-expansion, multi-center US-based trial. The trial enrolled 62 adults (21 in the dose-escalation and 41 in the dose-expansion phase) who had previously received three lines of therapy (including an IMiD and a PI), or were refractory to both classes. The dose-expansion phase also required exposure to daratumumab and that patients be refractory to the last line of therapy. Patients underwent leukapheresis, bridging therapy during manufacturing, and lymphodepletion with fludarabine and cyclophosphamide prior to infusion with 50, 150, 450, or 800x106 CAR-T cells in the dose-escalation phase and 150 to 450x106 CAR-T cells in the expansion phase. 33 patients were analyzed in the original publication and 62 patients were analyzed in the updated analysis as of January 2020. 59,60 The primary outcome was safety. Secondary outcomes were overall response rate (ORR) and duration of response.
More details on both KarMMa and CRB-401 are provided in Table D3.1.
Cilta-cel
In addition to the pivotal phase Ib/II CARTITUDE-1 trial described in the main report, we also identified a phase I trial of cilta-cel (LEGEND-2). LEGEND-2 is a Phase I single-arm trial conducted at four sites in China.13,61,62 The trial enrolled 74 adults with TCRMM who had progressive disease after at least 3 prior therapies (including a PI, an IMiD, and anti-CD38 antibody). The trial explored the differences between a single and three CAR-T cell infusion approach with varying doses (0.2-2.0×10⁶ CAR-T cells/kg) as well as cyclophosphamide alone versus in combination with fludarabine during conditioning. For this report, we will include data from the largest study site (Xi’an, N=57) because data was not aggregated across all four sites. The primary outcome was AEs; the secondary outcome was CR.
More details on both trials are provided in Table D3.1.
Belantamab
In addition to the pivotal phase II, open-label, two-arm, multicenter trial of belantamab (DREAMM-2), we identified a pooled post-hoc analysis of DREAMM-1 and DREAMM-2 and one expanded access study. Neither of the two additional studies had been published at the time of this report, and data was only available in form of conference abstracts/posters.

©Institute for Clinical and Economic Review, 2021 Page 80 Final Report – Multiple Myeloma Return to Table of Contents
DREAMM-2: DREAMM-2, the pivotal trial of belantamab in adults with triple-class refractory multiple myeloma, is an ongoing global, open-label, phase II randomized multicenter trial comparing the efficacy and safety of two doses of belantamab (2.5 mg/kg and 3.4 mg/kg).17 Patients were treated with intravenous belantamab every three weeks until disease progression, or unacceptable toxicity occurred. Dosing delays or reductions were permitted for the management of adverse events. Efficacy and safety outcomes were assessed every three weeks after the first course of treatment had been administered.17 Due to the risk for ocular toxicity of belantamab, ophthalmic testing was required prior to each round of treatment.17 To further mitigate corneal events, patients were administered prophylactic corticosteroid eye drops as well as artificial tears.
Pooled post-hoc analysis: Trudel 2020 presented pooled tolerability and safety data from the DREAMM-1 and DREAMM-2 trials.63 DREAMM-1 was an open-label phase I trial and included adult patients with RRMM, who had previously failed 3 or more lines of treatment, and were refractory to an alkylator, PI, and IMiD. DREAMM-2 has been described previously in this report. A total of 264 patients were randomized to either 2.5 mg/kg (N=103) or 3.4 mg/kg (N=161) every three weeks.63 For the purpose of this review, we will only discuss the arm that received the FDA approved dose of 2.5 mg/kg.
The median age of patients was 65 years and 50% of the randomized patients were male. The study population also included a subset of RRMM patients at higher risk of more aggressive disease, including 40% with ISS stage III, 20% who exhibited extramedullary disease (EMD), and 27% with high-risk cytogenetic features. The median number of prior lines of therapy was 7 (range 3 to 21).
Expanded Access Program: This multicenter, observational study included 32 patients with RRMM who were treated under the expanded access compassionate care program at 6 Israeli multiple myeloma centers.64 The primary outcome assessed was progression-free survival. Secondary outcomes included overall response rate, overall survival, as well as safety and tolerability.
Between July 2019 and February 2020, 32 patients were treated with at least one dose of belantamab (median 3; range 1-11) and identified for inclusion in this study. Median follow-up duration was 5.7 months (range 0.5 – 13.8 months) and data were obtained from medical charts. A total of 13 patients received the 2.5 mg/kg dose, and 17 patients received the 3.4 mg/kg dose, respectively. Of note, this study did not present stratified results of the two separate doses, and therefore, the results presented contain both doses. Thus, these results should be synthesized cautiously with other studies which focused solely on patients receiving the FDA approved 2.5 mg/kg dose.
Patients included had a median age of 70 years, over half were male (59%), and roughly 20% were considered to have high-risk cytogenetics. The heavily pre-treated patients had received a median of 6 prior lines of treatments (range 3-11), with a majority having been previously exposed to bortezomib (94%), carfilzomib (74%), lenalidomide (91%), pomalidomide (87%), or daratumumab

©Institute for Clinical and Economic Review, 2021 Page 81 Final Report – Multiple Myeloma Return to Table of Contents
(97%). The overwhelming majority of included participants (97%) had also received an autologous stem-cell transplant.
Usual Care
The main report discusses the primary source of outcomes data to inform our comparison of the interventions to usual care, the MAMMOTH study.7 Two additional retrospective studies were identified with sufficient numbers of triple-class refractory patients (Mehra 2020 and Goldsmith 2020). In Mehra 2020, patient data were abstracted from a US-based electronic health record system from January 2011 to October 2019.27 A total of 251 patients with at least triple-class refractory multiple myeloma were included in the analysis. Of those, 73 (29%) were “penta-refractory”. Primary outcomes were overall survival (OS), progression free survival (PFS), and time to next treatment (TTNT). In Goldsmith 2019, data from 58 patients were abstracted from health records at a single US-based academic center from January 2013 and August 2018.26 Patients were either quad or penta-refractory and treated with at least one cycle of bendustamine/prednisone (BP) or dexamethasone, cyclophosphamide, etoposide, cisplatin (DCEP). Primary outcomes were PFS and OS. Additional information on the study design of the usual care studies are available in Table D3.18 and baseline characteristics are available in Table D3.19.
Effectiveness
Ide-cel
Outcomes from the pivotal phase II trial of ide-cel (KarMMa) are described in the main report. In the phase 1 dose-escalation/expansion trial, CRB-401 (n=62), as of January 2020, median follow-up was 14.7 months, as-treated median PFS was 8.8 months (95% CI: 5.9-11.9 months), and as-treated median OS was 34.2 months (95% CI: 19.2-not estimable). As-treated ORR was 75.8% and as-treated stringent or complete response (sCR or CR) was 38.7%. As with KarMMa, ORR appeared to be dose-related in CRB-401. As-treated ORR in the higher dose (450x106) was 90% compared to 50% in the lower dose (150x106). As-treated median duration of response was 10.3 months overall (95% CI: 7.7-13.7 months).60 More detailed outcomes from both the KarMMa and CRB-401 trial are provided in Table D3.3. Details on HRQoL outcomes from KarMMa are provided in Table D3.10.

©Institute for Clinical and Economic Review, 2021 Page 82 Final Report – Multiple Myeloma Return to Table of Contents
Cilta-cel
The main report provides outcomes from the pivotal phase Ib/II trial (CARTITUDE-1) In the Phase I trial (LEGEND-2, Xi’an study site), with a median follow-up time of 25 months, median PFS was 19.9 months, median OS was 36 months, and ORR was 87.7%.65,66 Because all patients in LEGEND-2 who were enrolled were leukapheresed and underwent infusion, an ITT analysis was not applicable, however comparisons based on data from LEGEND-2 should be interpreted with caution due to differences in the patient population. Detailed outcomes from both trials are provided in Table D3.4. Details on HRQoL outcomes from CARTITUDE-1 are provided in Table D3.10.
Belantamab
DREAMM-2: The DREAMM-2 study reported ITT results; thus, the following results are all calculated on an ITT basis. At 13-month follow-up (data cut-off date: January 2020), 13 and 11 patients treated with 2.5 mg/kg belantamab achieved PR and vgPR, respectively. The median duration of response was 11 months (95% CI: 4.2 to not reached). Time to initial response and time to CR was not reported.23 Out of 97 participants, 59 had progressive disease at 6.3 months of follow-up.17 More detailed outcomes from DREAMM-2 are provided in Table D3.5 and for additional data on HRQoL please refer to Table D3.10.
Expanded Access Program: Overall, the median duration of PFS achieved by DREAMM-2 trial participants was 2.6 months. Twelve out of 29 patients who were evaluable, achieved an ORR (with 3 participants achieving PR, 8 achieving VGPR, and one participant achieving CR). OS at 6 months was 68%. Statistical analyses were not reported. A subgroup analysis showed that ORR and PFS were comparable between patient who had been previously treated with ≤ 5 prior lines of treatments, and those who had previously received more than 5.64 More detailed outcomes from the Expanded Access Program can be found in Table D3.17.
Usual Care
Outcomes from the retrospective MAMMOTH study are discussed in the main report.7 We also identified two additional retrospective studies (Goldsmith 2020 and Mehra 2020) to inform our comparison of usual care to the interventions. In these trials, median PFS varied from 1.4 months to 4.8 months, median OS varied from 6.2 months to 11.0 months, and ORR was around 31%26,27. The patient populations of these studies varied, particularly in the percentage of patients with penta-refractory disease (29% in Mehra and 78% in Goldsmith). Additional outcomes data for the MAMMOTH study is available in Table D3.20 and for the two additional retrospective studies is available in Table D3.21.

©Institute for Clinical and Economic Review, 2021 Page 83 Final Report – Multiple Myeloma Return to Table of Contents
Harms
Ide-cel
AEs from the pivotal phase II trial of ide-cel (KarMMa) are described in the main report. In the phase 1 dose-escalation/expansion trial, CRB-401 (n=62), the most frequent grade three or higher AEs were neutropenia (92%), leukopenia (61%), anemia (57%), and thrombocytopenia (57%). CRS was also common, occurring in 76% of patients and requiring tocilizumab in 21%. Sixty-nine percent had low to moderate (Grade 1 or 2) CRS, 7% had severe (Grade 3) CRS, and none had a grade 4 CRS. As in the KarMMa trial, risk of CRS in CRB-401 was dose-related. 92% of patients in the higher dose group (450x106) reported any grade CRS compared to 11% in the lower dose group (150x106). 82% of patients ≥65 experienced any grade CRS. As of the January 2020 cutoff date, 49 (79%) had discontinued due to progressive disease (58%), withdrawal by patient (10%), or death (10%).67 More detailed safety data from both the KarMMa and CRB-401 trials are provided in Table D3.11.
Cilta-cel
The main report provides adverse events from the pivotal phase Ib/II trial of cilta-cel (CARTITUDE-1). In the phase I trial (LEGEND-2, Xi’an site) of cilta-cel, CRS was common (89.5%) and with 25 months of follow-up, 17 deaths (29.8%) were reported, 14 (24.6%) due to progressive disease and 2 (3.5%) due to AEs. Other important AEs included thrombocytopenia (49.1%) and neurotoxicity (1.8%).65,66 Detailed safety data from both trials are provided in Table D3.12.
Belantamab
DREAMM-2: Most dose delays, as well as dose reductions were due to keratopathy (45/51 and 24/33 patients, respectively).23 Adverse events grade 3 or above were reported by 84% of patients treated with belantamab, and the most commonly reported events were keratopathy (46%), thrombocytopenia (22%), and anemia (21%).
Median time to onset of the first corneal event was 37 days and lasted for a median duration of 86.5 days.18 The occurrence of ocular toxicities increased with increasing number of doses; 25% of patients reported ocular toxicities after the first dose, 69% reported their first corneal event after by the fourth dose. Only two patients developed a corneal event subsequent to having received 4 doses. Overall, 24 patients reported experiencing blurred vision and 14 patients experienced dry eyes. CRS or neurotoxicity was not reported by any patient in the DREAMM-2 trial. Please refer to Table D3.13 for a more detailed description of safety data.
Pooled Analysis: Patients received a median of 3 courses of treatment with 2.5 mg/kg belantamab (range 1 – 15). Most patients (98%) experienced at least one AE, of which 90% were considered treatment related. Serious adverse events (SAEs) were reported by 42 participants, with 13

©Institute for Clinical and Economic Review, 2021 Page 84 Final Report – Multiple Myeloma Return to Table of Contents
reporting SAEs related to the study treatment. One participant died due a treatment-related SAE (sepsis). Keratopathy, which was only assessed in the DREAMM-2 trial, was the most commonly reported AE of any grade (66%), followed by anemia (26%) and thrombocytopenia (23%). Blurred vision and dry eye were reported by 20 and 12 patients, respectively. Grade 3/4 adverse events most frequently experienced by patients were keratopathy (27%), anemia (18%) and thrombocytopenia (17%). Four patients experienced grade 3/4 blurred vision, and no patients reported experiencing grade 3/4 dry eye. Generally, adverse events were managed by means of dose reductions (32%) and/or delays in treatment administration (51%). Keratopathy was the most frequently cited reason for delays or reduction in dosing by 45% and 24% of patients, respectively, as well as for treatment discontinuation (2%).
Expanded Access Program: Seventeen study participants (53%) were still receiving treatment at the time of data cut-off, while the remaining 15 had discontinued treatment. The most commonly cited reason for treatment discontinuation was progression or death (13 patients). Twenty out of 31 evaluable patients experienced ocular toxicity (keratopathy) of any grade, and eight reported grade ≥3 keratopathy. 62.5% of patients who experienced grade ≥3 ocular toxicity reported an improvement to grade ≤2 ocular toxicity, and one person discontinued treatment. Other adverse events commonly reported by ≥ 20% of study participants were thrombocytopenia (30%), neutropenia (22%), and infections (22%). Thrombocytopenia, neutropenia, and infections grade 3 or higher were reported by three, four, and three patients, respectively. Adverse events were managed by means of dosing delays (13 patients) and dosing reductions (11 patients). Ocular toxicity was most commonly cited as requiring dosing delays or reductions (9 patients).
Please refer to Table D3.17 for a more detailed description of safety data for the Pooled Analysis and Expanded Access Program.
Subgroup Analyses
Ide-cel
Subgroup data from the pivotal phase II trial of ide-cel (KarMMa) are described in the main report. In the phase 1 dose-escalation/expansion trial, CRB-401, subgroup efficacy data was only available from the original publication (n=33).59 At a median of 11.3 months of follow-up, as-treated ORR was 85% (28 patients had a response out of 33 infused). Response appeared to be dose-related, with the highest dose (>150x106 CAR-T cells) achieving the highest as-treated ORR (96%). Those with high cytogenetic risk (n=15) had a lower as-treated ORR (73%).59
More detailed subgroup data from both the KarMMa and CRB-401 trial are provided in Tables D3.6 and D3.7.

©Institute for Clinical and Economic Review, 2021 Page 85 Final Report – Multiple Myeloma Return to Table of Contents
Cilta-cel
At the time of the report, subgroup data from the pivotal phase Ib/II trial (CARTITUDE-1) of cilta-cel was not available. In the Phase I trial (LEGEND-2, Xi’an site), as-treated median PFS for cilta-cel for patients with EMD was significantly lower (8.1 months) than for patients without EMD (25 months, p<0.001).68 Additional subgroup data is presented in Table D3.8.
Belantamab
In DREAMM-2 the probability of PFS reaching a duration of 6 months or more was 35% for patients who had received 3 to 6 prior lines of treatment, and 30% for both those who had received 7 prior lines of therapy or more, and for patients with high-risk cytogenetics. Median OS, which was only reported for the subgroup considered to have high-risk cytogenetics, was 9.4 months. The probability of OS at 12 months was 45%.
At 12.4 months of median follow up time, 34% of the patients who had received three to six prior treatments achieved an overall response compared to 30% of patients who had received seven prior lines of treatments or more. Very good partial response was achieved by 17% of those who had received three to six prior lines of therapies and by 20% of those who had received seven or more.
ORR at nine months was achieved by 27% who had a high-risk cytogenetic risk profile, with 22% achieving a vgPR. Of the patients who had mild to moderate renal impairment, ORR was achieved by 31.3% and 33.3%, respectively. The median duration of response achieved by patients who had been treated with three to six prior lines of therapy was 11 months versus 13.1 months for those who had received seven or more. The probability of a response lasting six months or longer was 63% and 73%, respectively. At nine months of follow-up, the median duration of response for the high-risk cytogenetics and renal impairment subgroups had not yet been reached. The probability of a response lasting for six months or more was 52% for the high-risk cytogenetics subgroup. For the renal impairment subgroups (mild to moderate), the probability of a duration of response of six months or more was not reported.
More patients with moderate renal impairment experienced serious adverse events (50%) compared to those with mild renal impairment (33.3%). Of those with high-risk cytogenetics, 46.3% reported experiencing SAEs. For more information regarding subgroup safety outcomes refer to Table D3.13.
Usual Care
As discussed in the main report, the retrospective studies we selected to represent the effectiveness of usual care did not provide sufficient information on the harms of the treatment regimens. See Table D3.22 for what safety data was available in two of the retrospective studies.7,26

©Institute for Clinical and Economic Review, 2021 Page 86 Final Report – Multiple Myeloma Return to Table of Contents
Therefore we selected representative prospective trials of commonly used treatments that make up components of the market basket of therapies in the economic model (Elo-Pom-Dex: elotuzumab-pomalidomide-dexamethasone, Car-Cy-Dex: carfilzomib-cyclophosphamide-dexamethasone, Ixa-Len-Dex: ixazomib-lenalidomide-dexamethasone).29-31 In these prospective trials, treatment-related AEs were reported by 7-8% of patients. Discontinuation rates varied from 14 to 18%. Grade 3 or 4 AEs were common (57-74%). The most common grade 3 or 4 AEs were neutropenia (13-22%), anemia (9-11%), and thrombocytopenia (4-19%). Mortality ranged from 4.2% to 21.7%, however follow-up time varied (median 9 to 23 months). Deaths were most likely due to progressive disease (3.6-13.3%) followed by AEs (7.1-8.3%). Differences in harms between these regimes and that of the interventions should be interpreted with caution, however, as the trials were generally conducted in less heavily pre-treated populations (median of 2-3 prior therapies). See Table D3.23 for more details on harms of the usual care treatment regimens.

©Institute for Clinical and Economic Review, 2021 Page 87 Final Report – Multiple Myeloma Return to Table of Contents
D3. Evidence Tables
Interventions
Table D3.1. Study Design: Interventions
Trial (NCT) Study Design & Location Treatment Inclusion Criteria Exclusion Criteria
Ide-cel KarMMa10,12 (NCT03361748)
Phase II, open label, two-part, single-arm, multicenter trial N (enrolled) = 149 N (leukapheresed) = 140 N (treated) = 128 Location: Global
− 150 x 106 CAR+ T cells/kg − 300 x 106 CAR+ T cells/kg − 450 x 106 CAR+ T cells/kg Single infusion
− ≥ 18 years of age − Documented diagnosis of
multiple myeloma − Received ≥ 3 prior treatment
regimens, including a PI, IMiD, and an anti-CD38 antibody
− Must have undergone ≥2 consecutive treatment cycles for each regimen
− Must be refractory to last treatment regimen
− ECOG status of 0-1 − Subjects must have
measurable disease
− History of clinically relevant central nervous system pathology
− Active or history of plasma cell leukemia − Solitary plasmacytomas or non-secretory myeloma
without other evidence of measurable disease − Inadequate organ function − Ongoing treatment with chronic
immunosuppressants − Previous allogeneic hematopoietic SCT; or
treatment with any gene therapy-based therapy for cancer or investigational cellular therapy for cancer or BCMA targeted therapy
− HIV, hepatitis B, hepatitis C − History of class III or IV, CHF or severe non-ischemic
cardiomyopathy, history of stroke, unstable angina, myocardial infarction, or ventricular arrhythmia within the previous 6 months
− Secondary malignancies in addition to myeloma CRB-40159,67,69 (NCT02658929)
Phase I, open-label, single-group, multicenter trial N = 62 Location: United States
Dose-escalation phase (N=21): − 150 x 106 CAR+ T cells/kg − 450 x 106 CAR+ T cells/kg
*50 x 106 and 800 x 106
CAR+ T cells/kg arms were not abstracted
− 18 years of age and older − ≥3 lines of therapy (including
a PI and IMiD) − ECOG status of 0-1 − Measurable disease or more
than 30% bone marrow plasma cells
− Known CNS disease − Inadequate hepatic, renal, bone marrow function − Presence of active infection within 72 hours − Malignancies in addition to myeloma if the second
malignancy has required therapy in the last 3 years or is not in complete remission
− History of class III or IV CHF or non-ischemic cardiomyopathy, unstable angina, myocardial infarction, or ventricular arrhythmia requiring

©Institute for Clinical and Economic Review, 2021 Page 88 Final Report – Multiple Myeloma Return to Table of Contents
Trial (NCT) Study Design & Location Treatment Inclusion Criteria Exclusion Criteria
Expansion phase (N=41): − 150 x 106 CAR+ T cells/kg − 450 x 106 CAR+ T cells/kg
medication or mechanical control within the previous 6 months
− HIV − Plasma cell leukemia or clinically significant
amyloidosis Cilta-cel
CARTITUDE-116,20 (NCT03548207)
Phase Ib/II, single-group, open-label, multi-center study N (enrolled) = 126 N (apheresed) = 113 N (treated) = 97 Location: Japan, United States
Target dose: − 0.75 × 10⁶ CAR+ T
cells/kg (Range: 0.5–1.0 × 10⁶)
Median Dose: − 0.71 x 10⁶ CAR+ T
cells/kg (Range: 0.51-0.95 x 10⁶)
Single infusion
− ≥ 18 years of age − Documented MM diagnosis
per IMWG criteria − ECOG status ≤1 − Measurable disease − Previously received ≥ 3
therapies (including PI, IMiD, anti-CD38 antibody therapy) or are double refractory to an IMiD and PI
− Documented evidence of progressive disease per IMWG criteria or within 12 months of most recent therapy
− Prior CAR-T treatment directed at any target − Prior therapy that is targeted to B-cell maturation
antigen (BCMA) − NYHA stage III or IV CHF; myocardial infarction or
CABG within 6 months; history of clinically significant ventricular arrhythmia or unexplained syncope; history of severe non-ischemic cardiomyopathy; impaired cardiac function
− Received a cumulative dose of corticosteroids equivalent to >= 70 mg of prednisone within 7 days prior to apheresis
− Received an allogenic SCT within 6 months or an autologous SCT within 12 weeks
− History of CNS involvement or clinical signs of meningeal involvement of multiple myeloma
LEGEND-262,70 (NCT03090659)
Phase I, open-label, single-group, multicenter trial N = 74 Location: China
(Xi'an site) Median dose: − 0.5 × 10⁶ CAR+ T cells/kg
(Range: 0.07 - 2.1 × 10⁶) (Changzheng, Jiangsu, Ruijin sites) Mean dose: − 0.7 x 10⁶ CAR+ T cells/kg 3 separate infusions within 7 days (One clinical site administered the treatment in one single-dose)
− 18-75 years of age − Documented initial diagnosis
of multiple myeloma according to IMWG diagnostic criteria
− Measurable disease at screening
− Received at least 3 prior lines of treatment for multiple myeloma (incl. PI and/or IMiD)
− Documented disease progression during/within 12
− NYHA Stage III-IV CHF, myocardial infarction, or CABG ≤6 months prior
− History of ventricular arrythmia or unexplained syncope
− Impaired cardiac function (LVEF <45%) − Systemic corticosteroid therapy of greater than 5
mg/day of prednisone (or equivalent dose of another corticosteroid) within 2 weeks
− Received autologous SCT within 12 weeks − Received allogeneic SCT

©Institute for Clinical and Economic Review, 2021 Page 89 Final Report – Multiple Myeloma Return to Table of Contents
Trial (NCT) Study Design & Location Treatment Inclusion Criteria Exclusion Criteria
months of most recent anti-myeloma therapy
− ECOG status of 0 -2 Belantamab
DREAMM-217,71 (NCT03525678)
Phase II, open-label, multicenter study N (total) = 196 N (2.5mg/kg dose) = 97 Location: Global
2.5 mg/kg every three weeks The studied 3.4 mg/kg dose was not approved by the FDA and will not be presented here
− ≥ 18 years of age − Confirmed relapsed or
refractory multiple myeloma according to IMWG
− ECOG status of 0-2 − Received ≥3 previous lines of
anti-myeloma treatments − Refractory to an PI and IMiD,
refractory and or intolerant to an anti-CD38 monoclonal antibody
− Autologous SCT ineligible or transplantation >100 days
− Adequate organ system function
− Previous BCMA therapies, systemic high-dose corticosteroids, or investigational drug
− Received allogeneic SCT − Current corneal epithelial disease (except mild
punctate keratopathy) − Active renal condition; active mucosal or internal
bleeding − POEMS syndrome
BCMA: B-cell maturation antigen, CABG: coronary artery bypass graft, CAR+: chimeric antigen receptor positive, CHF: congestive heart failure, CNS: central nervous system, ECOG: Eastern Cooperative Oncology Group, IMWG: International Myeloma Working Group, IMiD: immunomodulatory drug, kg: kilogram, LVEF: left ventricular ejection fraction, mg: milligram, N: total number, NYHA: New York Heart Association, PI: proteasome inhibitor, POEMS: polyneuropathy, organomegaly, endocrinopathy, myeloma protein, and skin changes, SCT: stem cell transplant

©Institute for Clinical and Economic Review, 2021 Page 90 Final Report – Multiple Myeloma Return to Table of Contents
Table D3.2. Baseline Characteristics: Ide-cel, Cilta-cel, and Belantamab
Intervention Ide-cel Cilta-cel Belantamab
Trial KarMMa10,11 CRB-40159,67 CARTITUDE-120
LEGEND-262 Xi'an
LEGEND-262 Changzheng,
Ruijin, Jiangsu
DREAMM-217
Arms 150x106 CAR+ T cells/kg
300 x106 CAR+ T cells/kg
450 x106 CAR+ T cells/kg
Overall Overall 0.71x10⁶ CAR+ T cells/kg
0.5 × 10⁶ CAR+ T cells/kg
0.71x10⁶ CAR+ T cells/kg
Belantamab (2.5 mg/kg)
N 4 70 54 128 62** 97 57 17 97
Age, Median Years (Range) 54.0 (49.0-69.0)
61.0 (33.0-76.0)
62.0 (43.0-78.0)
61.0 (33.0-78.0) 61.0 (NR) 61.0 (43.0-
78.0) 54.0 (27.0-
72.0) 55.1 (35.0-
73.0) 65.0 (IQR:
60-70) Male, n (%) 4 (100) 38 (54.3) 34 (63.0) 76 (59.4) 21/33 (63.6) 57 (58.8) 34 (59.6) 11 (64.7) 51 (52.6)
Race, n (%) White
NR NR NR NR NR NR NR NR 72 (74.2)
Black 16 (16.5) Time since Diagnosis, Median
Years (Range) 10.0 (6.0-
12.0) 7.0 (2.0-
18.0) 6.0 (1.0-
17.0) 6.0
(1.0−18.0) 5.0 (1.0–
36.0); N=33 5.9 (1.6-
18.2) 4.0 (1.0-9.0) NR 5.5 (IQR: 4.0-7.0)
Tumor BCMA Expression*, n (%) 4 (100) 60 (85.7) 45 (83.3) 109 (85.2) 23/33 (69.7) 57 (91.9) NR 16 (94.1) NR
High Risk Population,
n (%)
Extramedullary Disease 0 (0) 34 (48.6) 16 (29.6) 50 (39.1) 9/33 (27.2) 13 (13.4) 17 (29.8)
NR
22 (22.7)
Received Bridging Therapy Prior to
Lymphodepletion 4 (100) 61 (87.1) 47 (87.0) 112 (87.5) 14/33
(42.4)¤ 73 (75.2) NR NR
High Cytogenetic Risk 1 (25.0) 20 (28.6) 24 (44.4) 45 (35.2) 15/33
(45.5)§ 23 (23.7) NR 41 (42.3)
High Tumor Burden 3 (75.0) 34 (48.6) 28 (51.9) 65 (50.8) 16/33 (48.5) NR NR NR ISS Disease Stage
III 1 (25.0) 12 (17.1) 8 (14.8) 21 (16.4) 8/33 (24.2) NR 21 (36.8) 42 (43.3)
>1 Treatment Regimen per Year 2 (50.0) 36 (51.4) 22 (40.7) 60 (46.9) NR NR NR NR
Number of Prior Regimens, Median (Range) 9 (4-12) 6 (3-16) 5 (3-13) 6 (3-16) 7 (3–23);
N=33 6 (3-18) 3 (1-9) 4 (3-11) 7 (3-21)
Triple-exposed, n (%) 128 (100)# 128 (100)# 128 (100)# 128 (100)# 62/62 (100) 97 (100) NR 17 (100) 97 (100) Triple-refractory, n (%) 4 (100) 60 (85.7) 44 (81.5) 108 (84.4) NR 85 (87.6) NR NR 97 (100)

©Institute for Clinical and Economic Review, 2021 Page 91 Final Report – Multiple Myeloma Return to Table of Contents
Intervention Ide-cel Cilta-cel Belantamab
Trial KarMMa10,11 CRB-40159,67 CARTITUDE-120
LEGEND-262 Xi'an
LEGEND-262 Changzheng,
Ruijin, Jiangsu
DREAMM-217
Arms 150x106 CAR+ T cells/kg
300 x106 CAR+ T cells/kg
450 x106 CAR+ T cells/kg
Overall Overall 0.71x10⁶ CAR+ T cells/kg
0.5 × 10⁶ CAR+ T cells/kg
0.71x10⁶ CAR+ T cells/kg
Belantamab (2.5 mg/kg)
N 4 70 54 128 62** 97 57 17 97 Penta-exposed, n (%) NR NR NR 77 (60.2) 26/33 (78.8) 81 (83.5) NR 7 (41.2)
Penta-refractory, n (%) 1 (25.0) 24 (34.3) 8 (14.8) 33 (25.8) 6/33 (18.2) 41 (42.3) NR NR
Anti-CD38 Ab-refractory, n (%) 4 (100) 66 (94.3) 50 (92.6) 120 (93.8) NR 96 (99.0) NR NR 97 (100)
Prior Therapies Received,
n (%)
Bortezomib
NR NR NR NR
33/33 (100)
NR
39 (68.4) 14 (82.4) 95 (97.9) Carfilzomib 30/33 (90.9) 1 (1.8) 2 (11.8) 74 (76.3)
Lenalidomide 33/33 (100) 25 (43.9) 10 (58.8) 97 (100) Pomalidomide 31/33 (93.9) 2 (3.6) 1 (5.9) 89 (91.8) Daratumumab 56/62 (90.0) NR NR 97 (100)
Isatuximab NR NR 1 (5.9) 3 (3.1)
Refractory to Prior
Therapies, n (%)
Bortezomib NR NR NR NR 20/33 (60.6) NR
NR NR
74 (76.3) Carfilzomib NR NR NR NR 19/33 (57.6) 63 (64.9) 63 (64.9)
Lenalidomide NR NR NR NR 24/33 (72.7) NR 87 (89.7) Pomalidomide NR NR NR NR 26/33 (78.8) 81 (83.5) 84 (86.6) Daratumumab 3 (75.0) 61 (87.1) 45 (83.3) 109 (85.2) 48/62 (77.0) NR 97 (100)
Isatuximab NR NR NR NR NR NR 3 (3.1) D/C Last Line of Therapy due to
Refractoriness, n (%) 4 (100)# 70 (100)# 54 (100)# 128 (100)# 21/33 (63.6)‡ 96 (99.0) NR NR NR
Received Autologous SCT, n (%)
1 4 (100) 67 (95.7) 49 (90.7) 120 (93.8) 32/33 (97.0) 87 (89.7) 10 (17.5) 8 (47.1)
≥1 3 (75.0) 23 (32.9) 18 (33.3) 44 (34.4)
EORTC QLQ-C30,
Fatigue NR NR NR
39.3 (24.4†) NR NR NR NR NR
Pain 39.9 (28.1†)

©Institute for Clinical and Economic Review, 2021 Page 92 Final Report – Multiple Myeloma Return to Table of Contents
Intervention Ide-cel Cilta-cel Belantamab
Trial KarMMa10,11 CRB-40159,67 CARTITUDE-120
LEGEND-262 Xi'an
LEGEND-262 Changzheng,
Ruijin, Jiangsu
DREAMM-217
Arms 150x106 CAR+ T cells/kg
300 x106 CAR+ T cells/kg
450 x106 CAR+ T cells/kg
Overall Overall 0.71x10⁶ CAR+ T cells/kg
0.5 × 10⁶ CAR+ T cells/kg
0.71x10⁶ CAR+ T cells/kg
Belantamab (2.5 mg/kg)
N 4 70 54 128 62** 97 57 17 97 Mean Score
(SD) Physical
Functioning 69.4 (25.1†)
Global Health/QoL 60.7 (20.6†)
EORTC QLQ-MY20
Disease Symptoms 32.4 (24.1)† NR NR NR NR NR
Side Effects 82.0 (15.3)†
ECOG PS, n (%)
0 3 (75.0) 31 (44.3) 23 (42.6) 57 (44.5) 10/33 (30.3) 0 (0)# 21 (36.8) 17 (100)# 97 (100)# 1 1 (25.0) 38 (54.3) 29 (53.7) 68 (53.1) 21/33 (63.6)
97 (100)# 27 (47.4)
2 0 (0) 1 (1.4) 2 (3.7) 3 (2.3) 2/33 (6.1) 9 (15.8) Data not reported for the following baseline characteristics: Height, weight, age at diagnosis, D/C last line of therapy due to side effects
BCMA: B-cell maturation antigen, CAR+: chimeric antigen receptor positive, ECOG PS: Eastern Cooperative Oncology Group performance status, EORTC: European Organization for Research and Treatment of Cancer, D/C: discontinued, kg: kilogram, mg: milligram, n: number, N: total number, NR: not reported, SCT: stem cell transplant, SD: standard deviation, QLQ: Quality of Life questionnaire * Defined as ≥50% BCMA+ † Data are digitized and should be interpreted with caution ‡ Progressive disease during most recent line of therapy § Defined by the presence of the following abnormalities: del(17p), t(4;14), or t(14;16) # Assumption made based on study protocol ¤ Administered after leukapheresis and before lymphodepletion ** N of 62 represents the entire treated CRB-401 population, N of 33 represents the first 33 patients to received Ide-cel treatment within the population

©Institute for Clinical and Economic Review, 2021 Page 93 Final Report – Multiple Myeloma Return to Table of Contents
Table D3.3. Efficacy Outcomes: Ide-cel
Trial KarMMa10,11 CRB-40167
Arms 150x106 CAR+ T cells/kg
300 x106 CAR+ T cells/kg
450 x106 CAR+ T cells/kg
Overall 150 x106 CAR+ T cells/kg
450 x106 CAR+ T cells/kg
Overall
N (as-treated) 4 70 54 128 18 38 62# Median Follow-Up 13.3 Months 14.7 Months
Response
Median Time to Initial Response, Months
(Range) NR NR NR 1 (0.5-8.8) NR NR 1 (0.5-3.0);
N=33
Median Time to CR or better, Months (Range) NR NR NR 2.8 (1.0-11.8) NR NR NR
Median Duration, Months (95%CI)
NR (2.8, NE)*
9.9 (5.4, 1.1.0)
11.3 (10.3, 11.4)
10.7 (9.0, 11.3)
13.7 (2.9, 39.6)
10.0 (6.3, 14.8)
10.3 (7.7, 13.7)
ORR, n (%); [95%CI] 2 (50.0) 48 (68.6) 44 (81.5) 94 (73.4); [65.8, 81.1] 9 (50.0); NR 34 (89.5) 47 (75.8);
NR sCR/CR, n (%) 1 (25.0) 20 (28.6) 21 (38.9) 42 (32.8) 7 (38.9) 14 (36.8) 24 (38.7)
vgPR, n (%) 1 (25.0) 10 (14.3) 14 (25.9) 25 (19.5) 7 (38.9) 30 (78.9) 40 (64.5) PR, n (%) 0 (0) 18 (25.7) 9 (16.7) 27 (21.1) NR NR NR
Overall Survival
Median Duration, Months (95%CI)
NR NR NR
19.4 (18.2, NE) NE (10.8, NE)
34.2 (23.2, NE) 34.2 (19.2, NE)
OS at 3 Months, n (%) NR (95.2)† NR NR NR OS at 6 Months, n (%) NR (90.0)† NR NR NR OS at 9 Months, n (%) NR (84.1)† NR NR NR
OS at 12 Months, n (%) NR (78.0) NR NR NR
Progression-Free
Survival
Median Duration, Months (95%CI) 2.8 (1.0, NE) 5.8 (4.2, 8.9) 12.1 (8.8,
12.3) 8.8 (5.6, 11.6) 4.5 (2.0, 12.0) 9 (7.2, 12.2) 8.8 (5.9, 11.9)
PFS at 3 Months, n (%) NR (50.6)† NR (69.1)† NR (80.9)† NR (72.0)† NR NR NR PFS at 6 Months, n (%) NR (24.0)† NR (48.7)† NR (69.3)† NR (56.7)† NR NR NR PFS at 9 Months, n (%) NR (24.0)† NR (36.4)† NR (60.3)† NR (45.2)† NR NR NR
PFS at 12 Months, n (%) NR (24.0)† NR (27.4)† NR (49.3)† NR (37.9)† NR NR NR
MRD-negativity, n (%); [95%CI] 1§ (25.0); [0.6, 80.6]
17§ (24.0); [14.8, 36.0]
15§ (28.0); [16.5, 41.6]
33§ (26.0); [18.5, 34.3] NR NR 30/37‡ (81.0)

©Institute for Clinical and Economic Review, 2021 Page 94 Final Report – Multiple Myeloma Return to Table of Contents
Trial KarMMa10,11 CRB-40167
Arms 150x106 CAR+ T cells/kg
300 x106 CAR+ T cells/kg
450 x106 CAR+ T cells/kg
Overall 150 x106 CAR+ T cells/kg
450 x106 CAR+ T cells/kg
Overall
Median peak CAR-T cell Expansion, Days (SE) 14 (NR) 11 (NR) 11 (NR) 11 (NR) NR NR NR
CAR-T cells detectable
At 6 Months, n (%) NR NR NR
29/49 (59.2) NR NR
13/23 (57.0) At 12 Months, n (%) 4/11 (36.4) 2/10 (20.0)
Disease Progression, n (%) NR NR NR 8 (6.3) NR NR 36/62 (58.0) Retreatment¤, n (%) NR NR NR 28 (21.9) NR NR NR
95% CI: 95% confidence interval, CAR: chimeric antigen receptor, CAR+: chimeric antigen receptor positive, CR: complete response, kg: kilogram, MRD: minimal residual disease, n: number, N: total number, NE: not estimable, NR: not reported, ORR: overall response rate, PFS: progression-free survival, PR: partial response, sCR: stringent complete response, SE: standard error, vgPR: very good partial response * Due to small N † Data are digitized and should be interpreted with caution ‡ Evaluable patients § MRD-negativity assessed in patients with complete response or better # N of 62 represents the entire treated CRB-401 population, N of 33 represents the first 33 patients to received Ide-cel treatment within the population ¤ Patients were retreated after disease progression

©Institute for Clinical and Economic Review, 2021 Page 95 Final Report – Multiple Myeloma Return to Table of Contents
Table D3.4. Efficacy Outcomes: Cilta-cel
Trial CARTITUDE-114,15,20 LEGEND-265,66 Xi'an
LEGEND-265,72 Changzheng, Ruijin, Jiangsu
Arms Overall 0.5x10⁶ CAR+ T cells/kg 0.7x10⁶ CAR+ T cells/kg N (as-treated) 97 57 17
Median Follow Up 18 Months 25 Months 26 Months
Response
Median Time to Initial Response, Months (Range) 1 (0.9-10.7) 1.0 (0.4-3.5) 1.0 (NR)
Median Duration, Months (95%CI) Not reached‡ 27 (NR) NR
ORR, n (%); [95%CI] 95 (97.9) 50 (87.7); [76.0, 95.0] 15 (88.2); [64.0, 99.0]
sCR, n (%) 74 (75.9) NR NR CR, n (%) 0 (0) 42 (73.7) 14 (82.4)
vgPR, n (%) 14 (14) 2 (3.5) 1 (5.9) PR, n (%) 3 (3) 6 (10.5) NR
Overall Survival
Median Duration, Months (95%CI) Not reached‡ 36.1 (26.4, NE) Not reached¤
At 3 months, n (%) NR NR (97.8)† NR (89.1)† At 6 months, n (%) NR (93.8)‡ NR (92.4)† NR (89.1)† At 9 months, n (%) NR NR (81.5)† NR (89.1)†
At 12 months, n (%) NR (88.5) NR (78.3)† NR (82.3) At 18 months, n (%) NR (80.9) N/A N/A
Progression-Free Survival
Median Duration, Months (95%CI) Not reached 19.9 (9.6, 31.0) 18.0 (NR)
At 3 months, n (%) NR (98.0)† NR (86.4)† NR (95.0)† At 6 months, n (%) NR (87.5)† NR (81.2)† NR (83.4)† At 9 months, n (%) NR (80.3)† NR (65.3)† NR (75.6)†
At 12 months, n (%) NR (76.6) NR (60.1)† 5/9 (57.0) At 18 months, n (%) NR (66%) N/A N/A
MRD-negativity, n (%) 56# (91.8) 39§ (68.4)¤ NR

©Institute for Clinical and Economic Review, 2021 Page 96 Final Report – Multiple Myeloma Return to Table of Contents
Trial CARTITUDE-114,15,20 LEGEND-265,66 Xi'an
LEGEND-265,72 Changzheng, Ruijin, Jiangsu
Arms Overall 0.5x10⁶ CAR+ T cells/kg 0.7x10⁶ CAR+ T cells/kg Median Peak CAR-T Cell Expansion, Days
(Range) 13 (9-55) NR NR
Disease Progression, n (%) NR 18/50†† (36.0)¤ 11 (64.7) Data not reported for the following efficacy outcomes: Median time to complete response, CAR-T cells detectable at 6 and 12 months
95% CI: 95% confidence interval, CAR: chimeric antigen receptor, CAR+: chimeric antigen receptor positive, CR: complete response, kg: kilogram, MRD: minimal residual disease, n: number, N: total number, N/A: not available, NE: not estimable, NR: not reported, ORR: overall response rate, PFS: progression-free survival, PR: partial response, sCR: stringent complete response, SE: standard error, vgPR: very good partial response * 95.7% confidence interval † Data are digitized and should be interpreted with caution ‡ 8.8-month follow up time § MRD-negativity assessed in patients with complete response # MRD-negativity assessed among evaluable patients ¤ 12-month follow up time †† Patients with partial response or better

©Institute for Clinical and Economic Review, 2021 Page 97 Final Report – Multiple Myeloma Return to Table of Contents
Table D3.5. Efficacy Outcomes: Belantamab
Trial DREAMM-223 Arms 2.5 mg/kg
N (ITT) 97 Median Follow Up 13 Months
Response
Median Duration, Months (95%CI) 11.0 (4.2, not reached) ORR, n (%); [95%CI] 31 (32.0); [21.7, 43.6]*
sCR, n (%) 2 (2.1) CR, n (%) 5 (5.2)
vgPR, n (%) 11 (11.3) PR, n (%) 13 (13.4)
Overall Survival
Median Duration, Months (95%CI) 13.7 (9.9, not reached) At 3 Months, n (%) 63/77 (82.2)† At 6 Months, n (%) 48/66 (72.6)† At 9 Months, n (%) 37/66 (63.0)†
At 12 Months, n (%) 28/49 (56.9)†
Progression-Free Survival
Median Duration, Months (95%CI) 2.8 (1.6, 3.6) At 3 Months, n (%) REDACTED At 6 Months, n (%) REDACTED At 9 Months, n (%) REDACTED
At 12 Months, n (%) REDACTED Disease Progression, n (%) 59 (60.8)‡
Data not reported for the following efficacy outcomes: Median time to complete response, CAR-T cells detectable at 6 and 12 months, median time to initial response, MRD-negativity
95% CI: 95% confidence interval, ITT: Intention to treat, CR: complete response, kg: kilogram, mg: milligram, MRD: minimal residual disease, n: number, N: total number, N/A: not available, NE: not estimable, NR: not reported, ORR: overall response rate, PFS: progression-free survival, PR: partial response, sCR: stringent complete response, SE: standard error, vgPR: very good partial response * 95.7% confidence interval † Data are digitized and should be interpreted with caution ‡ 6.3-month follow-up time

©Institute for Clinical and Economic Review, 2021 Page 98 Final Report – Multiple Myeloma Return to Table of Contents
Table D3.6. Subgroup Efficacy Data: Ide-cel
Trial KarMMa11,32,33
Subgroups
High Risk Age Groups
Extramedullary Disease
Received Bridging Therapy
High Cytogenetic
Risk
High Tumor Burden
ISS Disease Stage III
>1 Treatment Regimen per
Year < 65 years ≥ 65 years ≥ 70 years
Median Follow-Up
11.3 Months
N (as-treated) 50 112 45 65 21 60 83 45 20
ORR, n (%), [95%CI]
35 (70.0); [55.4, 82.1]*
80 (71.0); [62.1, 79.6]
31 (69.0); [55.4, 82.4]
46 (71.0); [58.2, 81.4]*
10 (48.0); [25.7, 70.2]
39 (65.0); [51.6, 76.9]
56 (67.5); [56.2, 77.1]†
38 (84.4); [70.5, 93.5]
18 (90.0); [76.9, 100]
CR, n (%); [95%CI]
12 (24.0); [13.1, 38.2]
38 (34.0); [25.3, 43.5]
14 (31.0); [17.6, 44.6]
19 (29.0); [18.6, 41.8]
2 (10.0); [1.2, 30.4]
18 (30.0); [18.8, 43.2]
28 (33.4); [23.7, 44.3]†
14 (31.1); [18.2, 46.6]
7 (35.0); [14.1, 55.9]
Median DOR, Months [95%CI]
9.2 [5.4, 11.3]
10.9 [9.0, 11.4]
10.7 [6.5, NE]
10.4 [6.1, 11.3]
6.9 [1.9, 10.3]
10.5 [9.0, 11.3] NR 10.9
[4.5, 11.4] 11.0
[3.9, 11.4] Median PFS,
Months [95%CI] 7.9
[5.1, 10.9] 8.8
[5.5, 11.6] 8.2
[4.8, 11.9] 7.5
[4.9, 11.3] 4.9
[1.8, 8.2] 8.9
[3.1, 11.1] NR 8.6 [4.9, 12.2]
10.2 [3.1, 12.3]
Subgroup data not reported for the following: probability of DOR ≥6 months, probability of PFS at 6 months, median OS, OS at 12 months; vgPR, PR 95% CI: 95% confidence interval, CR: complete response, DOR: duration of response, n: number, N: total number, ORR: overall response rate, OS: overall response, PFS: progression-free survival, PR: partial response, vgPR: very good partial response. * Did not significantly differ between patients with versus patients without risk factors † Data are digitized and should be interpreted with caution

©Institute for Clinical and Economic Review, 2021 Page 99 Final Report – Multiple Myeloma Return to Table of Contents
Table D3.7. Subgroup Efficacy Data: Ide-cel II
Trial CRB-40159 Extramedullary Disease Received Bridging Therapy High Cytogenetic Risk High Tumor Burden
Median Follow-Up 11.3 Months N (as-treated) 9 14 15 16
ORR, n (%); [95% CI] 8 (88.9); [51.8, 99.7] 14 (100); [76.8, 100] 11 (73.3); [44.9, 92.2) 12 (75.0); [47.6, 92.7] CR, n (%) 1 (11.1) 2 (14.3) 1 (6.7) 0 (0)
vgPR, n (%) 2 (22.2) 4 (28.6) 3 (20.0) 4 (25.0) PR, n (%) 2 (22.2) 1 (7.1) 1 (6.7) 1 (6.3)
Subgroup data not reported for the following outcomes: Probability of DOR ≥6, probability of PFS at 6 months, median DOR, median PFS, median OS, OS at 12 months
95% CI: 95% confidence interval, BCMA: B-cell maturation antigen, CR: complete response, DOR: duration of response, EMD: extramedullary disease, n: number, N: total number, NE: not estimable, NR: not reported, ORR: overall response rate, OS: overall response, PFS: progression-free survival, PR: partial response, vgPR: very good partial response

©Institute for Clinical and Economic Review, 2021 Page 100 Final Report – Multiple Myeloma Return to Table of Contents
Table D3.8. Subgroup Efficacy Data: Cilta-cel
Trial LEGEND-265,68 Xi'an
Subgroups BCMA Expression High Risk Complete Response
≥40% EMD Achieved Not Achieved Median Follow-Up 8 months 25 months
N (as-treated) 27/53 17 42 15 ORR, n (%); [95% CI] 22 (81.5); [NR] 14 (82.4); [NR] NR NR
CR, n (%) 17 (63.0) 10 (60.0)* NR NR vgPR, n (%) 1 (3.7) 2 (11.6)* NR NR
PR, n (%) 4 (14.8) 2 (11.6)* NR NR Median DOR, Months [95%CI] NR NR 29.1 [NR] NR Median PFS, Months [95%CI] 11 [6-NE] 8.1 [NR] 28.2 [19.9, NE] 3.2 [1.7, 6.4] Median OS, Months [95%CI] Not reached 13.9 [NR] Not reached [35.0, NE] 7.5 [3.8, 13.1]
OS at 12 Months, n (%) NR NR NR (92.9) NR Subgroup data not reported for the following outcomes: Probability of DOR ≥6, probability of PFS at 6 months, subgroup data for CARTITUDE-1 or LEGEND-2 (Changzheng, Ruijin, Jiangsu sites)
95% CI: 95% confidence interval, BCMA: B-cell maturation antigen, CR: complete response, DOR: duration of response, EMD: extramedullary disease, n: number, N: total number, NE: not estimable, NR: not reported, ORR: overall response rate, OS: overall response, PFS: progression-free survival, PR: partial response, VGPR: very good partial response * Data are digitized and should be interpreted with caution

©Institute for Clinical and Economic Review, 2021 Page 101 Final Report – Multiple Myeloma Return to Table of Contents
Table D3.9. Subgroup Efficacy Data: Belantamab
Trial DREAMM-217,34-36
Subgroups Prior Therapies High Risk Renal Impairment† Age Race / Ethnicity
3-6 Therapies
≥ 7 Therapies
High Risk Cytogenetics Mild Moderate 65 to < 75
years ≥75 years White Black
Median Follow-Up 12.4 Months 9 Months 9 Months 6.3 Months 6.3 Months N (ITT) 47 50 41 48 24 39 13 76 16
ORR, n (%); [95%CI]
16 (34.0); [19.3, 51.4]*
15 (30.0); [16.5, 46.6]*
11 (27.0); [14.2, 42.9]*
15 (31.3); [18.7, 46.3]
8 (33.3); [15.6, 55.3]
17 (43.6); [27.8, 60.4]
1 (7.7); [0.2, 36.0]
24 (31.6); [21.4, 43.3]‡
6 (37.5); [15.2, 64.6]§
vgPR, n (%) 8 (17.0) 10 (20.0) 9 (22.0) NR NR
NR NR
Median DOR, Months [95%CI]
11.0 [4.2, Not reached]
13.1 [4.0, Not reached]
Not reached [1.4, Not reached]
Not reached Not reached
Probability DOR ≥6 Months, % [95%CI] 63 [31, 83] 73 [44, 89] 52 [20, 77] NR NR
Median PFS, Months [95%CI] 2.9 [1.5, 5.7] 2.2 [1.2, 3.6] 2.1 [0.8, 3.7] 2.2
[2.1, 3.6]
3.7 [1.0, Not reached]
Probability of 6-Month PFS, % [95%CI] 35 [20, 50] 30 [17, 43] 30 [16, 45] NR NR
Median OS, Months [95%CI] NR NR 9.4
[4.3, 13.1] NR NR
Probability of 12-Month OS, % [95% CI] NR NR 45 [27, 61] NR NR
Subgroup data not reported for the following outcomes: CR, PR 95% CI: 95% confidence interval, ITT: Intention to treat, CR: complete response, DOR: duration of response, GFR: glomerular filtration rate, m2: meters squared, min: minute, mL: milliliter, n: number, N: total number, NR: not reported, ORR: overall response rate, OS: overall response, PFS: progression-free survival, PR: partial response, VGPR: very good partial response * 97.5% confidence interval † Mild renal impairment defined as GFR ≥60-<90 mL/min/1.73 m2, moderate renal impairment defined as GFR ≥30-<60 mL/min/1.73 m2 ‡ ORR at 13 months of follow-up was received as academic in confidence (REDACTED) § ORR at 13 months of follow-up was received as academic in confidence (REDACTED)

©Institute for Clinical and Economic Review, 2021 Page 102 Final Report – Multiple Myeloma Return to Table of Contents
Table D3.10. Patient Reported Outcomes: Ide-cel, Cilta-cel, Belantamab
Intervention Ide-cel (as-treated) Cilta-cel (as-treated) Belantamab (ITT) Trial KarMMa21 CARTITUDE-122 DREAMM-224,25
Arms (N) Overall (N=128) Overall (N=68) 2.5 mg/kg (N=97) Follow-Up Day 1 Month 9 Day 100 Day 184 Week 7 Week 13 Week 19 Week 25
EQ-5D-5L
Index
N 111 59
NR NR Improvement 33 (29.7) 32 (54.2)
No Change 57 (51.4) 22 (37.3) Deterioration 49 (44.1) 5 (8.5)
EQ VAS
N 111 59
NR NR Improvement 46 (41.4) 48 (81.3)
No Change 16 (14.4) 1 (1.8) Deterioration 49 (44.1) 10 (16.9)
EORTC QLQ-C30
N 110 59 47 30 46 29 19 19
Physical Functioning
Change from BL, Mean Score
(95%CI)
-1.2 (-4.3, 2.0)†
13.2 (7.9, 17.9)† NR NR 5.1
(0.5, 9.9)† 3.0
(-2.8, 8.7)† 0.3
(-6.3, 6.9)† -0.1
(-5.3, 5.3)†
Improvement‡ 40 (36.4) 35 (59.3) 34 (72.1) NR 13 (28.3) 8 (27.6) 3 (15.8) 4 (21.1) No Change 31 (28.2) 19 (32.2) NR NR NR NR NR NR
Deterioration 39 (35.5) 5 (8.5) NR NR NR NR NR NR
Cognitive Functioning
Change from BL, Mean Score
(95%CI)
0.8 (-3.1, 3.4)†
6.6 (2.7, 11.2)†
NR NR Improvement‡ 22 (20.0) 42 (71.2) No Change 38 (34.5) 10 (16.9)
Deterioration 50 (45.5) 7 (11.9)
Role Functioning
Change from BL, Mean Score
(95%CI) NR NR
NR
1.9 (-8.1, 11.9)†
7.3 (-5.7, 20.4)†
-4.4 (-19.3, 10.7)†
8.0 (-4.9, 20.7)†
Improvement‡ 23 (20.9) 34 (57.6) NR NR NR NR No Change 49 (44.5) 19 (32.2) NR NR NR NR
Deterioration 38 (34.5) 6 (10.2) NR NR NR NR

©Institute for Clinical and Economic Review, 2021 Page 103 Final Report – Multiple Myeloma Return to Table of Contents
Intervention Ide-cel (as-treated) Cilta-cel (as-treated) Belantamab (ITT) Trial KarMMa21 CARTITUDE-122 DREAMM-224,25
Arms (N) Overall (N=128) Overall (N=68) 2.5 mg/kg (N=97) Follow-Up Day 1 Month 9 Day 100 Day 184 Week 7 Week 13 Week 19 Week 25
Emotional Functioning
Improvement‡ 32 (29.1) 30 (50.8) NR NR No Change 34 (30.9) 17 (28.8)
Deterioration 44 (40.0) 12 (20.3)
Social Functioning
Improvement‡ 25 (22.7) 36 (61.0) NR NR No Change 42 (38.2) 16 (27.1)
Deterioration 43 (39.1) 7 (11.9)
Fatigue
Change from BL#, mean score
(95%CI)
7.7 (3.7, 11.4)†
-22.8 (-29.1, -17.1)†
-1.5 (-9.1, 5.1)†
-9.2 (-16.4, -2.0)†
-3.9 (-11.1, 2.5)†
-7.3 (-16.6, 1.8)†
-0.8 (-11.2, 10.6)†
3.6 (-7.6, 14.6)†
Improvement‡ 28 (25.5) 39 (66.1) NR (62.2) NR 21 (45.7) 12 (41.4) 6 (31.6) 6 (31.6) No Change 32 (28.8) 17 (28.8) NR NR NR NR NR NR
Deterioration 51 (46.4) 3 (5.1) NR NR NR NR NR NR
Pain
Change from BL#, mean score
(95%CI)
-8.7 (-13.0, 5.6)†
-23.8 (-30.2, -18.3)†
-8.9 (-16.6, NR)†
-8.9, (-17.6, -0.3)†
-4.7 (-13.0, 3.5)†
-4.4 (-14.4, 6.0)†
4.9 (-4.9, 14.2)†
2.6 (-6.5, 11.4)†
Improvement‡ 38 (34.5) 36 (61.0) 33 (71.1) NR 14 (30.4) 9 (31.0) 4 (21.1) 3 (15.8) No Change 48 (43.6) 17 (28.8) NR NR NR NR NR NR
Deterioration 24 (21.8) 6 (10.2) NR NR NR NR NR NR
Nausea/ Vomiting
Improvement‡ 7 (6.4) 15 (25.4) NR NR No Change 41 (37.3) 38 (64.4)
Deterioration 62 (56.4) 6 (10.2)
Constipation Improvement‡ 9 (8.2) 11 (18.6)
NR NR No Change 60 (54.5) 45 (76.3) Deterioration 41 (37.3) 3 (5.1)
Diarrhea Improvement‡ 17 (15.5) 13 (22.0)
NR NR No Change 76 (69.1) 44 (74.6) Deterioration 17 (15.5) 2 (3.4)
Insomnia Improvement‡ 20 (18.2) 24 (40.7) NR NR

©Institute for Clinical and Economic Review, 2021 Page 104 Final Report – Multiple Myeloma Return to Table of Contents
Intervention Ide-cel (as-treated) Cilta-cel (as-treated) Belantamab (ITT) Trial KarMMa21 CARTITUDE-122 DREAMM-224,25
Arms (N) Overall (N=128) Overall (N=68) 2.5 mg/kg (N=97) Follow-Up Day 1 Month 9 Day 100 Day 184 Week 7 Week 13 Week 19 Week 25
No Change 73 (66.4) 29 (49.2) Deterioration 17 (15.5) 6 (10.2)
Dyspnea Improvement‡ 24 (21.8) 17 (28.8)
NR NR No Change 77 (70.0) 37 (62.7) Deterioration 9 (8.2) 5 (8.5)
Appetite Loss
Improvement‡ 7 (6.4) 18 (30.5) NR NR No Change 47 (42.7) 35 (59.3)
Deterioration 56 (50.9) 6 (10.2)
Financial Difficulties
Improvement‡ 11 (10.0) 10 (16.9) NR NR No Change 79 (71.8) 40 (67.8)
Deterioration 20 (18.2) 9 (15.3)
Global Health / QoL
Change from BL, Mean Score
(95%CI)
-5.1 (-2.5, -7.7)†
15.4 (9.8, 20.9)† NR NR 0.4
(-5.7, 6.4)† -3.2
(-10.0, 3.8)† -2.3
(-8.9, 4.5)† -4.7
(-12.1, 2.8)†
Improvement‡ 23 (20.9) 24 (40.7) 24 (51.1) NR NR NR NR NR No Change 64 (58.2) 29 (49.2) NR NR NR NR NR NR
Deterioration 23 (20.9) 6 (10.2) NR NR NR NR NR NR
EORTC QLQ-MY20
N 109 57 47 NR 45 28 18 18
Disease Symptoms
Change from BL, Mean Score
(95%CI)
-1.14 (-3.4, 1.7)†
-20.00 (-14.3, -9.7)† NR NR -2.5
(-8.1, 3.8)† -0.8
(-7.2, 5.5)† 1.1.
(NR, 8.5)† 0.0
(-7.5, 7.5)†
Improvement‡ 15 (13.8) 25 (43.9) NR NR 17 (37.8) 8 (28.6) 5 (27.8) 6 (33.3) No Change 72 (66.1) 28 (49.1) NR NR NR NR NR NR
Deterioration 22 (20.2) 4 (7.0) NR NR NR NR NR NR
Future Perspectives
Improvement‡ 32 (29.4) 34 (59.6*) NR
0 (0) 0 (0) 0 (0) 0 (0) No Change 41 (37.6) 14 (24.6) NR NR NR NR
Deterioration 36 (33.0) 9 (15.8) NR NR NR NR Body Image Improvement‡ 13 (11.9) 17 (29.8) NR NR

©Institute for Clinical and Economic Review, 2021 Page 105 Final Report – Multiple Myeloma Return to Table of Contents
Intervention Ide-cel (as-treated) Cilta-cel (as-treated) Belantamab (ITT) Trial KarMMa21 CARTITUDE-122 DREAMM-224,25
Arms (N) Overall (N=128) Overall (N=68) 2.5 mg/kg (N=97) Follow-Up Day 1 Month 9 Day 100 Day 184 Week 7 Week 13 Week 19 Week 25
No Change 79 (72.5) 36 (63.2) Deterioration 17 (15.6) 4 (7.0)
Side Effects
Change from BL, Mean Score
(95%CI)
-0.57 (-5.14, -2.86)†
6.29 (3.43, 9.14)†
NR NR Improvement‡ 35 (32.1) 3 (5.3) No Change 62 (56.9) 37 (64.9)
Deterioration 12 (11.0) 17 (29.8)
OSDI
N NR NR 92 NR
Vision-related
Functioning Domain
Change from BL, Mean Score
(95%CI)
NR NR
NR
NR Deterioration from Baseline 46 (49.5)§
Improvement from Worst
Severity post-BL 33 (72.0)
No Change NR Patient reported outcomes not reported for the following trails: CRB-401, LEGEND-2
95% CI: 95% confidence interval, ITT: Intention to treat, EORTC: European Organization for Research and Treatment of Cancer, EQ-5D-5L: EuroQol 5 dimensions 5 levels, kg: kilogram, mg: milligram, MY20: Myeloma Module questionnaire, n: number, N: total number, NR: not reported, OSDI: Ocular Surface Disease Index, QoL: quality of life, QLQ-C30: Quality of Life C30 questionnaire, VAS: visual analog scale * Statistically significant improvement, p<0.05 † Data are digitized and should be interpreted with caution ‡ Change of ≥10 points § Change of ≥12.5-points # Negative changes indicate a reduction in pain or fatigue

©Institute for Clinical and Economic Review, 2021 Page 106 Final Report – Multiple Myeloma Return to Table of Contents
Table D3.11. Safety Outcomes: Ide-cel
Trial KarMMa10,11,28 CRB-40159,67
Arms 150x106 CAR+ T cells/kg
300 x106 CAR+ T cells/kg
450 x106 CAR+ T cells/kg
Overall 150 x106 CAR+ T cells/kg
450 x106 CAR+ T cells/kg
Overall
N (as-treated) 4 70 54 128 18 38 62†
Any AEs n (%) Overall
NR 128 (100)
NR 33/33 (100)
Grade 3/4 127 (99.2) 32/33 (96.7) Treatment-related SAEs, n (%) NR NR
Mortality, n (%)#
Overall 2 (50.0) 27 (38.6) 15 (27.8) 44 (34.4)
NR
6 (10.0) Disease Progression 2 (50.0) 18 (25.7) 7 (13.0) 27 (21.1) NR
AEs 0 (0) 5 (7.1) 4 (7.4) 9 (7.0) NR Other 0 (0) 3 (4.3) 4 (7.4) 7 (5.5) NR
Hospitalizations, n (%)
ICU§
NR
19/107 (17.8)
NR NR Mean Length of Stay, Days (Range) NR (6-30)
Study Discontinuation
prior to Treatment, n (%)
Overall
NR
12 (9.4)
NR
3/36 (8.3)
Death 2 (1.6) 0/36 (0) Disease Progression 1 (0.8) 3/36 (8.3)
Adverse Event 1 (0.8) 0/36 (0) Patient Withdrawal 4 (3.1) 0/36 (0)
Manufacturing Failure 1 (0.8) 0/36 (0)
Discontinuation, n (%)
Overall
NR
66 (51.6)‡
NR
49 (79.0) Death 41 (32.0) 6 (10.0)
Disease Progression 23 (18.0) 36 (58.0) Patient Withdrawal 2 (1.6) 6 (10.0)
CRS, n (%)
Median Onset, Days (Range) 7 (2-12) 2 (1-12) 1 (1-10) 1 (1-12) NR NR 2 (1-25); N=33 Median Duration, Days (Range) 5 (3-7) 4 (2-28) 7 (1-63) 5 (1-63) NR NR 5 (1-32); N=33
Overall 2 (50.0) 53 (75.7) 52 (96.3) 107 (83.6) 7 (11.3) 35 (92.1) 47 (76.0) Grade 1 1 (25.0) 33 (47.1) 27 (50.0) 61 (47.7) NR NR 43 (69.3)

©Institute for Clinical and Economic Review, 2021 Page 107 Final Report – Multiple Myeloma Return to Table of Contents
Trial KarMMa10,11,28 CRB-40159,67
Arms 150x106 CAR+ T cells/kg
300 x106 CAR+ T cells/kg
450 x106 CAR+ T cells/kg
Overall 150 x106 CAR+ T cells/kg
450 x106 CAR+ T cells/kg
Overall
Grade 2 1 (25.0) 16 (22.9) 22 (40.7) 39 (30.5) NR NR Grade 3 0 (0) 2 (2.9) 3 (4.3) 5 (3.9) 0 (0) 3 (7.9) 4 (6.5) Grade 4 0 (0) 1 (1.4) 0 (0) 1 (0.8) 0 (0) 0 (0) 0 (0) Grade 5 0 (0) 1 (1.4) 0 (0) 1 (0.8) 0 (0) 0 (0) 0 (0)
Progression from Grade 1 to ≥2 NR NR NR 30 (65.2)* NR NR NR
Required Tocilizumab for
CRS, n (%)
Overall 1 (25.0) 30 (42.8) 36 (66.7) 67 (52.3) NR
7/33 (21.2) 1 Dose 1 (25.0) 21 (30.0) 22 (40.7) 44 (34.3) NR
≥1 Dose 0 (0) 9 (12.9) 14 (25.9) 23 (18.0) NR
Neurotoxicity, n (%)
Median Onset, Days (Range) N/A 3 (1-10) 2 (1−5) 2 (1−10) NR NR NR Median Duration, Days (Range) N/A 3 (2−26) 5 (1−22) 3 (1−26) NR NR NR
Overall 0 (0) 12 (17.1) 11 (20.4) 23 (18.0) 5 (27.8) 20 (52.6) 27 (43.5) Grade 1 0 (0) 7 (10.0) 5 (9.3) 12 (9.4) NR NR
25 (39.1) Grade 2 0 (0) 4 (5.7) 3 (5.6) 7 (5.5) NR NR Grade 3 0 (0) 1 (1.4) 3 (5.6) 4 (3.1) 0 (0) 2 (5.3) 1 (1.6) Grade 4 0 (0) 0 (0) 0 (0) 0 (0) NR NR 1 (1.6) Grade 5 0 (0) 0 (0) 0(0) 0 (0) 0 (0) 0 (0) 0 (0)
Cytopenia, n (%) Overall 4 (100) 67 (95.7) 53 (98.1) 124 (97.0)
NR
NR ≥Grade 3 NR NR NR NR NR
Neutropenia, n (%) Overall 4 (100) 66 (94.3) 51 (94.4) 117 (91.4) 57 (92.0)
≥Grade 3 NR NR NR 114 (89.1) 55 (89.0)
Anemia, n (%) Overall 4 (100) 51 (72.9) 34 (63.0) 89 (69.5) 47 (76.0)
≥Grade 3 NR NR NR 77 (60.2) 35 (57.0)
Thrombocytopenia, n (%)
Overall 4 (100) 45 (64.3) 35 (64.8) 81 (63.3) 46 (74.0) ≥Grade 3 NR NR NR 67 (52.3) 35 (57.0)
Infections, n (%) Overall 3 (75.0) 47 (67.1) 38 (70.4) 88 (68.8) 14/33 (42.4)
≥Grade 3 NR NR NR 28 (21.9) 2/33 (6.1)

©Institute for Clinical and Economic Review, 2021 Page 108 Final Report – Multiple Myeloma Return to Table of Contents
Trial KarMMa10,11,28 CRB-40159,67
Arms 150x106 CAR+ T cells/kg
300 x106 CAR+ T cells/kg
450 x106 CAR+ T cells/kg
Overall 150 x106 CAR+ T cells/kg
450 x106 CAR+ T cells/kg
Overall
Data not reported for the following safety outcomes: Any SAEs, treatment-related AEs, discontinuation due to AE and lack of efficacy, bone disease, hypercalcemia, hyper viscosity, renal failure, thrombosis, corneal events
AE: adverse event, CAR+: chimeric antigen receptor positive, CRS: cytokine release syndrome, ICU: intensive care unit, kg: kilogram, mg: milligram, n: number, N: total number, N/A: not applicable, NR: not reported, SAE: serious adverse event. * Patients categorized as having Grade ≥2 CRS † N of 62 represents the entire treated CRB-401 population, N of 33 represents the first 33 patients to received Ide-cel treatment within the population ‡ includes 18 patients who were retreated # Up to 24 months of follow-up for KarMMa § due to CRS with or without neurologic event

©Institute for Clinical and Economic Review, 2021 Page 109 Final Report – Multiple Myeloma Return to Table of Contents
Table D3.12. Safety Outcomes: Cilta-cel
Trial CARTITUDE-120 LEGEND-261,65,66 Xi'an
LEGEND-213,65,72 Changzheng, Ruijin, Jiangsu
Arms 0.71x10⁶ CAR+ T cells/kg 0.5x10⁶ CAR+ T cells/kg 0.7x10⁶ CAR+ T cells/kg N (as-treated) 97 57 17 Any AE, n (%) 97 (100) 57 (100)
NR Treatment-related AE, n (%) NR NR
Any SAEs, n (%) NR 37 (64.9)* Treatment-related SAEs, n (%) NR NR
Mortality, n (%)
Overall 14 (14.4) 17 (29.8)
NR Disease Progression 5 (5.2) 14 (24.6)
AEs 9 (9.3) 2 (3.5) Other NR 1 (1.8)
Study Discontinuation
Prior to Treatment, n (%)
Overall 16/113 (14.2)
NR NR Death 9/113 (8.0)
Disease Progression 2/113 (1.8) Patient Withdrawal 5/113 (4.4)
Manufacturing Failure 0 (0)
Discontinuation, n (%)
Overall 14 (14.4) NR
NR Death 14 (14.4) 17 (29.8)
Disease Progression NR NR AEs NR NR
Lack of Efficacy NR NR
CRS, n (%)
Median Onset, Days (Range) 7 (1-12) 9 (1-19) NR
Median Duration, Days (Range) 4 (1-97) 9 (3-57) NR
Overall 92 (94.8) 51 (89.5) 17 (100) Grade 1 49 (50.5) 27 (47.4)
10 (58.8) Grade 2 38 (39.2) 20 (35.1) Grade 3 3 (3.1) 4 (7.0) 6 (35.3)

©Institute for Clinical and Economic Review, 2021 Page 110 Final Report – Multiple Myeloma Return to Table of Contents
Trial CARTITUDE-120 LEGEND-261,65,66 Xi'an
LEGEND-213,65,72 Changzheng, Ruijin, Jiangsu
Arms 0.71x10⁶ CAR+ T cells/kg 0.5x10⁶ CAR+ T cells/kg 0.7x10⁶ CAR+ T cells/kg Grade 4 1 (1.0) 0 (0) 0 (0) Grade 5 1 (1.0) 0 (0) 1 (5.9)
Progression from Grade 1 to ≥ 2 NR NR NR
Required tocilizumab, n (%) 67 (69.1) 26 (45.6)† 9 (52.9)
Neurotoxicity, n (%)
Overall 20 (20.6) 1 (1.8)
0 (0)
Grade 1 10 (10.3) 1 (1.8)
Grade 2 Grade 3
9 (9.3) 0 (0) Grade 4
Grade 5 1 (1.0)
Cytopenia, n (%) Overall NR NR 14 (82.4)
≥Grade 3 NR NR 10 (58.8)
Neutropenia, n (%) Overall 93 (95.9) NR NR
≥Grade 3 92 (94.8) NR NR
Anemia, n (%) Overall 79 (81.4) 17 (29.8)
NR ≥Grade 3 66 (68.0) 10 (17.5)
Thrombocytopenia, n (%)
Overall 77 (79.4) 28 (49.1) NR
≥ Grade 3 58 (59.8) 13 (22.8)
Infections, n (%) Overall 56 (57.7)
NR NR ≥ Grade 3 19 (19.6)
Data not reported for the following safety outcomes: Hospitalizations, bone disease, thrombosis, renal failure, hyper viscosity, hypercalcemia AE: adverse event, CAR+: chimeric antigen receptor positive, CRS: cytokine release syndrome, kg: kilogram, n: number, N: total number, N/A: not available, NR: not reported, SAE: serious adverse events, SE: standard error * Grade ≥3 AEs † Median 8-month follow up time

©Institute for Clinical and Economic Review, 2021 Page 111 Final Report – Multiple Myeloma Return to Table of Contents
Table D3.13. Safety Outcomes: Belantamab
Trial DREAMM-217,18,23 Arms Belantamab 2.5 mg/kg
N (Safety Population) 95 Any AE, n (%) 93 (97.9)
Treatment-related AEs, n (%) 84 (88.4) Any SAEs, n (%) 40 (42.1)
Treatment-related SAEs, n (%) 11 (11.6)
Mortality, n (%)
Overall 31 (32.6)† Disease Progression 25 (26.3)†
AEs 3 (3.2) Other 3 (3.2)†
Discontinuation, n (%)
Overall 73 (76.8)† Death 31 (32.6)†
Disease Progression 59 (60.8)† AEs 9 (9.5)
Corneal Events 3 (3.2) Lack of Efficacy 1 (1.1)†
CRS, n (%) 0 (0) Neurotoxicity, n (%) 0 (0)
Infections, n (%) 1 (1.1)*† Renal Failure, n (%) 1 (1.1)†
Hyper viscosity, n (%) 0 (0)†
Hypercalcemia, n (%) Overall 13 (13.7)†
≥Grade 3 7 (7.4)
Neutropenia, n (%) Overall 13 (13.7)†
≥Grade 3 9 (9.3)
Anemia, n (%) Overall 23 (24.2)†
≥Grade 3 20 (21.1)
Thrombocytopenia, n (%) Overall 36 (37.9)
≥ Grade 3 21 (22.1)

©Institute for Clinical and Economic Review, 2021 Page 112 Final Report – Multiple Myeloma Return to Table of Contents
Trial DREAMM-217,18,23 Arms Belantamab 2.5 mg/kg
Keratopathy (MECs), n (%)
Overall 68 (71.6) Grade 1 8 (8.4) Grade 2 16 (16.8) Grade 3 43 (45.3) Grade 4 1 (1.1)
Keratopathy (MECs) Grade ≥2, n (%)
Median Time to Onset, Days (Range) 37.0 (19.0-143.0) Median Duration, Days (Range) 86.5 (8.0-358.0)
Recovered‡ from First Occurrence, n (%) 46/60 (76.7)§ Blurred Vision, n (%) 24 (25.3)
Dry Eye, n (%) 14 (14.7) Permanent Vision Loss, n (%) 0 (0)
Changes in BCVA
Overall, n (%) 51 (53.7) Grade 1 7 (7.4) Grade 2 15 (15.8) Grade 3 28 (29.5) Grade 4 1 (1.1)
Median Time to Onset, Days (Range) 64.0 (20–213) Median Duration, Days (Range) 33.0 (8–127)
Recovered from First Occurrence, n (%)§ 34/44 (77)
Clinically Meaningful Changes in BCVA (BCVA of
20/50 or worse in the better-seeing eye)
Overall, n (%) 17 (17.9) Median Time to Onset, Days (Range) 66.0 (20-442)
Median Time to Resolution¤, Days (Range) 21.5 (7–64); N=14 Not recovered as of last follow-up, n (%) 3/17 (17.6)
Clinically Meaningful Changes in BCVA (BCVA of
20/200 or worse in the better-seeing eye)
Overall, n (%) 1 (1.1) Median Time to Onset, Days (Range) 21.0 (21–21)
Median Time to Resolution¤, Days (Range) 22.0 (22–22); N=1 Not Recovered as of Last Follow-up, n (%) 0 (0)
Data not reported for the following safety outcomes: Hospitalizations, bone disease, thrombosis, cytopenia

©Institute for Clinical and Economic Review, 2021 Page 113 Final Report – Multiple Myeloma Return to Table of Contents
AE: adverse event, BCVA: best corrected visual acuity, CAR+: chimeric antigen receptor positive, CRS: cytokine release syndrome, kg: kilogram, MECs: Microcyst-like epithelial changes, mg: milligram, n: number, N: total number, N/A: not available, NR: not reported, SAE: serious adverse events, SE: standard error. * Viral infection † 6.3-month follow up time ‡ Any Grade 1 eye exam findings/no exam findings § Data for Grade ≥2 events per the keratopathy and visual acuity (KVA) scale ¤ in patients who recovered as of last follow-up
Table D3.14. Subgroup Safety Data: Ide-cel
Trial KarMMa32 CRB-40159
Subgroups Elderly Patients Elderly Patients High Risk
≥ 65 years ≥ 70 years ≥ 65 years Bridging Therapy High Tumor Burden Median Follow-Up 11.3 Months 11.3 Months
N 45 20 11 14 16
CRS, n (%) Overall 40 (88.9) 20 (100) 9 (82.0) 11 (79.0) 12 (75.0)
Grade ≥3 2 (4.4) 2 (10.0) NR NR NR
Neurotoxicity, n (%)
Overall 11 (24.4) 6 (30.0) NR NR NR Grade ≥3 4 (8.9) 1 (5.0) NR NR NR
Subgroup data not reported for the following outcomes: Any adverse events, any serious adverse events, keratopathy, dry eye, blurred vision, thrombocytopenia, anemia; Subgroup safety data not available for the following: KarMMa high risk subgroups, CARTITUDE-1, LEGEND-2
CRS: cytokine release syndrome, n: number, N: total number, NR: not reported, SAE: serious adverse event

©Institute for Clinical and Economic Review, 2021 Page 114 Final Report – Multiple Myeloma Return to Table of Contents
Table D3.15. Subgroup Safety Data: Belantamab
Trial DREAMM-234-36
Subgroups Prior Therapies High Risk Renal Impairment*
3-6 Therapies ≥ 7 Therapies High Risk Cytogenetics Mild Moderate
N 47 50 41 48 24 Median Follow-Up 12.4 Months 9 Months 9 Months
Any SAEs, n (%) NR 19 (46.3) 16 (33.3) 12 (50.0)
Keratopathy Overall NR NR 24 (58.5) 33 (68.8) 15 (62.5)
Grade ≥3 16 (33.0) 14 (27.0) NR 12 (25.0) 8 (33.3) Dry eye Overall NR NR 5 (12.2) 9 (18.8) 1 (4.2)
Blurred Vision Overall NR NR 8 (19.5) 10 (20.8) 4 (1.7)
Thrombocytopenia Overall NR NR 17 (41.5) 11 (22.9) 6 (25.0)
Grade ≥3 8 (17.0) 10 (20.0) NR 9 (18.8) 6 (25.0)
Anemia Overall NR NR 10 (24.4) 13 (27.1) 7 (29.2)
Grade ≥3 5 (11.0) 16 (31.0) NR 9 (18.8) 6 (25.0) Subgroup data not reported for the following: Any adverse events, cytokine release syndrome, neurotoxicity, grade ≥3 dry eye, grade ≥3 blurred vision
GFR: glomerular filtration rate, m2: meters squared, min: minute, mL: milliliter, n: number, N: total number, NR: not reported, NT: neurotoxicity, SAEs: serious adverse events * Mild renal impairment defined as GFR ≥60-<90 mL/min/1.73 m2, moderate renal impairment defined as GFR ≥30-<60 mL/min/1.73 m2

©Institute for Clinical and Economic Review, 2021 Page 115 Final Report – Multiple Myeloma Return to Table of Contents
Table D3.16. Secondary Analyses: Ide-cel
Source Rodriguez-Otero EHA 202073 Jagannath ASCO 202074 Shah ASH 202044
Trials KarMMa vs. DREAMM-2 KarMMa vs. KarMMa Real World* KarMMa vs. MAMMOTH
Arms KarMMa (N=128)
DREAMM-2 2.5 mg/kg
(N=97)
KarMMa (N=128)
RW EC (N=190) Ide-cel (ESS=67)
Ide-cel 450x106 CAR+ T
cells/kg (ESS=33) Median Follow Up, Months 13.3 Study level 11.3 10.2 13.3
Baseline
Age, Median Years 61 (33-78) 65 61 64
NR
Male, n (%) 76 (59.4) 51 (52.6) 76 (59.4) NR Extramedullary Disease, n
(%) 50 (39.1) 22 (22.7) 50 (39.1) NR
ISS stage 3, n (%) 21 (16.4) 42 (43.3) 21 (16.4) 8 (4) Median Prior Regimens
Received (Range) 6 (3-16) 7 (3-21) 6 (3-16) 5 (NR)
High-risk Cytogenetics, n (%) 45 (35.2) 41 (42.3) 45 (35.2) 57 (30.0)
Prior Therapies Received,
n (%)
Bortezomib NR 95 (97.9)
NR NR
Carfilzomib NR 74 (76.3) Lenalidomide NR 97 (100) Pomalidomide NR 89 (91.8) Daratumumab NR 97 (100)
Isatuximab NR 3 (3.1) Triple-refractory, n (%) 108 (84.0) 97 (100) 108 (84.0) 82 (43.0) NR
Efficacy Outcomes
ORR, OR (95%CI) 5.12 (2.35, 11.13) RR: 2.4 (1.7, 3.3), p<0.0001 5.11 (2.92, 8.94), p<0.001 6.96 (2.94, 16.49)
vgPR, RR (95%CI) NR 4.2 (2.4, 7.2), p<0.0001 NR NR
PFS, HR (95%CI) 0.45 (0.27,0.76) 0.48 (0.33, 0.69), p<0.0001 0.55 (0.42, 0.73), p<0.001 0.37 (0.23, 0.57)
OS, HR (95%CI) 0.36 (0.15, 0.86) NR 0.36 (0.24, 0.54), p<0.001
0.35 (0.18, 0.67), p=0.002
Data not reported for safety outcomes

©Institute for Clinical and Economic Review, 2021 Page 116 Final Report – Multiple Myeloma Return to Table of Contents
95% CI: 95% confidence interval, AE: adverse event, CAR+: chimeric antigen receptor positive, ESS: effective sample size, HR: hazard ratio, kg: kilogram, mg: milligram, n: number, N: total number, NR: not reported, OR: odds ratio, ORR: overall response rate, PFS: progression-free survival, RR: risk ratio, SAE: serious adverse events, vgPR: very good partial response * Real world patients meeting KarMMa eligibility criteria (noninterventional, retrospective study (KarMMa-RW), patient-level data from clinical sites) Table D3.17. Secondary Analyses: Belantamab
Source Trudel EHA 202063 Shragai EHA 202064 Trials Pooled DREAMM-1 and DREAMM-2 Real World
Arms Belantamab 2.5mg/kg (N=103) Belantamab 2.5 and 3.4 mg/kg (N=32)
Median Follow Up, Months NR 5.7 (0.5-13.8)
Baseline
Age, median years 65.0 (39.0-85.0) 69.6 (49-88) Male, n (%) 52 (50.5) 19 (59.4)
Extramedullary Disease, n (%) 21 (20.4) NR ISS Stage 3, n (%) 41 (39.8) NR
Median Prior Regimens (Range) 7 (3-21) 6 (3-11) High-risk Cytogenetics, n (%) 28 (27.2) 7 (21.9)
Prior Therapies Received, n (%)
Bortezomib
NR
30 (93.8) Carfilzomib 25 (78.1)
Lenalidomide 29 (90.6) Pomalidomide 28 (87.5) Daratumumab 31 (96.9)
Isatuximab 6 (18.8) Triple refractory, n (%) NR NR
Efficacy Outcomes
ORR, OR (95%CI)
NR
n/N (%): 12/29 (41.4) vgPR, RR (95%CI) n/N (%): 8/29 (27.6)
Median PFS, months (95%CI) 2.6 (NR) OS at 6 months, n (%) 22 (68.0)
Safety Outcomes,
n (%)
Any AEs 101 (98.1) NR Treatment related AEs 91 (88.3)
Any SAEs 42 (40.8)

©Institute for Clinical and Economic Review, 2021 Page 117 Final Report – Multiple Myeloma Return to Table of Contents
Source Trudel EHA 202063 Shragai EHA 202064 Trials Pooled DREAMM-1 and DREAMM-2 Real World
Arms Belantamab 2.5mg/kg (N=103) Belantamab 2.5 and 3.4 mg/kg (N=32)
Treatment-related SAEs 13 (12.6) Fatal Treatment-related SAEs 1 (0.9)
Anemia Overall 27 (26.2)
NR Grade ≥3 19 (18.4)
Thrombo-cytopenia
Overall 24 (23.3) 7/23 (30.4) ≥ Grade 3 18 (17.5) 3/23 (13.0)
Keratopathy Overall 68 (66.0) 20/31 (64.5)
≥ Grade 3 28 (27.2) 8/31 (25.8)
Blurred Vision Overall 20 (19.4)
NR ≥ Grade 3 4 (3.9)
Dry Eye Overall 12 (11.7)
NR ≥ Grade 3 0 (0)
AE: adverse event, CAR+: chimeric antigen receptor positive, ESS: effective sample size, HR: hazard ratio, kg: kilogram, mg: milligram, n: number, N: total number, NR: not reported, OR: odds ratio, ORR: overall response rate, PFS: progression-free survival, RR: risk ratio, SAE: serious adverse events, VGPR: very good partial response

©Institute for Clinical and Economic Review, 2021 Page 118 Final Report – Multiple Myeloma Return to Table of Contents
Usual Care Regimens
Table D3.18. Study Design: Usual Care Regimens
Trial/Study Design Patient Characteristics MAMMOTH7 Retrospective cohort study
N = 275
− Diagnosis of active MM − Refractory to daratumumab or isatuximab (administered alone or in combination) − Treatment for at least 4 weeks with a CD38 MoAB-containing treatment regimen and
with evidence of progressive disease Mehra 202027 Real-world treatment
patterns; Flatiron Health electronic health records N =251
− MM diagnosis − Received at least 3 lines of therapy (including at least one PI, one IMiD, and an anti-
CD38 MoAB)
Goldsmith 202026 Single-center, retrospective cohort study N = 58
− Quad/Penta-refractory MM − Received at least one cycle of bendamustine/prednisone (BP) and/or dexamethasone,
cyclophosphamide, etoposide, and cisplatin (DCEP)
IMiD: immunomodulatory drug, MM: multiple myeloma, MoAB: monoclonal antibody, N: total number, PI: protease inhibitor

©Institute for Clinical and Economic Review, 2021 Page 119 Final Report – Multiple Myeloma Return to Table of Contents
Table D3.19. Baseline Characteristics: Usual Care Regimens
Trial/Study MAMMOTH7 Mehra 202027 Goldsmith 202026
Arms Overall Triple/Quad-refractory Penta-refractory Triple-refractory BP DCEP
N 275 148 70 251 27 31 Median Follow-Up, Months
(Range) 10.6 (1.9-42.3) 6.0 (IQR: 2.7-10.8) NR
Age, Median Years (Range) 65.0 (27.0–90.0) 60.0 (23.0–85.0) 58.5 (35.0–76.0) 67.9 (IQR: 61.3-75.7) 61 (38-85) 60 (38-73)
Male, n (%) 152 (55.3) 85 (57.4) 39 (55.7) 136 (54.2) 12 (44.4) 15 (48.4)
Race/Ethnicity, n (%)
White 202 (73.5) 116 (78.4) 47 (67.1) 173 (68.9) 23 (85.2) 27 (87.1) Black 45 (16.4) 19 (12.8) 13 (18.6) 38 (15.1) 4 (14.8) 3 (9.7)
Hispanic 6 (2.2) 1 (0.7) 2 (2.9) 30 (12.0) 0 (0) 1 (3.2)
Other 22 (8.0) 12 (8.1) 8 (11.4) Median Time since Diagnosis,
Years (Range) 4.5 (0.4–19.4) 4.4 (0.4–19.4) 5.7 (0.6–14.4) 44.8 (IQR: 28.0, 62.4) 4.7 (1.1-23.1) 4.5 (1.1-2.32)
High Risk Cytogenetics, n (%) 80 (29.1) 42 (28.4) 25 (35.7) 62 (24.7) NR NR Renal Function†, n (%) 22 (8.0) 11 (7.4) 5 (7.1) NR NR NR
ISS Disease Stage, n (%)
Stage 1 69 (25.1) 40 (27.0) 17 (24.3) 49 (19.5) 4 (14.8) 9 (29.0) Stage 2 84 (30.5) 40 (27.0) 24 (34.3) 59 (23.5) 9 (33.3) 12 (38.7) Stage 3 80 (29.1) 47 (31.8) 13 (18.6) 62 (24.7) 7 (25.9) 5 (16.1)
ECOG Performance
Status
Grade 0 NR
134 (53.4) NR Grade 1
Grade 2 N/A Received autologous SCT, n (%) 198 (72.0) 104 (70.3) 47 (67.1) 141 (56.2)* 22 (81.5) 28 (90.3)
Median Prior Regimens, n (Range) 4 (1–16) 4 (1–11) 5 (2–16) 4 (IQR: 3, 6) 6 (4-15) 8 (4-15)
Penta-exposed, n (%) 157 (57.1) 70 (47.3) 70 (100) 117 (46.6) NR NR Quad-refractory, n (%) NR NR 0 (0) NR 5 (18.5) 8 (25.8) Penta-refractory, n (%) 70 (25.4) 0 (0) 70 (100) 73 (29.1) 22 (81.5) 23 (74.2)
Exposed, n (%)
Daratumumab at least 256 (93.1) at least 138 (93.2) at least 68 (97.1) 251 (100) NR NR Lenalidomide 270 (98.2) 146 (98.6) 70 (100) 244 (97.2) 27 (100) 31 (100)

©Institute for Clinical and Economic Review, 2021 Page 120 Final Report – Multiple Myeloma Return to Table of Contents
Trial/Study MAMMOTH7 Mehra 202027 Goldsmith 202026
Arms Overall Triple/Quad-refractory Penta-refractory Triple-refractory BP DCEP
Bortezomib 271 (98.6) 146 (98.6) 69 (98.6) 226 (90.0) 27 (100) 31 (100) Pomalidomide 189 (68.7) 91 (61.5) 69 (98.6) 173 (68.9) 27 (100) 31 (100)
Carfilzomib 178 (64.8) 85 (57.4) 68 (97.1) 145 (57.8) 27 (100) 31 (100) Elotuzumab NR NR NR 24 (9.6) NR NR
Ixazomib 38 (13.9) 24 (16.2) 12 (17.1) NR NR NR Thalidomide 55 (20.0) 26 (17.6) 23 (32.9) NR NR NR
Refractory, n (%)
Daratumumab 256 (93.1) 138 (93.2) 68 (97.1)
NR
22 (81.5) 23 (74.2) Lenalidomide 211 (76.7) 117 (79.1) 69 (98.6) 27 (100) 31 (100) Bortezomib 188 (68.4) 107 (72.3) 68 (97.1) 27 (100) 31 (100)
Pomalidomide 179 (65.1) 87 (58.8) 69 (98.6) 27 (100) 31 (100) Carfilzomib 130 (47.3) 57 (38.5) 67 (95.7) 27 (100) 31 (100) Elotuzumab NR NR NR NR NR
Ixazomib 34 (12.4) 23 (15.5) 10 (14.3) NR NR Thalidomide 23 (8.4) 6 (4.1) 14 (20.0) NR NR
Data not reported on the following baseline characteristics: Height, weight BP: bendamustine/prednisone, DCEP: dexamethasone, cyclophosphamide, etoposide, and cisplatin, dL: deciliter, ECOG: Eastern Cooperative Oncology Group, IQR: interquartile range, mg: milligram, n: number, N: total number, N/A: not available, NR: not reported, SCT: stem cell transplant. * Type of SCT not specified. † Creatinine > 2mg/dL

©Institute for Clinical and Economic Review, 2021 Page 121 Final Report – Multiple Myeloma Return to Table of Contents
Table D3.20. Efficacy Outcomes: Usual Care Regimens I
Trial MAMMOTH7 Arms Overall Triple/Quad-refractory Penta-refractory
N 275 148 70 Median Follow-Up, Months (Range) 10.6 (1.9-42.3)
Median PFS, Months (95%CI or HR)
Overall NR
NR NR
Received ≥ 1 Subsequent LOT† 3.4 (2.8, 4.0)
LOT1†
Carfilzomib-based 4.2 (HR 0.60, p=0.004); [N=68] Carfilzomib + alkylator 5.7 (1.6-9.7); [N=19] Daratumumab + IMiD 4.5 (2.8-6.3); [N=41]
Elotuzumab + IMiD 2.6 (1.1-4.1); [N=19]
Median OS, Months (95%CI)
Overall 8.6 (7.2, 9.9) 9.2 (7.1, 11.2) 5.6 (3.5, 7.8) High-Risk Cytogenetics 5.6,(NR) p=0.025‡; [N=80]
NR NR
Impaired Renal Function* 3.7 (NR) p=0.031; [N=22] Received ≥ 1 subsequent LOT 9.31 (8.1, 10.6)
LOT1†
Carfilzomib-based 10.9 (9.5-12.4); [N=68] Carfilzomib + alkylator 12.7 (5.9-19.5); [N=19] Daratumumab + IMiD 12.6 (8.5-16.6); [N=41]
Elotuzumab + IMiD 8.3 (1.9-14.6); [N=19]
ORR, n (%)
Overall 116/249 (46.6) NR NR High-Risk Cytogenetics OR=0.14 (95%CI: 0.03, 0.65) NR NR
LOT1†
Overall 78/249 (31.0) 57/197 (29) 19/63 (30) Carfilzomib-based 22/68 (32.4)
NR NR
Carfilzomib + alkylator 9/19 (47.0) Daratumumab + IMiD 15/41 (36.6)
Elotuzumab + IMiD 4/19 (21.1) LOT2† 34/158 (21.5) LOT3† 22/87 (25.3)
ORR after LOT1† sCR/CR, n (%) 5/249 (2.0)
NR NR vgPR, n (%) 22/249 (8.8)

©Institute for Clinical and Economic Review, 2021 Page 122 Final Report – Multiple Myeloma Return to Table of Contents
Trial MAMMOTH7 Arms Overall Triple/Quad-refractory Penta-refractory
PR, n (%) 51/249 (20.5) Progressive Disease, n (%) 77 (28.0) 38 (25.7) 27 (38.6)
Patients Receiving Treatment After
Becoming anti-CD38 MoAB Refractory
N 249 134 63 Median LOT received, n (range) 2 (1-10) NR NR
Carfilzomib-based Treatment, n (%) 68 (27.3) 43 (32.1) 8 (12.7) Elotuzumab-based Treatments, n (%) 19 (7.6) NR NR
Daratumumab-based Treatments, n (%) 57 (22.9) 49 (36.6) 9 (50.9) Data not reported for the following efficacy outcomes: LOT received (Pomalidomide-based, Bortezomib-based, Lenalidomide-based, Ixazomib-based, Thalidomide-based, Monotherapy, Doublet regimen, Triplet regimens)
95% CI: 95% confidence interval, CR: complete response, HR: hazard ratio, IMiD: immunomodulatory drug, LOT: line of therapy (after becoming CD38 MoAB refractory), MoAB: monoclonal antibody, n: number, N: total number, NR: not reported, OR: odds ratio, ORR: overall response rate, OS: overall survival, PFS: progression-free survival, PR: partial response, sCR: stringent complete response, vgPR: very good partial response, * Creatinine > 2mg/dl. † First (LOT1), second (LOT2), or third (LOT3) line of therapy after becoming CD38 MoAB refractory. ‡ Versus standard risk.

©Institute for Clinical and Economic Review, 2021 Page 123 Final Report – Multiple Myeloma Return to Table of Contents
Table D3.21. Efficacy Outcomes: Usual Care Regimens II
Study Mehra 202027 Goldsmith 202026 Arms Overall LOT1* LOT2* LOT3* BP DCEP
N 251 251 138 54 27 31 Median Follow-Up, Months (Range) 6.0 (IQR: 2.7-10.8) NR
Median PFS, Months (95%CI) 4.8 (3.7, 6.1) NR NR NR 1.4 (1.1-1.6) 2.7 (1.5-3.8) Median OS, Months (95%CI) 11.0 (8.7, 13.6) NR NR NR 8.7 (2.3-15.0) 6.2 (4.4-7.8)
ORR, n (%) NR NR NR NR 7 (25.9) 11 (35.5)
ORR after First Subsequent
Line
sCR/CR, n (%) NR
CR: 0 (0) CR: 1 (3.2) vgPR, n (%) 4 (14.8) 1 (3.2)
PR, n (%) 3 (11.1) 9 (29.0) Progressive Disease, n (%) NR NR NR NR NR NR
Median Time to Next Treatment, months (95%CI) NR NR NR NR
NR
Receiving Treatment After Becoming Triple-refractory, n 251 251 138 54
LOT Received After Becoming Triple-refractory, Median (Range) 2 (1-8) NR NR NR
Lines of Therapy
Received, n (%)
Carfilzomib-based 111 (44.2) 81 (32.3) 25 (18.1) 12 (22.2) Pomalidomide-based 98 (39.0) 76 (30.3) 37 (26.8) 9 (16.7)
Bortezomib-based 83 (33.1) 47 (18.7) 32 (23.2) 12 (22.2) Elotuzumab-based 64 (25.5) 41 (16.3) 19 (13.8) 7 (13.0)
Lenalidomide-based 57 (22.7) 39 (15.5) 19 (13.8) 7 (13.0) Ixazomib-based NR 22 (8.8) 25 (18.1) 5 (9.3)
Thalidomide-based NR 12 (4.8) 2 (1.4) 4 (74) Daratumumab-based NR 5 (2.0) 19 (13.8) 8 (14.8)
Monotherapy NR
123 (49.0) 58 (42.0) 26 (48.1) Doublet Regimen 85 (33.9) 54 (39.1) 13 (24.1) Triplet Regimen 7 (2.8) 4 (2.9) 4 (7.4)
Retreatment with
Carfilzomib 39/145 (26.9) NR NR NR
Pomalidomide 49/173 (28.3)

©Institute for Clinical and Economic Review, 2021 Page 124 Final Report – Multiple Myeloma Return to Table of Contents
Study Mehra 202027 Goldsmith 202026 Arms Overall LOT1* LOT2* LOT3* BP DCEP
Previously Received
Regimen, n/N (%)
Bortezomib 72/226 (31.9) Elotuzumab 1/24 (4.2)
Lenalidomide 55/244 (22.5) Ixazomib NR
Thalidomide NR Daratumumab 34/251 (13.5)
95% CI: 95% confidence interval, BP: bendamustine/prednisone, CR: complete response, DCEP: dexamethasone, cyclophosphamide, etoposide, and cisplatin, LOT: line of therapy, n: number, N: total number, NR: not reported, ORR: overall response rate, OS: overall survival, PFS: progression-free survival, PR: partial response, sCR: stringent complete response, vgPR: very good partial response *Subgroup of patients receiving a first (LOT1), second (LOT2), or third (LOT3) line of therapy after becoming triple-class refractory. Table D3.22. Safety Outcomes: Usual Care Regimens
Trial/Study MAMMOTH7 Goldsmith 202026 Arms Overall BP DCEP
N 275 27 31 Median Follow-Up, Months (Range) 10.6 (1.9-42.3) NR
Risk of PD or Death, HR (95%CI)
Carfilzomib-based Regimens 0.60 (0.42, 0.85) NR
Daratumumab + IMiD Regimens 0.64 (0.43, 0.94)
Neutropenia Grade 4
NR
5 (18.5) NR Neutropenic fevers NR 5 (16.1)
Thrombocytopenia Grade 4 9 (33.3) NR Tumor Lysis Syndrome 1 (3.7) 1 (3.2)
Sepsis 1 (3.7) 1 (3.2) Safety data not reported for MAMMOTH triple/quad-refractory or penta-refractory arms, or any Mehra 2020 arm.
95% CI: 95% confidence interval, BP: bendamustine/prednisone, DCEP: dexamethasone, cyclophosphamide, etoposide, and cisplatin, HR: hazard ratio, IMiD: immunomodulatory drug, n: number, N: total number, NR: not reported, PD: progressive disease

©Institute for Clinical and Economic Review, 2021 Page 125 Final Report – Multiple Myeloma Return to Table of Contents
Table D3.23. Safety Outcomes: Additional Usual Care Regimens†
Trial/Study ELOQUENT-331 TOURMALINE-MM129 Bringhen 201430 Treatment Elo + Pom + Dex Ixa + Len + Dex Car + Cy + Dex
Median Follow-up Minimum 9.1 Months 23.3 Months 18 Months Safety Population, N 60 361 56 Age, Median (Range) 69 (43-81) 66 (38-91) 71 (IQR: 68-75)
Prior Therapies, Median (Range) 3 (2-8) NR NR Double-refractory, n (%) 41 (68) NR NR
AEs, n (%) 58 (96.7) 355 (98.3) 44 (78.6)* Grade ≥3 AEs, n (%) 34 (56.7) 267 (74.0) 15 (26.8)*
SAEs, n (%) 32 (53) 168 (46.5) NR
Mortality, n (%) Overall 13 (21.7) 15 (4.2) 7 (12.5)
Disease Progression 8 (13.3) NR 2 (3.6) AE 5 (8.3) NR 4 (7.1)
Discontinuation due to AEs, n (%) 11 (18) 60 (16.6) 8 (14)
Neutropenia, n (%) Overall 14 (23.3) 118 (32.7) 20 (35.7)
Grade 3/4 8 (13.3) 81 (22.4) 11 (19.6)
Anemia, n (%) Overall 15 (25.0) 103 (28.5) 39 (69.6)
Grade 3/4 6 (10.0) 34 (9.4) 6 (10.7)
Thrombocytopenia, n (%)
Overall 9 (15.0) 112 (31.0) 21 (37.5) Grade 3/4 5 (8.3) 69 (19.1) 2 (3.6)
Lymphopenia, n (%) Overall 6 (10.0) NR NR
Grade 3/4 5 (8.3) NR NR
Hyperglycemia, n (%) Overall 12 (20.0) NR 7 (12.5)
Grade 3/4 5 (8.3) NR 1 (1.8)
Infections, n (%) Overall 39 (65.0) 83 (23.0) 10 (17.9)
Grade 3/4 8 (13.3) 2 (0.6) 3 (5)
Fatigue, n (%) Overall 9 (15.0) 106 (29.4) 11 (20)
Grade 3/4 0 (0.0) 13 (3.6) 1 (1.8) Neuropathy, n (%) Overall NR 97 (26.9) 5 (8.9)

©Institute for Clinical and Economic Review, 2021 Page 126 Final Report – Multiple Myeloma Return to Table of Contents
Trial/Study ELOQUENT-331 TOURMALINE-MM129 Bringhen 201430 Treatment Elo + Pom + Dex Ixa + Len + Dex Car + Cy + Dex
Grade 3/4 NR 9 (2.5) 0 (0) AEs: adverse events, Car: carfilzomib, Cy: cyclophosphamide, Dex: dexamethasone, Elo: elotuzumab, IQR: interquartile range, Ixa: ixazomib, Len: lenalidomide, n: number, N: total number, NR: not reported, Pom: pomalidomide, SEA: serious adverse events * Hematologic adverse events. † Representative prospective trials of commonly used treatments selected externally to the systematic review meant to supplement the insufficient safety data in the three retrospective studies selected to represent the effectiveness of usual care regimens.

©Institute for Clinical and Economic Review, 2021 Page 127 Final Report – Multiple Myeloma Return to Table of Contents
D4. Ongoing Studies
Table D4.1. Ongoing Studies: Ide-cel
Title / Trial Sponsor Study Design Treatment Arms Patient Population Outcomes Estimated
Completion Study of bb2121 in Multiple Myeloma Celgene NCT02658929
Two-part, Non-randomized, Phase I Clinical Trial Actual enrollment: N = 67
Dose Escalation Phase (Part A): − Ide-cel (dose
range: 150 – 450 x 106 CAR+ T cells)
Expansion Phase (Part B): − Ide-cel
(recommended dose)
Inclusions: − ECOG status of 0 or 1 − Measurable disease − Diagnosis of relapsed or refractory MM with
at least 3 different prior lines of therapy including PI & IMiD, or be "double-refractory" to a PI and IMiD or previous (Part A)
− Diagnosis of relapsed/refractory MM with previous PI, IMiD, and dara exposure
Exclusions: − Known CNS disease − Inadequate renal, hepatic, bone marrow
function − Significant co-morbid conditions, second
malignancies, history of class III or IV congestive heart failure etc.
Primary: − Incidence of
adverse events (including dose limiting toxicities)
Secondary: − ORR, CR, vgPR, PR [60 Months]
November 30, 2023
Efficacy and Safety Study of bb2121 in Subjects with Relapsed and Refractory Multiple Myeloma (KarMMa) Celgene
Single Arm, Phase II Clinical Trial Actual enrollment: N = 149
Intervention: − Ide-cel (dose
range: 150 – 450 x 106 CAR+ T cells)
Inclusions: − ≥3 prior MM treatments with at least 2
consecutive cycles of treatment for each regimen
− Received PI, IMiD, and an anti-CD38 antibody, refractory to last treatment
− ECOG status 0 or 1 − Measurable disease
Primary: − ORR Secondary: − CR, Time to
response, DOR, PFS, OS, MRD
− Adverse events
November 1, 2024

©Institute for Clinical and Economic Review, 2021 Page 128 Final Report – Multiple Myeloma Return to Table of Contents
Title / Trial Sponsor Study Design Treatment Arms Patient Population Outcomes Estimated
Completion NCT03361748
Exclusions: − Known CNS involvement with myeloma or
presence of relevant CNS pathology − Active or history of plasma cel leukemia − Inadequate organ function − History of allogeneic hematopoietic SCT
− EORTC-QLQ-C30, EuroQol Group EQ-5D-5L, EORTC-QLQ-MY20
[≥24 months]
An Efficacy and Safety Study of bb2121 in Subjects with Relapsed and Refractory Multiple Myeloma and in Subjects with High-Risk Multiple Myeloma (KarMMa-2) Celgene NCT03601078
Single Arm, Multi-cohort Phase II Clinical Trial Estimated enrollment: N = 181
Intervention: − Ide-cel (dose
range: 150 – 450 x 106 CAR+ T cells)
Inclusions: − Measurable disease − Cohort-specific requirements: (Cohort 1)
relapsed/refractory MM subjects with ≥3 prior treatment regimens; (Cohort 2) subject with 1 prior treatment regimen
− ECOG status ≤1 − Grade 1 or baseline non-hematological
toxicities due to prior treatments Exclusions: − Receiving investigational dugs,
plasmapheresis, major surgery, radiation therapy, systemic anti-myeloma therapy 14 days prior to leukapheresis
− History of relevant CNS pathology, CNS involvement with myeloma
− Active plasma cell leukemia, Waldenstrom's macroglobulinemia, POEMS syndrome, clinically significant amyloidosis
− Previous allogeneic SCT
Primary: − Cohort 1: ORR − Cohort 2: CR Secondary: − Cohort 1: CR − Cohort 2: ORR − DOR, time to
response, PFS, OS, time to progression, MRD
− Adverse events [≥5 years]
− EORTC-QLQ-C30, EuroQoL Group EQ-5D-5L, EORTC-QLQ-MY20 [≥5 years]
[ ≥2 years]
May 13, 2026

©Institute for Clinical and Economic Review, 2021 Page 129 Final Report – Multiple Myeloma Return to Table of Contents
Title / Trial Sponsor Study Design Treatment Arms Patient Population Outcomes Estimated
Completion Efficacy and Safety Study of bb2121 Versus Standard Regimens in Subjects with Relapsed and Refractory Multiple Myeloma (RRMM) (KarMMa-3) Efficacy and Safety Study of bb2121 Versus Standard Regimens in Subjects with Relapsed and Refractory Multiple Myeloma (RRMM) (KarMMa-3) Celgene NCT03651128
Randomized, Phase III Clinical Trial Estimated enrollment: N = 381
Intervention: − Ide-cel (dose
range: 150-450 x 106 CAR+ T cells)
Standard Regimens: − Dara/Pom/Dex − Dara/Bor/Dex − Ixa/Len/Dex − Car/Dex − Elo/Pom/Dex
Inclusions: − Measurable disease − ECOG status of 0 or 1 − Received ≥2 but not >4 prior MM regimens − Prior treatment with dara, a PI, and an IMiD-
containing regiment for ≥2 consecutive cycles
− Refractory to last treatment regimen − Achieved minimal response or better to ≥1
prior treatment Exclusions: − Non-secretory MM − History of malignancies, history of or active
plasma cell leukemia, Waldenstrom's macroglobulinemia, POEMS syndrome, amyloidosis, etc.
− Subject treated with one of the comparator regimens as most-recent regimen cannot receive it again but may receive one of the others
− Autologous SCT 12 weeks prior to randomization
Primary: − PFS Secondary: − OS, event-free
survival, ORR, MRD, CR, DOR, time to response
− Adverse events − EORTC-QLQ-C30,
EuroQoL Group EQ-5D-5L, EORTC-QLQ-MY20
[≥5 years]
November 6, 2025
A Study to Evaluate the Safety of bb2121 in Subjects with High Risk, Newly Diagnosed Multiple Myeloma (NDMM) (KarMMa-4)
Single Group, Phase 1 Clinical Trial Estimated enrollment: N = 60
Intervention: − Ide-cel (dose
range: 150-800 x 106 CAR+ T cells)
Inclusions: − New diagnosis of symptomatic MM − Subject has measurable disease − Subject has high-risk MM − ECOG status of ≤ 1 − Has received ≤ 3 cycles of induction anti-
myeloma therapy
Primary: − Dose-limiting
toxicity [Up to 2 years]
− Adverse events [Up to 5 years]
January 15, 2025

©Institute for Clinical and Economic Review, 2021 Page 130 Final Report – Multiple Myeloma Return to Table of Contents
Title / Trial Sponsor Study Design Treatment Arms Patient Population Outcomes Estimated
Completion Celgene NCT04196491
Exclusions: − Non-secretory MM − Subject received any treatments of MM
other than up to 3 cycles of induction therapy
− Clinically significant CNS pathology − High risk developing deep vein
thrombosis/pulmonary embolus & cannot undergo anti-thrombotic therapy
− Moderate or severe pulmonary hypertension
− Subject has cardiac or pulmonary conditions; needs chronic immunosuppressants
− History of primary immunodeficiency
Secondary: [2.5 years] − CR, ORR, DOR,
PFS, OS − Time to
maintenance therapy
AE: adverse event, Bor: bortezomib, Car: carfilzomib, CNS: central nervous system, CR: complete response, Dara: daratumumab, Dex: dexamethasone, DOR: duration of response, ECOG: Eastern Cooperative Oncology Group, Elo: elotuzumab, IMiD: immunomodulatory drug, Ixa: Ixazomib, Len: lenalidomide, MM: multiple myeloma, MRD: minimal residual disease, N: total number, ORR: overall response rate, OS: overall survival, PFS: progression-free survival, PI: protease inhibitor, POEMS: polyneuropathy, organomegaly, endocrinopathy, myeloma protein, and skin changes, Pom: pomalidomide, SCT: stem cell transplant, vgPR: very good partial response. Source: www.ClinicalTrials.gov (NOTE: studies listed on site include both clinical trials and observational studies)

©Institute for Clinical and Economic Review, 2021 Page 131 Final Report – Multiple Myeloma Return to Table of Contents
Table D4.2. Ongoing Studies: Cilta-cel
Title / Trial Sponsor Study Design Treatment Arms Patient Population Outcomes Estimated Completion
LCAR-B38M Cells in Treating Relapsed/Refractory (R/R) Multiple Myeloma (LEGEND-2) Nanjing Legend Biotech Co. NCT03090659
Single Arm Phase I/II Clinical Trial Estimated enrollment: N = 100
Intervention: − Cilta-cel (dose
range: 0.5-5 x 10⁶ CAR+ T cells/kg)
Inclusions: − IMWG confirmed diagnosis of active MM − Refractory MM (≥3 prior regimens,
including Bortezomib) − Relapse criteria in NCCN clinical practice
guidelines Exclusions: − Systemic corticosteroid therapy greater
than 5 mg/day prednisone or equivalent of another corticosteroid within 2 weeks of leukapheresis or chemotherapy regimen
− History of allogeneic SCT (active acute or chronic GVHD or require immunosuppressant medication for GVHD within 6 months of enrollment
− Active autoimmune diseases or CNS metastases or symptomatic CNS involvement
Primary: [1 month] − Treatment related
adverse events Secondary: [36 months] − Changes in aberrant
immunoglobin in serum
− Multiple myeloma cells in bone marrow
December 31, 2021
A Study of JNJ-68284528, a Chimeric Antigen Receptor T Cell (CAR-T) Therapy Directed Against B-Cell Maturation Antigen (BCMA) in Participants with Relapsed or Refractory Multiple Myeloma (CARTITUDE-1) Janssen Research & Development, LLC
Single Arm, Phase 1b-2 Clinical Trial Estimated enrollment: N = 126
Intervention: − Cilta-cel (Dose: NR)
Inclusions: − Measurable disease − ECOG status of 0 or 1 − Received ≥3 prior therapies (including PI,
IMiD, and an anti-CD38 antibody), or double refractory to IMiD and PI
− Evidence of progressive disease Exclusions: − Prior CAR-T therapy at any target, therapy
targeted to BCMA − Allogenic SCT within 6 months before
apheresis; autologous SCT within 12 weeks before apheresis
Primary: − Phase 1b: Adverse
events − Phase 2: ORR Secondary: − Phase 2: Adverse
events − vgPR or better, DOR,
PFS, OS, MRD − EORTC QLQ-C30 and
QLQ-MY20, EQ-5D-5L [≥2 years]
April 30, 2022

©Institute for Clinical and Economic Review, 2021 Page 132 Final Report – Multiple Myeloma Return to Table of Contents
Title / Trial Sponsor Study Design Treatment Arms Patient Population Outcomes Estimated Completion
NCT03548207
− Known active/prior history of CNS or meningeal involvement of MM
A Study of LCAR-B38M CAR-T Cells, a Chimeric Antigen Receptor T-cell (CAR-T) Therapy Directed Against B-cell Maturation Antigen (BCMA) in Chinese Participants with Relapsed or Refractory Multiple Myeloma (CARTIFAN-1) Nanjing Legend Biotech Co. NCT03758417
Single Arm, Phase II Clinical Trial Estimated enrollment: N = 60
Intervention: − Cilta-cel (Dose: NR)
Inclusions: − Measurable disease − ECOG status of 0 or 1 − Received ≥3 prior lines of MM treatment
(≥1 complete cycle of treatment for each line; received a PI and IMiD)
− Evidence of progressive disease Exclusions: − Prior CAR-T therapy at any target, any
therapy targeted to BCMA − Allogeneic SCT for MM; Autologous SCT 12
weeks prior to apheresis − Diagnosed or treated for non-MM invasive
malignancies − Prior antitumor therapy, insufficient
washout period
Primary: − ORR Secondary: − vgPR or better, DOR,
PFS, OS, MRD − Adverse events [≥2 years]
November 30, 2022
A Study of JNJ-68284528, a Chimeric Antigen Receptor T Cell (CAR-T) Therapy Directed Against B-cell Maturation Antigen (BCMA) in Participants with Multiple Myeloma (CARTITUDE-2) Janssen Research & Development, LLC NCT04133636
Single Group, single arm, Phase 2 Clinical Trial Estimated enrollment: N = 100
Intervention: − Cohort A: cilta-cel − Cohort B: cilta-cel − Cohort C: cilta-cel − Cohort D: cilta-cel +
lenalidomide (only some participants)
− Cohort E: cilta-cel + Dara/Bor/Len/Dex
Inclusions: − Cohort A: Received 1-3 lines of prior
therapy − Cohort B: One line of therapy, early relapse − Cohort C: Treated with PI, IMiD, anti-CD38
monoclonal antibody and BCMA-directed therapy
− Cohort D: Newly diagnosed MM with history of 4-8cycles initial therapy
− Cohort E: Newly diagnosed, no prior therapy
Exclusions: − Prior treatment with CAR T therapy for any
target
Primary: − MRD [≥1 year] Secondary: − ORR, vgPR or better,
CBR, DOR − Adverse events [≥2 years]
July 25, 2024

©Institute for Clinical and Economic Review, 2021 Page 133 Final Report – Multiple Myeloma Return to Table of Contents
Title / Trial Sponsor Study Design Treatment Arms Patient Population Outcomes Estimated Completion
− Ongoing toxicity Grade 1 or less (except alopecia or peripheral neuropathy)
− Prednisone (≥70mg) within 7 days − History of CNS or meningeal involvement of
multiple myeloma A Study Comparing JNJ-68284528, a CAR-T Therapy Directed Against B-cell Maturation Antigen (BCMA), Versus Pomalidomide, Bortezomib and Dexamethasone (PVd) or Daratumumab, Pomalidomide and Dexamethasone (DPd) in Participants with Relapsed and Lenalidomide-Refractory Multiple Myeloma Janssen Research & Development, LLC NCT04181827
Interventional: Randomized, Parallel Assignment, Phase 3 Clinical Trial Estimated enrollment: N = 400
Intervention: − Cilta-cel (target
dose of 0.75 * 10^6 CAR+ T cells/kg)
Standard Regimens: − Bor/Pom/Dex − Dara/Pom/Dex
Inclusions: − Measurable disease − Received 1-3 prior lines of therapy − Evidence of progressive disease − Refractory to lenalidomide − Have clinical laboratory values meeting
screening phase criteria Exclusions: − Prior CAR T-cell therapy directed at any
target − Previous therapy targeting BCMA − Ongoing toxicity from previous anticancer
therapy − Monoclonal antibody treatment within 21
days; Cytotoxic therapy or Proteasome inhibitory therapy within 14 days; Immunomodulatory drug therapy within 7 days
Primary: − PFS Secondary: − ORR, CR/sCR, OS, MRD − Adverse events [Up to 6 years]
April 10, 2026
BCMA: b-cell maturation antigen, Bor: bortezomib, CAR: chimeric antigen receptor, CBR: clinical benefit rate, CNS: central nervous system, CR: complete response, Dara: daratumumab, Dex: dexamethasone, DOR: duration of response, ECOG: Eastern Cooperative Oncology Group, GVHD: graft versus host disease, IMiD: immunomodulatory drug, IMWG: International Myeloma Working Group, Len: lenalidomide, MM: multiple myeloma, mg: milligram, MRD: minimal residual disease, N: total number, NCCN: National Comprehensive Cancer Network, ORR: overall response rate, OS: overall survival, PFS: progression-free survival, PI: protease inhibitor, Pom: pomalidomide, sCR: stringent complete response, SCT: stem cell transplant, VGPR: very good partial response Source: www.ClinicalTrials.gov (NOTE: studies listed on site include both clinical trials and observational studies)

©Institute for Clinical and Economic Review, 2021 Page 134 Final Report – Multiple Myeloma Return to Table of Contents
Table D4.3. Ongoing Studies: Belantamab
Title / Trial Sponsor Study Design Treatment Arms Patient Population Outcomes Estimated Completion
A Study to Investigate the Efficacy and Safety of Two Doses of GSK2857916 in Participants with Multiple Myeloma Who Have Failed Prior Treatment with an Anti-CD38 Antibody (DREAMM 2) GlaxoSmithKline NCT03525678
Randomized, Two-Arm Phase II Clinical Trial Actual enrollment: N = 221
Interventions: − Arm 1: 2.5 mg/kg
frozen belantamab every three weeks
− Arm 2: 3.4 mg/kg frozen belantamab
− Arm 3: 3.4 mg/kg lyophilized belantamab
Inclusions: − ECOG status of 0-2 − Histologically/cytologically confirmed MM;
has undergone autologous SCT or transplant-ineligible; has failed ≥2 prior lines of therapy including IMiD and PI
− Measurable disease − History of autologous SCT only if 100 days
prior to study enrollment & no active infections
− Adequate organ system function Exclusions: − Systemic anti-myeloma therapy,
treatment with high dose steroids, investigational drug within 14 days
− Symptomatic amyloidosis, active POEMS, active plasma cell leukemia at time of screening
− Prior allogeneic SCT − Current corneal epithelial disease, active
renal condition, active mucosal/internal bleeding, unstable liver/biliary disease, other malignancies etc.
Primary: − ORR Secondary: − CBR, DOR, PFS, OS [Up to 48 weeks]
November 30, 2020
Characterization of Corneal Epithelial Changes in Participants Treated with Belantamab Mafodotin GlaxoSmithKline NCT04549363
Parallel, Non-Randomized, Phase 3 Clinical Trial Estimated enrollment: N = 25
Intervention: − Arm 1:
Participants undergoing Impression cytology + belantamab
− Arm 2: Participants
Inclusions: − Age 18 years or older − Patients with relapsed/refractory MM who
receives/has received treatment with Belantamab and microcyst-like epithelial changes diagnosis
− If undergoing superficial keratectomy, must not pose excessive risk to patient
Primary: − Abnormal corneal
epithelium composition − Abnormal pathologic
characteristics Secondary: − Adverse events, serious
adverse events
November 30, 2020

©Institute for Clinical and Economic Review, 2021 Page 135 Final Report – Multiple Myeloma Return to Table of Contents
Title / Trial Sponsor Study Design Treatment Arms Patient Population Outcomes Estimated Completion
undergoing Superficial keratectomy + belantamab
Exclusions: − Serious/unstable medical or psychiatric
disorder − Excess risk of delayed wound healing − Eye infections − Active uveitis − Permanent legal blindness in the non-
study eye
− Abnormal BCVA scores, corneal symptoms, and corneal epithelial lesions
[Up to 5 weeks]
A Study of Belantamab Mafodotin to Investigate Safety, Tolerability, Pharmacokinetics, Immunogenicity and Clinical Activity in Participants with Relapsed/Refractory Multiple Myeloma (RRMM) GlaxoSmithKline NCT04177823
Non-randomized, Single Group, Phase 1 Clinical Trial Estimated enrollment: N = 12 Actual enrollment: N = 5
Intervention: − 2.5 mg/kg
belantamab every 3 weeks
− 3.4 mg/kg belantamab every 3 weeks
Inclusions: − ECOG status of 0-2 − Histological/cytologically confirmed MM
diagnosis − Has undergone stem cell transplant/stem
cell transplant not deemed feasible − Failed at least 2 prior lines of anti-
myeloma treatment − Refractory to an immunomodulatory drug
and proteasome inhibitor − Measurable disease − Adequate organ system functions − All prior treatment-related toxicities must
be ≤ Grade 1, Grade 2 peripheral neuropathy
Exclusions: − Prior allogenic stem cell transplant − Systemic anti-myeloma therapy or
investigational drugs within 14 days; plasmapheresis within 7 days
− Symptomatic amyloidosis, POEMS syndrome
− Active renal condition, unstable liver, or biliary disease
Primary: − Adverse events, serious
adverse events − Dose-limiting toxicities Secondary: − Systolic and diastolic
blood pressure − Hematology and
chemistry parameters [Up to 15 months]
July 31, 2021

©Institute for Clinical and Economic Review, 2021 Page 136 Final Report – Multiple Myeloma Return to Table of Contents
Title / Trial Sponsor Study Design Treatment Arms Patient Population Outcomes Estimated Completion
− Malignancies other than disease under study
An Open-label, Dose Escalation Study in Japanese Subjects with Relapsed/Refractory Multiple Myeloma Who Have Failed Prior Anti Myeloma Treatments GlaxoSmithKline NCT03828292
Single Group, Dose-escalation, Phase I Clinical Trial Estimated enrollment: N = 14
Part 1: Belantamab monotherapy Part 2: − Belantamab +
Bor/Dex − Belantamab +
Pom/Dex
Inclusions: − Age 20 years or older − ECOG status of 0-2 − Measurable disease − Autologous stem cell transplant > 100 days
prior − Prior toxicities ≤ Grade 1, except alopecia
& peripheral neuropathy Grade 2 Exclusions: − Systemic anti-tumor therapy within 14
days, plasmapheresis within 7 days of first dose
− Symptomatic amyloidosis, active POEMS syndrome, active plasma cell leukemia at time of screening
− Allogeneic SCT − Active renal condition, corneal epithelial
disease, active mucosal or internal bleeding, severe or uncontrolled systemic disease, etc.
Primary: − Dose-limiting toxicities
[Day 21] − Adverse events − Abnormal hematology,
clinical chemistry, urine parameters
− Abnormal vital signs, ECG, physical and ocular examination
[Up to 2.2 years]
February 28, 2023
A Study of Belantamab Mafodotin (GSK2857916) in Multiple Myeloma Participants with Normal and Impaired Hepatic Function (DREAMM 13) GlaxoSmithKline
Non-Randomized, Parallel, Phase I Clinical Trial Estimated enrollment: N = 40
Intervention (Part 1): − Participants with
normal hepatic function: 2.5 mg/kg belantamab every 3 weeks
− Participants with moderate hepatic
Inclusions: − ECOG status of 0-2 − Histologically/cytologically confirmed MM;
has undergone autologous SCT or transplant-ineligible; has failed ≥2 prior lines of therapy including IMiD and PI
− Measurable disease − History of autologous SCT only if 100 days
prior to study enrollment & no active infections
− Adequate organ system function
Primary: − Max observed plasma
concentration − Predose plasma
concentration − AUC for plasma
concentration-time − AUC over the dosing
interval of belantamab [throughout 21-day cycle]
May 6, 2024

©Institute for Clinical and Economic Review, 2021 Page 137 Final Report – Multiple Myeloma Return to Table of Contents
Title / Trial Sponsor Study Design Treatment Arms Patient Population Outcomes Estimated Completion
NCT04398680 impairment: 2.5 mg/kg belantamab every 3 weeks
Intervention (Part 2): − Patients with
severe hepatic function: 2.5 mg/kg or 1.9 mg/kg belantamab every 3 weeks
Exclusions: − Active plasma cell leukemia, symptomatic
amyloidosis, active POEMS syndrome, Waldenstroem Macroglobulinemia
− Prior allogeneic SCT − Investigational drug or strong organic
anion transporting polypeptide inhibitor received 2 weeks prior
− ≥2 Grade toxicity from previous treatment except alopecia or peripheral neuropathy up to Grade 2
− Previous or concurrent malignancies unless medically stable for at least 2 years
Secondary: − Adverse events, serious
adverse events [Up to 4 years]
Study of Single Agent Belantamab Mafodotin Versus Pomalidomide Plus Low-dose Dexamethasone (Pom/Dex) in Participants with Relapsed/Refractory Multiple Myeloma (RRMM) GlaxoSmithKline NCT04162210
Randomized, Parallel, Phase 3 Clinical Trial Estimated enrollment: N = 380
Intervention: − 2.5 mg/kg
belantamab every 3 weeks
Comparator: − Pom/Dex (low
dose)
Inclusions: − ECOG status of 0-2 − Histological/cytologically confirmed MM − Has undergone stem cell transplant/stem
cell transplant not deemed feasible − Failed at least 2 prior lines of anti-
myeloma treatment − Refractory to an immunomodulatory drug
and proteasome inhibitor − Measurable disease − Adequate organ system functions − All prior treatment-related toxicities must
be ≤ Grade 1, Grade 2 peripheral neuropathy
Exclusions: − Prior allogenic stem cell transplant − Systemic anti-myeloma therapy or
investigational drugs within 14 days; plasmapheresis within 7 days
Primary: − PFS [Up to 20 months] Secondary: − OS, ORR, CBR, DOR − Adverse events [Up to 55 months]
November 21, 2024

©Institute for Clinical and Economic Review, 2021 Page 138 Final Report – Multiple Myeloma Return to Table of Contents
Title / Trial Sponsor Study Design Treatment Arms Patient Population Outcomes Estimated Completion
− Symptomatic amyloidosis, POEMS syndrome, plasma cell leukemia
− Active renal condition, unstable liver, or biliary disease
− Malignancies other than disease under study
A Study of Belantamab Mafodotin (GSK2857916) in Multiple Myeloma Participants with Normal and Varying Degree of Impaired Renal Function (DREAMM 12) GlaxoSmithKline NCT04398745
Non-Randomized, Phase I Clinical Trial Estimated enrollment: N = 36
Intervention (Part 1): − Patients with
normal/mild impaired renal function: 2.5 mg/kg belantamab every 3 weeks
− Patients with severe renal impairment: 2.5 mg/kg belantamab every 3 weeks
Intervention (Part 2): − Patients with
ESRD (not on dialysis): 2.5 mg/kg or 1.9 mg/kg belantamab every 3 weeks
− Patients with ESRD (on hemodialysis): 2.5 mg/kg or 1.9
Inclusions: − ECOG status of 0-2 − Histologically/cytologically confirmed MM;
has undergone autologous SCT or transplant-ineligible; has failed ≥2 prior lines of therapy including IMiD and PI
− Measurable disease − History of autologous SCT only if 100 days
prior to study enrollment & no active infections
− Adequate organ system function Exclusions: − Active plasma cell leukemia, symptomatic
amyloidosis, active POEMS syndrome, Waldenstroem Macroglobulinemia
− Prior allogeneic SCT − Investigational drug, belantamab, strong
organic anion transporting polypeptide inhibitor received 2 weeks prior
− ≥2 Grade toxicity from previous treatment except alopecia or peripheral neuropathy up to Grade 2
− Previous or concurrent malignancies unless medically stable for at least 2 years
Primary: − Max. observed plasma
concentration − Concentration
belantamab at end of infusion
− Pre-dose plasma concentration
− AUC over the dosing interval of belantamab
[Up to 3 21-day cycles) Secondary: − Adverse events, serious
adverse events [Up to 4 years]
March 7, 2025

©Institute for Clinical and Economic Review, 2021 Page 139 Final Report – Multiple Myeloma Return to Table of Contents
Title / Trial Sponsor Study Design Treatment Arms Patient Population Outcomes Estimated Completion
mg/kg belantamab every 3 weeks
Platform Study of Belantamab Mafodotin as Monotherapy and in Combination with Anti-cancer Treatments in Participants with Relapsed/Refractory Multiple Myeloma (RRMM) (DREAMM 5) GlaxoSmithKline NCT04126200
Randomized, Sequential Assignment, Phase I/II Clinical Trial Estimated enrollment: N = 464
Intervention: − Substudy 1:
Belantamab + GSK3174998
− Substudy 2: Belantamab + GSK3359609
− Substudy 3: Belantamab + Nirogacestat
− Substudy 4: Belantamab + Dostarlimab
Active Comparator: − Belantamab
monotherapy
Inclusions: − 3 prior lines of anti-myeloma treatments
(including IMiD, PI, anti-CD38 monoclonal antibody)
− History of autologous stem cell transplant >100 days prior to enrollment
− ECOG status 0-1 − Measurable disease Exclusions: − Corneal epithelial disease − Prior radiotherapy within 2 weeks, prior
allogenic transplant, prior CAR T therapy within 3 months, prior investigational agent treatment within 2 weeks
− Delayed hypersensitivity reaction or idiosyncrasy to drugs chemically similar to Belantamab
Primary: − Dose-limiting toxicities − Adverse events − Abnormality in vital
signs − Changes in hematology,
clinical chemistry, and urinalysis lab parameters
− ORR Secondary: − CBR, PR, vgPR, CR, sCR,
PFS, DOR, OS − Adverse events, serious
adverse events [Up to 36 months]
February 24, 2028
AUC: area under the curve, BCVA: Best Corrected Visual Acuity, CAR: chimeric antigen receptor, CBR: clinical benefit rate, CNS: central nervous system, CR: complete response, Dex: dexamethasone, DLT: dose limiting toxicities, DOR: duration of response, ECG: echocardiogram, ECOG: Eastern Cooperative Oncology Group, ESRD: end-stage renal disease, IMiD: immunomodulatory drug, kg: kilogram, max: maximal, MM: multiple myeloma, mg: milligram, MRD: minimal residual disease, N: total number, ORR: overall response rate, OS: overall survival, PFS: progression-free survival, PI: protease inhibitor, POEMS: polyneuropathy, organomegaly, endocrinopathy, myeloma protein, and skin changes, Pom: pomalidomide, PR: partial response, sCR: stringent complete rate, SCT: stem cell transplant Source: www.ClinicalTrials.gov (NOTE: studies listed on site include both clinical trials and observational studies)

©Institute for Clinical and Economic Review, 2021 Page 140 Final Report – Multiple Myeloma Return to Table of Contents
D5. Previous Systematic Reviews and Technology Assessments
We identified two ongoing health technology assessments, one of belantamab and one of ide-cel by the National Institute for Health and Care Excellence (NICE) summarized below. We also identified one systematic review and meta-analysis of BCMA CAR-T therapies and one systematic review that aimed to put the ide-cel and cilta-cel clinical trials into an appropriate comparative context.
NICE Technology Assessments
Belantamab mafodotin for treating relapsed or refractory multiple myeloma after 3 therapies [ID2701] NICE is currently conducting an appraisal of the clinical and cost effectiveness of belantamab in relapsed and refractory multiple myeloma patients who have received three prior therapies. The expected publication date is to be confirmed.
Idecabtagene vicleucel for treating relapsed and refractory multiple myeloma in people who have received at least 3 prior therapies [ID1442] NICE is currently conducting an appraisal of the clinical and cost effectiveness of ide-cel in relapsed and refractory multiple myeloma patients who have received at least three prior therapies. Comparators in the final scope include pomalidomide-dexamethasone and panobinostat-bortezomib-dexamethasone combinations, reflecting a difference in preferred treatment in England as compared to the U.S. The expected publication date is to be confirmed.
Previous Systematic Reviews
Roex G, Timmers M, Wouters K, et al. Safety and clinical efficacy of BCMA CAR-T-cell therapy in multiple myeloma. J Hematol Oncol. 2020;13(1):164.
This systematic review and meta-analysis assess the safety and clinical efficacy of BCMA-targeted CAR-T-cell therapies in patients with multiple myeloma. Including a total of 27 clinical studies pertaining to 23 different BCMA CAR-T-cell therapies, it is the most comprehensive review to date. One study for each of the two most advanced therapies (ide-cel and cilta-cel) were identified.
For all BCMA CAR-T patients evaluable for clinical response, high response rates were achieved. Response rates for high dose ide-cel and cilta-cel were comparable (ORR 82% and 88%, respectively). The median PFS among evaluable patients treated with high-dose ide-cel was 12.1 months (95% CI 8.8, 12.3) and 19.9 months for patients treated with cilta-cel (95% CI 9.6, 31.0). Although high response rates were achieved across BCMA CAR-T studies, toxicity was also high. 80.3% patients evaluable for safety experienced CRS with 14.1% experiencing CRS of grade ≥3. High dose ide-cel and cilta-cel had higher than average rates of CRS overall (96.3% and 89.5%,

©Institute for Clinical and Economic Review, 2021 Page 141 Final Report – Multiple Myeloma Return to Table of Contents
respectively) but lower rates of grade ≥3 CRS (7.0% and 5.6%, respectively). Rates of neurotoxicity differed considerably between studies. The population included in the ide-cel study was generally older and more heavily pretreated, possibly contributing to its higher neurotoxicity rate.
Overall, BCMA CAR-T-cell therapies prove to have high response rates, but equally as high toxicity. Despite toxicities, this meta-analysis provides robust evidence that BCMA CAR-T therapies are considered highly efficacious even in heavily pretreated MM patients.
Shah N, Sussman M, Crivera C, et al. Comparative effectiveness research for CAR-T therapies in multiple myeloma: appropriate comparisons require careful considerations of data sources and patient populations. Clin Drug Investig. Published online February 18, 2021. https://doi.org/10.1007/s40261-021-01012-x
This systematic literature review sought to evaluate the most appropriate data sources and populations for comparison to the novel CAR-T therapies ide-cel and cilta-cel, specifically their single-arm KarMMa and CARTITUDE-1 trials. Investigators reviewed clinical trials of regimens preferred by the National Comprehensive Cancer Network (NCCN) for previously treated multiple myeloma and assessed them for comparability to the CAR-T trials’ patient populations. None of the clinical trials identified were conducted in patient with triple class exposed (TCE) or triple class refractory (TCR) multiple myeloma exclusively and thus were not suitable for comparison. Additionally, investigators systematically reviewed real-world studies of patients with TCE and/or TCR multiple myeloma. Five real-world studies were included, with two exclusively focusing on the TCR patient population. Based on currently available data, real world studies with matching TCE and/or TCR patient populations make the most appropriate comparators for the single-arm trials of ide-cel and cilta-cel. Of note, the two real world studies identified by this systematic review, Gandhi 20197 and Mehra 202027, were included to define the comparator population in this report.

©Institute for Clinical and Economic Review, 2021 Page 142 Final Report – Multiple Myeloma Return to Table of Contents
E. Long-Term Cost-Effectiveness: Supplemental Information E1. Detailed Methods
Table E.1.1 Impact Inventory
Sector Type of Impact
(Add additional domains, as relevant)
Included in This Analysis from […]
Perspective?
Notes on Sources (if quantified),
Likely Magnitude & Impact (if not) Health Care
Sector Societal
Formal Health Care Sector Health Outcomes
Longevity effects X X Health-related quality of life effects
X X
Adverse events X X Medical Costs Paid by third-party payers X X
Paid by patients out-of-pocket Future related medical costs X X Future unrelated medical costs
Informal Health Care Sector Health-Related Costs
Patient time costs NA Unpaid caregiver-time costs NA Transportation costs NA X
Non-Health Care Sector Productivity Labor market earnings lost NA X
Cost of unpaid lost productivity due to illness
NA X
Cost of uncompensated household production
NA
Consumption Future consumption unrelated to health
NA
Social services Cost of social services as part of intervention
NA
Legal/Criminal Justice
Number of crimes related to intervention
NA
Cost of crimes related to intervention
NA
Education Impact of intervention on educational achievement of population
NA

©Institute for Clinical and Economic Review, 2021 Page 143 Final Report – Multiple Myeloma Return to Table of Contents
Housing Cost of home improvements, remediation
NA
Environment Production of toxic waste pollution by intervention
NA
Other Other impacts (if relevant) NA NA: not applicable Adapted from Sanders et al75 Target Population
The model focused on an intention-to-treat analysis, with a hypothetical cohort of patients in two different populations: 1) triple- or quad-refractory with 3+ prior lines of treatment being treated with ide-cel or cilta-cel, and 2) triple-, quad-, penta-refractory with 4+ prior lines of treatment being treated with belantamab. Cohort characteristics for each treatment group are described in E.1.2 and E.1.3.
Table E.1.2. Baseline Population Characteristics: Triple- or Quad-Refractory MM (3+ prior lines of treatment)
Triple-Class Refractory MM Idecabtagene vicleucel Ciltacabtagene autoleucel Triple and Quad-
Refractory Comparator Median Age 61 61 60 Percent Male 59% 59% 57% Refractory Status, % Anti-CD38 Ab-refractory:
94% Triple-refractory: 84%
Triple-refractory: 88% Anti-CD38 Ab-refractory: 100%
Median Prior Lines of Treatment
6 6 4
Source Munshi et al, 202010 Madduri et al, 202014 Gandhi et al, 20197 Table E.1.3. Baseline Population Characteristics: Triple-, Quad-, or Penta- Refractory MM (4+ prior lines of treatment)
Penta-Refractory MM Belantamab Triple/Quad/Penta-Refractory Therapies
Median Age 65 59 Percent Male 53% 56% Refractory Status, % Anti-CD38 Ab-refractory: 100% in
2.5 mg/kg dose
Anti-CD38 Ab-refractory: 100%
Median Prior Lines of Treatment 7 5 Source Lonial et al, 202043 Gandhi et al, 20197

©Institute for Clinical and Economic Review, 2021 Page 144 Final Report – Multiple Myeloma Return to Table of Contents
Comparators
The primary comparator for each type of therapy is listed below. Because of differences in population indications, interventions were not compared to each other. Given the numerous available therapies used by clinicians at various lines of therapy, a market basket approach was used to compare to each intervention based on refractory status using the MAMMOTH study.7 The market basket composition was approximated by both broad-therapy and specific-therapy estimations. For belantamab, we used a weighted average of MAMMOTH subcohorts so that the proportion of penta vs triple/quad refractory patients from the MAMMOTH comparator cohort matched that in the DREAMM-2 study. MAMMOTH results for these cohorts were used to inform comparator PFS and OS in the model. Specific regimens that are commonly employed in the relevant populations were also identified for the purpose of estimating market basket costs. For the triple- or quad-refractory population, the comparator market basket included (comparator for ide-cel and cilta-cel, sub-population within belantamab also compared using this market basket):
• Carfilzomib + cyclophosphamide + dexamethasone (KCd) • Pomalidomide + cyclophosphamide + dexamethasone (PCd) • Carfilzomib + pomalidomide + dexamethasone (KPd) • Elotuzumab + pomalidomide + dexamethasone (EPd) • Ixazomib, lenalidomide, and dexamethasone (IRd)
Comparator market basket for the penta-refractory population (used in weighted average comparator basket along with triple/quad for belantamab):
• Carfilzomib + cyclophosphamide + dexamethasone (KCd) • Pomalidomide + cyclophosphamide + dexamethasone (PCd) • Ixazomib, pomalidomide, and dexamethasone (IPd) • Elotuzumab + pomalidomide + dexamethasone (EPd) • Ixazomib, lenalidomide, and dexamethasone (IRd) • Bendamustine, prednisone, dexamethasone, cyclophosphamide, etoposide, and cisplatin
(DCEP) Within each progressed state, we also applied a proportion of patients on palliative chemotherapy consistent with current evidence. Tables E.2.2 and E.2.3 provide dosing, administration schedules, and costs for each market basket of comparators.
E2. Model Inputs
Model inputs were estimated from the clinical review, published literature, and information from expert stakeholders. The inputs that informed the model are described below. The base case

©Institute for Clinical and Economic Review, 2021 Page 145 Final Report – Multiple Myeloma Return to Table of Contents
analysis took a health care system perspective and focused on direct medical care costs only. Outcomes were estimated over a lifetime time horizon using a monthly cycle to capture the potential impacts of short-term and ongoing morbidity and mortality. Costs and outcomes were discounted at 3% per year.
Treatment Regimen Inputs
Treatment regimens for the interventions are described in Tables E2.1. The market basket of therapy regimens for three or more lines of therapy and four or more lines of therapy are described in tables E2.2 and E2.3.
Table E.2.1. Treatment Regimen Recommended Dosage
Category/Therapy Idecabtagene vicleucel Ciltacabtagene autoleucel Belantamab Brand Name Abecma TBD Blenrep Manufacturer Bristol Myers
Squibb/bluebird bio Janssen/Legend Biotech GlaxoSmithKline
Route of Administration Single infusion Single infusion Infusion once every 3 weeks
Dosing 150-450 x 106 CAR+ T cells
0.75 x 10⁶ (range: 0.5 - 1.0 x10⁶ ) CAR+ T cells/kg
2.5 mg/kg of body weight
Use of Lymphocyte Depleting Chemotherapy
Fludarabine (30 mg per square meter of body surface per day) and cyclophosphamide (300 mg per square meter per day) on days -5, -4, -3
Cyclophosphamide (300 mg per square meter per day) on days -5, -4, -3
N/A

©Institute for Clinical and Economic Review, 2021 Page 146 Final Report – Multiple Myeloma Return to Table of Contents
Table E.2.2. Triple- or Quad-Refractory MM Comparator Market Basket (3+ prior lines of treatment) Recommended Dosage and Total Cost
Therapy Combination Days/Cycle Cycle 1 Dose Admin. Days
Proportion of Patients
on Each Combination
Per Cycle Cost
Carfilzomib, Cyclophosphamide, Dexamethasone 18% $22,676 Carfilzomib 28 20 mg/m2 1, 2, 8, 9, 15, 16 (cycle 1);
1, 2, 15, 16 (remaining cycles)
Cyclophosphamide 28 300mg/m2 1,8,15 Dexamethasone 28 20 mg 1, 2, 8, 9, 15 and 16 Pomalidomide, Cyclophosphamide, Dexamethasone 34% $17,083 Pomalidomide 28 4mg/day 1-21 Cyclophosphamide 28 300mg/day 1, 8, 15, 22 Dexamethasone 28 40mg/day 1-4 and 15-18 Carfilzomib, Pomalidomide, Dexamethasone 18% $30,471 Carfilzomib 28 20mg/m2; 27 mg/m2 1, 2; 8, 9, 15, 16 (cycle 1)
1, 2, 8, 9, 15, 16 (cycles 2-12)
Pomalidomide 28 4mg/day 1-21 Dexamethasone 28 20 mg 1,8,15,22 Elotuzumab, Pomalidomide, Dexamethasone 19% $36,676 Elotuzumab 28 10 mg/kg 1, 8, 15, and 22 Pomalidomide 28 4mg/day 1-21 Dexamethasone 28 28mg oral+8mg iv 1,8,15,22 Ixazomib, Lenalidomide, Dexamethasone 10% $22,391 Ixazomib 28 4mg/day 1,8,15 Lenalidomide 28 25mg/day 1-21 Dexamethasone 28 40mg/day 1,8,15,22 Weighted average administration costs $3,130 Weighted average adverse event cost management (applied for 2 cycles)
$1,531
Weighted average dose intensity (applied after 2 cycles) 96% Weighted average total cost $29,490

©Institute for Clinical and Economic Review, 2021 Page 147 Final Report – Multiple Myeloma Return to Table of Contents
Table E.2.3. Triple-, Quad-, or Penta- Refractory MM Comparator Market Basket (4+ prior lines of treatment) Recommended Dosage and Total Cost
Therapy Combination Days/Cycle Cycle 1 Dose Admin. Days Proportion of
Patients on Each Combination
Per Cycle Cost
Carfilzomib, Cyclophosphamide, Dexamethasone 22% $22,456 Carfilzomib 28 20 mg/m2 1, 2, 8, 9, 15, 16 (cycle 1); 1, 2, 15, 16 (remaining cycles) Cyclophosphamide 28 300mg/m2 1,8,15 Dexamethasone 28 20 mg 1, 2, 8, 9, 15 and 16 Pomalidomide, Cyclophosphamide, Dexamethasone
17% $17,083
Pomalidomide 28 4mg/day 1-21 Cyclophosphamide 28 300mg/day 1, 8, 15, 22 Dexamethasone 28 40mg/day 1-4 and 15-18 Ixazomib, Pomalidomide, Dexamethasone 9% $27,323 Ixazomib 28 4mg/day 1,8,15 Pomalidomide 28 4mg/day 1-21 Dexamethasone 28 40mg/day 1,8,15,22 Elotuzumab, Pomalidomide, Dexamethasone 13% $36,676 Elotuzumab 28 10 mg/kg 1, 8, 15, and 22 Pomalidomide 28 4mg/day 1-21 Dexamethasone 28 28mg oral+8mg iv 1,8,15,22 Ixazomib, Lenalidomide, Dexamethasone 10% $22,393 Ixazomib 28 4mg/day 1,8,15 Lenalidomide 28 25mg/day 1-21 Dexamethasone 28 40mg/day 1,8,15,22 Bendamustine, prednisone, dexamethasone, cyclophosphamide, etoposide, and cisplatin
29% $9,907
Bendamustine 28 90mg/m2 Prednisone 1,2,3,4 Dexamethasone 28 40mg/day 1,2,3,4 Cyclophosphamide 28 400mg/m2 1,2,3,4 Etoposide 28 40mg/m2 1,2,3,4

©Institute for Clinical and Economic Review, 2021 Page 148 Final Report – Multiple Myeloma Return to Table of Contents
Cisplatin 28 10mg/m2 1,2,3,4 Weighted average administration costs $1,301 Weighted average adverse event cost management (applied for 2 cycles)
$1,259
Weighted average dose intensity (applied after 2 cycles)
96%
Weighted average total cost $22,994

©Institute for Clinical and Economic Review, 2021 Page 149 Final Report – Multiple Myeloma Return to Table of Contents
Detailed Description of Curve Digitization and Survival Extrapolation
Kaplan-Meier curves from the evidence were digitized using the algorithm by Guyot and colleagues to impute patient-level time-to-event data.76 Base-case survival was derived from parametric fits to each intervention’s available PFS and OS Kaplan-Meier curves.11,14,43 Table E.2.4 delineates the evidence that was used to calculate transition probabilities. The comparator OS evidence was derived from the MAMMOTH study using triple- and quad-refractory curves (for comparison to CAR-Ts) and a weighted average of triple-/quad-refractory and penta-refractory curves (for comparison to belantamab ).7 Given we did not have available PFS curves for the comparator populations (i.e., triple-, quad-, or penta-refractory in Gandhi et al.), we assumed similar distribution parameters as other curves in triple-, quad-, or penta-refractory MM and adjusted to fit a PFS to OS relationship as observed in meta-analyses.37,38
The model curves considered included distributional forms Weibull, exponential, log-normal, log-logistic, and Gompertz. The base-case distributional form was selected separately for each curve based on the best model fit using the Akaike information criterion (AIC) values, visual comparison, and clinical plausibility. Transition probabilities were then calculated for each time period in the model (monthly cycles). In some cases, we used piecewise modeling techniques to fit survival distributional forms at different time points after examining hazard functions.46 Table E.2.4 presents sources for each curve.
Table E.2.4. Sources of Kaplan-Meier Curves to Calculate Transition Probabilities
Survival Estimate
Idecabtagene vicleucel
Ciltacabtagene autoleucel
Triple- and Quad-Refractory
(Comparator to CAR-Ts)*
Belantamab Penta-Refractory
(Comparator to Belantamab)*
Progression-free survival
Phase II KarMMa results
CARTITUDE-1 PFS curve fit to proportional relationship reported in previous meta-analyses
Updated DREAMM-2 PFS curve
PFS curve fit to proportional relationship reported in previous meta-analyses
Overall survival
Phase II KarMMa results
CARTITUDE-1 MAMMOTH triple/quad-refractory
Updated DREAMM-2 OS curve
MAMMOTH penta-refractory
Sources Munshi et al, 202111
Madduri et al, 202014,15
Gandhi et al, 20197
Academic in confidence
Gandhi et al, 20197
* Comparator to belantamab weights outcomes from both populations exposed to three or more lines of therapy and populations exposed to four or more lines of therapy

©Institute for Clinical and Economic Review, 2021 Page 150 Final Report – Multiple Myeloma Return to Table of Contents
Table E.2.5 presents the final distributions chosen for the model based on visual inspection and Akaike information criterion (AIC). The shape and scale parameters were used to generate time-dependent transition probabilities for each curve. We provide alternative extrapolations to approximated KM curves in Figures E.4.1 to E.4.4. Figures showing belantamab extrapolations are not shown due to academic in confidence considerations. Extrapolations based on assumptions from other curve fittings are also not shown (i.e., Cilta-cel OS, MAMMOTH PFS).
Table E.2.5. Survival Curve Fit, Shape, and Scale Parameters for Final Model
Outcome (Distribution
Chose) AIC Shape/
Dist 1 Scale/Dist 2 Source Notes Modeled % at 12
months
Ide-Cel Progression Free Survival (Log-normal)
185.9 2.31 1.00 Munshi et al, 202111
N/A 40%
Overall Survival (Log-normal)
204.7 3.24 0.93 Munshi et al, 202111
N/A 78%
Cilta-Cel Progression Free Survival (Weibull)
218.6 1.61 29.24 Madduri et al, 202014
Median PFS not reached, therefore calibrated based on % alive and PFS at 12 months
77%
Overall Survival (Weibull)
218.6 1.61 49.66 Madduri et al, 202014
Assumed same shape as PFS curve with adjustment to scale parameter
89% and 80.9% at 18 months
Triple- or Quad-Refractory Comparator
Progression Free Survival (Log-normal)
N/A 1.22 1.00 Dimopoulos et al, 201737 Gandhi et al, 20197 Felix et al, 201338
PFS curve fit to proportional relationship reported in previous meta-analyses
10%
Overall Survival (Log-normal)
426.5 2.13 1.30 Gandhi et al, 20197
Figure 1a triple/quad refractory
39%

©Institute for Clinical and Economic Review, 2021 Page 151 Final Report – Multiple Myeloma Return to Table of Contents
Outcome
(Distribution Chose)
AIC Shape Scale Source Notes Modeled % at 12 Months
Belantamab* Progression Free Survival (Log-normal)
Academic in confidence
Overall Survival (Log-normal)
Academic in confidence
Penta-Refractory Comparator
Progression Free Survival (Log-normal)
N/A 1.0 0.71 Dimopoulos et al, 201737 Gandhi et al, 20197
PFS curve fit to proportional relationship reported in previous meta-analyses
1.5%
Overall Survival (Weibull)
329.0 1.53 7.61 Gandhi et al, 20197
Figure 1a penta-refractory
11%
*Comparator to belantamab weights outcomes from both populations exposed to three or more lines of therapy and populations exposed to four or more lines of therapy

©Institute for Clinical and Economic Review, 2021
Progression Free Survival Figure E.2.1. Progression-Free Survival Extrapolations for Ide-Cel
Figure E.2.2. Progression-Free Survival Extrapolations for Cilta-Cel

©Institute for Clinical and Economic Review, 2021 Page 153 Final Report – Multiple Myeloma
Overall Survival Figure E.2.3. Overall Survival Extrapolations for MAMMOTH Triple- or Quad-Refractory Cohort*
*Gompertz not shown due to poor fit of observed data from MAMMOTH
Figure E.2.4. Overall Survival Extrapolations for Ide-Cel
Health State Utilities
The most current and best available evidence on health utilities comes from the KarMMa study, with elicitation of utilities using the European Quality of Life-5 dimensions 5 levels (EQ-5D-5L) health state classification instrument.42 The analysis elicited utilities from the US, UK, and Canadian populations across different time points including baseline, pre-progression, and post-progression.

©Institute for Clinical and Economic Review, 2021 Page 154 Final Report – Multiple Myeloma
We applied the baseline utility value to the progressed state, the highest utility value elicited for the progression-free off therapy state, and the first month pre-progression overall utility for the progression-free on therapy state. Given feedback from RRMM patients, we applied a separate utility to the progression-free off therapy state for both ide-cel and cilta-cel to reflect the benefits of being off therapies for a disease that commonly continues patients on therapies until death. See table E.2.6 for health state utilities applied in the model.
Adverse event disutilities were applied for two cycles in the model (i.e., two months) as evidence suggested most adverse events were resolved within 1-3 cycles with additional dose adjustments. Consistent with previous health technology assessments,77,78 a utility score of 0 was applied for grade 3 or higher cytokine release syndrome for a duration. Table E.2.7 details the disutility estimates applied for adverse event disutilities.
Table E.2.6. Utility Values for Health States
Parameter Three or More Lines of Therapy Progression-free on Therapy and Responding 0.78 Progression-free off Therapy and Responding 0.82 Progressed Disease/not Responding to Treatment
0.71
Source Delforge et al, 202041 Adverse Events
The model included any grade 3/4 adverse events that occur in 5% of patients in any of the treatments and comparators. Given the potentially significant impact of cytokine release syndrome on health care resource utilization and quality of life, we included all grades 1-4 for these adverse events and adjusted costs and quality of life estimates accordingly. The costs and disutility of adverse events were applied to the first two cycles for each intervention and comparator. After cycle 2 of the model, we applied a dose adjustment factor, assuming adverse events would be resolved with lower dosing of each therapy. Table E.2.7 includes the proportions of patients with adverse events applied in the model.

©Institute for Clinical and Economic Review, 2021 Page 155 Final Report – Multiple Myeloma
Table E.2.7. Included Adverse Events
Parameter Idecabtagene vicleucel 10 Ciltacabtagene autoleucel 14 Belantamab 43 Proportion with grade 1 CRS
41% 49% N/A
Proportion with grade 2 CRS
23% 39% N/A
Proportion with grade 3 CRS
2% 3% N/A
Proportion with grade 4 CRS
1% 1% N/A
Proportion with CRS and NE <=2
12% NR N/A
Proportion with CRS>= 3 and NE <=2
3% NR N/A
Proportion with CRS<=2 and NE=>3
3% NR N/A
Anemia See above categories 68% 20% Neutropenia 95% 9.5% Thrombocytopenia 60% 20% Lymphopenia 49% 16.8% Leukopenia 61% Keratopathy N/A 27% Hypercalcemia NR 7.4% Hypophosphatemia
NR 5.3%
NR: Not reported
Adverse event disutilities or utilities are described in Table E.2.8. Adverse event disutilities were applied for two cycles in the model (i.e., two months). Consistent with previous health technology assessments,77,78 a utility score of 0 were applied for grade 3 or higher cytokine release syndrome for 8 days in the first cycle.

©Institute for Clinical and Economic Review, 2021 Page 156 Final Report – Multiple Myeloma
Table E.2.8. Adverse Event Disutilities
Adverse Event Parameter Disutility Source Anemia -0.31 Brown et al. 2013 79 Neutropenia -0.15 Brown et al. 2013 79 Thrombocytopenia -0.31 Brown et al. 2013 79 Lymphopenia -0.07 NICE TA 510 80 Cytokine release syndrome 0.00* Hettle et al. 2017 77 Keratopathy -0.05 Sullivan 2006 (ICD-9 369) 81 Hypercalcemia -0.04 Sullivan 2006 (ICD-9 289) 81 Hypophosphatemia -0.04 Sullivan 2006 (ICD-9 289) 81
*This value corresponds to a utility, not a disutility.
Economic Inputs
Cost Inputs
All costs used in the model were updated to 2020 dollars.
Drug Acquisition Costs
For CAR-T therapies, the base-case findings use the list price for ide-cel. There is not a price yet for cilta-cel; therefore, we assume the same price as a placeholder. For belantamab we used WAC pricing for the base-case findings. Comparator therapy prices were a function of one or more therapies on the market, inclusive of discounts, rebates (15% discount for comparator oral therapies based on FSS pricing schedule), patient assistance programs, and concessions to wholesalers and distributors. Patients that discontinued the CAR-T treatment before receiving the CAR-T infusion were not charged the CAR-T costs. Costs for subsequent therapies, including a proportion on palliative care, were assigned to the progressed state for 4 cycles using the appropriate comparator therapies for each population. The progressed state costs were consistent across treatment comparisons. Infusion therapies were subject to ASP + 6% pricing.

©Institute for Clinical and Economic Review, 2021 Page 157 Final Report – Multiple Myeloma
Table E.2.9. Drug Costs
Intervention (Dosage) WAC/List Price per Unit or per Time Period*
Net Price per Unit or per Time Period Source
Idecabtagene vicleucel $419,500 N/A Market analyst estimates82
Ciltacabtagene autoleucel Assumed same as ide-cel
N/A Assumption
Belantamab $8,277 per 100mg package
Micromedex Solutions45
Comparator therapies See Table E.2.3 and Table E.2.4
See Table E.2.3 and Table E.2.4
Multiple
*WAC as of March 25, 2021 Administration and Monitoring Costs
Tables E.2.10 through E2.12 detail administration and monitoring utilization and costs applied in the model. Table E.2.10 includes pre-infusion regimens and unit prices for CAR-T therapies. Table E.2.11 includes administration and monitoring utilization applied at different stages of the model. We used recent evidence in heavily pre-treated patients with multiple myeloma to inform average utilization inputs per cycle.83 We then applied unit prices from Table E.2.12 to each utilization parameter estimate. For hospital admissions we applied a fee-for-service approach.
Table E.2.10. Pre-Infusion Regimens for CAR-T Therapies
Treatment Regimen Unit Price Source
Cyclophosphamide 300 mg/mg(2) on days -5, -4, -3 $33
Munshi et al, 202010
Fludarabine 30 mg/m(2) on days -5, -4, -3 $50
Cytarabine 500 mg/m(2) for 2 days a week, 2 weeks total $1
Methotrexate 1000 mg/m(2) for 1 day a week, 2 weeks total $2

©Institute for Clinical and Economic Review, 2021 Page 158 Final Report – Multiple Myeloma
Table E.2.11. Administration and Monitoring Utilization
Model Stage Idecabtagene vicleucel
Ciltacabtagene autoleucel Belantamab Comparator Market Basket
of Therapies
Prior to and during therapy administration
• Leukapheresis • CRS-related
treatment • Inpatient days
(2 in ICU) • Neurotoxicity
adverse events
• Leukapheresis • CRS-related
treatment • Inpatient days
(2 in ICU) • Neurotoxicity
adverse events
• Ophthalmic examinations at baseline and prior to each dose
• Other AE-related costs
• IV administration costs • Other AE-related costs
Post-therapy monitoring; progression-free 83
• Complete blood count testing
• Liver function testing
• Complete blood count testing
• Liver function testing
• Treatment-specific outpatient visits per cycle
• Complete blood count testing each outpatient visit
• Liver function testing
• Treatment-specific outpatient visits per cycle
• Complete blood count testing each outpatient visit
• Liver function testing
Progressed disease83
• 4 cycles of subsequent treatment administration with market basket
• Complete blood count testing
• Liver function testing
• 4 cycles of subsequent treatment administration with market basket
• Complete blood count testing
• Liver function testing
• 4 cycles of subsequent treatment administration with market basket
• Complete blood count testing
• Liver function testing
• 4 cycles of subsequent treatment administration with market basket
• Complete blood count testing
• Liver function testing

©Institute for Clinical and Economic Review, 2021 Page 159 Final Report – Multiple Myeloma
Table E.2.12. Other Administration and Monitoring Unit Prices
Value Source Cost per hospital day* $3,190 HCUP Statistical Brief #12584 Cost per day in ICU $5,563 Dasta, 2005 85 Office visit $74 Physicians’ Fee and Coding Guide (HCPCS
code 99213)86 Leukapheresis (CAR-T only) $1,323 Physicians’ Fee and Coding Guide HCPCS
code 3651186 Intravenous treatment administration (first hour)
$140 Physicians’ Fee and Coding Guide (HCPCS code 96413)86
Intravenous treatment administration (each additional hour)
$29 Physicians’ Fee and Coding Guide (HCPCS code 96415)86
Visual acuity test $31 Physicians’ Fee and Coding Guide (HCPCS code 99173)86
Complete blood count test $44 Physicians’ Fee and Coding Guide (HCPCS code 85027)86
Slit lamp exam $110 Physicians’ Fee and Coding Guide (HCPCS code 92285)86
Liver function test $62 Physicians’ Fee and Coding Guide (HCPCS code 80076)86
*Inflated to 2020 USD Adverse Event Costs
The unit cost of adverse events applied to patients experiencing these events are shown in Table E.2.13. Adverse event costs were applied for the first two cycles of the model. Specific to CAR-T therapies, we relied on recent evidence that combined CRS and neurotoxicity events in different categories.28

©Institute for Clinical and Economic Review, 2021 Page 160 Final Report – Multiple Myeloma
Table E.2.13. Adverse Event Unit Costs
Adverse Event Parameter Mean Cost Source Anemia $2,007 Roy et al. 201587 Neutropenia $1,791 Roy et al. 201587 Thrombocytopenia $1,764 Roy et al. 201587 Leukopenia $3,045 Roy et al. 201587 Lymphopenia $3,102 Roy et al. 201587 Cytokine release syndrome $18,500 (grade 1) - $121,500 (grade 4) Hari et al. 202028 Hypercalcemia $193 Roy et al. 201587 Hypophosphatemia $193 Roy et al. 201587
*Inflated to 2020 USD Indirect Costs
A modified societal perspective was explored in a scenario analysis, and the below inputs informed that analysis to assess the impact on model outcomes. Table E.2.14. Indirect Cost Inputs for Modified Societal Perspective
Category Mean Source Average hourly wage $25.72 US BLS88 Transportation cost per administration*
$18.52 Ailawadhi et al. Clin Ther 201989
Patient workdays missed per administration
1 hour lost for each medical visit Ailawadhi et al. Clin Ther 201989
Employment rate 60.8% US BLS88
Description of evLYG Calculations
The cost per evLYG considers any extension of life at the same “weight” no matter what treatment is being evaluated. Below are the stepwise calculations used to derive the evLYG.
1. First, we attribute a utility of 0.851, the age- and gender-adjusted utility of the general population in the US that are considered healthy. 90
2. For each cycle (Cycle I) in the model where using the intervention results in additional years of life gained, we multiply this general population utility with the additional life years gained (ΔLYG).
3. We sum the product of the life years and average utility (cumulative LYs/cumulative QALYs) for Cycle I in the comparator arm with the value derived in Step 2 to derive the equal value of life years (evLY) for that cycle.

©Institute for Clinical and Economic Review, 2021 Page 161 Final Report – Multiple Myeloma
4. If no life years were gained using the intervention versus the comparator, we use the conventional utility estimate for that Cycle I.
5. The total evLY is then calculated as the cumulative sum of QALYs gained using the above calculations for each arm.
6. We use the same calculations in the comparator arm to derive its evLY.
Finally, the evLYG is the incremental difference in evLY between the intervention and the comparator arms.
E3. Undiscounted Results
Tables E.3.1 – E.3.3 present undiscounted results for all interventions and comparators.
Table E.3.1. Base-Case Undiscounted Results for Ide-Cel Compared to Population to Triple- or Quad-Refractory MM Comparator Market Basket (3+ prior lines of treatment)
Treatment Intervention Cost
Other non-intervention
costs
Total Cost QALYs Life
Years evLYGs
Incremental Results
Cost/QALY gained
Cost/LY gained
Cost per evLYG gained
Ide-Cel $466,000 $188,000 $654,000 2.47 3.30 2.66 $224,000 $286,000 $251,000
CAR-T Comparator Market Basket
$157,000 $127,000 $284,000 1.18 1.64 1.19
-
evLYG: equal-value of life years gained, QALYs: quality-adjusted life years gained

©Institute for Clinical and Economic Review, 2021 Page 162 Final Report – Multiple Myeloma
Table E.3.2. Preliminary Results for the Base-Case for Cilta-Cel Compared to Triple- or Quad-Refractory MM Comparator Market Basket (3+ prior lines of treatment)
Treatment Intervention Cost
Other non-intervention
costs
Total Cost QALYs Life
Years evLYGs
Incremental Results
Cost/QALY gained
Cost/LY gained
Cost per evLYG gained
Cilta-Cel* $445,000 $172,000 $617,000 2.57 3.34 2.74 $240,000 $197,000 $217,000
CAR-T Comparator Market Basket
$157,000 $127,000 $284,000 1.18 1.64 1.19
-
*using placeholder price for cilta-cel evLYG: equal-value of life years gained, QALYs: quality-adjusted life years gained
Table E.3.3. Results for the Base-Case for Belantamab Compared to Triple-, Quad-, or Penta- Refractory MM Comparator Market Basket (4+ prior lines of treatment)
Treatment Intervention Cost
Other non-intervention
costs
Total Cost QALYs Life
Years evLYGs
Incremental Results
Cost/QALY gained
Cost/LY gained
Cost per evLYG gained
Belantamab $155,000 $105,000 $260,000 1.21 1.68 1.24 $95,000 $68,000 $90,000 Belantamab Comparator Market Basket
$120,000 $101,000 $221,000 0.83 1.15 0.85
-
evLYG: equal-value of life years gained, QALYs: quality-adjusted life years gained
E4. Sensitivity Analyses
To demonstrate effects of uncertainty on both costs and health outcomes, we varied input parameters using available measures of parameter uncertainty (i.e., standard errors) or reasonable ranges to evaluate changes in cost per QALY.
We conducted one-way sensitivity analyses to identify the impact of parameter uncertainty and key drivers of model outcomes. Probabilistic sensitivity analyses were also be performed by jointly varying model parameters over 5000 simulations, then calculating 95% credible range estimates for each model outcome based on the results. We also performed threshold analyses for drug costs across a range of incremental cost-effectiveness ratios ($50,000, $100,000, $150,000, and $200,000 per QALY and evLYG).
Important input parameter drivers of model findings include progression-free survival for the active interventions, the unit price of the comparator market basket of therapies, and health state utility

©Institute for Clinical and Economic Review, 2021 Page 163 Final Report – Multiple Myeloma
values. When varying PFS, we assumed the same proportional relationship in terms of gains in OS. In the case of Ide-cel (Figure E.4.1 and Table E.4.1), higher PFS (and thus higher OS) leads to more favorable cost-effectiveness estimates but still do not meet commonly cited cost-effectiveness thresholds whereas lower PFS leads to less favorable cost-effectiveness estimates that do not meet commonly cited cost-effectiveness thresholds. When changing the price of the comparator market basket to the lower range, we find increases in the incremental cost-effectiveness ratio, and separately, decreases in the incremental cost-effectiveness ratio when the price of the comparator market basket is at the higher range. Utility of PFS (off treatment) was also a driver that led to increases in the incremental cost-effectiveness ratio at upper levels of the PFS utility (off treatment) and decreases in the incremental cost-effectiveness ratio at lower levels of utility. After varying multiple inputs simultaneously while running multiple iterations of the model, we found Ide-cel ranged from a lower bound incremental-cost effectiveness ratio that meets commonly cited cost-effectiveness thresholds to significantly higher incremental cost-effectiveness ratios above $1,000,000 per QALY (Table E.4.2 and Figure E.4.2).
Finally, given the sensitivity of progression-free and overall survival on model outcomes, we provide cost-effectiveness estimates using alternative survival extrapolations (Table E.4.3). Varying the distribution used to extrapolate survival resulted in incremental cost-effectiveness ratios of -36% from the base-case to above +490%. This sensitivity analysis should be interpreted with caution as some distributions may provide implausible estimates of long-run survival.
Figure E.4.1. Tornado Diagram for Ide-Cel

©Institute for Clinical and Economic Review, 2021 Page 164 Final Report – Multiple Myeloma
Table E.4.1. Tornado Diagram Inputs and Results for Ide-Cel versus Triple- or Quad-Refractory MM Comparator Market Basket (3+ prior lines of treatment)
Lower Cost-
Effectiveness Estimate
Upper Cost-Effectiveness
Estimate Lower Input* Upper Input*
Ide-Cel progression-free survival
$212,478 $836,482 6 12
Unit price of comparator basket
$264,180 $352,644 $17,083 $37,508
Proportion re-treated with CAR-T
$305,420 $333,805 0.16 0.24
Utility in progressed state
$307,436 $332,635 0.64 0.78
Utility of PFS (on treatment)
$311,466 $326,151 0.70 0.85
Dose intensity for comparator
$315,781 $329,000 0.83 1.00
Cost to manage grade 1 CRS
$315,981 $323,069 $10,573 $28,601
Cost to manage grade 2 CRS
$316,896 $321,902 $13,309 $36,005
Cost to manage CRS and NE <=2
$317,460 $321,182 $18,967 $51,310
*Note lower input may reflect either upper or lower ICER value depending on the direction that the input has on the ICER output. Table E.4.2. Results of Probabilistic Sensitivity Analysis for Ide-Cel versus Triple- or Quad-Refractory MM Comparator Market Basket (3+ prior lines of treatment)
Ide-Cel Comparator Basket Incremental
Mean Credible Range Mean Credible
Range Mean Credible Range
Total Total Costs $642,000 $500,000 -
$710,000 $277,000 $226,000 -
$340,000 $365,000 $208,000 -
$454,000 Total QALYs 2.30 1.30 – 3.67 1.08 1.00-1.15 1.22 0.20-2.55 ICER $393,000 $138,000 -
$1,200,000
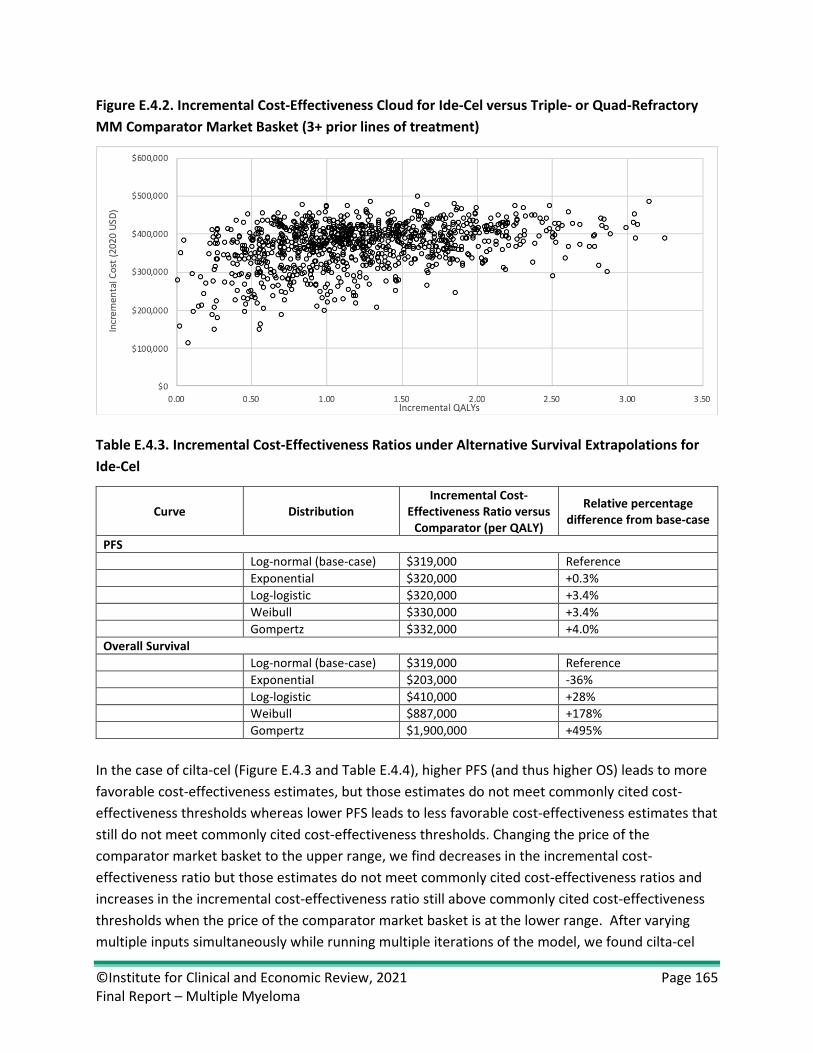
©Institute for Clinical and Economic Review, 2021 Page 165 Final Report – Multiple Myeloma
Figure E.4.2. Incremental Cost-Effectiveness Cloud for Ide-Cel versus Triple- or Quad-Refractory MM Comparator Market Basket (3+ prior lines of treatment)
Table E.4.3. Incremental Cost-Effectiveness Ratios under Alternative Survival Extrapolations for Ide-Cel
Curve Distribution Incremental Cost-
Effectiveness Ratio versus Comparator (per QALY)
Relative percentage difference from base-case
PFS Log-normal (base-case) $319,000 Reference Exponential $320,000 +0.3% Log-logistic $320,000 +3.4% Weibull $330,000 +3.4% Gompertz $332,000 +4.0% Overall Survival Log-normal (base-case) $319,000 Reference Exponential $203,000 -36% Log-logistic $410,000 +28% Weibull $887,000 +178% Gompertz $1,900,000 +495%
In the case of cilta-cel (Figure E.4.3 and Table E.4.4), higher PFS (and thus higher OS) leads to more favorable cost-effectiveness estimates, but those estimates do not meet commonly cited cost-effectiveness thresholds whereas lower PFS leads to less favorable cost-effectiveness estimates that still do not meet commonly cited cost-effectiveness thresholds. Changing the price of the comparator market basket to the upper range, we find decreases in the incremental cost-effectiveness ratio but those estimates do not meet commonly cited cost-effectiveness ratios and increases in the incremental cost-effectiveness ratio still above commonly cited cost-effectiveness thresholds when the price of the comparator market basket is at the lower range. After varying multiple inputs simultaneously while running multiple iterations of the model, we found cilta-cel

©Institute for Clinical and Economic Review, 2021 Page 166 Final Report – Multiple Myeloma
ranged from $204,000 per QALY to $305,000 per QALY (Table E.4.5). Based on limited clinical evidence, 0% of iterations for cilta-cel were below a threshold of $150,000 per QALY gained and 0% were below a threshold of $150,000 per evLYG gained (Tables E.4.6, E.4.7, and Figure E.4.4). However, this probabilistic analysis is limited in its incorporation of overall survival, therefore underestimates the range of uncertainty around lifetime outcomes and costs.
Finally, given the sensitivity of progression-free survival on model outcomes, we provide incremental cost-effectiveness ratios using alternative survival extrapolations (Table E.4.8). Varying the distribution used to extrapolate survival resulted in varying incremental cost-effectiveness ratios of -11% from the base-case of $253,000 to above 4%. This sensitivity analysis should be interpreted with caution as some distributions may provide clinically implausible estimates of progression-free survival. Furthermore, we did not capture all uncertainty in extrapolations given a publicly available overall survival curve was not available. The potential credible range around QALYs gained for cilta-cel would likely be larger given inclusion of uncertainty around overall survival. This limitation is in part addressed through the one-way sensitivity analysis that increased median OS at upper levels of PFS (Figure E.4.3). Please note for all cilta-cel sensitivity analyses that a placeholder price is used based on the list price of ide-cel.
Figure E.4.3. Tornado Diagram for Cilta-Cel
Table E.4.4. Tornado Diagram Inputs and Preliminary Results for Cilta-Cel versus Triple- or Quad-Refractory MM Comparator Market Basket (3+ prior lines of treatment)
Lower Cost-
Effectiveness Estimate
Upper Cost-Effectiveness Estimate Lower Input* Upper Input*
Cilta-Cel progression-free survival $129,007 $577,087 13 33 Unit price of comparator basket $203,094 $282,810 $17,083 $37,508

©Institute for Clinical and Economic Review, 2021 Page 167 Final Report – Multiple Myeloma
Utility of PFS (off treatment) $230,003 $286,018 0.73 0.89 Proportion re-treated with CAR-T cost applied $240,536 $265,531 0.16 0.24 Proportion re-treated with CAR-T $249,592 $261,504 0.83 1.00 Utility of PFS (on treatment) $247,040 $257,680 0.70 0.85 Cost to manage grade 1 CRS $249,351 $256,696 $10,573 $28,601 Cost to manage grade 2 CRS $249,428 $256,598 $13,309 $36,005 Utility in progressed state $250,069 $255,330 0.64 0.78 Cost to manage grade 4 CRS $251,714 $253,683 $69,468 $187,925
*Note lower input may reflect either upper or lower ICER value depending on the direction that the input has on the ICER output.

©Institute for Clinical and Economic Review, 2021 Page 168 Final Report – Multiple Myeloma
Table E.4.5. Preliminary Results of Probabilistic Sensitivity Analysis for Cilta-Cel versus Triple- or Quad-Refractory MM Comparator Market Basket (3+ prior lines of treatment)
Cilta-Cel Comparator Basket Incremental
Mean Credible Range Mean Credible Range Mean Credible Range
Total Total Costs
$609,000 $589,000 - $626,000
$277,000 $226,000 - $340,000
$331,000 $275,000 - $380,000
Total QALYs
2.40 2.22 – 2.57 1.08 1.00-1.15 1.32 1.16-1.46
ICER $253,000 $204,000 - $305,000
Table E.4.6. Preliminary Probabilistic Sensitivity Analysis Cost per QALY Gained Results: Cilta-Cel versus Triple-Class Refractory MM Comparator Market Basket (3+ prior lines of treatment)
Cost Effective at $50,000 per QALY
Cost Effective at $100,000 per
QALY
Cost Effective at $150,000 per
QALY
Cost Effective at $200,000 per
QALY Cilta-cel 0% 0% 0% 1.7%
Table E.4.7. Preliminary Probabilistic Sensitivity Analysis Cost per evLYG Gained Results: Cilta-Cel versus Triple-Class Refractory MM Comparator Market Basket (3+ prior lines of treatment)
Cost Effective at $50,000 per
evLYG
Cost Effective at $100,000 per
evLYG
Cost Effective at $150,000 per
evLYG
Cost Effective at $200,000 per
evLYG Cilta-cel 0% 0% 0% 10%

©Institute for Clinical and Economic Review, 2021 Page 169 Final Report – Multiple Myeloma
Figure E.4.4. Preliminary Incremental Cost-Effectiveness Cloud for Cilta-Cel versus Triple-Class Refractory MM Comparator Market Basket (3+ prior lines of treatment)
Table E.4.8. Preliminary Incremental Cost-Effectiveness Ratios under Alternative Survival Extrapolations for Cilta-Cel
Curve Distribution Incremental Cost-
Effectiveness Ratio versus Comparator (per QALY)
Relative percentage difference from base-case
PFS* Weibull (base-case) $252,000 Reference Exponential $224,000 -11.3% Log-logistic $238,000 -5.9% Log-normal $228,000 -9.6% Gompertz $264,000 +4.7%
*Variation in overall survival not included; OS was modeled based on PFS relationship given there was no available overall survival curve
In the case of belantamab (Figure E.4.5 and Table E.4.11), the model results were most sensitive to progression-free survival and the price of the comparator market basket, specifically the market basket of triple- or quad-refractory comparators. Higher PFS (and thus higher survival overall) led to decreases in the incremental cost-effectiveness ratio whereas lower PFS resulted in incremental cost-effectiveness ratios that exceeded commonly cited cost-effectiveness thresholds. Higher prices for the comparator market basket drove the incremental cost-effectiveness ratio toward a scenario where belantamab was less costly and more effective whereas lower prices drove the incremental cost-effectiveness ratio above commonly cited cost-effectiveness thresholds. Note that specific parameters for the triple-, quad- and penta-refractory market basket subsets are presented separately because the proportion of belantamab patients who were penta-refractory was submitted as academic-in-confidence).

©Institute for Clinical and Economic Review, 2021 Page 170 Final Report – Multiple Myeloma
After varying multiple inputs simultaneously while running multiple iterations of the model, we found belantamab ranged from less costly and more effective to incremental cost-effectiveness ratios that exceeded commonly cited cost-effectiveness thresholds (Table E.4.10, Table E.4.11, Table E.4.12, and Figure E.4.6). Overall model sensitivity is also illustrated here; for example, despite a base case estimate of $98,000 per QALY, only 50% of iterations in the probabilistic analysis yielded a similar result (i.e., $100,000 per QALY).
Figure E.4.5. Tornado Diagram for Belantamab
Table E.4.9. Tornado Diagram Inputs and Results for Belantamab versus Triple-, Quad-, or Penta- Refractory MM Comparator Market Basket (4+ prior lines of treatment)
Lower Cost-
Effectiveness Estimate
Upper Cost-Effectiveness Estimate Lower Input* Upper Input*
Belantamab Progression-Free Survival (months)
$62,300 $276,000 2 4
Unit Price of triple/quad comparator basket
Dominant (less costly, more effective)
$164,000 $17,083 $37,508
Unit Price of penta-refractory comparator basket
$83,400 $112,100 $16,626 $24,629
Dose intensity for triple/quad comparator
$92,800 $117,000 0.83 1.00
Utility in progressed state
$92,200 $105,400 0.64 0.78
Utility of PFS (on treatment)
$95,000 $102,000 0.70 0.85
*Note lower input may reflect either upper or lower ICER value depending on the direction that the input has on the ICER output.

©Institute for Clinical and Economic Review, 2021 Page 171 Final Report – Multiple Myeloma
Table E.4.10. Results of Probabilistic Sensitivity Analysis for Belantamab versus Triple-, Quad-, or Penta- Refractory MM Comparator Market Basket (4+ prior lines of treatment)
Belantamab Comparator Basket Incremental
Mean Credible Range Mean Credible
Range Mean Credible Range
Total Total Costs $254,000 $236,000 -
$270,000 $217,000 $151,000 -
$291,000 $36,000 -$5,000 -
$68,000 Total QALYs 1.16 0.91 – 1.41 0.78 0.72-0.84 0.38 0.14-0.60 ICER $97,000 Less costly,
more effective - $275,000
Table E.4.11. Probabilistic Sensitivity Analysis Cost Per QALY Gained Results: Belantamab versus Triple-, Quad-, or Penta- Refractory MM Comparator Market Basket (4+ prior lines of treatment)
Cost Effective at $50,000 per QALY
Cost Effective at $100,000 per
QALY
Cost Effective at $150,000 per
QALY
Cost Effective at $200,000 per
QALY Belantamab 17% 50% 78% 91%
QALY: quality-adjusted life years gained Table E.4.12. Probabilistic Sensitivity Analysis Cost Per evLYG Gained Results: Belantamab versus Triple-, Quad-, or Penta- Refractory MM Comparator Market Basket (4+ prior lines of treatment)
Cost Effective at $50,000 per
evLYG
Cost Effective at $100,000 per
evLYG
Cost Effective at $150,000 per
evLYG
Cost Effective at $200,000 per
evLYG Belantamab 18% 55% 81% 92%
evLYG: equal-value life years gained

©Institute for Clinical and Economic Review, 2021 Page 172 Final Report – Multiple Myeloma
Figure E.4.6. Incremental Cost-Effectiveness Cloud for Belantamab versus Triple-, Quad-, or Penta- Refractory MM Comparator Market Basket (4+ prior lines of treatment)
E5. Scenario Analyses
We conducted scenario analyses that include:
1. Assuming no additional charge for CAR-T retreatment, while continuing to assume administration, monitoring, and side-effect management costs for patients receiving a second infusion
2. Modified societal perspective that includes components such as productivity losses 3. Adjusting the proportional relationship between PFS and OS for belantamab to be within a
similar range as a recent meta-analyses.37
Scenario Analysis 1
Scenario analysis 1 is presented in the main report.
Scenario Analysis 2
We ran a modified societal perspective that included productivity losses and transportation time to and from health care appointments (see Table E.2.15 for unit costs).

©Institute for Clinical and Economic Review, 2021 Page 173 Final Report – Multiple Myeloma
Table E.5.1. Incremental Cost-Effectiveness Ratios for Scenario Analysis 2
Treatment Comparator Cost per QALY Gained
Cost per Life Year Gained
Cost per evLYG
Cost per Month of PFS
Gained Ide-cel CAR-T
Comparator Market Basket
$319,000 $250,000 $280,000 $35,000
Cilta-cel CAR-T Comparator Market Basket
$252,000 $207,000 $228,000 $17,000
Belantamab Belantamab Comparator Market Basket
$99,000 $70,000 $93,000 $18,000
evLYG: equal-value of life years gained, QALY: quality-adjusted life year, LY: life years
Scenario Analysis 3
Recent evidence synthesis in multiple myeloma suggests a proportional relationship between PFS and OS consistent with a 2.5-3.0 month gain in OS for every 1 month gain in PFS.37,38 While both CAR-T therapies were within the range of these proportional relationships, evidence from the DREAMM-2 trial suggests a nearly five month gain for every one month gain in PFS. We ran a scenario analysis that adjusted the relationship between PFS and OS for belantamab to be consistent with prior published data. In this scenario, belantamab adjusted OS estimates were set at an approximate median of 9 months (vs. 13.7 months from the trial). This scenario suggests belantamab is more costly and less effective than the market basket comparator. (Table E.5.2).
Table E.5.2. Incremental Cost-Effectiveness Ratios for Scenario Analysis 3
Treatment Comparator Cost per QALY Gained
Cost per Life Year Gained Cost per evLYG
Cost per Month of PFS
Gained Belantamab Belantamab Comparator
Market Basket Dominated (more costly, less effective)
Dominated (more costly, less effective)
Dominated (more costly, less effective)
$17,000
evLYG: equal-value of life years gained, QALY: quality-adjusted life year, LY: life years, PFS: progression-free survival
E6. Heterogeneity and Subgroups
We considered estimating costs and health outcomes among relevant subgroups, such as patients with genetic factors that put them at particularly high risk as well as subgroups defined by race. Due to small patient numbers and the lack of data on survival, health-related quality of life, and health care costs stratified by these subgroups, we were not able to conduct subgroup analyses.

©Institute for Clinical and Economic Review, 2021 Page 174 Final Report – Multiple Myeloma
E7. Model Validation
Model validation followed standard practices in the field. We tested all mathematical functions in the model to ensure they were consistent with the report (and supplemental materials). We also conducted sensitivity analyses with null input values to ensure the model was producing findings consistent with expectations. Further, independent modelers tested the mathematical functions in the model as well as the specific inputs and corresponding outputs.
Model validation was also conducted in terms of comparisons to other model findings. We searched the literature to identify models that were similar to our analysis, with comparable populations, settings, perspective, and treatments.
We used several approaches to validate the model. First, we provided preliminary model structure, methods and assumptions to manufacturers, patient groups, and clinical experts. Based on feedback from these groups, we refined data inputs used in the model, as needed. We also performed calibration techniques that fit survival estimates to observed findings from trials and other evidence in MM. Second, we varied model input parameters to evaluate face validity of changes in results. We performed model verification for model calculations using internal reviewers. As part of ICER’s efforts in acknowledging modeling transparency, we also are sharing the model with the relevant manufacturers for external verification around the time of publishing the draft report for this review. During the model transparency process manufacturers noted we underestimated survival for ide-cel and the CAR-T comparator market basket (which also impacted a percentage of the comparator to belantamab). These changes were reflected in the final model calculations. Finally, we compared results to other cost-effectiveness models in this therapy area. The outputs from the model were validated against the trial/study data of the interventions and also any relevant observational datasets.
E8. Prior Economic Models
We found prior economic models in multiple myeloma through two recent systematic literature reviews.39,91 While the most recent review identified 17 publications,39 the majority were assessing therapies in the first or second line setting. One publication that assessed the third line of therapy was based on the prior ICER review in multiple myeloma.40 Carlson et al. estimated the cost-effectiveness of second- and third-line therapies in RRMM. The Carlson et al. analysis had the advantage of a network meta-analysis to combine evidence on indirect comparisons across regimens of interest which was not available in this analysis. Therefore, this previous study allowed for direct application of hazard ratios to PFS and OS curves. Our analysis instead separately estimated and extrapolated survival outcomes by treatment arm in the model given the lack of an available indirect treatment comparison. For sensitivity analyses, instead of applying a hazard ratio we varied the shape and scale parameters on the active interventions, while fixing the comparator

©Institute for Clinical and Economic Review, 2021 Page 175 Final Report – Multiple Myeloma
arm. While the approach to estimate our base-case and sensitivity analyses was different than Carlson et al., both studies found considerable uncertainty on whether therapies were cost-effective at various commonly cited thresholds. It should be noted the Carlson et al. analysis was based on second- and third-lines of therapy versus this analysis that is focused on TCRMM patients that failed at least three lines of therapy. Therefore, direct comparisons on QALYs, LYs, and other outcomes should not be made between studies.
Studies by Ailawadhi et al. and Roy et al. informed our market basket cost calculations.87,89 Specifically, the approach used to identify regimen dosing each cycle along with identifying and costing adverse events informed our market basket calculation. In some cases, the combination of therapies was different so caution should be used when comparing the total cost estimates between studies. The most recent evidence from Ailawadhi et al. found total costs ranging from approximately $93,000 to $315,000 for common second-line regimens. While these estimates are for earlier line therapies, some of the reported regimens are approved for later lines of therapy and were used in our market basket calculations. For example, our total cost estimation for the CAR-T market basket of comparators was approximately $150,000 (discounted) over a lifetime horizon which is within the range reported by Ailawadhi et al. We further varied the market basket cost and found the cost of comparators to be a key driver of model results.

©Institute for Clinical and Economic Review, 2021 Page 176 Final Report – Multiple Myeloma
F. Potential Budget Impact: Supplemental Information
ICER’s methods for estimating potential budget impact are described in detail elsewhere and have recently been updated.92,93 The intent of our revised approach to potential budgetary impact is to document the percentage of patients that could be treated at selected prices without crossing a budget impact threshold that is aligned with overall growth in the US economy.
Briefly, we evaluate whether a new drug would take market share from one or more existing treatments and calculate the blended potential budget impact associated with displacing use of existing therapies with the new intervention. In this analysis, we assumed that patients eligible for the interventions under review in this analysis would otherwise have been treated with the comparator treatment(s).
Using this approach to estimate potential budget impact, we then compared our estimates to an updated budget impact threshold that represents a potential trigger for policy mechanisms to improve affordability, such as changes to pricing, payment, or patient eligibility. As described in ICER’s methods presentation (https://icer-review.org/methodology/icers-methods/icer-value-assessment-framework-2/), this threshold is based on an underlying assumption that health care costs should not grow much faster than growth in the overall national economy. From this foundational assumption, our potential budget impact threshold is derived using an estimate of growth in US gross domestic product (GDP) +1%, the average number of new drug approvals by the FDA over the most recent two-year period, and the contribution of spending on retail and facility-based drugs to total health care spending. For reports begun in 2019-2020, the five-year annualized potential budget impact threshold that should trigger policy actions to manage access and affordability is calculated to total approximately $819 million per year for new drugs.
All costs used in the potential budget impact model were undiscounted and estimated over a five-year time horizon. This potential budget impact analysis included the estimated number of individuals in the US who would be eligible for treatment described earlier in the report. We assumed 20% of these patients would initiate treatment in each of the five years

©Institute for Clinical and Economic Review, 2021 Page 177 Final Report – Multiple Myeloma
Results
Table F.1. Cumulative Net Cost per Patient Treated with Belantamab at Wholesale Acquisition Cost Over a Five-Year Time Horizon
Belantamab Year Additional Costs per Year (non-cumulative) Cumulative Cost
Year 1 $5,613 $5,613 Year 2 $23,914 $29,527 Year 3 $7,384 $36,911 Year 4 $1,908 $38,819 Year 5 $390 $39,209
Table F.2. Cumulative Net Cost per Patient Treated with Ide-cel at List Price
Ide-cel Year Additional Costs per Year (non-cumulative) Cumulative Cost
Year 1 $354,339 $354,339 Year 2 -$152 $354,187 Year 3 $4,361 $358,548 Year 4 $3,297 $361,845 Year 5 $2,270 $364,115
Table F.3. Cumulative Net Cost per Patient Treated with Cilta-cel at Placeholder Price
Cilta-cel Year Additional Costs per Year (non-cumulative) Cumulative Cost
Year 1 $289,662 $289,662 Year 2 $3,051 $292,713 Year 3 $16,978 $309,691 Year 4 $12,566 $322,257 Year 5 $7,061 $329,318

©Institute for Clinical and Economic Review, 2021 Page 178 Final Report – Multiple Myeloma
G. Public Comments This section includes summaries of the public comments prepared for the Midwest CEPAC Public Meeting on April 16, 2021. These summaries were prepared by those who delivered the public comments at the meeting and are presented in order of delivery.
A video recording of all comments can be found here. Conflict of interest disclosures are included at the bottom of each statement for each speaker.
Kyna Gooden, PhD, MPH Executive Director, WW HEOR Markets- US Hematology & CAR T Bristol Myers Squibb
Idecabtagene vicleucel, or ide-cel, is a CAR T cell therapy approved by the FDA as Abecma®. Abecma is approved for the treatment of adult patients with relapsed or refractory multiple myeloma after four or more prior lines of therapy.1 Abecma is a breakthrough CAR T cell therapy that offers patients a potentially transformative personalized therapy.
There are a number of issues with ICER’s approach to evaluating clinical and cost effectiveness that extend to this review and the findings of the evidence report:
• Assessments announced in the early stages of a medicine’s lifecycle, including prior to FDA approval, face a high level of uncertainty and can be fraught with error given the fast-evolving body of scientific evidence.
• Timelines for such assessments do not afford ICER time to develop a full understanding of the disease area and existing clinical evidence, which in turn can lead to methodological errors or oversights by ICER, as we saw in this review.
• This assessment lacked transparency and did not provide all model assumptions for the base case.
• Finally, this assessment included two particularly notable methodological errors: ICER’s overestimation of retreatment impact and an underestimation of overall survival.
ICER overestimated the impact of retreatment
ICER’s assumptions regarding cost of retreatment are based on a misguided interpretation of data from the KarMMa study.2 While some patients were retreated with Abecma, responses were infrequent and less durable when compared to initial treatment.3 Based on this limited clinical trial experience, it is not appropriate to assume retreatment would be pursued in the real-world setting. In ICER’s scenario analysis, patients who were retreated were assigned full costs associated with CAR T in the ICER model, such as infusion and other resource utilization. ICER failed to solicit key information relating to retreatment from us or clinical experts, leading to an overestimation of overall costs.
ICER underestimated overall survival
Overall survival is the clinical gold standard used by many Health Technology Assessments (HTAs) for

©Institute for Clinical and Economic Review, 2021 Page 179 Final Report – Multiple Myeloma
measuring a patient’s response to a medicine. The underestimation of overall survival led to lower QALYs attributed to Abecma and an overall underestimation of its value.
Specifically, ICER inappropriately used progression-free survival to estimate overall survival and ignored evidence from the Phase 1 CRB-401 study. CRB-401 demonstrated a median overall survival of 34.2 months with Abecma,4 yet ICER used a median overall survival of 19.4 months in their assessment. Using that estimate underappreciated the clinical value of Abecma. For a more accurate representation of patient impact, ICER should have used CRB- 401 data to calibrate and validate the survival predictions.
Abecma’s impact on patients’ overall survival is supported by data in the KarMMa trial, published in the New England Journal of Medicine. Twelve-month overall survival was 78% of 128 patients, with 33% continuing to exhibit a complete response after a median follow-up of 13.3 months.5
BMS is committed to advancing transformative therapies, like Abecma; we are also committed to ensuring the value of these therapies is assessed in a scientifically sound manner, based on relevant current data and represents effective partnership across stakeholders throughout the review process. We remain confident in the value of Abecma and the hope it brings to patients and the future of multiple myeloma treatments.
Dr. Gooden is a full-time employee of Bristol Myers Squibb. ________________________________________________________________________________ 1 ABECMA® [package insert]. Summit, NJ; Celgene Corporation, a Bristol Myers Squibb Company. 2021 2 Lee SJ, McQueen RB, Beinfeld M, Fluetsch N, Whittington MD, Pearson SD, Ollendorf DA. Anti B-Cell Maturation Antigen CAR T-cell and Antibody Drug Conjugate Therapy for Heavily Pre-Treated Relapsed and Refractory Multiple Myeloma; Evidence Report. Institute for Clinical and Economic Review, April 5, 2021 https://icer.org/assessment/multiple-myeloma-2021/#timeline. 3 Supplement to: Munshi et al. Idecabtagene Vicleucel in Relapsed and Refractory Multiple Myeloma. N Engl J Med 2021; 384:705-16. 4 Lin et al Idecabtagene Vicleucel (ide-cel, bb2121), a BCMA-Directed CAR T Cell Therapy, in Patients RRMM: Updated Results from Phase 1 CRB-401 Study, ASH 2020 (poster 131) 5 Munshi NC et al. N Engl J Med 2021; 384:705-16. DOI: 10.1056/NEJMoa2024850.

©Institute for Clinical and Economic Review, 2021 Page 180 Final Report – Multiple Myeloma
Ira Gupta, MD, GlaxoSmithKline Vice President, Medicines Development Leader
Relapsed/refractory multiple myeloma is both incurable and devastating for those living with the disease and their loved ones. There is significant unmet need in this late line indication, where patients often run out of possible effective treatments and have very poor survival outcomes. According to ICER’s comparator in this report, the median overall survival is only 7.7 months. Most treatments are triplet combination therapies, with limited late line data. Patients suffering from this incurable disease need additional options.
BLENREP or Belantamab mafodotin is the first anti-BCMA therapy approved in multiple myeloma. It is an off-the-shelf, single agent therapy with a novel mechanism of action. In the pivotal DREAMM-2 trial, patients who were administered the approved dose of 2.5 mg/kg every three weeks, had a median overall survival of 13.7 months - 6 months longer than the survival of ICER’s standard of care comparator. The DREAMM-2 population was 100% triple refractory, and heavily pre-treated with a median of 7 prior lines of therapies. In a late line population, with an expected overall survival of only 7.7 months, a key parameter to consider is duration of response. Of the one third of patients that responded, patients experienced a clinically meaningful duration of response with a median of 11 months.
With respect to the ocular adverse events in DREAMM-2, no permanent complete vision loss was reported, and only 3 patients discontinued due to corneal events. 18% of patients experienced clinically meaningful changes in visual acuity, as defined by loss in visual acuity to 20/50 or worse in the better-seeing eye. Ocular events in the DREAMM-2 trial, were resolved via dose holds and reductions, and are not likely to be associated with a high cost of management with no patients experiencing hospitalization due to ocular events. We also note that the overall 10% discontinuation due to adverse events in DREAMM-2 is lower than the 14-18% rates cited for the 3 usual care regimes in table 3.7 of ICER’s report.
ICER’s comparison of the BLENREP median PFS and median OS reported in DREAMM-2 to a fixed ratio is not conventional when OS data is available from a clinical trial. Additionally, ICER cites a PFS:OS ratio derived from 2 sources (Felix 2013, Dimopoulos 2017), which are based on populations that are not comparable late line relapsed refractory populations. In Felix 2013, the paper ICER cited, most patients were treatment naïve, and the authors themselves suggest their model is ‘less suitable for predicting median OS in relapsed/refractory MM’. Dimopoulos 2017 is a conference abstract with no transparency to the underlying sources, but the average median PFS of 8.3 months and OS of 24.3 months shows patients are in much earlier lines, where the ratio may be very different. Among the few relapsed refractory phase 3 trial arms in Felix 2013, the average ratio of median time to progression (mTTP) to OS was in fact 5.3 times, with a range of 2.8 to 6.9 times (including Richardson 2007 dexamethasone: 6.8x, Richardson 2007 bortezomib: 4.8x, and Dimopoulos 2009 dexamethasone: 6.9x). Far from being an ‘outlier compared to all other MM

©Institute for Clinical and Economic Review, 2021 Page 181 Final Report – Multiple Myeloma
treatments’, the DREAMM-2 trial PFS:OS ratio is actually consistent with the data from the comparable trial populations in ICER’s citation.
In terms of patient quality of life, ICER notes BLENREP treatment was associated with stable health-related quality of life, with trends toward improvement in some domains. Patients entering the DREAMM-2 trial had low baseline quality of life scores, lower than reported in all other multiple myeloma trials. The appropriate expectation versus baseline in such a heavily pre-treated population should be one of maintenance of quality of life, and treatment with BLENREP meets or exceeds this expectation.
As an FDA-approved regimen, BLENREP has undergone detailed benefit-risk assessment, and the FDA oncology drug advisory committee (ODAC), which includes oncologists, ophthalmologists, patients etc., voted 12 to zero in favor of the positive benefit-risk profile. This was based on deep and durable responses with the monotherapy that led to significantly improved survival compared to the standard of care and a manageable safety profile.
To conclude, BLENREP offers patients with heavily pre-treated multiple myeloma a much needed and innovative treatment option. Thank you for your time and the opportunity to comment on behalf of GSK.
Dr Gupta is a full-time employee of GlaxoSmithKline.

©Institute for Clinical and Economic Review, 2021 Page 182 Final Report – Multiple Myeloma
David Hendricks Patient Expert
In 2010, I was diagnosed with MGUS. It rapidly progressed and I was referred to Dr. Thomas Martin at UCSF in 2011. When I met him, he confirmed that I had myeloma and told me that "This is the start of a long relationship" (between him and me). This was very reassuring, given how terrified and stressed out I was at the time. My myeloma was progressing fast, so I started treatment later that year. I was on my first cocktail of Revlimid/Velcade/Dexamethasone for a year. It put me into remission and I stayed on Revlimid for maintenance until 2015. I was in CR starting in 2014, but in 2016 the myeloma started coming back.
When it came back, I took several cocktails, some of which worked for a while and some that didn't. In 2017 I was on Ixazomib/Revlimid/Dex for five cycles, but it didn't work. In late 2017 I started on Daratumumab/Pomalidomide/Dex, which was much nicer because I had fewer side effects than with the previous therapies, but unfortunately it didn't work either. My myeloma progressed to the point that I got some compression fractures in my spine in spring 2018. This was a miserable time for me - my back pain was continuous and it was very painful to get from my bed into an upright position. I had two kyphoplasties to repair three vertebrae in my back.
In summer 2018 I started on Carfilzomib/Cytoxan/Dex, which worked very well at first. I didn't get into remission, however, and after my numbers bottomed out in May 2019, they started trending up again.
At this point my myeloma was steadily getting worse and I was refractory to four different cocktails. Dr. Martin proposed that I participate in the CARTITUDE-1 clinical trial, and I accepted.
I got the CAR-T infusion at UCSF on Nov 20, 2019 and was in the hospital for two weeks after that. I felt fine the first couple of days after the infusion, but on the fifth day I got worse and then was very sick with a fever for four days. In retrospect they told me I had had Level 2 Cytokine Release Syndrome. Fortunately, they were able to treat it without sending me to the ICU.
After leaving the hospital, I slowly regained my energy. I went back to work a month after getting discharged and resumed a normal life.
I did have some lingering side effects from the CAR-T infusion. There was swelling in my ankles and feet for a few months. More significantly, I lost my sense of smell. I remember the odors I used to recognize, but now everything smells the same. The odor is hard to define, but it's kind of a soapy smell. Strong odors come across as a more intense version of the same smell. My sense of smell hasn't come back, but I don't mind. I accept this as a small price to pay for all the benefits I've gotten.

©Institute for Clinical and Economic Review, 2021 Page 183 Final Report – Multiple Myeloma
My quality of life has improved greatly since the CAR-T infusion. I always had problems with sleep and digestion in the years I was in chemotherapy, and those problems are all gone now. I no longer have the intermittent nausea, the frequent constipation, the violent reactions to something I ate, the fragmented sleep with an upset stomach, not to mention the inability to sleep after taking Dex.
During the chemo years I would get a vacation from the chemo when my wife and I went to France for a few weeks in the summer. I always felt wonderful when I was on vacation. I slept well and could eat what I wanted. I wondered if it was because I wasn't working, or because the food was better in France, or because I wasn't on chemo. In retrospect, I think all factors contributed, but the lack of chemo was probably the biggest factor. Being on chemo for extended periods of time is really draining and lowers your quality of life.
I'm so thankful to have participated in the CAR-T trial. Life without chemotherapy is wonderful and I've been off it for 17 months now. It's like being on vacation all the time.
I don't know if I'm technically in CR, but my M-spike is zero and my counts are all OK. Dr. Martin tells me that the remission probably won't last forever, but I'm not worrying about it. I'm enjoying life and grateful for every month of it.
No financial conflicts to disclose.

©Institute for Clinical and Economic Review, 2021 Page 184 Final Report – Multiple Myeloma
H. Conflict of Interest Disclosures Tables H1 through H3 contain conflict of interest (COI) disclosures for all participants at the April 16, 2021 Public meeting of Midwest CEPAC.
Table H1. ICER Staff and Consultants and COI Disclosures
ICER Staff and Consultants* Molly Beinfeld, MPH Research Lead, Evidence Synthesis, ICER
Sei J. Lee, MD, MAS Professor of Medicine University of California, San Francisco
Noemi Fluetsch, MPH Research Assistant, Health Economics and Outcomes Research, ICER
R. Brett McQueen, PhD Assistant Professor, University of Colorado Anschutz Medical Campus
Monica Frederick, BS Program and Event Coordinator, ICER
Daniel A. Ollendorf, PhD Director, Value Measurement & Global Health Initiatives Tufts Medical Center
Eric Gutierrez, MPH Statistical Analyst, University of Colorado Anschutz Medical Campus
Liis Shea, MA Program Manager, ICER
Belen Herce - Hagiwara, BA Research Assistant, ICER
Melanie D. Whittington, PhD, MS Associate Director of Health Economics, ICER
Sue Kwon, BS Graduate Research Assistant, University of Colorado Anschutz Medical Campus
Steven D. Pearson, MD, MSc President, ICER
*No relevant conflicts of interest to disclose, defined as more than $10,000 in healthcare company stock or more than $5,000 in honoraria or consultancies during the previous year from health care manufacturers or insurers.

©Institute for Clinical and Economic Review, 2021 Page 185 Final Report – Multiple Myeloma
Table H2. Midwest CEPAC Panel Member Participants and COI Disclosures
Participating Members of Midwest CEPAC Alan Balch, PhD* Chief Executive Officer, Patient Advocate Foundation, National Patient Advocate Foundation
Elbert Huang, MD, MPH, FACP* Professor of Medicine, Director, Center for Chronic Disease Research and Policy, University of Chicago Associate Director of the Chicago Center for Diabetes Translation Research, University of Chicago
Nick Bagley, JD* Professor of Law, the University of Michigan Law School
Jill Johnson, PharmD* Professor, Department of Pharmacy Practice, University of Arkansas for Medical Sciences College of Pharmacy
Bijan Borah, PhD* Professor of Health Services Research, Mayo Clinic College of Medicine and Science
Bradley Martin, PharmD, PhD* Professor, Division of Pharmaceutical Evaluation and Policy, University of Arkansas for Medical Sciences College of Pharmacy
Angela Brown, MPH* Chief Executive Officer, St. Louis Regional Health Commission (RHC)
Tim McBride, PhD* Co-Director, Center for Health Economics and Policy Professor, Brown School, Washington University in St. Louis
Kurt Vanden Bosch, PharmD* System Formulary Manager, St. Luke’s Health System, Idaho
Reem Mustafa, MD, MPH, PhD* (Chair) Associate Professor of Medicine, Division of Nephrology and Hypertension, and Director, Outcomes and Implementation Research, University of Kansas Medical Center
Gregory Curfman, MD* Deputy Editor, JAMA
Rachel Sachs, JD, MPH* Associate Professor of Law, Washington University in St. Louis
Stacie B. Dusetzina, PhD* Associate Professor of Health Policy, Ingram Associate Professor of Cancer Research, Vanderbilt University School of Medicine
Stuart A. Winston, DO* Cardiologist in the Sub-Specialty of Cardiac Electrophysiology, St. Joseph Mercy Health System Physician Lead: Patient Experience, Quality Improvement Integrated Health Associates, St. Joseph Mercy Health System
Yngve Falck-Ytter, MD, AGAF* Professor of Medicine, Case Western Reserve University; Chief, Gastroenterology and Hepatology VA Northeast Ohio Healthcare System, Cleveland
*No relevant conflicts of interest to disclose, defined as more than $10,000 in healthcare company stock or more than $5,000 in honoraria or consultancies during the previous year from health care manufacturers or insurers.

©Institute for Clinical and Economic Review, 2021 Page 186 Final Report – Multiple Myeloma
Table H3. Policy Roundtable Participants and COI Disclosures
Policy Roundtable Member Conflicts of Interest Tom Bellfort, Patient Expert No conflicts to disclose. Harold Carter, PharmD, Vice President, Pharma Contracting, Strategy & Wholesale Markets, Express Scripts
Harold Carter is a full-time employee of Express Scripts.
Anita D’Souza, MD, MS, Associate Professor of Medicine, Medical College of Wisconsin
Anita D’Souza has received institutional research funding from Sanofi, TeneoBio, Takeda, and Caelum. D’Souza reports advisory board roles with Akcea, Imbrium Therapeutics and Pfizer and received consulting honoraria from Janssen.
Ira Gupta, MD, Vice President & Medicine Development Leader, GlaxoSmithKline R&D, Oncology
Ira Gupta is a full-time employee of GSK.
David Mitchell, Patient Expert Founder, Patients For Affordable Drugs
David Mitchell is on the Board of Directors of Friends of Cancer Research which receives grants from BMS, bluebird Bio, and Janssen. He received honoraria from the FDA for his service on the Oncologic Drugs Advisory Committee and was part of a class action suit against Celgene to which he received a service award.
S. Vincent Rajkumar, MD, Edward W. and Betty Knight Scripps Professor of Medicine, Mayo Clinic, Rochester, MN
S. Vincent Rajkumar has held a position as a member of the Board of Directors for the International Myeloma Foundation.
Melissa Pozotrigo, PharmD, BCOP Senior Clinical Oncology Pharmacist, Oncology Analytics Inc.
Melissa Pozotrigo is a full-time employee of Oncology Analytics.

©Institute for Clinical and Economic Review, 2021 Page 187 Final Report – Multiple Myeloma
References 1. National Cancer Institute. Cancer Stat Facts: Myeloma.
https://seer.cancer.gov/statfacts/html/mulmy.html. Accessed September 14, 2020. 2. Rajkumar SV. Multiple myeloma: 2020 update on diagnosis, risk-stratification and management.
American journal of hematology. 2020;95(5):548-567. 3. Mikhael J. Treatment Options for Triple-class Refractory Multiple Myeloma. Clin Lymphoma
Myeloma Leuk. 2020;20(1):1-7. 4. Rajkumar SV. Multiple myeloma: Regimens used for relapsed or refractory disease. Published
2020. Accessed. 5. Munshi NC, Anderson JLD, Shah N, et al. Presentation 8503: Idecabtagene vicleucel (ide-cel;
bb2121), a BCMA-targeted CAR T-cell therapy, in patients with relapsed and refractory multiple myeloma (RRMM): Initial KarMMa results. Journal of Clinical Oncology; 2020/05/20, 2020.
6. Madduri D, Berdeja J, Usmani S, et al. CARTITUDE 1: Phase 1b/2 Study of Ciltacabtagene Autoleucel, a B-Cell Maturation Antigen–Directed ChimericAntigen Receptor T Cell Therapy, in Relapsed/Refractory Multiple Myeloma (Oral Presentation #177). https://drive.google.com/file/d/1qJ62T7kjvqf5w8yA2ewgACC0SKXz1qo9/view. Published 2020. Updated December 7, 2020. Accessed December 8, 2020.
7. Gandhi UH, Cornell RF, Lakshman A, et al. Outcomes of patients with multiple myeloma refractory to CD38-targeted monoclonal antibody therapy. Leukemia. 2019;33(9):2266-2275.
8. Lonial S, Lee HC, Badros A, et al. Belantamab mafodotin for relapsed or refractory multiple myeloma (DREAMM-2): a two-arm, randomised, open-label, phase 2 study. Lancet Oncol. 2020;21(2):207-221.
9. Lonial S, Lee HC, Badros A, et al. Pivotal DREAMM-2 Study: Single-agent Belantamab Mafodotin (GSK2857916) in Patients With Relapsed/Refractory Multiple Myeloma (RRMM) Refractory to Proteasome Inhibitors (PIs), Immunomodulatory Agents, and Refractory and/or Intolerant to Anti-CD38 Monoclonal Antibodies (mAbs). ASCO. 2020.
10. Laubach JP. Multiple myeloma: Clinical features, laboratory manifestations, and diagnosis. Kyle, Robert A Rajkumar, Vincent S. https://www.uptodate.com/. Published 2021. Updated January 15, 2021. Accessed January 16, 2021.
11. Kyle RA, Therneau TM, Rajkumar SV, Larson DR, Plevak MF, Melton LJ, 3rd. Incidence of multiple myeloma in Olmsted County, Minnesota: Trend over 6 decades. Cancer. 2004;101(11):2667-2674.
12. Tran D, Kamalakar R, Manthena S, Karve S. Economic Burden of Multiple Myeloma: Results from a Large Employer-Sponsored Real-World Administrative Claims Database, 2012 to 2018. Blood. 2019;134(Supplement_1):3414-3414.
13. Rajkumar SV. Multiple myeloma: Treatment of relapsed or refractory disease. Kyle, Robert A. https://www.uptodate.com/. Published 2020. Updated December 17, 2020. Accessed January 16, 2021.
14. Shah N, Chari A, Scott E, Mezzi K, Usmani SZ. B-cell maturation antigen (BCMA) in multiple myeloma: rationale for targeting and current therapeutic approaches. Leukemia. 2020;34(4):985-1005.
15. Raje N, Berdeja J, Lin Y, et al. Anti-BCMA CAR T-Cell Therapy bb2121 in Relapsed or Refractory Multiple Myeloma. N Engl J Med. 2019;380(18):1726-1737.

©Institute for Clinical and Economic Review, 2021 Page 188 Final Report – Multiple Myeloma
16. Lin Y, Martin III T, Cohen A, et al. 3240 Cytokine Release Syndrome in Patients with Relapsed/Refractory Multiple Myeloma Treated with CiltacabtageneAutoleucel in the Phase 1b/2 CARTITUDE-1 Study. ASH; December 7, 2020, 2020.
17. ClinicalTrials.gov. Efficacy and Safety Study of bb2121 in Subjects With Relapsed and Refractory Multiple Myeloma (KarMMa). https://clinicaltrials.gov/ct2/show/record/NCT03361748. Published 2020. Accessed.
18. Xu J, Chen L-J, Yang S-S, et al. Exploratory trial of a biepitopic CAR T-targeting B cell maturation antigen in relapsed/refractory multiple myeloma. Proceedings of the National Academy of Sciences. 2019;116(19):9543.
19. Madduri D, Berdeja J, Usmani S, et al. 177 CARTITUDE-1: Phase 1b/2 Study of Ciltacabtagene Autoleucel, a B-Cell Maturation Antigen–Directed Chimeric Antigen Receptor T Cell Therapy, in Relapsed/Refractory Multiple Myeloma. Paper Presented presented at American Society of Hematology; December, 2020.
20. ClinicalTrials.gov. A Study of JNJ-68284528, a Chimeric Antigen Receptor T Cell (CAR-T) Therapy Directed Against B-Cell Maturation Antigen (BCMA) in Participants With Relapsed or Refractory Multiple Myeloma (CARTITUDE-1). 2020.
21. Wang B-Y, Zhao W-H, Liu J, et al. Long-Term Follow-up of a Phase 1, First-in-Human Open-LabelStudy of LCAR-B38M, a Structurally Di?erentiated Chimeric AntigenReceptor T (CAR-T) Cell Therapy Targeting B-Cell MaturationAntigen (BCMA), in Patients (pts) with Relapsed/RefractoryMultiple Myeloma (RRMM). Blood. 2019;134(579).
22. Zhao WH, Liu J, Wang BY, et al. A phase 1, open-label study of LCAR-B38M, a chimeric antigen receptor T cell therapy directed against B cell maturation antigen, in patients with relapsed or refractory multiple myeloma. J Hematol Oncol. 2018;11(1):141.
23. Farooq AV, Degli Esposti S, Popat R, et al. Corneal Epithelial Findings in Patients with Multiple Myeloma Treated with Antibody-Drug Conjugate Belantamab Mafodotin in the Pivotal, Randomized, DREAMM-2 Study. Ophthalmology and therapy. 2020.
24. Legend Biotech. Form F-1 Registration Statement. In: Commission SaE, ed2020. 25. Shah N, Delforge M, San-Miguel JF, et al. 437: Secondary Quality-of-Life Domains in Patients
with Relapsed and Refractory Multiple Myeloma Treated with theBcma-Directed CAR T Cell Therapy Idecabtagene Vicleucel (ide-cel; bb2121): Results from the Karmma Clinical Trial. ASH; December 6, 2020, 2020.
26. Zhao W-H, Liu J, Wang B-Y, et al. Updated Analysis of a Phase 1, Open-Label Study of LCAR-B38M, a Chimeric Antigen Receptor T Cell Therapy Directed Against B-Cell Maturation Antigen, in Patients with Relapsed/Refractory Multiple Myeloma. Blood. 2018;132(955).
27. Martin T, Lin Y, Agha M, et al. 2291 Health-Related Quality of Life in the Cartitude-1 Study of Ciltacabtagene Autoleucel for Relapsed/RefractoryMultiple Myeloma. ASH; December 6, 2020, 2020.
28. Popat R, Lonial S, Lee HC, et al. EP1746 DREAMM-2: Belantamab Mafodotin Effect on Disease Symptoms and Health-relatedQuality of Life (HRQoL) in Patients With Relapsed/Refractory Multiple Myeloma (RRMM). EHA. 2020.
29. Popat R, Lonial S, Voorhees PM, et al. 2278 DREAMM-2: Single-Agent Belantamab Mafodotin (Belamaf) Effects on Patient-Reported Outcome (PRO) Measures inPatients with Relapsed/Refractory Multiple Myeloma (RRMM). ASH. 2020.
30. Goldsmith SR, Fiala MA, Wang B, et al. DCEP and bendamustine/prednisone as salvage therapy for quad- and penta-refractory multiple myeloma. Annals of Hematology. 2020;99(5):1041-1048.

©Institute for Clinical and Economic Review, 2021 Page 189 Final Report – Multiple Myeloma
31. Mehra M, Vogel M, Valluri S, et al. EP1032: Patient Characteristics, Treatment Patterns and Outcomes in Patients with Triple Class Refractory Multiple Myeloma. EHA. 2020.
32. Hari P, Nguyen A, McGarvey N, et al. 1598 Healthcare Resource Utilization and Cost of Cytokine Release Syndrome and Neurotoxicity in Patients with Relapsed and Refractory Multiple Myeloma Receiving the BCMA-Directed Chimeric Antigen Receptor T Cell Therapy Idecabtagene Vicleucel (ide-cel, bb2121) in the KarMMa Trial. American Society of Hematology; 2020.
33. Moreau P, Masszi T, Grzasko N, et al. Oral Ixazomib, Lenalidomide, and Dexamethasone for Multiple Myeloma. N Engl J Med. 2016;374(17):1621-1634.
34. Bringhen S, Petrucci MT, Larocca A, et al. Carfilzomib, cyclophosphamide, and dexamethasone in patients with newly diagnosed multiple myeloma: a multicenter, phase 2 study. Blood. 2014;124(1):63-69.
35. Dimopoulos MA, Dytfeld D, Grosicki S, et al. Elotuzumab plus Pomalidomide and Dexamethasone for Multiple Myeloma. New England Journal of Medicine. 2018;379(19):1811-1822.
36. Berdeja JG, Raje NS, Siegel DS, et al. 1367 Efficacy and Safety of Idecabtagene Vicleucel (ide-cel, bb2121) in Elderly Patients with Relapsed and RefractoryMultiple Myeloma: KarMMa Subgroup Analysis. ASH; December 5, 2020, 2020.
37. Raje NS, Siegel DS, Jagannath S, et al. 3234 Idecabtagene Vicleucel (ide-cel, bb2121) in Relapsed and Refractory Multiple Myeloma: Analyses of High-RiskSubgroups in the KarMMa Study. ASH; December 7, 2020, 2020.
38. Wang B, Liu J, Zhao W-H, et al. 2304 Chimeric Antigen Receptor T Cell Therapy in the Relapsed or Refractory Multiple Myeloma with ExtramedullaryDisease--a Single Institution Observation in China. ASH; December 6, 2020, 2020.
39. Lonial S, Lee HC, Badros AZ, et al. 1417 DREAMM-2: Single-Agent Belantamab Mafodotin (Belamaf) in Patients with Relapsed/Refractory Multiple Myeloma (RRMM) – 1-Year Outcomes By Prior Therapies. ASH. 2020.
40. Cohen AD, Trudel S, Lonial S, et al. DREAMM-2: Single-agent belantamab mafodotin (GSK2857916) in patients with relapsed/ refractory multiple myeloma (RRMM) and high-risk (HR) cytogenetics. EHA. 2020.
41. Lee HC, Cohen AD, Chari A, et al. EP1006 DREAMM-2: Single-agent belantamab mafodotin (GSK2857916) in patients with relapsed/ refractory multiple myeloma (RRMM) and renal impairment. EHA. 2020.
42. Carlson JJ, Guzauskas GF, Chapman RH, et al. Cost-effectiveness of Drugs to Treat Relapsed/Refractory Multiple Myeloma in the United States. J Manag Care Spec Pharm. 2018;24(1):29-38.
43. Delforge M, Shah N, Rodriguez-Otero P, et al. 3465 Health State Utility Valuation in Patients with Triple-Class-Exposed Relapsed and Refractory Multiple Myeloma Treated with the BCMA-Directed CAR T Cell Therapy, Idecabtagene Vicleucel (ide-cel, bb2121): Results from the KarMMa Trial. Paper presented presented at American Society of Hemotology; 2020.
44. Lonial S, Lee HC, Badros A, et al. DREAMM-2: Single-agent belantamab mafodotin in relapsed/refractory multiple myeloma refractory to proteasome inhibitors, immunomodulatory agents, and refractory and/or intolerant to anti-CD38 mABs. HemaSphere. 2020;4:442.
45. Shah N, Ayers D, Davies FE, et al. 1653 A Matching-Adjusted Indirect Comparison of Efficacy Outcomes for Idecabtagene Vicleucel (ide-cel, bb2121), aBCMA-Directed CAR T Cell Therapy Versus Conventional Care in Triple-Class-Exposed Relapsed and Refractory MultipleMyeloma. ASH; December 5, 2020, 2020.

©Institute for Clinical and Economic Review, 2021 Page 190 Final Report – Multiple Myeloma
46. Micromedex solutions. RedBook. https://www.micromedexsolutions.com/micromedex2/4.34.0/WebHelp/MICROMEDEX_2.htm#RED_BOOK/Introduction_to_REDB_BOOK_Online.htm. Published 2020. Accessed December 2020.
47. Dimopoulos M, Sonneveld P, Nahi H, et al. Progression-Free Survival as a Surrogate Endpoint for Overall Survival in Patients with Relapsed or Refractory Multiple Myeloma. Value in Health. 2017;20(9):A408.
48. Rutherford MJ, Lambert PC, Sweeting MJ, et al. NICE DSU Technical Support Document 21. Flexible Methods for Survival Analysis. http://www.nicedsu.org.uk. Published 2020. Accessed January 27, 2020.
49. Clark S, Weale A. Social values in health priority setting: a conceptual framework. Journal of Health Organization and Management. 2012;26(3):293-316.
50. Reckers-Droog VT, van Exel NJA, Brouwer WBF. Looking back and moving forward: On the application of proportional shortfall in healthcare priority setting in the Netherlands. Health policy (Amsterdam). 2018;122(6):621-629.
51. Versteegh M, Corro Ramos I, Buyukkaramikli NC, Ansaripour A, Reckers-og V, Brouwer W. Severity-Adjusted Probability of Being Cost Effective. PharmacoEconomics. 2019;37(9):1155-1163.
52. Ottersen T, Førde R, Kakad M, et al. A new proposal for priority setting in Norway: Open and fair. Health policy (Amsterdam). 2016;120(3):246-251.
53. Wetering E, Stolk E, van Exel J, Brouwer W. Balancing equity and efficiency in the Dutch basic benefits package using the principle of proportional shortfall. The European Journal of Health Economics. 2013;14(1):107-115.
54. Stolk EA, Donselaar Gv, Brouwer WBF, Ja JVB. Reconciliation of Economic Concerns and Health Policy: Illustration of an Equity Adjustment Procedure Using Proportional Shortfall. PharmacoEconomics. 2004;22(17):1097-1107.
55. iDBC - iMTA Disease Burden Calculator [computer program]. 2020. 56. Mikkilineni L, Kochenderfer JN. CAR T cell therapies for patients with multiple myeloma. Nat Rev
Clin Oncol. 2020. 57. National Cancer Institute. belantamab mafodotin-blmf.
https://www.cancer.gov/publications/dictionaries/cancer-drug/def/758317. Accessed2020. 58. National Cancer Institute. belantamab mafodotin. Accessed2021. 59. Durie BG, Harousseau JL, Miguel JS, et al. International uniform response criteria for multiple
myeloma. Leukemia. 2006;20(9):1467-1473. 60. Kumar S, Paiva B, Anderson KC, et al. International Myeloma Working Group consensus criteria
for response and minimal residual disease assessment in multiple myeloma. Lancet Oncol. 2016;17(8):e328-e346.
61. National Comprehensive Cancer Network. Multiple Myeloma (Version 4.2020). https://www.nccn.org/professionals/physician_gls/pdf/myeloma.pdf. Published 2020. Accessed.
62. Mikhael J, Ismaila N, Cheung MC, et al. Treatment of Multiple Myeloma: ASCO and CCO Joint Clinical Practice Guideline. J Clin Oncol. 2019;37(14):1228-1263.
63. Cook DJ, Mulrow CD, Haynes RB. Systematic reviews: synthesis of best evidence for clinical decisions. Ann Intern Med. 1997;126(5):376-380.
64. Higgins J, Thomas, J, Chandler, J, Cumpston, M, Li, T, Page, MJ, Welch, VA. Cochrane Handbook for Systematic Reviews of Interventions version 6.1 (updated September 2020). https://training.cochrane.org/handbook/current. Published 2020. Accessed.

©Institute for Clinical and Economic Review, 2021 Page 191 Final Report – Multiple Myeloma
65. Moher D, Liberati A, Tetzlaff J, Altman DG, The PG. Preferred Reporting Items for Systematic Reviews and Meta-Analyses: The PRISMA Statement. PLOS Medicine. 2009;6(7):e1000097.
66. Ollendorf DA, Pearson SD. An integrated evidence rating to frame comparative effectiveness assessments for decision makers. Medical care. 2010;48(6 Suppl):S145-152.
67. Ollendorf D, Pearson, SD. ICER Evidence Rating Matrix: A User's Guide. https://icer-review.org/methodology/icers-methods/icer-evidence-ratingmatrix/. . Published 2020. Updated January 31, 2020. Accessed.
68. Trudel S, Cohen AD, Richardson PG, et al. EP948 Safety and tolerability of single-agent belantamab mafodotin in heavily pre-treated patients with relapsed/refractory multiple myeloma: Pooled data from DREAMM-1 and DREAMM-2. EHA. 2020.
69. Shragai T, Gatt M, Jarchowsky O, et al. Real-world outcomes of belantamab mafoditin treatment for patients with relapsed/ refractory myeloma via GSK expanded access program. EHA. 2020.
70. Lin Y, Raje NS, Berdeja JG, et al. 131 Idecabtagene Vicleucel (ide-cel, bb2121), a BCMA-Directed CAR T Cell Therapy, in Patients with Relapsed andRefractory Multiple Myeloma: Updated Results from Phase 1 CRB-401 Study. ASH; December 5, 2020, 2020.
71. ClinicalTrials.gov. Study of bb2121 in Multiple Myeloma. 2020. 72. ClinicalTrials.gov. LCAR-B38M Cells in Treating Relapsed/Refractory (R/R) Multiple Myeloma
(LEGEND-2). 2020. 73. ClinicalTrials.gov. A Study to Investigate the Efficacy and Safety of Two Doses of GSK2857916 in
Participants With Multiple Myeloma Who Have Failed Prior Treatment With an Anti-CD38 Antibody. 2020.
74. Chen L, Xu J, Fu W, et al. Updated Phase 1 Results of a First-in-Human Open-Label Study of Lcar-B38M, a Structurally Di?erentiated Chimeric Antigen Receptor T (CAR-T)Cell Therapy Targeting B-Cell Maturation Antigen (Bcma). Blood. 2019;134(1858).
75. Rodriguez-Otero P, Weisel K, Davies F, et al. Matching-adjusted indirect comparisons of efficacy outcomes for idecabtagenevicleucelfrom the KarMMastudy vs selinexorplus dexamethasone (STORM part 2) and belantamabmafodotin(DREAMM-2). EHA; 2020.
76. Jagannath S, Lin Y, Goldschmidt H, et al. KarMMa‑RW: a study of real‑world treatment patterns in heavily pretreated patients with relapsed and refractory multiple myeloma and comparison of outcomes to KarMMa. ASCO; 2020.
77. Sanders GD, Neumann PJ, Basu A, et al. Recommendations for Conduct, Methodological Practices, and Reporting of Cost-effectiveness Analyses: Second Panel on Cost-Effectiveness in Health and Medicine. Jama. 2016;316(10):1093-1103.
78. Guyot P, Ades AE, Ouwens MJ, Welton NJ. Enhanced secondary analysis of survival data: reconstructing the data from published Kaplan-Meier survival curves. BMC Med Res Methodol. 2012;12:9.
79. Hettle R, Corbett M, Hinde S, et al. The assessment and appraisal of regenerative medicines and cell therapy products: an exploration of methods for review, economic evaluation and appraisal. Health technology assessment. 2017:1-204.
80. Institute for Clinical and Economic Review. Chimeric Antigen Receptor T-Cell Therapy for B-Cell Cancers: Effectiveness and Value. https://icer-review.org/wp-content/uploads/2017/07/ICER_CAR_T_Final_Evidence_Report_032318.pdf. Published 2018. Accessed.
81. Delforge M, Miguel JS, Bertin KB, et al. Quality Of Life In Patients With Relapsed And Refractory Multiple Myeloma Treated With The Bcmatargeted Car T Cell Therapy Idecabtagene Vicleucel (Ide-Cel; Bb2121): Results From The Karmma Trial. EHA; June 12, 2020, 2020.

©Institute for Clinical and Economic Review, 2021 Page 192 Final Report – Multiple Myeloma
82. Brown RE, Stern S, Dhanasiri S, Schey S. Lenalidomide for multiple myeloma: cost-effectiveness in patients with one prior therapy in England and Wales. Eur J Health Econ. 2013;14(3):507-514.
83. National Institute for Health and Care Excellence. Daratumumab monotherapy for treating relapsed and refractory multiple myeloma: technology appraisal guidance [TA510]. https://www.nice.org.uk/guidance/ta510. . Published 2018. Accessed.
84. Sullivan PW, Ghushchyan V. Preference-Based EQ-5D index scores for chronic conditions in the United States. Med Decis Making. 2006;26(4):410-420.
85. Chari A, Hagiwara M, Kee A, et al. Recent treatment patterns, healthcare utilization, and costs in heavily pretreated relapsed and/or refractory multiple myeloma patients in the United States. Poster Presented presented at European Hematology Association; June, 2020.
86. Agency for Healthcare Research and Quality. Statistical Brief #125: Cancer Hospitalizations for Adults, 2009. https://www.hcup-us.ahrq.gov/reports/statbriefs/sb125.jsp. Published 2009. Accessed December, 2020.
87. Dasta JF, McLaughlin TP, Mody SH, Piech CT. Daily cost of an intensive care unit day: the contribution of mechanical ventilation. Crit Care Med. 2005;33(6):1266-1271.
88. Roy A, Kish JK, Bloudek L, et al. Estimating the Costs of Therapy in Patients with Relapsed and/or Refractory Multiple Myeloma: A Model Framework. Am Health Drug Benefits. 2015;8(4):204-215.
89. United States Bureau of Labor Statistics. Occupational Employment Statistics. https://www.bls.gov/oes/current/oes_nat.htm#00-0000. Published 2019. Accessed December, 2020.
90. Ailawadhi S, DerSarkissian M, Duh MS, et al. Cost Offsets in the Treatment Journeys of Patients With Relapsed/Refractory Multiple Myeloma. Clin Ther. 2019;41(3):477-493.e477.
91. Pickard AS, Law EH, Jiang R, et al. United States Valuation of EQ-5D-5L Health States Using an International Protocol. Value in health : the journal of the International Society for Pharmacoeconomics and Outcomes Research. 2019;22(8):931-941.
92. Institute for Clinical and Economic Review. 2020-2023 Value Assessment Framework. https://icer-review.org/wp-content/uploads/2019/05/ICER_2020_2023_VAF_013120-4.pdf. Published 2020. Accessed.
93. Pearson SD. The ICER Value Framework: Integrating Cost Effectiveness and Affordability in the Assessment of Health Care Value. Value in health : the journal of the International Society for Pharmacoeconomics and Outcomes Research. 2018;21(3):258-265.
Supplemental Materials Reference List
1. Rajkumar SV. Multiple myeloma: 2020 update on diagnosis, risk-stratification and management. American journal of hematology. 2020;95(5):548-567.
2. Mikhael J. Treatment Options for Triple-class Refractory Multiple Myeloma. Clin Lymphoma Myeloma Leuk. 2020;20(1):1-7.
3. National Cancer Institute. Cancer Stat Facts: Myeloma. https://seer.cancer.gov/statfacts/html/mulmy.html. Accessed September 14, 2020.
4. Laubach JP. Multiple myeloma: Clinical features, laboratory manifestations, and diagnosis. Kyle, Robert A Rajkumar, Vincent S. https://www.uptodate.com/. Published 2021. Updated January 15, 2021. Accessed January 16, 2021.
5. Kyle RA, Therneau TM, Rajkumar SV, Larson DR, Plevak MF, Melton LJ, 3rd. Incidence of multiple myeloma in Olmsted County, Minnesota: Trend over 6 decades. Cancer. 2004;101(11):2667-2674.

©Institute for Clinical and Economic Review, 2021 Page 193 Final Report – Multiple Myeloma
6. Tran D, Kamalakar R, Manthena S, Karve S. Economic Burden of Multiple Myeloma: Results from a Large Employer-Sponsored Real-World Administrative Claims Database, 2012 to 2018. Blood. 2019;134(Supplement_1):3414-3414.
7. Gandhi UH, Cornell RF, Lakshman A, et al. Outcomes of patients with multiple myeloma refractory to CD38-targeted monoclonal antibody therapy. Leukemia. 2019;33(9):2266-2275.
8. Shah N, Chari A, Scott E, Mezzi K, Usmani SZ. B-cell maturation antigen (BCMA) in multiple myeloma: rationale for targeting and current therapeutic approaches. Leukemia. 2020;34(4):985-1005.
9. FDA Approves First Cell-Based Gene Therapy for Adult Patients with Multiple Myeloma [press release]. March 27, 2021 2021.
10. Munshi NC, Anderson JLD, Shah N, et al. Presentation 8503: Idecabtagene vicleucel (ide-cel; bb2121), a BCMA-targeted CAR T-cell therapy, in patients with relapsed and refractory multiple myeloma (RRMM): Initial KarMMa results. Journal of Clinical Oncology; 2020/05/20, 2020.
11. Munshi NC, Anderson LD, Jr., Shah N, et al. Idecabtagene Vicleucel in Relapsed and Refractory Multiple Myeloma. N Engl J Med. 2021;384(8):705-716.
12. ClinicalTrials.gov. Efficacy and Safety Study of bb2121 in Subjects With Relapsed and Refractory Multiple Myeloma (KarMMa). https://clinicaltrials.gov/ct2/show/record/NCT03361748. Published 2020. Accessed.
13. Xu J, Chen L-J, Yang S-S, et al. Exploratory trial of a biepitopic CAR T-targeting B cell maturation antigen in relapsed/refractory multiple myeloma. Proceedings of the National Academy of Sciences. 2019;116(19):9543.
14. Madduri D, Berdeja J, Usmani S, et al. 177 CARTITUDE-1: Phase 1b/2 Study of Ciltacabtagene Autoleucel, a B-Cell Maturation Antigen–Directed Chimeric Antigen Receptor T Cell Therapy, in Relapsed/Refractory Multiple Myeloma. Paper Presented presented at American Society of Hematology; December, 2020.
15. Cancer Network. Durable Responses Observed at 18 Months with Cilta-Cel to Treat Relapsed/Refractory Multiple Myeloma. https://www.cancernetwork.com/view/durable-responses-observed-at-18-months-with-cilta-cel-to-treat-relapsed-refractory-multiple-myeloma. Published 2021. Accessed June 24, 2021, 2021.
16. ClinicalTrials.gov. A Study of JNJ-68284528, a Chimeric Antigen Receptor T Cell (CAR-T) Therapy Directed Against B-Cell Maturation Antigen (BCMA) in Participants With Relapsed or Refractory Multiple Myeloma (CARTITUDE-1). 2020.
17. Lonial S, Lee HC, Badros A, et al. Belantamab mafodotin for relapsed or refractory multiple myeloma (DREAMM-2): a two-arm, randomised, open-label, phase 2 study. Lancet Oncol. 2020;21(2):207-221.
18. Farooq AV, Degli Esposti S, Popat R, et al. Corneal Epithelial Findings in Patients with Multiple Myeloma Treated with Antibody-Drug Conjugate Belantamab Mafodotin in the Pivotal, Randomized, DREAMM-2 Study. Ophthalmology and therapy. 2020.
19. Madduri D ea. CARTITUDE 1: Phase 1b/2 Study of Ciltacabtagene Autoleucel, a B-Cell Maturation Antigen–Directed ChimericAntigen Receptor T Cell Therapy, in Relapsed/Refractory Multiple Myeloma (Oral Presentation #177). https://drive.google.com/file/d/1qJ62T7kjvqf5w8yA2ewgACC0SKXz1qo9/view. Published 2020. Updated December 7, 2020. Accessed December 8, 2020.
20. Madduri D, Berdeja J, Usmani S, et al. CARTITUDE 1: Phase 1b/2 Study of Ciltacabtagene Autoleucel, a B-Cell Maturation Antigen–Directed ChimericAntigen Receptor T Cell Therapy, in Relapsed/Refractory Multiple Myeloma (Oral Presentation #177).

©Institute for Clinical and Economic Review, 2021 Page 194 Final Report – Multiple Myeloma
https://drive.google.com/file/d/1qJ62T7kjvqf5w8yA2ewgACC0SKXz1qo9/view. Published 2020. Updated December 7, 2020. Accessed December 8, 2020.
21. Shah N, Delforge M, San-Miguel JF, et al. 437: Secondary Quality-of-Life Domains in Patients with Relapsed and Refractory Multiple Myeloma Treated with theBcma-Directed CAR T Cell Therapy Idecabtagene Vicleucel (ide-cel; bb2121): Results from the Karmma Clinical Trial. ASH; December 6, 2020, 2020.
22. Martin T, Lin Y, Agha M, et al. 2291 Health-Related Quality of Life in the Cartitude-1 Study of Ciltacabtagene Autoleucel for Relapsed/RefractoryMultiple Myeloma. ASH; December 6, 2020, 2020.
23. Lonial S, Lee HC, Badros A, et al. Pivotal DREAMM-2 Study: Single-agent Belantamab Mafodotin (GSK2857916) in Patients With Relapsed/Refractory Multiple Myeloma (RRMM) Refractory to Proteasome Inhibitors (PIs), Immunomodulatory Agents, and Refractory and/or Intolerant to Anti-CD38 Monoclonal Antibodies (mAbs). ASCO. 2020.
24. Popat R, Lonial S, Lee HC, et al. EP1746 DREAMM-2: Belantamab Mafodotin Effect on Disease Symptoms and Health-relatedQuality of Life (HRQoL) in Patients With Relapsed/Refractory Multiple Myeloma (RRMM). EHA. 2020.
25. Popat R, Lonial S, Voorhees PM, et al. 2278 DREAMM-2: Single-Agent Belantamab Mafodotin (Belamaf) Effects on Patient-Reported Outcome (PRO) Measures inPatients with Relapsed/Refractory Multiple Myeloma (RRMM). ASH. 2020.
26. Goldsmith SR, Fiala MA, Wang B, et al. DCEP and bendamustine/prednisone as salvage therapy for quad- and penta-refractory multiple myeloma. Annals of Hematology. 2020;99(5):1041-1048.
27. Mehra M, Vogel M, Valluri S, et al. EP1032: Patient Characteristics, Treatment Patterns and Outcomes in Patients with Triple Class Refractory Multiple Myeloma. EHA. 2020.
28. Hari P, Nguyen A, McGarvey N, et al. 1598 Healthcare Resource Utilization and Cost of Cytokine Release Syndrome and Neurotoxicity in Patients with Relapsed and Refractory Multiple Myeloma Receiving the BCMA-Directed Chimeric Antigen Receptor T Cell Therapy Idecabtagene Vicleucel (ide-cel, bb2121) in the KarMMa Trial. American Society of Hematology; 2020.
29. Moreau P, Masszi T, Grzasko N, et al. Oral Ixazomib, Lenalidomide, and Dexamethasone for Multiple Myeloma. N Engl J Med. 2016;374(17):1621-1634.
30. Bringhen S, Petrucci MT, Larocca A, et al. Carfilzomib, cyclophosphamide, and dexamethasone in patients with newly diagnosed multiple myeloma: a multicenter, phase 2 study. Blood. 2014;124(1):63-69.
31. Dimopoulos MA, Dytfeld D, Grosicki S, et al. Elotuzumab plus Pomalidomide and Dexamethasone for Multiple Myeloma. New England Journal of Medicine. 2018;379(19):1811-1822.
32. Berdeja JG, Raje NS, Siegel DS, et al. 1367 Efficacy and Safety of Idecabtagene Vicleucel (ide-cel, bb2121) in Elderly Patients with Relapsed and RefractoryMultiple Myeloma: KarMMa Subgroup Analysis. ASH; December 5, 2020, 2020.
33. Raje NS, Siegel DS, Jagannath S, et al. 3234 Idecabtagene Vicleucel (ide-cel, bb2121) in Relapsed and Refractory Multiple Myeloma: Analyses of High-RiskSubgroups in the KarMMa Study. ASH; December 7, 2020, 2020.
34. Lonial S, Lee HC, Badros AZ, et al. 1417 DREAMM-2: Single-Agent Belantamab Mafodotin (Belamaf) in Patients with Relapsed/Refractory Multiple Myeloma (RRMM) – 1-Year Outcomes By Prior Therapies. ASH. 2020.

©Institute for Clinical and Economic Review, 2021 Page 195 Final Report – Multiple Myeloma
35. Cohen AD, Trudel S, Lonial S, et al. DREAMM-2: Single-agent belantamab mafodotin (GSK2857916) in patients with relapsed/ refractory multiple myeloma (RRMM) and high-risk (HR) cytogenetics. EHA. 2020.
36. Lee HC, Cohen AD, Chari A, et al. EP1006 DREAMM-2: Single-agent belantamab mafodotin (GSK2857916) in patients with relapsed/ refractory multiple myeloma (RRMM) and renal impairment. EHA. 2020.
37. Dimopoulos M, Sonneveld P, Nahi H, et al. Progression-Free Survival as a Surrogate Endpoint for Overall Survival in Patients with Relapsed or Refractory Multiple Myeloma. Value in Health. 2017;20(9):A408.
38. Félix J, Aragão F, Almeida JM, et al. Time-dependent endpoints as predictors of overall survival in multiple myeloma. BMC Cancer. 2013;13:122-122.
39. Asrar MM, Lad DP, Prinja S, Bansal D. A systematic review of economic evaluations of treatment regimens in multiple myeloma. Expert Rev Pharmacoecon Outcomes Res. 2020:1-11.
40. Carlson JJ, Guzauskas GF, Chapman RH, et al. Cost-effectiveness of Drugs to Treat Relapsed/Refractory Multiple Myeloma in the United States. J Manag Care Spec Pharm. 2018;24(1):29-38.
41. Delforge M, Miguel JS, Bertin KB, et al. Quality Of Life In Patients With Relapsed And Refractory Multiple Myeloma Treated With The Bcmatargeted Car T Cell Therapy Idecabtagene Vicleucel (Ide-Cel; Bb2121): Results From The Karmma Trial. EHA; June 12, 2020, 2020.
42. Delforge M, Shah N, Rodriguez-Otero P, et al. 3465 Health State Utility Valuation in Patients with Triple-Class-Exposed Relapsed and Refractory Multiple Myeloma Treated with the BCMA-Directed CAR T Cell Therapy, Idecabtagene Vicleucel (ide-cel, bb2121): Results from the KarMMa Trial. Paper presented presented at American Society of Hemotology; 2020.
43. Lonial S, Lee HC, Badros A, et al. DREAMM-2: Single-agent belantamab mafodotin in relapsed/refractory multiple myeloma refractory to proteasome inhibitors, immunomodulatory agents, and refractory and/or intolerant to anti-CD38 mABs. HemaSphere. 2020;4:442.
44. Shah N, Ayers D, Davies FE, et al. 1653 A Matching-Adjusted Indirect Comparison of Efficacy Outcomes for Idecabtagene Vicleucel (ide-cel, bb2121), aBCMA-Directed CAR T Cell Therapy Versus Conventional Care in Triple-Class-Exposed Relapsed and Refractory MultipleMyeloma. ASH; December 5, 2020, 2020.
45. Micromedex solutions. RedBook. https://www.micromedexsolutions.com/micromedex2/4.34.0/WebHelp/MICROMEDEX_2.htm#RED_BOOK/Introduction_to_REDB_BOOK_Online.htm. Published 2020. Accessed December 2020.
46. Rutherford MJ, Lambert PC, Sweeting MJ, et al. NICE DSU Technical Support Document 21. Flexible Methods for Survival Analysis. http://www.nicedsu.org.uk. Published 2020. Accessed January 27, 2020.
47. Mikkilineni L, Kochenderfer JN. CAR T cell therapies for patients with multiple myeloma. Nat Rev Clin Oncol. 2020.
48. National Cancer Institute. belantamab mafodotin-blmf. https://www.cancer.gov/publications/dictionaries/cancer-drug/def/758317. Accessed2020.
49. National Cancer Institute. belantamab mafodotin. Accessed2021. 50. Durie BG, Harousseau JL, Miguel JS, et al. International uniform response criteria for multiple
myeloma. Leukemia. 2006;20(9):1467-1473. 51. Kumar S, Paiva B, Anderson KC, et al. International Myeloma Working Group consensus criteria
for response and minimal residual disease assessment in multiple myeloma. Lancet Oncol. 2016;17(8):e328-e346.

©Institute for Clinical and Economic Review, 2021 Page 196 Final Report – Multiple Myeloma
52. National Comprehensive Cancer Network. Multiple Myeloma (Version 5.2021). https://www.nccn.org/professionals/physician_gls/pdf/myeloma.pdf. Published 2021. Accessed.
53. Mikhael J, Ismaila N, Cheung MC, et al. Treatment of Multiple Myeloma: ASCO and CCO Joint Clinical Practice Guideline. J Clin Oncol. 2019;37(14):1228-1263.
54. Cook DJ, Mulrow CD, Haynes RB. Systematic reviews: synthesis of best evidence for clinical decisions. Ann Intern Med. 1997;126(5):376-380.
55. Higgins J, Thomas, J, Chandler, J, Cumpston, M, Li, T, Page, MJ, Welch, VA. Cochrane Handbook for Systematic Reviews of Interventions version 6.1 (updated September 2020). https://training.cochrane.org/handbook/current. Published 2020. Accessed.
56. Moher D, Liberati A, Tetzlaff J, Altman DG, The PG. Preferred Reporting Items for Systematic Reviews and Meta-Analyses: The PRISMA Statement. PLOS Medicine. 2009;6(7):e1000097.
57. Ollendorf DA, Pearson SD. An integrated evidence rating to frame comparative effectiveness assessments for decision makers. Medical care. 2010;48(6 Suppl):S145-152.
58. Ollendorf D, Pearson, SD. ICER Evidence Rating Matrix: A User's Guide. https://icer-review.org/methodology/icers-methods/icer-evidence-ratingmatrix/. . Published 2020. Updated January 31, 2020. Accessed.
59. Raje N, Berdeja J, Lin Y, et al. Anti-BCMA CAR T-Cell Therapy bb2121 in Relapsed or Refractory Multiple Myeloma. N Engl J Med. 2019;380(18):1726-1737.
60. Lin Y, Martin III T, Cohen A, et al. 3240 Cytokine Release Syndrome in Patients with Relapsed/Refractory Multiple Myeloma Treated with CiltacabtageneAutoleucel in the Phase 1b/2 CARTITUDE-1 Study. ASH; December 7, 2020, 2020.
61. Wang B-Y, Zhao W-H, Liu J, et al. Long-Term Follow-up of a Phase 1, First-in-Human Open-LabelStudy of LCAR-B38M, a Structurally Di?erentiated Chimeric AntigenReceptor T (CAR-T) Cell Therapy Targeting B-Cell MaturationAntigen (BCMA), in Patients (pts) with Relapsed/RefractoryMultiple Myeloma (RRMM). Blood. 2019;134(579).
62. Zhao WH, Liu J, Wang BY, et al. A phase 1, open-label study of LCAR-B38M, a chimeric antigen receptor T cell therapy directed against B cell maturation antigen, in patients with relapsed or refractory multiple myeloma. J Hematol Oncol. 2018;11(1):141.
63. Trudel S, Cohen AD, Richardson PG, et al. EP948 Safety and tolerability of single-agent belantamab mafodotin in heavily pre-treated patients with relapsed/refractory multiple myeloma: Pooled data from DREAMM-1 and DREAMM-2. EHA. 2020.
64. Shragai T, Gatt M, Jarchowsky O, et al. Real-world outcomes of belantamab mafoditin treatment for patients with relapsed/ refractory myeloma via GSK expanded access program. EHA. 2020.
65. Legend Biotech. Form F-1 Registration Statement. In: Commission SaE, ed2020. 66. Zhao W-H, Liu J, Wang B-Y, et al. Updated Analysis of a Phase 1, Open-Label Study of LCAR-
B38M, a Chimeric Antigen Receptor T Cell Therapy Directed Against B-Cell Maturation Antigen, in Patients with Relapsed/Refractory Multiple Myeloma. Blood. 2018;132(955).
67. Lin Y, Raje NS, Berdeja JG, et al. 131 Idecabtagene Vicleucel (ide-cel, bb2121), a BCMA-Directed CAR T Cell Therapy, in Patients with Relapsed andRefractory Multiple Myeloma: Updated Results from Phase 1 CRB-401 Study. ASH; December 5, 2020, 2020.
68. Wang B, Liu J, Zhao W-H, et al. 2304 Chimeric Antigen Receptor T Cell Therapy in the Relapsed or Refractory Multiple Myeloma with ExtramedullaryDisease--a Single Institution Observation in China. ASH; December 6, 2020, 2020.
69. ClinicalTrials.gov. Study of bb2121 in Multiple Myeloma. 2020. 70. ClinicalTrials.gov. LCAR-B38M Cells in Treating Relapsed/Refractory (R/R) Multiple Myeloma
(LEGEND-2). 2020.

©Institute for Clinical and Economic Review, 2021 Page 197 Final Report – Multiple Myeloma
71. ClinicalTrials.gov. A Study to Investigate the Efficacy and Safety of Two Doses of GSK2857916 in Participants With Multiple Myeloma Who Have Failed Prior Treatment With an Anti-CD38 Antibody. 2020.
72. Chen L, Xu J, Fu W, et al. Updated Phase 1 Results of a First-in-Human Open-Label Study of Lcar-B38M, a Structurally Di?erentiated Chimeric Antigen Receptor T (CAR-T)Cell Therapy Targeting B-Cell Maturation Antigen (Bcma). Blood. 2019;134(1858).
73. Rodriguez-Otero P, Weisel K, Davies F, et al. Matching-adjusted indirect comparisons of efficacy outcomes for idecabtagenevicleucelfrom the KarMMastudy vs selinexorplus dexamethasone (STORM part 2) and belantamabmafodotin(DREAMM-2). EHA; 2020.
74. Jagannath S, Lin Y, Goldschmidt H, et al. KarMMa‑RW: a study of real‑world treatment patterns in heavily pretreated patients with relapsed and refractory multiple myeloma and comparison of outcomes to KarMMa. ASCO; 2020.
75. Sanders GD, Neumann PJ, Basu A, et al. Recommendations for Conduct, Methodological Practices, and Reporting of Cost-effectiveness Analyses: Second Panel on Cost-Effectiveness in Health and Medicine. Jama. 2016;316(10):1093-1103.
76. Guyot P, Ades AE, Ouwens MJ, Welton NJ. Enhanced secondary analysis of survival data: reconstructing the data from published Kaplan-Meier survival curves. BMC Med Res Methodol. 2012;12:9.
77. Hettle R, Corbett M, Hinde S, et al. The assessment and appraisal of regenerative medicines and cell therapy products: an exploration of methods for review, economic evaluation and appraisal. Health technology assessment. 2017:1-204.
78. Institute for Clinical and Economic Review. Chimeric Antigen Receptor T-Cell Therapy for B-Cell Cancers: Effectiveness and Value. https://icer-review.org/wp-content/uploads/2017/07/ICER_CAR_T_Final_Evidence_Report_032318.pdf. Published 2018. Accessed.
79. Brown RE, Stern S, Dhanasiri S, Schey S. Lenalidomide for multiple myeloma: cost-effectiveness in patients with one prior therapy in England and Wales. Eur J Health Econ. 2013;14(3):507-514.
80. National Institute for Health and Care Excellence. Daratumumab monotherapy for treating relapsed and refractory multiple myeloma: technology appraisal guidance [TA510]. https://www.nice.org.uk/guidance/ta510. . Published 2018. Accessed.
81. Sullivan PW, Ghushchyan V. Preference-Based EQ-5D index scores for chronic conditions in the United States. Med Decis Making. 2006;26(4):410-420.
82. Pagliarulo N. FDA approves first CAR-T cell therapy for multiple myeloma. https://www.biopharmadive.com/news/fda-car-t-multiple-myeloma-approval-bristol-myers-bluebird/597438/#:~:text=The%20pharma%2C%20which%20licensed%20the,other%20approved%20CAR%2DT%20therapies. Published 2021. Accessed March 31, 2021.
83. Chari A, Hagiwara M, Kee A, et al. Recent treatment patterns, healthcare utilization, and costs in heavily pretreated relapsed and/or refractory multiple myeloma patients in the United States. Poster Presented presented at European Hematology Association; June, 2020.
84. Agency for Healthcare Research and Quality. Statistical Brief #125: Cancer Hospitalizations for Adults, 2009. https://www.hcup-us.ahrq.gov/reports/statbriefs/sb125.jsp. Published 2009. Accessed December, 2020.
85. Dasta JF, McLaughlin TP, Mody SH, Piech CT. Daily cost of an intensive care unit day: the contribution of mechanical ventilation. Crit Care Med. 2005;33(6):1266-1271.
86. Centers for Medicare & Medicaid Services. Physician Fee Schedule Final Rule. https://www.cms.gov/Medicare/Medicare-Fee-for-Service-Payment/PhysicianFeeSched. Published 2020. Accessed.

©Institute for Clinical and Economic Review, 2021 Page 198 Final Report – Multiple Myeloma
87. Roy A, Kish JK, Bloudek L, et al. Estimating the Costs of Therapy in Patients with Relapsed and/or Refractory Multiple Myeloma: A Model Framework. Am Health Drug Benefits. 2015;8(4):204-215.
88. United States Bureau of Labor Statistics. Occupational Employment Statistics. https://www.bls.gov/oes/current/oes_nat.htm#00-0000. Published 2019. Accessed December, 2020.
89. Ailawadhi S, DerSarkissian M, Duh MS, et al. Cost Offsets in the Treatment Journeys of Patients With Relapsed/Refractory Multiple Myeloma. Clin Ther. 2019;41(3):477-493.e477.
90. Pickard AS, Law EH, Jiang R, et al. United States Valuation of EQ-5D-5L Health States Using an International Protocol. Value in health : the journal of the International Society for Pharmacoeconomics and Outcomes Research. 2019;22(8):931-941.
91. Fu S, Wu CF, Wang M, Lairson DR. Cost Effectiveness of Transplant, Conventional Chemotherapy, and Novel Agents in Multiple Myeloma: A Systematic Review. Pharmacoeconomics. 2019;37(12):1421-1449.
92. Institute for Clinical and Economic Review. 2020-2023 Value Assessment Framework. https://icer-review.org/wp-content/uploads/2019/05/ICER_2020_2023_VAF_013120-4.pdf. Published 2020. Accessed.
93. Pearson SD. The ICER Value Framework: Integrating Cost Effectiveness and Affordability in the Assessment of Health Care Value. Value in health : the journal of the International Society for Pharmacoeconomics and Outcomes Research. 2018;21(3):258-265.