Regulation of Caspase3 and -9 Activation in Oxidant Stress to Renal Tubular Epithelial Cells by...
46
1 Regulation of Caspase-3 and -9 Activation in Oxidant Stress to Renal Tubular Epithelial Cells by Forkhead Transcription Factors, Bcl-2 Proteins and Mitogen- Activated Protein Kinases Gur P. Kaushal 1,2 , Ling Liu 1 , Varsha Kaushal 1 , Xiaoman Hong 1 , Oksana Melnyk 1 , Rohit Seth 1 , Robert Safirstein 1 , and Sudhir V. Shah 1 University of Arkansas for Medical Sciences, Departments of Medicine 1 and Biochemistry 2 , Little Rock, Arkansas 72205 and Central Arkansas Veterans Healthcare System 1 , Little Rock, Arkansas 72205 Running Title: Caspases in oxidant injury Address correspondence to: Gur P. Kaushal, Ph.D. University of Arkansas for Medical Sciences Department of Medicine, Slot 501 4301 W. Markham St. Little Rock, AR 72205 Office: 501/257-5834 FAX: 501/257-5827 E-mail: [email protected] Articles in PresS. Am J Physiol Renal Physiol (August 10, 2004). 10.1152/ajprenal.00391.2003 Copyright © 2004 by the American Physiological Society.
-
Upload
ucentralgujaratgandhinagar -
Category
Documents
-
view
3 -
download
0
Transcript of Regulation of Caspase3 and -9 Activation in Oxidant Stress to Renal Tubular Epithelial Cells by...

1
Regulation of Caspase-3 and -9 Activation in Oxidant Stress to Renal Tubular
Epithelial Cells by Forkhead Transcription Factors, Bcl-2 Proteins and Mitogen-
Activated Protein Kinases
Gur P. Kaushal1,2, Ling Liu1, Varsha Kaushal1, Xiaoman Hong1, Oksana Melnyk1, Rohit Seth1,
Robert Safirstein1, and Sudhir V. Shah1
University of Arkansas for Medical Sciences, Departments of Medicine1 and Biochemistry2,
Little Rock, Arkansas 72205
and
Central Arkansas Veterans Healthcare System1,
Little Rock, Arkansas 72205
Running Title: Caspases in oxidant injury
Address correspondence to: Gur P. Kaushal, Ph.D. University of Arkansas for Medical Sciences Department of Medicine, Slot 501 4301 W. Markham St. Little Rock, AR 72205 Office: 501/257-5834 FAX: 501/257-5827 E-mail: [email protected]
Articles in PresS. Am J Physiol Renal Physiol (August 10, 2004). 10.1152/ajprenal.00391.2003
Copyright © 2004 by the American Physiological Society.
2
ABSTRACT
Cytotoxicity to renal tubular epithelial cells (RTE) is dependent on the relative response of cell
survival and cell death signals triggered by the injury. Forkhead transcription factors, Bcl-2 family
member Bad, and mitogen-activated protein kinases are regulated by phosphorylation that plays
crucial roles in determining cell fate. We examined the role of phosphorylation of these proteins in
regulation of H2O2-induced caspase activation in RTE. The phosphorylation of FKHR, FKHRL, and
Bcl-2 family member Bad were markedly increased in response to oxidant injury, and this increase
was associated with elevated levels of basal phosphorylation of Akt/protein kinase B. PI-3 kinase
inhibitors abolished this phosphorylation and also decreased expression of antiapoptotic proteins
Bcl-2 and BclxL. Inhibition of phosphorylation of forkhead proteins resulted in a marked increase in
proapoptotic protein Bim. These downstream effects of PI-3 kinase inhibition promoted the oxidant-
induced activation of caspase-3 and -9, but not caspase-8 and -1. The impact of enhanced activation
of caspases by PI-3 kinase inhibition was reflected on accelerated oxidant-induced cell death.
Oxidant stress also induced marked phosphorylation of ERK ½, P38, and JNK kinases. Inhibition of
ERK ½ phosphorylation but not P38 and JNK kinase increased caspase-3 and -9 activation;
however, this activation was far less than induced by inhibition of Akt phosphorylation. Thus, Akt -
mediated phosphorylation pathway, ERK signaling and the antiapoptotic Bcl-2 proteins distinctly
regulate caspase activation during oxidant injury to RTE. These studies suggest that enhancing renal-
specific survival signals may lead to preservation of renal function during oxidant injury.
Key Words: LLC-PK1 cells, caspases, Akt phosphorylation, Bim, PI-3 kinase inhibitors
3
INTRODUCTION
Caspases are a family of structurally related cysteine proteases that play a central role in the
execution of apoptosis (20, 49, 62). On receiving a proapoptotic stimulus, the caspases are
proteolytically processed to the active forms from their normally synthesized inactive proenzymes.
Activated caspases mediate apoptosis by cleaving and inactivating intracellular proteins that are
essential for cell survival and proliferation (20, 22, 49, 62). This cleavage of target proteins
contributes to the morphological changes observed in apoptosis. Multiple pathways can result in
activation of executioner caspases depending on the nature of the death-inducing stimulus. At
present, there are two relatively well-characterized cell death pathways that result in the activation of
the downstream caspase-3. One is receptor-mediated (53) and the other is mitochondrial-dependent
(29). The receptor-dependent pathway is initiated by activation of cell death receptors (Fas and
tumor necrosis factor α) leading to activation of procaspase-8, which in turn cleaves and activates
procaspase-3. The mitochondrial-dependent pathway is triggered by cytochrome c release and other
proapoptotic proteins from the mitochondria. The cytosolic cytochrome c recruits procaspase-9,
Apaf-1, and dATP and promotes caspase-9 activation. Activated caspase-9 then cleaves and
activates downstream procaspase-3 to its active form (29). However, it is not known whether oxidant
-induced activation of caspases involves both of these signaling pathways in renal injury.
Reactive oxygen species (ROS) have been implicated in the pathogenesis of a variety of renal
diseases including ischemic and toxic acute renal failure (4, 5, 43). ROS-induced cell death has been
reported in a wide variety of cells including renal tubular epithelial cells (RTE) (1, 14, 24, 31, 38, 57,
58) and in non-renal cells (25, 40). Studies from other laboratories and that of ours have shown an
important role of caspases in RTE injury (15, 21, 23, 33-36, 38, 41, 44, 46). Since oxidants have
been implicated in wide spectrum of RTE injury, understanding the relationship between oxidants
4
and caspases and cellular pathways that controls their activation would provide important
information related to RTE injury.
Cells mount responses to death stimuli that can overcome the insult and maintain cell
viability. Thus, cell fate in response to severe stress will depend on the balance between
antiapoptotic and proapoptotic signaling pathways. Oxidative stress can provoke cellular responses
in which proapoptotic pathways are activated as well as those that participate to defend against
oxidative injury (25, 40). Thus, the extent of oxidant-induced cellular injury will depend on the
balance between the activation of caspase cascade and induction of survival factors capable of
blocking the activation of caspases.
At present there is limited information on the role of cytoprotective as well as proapoptotic
signals that regulate cell fate in oxidant injury to renal cells. We have previously shown that Akt
phosphorylation plays an important role in cisplatin–induced caspase activation in RTE (34). The
present study provides evidence that downstream targets of Akt phosphorylation, Bcl-2 family
members, and MAP kinases play distinct roles in regulation of caspase activation in H2O2-induced
RTE injury. We provide evidence that regulation of caspase-3 and caspase-9 activation in oxidant
injury is controlled by Akt-mediated phosphorylation of proapoptotic Bcl-2 family member Bad and
forkhead transcription factors FKHR and FKHRL1 that control expression of proapoptotic protein
Bim. In addition, our studies demonstrate that, while activation of mitogen-activated protein kinases
is a common response to oxidant injury only induction of ERK ½ activation in oxidant injury
contributes to the regulation of caspase activation.
5
METHODS
Cell Culture and Reagents
LLC-PK1 cells obtained from American Type Culture Collection were cultured as in our
previous studies (34). The cells were grown in Dulbecco's modified Eagle's medium (DMEM)
supplemented with 10% heat-inactivated fetal calf serum, 2 mM L-glutamine, 20 mM 4-(2-hydroxy
ethyl)-1-piperazine ethanesulfonic acid (HEPES) and 2 mM nonessential amino acids. Cultures were
maintained in a humidified incubator gassed with 5% CO2 and 95% air at 37° C and fed with fresh
medium at intervals of 48 h-72 h. Experiments were performed with cells grown to 80% confluence.
Caspase substrates were purchased from Peptide International and antibodies to caspases and
proteins of Bcl-2 family were from Santa Cruz Biotechnology and Cell Signaling Technology.
Antibodies to Akt, Ser-473-phosphorylated Akt, Bad, Ser-136-phosphorylated Bad, Ser-112-
phosphorylated Bad, phospho-ERK ½ (phospho p44/42 MAP kinase), ERK (p44/42 MAP kinase),
Ser-256 phosphorylated forkhead transcription factor P-FKHR, Thr-32- and Thr-24-phosphorylated
forkhead transcription factor P-FKHRL1 and Akt kinase assay kit were obtained from Cell Signaling
Technology (Beverly, MA). Antibodies to Bim, cytochrome c, AIF (apoptosis-inducing factor) were
from Santa Cruz Biotechnology. Antibody to Cox IV (cytochrome c oxidase subunit IV) was from
Molecular Probes. MEK inhibitor UO126, JNK inhibitor SP600125, p38 inhibitor SB202190,
LY294002 (2-(4-morpholinyl)-8-phenyl-4H-1-benzopyran-4-one) a quercetin derivative and a
specific inhibitor of PI-3 kinase, and wortmannin a potent inhibitor of PI-3 kinase were obtained
from Calbiochem.
Induction of oxidant injury
Cell medium was replaced with fresh DMEM containing serum, glutamine, pyruvate,
nonessential amino acids, glucose, 3.7 g/liter NaHCO3 and 20 mM HEPES at pH 7.4, and cells were
6
incubated either with or without H2O2 of various concentrations (50 µM-400 µM) for the period of
time indicated (1h-8 h). In initial studies we determined the optimum exposure time and the suitable
concentration of H2O2. To determine a role of inhibition of Akt phosphorylation and signaling by
MAP kinases in H2O2-induced cell death, cells were preincubated with LY294002 or wortmannin,
inhibitors of Akt phosphorylation, and MAP kinases respectively for 10 min and then exposed to
H2O2 (100 µM).
Determination of caspase activity
Cells were harvested by centrifugation and the pellets were washed in cold PBS twice. The
washed cell pellets were lysed with 20 mM HEPES, pH 7.5, containing 10% sucrose, 0.1% CHAPS,
2 mM DTT, 0.1% NP40, 1 mM EDTA, 1 mM PMSF, 1µg/ml leupeptin and 1µg/ml pepstatin A at
4°C. The supernatants obtained were used to determine the activities of caspase-1, -3, -8, -and -9 by
fluorometric assay using the following amino-4-methyl coumarin (AMC)-tagged substrates: YVAD-
AMC for caspase-1, DEVD-AMC for caspase-3, IETD-AMC for caspase-8 and LEHD-AMC for
caspase-9. These substrates are specifically cleaved by the respective caspases at the Asp residue
releasing the fluorescent AMC tag (34, 52). The enzyme extracts containing 50 µg protein were
incubated with 100 mM HEPES, pH 7.4, containing 10% sucrose, 0.1% CHAPS, 10 mM DTT and
50 µM of caspase substrate in a total reaction volume of 0.25 ml. The reaction mixture was
incubated for 60 min at 30°C. At the end of incubation, the amount of liberated fluorescent group,
AMC was determined using a fluorescent Spectrofluorometer (Perkin Elmer) with an excitation
wavelength of 380 nm and an emission wavelength of 460 nm (34, 52). AMC was used as a
standard. Based on the standard curve made with fluorescence reading with free AMC, the data for
caspase activity are expressed as nmoles of AMC liberated when 50 µg of protein extract was
incubated with 50 µM of substrate for 60 min at 30°C.
7
Phosphorylation of Akt, Bad and Forkhead proteins
Akt phosphorylation was determined by using an “Akt Kinase Assay” kit (Cell Signaling
Technology) following the manufacturer’s instructions. Briefly, cells were lysed with cell lysis
buffer supplied with the assay kit. Total Akt in cell extracts was immunoprecipitated with anti-Akt
antibody conjugated to agarose beads. The immunoprecipitated Akt was then incubated with GSK-3
protein in kinase assay containing ATP. Following incubation and centrifugation, the supernatant
was used to assay phospho-GSK-3 by Western blot analysis using anti-phospho-GSK–3α/β
antibodies. Akt bound to the agarose beads was released by boiling in SDS-sample buffer and
quantitated by Western blot using anti-Akt antibody. Phosphorylation of Bad, ERK ½, and forkhead
transcription factors (FKHR and FKHRL1) was determined using the respective phospho-specific
antibodies.
Western blot analysis
The cell lysates were prepared as described above for caspase assay and 100 µg protein samples
were subjected to reducing sodium dodecyl sulfate (SDS)-gel electrophoresis. SDS-polyacrylamide
gel electrophoresis (PAGE) was performed as previously described (56) using 8% polyacrylamide
gels. The resolved proteins were electrophoretically transferred to Immobilon polyvinylidine
difluoride (Millipore) membrane and processed further for antibody staining as described by
Towbin, Staehelin and Gordon (56). Following this transfer, membranes were washed in a buffer
containing 50 mM Tris-HCl, pH 7.5, 150 mM NaCl, and 0.05% Tween 20 for 5 min, and then in the
same buffer containing 5% non-fat dry milk for an hour at room temperature. The membranes were
then incubated for 2 hours with primary antibodies (1:1000 dilution) in the same buffer with 5% dry
milk. At the end of this time, the membranes were thoroughly washed (at least 4 times) with 50 mM
Tris-HCl, pH 7.5, containing 0.05% Tween 20. The membrane filters were then incubated for 2

8
hours with horseradish peroxidase-conjugated goat anti-rabbit antibody diluted 1:3000 in Tris buffer
containing 5% dry milk. After incubation, membrane filters were washed in the same buffer
containing 0.05% Tween 20 and developed by exposure to chemiluminescent substrates (Pierce,
Rockford, IL).
Transient transfection
LLC-PK1 cells were transfected with expression constructs pUSE-DN-Akt encoding DN-Akt or the
empty vector pUSE in the presence of an expression vector pCMV-Lac Z expressing β-
galactosidase. pUSE-DN-Akt and pUSE were from Upstate Biotechnology. Transfection was
performed using Lipofectamine (Life Technologies) as per manufacturer's recommendation as
described in our previous studies (34). Briefly, cells were plated at a density of 2 x 10⁵ in six-well
plates. After 24 h, cells were washed three times with serum-free media and incubated 6 h with a
mixture of Lipofectamine and plasmids containing the inserts (1.5 µl of Lipofectamine 50 µl of
serum free medium and 1µg of DNA in 50 µl of serum-free medium) in serum free media at 37°C
with 10% CO2. Culture medium then was replaced with fresh DMEM containing 10% serum and
1% penicillin-streptomycin mixture and cells were then treated with H2O2 for the indicated times.
After incubation, cells were examined for expression of phospho-Akt by Western blot and for
caspase activity using fluorogenic substrates.
Immunofluorescence localization of active caspase-3
Cells grown on sterile glass cover slips were treated with 200 µM H2O2 for various time points in
presence and absence of PI-3 kinase inhibitor LY294002. Following treatments cells were washed in
PBS and fixed in 2% parformaldehyde in PBS for 15 min. After washing twice in PBS cells were
permeabilized for 1 h in blocking buffer containing 1% BSA, 1% Goat serum, 0.1% saponin, 1 mM
CaCl2, 1 mM MgCl2, and 2 mM NaV2O5 in PBS. Cells were then incubated in with 1:200 rabbit
9
anti-caspase-3 (active) antibody for 1h in 37oC humidified incubator. After three washes in buffer
containing 1% BSA and 0.1% saponin in PBS, cells were incubated at 37oC in humidified incubator
for 1h with 1:500 of Alexa fluor-conjugated secondary antibody (goat anti-rabbit) in blocking
solution and again washed with washing buffer. The nuclei were stained with 0.5 µg/ml 4', 6'-
diamidino-2-phenylindole (DAPI) for 5 min and cells were washed twice in washing buffer. Cover
slips were then mounted on slides using antifade mounting media (Molecular Probes) and visualized
for active caspase-3 and morphological changes using a Zeiss Deconvoluted Microscope.
Subcellular fractionation
LLC-PK1 cells were harvested and cell pellets were washed in PBS.
Mitochondrial and cytosolic fractions were isolated essentially as previously described (3, 17).
Briefly, cells were suspended in isotonic mitochondrial buffer containing 210 mM mannitol, 70 mM
sucrose, 1 mM EDTA, and 10 mM Hepes, pH 7.5, supplemented with protease inhibitor cocktail,
and homogenized for 30-40 strokes with Dounce homogenizer at 4˚C. To establish the number of
strokes necessary for cell permeabilzation, the trypan blue exclusion method (0.4% trypan blue
solution in PBS diluted 1:10 with cell suspension) was used to discriminate between permeabilized
(stained) cells and intact cells (unstained). The suspension was then transferred to Eppendorf
centrifuge tubes and centrifuged at 500x g for 5 min to pellet nuclei and unbroken cells. The
supernatant was then centrifuged at 10,000x g for 30 min to pellet the mitochondria-enriched
fraction. The resulting supernatant was used as the cytosolic fraction. The mitochondrial pellet was
further purified by resuspending in isotonic mitochondrial buffer and centrifuging at 10,000 x g.
Contamination of mitochondria in the cytosolic fraction was determined by immunoblotting for
cytochrome oxidase subunit IV, an integral membrane protein of mitochondria.
10
Fluorescent –activated cell sorter (FACS) analysis
Following treatments with 200 µM H2O2 in presence and absence of LY294002, cells were harvested
by trypsinization, pooled with culture medium containing floating cells, and collected by
centrifugation at 500g for 5min. The cell pellets were suspended in 70% ethanol in PBS containing
5mM EDTA and kept at 4oC overnight, collected by centrifugation at 1500g for 10 min, and
resuspended in 0.5 ml of PBS containing 5 mM EDTA. RNase A was added (50 µl, 10mg/ml), and
the suspension was incubated for 30 min at 25oC. Propidium iodide was added (450 µl, 10 µg/ml),
and the samples were analyzed using a FACSCalibur machine (Becton Dickinson). For each culture
condition 5X10⁵ cells were analyzed. The percentage of cells in sub-G1/G0 (fraction containing cell
debris, apoptotic and necrotic cells), S, and G2/M phases was determined using a cell cycle analysis
program (Win MDI 2.8). The results shown are representative of three independent experiments.
Statistical analyses
Results are mean ± SE. Comparison between values was determined by Student’s t-test. A P value
less than 0.05 was considered significant.
11
RESULTS Phosphorylation of Akt, Bad, FKHR, and FKHRL1 in oxidant injury
To elucidate the role of Akt-phosphorylation in caspase activation in oxidant injury we first
examined the activity of Akt in response to H2O2 to LLC-PK1 cells. Akt kinase assay revealed that
H2O2 markedly increased basal Akt kinase activity in a time- and dose-dependent manner (Figure
1A and 1B). However, the protein expression of Akt alone was not changed during the course of
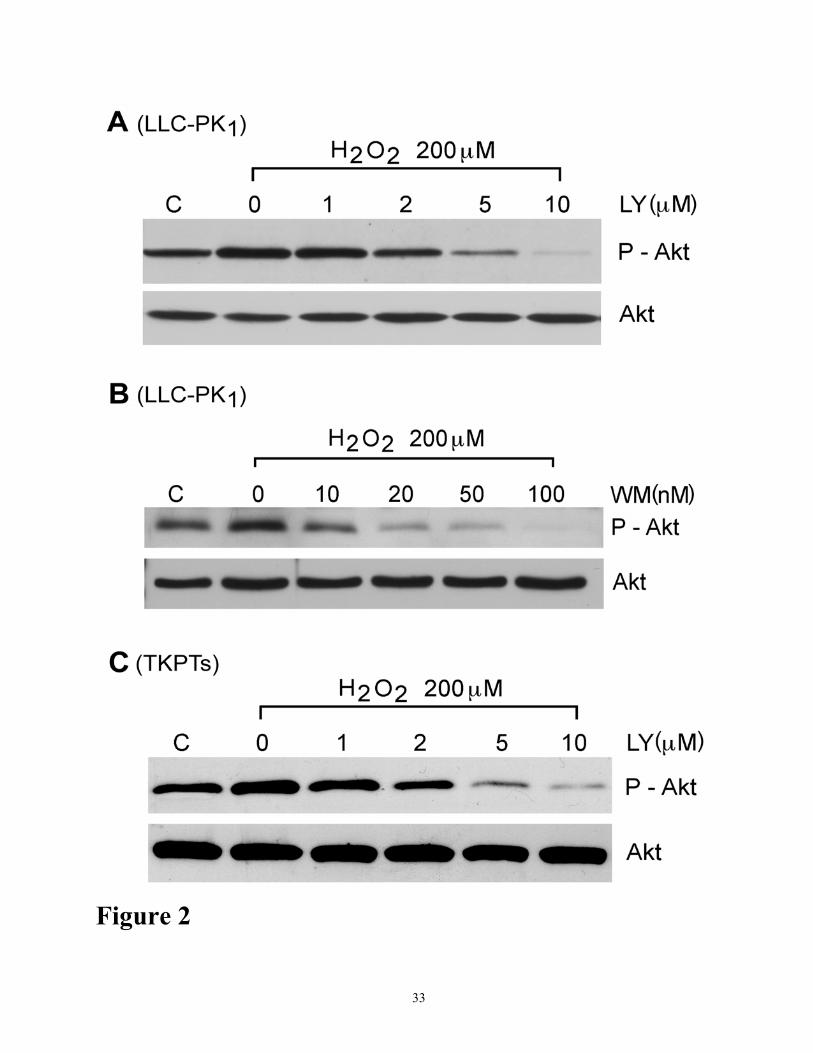
oxidant injury. Oxidant-induced phosphorylation of Akt was abolished in a dose-dependent manner
by LY294002 (0 µM-10 µM) (Figure 2A) or by wortmannin (0 µM-0.25 µM) (Figure 2B),
inhibitors of PI-3 kinase. Similar results were obtained when TKPTS (mouse proximal tubular
epithelial cells) cells were treated with H2O2 and LY294002 (Figure 2C). MAP kinase MEK
inhibitor UO126 and JNK inhibitor, SP600125 did not prevent H2O2-induced Akt phosphorylation
(Figure 3) indicating that MAP kinases are not involved in phosphorylation of Akt.
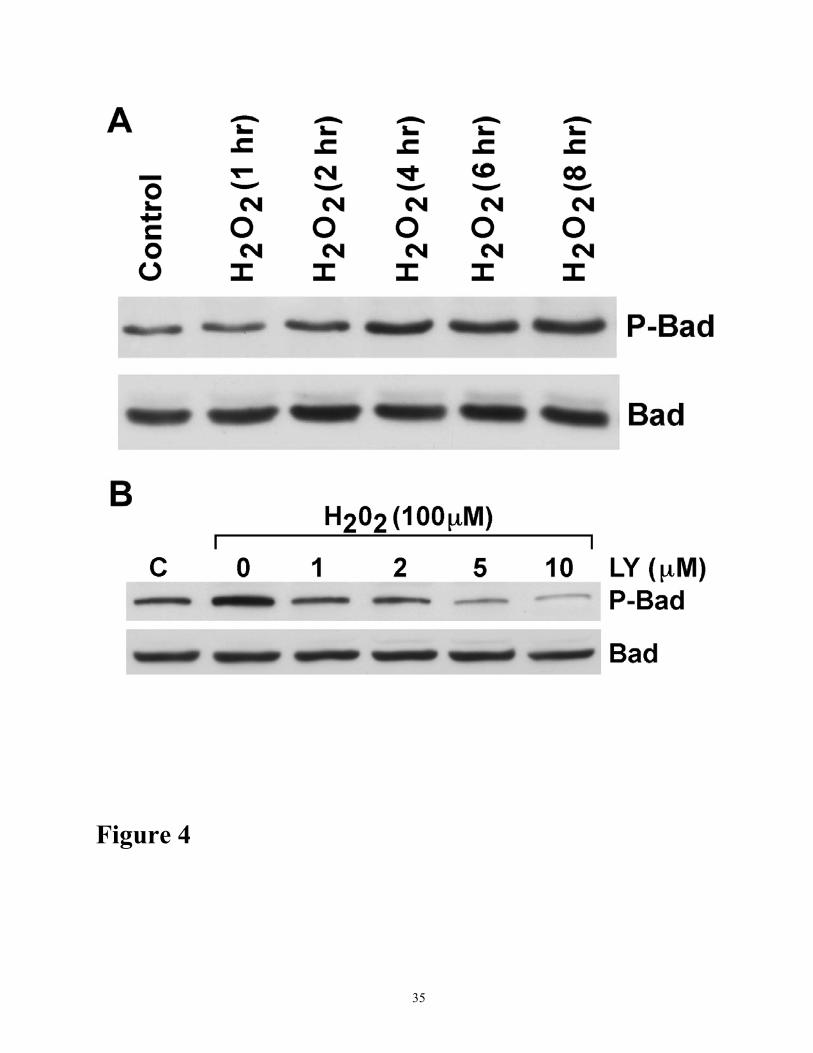
Bad phoshorylation was markedly increased with H2O2 treatment; however, the level of Bad
protein was not changed during the course of oxidant injury (Figure 4A). These studies indicate that
Bad phosphorylation is associated with Akt phosphorylation during H2O2-induced injury and may be
involved in the suppression of caspase activation. Indeed, phosphorylation of Bad was abolished in a
dose-dependent manner by LY294002 (0 µM-10 µM) (Figures 4B) or by wortmannin (0 µM-0.25
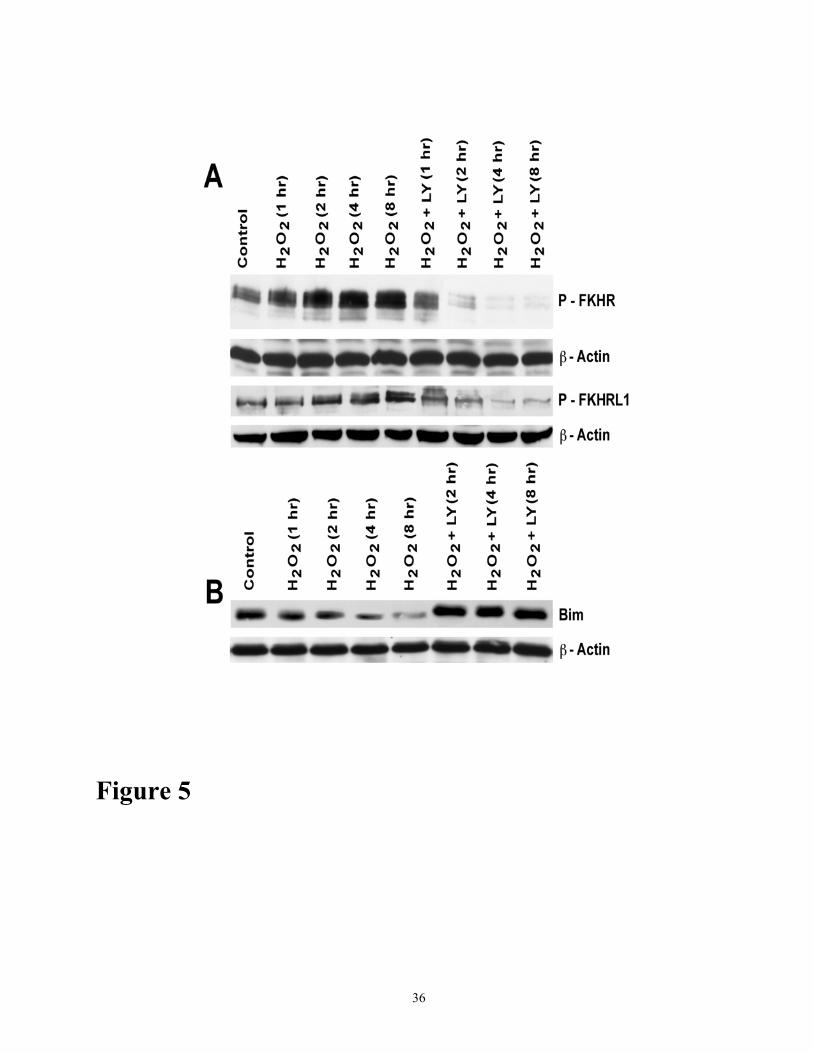
µM) (data not shown). Similarly, H2O2 induced marked phosphorylation of the FKHR and FKHRL1,
and this phosphorylation was abrogated by LY294002 in a time-dependent manner (Figure 5A),
indicating that forkhead factors are downstream targets of Akt phosphorylation in oxidant injury.
The phosphorylated forms of forkhead proteins are antiapoptotic whereas unphosphorylated forms
are proapoptotic. Because in some cell types, forkhead transcription factors induce expression of
proapoptotoic protein Bim (19, 28, 51) we examined the expression of protein levels of proapoptotic
12
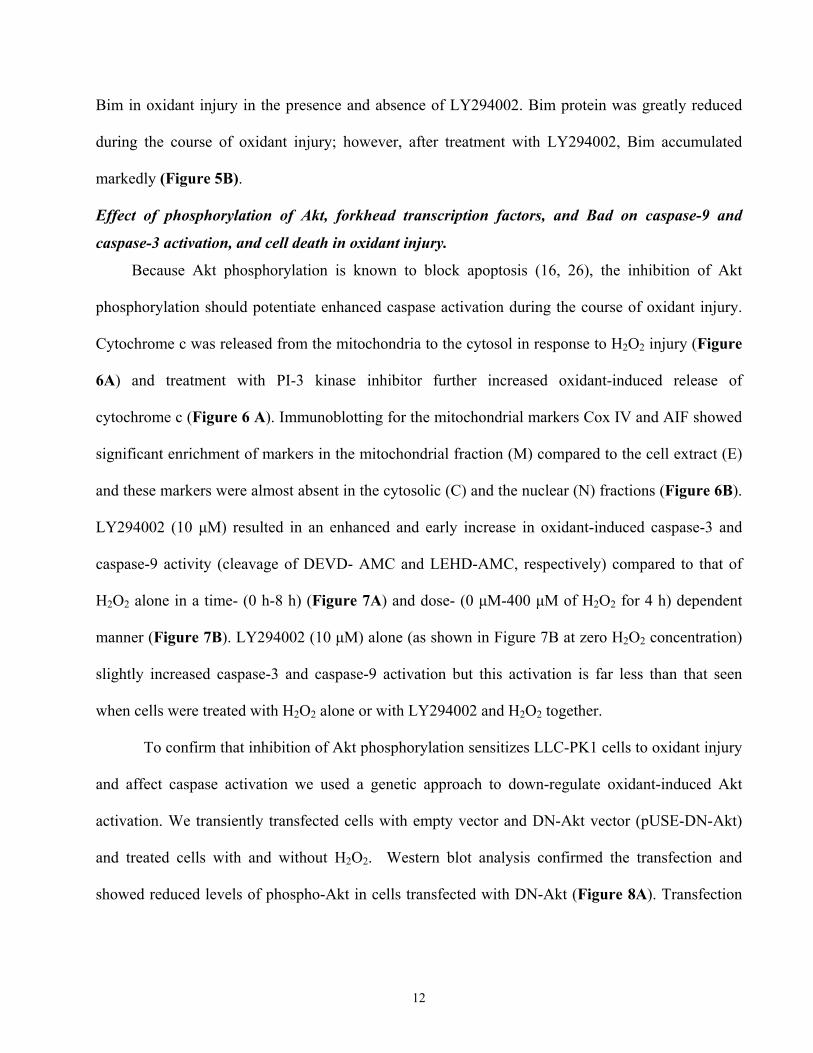
Bim in oxidant injury in the presence and absence of LY294002. Bim protein was greatly reduced
during the course of oxidant injury; however, after treatment with LY294002, Bim accumulated
markedly (Figure 5B).
Effect of phosphorylation of Akt, forkhead transcription factors, and Bad on caspase-9 and
caspase-3 activation, and cell death in oxidant injury.
Because Akt phosphorylation is known to block apoptosis (16, 26), the inhibition of Akt
phosphorylation should potentiate enhanced caspase activation during the course of oxidant injury.
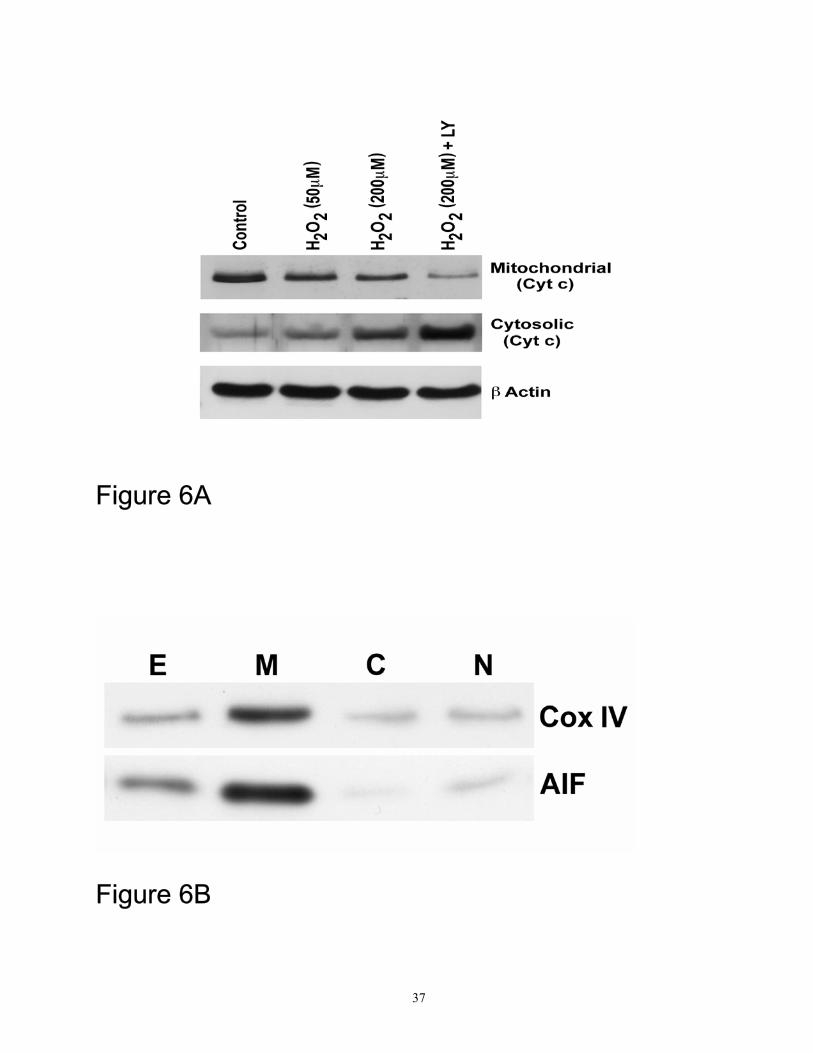
Cytochrome c was released from the mitochondria to the cytosol in response to H2O2 injury (Figure
6A) and treatment with PI-3 kinase inhibitor further increased oxidant-induced release of
cytochrome c (Figure 6 A). Immunoblotting for the mitochondrial markers Cox IV and AIF showed
significant enrichment of markers in the mitochondrial fraction (M) compared to the cell extract (E)
and these markers were almost absent in the cytosolic (C) and the nuclear (N) fractions (Figure 6B).
LY294002 (10 µM) resulted in an enhanced and early increase in oxidant-induced caspase-3 and
caspase-9 activity (cleavage of DEVD- AMC and LEHD-AMC, respectively) compared to that of
H2O2 alone in a time- (0 h-8 h) (Figure 7A) and dose- (0 µM-400 µM of H2O2 for 4 h) dependent
manner (Figure 7B). LY294002 (10 µM) alone (as shown in Figure 7B at zero H2O2 concentration)
slightly increased caspase-3 and caspase-9 activation but this activation is far less than that seen
when cells were treated with H2O2 alone or with LY294002 and H2O2 together.
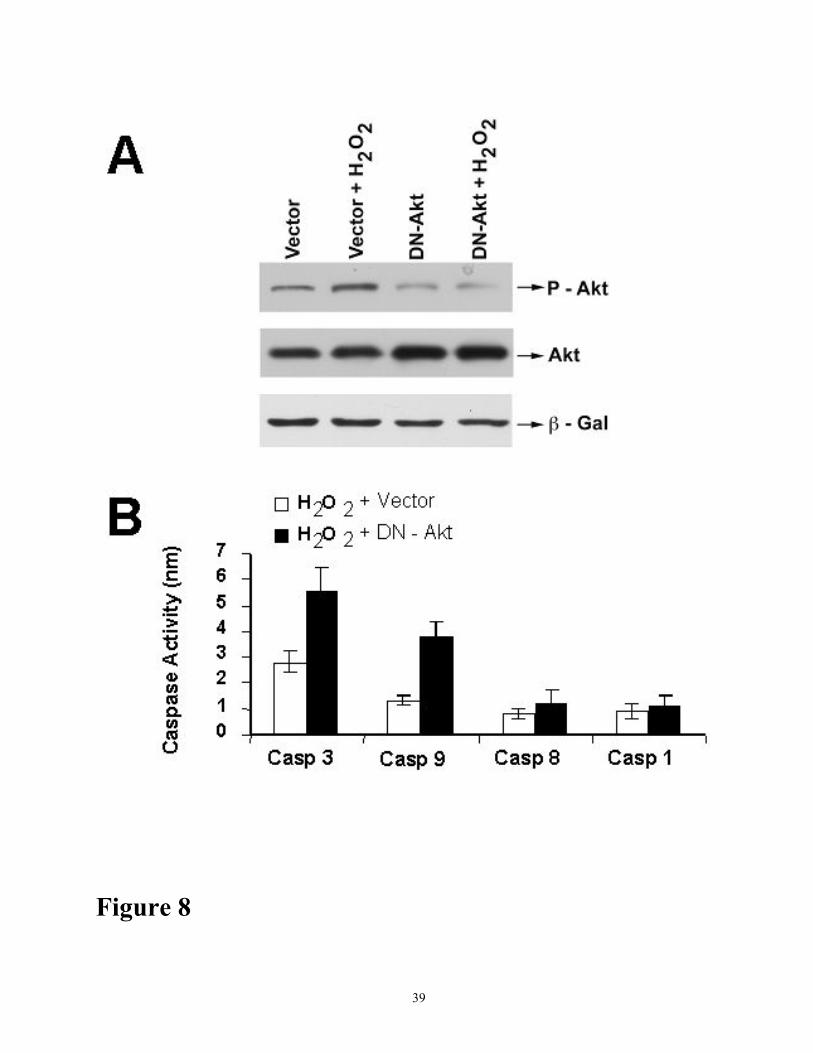
To confirm that inhibition of Akt phosphorylation sensitizes LLC-PK1 cells to oxidant injury
and affect caspase activation we used a genetic approach to down-regulate oxidant-induced Akt
activation. We transiently transfected cells with empty vector and DN-Akt vector (pUSE-DN-Akt)
and treated cells with and without H2O2. Western blot analysis confirmed the transfection and
showed reduced levels of phospho-Akt in cells transfected with DN-Akt (Figure 8A). Transfection
13
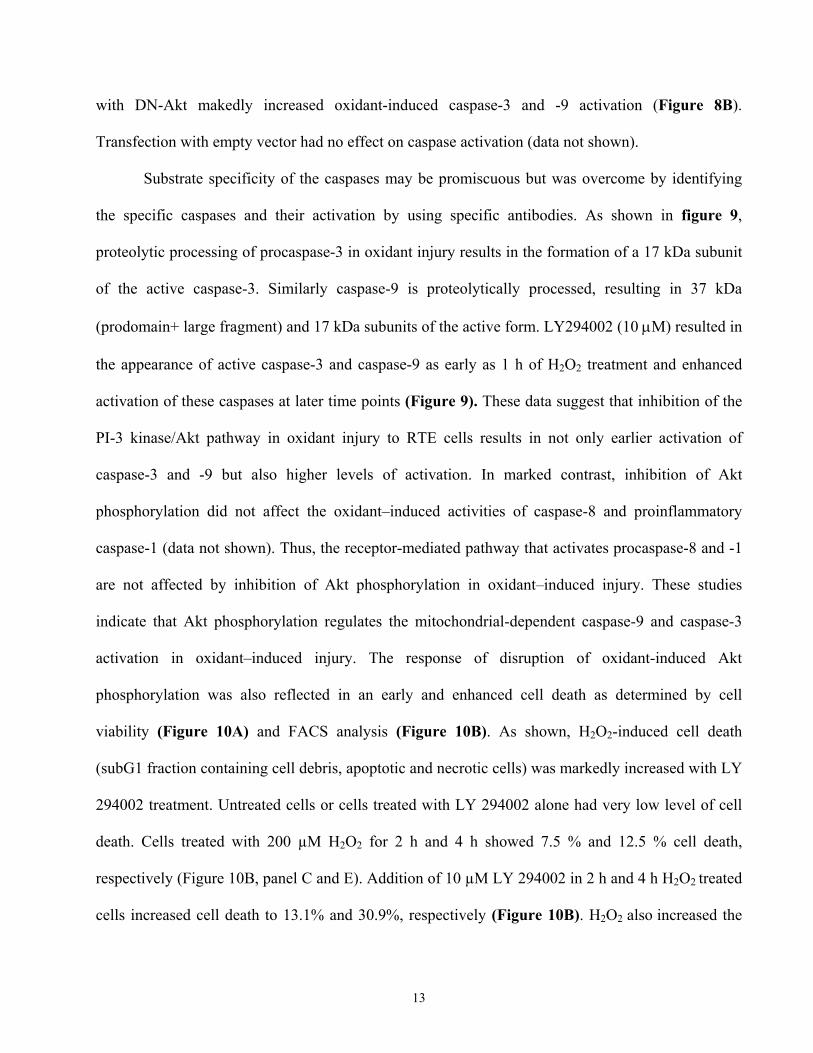
with DN-Akt makedly increased oxidant-induced caspase-3 and -9 activation (Figure 8B).
Transfection with empty vector had no effect on caspase activation (data not shown).
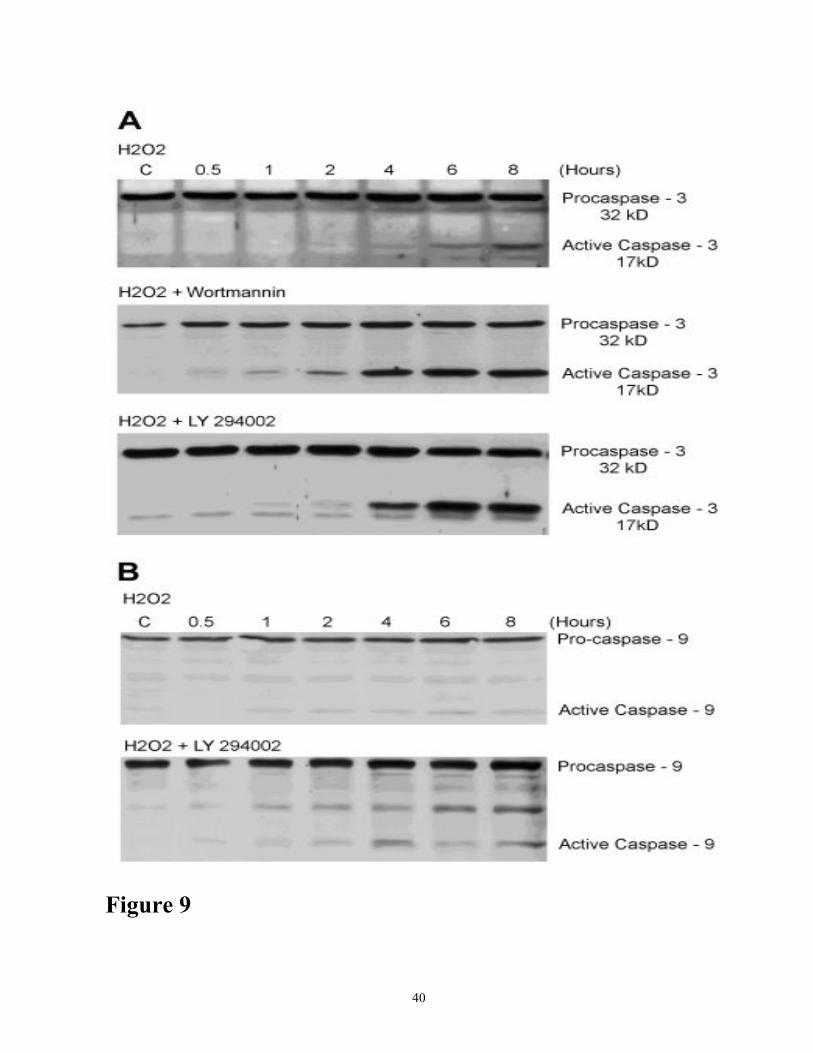
Substrate specificity of the caspases may be promiscuous but was overcome by identifying
the specific caspases and their activation by using specific antibodies. As shown in figure 9,
proteolytic processing of procaspase-3 in oxidant injury results in the formation of a 17 kDa subunit
of the active caspase-3. Similarly caspase-9 is proteolytically processed, resulting in 37 kDa
(prodomain+ large fragment) and 17 kDa subunits of the active form. LY294002 (10 µM) resulted in
the appearance of active caspase-3 and caspase-9 as early as 1 h of H2O2 treatment and enhanced
activation of these caspases at later time points (Figure 9). These data suggest that inhibition of the
PI-3 kinase/Akt pathway in oxidant injury to RTE cells results in not only earlier activation of
caspase-3 and -9 but also higher levels of activation. In marked contrast, inhibition of Akt
phosphorylation did not affect the oxidant–induced activities of caspase-8 and proinflammatory
caspase-1 (data not shown). Thus, the receptor-mediated pathway that activates procaspase-8 and -1
are not affected by inhibition of Akt phosphorylation in oxidant–induced injury. These studies
indicate that Akt phosphorylation regulates the mitochondrial-dependent caspase-9 and caspase-3
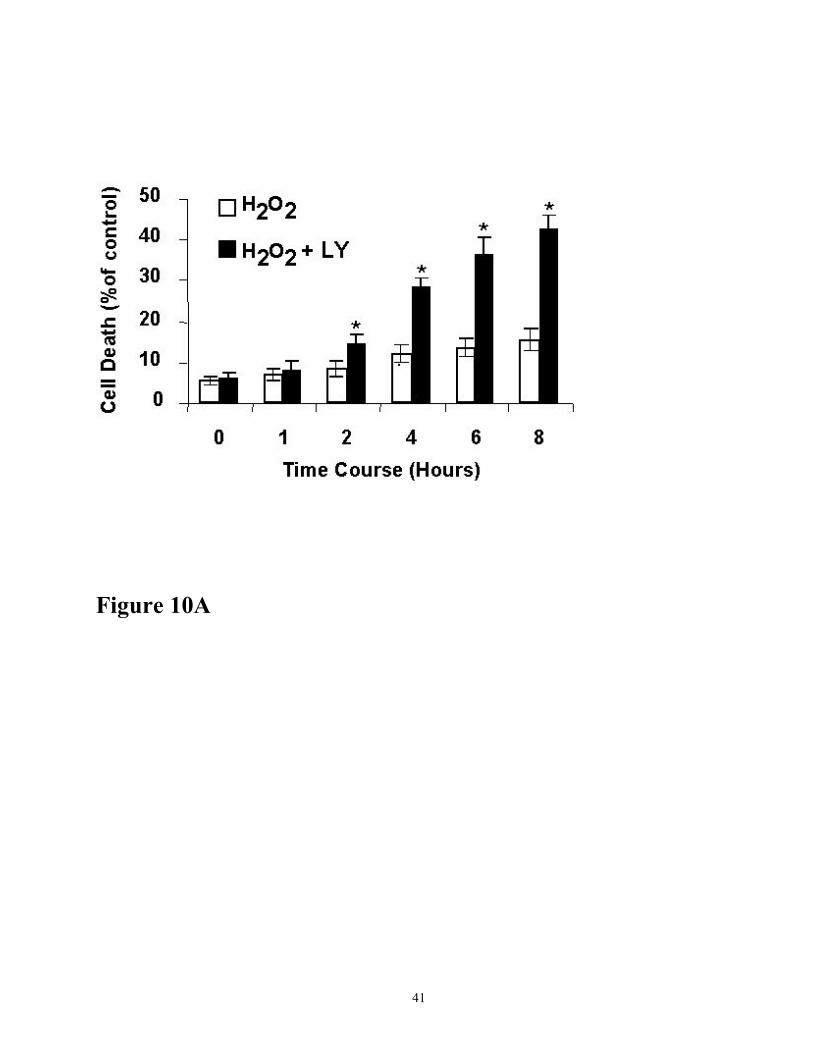
activation in oxidant–induced injury. The response of disruption of oxidant-induced Akt
phosphorylation was also reflected in an early and enhanced cell death as determined by cell
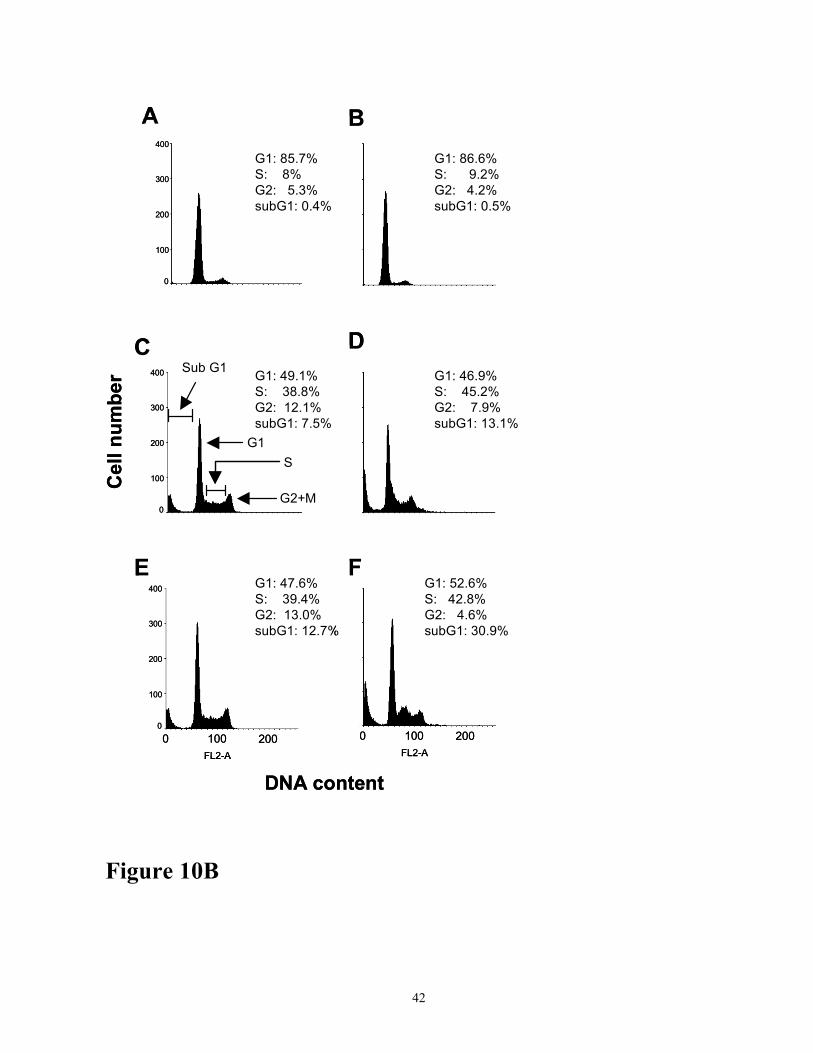
viability (Figure 10A) and FACS analysis (Figure 10B). As shown, H2O2-induced cell death
(subG1 fraction containing cell debris, apoptotic and necrotic cells) was markedly increased with LY
294002 treatment. Untreated cells or cells treated with LY 294002 alone had very low level of cell
death. Cells treated with 200 µM H2O2 for 2 h and 4 h showed 7.5 % and 12.5 % cell death,
respectively (Figure 10B, panel C and E). Addition of 10 µM LY 294002 in 2 h and 4 h H2O2 treated
cells increased cell death to 13.1% and 30.9%, respectively (Figure 10B). H2O2 also increased the
14
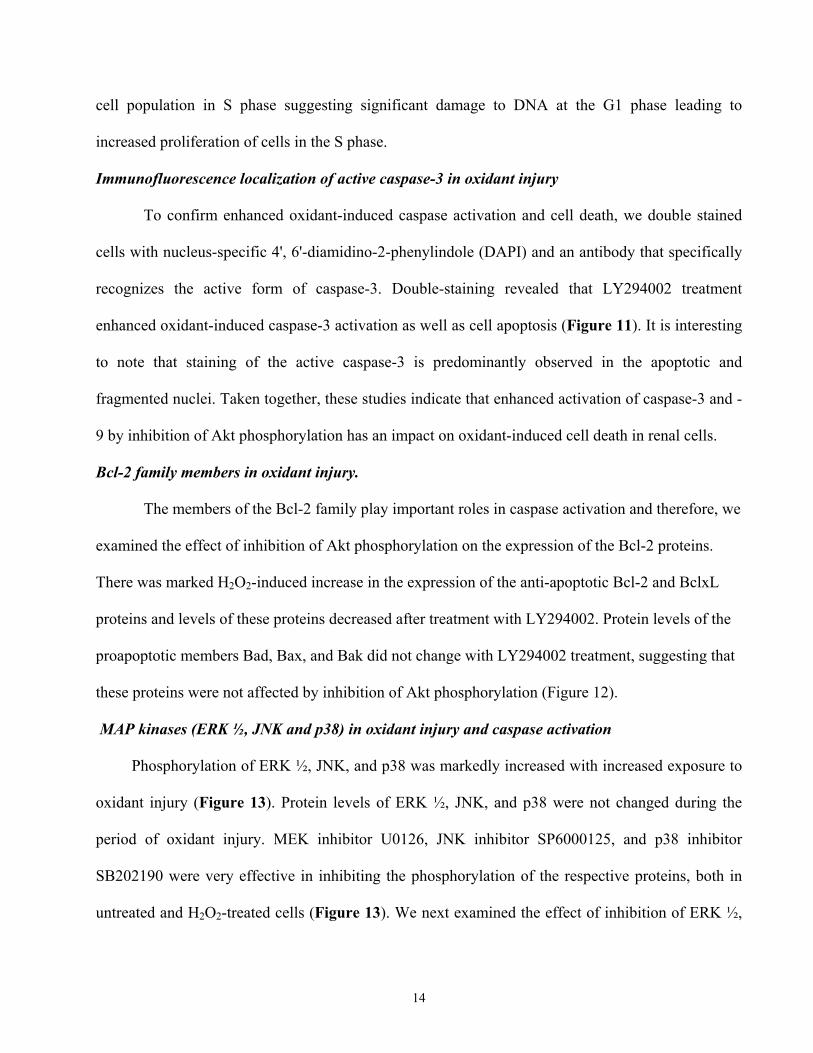
cell population in S phase suggesting significant damage to DNA at the G1 phase leading to
increased proliferation of cells in the S phase.
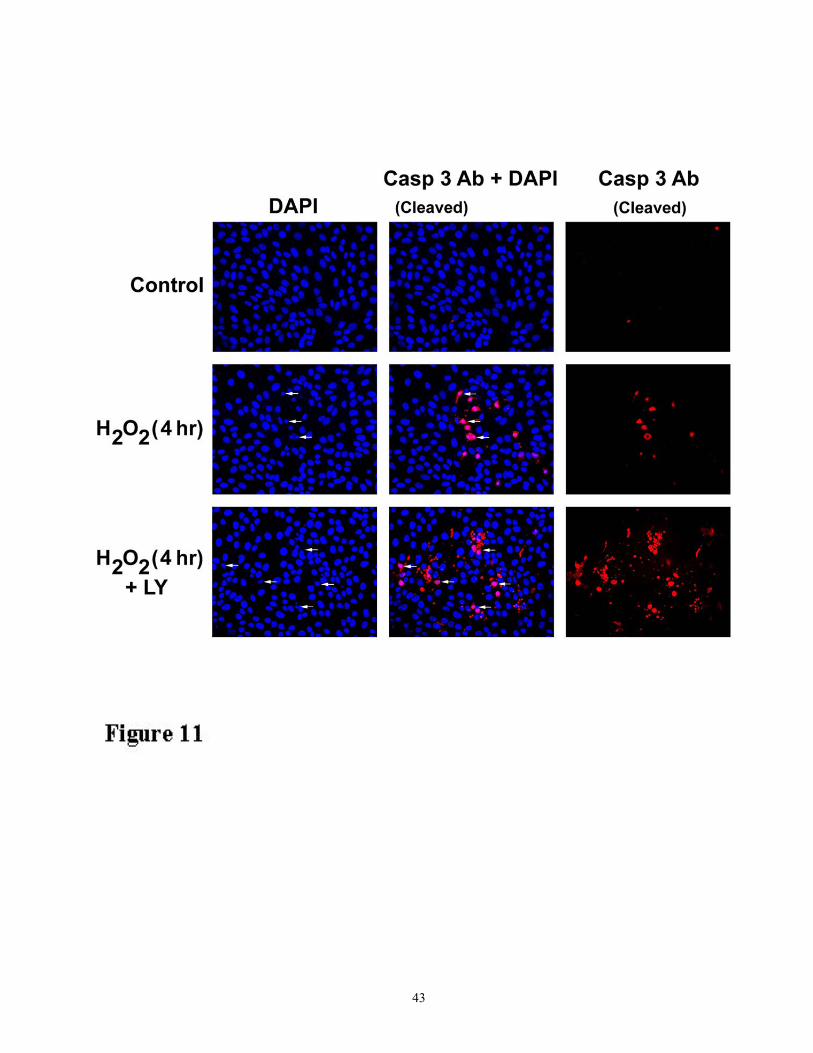
Immunofluorescence localization of active caspase-3 in oxidant injury
To confirm enhanced oxidant-induced caspase activation and cell death, we double stained
cells with nucleus-specific 4', 6'-diamidino-2-phenylindole (DAPI) and an antibody that specifically
recognizes the active form of caspase-3. Double-staining revealed that LY294002 treatment
enhanced oxidant-induced caspase-3 activation as well as cell apoptosis (Figure 11). It is interesting
to note that staining of the active caspase-3 is predominantly observed in the apoptotic and
fragmented nuclei. Taken together, these studies indicate that enhanced activation of caspase-3 and -
9 by inhibition of Akt phosphorylation has an impact on oxidant-induced cell death in renal cells.
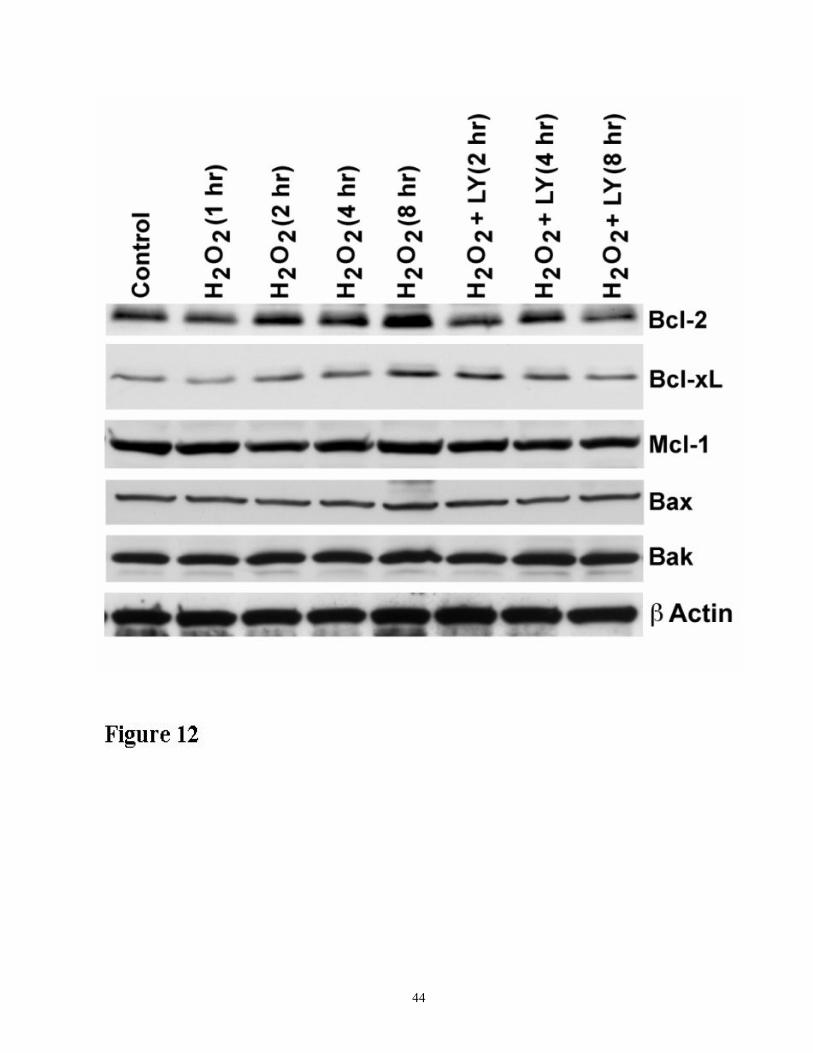
Bcl-2 family members in oxidant injury.
The members of the Bcl-2 family play important roles in caspase activation and therefore, we
examined the effect of inhibition of Akt phosphorylation on the expression of the Bcl-2 proteins.
There was marked H2O2-induced increase in the expression of the anti-apoptotic Bcl-2 and BclxL
proteins and levels of these proteins decreased after treatment with LY294002. Protein levels of the
proapoptotic members Bad, Bax, and Bak did not change with LY294002 treatment, suggesting that
these proteins were not affected by inhibition of Akt phosphorylation (Figure 12).
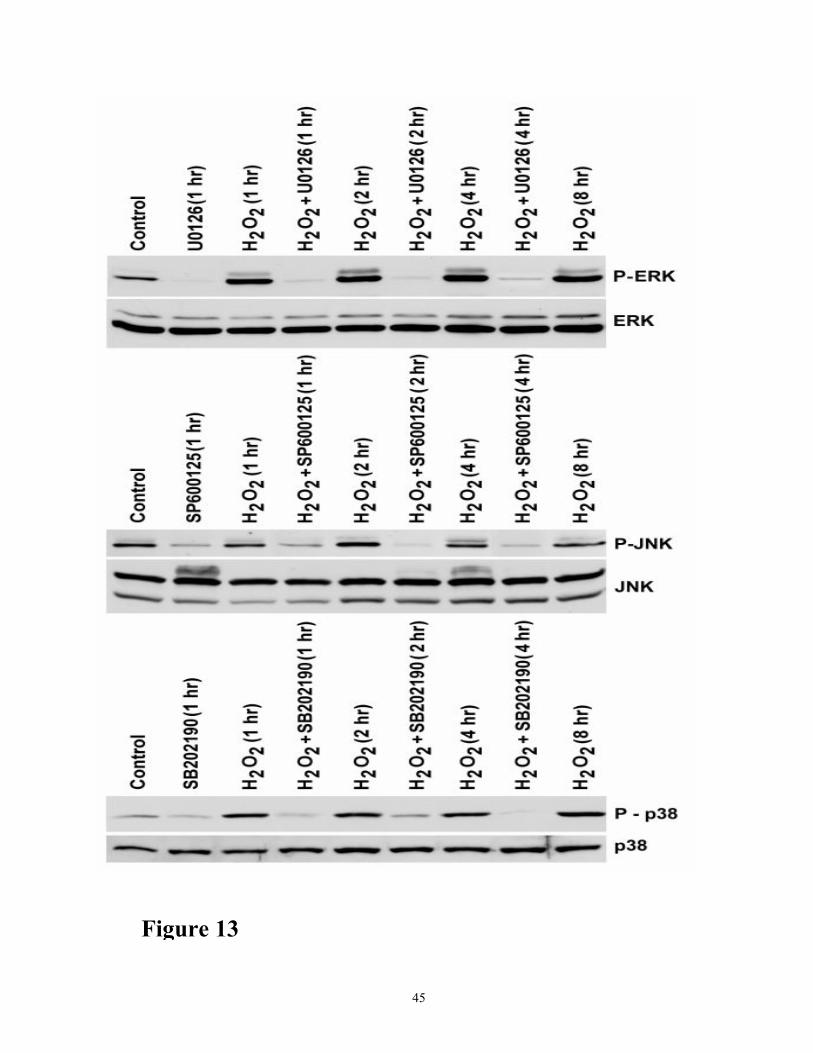
MAP kinases (ERK ½, JNK and p38) in oxidant injury and caspase activation
Phosphorylation of ERK ½, JNK, and p38 was markedly increased with increased exposure to
oxidant injury (Figure 13). Protein levels of ERK ½, JNK, and p38 were not changed during the
period of oxidant injury. MEK inhibitor U0126, JNK inhibitor SP6000125, and p38 inhibitor
SB202190 were very effective in inhibiting the phosphorylation of the respective proteins, both in
untreated and H2O2-treated cells (Figure 13). We next examined the effect of inhibition of ERK ½,
15
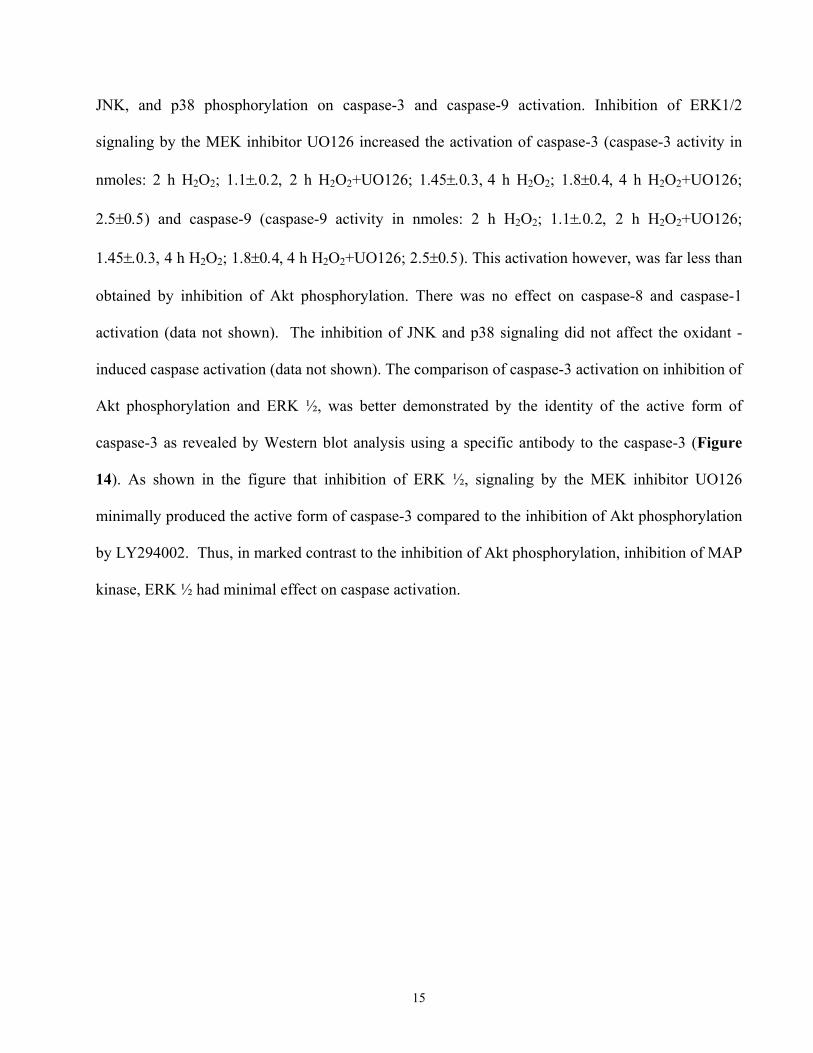
JNK, and p38 phosphorylation on caspase-3 and caspase-9 activation. Inhibition of ERK1/2
signaling by the MEK inhibitor UO126 increased the activation of caspase-3 (caspase-3 activity in
nmoles: 2 h H2O2; 1.1±.0.2, 2 h H2O2+UO126; 1.45±.0.3, 4 h H2O2; 1.8±0.4, 4 h H2O2+UO126;
2.5±0.5) and caspase-9 (caspase-9 activity in nmoles: 2 h H2O2; 1.1±.0.2, 2 h H2O2+UO126;
1.45±.0.3, 4 h H2O2; 1.8±0.4, 4 h H2O2+UO126; 2.5±0.5). This activation however, was far less than
obtained by inhibition of Akt phosphorylation. There was no effect on caspase-8 and caspase-1
activation (data not shown). The inhibition of JNK and p38 signaling did not affect the oxidant -
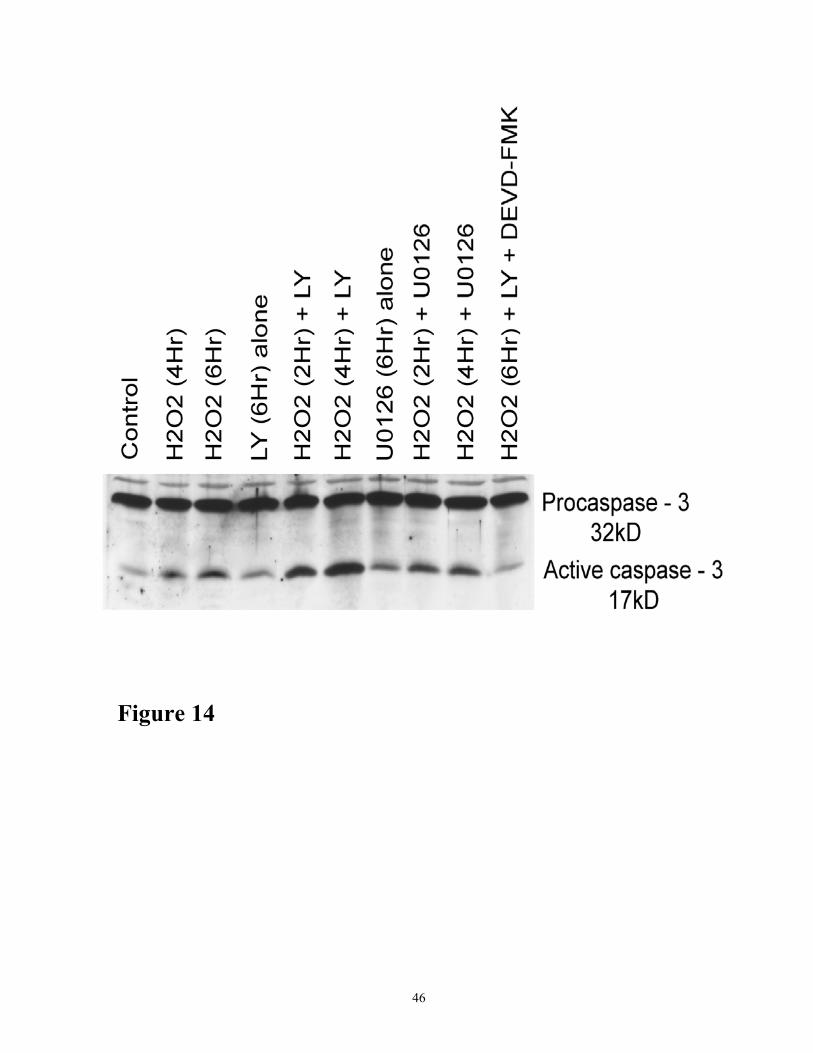
induced caspase activation (data not shown). The comparison of caspase-3 activation on inhibition of
Akt phosphorylation and ERK ½, was better demonstrated by the identity of the active form of
caspase-3 as revealed by Western blot analysis using a specific antibody to the caspase-3 (Figure
14). As shown in the figure that inhibition of ERK ½, signaling by the MEK inhibitor UO126
minimally produced the active form of caspase-3 compared to the inhibition of Akt phosphorylation
by LY294002. Thus, in marked contrast to the inhibition of Akt phosphorylation, inhibition of MAP
kinase, ERK ½ had minimal effect on caspase activation.
16
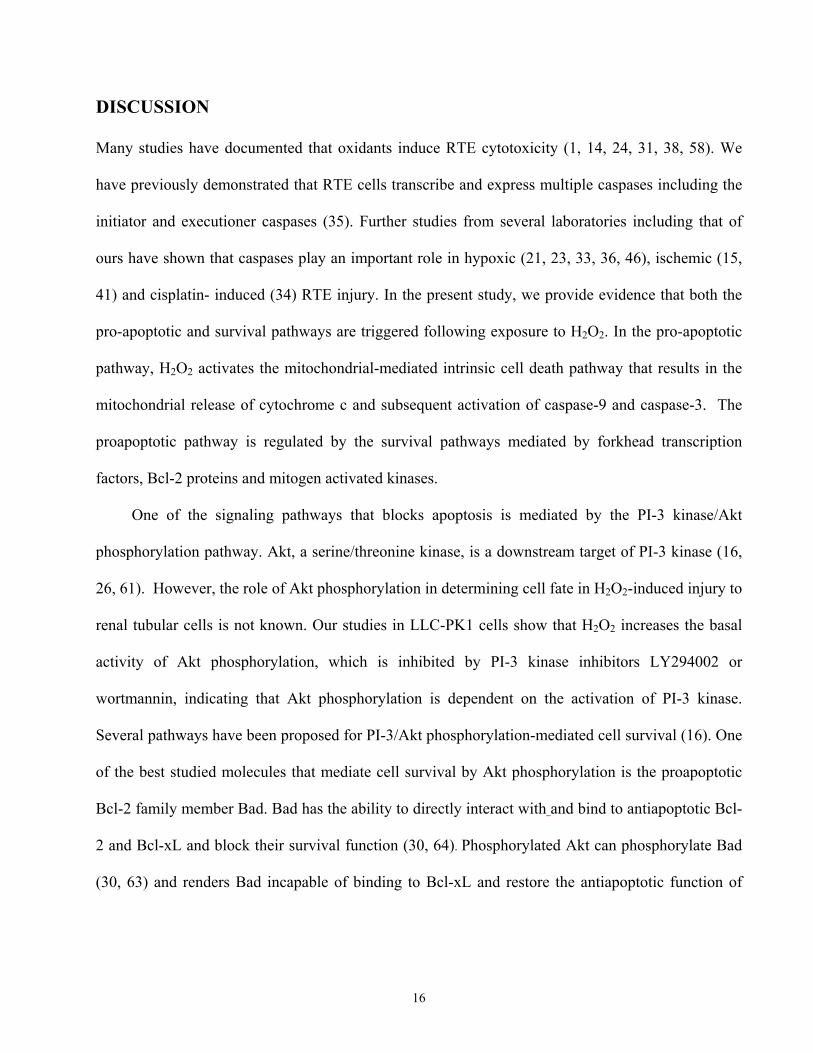
DISCUSSION
Many studies have documented that oxidants induce RTE cytotoxicity (1, 14, 24, 31, 38, 58). We
have previously demonstrated that RTE cells transcribe and express multiple caspases including the
initiator and executioner caspases (35). Further studies from several laboratories including that of
ours have shown that caspases play an important role in hypoxic (21, 23, 33, 36, 46), ischemic (15,
41) and cisplatin- induced (34) RTE injury. In the present study, we provide evidence that both the
pro-apoptotic and survival pathways are triggered following exposure to H2O2. In the pro-apoptotic
pathway, H2O2 activates the mitochondrial-mediated intrinsic cell death pathway that results in the
mitochondrial release of cytochrome c and subsequent activation of caspase-9 and caspase-3. The
proapoptotic pathway is regulated by the survival pathways mediated by forkhead transcription
factors, Bcl-2 proteins and mitogen activated kinases.
One of the signaling pathways that blocks apoptosis is mediated by the PI-3 kinase/Akt
phosphorylation pathway. Akt, a serine/threonine kinase, is a downstream target of PI-3 kinase (16,
26, 61). However, the role of Akt phosphorylation in determining cell fate in H2O2-induced injury to
renal tubular cells is not known. Our studies in LLC-PK1 cells show that H2O2 increases the basal
activity of Akt phosphorylation, which is inhibited by PI-3 kinase inhibitors LY294002 or
wortmannin, indicating that Akt phosphorylation is dependent on the activation of PI-3 kinase.
Several pathways have been proposed for PI-3/Akt phosphorylation-mediated cell survival (16). One
of the best studied molecules that mediate cell survival by Akt phosphorylation is the proapoptotic
Bcl-2 family member Bad. Bad has the ability to directly interact with and bind to antiapoptotic Bcl-
2 and Bcl-xL and block their survival function (30, 64). Phosphorylated Akt can phosphorylate Bad
(30, 63) and renders Bad incapable of binding to Bcl-xL and restore the antiapoptotic function of
17
Bcl-2 (16, 30). We have demonstrated oxidant-induced increased phosphorylation of Bad that was
dependent on Akt phosphorylation.
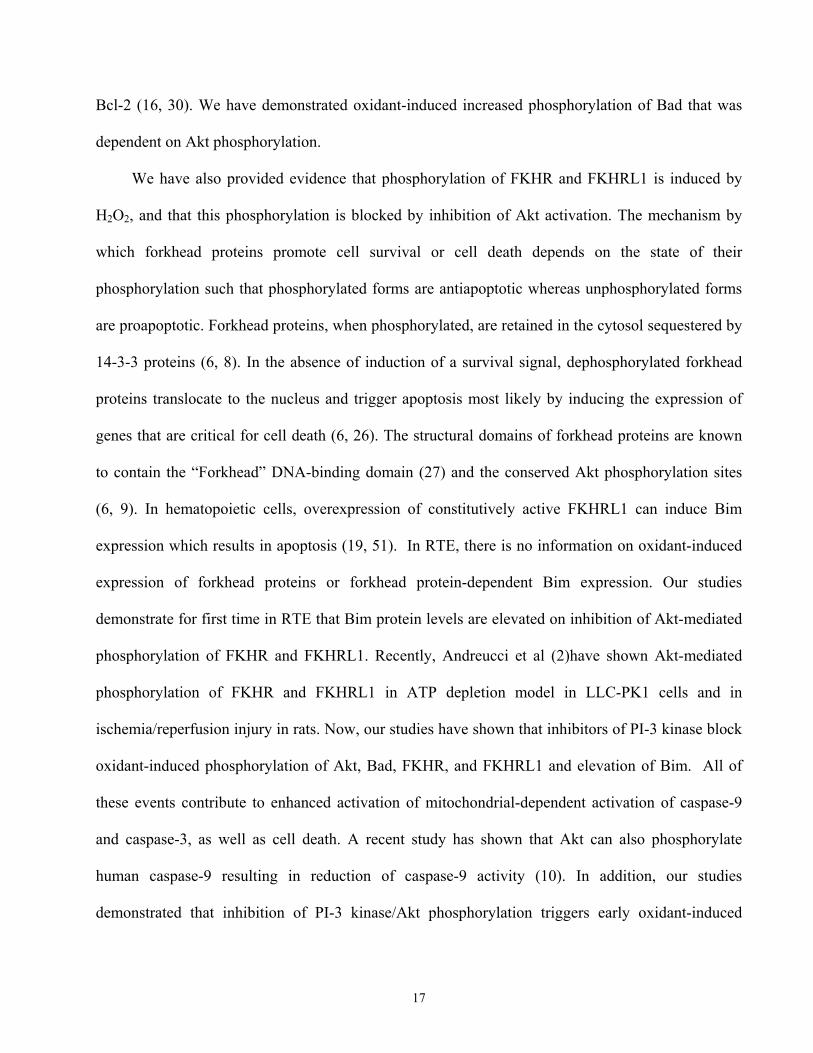
We have also provided evidence that phosphorylation of FKHR and FKHRL1 is induced by
H2O2, and that this phosphorylation is blocked by inhibition of Akt activation. The mechanism by
which forkhead proteins promote cell survival or cell death depends on the state of their
phosphorylation such that phosphorylated forms are antiapoptotic whereas unphosphorylated forms
are proapoptotic. Forkhead proteins, when phosphorylated, are retained in the cytosol sequestered by
14-3-3 proteins (6, 8). In the absence of induction of a survival signal, dephosphorylated forkhead
proteins translocate to the nucleus and trigger apoptosis most likely by inducing the expression of
genes that are critical for cell death (6, 26). The structural domains of forkhead proteins are known
to contain the “Forkhead” DNA-binding domain (27) and the conserved Akt phosphorylation sites
(6, 9). In hematopoietic cells, overexpression of constitutively active FKHRL1 can induce Bim
expression which results in apoptosis (19, 51). In RTE, there is no information on oxidant-induced
expression of forkhead proteins or forkhead protein-dependent Bim expression. Our studies
demonstrate for first time in RTE that Bim protein levels are elevated on inhibition of Akt-mediated
phosphorylation of FKHR and FKHRL1. Recently, Andreucci et al (2)have shown Akt-mediated
phosphorylation of FKHR and FKHRL1 in ATP depletion model in LLC-PK1 cells and in
ischemia/reperfusion injury in rats. Now, our studies have shown that inhibitors of PI-3 kinase block
oxidant-induced phosphorylation of Akt, Bad, FKHR, and FKHRL1 and elevation of Bim. All of
these events contribute to enhanced activation of mitochondrial-dependent activation of caspase-9
and caspase-3, as well as cell death. A recent study has shown that Akt can also phosphorylate
human caspase-9 resulting in reduction of caspase-9 activity (10). In addition, our studies
demonstrated that inhibition of PI-3 kinase/Akt phosphorylation triggers early oxidant-induced
18
activation of caspase-3 and caspase-9 as well as enhanced cell death indicating the possibility that
activation of Akt modulates the response to oxidant injury.
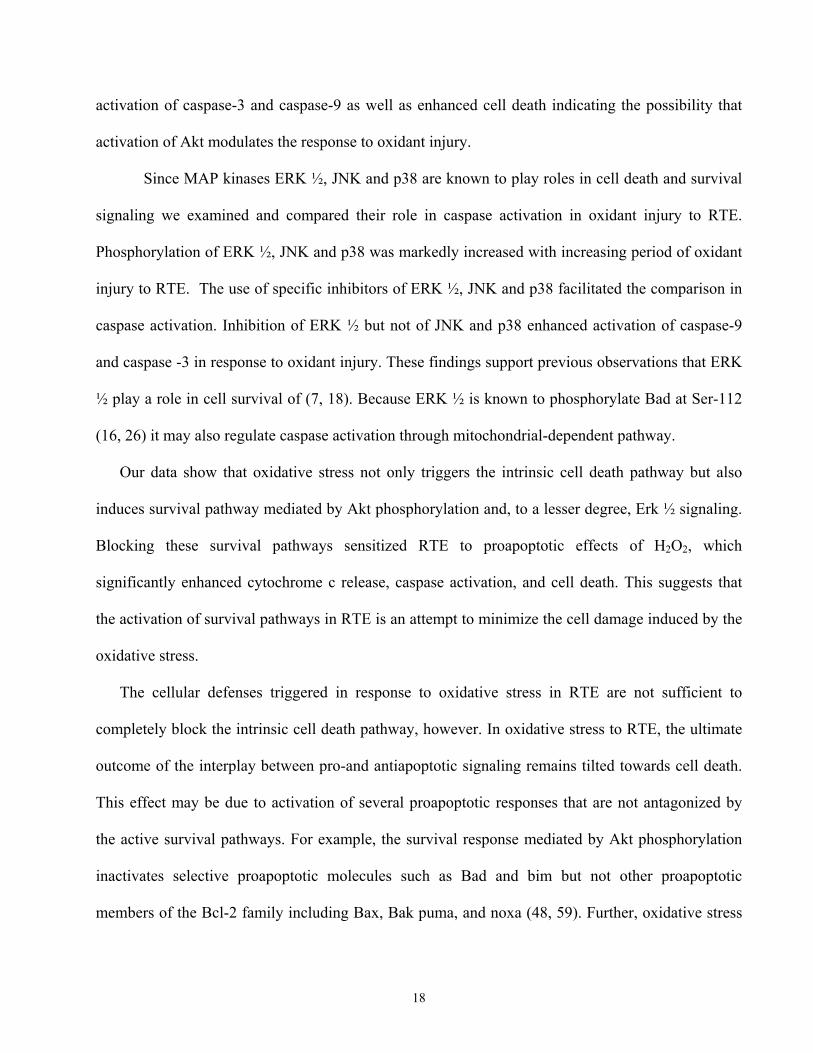
Since MAP kinases ERK ½, JNK and p38 are known to play roles in cell death and survival
signaling we examined and compared their role in caspase activation in oxidant injury to RTE.
Phosphorylation of ERK ½, JNK and p38 was markedly increased with increasing period of oxidant
injury to RTE. The use of specific inhibitors of ERK ½, JNK and p38 facilitated the comparison in
caspase activation. Inhibition of ERK ½ but not of JNK and p38 enhanced activation of caspase-9
and caspase -3 in response to oxidant injury. These findings support previous observations that ERK
½ play a role in cell survival of (7, 18). Because ERK ½ is known to phosphorylate Bad at Ser-112
(16, 26) it may also regulate caspase activation through mitochondrial-dependent pathway.
Our data show that oxidative stress not only triggers the intrinsic cell death pathway but also
induces survival pathway mediated by Akt phosphorylation and, to a lesser degree, Erk ½ signaling.
Blocking these survival pathways sensitized RTE to proapoptotic effects of H2O2, which
significantly enhanced cytochrome c release, caspase activation, and cell death. This suggests that
the activation of survival pathways in RTE is an attempt to minimize the cell damage induced by the
oxidative stress.
The cellular defenses triggered in response to oxidative stress in RTE are not sufficient to
completely block the intrinsic cell death pathway, however. In oxidative stress to RTE, the ultimate
outcome of the interplay between pro-and antiapoptotic signaling remains tilted towards cell death.
This effect may be due to activation of several proapoptotic responses that are not antagonized by
the active survival pathways. For example, the survival response mediated by Akt phosphorylation
inactivates selective proapoptotic molecules such as Bad and bim but not other proapoptotic
members of the Bcl-2 family including Bax, Bak puma, and noxa (48, 59). Further, oxidative stress
19
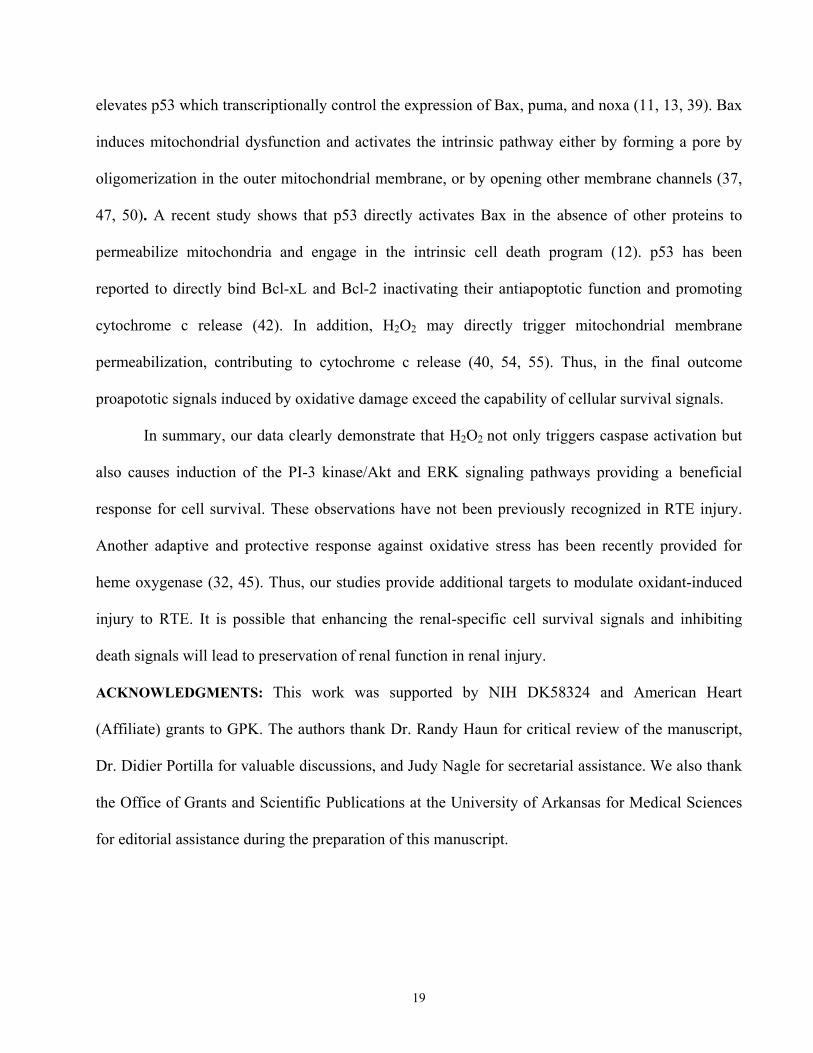
elevates p53 which transcriptionally control the expression of Bax, puma, and noxa (11, 13, 39). Bax
induces mitochondrial dysfunction and activates the intrinsic pathway either by forming a pore by
oligomerization in the outer mitochondrial membrane, or by opening other membrane channels (37,
47, 50). A recent study shows that p53 directly activates Bax in the absence of other proteins to
permeabilize mitochondria and engage in the intrinsic cell death program (12). p53 has been
reported to directly bind Bcl-xL and Bcl-2 inactivating their antiapoptotic function and promoting
cytochrome c release (42). In addition, H2O2 may directly trigger mitochondrial membrane
permeabilization, contributing to cytochrome c release (40, 54, 55). Thus, in the final outcome
proapototic signals induced by oxidative damage exceed the capability of cellular survival signals.
In summary, our data clearly demonstrate that H2O2 not only triggers caspase activation but
also causes induction of the PI-3 kinase/Akt and ERK signaling pathways providing a beneficial
response for cell survival. These observations have not been previously recognized in RTE injury.
Another adaptive and protective response against oxidative stress has been recently provided for
heme oxygenase (32, 45). Thus, our studies provide additional targets to modulate oxidant-induced
injury to RTE. It is possible that enhancing the renal-specific cell survival signals and inhibiting
death signals will lead to preservation of renal function in renal injury.
ACKNOWLEDGMENTS: This work was supported by NIH DK58324 and American Heart
(Affiliate) grants to GPK. The authors thank Dr. Randy Haun for critical review of the manuscript,
Dr. Didier Portilla for valuable discussions, and Judy Nagle for secretarial assistance. We also thank
the Office of Grants and Scientific Publications at the University of Arkansas for Medical Sciences
for editorial assistance during the preparation of this manuscript.

20
REFERENCES
1. Andreoli SP and Mallett CP. Disassociation of oxidant-induced ATP depletion and DNA
damage from early cytotoxicity in LLC-PK1 cells. Am J Physiol 272: F729-735, 1997.
2. Andreucci M, Michael A, Kramers C, Park KM, Chen A, Matthaeus T, Alessandrini A,
Haq S, Force T, and Bonventre JV. Renal ischemia/reperfusion and ATP depletion/repletion in
LLC-PK(1) cells result in phosphorylation of FKHR and FKHRL1. Kidney Int 64: 1189-1198, 2003.
3. Arnoult D, Parone P, Martinou JC, Antonsson B, Estaquier J, and Ameisen JC.
Mitochondrial release of apoptosis-inducing factor occurs downstream of cytochrome c release in
response to several proapoptotic stimuli. J Cell Biol 159: 923-929, 2002.
4. Baliga R, Ueda N, Walker PD, and Shah SV. Oxidant mechanisms in toxic acute renal
failure. Am J Kidney Dis 29: 465-477, 1997.
5. Basnakian AG, Kaushal GP, and Shah SV. Apoptotic pathways of oxidative damage to
renal tubular epithelial cells. Antioxid Redox Signal 4: 915-924, 2002.
6. Birkenkamp KU and Coffer PJ. Regulation of cell survival and proliferation by the FOXO
(Forkhead box, class O) subfamily of Forkhead transcription factors. Biochem Soc Trans 31: 292-
297, 2003.
7. Bonni A, Brunet A, West AE, Datta SR, Takasu MA, and Greenberg ME. Cell survival
promoted by the Ras-MAPK signaling pathway by transcription-dependent and -independent
mechanisms. Science 286: 1358-1362, 1999.
8. Brunet A, Bonni A, Zigmond MJ, Lin MZ, Juo P, Hu LS, Anderson MJ, Arden KC,
Blenis J, and Greenberg ME. Akt promotes cell survival by phosphorylating and inhibiting a
Forkhead transcription factor. Cell 96: 857-868, 1999.
9. Burgering BM and Kops GJ. Cell cycle and death control: long live Forkheads. Trends
Biochem Sci 27: 352-360, 2002.
10. Cardone MH, Roy N, Stennicke HR, Salvesen GS, Franke TF, Stanbridge E, Frisch S,
and Reed JC. Regulation of cell death protease caspase-9 by phosphorylation. Science 282: 1318-
1321, 1998.
21
11. Chen K, Albano A, Ho A, and Keaney JF, Jr. Activation of p53 by oxidative stress
involves platelet-derived growth factor-beta receptor-mediated ataxia telangiectasia mutated (ATM)
kinase activation. J Biol Chem 278: 39527-39533, 2003.
12. Chipuk JE, Kuwana T, Bouchier-Hayes L, Droin NM, Newmeyer DD, Schuler M, and
Green DR. Direct activation of Bax by p53 mediates mitochondrial membrane permeabilization and
apoptosis. Science 303: 1010-1014, 2004.
13. Cregan SP, MacLaurin JG, Craig CG, Robertson GS, Nicholson DW, Park DS, and
Slack RS. Bax-dependent caspase-3 activation is a key determinant in p53-induced apoptosis in
neurons. J Neurosci 19: 7860-7869, 1999.
14. Cuttle L, Zhang XJ, Endre ZH, Winterford C, and Gobe GC. Bcl-X(L) translocation in
renal tubular epithelial cells in vitro protects distal cells from oxidative stress. Kidney Int 59: 1779-
1788, 2001.
15. Daemen MA, van 't Veer C, Denecker G, Heemskerk VH, Wolfs TG, Clauss M,
Vandenabeele P, and Buurman WA. Inhibition of apoptosis induced by ischemia-reperfusion
prevents inflammation. J Clin Invest 104: 541-549, 1999.
16. Datta SR, Brunet A, and Greenberg ME. Cellular survival: a play in three Akts. Genes
Dev 13: 2905-2927, 1999.
17. Desagher S, Osen-Sand A, Nichols A, Eskes R, Montessuit S, Lauper S, Maundrell K,
Antonsson B, and Martinou JC. Bid-induced conformational change of Bax is responsible for
mitochondrial cytochrome c release during apoptosis. J Cell Biol 144: 891-901, 1999.
18. di Mari JF, Davis R, and Safirstein RL. MAPK activation determines renal epithelial cell
survival during oxidative injury. Am J Physiol 277: F195-203, 1999.
19. Dijkers PF, Birkenkamp KU, Lam EW, Thomas NS, Lammers JW, Koenderman L,
and Coffer PJ. FKHR-L1 can act as a critical effector of cell death induced by cytokine withdrawal:
protein kinase B-enhanced cell survival through maintenance of mitochondrial integrity. J Cell Biol
156: 531-542, 2002.
20. Earnshaw WC, Martins LM, and Kaufmann SH. Mammalian caspases: structure,
activation, substrates, and functions during apoptosis. Annu Rev Biochem 68: 383-424, 1999.
22
21. Edelstein CL, Shi Y, and Schrier RW. Role of caspases in hypoxia-induced necrosis of rat
renal proximal tubules. J Am Soc Nephrol 10: 1940-1949, 1999.
22. Faleiro L, Kobayashi R, Fearnhead H, and Lazebnik Y. Multiple species of CPP32 and
Mch2 are the major active caspases present in apoptotic cells. Embo J 16: 2271-2281, 1997.
23. Feldenberg LR, Thevananther S, del Rio M, de Leon M, and Devarajan P. Partial ATP
depletion induces Fas- and caspase-mediated apoptosis in MDCK cells. Am J Physiol 276: F837-
846, 1999.
24. Filipovic DM, Meng X, and Reeves WB. Inhibition of PARP prevents oxidant-induced
necrosis but not apoptosis in LLC-PK1 cells. Am J Physiol 277: F428-436, 1999.
25. Fleury C, Mignotte B, and Vayssiere JL. Mitochondrial reactive oxygen species in cell
death signaling. Biochimie 84: 131-141, 2002.
26. Franke TF, Kaplan DR, and Cantley LC. PI3K: downstream AKTion blocks apoptosis.
Cell 88: 435-437, 1997.
27. Furuyama T, Nakazawa T, Nakano I, and Mori N. Identification of the differential
distribution patterns of mRNAs and consensus binding sequences for mouse DAF-16 homologues.
Biochem J 349: 629-634, 2000.
28. Gilley J, Coffer PJ, and Ham J. FOXO transcription factors directly activate bim gene
expression and promote apoptosis in sympathetic neurons. J Cell Biol 162: 613-622, 2003.
29. Green DR and Reed JC. Mitochondria and apoptosis. Science 281: 1309-1312, 1998.
30. Gross A, McDonnell JM, and Korsmeyer SJ. BCL-2 family members and the
mitochondria in apoptosis. Genes Dev 13: 1899-1911, 1999.
31. Hagar H, Ueda N, and Shah SV. Role of reactive oxygen metabolites in DNA damage and
cell death in chemical hypoxic injury to LLC-PK1 cells. Am J Physiol 271: F209-215, 1996.
32. Hill-Kapturczak N, Chang SH, and Agarwal A. Heme oxygenase and the kidney. DNA
Cell Biol 21: 307-321, 2002.
33. Kaushal GP. Role of caspases in renal tubular epithelial cell injury. Semin Nephrol 23: 425-
431, 2003.

23
34. Kaushal GP, Kaushal V, Hong X, and Shah SV. Role and regulation of activation of
caspases in cisplatin-induced injury to renal tubular epithelial cells. Kidney Int 60: 1726-1736, 2001.
35. Kaushal GP, Singh AB, and Shah SV. Identification of gene family of caspases in rat
kidney and altered expression in ischemia-reperfusion injury. Am J Physiol 274: F587-595, 1998.
36. Kaushal GP, Ueda N, and Shah SV. Role of caspases (ICE/CED 3 proteases) in DNA
damage and cell death in response to a mitochondrial inhibitor, antimycin A. Kidney Int 52: 438-445,
1997.
37. Kuwana T, Mackey MR, Perkins G, Ellisman MH, Latterich M, Schneiter R, Green
DR, and Newmeyer DD. Bid, Bax, and lipids cooperate to form supramolecular openings in the
outer mitochondrial membrane. Cell 111: 331-342, 2002.
38. Lieberthal W, Triaca V, Koh JS, Pagano PJ, and Levine JS. Role of superoxide in
apoptosis induced by growth factor withdrawal. Am J Physiol 275: F691-702, 1998.
39. Macip S, Igarashi M, Berggren P, Yu J, Lee SW, and Aaronson SA. Influence of induced
reactive oxygen species in p53-mediated cell fate decisions. Mol Cell Biol 23: 8576-8585, 2003.
40. Martindale JL and Holbrook NJ. Cellular response to oxidative stress: signaling for
suicide and survival. J Cell Physiol 192: 1-15, 2002.
41. Melnikov VY, Faubel S, Siegmund B, Lucia MS, Ljubanovic D, and Edelstein CL.
Neutrophil-independent mechanisms of caspase-1- and IL-18-mediated ischemic acute tubular
necrosis in mice. J Clin Invest 110: 1083-1091, 2002.
42. Mihara M, Erster S, Zaika A, Petrenko O, Chittenden T, Pancoska P, and Moll UM.
p53 has a direct apoptogenic role at the mitochondria. Mol Cell 11: 577-590, 2003.
43. Nath KA and Norby SM. Reactive oxygen species and acute renal failure. Am J Med 109:
665-678, 2000.
44. Ortiz A, Lorz C, Justo P, Catalan MP, and Egido J. Contribution of apoptotic cell death
to renal injury. J Cell Mol Med 5: 18-32, 2001.
45. Platt JL and Nath KA. Heme oxygenase: protective gene or Trojan horse. Nat Med 4: 1364-
1365, 1998.
24
46. Saikumar P, Dong Z, Patel Y, Hall K, Hopfer U, Weinberg JM, and Venkatachalam
MA. Role of hypoxia-induced Bax translocation and cytochrome c release in reoxygenation injury.
Oncogene 17: 3401-3415, 1998.
47. Saito M, Korsmeyer SJ, and Schlesinger PH. BAX-dependent transport of cytochrome c
reconstituted in pure liposomes. Nat Cell Biol 2: 553-555, 2000.
48. Scorrano L and Korsmeyer SJ. Mechanisms of cytochrome c release by proapoptotic BCL-
2 family members. Biochem Biophys Res Commun 304: 437-444, 2003.
49. Shi Y. Mechanisms of caspase activation and inhibition during apoptosis. Mol Cell 9: 459-
470, 2002.
50. Shimizu S, Narita M, and Tsujimoto Y. Bcl-2 family proteins regulate the release of
apoptogenic cytochrome c by the mitochondrial channel VDAC. Nature 399: 483-487, 1999.
51. Stahl M, Dijkers PF, Kops GJ, Lens SM, Coffer PJ, Burgering BM, and Medema RH.
The forkhead transcription factor FoxO regulates transcription of p27Kip1 and Bim in response to
IL-2. J Immunol 168: 5024-5031, 2002.
52. Stennicke HR and Salvesen GS. Caspase assays. Methods Enzymol 322: 91-100, 2000.
53. Strasser A, O'Connor L, and Dixit VM. Apoptosis signaling. Annu Rev Biochem 69: 217-
245, 2000.
54. Stridh H, Kimland M, Jones DP, Orrenius S, and Hampton MB. Cytochrome c release
and caspase activation in hydrogen peroxide- and tributyltin-induced apoptosis. FEBS Lett 429: 351-
355, 1998.
55. Takeyama N, Miki S, Hirakawa A, and Tanaka T. Role of the mitochondrial permeability
transition and cytochrome C release in hydrogen peroxide-induced apoptosis. Exp Cell Res 274: 16-
24, 2002.
56. Towbin H, Staehelin T, and Gordon J. Electrophoretic transfer of proteins from
polyacrylamide gels to nitrocellulose sheets: procedure and some applications. Proc Natl Acad Sci U
S A 76: 4350-4354, 1979.
57. Ueda N, Kaushal GP, and Shah SV. Apoptotic mechanisms in acute renal failure. Am J
Med 108: 403-415, 2000.

25
58. Ueda N and Shah SV. Endonuclease-induced DNA damage and cell death in oxidant injury
to renal tubular epithelial cells. J Clin Invest 90: 2593-2597, 1992.
59. von Harsdorf R, Li PF, and Dietz R. Signaling pathways in reactive oxygen species-
induced cardiomyocyte apoptosis. Circulation 99: 2934-2941, 1999.
60. Wang HG, Pathan N, Ethell IM, Krajewski S, Yamaguchi Y, Shibasaki F, McKeon F,
Bobo T, Franke TF, and Reed JC. Ca2+-induced apoptosis through calcineurin dephosphorylation
of BAD. Science 284: 339-343, 1999.
61. Wang X, McCullough KD, Franke TF, and Holbrook NJ. Epidermal growth factor
receptor-dependent Akt activation by oxidative stress enhances cell survival. J Biol Chem 275:
14624-14631, 2000.
62. Wolf BB and Green DR. Suicidal tendencies: apoptotic cell death by caspase family
proteinases. J Biol Chem 274: 20049-20052, 1999.
63. Yang E, Zha J, Jockel J, Boise LH, Thompson CB, and Korsmeyer SJ. Bad, a
heterodimeric partner for Bcl-XL and Bcl-2, displaces Bax and promotes cell death. Cell 80: 285-
291, 1995.
64. Zha J, Harada H, Yang E, Jockel J, and Korsmeyer SJ. Serine phosphorylation of death
agonist BAD in response to survival factor results in binding to 14-3-3 not BCL-X(L). Cell 87: 619-
628, 1996.
26
Figure Legends
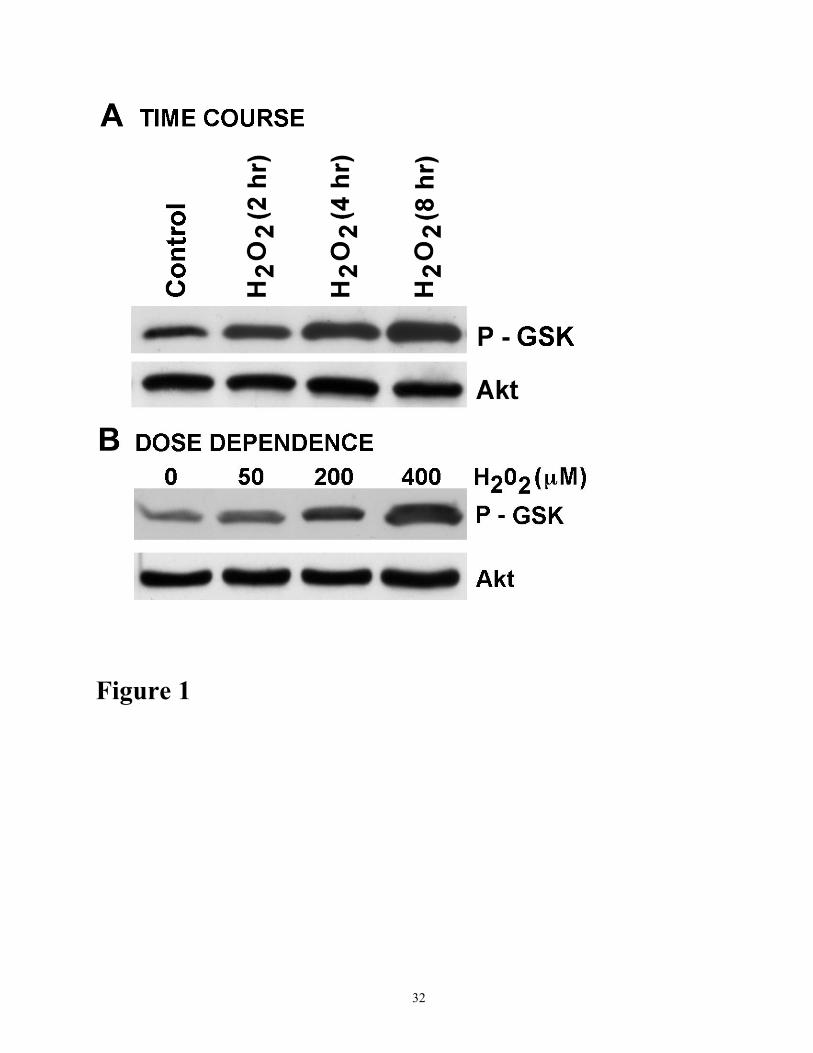
Figure 1. Activation of Akt in response to oxidant injury. (A) Time course activation of Akt in
response to H2O2. Cells were treated with 200 µM H2O2 for various time periods as indicated. Cell
lysates (100µg protein) were analyzed for Akt activation by Western blot analysis using Akt Kinase
Assay Kit (Cell. Signaling Technol.) Total Akt in the cell exracts was immunoprecipitated with Akt
antibody and Akt kinase assay was performed using GSK-3 fusion protein. Phosphorylated GSK-3
(P-GSK) was determined by Westermn blot analysis using phospho-GSK-3α/β antibody as described
in Methods. Total Akt in the immunoprecipitate was determined by Western blot using Akt
antibody. (B) Dose-dependent activation Akt in response to H2O2. Cells were treated for 4h with
various concentrations of H2O2 as indicated. Cell lysates (100 µg protein) were analyzed for Akt
activation as described in A. The results shown are representative of three independent experiments.
Figure 2. Effect of PI-3 kinase inhibitors on oxidation-induced Akt phosphorylation. (A) Dose-
dependent inhibition of Akt phosphorylation by PI-3 kinase inhibitor, LY294002. LLC-PK1 cells
were treated with 200 µM H2O2 in the presence or absence of various concentrations (0-10 µM) of
LY294002 (LY) for 4h as indicated. Cell lysates (50µg protein) were analyzed for Akt activation by
Western blot analysis using antibodies to phosphorylated Akt (ser-473) and Akt. (B) Dose-
dependent inhibition of Akt phosphorylation by PI-3 kinase inhibitor, wortmannin. Phosphorylated
Akt in the cell extracts was determined as described above in part A. (C) TKPTS cells were treated
with 200 µM H2O2 in the presence or absence of various concentrations (0-10 µM) of LY294002
(LY) for 4h as indicated. Phosphorylated Akt in the cell extracts was determined as described above
in part A. The results shown are representative of three independent experiments.
Figure 3. Effect of MAP kinase MEK inhibitor U0126, and JNK inhibitor SP600125 on Akt
phosphorylation. Cells were treated for 4 h with 100 and 200 µM H2O2 in the presence or absence
27
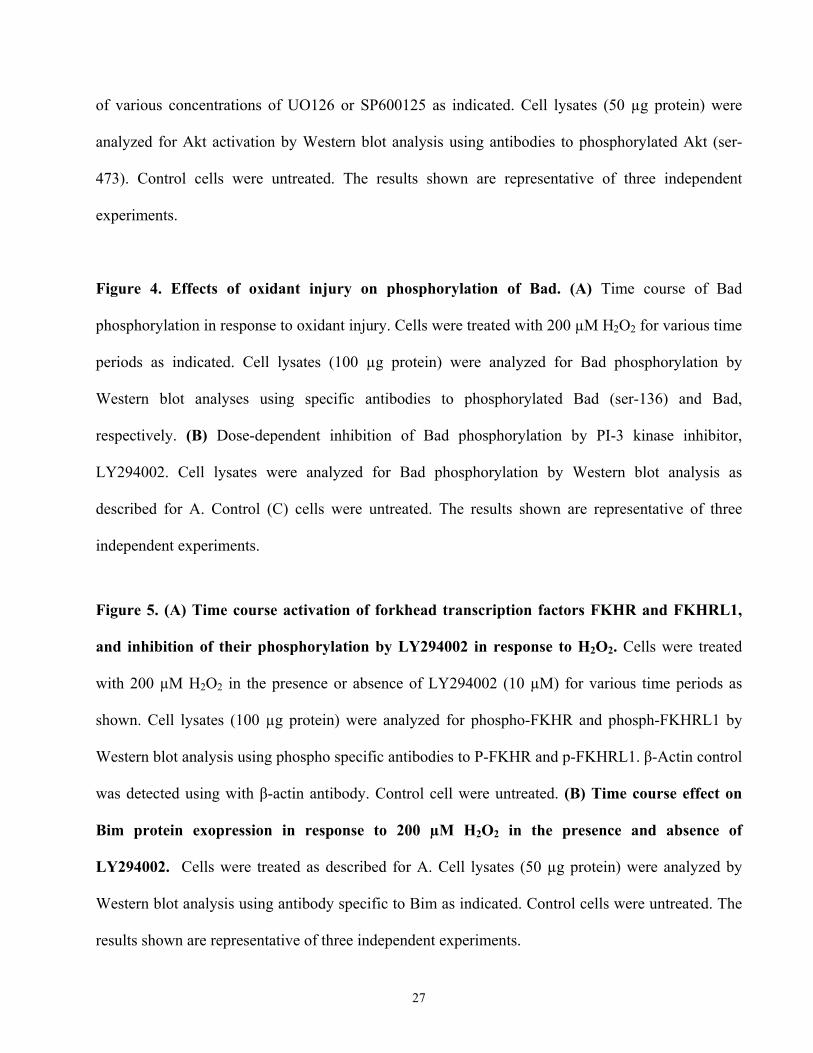
of various concentrations of UO126 or SP600125 as indicated. Cell lysates (50 µg protein) were
analyzed for Akt activation by Western blot analysis using antibodies to phosphorylated Akt (ser-
473). Control cells were untreated. The results shown are representative of three independent
experiments.
Figure 4. Effects of oxidant injury on phosphorylation of Bad. (A) Time course of Bad
phosphorylation in response to oxidant injury. Cells were treated with 200 µM H2O2 for various time
periods as indicated. Cell lysates (100 µg protein) were analyzed for Bad phosphorylation by
Western blot analyses using specific antibodies to phosphorylated Bad (ser-136) and Bad,
respectively. (B) Dose-dependent inhibition of Bad phosphorylation by PI-3 kinase inhibitor,
LY294002. Cell lysates were analyzed for Bad phosphorylation by Western blot analysis as
described for A. Control (C) cells were untreated. The results shown are representative of three
independent experiments.
Figure 5. (A) Time course activation of forkhead transcription factors FKHR and FKHRL1,
and inhibition of their phosphorylation by LY294002 in response to H2O2. Cells were treated
with 200 µM H2O2 in the presence or absence of LY294002 (10 µM) for various time periods as
shown. Cell lysates (100 µg protein) were analyzed for phospho-FKHR and phosph-FKHRL1 by
Western blot analysis using phospho specific antibodies to P-FKHR and p-FKHRL1. β-Actin control
was detected using with β-actin antibody. Control cell were untreated. (B) Time course effect on
Bim protein exopression in response to 200 µM H2O2 in the presence and absence of
LY294002. Cells were treated as described for A. Cell lysates (50 µg protein) were analyzed by
Western blot analysis using antibody specific to Bim as indicated. Control cells were untreated. The
results shown are representative of three independent experiments.
28
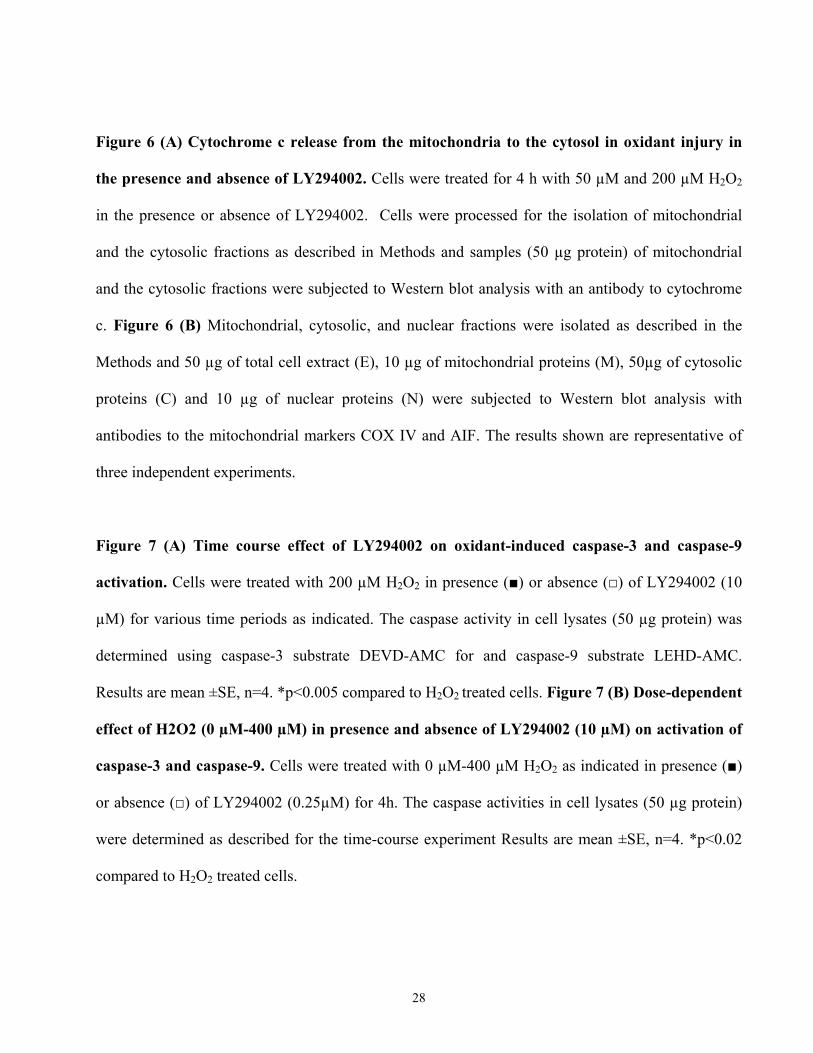
Figure 6 (A) Cytochrome c release from the mitochondria to the cytosol in oxidant injury in
the presence and absence of LY294002. Cells were treated for 4 h with 50 µM and 200 µM H2O2
in the presence or absence of LY294002. Cells were processed for the isolation of mitochondrial
and the cytosolic fractions as described in Methods and samples (50 µg protein) of mitochondrial
and the cytosolic fractions were subjected to Western blot analysis with an antibody to cytochrome
c. Figure 6 (B) Mitochondrial, cytosolic, and nuclear fractions were isolated as described in the
Methods and 50 µg of total cell extract (E), 10 µg of mitochondrial proteins (M), 50µg of cytosolic
proteins (C) and 10 µg of nuclear proteins (N) were subjected to Western blot analysis with
antibodies to the mitochondrial markers COX IV and AIF. The results shown are representative of
three independent experiments.
Figure 7 (A) Time course effect of LY294002 on oxidant-induced caspase-3 and caspase-9
activation. Cells were treated with 200 µM H2O2 in presence (■) or absence (□) of LY294002 (10
µM) for various time periods as indicated. The caspase activity in cell lysates (50 µg protein) was
determined using caspase-3 substrate DEVD-AMC for and caspase-9 substrate LEHD-AMC.
Results are mean ±SE, n=4. *p<0.005 compared to H2O2 treated cells. Figure 7 (B) Dose-dependent
effect of H2O2 (0 µM-400 µM) in presence and absence of LY294002 (10 µM) on activation of
caspase-3 and caspase-9. Cells were treated with 0 µM-400 µM H2O2 as indicated in presence (■)
or absence (□) of LY294002 (0.25µM) for 4h. The caspase activities in cell lysates (50 µg protein)
were determined as described for the time-course experiment Results are mean ±SE, n=4. *p<0.02
compared to H2O2 treated cells.

29
Figure 8 Effect of DN-Akt on H2O2-induced Akt phosphorylation and caspase activation. (A)
Westerm blot analysis of phospho-Akt levels in LLC-PK1 cells transiently transfected with empty
vector (pUSE) and DN-Akt vector (pUSE-DN-Akt) in the presence and absence of 100 µM H2O2.
Cells were cotransfected with control plasmid (pCMV-Lac Z) encoding the β-galactosidase. (B)
Cells were transiently transfected with empty vector (pUSE) and DN-Akt vector (pUSE-DN-Akt) in
the presence of 100 µM H2O2 The caspase activities in cell lysates (50 µg protein) were determined
as described in Methods section.
Figure 9 (A) Effect of LY294002 and wortmannin on oxidant-induced time course expression
and activation of caspase-3. Cells were treated with 200 µM H2O2 in the presence of LY294002
(10 µM) or wortmannin (0.5 µM) for various time periods as indicated. Cell lysates (100µg protein)
were subjected to Western blot analyses using antibodies specific for caspase-3. Control cells (c)
were not treated. Figure 9(B) Effect of LY294002 on oxidant-induced expression and activation
of caspase-9. Cells were treated with 200 µM H2O2 in the presence of LY294002 (10 µM) for
various time periods as indicated. Cell lysates (100 µg protein) were subjected to Western blot
analyses using antibodies specific for caspase-9. Control cells (C) were not treated. The results
shown are representative of three independent experiments.
Figure 10 (A) Effect of LY294002 on H2O2-induced cell death. Cells were treated with 200 µM of
H2O2 in presence (■) or absence (□) of LY294002 (10µM) for the time points indicated. Following
incubations, cell death was determined by trypan blue exclusion. Results are mean ± SE, n=5.
*p<.001 compared to control H2O2 treated cells. Figure 10 (B) Effect of LY294002 on H2O2 -
induced apoptosis determined by Fluorescent -activated cell sorter (FACS) analysis. Cells were

30
treated with 200 µM of H2O2 in presence or absence of LY294002 (10µM) for the time points
indicated. Following incubations, the cell were stained with propidium iodide before analysis using
FACSCalibur. Panels are: A. Cells were untreated; B. Cells were treated with LY294002 (10 µM)
alone for 4 h; C. Cells were treated with H2O2 alone for 2 h; D. Cells were treated with H2O2 and
LY294002 (10 µM) for 2h; E. Cells were treated with H2O2 alone for 4 h; F. Cells were treated with
H2O2 and LY294002 (10 µM) for 4 h. Peaks represent histograms of cell numbers in G1/G0, S, and
G2/M phases and sub-G1/G0 phase (cell debris, apoptotic and necrotic cells).
Figure 11. Enhanced activation of caspase-3 and cell apoptosis by the PI-3 inhibitor LY294002
as revealed by double-staining with DAPI and antibody to the cleaved form of caspase-3. LLC-
PK1 cells were grown on glass coverslips and treated with 200 µM H2O2 for 4 h in the presence and
absence of LY294002. The cells were fixed in a 4% paraformaldehyde solution in phosphate-
buffered saline (PBS), washed and permeabilized with 1% saponin as described in Methods. Cells on
cover glasses were then processed for anticaspase-3 antibody (against the cleaved subunit that reacts
only with the active form of the enzyme) followed by Alexa Fluor (BD Biosciences)-conjugated
secondary antibody (shown in red for active caspase-3). Finally, cover glasses were washed in PBS
and treated with with 1 µg/ml DAPI solution in PBS (nuclei stain blue), mounted, and visualized in a
deconvoluted fluorescence microscope. Arrows indicate some apoptotic nuclei that stain with
antibody to the active form of caspase-3. The results shown are representative of three independent
experiments.
Figure 12. Time course expression of the members of Bcl-2 family in response to 200 µM H2O2
in the presence and absence of LY294002. Cell lysates (50 µg protein) were analyzed by Western
31
blot analysis using antibodies specific to members of the Bcl-2 family as indicated. The results
shown are representative of three independent experiments.
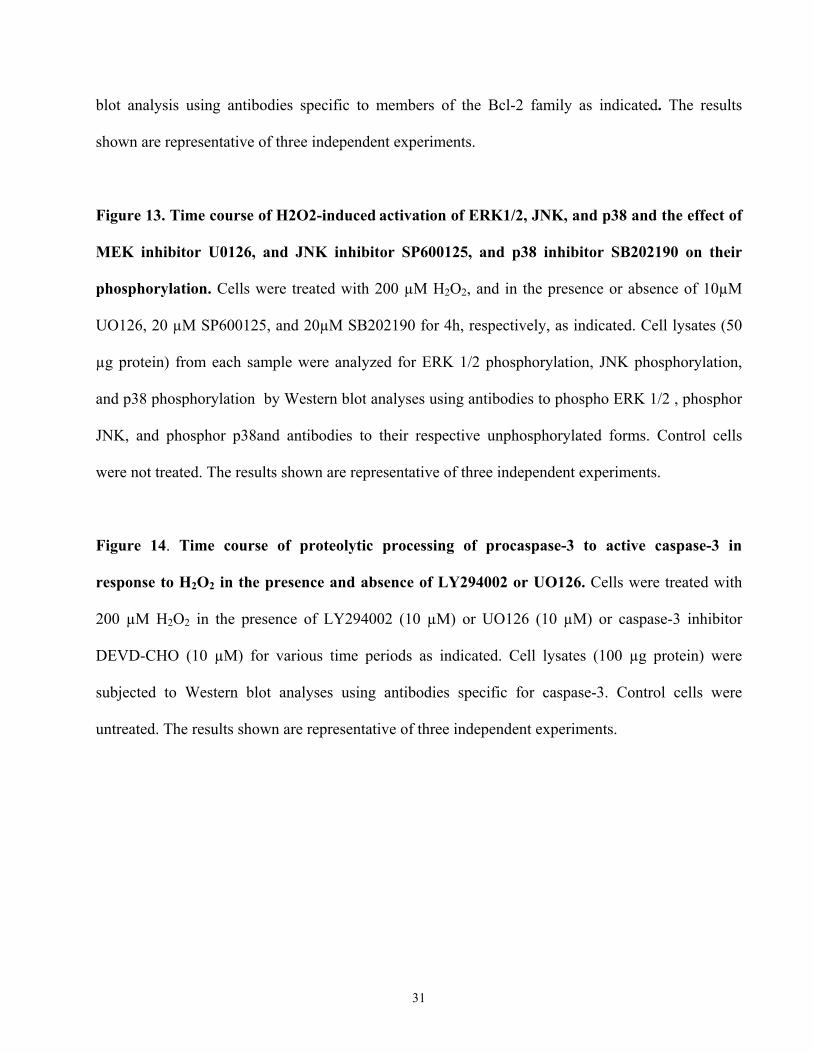
Figure 13. Time course of H2O2-induced activation of ERK1/2, JNK, and p38 and the effect of
MEK inhibitor U0126, and JNK inhibitor SP600125, and p38 inhibitor SB202190 on their
phosphorylation. Cells were treated with 200 µM H2O2, and in the presence or absence of 10µM
UO126, 20 µM SP600125, and 20µM SB202190 for 4h, respectively, as indicated. Cell lysates (50
µg protein) from each sample were analyzed for ERK 1/2 phosphorylation, JNK phosphorylation,
and p38 phosphorylation by Western blot analyses using antibodies to phospho ERK 1/2 , phosphor
JNK, and phosphor p38and antibodies to their respective unphosphorylated forms. Control cells
were not treated. The results shown are representative of three independent experiments.
Figure 14. Time course of proteolytic processing of procaspase-3 to active caspase-3 in
response to H2O2 in the presence and absence of LY294002 or UO126. Cells were treated with
200 µM H2O2 in the presence of LY294002 (10 µM) or UO126 (10 µM) or caspase-3 inhibitor
DEVD-CHO (10 µM) for various time periods as indicated. Cell lysates (100 µg protein) were
subjected to Western blot analyses using antibodies specific for caspase-3. Control cells were
untreated. The results shown are representative of three independent experiments.
32
Figure 1
33
Figure 2

34
Figure 3
35
Figure 4
36
Figure 5
37
Figure 6A
Figure 6B

38
Figure 7
39
Figure 8
40
Figure 9 Figure 9
41
Figure 10A
42
Figure 10B
DNA content
G1: 85.7%S: 8%G2: 5.3%subG1: 0.4%
Cel
l num
ber
G1: 86.6%S: 9.2%G2: 4.2%subG1: 0.5%
A B
C D
E F
G1: 49.1%S: 38.8%G2: 12.1%subG1: 7.5%
G1: 46.9%S: 45.2%G2: 7.9%subG1: 13.1%
G1: 47.6%S: 39.4%G2: 13.0%subG1: 12.7%
G1: 52.6%S: 42.8%G2: 4.6%subG1: 30.9%
400
300
200
100
0
400
300
200
100
0
400
300
200
100
0
Sub G1
G1
G2+M
S
100 2000FL2-A
100 2000FL2-A
DNA content
G1: 85.7%S: 8%G2: 5.3%subG1: 0.4%
Cel
l num
ber
G1: 86.6%S: 9.2%G2: 4.2%subG1: 0.5%
A B
C D
E F
G1: 49.1%S: 38.8%G2: 12.1%subG1: 7.5%
G1: 46.9%S: 45.2%G2: 7.9%subG1: 13.1%
G1: 47.6%S: 39.4%G2: 13.0%subG1: 12.7%
G1: 52.6%S: 42.8%G2: 4.6%subG1: 30.9%
400
300
200
100
0
400
300
200
100
0
400
300
200
100
0
400
300
200
100
0
400
300
200
100
0
400
300
200
100
0
Sub G1
G1
G2+M
S
100 2000FL2-A
100 2000FL2-A
100 2000FL2-A
100 2000FL2-A
43
44
45
Figure 13
46
Figure 14