Preparation and characterization of chitosan extracted from ...
Upload
independentCategory
view
1download
0
Please cite this article in press as: Low et al., Quantitative and Qualitative Proteome Characteristics Extracted from In-Depth Integrated Genomics andProteomics Analysis, Cell Reports (2013), http://dx.doi.org/10.1016/j.celrep.2013.10.041
Cell Reports
Resource
Quantitative and Qualitative ProteomeCharacteristics Extracted from In-DepthIntegrated Genomics and Proteomics AnalysisTeck Yew Low,1,2,6 Sebastiaan van Heesch,3,6 Henk van den Toorn,1,2,6 Piero Giansanti,1,2 Alba Cristobal,1,2 Pim Toonen,3
Sebastian Schafer,4 Norbert Hubner,4,5 Bas van Breukelen,1,2 Shabaz Mohammed,1,2,7 Edwin Cuppen,3,*Albert J.R. Heck,1,2,* and Victor Guryev3,81Biomolecular Mass Spectrometry and Proteomics, Bijvoet Center for Biomolecular Research and Utrecht Institute for Pharmaceutical
Sciences, Utrecht University, Padualaan 8, 3584 CH Utrecht, the Netherlands2Netherlands Proteomics Center, Padualaan 8, 3584 CH Utrecht, the Netherlands3Hubrecht Institute-KNAW & University Medical Center Utrecht, Uppsalalaan 8, 3584 CT Utrecht, the Netherlands4Max-Delbruck-Center for Molecular Medicine (MDC), Robert-Rossle-Strasse 10, 13125 Berlin, Germany5DZHK (German Centre for Cardiovascular Research), Partner Site Berlin, Berlin, Germany6These authors contributed equally to this work7Present address: Departments of Chemistry and Biochemistry, University of Oxford, Physical & Theoretical Chemistry Laboratory,
South Parks Road, OX1 3QZ Oxford, UK8Present address: European Research Institute for the Biology of Ageing, University of Groningen, University Medical Center Groningen,Antonius Deusinglaan, 1, Building 3226, 9713 AV Groningen, the Netherlands
*Correspondence: [email protected] (E.C.), [email protected] (A.J.R.H.)
http://dx.doi.org/10.1016/j.celrep.2013.10.041
This is an open-access article distributed under the terms of the Creative Commons Attribution-NonCommercial-No Derivative WorksLicense, which permits non-commercial use, distribution, and reproduction in any medium, provided the original author and source are
credited.
SUMMARY
Quantitative and qualitative protein characteristicsare regulated at genomic, transcriptomic, and post-transcriptional levels. Here, we integrated in-depthtranscriptome and proteome analyses of liver tissuesfrom two rat strains to unravel the interactions withinand between these layers. We obtained peptide evi-dence for 26,463 rat liver proteins. We validated1,195 gene predictions, 83 splice events, 126 pro-teins with nonsynonymous variants, and 20 isoformswith nonsynonymous RNA editing. Quantitative RNAsequencing and proteomics data correlate highlybetween strains but poorly among each other, indi-cating extensive nongenetic regulation. Our multi-level analysis identified a genomic variant in thepromoter of the most differentially expressed geneCyp17a1, a previously reported top hit in genome-wide association studies for human hypertension,as a potential contributor to the hypertension pheno-type in SHR rats. These results demonstrate thepower of and need for integrative analysis for under-standing genetic control of molecular dynamics andphenotypic diversity in a system-wide manner.
INTRODUCTION
Mass spectrometry (MS)-based proteomics and next-genera-
tion sequencing (NGS) are rapidly maturing techniques, each
enabling comprehensive measurements of gene products at a
system level (Altelaar et al., 2013; Cox and Mann, 2011; Soon
et al., 2013). Although MS and NGS are highly complementary,
they are still rarely applied integrated in large-scale studies
(Ning et al., 2012). State-of-the-art MS approaches can currently
identify over 10,000 proteins in a single experiment (Munoz et al.,
2011; Nagaraj et al., 2011), which brings the analysis of complete
proteomes within reach (Ahrens et al., 2010; Cox and Mann,
2011). However, as long as noncustomary protein databases
that are derived from (typically incomplete) reference genome
assemblies and annotations remain the sole source used for
MS spectra matching, true completeness will not be reached.
For example, protein isoforms arising from genetic polymor-
phisms, posttranscriptional events such as RNA-editing and
posttranslational modifications are largely missed (Jensen,
2004; Uhlen and Ponten, 2005).
Recent advances in NGS techniques, including whole genome
sequencing (WGS) and total RNA sequencing (RNA-seq) allow
for the generation of near-complete inventories of genetic varia-
tion in a system and its transcribed repertoire (Ozsolak and
Milos, 2011). However, from such analyses, the effects on the
proteins cannot be predicted with high confidence. For example,
the consequence of a single nucleotide variant (SNV) on the
coding capacity of a transcript can be predicted accurately,
but not the potential effect on the stability of the corresponding
protein. Systematic comparison of RNA-seq data with genomic
data reveals another layer of complexity. It has now been
convincingly demonstrated that certain transcripts are modified
by posttranscriptional editing, primarily by targeted A to I deam-
ination (Farajollahi and Maas, 2010). Most likely, all these types
of variation will not only affect the composition and function of
Cell Reports 5, 1–10, December 12, 2013 ª2013 The Authors 1

Please cite this article in press as: Low et al., Quantitative and Qualitative Proteome Characteristics Extracted from In-Depth Integrated Genomics andProteomics Analysis, Cell Reports (2013), http://dx.doi.org/10.1016/j.celrep.2013.10.041
a protein, but also influence expression levels. However, addi-
tional layers of translation control may dampen or completely
abolish such effects (Kleinman and Majewski, 2012; Lin et al.,
2012; Pickrell et al., 2012).
An integrative analysis of different data modalities, ideally
derived from samples of a single source, is required for correctly
deciphering the effects of genomic and transcriptomic variation
on molecular processes and cellular functioning. An example of
such data integration is the use of proteomic data derived from
MS in combination with complete genome data to improve
gene annotation (Jaffe et al., 2004; Renuse et al., 2011). This
approach has so far been sparsely performed and mainly in
organisms with smaller genomes (Merrihew et al., 2008; Venter
et al., 2011). On the other hand, integrative investigations of
messenger RNA levels and the proteins they encode reveal
only modest correlations, implying an unresolved level of
complexity in regulation of expression (Nesvizhskii et al., 2006;
Ning et al., 2012; Schwanhausser et al., 2011; de Sousa Abreu
et al., 2009; Vogel and Marcotte, 2012).
For this study, we selected two rat inbred strains BN-Lx/Cub
(BN-Lx) and SHR/OlaIpcv (SHR) (Printz et al., 2003), representing
widely studied, renewable, and genetically homogeneous re-
sources. Both strains have previously been extensively charac-
terized at the genomic (Atanur et al., 2010; Gibbs et al., 2004)
and phenotypic level (Hubner et al., 2005; Johnson et al., 2009;
Pravenec and Kurtz, 2010; Simonis et al., 2012). The BN-Lx
strain is derived from, and thus very closely related to, the Brown
Norway (BN) strain. The latter strain was used for creating the
rat reference genome assembly (Gibbs et al., 2004) and is
commonly used as the protein reference data set in rat prote-
omics studies. The spontaneously hypertensive rat (SHR) is
more diverged from BN and is a widely used disease model for
hypertension studies. Whereas several blood pressure quantita-
tive trait loci (QTLs) have been mapped to the SHR genome, no
functional variants driving elevated blood pressure have been
validated to date. Here, we combine in-depth genomic, tran-
scriptomic, and proteomic analyses from inbred rats of two
different genetic backgrounds using the same sets of rat liver tis-
sues (Figure 1A). The liver is a large and relatively homogeneous
tissue source that is well known to be involved in both hyperten-
sion and metabolic syndrome - the phenotypes associated with
the SHR strain. We determine quantitative and qualitative molec-
ular dynamics at different functional levels and achieve a level of
proteome completeness by adding variation information derived
from WGS and RNA-seq data. These data allow us to apply a
genome-wide genetic-genomics approach (Jansen and Nap,
2001) to start understanding multilevel systems regulation and
to identify candidate genes that are potentially involved in the
hypertension phenotype of the SHR rat.
RESULTS AND DISCUSSION
Extension of the Rat Protein DatabaseIn proteomics, tandem mass spectra are typically annotated by
searching against in silico-generated spectra based on a pub-
licly available protein database. For rat, such a database is
derived from the reference genome assembly of the BN rat
(Gibbs et al., 2004). To create a sample-specific database for
2 Cell Reports 5, 1–10, December 12, 2013 ª2013 The Authors
MS peptide searching, we extended the existing RefSeq-based
peptide database by incorporating strain-specific peptides and
predicted peptides. We first obtained all strain-specific genetic
variation of the BN-Lx and SHR strains including single nucleo-
tide variants (SNVs) and in-frame indels.
Most genomic SNVs are located in the noncoding sequences,
and only the less frequent nonsynonymous variants in coding re-
gions give rise to altered amino acid sequences (Hurst et al.,
2009; Su et al., 2011; Valentine et al., 2006). We collected
10,493 nonsynonymous variants from recently generated high-
coverage WGS data of the BN-Lx and SHR genomes (Atanur
et al., 2010; Simonis et al., 2012), which are predicted to affect
6,187 protein isoforms derived from 4,566 genes. Furthermore,
to be able to detect in silico gene predictions using the prote-
omics data as evidence (Volkening et al., 2012), we added
44,993 GENSCAN gene predictions to our rat database (Burge
and Karlin, 1997).
Next, we performed RNA-seq (Table S1) on RNA extracted
from liver tissue of both rat strains (two males and two females
per strain). To this end, paired-end sequencing data were gener-
ated to construct de novo transcriptome assemblies for each
strain, In total, we found expression evidence for 18,116 known
genes (12,052 with fragments per kilobase of exon per million
fragments mapped [FPKM] >1), of which 2,612 (1,820 with
FPKM >1) overlap the nonsynonymous variants previously
detected by genome resequencing. Also, we identified 2,545
transcript splicing events affecting 1,015 genes. Although the
majority of the identified splice events (1,687) were detected in
both strains, 220 and 638 events were specific to BN-Lx and
SHR rats, respectively (Table S2). Independent RT-PCR-based
Sanger sequencing confirmed 74.1% (43 out of the 58 suc-
cessful PCR assays) of a randomly sampled subset as true
transcript isoforms (Table S3A). In addition, the same transcrip-
tome assembly data provided expression evidence for 2,903
GENSCAN predictions (Table S4).
The de novo assembled transcriptome data also allow for
characterization of transcriptomes at nucleotide resolution.
Because both BN-Lx and SHR strains are fully inbred, observed
changes at the transcript level are unlikely to be allele-specific
variation and can thus be attributed to technical artifacts (intro-
duced during sequencing or mapping) or to RNA editing (Farajol-
lahi and Maas, 2010). We find a total of 799 canonical (A to I or
C to T) RNA-editing variants (Table S5) of which 176 and 354
are specifically observed in BN-Lx and SHR, respectively. As ex-
pected, a large proportion of edits resides in the noncoding UTR
parts of transcripts or do not change the coding capacity of a
transcript. Yet, theymight be affecting RNA secondary structure,
stability, or miRNA binding. Only 196 edits were nonsynonymous
and therefore included in our protein database as potentially
detectable by MS. Of a subset of 169 candidate editing events
tested by independent RT-PCR-based amplicon resequencing,
most (104) showed reads corresponding to expected edited
transcripts, and another 12 likely represent germline variants
that missed detection during genome resequencing (Table S3B).
All peptide variants and isoforms derived from genome and
transcriptome variation and all newly predicted peptides based
on GENSCAN and de novo transcriptome assembly data were
appended to the Ensembl rat database (3.4.63) to create our

SHR2 males, 2 females
BN-Lx2 males, 2 females
liver tissue snapshot
Experimental overview
DNA sequencing RNA sequencing Protein sequencing
5132
3009
18322
B
BN-Lx
Relative identification findings
C
A
BN-Lx
SHR
BN-Lx specific
splice variantsedited mRNAsSHR specific
GENSCAN
Protein mapping on genesPPPP
same between strains
D
0%
50%
100%
Sun et al Low et al
No. Proteins IDDatabase Size 2% 1%
1%
64%
32%
3% 1%3%
61%
32%
SHR
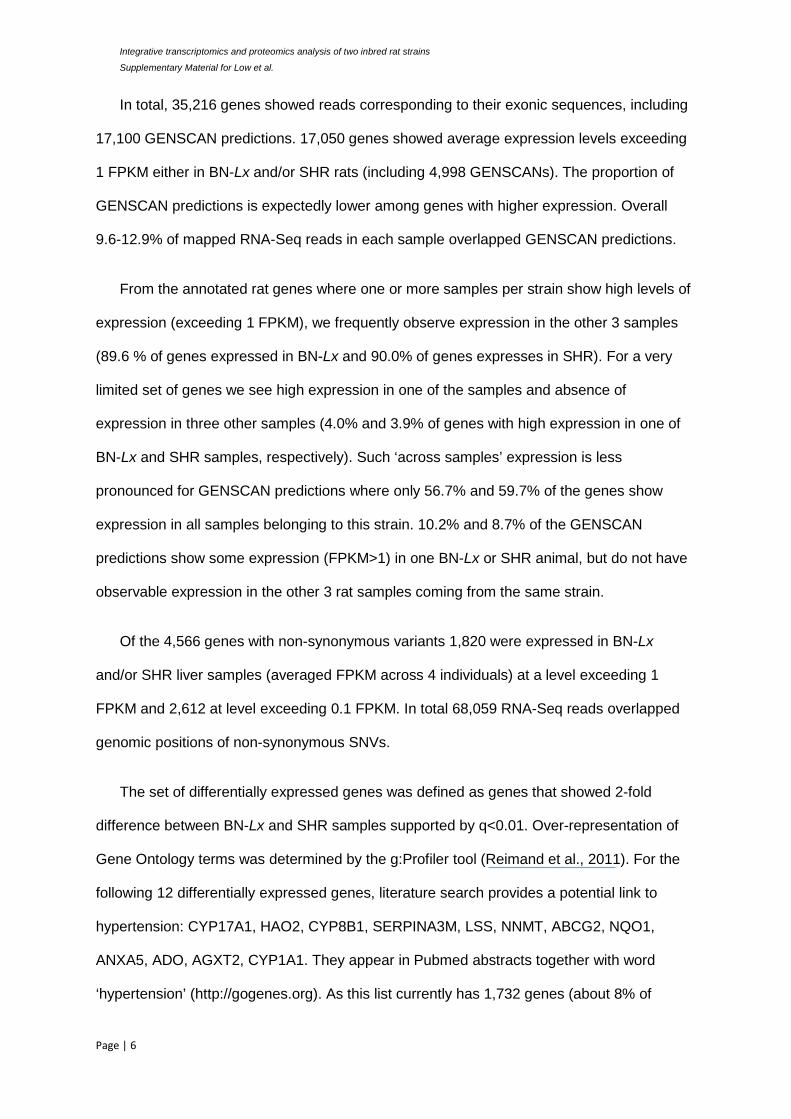
Figure 1. Integrated Proteomics, Genomics,
and Transcriptomics to Improve Sample-
Specific Protein Identification
(A) Schematic representation of the integrated
genome and proteome analysis of BN-Lx and SHR
rat liver using NGS and deep-proteome profiling.
(B) Bar plot showing the percentage of the current
reference database that is covered by the ex-
perimentally derived proteomes, with respect to
recent other proteomics efforts (Sun et al., 2010).
For BN-Lx and SHR, 39.7% of the Ensembl data-
base is represented (13,088 out of 32,971 entries;
release 3.4.63). The human liver proteome gener-
ated by the Chinese Human Liver Proteome
Profiling Consortium cover 13.5% of the IPI human
database (version 3.07; 7,050 out of 50,225
entries).
(C) Diagram displaying identified proteins specific
to BN-Lx (blue), SHR-specific proteins (red), and
proteins shared between both strains (green).
(D) Relative contribution (%) to the BN-Lx and SHR
rat proteomes (containing unique peptides) of each
additional layer of genomics- and transcriptomics-
derived protein variants.
See also Tables S1, S2, S3, S4, S5, S6, S8, S9, S10,
S11, and S12.
Please cite this article in press as: Low et al., Quantitative and Qualitative Proteome Characteristics Extracted from In-Depth Integrated Genomics andProteomics Analysis, Cell Reports (2013), http://dx.doi.org/10.1016/j.celrep.2013.10.041
customized RAT_COMBINED database, which was used for all
subsequent proteomic analyses.
Proteomics AnalysisWe generated proteomics data with the same liver tissues used
for RNA-seq. Each lysate was proteolyzed with five orthogonal
proteases, and the resulting 36 SCX fractions per digest were
Cell Reports 5, 1–10
analyzed with LC-MS/MS, cumulating in
180 runs per strain, yielding �12 million
tandem MS spectra. By using multiple
proteases, not only the identification and
sequence coverage of each protein in-
crease, but also the chance of capturing
evidence for predicted peptides/proteins
and consequences of RNA editing (Mo-
hammed et al., 2008; Peng et al., 2012;
Swaney et al., 2010). To ensure compre-
hensive coverage, two different but
complementary algorithms for spectra-
to-peptide assignment were applied.
First, Mascot search engine was used
for database searching. Next, remaining
unassigned spectra were processed
with PEAKS Studio 6.0 which incorpo-
rates a proprietary de novo sequencing
algorithm. The large amount of data
allowed us to apply a false discovery
rate (FDR) filter of 0% (q = 0) and
still identify over 2 million peptide-
spectral matches (PSMs), corresponding
to �175,000 nonredundant peptides
(Tables S6A and S6B). By performing a
merged BN-Lx and SHR data set search against our custom
RAT_COMBINED database, we obtained peptide evidence for
26,463 database entries. Of these, 18,322 are shared between
BN-Lx and SHR (Figure 1C; Table S7), whereas 3,009 and
5,132 appear strain specific for SHR and BN-Lx, respectively.
For comparison, we counted the number of identifications
matching entries in the Ensembl database (3.4.63), disregarding
, December 12, 2013 ª2013 The Authors 3

Please cite this article in press as: Low et al., Quantitative and Qualitative Proteome Characteristics Extracted from In-Depth Integrated Genomics andProteomics Analysis, Cell Reports (2013), http://dx.doi.org/10.1016/j.celrep.2013.10.041
the variants. Out of the 32,971 original database entries, 13,088
were matched, representing 39.7% of database entries. In
contrast, the most extensive liver proteome so far (the human
liver proteome generated by the Chinese Human Liver Proteome
Profiling Consortium) covers only 13.5% of the human IPI data-
base (version 3.07; 50,225 entries), illustrating the depth of our
data (Figure 1B; Table S6D). Over 86.5% of all proteins could
be supported by evidence of gene expression in the RNA-seq
data. As expected, identified peptides are evenly distributed
over the rat chromosomes, concordant with the distribution of
genes and transcripts (Figure S1A). The median coverage of all
proteins is 15.6% with roughly equal contributions from each
protease data set (Figure S1B).
Identification of Predicted Proteins and ProteinIsoformsApproximately 5,700 unique peptides (Table S8A) provide exper-
imental evidence for 1,195 in silico predicted GENSCANproteins
(Table S7 and S8B). For 1,187 (99%) of those, RNA-seq data
support the observed expression. Fifty of them show best recip-
rocal hits with known mouse proteins, and another 32 with
known human proteins (Table S8C). Furthermore, we detect
N-terminally acetylated peptides for 69 of these 1,187 proteins,
with A, M, S, and T as their N-terminal residues (Table S8D) (Dor-
meyer et al., 2007; Starheim et al., 2012). N-terminal peptides
validate these putative genes by confirming their translational
start sites. A different class of proteins with largely uncertain ex-
istence is the short expressed proteins (SEPs) encoded by short
open reading frames (Slavoff et al., 2013). Of all peptides in our
data set, 0.25% could be assigned to 86 known SEPs and 37
identified SEPs (Figure S2; Tables S7 and S8B).
The proteomics data also provide support for 83 transcript
splicing events (0% FDR) that were previously not annotated
(Figure 1D; Tables S6C, S7, S10A, and S10D). From all predicted
proteins and splice isoform identifications, 309 and 15 respec-
tively were unique for BN-Lx, and 193 and 13 were specific to
SHR (Table S6C).
Detection of Nonsynonymous Protein VariantsNext, we explored to what extent the addition of strain-specific
variants affected protein detectability and stability. Of the
uniquely assigned spectra, 3.5% did discriminate between
allele-specific protein isoforms. We detected 126 nonsynony-
mous variants in our proteomic data, 38 for BN-Lx, and 88 for
SHR (Tables S10A and S10B). By applying a 0% FDR cutoff,
we reassuringly did not find any BN-Lx variants in the SHR sam-
ples, and vice versa (Table S6C). The fact that only a portion of
nonsynonymous variants was confirmed by peptide-based evi-
dence can be explained by our experimental design in which
only genes expressed in the liver could be detected. Clearly,
the inclusion of allele-specific variants has a measurable impact
on protein discovery and results in more balanced peptide count
per strain. The latter is most notable for the SHR rat because its
genome is more diverged from the reference strain (BN).
We used SIFT and Polyphen2 to predict if nonsynonymous
SNVs could affect protein stability (Tables S9 and S11). Poten-
tially damaging mutations were clearly overrepresented in differ-
entially expressed proteins with nondifferential transcript levels
4 Cell Reports 5, 1–10, December 12, 2013 ª2013 The Authors
(p < 0.002) (Table S11). This illustrates that nonconservative
and structural missense variants may have limited influence on
the abundance of a transcript yet can show a pronounced effect
on protein stability.
Peptide-Based Evidence for RNA EditingTo identify functional RNA-editing events, we mapped our pep-
tide spectra to the set of potential RNA-editing events. In total,
20 out of the 196 nonsynonymous editing events could be
confirmed by unique peptide-based evidence (Tables S6C, S9,
S10A, and S10C). Because unique peptide evidence needs to
overlap with the predicted editing site, many of the remaining
176 edits are likely missed because of incomplete coverage or
redundancy in peptide data. Whereas limitations in the MS tech-
nology obviously result in an underrepresentation of identified
RNA edits, MS still provides the best means to confirm the pres-
ence of such posttranscriptional modifications in the expressed
proteins. On the other hand, we cannot rule out a possibility that
the relatively low percentage of confirmed events is a true repre-
sentation of the actual level of posttranscriptional modifications
that make it to mature proteins. This may be due to negative
selection against modified mRNA molecules. The high level of
RNA sequencing coverage and the strict calling settings used
to define editing events make it unlikely that an overestimation
of editing events is introduced during the RNA sequencing pro-
cedure and analysis.
It is worth noting that our comparison of de novo assembled
and the annotated transcriptomes may not only reveal genetic
differences, transcript isoforms, and common edited sites.
Sequence and annotation imperfections within the current
assembly and gene build can also be detected because the pro-
teogenomics approach used in this study accounts for differ-
ences between observed and annotated transcriptome that
originate from both biological and technical sources. Also, we
emphasize that the de novo transcriptome assembly approach
should be supplemented by regular transcriptome profiling if
one aims to discover transcript variants that correspond to
low-abundance transcripts and low-frequency events. To this
end, we performed direct alignment of RNA-seq data to the
rat transcriptome (known proteins and GENSCAN predictions)
and predicted additional modifications of annotated transcripts
(Table S5).
Relation between Transcriptome and Proteome LevelsNext, we studied quantitative aspects by investigating the
abundance of mRNA and protein levels. Although being derived
from two different strains of rats, we observed a very high
correlation of liver mRNA between BN-Lx and SHR (r = 0.98).
Similarly, the correlation coefficient for protein expression be-
tweenBN-Lx andSHR is also remarkably high (r = 0.94) (Figure 2),
providing confidence in our quantification strategy based on
spectral counts.
Next, we sought to define a correlation between mRNA and
protein expression levels in our data. Making a direct correlation
between mRNA and protein levels is hampered by the fact that
in peptide-based proteomics many proteins contain similar
peptide sequences. It is therefore hard to assign any of the
shared peptides unambiguously to a protein, the so-called

r=0.43
−3−1
12
3 r=0.94
−3 −1 1 2 3
−20
12
3
−2 0 1 2 3
Protein SHR
mRNA BN-Lx
mRN
A B
N-Lx
n=18000
mRNA SHR
Prot
ein
BN-Lx
−20
12
3
−3 −1 1 2 3
mRNA SHR
r=0.42
−20
12
3
−3 −1 1 2 3
Prot
ein
SHR
Prot
ein
BN- Lx
BA
mRNA to Protein conversion factor (log10, BN-Lx)
mRN
A to
Pro
tein
con
vers
ion
fact
or (l
og10
, SH
R)
−4 −2 0 2
−4−2
02 r=0.88
r=0.98
0.433330.0.43r=00 333..00 4r= 0 2r=0.42.0 24r=
r=0.980.98r=r 0.0.9888..00 99r= 0.940 94r=0.94.0 94r=
−2 0
0−2
-1
-1−1
−2 00−2
−1
Figure 2. Global Correlation Plots Displaying the Complexity of mRNA and Protein Abundance
(A) The top two panels display the high correlations between BN-Lx and SHR mRNA (left, r = 0.98) and protein levels (right, r = 0.94), estimated using log10
normalized spectral counts (Log10SAF) and normalized RNA seq counts (Log10FPKM). The bottom two panels show the poor correlations between mRNA and
protein abundance for BN-Lx (r = 0.43) and SHR (r = 0.42), respectively.
(B) Scatterplot depicting the correlation between experimentally determined gene-specificmRNA to protein abundance conversion factors as calculated for both
BN-Lx and SHR (r = 0.88).
See also Table S15.
Please cite this article in press as: Low et al., Quantitative and Qualitative Proteome Characteristics Extracted from In-Depth Integrated Genomics andProteomics Analysis, Cell Reports (2013), http://dx.doi.org/10.1016/j.celrep.2013.10.041
protein-inference problem (Grobei et al., 2009; Nesvizhskii and
Aebersold, 2005). Consequently, it is hard to integrate the
quantitative measurements, which are necessarily restricted to
peptides, to a protein measurement. Still, numerous studies
conclude that the global correlation between mRNA and protein
is certainly not linear and often an r of 0.4–0.5 is reported (Ning
et al., 2012; de Sousa Abreu et al., 2009; Vogel and Marcotte,
2012). Such findings are corroborated by results that show that
indeed only part of the variation in the protein levels can be ex-
plained by mRNA levels (Schwanhausser et al., 2011). Here,
we use a spectra-count method for quantification of protein
levels. We use data derived from five different proteolytic en-
zymes, which is sufficient to exclude a proteolytic digest-specific
bias (Peng et al., 2012). Although we did identify unique peptides
per protein (Table S12), we chose to take the total number of
PSMs for every peptide matching a protein as a measurement
of its abundance to increase the quantitative resolution per pro-
tein. Subsequently, we determined the proteome-transcriptome
correlation for BN-Lx and SHR to be r = 0.43 and 0.42, respec-
tively (Figure 2A). This correlation is thus weak, albeit in line
with the previous studies in other systems. Based on these quan-
titative comparisons, we also found that 30 UTR expression
levels correlate increasingly better with protein levels (r = 0.54)
than do 50 UTR levels (r = 0.43) or reads derived from the coding
sequence (r = 0.47) (Figures S3C–S3E). We speculate that the
abundance of 30 UTR reads depends on transcript integrity and
reflects both transcript count and stability. Transcript levels
could also be reproducibly converted to predicted protein levels
using a gene-specific conversion factor, which showed high cor-
relation between the two strains (r = 0.88) (Figure 2B; Table S15).
The high correlation between strains for this gene-specific factor
illustrates the conservation of quantitative mRNA levels in rela-
tion to protein levels, independent of intermediate (less under-
stood) levels of expression regulation. Although the conversion
factor cannot be analyzed in-depth within the scope of this
article, we postulate that translation efficiency, RNA, and protein
degradation (and thus stability) are likely to play an important
role. The top 100 proteins with the lowest and highest conversion
factors were subjected to gene ontology (GO) overrepresenta-
tion analysis. We observed a trend in cellular localization toward
cytoskeleton (highest 100) or the membrane (lowest 100),
although the observations were not significant (Figure S3B;
Table S15). We can only speculate that the conversion factor
appears to be protein specific and conserved between strains.
This factor combines the aforementioned levels of gene expres-
sion regulation in one value. One particular group of proteins
appears to behave differently, representing the family of a2u-
globulins (known as rat major urinary proteins; Figures S3A
and S3B). Unfortunately, none of these proteins could be identi-
fied by unique peptides due to high protein sequence homology
Cell Reports 5, 1–10, December 12, 2013 ª2013 The Authors 5

-6
6
-6 6
Ces2e
Cyp17a1
Serpina3m
Adh6
Acsm2
Log2 SHR/BN-Lx (transcriptome)
Acsm5
Hao2
Log2 SHR/BN-Lx (proteome)
Slc1a2
Cyp2b2 Cyp8b1
Cyp2a2
Cyp1a1
Rpl10lPcp4l1
Ifgga1Crot
AdoNqo1
Ste2
Cyp2c24
Akr1c13
Igg2b
Abcg3l2 Raldh1*
Hmfn2073* Ugcgl2*
Lss
Cyp2c11
Cyp17a1
ActinHao2
kDa70
55
55
35
BN-Lx SHR
R1
R2
R5
R4
R3
R1
R2
R5
R4
R3
A
B
significant at proteome and transcriptome levelsignificant at transcriptome level
Figure 3. Gene-Centric Strain-to-Strain Com-
parison of Significantly Differentially Ex-
pressed Genes
(A) Genes in BN-Lx and SHR with significantly
deviating mRNA levels (blue dots; n = 59) or mRNA
and protein levels (red dots; n = 54) are highlighted.
Gene names marked by an asterisk are based
on GENSCAN blast predictions derived from
the closest predicted homology to human and
mouse genes. Genes belonging to the CYP450
superfamily of catalytic enzymes are in bold and
genes associated with hypertension in human or rat
literature (Hao2, Serpina3m, Cyp8b1, and Cyp17a1)
are underscored.
(B) Western blot performed with liver tissues from
five animals each for BN-Lx and SHR. Both Cyp17a1
and Hao2 are downregulated in all the biological
replicates in the SHR strain compared to BN-Lx,
consistent with the proteomics data. Actin was used
as a loading control.
See also Tables S7 and S13.
Please cite this article in press as: Low et al., Quantitative and Qualitative Proteome Characteristics Extracted from In-Depth Integrated Genomics andProteomics Analysis, Cell Reports (2013), http://dx.doi.org/10.1016/j.celrep.2013.10.041
within this class of genes. Therefore, although this class stands
out in the quantitative comparisons, absolute differences be-
tween BN-Lx and SHR cannot be determined with high confi-
dence at this point.
Genetic Control of Quantitative ProteomeCharacteristicsTo determine the effects of genetic variation on quantitative
transcriptome and proteome characteristics, we compared the
difference of mRNA and protein expression between the two
rat strains. First, we filtered our quantitative data with more strin-
gent criteria retaining only genes quantifiable at both the protein
and the RNA level (reliable expression level estimates by Cuffdiff
and nonzero SAF counts). This allowed us to compare 6,743
genes (Figure 3A; Table S13), 113 of which were differentially ex-
pressed at the RNA level (at least 2-fold change in expression;
and q < 0.01) and 205 at the protein level (at least 2-fold change
and q = 0). Themajority of the differentially expressed transcripts
(59/113) do not show comparable changes at proteomics level.
This group of proteins likely acquires stable expression through
regulation of at the level of translation or through proteostasis.
A small proportion of the genes (13/113) shows discordant
6 Cell Reports 5, 1–10, December 12, 2013 ª2013 The Authors
behavior with opposite expression pat-
terns for transcripts and proteins. Both
groups do not show any overrepresenta-
tion in GO terms or pathways. The limited
number of genes with significantly altered
expression indicates the high global
genome and proteome similarity between
the two inbred rat strains. However, it also
illustrates that interindividual differences
may be in the details, such as repre-
sented by changes in posttranslational
protein modifications and protein net-
works (Altelaar et al., 2013; Bensimon
et al., 2012). Finally, 41 out of the 113
differential genes show strain-specific
expression changes that are consistent between transcriptome
and proteome (Figure 3A; Table S13). The products of these 41
genes relate to catalytic activity (28 genes, GO-term enrichment
p value 1.4e-5) and metabolic pathways (13 genes, p = 2.6e-4).
A Germline Promoter Variant Deregulates Cyp17a1Expression in Spontaneously Hypertensive RatsThis set of 41 genes likely underlies some of the phenotypic dif-
ferences known to exist between BN-Lx and SHR rats, like spon-
taneous hypertension (Okamoto and Aoki, 1963) and metabolic
syndrome (Aitman et al., 1997, 1999). We therefore investigated
which genes were previously reported to be associated with hy-
pertension in human or rat. First, three out of the 41 genes that
are differential at both the mRNA and protein level were found
to be associated with hypertension in the rat. Those three genes,
Hao2 (Lee et al., 2003), Serpina3m, and Cyp8b1 (Kinoshita et al.,
2011), came out as top hits when studying SHR (-related)
strains or a panel of congenic rat strains to define candidates
for hypertension. All three genes also overlap known blood pres-
sure QTLs in the rat (Dwinell et al., 2009), and two of them
(Serpina3m and Hao2) show a very strong connection to the
SHR genotype based on eQTL data derived from the BXH/HXB

Bits
1
2
1 2 3 4 5 6 7 8 9 10 11Postion in motif
Consensus forkhead box DNA binding motifD
A A T G T T T C C A C
355
BN-Lx
A A T G T T C C A CCSHR
B
129
Cyp17a1actual TSS
0
0
129
251,965 kb 251,968 kb 251,971 kb 251,974 kb
Chr.1
A
355
Cyp17a1
SHR
RNA-seqcoverage
RNA-seqcoverage
Cyp17a1
0
0
BN-Lx
Annotated TSS
Actual TSS
0
100Spectralcount
250
Spectralcount RI SHR RI BN-Lx SHR BN-Lx
0
200
400
600
*** ***800
FPK
M
Annotated TSS
Actual TSS
C
RNA-seqcoverage
RNA-seqcoverage
Cyp17a1actual TSS
Figure 4. A Germline Promoter Variant Deregulates Cyp17a1 Expression in Spontaneously Hypertensive Rats
(A) Experimental evidence covering this part of the genome from RNA sequencing and the proteomics data (spectral counts) are plotted along the gene body of
Cyp17a1 for BN-Lx (blue) and SHR (red). The transcript is positioned on the reverse strand. Both the annotated transcription start site (TSS, black arrow) and the
actual TSS (gray arrow) are shown.
(B) Expression QTL analysis of Cyp17a1 expression in the HXB/BXH recombinant inbred panel. Gene expression is plotted based on RNA-seq for the ancestral
strains (n = 5) and the RI strains split by ancestral haplotype at the Cyp17a1 locus (n = 16 for BN-Lx and n = 14 for SHR).
(C) Zoomed-in view of the actual TSS, with the position of the germline T/C SNV shown. The dashed box (gray) shows the core part of the forkhead box DNA
binding motif.
(D) Consensus forkhead box DNA binding motif, obtained from the JASPAR database FOXA1 motif (Sandelin et al., 2004).
See also Table S14.
Please cite this article in press as: Low et al., Quantitative and Qualitative Proteome Characteristics Extracted from In-Depth Integrated Genomics andProteomics Analysis, Cell Reports (2013), http://dx.doi.org/10.1016/j.celrep.2013.10.041
recombinant inbred panel (founded by the BN-Lx and SHR
strains) (Figure S4A–S4C). This implies that the gene expression
regulation of Serpina3m and Hao2 is regulated in cis and thus
strongly related to the genotype of the SHR strain. A fourth
gene, Cyp17a1, was identified as a top hit in relation to blood
pressure and hypertension in human genome-wide association
studies on European, Japanese, and Chinese individuals (Li
et al., 2013; Liu et al., 2011; Newton-Cheh et al., 2009; Takeuchi
et al., 2010) (Table S14A). Cyp17a1 also overlaps a blood pres-
sure QTL in the rat and shows the most extreme downregulation
in SHR compared to BN-Lx in our analysis (Figure 3A). The differ-
ential expression of Hao2 and Cyp17a1 was verified indepen-
dently by western blot, using liver samples of five animals from
each strain (Figure 3B). Like Cyp8b1, Cyp17a1 is a member of
the cytochrome P450 (CYP450) superfamily (Danielson, 2002)
of catalytic enzymes that mediate monooxygenase reactions
and regulate drugmetabolism. Interestingly, mutations in human
CYP17A1 are known to lead to congenital adrenal hyperplasia
due to 17 alpha-hydroxylase deficiency, which results in hypo-
gonadism, pseudohermaphroditism, and severe hypertension
(Biglieri, 1997; Biglieri et al., 1966; Geller et al., 1997; Goldsmith
et al., 1967). To determine the genetic basis of the Cyp17a1
expression differences between BN-Lx and SHR, we sought
for genetic variants in the annotated exons and flanking regula-
tory sequences, but none were present. Exploration of eQTL
data, however, revealed a very strong cis-effect (Figure 4B;
Table S14B), indicating that the measured expression difference
is due to genetic variants in the gene itself or in neighboring
regulatory elements. Upon closer inspection of the RNA-seq
data, we found that the transcriptional start site (TSS) of the
Cyp17a1 gene was incorrectly annotated and resides approxi-
mately 2 kb upstream of the currently annotated most 50 exon(Figure 4A). The true location of the promoter could be confirmed
by H3K4me3 ChIP data that show specific enrichment of this
active promoter mark surrounding the nucleosome-free region
of the unannotated TSS (Figure S4D). Interestingly, this promoter
Cell Reports 5, 1–10, December 12, 2013 ª2013 The Authors 7

Please cite this article in press as: Low et al., Quantitative and Qualitative Proteome Characteristics Extracted from In-Depth Integrated Genomics andProteomics Analysis, Cell Reports (2013), http://dx.doi.org/10.1016/j.celrep.2013.10.041
does harbor a germline variant in SHR that disrupts the core part
of an evolutionary conserved forkhead-box DNA binding domain
(Figures 4C and 4D) (Sandelin et al., 2004), specifically deregu-
lating transcription in SHR (Figure 4A). Because this expression
trait is regulated in cis and this SNV is the only germline variant
in the vicinity of the gene, our integrated genomics, transcrip-
tomics, and proteomics approach has most likely identified the
source of expression variation. The overlap with the RGD blood
pressure QTL (http://rgd.mcw.edu/), top GWAS loci in humans,
and known link to hypertension as a result of renal hyperplasia
in patients carrying CYP17A1 mutations are good indications
that this promoter mutation in the SHR Cyp17a1 gene contrib-
utes to the observed hypertensive phenotype of SHR rats.
ConclusionsTechnological advances in both the proteomics and the
sequencing community now provide the ability to discriminate
genetic and posttranscriptional polymorphisms at the proteome
level. These advances also allow improved quantitation of gene
expression, which is generally restricted by the imprecise proxy
of transcriptome data alone. We here show that the synergistic
use of genomic, transcriptomic, and proteomic technologies
significantly improves the information load that can be gained
from proteomics as well as genomics efforts. By matching
deep MS-based proteomics to a personalized database built
from a sample-specific genome and transcriptome, we identify
thousands of peptides that would otherwise escape identifica-
tion. We believe that future efforts on both platforms benefit
largely from our proof-of-concept approach, which brings
integrated proteogenomics to a higher level. To highlight the
strength of this approach, we present a link of a genomic variant
in the Cyp17a1 gene promoter and associate it with the hyper-
tension phenotype of the extensively studied SHR rats.
EXPERIMENTAL PROCEDURES
An extended version of the experimental procedures can be found in the Sup-
plemental Information.
Custom Rat Protein Database Construction
We modified and appended the Ensembl (Birney et al., 2004; Curwen et al.,
2004; Hubbard et al., 2002) rat protein FASTA (build 3.4.63), whichwas derived
from the reference (BN) genome assembly, with DNA resequencing and
RNA-seq data of the BN-Lx and SHR strains. Single nucleotide variants and in-
dels were obtained from previous genome sequencing efforts (Atanur et al.,
2010; Simonis et al., 2012). RNA was isolated from liver tissues of 6-week-
old inbred BN-Lx/Cub and SHR/OlaIpcv rats. SOLiD RNA-seq libraries were
prepared with ribosomal RNA depleted RNA and sequenced on the SOLiD
V4 system. Next, we used CLC assembly cell version 4 (CLC Bio) to de novo
assemble each rat liver transcriptome.MergedBN-Lx andSHR transcriptomes
were mapped against the reference genome assembly using BLAT software
(Kent, 2002). Splicing and RNA-editing events were detected using alignments
between the assembled transcriptomeandgenomeandcompared to their cor-
responding proteins. For all nonsynonymous genomic and transcriptome var-
iants, individual entries were added to the extended protein search database.
Also, we included 44,993 GENSCAN gene predictions of which 17,100
(FPKM >0.1) or 4,998 (FPKM >1.0) show evidence of expression.
Quantification of Transcriptome Data and Identification of eQTLs
To quantify expression differences, RNA-seq data for each sample were
aligned to reference genome using TopHat2. Expressed and differentially ex-
8 Cell Reports 5, 1–10, December 12, 2013 ª2013 The Authors
pressed genes were defined by Cuffdiff using all four transcriptomes per strain
(Trapnell et al., 2012). Determination of eQTLs in the HXB/BXH recombinant
inbred panel consisting of 30 rat strains was performed exactly as previously
described (Heinig et al., 2010).
Strong Cation Exchange Chromatography
After sonication and centrifugation, liver tissue lysates (300 mg each) were pro-
teolyzed using trypsin, LysC, GluC, AspN, and chymotrypsin. After desalting,
peptides were fractionated using a strong cation exchange (SCX) column
(Zorbax BioSCX-Series II; 0.8 mm inner diameter 3 50 mm length, 3.5 mm),
and 36 fractions were collected per digest.
Mass Spectrometry Analysis
The first 26 fractions were analyzed with an Agilent 1290 Infinity (Agilent Tech-
nologies) LC, operating in reverse-phase (C18) mode, coupled to a TripleTOF
5600 (AB Sciex). MS spectra (350–1,250 m/z) were acquired in high-resolution
mode (R > 30,000), whereas MS2 in high-sensitivity mode (R > 15 000). The
next ten fractions were analyzed with a Proxeon EASY-nLC 1000 (Thermo
Scientific) operating in reverse phase (C18) and connected to an LTQ-Orbitrap
Velos (Thermo Fisher Scientific). For MS analysis, MS spectra (350–1,500 m/z)
were acquired at a resolution of 30,000 and for MS2, R = 7,500.
Protein Database Searching
Peak lists (MGFs) were submitted to the Mascot (version 2.3) via Proteome
Discoverer version 1.3 (Thermo Fisher Scientific) and searched against RAT_
COMBINED with the respective proteases chosen. Peptide tolerance was
50 ppm, and MS/MS tolerance was 0.1 Da (TOF), 0.02 Da (Orbitrap), and
0.5 Da (ion trap). All PSMs were validated with Percolator (Kall et al., 2007)
based on q = 0 (0% FDR). Only PSMs ranked first by the search engine with
at least six amino acids were kept. Unmatched spectra were exported for anal-
ysis with PEAKS Studio (version 6.0). Peak lists were filtered with a quality
value of 0.65, followed by a tag database search. The maximum allowed var-
iable PTM per peptide was set to 3. De novo interpreted PSMswere submitted
to PEAKS DB database matching, allowing semienzymatic specificity and a
maximum cleavage per peptide of 2. The FDR was estimated using a concat-
enated decoy database and according to a threshold of 0.0%.
Quantitative Comparison of Proteome and Transcriptome Data
To combine quantitative data from all methods, we developed a relational
database schema (Figure S8) for data storage. The database schema was
converted to Java (Java SE 7, Oracle) entities, using Java Persistence API
(JPA version 2) implemented in EclipseLink version 2.3.2 (http://www.
eclipse.org/eclipselink), with the tools provided in Netbeans IDE 7.3 (http://
www.netbeans.org). The database used was MySQL version 5.5 (Oracle).
ACCESSION NUMBERS
The ProteomeXchange (Vizcaıno et al., 2013) accession number for the MS
data reported in this paper is PXD000131. The Sequence Read Archive acces-
sion numbers for the DNA data are ERP001355 (BN-Lx genome), ERP001371
(SHR genome), and ERP000510 (BN reference genome). RNA sequencing
data were stored in ArrayExpress under the accession number E-MTAB-1666.
SUPPLEMENTAL INFORMATION
Supplemental Information includes Supplemental Experimental Procedures,
five figures, and fifteen tables and can be found with this article online at
http://dx.doi.org/10.1016/j.celrep.2013.10.041.
AUTHOR CONTRIBUTIONS
T.Y.L designed, performed, and analyzed the proteomics experiments; S.v.H.
designed, performed, and analyzed the RNA-seq experiments. V.G. per-
formed bioinformatics analysis on genomics, transcriptomics, and proteomics
data and is responsible for generating the protein database. H.v.d.T. and V.G.
performed qualitative, quantitative, and bioinformatics analysis on both

Please cite this article in press as: Low et al., Quantitative and Qualitative Proteome Characteristics Extracted from In-Depth Integrated Genomics andProteomics Analysis, Cell Reports (2013), http://dx.doi.org/10.1016/j.celrep.2013.10.041
transcriptomics and proteomics data. P.G. and A.C. performed MS and data
analysis. B.v.B. and S.M. provided consultation and support for bioinformatics
andMS. S.v.H, P.T., and V.G. performed and analyzed RNA-seq validation ex-
periments. S.S. andN.H. provided eQTL data and interpretation. T.Y.L., S.v.H.,
H.v.d.T., S.M., V.G., E.C., and A.J.R.H. contributed to conceptual design and
scientific discussions. T.Y.L., S.v.H., H.v.d.T., B.v.B., S.M., A.J.R.H., E.C., and
V.G. wrote the manuscript. E.C. and A.J.R.H. supervised the study.
ACKNOWLEDGMENTS
This work was supported by the Netherlands Proteomics Centre, which is
part of the Netherlands Genomics Initiative and a TOP grant from NWO-CW
(N� 700.58.303) to E.C. This work was financially supported by the European
Community’s Seventh Framework Programme (FP7/2007-2013) under grant
agreement no. HEALTH-F4-2010-241504 (EURATRANS) to E.C. and N.H.
and the PRIME-XS project grant agreement number 262067 to A.J.R.H. We
would like to thank Dr. Vincentius A. Halim for technical assistance. We would
also like to thank the PRIDE Team for assistance.
Received: July 8, 2013
Revised: September 28, 2013
Accepted: October 24, 2013
Published: November 27, 2013
REFERENCES
Ahrens, C.H., Brunner, E., Qeli, E., Basler, K., and Aebersold, R. (2010). Gener-
ating and navigating proteome maps using mass spectrometry. Nat. Rev. Mol.
Cell Biol. 11, 789–801.
Aitman, T.J., Gotoda, T., Evans, A.L., Imrie, H., Heath, K.E., Trembling, P.M.,
Truman, H.,Wallace, C.A., Rahman, A., Dore, C., et al. (1997). Quantitative trait
loci for cellular defects in glucose and fatty acid metabolism in hypertensive
rats. Nat. Genet. 16, 197–201.
Aitman, T.J., Glazier, A.M., Wallace, C.A., Cooper, L.D., Norsworthy, P.J.,
Wahid, F.N., Al-Majali, K.M., Trembling, P.M., Mann, C.J., Shoulders, C.C.,
et al. (1999). Identification of Cd36 (Fat) as an insulin-resistance gene causing
defective fatty acid and glucose metabolism in hypertensive rats. Nat. Genet.
21, 76–83.
Altelaar, A.F.M., Munoz, J., and Heck, A.J.R. (2013). Next-generation prote-
omics: towards an integrative view of proteome dynamics. Nat. Rev. Genet.
14, 35–48.
Atanur, S.S., Birol, I., Guryev, V., Hirst, M., Hummel, O., Morrissey, C., Beh-
moaras, J., Fernandez-Suarez, X.M., Johnson, M.D., McLaren, W.M., et al.
(2010). The genome sequence of the spontaneously hypertensive rat: Analysis
and functional significance. Genome Res. 20, 791–803.
Bensimon, A., Heck, A.J.R., and Aebersold, R. (2012). Mass spectrometry-
based proteomics and network biology. Annu. Rev. Biochem. 81, 379–405.
Biglieri, E.G. (1997). 17 alpha-Hydroxylase deficiency: 1963-1966. J. Clin.
Endocrinol. Metab. 82, 48–50.
Biglieri, E.G., Herron, M.A., and Brust, N. (1966). 17-hydroxylation deficiency in
man. J. Clin. Invest. 45, 1946–1954.
Birney, E., Andrews, T.D., Bevan, P., Caccamo, M., Chen, Y., Clarke, L.,
Coates, G., Cuff, J., Curwen, V., Cutts, T., et al. (2004). An overview of
Ensembl. Genome Res. 14, 925–928.
Burge, C., and Karlin, S. (1997). Prediction of complete gene structures in
human genomic DNA. J. Mol. Biol. 268, 78–94.
Cox, J., and Mann, M. (2011). Quantitative, high-resolution proteomics for
data-driven systems biology. Annu. Rev. Biochem. 80, 273–299.
Curwen, V., Eyras, E., Andrews, T.D., Clarke, L., Mongin, E., Searle, S.M.J.,
and Clamp, M. (2004). The Ensembl automatic gene annotation system.
Genome Res. 14, 942–950.
Danielson, P.B. (2002). The cytochrome P450 superfamily: biochemistry, evo-
lution and drug metabolism in humans. Curr. Drug Metab. 3, 561–597.
de Sousa Abreu, R., Penalva, L.O., Marcotte, E.M., and Vogel, C. (2009).
Global signatures of protein and mRNA expression levels. Mol. Biosyst. 5,
1512–1526.
Dormeyer, W., Mohammed, S., Breukelen, Bv., Krijgsveld, J., and Heck, A.J.R.
(2007). Targeted analysis of protein termini. J. Proteome Res. 6, 4634–4645.
Dwinell, M.R., Worthey, E.A., Shimoyama, M., Bakir-Gungor, B., DePons, J.,
Laulederkind, S., Lowry, T., Nigram, R., Petri, V., Smith, J., et al.; RGD Team
(2009). The Rat Genome Database 2009: variation, ontologies and pathways.
Nucleic Acids Res. 37 (Database issue), D744–D749.
Farajollahi, S., and Maas, S. (2010). Molecular diversity through RNA editing: a
balancing act. Trends Genet. 26, 221–230.
Geller, D.H., Auchus, R.J., Mendonca, B.B., and Miller, W.L. (1997). The
genetic and functional basis of isolated 17,20-lyase deficiency. Nat. Genet.
17, 201–205.
Gibbs, R.A., Weinstock, G.M., Metzker, M.L., Muzny, D.M., Sodergren, E.J.,
Scherer, S., Scott, G., Steffen, D.,Worley, K.C., Burch, P.E., et al.; Rat Genome
Sequencing Project Consortium (2004). Genome sequence of the Brown
Norway rat yields insights into mammalian evolution. Nature 428, 493–521.
Goldsmith, O., Solomon, D.H., and Horton, R. (1967). Hypogonadism and
mineralocorticoid excess. The 17-hydroxylase deficiency syndrome. N. Engl.
J. Med. 277, 673–677.
Grobei, M.A., Qeli, E., Brunner, E., Rehrauer, H., Zhang, R., Roschitzki, B.,
Basler, K., Ahrens, C.H., and Grossniklaus, U. (2009). Deterministic protein
inference for shotgun proteomics data provides new insights into Arabidopsis
pollen development and function. Genome Res. 19, 1786–1800.
Heinig, M., Petretto, E., Wallace, C., Bottolo, L., Rotival, M., Lu, H., Li, Y., Sar-
war, R., Langley, S.R., Bauerfeind, A., et al.; Cardiogenics Consortium (2010).
A trans-acting locus regulates an anti-viral expression network and type 1 dia-
betes risk. Nature 467, 460–464.
Hubbard, T., Barker, D., Birney, E., Cameron, G., Chen, Y., Clark, L., Cox, T.,
Cuff, J., Curwen, V., Down, T., et al. (2002). The Ensembl genome database
project. Nucleic Acids Res. 30, 38–41.
Hubner, N., Wallace, C.A., Zimdahl, H., Petretto, E., Schulz, H., Maciver, F.,
Mueller, M., Hummel, O., Monti, J., Zidek, V., et al. (2005). Integrated transcrip-
tional profiling and linkage analysis for identification of genes underlying dis-
ease. Nat. Genet. 37, 243–253.
Hurst, J.M., McMillan, L.E.M., Porter, C.T., Allen, J., Fakorede, A., and Martin,
A.C.R. (2009). The SAAPdb web resource: a large-scale structural analysis of
mutant proteins. Hum. Mutat. 30, 616–624.
Jaffe, J.D., Berg, H.C., and Church, G.M. (2004). Proteogenomic mapping as a
complementary method to perform genome annotation. Proteomics 4, 59–77.
Jansen, R.C., and Nap, J.P. (2001). Genetical genomics: the added value from
segregation. Trends Genet. 17, 388–391.
Jensen, O.N. (2004). Modification-specific proteomics: characterization of
post-translational modifications by mass spectrometry. Curr. Opin. Chem.
Biol. 8, 33–41.
Johnson, M.D., He, L., Herman, D., Wakimoto, H., Wallace, C.A., Zidek, V.,
Mlejnek, P., Musilova, A., Simakova, M., Vorlicek, J., et al. (2009). Dissection
of chromosome 18 blood pressure and salt-sensitivity quantitative trait loci
in the spontaneously hypertensive rat. Hypertension 54, 639–645.
Kall, L., Canterbury, J.D., Weston, J., Noble, W.S., and MacCoss, M.J. (2007).
Semi-supervised learning for peptide identification from shotgun proteomics
datasets. Nat. Methods 4, 923–925.
Kent, W.J. (2002). BLAT—the BLAST-like alignment tool. Genome Res. 12,
656–664.
Kinoshita, K., Ashenagar, M.S., Tabuchi, M., and Higashino, H. (2011). Whole
rat DNA array survey for candidate genes related to hypertension in kidneys
from three spontaneously hypertensive rat substrains at two stages of age
and with hypotensive induction caused by hydralazine hydrochloride. Exp
Ther Med 2, 201–212.
Kleinman, C.L., and Majewski, J. (2012). Comment on ‘‘Widespread RNA and
DNA sequence differences in the human transcriptome’’. Science 335, 1302,
author reply 1302.
Cell Reports 5, 1–10, December 12, 2013 ª2013 The Authors 9

Please cite this article in press as: Low et al., Quantitative and Qualitative Proteome Characteristics Extracted from In-Depth Integrated Genomics andProteomics Analysis, Cell Reports (2013), http://dx.doi.org/10.1016/j.celrep.2013.10.041
Lee, S.J., Liu, J., Qi, N., Guarnera, R.A., Lee, S.Y., and Cicila, G.T. (2003). Use
of a panel of congenic strains to evaluate differentially expressed genes as
candidate genes for blood pressure quantitative trait loci. Hypertens. Res.
26, 75–87.
Li, X., Ling, Y., Lu, D., Lu, Z., Liu, Y., Chen, H., and Gao, X. (2013). Common
polymorphism rs11191548 near the CYP17A1 gene is associated with hyper-
tension and systolic blood pressure in the Han Chinese population. Am. J.
Hypertens. 26, 465–472.
Lin, W., Piskol, R., Tan, M.H., and Li, J.B. (2012). Comment on ‘‘Widespread
RNA and DNA sequence differences in the human transcriptome’’. Science
335, 1302, author reply 1302.
Liu, C., Li, H., Qi, Q., Lu, L., Gan, W., Loos, R.J., and Lin, X. (2011). Common
variants in or near FGF5, CYP17A1 and MTHFR genes are associated with
blood pressure and hypertension in Chinese Hans. J. Hypertens. 29, 70–75.
Merrihew, G.E., Davis, C., Ewing, B.,Williams, G., Kall, L., Frewen, B.E., Noble,
W.S., Green, P., Thomas, J.H., andMacCoss,M.J. (2008). Use of shotgun pro-
teomics for the identification, confirmation, and correction of C. elegans gene
annotations. Genome Res. 18, 1660–1669.
Mohammed, S., Lorenzen, K., Kerkhoven, R., van Breukelen, B., Vannini, A.,
Cramer, P., and Heck, A.J.R. (2008). Multiplexed proteomics mapping of yeast
RNA polymerase II and III allows near-complete sequence coverage and re-
veals several novel phosphorylation sites. Anal. Chem. 80, 3584–3592.
Munoz, J., Low, T.Y., Kok, Y.J., Chin, A., Frese, C.K., Ding, V., Choo, A., and
Heck, A.J.R. (2011). The quantitative proteomes of human-induced pluripotent
stem cells and embryonic stem cells. Mol. Syst. Biol. 7, 550.
Nagaraj, N., Wisniewski, J.R., Geiger, T., Cox, J., Kircher, M., Kelso, J., Paabo,
S., and Mann, M. (2011). Deep proteome and transcriptome mapping of a
human cancer cell line. Mol. Syst. Biol. 7, 548.
Nesvizhskii, A.I., and Aebersold, R. (2005). Interpretation of shotgun proteomic
data: the protein inference problem. Mol. Cell. Proteomics 4, 1419–1440.
Nesvizhskii, A.I., Roos, F.F., Grossmann, J., Vogelzang, M., Eddes, J.S., Gruis-
sem, W., Baginsky, S., and Aebersold, R. (2006). Dynamic spectrum quality
assessment and iterative computational analysis of shotgun proteomic data:
toward more efficient identification of post-translational modifications,
sequence polymorphisms, and novel peptides. Mol. Cell. Proteomics 5,
652–670.
Newton-Cheh, C., Johnson, T., Gateva, V., Tobin, M.D., Bochud, M., Coin, L.,
Najjar, S.S., Zhao, J.H., Heath, S.C., Eyheramendy, S., et al.; Wellcome Trust
Case Control Consortium (2009). Genome-wide association study identifies
eight loci associated with blood pressure. Nat. Genet. 41, 666–676.
Ning, K., Fermin, D., and Nesvizhskii, A.I. (2012). Comparative analysis of
different label-free mass spectrometry based protein abundance estimates
and their correlation with RNA-Seq gene expression data. J. Proteome Res.
11, 2261–2271.
Okamoto, K., and Aoki, K. (1963). Development of a strain of spontaneously
hypertensive rats. Jpn. Circ. J. 27, 282–293.
Ozsolak, F., and Milos, P.M. (2011). RNA sequencing: advances, challenges
and opportunities. Nat. Rev. Genet. 12, 87–98.
Peng, M., Taouatas, N., Cappadona, S., van Breukelen, B., Mohammed, S.,
Scholten, A., and Heck, A.J.R. (2012). Protease bias in absolute protein quan-
titation. Nat. Methods 9, 524–525.
Pickrell, J.K., Gilad, Y., and Pritchard, J.K. (2012). Comment on ‘‘Widespread
RNA and DNA sequence differences in the human transcriptome’’. Science
335, 1302, author reply 1302.
Pravenec, M., and Kurtz, T.W. (2010). Recent advances in genetics of the
spontaneously hypertensive rat. Curr. Hypertens. Rep. 12, 5–9.
Printz, M.P., Jirout, M., Jaworski, R., Alemayehu, A., and Kren, V. (2003).
GeneticModels in Applied Physiology. HXB/BXH rat recombinant inbred strain
10 Cell Reports 5, 1–10, December 12, 2013 ª2013 The Authors
platform: a newly enhanced tool for cardiovascular, behavioral, and develop-
mental genetics and genomics. J. Appl. Physiol. 94, 2510–2522.
Renuse, S., Chaerkady, R., and Pandey, A. (2011). Proteogenomics. Prote-
omics 11, 620–630.
Sandelin, A., Alkema, W., Engstrom, P., Wasserman, W.W., and Lenhard, B.
(2004). JASPAR: an open-access database for eukaryotic transcription factor
binding profiles. Nucleic Acids Res. 32 (Database issue), D91–D94.
Schwanhausser, B., Busse, D., Li, N., Dittmar, G., Schuchhardt, J., Wolf, J.,
Chen, W., and Selbach, M. (2011). Global quantification of mammalian gene
expression control. Nature 473, 337–342.
Simonis, M., Atanur, S.S., Linsen, S., Guryev, V., Ruzius, F.-P., Game, L.,
Lansu, N., de Bruijn, E., van Heesch, S., Jones, S.J.M., et al. (2012). Genetic
basis of transcriptome differences between the founder strains of the rat
HXB/BXH recombinant inbred panel. Genome Biol. 13, r31.
Slavoff, S.A., Mitchell, A.J., Schwaid, A.G., Cabili, M.N., Ma, J., Levin, J.Z.,
Karger, A.D., Budnik, B.A., Rinn, J.L., and Saghatelian, A. (2013). Peptidomic
discovery of short open reading frame-encoded peptides in human cells. Nat.
Chem. Biol. 9, 59–64.
Soon, W.W., Hariharan, M., and Snyder, M.P. (2013). High-throughput
sequencing for biology and medicine. Mol. Syst. Biol. 9, 640.
Starheim, K.K., Gevaert, K., and Arnesen, T. (2012). Protein N-terminal acetyl-
transferases: when the start matters. Trends Biochem. Sci. 37, 152–161.
Su, Z.-D., Sun, L., Yu, D.-X., Li, R.-X., Li, H.-X., Yu, Z.-J., Sheng, Q.-H., Lin, X.,
Zeng, R., and Wu, J.-R. (2011). Quantitative detection of single amino acid
polymorphisms by targeted proteomics. J. Mol. Cell Biol. 3, 309–315.
Sun, A., Jiang, Y., Wang, X., Liu, Q., Zhong, F., He, Q., Guan,W., Li, H., Sun, Y.,
Shi, L., et al. (2010). Liverbase: a comprehensive view of human liver biology.
J. Proteome Res. 9, 50–58.
Swaney, D.L.,Wenger, C.D., and Coon, J.J. (2010). Value of usingmultiple pro-
teases for large-scale mass spectrometry-based proteomics. J. Proteome
Res. 9, 1323–1329.
Takeuchi, F., Isono, M., Katsuya, T., Yamamoto, K., Yokota, M., Sugiyama, T.,
Nabika, T., Fujioka, A., Ohnaka, K., Asano, H., et al. (2010). Blood pressure and
hypertension are associated with 7 loci in the Japanese population. Circulation
121, 2302–2309.
Trapnell, C., Roberts, A., Goff, L., Pertea, G., Kim, D., Kelley, D.R., Pimentel,
H., Salzberg, S.L., Rinn, J.L., and Pachter, L. (2012). Differential gene and tran-
script expression analysis of RNA-seq experiments with TopHat and Cufflinks.
Nat. Protoc. 7, 562–578.
Uhlen, M., and Ponten, F. (2005). Antibody-based proteomics for human tissue
profiling. Mol. Cell. Proteomics 4, 384–393.
Valentine, S.J., Sevugarajan, S., Kurulugama, R.T., Koeniger, S.L., Meren-
bloom, S.I., Bohrer, B.C., and Clemmer, D.E. (2006). Split-field drift tube/
mass spectrometry and isotopic labeling techniques for determination of sin-
gle amino acid polymorphisms. J. Proteome Res. 5, 1879–1887.
Venter, E., Smith, R.D., and Payne, S.H. (2011). Proteogenomic analysis of
bacteria and archaea: a 46 organism case study. PLoS ONE 6, e27587.
Vizcaıno, J.A., Cote, R.G., Csordas, A., Dianes, J.A., Fabregat, A., Foster, J.M.,
Griss, J., Alpi, E., Birim, M., Contell, J., et al. (2013). The PRoteomics
IDEntifications (PRIDE) database and associated tools: status in 2013. Nucleic
Acids Res. 41 (Database issue), D1063–D1069.
Vogel, C., and Marcotte, E.M. (2012). Insights into the regulation of protein
abundance from proteomic and transcriptomic analyses. Nat. Rev. Genet.
13, 227–232.
Volkening, J.D., Bailey, D.J., Rose, C.M., Grimsrud, P.A., Howes-Podoll, M.,
Venkateshwaran, M., Westphall, M.S., Ane, J.-M., Coon, J.J., and Sussman,
M.R. (2012). A proteogenomic survey of the Medicago truncatula genome.
Mol. Cell. Proteomics 11, 933–944.

Integrative transcriptomics and proteomics analysis of two inbred rat strains
Supplementary Material for Low et al.
Supplementary information to:
Quantitative and qualitative proteome
characteristics extracted from in-depth integrated
genomics and proteomics analysis
Teck Yew Low1,2,6, Sebastiaan van Heesch3,6, Henk van den Toorn1,2,6, Piero Giansanti1,2,
Alba Cristobal1,2, Pim Toonen3, Sebastian Schafer4, Norbert Hübner4,5, Bas van Breukelen1,2,
Shabaz Mohammed1,2,7 Edwin Cuppen3, Albert J. R. Heck 1,2, Victor Guryev3,8
1 Biomolecular Mass Spectrometry and Proteomics, Bijvoet Center for Biomolecular
Research and Utrecht Institute for Pharmaceutical Sciences, Utrecht University, Padualaan
8, 3584 CH Utrecht, The Netherlands 2 Netherlands Proteomics Center, Padualaan 8, 3584 CH Utrecht, The Netherlands 3 Hubrecht Institute, KNAW and University Medical Center Utrecht, 3584 CT Utrecht, The
Netherlands 4 Max-Delbruck-Center for Molecular Medicine (MDC), Robert-Rossle-Str. 10, 13125 Berlin,
Germany 5 DZHK (German Centre for Cardiovascular Research), partner site Berlin, Berlin, Germany
6 These authors contributed equally to this article 7 Current address: Departments of Chemistry and Biochemistry, University of Oxford,
Physical & Theoretical Chemistry Laboratory, South Parks Road, OX1 3QZ Oxford, UK 8 Current address: European Research Institute for the Biology of Ageing, University of
Groningen, University Medical Center Groningen, Antonius Deusinglaan, 1, Building 3226,
9713 AV Groningen, The Netherlands
Page | 1

Integrative transcriptomics and proteomics analysis of two inbred rat strains
Supplementary Material for Low et al.
Correspondence to:
*E.C., [email protected]
Phone: +31 (0)30 212 18 00
Fax: +31 (0)30 251 64 64
**A.J.R.H., [email protected]
Phone: +31 (0)30 253 67 97
Fax: +31 (0)30 253 69 19
Character count: 45,754 (with spaces)
Extended Experimental Procedures Supplementary Tables: S1-S15 Supplementary Figures: S1-S5
Page | 2

Integrative transcriptomics and proteomics analysis of two inbred rat strains
Supplementary Material for Low et al.
Extended experimental procedures
Identification of non-synonymous genomic variants for BN-Lx and SHR
Single nucleotide variants and indels were obtained from previous genome sequencing
efforts (Atanur et al., 2010; Simonis et al., 2012). Non-synonymous (amino acid changing)
mutations were predicted using the Variant Effect Predictor tool (V2.1) (McLaren et al.,
2010). For each genomic variant that can result in a polymorphic protein, strain-specific
alleles were reconstructed and added to extended peptide reference database. The set
totals 10,493 non-synonymous variants between BN-Lx and SHR that map to 6,187 proteins
in 4,566 genes. Nearly two-thirds of the genes and proteins harbor only a single non-
synonymous variant (63.6% and 64.8% respectively). Every fifth (20.4%, 20.2%) exhibits 2
variants and the rest of the genes and proteins posses between 3 and 31 variants.
Transcriptome sequencing and assembly
All experiments involving animals were performed according to the national rules and
regulations of the Netherlands. Total RNA was isolated from snap-frozen and powdered liver
tissue samples of 6-week old inbred BN-Lx/Cub and SHR/OlaIpcv males and females (2 per
gender, per strain). Total RNA was purified prior to RNA sequencing library preparation
using the RiboMinus™ Eukaryote Kit for RNA-Seq (Invitrogen). Libraries were prepared
exactly according to manufacturer’s instructions (SOLiDTM V4 guide for library preparation,
Life Technologies) using the SOLiDTM total RNA-seq kit. Eight libraries were sequenced
simultaneously using multiplexed paired-end technology (50 + 35 bp) on a single slide of
SOLiDTM V4 system. For de novo transcriptome assembly, we used CLCBio assembly cell
version 4 (CLC Bio, Aarhus, Denmark) to assemble transcriptomes of rat liver samples. All
de novo assembly and scaffolding procedures were done for each of the eight samples
separately. In addition we constructed transcriptomes by merging datasets from the same
genetic background (BN-Lx or SHR). Transcriptomes were mapped against the reference
Page | 3

Integrative transcriptomics and proteomics analysis of two inbred rat strains
Supplementary Material for Low et al.
genome assembly using BLAT software (Kent, 2002) retaining only the best match with a
score of at least 100.
Detection of RNA editing and splicing in RNA sequencing data
To define accurately where RNA editing took place, we selected only the best read-
alignments, with the second best hits having an at least 10% lower BLAT score. Also,
gapped alignments produced in the previous step were scored for base-level inconsistencies
between the genome and transcriptome sequences. We required that each RNA editing
candidate was flanked by at least 50 base pairs of uninterrupted sequence that match the
genome in both the 5' and 3' direction. Transcriptome contigs that showed a discrepancy
with the genome sequence (taking previously annotated strain-specific genomic variants into
account) were compared with their corresponding protein sequences using NCBI BLAST
(blastx). Only classical editing events (A to I or C to T) were retained. For all predicted non-
synonymous RNA editing variants, an individual entry was created in the extended rat
protein database. For each entry we included which of the 8 rat liver samples showed this
specific variant.
Similar to the detection of editing events, splice events were detected using alignments
between the assembled transcriptome and genome, and compared to their corresponding
proteins. Best, but structurally imperfect homologies between the annotated protein and
translated transcript (due to insertions / deletions) comprised the source for alternative
transcripts. Together with the genomic variants and RNA editing events, these alternative
splice events were included into the extended protein search database.
GENSCAN gene predictions and support by RNA sequencing data
When best matches of de novo assembled transcriptome contigs corresponded to a
GENSCAN prediction rather than to an annotated gene, we included it as possible translated
sequence. About 6.5% of all GENSCAN predictions were supported by RNA-Seq data
Page | 4

Integrative transcriptomics and proteomics analysis of two inbred rat strains
Supplementary Material for Low et al.
(2,903), but as a control for the detection limit of the RNA sequencing data, all 44,993
GENSCAN predictions were included in our protein search database.
Sequence database compilation
We downloaded the annotated Ensembl (Birney et al., 2004; Curwen et al., 2004;
Hubbard, 2002) rat protein FASTA (build 3.4.63) derived from the genome assembly of the
Brown Norway (BN) strain as our foundation. Subsequently, to tailor-make an in-house rat
protein database with enhanced comprehensiveness and precision, we modified and
appended the original database with information derived from DNA re-sequencing and RNA-
sequencing (RNA-Seq) of the BN-Lx and SHR strain used in this study. When considering
strain-specific isoforms, each original Ensembl protein entry that contained variants between
BN-Lx and SHR was replaced by the two allelic variants. In the vast majority of cases BN-Lx
allele (with more similar genetic background to reference strain) was representing
ENSEMBL entries, except for the rare cases where reference assembly (with estimated error
rate 1/100kb) disagreed with WGS data from both rat strains. Prediction of effect of non-
synonymous amino acid changes on protein structure was performed by SIFT (Ng and
Henikoff, 2001) and Polyphen2 (Adzhubei et al., 2010).
Quantification of transcriptome data
To quantify expression differences between BN-Lx and SHR strains, RNA-Seq data for
each sample was aligned to reference genome using TopHat 2.0.8 / Bowtie 1.0 allowing up
to 6 mismatches and using parameters –bowtie1 –csfasta –qual –library-type fr-
secondstrand. Expressed and differentially expressed genes were defined by the Cuffdiff
program (Trapnell et al., 2012) through comparison of 4 BN-Lx with 4 SHR transcriptomes.
Genes with reliable expression level calculation by Cuffdiff were selected allowing only
confident calls (status code ”OK”). We used gene annotation that corresponds to Ensembl
build 69 to assign reads to corresponding transcripts.
Page | 5
Integrative transcriptomics and proteomics analysis of two inbred rat strains
Supplementary Material for Low et al.
In total, 35,216 genes showed reads corresponding to their exonic sequences, including
17,100 GENSCAN predictions. 17,050 genes showed average expression levels exceeding
1 FPKM either in BN-Lx and/or SHR rats (including 4,998 GENSCANs). The proportion of
GENSCAN predictions is expectedly lower among genes with higher expression. Overall
9.6-12.9% of mapped RNA-Seq reads in each sample overlapped GENSCAN predictions.
From the annotated rat genes where one or more samples per strain show high levels of
expression (exceeding 1 FPKM), we frequently observe expression in the other 3 samples
(89.6 % of genes expressed in BN-Lx and 90.0% of genes expresses in SHR). For a very
limited set of genes we see high expression in one of the samples and absence of
expression in three other samples (4.0% and 3.9% of genes with high expression in one of
BN-Lx and SHR samples, respectively). Such ‘across samples’ expression is less
pronounced for GENSCAN predictions where only 56.7% and 59.7% of the genes show
expression in all samples belonging to this strain. 10.2% and 8.7% of the GENSCAN
predictions show some expression (FPKM>1) in one BN-Lx or SHR animal, but do not have
observable expression in the other 3 rat samples coming from the same strain.
Of the 4,566 genes with non-synonymous variants 1,820 were expressed in BN-Lx
and/or SHR liver samples (averaged FPKM across 4 individuals) at a level exceeding 1
FPKM and 2,612 at level exceeding 0.1 FPKM. In total 68,059 RNA-Seq reads overlapped
genomic positions of non-synonymous SNVs.
The set of differentially expressed genes was defined as genes that showed 2-fold
difference between BN-Lx and SHR samples supported by q<0.01. Over-representation of
Gene Ontology terms was determined by the g:Profiler tool (Reimand et al., 2011). For the
following 12 differentially expressed genes, literature search provides a potential link to
hypertension: CYP17A1, HAO2, CYP8B1, SERPINA3M, LSS, NNMT, ABCG2, NQO1,
ANXA5, ADO, AGXT2, CYP1A1. They appear in Pubmed abstracts together with word
‘hypertension’ (http://gogenes.org). As this list currently has 1,732 genes (about 8% of
Page | 6

Integrative transcriptomics and proteomics analysis of two inbred rat strains
Supplementary Material for Low et al.
coding genes), 29% of genes in our list being part of that list is a significant enrichment (chi-
square test, p=1e-6).
Determination of expression Quantitative Trait Loci (eQTL)
Determination of eQTLs in the HXB/BXH recombinant inbred panel consisting of 30 rat
strains were performed exactly as previously described (Heinig et al., 2010).
Liver tissue sample preparation for proteomics
Snap-frozen liver tissues were re-suspended in 8 M urea in 50 mM ammonium
bicarbonate (pH 8.0), supplemented with protease inhibitors (Complete protease inhibitor
cocktail tablets, Roche Diagnostics). Lysates were then sonicated and cleared by
centrifugation at 13,000 RPM. Protein lysates (300µg) were reduced with 1 mM dithiothreitol
(DTT) and alkylated with 5.5 mM iodoacetamide. For tryptic digestion, proteins were
digested with endoproteinase Lys-C (Wako Chemicals) and sequencing grade modified
trypsin (Promega) after 4-fold dilution with 50 mM ammonium bicarbonate. Protease
digestion was stopped by addition of trifluoroacetic acid and precipitates were removed after
centrifugation. Peptides were desalted using reversed-phase Sep-Pak C18 cartridges
(Waters). For the GluC, AspN and chymotrypsin digestion, the urea concentration was
diluted to 1 M before addition of proteases.
Strong Cation Exchange Chromatography (SCX)
Desalted peptide samples were fractionated using strong cation exchange (SCX) system
consisting of an Agilent 1100 HPLC system (Agilent Technologies) coupled to a Zorbax
BioSCX-Series II column (0.8-mm inner diameter × 50-mm length, 3.5 μm). Solvent A
consisted of 0.05% formic acid in 20% acetonitrile while solvent B was 0.05% formic acid,
0.5 M NaCl in 20% acetonitrile. The SCX salt gradient is as follows: 0-0.01 min (0-2% B);
0.01-8.01 min (2-3% B); 8.01-14.01 min (3-8% B); 14.01-28 min (8-20% B); 28-38 min (20-
40% B); 38-48 min (40-90% B); 48-54 min (90% B); 54-60 min (0% B). A total of 36 SCX
Page | 7

Integrative transcriptomics and proteomics analysis of two inbred rat strains
Supplementary Material for Low et al.
fractions (1 min each, i.e. 50-μl elution volume) were collected and dried in a vacuum
centrifuge.
MS Analysis
The early fractions from SCX were analyzed with an Agilent 1290 Infinity (Agilent
Technologies, Waldbronn, DE) system coupled to a TripleTOF 5600 system (AB Sciex,
Concord, ON). The UPLC was equipped with a double frit trapping column (ReproSil-Pur
C18-AQ, 3µm, Dr. Maisch GmbH, Ammerbuch, Germany: 2 cm x 100 mID, packed in-
house) and an analytical column (Agilent Zorbax SB-C18, 1.8 μm, 40 cm x 50 μm, packed
in-house) for online trapping, desalting, and analytical separations. The solvents used were:
buffer A 0.1% formic acid in water and buffer B 0.1% formic acid in 80% acetonitrile.
Trapping and desalting were carried out at 5 μL/min for 10 min with 100% buffer A. For
elution, the flow rate was passively split to 100 nL/min and the analytical separation was
established in 2h gradient by the following conditions: immediately after loading the
percentage of buffer B was increased to 15% in 0.1min, then buffer B was increased up to
21% and 35% respectively in 47.4 min and 47.5 min. Following the gradient was increased
to 100% B in 2 min and maintained for 1 min. Initial chromatographic conditions were
restored in 1 min and maintained for 10 min. Data acquisition was performed with a
TripleTOF5600 System fitted with a Nanospray III source (AB SCIEX, Concord, ON) and a
coated tip as the emitter (New Objectives, Woburn, MA). Data was acquired using an ion
spray voltage of 2.7 kV, curtain gas of 10 psi, nebulizer gas of 10 psi, and an interface
heater temperature of 100°C. The mass spectrometer was operated in information-
dependent acquisition mode (IDA) and MS spectra were acquired across the mass range of
350–1250 m/z in high-resolution mode (> 30,000) using 250 ms accumulation time per
spectrum. The 20 most abundant precursors ions per cycle at a threshold of 50 counts per
second and peptides carrying from 2 up to 5 positive charges were chosen for fragmentation
from each MS spectrum with 50 ms minimum accumulation time for each precursor.
Dynamic exclusion was set 15 s, and then the precursor was refreshed off the exclusion list.
Page | 8

Integrative transcriptomics and proteomics analysis of two inbred rat strains
Supplementary Material for Low et al.
Tandem mass spectra were recorded in high sensitivity mode (resolution > 15 000) with
rolling collision energy on and with a collision energy spared of 15 V.
The late SCX fractions were analyzed with Nano-UPLC-MS/MS on a Proxeon EASY-
nLC 1000 (Thermo Scientific, Odense, Denmark) connected to an LTQ-Orbitrap Velos
(Thermo Fisher Scientific, Bremen, DE). The injected sample was first trapped with a
double-fritted trapping column (Dr Maisch Reprosil C18, 3 μm, 2 cm x 100 μm) before being
separated in an analytical column (Agilent Zorbax SB-C18, 1.8 μm, 35 cm x 50 μm). Solvent
A consists of 0.1 M acetic acid while solvent B is 0.1 M acetic acid in 80% acetonitrile.
Measurement time for each sample took 120 min. Samples are first loaded at a maximum
pressure of 980 bar with 100% solvent A. Subsequently, peptides are chromatographically
separated by a 91min gradient consisting of 15% to 40% solvent B at an un-split flow of 100
nL/min; then ramped to 100% B in 3 min and held in 100% B for another 2 min. This is finally
followed by a 13-min equilibration with 100% A. For MS analysis, 1.7 kV was applied to the
Nanospray needle. The survey scan was from 350 to 1500 m/z at a resolution of 30000 and
for the MS2 the resolution was set to 7500. The 10 most intense precursors were selected
for subsequent fragmentation using a direct dependent acquisition. A decision tree method
previously described was used (Frese et al., 2011), only selecting the peptides with charge
state higher than 3. Briefly, it chooses between ETD (with orbitrap or ion trap readout) and
HCD as the fragmentation technique depending on the charge and m/z value of the
precursor ion.
MS peak list generation
For Wiff files generated from TripleTOF 5600, tandem MS spectra were deisotoped,
charge-deconvoluted and peak lists were generated in Mascot generic format (MGF) using
AB Sciex Data Converter (version 1.1). For data generated from the LTQ-Orbitrap Velos,
Raw files were converted to MGF files using Proteome Discoverer (version 1.3). The non-
fragment filter was used to simplify ETD spectra and the Top N filter (10 highest peaks
admitted per 100 Da) for the HCD spectra. Three MGF files were generated (one for HCD,
Page | 9

Integrative transcriptomics and proteomics analysis of two inbred rat strains
Supplementary Material for Low et al.
one for ETD IT and one for ETD FT). The MGF files were then deisotoped and charge-
deconvoluted with the H-Score script as described (Savitski et al., 2010).
Protein database searching
All MGF files were submitted to Mascot search engine (version 2.3) via Proteome
Discoverer version 1.3 (Thermo Fisher). The spectra were searched against
RAT_COMBINED custom database. Respective proteases (Trypsin/P, LysC/P,
Chymotrypsin, GluC and AspN) were chosen for the corresponding samples. Cysteine
carbamidomethylation was set as fixed modification, and oxidation of methionine and
acetylation of the N-terminal as variable modifications. Peptide tolerance was initially set to
50 ppm and the MS/MS tolerance was set to 0.1 Da (for TOF readout), 0.02 Da (Orbitrap
readout) and 0.5 Da (ion trap readout). All peptide-spectrum matches (PSMs) were validated
with Percolator (Käll et al., 2007). We classified each PSM based on a high stringency filter
of q = 0 or 0% FDR. The expected protein level FDR therefore is also 0%. Furthermore,
only PSMs with a first rank in the search engine and a minimum length of 6 amino acids
were kept.
Unmatched spectra were exported for analysis with PEAKS Studio (version 6.0). Peak
lists were first filtered with a quality value of 0.65 as suggested by the manufacturer, followed
by a tag database search. Both peptide tolerance and MS/MS tolerance were set according
to the Mascot search. To increase the options for matching the unassigned spectra, we
additionally set deamidation of asparagine and glutamine, and pyro-glu from glutamic acid
and glutamine as variable modifications, on top of the modifications used in the Proteome
Discoverer search. The maximum allowed variable PTM per peptide was set to 3. Finally de
novo interpreted PSMs were submitted to PEAKS DB database matching, allowing semi-
enzymatic specificity and a maximum missed cleavage per peptide of 2. Again, the
sequence database used was the RAT_COMBINED. The FDR was estimated using a
concatenated decoy database and data was filtered according to an FDR threshold of 0.0%.
For reference, we have also searched the data with Proteome Discoverer using the original
Page | 10

Integrative transcriptomics and proteomics analysis of two inbred rat strains
Supplementary Material for Low et al.
Ensembl rat database (build 3.4.63). At the 0.0% FDR level we obtained 15,413 of proteins
for both BN-Lx and SHR.
Quantitative comparison of proteome and transcriptome data
To combine quantitative data from all methods, we developed a relational database
schema (Figure S5) for data storage. The database schema was converted to Java (Java
SE 7, Oracle California USA) entities, using Java Persistence API (JPA version 2)
implemented in EclipseLink version 2.3.2 (http://www.eclipse.org/eclipselink), with the tools
provided in Netbeans IDE 7.3 (http://www.netbeans.org). The database used was MySQL
version 5.5 (Oracle, California USA).
The following is a step-by-step description for storing and comparing quantitative
transcriptomics and proteomics data:
I. We first imported Ensembl transcript to protein conversion table. Transcript
identifiers were converted to Ensembl protein identifiers using a list exported from
Ensembl with the Biomart (Kasprzyk, 2011) tool.
II. Subsequently, we imported RAT_COMBINED sequences, disambiguate the
protein sequences, followed by creating a table to map non-redundant sequences
to the original identifiers. Another table was created to map the redundant
identifiers to standard identifiers.
III. Entity classes were generated from the unimod schema using JAXB-2 Maven
Plugin (version 0.8.2), and the unimod (http://www.unimod.org, 19 Jul 2012) xml
file was imported into the database.
Page | 11

Integrative transcriptomics and proteomics analysis of two inbred rat strains
Supplementary Material for Low et al.
IV. This is followed by importing RNA-seq quantification in the form of normalized
FPKM values. FPKM values were averaged across all individuals (male and
female), after confirmation that the quantification values were highly correlated.
V. For quantitative proteomics data, PSMs were collected from the PD .msf files
using thermo_msf_reader (Colaert et al., 2011) version 2.0.3, where only high
quality matches (set to 0% FDR in PD) and first ranking search engine hits were
accepted. PEAKS results, exported as tab-delimited peptide files were read into
the database and filtered by FDR cutoff threshold scores determined by the
PEAKS software. In the database, peptides were grouped based on sequence
and matched to the known protein sequences from the RAT_COMBINED
database. For every protein the spectral counts were calculated based on the
number of PSMs present in the database per strain. A semi-quantitative measure
for expression SAF (spectral abundance factor) was calculated by dividing the
spectral counts by the amino acid length of the protein. Subsequently, ratios
between the two strains were calculated and the log-2 of the ratios were taken for
further analysis. These ratios were further normalized to Z-values using the
robust Median Absolute Deviation (MAD) as implemented in the “mad” function in
R (http://www.r-project.org). The p-values calculated from these z-values were
corrected for multiple testing with the Benjamini-Hochberg (Benjamini and
Hochberg, 1995) FDR method using the R function “p.adjust”.
VI. The conversion factor was calculated by dividing the SAF by the FPKM. For
convenience, the log10 was taken of this factor.
From 17,050 genes that showed expression level exceeding 1 FPKM, 9,557 of them
(56%) were detected at protein level. These numbers include 4,998 GENSCANs predictions,
from which 3,014 gene models had supported by proteomics data. Prior to the comparative
Page | 12

Integrative transcriptomics and proteomics analysis of two inbred rat strains
Supplementary Material for Low et al.
analysis, we omitted all non-unique peptides that match to common sequences between
allelic variants of BN-Lx and SHR. Thus, if a peptide observed in a BN-Lx sample that was
assigned to both BN-Lx and SHR proteins isoforms, a match against SHR isoform was not
considered.
Apart from the approach using only genes having evidence at both the RNA and protein
level, as discussed in the main text, we also considered genes showing significant
differential expression on the protein level. We obtained 205 genes showing differential
expression on the proteomics level (q<0.01, Table S13). Over half of them (109) were
GENSCAN predictions. Functional analysis of 102 genes upregulated in SHR as compared
to BN-Lx results in a mild over-representation of cytosolic small ribosomal subunit genes (4
genes). Similarly, 5 out of 103 downregulated genes (SHR versus BN-Lx) were found to be
involved in myosin complexes.
Antibodies for western blots
Cyp17a1 (Santa Cruz) and Hao2 (Santa Cruz), both polyclonal, were used in western blots.
Page | 13

Integrative transcriptomics and proteomics analysis of two inbred rat strains
Supplementary Material for Low et al.
Supplementary Tables Table S1 Related to Figure 1
Sequencing depth for RNA-seq performed on the mRNA content of 8 liver tissues from BN-Lx and SHR
See Page 16 of the Supplementary material
Table S2 Related to Figure 1 Protein splice isoforms derived from de novo transcriptome assembly
See Excel spreadsheet: Supplementary_Table_S2_Rat_Liver_splice.xlsx
Table S3A related to Figure 1 RNA-splicing events independently verified by RT-PCR-based Sanger sequencing
See Excel spreadsheet: Supplementary_Table_S3B_editing_validation.xlsx
Table S3B Related to Figure 1 RNA-editing events independently verified by RT-PCR-based Sanger sequencing
See Excel spreadsheet: Supplementary_Table_S3A_splicing_validation.xlsx
Table S4 Related to Figure 1 A list of 2,903 GENSCAN predictions supported by de novo assembly of transcriptomic data
See Excel spreadsheet: Supplementary_Table_S4_GENSCAN_Predictions_Validated_with_RNAseq.xlsx
Table S5 related to Figure 1 RNA edits identified from RNA-seq data This list contains 799 canonical RNA edits, only 196 edits are non-synonymous and potentially detected by MS-based proteomics.
See Excel spreadsheet: Supplementary_Table_S5_RNA_editing.xlsx
Table S6 related to Figure 1 Basic statistics of the proteomics data for BN-Lx and SHR liver tissue (S6A) This table breaks down the proteomics data for BN-Lx and SHR liver tissue, in terms of the number of search input (peak lists), peptide-spectral matches, distinct peptide groups, proteins, genes with and without GENSCAN predictions. The numbers in this table include these strain-specific proteins that are found in the measurement of the other strain, omitted in table S7 (S6B) An overview of the numbers found in the different analysis software as PSMs, peptides and proteins, as well as the average mass deltas and standard deviations in ppm. (S6C) A global overview of the peptide variants in BN-Lx and SHR that were detected in our experiments. In this context, the term “unique” refers to proteins only identified by unique peptides. The global numbers merge the identifications between SHR and BN-Lx.(S6D) Progress on the analyses of Liver proteomics in the last 10 years. This table lists seven research papers which document the proteome analysis of livers by year of publication, sample sources, databases used and their sizes, number of proteins identified followed by percentage of proteins identified from the respective database.
See Page 17,18 of the Supplementary material
Page | 14

Integrative transcriptomics and proteomics analysis of two inbred rat strains
Supplementary Material for Low et al.
Table S7 related to Figure 3
Overall identified and quantified transcripts and proteins See Excel spreadsheet: Supplementary_Table_S7_Identified_and_Quantified_Proteins_and_Transcripts.xlsx
Table S8 related to Figure 1 Proteomics validation of GENSCAN predictions (S8A) A list of uniquely assigned peptides that provide supporting evidence for 1195 in silico predicted GENSCAN genes. (S8B) GENSCANs that are supported by evidence from both proteomics and RNAseq data. (S8C) Reciprocal Blast results matching validated GENSCANs from rats to known proteins in human and mouse (S8D) Peptides acetylated at the N-terminal of GENSCAN proteins, confirming their translational start sites.
See Excel spreadsheet: Supplementary_Table_S8A,B,C,D_GENSCAN_UniquePeptides_and_Proteins.xlsx
Table S9 related to Figure 1 Proteins variants confirmed with proteomics with unique peptide evidence This list contains all forms of protein variants (SNVs, RNA edits and splice variants) that are identified based only on unique, non-degenerate peptides.
See Excel spreadsheet: Supplementary_Table_S9_Overview_of_Variant_evidence_by_unique_peptides.html
Table S10 related to Figure 1 Overview of protein variants This list contains all forms of protein variants (SNVs, RNA edits and splice variants) that are identified based on all peptides (S10A). Genetic (S10B), RNA-editing (S10C) and new splice sites (S10D) predictions supported by unique peptides are given in separate tables.
See Excel spreadsheet: Supplementary_Table_S10_Overview_of_Identified_Protein_Variants.xlsx
Table S11 related to Figure 1 Prediction of variant effects on proteins In this table, the results of SIFT and PolyPhen2 predictions of the effects of non-synonymous genomic and transcriptomic variants on proteins are listed.
See Excel spreadsheet: Supplementary_Table_S11_BNLx_SHR_ns_sift_predictions.xlsx
Table S12 related to Figure 1 Complete list of uniquely assigned peptides This list contains unique, non-degenerate peptides that are assigned only to a single database entry.
See Excel spreadsheet: Supplementary_Table_S12_All_Unique_peptides.xlsx
Table S13 related to Figure 3 Gene expression quantified at RNA and protein levels. This list contains expression values for genes as detected by MS (SAF) with corresponding RNA-Seq (FPKM, only reliable Cuffdiff expression estimates) analyses in BN-Lx and SHR liver samples.
See Excel spreadsheet: Supplementary_Table_S13_Gene_expression_quantification.xlsx
Page | 15

Integrative transcriptomics and proteomics analysis of two inbred rat strains
Supplementary Material for Low et al.
Table S14A related to Figure 4
Human GWAS hits that overlap with differentially expressed genes between BN-Lx and SHR This list contains GWAS hits that overlap genes that are differentially expressed at mRNA and protein levels between BN-Lx and SHR livers.
See Excel spreadsheet:
Supplementary_Table_S14A,B_Rat_DE_Genes_and_(a)Human_GWAS_hits_(b)HXB_BXH_eQTLs.xlsx
Table S14B related to Figure 4 eQTL analysis over the BXH/HXB recombinant inbred (RI) panel derived from BN-Lx and SHR RNAseq data of the Cyp17a1 gene is linked to the ancestral genotype via marker B01P1773, showing a strong up-regulation for Cyp17a1 expression in the BN-Lx derived allele. The strong correlation between the genomic marker and the difference in gene expression shows that this locus is regulated in cis.
See Excel spreadsheet:
Supplementary_Table_S14A,B_Rat_DE_Genes_and_(a)Human_GWAS_hits_(b)HXB_BXH_eQTLs.xlsx
Table S15 related to Figure 2 GO analysis of the top 100 proteins with highest and lowest conversion factor The average conversion factor between SHR and BN-Lx of every protein was calculated, and these factors were ranked from low to high. The top hit of each factor from usearch (Edgar, 2010) was obtained and used to obtain overexpression analysis of GO terms using DAVID (Huang et al., 2009). The whole list of homologous proteins was used as background. For the highest 100 conversion factors, 73 mapped accessions were analyzed and tend to be associated with membranes. For the lowest conversion factors 83 accessions were mostly associated with cytoskeleton. No conclusive evidence was found since the identified GO terms had a high false discovery rate.
See Excel spreadsheet: Supplementary_Table_S15_Conversion_factor_analysis.xlsx
Page | 16

Integrative transcriptomics and proteomics analysis of two inbred rat strains
Supplementary Material for Low et al.
Table S1.
Animal No of RNA-seq paired reads Mapping Percentage (%)
BN-Lx_1_Female 32,085,968 42.49%
BN-Lx_1_Male 23,974,292 44.34%
BN-Lx_2_Female 22,722,598 42.86%
BN-Lx_2_Male 29,557,406 42.24%
SHR_1_Female 32,763,008 41.99%
SHR_1_Male 28,077,958 43.64%
SHR_2_Female 33,292,549 43.60%
SHR_2_Male 24,447,631 39.60%
Page | 17

Integrative transcriptomics and proteomics analysis of two inbred rat strains
Supplementary Material for Low et al.
Table S6
Table S6A
Proteomics Data BN-Lx Liver SHR Liver
Peak lists 6,047,421 6,548,727
Peptide-spectral Matches (PSM)
1,322,339 803,454
Peptide groups 96,230 79,212
Proteins 25,254 23,129
Genes and GENSCAN predictions 17,436 15,902
Genes 8,195 7,426
Table S6B
Proteome Discoverer Peaks Studio Global
Peptide-spectral Matches (PSMs) 1,282,519 843,274 2,125,793
Peptides 80,392 101,973 113,350
Proteins 24,756 25,382 26,463
Average mass delta ± standard deviation (ppm) 6.01 ± 4.39 7.25 ± 5.28 6.44 ± 4.75
Table S6C
BN-Lx BN-Lx Unique SHR SHR
Unique Global Global Unique
GENSCAN 9,241 1,002 8,476 886 9,731 1,195
Genomic variant BN-Lx 2,186 38 1,798 0 2,186 38
Genomic variant SHR 1,800 0 1,934 88 1,934 88
Genomic invariant 10,243 1,970 9,272 1,682 10,765 2,133
Splice variants 1,567 70 1,448 68 1,617 83
Edit variants 217 18 201 18 230 20
Page | 18

Integrative transcriptomics and proteomics analysis of two inbred rat strains
Supplementary Material for Low et al.
Table S6D
Paper
Year Sample Database Database
Size (MB) No. Proteins
% of Database
A dataset of human liver proteins identified by protein profiling via isotope-coded affinity tag (ICAT) and tandem mass spectrometry (Yan et al., 2004)
2004 Liver cell line IPI Human 2.28 40,113 2486 6.20
A dataset of human fetal liver proteome identified by subcellular fractionation and multiple protein separation and identification technology (Ying et al., 2006)
2006 Fetal liver tissue IPI Human 2.33 43,187 2495 5.78
A mammalian organelle map by protein correlation profiling (Foster et al., 2006) 2006 liver tissue IPI Mouse 3.15 68,236 2197 3.22
Analysis of the mouse liver proteome using advanced mass spectrometry (Shi et al., 2007)
2007 liver tissue IPI Mouse 3.18 53,802 2210 4.11
Comparative proteomic phenotyping of cell lines and primary cells to assess preservation of cell type-specific functions (Pan et al., 2009)
2009 Liver cell line IPI Mouse 3.24 52,326 4063 7.76
Liverbase: a comprehensive view of human liver biology (Sun et al., 2010) 2010 Adult liver
tissue IPI Human 3.07 50,225 6788 13.52
Quantitative and qualitative proteome characteristics extracted from in-depth integrated genomics and proteomics
2013 Rat liver tissue RAT_COMBINED 91,264 26,463 28.45
Page | 19

Integrative transcriptomics and proteomics analysis of two inbred rat strains
Supplementary Material for Low et al.
Supplementary Figures See separate PDF files
Figure S1 related to Figure 1 (A) Distribution of annotated genes, RNA-seq identified transcripts and proteomics-identified proteins on the rat chromosomes. (A) Identified
proteins are evenly distributed over the rat chromosomes, concordant to the distribution of
genes and transcripts. The right part of the figure displays the physical locations of the
differential expression of the proteins on the chromosomes on a color scale from red (SHR
highest) to white (BN-Lx highest). The upper half represent genes that are located on the “+”
strand of DNA while lower half the “-“ strand. Regions where no corresponding proteins were
identified were colored in grey. The end caps of the chromosomes are for graphical display only
and do not represent physical dimensions of telomeres. (B,C) The depth of the proteomics data. (B) The distribution of sequence coverage of proteins at a false discovery rate (FDR) of
0%. About 18% of proteins harbor at least 50% coverage. (C) On average, each of the five
proteases used contributed to more than 15% of peptide-spectral matches (PSMs) and non-
redundant peptide sequences with trypsin being the best overall, about 25%.
Figure S2 related to Figure 1 The distribution of lengths for all GENSCAN predicted proteins validated with proteomics. (A) Length distribution for all protein entries retrieved
from Ensembl and GENSCAN databases shows that GENSCAN predictions agree with
Ensembl annotation for proteins larger than 400 amino acids. For proteins comprising < 300
amino acids, GENSCAN predicts a lot more proteins than those that are validated by Ensembl.
(B) At an FDR of 0% and using at least one unique peptide as supporting evidence to verify
predicted gene models, we find that proteins < 100 amino acids are indeed present at
comparatively lower levels in rat liver tissues. (C) When data from (A) and (B) are normalized
and plotted together, it is clear that both Ensembl-annotated proteins and MS-verified gene
models are consistent in size distribution.
Besides regular-sized proteins, computational analysis (Frith et al., 2006) and ribosome
profiling (Ingolia et al., 2011) indicate the existence of thousands of short-ORFs (sORFs) that
encode short expressed proteins (SEPs) (Slavoff et al., 2013). Relatively few have been
confirmed by proteomics (Kastenmayer et al., 2006; Oyama et al., 2007; Slavoff et al., 2013;
Yang et al., 2011). SEPs have been implicated in plant and animal development (Galindo et al.,
2007; Hashimoto et al., 2001; Oelkers et al., 2008) stressing the need for their accurate
detection. Within Ensembl release 3.4.63, peptides derived from sORFs constitute only 5.13%
Page | 20
Integrative transcriptomics and proteomics analysis of two inbred rat strains
Supplementary Material for Low et al.
(1,683) of all entries (Figure S2A). However, the relative contribution of sORFs to the in silico
predicted GENSCANs is much higher (6,769, 14.13%) (Figure S2B). When we plot the
distribution of the proteins detected in our experiments by size, the majority consists of 200-
2000 amino acids, while short proteins (< 100 amino acids) constitute only 3.09% (Figure S2C).
In total, we obtained experimental evidence for 37 of the many (6,769) predicted novel SEPs,
indicating that current sORF annotation may severely overestimate the number of SEPs.
Figure S3 related to Figure 2 (A-B) Figure 2 augmented with the α2u-globulins / MUPs indicated in red. (A) Overview of the correlation between strains at mRNA level (top left) and
protein level (top right). The relation between protein levels and mRNA levels is shown in the
bottom plots, for BN-Lx (left) and SHR (right). (B) The α2u-globulins / MUPs show an outlying
group in the conversion factor plot. The green points indicate these with the highest 100 or
lowest 100 average conversion factors, that were analyzed further in Table S15. (C-E) The correlation of the abundance of the different regions of transcripts to protein abundance. Since various sequence features of transcripts have been documented to impact protein
abundance (Vogel et al., 2010), we determined which part of the transcript may be the most
informative for estimating protein levels. To do so, we selected all coding transcripts with
annotated 5’-UTRs and 3’-UTRs, exhibiting positive expression values as well as non-zero
protein abundance (n=1,576). We observe that transcript abundance that is calculated from the
3’-UTR sequences alone improves the observed mRNA protein correlation substantially (r =
0.54, Figure S3E), when compared to measures obtained from the 5’-UTR (r = 0.43, Figure
S3D) or the actual coding part of a transcript (r = 0.47) (Figure S3C). This suggests that reads
that correspond to the 3’-UTR part of the gene, thus reflecting both the expression level and
degree of mRNA degradation may be a better proxy to approximate protein abundance.
Figure S4 related to Figure 4 (A-C) eQTL data of three genes associated with hypertension in the rat. RNA expression levels in the recombinant inbred panel BXH/HXB
founded by SHR and BN-Lx were explored to determine the genetic basis of these differentially
expressed genes. For Serpina3m (A) and Hao2 (B), expression differences clearly co-segregate
with the genomic background of the founder strains, indicative of a cis-eQTL. For Cyp8b1 (C) on
the other hand, significant differences in expression are only observed in the founder strains.
This means that the expression of Cyp8b1 is likely to be trans-regulated and no genetic variants
in the vicinity of the gene are main determinants of the observed expression differences. (D) H3K4me3 (unpublished) data confirms the actual promoter location of the Cyp17a1 gene.
Page | 21

Integrative transcriptomics and proteomics analysis of two inbred rat strains
Supplementary Material for Low et al.
(D) Normalized ChIP data signal of the active transcriptional start site (TSS) mark H3K4me3
shows a strong enrichment around the actual gene promoter and much lower enrichment
around the annotated TSS. The “dip” in the signal likely corresponds to the nucleosome free
region where transcription is initiated. These data also illustrate that the Cyp17a1 TSS in SHR is
almost inactive, in line with the significantly decreased mRNA and protein levels.
Figure S5 related to Figure 1 The schema of the relational database developed to store all transcriptomics and proteomics data. The database schema was converted to Java
(Java SE 7, Oracle California USA) entities, using the Java Persistence API (JPA version 2)
implemented in EclipseLink version 2.3.2 (http://www.eclipse.org/eclipselink), using the tools
provided in Netbeans IDE 7.3 (http://www.netbeans.org). The database used was MySQL
version 5.5 (Oracle, California USA).
Page | 22

Integrative transcriptomics and proteomics analysis of two inbred rat strains
Supplementary Material for Low et al.
Figure S1.
Page | 23

Integrative transcriptomics and proteomics analysis of two inbred rat strains
Supplementary Material for Low et al.
Figure S2.
Page | 24

Integrative transcriptomics and proteomics analysis of two inbred rat strains
Supplementary Material for Low et al.
Figure S3.
Page | 25

Integrative transcriptomics and proteomics analysis of two inbred rat strains
Supplementary Material for Low et al.
Figure S4.
Page | 26

Integrative transcriptomics and proteomics analysis of two inbred rat strains
Supplementary Material for Low et al.
Figure S5.
Page | 27

Integrative transcriptomics and proteomics analysis of two inbred rat strains
Supplementary Material for Low et al.
Supplementary References
Adzhubei, I.A., Schmidt, S., Peshkin, L., Ramensky, V.E., Gerasimova, A., Bork, P., Kondrashov, A.S., and Sunyaev, S.R. (2010). A method and server for predicting damaging missense mutations. Nature Methods 7, 248–249.
Atanur, S.S., Birol, I., Guryev, V., Hirst, M., Hummel, O., Morrissey, C., Behmoaras, J., Fernandez-Suarez, X.M., Johnson, M.D., McLaren, W.M., et al. (2010). The genome sequence of the spontaneously hypertensive rat: Analysis and functional significance. Genome Research 20, 791–803.
Benjamini, Y., and Hochberg, Y.C.N.-M. (96d:62143) (1995). Controlling the false discovery rate: a practical and powerful approach to multiple testing. J. Roy. Statist. Soc. Ser. B 57, 289–300.
Birney, E., Andrews, T.D., Bevan, P., Caccamo, M., Chen, Y., Clarke, L., Coates, G., Cuff, J., Curwen, V., Cutts, T., et al. (2004). An overview of Ensembl. Genome Research 14, 925–928.
Colaert, N., Barsnes, H., Vaudel, M., Helsens, K., Timmerman, E., Sickmann, A., Gevaert, K., and Martens, L. (2011). Thermo-msf-parser: an open source Java library to parse and visualize Thermo Proteome Discoverer msf files. Journal of Proteome Research 10, 3840–3843.
Curwen, V., Eyras, E., Andrews, T.D., Clarke, L., Mongin, E., Searle, S.M.J., and Clamp, M. (2004). The Ensembl automatic gene annotation system. Genome Research 14, 942–950.
Edgar, R.C. (2010). Search and clustering orders of magnitude faster than BLAST. Bioinformatics (Oxford, England) 26, 2460–2461.
Foster, L.J., de Hoog, C.L., Zhang, Y., Zhang, Y., Xie, X., Mootha, V.K., and Mann, M. (2006). A mammalian organelle map by protein correlation profiling. Cell 125, 187–199.
Frese, C.K., Altelaar, A.F.M., Hennrich, M.L., Nolting, D., Zeller, M., Griep-Raming, J., Heck, A.J.R., and Mohammed, S. (2011). Improved peptide identification by targeted fragmentation using CID, HCD and ETD on an LTQ-Orbitrap Velos. Journal of Proteome Research 10, 2377–2388.
Frith, M.C., Forrest, A.R., Nourbakhsh, E., Pang, K.C., Kai, C., Kawai, J., Carninci, P., Hayashizaki, Y., Bailey, T.L., and Grimmond, S.M. (2006). The abundance of short proteins in the mammalian proteome. PLoS Genetics 2, e52.
Galindo, M.I., Pueyo, J.I., Fouix, S., Bishop, S.A., and Couso, J.P. (2007). Peptides encoded by short ORFs control development and define a new eukaryotic gene family. PLoS Biology 5, e106.
Hashimoto, Y., Niikura, T., Tajima, H., Yasukawa, T., Sudo, H., Ito, Y., Kita, Y., Kawasumi, M., Kouyama, K., Doyu, M., et al. (2001). A rescue factor abolishing neuronal cell death by a wide spectrum of familial Alzheimer’s disease genes and Abeta. Proceedings of the National Academy of Sciences of the United States of America 98, 6336–6341.
Page | 28

Integrative transcriptomics and proteomics analysis of two inbred rat strains
Supplementary Material for Low et al.
Heinig, M., Petretto, E., Wallace, C., Bottolo, L., Rotival, M., Lu, H., Li, Y., Sarwar, R.,
Langley, S.R., Bauerfeind, A., et al. (2010). A trans-acting locus regulates an anti-viral expression network and type 1 diabetes risk. Nature 467, 460–464.
Huang, D.W., Sherman, B.T., and Lempicki, R.A. (2009). Systematic and integrative analysis of large gene lists using DAVID bioinformatics resources. Nature Protocols 4, 44–57.
Hubbard, T. (2002). The Ensembl genome database project. Nucleic Acids Research 30, 38–41.
Ingolia, N.T., Lareau, L.F., and Weissman, J.S. (2011). Ribosome profiling of mouse embryonic stem cells reveals the complexity and dynamics of mammalian proteomes. Cell 147, 789–802.
Käll, L., Canterbury, J.D., Weston, J., Noble, W.S., and MacCoss, M.J. (2007). Semi-supervised learning for peptide identification from shotgun proteomics datasets. Nature Methods 4, 923–925.
Kasprzyk, A. (2011). BioMart: driving a paradigm change in biological data management. Database : the Journal of Biological Databases and Curation 2011, bar049.
Kastenmayer, J.P., Ni, L., Chu, A., Kitchen, L.E., Au, W.-C., Yang, H., Carter, C.D., Wheeler, D., Davis, R.W., Boeke, J.D., et al. (2006). Functional genomics of genes with small open reading frames (sORFs) in S. cerevisiae. Genome Research 16, 365–373.
Kent, W.J. (2002). BLAT--the BLAST-like alignment tool. Genome Research 12, 656–664.
McLaren, W., Pritchard, B., Rios, D., Chen, Y., Flicek, P., and Cunningham, F. (2010). Deriving the consequences of genomic variants with the Ensembl API and SNP Effect Predictor. Bioinformatics (Oxford, England) 26, 2069–2070.
Ng, P.C., and Henikoff, S. (2001). Predicting deleterious amino acid substitutions. Genome Research 11, 863–874.
Oelkers, K., Goffard, N., Weiller, G.F., Gresshoff, P.M., Mathesius, U., and Frickey, T. (2008). Bioinformatic analysis of the CLE signaling peptide family. BMC Plant Biology 8, 1.
Oyama, M., Kozuka-Hata, H., Suzuki, Y., Semba, K., Yamamoto, T., and Sugano, S. (2007). Diversity of translation start sites may define increased complexity of the human short ORFeome. Molecular & Cellular Proteomics : MCP 6, 1000–1006.
Pan, C., Kumar, C., Bohl, S., Klingmueller, U., and Mann, M. (2009). Comparative proteomic phenotyping of cell lines and primary cells to assess preservation of cell type-specific functions. Molecular & Cellular Proteomics: MCP 8, 443–450.
Reimand, J., Arak, T., and Vilo, J. (2011). g:Profiler--a web server for functional interpretation of gene lists (2011 update). Nucleic Acids Research 39, W307–15.
Page | 29

Integrative transcriptomics and proteomics analysis of two inbred rat strains
Supplementary Material for Low et al.
Savitski, M.M., Fischer, F., Mathieson, T., Sweetman, G., Lang, M., and Bantscheff, M.
(2010). Targeted data acquisition for improved reproducibility and robustness of proteomic mass spectrometry assays. Journal of the American Society for Mass Spectrometry 21, 1668–1679.
Shi, R., Kumar, C., Zougman, A., Zhang, Y., Podtelejnikov, A., Cox, J., Wiśniewski, J.R., and Mann, M. (2007). Analysis of the mouse liver proteome using advanced mass spectrometry. Journal of Proteome Research 6, 2963–2972.
Simonis, M., Atanur, S.S., Linsen, S., Guryev, V., Ruzius, F.-P., Game, L., Lansu, N., de Bruijn, E., van Heesch, S., Jones, S.J.M., et al. (2012). Genetic basis of transcriptome differences between the founder strains of the rat HXB/BXH recombinant inbred panel. Genome Biology 13, r31.
Slavoff, S.A., Mitchell, A.J., Schwaid, A.G., Cabili, M.N., Ma, J., Levin, J.Z., Karger, A.D., Budnik, B.A., Rinn, J.L., and Saghatelian, A. (2013). Peptidomic discovery of short open reading frame-encoded peptides in human cells. Nature Chemical Biology 9, 59–64.
Sun, A., Jiang, Y., Wang, X., Liu, Q., Zhong, F., He, Q., Guan, W., Li, H., Sun, Y., Shi, L., et al. (2010). Liverbase: a comprehensive view of human liver biology. Journal of Proteome Research 9, 50–58.
Trapnell, C., Roberts, A., Goff, L., Pertea, G., Kim, D., Kelley, D.R., Pimentel, H., Salzberg, S.L., Rinn, J.L., and Pachter, L. (2012). Differential gene and transcript expression analysis of RNA-seq experiments with TopHat and Cufflinks. Nature Protocols 7, 562–578.
Yan, W., Lee, H., Deutsch, E.W., Lazaro, C.A., Tang, W., Chen, E., Fausto, N., Katze, M.G., and Aebersold, R. (2004). A dataset of human liver proteins identified by protein profiling via isotope-coded affinity tag (ICAT) and tandem mass spectrometry. Molecular & Cellular Proteomics: MCP 3, 1039–1041.
Yang, X., Tschaplinski, T.J., Hurst, G.B., Jawdy, S., Abraham, P.E., Lankford, P.K., Adams, R.M., Shah, M.B., Hettich, R.L., Lindquist, E., et al. (2011). Discovery and annotation of small proteins using genomics, proteomics, and computational approaches. Genome Research 21, 634–641.
Ying, W., Jiang, Y., Guo, L., Hao, Y., Zhang, Y., Wu, S., Zhong, F., Wang, J., Shi, R., Li, D., et al. (2006). A dataset of human fetal liver proteome identified by subcellular fractionation and multiple protein separation and identification technology. Molecular & Cellular Proteomics: MCP 5, 1703–1707.
Page | 30
Copyright © 2022 FDOKUMEN