Stability, folding dynamics, and long-range conformational ...
Upload
khangminh22Category
view
0download
0
Protein Folding Dynamics
Single-Molecule Studies of
Ribonuclease HI on Biocompatible Surfaces
Dissertation zur Erlangung des Doktorgrades Dr. rer. nat.
der Fakultät für Naturwissenschaften der Universität Ulm
vorgelegt von
Elza Kuzmenkina geborene Amirgoulova
aus Narofominsk, Russland
Ulm, 2005

Universität Ulm, Abteilung Biophysik Oberer Eselsberg 1 D-89069, Ulm Amtierender Dekan: Prof. Dr. K.-D. Spindler 1. Berichterstatter: Prof. Dr. G. U. Nienhaus 2. Berichterstatter: Prof. Dr. M. Pietralla Tag der Promotion: 10. November 2005

1
Contents 1 Introduction ................................................................................................................... 4
1.1 Why study protein folding? .................................................................................... 4 1.2 Why study folding on the single-molecule level? .................................................. 6 1.3 FRET as a spectroscopic ruler to study biomolecules............................................ 7 1.4 Why we need to immobilize proteins on biocompatible surfaces .......................... 9
1.4.1 Protein-based surfaces ................................................................................... 11 1.4.2 PEG-based surfaces ....................................................................................... 11
1.5 Model proteins...................................................................................................... 12 1.5.1 Ribonuclease HI ............................................................................................ 12 1.5.2 eqFP611......................................................................................................... 15
2 Materials and methods................................................................................................. 18 2.1 Ensemble absorption and fluorescence spectroscopy........................................... 18
2.1.1 Setup .............................................................................................................. 18 2.1.2 Concentration measurements......................................................................... 18
2.2 Single-molecule fluorescence microscopy ........................................................... 18 2.2.1 Setup .............................................................................................................. 18 2.2.2 Sandwich cell................................................................................................. 22 2.2.3 Software......................................................................................................... 22 2.2.4 Measurements protocols ................................................................................ 22
2.2.4.1 Imaging................................................................................................... 22 2.2.4.2 Recording of fluorescence time traces.................................................... 22
2.2.5 Intensity corrections for the analysis ............................................................. 23 2.2.5.1 Images..................................................................................................... 24 2.2.5.2 Traces ..................................................................................................... 24
2.2.6 Analysis of FRET efficiency changes from single molecule traces.............. 24 2.2.7 Correlation functions ..................................................................................... 26
2.3 Buffers and solutions ............................................................................................ 28 2.4 RNase H biochemical procedures ........................................................................ 28
2.4.1 Construction of the double-cysteine mutant of RNase H.............................. 28 2.4.1.1 Primers for site-directed mutagenesis and plasmid sequencing ............. 28 2.4.1.2 Site-directed mutagenesis ....................................................................... 29 2.4.1.3 Competent cells ...................................................................................... 30 2.4.1.4 Transformation of E. coli with a mutated plasmid ................................. 30 2.4.1.5 Saving and characterization of colonies ................................................. 31
2.4.2 RNase H expression and purification ............................................................ 31 2.4.2.1 Bacteria growth....................................................................................... 31 2.4.2.2 Purification of RNase H ......................................................................... 31
2.4.3 Activity assay ................................................................................................ 32 2.4.3.1 RNA-DNA hybrid .................................................................................. 32 2.4.3.2 Enzyme kinetics in dilute solution ......................................................... 32 2.4.3.3 Measurement of activity ......................................................................... 33
2.4.4 Label conjugation .......................................................................................... 33 2.4.4.1 For testing specific/unspecific adsorption of RNase H onto surfaces. ... 33 2.4.4.2 For FRET measurements ........................................................................ 35
2.5 eqFP611 biochemical procedures......................................................................... 35 2.6 Preparation of glass surfaces ................................................................................ 35
2.6.1 Cleaning and aminosilanization of glass coverslips ...................................... 35 2.6.2 Protein-based surfaces ................................................................................... 36 2.6.3 Linear PEG surfaces ...................................................................................... 36
2
2.6.4 Cross-linked PEG surface.............................................................................. 36 2.6.5 Immobilization of biotinylated target molecules on surfaces........................ 37
2.7 Linear extrapolation method for protein denaturation.......................................... 37 2.8. Interpretation of FRET efficiency values ............................................................ 38
3 Results ......................................................................................................................... 41 3.1 Resistance of the surfaces to unspecific protein adsorption ................................. 41
3.1.1 Protein-based surfaces ................................................................................... 42 3.1.2 PEG-based surfaces ....................................................................................... 42
3.2 Protein structure on biocompatible surfaces......................................................... 44 3.2.1 Folding/unfolding of immobilized RNase H................................................. 44 3.2.2 Fluorescence brightness of eqFP611 ............................................................. 47
3.3 Irreversible denaturation of eqFP611 with GdmCl .............................................. 48 3.4 Thermodynamics and kinetics of RNase H folding/unfolding............................. 49
3.4.1 Free energies of the folded and unfolded states ............................................ 49 3.4.2 Sizes of the folded and unfolded states ......................................................... 53 3.4.3 Reorientation times of the dyes attached to RNase H ................................... 54 3.4.4 Rates of conformational changes................................................................... 57
3.4.4.1 Transitions between states ...................................................................... 57 3.4.4.2 Reconfiguration of the unfolded protein chain....................................... 59
3.4.5 Modeling dynamic heterogeneity of the unfolded state ................................ 60 3.4.5.1 Data......................................................................................................... 60 3.4.5.2 Model...................................................................................................... 61 3.4.5.3 Results .................................................................................................... 62
3.4.6 Modeling the expansion of the unfolded state............................................... 62 3.4.6.1 Data......................................................................................................... 62 3.4.6.2 Model...................................................................................................... 63 3.4.6.3 Results .................................................................................................... 65
3.5 Enzymatic function of RNase H on cross-linked PEG surfaces........................... 66 4 Discussion.................................................................................................................... 69
4.1 Biocompatible surfaces......................................................................................... 69 4.1.1 Surface architecture and resistance to protein adsorption ............................. 69
4.1.1.1 Protein-based surfaces ............................................................................ 69 4.1.1.2 PEG-based surfaces ................................................................................ 70
4.1.2 Protein structure on surfaces ......................................................................... 72 4.1.2.1 Protein-based surfaces ............................................................................ 72 4.1.2.2 PEG 5000................................................................................................ 73 4.1.2.3 Cross-linked PEG ................................................................................... 75
4.2 Single-molecule conformational dynamics of RNase H under denaturing conditions ................................................................................................................... 76
4.2.1 Expansion of the unfolded state .................................................................... 76 4.2.2 Structural heterogeneity of the unfolded state............................................... 79 4.2.3 Origin of the structure in the unfolded state .................................................. 80 4.2.4 Folding free energy landscape under denaturing conditions ......................... 81
4.3 Exploration of folding energy landscape by single-molecule spectroscopy ........ 83 4.3.1 Past (… − 2000)............................................................................................ 84 4.3.2 From 2001 to 2005 ........................................................................................ 84 4.3.3 Outlook .......................................................................................................... 86
Bibliography ................................................................................................................... 87 Summary....................................................................................................................... 108 Zusammenfassung ........................................................................................................ 111 Curriculum Vitae .......................................................................................................... 114

3
List of publications ....................................................................................................... 115 List of posters ............................................................................................................... 116 Acknowledgements ...................................................................................................... 118

4
1 Introduction
1.1 Why study protein folding?
Earth began as one of many inanimate planets some 4.6 billion years ago. However, one billion years later it was already abound with prokaryotes, the ancestors of all known living things. Today we can find life everywhere on Earth: from the highest mountains to the deepest ocean trenches. We still do not know how life did start but we do know that without proteins life, as we know it now, would be impossible. Proteins catalyze chemical reactions; they provide structure and support, generate movements; they are responsible for defense against invaders and protection in case of injuries; proteins regulate cellular functions; they store and transport substances and so on and so forth. From the chemical point of view, proteins are linear polymers synthesized from 20 different monomers called amino acids (Fig. 1.1a). Because of local interactions, segments of the polypeptide chain form elements of the so-called secondary structure: α-helices and β-sheets (Fig. 1.1b). Then, the protein chain must further organize itself in a specific 3-D structure (Fig. 1.1c). It is literally the case for proteins that the function is determined by the shape. The grooves and clefts, channels and cavities, of the right size and in the right place allow the protein to recognize its particular co-reactant and to accomplish its individual biological function.
(a)
(b)
(c)
(i) (ii)
Figure 1.1: Different levels of protein structure. (a) Primary structure is a sequence of amino acidsconnected via peptide bonds. Peptide bonds have partial double-bond properties making them rigid andplanar. R are side chains of amino acids. The rectangle represents a planar peptide unit. ψ and ϕ are angleswhich can be rotated. (b) A cartoon representation of the fundamental elements of the secondary structure:α-helix (i) and β-hairpin (ii). (c) An example of tertiary structure. Myoglobin consists of 8 α-helices tightlypacked together. They form a pocket where a heme group (shown in black) is bound. PDB entry 1MBN.

5
The protein native fold is stabilized by several forces: (i) hydrogen bonds; (ii) specific electrostatic interactions such as salt bridges and dipole-dipole alignment; (iii) van der Waals interactions; and (iv) the hydrophobic effect, which is the tendency of the system to minimize the area of interaction between water and non-polar groups by burying the latter in the tightly-packed core of the folded protein. A large free energy gain of the folded state is opposed by a huge loss of conformational entropy of the protein backbone and side chains, whose motional freedom is severely restricted in the native conformation as compared to the loose unfolded protein. The main origin of the entropy loss is the excluded volume effect, i.e., large movements in the folded state are suppressed by steric hindrance between tightly packed segments of the protein chain. Although each factor contributing to the protein stability can be very large, the free energy difference between the stabilizing interactions and the loss of conformational entropy is relatively small, 5 – 20 kcal/mol, which comparable to the energy of a few hydrogen bonds. This makes proteins only marginally stable and they easily unfold once taken out of their optimal conditions. Variation in pH, temperature or pressure, adding high concentrations of salts or chemical denaturants, such as urea or guanidinium chloride (GdmCl) decrease the protein stability and are routinely applied to investigate the physical principles governing protein folding. However, protein folding is not a merely academic problem. Misfolding of proteins is involved in the pathogenesis of diseases such as BSE, CJD, and Alzheimer’s disease (1). Understanding of folding is an important issue in the de novo design of proteins and peptides with novel functions (2). Furthermore, since the human genome has been sequenced, the prediction of protein folds from the primary amino sequence becomes the next grand challenge (3). So, how does a protein fold? For many proteins, folding is spontaneous1 and reversible. That means that all the information of how to find a unique conformation that enables biological function of the protein is encoded in the primary amino sequence of the protein (Anfinsen’s dogma) (4, 5). Therefore, once we know the Hamiltonian of the interactions of all amino acids with each other and with solvent molecules, we are able to calculate the energies of all conformational states of the protein. However, proteins are macromolecules consisting of thousands of atoms! Let us consider a very small protein of 50 amino acids. Amino acids in a chain are connected via peptide bonds; for every peptide bond, there are 2 dihedral angles, which can rotate (Fig. 1.1a). Now, let us take 3 available angles for every rotating link, which means that there exist 950 conformations for this particular protein. If the protein would search randomly for the state with the lowest energy, and assuming that every rotation requires 1 picosecond, the protein would need 1028 years to find its native structure, much longer than the age of the universe (1010 years). This paradox, first formulated by Cyrus Levinthal, was partly solved by him by postulating that proteins fold through succession of intermediate states (6, 7). Such series of discrete intermediates are indeed detected and classified (8). However, the central question remained: how does folding start? (How can the first intermediate be found?) Furthermore, a new question arose: is there only one single folding track or are there parallel pathways? In the late 80s, a new conception of protein folding based on the theory of spin glasses was developed (9, 10). A protein is considered as a random heteropolymer with energy biased towards the native structure. The protein is assumed to consist of a finite but very large number of units. This allows transition from the calculations of exact interactions to a stochastic Hamiltonian with only a few generalized parameters (average interaction 1 In a cell, protein folding is often aided by chaperones. Their role is likely to protect a newly synthesized protein chain from aggregation with other proteins and to expedite proline cis/trans isomerization.

6
energy, variance of interaction energies, similarity to the native state etc.). Fig. 1.2a illustrates main features of the energy landscape for the protein folding obtained with this statistical approach (11, 12). The shape of the landscape resembles a rough funnel. The native structure, which, to be precise, is an ensemble of slightly different native structures (13) (Fig. 1.2b), has the lowest energy and multitudes of unfolded conformations are at the top of the funnel. As the folding proceeds, the loss of entropy due to the decrease in number of available conformations (represented by the width of the funnel) is compensated by the energy gain due to molecular interactions. Many local minima on the energy surface represent intermediates, misfolded states and kinetic traps in the folding process. For the overall folding kinetics to be exponential and fast, the slope to the native state must be large relative to the ruggedness of the landscape (14).
1.2 Why study folding on the single-molecule level?
Protein motions extend over a wide range of time scales: from local librations of the amino residues on the order of picoseconds to reorganizations on the late stages of the folding, which can be as slow as minutes and hours. Because of these experimental timescales, it is unfeasible to study protein folding with only one single method. Numerous techniques have been developed in order to cover the enormous time span. Quite recently, the significant progress in scanning-probe and optical microscopies has made it possible to investigate structure and dynamics of proteins on the level of individual molecules (15-17). Protein folding is an intrinsically heterogeneous process. It can be described as a Brownian diffusion on a rough free energy landscape. Driven by thermal fluctuations, molecules jump from one conformational state to another, and there exists a huge
Conformational coordinate
Ene
rgy
Conformational coordinate
Ene
rgy
(b) (a)
Figure 1.2: Energy landscape of protein folding. (a) Folding funnel. (b) Enlarged view of the energyprofile of the native state: it consists of many slightly different conformations.

7
number of possible pathways from the manifold of unfolded conformations to the smaller set of native states. Conventional techniques measure signals averaged over a large ensemble of molecules. To measure folding kinetics on an ensemble of proteins, all molecules have to be synchronized. The first step typically is to homogenize the system by preparing the protein solution in conditions where only one state is populated (for example, all protein molecules are either folded or unfolded). In the second step, the system must be brought out of equilibrium by, for example, temperature or pressure jumps or by rapid mixing with a new solvent. Then, relaxation kinetics of the system to a new equilibrium is measured. However, since every protein may take a different route to the equilibrium and each protein was in a slightly different initial state, the synchronization is rapidly lost. As a result, the complex nature of the folding becomes hidden in the observed mono- or multi-exponential process, which is interpreted as a transition from one unfolded to one folded state with up to three discrete intermediates (18-26). In contrast to bulk experiments, observing the folding/unfolding transitions on the level of individual molecules allows us to directly resolve the heterogeneity of the folding pathways and disclose intermediate states even if they are only transiently and incoherently populated (27). Another important advantage of the single molecule approach is the tiny amount of sample required for the experiments. This is a crucial point for drug screening assays in the pharmaceutical industry (28). For protein folding, very dilute protein solutions (on the order of 1 or less molecules per femtoliter) allow control over protein aggregation, which can occur when unfolded protein coil is quickly placed in native conditions. If this aggregation is reversible, it can be mistaken for transient folding intermediate states (29, 30).
1.3 FRET as a spectroscopic ruler to study biomolecules
In this work, we employed single-molecule fluorescence resonance energy transfer (FRET) spectroscopy to study structural states of proteins. FRET is a nonradiative process by which the excitation energy can be passed from a fluorescent donor molecule (D) to an acceptor chromophore (A) over distances of typically 10 – 100 Å. The mechanism of the transfer is based on a dipole-dipole interaction of the donor and acceptor, and was first described by Förster over 50 years ago (31). Stryer and Haugland experimentally confirmed that the energy transfer rate is proportional to the inverse sixth power of the distance between the chromophores (32), as predicted by Förster. Due to this strong distance dependence of the process, FRET is often called a spectroscopic ruler (32). Because the FRET sensitivity range is comparable to the typical dimensions of biological macromolecules, FRET is extensively utilized to study their interactions and conformational changes (33-37). A typical FRET experiment to investigate protein folding (27, 38-44) is depicted in Fig. 1.3. In Fig. 1.3a, we see a protein in its native conformation. It is specifically labeled with 2 chromophores so that the donor and the acceptor are very close to each other. Upon laser excitation of the donor, the excitation energy passes to the acceptor and, consequently, one sees the acceptor emission, and very little or no fluorescence from the donor is observed. Fig. 1.3b shows the protein in its unfolded state (e.g., induced by a denaturing salt in the solution). In this case, the average donor-acceptor distance is increased and the energy transfer is less effective, which is reflected in the enhancement of the donor fluorescence and anticorrelated drop of fluorescence intensity from the acceptor.

8
The efficiency of the energy transfer, E, is calculated from the measured fluorescence intensities of the donor, ID, and the acceptor, IA, according to
( )DA
A
I + I IE =
γ. (1.1)
Its dependence on the distance between the dyes, r, is given by
60 )/(1
1 Rr
E+
= . (1.2)
Here γ is an experimental correction factor for the different detection efficiencies and the quantum yields of the dyes, and R0 is the so-called Förster distance, which is calculated form the spectral properties of the dyes (45),
( ) 6/124230 1079.8 κφ JnR D
−×= , (1.3)
here n is the refractive index of the media; φD is the quantum yield of the donor, J is the overlap integral of the donor fluorescence, FD, and the acceptor absorbance, εA, spectra as functions of the wavelength, λ,
∫∫−=
λ
λλε
dF
dFJ
D
AD4
2810 , (1.4)
and κ2 is the orientation factor, ( )θ=κ ADT
22 coscos3-cos θθ , (1.5)
where θT is the angle between the donor emission dipole and the absorption dipole of the acceptor; and θD and θA are the angles between the donor or, respectively, the acceptor dipole and the vector connecting the donor to the acceptor (45) (Fig. 1.4). In solution, the rotation of small dye molecules occurs on the picosecond time scale, much faster than the fluorescence lifetime of 1 – 2 ns (46). In this case, κ2 averages to ⅔ (45). However, the motion of the dyes attached to a protein can be sterically hindered,
Figure 1.3: Protein folding examined by FRET. (a) A protein is in the compact, structured nativeconformation. The donor (D) and the acceptor (A) probes are introduced in the protein sequence so thatthey are in the close proximity to each other. A light source excites the donor. The excitation energy istransferred to the acceptor (FRET). The acceptor fluoresces. (b) The protein is unfolded. The distancebetween the donor and the acceptor is enlarged and, consequently, the energy transfer is impaired.Accordingly, the fluorescence from the donor is increased and from the acceptor is decreased.
(b) (a)

9
and κ2 can vary between 0 and 4. Therefore, a careful characterization of the dyes mobility is required to relate the FRET efficiency values to the distance between the dyes, and thus to the protein conformation.
1.4 Why we need to immobilize proteins on biocompatible surfaces
In recent years, single-molecule FRET analysis has been applied to proteins diffusing in solution (42-44). However, it takes only about 1 ms to diffuse through the femtoliter-sized volume of the single-molecule detection, which is usually a too short to observe transitions between folded, unfolded and/or intermediate states. To study such slow processes, the molecules have to be fixed in space, for example, by trapping them in pores of polymer matrixes (47-49), unspecific adsorption to glass surfaces (50, 51), specific adsorption via charge interactions (52, 53), by complex coordination of histidine tags added to the protein sequence (54, 55), or by using biotin/(strept)avidin coupling (56-58). However, immobilization bears the risk of uncontrolled interactions between the protein of interest and the supporting material. In this case, it is difficult to separate the intrinsic properties of the studied molecules from the artifacts because of these unwanted interactions, especially, in separating the heterogeneity of the folding pathways from the heterogeneity of the environment. An elegant solution to this problem has been shown by Haran and co-workers (27, 59, 60). They trapped proteins in 100-nm lipid vesicles, which can then be tethered to surfaces by a biotin-streptavidin linkage. The diameter of the vesicles, although very small compared with the optical resolution, is much larger than the diameter of the proteins, and the latter can freely diffuse inside them. The disadvantage of this approach, however, is that it is difficult to change the solvent conditions inside the vesicles in situ. In this work we focus on the design of biocompatible surfaces which permit easy protein immobilization, quick solvent exchange and which do not interfere with the protein functionality. Such surfaces are also of high importance in biomedical applications, e.g. protein microarrays (61-65). Schematic representations of the biocompatible surfaces that were studied in this work are portrayed in Fig. 1.5. We considered two classes of biocompatible surfaces: protein-based surfaces, and poly(ethylene glycol) (PEG) based surfaces. The surfaces were decorated with biotins, so that biomolecules of interest can be attached to the surfaces
Figure 1.4: Orientation of the donor and acceptor transition dipoles, pD and pA, respectively. R is the vectorconnecting the donor and the acceptor. The dotted arrow shows a vector parallel the acceptor dipole. θD isthe angle between the donor emission dipole and R, θA is the angle between the acceptor adsorption dipoleand R, and θT is the angle between the donor and acceptor dipoles.

10
(b)(a)
(d) (c)
(f) (e)
via a biotin-streptavidin linkage (Fig. 1.5f), which has a high association constant Ka ~ 1015 M-1 and a dissociation time of several tens of hours. Furthermore, the native structure of streptavidin and the biotin-streptavidin complex are stable even in 6 M GdmCl (66, 67). Streptavidin has 4 binding sites for biotin. One or more of them are occupied to bind streptavidin to the surface and the others are used attach biotinylated proteins of interest. We systematically analyzed our surfaces according to the following criteria (68): (i) homogeneity of coverage, (ii) resistance to unspecific protein adsorption, and (iii) ability to preserve the native fold and functionality of the specifically bound proteins.
Figure 1.5: Surface preparations studied in this thesis. (a) Protein adsorption on bare glass. (b) Proteincoupling via amide bonds to an aminosilane-functionalized glass surface using EDC. (c) Bonding of linearPEG onto amino-functionalized glass. (d) Binding and cross-linking of star-shaped PEG molecules onamino-activated surface. (e) Two-layer surface: linear PEG on top of the cross-linked BSA layer. (f)Immobilization of the probe protein via biotin-streptavidin linkage.
11
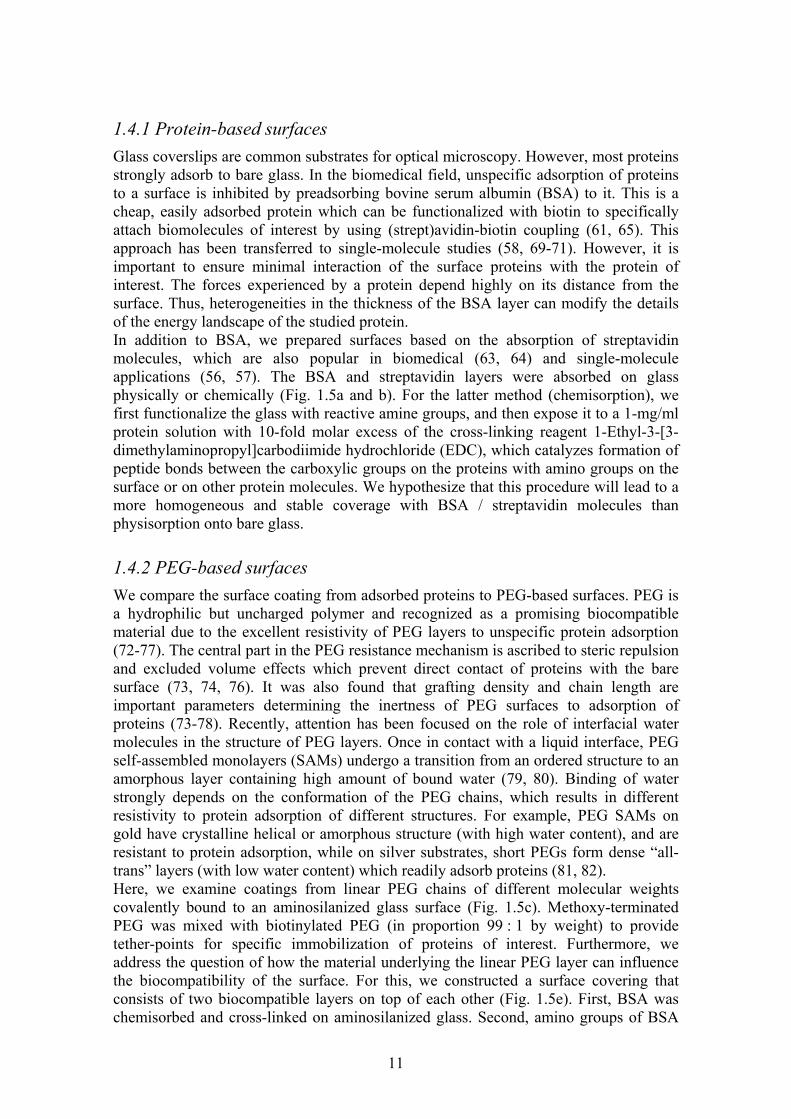
1.4.1 Protein-based surfaces Glass coverslips are common substrates for optical microscopy. However, most proteins strongly adsorb to bare glass. In the biomedical field, unspecific adsorption of proteins to a surface is inhibited by preadsorbing bovine serum albumin (BSA) to it. This is a cheap, easily adsorbed protein which can be functionalized with biotin to specifically attach biomolecules of interest by using (strept)avidin-biotin coupling (61, 65). This approach has been transferred to single-molecule studies (58, 69-71). However, it is important to ensure minimal interaction of the surface proteins with the protein of interest. The forces experienced by a protein depend highly on its distance from the surface. Thus, heterogeneities in the thickness of the BSA layer can modify the details of the energy landscape of the studied protein. In addition to BSA, we prepared surfaces based on the absorption of streptavidin molecules, which are also popular in biomedical (63, 64) and single-molecule applications (56, 57). The BSA and streptavidin layers were absorbed on glass physically or chemically (Fig. 1.5a and b). For the latter method (chemisorption), we first functionalize the glass with reactive amine groups, and then expose it to a 1-mg/ml protein solution with 10-fold molar excess of the cross-linking reagent 1-Ethyl-3-[3-dimethylaminopropyl]carbodiimide hydrochloride (EDC), which catalyzes formation of peptide bonds between the carboxylic groups on the proteins with amino groups on the surface or on other protein molecules. We hypothesize that this procedure will lead to a more homogeneous and stable coverage with BSA / streptavidin molecules than physisorption onto bare glass.
1.4.2 PEG-based surfaces We compare the surface coating from adsorbed proteins to PEG-based surfaces. PEG is a hydrophilic but uncharged polymer and recognized as a promising biocompatible material due to the excellent resistivity of PEG layers to unspecific protein adsorption (72-77). The central part in the PEG resistance mechanism is ascribed to steric repulsion and excluded volume effects which prevent direct contact of proteins with the bare surface (73, 74, 76). It was also found that grafting density and chain length are important parameters determining the inertness of PEG surfaces to adsorption of proteins (73-78). Recently, attention has been focused on the role of interfacial water molecules in the structure of PEG layers. Once in contact with a liquid interface, PEG self-assembled monolayers (SAMs) undergo a transition from an ordered structure to an amorphous layer containing high amount of bound water (79, 80). Binding of water strongly depends on the conformation of the PEG chains, which results in different resistivity to protein adsorption of different structures. For example, PEG SAMs on gold have crystalline helical or amorphous structure (with high water content), and are resistant to protein adsorption, while on silver substrates, short PEGs form dense “all-trans” layers (with low water content) which readily adsorb proteins (81, 82). Here, we examine coatings from linear PEG chains of different molecular weights covalently bound to an aminosilanized glass surface (Fig. 1.5c). Methoxy-terminated PEG was mixed with biotinylated PEG (in proportion 99 : 1 by weight) to provide tether-points for specific immobilization of proteins of interest. Furthermore, we address the question of how the material underlying the linear PEG layer can influence the biocompatibility of the surface. For this, we constructed a surface covering that consists of two biocompatible layers on top of each other (Fig. 1.5e). First, BSA was chemisorbed and cross-linked on aminosilanized glass. Second, amino groups of BSA

12
molecules were reacted with linear PEG molecules. The main differences between one- and two-layer surfaces are the charge and the hydrophobicity under the PEG layer: aminosilanized glass is strongly positively charged and hydrophilic, whereas BSA molecules compensate the positive charge by the negative charge of the carboxylic groups and also can expose hydrophobic side chains upon surface-induced denaturation. Additionally, we compare linear PEG with cross-linked PEG surfaces. For this, we use a six-arm star-shaped PEG (Fig. 1.5d). Numerous end-functionalizations of PEGs have been developed to attach them to surfaces (83) and biomolecules (84, 85). Here, we employed isocyanate groups at the ends of the PEG arms for binding to amine groups on the glass surface and for inter-molecular cross-linking. At the same time, a small fraction of isocyanate groups were biotinylated by reacting with biocytin to enable specific protein immobilization. In the present studies, we will show that this easily applicable surface coverage from cross-linked PEG satisfies all the criteria of the biocompatibility for protein immobilization: homogeneity, resistance to unspecific adsorption, and practically no difference between functional characteristics of the immobilized and the free proteins.
1.5 Model proteins
The main topic of the thesis is a small enzyme Ribonuclease H, which is a model protein for studies of protein folding dynamics and is used here to (i) explore various surfaces for their biocompatibility and (ii) to elucidate the protein folding mechanistic details. In order to probe whether the observed characteristics of the surfaces are applicable to other proteins, we also study them with a naturally occurring fluorescent protein eqFP611, a protein which has very different chemical and structural properties from Ribonuclease H.
1.5.1 Ribonuclease HI Ribonuclease HI (RNase H) is an endonuclease that specifically cleaves an RNA strand hybridized to a complementary DNA strand. RNase H was originally isolated from the calf thymus (86, 87), and subsequently was found in various viruses and a range of organisms from Escherichia coli (E. coli) to humans (88). Despite high sequence and structural homology, physiological roles and importance of RNase H enzymes are quite diverse. It was shown that the RNase H domain of HIV-1 reverse transcriptase is essential for the replication of the viral genomic RNA. However, the role of E. coli RNase H, the protein studied in the present thesis, has not yet been fully clarified. The enzyme appears to be involved in an auxiliary manner in DNA replication and repair (for detailed review see (88)). An important application for E. coli RNase H has been found in antisense technology (Fig. 1.6) (89-93). For example, the recombinant enzyme was chemically coupled to a DNA oligonucleotide complementary to the 5’-noncoding region of the hepatitis C virus (HCV) and then transferred to the cytoplasm2 of infected human liver cells, where it specifically cleaved the target RNA and thus suppressed the expression of HCV-directed marker gene (93).
2 The expression level of their own RNase H in mammalian cells is low and the enzyme is localized in the nucleus. Because the replication of HCV takes place in the cytoplasm, it is necessary to deliver external RNase H there.

13
The E. coli RNase H (EC 3.1.26.4), subsequently referred to simply as RNase H, is a single domain protein consisting of 155 amino acids (94). It is the smallest natural enzyme with RNase H activity. The primary sequence completely encodes the active conformation of the enzyme, since chemical and thermal unfolding of the protein was shown to be fully reversible in vitro (95). For this reason, RNase H is extensively studied as a model for studies of the protein-folding problem (25, 26, 96-105). Fig. 1.7 shows the X-ray structure of RNase H* (a cysteine-free variant of RNase H) (102). The secondary structure is comprised of 5 α-helices and 5 β-sheets.
Figure 1.6: A model for the catalytic cycle of RNase H covalently linked with an antisense DNA oligo. Amessenger RNA encoding a disease-causing protein binds to the complementary DNA oligo. In the nextstep, the RNase H cleaves the RNA. The RNA-DNA duplex becomes unstable and the pieces of destroyedRNA are released in the solution. The hybrid of DNA and RNase H is ready for a new cycle. Figureadopted from Ref. (93).
Figure 1.7: Crystal structure of RNase H* in acartoon view mode. Dark gray shows thefolding core. PDB entry 1F21.
αE
αC
αB
αD
αA
βI
βII
βIII
βIV
βV

14
Equilibrium chemical and temperature denaturation curves of RNase H are described by a 2-state process (only one folded and one unfolded state) (96). However, stopped-flow measurements of folding kinetics reveal an intermediate state, which is formed within the mixing time of the experimental set-up (on the order of a few milliseconds) and then followed by slow reorganization into the native conformation (26). This kinetic intermediate resembles a partially folded state, which can be stabilized at acidic conditions (26, 96). The acid / kinetic intermediate state is compact compared to the unfolded state and has a loosely packed hydrophobic core. It has no defined tertiary structure but helices A and D are already formed (26, 97). Hydrogen exchange experiments showed also that these helices are more stable than the rest of the protein (97). These observations led to the hierarchical model of the folding of RNase H, in which the crucial folding core consists of the central helices of the protein (Fig. 1.7) (98, 99). Recently, based on a detailed analysis of the native state hydrogen exchange data, Parker and Marqusee have demonstrated that there is a continuum of unfolded states rather than a separate single unfolded and single intermediate state (Fig. 1.8) (100, 101). Let us spend more words on this important issue. Speaking about a folded, unfolded or intermediate state, we always refer to a macroscopic state, a set of selected microscopic conformations. States can further be subdivided into (sub)states. The term continuum was used to emphasize that (i) the number of the unfolded substates is very large and (ii) the free energy barriers between them are very small so that there are no abrupt changes in the phase space of the unfolded state (Fig. 1.8b) (100, 101). The first statement rests on the density of states obtained from the hydrogen exchange experiments, which reflect equilibrium properties of the unfolded ensemble. The second statement was concluded from the presence of a fast phase in stopped-flow folding experiments (100). However, distributions of barriers between states on a rough free energy landscape may result in nonexponential relaxation kinetics, which can usually be parametrized by a power law, (1 + kt)−δ, or by a stretched exponential, exp[−(kt)β], 0 < β < 1 (106). Such kinetics expand over many decades on the logarithmic time scale (106) and, when measured in a limited range on the linear time scale, can look like a fast phase followed by a slow decay (Fig. 1.9). Therefore, the height of free energy barriers (if any) in the unfolded state of RNase H may still be an open question.
F
UNU1 . .
‡F
F
U I
‡F
‡ (a) (b)
Figure 1.8: Free energy profiles for folding. (a) Folding through an intermediate (compact unfolded) state.(b) Unfolded state consists of a spectrum of unfolded conformations. U, I, F are the unfolded, intermediate,and folded states, respectively. U1 … UN are the spectrum of unfolded states. ‡ is the transition statebetween the unfolded and the intermediate states, ‡F is the transition state between U1 and F states.

15
Like RNase H, many proteins, for example, myoglobin (23, 24), cytochrome c (18, 20), and SNase (21, 22), apparently fold through rapidly-formed intermediate states with similar properties. They are compact, have some native-like secondary structure and no well-defined (but probably flexible, fluctuating) tertiary structure. Such states are believed to play an important role in protein folding and termed “molten globule” states (107, 108). Thus, the issues, (i) whether there exist separate intermediate (molten globule) and unfolded states, or an unfolded continuum, and (ii) what are the barriers between unfolded conformations, are important for the general concept of protein folding. The main difficulties in the characterization of the unfolded states originate from their enormous heterogeneity and fast rates of interconversion. For this reason, it was formerly believed that denatured proteins were structureless polypeptide coils. However, recent studies have demonstrated the presence of long-range order in unfolded proteins even in the highest-possible concentrations of denaturant (109-113). In our work, we will further focus on the thermodynamic and structural properties of unfolded RNase H, applying the single-molecule approach to reveal details on the free energy landscape that are lost in ensemble experiments.
1.5.2 eqFP611 eqFP611 is a far-red fluorescent protein (FP) from the sea anemone Entacmaea quadricolor (49). eqFP611 belongs to the family of Anthozoan GFP3-like proteins, which have revolutionized life science research. They have become important tools to study complicated networks of cellular processes (for a review see (114, 115)). For example, genetic fusion of fluorescent proteins with various proteins of interest allows non-invasive in vivo monitoring of gene expression and protein localization in the cell. Red-shifted fluorescent proteins have the additional important advantage that the cell auto-fluorescence is lower in the red spectral range, and the red light used to excite red fluorescent proteins can penetrate deeper through tissues due to lower scattering and is less cytotoxic. Furthermore, they can be exploited in multicolor assays, such as co-localization of different components in cellular compartments or detection of molecular interactions by using FRET detection. Moreover, even though eqFP611 like other proteins from GFP family has tendency to form tetramers, at very low concentrations (e.g. molecules sparsely immobilized on surfaces) it exists only as monomeric units (49). This reduced olygomerization tendency is highly beneficial for many applications.
3 GFP is a green fluorescent protein from Aequoria victoria, also called avGFP.
Figure 1.9: A stretched exponential (symbols,y = exp[−t0.4]) measured in a limited windowon the linear time scale may appear as a fastphase (between the first and the second point)followed by a slow exponential decay (line).
0 10 20 30
0.0
0.5
1.0
burst phase
Rel
ativ
e si
gnal
Time
16
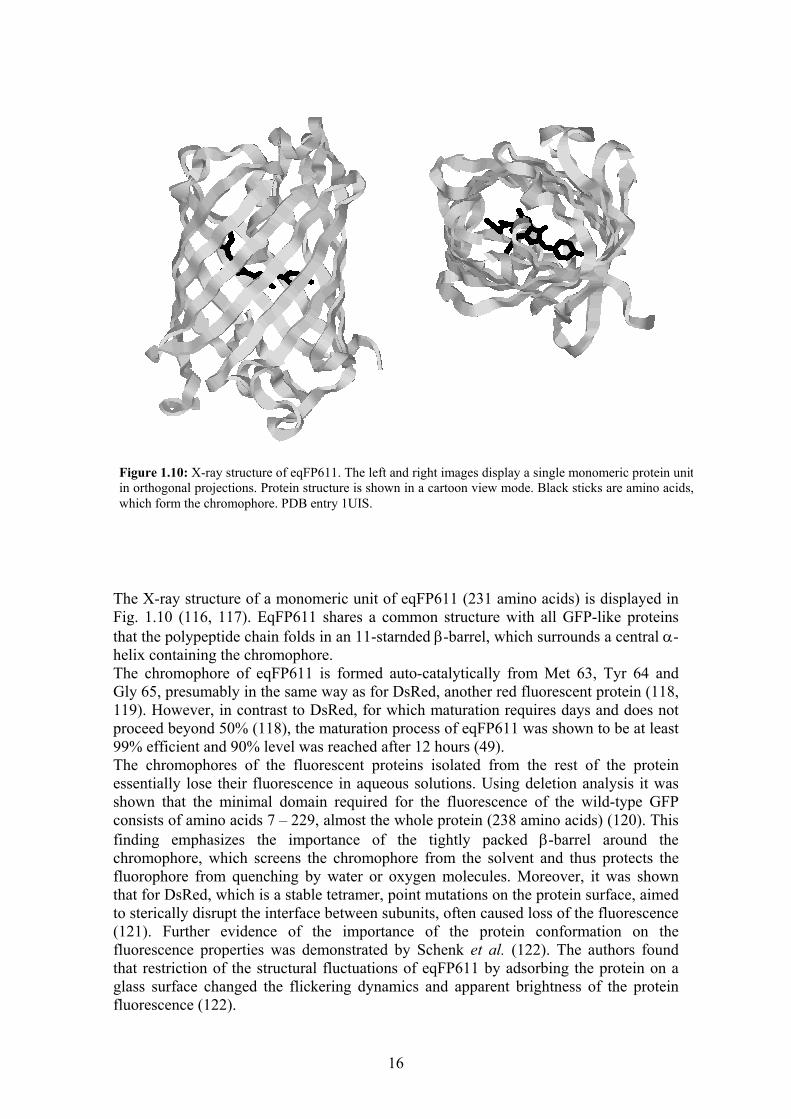
The X-ray structure of a monomeric unit of eqFP611 (231 amino acids) is displayed in Fig. 1.10 (116, 117). EqFP611 shares a common structure with all GFP-like proteins that the polypeptide chain folds in an 11-starnded β-barrel, which surrounds a central α-helix containing the chromophore. The chromophore of eqFP611 is formed auto-catalytically from Met 63, Tyr 64 and Gly 65, presumably in the same way as for DsRed, another red fluorescent protein (118, 119). However, in contrast to DsRed, for which maturation requires days and does not proceed beyond 50% (118), the maturation process of eqFP611 was shown to be at least 99% efficient and 90% level was reached after 12 hours (49). The chromophores of the fluorescent proteins isolated from the rest of the protein essentially lose their fluorescence in aqueous solutions. Using deletion analysis it was shown that the minimal domain required for the fluorescence of the wild-type GFP consists of amino acids 7 – 229, almost the whole protein (238 amino acids) (120). This finding emphasizes the importance of the tightly packed β-barrel around the chromophore, which screens the chromophore from the solvent and thus protects the fluorophore from quenching by water or oxygen molecules. Moreover, it was shown that for DsRed, which is a stable tetramer, point mutations on the protein surface, aimed to sterically disrupt the interface between subunits, often caused loss of the fluorescence (121). Further evidence of the importance of the protein conformation on the fluorescence properties was demonstrated by Schenk et al. (122). The authors found that restriction of the structural fluctuations of eqFP611 by adsorbing the protein on a glass surface changed the flickering dynamics and apparent brightness of the protein fluorescence (122).
Figure 1.10: X-ray structure of eqFP611. The left and right images display a single monomeric protein unitin orthogonal projections. Protein structure is shown in a cartoon view mode. Black sticks are amino acids,which form the chromophore. PDB entry 1UIS.

17
Due to the high rigidity of the β-barrel, fluorescent proteins are very stable towards denaturation and attack by proteases. The disruption of the tertiary structure upon unfolding is rather slow (minutes) and accompanied by the disappearance of the fluorescence. Refolding of the denatured proteins is shown to be multi-exponential and the ability to the recover original fluorescence is dependent on the duration of the denaturation (123-125). In case the of DsRed, however, the denaturation of the protein is irreversible because of the cleavage of the unprotected chromophore by attack of solvent water molecules, resulting in the disconnection of the protein chain into 2 separate parts (118). In the present thesis we evaluate the influence of different biocompatible surfaces on the conformation of eqFP611 in order to provide a solid base for single-molecule studies of immobilized fluorescent proteins, which have become very topical at present (122, 126-129).

18
2 Materials and methods
2.1 Ensemble absorption and fluorescence spectroscopy
2.1.1 Setup Absorption spectra were recorded on a Cary 1E spectrophotometer (Varian, Darmstadt, Germany). Fluorescence excitation and emission spectra were measured on a SPEX Fluorolog II spectrofluorometer (Spex Industries, Edison, NJ). The emission was collected at a 90° angle to the direction of the excitation light. For fluorescence polarization experiments, polarization filters were inserted in the excitation and detection paths. All spectra were baseline-corrected for absorption/fluorescence and light scattering arising from solvents and sample holders used for measurements.
2.1.2 Concentration measurements Concentrations of biomolecules and dyes in solution were calculated by their absorbance according to Beer-Lambert Law,
A(λ) ≡ log10 (I0 / I) = ε (λ) l c , (2.1) where A is the measured absorbance, which is a logarithm of the ratio of the initial light intensity, I0, to the intensity of the light after it passes through the sample, I; λ is the wavelength at which the light intensity is measured; ε (λ) is the wavelength-dependent molar absorptivity (extinction coefficient); l is the pass length (thickness of a sample); and c is the analyte concentration in M.
2.2 Single-molecule fluorescence microscopy
2.2.1 Setup To Microscopy Lab4 Среди болтов, проводов и линз, Сминая собственный скептицизм, И в полной тьме Ищу я свет не далёких звёзд, Смотря сквозь фильтры не цвета грёз – Так нужно. Мне.
Fig. 2.1 outlines the arrangement of our confocal scanning microscopy system, which is based on a Zeiss Axiovert 135 TV (Jena, Germany) inverted microscope. Two lasers can be used to excite fluorescent probes in a sample. If not otherwise stated, the “green” excitation was provided by the 514 nm line of an Ar+/Kr+ ion laser (modified model 164, Spectra Physics, Mountain View, CA). In some experiments we utilized the 532-nm light from a diode-pumped Nd-YAG laser instead (Laserlight Showdesign, Berlin, Germany). For the “red” excitation, we employed the 633 nm line of a He-Ne laser (model 159, Spectra Physics, Mountain View, CA). The lasers could
4 Between holders, wires and lenses,//crushing my own skepticism,// and in complete darkness,// I am searching for the light not from faraway stars// looking through filters not of the daydream’s color.// It is necessary. For me.

19
be used simultaneously or alternately, which was controlled by the shutters S1 and S2 connected to a computer via a LPT port. The laser beams were superimposed with a semitransparent beam splitter (Edmund Opitcs, Barrington, NJ) and conveyed to the microscope via a single-mode fiber (OZ Optics, Ottawa, Canada) that serves also as a spatial filter providing a nearly gaussian intensity profile of output light (130). The intensity of the excitation light was measured at the entrance to the microscope by introducing a flippable mirror M1, which reflected the light to a power meter. The output of the lasers was usually attenuated to supply ~5 µW for measurements on immobilized single molecules or to ~50 µW for measurements on diffusing molecules in solution.
Figure 2.1: The setup for single-molecule confocal scanning microscopy. The standard FRETconfiguration is shown in black color. The gray color marks the arrangement for the polarizationmeasurements or the objects to be inserted temporarily during the adjustments. Abbreviations: BS – beamsplitter, D – detector, DM – dichroic mirror, F – filter, L – lens, M – mirror, P – pinhole, PC – polarizationcube, PM – power meter, S – shutter, WP – wave plate.

20
(a) (b) (c)
In the microscope, the parallel excitation light beam is reflected by a dichroic mirror DM1 (532/633DCXR, AHF, Tübingen, Germany) and focused to a diffraction-limited spot in a sample by means of an infinity-corrected, water-immersion objetive (C-Apochromat 63x/1.2W, Zeiss). Reflection of the light at the dichroic mirror causes a slight distortion of the initially circular polarization of the fiber output. For the single-molecule polarization measurements, this distortion was corrected by a variable wave plate WP (New Focus, San Jose, CA) inserted between the fiber and the microscope entrance. The sample was fixed onto a piezoelectric scanning stage with a feedback control (model P-731.20, Physik Instrumente, Karlsruhe/Palmbach, Gremany), which could be moved by the computer in two dimensions orthogonal to the optical axis of the objective. The emitted fluorescence photons from the sample were collected through the same objective, transmitted through the dichroic mirror DM1 and focused with a tube lens (L1) of the microscope onto a confocal pinhole P (diameter 80 µm). The photons emitted by molecules out of the focal plane in the sample are rejected by the pinhole (Fig. 2.2), thus improving the signal-to-noise ratio.
Figure 2.2: Principle of confocal microscopy. Excitation light (blue) is focused with an objective onto asample. Emission from the sample (red; overlap of blue and red shown in violet) is collected through thesame objective and then converged with a tube lens. A pinhole is placed in the focus plane of the tube lens.Light from the focal plane of the objective is imaged onto the pinhole and therefore gets through to thedetectors (b). Light from below (a) or above (c) the focal plane of the objective is imaged behind or in frontof the pinhole, respectively, and thus is rejected.

21
To identify the plane of interest in the sample, we monitored the bright reflection spots of the excitation on the glass/water interfaces. For this, a built-in sliding mirror of the microscope M2 could be inserted in the light path to redirect the reflected excitation light (even significantly suppressed by DM1) to a CCD camera (DMK 3002/C, DBS, Bremen, Germany). After the pinhole, the collected light was collimated by a lens L2 and split into “green” and “red” channels by a dichroic mirror DM2 (650DCXR-U, Chroma, Rockingham, VT). To refine the spectral selectivity of the channels and further suppress scattered excitation light, a band pass filter F1 (HQ582/50, AHF) and a long pass filter F2 (HQ665LP, AHF) were inserted into the green and the red channel, respectively. Photons in each channel were focused with lenses L3 and L4 onto the sensitive areas of avalanche photodiodes D1 and D2 (SPCM-AQR-14, Perkin-Elmer, Wellesley, MA). Their output signals were registered in a homebuilt photon-counting card interfaced to the same computer that also controlled the piezoelectric scanner and the shutters. Fig. 2.3 shows the overall transmission spectra of the green and the red channels overlaid with fluorescence spectra of the dyes used in this work for the FRET experiments: the donor, Alexa Fluor 546 and the acceptor, Alexa Fluor 647. We see that a part of the donor emission is also detected in the red (acceptor) channel. This effect is called cross-talk, and must be corrected during the analysis of the data. For polarization measurements, the detection path was modified after the pinhole: the light was first filtered with the HQ582/50 or HQ665LP filter (F) for Alexa Fluor 546 or Alexa Fluor 647, respectively, and then split into two channels X and Y with a polarization cube PC.
550 600 650 700 7500
20
40
60
80
100
0
20
40
60
80
100 T
rans
mis
sion
, %
Fluo
resc
ence
, a.u
.
Wavelength, nmFigure 2.3: Fluorescence spectra of the dyes and transmission functions of the detection channels. Thefluorescence of the donor (Alexa 546) and the acceptor (Alexa 647) are shown in thick green and red lines,respectively. The thin lines with filled area underneath are transmission functions of the green and the redchannels. The part of the donor fluorescence passes to the detector in the red channel. This effect is calledcross-talk.

22
2.2.2 Sandwich cell The sample holder for the single-molecule measurements was typically a sandwich cell prepared as shown in Fig. 2.4 (58). Two pieces of double-sided adhesive tape were fixed on a larger glass coverslip (24 × 32 mm2) so that the space between the pieces forms a channel with a width of ~2 mm. A smaller glass coverslip (20 × 20 mm2) is then fixed on the top of the construction. The measurements were performed in the channel. The typical volume of such a channel is 4 µl; its height is about 100 µm.
2.2.3 Software The development and support of the data acquisition and processing software was a part of the present PhD thesis. The software was written and compiled with Microsoft Visual C++ 6.0. The software included: confocal imaging, recording of fluorescence time traces, recording of photon counting histograms with simultaneous scanning through the sample, evaluation of distribution of individual molecules from the scanned images, calculation of correlation functions from the recorded fluorescence time traces, statistical analysis of FRET transitions from the single molecule fluorescence time traces and global fitting of the expansion of the unfolded state. Further analysis was performed with Origin 6.1 package.
2.2.4 Measurements protocols
2.2.4.1 Imaging
“Images” show the spatial distribution of the emission from a specific area of the sample (Fig. 2.5). They were obtained by measuring the fluorescence at different positions of the excitation light relative to the sample, which was moved by a voltage applied to the piezo-stage on which the sample sits. Typical images were scans of 18 x 18 µm2 with 128 x 128 pixel resolution. The sample positions were actively controlled by the feedback loop of the piezo-stage. An amount of dynamic scanner hysteresis was dependent on the speed of scanning. To circumvent this hysteresis, all lines were scanned in the same direction (from left to right). Every pixel of an image contains information about the number of photons collected from the sample in each detection channel during a fixed integration time (usually 5 ms). Because our measurements are limited by the optical resolution, even a single fluorescent molecule, which can be considered as a point light source, is imaged as a spot with a diameter on the order of 500 nm, 3 – 4 pixels at the typical scan resolution.
2.2.4.2 Recording of fluorescence time traces
First, the program scans an area of the sample to find positions of fluorescent molecules of interest. The scanning procedure is performed as described above, but lines in an image are scanned in alternating directions (from left to right and from right to left) in order to establish absolute coordinates despite the hysteresis of the piezo-stage. After the image has been recorded, the scan is smoothed by averaging 3 x 3 pixels and
Figure 2.4: A sandwich cell.
Figure 2.5: A scanned image.

23
molecules are identified as local maxima of the fluorescence signal. Further, the molecules are sorted according to their brightness and, if necessary, desired FRET efficiency. For each chosen molecule, the program moves the scanner to place the molecule’s center in the focus of the excitation light and records the fluorescence signal in the green and/or red channels until the molecule bleaches (the countrate drops below a specified threshold). Time traces of fluorescence are recorded with user-defined time resolutions down to 1 µs. An example of such fluorescence time traces is presented in Fig. 2.6 (top). Additionally, during the recording of time traces, the program can close and open shutters for different excitations according to a user-defined protocol.
2.2.5 Intensity corrections for the analysis The intensity values used in the analysis are derived from the measured intensities by the following corrections: (i) subtracting background fluorescence, which comes from light scattering, autofluorescence of glass, and weakly fluorescent contaminations in solution; (ii) subtracting the cross-talk of the green dye emission to the red channel; (iii) multiplying of the red channel by the factor 1/γ to correct for different detection efficiencies and different quantum yields of the green and red dyes. With the last correction, Eq 1.1 relating FRET efficiency, E, to the donor and acceptor signals, ID and IA, simplifies to E = IA / (IA + ID). The details of the intensity corrections are explained below.
Figure 2.6: Trace analysis. Top: raw data measured in the donor (I1, green) and the acceptor (I2, red)detection channels. Middle: corrected donor (ID) and acceptor (IA) signals. Bottom: calculated FRETefficiency. Green and red circles mark bleaching events of the donor and the acceptor, respectively. Bluecircles mark a sudden change of the FRET efficiency value.

24
2.2.5.1 Images
For images, the level of background fluorescence can be determined by measuring the average fluorescence intensity from (a) a sample without/before adding fluorescent molecules, (b) from the average intensity of the sample between fluorescent molecules, or (c) from the fluorescence intensity distribution of the whole image. In method (c), a histogram of photon counts detected in every pixel is built; the section of the histogram with the maximum occurrence (i.e. the bin with maximum counts and neighboring 2 bins) is fit to a Poisson distribution; and the average value of the Poisson fit is used for the corrections. Methods (b) and (c) may be applied only for images where fluorescent spots are well separated (by several widthes of the point-spread function). This separation is the condition for all types of single-molecule analyses. When this “single-molecule density” condition is met, all 3 methods give consistent results. The cross-talk and the correction factor are determined from the analysis of the traces measured immediately before or after the images, as described below.
2.2.5.2 Traces
Fig. 2.6 shows an example of the trace analysis. Only traces that show a single-step bleaching are considered as traces from single molecules. The local background fluorescence is calculated for every trace as the average signal intensity after all fluorophores have bleached. The cross-talk, ct, is calculated from the section of the trace after photobleaching of the acceptor but before photobleaching of the donor,
1
2
IIct = , (2.2)
where I1 and I2 are average fluorescence intensities in the donor and the acceptor channels, respectively, corrected for background. The formula to determine the correction factor, γ, is derived from the postulate that the number of photons absorbed by the donor does not depend on whether acceptor is present or not. This results in the following expression,
−−+ =+ DAD III γγ , (2.3) where ID and IA are average fluorescence intensities of the donor and the acceptor, respectively, corrected for the background and cross-talk. The superscripts + and − signify whether the averaging was performed over the part of the trace before or after the acceptor photobleaching, respectively.
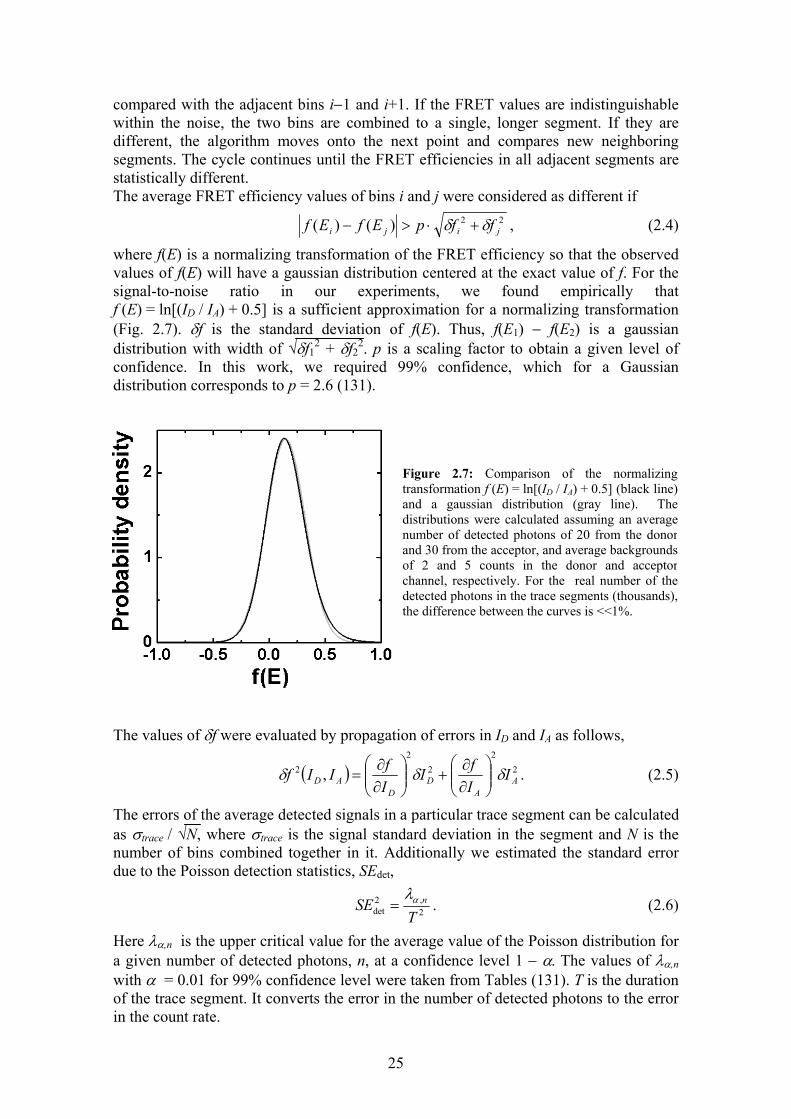
2.2.6 Analysis of FRET efficiency changes from single molecule traces The true changes of FRET efficiency are partially obscured by the presence of noise, inevitable in single-molecule measurements. The main sources of noise are the dark noise of the detectors, background signals (from light scattering, glass autofluorescence and fluorescent particles in solution), shot noise due to the finite number of detected photons, and fluctuations of the dye fluorescence due to the triplet or other non-fluorescent states. We have developed an algorithm for automatic extraction of step-wise FRET transitions, as one presented in Fig. 2.6, from noisy single-molecule traces. It combines time bins into longer time segments to increase the signal-to-noise ratio. The algorithm starts with the FRET efficiency values, Ei, from 1-ms time bins, i. Then, each bin, i, is
25
compared with the adjacent bins i−1 and i+1. If the FRET values are indistinguishable within the noise, the two bins are combined to a single, longer segment. If they are different, the algorithm moves onto the next point and compares new neighboring segments. The cycle continues until the FRET efficiencies in all adjacent segments are statistically different. The average FRET efficiency values of bins i and j were considered as different if
22)()( jiji ffpEfEf δδ +⋅>− , (2.4)
where f(E) is a normalizing transformation of the FRET efficiency so that the observed values of f(E) will have a gaussian distribution centered at the exact value of f. For the signal-to-noise ratio in our experiments, we found empirically that f (E) = ln[(ID / IA) + 0.5] is a sufficient approximation for a normalizing transformation (Fig. 2.7). δf is the standard deviation of f(E). Thus, f(E1) − f(E2) is a gaussian distribution with width of √δf1
2 + δf22. p is a scaling factor to obtain a given level of
confidence. In this work, we required 99% confidence, which for a Gaussian distribution corresponds to p = 2.6 (131). The values of δf were evaluated by propagation of errors in ID and IA as follows,
( ) 22
22
2 , AA
DD
AD IIfI
IfIIf δδδ
∂∂
+
∂∂
= . (2.5)
The errors of the average detected signals in a particular trace segment can be calculated as σtrace / √N, where σtrace is the signal standard deviation in the segment and N is the number of bins combined together in it. Additionally we estimated the standard error due to the Poisson detection statistics, SEdet,
2,2
det TSE nαλ
= . (2.6)
Here λα,n is the upper critical value for the average value of the Poisson distribution for a given number of detected photons, n, at a confidence level 1 − α. The values of λα,n with α = 0.01 for 99% confidence level were taken from Tables (131). T is the duration of the trace segment. It converts the error in the number of detected photons to the error in the count rate.
Figure 2.7: Comparison of the normalizingtransformation f (E) = ln[(ID / IA) + 0.5] (black line)and a gaussian distribution (gray line). Thedistributions were calculated assuming an averagenumber of detected photons of 20 from the donorand 30 from the acceptor, and average backgroundsof 2 and 5 counts in the donor and acceptorchannel, respectively. For the real number of thedetected photons in the trace segments (thousands),the difference between the curves is <<1%.

26
The larger value of σtrace / √N and SEdet was used to calculate δID and δIA,
1,max
21,2
det
22
, −
= −
NSE
NI Ntrace
ADαχσ
δ . (2.7)
Here, the factor χ2α, N − 1/(N − 1) accounts for the difference between the measured
variance from the true variance due to the limited number of measured time bins. 21, −Nαχ
is the upper critical value of the chi-squared statistics with N – 1 degrees of freedom at a given confidence level 1 − α. The values of χ2
α, N − 1 with α = 0.01 were taken from Tables (131). For large N, χ2
α, N − 1/(N − 1) approaches 1.
2.2.7 Correlation functions The normalized pair correlation functions, CAB (τ), were calculated from the single-molecule time traces of signals A and B,
( ) ( ))( )(
)(ττδδ
+⋅
+⋅
tBtAtBtA
= τ CAB , (2.8)
)()()( tAt =AtA −δ , (2.9)
)()()( τττδ +−++ tBt =BtB , (2.10)
where angular brackets denote averaging over time, t. A and B can be, for example, either donor and acceptor, or X and Y polarization signals. If A and B are different signals, CAB (τ) is called the cross-correlation. We can also correlate a signal with itself; then, CAA (τ) is called the auto-correlation. If changes in signals A and B are correlated, i.e., both signals increase or decrease simultaneously, then the numerator of the correlation function is positive. If the signals A and B are anticorrelated, i.e. one signal increases while the other decreases, then the numerator of CAB (τ) is negative. For example, changes of distance between dyes attached to a protein will result in changes of FRET efficiency and, therefore, in anticorrelated changes of donor and acceptor fluorescence. Thus, on timescales relevant to protein conformational changes one expects a negative cross-correlation function of donor and acceptor signals. In the case of polarization measurements, rotation of the dye dipole in XY plane will result in anticorrelated changes of the X and Y polarization components (negative cross-correlation). However, dye rotations in any plane perpendicular to XY plane change the intensities of the X and Y polarization components but not their ratio and, therefore, produce a positive contribution to the cross-correlation function. Let us show that overall sign of the cross-correlation function will be dominated by anticorrelated fluctuations of polarization signals. The amplitude of the cross-correlation function is given by
YX
YXXY II
IIC
⋅
⋅=
δδ)0( , (2.11)
where IX and IY are the intensities of the X and Y polarized components and δIX and δIY are their fluctuations. The angular brackets denote averaging over possible orientations of the transition dipole of the chromophore, d = (dX, dY, dZ) (Fig. 2.8). For the following, we assume that the dyes have the same transition dipole for absorption and emission processes.

27
The observed fluorescence intensities IX and IY are proportional to a product of probabilities (i) to absorb a photon and (ii) to collect an emitted photon by the objective. For excitation light with circular polarization in XY plane, the probability to absorb a photon is proportional to the square of the dipole component in XY plane, ∝ (dX
2 + dY2) ∝ sin2(θ), where θ is the angle between the transition dipole and Z axis
(Fig. 2.8). The angular distribution of dipole emission, Pα, depends on the angle between the dipole and the direction of the emitted light, α,
Pα ∝ sin2(α) = 1 − cos2(α) = 1 − (ed, eem)2 . (2.12) Here, ed and eem are unit vectors parallel to the dipole and direction of the emitted light, respectively. A microscope objective collects the emission only from a solid angle determined by numerical apperture (NA) of the objective,
NA = n sin θmax, (2.13) where n is the refractive index of the medium and θmax is one half of the angular apperture of the objective (Fig. 2.9). Using n = 1.33 for water and NA = 1.2 for our objective, we obtain θmax = 64.5°. Integrating Eq. 2.13 over all emission directions in the cone detected by the objective, one obtains detection efficiency, η, (132, 133)
( ) θθθθθθη 2max
3max8
3max
341
max43
21 coscoscoscoscos)( −++−= ≈
≈ 0.197 + 0.132 cos2θ. (2.14) The emitted photons with X and Y polarization will be detected in the X and Y detection channels, respectively, and photons with Z polarization will be split half-to-half between the two detectors (59). Combining probabilities of absorption and detection, we obtain
IX ∝ sin2θ η(θ ) [dX2 + 2
1 dZ 2] ∝
∝ sin2θ η(θ ) [sin2θ cos2ϕ + 21 cos2θ ], (2.15)
IY ∝ sin2θ η(θ ) [dY 2 + 2
1 dZ 2] ∝
∝ sin2θ η(θ ) [sin2θ sin2ϕ + 21 cos2θ ], (2.16)
where ϕ is the azimuth angle of the transition dipole (Fig. 2.8). Averaging of Eq. 2.11 with IX and IY from Eqs. 2.15 and 2.16, respectively, results in a negative amplitude of the cross-correlation function, CXY (0) ≈ −0.27. Figure 2.8: Orientation of a transition dipole, d.
Figure 2.9: Emission angles, collected by anobjective.

28
2.3 Buffers and solutions
Until otherwise mentioned all proteins were measured in the following buffer. Buffer 0: 20 mM TrisHCl (pH 7.4), 100 mM KCl, 10 mM MgCl2. Solutions with guanidinium chloride were prepared by mixing buffer 0 and the buffered 6 M GdmCl solution: 20 mM TrisHCl (pH 7.4), 6 M GdmCl, 100 mM KCl, 10 mM MgCl2. For site-directed mutagenesis, 10× reaction buffer (Stratagene Europe, Amsterdam, Netherlands) optimized for PfuTurbo DNA polymerase was used. 10× reaction buffer: 200 mM TrisHCl (pH 8.8), 100 mM KCl, 100 mM (NH4)2SO4, 20 mM MgSO4, 1% Triton X-100, 1 mg/ml BSA. E. coli cells were grown in Luria bertani (LB) broth. LB: 10 g/l tryptone, 5 g/l yeast extract, 10 g/l NaCl. LBA: LB + 50 mg/l ampicillin. LBS: LB + 50 mg/l streptomycin. For RNase H purification, the following buffers and solutions were used. TE buffer: 10 mM TrisHCl (pH 7.5), 1 mM EDTA. solution A: 0.157 M NaCl, 10 mM DTT, 17% PEG 6000. solution B: 10 mM TrisHCl (pH 7.9), 2 M NaCl, 10 mM DTT, 5% PEG 6000. buffer C: 50 mM TrisHCl (pH 7.5), 10 mM DTT, 1 mM EDTA, 10% w/v glycerol. buffer D: 10 mM TrisHCl (pH 7.5), 0.08 M NaCl, 1 mM DTT, 1 mM EDTA, 10% w/v glycerol.
2.4 RNase H biochemical procedures
2.4.1 Construction of the double-cysteine mutant of RNase H The plasmid pJAL135C containing the gene for a single-cysteine mutant of RNase H and ampicillin resistance was a generous gift of Dr. S. Kanaya (Osaka University, Japan). In this mutant, all natural cysteines were substituted by alanines, and a new cysteine was inserted instead of Glu 135. For FRET measurements, we introduced a second cysteine instead of Lys 3 by site-directed mutagenesis.
2.4.1.1 Primers for site-directed mutagenesis and plasmid sequencing
The substitution of Lys 3 was performed in 2 steps: (i) the codon of Lys 3, AAA, was changed to a codon of Asn, AAC, and (ii) Asn was changed to Cys, codon TGC. The DNA primers were synthesized by MWG-Biotech GmbH (Ebersberg, Germany). The oligonucleotide sequences of the primers (Table 2.1) were based on the results of sequencing of the plasmid pJAL135C (by MWG-Biotech), because we found that the sequence of our pJAL135C differed from the sequence of the original pJAL135C owing to spontaneous mutations accumulated during many multiplication cycles of the bacteria prior to our request for colonies. Custom synthesized primers used for sequencing are also listed in Table 2.1.

29
Table 2.1: Primers used for sited directed mutagenesis and plasmid sequencing.
primer I 5’-GGAGACTGGTATGCTTAACCAGGTAGAGATC-3’ K3N mutation primer II 5’-GATCTCTACCTGGTTAAGCATACCAGTCTCC-3’ primer I 5’-GGAGACTGGTATGCTTTGCCAGGTAGAGATCTTCACCG-3’ N3C mutation primer II 5’-CGGTGAAGATCTCTACCTGGCAAAGCATACCAGTCTCC-3’
5’-GAAGCATTGGCGCCTCGA-3’ 5’-CTCGCGTCCGCGATAGCG-3’
plasmid sequencing
5’-GGCAGTCAGGCGTTGGTG-3’
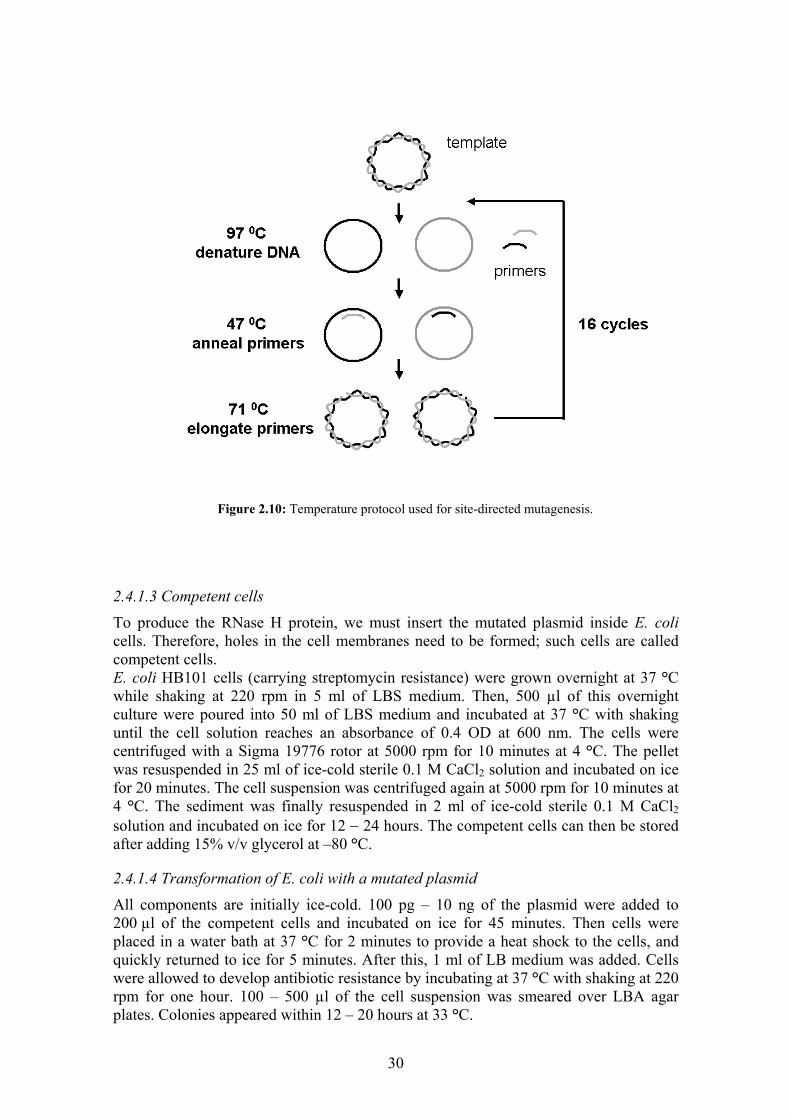
2.4.1.2 Site-directed mutagenesis To mutate RNase H, reaction mixtures were prepared in small reaction vials by mixing 5 µl of 10× reaction buffer, 5 – 50 ng double stranded template DNA, 125 ng mutagenic primer I, 125 ng mutagenic primer II (complementary to primer I), 1 µl dNTP-mix (Stratagene Europe), and sterile water to a total volume of 50 µl. PfuTurbo DNA polymerase (Stratagene Europe) was added to the reaction mixture later as described in the protocol. The vials with the reaction mixtures were placed in an automatic thermocycler (Primus, MWG-Biotech) which heats and cools the reaction tubes to desired temperatures. The site-directed mutagenesis procedure consists of 3 major steps, repeated over many cycles: denaturation, annealing and extension (Fig. 2.10). A cycle starts with heating the solution to 97 °C and incubating at this temperature for 45 seconds. This causes separation of the double-stranded DNA molecules. In the first cycle, the heating phase lasts for 3 minutes, then 1 µl of heat-tolerant PfuTurbo DNA polymerase (2.5 U) is added, and heating continues for an additional 45 seconds. In the second step, the mixture is cooled to 47 °C and incubated at this temperature for 1 minute. During this time, the primers anneal to their complementary sites on the single-stranded template DNAs. There is also annealing of primers I to primers II, but rebinding of the template DNA strands to each other is virtually impossible because of the huge molar excess of the primers over the templates. Following this, all of the DNAs are single-stranded except for the regions where they are base-paired with the primers. In the third step, the temperature is raised to 71 °C for 12½ minutes to provide the polymerase with its optimal conditions and enough time to replicate the whole plasmid using the bound mutagenic primers as starting points for the elongation. After 16 cycles, the reaction mixture is cooled to 37 °C and 1 µl of restriction enzyme Dpn I (10 U) is injected to digest the original DNA strands. Dpn I specifically cleaves G(CH3-A)/TC. Since the original DNA isolated from E. coli is methylated, it is subject to digestion.
30
2.4.1.3 Competent cells
To produce the RNase H protein, we must insert the mutated plasmid inside E. coli cells. Therefore, holes in the cell membranes need to be formed; such cells are called competent cells. E. coli HB101 cells (carrying streptomycin resistance) were grown overnight at 37 °C while shaking at 220 rpm in 5 ml of LBS medium. Then, 500 µl of this overnight culture were poured into 50 ml of LBS medium and incubated at 37 °C with shaking until the cell solution reaches an absorbance of 0.4 OD at 600 nm. The cells were centrifuged with a Sigma 19776 rotor at 5000 rpm for 10 minutes at 4 °C. The pellet was resuspended in 25 ml of ice-cold sterile 0.1 M CaCl2 solution and incubated on ice for 20 minutes. The cell suspension was centrifuged again at 5000 rpm for 10 minutes at 4 °C. The sediment was finally resuspended in 2 ml of ice-cold sterile 0.1 M CaCl2 solution and incubated on ice for 12 − 24 hours. The competent cells can then be stored after adding 15% v/v glycerol at –80 °C.
2.4.1.4 Transformation of E. coli with a mutated plasmid
All components are initially ice-cold. 100 pg – 10 ng of the plasmid were added to 200 µl of the competent cells and incubated on ice for 45 minutes. Then cells were placed in a water bath at 37 °C for 2 minutes to provide a heat shock to the cells, and quickly returned to ice for 5 minutes. After this, 1 ml of LB medium was added. Cells were allowed to develop antibiotic resistance by incubating at 37 °C with shaking at 220 rpm for one hour. 100 – 500 µl of the cell suspension was smeared over LBA agar plates. Colonies appeared within 12 – 20 hours at 33 °C.
Figure 2.10: Temperature protocol used for site-directed mutagenesis.

31
2.4.1.5 Saving and characterization of colonies
5 ml of LBA medium were inoculated with a single colony and cells were grown overnight at 37 °C with shaking. Cultures were stored after adding 15% v/v glycerol at –80 °C. For characterization, the plasmid DNA was extracted with the Quantum Prep Plasmid Mini- or Midiprep Kit (Bio-Rad, Munich, Germany) and sequenced by MWG-Biotech.
2.4.2 RNase H expression and purification The protein was overexpressed in E. coli HB101 strain and purified as described below. The protocol is based on the protocol developed by Kanaya et al. (94, 134).
2.4.2.1 Bacteria growth
Bacteria were grown in LBA medium at 32 °C until the absorbance at 600 nm reached 0.6 OD and then RNase H overproduction was induced by increasing the temperature to 42 °C. After 4 hours, the cells were harvested by centrifugation for 10 minutes at 6500 rpm, 4 °C using a Heraeus Sepatech HFA 14.290 rotor, and frozen until use.
2.4.2.2 Purification of RNase H
All purification steps were performed at 4 °C. All centrifugations were performed using a Sovall SS 34 rotor. Approximately 30 g of cells were thawed and suspended in 150 ml of TE buffer. Cell membranes were fractured by sonication for 6 minutes in an ice bath, followed by centrifugation for 30 minutes at 15000 rpm. For PEG precipitation of RNase H, 360 ml of solution A was added to the supernatant. The suspension was stirred for 30 minutes and then centrifuged for 10 minutes at 10000 rpm. The pellet was resuspended in 60 ml of solution B and the enzyme solution was centrifuged for 20 minutes at 20000 rpm to remove insoluble material. The supernatant was dialyzed against buffer C for 17 hours to produce fraction I. Fraction I was applied to a DEAE-Sephacel column (0.8 x 24 cm) equilibrated with buffer C and eluted with buffer C at a flow rate of 50 – 75 ml/h. RNase H passes through the column without interaction with the solid phase. The eluted fractions containing protein (monitored by absorption at 280 nm) were further applied to a P11 column (2 x 8 cm) equilibrated with buffer C. The P11 column was eluted with 250 ml of a linear gradient of 0 – 0.5 M NaCl in buffer C. The eluted fractions were checked for RNase H activity. The active fractions (eluted approximately at 0.3 M of NaCl) were pooled, dialyzed against buffer D, and concentrated to 2 ml in an Amicon cell (Model 8050, YM10 membrane) to produce fraction II. Fraction II was applied to a Sephacryl S-200 HR column (1.5 x 100 cm) equilibrated with buffer D. The column was eluted with buffer D at a flow rate of 5 ml/h. Fractions were collected and checked for RNase H activity. Active fractions were pooled, mixed with 30% v/v glycerol and stored at –20 °C. The purity of the protein was confirmed by SDS-gel electrophoresis and MALDI-TOF mass spectrometry prior to use.

32
2.4.3 Activity assay
2.4.3.1 RNA-DNA hybrid
The enzymatic function of RNase H is to cleave an RNA strand duplexed to a complementary DNA strand. To assess the activity of the enzyme, we used the following RNA-DNA hybrid (RNA nucleotides are shown in bold): Cy3 - 5’ dT dT dA dT dT dC dT rA rA rA rA dT dC dT dC dT dT dA dT 3’ QSY - 3’ dA dA dT dA dA dG dA dT dT dT dT dA dG dA dG dA dA dT dA 5’ The hybrid is cleaved at a single site (↓); the RNA moiety is flanked on either side by DNA to provide thermal stability of the duplex (135). The DNA-RNA-DNA strand was labeled with a fluorescent dye, Cy3, and the DNA strand was labeled with a fluorescence quencher, QSY. When the duplex is formed, the Cy3 fluorescence is quenched by QSY, but once RNA is hydrolyzed and the duplex falls apart, the fluorescence is no longer quenched. Therefore, the enzyme function can be observed by following the restoration of the Cy3 emission. The DNA-RNA-DNA strand,
NH2 - (CH2)6 - 5’d(TTATTCT) r(AAAA) d(TCTCTTAT) 3’, was synthesized in-house by standard phosphoramidite chemistry and labeled at the amino group with Cy3 succinimidyl ester (Amersham Biosciences, Little Chalfont, United Kingdom) according to the vendor’s protocol. The DNA strand,
5’ d(ATAAAGAGATTTTAGAATAA) 3’ – (CH2)7 – NH2, was purchased from MWG-Biotech and labeled at the amino group with QSY succinimidyl ester (Molecular Probes Europe BV, Leiden, the Netherlands) according to the manufacture ’s protocol. The oligonucleotides were stored dry or highly concentrated in water at –80 °C. To prepare the hybrid solution, the DNA-RNA-DNA and DNA strands were diluted in buffer 0 to final concentrations of 1.2 and 2.5 µM, respectively. The mixture was heated to 50 °C for 5 minutes, followed by slow cooling to 4 °C. The hybrid solution was stored at –80 °C. The concentration of the hybrid was assumed to be equal to the concentration of the DNA-RNA-DNA strand.
2.4.3.2 Enzyme kinetics in dilute solution
According to the Michaeis-Menten model, an enzymatic reaction can be described by the following kinetic scheme,
E + S V ES T E + P. (2.17) Here, E is enzyme, S is substrate, ES is a complex of the enzyme with the substrate, and P is product. k1 is the rate of the complex formation, k–1 is the rate of the complex dissociation, and kc to the rate of the enzyme-catalyzed reaction forming the product. We can assume that product formation is practically irreversible in dilute solution, since for RNase H the reverse reaction is tetramolecular (the enzyme, the DNA, and 2 pieces of the RNA strands). In the case when the concentrations of the enzyme and the substrate are far less than (k–1 + kc) / k1, the quantity known as the Michaelis-Menten constant or concentration (KM), the amount of the enzyme-substrate complex is negligibly small compared to the number of the enzyme or substrate molecules,
k1
k–1
kc

33
ES(t) << E(t), (2.18) ES(t) << S(t). (2.19)
Here ES(t), E(t) and S(t) are the concentrations of the enzyme-substrate complex, free enzyme and substrate, respectively, as functions of time, t. Therefore,
E(t) ≈ E0, (2.20) S(t) ≈ S0 – (P(t) –P0), (2.21)
where P(t) is the concentration of the product as a function of time, E0 is the total enzyme concentration, and P0 and S0 are the initial concentrations of the product and substrate, respectively. Then, the differential equations for the substrate and product concentrations are given by
)()()( 101 tESktSEktS −+⋅−=& , (2.22)
)()( tESktP c=& . (2.23)
Expressing ES(t) from equation 2.22 and using equation 2.21 to substitute S(t) and its time derivative, we obtain
( )0001
1 )( SPtPEkk
kkP
c
c +−+
−=−
& . (2.24)
Finally, solving this differential equation gives P(t) = P0 + S0 ⋅ (1 – exp[–kapp t]), (2.25)
001
1 EKk
Ekk
kkk
M
c
c
capp ≡
+=
−
, (2.26)
where kapp is the apparent rate coefficient of the enzymatic reaction.
2.4.3.3 Measurement of activity
All components are dissolved in buffer 0 (section 2.3), which contains divalent Mg2+ ions required for RNase H catalytic function (88). A cuvette with 150 µl of 30 nM RNA-DNA hybrid solution was placed in the fluorometer. The emission was excited at 514 nm and detected at 570 nm and was recorded as a function of time for 10 or more minutes to confirm that the RNA-DNA duplex was stable. Then, 150 µl of ~1 µM RNase H solution (the concentration was measured by absorption of UV light at 280 nm prior to the activity measurement) were added to the cuvette and quickly and thoroughly mixed. The final concentrations were ~15 nM and ~0.5 µM for the substrate and the enzyme, respectively. The increase of the fluorescence was recorded until the reaction was complete and the emission signal reached a steady-state. The data were fit to a single exponential process, describing the generation of the product (Eq. 2.25).
2.4.4 Label conjugation
2.4.4.1 For testing specific/unspecific adsorption of RNase H onto surfaces.
Primary amines of the lysine residues or the N-terminus of RNase H were labeled with Alexa 546 succinimidyl ester (Molecular Probes) and biotin succinimidyl ester (Sigma-Aldrich Chemie, Munich, Germany) by a standard protocol for succinimidyl ester-amine coupling (Fig. 2.11a). The protein and label in a 1 : 1 ratio were reacted overnight at 4 °C in 50 mM carbonate buffer, pH 8.2; the protein was purified from unbound labels by gel filtration using Performa-DTR cartridges (Edge Biosystems,

34
Gaithersburg, MD). A labeling efficiency of > 70% was determined by UV-visible absorption spectroscopy.
Figure 2.11: Coupling reactions: (a) succinimidyl ester – amine conjugation, (b) maleimide – cysteinebonding, (c) EDC-activated formation of the peptide bond between a carboxylic acid group and an amine,and (d) cross-linking of the star PEG polymer via isocyanate groups (R1 is a star molecule).
(a)
(b)
(c)
(d)
Succinimidyl ester
Maleimide
EDC
Unstable amine-reactive intermediate
Urea

35
2.4.4.2 For FRET measurements
Standard cysteine-maleimide coupling (Fig. 2.11b) was used to specifically attach fluorescent probes to the protein. The double cysteine mutant of RNase H, Alexa 546 maleimide and Alexa 647 maleimide (Molecular Probes) in a molar ratio 1 : 1 : 3 were reacted overnight at 4 °C in 20 mM phosphate buffer, pH 7.0. The protein molecules labeled with both a donor and an acceptor dye molecules could be separated from other labeling variants by ion echange chromatography (43). The separation procedure is based on different negative charges of Alexa 546 and Alexa 647 dyes. The protein solution was applied to a cation exchange column (RESOURCE S, Äkta-System, Amersham Pharmacia, Little Chalfont, United Kingdom) and eluted with a linear gradient of 0 to 1 M NaCl in 20 mM sodium phosphate buffer (pH 7.0). The fraction of interest was eluted at about 0.13 M NaCl. No peaks corresponding to the protein labeled with 3 dyes were detected, indicating that the dye maleimides reacted specifically only with 2 cysteines in the protein sequence. Finally, the protein was biotinylated by reaction of the amine groups with biotin succinimidyl ester. To minimize probability of multiple labeling, the protein and biotin were reacted in a molar ratio 1 : 0.5.
2.5 eqFP611 biochemical procedures
The far-red fluorescent protein eqFP611 was kindly provided by Dr. Jörg Wiedenmann (Ulm, Germany) (49) and was stored before use at 4 °C. According to the recently resolved X-ray structure of eqFP611 (116, 117), the protein has two cysteines on each subunit, which are accessible from the solvent. We used these cysteines to couple Alexa 647 maleimide dye serving as a FRET acceptor from the excitation from the protein chromophore. The protein and the dye were reacted overnight in a molar ratio 1 : 2 at 4 °C in 20 mM phosphate buffer (pH 7.0). Then, in order to enable immobilization onto surfaces, the protein was labeled with biotin succinimidyl ester using a protein : biotin ratio of 1 : 1. Protein aliquots were stored at –20 °C in 30% v/v glycerol.
2.6 Preparation of glass surfaces
2.6.1 Cleaning and aminosilanization of glass coverslips For protein physisorption onto bare glass coverslips, aminosilanization was not required. Glass coverslips (24 × 32 mm2 and 20 × 20 mm2, Menzel, Braunschweig, Germany) were cleaned by brief exposure to an open flame, and then rinsed with buffer (58). For chemical binding of proteins or PEG to the glass slides, they were functionalized with aminosilane. The glass slides were cleaned by an O2/Ozone plasma for 10 minutes, and then reacted with a commercial aminosilane (Vectabond, Vector Laboratories, Burlingame, CA) according to the manufacture’s protocol. Use of Vectabond was simpler, more reproducible and did not require a glove box, as compared with the reaction using conventional aminopropyl silane. The coverslips were dipped for 5 minutes in an acetone (Selectipure grade, Merck) solution of Vetabond, washed first in acetone and then several times by immersion in 18 MΩ Millipore water, and dried under a nitrogen flow. All steps of the aminosilanization were carried out in a cleanroom by Mrs. Niederhausen-Kraft.

36
2.6.2 Protein-based surfaces Physi- and chemisorption of the protein layers were performed directly in the channels of sandwich-cells made for single-molecule experiments (section 2.2.2). For physisorption, the sandwiches were made from cleaned, non-functionalized glass substrates (section 2.6.1). A 1 mg/ml solution of biotinylated BSA or streptavidin (both from Sigma) in 100 mM sodium phosphate buffer (pH 7.4) were filled into the channels and incubated for 10 minutes to allow the proteins to adsorb on the glass. Then the channels were rinsed with sodium phosphate buffer. For chemisorption, the sandwiches were made from freshly prepared aminosilanized glass. The carboxylic acid groups on the proteins were activated by EDC (Fluka Chemicals, Buchs SG, Switzerland) and reacted with the amino groups on the surface to form peptide bonds (Fig. 2.11c) (67). At the same time, the layer of the adsorbed proteins also becomes cross-linked, as the carboxylic groups of one protein can react with amino groups of a neighboring protein. For the reaction, a 10-fold molar excess of EDC was added to a 1 mg/ml BSA or streptavidin solution. The reaction mixture was filled into the channel and left to react for 2 hours. Unbound proteins were then rinsed out with Tris buffer (buffer 0). Since Tris molecules contain amino groups, we incubated the buffer in the channel for an additional 15 minutes to quench any remaining activated carboxylic groups.
2.6.3 Linear PEG surfaces Linear PEG chains were bound to the aminosilanized surfaces by standard succinimidyl ester – amine coupling. Methoxy-PEG-succinimidyl propionate (mPEG-SPA) with molecular mass of 5000 and 2000 were purchased from Nektar Therapeutics (Huntsville, AL). 100 mg/ml solutions of mPEG-SPA 5000 or mPEG-SPA 2000 in 50 mM sodium carbonate buffer (pH 8.2) were incubated in the sample channels for 2 hours and then thoroughly washed out with 18 MΩ Millipore water. The PEG succinimidyl groups react with the surface amino groups to chemically bind PEG to the glass surface. To provide anchors for specific protein immobilization via biotin-streptavidin linkage, mPEG-SPAs were mixed with biotin-PEG-succinimidyl ester (biotin-PEG-NHS, molecular mass 3400) (Nektar Therapeutics) at a 1% w/w ratio.
2.6.4 Cross-linked PEG surface Surfaces from cross-linked star-shaped PEG were prepared in collaboration with Prof. Martin Möller, Dr. Jürgen Groll, and SusTech GmbH (Darmstadt, Germany) (136). We used 6-armed, isocyanate-terminated star polymers. Their backbone consisted of 80% ethylene oxide and 20% propylene oxide. The average molecular mass was 12000 g/mol. 1 mg of the star polymer was dissolved in 1 ml of anhydrous THF and transferred to the clean room. There, 9 ml of deionized water was added, and the mixture was left to react for 5 minutes. During this time, some of the isocyanate groups reacted with water to form amines (Fig. 2.11d), which then form ureylene bonds with other isocyanate groups and thus form di-, tri- and higher oligomers of the star molecules. The solution containing monomers and oligomers of the stars was spin-coated on the aminosilanized glass surfaces. First, the slides were carefully and homogeneously covered by the solution, and then accelerated within 5 s to 2500 rpm and spun for 40 s. The surface amino groups reacted with the isocyanate end-groups of the polymers to form ureylene bonds. The resulting films of the stars were left overnight at ambient atmosphere in the clean room to complete the cross-linking reaction. Thereafter, sandwich cells were

37
made from the coated glasses. They were stored in glass Petri dishes sealed with a paraffin film under clean room conditions. For biotinylation of the star polymer surfaces, biocytin (Sigma) was dissolved in 9 ml of water and added to 1 ml THF solution of the star polymers. The primary amino group of the biocytin reacts with the isocyanate end-groups of the polymers to form biotinylated star molecules. The procedure of the surface preparation was carried out as described above.
2.6.5 Immobilization of biotinylated target molecules on surfaces For specific binding of proteins to the covered glass surfaces, the channel was filled with a 20 µg/ml streptavidin solution and left to react for 10 minutes for streptavidin to bind to the biotin on the surfaces. Subsequently, the channel was filled with a dilute solution of the biotinylated protein molecules (~100 pM), which then bond to the previously attached streptavidin. After 10 minutes, the unbound proteins were flushed out of the channel with buffer 0. For unspecific adsorption, the streptavidin step was omitted. In the case of the streptavidin surfaces, specific immobilization was performed by incubation with the biotinylated protein, and the unspecific binding was checked with an identical concentration of the non-biotinylated protein.
2.7 Linear extrapolation method for protein denaturation
The equilibrium between 2 states, for example, the folded and the unfolded states, is described by Boltzmann’s law,
KU/F = exp(–∆GU-F / RT), (2.27) where KU/F is the equilibrium constant, i.e., the ratio of the fraction of the unfolded molecules to the fraction of the folded molecules at thermodynamic equilibrium, ∆GU-F is the difference between the free energies of the unfolded and folded states, R is the gas constant, and T is the absolute temperature. According to the linear extrapolation method (LEM), the free energy difference depends linearly on the denaturant concentration, [D],
∆GU-F =∆GU-F (0) + mU-F [D]. (2.28) Here, ∆GU-F (0) is the free energy difference in the absence of the denaturant, and m is the proportionality coefficient, also known as the cooperativity factor (137-139). It was shown experimentally and theoretically that the cooperativity factor m is only weakly dependent on the nature of a particular protein but primarily a function of the protein surface area exposed to the solution (140-143),
mU-F ∝ ∆SASA. (2.29) Here, SASA is the solvent-accessible surface area. This linear relationship is easy to understand because guanidinium ions interact with exposed protein chains. Although the LEM method is commonly used to analyze protein stability, alternative approaches are being developed. For example, Murugan has introduced the so-called competitive model, which describes substitution of water molecules bound to the protein native structure by denaturant molecules (144). This model converges to the linear extrapolation method in the limit of very low concentration of denaturant (144), such that
b[D] << [H2O] . (2.30)

38
Here, b is the mean number of water molecules interacting with one molecule of the denaturant; it can approximately be taken as the number of amino groups: for urea b ~ 2 and for guanidinium cation b ~ 3 (144, 145). Since the concentration of pure water, [H2O], is 55.5 M, the condition of Eq. 2.30 is true up to 2 – 3 M of denaturants. The validity of the linear extrapolation method for denaturant concentrations above and below the transition region of folding/unfolding was extensively studied, but the data are controversial (146, 147). Recently, the denaturant activity, D, instead of the denaturant concentration was proposed to more accurately describe the LEM (148, 149),
∆GU-F =∆GU-F (0) + mU-F D, (2.31) [ ][ ]DCDC
D+
=5.0
5.0 , (2.32)
where the denaturation constant C0.5 = 7.5 M for GdmCl in water (149, 150). The activity is measured in mol/l (M), but we will denote it as M’ to distinguish activity and concentration of the denaturant. In our single molecule experiments, the free energy difference between the states was directly calculated from the fractions of the folded and unfolded molecules using Eq. 2.27, and then fitted with Eq. 2.31. The standard procedure to extract thermodynamic parameters of protein folding from bulk experiments is to fit the measured signal, y, to the following equations (146)5,
y = yF [F] + yU [U], (2.33) yF,U (D) = yF,U (0) + zF,U D. (2.34)
Here, yF and yU are signals of the folded and the unfolded states, respectively; they depend linearly (as a first-order approximation) on the denaturant activity, D, as described by Eq. 2.34 with constants yF,U (0) and zF,U. [F] and [U] are populations of the folded and unfolded states, respectively, which are related to the free energy difference between the states according to Eqs. 2.27 and 2.31. The same principle can be applied to fit not only single quantities but also spectra. The procedure can be simplified if all spectra can be decomposed in a sum of 2 reference spectra. For example, we can use a spectrum of folded molecules in buffer, yF (0), and a spectrum of unfolded molecules at the highest possible concentration of GdmCl, yU (Dmax), as the references. With this approach, Eq. 2.34 can be rewritten as follows.
yF (D) = yF (0) (1 + αF D) + yU (Dmax) βF D, (2.35) yU (D) = yF (0) αU (D − Dmax) + yU (Dmax) (1 + βU (D − Dmax)), (2.36)
where αF, βF, αU, and βU, are fitted coefficients.
2.8. Interpretation of FRET efficiency values
To calculate the Förster distance (Eq. 1.3), one typically assumes complete averaging of the dye rotations so that κ2 = ⅔. For characterization of the dyes’ properties, we used RNase H molecules singly labeled with either Alexa 546 or Alexa 647. The quantum yield of the donor Alexa 546, φD = 0.82, was determined by comparing its total fluorescence with that of rhodamine 6G, excited at the same wavelength. The overlap integral, J, was calculated from the measured fluorescence and absorbance spectra and the molar extinction coefficient of Alexa 647, which was provided by the vendor. Using the refractive index of 1.33 for water, we obtained R0 = 71 Å. In 6 M GdmCl, the refractive index increases to 1.43 (151) resulting in R0 = 68 Å. However, it was shown 5 In the original paper, denaturant concentrations were used instead of denaturant activities.

39
experimentally and theoretically that it is more accurate to use the local refractive index of the medium between the dyes through which the electromagnetic coupling occurs (152, 153). A folded protein has a refractive index of ~1.6 (153, 154), whereas for unfolded proteins it lies between 1.33 and 1.6 due to a mixture of protein and solvent between the dyes. Taking n = 1.47 (50% water and 50% protein), we obtained R0 = 66 Å in buffer and 63 Å in 6 M GdmCl. These are the values which will be used for the analysis in this work. The simple relationship connecting the distance between dyes with the observed FRET efficiency (Eq. 1.2), is valid only if the distance is fixed and κ2 is known, e.g. if the orientation of the dye dipoles is averaged much faster than the rate of the energy transfer so that κ2 = ⅔. However, the rotations of a dye attached to a biomolecule can be significantly slowed or hindered. Furthermore, structural fluctuations of the biomolecules will modulate the distance between the dyes. In time-resolved experiments, our observations will dependent on the speed of the orientation and distance modulation compared to the time bin of the measurements. Upon characterizing the unfolded RNase H, we encountered the situation where both dye reorientation and fluctuations of the end-to-end distance of the biopolymer occured slower than the energy transfer but much faster than the time resolution of the experiment. For such a case, the observed FRET efficiency is obtained by averaging over distributions of the orientation factor, κ2, and inter-dye separation, r,
drdprP
Rr
E ∫ ∫
+
=cl
0
4
0
226
02
)()(3/21
1 κκ
κ
. (2.37)
Here, P(r) and p(κ2) are probability density functions, R0 is calculated from Eq. 1.3 with κ2 = ⅔, and lc is the contour length of the protein chain. Even if the distance between the dyes is fixed (i.e. the probability density is a delta function), slow isotropic reorientations of the donor and acceptor may lead to significant deviation from the Förster law (dashed and solid lines in Fig. 2.12). The additional flexibility of the polymer results in a much weaker dependence of FRET on the dye-to-dye distance, which is depicted as a dotted line in Fig. 2.12. This curve was calculated numerically assuming Gaussian chain statistics,
( )
−= 2
2
2/32
2
23exp
24)(
aarr
rrrP
ππ , (2.38)
where ra = ⟨r2⟩1/2 is the root-mean-square of r, and the slow dye reorientations are isotropic. It was shown that the end-to-end distances and radii of gyration of unfolded proteins even with 92% of residual structure may still agree with the values obtained assuming a Gaussian chain model (155). For an unfolded protein, the distribution of the relative dye orientations can be assumed isotropic even in the presence of local steric limitations for the dye rotations, because of random relative orientations of the ends of the unfolded protein chain. The FRET dependence of such a Gaussian chain can be numerically approximated by an analytical function,
( ) 650.20/975.01
1 Rr
Ea+
= for 0/ Rra < 3, (2.39)
which allows easy conversion between the FRET efficiency and the structural parameter, ra (the root-mean-square deviation between the curves calculated with Eq. 2.37 and Eq. 2.39 is 0.003).

40
We can further relate the distance between the dyes to the end-to-end size, re, and the radius of gyration, RG, of the unfolded protein. The distance between N units of the polymer, rN, increases with N as a power law,
ν22 NrN ∝ . (2.40)
For a Gaussian chain, the exponent ν = 0.5 (156). For our FRET experiments, RNase H was labeled with dyes on cysteines at positions 3 and 135; taking the length for each dye linker of approximately 2 protein residues, we obtain the total distance between dyes of monomer 137 units. The full sequence of RNase H has 155 amino acids, and consequently
( ) ae rr 5.0137/155= . (2.41)
For a Gaussian chain, the end-to-end distance is related to RG by
6e
GrR = . (2.42)
Figure 2.12: Dependence of the FRET efficiency E on the distance between dyes r. The solid line is thestandard Förster law. The dashed line depicts the average FRET efficiency, ⟨E⟩, for fixed distance r, andisotropic reorientation of the dyes slower than the energy transfer but faster than the time resolution of theexperiment. The dotted line represents ⟨E⟩ averaged over an ensemble of Gaussian chains and dyeorientations like as in the previous case, as a function of the root-mean-square inter-dye distance, ra.
0.0 0.5 1.0 1.5 2.0 2.50.0
0.2
0.4
0.6
0.8
1.0
r/R0, ra/R0
<E>
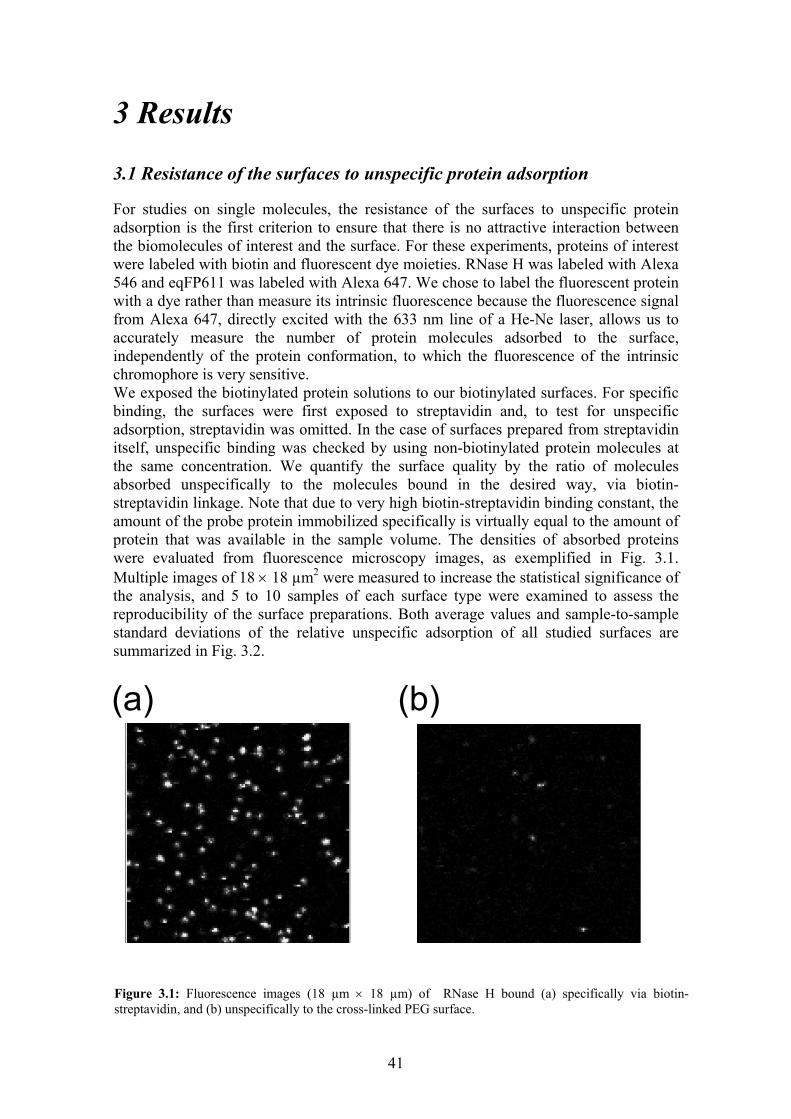
41
3 Results
3.1 Resistance of the surfaces to unspecific protein adsorption
For studies on single molecules, the resistance of the surfaces to unspecific protein adsorption is the first criterion to ensure that there is no attractive interaction between the biomolecules of interest and the surface. For these experiments, proteins of interest were labeled with biotin and fluorescent dye moieties. RNase H was labeled with Alexa 546 and eqFP611 was labeled with Alexa 647. We chose to label the fluorescent protein with a dye rather than measure its intrinsic fluorescence because the fluorescence signal from Alexa 647, directly excited with the 633 nm line of a He-Ne laser, allows us to accurately measure the number of protein molecules adsorbed to the surface, independently of the protein conformation, to which the fluorescence of the intrinsic chromophore is very sensitive. We exposed the biotinylated protein solutions to our biotinylated surfaces. For specific binding, the surfaces were first exposed to streptavidin and, to test for unspecific adsorption, streptavidin was omitted. In the case of surfaces prepared from streptavidin itself, unspecific binding was checked by using non-biotinylated protein molecules at the same concentration. We quantify the surface quality by the ratio of molecules absorbed unspecifically to the molecules bound in the desired way, via biotin-streptavidin linkage. Note that due to very high biotin-streptavidin binding constant, the amount of the probe protein immobilized specifically is virtually equal to the amount of protein that was available in the sample volume. The densities of absorbed proteins were evaluated from fluorescence microscopy images, as exemplified in Fig. 3.1. Multiple images of 18 × 18 µm2 were measured to increase the statistical significance of the analysis, and 5 to 10 samples of each surface type were examined to assess the reproducibility of the surface preparations. Both average values and sample-to-sample standard deviations of the relative unspecific adsorption of all studied surfaces are summarized in Fig. 3.2.
(b) (a)
Figure 3.1: Fluorescence images (18 µm × 18 µm) of RNase H bound (a) specifically via biotin-streptavidin, and (b) unspecifically to the cross-linked PEG surface.

42
3.1.1 Protein-based surfaces Using RNase H as a probe (Fig. 3.2a), both chemisorbed/cross-linked BSA and streptavidin surfaces showed excellent resistance to unspecific adsorption (less than 5%), and were reproducible from sample to sample. In contrast, the performance of physisorbed-protein coatings was very poor. In particular, unspecific adsorption was not prevented at all on the physisorbed streptavidin. Even after overnight incubation of the streptavidin solution in the sample channels, either at room temperature or at 4 °C, sufficient coverage of the glass surface to prevent unspecific adsorption was not achieved. Physisorbed BSA exhibited much better resistance to unspecific adsorption than streptavidin, but this type of surface preparation suffered from large sample-to-sample variations represented by the error bars in Fig. 3.2a. Although, chemisorption/cross-linking with EDC improved both the resistance and reproducibility of the protein-based surfaces, as judged by the binding of RNase H, we found that eqFP611 was strongly adsorbed onto the BSA surfaces (Fig. 3.2b). Since we can exclude the possibility of an incomplete layer of chemisorbed BSA due to the high resistance to RNase H unspecific adsorption, we conclude that the unspecific binding of eqFP611 is caused by strong interaction between the probe protein and the BSA coating.
3.1.2 PEG-based surfaces Linear PEG 5000 and the cross-linked star PEG (molecular mass 12000) surfaces shared an extremely low level of unspecific adsorption for both RNase H and eqFP611 (~1%) (Fig. 3.2). Surprisingly, linear PEG 2000 had a drastically lower performance than either linear PEG 5000 or the cross-linked PEG surfaces (Fig. 3.2a). The average relative unspecific adsorption of PEG 2000 surfaces was higher (~9%) but, even more
(b) (a)
Figure 3.2: Relative unspecific adsorption of (a) RNase H, and (b) eqFP611 to biocompatible surfaces. phys. BSA and strept. – physisorbed BSA and streptavidin surfaces, respectively; xl-BSA and strept. –chemisorbed and crosslinked BSA and streptavidin surfaces, respectively; PEG 5000 and PEG 2000 –linear PEG surfaces; xl-PEG – cross-linked star PEG; and xl-BSA/PEG is chemisorbed cross-linked BSAsurface covered with linear PEG.

43
important, the surface quality varied from sample to sample, and from one area of a sample to another. Fig. 3.3 displays several images with RNase H unspecifically adsorbed on PEG 2000. We see that areas with low binding of the protein are contiguous with areas where protein binding is not prevented. Increasing or decreasing the concentration of the PEG 2000 solution between 0.5% and 100% w/v did not improve the surface resistance (the usual concentration of linear PEG solutions in our experiments was 10% w/v). To optimize the conditions for linking PEG 2000 to the surface, we also tried to raise the temperature of the reaction of PEG linking to 37 °C, also resulting in no change in the quality of the surface. To evaluate the effect of the layer underneath the linear PEG on surface biocompatibility, we tested a double-layer strategy, which was prepared as a chemisorbed/cross-linked BSA layer upon which linear PEG 5000 was bound. As we can see from Fig. 3.2b, this surface resisted adsorption of eqFP611. It appears that a monolayer of linear PEG 5000 efficiently screens the attraction between the BSA layer and eqFP611 in solution.
Figure 3.3: Examples of fluorescence scan images (18 µm × 18 µm) of RNase H unspecifically adsorbedonto PEG 2000 surfaces.
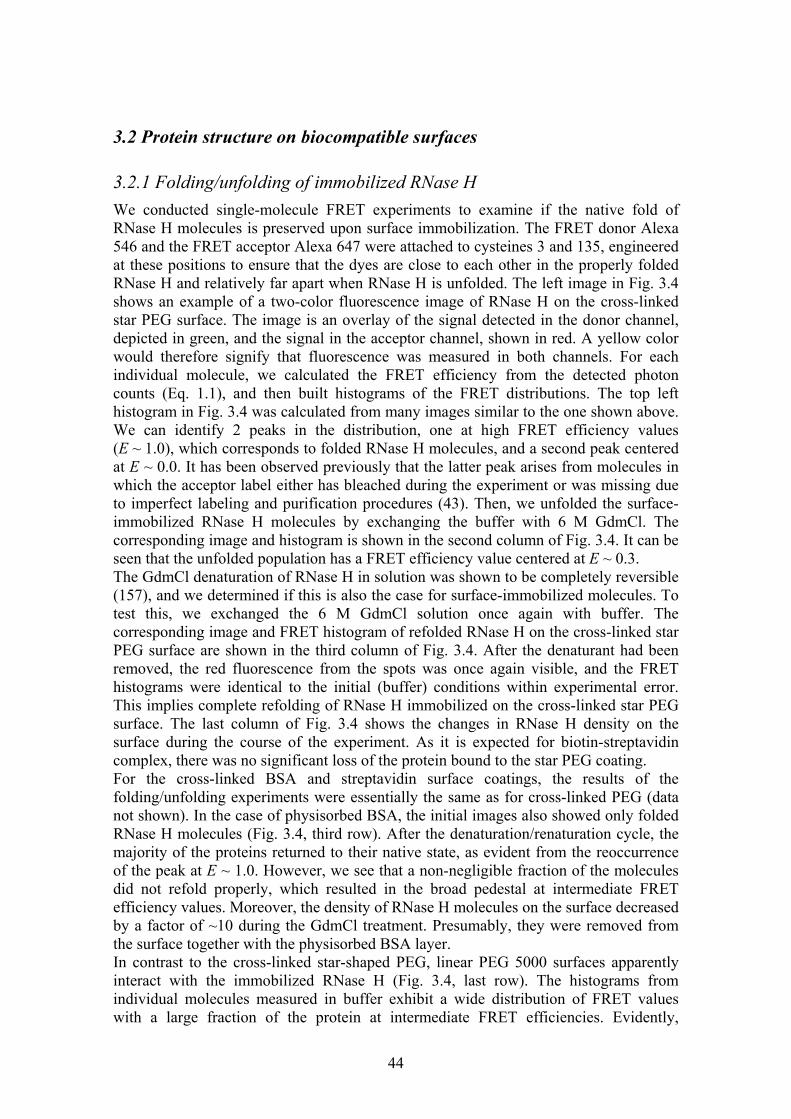
44
3.2 Protein structure on biocompatible surfaces
3.2.1 Folding/unfolding of immobilized RNase H We conducted single-molecule FRET experiments to examine if the native fold of RNase H molecules is preserved upon surface immobilization. The FRET donor Alexa 546 and the FRET acceptor Alexa 647 were attached to cysteines 3 and 135, engineered at these positions to ensure that the dyes are close to each other in the properly folded RNase H and relatively far apart when RNase H is unfolded. The left image in Fig. 3.4 shows an example of a two-color fluorescence image of RNase H on the cross-linked star PEG surface. The image is an overlay of the signal detected in the donor channel, depicted in green, and the signal in the acceptor channel, shown in red. A yellow color would therefore signify that fluorescence was measured in both channels. For each individual molecule, we calculated the FRET efficiency from the detected photon counts (Eq. 1.1), and then built histograms of the FRET distributions. The top left histogram in Fig. 3.4 was calculated from many images similar to the one shown above. We can identify 2 peaks in the distribution, one at high FRET efficiency values (E ~ 1.0), which corresponds to folded RNase H molecules, and a second peak centered at E ~ 0.0. It has been observed previously that the latter peak arises from molecules in which the acceptor label either has bleached during the experiment or was missing due to imperfect labeling and purification procedures (43). Then, we unfolded the surface-immobilized RNase H molecules by exchanging the buffer with 6 M GdmCl. The corresponding image and histogram is shown in the second column of Fig. 3.4. It can be seen that the unfolded population has a FRET efficiency value centered at E ~ 0.3. The GdmCl denaturation of RNase H in solution was shown to be completely reversible (157), and we determined if this is also the case for surface-immobilized molecules. To test this, we exchanged the 6 M GdmCl solution once again with buffer. The corresponding image and FRET histogram of refolded RNase H on the cross-linked star PEG surface are shown in the third column of Fig. 3.4. After the denaturant had been removed, the red fluorescence from the spots was once again visible, and the FRET histograms were identical to the initial (buffer) conditions within experimental error. This implies complete refolding of RNase H immobilized on the cross-linked star PEG surface. The last column of Fig. 3.4 shows the changes in RNase H density on the surface during the course of the experiment. As it is expected for biotin-streptavidin complex, there was no significant loss of the protein bound to the star PEG coating. For the cross-linked BSA and streptavidin surface coatings, the results of the folding/unfolding experiments were essentially the same as for cross-linked PEG (data not shown). In the case of physisorbed BSA, the initial images also showed only folded RNase H molecules (Fig. 3.4, third row). After the denaturation/renaturation cycle, the majority of the proteins returned to their native state, as evident from the reoccurrence of the peak at E ~ 1.0. However, we see that a non-negligible fraction of the molecules did not refold properly, which resulted in the broad pedestal at intermediate FRET efficiency values. Moreover, the density of RNase H molecules on the surface decreased by a factor of ~10 during the GdmCl treatment. Presumably, they were removed from the surface together with the physisorbed BSA layer. In contrast to the cross-linked star-shaped PEG, linear PEG 5000 surfaces apparently interact with the immobilized RNase H (Fig. 3.4, last row). The histograms from individual molecules measured in buffer exhibit a wide distribution of FRET values with a large fraction of the protein at intermediate FRET efficiencies. Evidently,
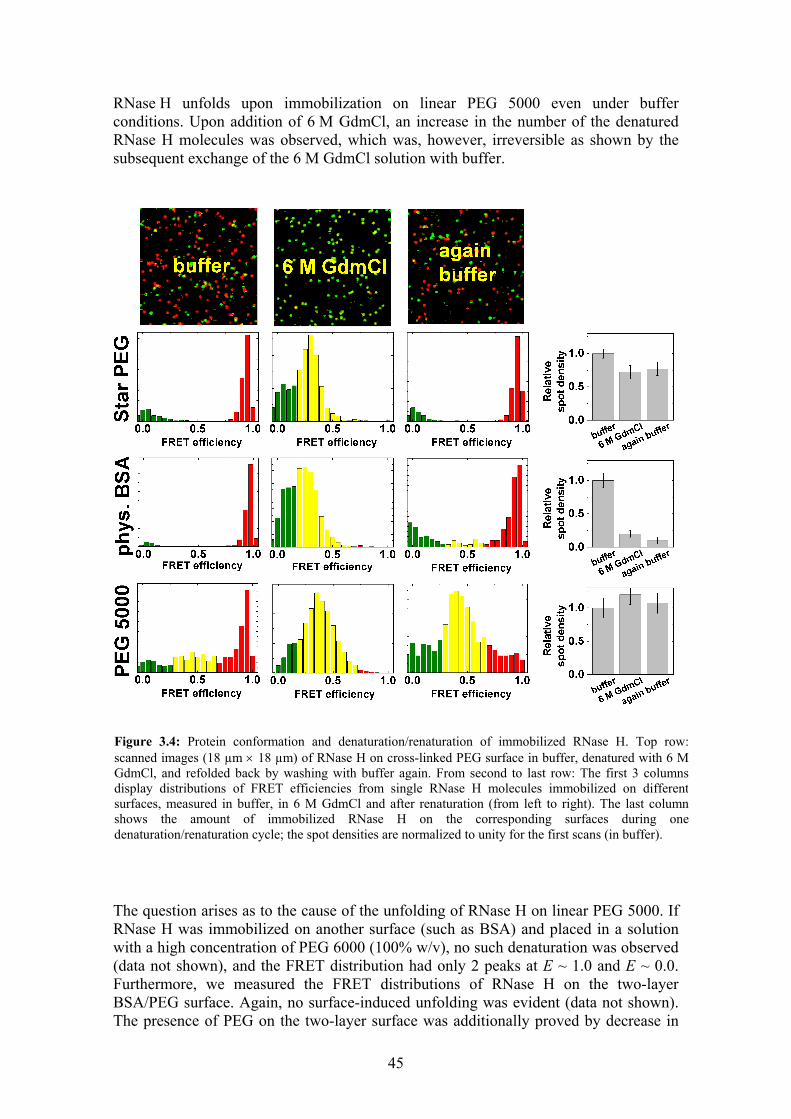
45
RNase H unfolds upon immobilization on linear PEG 5000 even under buffer conditions. Upon addition of 6 M GdmCl, an increase in the number of the denatured RNase H molecules was observed, which was, however, irreversible as shown by the subsequent exchange of the 6 M GdmCl solution with buffer. The question arises as to the cause of the unfolding of RNase H on linear PEG 5000. If RNase H was immobilized on another surface (such as BSA) and placed in a solution with a high concentration of PEG 6000 (100% w/v), no such denaturation was observed (data not shown), and the FRET distribution had only 2 peaks at E ~ 1.0 and E ~ 0.0. Furthermore, we measured the FRET distributions of RNase H on the two-layer BSA/PEG surface. Again, no surface-induced unfolding was evident (data not shown). The presence of PEG on the two-layer surface was additionally proved by decrease in
Figure 3.4: Protein conformation and denaturation/renaturation of immobilized RNase H. Top row:scanned images (18 µm × 18 µm) of RNase H on cross-linked PEG surface in buffer, denatured with 6 MGdmCl, and refolded back by washing with buffer again. From second to last row: The first 3 columnsdisplay distributions of FRET efficiencies from single RNase H molecules immobilized on differentsurfaces, measured in buffer, in 6 M GdmCl and after renaturation (from left to right). The last columnshows the amount of immobilized RNase H on the corresponding surfaces during onedenaturation/renaturation cycle; the spot densities are normalized to unity for the first scans (in buffer).

46
unspecific adsorption of eqFP611 on this surface as compared to the cross-linked BSA surface. Our observations suggest that it is not the linear PEG chains but rather the underlying amino-functionalized surface that causes RNase H to unfold in case of the one-layer PEG 5000 surface. An additional advantage of the cross-linked PEG surfaces compared to other surfaces is that the other surfaces (especially the protein surfaces) have to be prepared freshly before the experiment, whereas the cross-linked PEG films can be stored for months. To demonstrate the superior performance of the cross-linked star PEG surface, the following experiment was conducted in a sandwich cell 3 months after the preparation of the cross-linked PEG coated surfaces. We subjected the sample containing immobilized RNase H molecules to 50 cycles of consecutive denaturation-renaturation. In Fig. 3.5a and b, we show confocal images of the same sample area taken before and after the 50 cycles. Monitoring the same molecules (examples are highlighted with arrows in Fig. 3.5), we found that the majority of them refolded every time. Occasionally, the acceptor bleaches, and a green spot appears instead of a red one (highlighted by the yellow arrow in Fig. 3.5). The corresponding FRET distributions from multiple images are plotted in Fig. 3.5c. After 50 cycles, only 4 molecules from 116 initially having both a donor and an acceptor, were observed at intermediate FRET values (0.4 < E < 0.6) characteristic of non-native RNase H. The vast majority refolded completely after all cycles.
Figure 3.5: Fluorescence images of the same 10 µm × 10 µm area (a) before and (b) after 50 successivedenaturation/renaturation cycles. RNase H was immobilized on cross-linked PEG; the unfolding andrefolding were performed by washing with 6 M GdmCl and buffer, respectively. The arrows highlightexamples of the exact same molecules in both images. The molecule marked by the yellow arrow bleachedduring the experiment. (c) FRET histograms of the same 116 initially folded molecules before (left frame)and after (right frame) 50 unfolding cycles.
(a) (b)
(c)

47
3.2.2 Fluorescence brightness of eqFP611 In order to probe the conformational states of eqFP611 immobilized on different biocompatible surfaces, we implemented an assay based on protein brightness and FRET efficiency between the chromophore and an external acceptor dye (Alexa 647) on the protein surface. First, a biocompatible surface with immobilized proteins was imaged using green laser light (532 nm), which excited the protein chromophore (Fig. 3.6, top part of the image). Due to the short distance between the chromophore and the dye in the folded molecules, the excitation energy was efficiently transferred to the dye (E > 0.9). The integrated detected fluorescence from the image is proportional to (i) the density of eqFP611 molecules, (ii) the fraction of them that are folded and, thus, can emit, and (iii) the FRET efficiency between the chromophore and the dye, which is dependent on the protein size, as well as the quantum yield and the spectral properties of the protein chromophore. Thus, dividing this integrated fluorescence by the density of eqFP611 molecules, we can obtain a FRET brightness parameter, which is very sensitive to the changes of the eqFP611 conformation. The density of the molecules on the surface can be determined by direct excitation of the dye with 633 nm laser line measured separately (Fig. 3.6, low part of the image). Fig. 3.7a combines the FRET brightness of eqFP611 on different surfaces normalized to the FRET brightness measured with eqFP611 molecules freely diffusing in solution. The measurements were repeated at various times after the immobilization because unfolding of the fluorescent proteins can be a slow process (124). Additionally, Fig. 3.7b displays the folded fraction of the protein calculated as the ratio of the density of the fluorescent spots on a surface excited by the green laser (folded proteins) to the density of fluorescent spots excited by the red laser (all proteins). Our data demonstrate that the interaction between eqFP611 molecules and the BSA layer, which causes strong unspecific adsorption, also results in partial unfolding of the fluorescent protein. In contrast, the resistant PEG surfaces, both linear PEG 5000 and cross-linked star PEG, offer a friendly environment to eqFP611 so that the immobilized protein remains folded. For all surfaces, there were no changes of eqFP611 properties on the timescale of several hours after the immobilization.
Figure 3.6: Measurement of FRET brightness ofimmobilized eqFP611. The protein labeled with Alexa 647was attached to the cross-linked PEG surface viabition-streptavidin. The top part of the 18 µm × 18 µmimage was excited at 514 nm and measured in both thegreen and red channels. However, because of FRET, theexcitation energy from the protein chromophore, whoseemission could be detected in the green channel, isefficiently transferred to the dye emitting in the red channel.The bottom part of the image was recorded with 633 nmillumination exciting the Alexa 647 dye directly.

48
3.3 Irreversible denaturation of eqFP611 with GdmCl
We found that denaturation of eqFP611 with GdmCl is an irreversible process. EqFP611 was dissolved in 6 M GdmCl to the final protein concentration of 320 nM and denatured for 3 hours. Then, the solution was diluted 10 times in buffer 0 to produce final concentrations of GdmCl of 0.6 M and protein of 32 nM. The GdmCl concentration of 0.6 M is far below the folding/unfolding midpoint of the fluorescent proteins of ~4 M GdmCl (124), and therefore should not prevent the refolding process. However, recovery of the intrinsic chromophore fluorescence, measured at 610 nm with the excitation at 510 nm, was very low. Immediately after renaturation, the fluorescence recovered to 9% of its initial value (measured with 32 nM solution of eqFP611). After 2 and 17 hours of the renaturation, the fluorescence recovery was 13% and 15%, respectively. The unfolding of eqFP611 immobilized on linear PEG 5000 and cross-linked PEG surfaces was also irreversible. Moreover, adding 6 M GdmCl to the solution in the channel resulted in ~4 times decrease of the density of the proteins on the surfaces. Presumably, once eqFP611 unfolds, the chromophore is hydrolyzed by the solvent molecules, and the protein falls apart into 2 pieces similar to DsRed (118), which has an identical chromophore. Modification of the chromophore structure can be visualized by absorption spectroscopy. Fig. 3.8a shows the absorption spectra of eqFP611 at various times after adding 6 M GdmCl. The spectra consist of 4 peaks. The peak at 280 nm arises from the aromatic residues of the protein (tryptophans, tyrosines, and phenylalanines), and, thus, is directly proportional to the protein concentration in the solution. The other 3 peaks at 560, 470 and 386 nm are the chromophore absorption bands. The 560-nm absorption corresponds to the normal deprotonated fluorescent form of the chromophore (49). The peak amplitudes were fitted with a two-exponent process (Fig. 3.8b). The characteristic time determining the decrease of the line at 560 nm and the increase at 470 nm was 7.9 ± 0.3 min. Following this, the 470 nm peak decayed and the 386 nm peak appeared with a time constant of 46 ± 5 min. We suggest that upon unfolding, the chromophore becomes protonated, which shifts the absorption to 470 nm.
(a) (b)
Figure 3.7: Fluorescence properties of eqFP611 immobilized on biocompatible surfaces. (a) AverageFRET brightness of immobilized eqFP611, normalized to the brightness of eqFP611 molecules freelydiffusing in solution. (b) Fraction of folded (fluorescent) molecules, calculated as the density of fluorescentspots excited with green light (excitation of the chromophore) divided by the density of the fluorescentspots excited by red light (excitation of the dye).

49
The second process is probably the cleavage of the chromophore, which results in a structure similar to the (protonated) chromophore of GFP (118), with an absorption peak at 386 nm (158).
3.4 Thermodynamics and kinetics of RNase H folding/unfolding
3.4.1 Free energies of the folded and unfolded states The unfolding of RNase H in solution has been studied extensively. However, to determine the effects of the various surfaces on the folding process, it is important to perform control measurements with the particular mutant used under the same buffer conditions. The GdmCl-induced denaturation was monitored by the intrinsic fluorescence from the aromatic residues of RNase H. The emission spectra were measured upon excitation at 280 nm as a function of GdmCl. Upon protein unfolding, peaks of the emission spectra (Fig. 3.9a) shifted to the red from ~331 nm to ~350 nm. Fig. 3.9b shows a shift of the first moment of the emission spectra, integrated from 300 to 400 nm. The changes have a sigmoidal shape, characteristic of the folding/unfolding transition. To extract the thermodynamic parameters of folding, all spectra were simultaneously fitted to the corrected LEM, as described in section 2.7. Briefly, a spectrum at particular GdmCl concentration can be decomposed to a sum of the spectra of folded and unfolded RNase H molecules. The ratio of folded and unfolded molecules is determined by the free energy difference between the folded and unfolded states, ∆GU-F, according to Boltzmann’s law. Finally, ∆GU-F is assumed to be a linear function of the denaturant activity, D, (Eq. 2.31) and D is related to the GdmCl concentration (Eq. 2.23). The spectra measured in buffer and 6 M GdmCl were used as the spectra of folded and unfolded molecules, respectively, in the corresponding solvent conditions. The emission spectra at all intermediate GdmCl concentrations could be reproduced from them by the fitting procedure (Fig. 3.9a). The global fit of the first moments of the emission spectra is plotted in Fig. 3.9b with a solid line, dashed lines show the first moment of the model folded and unfolded spectra. The calculated fractions of folded RNase H molecules at
300 400 500 6000.00
0.02
0.04
0.06
0.08
Abs
orba
nce,
OD
Wavelength, nm
0 min 1 min 4 min 7 min 22 min 37 min 75 min 107 min
0 20 40 60 80 1000.00
0.02
0.04
0.06
Time, min
(a) (b)
Figure 3.8: Unfolding of eqFP611 in 6 M GdmCl solution, leading to the irreversible cleavage of theprotein chromophore. (a) Absorbance spectra of eqFP611 after various times of incubation with 6 MGdmCl. (b) The absorbance intensities at 560 nm (black squares), 470 nm (open circles), and 386 nm (graytriangles) were simultaneously fitted with a two-exponential process.

50
different GdmCl concentrations and their fit are shown in Fig. 3.9c. The fit parameters are listed in table 3.1, together with the midpoint activity,
Dm = FU
FU
mG
−
−∆−
)0(, (3.1)
and the corresponding midpoint GdmCl concentration, Cm, which quantify the point at which ∆GU-F = 0, when the folded and unfolded states are equally populated. Here, ∆GU-F (0) is ∆GU-F, extrapolated to zero denaturant activity (and concentration), and mU-F is the slope of ∆GU-F versus activity of GdmCl. Table 3.1: Parameters of the folding/unfolding equilibrium for RNase H freely diffusing in solution and RNase H immobilized onto various biocompatible surfaces.
∆GU-F (0), kJ/mol
mU-F, kJ/(mol M’)
Dm, M’
Cm, M
solution 36 ± 2 –26 ± 2 1.37 1.68 cross-linked star PEG 33 ± 2 –24 ± 2 1.37 1.68 chemisorbed cross-linked BSA 23 ± 1 –18 ± 1 1.27 1.53 PEG 5000 on chem./cross-linked BSA 24 ± 5 –19 ± 3 1.30 1.57 chemisorbed cross-linked streptavidin 22 ± 1 –17 ± 1 1.34 1.63 physisorbed BSA 12 ± 1 –8 ± 1 1.48 1.84
Figure 3.9: The unfolding equilibrium of RNase H in solution monitored by the intrinsic proteinfluorescence. Protein concentration was 1 µM. (a) Open circles, gray diamonds, and open triangles arefluorescence spectra of RNase H (excitation at 280 nm) in buffer, 1.7 M GdmCl, and 6 M GdmCl,respectively. The line shows the fit to the fluorescence spectrum in 1.7 M GdmCl. (b) Shift of the firstmoment of the fluorescence spectrum (integrated from 300 to 400 nm) as a function of GdmCl activity. Thesolid line is a global fit to the fluorescence spectra. Dashed lines show first moments of the folded andunfolded spectra. (c) Folded fraction of RNase H plotted against GdmCl activity. The line is a global fit tothe fluorescence spectra.
300 325 350 375 4000
2
4
6
8
10
Fluo
resc
ence
, a.u
.
Wavelength, nm
(a)
340
345
350
0 1 2 3 4 5 6[GdmCl], M
<λ> 30
0 - 4
00 n
m, n
m
0 1 2 3
0.0
0.5
1.0
Fold
ed fr
actio
n
GdmCl activity, M'
(b)
(c)

51
A major advantage of single molecule measurements is that the free energy difference can be accessed by measuring the folded and unfolded populations separately (Boltzmann’s law),
[ ][ ]
−=∆ − F
URTG FU ln . (3.2)
Here, [F] and [U] are fractions of folded and unfolded molecules, respectively. Fig. 3.10a exemplifies a two-color overlay image of RNase H molecules on a cross-linked PEG surface near the titration midpoint, 1.7 M GdmCl. We observe spots of three different colors: red (folded), yellow (unfolded), and green (without an acceptor). The FRET histograms from such images at different concentrations of GdmCl (Fig. 3.10b) demonstrate the rate at which the relative fraction of the unfolded state grows with the addition of denaturant. The data were fitted with a sum of normal and 2 log-normal distributions to quantify the unfolded, folded, and no-acceptor components, respectively (43). The fractions of folded and unfolded molecules were determined from the areas under the fitted functions of the red and yellow distributions, respectively, and used in Eq. 3.2 to obtain ∆GU-F.
(a) (b)
(c)
070
080
0300
040
080
060
0.0 0.2 0.4 0.6 0.8 1.00
100
# m
olec
ules
E
060
060
050
060
0.0 M
1.5 M
1.6 M
1.7 M
1.8 M
1.9 M
2.0 M
2.1 M
2.5 M
3.0 M
6.0 M
Figure 3.10: Single-molecule measurements of the RNase H folding/unfolding equilibrium. (a) A scannedfluorescence image (18 µm × 18 µm) of RNase H immobilized on the cross-linked star PEG surface at 1.7M GdmCl. (b) FRET histograms of individual RNase H molecules, evaluated from the scanned images.RNase H on the cross-linked star PEG surface at various concentrations of GdmCl. (c) An example of ascanned image (18 µm × 18 µm) of RNase H on physisorbed BSA at 2.3 M GdmCl. The heterogeneity ofthe surface environment is evident: on the upper part of the image, molecules are preferentially folded,whereas on the lower part, they are unfolded.
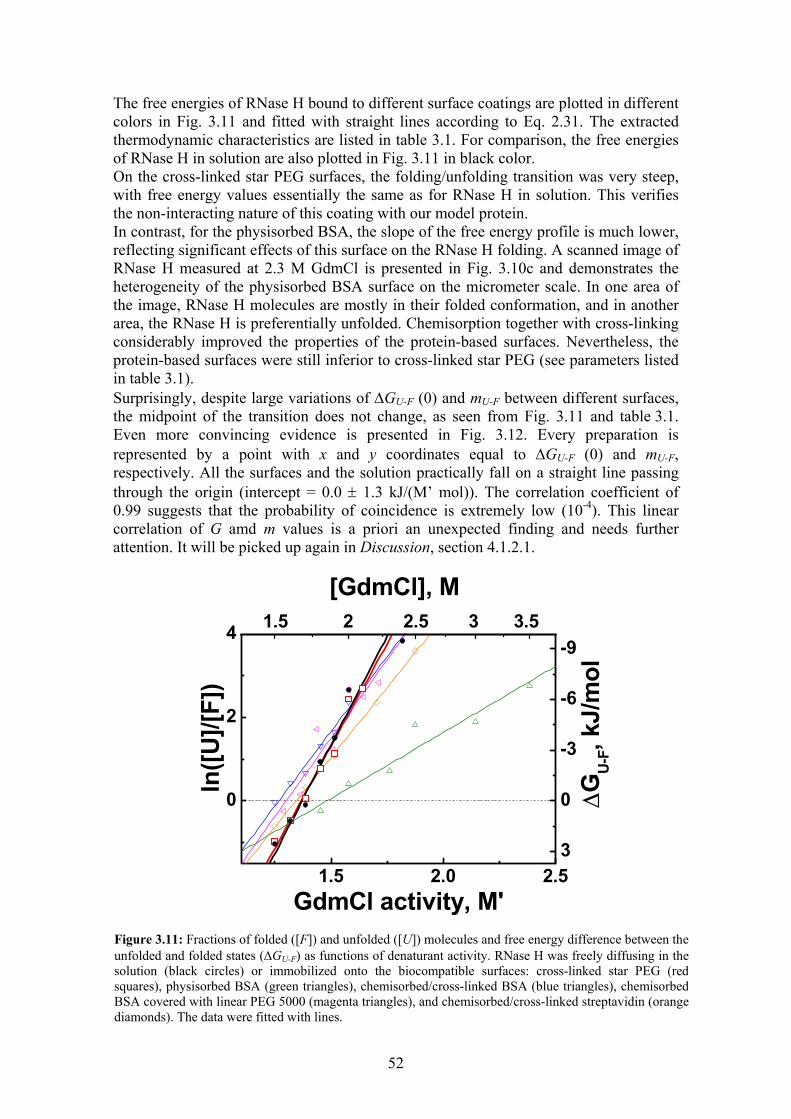
52
The free energies of RNase H bound to different surface coatings are plotted in different colors in Fig. 3.11 and fitted with straight lines according to Eq. 2.31. The extracted thermodynamic characteristics are listed in table 3.1. For comparison, the free energies of RNase H in solution are also plotted in Fig. 3.11 in black color. On the cross-linked star PEG surfaces, the folding/unfolding transition was very steep, with free energy values essentially the same as for RNase H in solution. This verifies the non-interacting nature of this coating with our model protein. In contrast, for the physisorbed BSA, the slope of the free energy profile is much lower, reflecting significant effects of this surface on the RNase H folding. A scanned image of RNase H measured at 2.3 M GdmCl is presented in Fig. 3.10c and demonstrates the heterogeneity of the physisorbed BSA surface on the micrometer scale. In one area of the image, RNase H molecules are mostly in their folded conformation, and in another area, the RNase H is preferentially unfolded. Chemisorption together with cross-linking considerably improved the properties of the protein-based surfaces. Nevertheless, the protein-based surfaces were still inferior to cross-linked star PEG (see parameters listed in table 3.1). Surprisingly, despite large variations of ∆GU-F (0) and mU-F between different surfaces, the midpoint of the transition does not change, as seen from Fig. 3.11 and table 3.1. Even more convincing evidence is presented in Fig. 3.12. Every preparation is represented by a point with x and y coordinates equal to ∆GU-F (0) and mU-F, respectively. All the surfaces and the solution practically fall on a straight line passing through the origin (intercept = 0.0 ± 1.3 kJ/(M’ mol)). The correlation coefficient of 0.99 suggests that the probability of coincidence is extremely low (10-4). This linear correlation of G amd m values is a priori an unexpected finding and needs further attention. It will be picked up again in Discussion, section 4.1.2.1.
1.5 2.0 2.5
0
2
4
3
0
-3
-6
-9
ln([U
]/[F]
)
GdmCl activity, M'
∆G
U-F, k
J/m
ol[GdmCl], M
1.5 2 2.5 3 3.5
Figure 3.11: Fractions of folded ([F]) and unfolded ([U]) molecules and free energy difference between theunfolded and folded states (∆GU-F) as functions of denaturant activity. RNase H was freely diffusing in thesolution (black circles) or immobilized onto the biocompatible surfaces: cross-linked star PEG (redsquares), physisorbed BSA (green triangles), chemisorbed/cross-linked BSA (blue triangles), chemisorbedBSA covered with linear PEG 5000 (magenta triangles), and chemisorbed/cross-linked streptavidin (orangediamonds). The data were fitted with lines.

53
3.4.2 Sizes of the folded and unfolded states Comparison of the single molecule FRET histograms measured at different GdmCl concentrations (Fig. 3.10) reveals that the average FRET efficiency value of the unfolded state gradually decreased upon adding GdmCl. In Fig. 3.13a, we plotted the average FRET efficiency values of the unfolded state for RNase H immobilized on different biocompatible surfaces. Additionally, we plotted the average FRET of the folded state (on the cross-linked PEG surface). In Fig. 3.13b, we plot the width of both the unfolded and folded distributions. Our data show no evidence for GdmCl-induced changes of the native state. However, the size of the unfolded state, inversely proportional to the FRET efficiency, clearly increases in a non-linear manner. At the same time, the observed width of the unfolded state decreases by a factor of ~2.8, implying faster averaging between different conformations within the denatured ensemble. The size of the unfolded state behaves identically on different surfaces. This shows that there is no interaction between the surfaces and the unfolded chain of RNase H. Therefore, the observed changes of the unfolded state are intrinsic properties of the protein.
0 10 20 30 400
-10
-20
solution xl-PEG
xl-BSA
xl-BSA/PEG 5000
xl-strept.
phys. BSA
mU
-F, k
J/(M
' mol
)
∆GU-F(0), kJ/mol
Figure 3.12: Linear correlation between ∆GU-F (0) and mU-F values for RNase H in solution and ondifferent surfaces: cross-linked star PEG (xl-PEG), chemisorbed cross-linked BSA surface covered withlinear PEG 5000 (xl-BSA/PEG 5000), cross-linked BSA (xl-BSA) and streptavidin (xl-strept.), andphysisorbed BSA (phys. BSA). The linear fit of the data yielded a correlation coefficient of 0.99, anintercept of 0.0 ± 1.3 kJ/(M’ mol), and a slope of –0.75 ± 0.05 1/M’, which corresponds to the averagemidpoint Dm = 1.33 M’ (Cm = 1.62 M).

54
3.4.3 Reorientation times of the dyes attached to RNase H In order to interpret FRET efficiency values, we need to know how the dye dynamics alters the observed FRET efficiency. For this, we need to determine their rotational timescales. The dye mobility during their radiative lifetime can be measured by ensemble polarization spectroscopy. RNase H samples, labeled either with Alexa 546 or Alexa 647, were excited with linearly polarized light at 514 nm and 633 nm, respectively, and their fluorescence was detected at 570 nm and 670 nm, respectively. The polarization, P, was calculated from the emission intensities polarized parallel, IY, and perpendicular, IX, to the polarization of the excitation light,
XY
XY
IIIIP
+−
= . (3.3)
For Alexa 546, we found PF = 0.21, PU = 0.17, and for Alexa 647, PF = 0.37, PU = 0.27, where the subscripts F and U denote folded and unfolded conformations of RNase H, measured in buffer and 3.5 M GdmCl, respectively. The high polarization values, which decrease only slightly upon protein denaturation, indicate that dye reorientaion is much slower than the fluorescence lifetime, which is ~1 − 2 ns (46). This slow dynamics can arise from the interactions of the dye moieties with the polypeptide chain. To access the dye dynamics on the slower timescales, we performed single molecule measurements on immobilized RNase H. To separate dye motions with respect to the protein from rotations of the protein, RNase H was adsorbed directly onto a cleaned glass surface, which eliminates protein rotation as whole. We excited the samples with circular-polarized light at 532 nm and 633 nm for Alexa 546 and Alexa 647, respectively, and the collected fluorescence was split into 2 channels with orthogonal polarizations, X and Y. The single-molecule fluorescence time traces of immobilized RNase H were recorded with a time-bin resolution of 1 ms (Fig. 3.14).
0 1 2 3
0.4
0.6
0.8
1.0 0 1 2 3 4 5 6[GdmCl], M
<E>
GdmCl activity, M'
0 1 2 30.0
0.1
0.2
σ E
0 1 2 3 4 5 6[GdmCl], M
GdmCl activity, M'
(a) (b)
Figure 3.13: The mean (a) and the width (b) of single-molecule FRET distributions. Black squares andcircles are the folded and unfolded populations, respectively, of RNase H immobilized on cross-linked PEGsurface. Gray triangles, open squares, and half-filled diamonds are average FRET values of unfoldedRNase H immobilized on cross-linked BSA, cross-linked BSA covered with linear PEG, and cross-linkedstreptavidin, respectively.

55
The polarization values were calculated according to Eq. 3.3 by averaging the fluorescence signals over the entire time traces before the photobleaching of the dyes. Only traces showing single-step bleaching were analyzed. Fig. 3.15a and b summarizes the histograms of the polarizations calculated from individual RNase H molecules at different solvent conditions. In buffer, for both Alexa 546 (Fig. 3.15a) and Alexa 647 (Fig. 3.15b) labeled RNase H, we observe wide distributions of the polarization values, suggesting that the orientation of the dyes is not averaged even on the second time scale. In the case of unfolded RNase H (6 M GdmCl), the distributions collapse to the single value P = 0, indicating complete averaging of the dye orientations. At 1.7 M GdmCl, we see a superposition of the wide and narrow distributions, as expected for a mixture of the folded and unfolded molecules at this denaturant concentration. To determine the timescale of dye rotations in the unfolded state, we evaluated the auto- and cross-correlation functions of the X and Y polarized components of the emitted light. The data were recorded with 10 µs resolution, the unfolded molecules were selected by their polarization values P ≈ 0.0, and the individual correlation functions were averaged over 60 measured molecules to increase the statistical significance (Fig. 3.15c and d). Because rotation of dye dipoles in XY plane causes anticorrelated fluctuations of X and Y polarization components, one would expect a negative cross-correlation on timescales relevant to the rotations of the dyes (see section 2.2.7 for the details). However, we observed the opposite effect for both Alexa 546 and Alexa 647. The cross-correlations were positive and, within the experimental error, similar to the auto-correlation functions. This suggests that the dye rotations are averaged faster than the fastest monitored time of the correlation functions, τ = 30 µs. The observed
0 2 40
1
2
3
4C
ount
rate
, kH
z
0 1 2 3 40
1
2
3
4
5
Time, s
0 1 2 30
2
4
6
8
Cou
ntra
te, k
Hz
Time, s
Figure 3.14: Representative polarization timetraces from Alexa 546 attached to RNase Habsorbed onto bare glass. The sample wasexcited by 532-nm circular-polarized laser light.X and Y emission polarization components areshown in black and gray colors, respectively.(a) and (b) were recorded in buffer; (c) wasrecorded in 1.7 M GdmCl.
(a) (b)
(c)
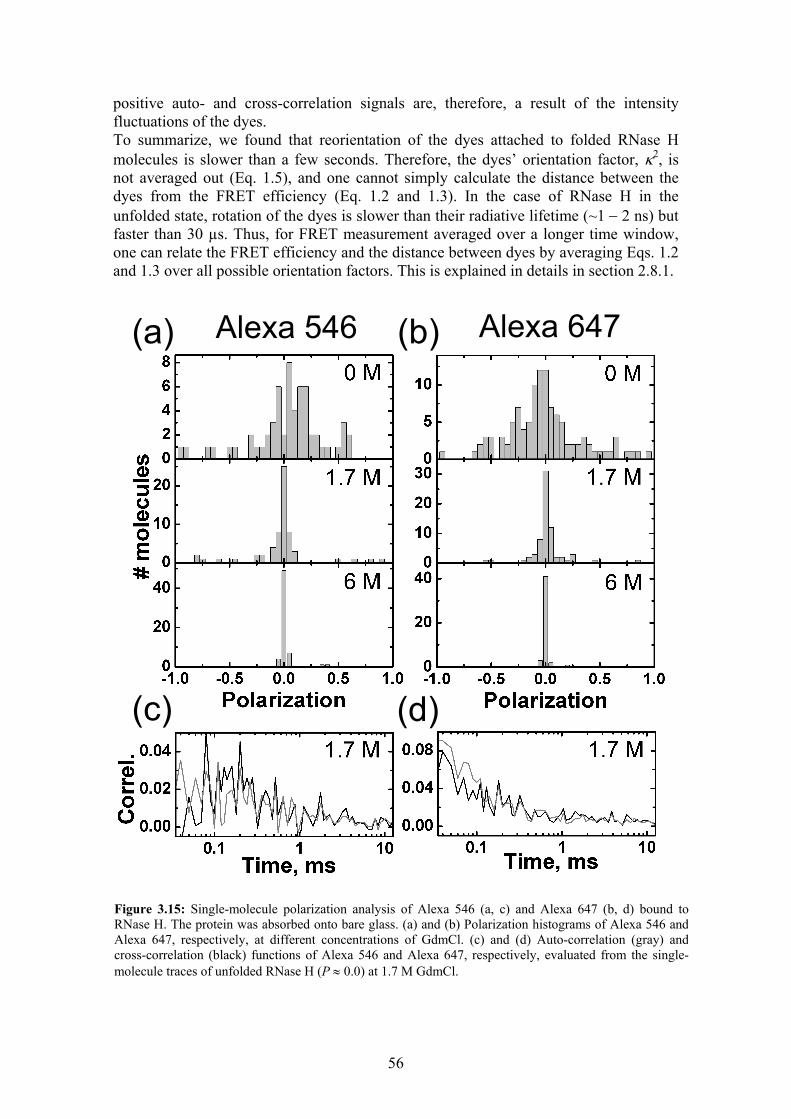
56
positive auto- and cross-correlation signals are, therefore, a result of the intensity fluctuations of the dyes. To summarize, we found that reorientation of the dyes attached to folded RNase H molecules is slower than a few seconds. Therefore, the dyes’ orientation factor, κ2, is not averaged out (Eq. 1.5), and one cannot simply calculate the distance between the dyes from the FRET efficiency (Eq. 1.2 and 1.3). In the case of RNase H in the unfolded state, rotation of the dyes is slower than their radiative lifetime (~1 − 2 ns) but faster than 30 µs. Thus, for FRET measurement averaged over a longer time window, one can relate the FRET efficiency and the distance between dyes by averaging Eqs. 1.2 and 1.3 over all possible orientation factors. This is explained in details in section 2.8.1.
(d) (c)
(a) (b) Alexa 546 Alexa 647
Figure 3.15: Single-molecule polarization analysis of Alexa 546 (a, c) and Alexa 647 (b, d) bound toRNase H. The protein was absorbed onto bare glass. (a) and (b) Polarization histograms of Alexa 546 andAlexa 647, respectively, at different concentrations of GdmCl. (c) and (d) Auto-correlation (gray) andcross-correlation (black) functions of Alexa 546 and Alexa 647, respectively, evaluated from the single-molecule traces of unfolded RNase H (P ≈ 0.0) at 1.7 M GdmCl.

57
3.4.4 Rates of conformational changes
3.4.4.1 Transitions between states
To explore structural fluctuations of the protein, we measured single-molecule fluorescence traces of RNase H labeled with the FRET pair of dyes. The protein was immobilized on a cross-linked star PEG surface which, as we demonstrated above, does not interfere with the folding of RNase H. Fig. 3.16a shows examples of the traces recorded near the folding/unfolding midpoint, 1.7 M GdmCl. The upper frames display the donor and acceptor intensities, and the lower frames show traces of the calculated FRET efficiencies (Eq. 1.1). In nearly all traces, we observed sudden changes of FRET efficiencies, marked on the figure by blue dots. Under continuous illumination, the observation of FRET is limited by dye photobleaching (marked by red and green dots) to a few seconds. To extend the accessible time range by 2 orders of magnitude, we applied the technique of time-lapse excitation. The laser light was incident on the sample every 2 seconds for only a short period of time, 20 ms. Fig. 3.16b displays examples of traces recorded with this method.
Figure 3.16: Representative single-molecule FRET traces of RNase H immobilized on cross-linked starPEG at 1.7 M GdmCl. Green and red lines are donor and acceptor fluorescence intensities, respectively,corrected for background, cross-talk, and different detection/quantum yields of the dyes. The evaluatedFRET efficiencies are plotted with blue lines. Blue, red, and green dots mark FRET jumps and bleachingevents of the acceptor and donor, respectively. The data were measured (a) under the continuousillumination, and (b) with time-lapse excitation for 20 ms every 2 s.
(a)
(b)
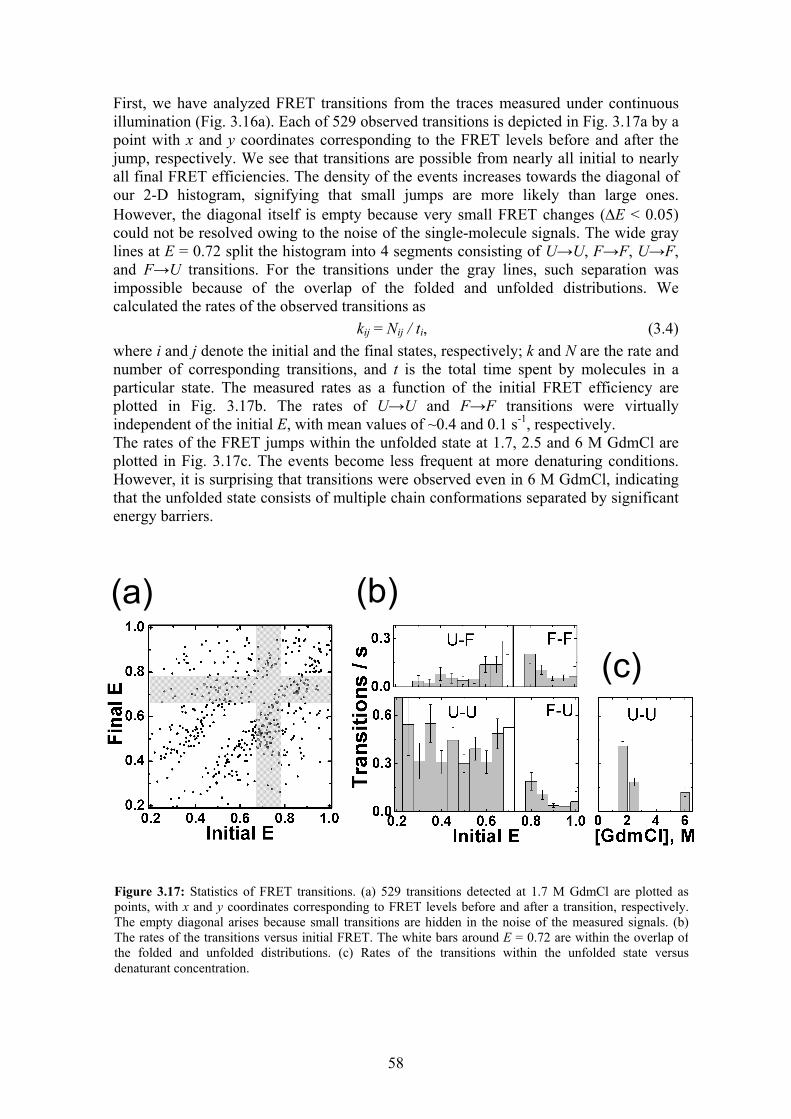
58
First, we have analyzed FRET transitions from the traces measured under continuous illumination (Fig. 3.16a). Each of 529 observed transitions is depicted in Fig. 3.17a by a point with x and y coordinates corresponding to the FRET levels before and after the jump, respectively. We see that transitions are possible from nearly all initial to nearly all final FRET efficiencies. The density of the events increases towards the diagonal of our 2-D histogram, signifying that small jumps are more likely than large ones. However, the diagonal itself is empty because very small FRET changes (∆E < 0.05) could not be resolved owing to the noise of the single-molecule signals. The wide gray lines at E = 0.72 split the histogram into 4 segments consisting of U→U, F→F, U→F, and F→U transitions. For the transitions under the gray lines, such separation was impossible because of the overlap of the folded and unfolded distributions. We calculated the rates of the observed transitions as
kij = Nij / ti, (3.4) where i and j denote the initial and the final states, respectively; k and N are the rate and number of corresponding transitions, and t is the total time spent by molecules in a particular state. The measured rates as a function of the initial FRET efficiency are plotted in Fig. 3.17b. The rates of U→U and F→F transitions were virtually independent of the initial E, with mean values of ~0.4 and 0.1 s-1, respectively. The rates of the FRET jumps within the unfolded state at 1.7, 2.5 and 6 M GdmCl are plotted in Fig. 3.17c. The events become less frequent at more denaturing conditions. However, it is surprising that transitions were observed even in 6 M GdmCl, indicating that the unfolded state consists of multiple chain conformations separated by significant energy barriers.
(a) (b)
(c)
Figure 3.17: Statistics of FRET transitions. (a) 529 transitions detected at 1.7 M GdmCl are plotted aspoints, with x and y coordinates corresponding to FRET levels before and after a transition, respectively.The empty diagonal arises because small transitions are hidden in the noise of the measured signals. (b)The rates of the transitions versus initial FRET. The white bars around E = 0.72 are within the overlap ofthe folded and unfolded distributions. (c) Rates of the transitions within the unfolded state versusdenaturant concentration.
59
We cannot interpret F→F FRET transitions because the rotation of the dyes on folded RNase H is not averaged and, therefore, different E values can correspond to the same inter-dye distance but with different dye orientations, and vice versa. The average rates of folding and unfolding transitions, U→F and F→U, were ~0.04 s-1. However, these values should be taken with caution since the time window of the experiment of ~1 second is very small compared to the anticipated time between the events of tens of seconds. Furthermore, it is not possible to avoid misclassification of some U→U and F→F transitions as U→F and F→U transitions because of the distribution overlap. In this case, the rate of the more frequent U→U and F→F jumps will dominate the slow rate of the folding/unfolding. More accurate results for U→F and F→U transitions can be obtained with time-lapse illumination. In this method, we increase the observation time by 2 orders of magnitude and the fast transitions become averaged within a few 2-s time bins. With this approach, we calculated the unfolding and unfolding rates as kUF = NUF / tU = (1.1 ± 0.4) × 10-2 s-1 and kFU = NFU / tF = (0.8 ± 0.3) × 10-2 s-1, respectively. The apparent rate of the folding, kapp = kUF + kFU = (1.9 ± 0.5) × 10-2 s-1, is in excellent agreement with published values of ≈ 2 × 10⁻² s-1 measured by ensemble CD (25) and tryptophan fluorescence (100) spectroscopies at 1.7 M GdmCl and 25 °C.
3.4.4.2 Reconfiguration of the unfolded protein chain
To examine protein dynamics on the sub-millisecond timescale, we cross-correlated the donor and the acceptor fluorescence from 249 unfolded RNase H molecules (0.22 < E < 0.72). The correlation functions were evaluated separately for each segment of a single-molecule trace between sudden FRET jumps. For statistical reasons, we included only fragments longer than 200 ms. The average cross-correlation function (Fig. 3.18a) shows a biphasic decay, and its negative amplitude indicates anti-correlated changes in donor and the acceptor signals due to FRET fluctuations. These fluctuations can reflect the dynamics of the polypeptide chain and the photodynamics of the dyes (blinking). To distinguish these effects, we calculated the correlation functions of the donor and acceptor fluorescence in the absence of FRET (Fig. 3.18b and c). For Alexa 546, the unfolded molecules were selected by their FRET efficiency 0.22 < E < 0.72, and the auto-correlation functions were evaluated from the donor fluorescence after acceptor bleaching. For Alexa 647, the measurements were conducted at 2 M GdmCl where the vast majority of RNase H molecules are denatured and the acceptor was excited directly with 633 nm light. The auto-correlation functions of the dyes have similar amplitudes and decay with similar time constants (90 ± 10 µs for Alexa 546, and 250 ± 70 µs for Alexa 647). Moreover, the time scale of the dye intensity fluctuations resembles the second step of the cross-correlation function. Thus, this slow component arises from intrinsic fluctuations of the dye emission. We fit the cross-correlation function with a sum of 3 exponents. The decays of the first two were fixed at 90 and 250 µs to model the dye-dependent dynamics; their sum, shown by the dashed line in Fig. 3.18a, reproduced the slow step of the cross-correlation. The time constant of the third exponent in the fit, describing fast polypeptide fluctuations, was 20 ± 5 µs.

60
3.4.5 Modeling dynamic heterogeneity of the unfolded state
3.4.5.1 Data
Fig. 3.19a shows a histogram of root-mean-square distances between the dyes, ra, and the respective radii of gyration, RG, calculated from single-molecule traces of RNase H at 1.7 M GdmCl. The average FRET efficiency values were converted to distances as described in section 2.8. The unfolded state was described by a Gaussian chain and we took into account that the dye rotations were slower than the rate of energy transfer but faster than the time binning of the experiment (see section 3.4.3). The observed distribution of the unfolded sub-population can be described well by a Gaussian function. It is much broader (standard deviation σ = 12 Å) than the native state ensemble and the expected distribution due to statistical uncertainties (σ = 2.6 Å), originating from the noise in the fluorescence signals and errors of the background, cross-talk and the detection correction factor, γ. The question arises whether the width of the unfolded state is determined by static or dynamic heterogeneity of the ensemble. In the case of static heterogeneity, molecules exhibit dissimilar behavior (i) due to variations in their microenvironment or (ii) if they
-0.10
-0.05
0.00
Cor
rela
tion
0.1 10.00
0.02
0.04
Time, ms
0.00
0.05
0.10
(b)
(a)
(c)
Figure 3.18: Average correlation functions of the unfolded RNase H at 1.7 M GdmCl, calculated from thesingle-molecule traces. (a) Cross-correlation of the donor and the acceptor signal, averaged over 249unfolded molecules (0.22 < E < 0.72) The solid line is 3-exponential fit. The slow step, shown with thedashed line, was modeled by 2 exponents, with time constants fixed at 90 and 250 µs, the values obtainedin (b) and (c) for the dye photodynamics. The time constant of the fast decay was 20 ± 5 µs. (b) Theaverage auto-correlation function of the donor Alexa 546, measured after the bleaching of the acceptor.Unfolded molecules were selected by FRET before the acceptor bleaching. The single exponential fit (solidline) yielded a decay time of 90 ± 10 µs. (c) The auto-correlation decay of the acceptor Alexa 647measured with 633-nm excitation at 2 M GdmCl, where RNase H is predominantly in the unfolded state.The data were fitted with a single exponential with a time constant of 250 ± 70 µs.

61
are trapped in different conformations such that the interconversion is much slower than the time window of the experiment. By contrast, dynamic heterogeneity implies that every molecule fluctuates from one configuration to another, and can explore the full width of the conformational space during the data aquisition. To distinguish the two situations, we have compared the distribution of inter-dye distances in the unfolded state, P(ra), (Fig. 3.19a), with the distribution of distance changes in the observed FRET transitions, P(∆ra), (Fig. 3.19b).
3.4.5.2 Model
Let us consider an unfolded ensemble, which consists of many substates. The free energy of the ith state, Gi, is described by a parabolic function of the inter-dye distance, ri,
( )2
2
2σUii rr
RTG −
= , (3.5)
where rU = ⟨ri⟩ is the average size of the entire unfolded ensemble, σ is the width of the distribution, R denotes the gas constant, and T is the absolute temperature. According to Boltzmann’s law, the probability density to find a molecule in a particular state, P(ri), is proportional to exp(−Gi/RT), and therefore has a Gaussian shape (Fig. 3.19a),
( )
−−=
2
2
2exp
21)(
σσπUi
irrrP . (3.6)
The probability density to observe a transition from state i to state j is
Figure 3.19: Dynamic heterogeneity of unfolded RNase H at 1.7 M GdmCl. (a) Distribution of the dyeseparation, ra, and radius of gyration, RG, calculated from single-molecule traces. The folded and unfoldedpopulations were fitted with a log-normal and a gaussian distribution. The gray Gaussian shows thedistribution expected from the statistical noise of the data. (b) The histogram of the size changes ascalculated from FRET transitions within the unfolded ensemble. The solid line is a fit to the model of theunfolded state containing many substates.
10 20 30
20 40 60 800
20
40
60
80
100
# M
olec
ules
ra, Å
RG, Å10 20
20 40 600
20
40
60
80
# Tr
ansi
tions
∆ra, Å
∆RG, Å
(b) (a)

62
( ) ( ) Uijiji TkrPrrP =→ , (3.7)
where kij is the transition rate coefficient, and TU is the total time that the unfolded state was observed. We assume that the unfolded substates are separated by free energy barriers of a similar height so we can use an average value, ∆G. Furthermore, we assume that once a barrier is overcome, the molecule may settle down in any of the lower-energy states with equal probabilities. Consequently, we apply Arrhenius rate law
−−=
RTGG
Ak iijij exp , (3.8)
where Gij is the energy of the transition state between conformations i and j. The pre-exponential factor, Aij, for simplicity, was assumed to be identical for all transitions. Now, we insert the average barrier height, ∆G,
, if
, if
j
j
iiij
ijij
GGGGG
GGGGG
<∆+=
>∆+= (3.9)
and obtain the well-known Metropolis Monte Carlo rule (159),
−−=
RTGG
Bk ijij exp,1min . (3.10)
Here, the pre-factor , B = A exp (− ∆G / RT), is constant for all transitions. Incorporation of this relation in Eq. 3.7 gives
( ) ( )
−∝→
RTGG
rrP jiji
,maxexp . (3.11)
Thus, the probability density to observe a transition with a given change, ∆r, is
( ) ( ) ( )∫∫∆
∝∆−→+∆+→=∆σ22
erfc rdrrrrPdrrrrPrP iiiiii , (3.12)
where erfc denotes the complementary error function.
3.4.5.3 Results
The fit of the P(∆ra) distribution with Eq. 3.12, plotted in Fig. 3.19b, results in σ = 11 Å, which is close to σ = 12 Å obtained for P(ra) in Fig. 3.19a. This signifies that the observed width of the unfolded population is dominated by dynamic heterogeneity of the denatured state and provides an additional prove that the immobilization on the cross-linked PEG surface does not interfere with the structural fluctuations of RNase H.
3.4.6 Modeling the expansion of the unfolded state
3.4.6.1 Data
In Fig. 3.13a, we showed that higher concentrations of the denaturant GdmCl caused an expansion of the unfolded RNase H. To quantify the thermodynamics of this process, we modeled the expansion by an equilibrium shift between denatured conformations of different compactness. This equilibrium of substates within the unfolded state will influence the folding/unfolding equilibrium. Therefore, we performed a global fit of the mean FRET efficiency of the unfolded ensemble and the free-energy difference between the folded and unfolded populations, displayed in Fig. 3.20a.

63
3.4.6.2 Model
Equilibrium within the unfolded ensemble To quantitatively describe the observed expansion of RNase H, we further developed the model proposed by Parker and Marqusee (Fig. 1.7b) (100, 101). The authors described properties of the unfolded substates as function of their cooperativity factors (m-values). For simplicity, they assumed that m-values of the unfolded substates, U1 ... UN, are homogeneously distributed among the cooperativity values from mU1 to mUN and the free energies of the unfolded states, GU1 ... GUN, are linearly coupled to their m-values (100, 101),
( )11 UUUU mmGG
ii−−=− γ , (3.13)
where Ui is the ith unfolded substate, and γ is a proportionality coefficient. Although, this can be considered as a first-order approximation to the problem, native-state hydrogen exchange experiments indeed revealed a linear correlation between the m-values and free energies of the unfolded substates (100, 101). According to the corrected LEM (see section 2.7, Eqs. 2.31 and 2.32), the free energy of a state depends linearly on the denaturant activity, D,
( ) ( ) DmGDGiii UUU += 0 . (3.14)
In the parentheses, we specify the denaturant activity at which the free energy is measured. From Eqs. 3.13 and 3.14, it follows that
( ) DD −= )0(γγ (3.15)
( )1
10UU
UU
mm
GG
N
N
−
−−=γ . (3.16)
(b) (a)
Figure 3.20: Modeling the expansion of the unfolded state. (a) Global fit of the single molecule FRET datawith a continuum of unfolded states. The solid lines represent the fit using x
GqRm = , while the dashed linesrepresent the fit using . (b) Average FRET efficiency values and fit, converted to RG.The broken line at 17.5 Å corresponds to the radius of gyration of folded RNase H (183).
xGGF F
RRqmm )( −=−

64
γ(0) can also be interpreted as the midpoint of the transition within the unfolded state because, when D = γ(0), all the unfolded substates have the same free energy and, thus, are equally populated. The average (observed) FRET efficiency of the unfolded state, E , is given by
∑ ==
N
i UU iiPEE
1, (3.17)
where EUi is the FRET efficiency of the ith substate, and the probability to find an unfolded protein in the sub-state Ui, iUP , is given by
∑ =
= N
i UU
UUU
i
i
i K
KP
1 /
/
1
1 . (3.18)
Here1UUi
K is the equilibrium constant between the ith substate and the lowest unfolded substate, U1, which can be calculated from Boltzmann’s law,
[ ][ ]
( )
−=
−−=≡
RTmm
RTGG
UUK UUUUi
UUii
i
11
1expexp
1/
γ. (3.19)
Substituting Eq. 3.19 in Eq. 3.18, we can express iUP as a function of m. In the limit of
an infinite number of homogeneously distributed unfolded states, the probability transforms to the probability density, P(m), and the sum over states turns to the integral over m, then
1)(
exp
)(exp
)(1
1
−
−
−
⋅=
RTmm
RTmm
RTmP
UU
U
Nγ
γ
γ , (3.20)
and Eq. 3.17 becomes
∫= NU
U
m
mdmmPmEE
1
)()( . (3.21)
To evaluate E(m), we need to relate m to the distance between the dyes, which is related to the size of the protein. As we discussed in section 2.7, the cooperativity factor m is proportional to the protein surface area exposed to the solution (140, 142). The surface area of a solid sphere is proportional to the squared radius, i.e. m ∝ 2
GR . In general, we can write
xGqRm = , (3.22)
where q and x are empirical proportionality coefficient and exponent, respectively. Many studies have pointed out that already a little increase in protein size as compared with the folded state is sufficient for solvent penetration, and hence, for a large increase in SASA (160-164). This would correspond to x < 1. Alternatively, this situation can be modeled by relating m and RG as follows,
( )xGGF F
RRqmm −=− , (3.23)
where FGR and mF denote the radius of gyration and the cooperativity for the folded
state, respectively. Now, we can calculate E(m) by relating m to RG with Eqs. 3.22 or 3.23, and RG to the inter-dye distance and FRET with Eqs. 2.41, 2.40 and 2.39

65
(Materials and methods, section 2.8). Finally, we fit our observed E by numerical integration of Eq. 3.21. Effect of the expansion on the folding/unfolding equilibrium So far, we have considered only the equilibrium within the unfolded ensemble. Next, we evaluate the effect of the continuum of unfolded substates on the folding/unfolding equilibrium. We start with the equilibrium coefficient between the entire unfolded and the folded states,
[ ][ ]
[ ][ ]
[ ][ ]
[ ][ ]
.expexp 11
1
1/
∑
∑∑
−−
−−=
===≡
i
UUFU
ii
ii
FU
RTGG
RTGG
UU
FU
FU
FUK
i
(3.24)
Here, GF is the free energy of the folded state, which is also a linear function of the denaturant activity according to the corrected LEM, and thus
( )DmmGGDGDG FUFUFU −+−=−111
)0()0()()( , (3.25)
where mF is the cooperativity of the folded state, which we assume to be described by the same dependency on the radius of gyration as for the unfolded states (Eq. 3.22 or 3.23). In the limit of a large number of unfolded substates, N, homogeneously distributed between
1Um and NUm , the sum of Eq. 3.24 becomes an integral over m and
we obtain
[ ][ ]
( ) ( )( )( )
1
1111exp)0()0(
expUU
UUFUFU
mmmm
RTDmmGG
NFU
N
N
−
−−⋅
−+−−⋅=
γγ
. (3.26)
The effective free energy of the total unfolded ensemble, GU, is given by Boltzmann’s law,
[ ][ ]
−−=
RTGG
FU FUexp , (3.27)
and, therefore, [ ][ ]
( ) ( ) ( )( )( ) ,
1expln)0(ln)0(
ln)()(
1
1
11
−
−−−−+−−=
=
−=−
UU
UUFUFU
FU
mmmm
RTDmmGNRTG
FURTDGDG
N
N
γγ (3.28)
with γ defined in Eq. 3.15.
3.4.6.3 Results
The global fit of the average FRET efficiency of the unfolded state and free energy difference between the folded and unfolded state (Fig. 3.20a) resulted in the following 90% confidence intervals of the exponent, x: 0.3 < x < 1.5 for x
GqRm = , and
0.2 < x < 1.2 for ( )xGGF F
RRqmm −=− . The best-fit parameters and their interpretation are listed in table 3.2. The fits of the experimental data are presented in Fig. 3.20a, and the radius of gyration of the unfolded RNase H calculated from the FRET efficiency values is plotted in Fig. 3.20b. For both assumptions, x
GqRm = and

66
( )xGGF F
RRqmm −=− , the fitted parameters and curves are very similar. Interestingly, the size of the unfolded state in buffer is very small (~23 Å). It is closer to the size of the folded state (~18 Å) than to the size of the unfolded state in 6 M GdmCl (~38 Å) (Fig. 3.20b). Table 3.2: Parameters from the global fit of the folding/unfolding transition and the expansion of the unfolded state of RNase H measured by single-molecule FRET.
Quantity Parameter xGqRm =
xGG
F
FRRq
mm)( −=
=−
Size of the folded state Å,FGR 17.5*
Size of the most compact
unfolded state Å,
1UGR 24 ± 1 21 ± 3
Size of the largest unfolded state
Å,NUGR 38.5 ± 0.5 40 ± 1
Cooperativity of the transition between the folded and the first
unfolded substate
,1 FU mm −
kJ/(mol M’) −11.5 ± 0.5 −12 ± 1
Cooperativity of the transition between the folded and the largest unfolded substate
,FU mmN
− kJ/(mol M’)
−39 ± 2 −33 ± 3
(a) Slope of G versus m in the absence of the denaturant
(b) Midpoint of the transition within the unfolded ensemble
γ(0), M’
1.45 ± 0.05 (1.8 ± 0.1)**
1.25 ± 0.25 (1.5 ± 0.4)**
Free energy difference between the most compact unfolded and
the folded states in buffer
( ) ),0(ln)0(1 FU GNRTG −−
kJ/mol 14 ± 1 17 ± 1
Free energy difference between the total unfolded and folded
states in buffer
),0()0( FU GG − kJ/mol
20.5 ± 0.5 23 ± 1
* fixed according to Ref. (183) ** corresponding values of GdmCl concentration, M.
3.5 Enzymatic function of RNase H on cross-linked PEG surfaces
The FRET experiments under varying denaturant concentration can directly access the stability of the folded state only in the transition region, where both folded and unfolded states are populated. Furthermore, FRET is a measure of protein size rather than protein functionality. To prove that RNase H indeed folds in the unique native and functional structure, we tested the activity of RNase H immobilized on star PEG surfaces before and after denaturation. RNase H was labeled with Alexa 647 so that we can measure the density of immobilized proteins by their fluorescence intensity. The sample cell containing RNase H tethered to the star polymer surface was filled with a ~20 nM solution of the RNA/DNA duplex (discussed in section 2.4.3.1). The DNA and DNA-RNA-DNA strands were labeled with the dye Cy3 and the quencher QSY, respectively, so that the fluorescence from the dye is quenched to approximately 95% when the duplex is formed. RNase H hydrolyzes the RNA strand and the duplex is no
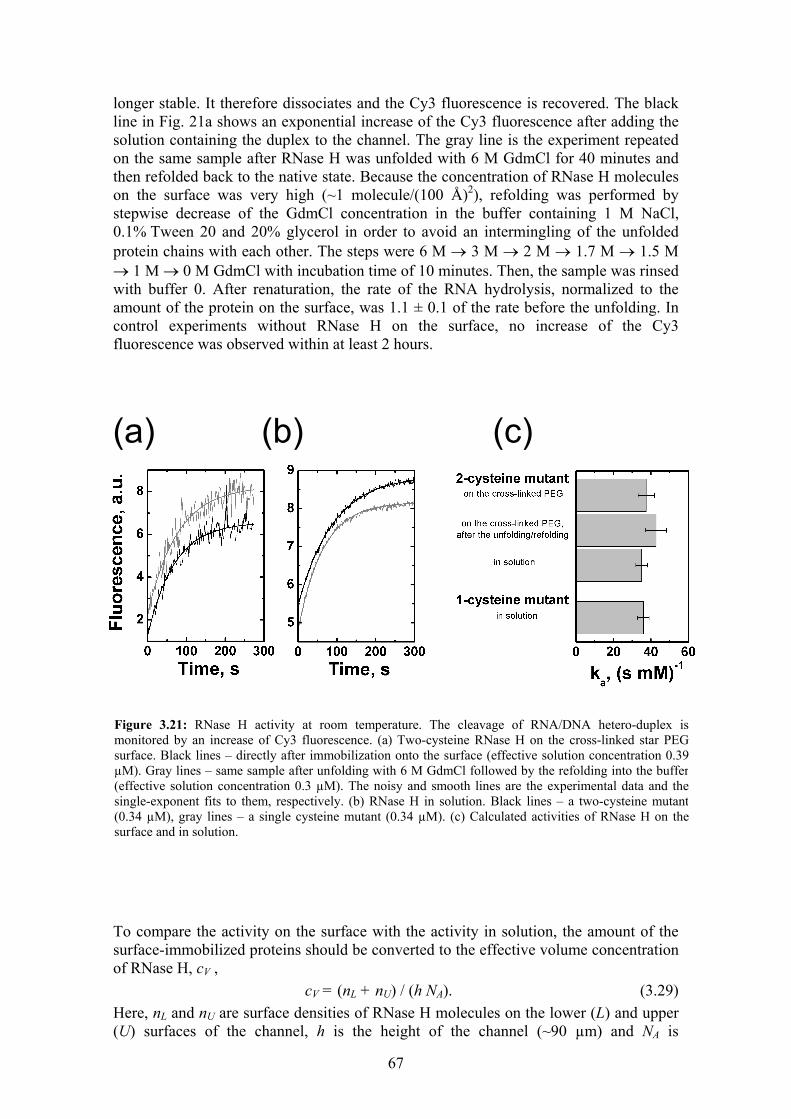
67
longer stable. It therefore dissociates and the Cy3 fluorescence is recovered. The black line in Fig. 21a shows an exponential increase of the Cy3 fluorescence after adding the solution containing the duplex to the channel. The gray line is the experiment repeated on the same sample after RNase H was unfolded with 6 M GdmCl for 40 minutes and then refolded back to the native state. Because the concentration of RNase H molecules on the surface was very high (~1 molecule/(100 Å)2), refolding was performed by stepwise decrease of the GdmCl concentration in the buffer containing 1 M NaCl, 0.1% Tween 20 and 20% glycerol in order to avoid an intermingling of the unfolded protein chains with each other. The steps were 6 M → 3 M → 2 M → 1.7 M → 1.5 M → 1 M → 0 M GdmCl with incubation time of 10 minutes. Then, the sample was rinsed with buffer 0. After renaturation, the rate of the RNA hydrolysis, normalized to the amount of the protein on the surface, was 1.1 ± 0.1 of the rate before the unfolding. In control experiments without RNase H on the surface, no increase of the Cy3 fluorescence was observed within at least 2 hours. To compare the activity on the surface with the activity in solution, the amount of the surface-immobilized proteins should be converted to the effective volume concentration of RNase H, cV ,
cV = (nL + nU) / (h NA). (3.29) Here, nL and nU are surface densities of RNase H molecules on the lower (L) and upper (U) surfaces of the channel, h is the height of the channel (~90 µm) and NA is
(a) (b) (c)
Figure 3.21: RNase H activity at room temperature. The cleavage of RNA/DNA hetero-duplex ismonitored by an increase of Cy3 fluorescence. (a) Two-cysteine RNase H on the cross-linked star PEGsurface. Black lines – directly after immobilization onto the surface (effective solution concentration 0.39µM). Gray lines – same sample after unfolding with 6 M GdmCl followed by the refolding into the buffer(effective solution concentration 0.3 µM). The noisy and smooth lines are the experimental data and thesingle-exponent fits to them, respectively. (b) RNase H in solution. Black lines – a two-cysteine mutant(0.34 µM), gray lines – a single cysteine mutant (0.34 µM). (c) Calculated activities of RNase H on thesurface and in solution.

68
Avogadro’s number. Fig. 3.21b shows the same type of the activity test performed with RNase H freely diffusing in solution with the concentration of RNase H similar to the effective volume concentration of RNase H on the surface in the previous experiment. Additionally, we measured the single-cysteine mutant of RNase H, which is published to have a 3.1-fold reduced activity compared to wild-type RNase H. Fig. 3.21c summarizes the activity constants, ka, determined as
ka ≡ kc / KM = kapp / cV. (3.30) Here, kc is the maximal turnover rate of the enzymatic reaction, KM is the Michaelis constant, kapp is the apparent rate of product formation (increase of the Cy3 fluorescence), and cV is the volume concentration of the enzyme. The error bars of the surface measurements in Fig. 3.21c also include uncertainties in the conversion of the surface densities to volume concentrations. Our studies found that the functionality of RNase H is not affected by immobilization on the cross-linked star PEG surface.

69
4 Discussion
4.1 Biocompatible surfaces
In single-molecule fluorescence studies, it is often required to immobilize investigated proteins in space to prolong the observation time of the molecule. Of utmost importance is to exclude all interfering interactions between the protein and the material whereon or wherein it is fixed so that the immobilized proteins exhibit the same behavior as proteins free in solution. Here, we examined two classes (protein- and PEG-based) of biocompatible coating for glass or quartz substrates, which also allow specific tethering of biomolecules via a biotin-streptavidin linkage. However, it should be straightforward to modify these surfaces for other immobilization techniques, e.g., coupling via His-tags incorporated in the protein sequence (54, 55).
4.1.1 Surface architecture and resistance to protein adsorption
4.1.1.1 Protein-based surfaces
In contact with water, glass surfaces become charged due to the dissociation of terminal silanol groups,
SiOH V SiO− + H+ (4.1) Therefore, the untreated glass surface is partially negatively charged, which causes strong adsorption of protein molecules with positive charges. This is especially true for RNase H since this protein is designed by nature to bind to negatively charged nucleic acids and has a pI value of 9.0 (88). One of the most often used techniques to overcome the problem of unspecific adsorption is to first passivate the glass surface with some other protein, e.g., BSA, and then to bind the protein of interest via a biotin-streptavidin linkage (69, 70). The presence of the protein layer close to the protein of interest is similar to the situation in a cell where the protein density is also very high. We studied glass surfaces passivated with layers of BSA or streptavidin. The proteins were absorbed physically (by electrostatic interactions) or chemically (by peptide bonds). Chemical binding was accompanied by the simultaneous cross-linking of the protein layer. We found that chemisorption with cross-linking radically improves the quality of the protein surfaces. For example, whereas both BSA and streptavidin chemisorbed/cross-linked surfaces resisted non-specific adsorption of RNase H, the average resistance of physisorbed BSA was 10 times less and, even worse, the surface quality strongly deviated from sample to sample. Furthermore, the physisorbed streptavidin did not resist unspecific adsorption of RNase H at all. The poor performance of the physisorbed surfaces reflects the weak nature of the electrostatic interactions involved. Streptavidin is virtually uncharged at neutral pH and therefore it is only weakly attracted to the glass surface. This explains why physisorbed streptavidin could not cover the glass surface sufficiently to prevent unspecific adsorption of RNase H. BSA has a pI of 4.7 and thus, at pH 7.4, which is used in our experiments, it is negatively charged. Therefore, it seems surprising that BSA binds to the negatively charged glass. However, it was previously observed that some proteins indeed readily adsorb to surfaces of the same charge (165-168). Bernabeu and Caprani proposed that this is possible due to co-adsorption of buffer cations to the surface (165). Zhou et al. also found that positively charged carbonic anhydrase adsorbs to positively charged

70
surfaces (168). They calculated the distribution of protein charges and identified a small negatively charged pattern on the protein surface, which can be responsible for attraction to the positive charges. This may also apply to BSA. First, the charges are non-uniformly distributed along the primary sequence of BSA. The first two domains are heavily negative with net charges of –10 and –8, respectively, whereas the third domain has a zero net charge (169). Second, serum albumin adopts different conformations in solution depending on pH ranging from compact to very extended structures (170). Close to the negatively charged surface, there is an excess of protons, i.e. the pH at the surface is lower than in solution. This will not only reduce the overall negative charge of BSA molecules approaching the glass but also will cause BSA to assume a flexible, extended conformation with its positive charges directed towards the glass surface. Additionally, some specific interactions can play a role in the adhesion of BSA to glass. For example, by measuring the pull-off forces, Wang et al. found that BSA interacts significantly stronger with OH-terminated than with other (–NH2, –COOH, –CH3) surfaces (171). Such OH groups are present on the glass surface as non-dissociated silanol groups (Eq. 4.1). It is interesting to compare and correlate the resistance to unspecific adsorption with the surface topography measured by atomic force microscopy (AFM) (172). It was found that streptavidin physisorbed onto glass surfaces forms patchy layers with a height difference of ~30 Å. This is similar to the size of a streptavidin molecule and in agreement with the observation of poor resistance to unspecific adsorption of RNase H. It is likely that this corresponds to the sample containing monolayers of streptavidin as well as areas of bare glass. By contrast, physisorbed BSA forms rough multilayers with average height fluctuations of ~700 Å. However, sample-to-sample variations were also very large, which correlates with the sample-to-sample variations of the resistance to unspecific protein adsorption. In contrast to physisorbed proteins, chemisorbed and cross-linked BSA and streptavidin on amino-silanized glass formed very smooth and reproducible films with roughnesses of ~20 Å (172). This again coincides with the high resistance of the chemisorbed surfaces to unspecific adsorption of RNase H. The paradox of why the negatively charged BSA does not attract positively charged RNase H, is likely a consequence of a different conformation of BSA on the surface, which results in a different pI value of the protein. Moreover, in case of chemisorption, negative groups of BSA should point primarily towards the positively charged underlying amino-layer. Although the chemisorbed/cross-linked protein surfaces show excellent homogeneity, complete coverage and exemplary resistance to unspecific adsorption of RNase H, the application of these surfaces for immobilization of an arbitrary protein is limited. For instance, we found that eqFP611 is strongly adsorbed by the chemisorbed/cross-linked BSA surface. Reasons for this can include the electrostatic attraction, and/or hydrophobic or specific interactions between the proteins.
4.1.1.2 PEG-based surfaces
Opposite to the protein-based surfaces, we found that linear PEG 5000 and cross-linked star PEG layers do not absorb either of the probe proteins. We also proved the resistance of the cross-linked star PEG surfaces to adsorption of streptavidin and avidin (136). These results concur with multiple studies showing that various materials with PEG coated onto the surface resist unspecific protein adsorption (72-77). The molecular mechanism of unspecific protein adsorption and how using biocompatible surfaces avoids it has been the subject of numerous theoretical and experimental investigations (72, 76, 78-82, 173). In general, minimally interacting biocompatible surfaces show hydrophilicity and electrical neutrality, and should provide hydrogen-bond acceptors

71
but not donors (72, 174). Indeed, this list of properties describes the chemical properties of PEG. However, we found that our surfaces prepared from PEG 2000 cannot prevent unspecific adsorption of RNase H. For this surface, areas in which protein adsorption was completely eliminated coexisted with areas in which protein binding was not prevented at all. One can argue that incomplete surface coverage may account for this. Therefore, we tried to increase (up to the solubility limit of the polymer) and to reduce the concentration of PEG used for binding to the surface in order to study the effect of concentration on the surface quality. We also increased the temperature of the reaction of PEG to the surface to 37 °C. However, under all conditions investigated, PEG 2000 coated surfaces did not prevent unspecific protein adsorption. The surface resistance to unspecific protein adsorption to PEG-based surfaces also correlates with the topography of the surfaces measured by AFM (136, 172). Cross-linked PEG and PEG 5000 coated surfaces were extremely smooth, with root-mean-square roughness on the order of 10 Å (136, 172). In contrast, PEG 2000 surfaces showed micrometer-sized structures. These structure were very smooth areas but had a large height difference between them (172). This was observed for films prepared from 10% w/v PEG solutions but for higher concentrations (100% w/v), PEG 2000 layers were uniform and smooth (roughness ~10 Å). The difference between PEG 5000 and PEG 2000 can be explained in terms of the grafting density and the structure of the hydrated PEG chains on the surface. Due to excluded volume effects, hydrated PEG chains in solution stay in the form of isolated coils until they are forced to overlap by high concentrations of the polymer (77). The critical concentration, Ccrit, where this overlap occurs can be determined from the radius of gyration of PEG molecules, RG, (77),
33
4GA
mcrit RN
MC
π⋅= . (4.2)
Here, NA is Avogadro’s number, and the radius of gyration can be evaluated from the molecular mass of PEG, Mm (175),
RG = 0.215 Mm 0.583. (4.3) Therefore, for PEG 5000, RG = 30 Å, and Ccrit = 6.5% w/v, while for PEG 2000, RG = 18 Å and Ccrit = 13% w/v (172). Thus, at the standard concentrations used in our experiments, 10% w/v, PEG 5000 chains overlap in solution and adsorb on the surface as a homogeneous monolayer. However, at 10% w/v, the majority of PEG 2000 molecules do not interact with each other, and only a small fraction of them overlaps. Thus, upon adsorption, it forms areas of different grafting density, and, therefore, of different height of PEG layer. However, the question remains why, even at high concentrations, PEG 2000 cannot prevent unspecific adsorption of RNase H. Despite a common assumption that ethylene glycol segments repel proteins (73, 74, 80, 176), a growing number of experimental studies show evidence of protein binding to PEG (177-182). Protein adhesion to PEG layers was found to be dependent on the particular protein, PEG molecular weight, grafting density, temperature, and PEG conformation, which can be altered by protein binding (180-182). In particular, Xu and Marchant studied the protein-binding resistance of PEG 2000 in different conformations corresponding to varying grafting densities (from low to high): pancakes, overlapping mushrooms, and dense brushes (181). They found that adsorption of plasma proteins onto the surface increased at higher concentrations of PEG 2000. Besides the higher PEG-protein attraction at higher PEG concentrations, it was proposed that brush-like PEG are less resistant to protein adsorption than mushroom-like PEG due to entropic reasons (74, 76, 176). Specifically, the entropic barrier to penetrate between brushes and

72
to adsorb on the glass is much less than the entropic barrier to penetrate through intermingled mushrooms, where it is additionally required to expel solvation water molecules. Therefore, we explain the low resistance of PEG 2000 to protein adsorption in our experiments as follows. At very low concentrations of PEG 2000, there are large surface areas that are not sufficiently covered by polymer molecules to prevent protein adsorption. At intermediate concentrations, PEG 2000 coexists in 2 conformations: mushroom-like and brush-like, the latter of which is less resistant to protein adsorption. At high grafting densities, PEG 2000 forms only brush-like structures, which are also less resistant to protein adsorption. In contrast, PEG 5000 completely covers the surface with only a homogeneous and very resistant layer of mushroom-like structure (75). This is because Ccrit for PEG 5000 is 2 times lower than for PEG 2000. From the factor of 2.5 in their molecular mass, 5 times less polymer molecules are required to cover the surface completely in the case of PEG 5000. Moreover, Sofia et al. showed that increasing the PEG concentration in solution above its Ccrit concentration will not lead to an increase of PEG bound to the surface (77). In the case of cross-linked PEG surfaces, there is no way for the protein to penetrate between the PEG chains, which results in its excellent resistance to protein adsorption.
4.1.2 Protein structure on surfaces
4.1.2.1 Protein-based surfaces
For all protein-based surfaces, we found that the immobilized RNase H retained its folded structure, as visualized by FRET, and that denaturation of the protein with GdmCl was reversible. However, detailed analysis showed that, when tethered to the physisorbed BSA layer, a non-negligible fraction of RNase H molecules did not refold properly after the unfolding. Furthermore, the slope of the free energy difference between the unfolded and the folded state versus denaturant concentration/activity was markedly different from the slope measured with RNase H in solution. The slope of the free energy versus denaturant concentration/activity, the so-called cooperativity factor mU-F, was shown to be a linear function of the protein surface area exposed to the solution, i.e. the protein size, with only small random variations from protein to protein (140, 142). That is to say, the change of the cooperativity value usually indicates significant perturbation of the protein structure. These considerations, however, are applicable only to a homogeneous ensemble of protein molecules. In Fig. 3.12, we showed that for the different surfaces studied here, the decrease of the m-value resulted in a correlated decrease of the apparent protein stability, ∆GU-F (0), so that the midpoint of the folding/unfolding transition was conserved. This is an unlikely coincidence and indicates that we observe ensembles of molecules whose energetics are distributed (with different widths) around the same average values in all cases, specifically, around the stability and the cooperativity of the protein in solution. In this case, the majority of the molecules will unfold the same as in solution, at around 1.7 M GdmCl, but, due to variations of the environment, some will unfold at lower and some at higher concentrations of GdmCl. This results in a broadening of the observed folding/unfolding transition and therefore in a decrease of the apparent mU-F and the extrapolated ∆GU-F (0) value. The largest difference from the solution m-value was observed for molecules on the physisorbed BSA surface. Indeed, variations in the BSA-film thickness would lead to very different environmental conditions for each molecule. Furthermore, the addition of

73
GdmCl also removes a large part of the BSA layer (Fig. 3.4), causing even more heterogeneity of the environment of the tethered RNase H than in the buffer conditions. Chemisorption/cross-linking of BSA or streptavidin onto the glass surfaces resulted in smoother, more reproducible and more stable protein layers. Therefore, less surface-induced heterogeneity is expected. Indeed, the free energy slope for the cross-linked protein surfaces approaches the slope for the solution measurements. In the case of the cross-linked streptavidin, small deviations from the solution parameters can be attributed to the very close proximity of RNase H to the surface. Regarding BSA, we propose that even though the cross-linking prevents complete unfolding of BSA by the surface and GdmCl, due to the high density of the BSA on the surface, there is a small possibility that unfolded RNase H will interact with a partially unfolded chain of BSA. To further prove that the deviation between the free energy slopes of RNase H in solution and on cross-linked protein surfaces is caused by the occasional surface-protein interactions rather than by strong systematic interactions changing size of RNase H, we compared the average FRET efficiency values of the unfolded state of RNase H immobilized on different surfaces. We found that the FRET efficiencies, and thus the size, of the unfolded RNase H are virtually indistinguishable for molecules on the cross-linked protein surfaces and on cross-linked star PEG surface, which has the same slope of the free energy as in solution. Furthermore, the FRET values of the unfolded state can be converted to the radii of gyration, which yields RG ≈ 38 Å at 6 M GdmCl in agreement with 36 Å measured for RNase H by small-angle X-ray scattering (183) and with RG of other proteins of a similar size (184). In summary, we have shown that the chemisorbed/cross-linked protein-based surfaces provide homogeneous, slightly-interacting support for the immobilization of RNase H. Nevertheless, cross-linked BSA surfaces cause strong unspecific adsorption of the red fluorescent protein, eqFP611. Furthermore, we demonstrated that the interaction between chemisorbed BSA and eqFP611 results in partial unfolding of the fluorescent protein despite the known high stability of fluorescent proteins owing to their β-barrel structure. Although the majority of eqFP611 on the BSA surface was still fluorescent, and thus functional, for single molecule experiments we demand that the surface would show minimal-possible interaction with the protein under study. That is not the case for protein microarray technology, where protein-based surfaces are exploited due to their low cost and easy fabrication on glass substrates compatible with regular equipment (61-65). MacBeath and co-wokers (61) have even proved that surfaces with covalently bound BSA could be stored for 2 months under vacuum conditions. However, before use, even freshly prepared substrates have to be passivated with an additional layer of physisorbed BSA, which can be disadvantageous for some applications, and certainly not acceptable for single molecule experiments.
4.1.2.2 PEG 5000
From the high resistance to unspecific adsorption and flat and homogeneous coverage, it would seem as though PEG 5000 coated surfaces are an excellent choice for single-molecule experiments on immobilized proteins. To our surprise, however, we found that a large fraction of RNase H molecules irreversibly unfolds when immobilized on linear PEG 5000 surface. We propose that RNase H, once permanently linked to the surface, can eventually penetrate through the flexible PEG mushrooms to bind onto the underlying aminosilane layer, which stabilizes the unfolded state due to strong charge interactions. This is possible due to the low grafting density of large PEG chains on the surface. A similar

74
situation was described by Satulovsky et al. (76). The authors showed that polymer coatings, which are not attracted to the underlying surface (in our case PEG chains are not attracted to the charged amino layer), exhibit strong kinetic prevention to unspecific protein adsorption but they allow proteins to penetrate through the coating on long time scales. When PEG 5000 was bound not to amino-silane but to the cross-linked BSA surface, no unfolding of the surface-immobilized RNase H was observed. This is because of the fact that the underlying cross-linked BSA surface is itself resistant to unspecific adsorption and preserves the native state of RNase H. Moreover, we found that the presence of high PEG concentrations in solution does not induce the unfolding of RNase H. These results strongly advocate that in the case of linear PEG 5000 surfaces, unfolding of RNase H is caused by the underlying charged layer of amino groups rather than by PEG itself. However, we found that the red fluorescent protein, eqFP611, which has a similar size to RNase H and also is attracted to amino-silanized glasses, remains properly folded on the linear PEG 5000 surface. Furthermore, Schenk et al. showed that the flickering rates of eqFP611 are identical for the protein immobilized on the PEG 5000 surface and in solution (122). It is evident that the grafting density of PEG is not the only factor that determines whether a particular protein can penetrate through the PEG layer and then unfold on the surface. The main difference between RNase H and eqFP611 is the stability of the native structure. The structure of EqFP611 is a rigid β-barrel, which protects the chromophore from solution. The stiffness of the barrel was confirmed by molecular dynamics simulations (185). RNase H is an enzyme and, as such, should be able to fluctuate between several conformations in order to perform its function. We suggest that during one of these fluctuations, the flexible PEG chains are able to penetrate and bind into the protein interior, replacing some intra-protein interactions. The energy gained by the interactions between intermingled PEG and protein chains will compensate the entropic penalty for the protein to go inside the mushroom-like PEG and, subsequently, adsorb onto the underlying amino layer. The mechanism of PEG-protein interactions is still not completely understood. Kokufuta and co-workers studied the formation of complexes from proteins and PEG in aqueous solutions (179, 186, 187). Because the formation of complexes was strongly pH dependent, the authors proposed that protein-PEG binding is caused by hydrogen bonding. For pepsin, which has 59 acidic residues and only 5 basic groups, the complexes were observed at pH 3 but not at pH 4.5. For human serum albumin (HSA), which has 116 acidic and 100 basic groups, the complexes were detected at pH 3 and pH 8, but not at pH 5 (179, 186, 187). Therefore, at low pH, the ether groups of PEG could form hydrogen bonds with the protonated (uncharged) carboxylic acid and phenolic OH groups of the proteins (Fig. 4.1a). At high pH, hydrogen bonding is likely to be between deprotonated (uncharged) basic protein groups and PEG ethers (Fig. 4.1b). Alternatively, from studies on protein thermal stability in PEG solutions, Lee and Lee proposed that PEG chains interact with hydrophobic regions and avoid charged residues (188). They observed a decrease in the unfolding temperature for 4 different proteins in the presence of poly(ethylene glycol), which correlated with the average hydrophobicity of a protein. Additionally, they found that the destabilization caused by high molecular weight PEG 4000 was significantly less than for shorter PEG chains. This was rationalized that for long PEG chains it is more difficult to interact with the hydrophobic regions and simultaneously avoid charged groups on the protein surface.

75
Even though the details of PEG-protein interactions require further investigations, we propose that these interactions can be exaggerated when a protein is forced into close proximity to the dense PEG layer upon surface immobilization. Apparently, extensive cross-linking of PEG chains overcomes both of the problems which we met with RNase H on the linear PEG 5000 surface: penetration through the PEG layer to the underlying substrate and intermingling between PEG and protein chains.
4.1.2.3 Cross-linked PEG
Our cross-linked star PEG surface fulfilled all the criteria required for a biocompatible surface. The surface preparation yields a reproducibly smooth and homogeneous coating. It exhibits excellent resistivity to unspecific protein adsorption, and both of the probe proteins remained properly folded when immobilized on the surface. We demonstrated that the unfolding of RNase H on star PEG surfaces is completely reversible. Even after 50 denaturation/renaturation cycles, the vast majority of RNase H molecules returned to their native conformation. It is necessary to emphasize here that fast renaturation of proteins can be a problematic procedure. This is due to the fact that since the unfolded protein coil is not soluble in buffer, it will tend to aggregate with other unfolded molecules before it has time to refold (29, 30). In case of single-molecule experiments, insoluble globules might interact with the surface coverage itself. However, this interaction is evidently prevented on the cross-linked star PEG surfaces. Our experiments also showed that the free energy profiles of the folding are practically identical for RNase H in solution and on cross-linked PEG. Moreover, the kinetics of folding/unfolding measured on single immobilized RNase H proteins was found to be in agreement with previously published data for RNase H in solution (25, 100). Finally, we confirmed that the folded state of the immobilized RNase H enzyme maintains full activity compared with native RNase H in solution. Furthermore, to our knowledge, we demonstrated for the first time that an immobilized enzyme completely recovers its functionality after following denaturation-renaturation. To date, only a few coatings were proven to retain complete activity of the enzymes immobilized on a flat surface. One example is sulfotransferase bound via a His-tag to multi-armed PEG
(a)
(b)
Figure 4.1: Hydrogen bonds between HSA and PEG.(a) Bonding at pH 3. (b) Bonding at pH 8. Figuresadopted from Ref. (179).
COOH
O
O
O
protein
O
O
O
NH2protein

76
molecules grafted on silicon chips (189). Tampé and coworkers confirmed unperturbed activity of the 20S proteasome docked at chelator lipid membranes on mica (190). However, this approach cannot be directly used to study slow enzymatic or folding reactions at the single-molecule level because of lipid diffusion in the plane of the fluid membrane. So far, it has been published that the best surfaces for single-molecule fluorescence studies of enzymes have been chemisorbed streptavidin (57, 191) and biotinylated glass surfaces covered with streptavidin and additionally passivated with BSA (192). However, these papers provided qualitative rather than quantitative verification of the enzymatic activity on the surfaces. Furthermore, the detailed analysis presented in our work shows that, in general, protein-based surfaces are inferior to our cross-linked PEG surfaces on many levels. To conclude, the cross-linked, star-shaped PEG coating presented here is a protein biocompatible surface, which was specially designed for the fluorescence single-molecule experiments. No significant difference between the properties of the proteins immobilized on this surface and the proteins in solution was detected. Thus, this surface is an excellent platform to study intrinsic heterogeneity and complexity of protein folding or enzymatic reactions.
4.2 Single-molecule conformational dynamics of RNase H under denaturing conditions
4.2.1 Expansion of the unfolded state The key advantage of single-molecule FRET analysis is that we directly resolve different protein sub-populations rather than model the changes in an observed ensemble-averaged signal. Therefore, we can monitor changes within each sub-population (folded or unfolded) caused by a change in conditions. Here, we observed a pronounced decrease of the average FRET efficiency of the unfolded RNase H sub-population with increasing GdmCl concentration, indicating a significant expansion of the polypeptide coil. Moreover, the size difference between the folded (RG ~ 18 Å (183)) and the compact unfolded (RG ~ 23 Å) states was less than the difference between the compact unfolded and expanded unfolded (RG ~ 38 Å) conformations. Our results agree qualitatively with the theoretical predictions of Alonso and Dill based on the competition between hydrophobic effects and conformational entropy (193). They concluded that, at neutral pH, the radius of the unfolded protein is much smaller than for a non-interacting random coil, and strongly dependent on the average hydrophobicity of the protein and the length of the protein sequence. For example, for a 100-amino-acid protein, the volume increase upon denaturation relative to the native state was 2-fold and 8-fold, for average hydrophobicities of 0.46 and 0.38, respectively. An increase of GdmCl concentration to 6 M caused an additional 2-fold swelling of the protein volume. A similar expansion of the unfolded state was also observed in single-molecule studies on the cold shock protein CspTm (43) and, to lesser extent, the chymotrypsin inhibitor 2 (42). In all 3 examples, the size changes were most pronounced near the folding/unfolding transition region. Apparently, the unfolded chain binds more and more guanidinium ions up to a saturation level. From the statistical theory of Alonso and Dill (193) follows that there exists a continuum of unfolded states, and that the free energy of the more expanded configurations is preferentially lowered by interactions with guanidinium.

77
It is generally believed that denatured RNase H has 2 distinct unfolded states (a compact intermediate and a loose unfolded states) (26, 104, 194, 195). However, careful analysis of the native-state hydrogen exchange data by Parker and Marqusee confirmed their hypothesis of a continuum of unfolded states (100, 101). Moreover, Parker and Marqusee observed a linear correlation between the free energies of the unfolded states and their cooperativities (101). For quantitative analysis of the expansion of the unfolded state observed in our experiments, we have to relate the cooperativity m-values with the protein size. Myers et al. compared 45 different proteins and found a linear correlation between the change of the solvent accessible surface area of the proteins and their m-values (140). Surface areas of the folded conformations were calculated directly from X-ray structures of the proteins and surface areas of the unfolded states were computed based on the protein sequences. This linear relationship is expected because, according to definition, the m-value is a derivative of the free energy versus denaturant concentration/activity, and guanidinium promotes protein unfolding by changing free energy of exposed protein backbone and side-chains. Multiple theoretical studies address the relationship between m-values and SASA in more detail, e.g., by including preferential interactions or excluded volume effects (141-143). Presuming that cooperativity m-values are proportional to SASA, the question reduces to how to relate the solvent accessible area and the protein size in a particular state. For proteins that can be represented by a sphere, 2
GRSASAm ∝∝ . With this approximation we would expect that, upon unfolding from RG ~ 18 Å to RG ~ 38 Å (the dimensions of folded and unfolded RNase H), the protein surface area increases by a factor of ~4.5. This is in contradiction to the current view that the accessible area increases between 2 and 3 times upon unfolding (162). The upper boundary was obtained by Monte Carlo simulations of peptides with atoms treated as hard spheres and the lower boundary was calculated from fragments of proteins with known structure (162). Therefore, it would be more accurate to assume x
GRm ∝ , with an exponent x < 2. It has been discussed that only a small increase in protein size compared to the folded state is needed to cause solvent penetration into the protein interior, leading to a large increase of the solvent accessible area of the protein backbone and side chains (160, 161, 163, 164). For example, molecular dynamics simulations of thermal denaturation of barnase showed that the accessible surface area increased nearly twice within the first 70 ps whereas the radius of gyration increased from ~14 Å to only ~15 Å during the same time (160). Similarly, SAXS measurements on cytochrome c revealed that addition of imidazole resulted in only a 1 Å swelling of the folded protein (from ~14 Å to ~15 Å, whereas the radius of gyration of the unfolded protein is ~ 30 Å) but the cooperativity of unfolding decreased by a factor of 1.6 (163). For apomyoglobin, the molten globule state is only 2 Å larger than the folded state (~22 Å versus ~20 Å) and 7 Å smaller than the acid unfolded state (~29 Å). However, the heat capacity change upon unfolding, which is also proportional to the difference in the accessible surface areas, for the molten globule is 2 times less than for the folded state (161, 196). Summing up these observations, we suggest that x
GGF FRRmm )( −∝− , with x < 1,
would be a more relevant approximation for the relationship between the cooperativity parameter and the size. Because the changes in the unfolded state influence the folding/unfolding equilibrium, we performed a global fit of the expansion of the unfolded RNase H and the free energy differences between the folded and unfolded conformations with the continuum model. In agreement with our expectations, we found 0.3 < x < 1.5 using x
GRm ∝ , and
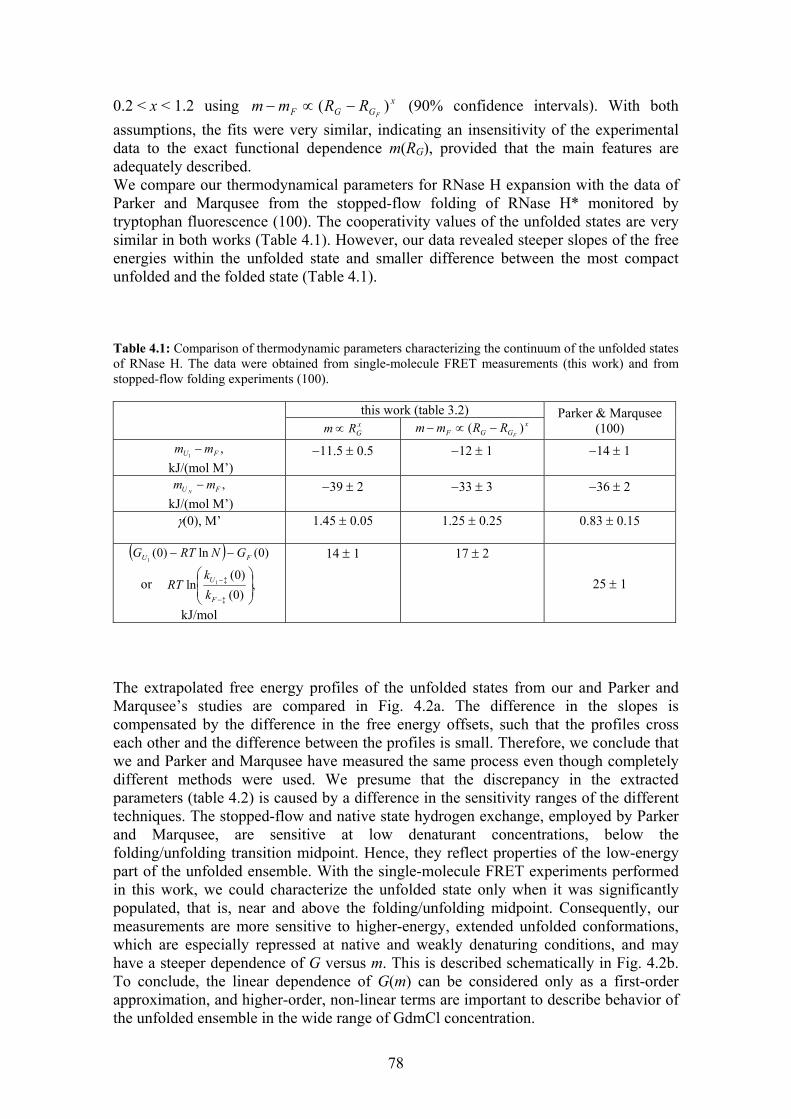
78
0.2 < x < 1.2 using xGGF F
RRmm )( −∝− (90% confidence intervals). With both assumptions, the fits were very similar, indicating an insensitivity of the experimental data to the exact functional dependence m(RG), provided that the main features are adequately described. We compare our thermodynamical parameters for RNase H expansion with the data of Parker and Marqusee from the stopped-flow folding of RNase H* monitored by tryptophan fluorescence (100). The cooperativity values of the unfolded states are very similar in both works (Table 4.1). However, our data revealed steeper slopes of the free energies within the unfolded state and smaller difference between the most compact unfolded and the folded state (Table 4.1). Table 4.1: Comparison of thermodynamic parameters characterizing the continuum of the unfolded states of RNase H. The data were obtained from single-molecule FRET measurements (this work) and from stopped-flow folding experiments (100).
this work (table 3.2) x
GRm ∝ xGGF F
RRmm )( −∝− Parker & Marqusee
(100) ,
1 FU mm − kJ/(mol M’)
−11.5 ± 0.5
−12 ± 1
−14 ± 1
,FU mmN
− kJ/(mol M’)
−39 ± 2
−33 ± 3
−36 ± 2
γ(0), M’
1.45 ± 0.05
1.25 ± 0.25
0.83 ± 0.15
( ) )0(ln)0(1 FU GNRTG −−
or ,)0()0(
ln ‡
‡1
−
−
F
U
kk
RT
kJ/mol
14 ± 1
17 ± 2
25 ± 1
The extrapolated free energy profiles of the unfolded states from our and Parker and Marqusee’s studies are compared in Fig. 4.2a. The difference in the slopes is compensated by the difference in the free energy offsets, such that the profiles cross each other and the difference between the profiles is small. Therefore, we conclude that we and Parker and Marqusee have measured the same process even though completely different methods were used. We presume that the discrepancy in the extracted parameters (table 4.2) is caused by a difference in the sensitivity ranges of the different techniques. The stopped-flow and native state hydrogen exchange, employed by Parker and Marqusee, are sensitive at low denaturant concentrations, below the folding/unfolding transition midpoint. Hence, they reflect properties of the low-energy part of the unfolded ensemble. With the single-molecule FRET experiments performed in this work, we could characterize the unfolded state only when it was significantly populated, that is, near and above the folding/unfolding midpoint. Consequently, our measurements are more sensitive to higher-energy, extended unfolded conformations, which are especially repressed at native and weakly denaturing conditions, and may have a steeper dependence of G versus m. This is described schematically in Fig. 4.2b. To conclude, the linear dependence of G(m) can be considered only as a first-order approximation, and higher-order, non-linear terms are important to describe behavior of the unfolded ensemble in the wide range of GdmCl concentration.

79
4.2.2 Structural heterogeneity of the unfolded state Interestingly, the expansion of the denatured RNase H was accompanied by a narrowing of the measured distributions of the unfolded conformations. The apparent width decreased by a factor of 2.8 from 1.5 to 6 M GdmCl. This evidences the heterogeneous nature of the unfolded ensemble, which averages out at higher denaturant concentrations. Careful analysis of the single-molecule traces recorded at 1.7 M GdmCl showed that, on the 100-ms timescale, the distribution of sizes of the unfolded RNase H is 4.6 times broader than the expected scattering due to the overall noise of the measured signals (12 Å vesrus 2.6 Å). From the same traces, we could observe that the protein indeed fluctuates between multiple unfolded conformations. Analogous transitions between multiple unfolded states were recently observed with single-molecule FRET of adenylate kinase (27). The time scale of the transitions for adenalyte kinase was distributed from times below the resolution of the experiment (<10 ms) to seconds (27). In contrast, for RNase H, we could detect only sudden changes of the FRET efficiency within the statistical noise. Unfortunately, transitions with only small changes of FRET could not be resolved due to the noise of the fluorescence signal. We developed a statistical test, which allowed us
-10 -20 -30 -40
20
40
60
G(0
) - G
F(0),
kJ/m
ol
m - mF, kJ/(mol M')
0 M GdmCl
6 M GdmCl
U1 …………… UN m
G
(a) (b)
Figure 4.2: Free energy profile of the unfolded state continuum for RNase H. (a) Free energies ofunfolded states in buffer are plotted against their cooperativity values. The most compact and themost extended denatured conformations are marked by symbols. The gray line with squares andthe black line with diamonds show our data from fitting the expansion of the unfolded state withassumptions and , respectively. The broken black line with circlesrepresents the data obtained from fitting the folding kinetics measured with intrinsic fluorescenceby Parker and Marqusee (100). (b) Nonlinear profile of the unfolded continuum. The statespopulated at different concentrations of guanidinium are shown with gray ellipses. For the freeenergy profile in buffer (upper panel), the states occupied at low denaturant concentrations have asmaller slope of the free energy versus the cooperativity parameter than the higher energy states,which will be occupied at higher denaturant concentrations.
xGGF F
RRmm )( −∝−xGRm ∝

80
to evaluate the probability that the observed FRET changes are due to the conformational changes of the protein and not due to random fluctuations of the detected signal. For the analysis, we used a confidence level of 99%. The resolved transitions were spread over all possible FRET efficiency values, indicating a high diversity in the folding/unfolding pathways. However, small changes occurred more frequently than large jumps. This observation is similar to single-molecule measurements on adenylate kinase (27). We found that the rate of the FRET transitions was relatively constant within the unfolded state and increased at its limits at high and low FRET efficiency values. Therefore, the barrier height does not vary significantly between the populated unfolded conformations. With this observation and presuming that once a barrier is overcome, the protein can adopt any unfolded conformation with lower energy, we showed that the measured width of the unfolded state quantitatively correlates with the distribution of the transitions. Therefore, the width of the denatured ensemble is determined by the existence of multiple unfolded substates, which is an intrinsic property of RNase H and not a surface-induced effect. We also observed FRET changes in the folded state of RNase H. However, the orientations of the dyes attached to the folded RNase H were not completely averaged out on the second timescale. Therefore, FRET changes can result from fluctuating orientations of the dyes rather than changes of the protein conformation. As a result, we cannot quantitatively analyze the detected transitions within the folded state.
4.2.3 Origin of the structure in the unfolded state Surprisingly, we observed transitions within the unfolded state even at 6 M GdmCl. The transition timescale of a few seconds is 2 orders magnitude faster than the rate of the folding, and at least 2 orders of magnitude slower than the formation of secondary structure and re-equilibration within the unfolded continuum, as shown to occur within the dead time of stopped-flow experiments (~10 ms) (26, 100). A possible source of slow conformational changes in proteins is isomerization of prolines. However, the observed transitions appear to be too fast for proline cis-trans isomerization. Measurements on dipeptides containing a proline residue revealed that the isomerization rate decreases with increasing size of the second residue (197), so that the isomerization in a protein chain is slower than in a dipeptide. Taking the isomerization rate of Val-Pro at neutral pH and 22.5 °C, and multiplying it by 5 (our RNase H contains 5 prolines) we obtain a rate of 0.0125 s-1, which is tens times slower than the observed rate of FRET transitions. Unlike E. coli RNase H*, the folding of T. thermophilus RNase H* has two phases, the slowest believed to be influenced by proline isomerization (194). The rate of the slowest phase was 0.0047 s-1; again, much slower than the rate of the observed FRET transitions. Other proteins such as Barstar, chymotrypsin inhibitor 2 and SNase show proline cis-trans isomerization kinetics of 0.016 s-1 (198), 0.024 s-1 (199) and 0.0015 s-1 (200), respectively, 1 − 2 orders of magnitude slower than the transitions observed in this work. It is unlikely that the rate of proline isomerization can increase tens times under denaturing conditions since it was observed to be independent of denaturant concentrations (198, 200, 201). Therefore, the observed FRET transitions provide evidence of the presence of residual non-random structure in the unfolded state even at high GdmCl concentrations. Until recently, proteins under high concentrations of denaturant were frequently considered as polypeptide “random coil” models (184). However, Fitzkee and Rose recently calculated for 33 different proteins that if 8% of the residues were disordered whereas the other 92% were fixed in the native structure, the protein end-to-end distance and the

81
radius of gyration were practically indistinguishable from the values obtained experimentally or with the random coil model (155). In particular, for RNase H with only 13 flexible residues, the authors evaluated RG ~ 39 Å with both models, in excellent agreement with the value of 38 Å measured in our single-molecule FRET experiments. In recent years, a growing body of studies reported detection of residual structure in “completely” unfolded proteins. Possible mechanisms causing pre-organization of the protein chain include long-range hydrophobic clustering (39, 109, 110, 113, 202-205) and local arrangement of the residues imposed by sterical or dipole interactions (203, 206-211). Apparently, the unfolded proteins have a stronger bias towards the native state than it was previously assumed, which can be of high importance for in vivo protein synthesis, for example by preventing the aggregation with other proteins.
4.2.4 Folding free energy landscape under denaturing conditions From the FRET transitions, we can calculate the free energy barriers separating the resolved unfolded substates and the barrier between the unfolded and folded ensembles can be calculated. The Kramers equation in the spatial-diffusion limit (i.e. high friction) can be used for such calculations (43),
∆
≈
∆
RTG
RTG= exp2exp
2 0
max
0min πτω
τπωτ . (4.4)
Here, τ is the timescale of the conformational changes; ωmin and ωmax are angular frequencies describing the curvatures of the free energy profile along the reaction coordinate in the parabolic well of the initial state and at the top of the barrier, respectively. ∆G is the barrier height, and 2
min0 / ωτ mDRT= is the reconfiguration time of the unfolded protein, where D and m represent the reconfiguration diffusion coefficient and the mass, respectively. For simplicity, this equation assumes that the diffusion coefficient is constant and we take the curvatures ωmin and ωmax to be equal, which has been supported by lattice (212) and off-lattice (213) protein models. The reconfiguration time, τ0, of the unfolded protein chain can be estimated from the fast fluctuations of the FRET efficiency. The single-molecule cross-correlation functions from individual unfolded RNase H molecules showed a decay in 2 steps. However, the slow, ~100-µs, component was present in the correlation functions of the dyes in the absence of FRET, and, therefore, originates from intrinsic fluctuations of the dye emission. Such slow emission dynamics was also observed in single-molecule studies on cyanine dyes (214, 215). For Alexa dyes, slow intensity fluctuations were recently hypothesized by Schuler et al. to explain the large width of the observed FRET distributions from the dyes attached to rigid polyproline molecules (43). In contrast, the fast decay of the correlation functions with a time constant of 20 µs was present only in our FRET experiments. Therefore, this can be attributed to the conformational fluctuations of the protein. For other unfolded proteins such as the fatty acid binding protein, the cold shock protein CspTm and cytochrome c, the reconfiguration times were also reprorted in a similar range, 1 − 40 µs (216-219). With τ0 = 20 µs and τUU = 1/kUU = 2.5 s for transitions within the unfolded ensemble at 1.7 M GdmCl, we obtain the average free energy barrier between the unfolded substates ∆GUU ≈ 24 kJ/mol (~10 RT). Similarly, using τUF = 1/kUF = 90 s at 1.7 M GdmCl, we evaluate the free energy for the folding ∆GUF ≈ 33 kJ/mol (~13 RT). Alternatively, we can estimate the upper limit of the reconfiguration time from the diffusion limits of the Gaussian chain (43, 220):

82
Dre
3
2
0 =τ . (4.5)
Here, re is the end-to-end distance, and D is the protein end-to-end diffusion coefficient. From measurements on random polypeptides, D ≈ 17 Å2/ns (220). With real proteins, we expect a smaller diffusion coefficient because of residual long-range interactions. For RNase H denatured by 6 M GdmCl, we found RG ≈ 38 Å, which corresponds to re = 6 RG ≈ 93 Å and, therefore, τ0 > 170 ns. At 1.7 M GdmCl, the unfolded state is more compact, i.e., re is smaller. However, due to an increased number of contacts between residues, friction also increases, resulting in a decrease of the end-to-end diffusion coefficient. With the estimate of τ0 > 170 ns, we obtain the upper limit of ∆GUU < 33 kJ/mol (~13 RT) and ∆GUF < 45 kJ/mol (~18 RT). To summarize the results of our investigations of the folding of RNase H, Fig. 4.3a presents a schematic free energy landscape of RNase H folding. Two spatial coordinates, Q1 and Q2, have been introduced to describe the protein motions on different timescales. Transitions between unfolded conformations occur along the Q1 coordinate, their slow rate is determined by significant free energy barriers, ∆GUU ≈ 24 kJ/mol (Fig. 4.3b). Folding occurs along the Q2 axis, with a barrier separating the unfolded ensemble from the native state, ∆GUF ≈ 33 kJ/mol (Fig. 4.3c). This barrier can be approached by unfolded molecules on a sub-millisecond timescale, as was shown in fast-mixing experiments (25, 26, 98, 100). Therefore, the cross-section along the Q2 coordinate is relatively smooth and barrierless (Fig. 4.3c); this corresponds to spontaneous collapse of unfolded chain. The distribution of FRET efficiency values of transitions (Fig. 3.17) showed that folding occurs from many different unfolded substates, as we presented in Fig. 4.3. If folding were possible only from one particular unfolded conformation, this would require structural reorganization between unfolded substates along the Q1 coordinate until this particular state is found. This reorganization is more difficult (i.e., slower) in buffer than in 1.7 M GdmCl due to compaction and lower hydrophobic solvation of unfolded substates, which contradicts to the fast folding rate of ~1 s-1 measured in buffer (25, 26). Clearly, the presented scheme captures only the main features of the free energy landscape. With our single-molecule experiments, we resolved only the first level of the hierarchical organization of the residual structure in the unfolded ensemble. A closer, more detailed examination will undoubtedly reveal that the folded and the unfolded substates consist of a large number of conformational states separated by lower barriers, and that these conformational states, in turn, can be further divided in substates (13, 14, 221-224).
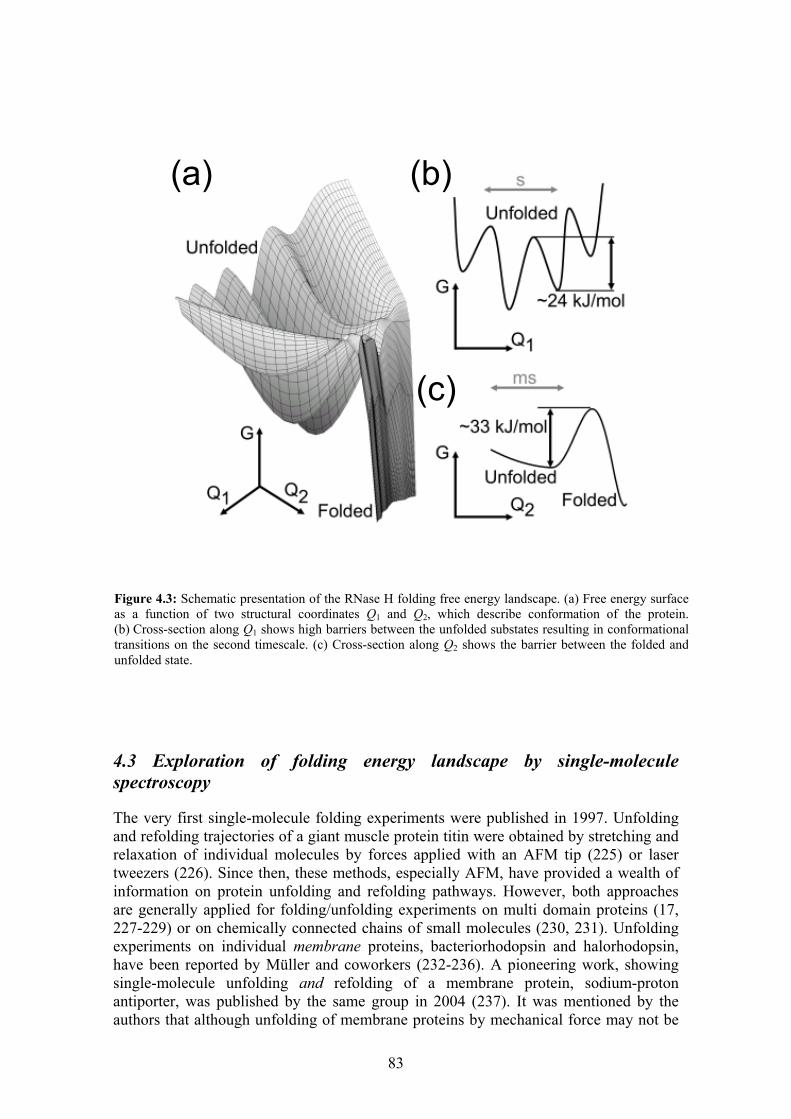
83
4.3 Exploration of folding energy landscape by single-molecule spectroscopy
The very first single-molecule folding experiments were published in 1997. Unfolding and refolding trajectories of a giant muscle protein titin were obtained by stretching and relaxation of individual molecules by forces applied with an AFM tip (225) or laser tweezers (226). Since then, these methods, especially AFM, have provided a wealth of information on protein unfolding and refolding pathways. However, both approaches are generally applied for folding/unfolding experiments on multi domain proteins (17, 227-229) or on chemically connected chains of small molecules (230, 231). Unfolding experiments on individual membrane proteins, bacteriorhodopsin and halorhodopsin, have been reported by Müller and coworkers (232-236). A pioneering work, showing single-molecule unfolding and refolding of a membrane protein, sodium-proton antiporter, was published by the same group in 2004 (237). It was mentioned by the authors that although unfolding of membrane proteins by mechanical force may not be
(a) (b)
(c)
Figure 4.3: Schematic presentation of the RNase H folding free energy landscape. (a) Free energy surfaceas a function of two structural coordinates Q1 and Q2, which describe conformation of the protein.(b) Cross-section along Q1 shows high barriers between the unfolded substates resulting in conformationaltransitions on the second timescale. (c) Cross-section along Q2 shows the barrier between the folded andunfolded state.

84
physiological, single-molecule AFM provides important information about energy barriers stabilizing protein conformations (237). Single-molecule FRET microscopy, utilized in this thesis, allows investigation of folding free energy landscape on the level of individual protein units. Moreover, fluctuations between different conformational states can be studied at dynamic equilibrium. The discussion will further focus on this highly sensitive method.
4.3.1 Past (… − 2000) First applications of single-molecule fluorescence microscopy to study dynamics of biomolecules were demonstrated in 1995. At a video rate of 1/30 s-1, groups of Kinosita and Yanagida observed sliding of actin filaments along meromyosin (238) and individual ATP-turnovers by single myosin molecules (239), respectively. The first paper addressing protein folding by single-molecule FRET microscopy appeared in 1999 from a collaboration between groups of Hochstrasser and DeGrado (52). A modified GSN-4 peptide was labeled with fluorescent dyes and cross-linked to produce a dimer with a FRET donor and acceptor on different strands. The construct was adsorbed via charge interactions on an aminosilanized glass surface. Transitions between folded coiled-coil and unfolded forms of the dipeptide were observed as a function of added denaturant, urea. A subsequent publication by the same groups provided a quantitative analysis of conformational fluctuations of the peptide and showed that folding occurs on a similar time scale in single-molecule experiments on the surface and ensemble measurements in solution (53). However, it was also found that peptide molecules interact with the aminosilanized surface, which was visible as an additional slow decay in the correlation functions and improper shape of the distributions of the inter-dye distances (53). The power of single-molecule spectroscopy to study protein folding was demonstrated by Deniz et al. in 2000 (42). FRET efficiency histograms at different GdmCl concentrations were measured from a small protein, chymotrypsin inhibitor 2, freely diffusing in solution. The histograms revealed clearly that separated peaks of folded and unfolded molecules coexisted near the midpoint of folding/unfolding transition. The authors observed that the average FRET efficiency of the unfolded state decreases upon addition of denaturant and calculated free energy profiles of folding from distribution of FRET efficiency values. However, without statistical analysis and control over dye properties, this was only a demonstration of new possibilities offered by single-molecule detection (43).
4.3.2 From 2001 to 2005 In 2002, Schuler et al. published an analysis of single-molecule FRET efficiency distributions from freely diffusing cold-shock protein CspTm (43). In addition, the authors measured FRET efficiency distributions from polyproline peptides with sizes similar to sizes of folded and unfolded CspTm molecules. Polyproline helices provided a rigid spacer between dyes and, thus, allowed to separate effects of the dyes and conformational dynamics of CspTm molecules. This control experiment made the paper a real breakthrough in single-molecule folding studies. Although the distribution of FRET efficiency values in the unfolded state of CspTm was very wide (similar to the work of Deniz et al. (42)), the same wide distributions were observed for polyproline molecules. Careful analysis revealed that the fluctuations of the end-to-end distances in the unfolded protein should be faster than 200 µs, otherwise the FRET distributions for the unfolded protein would be detectably larger than for the polyproline (43, 240).

85
Substituting limits on the reconfiguration time of the unfolded protein in Kramers equation (Eq. 4.4), the authors calculated limits on the free energy barrier between folded and unfolded protein conformations. The second important finding of this paper was significant expansion of the unfolded protein upon addition of denaturant. Because the largest effect was observed at the midpoint of folding/unfolding transition, this phenomenon could so far escape detection with conventional ensemble techniques. Characterization of the unfolded state with equilibrium single-molecule FRET microscopy is limited to denaturant concentrations at which this state is significantly populated. In 2003, the same group measured folding kinetics of CspTm by coupling single-molecule confocal detection system with a microfabricated laminar-flow mixer (44). A GdmCl solution with denatured molecules was mixed with buffer and pumped through a channel of the mixer. By varying the distance between the mixing region and the detection in the channel, it was possible to measure FRET efficiency histograms from molecules in solution at different times after refolding was initiated. The authors demonstrated that collapse of the unfolded state at low denaturant concentrations precedes protein folding and is faster than the dead time of their device, < 50 ms. In contrast to ensemble measurements, this was a direct observation rather than modeling of the relaxation kinetics. Observation of individual molecules in solution is constrained to the time that it takes the molecule to diffuse through a detection volume, < 1ms. In 2003, Haran and coworkers reported their studies of folding/unfolding conformational changes of adenylate kinase encapsulated within surface-bound lipid vesicles (27). The size of vesicles was large enough to let the protein freely diffuse inside but small compared with the detection volume of a confocal microscope. In contrast to the above-mentioned chymotrypsin inhibitor 2 and CspTm, equilibrium and kinetic folding/unfolding of adenylate kinase deviates from a two-state model and at least one intermediate state was expected (see references in (27)). Single-molecule FRET efficiency distributions of adenylate kinase revealed two distinct populations, “folded” and “unfolded”, but both of the conformations changed their properties upon addition of denaturant. Moreover, single-molecule fluorescence time traces showed transitions between nearly all possible initial and final FRET efficiency values. This was a clear indication of multiple conformations comprising “folded” and “unfolded” ensembles and demonstrated heterogeneity of the folding pathways. In 2004, the same group in collaboration with Schuler published similar measurements of CspTm, which displayed a simple two-state behavior (60). During the period discussed in this section, 2001 − 2005, we have developed a novel surface preparation which allows immobilization of protein molecules without interfering with protein folding and function (tested on RNase H and eqFP611). We utilized this surface to study folding free energy landscape of RNase H. Single-molecule FRET efficiency histograms showed that conformational space of RNase H molecules consists of two, a folded and an unfolded, states with a free energy barrier between them. As for other proteins studied by single-molecule FRET spectroscopy, we observed that the unfolded state of RNase H expands upon addition of denaturant. This expansion is most pronounced near the folding/unfolding midpoint. We have developed a quantitative thermodynamic model of the process, which allows analysis of free energy profile of the continuum of unfolded conformations. Similar to observations on adenylate kinase (27), our single-molecule fluorescence time traces revealed that unfolded RNase H molecules fluctuate between many different substates on the second time scale. We have developed a statistical analysis for automatic extraction of significant FRET transitions from noisy single-molecule traces. This allowed us to increase the number of analyzed events by one order of magnitude as

86
compared with the work of Haran and coworkers (27). Unlike in the case of adenylate kinase, the existence of multiple unfolded substates with a lifetime on the order of 1 second was not expected for RNase H. This can be explained by the presence of some residual structure in unfolded molecules even at the highest possible denaturant concentrations, which escaped detection by ensemble techniques due to the enormous heterogeneity of unfolded ensemble. We have also measured correlation functions of individual unfolded RNase H molecules and extracted reconfiguration time of 20 µs, in agreement with data from other proteins (216-219). Applying Kramers’ theory as suggested by Schuler et al. (43), we calculated free energy barriers between unfolded substates, and between unfolded and folded ensembles. Finally, we have introduced a two-dimensional scheme of the folding free energy landscape of RNase H, which brings together ensemble and single-molecule data.
4.3.3 Outlook The progress of the last five years promises that the single-molecule approach in combination with theory will improve our understanding of protein folding considerably (37, 241, 242). Statistical analysis of single-molecule data should be further developed. For example, higher order correlation functions provide information on non-Markovian protein dynamics (57). A major limitation of single-molecule FRET experiments is dye photobleaching and photodynamics and a finite range of Förster distances, ~50 − 80 Å, available for sufficiently bright dyes. Development of novel dyes (243) and new spectroscopic ideas (244) are, therefore, required. It is important to perform systematic studies of model proteins with selected properties, e.g. to compare “two-state folders” and proteins with intermediate states, or pure α-helical and β-sheet proteins and proteins with mixed αβ fold. With the help of protein engineering, one can introduce fluorescent labels at different positions in the protein sequence and investigate folding pathways and interactions of particular parts of a protein. For instance, it would be especially interesting to clarify what forms a residual structure in unfolded RNase H molecules. Combination of fast-mixing devices and protein immobilization on biocompatible surfaces will allow the investigation of long, non-equilibrium folding trajectories from individual molecules. Undoubtedly, joined single-molecule fluorescence and force microscopy will be a powerful tool to study protein conformational space and intra-molecular interactions (245). These directions are currently under development in our lab.

87
Bibliography 1. Dobson, C. M. (2003) Nature 426, 884-890. Protein folding and misfolding. 2. Baltzer, L. (1998) Curr Opin Struct Biol 8, 466-470. Functionalization of designed folded polypeptides. 3. Jones, D. T. (2000) Curr Opin Struct Biol 10, 371-379. Protein structure prediction in the postgenomic era. 4. Epstein, C. J. & Anfinsen, C. B. (1962) J Biol Chem 237, 2175-2179. The reversible reduction of disulfide bonds in trypsin and ribonuclease coupled
to carboxymethyl cellulose. 5. Anfinsen, C. B. (1973) Science 181, 223-230. Principles that govern the folding of protein chains. 6. Levinthal, C. (1969) in Mössbaer Spectroscopy in Biological Systems
(University of Illinois Press: Urbana, IL, Allerton House, Monticello, IL), Vol. 67, pp. 22-24.
How to fold graciously. 7. Levinthal, C. (1968) Extrait du Journal de Chimie Physique 65, 44-45. Are there pathways for protein folding? 8. Kim, P. S. & Baldwin, R. L. (1990) Annu Rev Biochem 59, 631-660. Intermediates in the folding reactions of small proteins. 9. Bryngelson, J. D. & Wolynes, P. G. (1987) Proc Natl Acad Sci U S A 84, 7524-
7528. Spin glasses and the statistical mechanics of protein folding. 10. Bryngelson, J. D. & Wolynes, P. G. (1989) J Phys Chem 93, 6902-6915. Intermediates and barrier crossing in a random energy model (with applications
to protein folding). 11. Wolynes, P. G., Onuchic, J. N. & Thirumalai, D. (1995) Science 267, 1619-
1620. Navigating the folding routes. 12. Onuchic, J. N., Nymeyer, H., Garcia, A. E., Chahine, J. & Socci, N. D. (2000)
Adv Protein Chem 53, 87-152. The energy landscape theory of protein folding: insights into folding
mechanisms and scenarios. 13. Frauenfelder, H., Sligar, S. G. & Wolynes, P. G. (1991) Science 254, 1598-1603. The energy landscapes and motions of proteins.

88
14. Brooks, C. L., 3rd, Gruebele, M., Onuchic, J. N. & Wolynes, P. G. (1998) Proc Natl Acad Sci U S A 95, 11037-11038.
Chemical physics of protein folding. 15. You, H. X. & Lowe, C. R. (1996) Curr Opin Biotechnol 7, 78-84. Progress in the application of scanning probe microscopy to biology. 16. Weiss, S. (2000) Nat Struct Biol 7, 724-729. Measuring conformational dynamics of biomolecules by single molecule
fluorescence spectroscopy. 17. Fernandez, J. M. & Li, H. (2004) Science 303, 1674-1678. Force-clamp spectroscopy monitors the folding trajectory of a single protein. 18. Roder, H., Elöve, G. A. & Englander, S. W. (1988) Nature 335, 700-704. Structural characterization of folding intermediates in cytochrome c by H-
exchange labelling and proton NMR. 19. Englander, S. W., Sosnick, T. R., Mayne, L. C., Shtilerman, M., Qi, P. X. & Bai,
Y. (1998) Acc Chem Res 31, 737-744. Fast and slow folding in cytochrome c. 20. Akiyama, S., Takahashi, S., Kimura, T., Ishimori, K., Morishima, I., Nishikawa,
Y. & Fujisawa, T. (2002) Proc Natl Acad Sci U S A 99, 1329-1334. Conformational landscape of cytochrome c folding studied by microsecond-
resolved small-angle x-ray scattering. 21. Su, Z.-D., Arooz, M. T., Chen, H. M., Gross, C. J. & Tsong, T. Y. (1996) Proc
Natl Acad Sci U S A 93, 2539-2544. Least activation path for protein folding: investigation of staphylococcal
nuclease folding by stopped-flow circular dichroism. 22. Nishimura, C., Riley, R., Eastman, P. & Fink, A. L. (2000) J Mol Biol 299,
1133-1146. Fluorescence energy transfer indicates similar transient and equilibrium
intermediates in staphylococcal nuclease folding. 23. Jennings, P. A. & Wright, P. E. (1993) Science 262, 892-896. Formation of a molten globule intermediate early in the kinetic folding pathway
of apomyoglobin. 24. Uzawa, T., Akiyama, S., Kimura, T., Takahashi, S., Ishimori, K., Morishima, I.
& Fujisawa, T. (2004) Proc Natl Acad Sci U S A 101, 1171-1176. Collapse and search dynamics of apomyoglobin folding revealed by
submillisecond observations of a-helical content and compactness. 25. Yamasaki, K., Ogasahara, K., Yutani, K., Oobatake, M. & Kanaya, S. (1995)
Biochemistry 34, 16552-16562. Folding pathway of Escherichia coli ribonuclease HI: a circular dichroism,
fluorescence, and NMR study.

89
26. Raschke, T. M. & Marqusee, S. (1997) Nat Struct Biol 4, 198-304. The kinetic folding intermediate of ribonuclease H resembles the acid molten
globule and partially unfolded molecules detected under native conditions. 27. Rhoades, E., Gussakovsky, E. & Haran, G. (2003) Proc Natl Acad Sci U S A
100, 3197-3202. Watching proteins fold one molecule at a time. 28. Zemanova, L., Schenk, A., Valler, M. J., Nienhaus, G. U. & Heilker, R. (2003)
Drug Discov Today 8, 1085-1093. Confocal optics microscopy for biochemical and cellular high-throughput
screening. 29. Silow, M. & Oliveberg, M. (1997) Proc Natl Acad Sci U S A 94, 6084-6086. Transient aggregates in protein folding are easily mistaken for folding
intermediates. 30. Silow, M., Tan, Y. J., Fersht, A. R. & Oliveberg, M. (1999) Biochemistry 38,
13006-13012. Formation of short-lived protein aggregates directly from the coil in two-state
folding. 31. Förster, T. (1948) Ann Physik 2, 55-75. Intermolecular energy migration and fluorescence. 32. Stryer, L. & Haugland, R. P. (1967) Proc Natl Acad Sci U S A 58, 719-726. Energy transfer: a spectroscopic ruler. 33. Selvin, P. R. (2000) Nat Struct Biol 7, 730-734. The renaissance of fluorescence resonance energy transfer. 34. Zaccolo, M. (2004) Circ Res 94, 866-873. Use of chimeric fluorescent proteins and fluorescence resonance energy transfer
to monitor cellular responses. 35. Johnson, A. E. (2005) FEBS Lett 579, 916-920. The co-translational folding and interactions of nascent protein chains: a new
approach using fluorescence resonance energy transfer. 36. Wallrabe, H., Periasamy, A., Stanley, M., Barroso, M., Elangovan, M.,
Burchard, A., Chen, Y. & Day, R. N. (2005) Curr Opin Biotechnol 16, 19-27. Imaging protein molecules using FRET and FLIM microscopy. 37. Schuler, B. (2005) Chemphyschem 6, 1206-1220. Single-molecule fluorescence spectroscopy of protein folding. 38. Navon, A., Ittah, V., Landsman, P., Scheraga, H. A. & Haas, E. (2001)
Biochemistry 40, 105-118. Distributions of intramolecular distances in the reduced and denatured states of
bovine pancreatic ribonuclease A. Folding initiation structures in the C-terminal portions of the reduced protein.

90
39. Sridevi, K. & Udgaonkar, J. B. (2003) Biochemistry 42, 1551-1563. Surface expansion is independent of and occurs faster than core solvation during
the unfolding of barstar. 40. Kuznetsov, S. V., Hilario, J., Keiderling, T. A. & Ansari, A. (2003)
Biochemistry 42, 4321-4332. Spectroscopic studies of structural changes in two beta-sheet-forming peptides
show an ensemble of structures that unfold noncooperatively. 41. Lakshmikanth, G. S., Sridevi, K., Krishnamoorthy, G. & Udgaonkar, J. B.
(2001) Nat Struct Biol 8, 799-804. Structure is lost incrementally during the unfolding of barstar. 42. Deniz, A. A., Laurence, T. A., Beligere, G. S., Dahan, M., Martin, A. B.,
Chemla, D. S., Dawson, P. E., Schultz, P. G. & Weiss, S. (2000) Proc Natl Acad Sci U S A 97, 5179-5184.
Single-molecule protein folding: diffusion fluorescence resonance energy transfer studies of the denaturation of chymotrypsin inhibitor 2.
43. Schuler, B., Lipman, E. A. & Eaton, W. A. (2002) Nature 419, 743-747. Probing the free-energy surface for protein folding with single-molecule
fluorescence spectroscopy. 44. Lipman, E. A., Schuler, B., Bakajin, O. & Eaton, W. A. (2003) Science 301,
1233-1235. Single-molecule measurement of protein folding kinetics. 45. Lakowicz (1999) Principles of fluorescence spectroscopy (Kluwer
Academic/Plenum, New York). 46. Marme, N., Knemeyer, J. P., Sauer, M. & Wolfrum, J. (2003) Bioconjug Chem
14, 1133-1139. Inter- and intramolecular fluorescence quenching of organic dyes by tryptophan. 47. Dickson, R. M., Cubitt, A. B., Tsien, R. Y. & Moerner, W. E. (1997) Nature
388, 3558-3358. On/off blinking and switching behaviour of single molecules of green
fluorescent protein. 48. Lu, H. P., Xun, L. & Xie, X. S. (1998) Science 282, 1877-1882. Single molecule enzymatic dynamics. 49. Wiedenmann, J., Schenk, A., Rocker, C., Girod, A., Spindler, K. D. & Nienhaus,
G. U. (2002) Proc Natl Acad Sci U S A 99, 11646-11651. A far-red fluorescent protein with fast maturation and reduced oligomerization
tendency from Entacmaea quadricolor (Anthozoa, Actinaria). 50. Ha, T., Ting, A., Liang, J., Glass, J., Chemla, D., Schultz, P. & Weiss, S. (1998)
in Proc SPIE-Int Soc Opt Eng, Vol. 3273, pp. 179-185.

91
Fluorescence spectroscopy of single molecule dynamics and its biological applications.
51. Wazawa, T., Ishii, Y., Funatsu, T. & Yanagida, T. (2000) Biophys J 78, 1561-
1569. Spectral fluctuation of a single fluorophore conjugated to a protein molecule. 52. Jia, Y., Talaga, D. S., Lau, W. L., Lu, H. S. M., DeGrado, W. F. & Hochstrasser,
R. M. (1999) Chem Phys 247, 69-83. Folding dynamics of single GCN-4 peptides by fluorescence resonant energy
transfer confocal microscopy. 53. Talaga, D. S., Lau, W. L., Roder, H., Tang, J., Jia, Y., DeGrado, W. F. &
Hochstrasser, R. M. (2000) Proc Natl Acad Sci U S A 97, 13021-13026. Dynamics and folding of single two-stranded coiled-coil peptides studied by
fluorescent energy transfer confocal microscopy. 54. Noji, H., Yasuda, R., Yoshida, M. & Kinosita, K. (1997) Nature 386, 299-302. Direct observation of the rotation of F1-ATPase. 55. Ha, T., Ting, A. Y., Liang, J., Caldwell, W. B., Deniz, A. A., Chemla, D. S.,
Schultz, P. G. & Weiss, S. (1999) Proc Natl Acad Sci U S A 96, 893-898. Single-molecule fluorescence spectroscopy of enzyme conformational dynamics
and cleavage mechanism. 56. Wennmalm, S., Edman, L. & Rigler, R. (1997) Proc Natl Acad Sci U S A 94,
10641-10646. Conformational fluctuations in single DNA molecules. 57. Edman, L. & Rigler, R. (2000) Proc Natl Acad Sci U S A 97, 8266-8271. Memory landscapes of single-enzyme molecules. 58. Kim, H. D., Nienhaus, G. U., Ha, T., Orr, J. W., Williamson, J. R. & Chu, S.
(2002) Proc Natl Acad Sci U S A 99, 4284-4289. Mg2+-dependent conformational change of RNA studied by fluorescence
correlation and FRET on immobilized single molecules. 59. Boukobza, E., Sonnenfeld, A. & Haran, G. (2001) J Phys Chem B 105, 12165-
12170. Immobilization in surface-tethered lipid vesicles as a new tool for single
biomolecule spectroscopy. 60. Rhoades, E., Cohen, M., Schuler, B. & Haran, G. (2004) J Am Chem Soc 126,
14686-14687. Two-state folding observed in individual protein molecules. 61. MacBeath, G. & Schreiber, S. L. (2000) Science 289, 1760-1763. Printing proteins as microarrays for high-throughput function determination. 62. Nielsen, U. B., Cardone, M. H., Sinskey, A. J., MacBeath, G. & Sorger, P. K.
(2003) Proc Natl Acad Sci U S A 100, 9330-9335.

92
Profiling receptor tyrosine kinase activation by using Ab microarrays. 63. Rowe, C. A., Tender, L. M., Feldstein, M. J., Golden, J. P., Scruggs, S. B.,
MacCraith, B. D., Cras, J. J. & Ligler, F. S. (1999) Anal Chem 71, 3846-3852. Array biosensor for simultaneous identification of bacterial, viral, and protein
analytes. 64. Pavlickova, P., Knappik, A., Kambhampati, D., Ortigao, F. & Hug, H. (2003)
BioTechniques 34, 124-130. Microarray of recombinant antibodies using a streptavidin sensor surface self-
assembled onto a gold layer. 65. Levit-Binnun, N., Lindner, A. B., Zik, O., Eshhar, Z. & Moses, E. (2003) Anal
Chem 75, 1436-1441. Quantitative detection of protein arrays. 66. Piran, U. & Riordan, W. J. (1990) J Immunol Methods 133, 141-143. Dissociation rate constant of the biotin-streptavidin complex. 67. Hermanson, G. T. (1996) Bioconjugate Techniques (Academic Press, San
Diego, CA). 68. Busch, K. & Tampe, R. (2001) J Biotechnol 82, 3-24. Single molecule research on surfaces: from analytics to construction and back. 69. Sakamoto, T., Amitani, I., Yokota, E. & Ando, T. (2000) Biochem Biophys Res
Commun 272, 586-590. Direct observation of processive movement by individual myosin V molecules. 70. Forkey, J. N., Quinlan, M. E., Shaw, M. A., Corrie, J. E. T. & Goldman, Y. E.
(2003) Nature 422, 399-404. Three-dimensional structural dynamics of myosin V by single-molecule
fluorescence polarization. 71. Piestert, O., Barsch, H., Buschmann, V., Heinlein, T., Knemeyer, J.-P., Weston,
K. D. & Sauer, M. (2003) Nano Letters 3, 979-982. A single-molecule sensitive DNA hairpin system based on intramolecular
electron transfer. 72. Ostuni, E., Chapman, R. G., Holmlin, R. E., Takayama, S. & Whitesides, G. M.
(2001) Langmuir 17, 5605-5620. A survey of structure-property relationships of surfaces that resist the adsorption
of protein. 73. Szleifer, I. (1997) Biophys J 72, 595-612. Protein adsorption on surfaces with grafted polymers: a theoretical approach. 74. Halperin, A. (1999) Langmuir 15, 2525-2533. Polymer brushes that resist adsorption of model proteins: design parameters. 75. Yang, Z., Galloway, J. A. & Yu, H. (1999) Langmuir 15, 8405-8411.

93
Protein interactions with poly(ethylene glycol) self-assembled monolayers on glass substrates: diffusion and adsorption.
76. Satulovsky, J., Carignano, M. A. & Szleifer, I. (2000) Proc Natl Acad Sci U S A
97, 9037-9041. Kinetic and thermodynamic control of protein adsorption. 77. Sofia, S. J., Premnath, V. & Merrill, E. W. (1998) Macromolecules 31, 5059-
5070. Poly(ethylene oxide) grafted to silicon surfaces: grafting density and protein
adsorption. 78. Fang, F., Satulovsky, J. & Szleifer, I. (2005) Biophys J. Kinetics of protein adsorption and desorption on surfaces with grafted polymers. 79. Zolk, M., Eisert, F., Pipper, J., Herrwerth, S., Eck, W., Buck, M. & Grunze, M.
(2000) Langmuir 16, 5849-5852. Solvation of oligo(ethylene glycol)-terminated self-assembled monolayers
studied by vibrational sum frequency spectroscopy. 80. Zheng, J., Li, L., Tsao, H. K., Sheng, Y. J., Chen, S. & Jiang, S. (2005) Biophys
J 89, 158-166. Strong repulsive forces between protein and oligo (ethylene glycol) self-
assembled monolayers: a molecular simulation study. 81. Harder, P., Grunze, M., Dahint, R., Whitesides, G. M. & Laibinis, P. E. (1998) J
Phys Chem B 102, 426-436. Molecular conformation in oligo(ethylene glycol)-terminated self-assembled
monolayers on gold and silver surfaces determines their ability to resist protein adsorption.
82. Feldman, K., Hähner, G., Spencer, N. D., Harder, P. & Grunze, M. (1999) J Am
Chem Soc 121, 10134-10141. Probing resistance to protein adsorption of oligo(ethylene glycol)-terminated
self-assembled monolayers by scanning force microscopy. 83. Jo, S. & Park, K. (2000) Biomaterials 21, 605-616. Surface modification using silanated poly(ethylene glycol)s. 84. Veronese, F. M. (2001) Biomaterials 22, 405-417. Peptide and protein PEGylation. 85. Cha, T.-W., Boiadjiev, V., Lozano, J., Yang, H. & Zhu, X.-Y. (2002) Anal
Biochem 311, 27-32. Immobilization of oligonucleotides on poly(ethylene glycol) brush-coated Si
surfaces. 86. Stein, H. & Hausen, P. (1969) Science 166, 393-395. Enzyme from calf thymus degrading the RNA moiety of DNA-RNA hybrids:
effect on DNA-dependent RNA polymerase.
94
87. Hausen, P. & Stein, H. (1970) Eur J Biochem 14, 278-283. Ribonuclease H. An enzyme degrading the RNA moiety of DNA-RNA hybrids. 88. Kanaya, S. & Ikehara, M. (1995) Subcell Biochem 24, 377-422. Functions and structures of ribonuclease H enzymes. 89. Kanaya, S., Nakai, C., Konishi, A., Inoue, H., Ohtsuka, E. & Ikehara, M. (1992)
J Biol Chem 267, 8492-8498. A hybrid ribonuclease H. A novel RNA cleaving enzyme with sequence-specific
recognition. 90. Ma, W. P., Hamilton, S. E., Stowell, J. G., Byrn, S. R. & Davisson, V. J. (1994)
Bioorg Med Chem 2, 169-179. Sequence specific cleavage of messenger RNA by a modified ribonuclease H. 91. Nakai, C., Konishi, A., Komatsu, Y., Inoue, H., Ohtsuka, E., Kanaya, S. &
Ikehara, M. (1994) FEBS Lett 339, 67-72. Sequence-specific cleavage of RNA by a hybrid ribonuclease H. 92. Walton, C. M., Wu, C. H. & Wu, G. Y. (2001) Bioconjug Chem 12, 770-775. A ribonuclease H-oligo DNA conjugate that specifically cleaves hepatitis B viral
messenger RNA. 93. Fukuma, T., Walton, C. M., Wu, C. H. & Wu, G. Y. (2003) Bioconjug Chem 14,
295-301. Conjugation of an antisense oligodeoxynucleotide to ribonuclease h results in
sequence-specific cleavage and intracellular inhibition of HCV gene expression. 94. Kanaya, S. & Crouch, R. J. (1983) J Biol Chem 258, 1276-1281. DNA sequence of the gene coding for Escherichia coli ribonuclease H. 95. Kanaya, S., Katsuda, C., Kimura, S., Nakai, T., Kitakuni, E., Nakamura, H.,
Katayanagi, K., Morikawa, K. & Ikehara, M. (1991) J Biol Chem 266, 6038-6044.
Stabilization of Escherichia coli ribonuclease H by introduction of an artificial disulfide bond.
96. Dabora, J. M. & Marqusee, S. (1994) Protein Sci 3, 1401-1408. Equilibrium unfolding of Escherichia coli ribonuclease H: characterization of a
partially folded state. 97. Chamberlain, A. K., Handel, T. M. & Marqusee, S. (1996) Nat Struct Biol 3,
782-787. Detection of rare partially folded molecules in equilibrium with the native
conformation of RNaseH. 98. Raschke, T. M., Kho, J. & Marqusee, S. (1999) Nat Struct Biol 6, 825-831. Confirmation of the hierarchical folding of RNase H: a protein engineering
study. 99. Robic, S., Berger, J. M. & Marqusee, S. (2002) Protein Sci 11, 381-389.

95
Contributions of folding cores to the thermostabilities of two ribonucleases H. 100. Parker, M. J. & Marqusee, S. (1999) J Mol Biol 293, 1195-1210. The cooperativity of burst phase reactions explored. 101. Parker, M. J. & Marqusee, S. (2000) J Mol Biol 300, 1361-1375. A statistical appraisal of native state hydrogen exchange data: evidence for a
burst phase continuum? 102. Goedken, E. R., Keck, J. L., Berger, J. M. & Marqusee, S. (2000) Protein Sci 9,
1914-1921. Divalent metal cofactor binding in the kinetic folding trajectory of Escherichia
coli ribonuclease HI. 103. Spudich, G., Lorenz, S. & Marqusee, S. (2002) Protein Sci 11, 522-528. Propagation of a single destabilizing mutation throughout the Escherichia coli
ribonuclease HI native state. 104. Spudich, G. M., Miller, E. J., Marqusee, S., Yamasaki, K., Yamasaki, T.,
Kanaya, S. & Oobatake, M. (2004) J Mol Biol 335, 609-618. Destabilization of the Escherichia coli RNase H kinetic intermediate: switching
between a two-state and three-state folding mechanism. 105. Yamasaki, K., Yamasaki, T., Kanaya, S. & Oobatake, M. (2003) Biopolymers
69, 176-188. Acid-induced denaturation of Escherichia coli ribonuclease HI analyzed by CD
and NMR spectroscopies. 106. Iben, I. E., Braunstein, D., Doster, W., Frauenfelder, H., Hong, M. K., Johnson,
J. B., Luck, S., Ormos, P., Schulte, A., Steinbach, P. J., Xie, A. H. & Young, R. D. (1989) Phys Rev Lett 62, 1916-1919.
Glassy behavior of a protein. 107. Kuwajima, K. (1989) Proteins 6, 87-103. The molten globule state as a clue for understanding the folding and
cooperativity of globular-protein structure. 108. Ptitsyn, O. (1996) Nat Struct Biol 3, 488-490. How molten is the molten globule? 109. Klein-Seetharaman, J., Oikawa, M., Grimshaw, S. B., Wirmer, J., Duchardt, E.,
Ueda, T., Imoto, T., Smith, L. J., Dobson, C. M. & Schwalbe, H. (2002) Science 295, 1719-1722.
Long-range interactions within a nonnative protein. 110. Denisov, V. P., Jonsson, B.-H. & Halle, B. (1999) Nat Struct Biol 6, 253-260. Hydration of denatured and molten globule proteins. 111. Shortle, D. & Ackerman, M. S. (2001) Science 293, 487-489. Persistence of native-like topology in a denatured protein in 8 M urea.

96
112. Shortle, D. (1996) FASEB J 10, 27-34. The denatured state (the other half of the folding equation) and its role in protein
stability. 113. Neri, D., Billeter, M., Wider, G. & Wuthrich, K. (1992) Science 257, 1559-
1563. NMR determination of residual structure in a urea-denatured protein, the 434-
repressor. 114. Tsien, R. Y. (1998) Annu Rev Biochem 67, 509-544. The green fluorescent protein. 115. Zacharias, D. A., Baird, G. S. & Tsien, R. Y. (2000) Curr Opin Neurobiol 10,
416-421. Recent advances in technology for measuring and manipulating cell signals. 116. Nienhaus, K., Vallone, B., Renzi, F., Wiedenmann, J. & Nienhaus, G. U. (2003)
Acta Crystallogr D Biol Crystallogr 59, 1253-1255. Crystallization and preliminary X-ray diffraction analysis of the red fluorescent
protein eqFP611. 117. Petersen, J., Wilmann, P. G., Beddoe, T., Oakley, A. J., Devenish, R. J.,
Prescott, M. & Rossjohn, J. (2003) J Biol Chem 278, 44626-44631. The 2.0-A crystal structure of eqFP611, a far red fluorescent protein from the
sea anemone Entacmaea quadricolor. 118. Gross, L. A., Baird, G. S., Hoffman, R. C., Baldridge, K. K. & Tsien, R. Y.
(2000) Proc Natl Acad Sci U S A 97, 11990-11995. The structure of the chromophore within DsRed, a red fluorescent protein from
coral. 119. Yarbrough, D., Wachter, R. M., Kallio, K., Matz, M. V. & Remington, S. J.
(2001) Proc Natl Acad Sci U S A 98, 462-467. Refined crystal structure of DsRed, a red fluorescent protein from coral, at 2.0-A
resolution. 120. Li, X., Zhang, G., Ngo, N., Zhao, X., Kain, S. R. & Huang, C. C. (1997) J Biol
Chem 272, 28545-28549. Deletions of the Aequorea victoria green fluorescent protein define the minimal
domain required for fluorescence. 121. Campbell, R. E., Tour, O., Palmer, A. E., Steinbach, P. A., Baird, G. S.,
Zacharias, D. A. & Tsien, R. Y. (2002) Proc Natl Acad Sci U S A 99, 7877-7882.
A monomeric red fluorescent protein. 122. Schenk, A., Ivanchenko, S., Rocker, C., Wiedenmann, J. & Nienhaus, G. U.
(2004) Biophys J 86, 384-394. Photodynamics of red fluorescent proteins studied by fluorescence correlation
spectroscopy.
97
123. Ward, W. W. & Bokman, S. H. (1982) Biochemistry 21, 4535-4540. Reversible denaturation of Aequorea green-fluorescent protein: physical
separation and characterization of the renatured protein. 124. Fukuda, H., Arai, M. & Kuwajima, K. (2000) Biochemistry 39, 12025-12032. Folding of green fluorescent protein and the cycle3 mutant. 125. Verkhusha, V. V., Akovbian, N. A., Efremenko, E. N., Varfolomeyev, S. D. &
Vrzheshch, P. V. (2001) Biochemistry (Mosc) 66, 1342-1351. Kinetic analysis of maturation and denaturation of DsRed, a coral-derived red
fluorescent protein. 126. Cotlet, M., Hofkens, J., Habuchi, S., Dirix, G., Van Guyse, M., Michiels, J.,
Vanderleyden, J. & De Schryver, F. C. (2001) Proc Natl Acad Sci U S A 98, 14398-14403.
Identification of different emitting species in the red fluorescent protein DsRed by means of ensemble and single-molecule spectroscopy.
127. Garcia-Parajo, M. F., Koopman, M., van Dijk, E. M., Subramaniam, V. & van
Hulst, N. F. (2001) Proc Natl Acad Sci U S A 98, 14392-14397. The nature of fluorescence emission in the red fluorescent protein DsRed,
revealed by single-molecule detection. 128. Chirico, G., Cannone, F., Beretta, S., Diaspro, A., Campanini, B., Bettati, S.,
Ruotolo, R. & Mozzarelli, A. (2002) Protein Sci 11, 1152-1161. Dynamics of green fluorescent protein mutant2 in solution, on spin-coated
glasses, and encapsulated in wet silica gels. 129. Cannone, F., Chirico, G. & Diaspro, A. (2003) J Biomed Opt 8, 391-395. Two-photon interactions at single fluorescent molecule level. 130. Saleh, B. E. A. & Teich, M. C. (1991) Fundamentals of photonics (John Wiley
& Sons, Inc. 131. Beyer, W. H. (2000) CRC Handbook of tables for Probability and Statistics
(CRC Press, Boca Raton, FL). 132. Plakhotnik, T., Moerner, W. E., Palm, V. & Wild, U. P. (1995) Opt Commun
114, 83-88. Single molecule spectroscopy: maximum emission rate and saturation intensity. 133. Bopp, M. A., Jia, Y., Haran, G., Morlino, E. A. & Hochstrasser, R. M. (1998)
Appl Phys Lett 73, 7-9. Single-molecule spectroscopy with 27 fs pulses: time-resolved experiments and
direct imaging of orientational distributions. 134. Kanaya, S., Kohara, A., Miyagawa, M., Matsuzaki, T., Morikawa, K., Ikehara,
M. & Crouch, R. J. (1989) J Biol Chem 264, 11546-11549. Overproduction and preliminary crystallographic study of ribonuclease H from
Escherichia coli.
98
135. Hogrefe, H. H., Hogrefe, R. I., Walder, R. Y. & Walder, J. A. (1990) J Biol Chem 265, 5561-5566.
Kinetic analysis of Escherichia coli RNase H using DNA-RNA-DNA/DNA substrates.
136. Groll, J., Amirgoulova, E., Ameringer, T., Heyes, C. D., Röcker, C., Möller, M.
& Nienhaus, G. U. (2004) J Am Chem Soc 126, 4234-4239. Biofunctionalized, ultrathin coatings of cross-linked star-shaped poly(ethylene
oxide) allow reversible folding of immobilized proteins. 137. Greene, R. F., Jr. & Pace, C. N. (1974) J Biol Chem 249, 5388-5393. Urea and guanidine hydrochloride denaturation of ribonuclease, lysozyme,
alpha-chymotrypsin, and beta-lactoglobulin. 138. Pace, C. N. (1986) Methods Enzymol 131, 266-280. Determination and analysis of urea and guanidine hydrochloride denaturation
curves. 139. Pace, C. N. & Shaw, K. L. (2000) Proteins Suppl 4, 1-7. Linear extrapolation method of analyzing solvent denaturation curves. 140. Myers, J. K., Pace, C. N. & Scholtz, J. M. (1995) Protein Sci 4, 2138-2148. Denaturant m values and heat capacity changes: relation to changes in accessible
surface areas of protein unfolding. 141. Courtenay, E. S., Capp, M. W. & Record, M. T., Jr. (2001) Protein Sci 10, 2485-
2497. Thermodynamics of interactions of urea and guanidinium salts with protein
surface: relationship between solute effects on protein processes and changes in water-accessible surface area.
142. Courtenay, E. S., Capp, M. W., Saecker, R. M. & Record, M. T., Jr. (2000)
Proteins S4, 72-85. Thermodynamic analysis of interactions between denaturants and protein surface
exposed on unfolding: interpretation of urea and guanidinium chloride m-values and their correlation with changes in accessible surface area (ASA) using preferential interaction coefficients and the local-bulk domain model.
143. Schellman, J. A. (2003) Biophys J 85, 108-125. Protein stability in mixed solvents: a balance of contact interaction and excluded
volume. 144. Murugan, R. (2003) Biophys J 84, 770-774. Competitive model on denaturant-mediated protein unfolding. 145. Mason, P. E., Neilson, G. W., Dempsey, C. E., Barnes, A. C. & Cruickshank, J.
M. (2003) Proc Natl Acad Sci U S A 100, 4557-4561. The hydration structure of guanidinium and thiocyanate ions: implications for
protein stability in aqueous solution. 146. Santoro, M. M. & Bolen, D. W. (1992) Biochemistry 31, 4901-4907.

99
A test of the linear extrapolation of unfolding free energy changes over an extended denaturant concentration range.
147. Monera, O. D., Kay, C. M. & Hodges, R. S. (1994) Protein Sci 3, 1984-1991. Protein denaturation with guanidine hydrochloride or urea provides a different
estimate of stability depending on the contributions of electrostatic interactions. 148. Staniforth, R. A., Burston, S. G., Smith, C. J., Jackson, G. S., Badcoe, I. G.,
Atkinson, T., Holbrook, J. J. & Clarke, A. R. (1993) Biochemistry 32, 3842-3851.
The energetics and cooperativity of protein folding: a simple experimental analysis based upon the solvation of internal residues.
149. Parker, M. J., Spencer, J. & Clarke, A. R. (1995) J Mol Biol 253, 771-786. An integrated kinetic analysis of intermediates and transition states in protein
folding reactions. 150. Parker, M. J. & Clarke, A. R. (1997) Biochemistry 36, 5786-5794. Amide backbone and water-related H/D isotope effects on the dynamics of a
protein folding reaction. 151. Nozaki, Y. (1972) Methods Enzymol 26 PtC, 43-50. The preparation of guanidine hydrochloride. 152. Kleima, F. J., Hofmann, E., Gobets, B., van Stokkum, I. H., van Grondelle, R.,
Diederichs, K. & van Amerongen, H. (2000) Biophys J 78, 344-353. Forster excitation energy transfer in peridinin-chlorophyll-a-protein. 153. Knox, R. S. & van Amerongen, H. (2002) J Phys Chem B 106, 5289-5293. Refractive index dependence of the Foerster resonance excitation transfer rate. 154. Vörös, J. (2004) Biophys J 87, 553-561. The density and refractive index of adsorbing protein layers. 155. Fitzkee, N. C. & Rose, G. D. (2004) Proc Natl Acad Sci U S A 101, 12497-
12502. Reassessing random-coil statistics in unfolded proteins. 156. Flory, P. J. (1969) Statistical Mechanics of Chain Molecules (Wiley, New
York). 157. Kanaya, S. (1998) in Ribonucleases H, eds. Crouch, R. J. & Toulme, J. J.
(INSERM, Paris), pp. 1-38. Enzymatic activity and protein stability of E. coli ribonuclease HI. 158. Niwa, H., Inouye, S., Hirano, T., Matsuno, T., Kojima, S., Kubota, M., Ohashi,
M. & Tsuji, F. I. (1996) Proc Natl Acad Sci U S A 93, 13617-13622. Chemical nature of the light emitter of the Aequorea green fluorescent protein. 159. Metropolis, N., Rosenbluth, A. W., Rosenbluth, M. N., Teller, A. H. & Teller, E.
(1953) J Chem Phys 21, 1087-1092.

100
Equation of state populations by fast computing machines. 160. Caflisch, A. & Karplus, M. (1994) Proc Natl Acad Sci U S A 91, 1746-1750. Molecular dynamics simulation of protein denaturation: solvation of the
hydrophobic cores and secondary structure of barnase. 161. Nishii, I., Kataoka, M., Tokunaga, F. & Goto, Y. (1994) Biochemistry 33, 4903-
4909. Cold denaturation of the molten globule states of apomyoglobin and a profile for
protein folding. 162. Creamer, T. P., Srinivasan, R. & Rose, G. D. (1997) Biochemistry 36, 2832-
2835. Modeling unfolded states of proteins and peptides. II. Backbone solvent
accessibility. 163. Segel, D. J., Eliezer, D., Uversky, V., Fink, A. L., Hodgson, K. O. & Doniach,
S. (1999) Biochemistry 38, 15352-15359. Transient dimer in the refolding kinetics of cytochrome c characterized by
small-angle X-ray scattering. 164. Shimizu, S. & Chan, H. S. (2002) Proteins 49, 560-566. Origins of protein denatured state compactness and hydrophobic clustering in
aqueous urea: inferences from nonpolar potentials of mean force. 165. Bernabeu, P. & Caprani, A. (1990) Biomaterials 11, 258-264. Influence of surface charge on adsorption of fibrinogen and/or albumin on a
rotating disc electrode of platinum and carbon. 166. Topoglidis, E., Campbell, C. J., Cass, A. E. G. & Durrant, J. R. (2001) Langmuir
17, 7899-7906. Factors that affect protein adsorption on nanostructured titania films. A novel
spectroelectrochemical application to sensing. 167. Wadu-Mesthrige, K., Amro, N. A., Garno, J. C., Xu, S. & Liu, G. (2001)
Biophys J 80, 1891-1899. Fabrication of nanometer-sized protein patterns using atomic force microscopy
and selective immobilization. 168. Zhou, D., Wang, X., Birch, L., Rayment, T. & Abell, C. (2003) Langmuir 19,
10557-10562. AFM study on protein immobilization on charged surfaces at the nanoscale:
toward the fabrication of three-dimensional protein nanostructures. 169. Peters, T., Jr. (1985) Adv Protein Chem 37, 161-245. Serum albumin. 170. Carter, D. C. & Ho, J. X. (1994) Adv Protein Chem 45, 153-203. Structure of serum albumin.
101
171. Wang, M. S., Palmer, L. B., Schwartz, J. D. & Razatos, A. (2004) Langmuir 20, 7753-7759.
Evaluating protein attraction and adhesion to biomaterials with the atomic force microscope.
172. Heyes, C. D., Kobitski, A. Y., Amirgoulova, E. V. & Nienhaus, G. U. (2004) J
Phys Chem B 108, 13387-13394. Biocompatible surfaces for specific tethering of individual protein molecules. 173. Jeon, S. I., Lee, J. H., Andrade, J. D. & DeGennes, P. G. (1991) J Colloid
Interface Sci 142, 149-158. Protein-surface interactions in the presence of polyethylene oxide: simplified
theory. 174. Kingshott, P. & Griesser, H. J. (1999) Curr Opin Sol State Mat Sci 4, 403-412. Surfaces that resist bioadhesion. 175. Devanand, K. & Selser, J. C. (1991) Macromolecules 24, 5943-5947. Asymptotic behavior and long-range interactions in aqueous solutions of
poly(ethylene oxide). 176. Szleifer, I. & Carignano, M. A. (2000) Macromolecular Rapid Communications
21, 423-448. Tethered polymer layers: phase transitions and reduction of protein adsorption. 177. Sheth, S. R. & Leckband, D. (1997) Proc Natl Acad Sci U S A 94, 8399-8404. Measurements of attractive forces between proteins and end-grafted
poly(ethylene glycol) chains. 178. Furness, E. L., Ross, A., Davis, T. P. & King, G. C. (1998) Biomaterials 19,
1361-1369. A hydrophobic interaction site for lysozyme binding to polyethylene glycol and
model contact lens polymers. 179. Azegami, S., Tsuboi, A., Izumi, R., Hirata, M., Dubin, P. L., Wang, B. &
Kokufuta, E. (1999) Langmuir 15, 940-947. Formation of an intrapolymer complex from human serum albumin and
poly(ethylene glycol). 180. Efremova, N. V., Bondurant, B., O'Brien, D. F. & Leckband, D. E. (2000)
Biochemistry 39, 3441-3451. Measurements of interbilayer forces and protein adsorption on uncharged lipid
bilayers displaying poly(ethylene glycol) chains. 181. Xu, Z. & Marchant, R. E. (2000) Biomaterials 21, 1075-1083. Adsorption of plasma proteins on polyethylene oxide-modified lipid bilayers
studied by total internal reflection fluorescence. 182. Efremova, N. V., Sheth, S. R. & Leckband, D. E. (2001) Langmuir 17, 7628-
7636.

102
Protein-induced changes in poly(ethylene glycol) brushes: molecular weight and temperature dependence.
183. Nishimura, C., Segel, D. J., Hodgson, K. O., Doniach, S. & Fink, A. L. (1997) in
SSRL activity report (Stanford Synchrotron Radiation Laboratory, Stanford, CA), pp. 7.25-27.
Monitoring the rate of protein folding with small-angle X-ray scattering. 184. Millett, I. S., Doniach, S. & Plaxco, K. W. (2002) Adv Protein Chem 62, 241-
261. Toward a taxonomy of the denatured state: small angle scattering studies of
unfolded proteins. 185. Helms, V., Straatsma, T. P. & McCammon, J. A. (1999) J Phys Chem B 103,
3263-3269. Internal dynamics of green fluorescent protein. 186. Kokufuta, E. & Nishimura, H. (1991) Polym Bull 26, 277-282. Complexation of pepsin with poly(ethylene glycol). 187. Matsudo, T., Ogawa, K. & Kokufuta, E. (2003) Biomacromolecules 4, 1794-
1799. Complex formation of protein with different water-soluble synthetic polymers. 188. Lee, L. L. Y. & Lee, J. C. (1987) Biochemistry 26, 7813-7819. Thermal stability of proteins in the presence of poly(ethylene glycols). 189. Cha, T., Guo, A. & Zhu, X.-Y. (2005) Proteomics 5, 416-419. Enzymatic activity on a chip: the critical role of protein orientation. 190. Hutschenreiter, S., Tinazli, A., Model, K. & Tampe, R. (2004) EMBO J 23,
2488-2497. Two-substrate association with the 20S proateasome at single-molecule level. 191. Edman, L., Földes-Papp, Z., Wennmalm, S. & Rigler, R. (1999) Chem Phys 247,
11-22. The fluctuating enzyme: a single molecule approach. 192. Rajagopalan, P. T., Zhang, Z., McCourt, L., Dwyer, M., Benkovic, S. J. &
Hammes, G. G. (2002) Proc Natl Acad Sci U S A 99, 13481-13486. Interaction of dihydrofolate reductase with methotrexate: ensemble and single-
molecule kinetics. 193. Alonso, D. O. V. & Dill, K. A. (1991) Biochemistry 30, 5974-5985. Solvent denaturation and stabilization of globular proteins. 194. Hollien, J. & Marqusee, S. (1999) Biochemistry 38, 3831-3836. A thermodynamic comparison of mesophilic and thermophilic ribonucleases H. 195. Spudich, G. & Marqusee, S. (2000) Biochemistry 39, 11677-11683.

103
A change in the apparent m value reveals a populated intermediate under equilibrium conditions in Escherichia coli ribonuclease HI.
196. Kamei, T., Oobatake, M. & Suzuki, M. (2002) Biophys J 82, 418-425. Hydration of apomyoglobin in native, molten globule, and unfolded states by
using microwave dielectric spectroscopy. 197. Brandts, J. F., Halvorson, H. R. & Brennan, M. (1975) Biochemistry 14, 4953-
4963. Consideration of the possibility that the slow step in protein denaturation
reactions is due to cis-trans isomerism of proline residues. 198. Shastry, M. C. R., Agashe, V. R. & Udgaonkar, J. B. (1994) Protein Sci 3, 1409-
1417. Quantitative analysis of the kinetics of denaturation and renaturation of barstar
in the folding transition zone. 199. Jackson, S. E. & Fersht, A. R. (1991) Biochemistry 30, 10436-10443. Folding of chymotrypsin inhibitor 2. 2. Influence of proline isomerization on the
folding kinetics and thermodynamic characterization of the transition state of folding.
200. Nakano, T., Antonino, L. C., Fox, R. O. & Fink, A. L. (1993) Biochemistry 32,
2534-2541. Effect of proline mutations on the stability and kinetics of folding of
staphylococcal nuclease. 201. Nall, B. T., Garel, J. R. & Baldwin, R. L. (1978) J Mol Biol 118, 317-330. Test of the extended two-state model for the kinetic intermediates observed in
the folding transition of ribonuclease A. 202. Evans, P. A., Topping, K. D., Woolfson, D. N. & Dobson, C. M. (1991)
Proteins 9, 248-266. Hydrophobic clustering in nonnative states of a protein: interpretation of
chemical shifts in NMR spectra of denatured states of lysozyme. 203. Schwalbe, H., Fiebig, K. M., Buck, M., Jones, J. A., Grimshaw, S. B., Spencer,
A., Glaser, S. J., Smith, L. J. & Dobson, C. M. (1997) Biochemistry 36, 8977-8991.
Structural and dynamical properties of a denatured protein. Heteronuclear 3D NMR experiments and theoretical simulations of lysozyme in 8 M urea.
204. Sridevi, K., Juneja, J., Bhuyan, A. K., Krishnamoorthy, G. & Udgaonkar, J. B.
(2000) J Mol Biol 302, 479-495. The slow folding reaction of barstar: the core tryptophan region attains tight
packing before substantial secondary and tertiary structure formation and final compaction of the polypeptide chain1.
205. Schwarzinger, S., Wright, P. E. & Dyson, H. J. (2002) Biochemistry 41, 12681-
12686. Molecular hinges in protein folding: the urea-denatured state of apomyoglobin.

104
206. Arcus, V. L., Vuilleumier, S., Freund, S. M. V., Bycroft, M. & Fersht, A. R.
(1995) J Mol Biol 254, 305-321. A comparison of the pH, urea, and temperature-denatured states of barnase by
heteronuclear NMR: implications for the initiation of protein folding. 207. Penkett, C. J., Redfield, C., Dodd, I., Hubbard, J., McBay, D. L., Mossakowska,
D. E., Smith, R. A., Dobson, C. M. & Smith, L. J. (1997) J Mol Biol 274, 152-159.
NMR analysis of main-chain conformational preferences in an unfolded fibronectin-binding protein.
208. Wong, K.-B., Clarke, J., Bond, C. J., Neira, J. L., Freund, S. M. V., Fersht, A. R.
& Daggett, V. (2000) J Mol Biol 296, 1257-1282. Towards a complete description of the structural and dynamic properties of the
denatured state of barnase and the role of residual structure in folding. 209. Avbelj, F. & Baldwin, R. L. (2004) Proc Natl Acad Sci U S A 101, 10967-
10972. Origin of the neighboring residue effect on peptide backbone conformation. 210. Pappu, R. V., Srinivasan, R. & Rose, G. D. (2000) Proc Natl Acad Sci U S A 97,
12565-12570. The Flory isolated-pair hypothesis is not valid for polypeptide chains:
implications for protein folding. 211. Fitzkee, N. C. & Rose, G. D. (2004) Protein Sci 13, 633-639. Steric restrictions in protein folding: an alpha-helix cannot be followed by a
contiguous beta-strand. 212. Socci, N. D., Onuchic, J. N. & Wolynes, P. G. (1996) J Chem Phys 104, 5860-
5868. Diffusive dynamics of the reaction coordinate for protein folding funnels. 213. Klimov, D. K. & Thirumalai, D. (1997) Phys Rev Lett 79, 317-320. Viscosity dependence of the folding rates of proteins. 214. Widengren, J. & Schwille, P. (2000) Journal Of Physical Chemistry A 104,
6416-6428. Characterization of photoinduced isomerization and back-isomerization of the
cyanine dye Cy5 by fluorescence correlation spectroscopy. 215. Heilemann, M., Margeat, E., Kasper, R., Sauer, M. & Tinnefeld, P. (2005) J Am
Chem Soc 127, 3801-3806. Carbocyanine dyes as efficient reversible single-molecule optical switch. 216. Chattopadhyay, K., Elson, E. L. & Frieden, C. (2005) Proc Natl Acad Sci U S A
102, 2385-2389. The kinetics of conformational fluctuations in an unfolded protein measured by
fluorescence methods.

105
217. Buscaglia, M., Schuler, B., Lapidus, L. J., Eaton, W. A. & Hofrichter, J. (2003) J Mol Biol 332, 9-12.
Kinetics of intramolecular contact formation in a denatured protein. 218. Hagen, S. J., Hofrichter, J., Szabo, A. & Eaton, W. A. (1996) Proc Natl Acad Sci
U S A 93, 11615-11617. Diffusion-limited contact formation in unfolded cytochrome c: estimating the
maximum rate of protein folding. 219. Hagen, S. J., Carswell, C. W. & Sjolander, E. M. (2001) J Mol Biol 305, 1161-
1171. Rate of intrachain contact formation in an unfolded protein: temperature and
denaturant effects. 220. Lapidus, L. J., Eaton, W. A. & Hofrichter, J. (2000) Proc Natl Acad Sci U S A
97, 7220-7225. Measuring the rate of intramolecular contact formation in polypeptides. 221. Onuchic, J. N., Wolynes, P. G., Luthey-Schulten, Z. & Socci, N. D. (1995) Proc
Natl Acad Sci U S A 92, 3626-3630. Toward an outline of the topography of a realistic protein-folding funnel. 222. Wang, J., Saven, J. G. & Wolynes, P. G. (1996) J Chem Phys 105, 11276-11284. Kinetics in globally connected, correlated random energy model. 223. Frauenfelder, H., McMahon, B. H., Austin, R. H., Chu, K. & Groves, J. T.
(2001) Proc Natl Acad Sci U S A 98, 2370-2374. The role of structure, energy landscape, dynamics, and allostery in the enzymatic
function of myoglobin. 224. Krivov, S. V. & Karplus, M. (2004) Proc Natl Acad Sci U S A 101, 14766-
14770. Hidden complexity of free energy surfaces for peptide (protein) folding. 225. Rief, M., Gautel, M., Oesterhelt, F., Fernandez, J. M. & Gaub, H. E. (1997)
Science 276, 1109-1112. Reversible unfolding of individual titin immunoglobulin domains by AFM. 226. Kellermayer, M. S., Smith, S. B., Granzier, H. L. & Bustamante, C. (1997)
Science 276, 1112-1116. Folding-unfolding transitions in single titin molecules characterized with laser
tweezers. 227. Leake, M. C., Wilson, D., Bullard, B. & Simmons, R. M. (2003) FEBS Lett 535,
55-60. The elasticity of single kettin molecules using a two-bead laser-tweezers assay. 228. Li, L., Huang, H. H., Badilla, C. L. & Fernandez, J. M. (2005) J Mol Biol 345,
817-826. Mechanical unfolding intermediates observed by single-molecule force
spectroscopy in a fibronectin type III module.

106
229. Schlierf, M., Li, H. & Fernandez, J. M. (2004) Proc Natl Acad Sci U S A 101,
7299-7304. The unfolding kinetics of ubiquitin captured with single-molecule force-clamp
techniques. 230. Best, R. B., Li, B., Steward, A., Daggett, V. & Clarke, J. (2001) Biophys J 81,
2344-2356. Can non-mechanical proteins withstand force? Stretching barnase by atomic
force microscopy and molecular dynamics simulation. 231. Dietz, H. & Rief, M. (2004) Proc Natl Acad Sci U S A 101, 16192-16197. Exploring the energy landscape of GFP by single-molecule mechanical
experiments. 232. Oesterhelt, F., Oesterhelt, D., Pfeiffer, M., Engel, A., Gaub, H. E. & Muller, D.
J. (2000) Science 288, 143-146. Unfolding pathways of individual bacteriorhodopsins. 233. Muller, D. J., Kessler, M., Oesterhelt, F., Moller, C., Oesterhelt, D. & Gaub, H.
(2002) Biophys J 83, 3578-3588. Stability of bacteriorhodopsin alpha-helices and loops analyzed by single-
molecule force spectroscopy. 234. Janovjak, H., Kessler, M., Oesterhelt, D., Gaub, H. & Muller, D. J. (2003)
EMBO J 22, 5220-5229. Unfolding pathways of native bacteriorhodopsin depend on temperature. 235. Cisneros, D. A., Oesterhelt, D. & Muller, D. J. (2005) Structure (Camb) 13, 235-
242. Probing origins of molecular interactions stabilizing the membrane proteins
halorhodopsin and bacteriorhodopsin. 236. Janovjak, H., Muller, D. J. & Humphris, A. D. (2005) Biophys J 88, 1423-1431. Molecular force modulation spectroscopy revealing the dynamic response of
single bacteriorhodopsins. 237. Kedrov, A., Ziegler, C., Janovjak, H., Kuhlbrandt, W. & Muller, D. J. (2004) J
Mol Biol 340, 1143-1152. Controlled unfolding and refolding of a single sodium-proton antiporter using
atomic force microscopy. 238. Sase, I., Miyata, H., Corrie, J. E., Craik, J. S. & Kinosita, K., Jr. (1995) Biophys
J 69, 323-328. Real time imaging of single fluorophores on moving actin with an
epifluorescence microscope. 239. Funatsu, T., Harada, Y., Tokunaga, M., Saito, K. & Yanagida, T. (1995) Nature
374, 555-559. Imaging of single fluorescent molecules and individual ATP turnovers by single
myosin molecules in aqueous solution.

107
240. Schuler, B., Lipman, E. A. & Eaton, W. A. (2003) Nature 421, 94. corrigendum: Probing the free-energy surface for protein folding with single-
molecule fluorescence spectroscopy. 241. Gopich, I. & Szabo, A. (2005) J Chem Phys 122, 14707. Theory of photon statistics in single-molecule Forster resonance energy transfer. 242. Leite, V. B., Onuchic, J. N., Stell, G. & Wang, J. (2004) Biophys J 87, 3633-
3641. Probing the kinetics of single molecule protein folding. 243. Willets, K. A., Ostroverkhova, O., He, M., Twieg, R. J. & Moerner, W. E.
(2003) J Am Chem Soc 125, 1174-1175. Novel fluorophores for single-molecule imaging. 244. Bates, M., Blosser, T. R. & Zhuang, X. (2005) Phys Rev Lett 94, 108101. Short-range spectroscopic ruler based on a single-molecule optical switch. 245. Wallace, M. I., Molloy, J. E. & Trentham, D. R. (2003) J Biol 2, 4. Combined single-molecule force and fluorescence measurements for biology.

108
Summary
The heterogeneity of individual trajectories of a protein adopting its native conformation from the myriad of denatured states can be studied by single-molecule spectroscopy. However, to study timescales longer than a few milliseconds, the protein has to be fixed in space, for example by immobilization on a surface. The delicate structure of proteins requires surface coatings which neither interfere with the energetics of the folding nor introduce additional, surface-induced heterogeneities. In this work, we characterize and compare several surfaces devised for single molecule fluorescence experiments for their biocompatibility and employ the best of the designed surfaces to investigate the complex folding landscape of the Ribonuclease H (RNase H) protein. Our studies were focused on two classes of biocompatible surfaces, based on coating with proteins and poly(ethylene glycols) (PEGs). In the first case, the glass surface was passivated with bovine serum albumin (BSA) or streptavidin protein molecules. We adsorbed these proteins by either physical (electrostatic) interactions or by chemical bonding and concurrent cross-linking (via peptide bonds). In the second case, the studied PEG coatings were either monolayers of linear PEG chains with molecular masses of 2000 and 5000 or films of cross-linked star-shaped PEG molecules with a molecular mass of 12000. In both cases, proteins of interest could then be tethered to the surfaces via a biotin-streptavidin linkage. The protein conformations were studied by fluorescence resonance energy transfer (FRET) spectroscopy. For physisorbed protein layers, we found that (i) they were irreproducible from sample-to-sample, (ii) on average, they showed poor resistance to unspecific protein adsorption (by interactions other than the biotin-streptavidin coupling), (iii) they were unstable in the presence of guanidinium chloride (GdmCl), the denaturant solution used to study protein folding and (iv) the folding free energy profile of RNase H was altered for the immobilized molecules compared to RNase H freely diffusing in solution. Chemisorption and cross-linking of the protein layers on the surface radically improved the performance and reproducibility of the protein-based coatings. They exhibited excellent resistance to unspecific adsorption of RNase H, and, moreover, the immobilized RNase H could be reversibly unfolded and folded by GdmCl. Only small deviations compared to RNase H in solution were detected for the protein stability and cooperativity of the folding process. However, the application of protein-based surfaces to study an arbitrary protein is limited because of the uncontrollable protein-protein interactions. For example, we found that fluorescent protein eqFP611 is strongly attracted to the chemisorbed/cross-linked BSA surface, which results in partial loss of its intrinsic fluorescence. Both linear PEG 5000 and cross-linked star PEG resisted unspecific adsorption of the proteins of interest. However, for the shorter linear PEG 2000, there were coexisting micrometer-sized areas with both low and high resistance. We rationalize this by the different architectures of linear PEG on the surface, existing either as highly resistant mushroom-like structure or as low resistant, more densely grafted, brush-like structure. Furthermore, specific immobilization of RNase H on PEG 5000 resulted in irreversible

109
protein unfolding whereas eqFP611 seemed to be unperturbed on this surface. The unfolding of RNase H can be explained by the interplay of two effects: (i) intermingling of the PEG and polypeptide chains following structural fluctuations of the protein, and (ii) once it is fixed in close proximity to the surface, the protein can occasionally penetrate between the flexible PEG chains and bind and unfold onto the underlying charged surface. The cross-linking of PEG chains solves both of these problems. Denaturation/renaturation of RNase H on the cross-linked star PEG surface was completely reversible. There were no differences in the free energies of the folded and unfolded states for RNase H on this surface compared to the protein in solution and the folding and unfolding rates of immobilized RNase H were identical with the published data for RNase H freely diffusing in solution. Moreover, the enzymatic activity of RNase H on this surface was identical to its activity in solution and completely recovered after protein denaturation with 6 M GdmCl and renaturation in buffer. The fluorescence properties of eqFP611 were also unperturbed upon immobilization on this surface. Therefore, the cross-linked star PEG surface is the optimum platform for single-molecule studies on immobilized proteins, and all of the following results were obtained using this surface. Careful analysis of the single-molecule data revealed that, in contrast to the folded state, the average radius of gyration of unfolded RNase H molecules increases with increasing GdmCl concentration. The most pronounced expansion was observed near the midpoint of the folding/unfolding transition, while at stronger denaturing conditions the size changes were much smaller. Apparently, upon increasing the GdmCl concentration, the unfolded polypeptide chain binds more Gdm+ ions up to a saturation point. We modeled our data as a shift of the equilibrium within a continuum of unfolded states and obtained various thermodynamic parameters such as their free energies and cooperativity values. The fluorescence time traces recorded from individual RNase H molecules showed that unfolded RNase H molecules fluctuate between many conformations on the second timescale. Therefore, these substates are separated by large free energy barriers. The transitions were spread over all possible initial and final FRET efficiency values, indicating a high diversity in the folding pathways. However, smaller changes occur more frequently than larger ones. The existence of long-lived unfolded structures resulted in a significant width of the FRET efficiency distribution of the unfolded state. We developed a model that connects the distribution of the transition magnitudes with the observed width of the unfolded state. With this model, we proved quantitatively that the width of the unfolded state is determined by multiple substates and is not a surface-induced artifact. The increase of GdmCl concentration was accompanied by a narrowing of the unfolded distribution, implying greater averaging between the unfolded substates. However, the transitions between unfolded substates were still observed even at highest-possible GdmCl concentration, 6 M. The existence of structure in RNase H under such strong denaturing conditions is the most intriguing finding of this work. We suggest that it is determined by hydrophobic clustering and local arrangement of the residues due to steric and dipole-dipole interactions. From the cross-correlation functions of the donor and acceptor emission measured on individual molecules, we found that the reconfiguration time of unfolded RNase H

110
chains is ~20 µs (at 1.7 M GdmCl). Applying Kramer’s theory, which relates the reconfiguration time and the free energy barriers with the rate of the barrier crossing, we evaluated the average height of the barriers between the unfolded substates to be ~24 kJ/mol and the barrier from the unfolded to the folded ensemble to be ~33 kJ/mol (at 1.7 M GdmCl). Finally, we present a two-dimensional scheme of the free energy landscape. The first spatial coordinate, Q1, describes transitions between the unfolded substates, separated by barriers. The other reaction coordinate, Q2, describes protein folding. The folded state is separated from the unfolded ensemble by a larger barrier, which can be approached from the unfolded states by smooth valleys along the Q2 coordinate.
111
Zusammenfassung Die Vielfalt von individuellen Trajektorien eines Proteins, das den Weg zu seiner nativen Konformation aus der Myriade von denaturierten Zuständen sucht, kann man mittels Einzelmolekülspektroskopie untersuchen. Um jedoch das Protein länger als einige Millisekunden untersuchen zu können, muss das Protein räumlich fixiert werden, zum Beispiel durch Immobilisierung auf einer Oberfläche. Die feine Struktur der Proteine verlangt Oberflächenbeschichtungen, die weder die Energielandschaft der Faltung beeinflussen noch oberflächenbedingte Artefakte verursachen. Wir charakterisieren und vergleichen in dieser Studie mehrere Oberflächen, die für die Fluoreszenzspektroskopie an einzelnen Molekülen entwickelt wurden, und wenden die optimale Oberfläche zur Untersuchung der komplexen Landschaft der Proteinfaltung der Ribonuklease H (RNase H) an. Unsere Untersuchungen wurden auf zwei Klassen von biokompatiblen Oberflächen gerichtet – proteinbeschichtete und Poly(Ethylen-Glykole)(PEG)-beschichtete. Im ersten Fall war die Glasoberfläche mit Rinder Serum Albumin (bovine serum albumin, BSA) oder Streptavidinmolekülen beschichtet. Wir adsorbierten diese Proteine entweder durch physikalische (elektrostatische) Wechselwirkungen oder durch chemische Bindungen und Quervernetzung durch Peptidbrücken. Im zweiten Fall waren die benutzten PEG-Oberflächen entweder Monoschichten von linearen PEG-Ketten mit einem Molekulargewicht von 2000 und 5000 oder Schichten von querververnetzten, sternförmigen PEG-Molekülen mit einem Molekulargewicht von 12000. In beiden Fällen konnten die zu untersuchenden Proteine durch eine Biotin-Streptavidin-Bindung auf einer Oberfläche immobilisiert werden. Die Proteinkonformationen wurden dann mittels Fluoreszenz-Resonanz-Energie-Transfer (FRET) untersucht. Wir fanden, dass die physisorbierten Proteinoberflächen (i) nicht reproduzierbare Ergebnisse lieferten, (ii) im Schnitt nicht resistent gegen unspezifische Proteinadsorption sind, (iii) instabil in Präsenz von Guanidinium Chlorid (GdmCl) waren, einer Denaturierungslösung, die in Untersuchungen von Proteinfaltung benutzt wird, und (iv) die Energielandschaft der Proteinfaltung beeinflussten, so dass die auf der Oberfläche immobilisierten RNase H Moleküle im Vergleich zu den in der Lösung frei diffundierenden Molekülen andere Eigenschaften aufwiesen. Chemisorption und Quervernetzung der Proteinschichten auf der Oberfläche verbesserten die Leistung und Reproduzierbarkeit der Proteinoberflächen erheblich, die nun resistent gegen unspezifische Adsorption waren. Außerdem ließ sich RNase H auf solchen Oberflächen durch GdmCl reversibel entfalten und falten. Proteinstabilität und Kooperativität der Faltung zeigte nur kleine Abweichungen zu den Eigenschaften von RNase H in der Lösung. Jedoch ist die Anwendung der proteinbasierten Oberflächen in den Untersuchungen beliebiger Proteine wegen unkontrollierbarer Protein-Protein-Interaktionen begrenzt. Wir fanden zum Beispiel, dass das Fluoreszenzprotein eqFP611 stark zu der chemisorbierenden / quervernetzten BSA-Oberfläche angezogen wird, was einen Teilverlust der intrinsischen Fluoreszenz zur Folge hat. Die beiden PEG-Formen – lineares PEG 5000 und querverntztes, sternförmiges PEG – waren resistent gegen unspezifische Adsorption bei den zu untersuchenden Proteinen, obwohl es bei der kürzeren, linearen Form PEG 2000 Mikrometerbereiche mit hoher und niedriger Resistenz gab. Wir erklären dies durch unterschiedliche Architekturen von linearer PEG auf der Oberfläche; entweder eine hochresistente pilzförmige Architektur oder eine niedrigresistente, dichtere, bürstenförmige Architektur. Außerdem hatte spezifische Immobilisierung von RNase H auf PEG 5000 irreversible Proteinentfaltung zur Folge, wobei eqFP611 auf dieser Oberfläche nicht gestört wurde.

112
Die RNase H-Entfaltung kann durch Zusammenspiel von zwei Faktoren erklärt werden: (i) Verflechtung von PEG und Polypeptidketten nach strukturellen Proteinfluktuationen und (ii) Eindringen des in der Nähe der Oberfläche fixierten Proteins zwischen flexiblen PEG-Ketten und damit verbundene Bindung und Enfaltung auf der darunterliegenden geladenen Oberfläche. Die Quervernetzung von PEG-Ketten löst die beiden Probleme. Die Denaturierung / Renaturierung von RNase H auf der quervernetzten, sternförmigen PEG-Oberfläche war vollständig reversibel. Es gab keine messbaren Unterschiede in der freien Enthalpie und den Faltungs-/Entfaltungsraten von gefalteten und entfalteten Konformationszuständen von RNase H auf dieser Oberfläche im Vergleich zu frei in der Lösung diffundierender RNase H. Darüber hinaus war die enzymatische Aktivität von RNase H auf dieser Oberfläche identisch zu der Aktivität in Lösung und konnte nach Denaturierung mit 6 M GdmCl und anschließender Renaturierung in Puffer völlig wiederhergestellt werden. Die Fluoreszenzeigenschaften von eqFP611 waren durch die Immobilisierung auf dieser Oberfläche auch nicht beeinträchtigt. Deswegen ist die quervernetzte, sternförmige PEG-Oberfläche die optimale Plattform für Einzelmolekülexperimente mit immobilisierten Proteinen. Demzufolge wurden alle folgenden Ergebnisse mit dieser Oberfläche erzielt. Sorgfältige Analyse von Einzelmoleküldaten ergab, dass im Gegensatz zum gefalteten Zustand der mittlere Trägheitsradius der entfalteten RNase H-Moleküle mit steigender GdmCl-Konzentration zunimmt. Die ausgeprägteste Expansion war im Bereich des Faltung-Entfaltung-Überganges zu beobachten, wohingegen in stärker denaturierender Umgebung die Radiusveränderungen viel geringer waren. Anscheinend bindet bei zunehmender GdmCl-Konzentration das entfaltete Polypeptid mehr Gdm+ Ionen bis zum Sättigungspunkt. Wir modellierten unsere Daten als eine Verschiebung des Gleichgewichts innerhalb des Kontinuums entfalteter Zustände und bekamen verschiedene thermodynamische Parameter wie deren freien Enthalpien und Kooperativitätsparameter. Die an einzelnen RNase H-Molekülen gemessene zeitaufgelöste Fluoreszenzemission zeigte, dass entfaltete RNase H-Moleküle zwischen mehreren Konformationen auf der Sekunden-Zeitskala fluktuieren. Daher sind diese Konformationen durch große Barrieren der freien Enthalpie getrennt. Die Übergänge waren bei allen denkbaren FRET-Effizienzen möglich, was eine hohe Vielfalt der Faltungsvorgänge zeigt. Dennoch kamen kleine Veränderungen öfter vor als große. Die Existenz von langlebigen, entfalteten Strukturen hatte eine ausgeprägt breite FRET-Effizienzverteilung beim entfalteten Zustand zur Folge. Wir entwickelten ein Modell, das die Verteilung von Übergangsamplituden mit der beobachteten Breite des entfalteten Zustandes in Verbindung bringt. Mithilfe dieses Modells bewiesen wir quantitativ, dass die Breite des entfalteten Zustandes durch mehrere Unterzustände hervorgerufen wird und nicht ein oberflächebedingtes Artefakt ist. Die Zunahme der GdmCl-Konzentration war durch die Einengung der Verteilung des entfalteten Zustandes begleitet, was auf ausgeprägtere Mittelung zwischen entfalteten Unterzuständen hinweist. Dennoch waren die Übergänge zwischen entfalteten Unterzuständen sogar bei der höchstmöglichen GdmCl-Konzentration – 6 M – zu beobachten. Die Existenz von stabilen Strukturen der RNase H unter solch denaturierenden Umständen ist die interessanteste Erkenntnis dieser Arbeit. Wir vermuten, dass dies durch einen hydrophoben Cluster und eine lokale Anordnung der Aminosäurereste durch sterische und Dipol-Dipol-Interaktionen verursacht wird. Aus den Kreuzkorrelationsfunktionen für die Donor- und Akzeptoremissionen, gemessen an Einzelmolekülen, fanden wir, dass die Rekonfigurierungszeit entfalteter RNase H-Ketten ca. 20 µs beträgt (in 1.7 M GdmCl). Mit Hilfe Kramers’scher Theorie, die die Rekonfigurierungszeit und die Barrieren der freien Enthalpie mit der Rate des

113
Barrierüberganges in Verbindung bringt, schätzten wir die mittlere Höhe der Barrieren zwischen den entfalteten Unterzuständen auf ca. 24 kJ/mol und die Barriere vom entfalteten zum gefalteten Ensemble auf ca. 33 kJ/mol (in 1.7 M GdmCl). Schließlich stellen wir ein zweidimensionales Schema der Energielandschaft vor. Die erste räumliche Koordinate, Q1, beschreibt die Übergänge zwischen den entfalteten Unterzuständen, die durch die Barrieren getrennt sind. Eine andere Reaktionskoordinate, Q2, beschreibt die Proteinfaltung. Der gefaltete Zustand ist vom entfalteten Ensemble durch eine hohe Energiebarriere getrennt, die man aus entfalteten Zuständen über flache Täler entlang der Q2-Koordinate erreichen kann.

114
Curriculum Vitae Elza Kuzmenkina (born Amirgoulova)
Personal data Born: January 12, 1976 in Narofominsk, Russia Nationality: Russian Social staus: Married Schooling 1983-1992 Schools in Svobodny, Maycop, Raychichinsk, and Petropavlovsk-
Kamchatsky, Russia 1992-1993 Boarding school at Novosibirsk State University, Russia
average grade: 4.9/5.0 Education and Research 1993-1997 B. Sc. in Physiscs, Novosibirsk State University, Russia average grade: 4.6/5.0, thesis: 5/5
Influence of irregularities in crystals of LiNbO3 on their infra-red and Raman scattering spectra (numerical computations)
1995-1997 student, Laboratory of Physical Electronics, Institute of Automation and Electrometry, Novosibirsk, Russia (Dr. A. A. Sokolov)
1997-1999 M. Sc. in Physics, Novosibirsk State University, Russia average grade 4.6/5.0, thesis 5/5
Theoretical and numerical investigations of non-stationary fluid flows between a porous rotating disk and a plane
1997-1999 researcher, Laboratory of Modeling, Institute of Thermophysics, Novosibirsk, Russia
(Prof. N. I. Yavorsky) 1999-2000 researcher, ESR Surface Group, Laboratiry of Quantum Chemistry,
Boreskov Institute of Catalysis, Novosibirsk, Russia Developing application of NO molecule as a spin probe to study active
sites of oxide catalysts (Electron Spin Resonance spectroscopy, modeling, and numerical computations)
(Prof. A. M. Volodin) 2000-present Ph.D. student, Department of Biophysics, University of Ulm, Germany
Single-molecule Fluorescence Resonance Energy Transfer studies of folding dynamics of proteins immobilized on biocompatible surfaces Interaction of C-reactive protein with FcγR receptors expressed in COS-7 cells studied by fluorescence microscopy (Prof. G.U. Nienhaus)
115
List of publications 1) E. V. Kuzmenkina, C. D. Heyes, G. U. Nienhaus, Single molecule FRET study of protein dynamics under denaturing conditions // Proc Natl Acad Sci USA, in press 2) C. Röcker#, D. E. Manolov#, E. V. Kuzmenkina#, H. Slatosch, J. Torzewski, G. U. Nienhaus, Affinity of C-reactive protein towards FcγRI is strongly enhanced by the γ-chain // submitted # these authors contributed equally to the work 3) A. Kuzmenkin, Ch. Hang, E. Kuzmenkina, K. Jurkat-Rott, Site-specific effects and cooperativity of the HypoPP-1 mutations in Ca2+ channel gating // submitted 4) E. V. Kuzmenkina, C. D. Heyes, G. U. Nienhaus, S ingle molecule FRETstudy of denaturant induced unfolding of RNase H // submitted 5) Ch. Hang, A. Kuzmenkin, E. Kuzmenkina, K. Jurkat-Rott, Site-specific effects of calcium channel agonist BayK 8644 on the mutants causing hypokalemic periodic paralysis type 1 // in preparation 6) E. V. Amirgoulova, J. Groll, C. D. Heyes, T. Ameringer, C. Röcker, M. Möller, G. U. Nienhaus, Biofunctionalized polymer surfaces exhibiting minimal interaction towards immobilized proteins molecule // ChemPhysChem, (2004), 5, 552-555 7) J. Groll, E. V. Amirgoulova, T. Ameringer, C. D. Heyes, C. Röcker, M. Möller, G. U. Nienhaus, Biofunctionalized, ultrathin coatings of cross-linked star-shaped poly(ethylene oxide) allow reversible folding of immobilized proteins // J Am Chem Soc, (2004), 126, 4234-4239 8) C. D. Heyes#, A. Yu. Kobitski#, E. V. Amirgoulova#, G. U. Nienhaus, Biocompatible surfaces for specific tethering of individual protein molecules // J Phys Chem B, (2004), 108, 13387-13394 # these authors contributed equally to the work

116
List of posters 1) A. Kuzmenkin, E. Kuzmenkina, F. Lehmann-Horn, K. Jurkat-Rott, Gating of the Nav1.4 mutations causing hypokalemic periodic paralysis type 2: charge movement and channel behaviour // Biophysical Society 49th Annual Meeting, Long Beach, California, USA, 2005 2) C. D. Heyes, V. V. Breus, A. Yu. Kobitski, E. V. Amirgulova, G. U. Nienhaus, Bioconjugation strategies and applications of quantum dots for single-molecule and cellular biophysics // Biophysical Society 49th Annual Meeting, Long Beach, California, USA, 2005 3) E. V. Amirgoulova, C. D. Heyes, J. Groll, A. Yu. Kobitski, M. Möller, Folding dynamics of RNase H immobilized on biocompatible surfaces // Optical Spectroscopy of Biomolecular Dynamics, Kloster Banz, Staffelstein, Germany, 2004 4) C. D. Heyes, A. Yu. Kobitski, E. V. Amirgoulova, V. V. Breus, K. V. Anikin, G. U. Nienhaus, Biophysical applications of quantum dots: Labeling of single biomolecules // Deutsche Physikallische Gesellschaft, Frühjahrstagung des Arbeitskreises Festkörperphysik, Regensburg, Germany, 2004 5) E. Amirgoulova, C. D. Heyes, J. Groll, A. Yu. Kobitski, T. Ameringer, M. Möller, G. U. Nienhaus, Single molecule folding of RNase H on biocompatible surfaces // Biophysical Society 48th Annual Meeting, Baltimore, Mariland, USA, 2004 6) E. Amirgoulova, A. Yu. Kobitski, C. D. Heyes, G. U. Nienhaus, Single molecule protein-folding dynamics on surfaces // The Joint Meeting of Belgian and German Biophysicists "Folding, Dynamics and Interaction of Biomolecules", Hünfeld, Germany, 2003 7) C. D. Heyes, A. Yu. Kobitski, E. Amirgoulova, G. U. Nienhaus, Evaluation of quantum dots as fluorescent labels for the study of biomolecular dynamics // The Joint Meeting of Belgian and German Biophysicists "Folding, Dynamics and Interaction of Biomolecules, Hünfeld, Germany, 2003 8) E. Amirgoulova, C. Röcker, G. U. Nienhaus, Single molecule fret studies of folding/unfolding transitions of RNase H // Biophysical Society 47th Annual Meeting, San Antonio, Texas, USA, 2003 9) C. D. Heyes, A. Yu. Kobitski, E. Amirgoulova, G. U. Nienhaus, Spectral and dynamical properties of single inorganic nanoparticles as ultrasensitive, photostable probes in life science research // Discussion Meeting on "Multi-Level Ordering - Molecular Organization for Nanosystems, Kloster Banz, Staffelstein, Germany, 2003 10) E. Amirgoulova, O. Dediu, C. Röcker, G. U. Nienhaus, Single-molecule studies of RNase H immobilized on functionalized mixed peg-monolayers // Jahrestagung der Deutschen Gesellshaft für Biophysik, Münster, Germany, 2001
117
11) E. V. Amirgoulova, A. G. Maryasov, A. M. Volodin, D. Biglino, A Lund, Analysis of EPR spectra and geometric structure of triplet (NO)2 dimers on the active sites of catalysts // XI-th International Conference "Magnetic Resonance in Chemistry and Biology, Zvenigorod, Russia, 2001 12) E. V. Amirgulova, A. G. Maryasov, A. M. Volodin, Modeling of EPR spectra of radical pairs NO adsorbed on the surface of sulfated zirconia // Modern Chemical Physics (XII Symposium), Tuapse, Russia, 2000 13) E. V. Amirgoulova, A. G. Maryasov, A. M. Volodin, Biradicals (triplet states) of NO molecules on the surface of sulphated ZrO2, and their structure // II All-Russian Scientific Seminar "Highly Organized Catalytic Systems, Moscow, Russia, 2000 14) E. V. Amirgulova, N. I. Yavorsky, Non-stationary flow regimes between a porous rotating disk and a plane // International Symposium "Actual Problems of Physical Hydroaerodynamics", Novosibirsk, Russia, 1999

118
Acknowledgements I would like to express my gratitude to all people who helped me, supported me and taught me during my work on the presented here Ph.D. thesis. My especial thanks are to Professor Nienhaus, who invited me to Ulm and provided me with the scientific guidance through all these years. His help, his broad and deep scientific knowledge, his motivation and challenging have made this work possible. I am indebted to Dr. Röcker for helping me to learn all the equipment and methods in our laboratory. I gratefully appreciate his excellent and precise advice given whenever I need it. I am indebted to Dr. Colin Heyes for his critical discussion of my results, for his scientific advice and for correcting my thesis. I thank Prof. Martin Möller and Dr. Jürgen Groll and for their collaboration on star polymer surfaces and SusTech GmbH for providing the material. I also thank Sigrid Niederhausen-Kraft and Uwe Theilen for technical assistance with surface preparation and protein expression. I am indebted to Dr. S. Kanaya for the generous gift of the plasmid pJAL135C. I thank Vladimir Ens for computers and equipment maintenance. I acknowledge the financial support of my work provided by SFB 569 and GRK 328. I would like to thank Vovochka Ens, Sasha Minkov, Mrs. Kohn and Mrs. Fisher for endlessly helping me in all difficult situations one meets in a new country. I would like to thank all former and current members of the Department of Biophysics for the atmosphere of friendship, collaboration and scientific excitement in the group. I thank my family and my friends for supporting me and believing in me throughout these years. Finally, I would like to thank my dearest parents who enabled my studies.
Copyright © 2022 FDOKUMEN