Protein Folding Pathways Revealed by Essential Dynamics Sampling
10
Subscriber access provided by UNIVERSITA DI ROMA LA SAPIENZA Journal of Chemical Theory and Computation is published by the American Chemical Society. 1155 Sixteenth Street N.W., Washington, DC 20036 Article Protein Folding Pathways Revealed by Essential Dynamics Sampling Daniele Narzi, Isabella Daidone, Andrea Amadei, and Alfredo Di Nola J. Chem. Theory Comput., 2008, 4 (11), 1940-1948• DOI: 10.1021/ct800157v • Publication Date (Web): 20 October 2008 Downloaded from http://pubs.acs.org on April 28, 2009 More About This Article Additional resources and features associated with this article are available within the HTML version: • Supporting Information • Access to high resolution figures • Links to articles and content related to this article • Copyright permission to reproduce figures and/or text from this article
Transcript of Protein Folding Pathways Revealed by Essential Dynamics Sampling

Subscriber access provided by UNIVERSITA DI ROMA LA SAPIENZA
Journal of Chemical Theory and Computation is published by the AmericanChemical Society. 1155 Sixteenth Street N.W., Washington, DC 20036
Article
Protein Folding Pathways Revealed by Essential Dynamics SamplingDaniele Narzi, Isabella Daidone, Andrea Amadei, and Alfredo Di Nola
J. Chem. Theory Comput., 2008, 4 (11), 1940-1948• DOI: 10.1021/ct800157v • Publication Date (Web): 20 October 2008
Downloaded from http://pubs.acs.org on April 28, 2009
More About This Article
Additional resources and features associated with this article are available within the HTML version:
• Supporting Information• Access to high resolution figures• Links to articles and content related to this article• Copyright permission to reproduce figures and/or text from this article
Protein Folding Pathways Revealed by EssentialDynamics Sampling
Daniele Narzi,†,§ Isabella Daidone,*,†,| Andrea Amadei,‡ and Alfredo Di Nola†
Department of Chemistry, UniVersity of Rome ‘La Sapienza’, P.le Aldo Moro 5,00185 Rome, Italy, and Dipartimento di Scienze e Tecnologie Chimiche, UniVersity of
Rome ‘Tor Vergata’, Via della Ricerca Scientifica 1, I-00133 Rome, Italy
Received May 8, 2008
Abstract: The characterization of the protein folding process represents one of the majorchallenges in molecular biology. Here, a method to simulate the folding process of a protein toits native state is reported, the essential dynamics sampling (EDS) method, and is successfullyapplied to detecting the correct folding pathways of two small proteins, the all-� SH3 domain ofSrc tyrosine kinase transforming protein (SH3) and the R/� B1 domain of streptococcal proteinG (GB1). The main idea of the method is that a subset of the natural modes of fluctuation in thenative state is key in directing the folding process. A biased molecular dynamics simulation isperformed, in which the restrained degrees of freedom are chosen among those obtained by aprincipal component, or essential dynamics, analysis of the positional fluctuations of the CRatoms in the native state. Successful folding is obtained if the restraints are applied only to theeigenvectors with lowest eigenvalues, representing the most rigid quasi-constraint motions. Ifthe essential eigenvectors, the ones accounting for most of the variance, are used, folding isnot successful. These results clearly show that the eigenvectors with lowest eigenvalues containthe main mechanical information necessary to drive the folding process, while the essentialeigenvectors represent the large concerted motions which can occur without folding/unfoldingthe protein.
1. Introduction
Understanding protein folding mechanisms represents oneof the major aims of biophysics and molecular biology.Information on the sequence of conformational steps thatlead to the native structure from denaturated polypeptidechains is fundamental to shed light on protein foldingmechanisms, on the effects of different physicochemicalconditions and mutations. Many experimental and theoretical
approaches for the study of protein folding have beendeveloped.1-8 Computational methods represent a valid toolin order to obtain atomic details of such a process, andmolecular dynamics (MD) simulations are among the mostused ones.9-12 A limitation encountered using MD simula-tions is due to the time scale accessible to this methodologythat is not comparable with the time scale of most foldingprocesses (ms-s). At present, with standard MD simulationsthis process can be well simulated only for short pep-tides9,11,13,14 but is still beyond reach for globular proteins.To overcome this problem different MD techniques havebeen developed.
The simplest approach is to perform high-temperature MDsimulations starting from the native structure to study theunfolding process.15-22 In some instances, by consideringthe unfolding as the reverse of folding, information on thefolding process is inferred from the high-temperature unfold-ing simulations.20-22 A more sophisticated approach makes
* Corresponding author e-mail: [email protected].
† University of Rome ‘La Sapienza’.§ Current address: Theoretical & Computational Membrane
Biology, Center for Bioinformatics Saar, Universitat des Saarlandes,D-66041 Saarbrucken, Germany.|Current address: Interdisciplinary Center for Scientific Comput-
ing, University of Heidelberg, Im Neuenheimer Feld 368, 69120Heidelberg, Germany.
‡ University of Rome ‘Tor Vergata’.
J. Chem. Theory Comput. 2008, 4, 1940–19481940
10.1021/ct800157v CCC: $40.75 2008 American Chemical SocietyPublished on Web 10/21/2008
use of unfolding simulations followed by the calculation ofthe free energy of the folding process at T ) 300 K, by meansof the umbrella sampling method, along the previouslydetermined path. Unfolding is performed by high temper-ature23,24 or by applying a harmonic potential to differentreaction coordinates, such as the radius of gyration25 andthe end-to-end distance.26,27 The previously reported ap-proaches are based on the hypothesis that the folding processat 300 K follows the same path of the unfolding processperformed with high temperature or with a harmonicpotential, but the issue of whether unfolding simulations arerepresentative for the folding process is still open.28,29
Different from the previous methods, in ‘targeted molec-ular dynamics’ (TMD) simulation,30 a folding simulation isperformed along a path not previously determined. This isaccomplished by applying a harmonic, time-dependent,restraint on each atom to continuously decrease the all-atomroot-mean-square deviation from the native state. Othermethods make use of simplified molecular models in orderto gain computation time by neglecting details. This categoryincludes the widely used so-called lattice models.31,32 Ad-ditionally, accurate prediction of native three-dimensionalprotein structures could be reached using semiempiricaldatabase-driven prediction methods.33-35
Here, the essential dynamics sampling (EDS) method36,37
is used to simulate protein folding. Starting from an unfoldedstructure, a usual MD simulation step is performed. Thenew structure is accepted only if its distance from the nativestructure does not increase, otherwise, it is projected ontothe closest configuration having the same distance to thenative conformation as the structure before the MD step. Thedistance is calculated in a configurational subspace definedby a set of generalized coordinates obtained by a principalcomponent, or essential dynamics, analysis38-40 of a native-state equilibrium simulation. Hence, correct folding can beobtained by using only a small fraction of the degrees offreedom of the protein to bias the MD simulation toward itsnative conformation.
Due to the absence of any restraining potential, as usedfor example in TMD, the EDS method does not force thesystem to overcome barriers higher than a few kT. Thus,the protein is not allowed to undergo major unfolding ifincorrect packing leads to kinetic traps or, in other words,to off-pathway intermediates. In this sense the method issomewhat similar to the CONTRA MD41 but differs mainlyin the choice of the reaction coordinates which, in the presentcase, are chosen so to contain information on the dynamicalproperties of the native state and might, hence, representbetter candidates than reaction coordinates often used suchas the radius of gyration or the root-mean-square deviationfrom the native structure.
The EDS method was successfully applied to the foldingprocess of cytochrome c,42 an all-R protein. In the presentwork, the method is further extended, and its ability inreproducing the native conformation and the known foldingsteps in proteins with different topologies, namely the all-�and R/� motives, is verified. The model systems used arethe SH3 domain of Src tyrosine kinase transforming protein(SH3) and the B1 domain of streptococcal protein G (GB1).
The src-SH3, a 56-residue all-� protein, was largely inves-tigated by MD simulations,43-46 and, in agreement withexperimental data,47,48 the folding transition state is foundto be characterized by the presence of the central three-stranded �-sheet, whereas the formation of the hydrophobicsheet, consisting of the two terminal strands, is observed inthe last stage of the folding process. The GB1, a 56 residuesR/� protein, has been shown to populate an intermediate statealong its folding process with native-like structural elementsinvolving one of the four strands, namely the �3 strand.49,50
The results of the EDS folding simulations performed hereshow that in SH3 the central three-stranded �-sheet precedesthe whole structure formation and in GB1 the native-contactsformation of the �3 strand is a prerequisite for a correctfolding. These results are in agreement with experiments,47-50
thus assessing the predictive capabilities of the method.
2. Methods
2.1. Molecular Dynamics Simulations. All MD simula-tions were performed using the GROMACS software pack-age and the Gromos87 force field51 with modification assuggested by van Buuren et al.52 In both cases the proteinswere solvated with water in a periodic cubic box ofdimensions 57.0 × 57.0 × 57.0 Å. The simple point charge53
water model was used. Neutralization of the total charge ofthe system was obtained by replacing 3 and 4 molecules ofwater with 3 and 4 Na ions for SH3 and GB1, respectively.The SHAKE algorithm54 was used to constrain all bondlengths. A time step of 2 fs was used for numericalintegration. The isokinetic temperature coupling55 was usedto keep the temperature constant. The long-range electrostaticinteractions were treated with the particle mesh Ewaldmethod56 using a 48 × 48 × 48 grid combined with a fourth-order B-spline interpolation to compute the potential andforces in between grid points, whereas the short-rangeelectrostatic interactions were treated with a nonbonded pair-list cutoff of 9.0 Å.
2.2. Native-State Simulations and Essential Dyna-mics (ED) Analysis. For both SH3 and GB1 a 5000 ps longMD simulation of the native state was performed at roomtemperature (T ) 300 K) in the NVT ensemble (at a liquiddensity of 55.32 mol/L). The starting structures were takenfrom the NMR structure (PDB entry 1srl)57 for SH3 and fromthe 2.07 Å resolution refined crystal structure (PDB entry1pga)58 for GB1. From the equilibrated portion of the native-state trajectory (beyond 200 ps) the covariance matrix of thepositional fluctuations of the CR carbon atoms was built upand diagonalized. The procedure yields new axes (eigen-vectors), representing the directions of the concerted motions.The corresponding eigenvalues give the mean square posi-tional fluctuation for each direction.38,39 168 eigenvectorswere obtained for each protein, corresponding to the numberof degrees of freedom of the CR carbon atoms. Sorting theeigenvectors by the size of the eigenvalues shows that theconfigurational space can be divided in a low dimensional(essential) subspace (the first 10-15 eigenvectors in thepresent proteins) in which most of the positional fluctuationsare confined (≈ 60-70% of the total variance) and a high
Essential Dynamics Sampling J. Chem. Theory Comput., Vol. 4, No. 11, 2008 1941
dimensional (near-constraint) subspace in which small-amplitude fluctuations occur.
2.3. Essential Dynamics Sampling (EDS). The essentialdynamics sampling technique36,37,59 can be used to decreasethe distance of a given structure from a reference structurein a space defined by a subset of eigenvectors as obtainedby the ED analysis of the native-state MD simulation (seethe Results section for the choice of the set of eigenvectorsused in the present work).
In the EDS simulation a usual MD simulation step isperformed starting from an unfolded conformation; at eachstep the distance from the reference conformation (the crystalor NMR structure in the present cases) is calculated in thechosen subspace. If this distance does not increase, the newconformation is accepted. Otherwise, the coordinates (in thechosen subspace) are radially corrected in order to keepthe position onto the hypersphere centered on the referenceconformation, with a radius given by the distance from thereference in the previous step. This correction step isperformed using a nonstationary holonomic constraint in thechosen subspace �
G(�(t+∆t);t+∆t)) |�(t+∆t)+∆�c - �0|2 - |�(t)-
�0|2 ) 0 (1)
where �(t) and �(t+∆t) are the unconstrained positions attime t and (t+∆t), respectively, ∆�c is the correction for theapplication of the constraint, and �0 is the reference position(the crystal or NMR structure). Eq 1 does not suffice to solvefor ∆�c in a unique way. To obtain a unique solution, weadd the requirement that |∆�c|2 is minimized. This is achievedusing one Lagrangian multiplier:
∆�ci - λ ∂G
∂∆�ci)∆�c
i - 2λ(�i(t+∆t)+∆�ci - �0
i )) 0 (2)
and therefore
∆�ci ) 2λ
1- 2λ(�i(t+∆t)- �0
i ) (3)
Using eq 3 and eq 1 λ can be expressed as a function of�(t), �(t+∆t), and �0. This value of λ, and the corresponding∆�c, is then used to correct �(t+∆t) to fulfill the constraintwith the least perturbation.
2.4. Unfolding/Folding Simulations. Starting from twodifferent structures extracted from the native-state MDsimulations at t ) 2000 ps and t ) 3000 ps, two hightemperature unfolding simulations of 3500-4000 ps wereperformed for each protein. The temperature was kept at avalue of 500 K, and the system was coupled to a pressurebath at a value of 1 bar. It has to be pointed out that theseconditions are not meant to represent a real unfolding process,and the corresponding trajectories are not used for analysispurpose. They are rather meant as a computational procedureto generate a large number of denatured structures to be usedas starting points in the folding simulations. For the GB1protein a further simulation of 5000 ps was performedcoupling the residues corresponding to the �3 strand(GLY41-ASP47) at a temperature of 300 K and the remain-ing residues at 500 K (see the Results section for thejustification of this simulation).
Six and twelve protein structures for the SH3 and the GB1,respectively, were extracted from these unfolding simulationsand used as starting structures in the EDS folding simulations.The selected structures are characterized by high values ofroot-mean-square deviation with respect to either the NMRor the crystal structure and high radius of gyration. Neverthe-less, they retain some degree of secondary structure (see theResults section). Experimental and computational methodshave demonstrated that even under strong denaturing condi-tions unfolded structures retain a residual native-like second-ary structure.60,61 Therefore, we believe that the unfoldedstructures used in the present work, which in fact containinformation from the native starting conformation, are goodcandidates as representative structures of the unfoldedensemble.
The starting unfolded structures were solvated in waterand equilibrated for 10 ps at a temperature of 300 K and apressure of 1 bar. The folding simulations were thenperformed in the NVT ensemble at room temperature (T )300 K). A slightly different procedure is used in the presentwork, with respect to the one previously reported:42 to allowa local increase of the distance from the reference, each 10ps of EDS simulation is followed by 10 ps of unbiased MDsimulation.
3. Results
3.1. EDS Procedure. Preliminary analyses were per-formed to assess the relevance of using different sets of thenative eigenvectors, accounting for the CR carbon atomsfluctuations, in the biasing procedure of the folding simula-tions (only results for the GB1 are reported here since similarresults are also obtained for SH3).
Starting from an unfolded conformation (structure RUN1in Figure 1) three initial folding simulations were performedusing all the CR eigenvectors, the high-variance essentialeigenvectors (the first 13), and the low-variance eigenvectors(the last 155) - RUN1all, RUN1′, and RUN1, respectively,in Table 1. At the end of both simulations that included theessential eigenvectors a compact structure is reached, butalmost no secondary and tertiary structure is recovered (seeRUN1all and RUN1′ in Table 1).
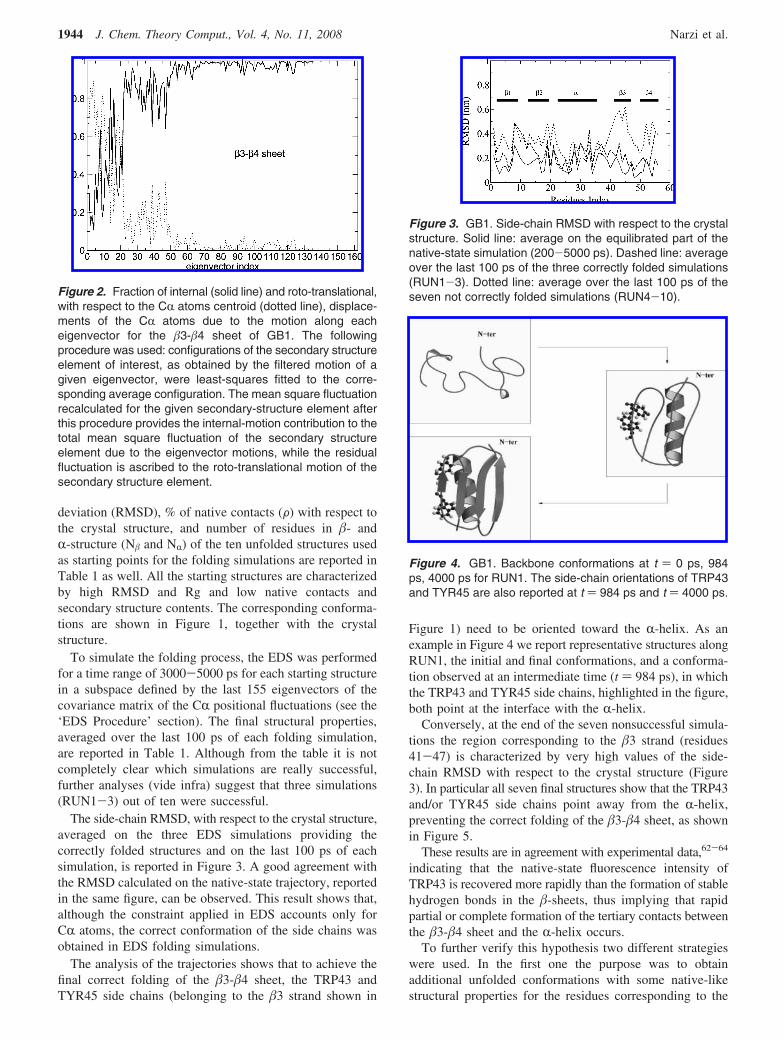
In order to characterize the two sets of the CR eigenvec-tors, i.e., providing and not providing correct folding, thenature of the associated motions was investigated. For thispurpose, the overall displacement of the CR atoms belongingto a given secondary-structure element was decomposed intointernal motions, i.e., occurring within the secondary struc-ture, and roto-translational motion, i.e., of the secondary-structure element with respect to its CR centroid. An examplefor the �3-�4 sheet of GB1 is reported in Figure 2. Theresults make evidence that the last, i.e., with the lowesteigenvalues, 150-155 eigenvectors (out of 168) mostlyrepresent internal collective vibrations, i.e., within the�-sheet, whereas the essential eigenvectors (the first 10-20)mainly provide roto-translational motions of the �-sheet.
These results show that the quasi-constraint, low-varianceeigenvectors, that were shown here to represent in the foldedprotein the smallest vibrations within each secondary struc-
1942 J. Chem. Theory Comput., Vol. 4, No. 11, 2008 Narzi et al.
ture element, contain the proper mechanical information forthe folding process, whereas the essential eigenvectorsrepresent the large collective motions which can occurwithout folding/unfolding the protein.
It should be noted that in the previous study on thecytochrome c,42 an all-R protein, a correct folding of theprotein was obtained performing EDS folding simulationson a smaller space with respect to the GB1 and SH3, i.e.,the last 30% of the eigenvectors versus the last 90% usedhere. When only the last 30% of the eigenvecors was usedfor GB1 and SH3, folding was not successful (data notshown). We assign this difference to the fact that � or R/�
folds, such as SH3 and GB1, are characterized by highercontact order with respect to R topologies, such as cyto-chrome c, and hence the main mechanical informationnecessary for folding is distributed over a larger number ofdegrees of freedom.
In what follows we will perform different independentfolding simulations using the last 155 eigenvectors for theGB1 and the last 160 for SH3.
3.2. GB1. The main structural properties of the native-state MD simulation at 300 K (NatGB1) are reported in Table1. The data show a good agreement with the crystal structure.The values of the radius of gyration (Rg), root-mean-square
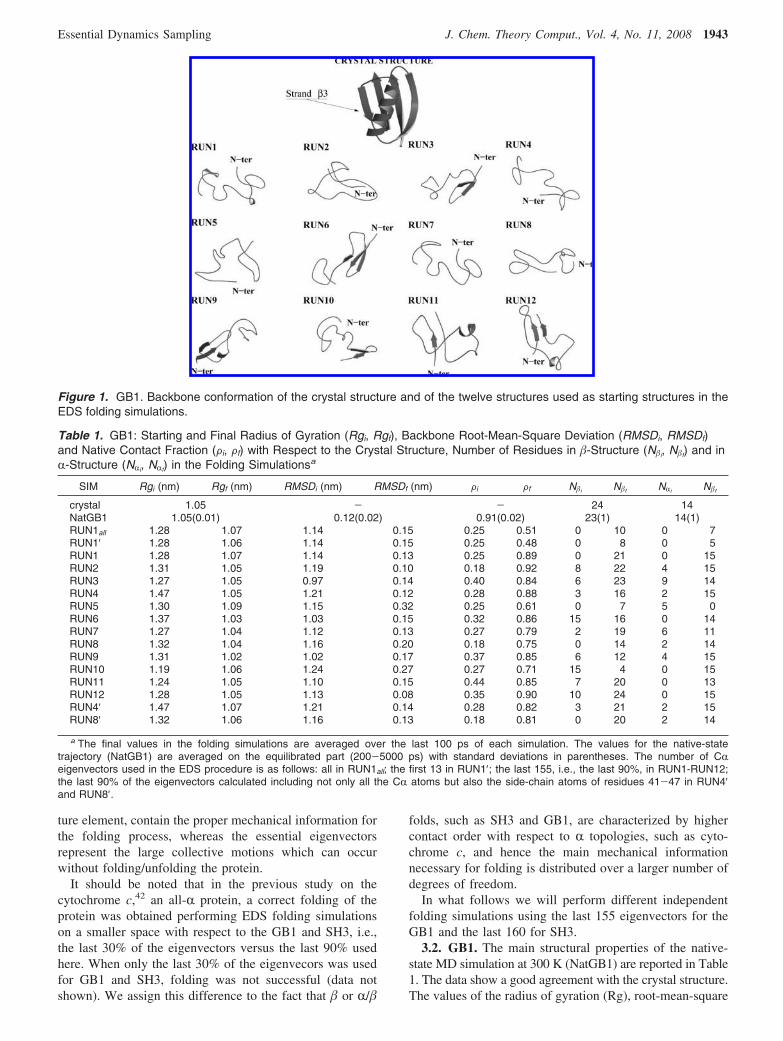
Figure 1. GB1. Backbone conformation of the crystal structure and of the twelve structures used as starting structures in theEDS folding simulations.
Table 1. GB1: Starting and Final Radius of Gyration (Rgi, Rgf), Backbone Root-Mean-Square Deviation (RMSDi, RMSDf)and Native Contact Fraction (Fi, Ff) with Respect to the Crystal Structure, Number of Residues in �-Structure (N�i, N�f) and inR-Structure (NRi, NRf) in the Folding Simulationsa
SIM Rgi (nm) Rgf (nm) RMSDi (nm) RMSDf (nm) Fi Ff N�i N�f NRi N�f
crystal 1.05 - - 24 14NatGB1 1.05(0.01) 0.12(0.02) 0.91(0.02) 23(1) 14(1)RUN1all 1.28 1.07 1.14 0.15 0.25 0.51 0 10 0 7RUN1′ 1.28 1.06 1.14 0.15 0.25 0.48 0 8 0 5RUN1 1.28 1.07 1.14 0.13 0.25 0.89 0 21 0 15RUN2 1.31 1.05 1.19 0.10 0.18 0.92 8 22 4 15RUN3 1.27 1.05 0.97 0.14 0.40 0.84 6 23 9 14RUN4 1.47 1.05 1.21 0.12 0.28 0.88 3 16 2 15RUN5 1.30 1.09 1.15 0.32 0.25 0.61 0 7 5 0RUN6 1.37 1.03 1.03 0.15 0.32 0.86 15 16 0 14RUN7 1.27 1.04 1.12 0.13 0.27 0.79 2 19 6 11RUN8 1.32 1.04 1.16 0.20 0.18 0.75 0 14 2 14RUN9 1.31 1.02 1.02 0.17 0.37 0.85 6 12 4 15RUN10 1.19 1.06 1.24 0.27 0.27 0.71 15 4 0 15RUN11 1.24 1.05 1.10 0.15 0.44 0.85 7 20 0 13RUN12 1.28 1.05 1.13 0.08 0.35 0.90 10 24 0 15RUN4′ 1.47 1.07 1.21 0.14 0.28 0.82 3 21 2 15RUN8′ 1.32 1.06 1.16 0.13 0.18 0.81 0 20 2 14
a The final values in the folding simulations are averaged over the last 100 ps of each simulation. The values for the native-statetrajectory (NatGB1) are averaged on the equilibrated part (200-5000 ps) with standard deviations in parentheses. The number of CReigenvectors used in the EDS procedure is as follows: all in RUN1all; the first 13 in RUN1′; the last 155, i.e., the last 90%, in RUN1-RUN12;the last 90% of the eigenvectors calculated including not only all the CR atoms but also the side-chain atoms of residues 41-47 in RUN4′and RUN8′.
Essential Dynamics Sampling J. Chem. Theory Comput., Vol. 4, No. 11, 2008 1943
deviation (RMSD), % of native contacts (F) with respect tothe crystal structure, and number of residues in �- andR-structure (N� and NR) of the ten unfolded structures usedas starting points for the folding simulations are reported inTable 1 as well. All the starting structures are characterizedby high RMSD and Rg and low native contacts andsecondary structure contents. The corresponding conforma-tions are shown in Figure 1, together with the crystalstructure.
To simulate the folding process, the EDS was performedfor a time range of 3000-5000 ps for each starting structurein a subspace defined by the last 155 eigenvectors of thecovariance matrix of the CR positional fluctuations (see the‘EDS Procedure’ section). The final structural properties,averaged over the last 100 ps of each folding simulation,are reported in Table 1. Although from the table it is notcompletely clear which simulations are really successful,further analyses (vide infra) suggest that three simulations(RUN1-3) out of ten were successful.
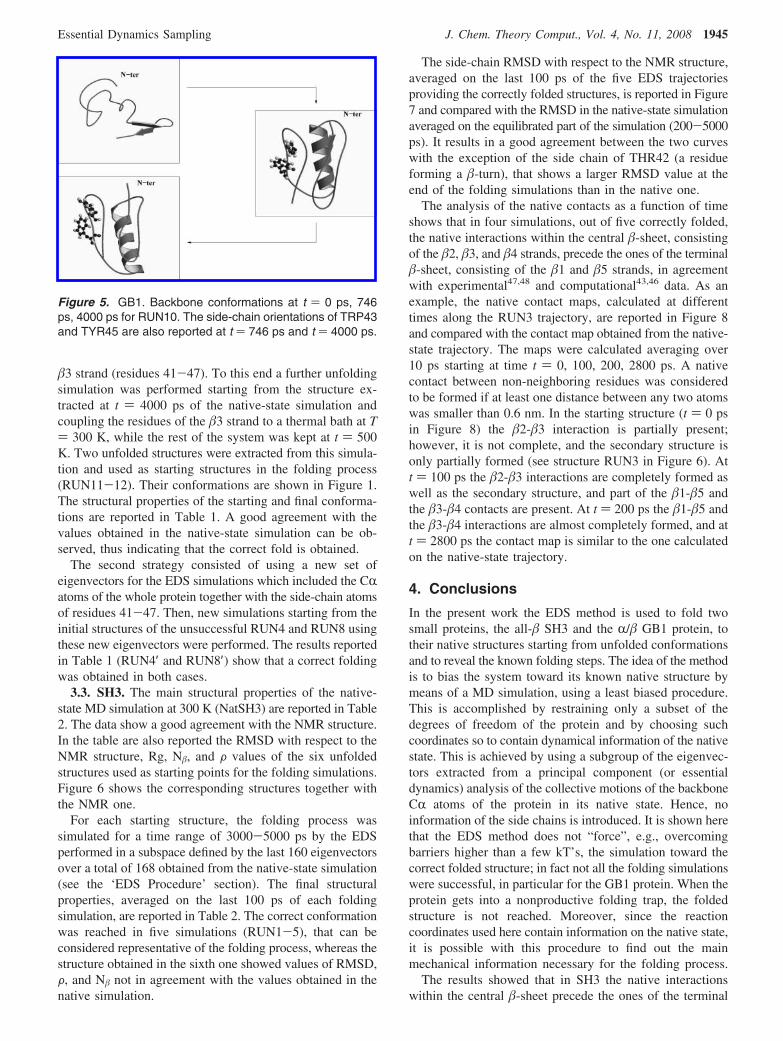
The side-chain RMSD, with respect to the crystal structure,averaged on the three EDS simulations providing thecorrectly folded structures and on the last 100 ps of eachsimulation, is reported in Figure 3. A good agreement withthe RMSD calculated on the native-state trajectory, reportedin the same figure, can be observed. This result shows that,although the constraint applied in EDS accounts only forCR atoms, the correct conformation of the side chains wasobtained in EDS folding simulations.
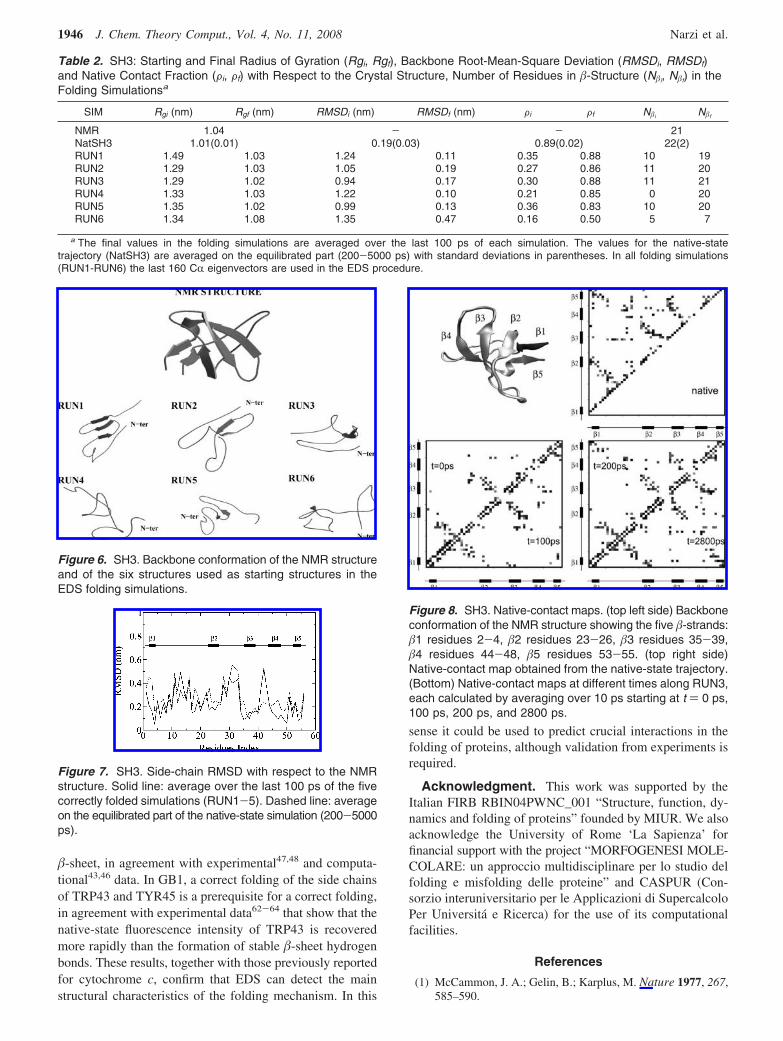
The analysis of the trajectories shows that to achieve thefinal correct folding of the �3-�4 sheet, the TRP43 andTYR45 side chains (belonging to the �3 strand shown in
Figure 1) need to be oriented toward the R-helix. As anexample in Figure 4 we report representative structures alongRUN1, the initial and final conformations, and a conforma-tion observed at an intermediate time (t ) 984 ps), in whichthe TRP43 and TYR45 side chains, highlighted in the figure,both point at the interface with the R-helix.
Conversely, at the end of the seven nonsuccessful simula-tions the region corresponding to the �3 strand (residues41-47) is characterized by very high values of the side-chain RMSD with respect to the crystal structure (Figure3). In particular all seven final structures show that the TRP43and/or TYR45 side chains point away from the R-helix,preventing the correct folding of the �3-�4 sheet, as shownin Figure 5.
These results are in agreement with experimental data,62-64
indicating that the native-state fluorescence intensity ofTRP43 is recovered more rapidly than the formation of stablehydrogen bonds in the �-sheets, thus implying that rapidpartial or complete formation of the tertiary contacts betweenthe �3-�4 sheet and the R-helix occurs.
To further verify this hypothesis two different strategieswere used. In the first one the purpose was to obtainadditional unfolded conformations with some native-likestructural properties for the residues corresponding to the
Figure 2. Fraction of internal (solid line) and roto-translational,with respect to the CR atoms centroid (dotted line), displace-ments of the CR atoms due to the motion along eacheigenvector for the �3-�4 sheet of GB1. The followingprocedure was used: configurations of the secondary structureelement of interest, as obtained by the filtered motion of agiven eigenvector, were least-squares fitted to the corre-sponding average configuration. The mean square fluctuationrecalculated for the given secondary-structure element afterthis procedure provides the internal-motion contribution to thetotal mean square fluctuation of the secondary structureelement due to the eigenvector motions, while the residualfluctuation is ascribed to the roto-translational motion of thesecondary structure element.
Figure 3. GB1. Side-chain RMSD with respect to the crystalstructure. Solid line: average on the equilibrated part of thenative-state simulation (200-5000 ps). Dashed line: averageover the last 100 ps of the three correctly folded simulations(RUN1-3). Dotted line: average over the last 100 ps of theseven not correctly folded simulations (RUN4-10).
Figure 4. GB1. Backbone conformations at t ) 0 ps, 984ps, 4000 ps for RUN1. The side-chain orientations of TRP43and TYR45 are also reported at t ) 984 ps and t ) 4000 ps.
1944 J. Chem. Theory Comput., Vol. 4, No. 11, 2008 Narzi et al.
�3 strand (residues 41-47). To this end a further unfoldingsimulation was performed starting from the structure ex-tracted at t ) 4000 ps of the native-state simulation andcoupling the residues of the �3 strand to a thermal bath at T) 300 K, while the rest of the system was kept at t ) 500K. Two unfolded structures were extracted from this simula-tion and used as starting structures in the folding process(RUN11-12). Their conformations are shown in Figure 1.The structural properties of the starting and final conforma-tions are reported in Table 1. A good agreement with thevalues obtained in the native-state simulation can be ob-served, thus indicating that the correct fold is obtained.
The second strategy consisted of using a new set ofeigenvectors for the EDS simulations which included the CRatoms of the whole protein together with the side-chain atomsof residues 41-47. Then, new simulations starting from theinitial structures of the unsuccessful RUN4 and RUN8 usingthese new eigenvectors were performed. The results reportedin Table 1 (RUN4′ and RUN8′) show that a correct foldingwas obtained in both cases.
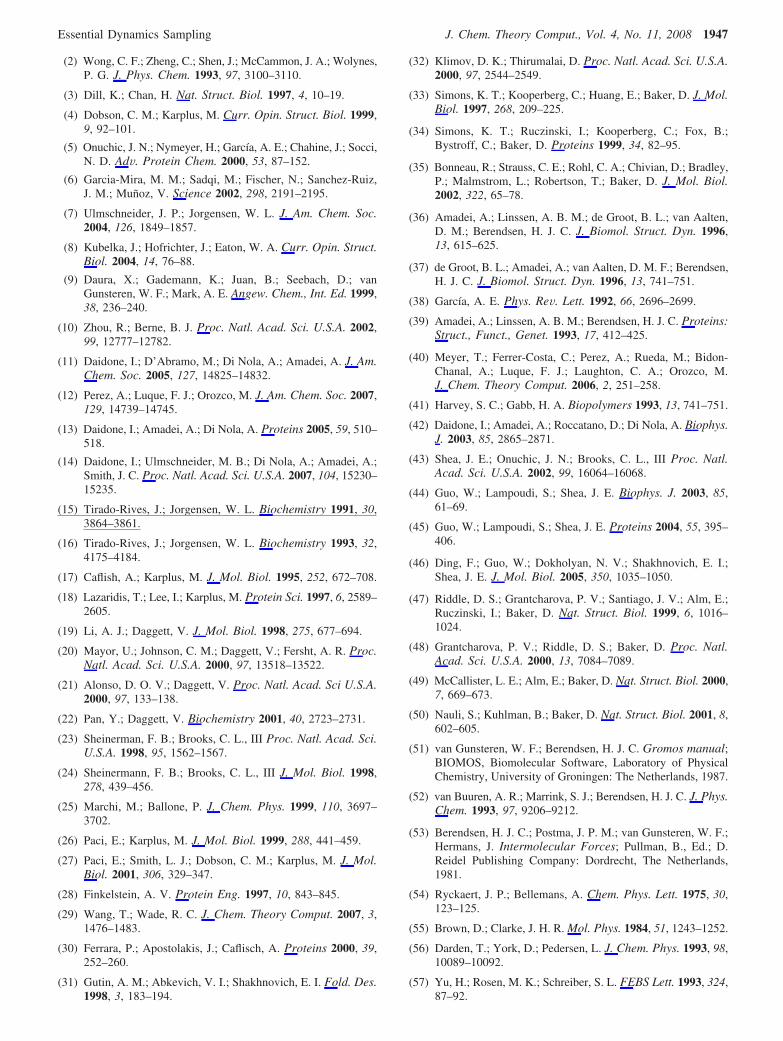
3.3. SH3. The main structural properties of the native-state MD simulation at 300 K (NatSH3) are reported in Table2. The data show a good agreement with the NMR structure.In the table are also reported the RMSD with respect to theNMR structure, Rg, N�, and F values of the six unfoldedstructures used as starting points for the folding simulations.Figure 6 shows the corresponding structures together withthe NMR one.
For each starting structure, the folding process wassimulated for a time range of 3000-5000 ps by the EDSperformed in a subspace defined by the last 160 eigenvectorsover a total of 168 obtained from the native-state simulation(see the ‘EDS Procedure’ section). The final structuralproperties, averaged on the last 100 ps of each foldingsimulation, are reported in Table 2. The correct conformationwas reached in five simulations (RUN1-5), that can beconsidered representative of the folding process, whereas thestructure obtained in the sixth one showed values of RMSD,F, and N� not in agreement with the values obtained in thenative simulation.
The side-chain RMSD with respect to the NMR structure,averaged on the last 100 ps of the five EDS trajectoriesproviding the correctly folded structures, is reported in Figure7 and compared with the RMSD in the native-state simulationaveraged on the equilibrated part of the simulation (200-5000ps). It results in a good agreement between the two curveswith the exception of the side chain of THR42 (a residueforming a �-turn), that shows a larger RMSD value at theend of the folding simulations than in the native one.
The analysis of the native contacts as a function of timeshows that in four simulations, out of five correctly folded,the native interactions within the central �-sheet, consistingof the �2, �3, and �4 strands, precede the ones of the terminal�-sheet, consisting of the �1 and �5 strands, in agreementwith experimental47,48 and computational43,46 data. As anexample, the native contact maps, calculated at differenttimes along the RUN3 trajectory, are reported in Figure 8and compared with the contact map obtained from the native-state trajectory. The maps were calculated averaging over10 ps starting at time t ) 0, 100, 200, 2800 ps. A nativecontact between non-neighboring residues was consideredto be formed if at least one distance between any two atomswas smaller than 0.6 nm. In the starting structure (t ) 0 psin Figure 8) the �2-�3 interaction is partially present;however, it is not complete, and the secondary structure isonly partially formed (see structure RUN3 in Figure 6). Att ) 100 ps the �2-�3 interactions are completely formed aswell as the secondary structure, and part of the �1-�5 andthe �3-�4 contacts are present. At t ) 200 ps the �1-�5 andthe �3-�4 interactions are almost completely formed, and att ) 2800 ps the contact map is similar to the one calculatedon the native-state trajectory.
4. Conclusions
In the present work the EDS method is used to fold twosmall proteins, the all-� SH3 and the R/� GB1 protein, totheir native structures starting from unfolded conformationsand to reveal the known folding steps. The idea of the methodis to bias the system toward its known native structure bymeans of a MD simulation, using a least biased procedure.This is accomplished by restraining only a subset of thedegrees of freedom of the protein and by choosing suchcoordinates so to contain dynamical information of the nativestate. This is achieved by using a subgroup of the eigenvec-tors extracted from a principal component (or essentialdynamics) analysis of the collective motions of the backboneCR atoms of the protein in its native state. Hence, noinformation of the side chains is introduced. It is shown herethat the EDS method does not “force”, e.g., overcomingbarriers higher than a few kT’s, the simulation toward thecorrect folded structure; in fact not all the folding simulationswere successful, in particular for the GB1 protein. When theprotein gets into a nonproductive folding trap, the foldedstructure is not reached. Moreover, since the reactioncoordinates used here contain information on the native state,it is possible with this procedure to find out the mainmechanical information necessary for the folding process.
The results showed that in SH3 the native interactionswithin the central �-sheet precede the ones of the terminal
Figure 5. GB1. Backbone conformations at t ) 0 ps, 746ps, 4000 ps for RUN10. The side-chain orientations of TRP43and TYR45 are also reported at t ) 746 ps and t ) 4000 ps.
Essential Dynamics Sampling J. Chem. Theory Comput., Vol. 4, No. 11, 2008 1945
�-sheet, in agreement with experimental47,48 and computa-tional43,46 data. In GB1, a correct folding of the side chainsof TRP43 and TYR45 is a prerequisite for a correct folding,in agreement with experimental data62-64 that show that thenative-state fluorescence intensity of TRP43 is recoveredmore rapidly than the formation of stable �-sheet hydrogenbonds. These results, together with those previously reportedfor cytochrome c, confirm that EDS can detect the mainstructural characteristics of the folding mechanism. In this
sense it could be used to predict crucial interactions in thefolding of proteins, although validation from experiments isrequired.
Acknowledgment. This work was supported by theItalian FIRB RBIN04PWNC_001 “Structure, function, dy-namics and folding of proteins” founded by MIUR. We alsoacknowledge the University of Rome ‘La Sapienza’ forfinancial support with the project “MORFOGENESI MOLE-COLARE: un approccio multidisciplinare per lo studio delfolding e misfolding delle proteine” and CASPUR (Con-sorzio interuniversitario per le Applicazioni di SupercalcoloPer Universita e Ricerca) for the use of its computationalfacilities.
References
(1) McCammon, J. A.; Gelin, B.; Karplus, M. Nature 1977, 267,585–590.
Table 2. SH3: Starting and Final Radius of Gyration (Rgi, Rgf), Backbone Root-Mean-Square Deviation (RMSDi, RMSDf)and Native Contact Fraction (Fi, Ff) with Respect to the Crystal Structure, Number of Residues in �-Structure (N�i, N�f) in theFolding Simulationsa
SIM Rgi (nm) Rgf (nm) RMSDi (nm) RMSDf (nm) Fi Ff N�i N�f
NMR 1.04 - - 21NatSH3 1.01(0.01) 0.19(0.03) 0.89(0.02) 22(2)RUN1 1.49 1.03 1.24 0.11 0.35 0.88 10 19RUN2 1.29 1.03 1.05 0.19 0.27 0.86 11 20RUN3 1.29 1.02 0.94 0.17 0.30 0.88 11 21RUN4 1.33 1.03 1.22 0.10 0.21 0.85 0 20RUN5 1.35 1.02 0.99 0.13 0.36 0.83 10 20RUN6 1.34 1.08 1.35 0.47 0.16 0.50 5 7
a The final values in the folding simulations are averaged over the last 100 ps of each simulation. The values for the native-statetrajectory (NatSH3) are averaged on the equilibrated part (200-5000 ps) with standard deviations in parentheses. In all folding simulations(RUN1-RUN6) the last 160 CR eigenvectors are used in the EDS procedure.
Figure 6. SH3. Backbone conformation of the NMR structureand of the six structures used as starting structures in theEDS folding simulations.
Figure 7. SH3. Side-chain RMSD with respect to the NMRstructure. Solid line: average over the last 100 ps of the fivecorrectly folded simulations (RUN1-5). Dashed line: averageon the equilibrated part of the native-state simulation (200-5000ps).
Figure 8. SH3. Native-contact maps. (top left side) Backboneconformation of the NMR structure showing the five �-strands:�1 residues 2-4, �2 residues 23-26, �3 residues 35-39,�4 residues 44-48, �5 residues 53-55. (top right side)Native-contact map obtained from the native-state trajectory.(Bottom) Native-contact maps at different times along RUN3,each calculated by averaging over 10 ps starting at t ) 0 ps,100 ps, 200 ps, and 2800 ps.
1946 J. Chem. Theory Comput., Vol. 4, No. 11, 2008 Narzi et al.
(2) Wong, C. F.; Zheng, C.; Shen, J.; McCammon, J. A.; Wolynes,P. G. J. Phys. Chem. 1993, 97, 3100–3110.
(3) Dill, K.; Chan, H. Nat. Struct. Biol. 1997, 4, 10–19.
(4) Dobson, C. M.; Karplus, M. Curr. Opin. Struct. Biol. 1999,9, 92–101.
(5) Onuchic, J. N.; Nymeyer, H.; Garcıa, A. E.; Chahine, J.; Socci,N. D. AdV. Protein Chem. 2000, 53, 87–152.
(6) Garcia-Mira, M. M.; Sadqi, M.; Fischer, N.; Sanchez-Ruiz,J. M.; Munoz, V. Science 2002, 298, 2191–2195.
(7) Ulmschneider, J. P.; Jorgensen, W. L. J. Am. Chem. Soc.2004, 126, 1849–1857.
(8) Kubelka, J.; Hofrichter, J.; Eaton, W. A. Curr. Opin. Struct.Biol. 2004, 14, 76–88.
(9) Daura, X.; Gademann, K.; Juan, B.; Seebach, D.; vanGunsteren, W. F.; Mark, A. E. Angew. Chem., Int. Ed. 1999,38, 236–240.
(10) Zhou, R.; Berne, B. J. Proc. Natl. Acad. Sci. U.S.A. 2002,99, 12777–12782.
(11) Daidone, I.; D’Abramo, M.; Di Nola, A.; Amadei, A. J. Am.Chem. Soc. 2005, 127, 14825–14832.
(12) Perez, A.; Luque, F. J.; Orozco, M. J. Am. Chem. Soc. 2007,129, 14739–14745.
(13) Daidone, I.; Amadei, A.; Di Nola, A. Proteins 2005, 59, 510–518.
(14) Daidone, I.; Ulmschneider, M. B.; Di Nola, A.; Amadei, A.;Smith, J. C. Proc. Natl. Acad. Sci. U.S.A. 2007, 104, 15230–15235.
(15) Tirado-Rives, J.; Jorgensen, W. L. Biochemistry 1991, 30,3864–3861.
(16) Tirado-Rives, J.; Jorgensen, W. L. Biochemistry 1993, 32,4175–4184.
(17) Caflish, A.; Karplus, M. J. Mol. Biol. 1995, 252, 672–708.
(18) Lazaridis, T.; Lee, I.; Karplus, M. Protein Sci. 1997, 6, 2589–2605.
(19) Li, A. J.; Daggett, V. J. Mol. Biol. 1998, 275, 677–694.
(20) Mayor, U.; Johnson, C. M.; Daggett, V.; Fersht, A. R. Proc.Natl. Acad. Sci. U.S.A. 2000, 97, 13518–13522.
(21) Alonso, D. O. V.; Daggett, V. Proc. Natl. Acad. Sci U.S.A.2000, 97, 133–138.
(22) Pan, Y.; Daggett, V. Biochemistry 2001, 40, 2723–2731.
(23) Sheinerman, F. B.; Brooks, C. L., III Proc. Natl. Acad. Sci.U.S.A. 1998, 95, 1562–1567.
(24) Sheinermann, F. B.; Brooks, C. L., III J. Mol. Biol. 1998,278, 439–456.
(25) Marchi, M.; Ballone, P. J. Chem. Phys. 1999, 110, 3697–3702.
(26) Paci, E.; Karplus, M. J. Mol. Biol. 1999, 288, 441–459.
(27) Paci, E.; Smith, L. J.; Dobson, C. M.; Karplus, M. J. Mol.Biol. 2001, 306, 329–347.
(28) Finkelstein, A. V. Protein Eng. 1997, 10, 843–845.
(29) Wang, T.; Wade, R. C. J. Chem. Theory Comput. 2007, 3,1476–1483.
(30) Ferrara, P.; Apostolakis, J.; Caflisch, A. Proteins 2000, 39,252–260.
(31) Gutin, A. M.; Abkevich, V. I.; Shakhnovich, E. I. Fold. Des.1998, 3, 183–194.
(32) Klimov, D. K.; Thirumalai, D. Proc. Natl. Acad. Sci. U.S.A.2000, 97, 2544–2549.
(33) Simons, K. T.; Kooperberg, C.; Huang, E.; Baker, D. J. Mol.Biol. 1997, 268, 209–225.
(34) Simons, K. T.; Ruczinski, I.; Kooperberg, C.; Fox, B.;Bystroff, C.; Baker, D. Proteins 1999, 34, 82–95.
(35) Bonneau, R.; Strauss, C. E.; Rohl, C. A.; Chivian, D.; Bradley,P.; Malmstrom, L.; Robertson, T.; Baker, D. J. Mol. Biol.2002, 322, 65–78.
(36) Amadei, A.; Linssen, A. B. M.; de Groot, B. L.; van Aalten,D. M.; Berendsen, H. J. C. J. Biomol. Struct. Dyn. 1996,13, 615–625.
(37) de Groot, B. L.; Amadei, A.; van Aalten, D. M. F.; Berendsen,H. J. C. J. Biomol. Struct. Dyn. 1996, 13, 741–751.
(38) Garcıa, A. E. Phys. ReV. Lett. 1992, 66, 2696–2699.
(39) Amadei, A.; Linssen, A. B. M.; Berendsen, H. J. C. Proteins:Struct., Funct., Genet. 1993, 17, 412–425.
(40) Meyer, T.; Ferrer-Costa, C.; Perez, A.; Rueda, M.; Bidon-Chanal, A.; Luque, F. J.; Laughton, C. A.; Orozco, M.J. Chem. Theory Comput. 2006, 2, 251–258.
(41) Harvey, S. C.; Gabb, H. A. Biopolymers 1993, 13, 741–751.
(42) Daidone, I.; Amadei, A.; Roccatano, D.; Di Nola, A. Biophys.J. 2003, 85, 2865–2871.
(43) Shea, J. E.; Onuchic, J. N.; Brooks, C. L., III Proc. Natl.Acad. Sci. U.S.A. 2002, 99, 16064–16068.
(44) Guo, W.; Lampoudi, S.; Shea, J. E. Biophys. J. 2003, 85,61–69.
(45) Guo, W.; Lampoudi, S.; Shea, J. E. Proteins 2004, 55, 395–406.
(46) Ding, F.; Guo, W.; Dokholyan, N. V.; Shakhnovich, E. I.;Shea, J. E. J. Mol. Biol. 2005, 350, 1035–1050.
(47) Riddle, D. S.; Grantcharova, P. V.; Santiago, J. V.; Alm, E.;Ruczinski, I.; Baker, D. Nat. Struct. Biol. 1999, 6, 1016–1024.
(48) Grantcharova, P. V.; Riddle, D. S.; Baker, D. Proc. Natl.Acad. Sci. U.S.A. 2000, 13, 7084–7089.
(49) McCallister, L. E.; Alm, E.; Baker, D. Nat. Struct. Biol. 2000,7, 669–673.
(50) Nauli, S.; Kuhlman, B.; Baker, D. Nat. Struct. Biol. 2001, 8,602–605.
(51) van Gunsteren, W. F.; Berendsen, H. J. C. Gromos manual;BIOMOS, Biomolecular Software, Laboratory of PhysicalChemistry, University of Groningen: The Netherlands, 1987.
(52) van Buuren, A. R.; Marrink, S. J.; Berendsen, H. J. C. J. Phys.Chem. 1993, 97, 9206–9212.
(53) Berendsen, H. J. C.; Postma, J. P. M.; van Gunsteren, W. F.;Hermans, J. Intermolecular Forces; Pullman, B., Ed.; D.Reidel Publishing Company: Dordrecht, The Netherlands,1981.
(54) Ryckaert, J. P.; Bellemans, A. Chem. Phys. Lett. 1975, 30,123–125.
(55) Brown, D.; Clarke, J. H. R. Mol. Phys. 1984, 51, 1243–1252.
(56) Darden, T.; York, D.; Pedersen, L. J. Chem. Phys. 1993, 98,10089–10092.
(57) Yu, H.; Rosen, M. K.; Schreiber, S. L. FEBS Lett. 1993, 324,87–92.
Essential Dynamics Sampling J. Chem. Theory Comput., Vol. 4, No. 11, 2008 1947

(58) Gallagher, T.; Alexander, P.; Bryan, P.; Gilliland, G. L.Biochemistry 1994, 33, 4721–4720.
(59) Roccatano, D.; Daidone, I.; Ceruso, M.-A.; Bossa, C.; Di Nola,A. Biophys. J. 2003, 84, 1876–1883.
(60) Shortle, D.; Ackerman, M. S. Science 2001, 293, 487–489.
(61) Zagrovic, B.; Snow, C. D.; Khaliq, S.; Shirts, M. R.; Pande,V. S. J. Mol. Biol. 2002, 323, 153–164.
(62) Park, S.; O’Neil, K. T.; Roder, H. Biochemistry 1997, 36,14277–14283.
(63) Park, S.; Ramachandra Shastry, M. C.; Roder, H. Nat. Struct.Biol. 1999, 6, 943–947.
(64) Kuszewski, J.; Clore, G. M.; Gronenborn, A. M. Protein Sci.1994, 3, 1945–1952.
CT800157V
1948 J. Chem. Theory Comput., Vol. 4, No. 11, 2008 Narzi et al.