Independent Doubly Adaptive Rejection Metropolis Sampling Within Gibbs Sampling
Sampling Methods
ByMarchang Reimeingam
Lecture during Certificate Course on Methods and Applications in Social Science Research
(A Multi-Disciplinary Training Programme)Institute for Social and Economic Change (ISEC), Bangalore, India
15th May 2014
Sample Design
• Source of information
Determining Sample Design
• Researchers usually draw conclusions about large groups by taking a sample
• Sample (n) is a segment of the population selected to represent the population (N) as a whole.
• Ideally, the sample should be representative and allow the researcher to make accurate estimates of the thoughts and behaviour of the larger population.

Decision requirements in Sample Designing
• Sample: Who will be surveyed?
The researcher must determine what type of information is needed and who is most likely to have it.
• Sample Size: How many people will be surveyed?
Large samples give more reliable results than small samples. However it is not necessary to sample the entire target population.
• Sampling: How should the sample be chosen?

Sampling Frame
The frame is a set of elements from which a researcher can select a sample of the target population.
It is a source material from which a sample is drawn from the population.
Requirement: Listing and mapping of e.g. individuals, households, areas.
Issues: • Difficult to get data• Incomplete data (omit some)• Data contain some mistakes• Data not up to dateSampling frame and Population: Ideally the sampling frame should be
the same with the population. However, its not the case in all.

Sampling
• Right choice for the elements of the sample so as to make it representative of population.
• The process by which inference is made to the whole by examining a part.
• Sample should be unbiased i.e. sample representative of population.
Reason for sampling
• Population/universe too big for study with limited factors: time, resources/money, effort, manpower, access to suitable sites to measure every single item within the population/whole sampling frame
• To provide various statistical information (qualitative/quantitative) about the whole population by studying a selected sample (few units)
Types of sampling
• Probability sampling: Sample members may be chosen at random from the entire population.
• Non-probability sampling: The researcher might select people who are easier to obtain information from.
Probability sampling
In probability sampling each sample has the same probability of being chosen
• Simple random
• Stratified
• Cluster/area.
• Systematic
• Two or multi stage
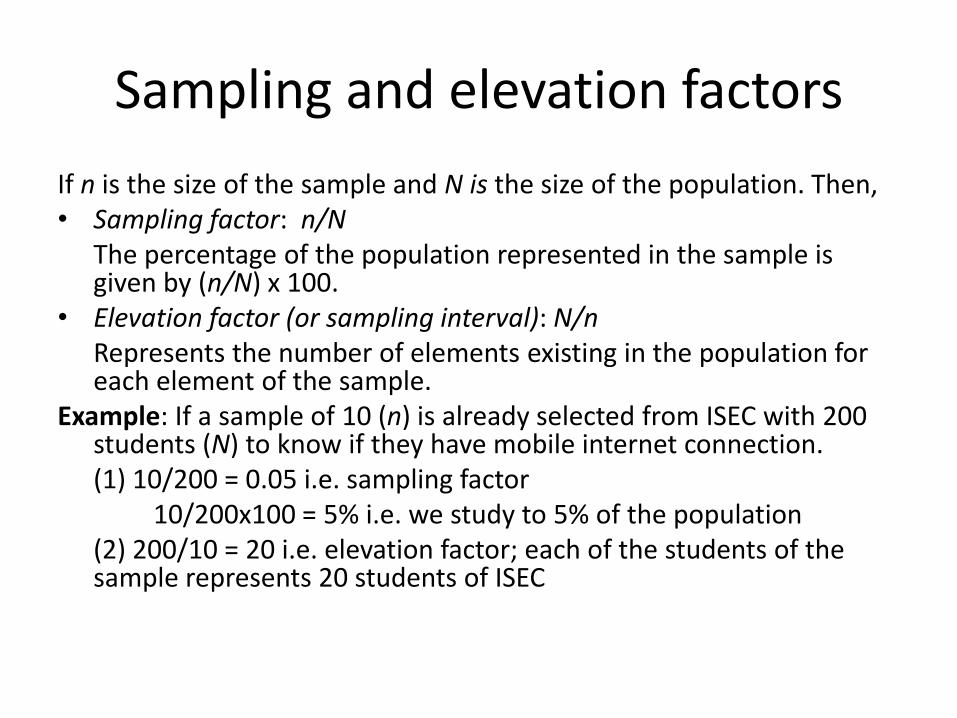
Sampling and elevation factors
If n is the size of the sample and N is the size of the population. Then, • Sampling factor: n/N
The percentage of the population represented in the sample is given by (n/N) x 100.
• Elevation factor (or sampling interval): N/nRepresents the number of elements existing in the population for each element of the sample.
Example: If a sample of 10 (n) is already selected from ISEC with 200 students (N) to know if they have mobile internet connection.(1) 10/200 = 0.05 i.e. sampling factor
10/200x100 = 5% i.e. we study to 5% of the population(2) 200/10 = 20 i.e. elevation factor; each of the students of the sample represents 20 students of ISEC
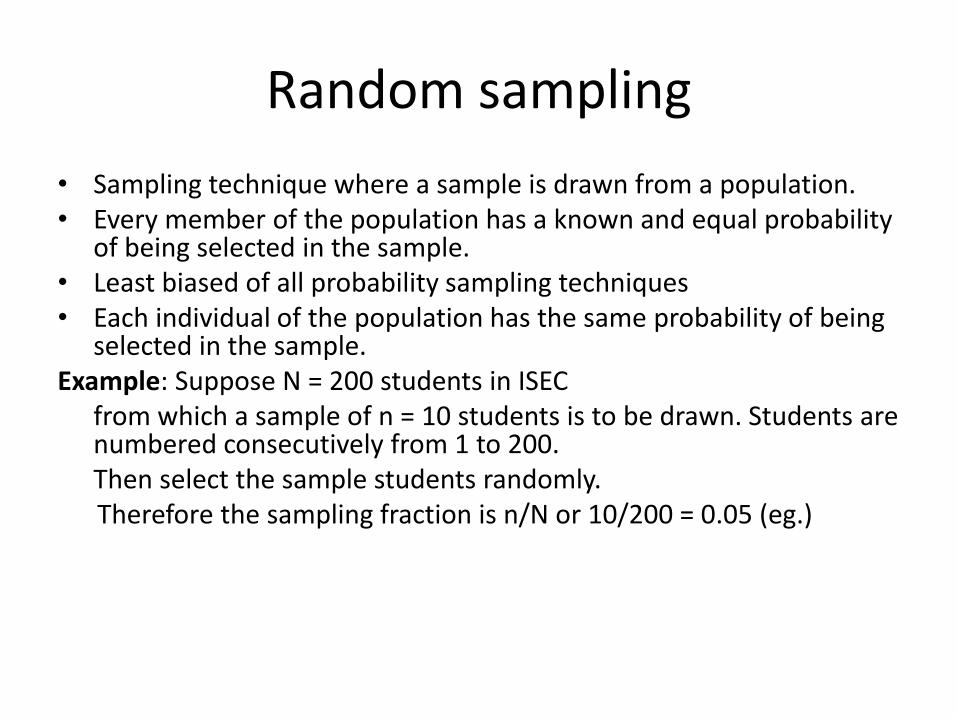
Random sampling
• Sampling technique where a sample is drawn from a population. • Every member of the population has a known and equal probability
of being selected in the sample.• Least biased of all probability sampling techniques• Each individual of the population has the same probability of being
selected in the sample.Example: Suppose N = 200 students in ISEC
from which a sample of n = 10 students is to be drawn. Students are numbered consecutively from 1 to 200. Then select the sample students randomly.Therefore the sampling fraction is n/N or 10/200 = 0.05 (eg.)

Random sampling with replacement• Sampling with replacement: When a certain element is selected and we have
measured the variables needed in a certain study and it can be selected again.i.e. simple random sampling
Consider a box of three pencil (N=3) with red, blue and green colours.We choose a pencil, note its colour, put it back and shake the box, then choose a
pencil again (which may be the same pencil as before or a different one) and so on.
Then if we sample two with replacement, then first pick red (say). We had a (1/N) or 1/3 probability of choosing red pencil. Then we replace it. Then we pick another. Every one of them still has 1/3 probability of being chosen. There are 9 different possibilities:
(RR), (RB), (RG), (BR), (BB), (BG), (GR), (GB), (GG).
The event (e) at least one red pencil is [RR, RB, RG, BR, GR].It has the probability 5/9

Random sampling without replacement
• Sampling without replacement: the element cannot be selected again after being selected once.
Consider a box of three pencil (N=3) with red, blue and green colours.We choose red pencil but do not put it back so that our final selection
cannot include two pencils of the same colour. Then if we sample two without replacement, then first pick red pencil but
do not put it back. We had a (1/N) or 1/3 probability of choosing red pencil. Then we pick another say blue.At this time there are only two possibilities (blue and green). There are 6 different possibilities:
, (RB), (RG), (BR), , (BG), (GR), (GB),
The event at least one red pencil is [RB, RG, BR, GR].It has the probability 4/6
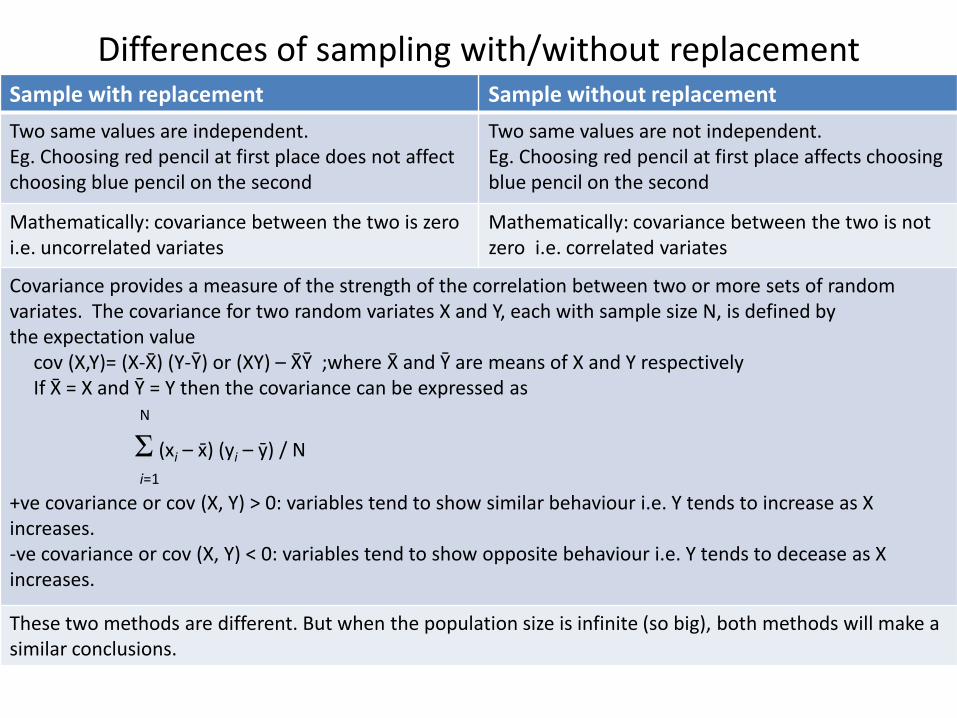
Differences of sampling with/without replacementSample with replacement Sample without replacement
Two same values are independent.Eg. Choosing red pencil at first place does not affect choosing blue pencil on the second
Two same values are not independent.Eg. Choosing red pencil at first place affects choosing blue pencil on the second
Mathematically: covariance between the two is zeroi.e. uncorrelated variates
Mathematically: covariance between the two is not zero i.e. correlated variates
Covariance provides a measure of the strength of the correlation between two or more sets of random variates. The covariance for two random variates X and Y, each with sample size N, is defined by the expectation value
cov (X,Y)= (X-X̄) (Y-Ῡ) or (XY) – X̄Ῡ ;where X̄ and Ῡ are means of X and Y respectivelyIf X̄ = X and Ῡ = Y then the covariance can be expressed as
N
Ʃ (xi – x)̄ (yi – ȳ) / N
i=1
+ve covariance or cov (X, Y) > 0: variables tend to show similar behaviour i.e. Y tends to increase as X increases.-ve covariance or cov (X, Y) < 0: variables tend to show opposite behaviour i.e. Y tends to decease as X increases.
These two methods are different. But when the population size is infinite (so big), both methods will make a similar conclusions.
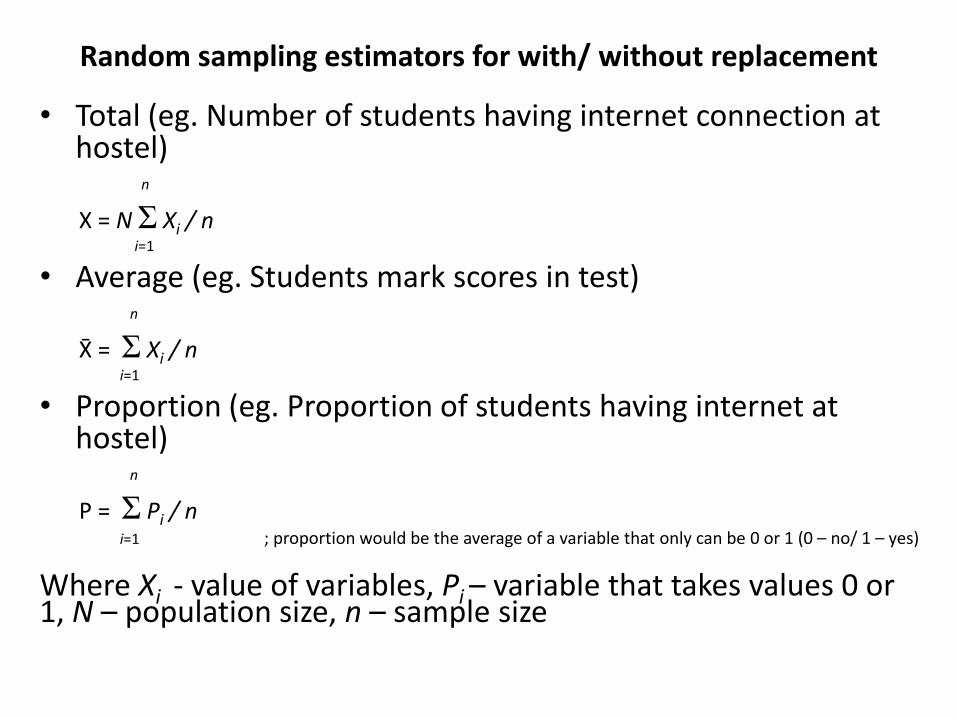
Random sampling estimators for with/ without replacement
• Total (eg. Number of students having internet connection at hostel)
n
X = N Ʃ Xi / ni=1
• Average (eg. Students mark scores in test)n
X̄ = Ʃ Xi / ni=1
• Proportion (eg. Proportion of students having internet at hostel)
n
P = Ʃ Pi / ni=1 ; proportion would be the average of a variable that only can be 0 or 1 (0 – no/ 1 – yes)
Where Xi - value of variables, Pi – variable that takes values 0 or 1, N – population size, n – sample size

Random sampling error estimators
Example for Total (Number of students having internet connection at hostel)
• Sampling with replacementẊ = N2 (S2 / n)
• Sampling without replacementẊ = N2 (1 – n/N)(S2 / n)
Where N – population size, n – sample size, S –standard deviation
Stratified sampling
• Population is divided into mutually exclusive (homogeneous) groups/categories such as age groups and random samples are drawn from each group or stratum.
• Each individual of the population will appear only in one stratum.
• Improves the efficiency of sampling i.e. better representation to the population (advantage).
• Small sample size are quite representative in homogeneous strata.
• However, a large sample size is required in a heterogeneous strata.
• Error estimation is difficult.

Stratified Sampling Computations
• Compute mean and standard errors separately for each strata
• Weigh them;
where weight is the relative size of the stratum population
• If wi is weight of a particular stratum, then the weighted estimate is given by
Ʃ wixi ; where i = 1 to n
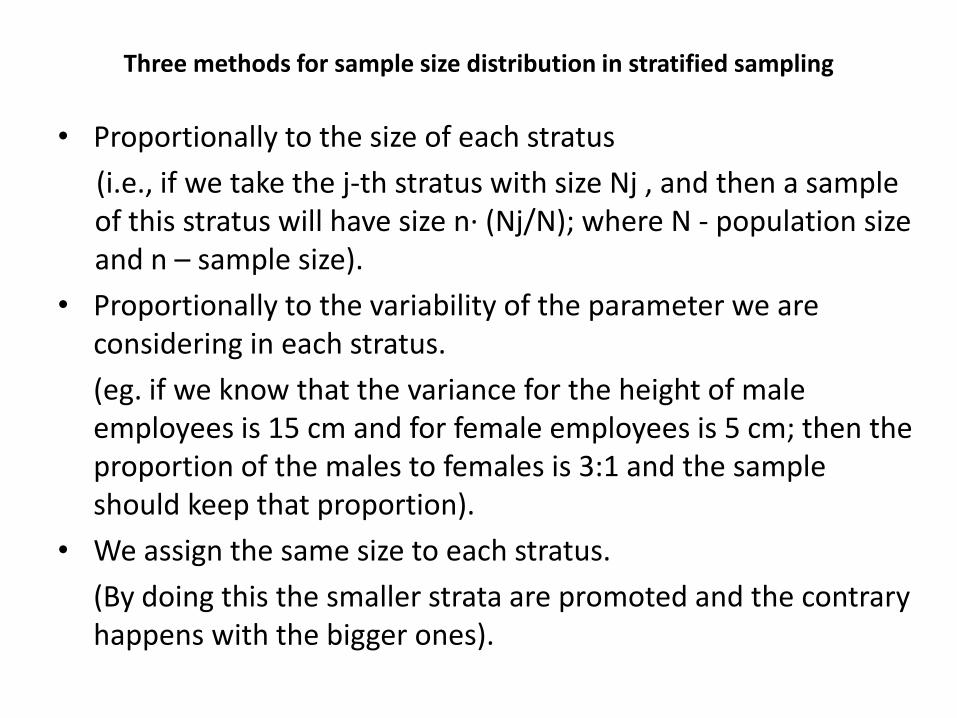
Three methods for sample size distribution in stratified sampling
• Proportionally to the size of each stratus
(i.e., if we take the j-th stratus with size Nj , and then a sample of this stratus will have size n· (Nj/N); where N - population size and n – sample size).
• Proportionally to the variability of the parameter we are considering in each stratus.
(eg. if we know that the variance for the height of male employees is 15 cm and for female employees is 5 cm; then the proportion of the males to females is 3:1 and the sample should keep that proportion).
• We assign the same size to each stratus.
(By doing this the smaller strata are promoted and the contrary happens with the bigger ones).
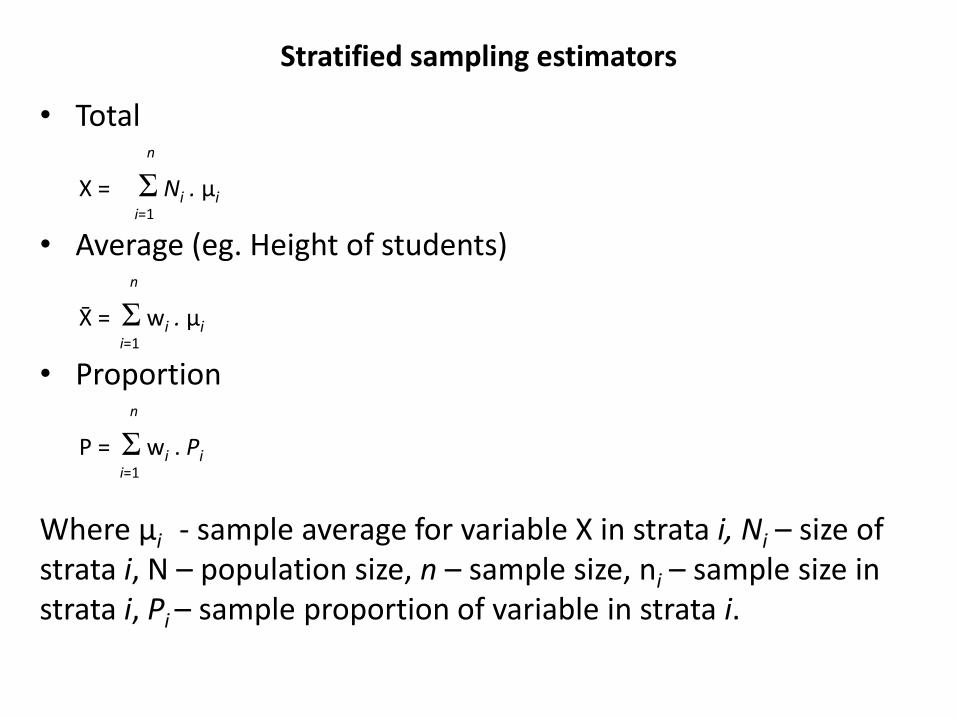
Stratified sampling estimators
• Totaln
X = Ʃ Ni . μii=1
• Average (eg. Height of students)n
X̄ = Ʃ wi . μii=1
• Proportionn
P = Ʃ wi . Pii=1
Where μi - sample average for variable X in strata i, Ni – size of strata i, N – population size, n – sample size, ni – sample size in strata i, Pi – sample proportion of variable in strata i.
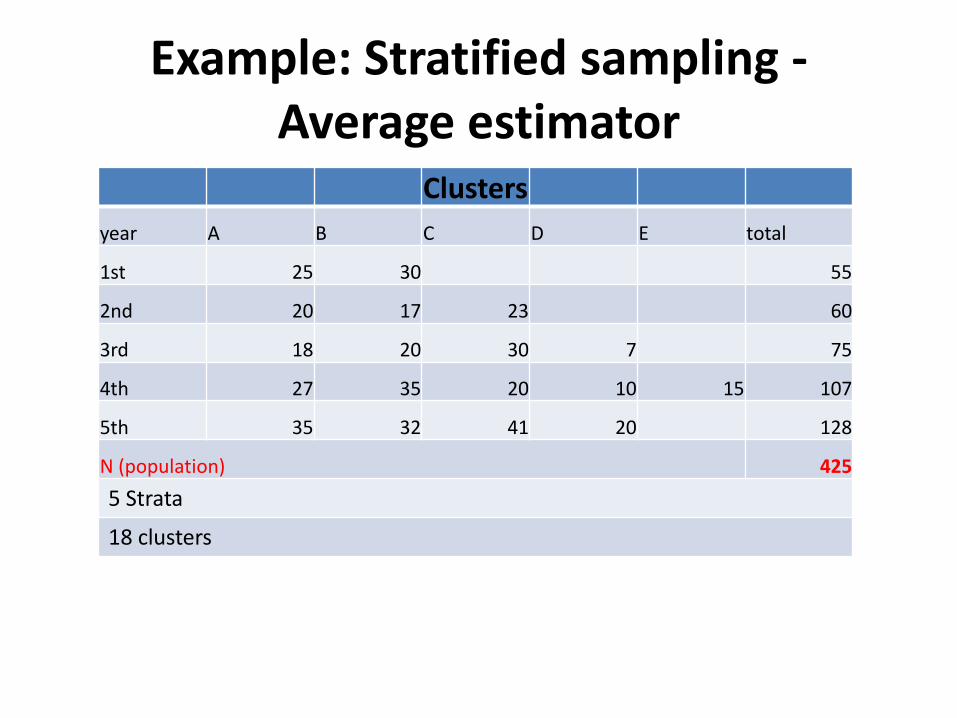
Example: Stratified sampling -Average estimator
Clusters
year A B C D E total
1st 25 30 55
2nd 20 17 23 60
3rd 18 20 30 7 75
4th 27 35 20 10 15 107
5th 35 32 41 20 128
N (population) 425
5 Strata
18 clusters

Sample size selection
strata
Strata population
Total sample
Total population
sample size
sampling factor of population
sampling factor of strata
Wi
Wi2
Fi
1 - FiNi n N(ni=n.Ni/
N) = Ni/N = ni/Ni
1 55 50 425 6 0.1294 0.0167 0.1176 0.8824
2 60 50 425 7 0.1412 0.0199 0.1176 0.8824
3 75 50 425 9 0.1765 0.0311 0.1176 0.8824
4 107 50 425 13 0.2518 0.0634 0.1176 0.8824
5 128 50 425 15 0.3012 0.0907 0.1176 0.8824
Total sample size (ni) 50
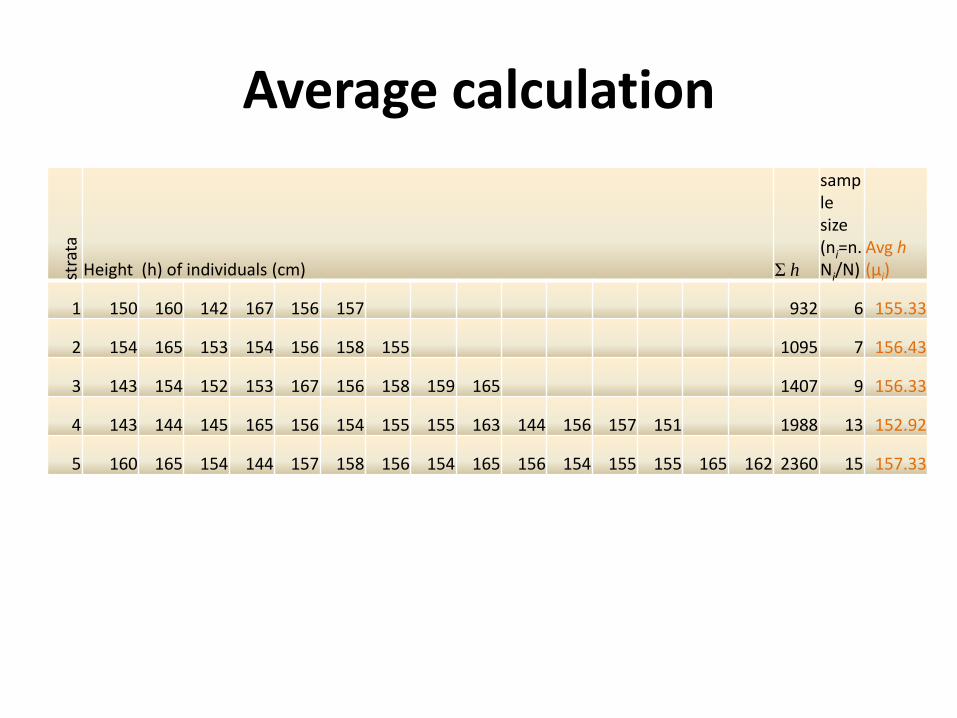
Average calculationst
rata
Height (h) of individuals (cm) Ʃ h
sample size (ni=n.Ni/N)
Avg h(μi)
1 150 160 142 167 156 157 932 6 155.33
2 154 165 153 154 156 158 155 1095 7 156.43
3 143 154 152 153 167 156 158 159 165 1407 9 156.33
4 143 144 145 165 156 154 155 155 163 144 156 157 151 1988 13 152.92
5 160 165 154 144 157 158 156 154 165 156 154 155 155 165 162 2360 15 157.33
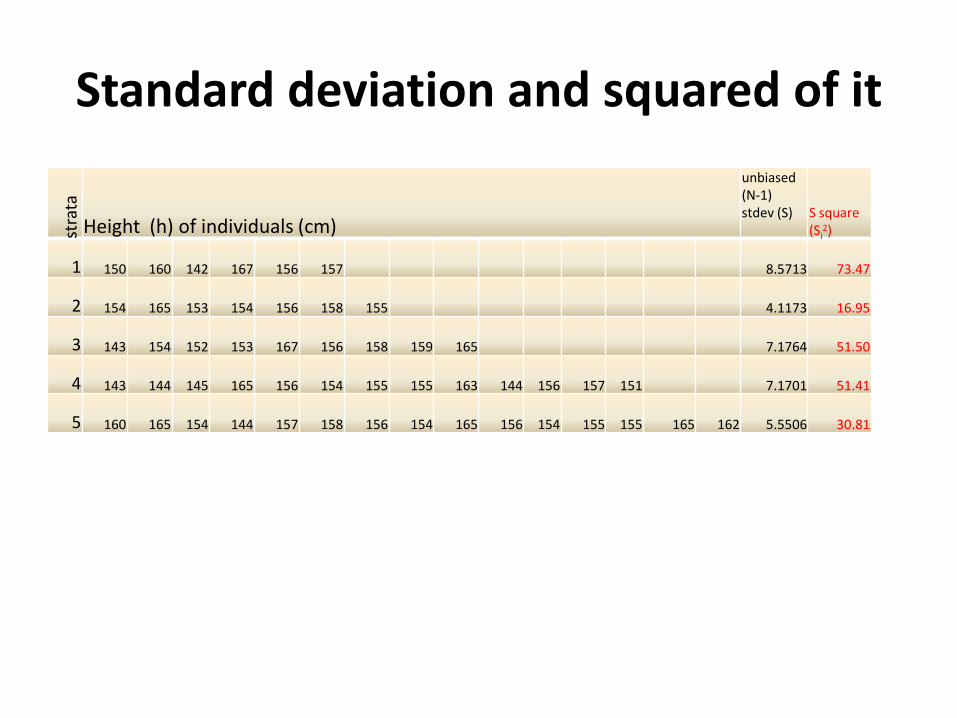
Standard deviation and squared of itst
rata
Height (h) of individuals (cm)
unbiased (N-1) stdev (S) S square
(Si2)
1 150 160 142 167 156 157 8.5713 73.47
2 154 165 153 154 156 158 155 4.1173 16.95
3 143 154 152 153 167 156 158 159 165 7.1764 51.50
4 143 144 145 165 156 154 155 155 163 144 156 157 151 7.1701 51.41
5 160 165 154 144 157 158 156 154 165 156 154 155 155 165 162 5.5506 30.81
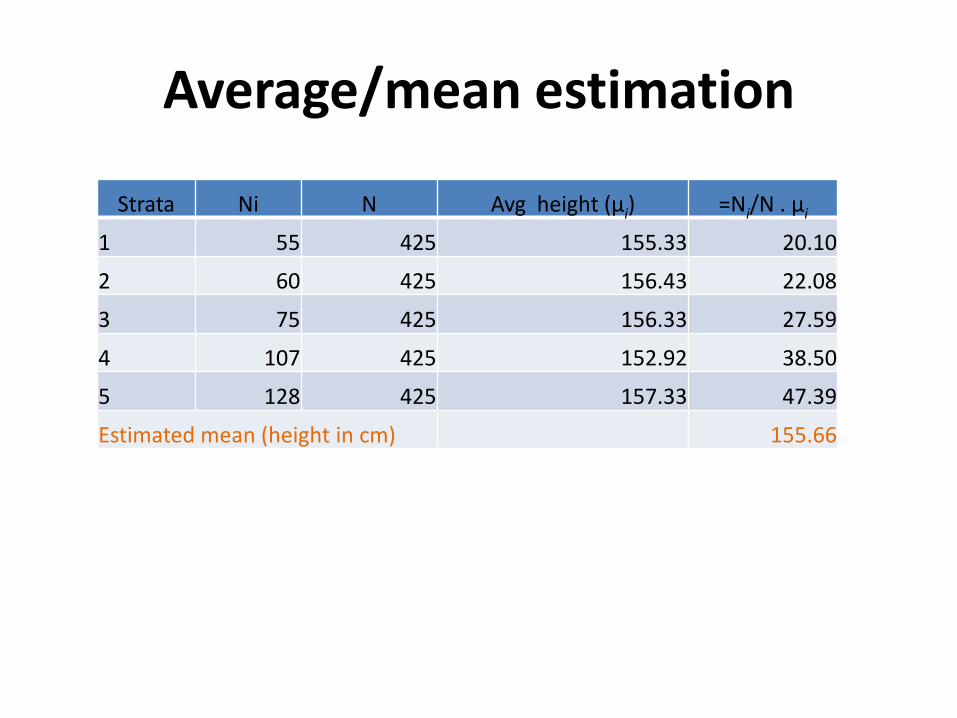
Average/mean estimation
Strata Ni N Avg height (μi) =Ni/N . μi
1 55 425 155.33 20.10
2 60 425 156.43 22.08
3 75 425 156.33 27.59
4 107 425 152.92 38.50
5 128 425 157.33 47.39
Estimated mean (height in cm) 155.66
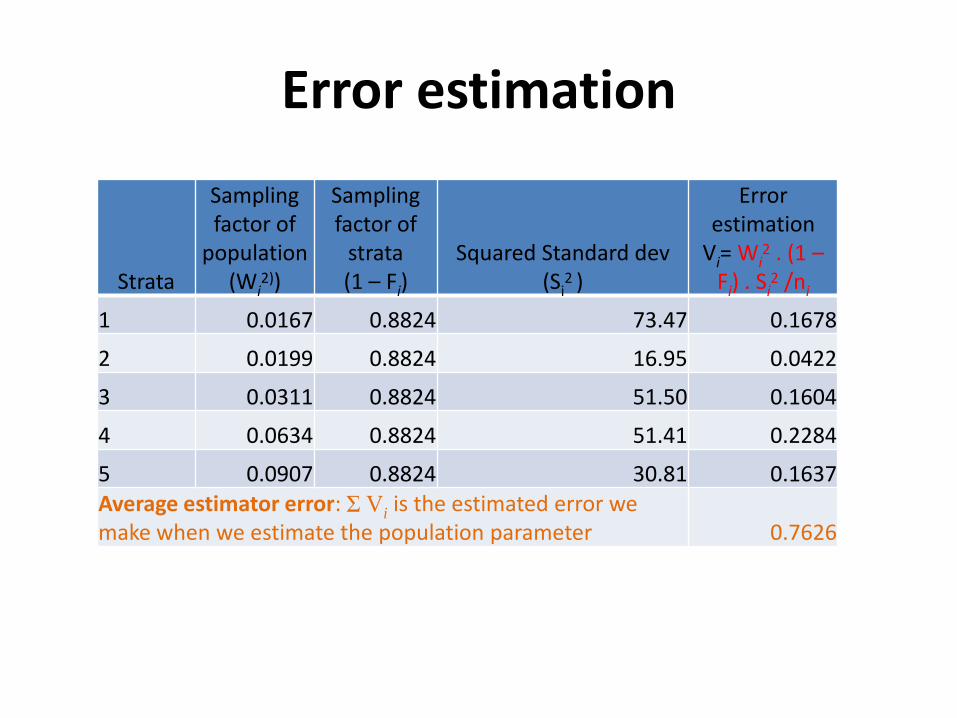
Error estimation
Strata
Sampling factor of
population (Wi
2))
Sampling factor of
strata (1 – Fi)
Squared Standard dev (Si
2 )
Error estimation
Vi= Wi2 . (1 –
Fi) . Si2 /ni
1 0.0167 0.8824 73.47 0.1678
2 0.0199 0.8824 16.95 0.0422
3 0.0311 0.8824 51.50 0.1604
4 0.0634 0.8824 51.41 0.2284
5 0.0907 0.8824 30.81 0.1637Average estimator error: Ʃ Vi
is the estimated error we make when we estimate the population parameter 0.7626
Cluster sampling
• The population is divided into mutually exclusive groups/clusters such as blocks, and the researcher draws a sample randomly of the groups/clusters (possibly heterogeneous) to interview.
• Adopt this technique if geographical area is large.
• Efficiency lesser than random sampling.
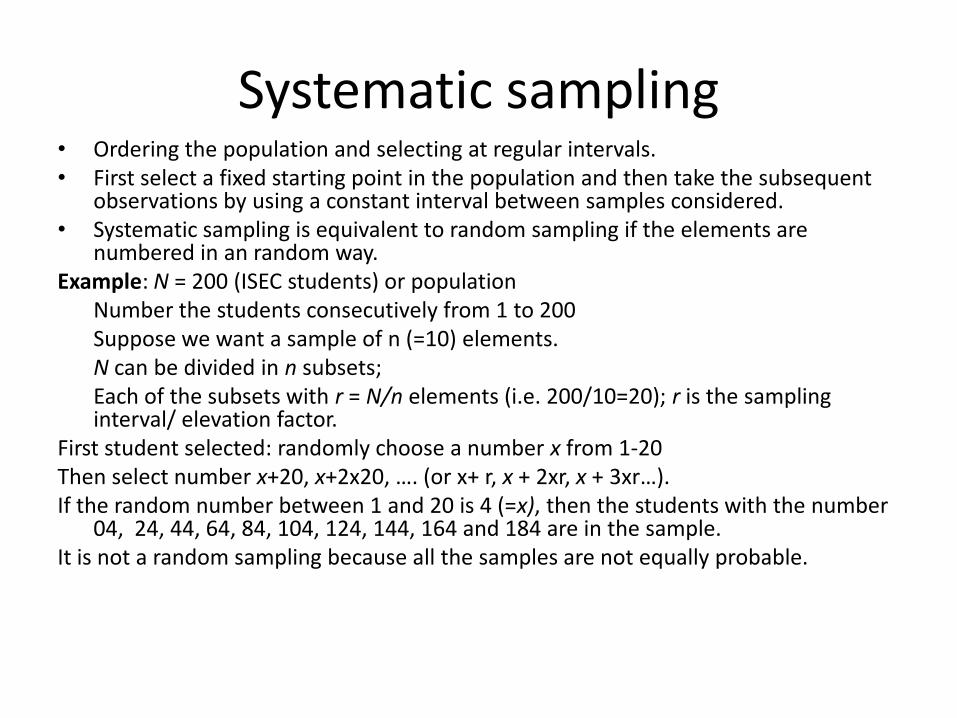
Systematic sampling• Ordering the population and selecting at regular intervals.• First select a fixed starting point in the population and then take the subsequent
observations by using a constant interval between samples considered.• Systematic sampling is equivalent to random sampling if the elements are
numbered in an random way.Example: N = 200 (ISEC students) or population
Number the students consecutively from 1 to 200Suppose we want a sample of n (=10) elements. N can be divided in n subsets;Each of the subsets with r = N/n elements (i.e. 200/10=20); r is the sampling interval/ elevation factor.
First student selected: randomly choose a number x from 1-20Then select number x+20, x+2x20, …. (or x+ r, x + 2xr, x + 3xr…).If the random number between 1 and 20 is 4 (=x), then the students with the number
04, 24, 44, 64, 84, 104, 124, 144, 164 and 184 are in the sample.It is not a random sampling because all the samples are not equally probable.
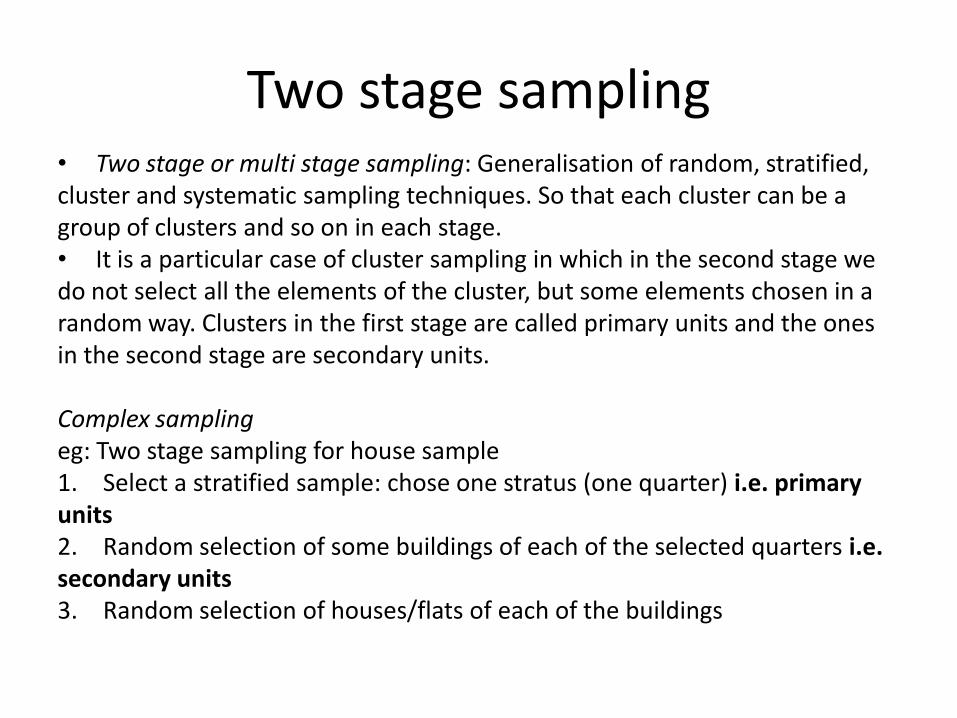
Two stage sampling• Two stage or multi stage sampling: Generalisation of random, stratified, cluster and systematic sampling techniques. So that each cluster can be a group of clusters and so on in each stage.• It is a particular case of cluster sampling in which in the second stage we do not select all the elements of the cluster, but some elements chosen in a random way. Clusters in the first stage are called primary units and the ones in the second stage are secondary units.
Complex samplingeg: Two stage sampling for house sample1. Select a stratified sample: chose one stratus (one quarter) i.e. primary units2. Random selection of some buildings of each of the selected quarters i.e. secondary units3. Random selection of houses/flats of each of the buildings

Sampling errors
Sampling error occurs when using sample (n) to make inferences about the population (N) from which they are draw. It is an error that occurs due to sampling.
Types• Random error: Resulted from sample selection (selection
error). The error is caused by observing a sample instead of the whole population.
• Systematic (or bias) error: results from errors in the sampling procedures; and it cannot be reduced/ eliminated by increasing the sample size.
• Non-answer error: arises due to some population who do not want or cannot answer certain questions.
Greater accuracy required
It can be obtained by
• increasing the size of sample
• increasing the homogeneity of the variable under investigation
• using adequate/accurate sampling design
Note: Sampling may not be feasible for research or
problems that require very high accuracy.
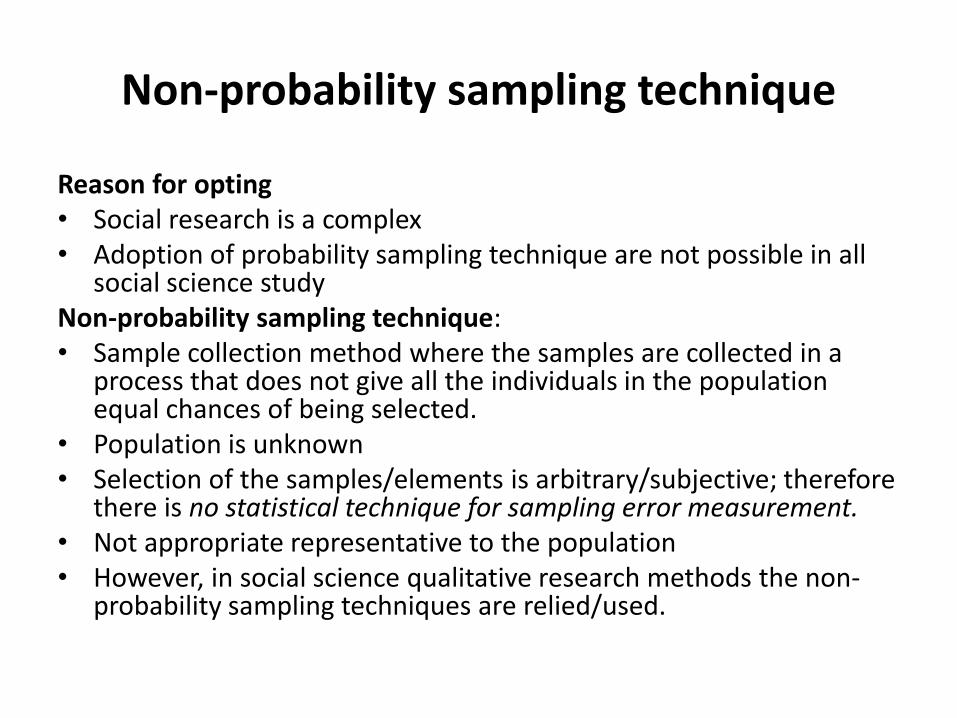
Non-probability sampling technique
Reason for opting• Social research is a complex• Adoption of probability sampling technique are not possible in all
social science studyNon-probability sampling technique: • Sample collection method where the samples are collected in a
process that does not give all the individuals in the population equal chances of being selected.
• Population is unknown• Selection of the samples/elements is arbitrary/subjective; therefore
there is no statistical technique for sampling error measurement.• Not appropriate representative to the population• However, in social science qualitative research methods the non-
probability sampling techniques are relied/used.
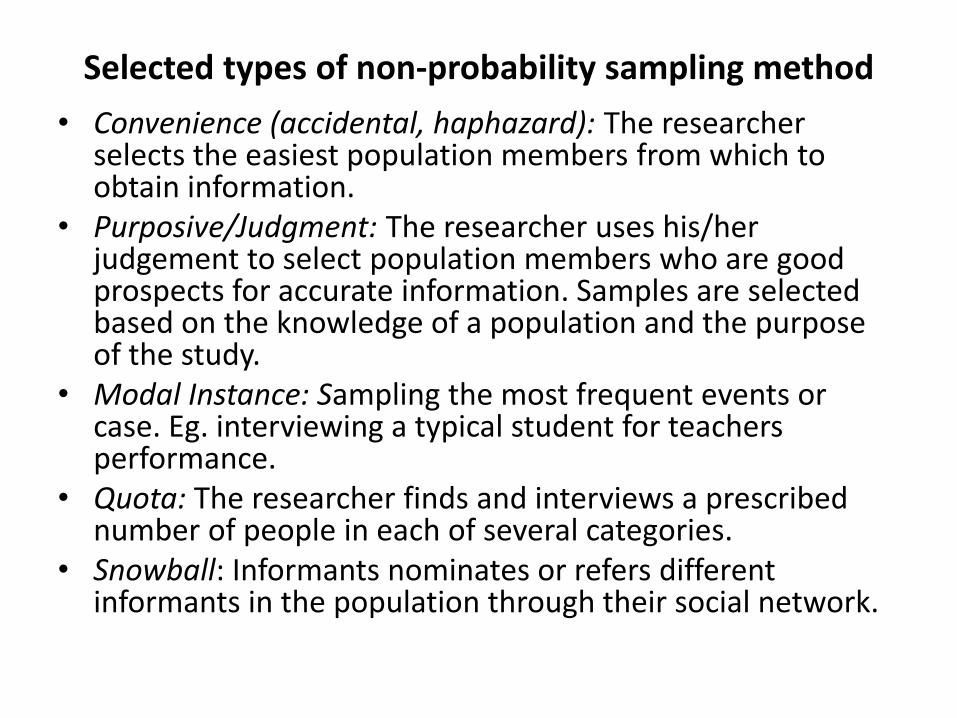
Selected types of non-probability sampling method
• Convenience (accidental, haphazard): The researcher selects the easiest population members from which to obtain information.
• Purposive/Judgment: The researcher uses his/her judgement to select population members who are good prospects for accurate information. Samples are selected based on the knowledge of a population and the purpose of the study.
• Modal Instance: Sampling the most frequent events or case. Eg. interviewing a typical student for teachers performance.
• Quota: The researcher finds and interviews a prescribed number of people in each of several categories.
• Snowball: Informants nominates or refers different informants in the population through their social network.
references
Dawson, Catherine, Practical Research Methods, UBS Publishers, Delhi (2002).Isadore Newman and Carolyn R. Benz, Qualitative-Quantitative Research
Methodology Exploring the Interactive Continuum, Southern Illinois University Press, Carbondale and Edwardsville (1998).
Johann Mouton, HC Marais, Basic Concepts in the Methodology of the Social Sciences. Human Sciences Research Council, HSRC Publishers, South Africa (1996).
Kothari, C.R., Research Methodology-Methods and Techniques, Wiley Eastern Limited, Delhi (1985).
Kumar, Ranjit, Research Methodology-A Step-by-Step Guide for Beginners (2nd
ed.), Pearson Education, Singapore (2005).Paula Lagares Barreiro and Justo Puerto Albandoz , Population and sample.
Sampling techniques, Management Mathematics for European Schools, University of Seville, (http://www.mathematik.unikl.de/˜ mamaeusch)
Singh, Y.K., Fundamental of Research Methodology and Statistics, New Age International Limited, Delhi (2006).
Copyright © 2022 FDOKUMEN