
The DEM of Mt. Etna: geomorphological and structural implications
Geomorphology 201 (2013) 335–343
Contents lists available at ScienceDirect
Geomorphology
j ourna l homepage: www.e lsev ie r .com/ locate /geomorph
Two-dimensional geomorphological characterization of a filledabandoned meander using geophysical methods and soil sampling
Jörg Hausmann a,⁎, Hannes Steinel a, Manuel Kreck a, Ulrike Werban a, Thomas Vienken a, Peter Dietrich a,b
a UFZ Helmholtz Centre for Environmental Research, Department Monitoring and Exploration Technologies, Permoserstrasse 15, 04318 Leipzig, Germanyb Eberhard Karls University of Tübingen, Institute of Geosciences, Hölderlinstrasse 12, 72076 Tübingen, Germany
⁎ Corresponding author. Tel.: +49 341 235 1039; faxE-mail address: [email protected] (J. Hausman
0169-555X/$ – see front matter © 2013 Elsevier B.V. Alhttp://dx.doi.org/10.1016/j.geomorph.2013.07.009
a b s t r a c t
a r t i c l e i n f oArticle history:Received 24 August 2012Received in revised form 4 July 2013Accepted 6 July 2013Available online 13 July 2013
Keywords:Geomorphological characterizationCombination of geophysical methodsElectrical resistivity tomographyRefraction seismicMASWGround penetrating radar
Using geophysical methods for the geomorphological characterization of subsurface features has numerousadvantages over traditional exploration methods, because of their noninvasive and rapid nature. In this study,we compared the results of four geophysical methods with each other. We also discuss their possibilities andlimitations in a geomorphological investigation. Electrical resistivity tomography (ERT), refraction seismic(RS), ground penetrating radar (GPR), and multichannel analysis of surface waves (MASW) methods were ap-plied at an abandonedmeander in northern Saxony tomap a predefined structure. By combining thesemethods,wewere able to characterize and delineate subsurface features of the abandonedmeander, including a point bar,a channel, and a cutbank. Core samples obtained from sonic drilling were used to validate the findings of bothseismic methods. However, we found that electrical resistivity tomography and ground penetrating radar lackedpenetration depth and could only be used to resolve shallower subsurface layers. The ERT, GPR, RS, and MASWcanbeused to gather images of subsurface structures. TheMASW inparticular provides supplementary informationabout the channel's internal structure (with respect to lateral and vertical resolution). Besides fluvial–morpholog-ical features, we also detected inverse velocity structures within the channel. This allowed us to characterize theabandoned meander using information about its layer distribution and material composition. However, we wereonly able to characterize and delineate the subsurface features of the abandoned meander by combining all ofthe aforementioned methods.
© 2013 Elsevier B.V. All rights reserved.
1. Introduction
The use of shallow geophysical methods for the geomorphologicalcharacterization of subsurface features has become very popular in recentyears. Schrott and Sass (2008) andVanDam(2012) provided examples ofhowgeophysicalmethods can beutilized formultidimensional identifica-tion, distinction, and characterization of glacial, fluvial, aeolian, volcanic,and tectonic landforms in relation to different survey aims. Noninvasivegeophysical investigation techniques map the contrasts between certainphysical properties of the subsurface, which can limit the applicationrange of a particular method. Over the last decade, ground penetratingradar (GPR), electrical resistivity tomography (ERT), and refraction seismic(RS)methods have beenproven todeliver valuable informationon the di-electric, resistivity, and density properties of subsurface sedimentarystructures and compositions for their characterization (Schrott and Sass,2008; Van Dam, 2012). In addition, seismic surface wave techniques,e.g., multichannel analysis of surface waves (MASW), have been recentlyapplied in geomorphological studies, showing that it is possible for thismethod to complement these techniques, precisely because the sameseismic data set can be analyzed with regard to surface and refraction
: +49 341 235 1939.n).
l rights reserved.
waves (Socco et al., 2010; Yamakawa et al., 2012). Even though theapplied surface wave method delivers more detailed results in compari-son with RS, it however failed to accurately estimate soil thickness(Yamakawa et al., 2012). Although increased computational powerand light-weight equipment help to improve user-friendliness andtime/cost-efficient gathering and processing of high resolution two- andthree-dimensional subsurface data, every method has its drawbacks andlimitations. These are mainly caused by a lack of contrast betweenthephysical properties of the subsurface towhich each technique is sen-sitive (Schrott and Sass, 2008). Furthermore, themeasurement parame-ters are proxies for several mechanical and physical subsurfacecharacteristics (Yamakawa et al., 2012). Multiple GPR reflections canoccur in gravelly sediments without achieving themain aim of a partic-ular survey (e.g., measuring thickness distribution). The electrical resis-tivity is mainly dependent on the water content, the fluid compositionof the subsurface, and the grain size, thereby leading to the problem ofequivalence in two-dimensional resistivity interpretation (Hoffmannand Dietrich, 2004). Methodical difficulties of refraction seismic surveysbecome apparent with increasing density and therefore increasingvelocity with depth. Therefore, measurements for low velocity and hid-den layers cannot be registered by the seismogram. Schrott and Sass(2008) discussed advantages and disadvantages of various geophysicalmethods for the characterization of geomorphological subsurface
336 J. Hausmann et al. / Geomorphology 201 (2013) 335–343
features. As a result, combining different geophysical methods has be-come state-of-the-art for geomorphological studies, making it possibleto overcome the limitations of each technique and to cross-check the re-sults as well as to determinewhichmethod is most suitable for a partic-ular environment (Otto and Sass, 2006; Schrott and Sass, 2008; Socco etal., 2010).
Although applied for many geomorphological investigations withvarious geological settings, studies have shown that GPR, ERT, andRS often yield uncertain results (Otto and Sass, 2006; Socco et al.,2010; Yamakawa et al., 2012). The MASW, as a surface-wave method,is a very powerful tool for the near-surface characterization of shal-low layers that is able to accurately reflect, e.g., the soil–bedrock in-terface more appropriately than the refraction seismic method, eventhough larger variations in lateral directions of the one-dimensionalprofiles also occur (Socco et al., 2010; Yamakawa et al., 2012). Weconsidered data acquisition with two different source-offsets to rec-ognize the near-field effects (Dikmen et al., 2010). Furthermore, wecombined the resulting dispersion curves of both offsets to increasethe bandwidth frequency and to resolve shallower and deeper sub-surface layers (Park and Shawver, 2009). This allows increased reso-lution to be achieved for near-subsurface characterization.
Thus, a validation and a comparison of these resolutions are neces-sary in order to understand the capabilities, advantages, and limita-tions of each method. In this study, we use GPR, ERT, RS, and MASWto delineate geomorphological features of a filled abandoned mean-der of the River Mulde in northern Saxony, Germany. We conducteda multimethodical investigation to cross-check and verify the resultsof each individual method. In addition, we compared the findingswith data obtained from core samples to evaluate the aforementionedgeophysical techniques to establish their capacity to provide imagingof fluvial–morphological features.
Structural information about the near-subsurface is not only ofgreat interest in explaining geomorphological evolution but also forgeotechnical site assessment. At the study site, we assume a subsur-face hydraulic connection given by cutoff oxbows that cross a dikestructure beneath ground level. This allows a base flow in the direc-tion of the river and in the land along those channel structures,which is controlled by steam gauge fluctuations and groundwaterlevel. Therefore, these subsurface streams along the abandoned chan-nel structure have a severe impact on the protection capacity of thedike in the case of a flood event.
2. Study area
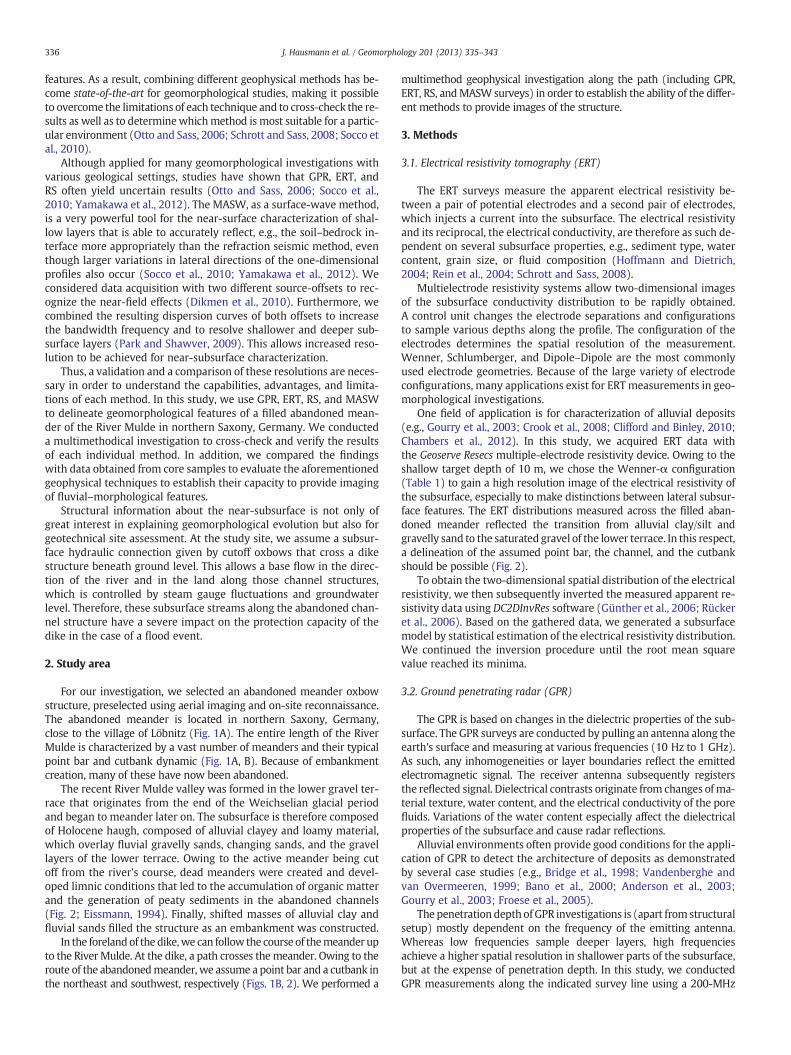
For our investigation, we selected an abandoned meander oxbowstructure, preselected using aerial imaging and on-site reconnaissance.The abandoned meander is located in northern Saxony, Germany,close to the village of Löbnitz (Fig. 1A). The entire length of the RiverMulde is characterized by a vast number of meanders and their typicalpoint bar and cutbank dynamic (Fig. 1A, B). Because of embankmentcreation, many of these have now been abandoned.
The recent River Mulde valley was formed in the lower gravel ter-race that originates from the end of the Weichselian glacial periodand began to meander later on. The subsurface is therefore composedof Holocene haugh, composed of alluvial clayey and loamy material,which overlay fluvial gravelly sands, changing sands, and the gravellayers of the lower terrace. Owing to the active meander being cutoff from the river's course, dead meanders were created and devel-oped limnic conditions that led to the accumulation of organic matterand the generation of peaty sediments in the abandoned channels(Fig. 2; Eissmann, 1994). Finally, shifted masses of alluvial clay andfluvial sands filled the structure as an embankment was constructed.
In the forelandof the dike,we can follow the course of themeander upto the RiverMulde. At the dike, a path crosses themeander. Owing to theroute of the abandonedmeander, we assume a point bar and a cutbank inthe northeast and southwest, respectively (Figs. 1B, 2). We performed a
multimethod geophysical investigation along the path (including GPR,ERT, RS, andMASW surveys) in order to establish the ability of the differ-ent methods to provide images of the structure.
3. Methods
3.1. Electrical resistivity tomography (ERT)
The ERT surveys measure the apparent electrical resistivity be-tween a pair of potential electrodes and a second pair of electrodes,which injects a current into the subsurface. The electrical resistivityand its reciprocal, the electrical conductivity, are therefore as such de-pendent on several subsurface properties, e.g., sediment type, watercontent, grain size, or fluid composition (Hoffmann and Dietrich,2004; Rein et al., 2004; Schrott and Sass, 2008).
Multielectrode resistivity systems allow two-dimensional imagesof the subsurface conductivity distribution to be rapidly obtained.A control unit changes the electrode separations and configurationsto sample various depths along the profile. The configuration of theelectrodes determines the spatial resolution of the measurement.Wenner, Schlumberger, and Dipole–Dipole are the most commonlyused electrode geometries. Because of the large variety of electrodeconfigurations, many applications exist for ERT measurements in geo-morphological investigations.
One field of application is for characterization of alluvial deposits(e.g., Gourry et al., 2003; Crook et al., 2008; Clifford and Binley, 2010;Chambers et al., 2012). In this study, we acquired ERT data withthe Geoserve Resecs multiple-electrode resistivity device. Owing to theshallow target depth of 10 m, we chose the Wenner-α configuration(Table 1) to gain a high resolution image of the electrical resistivity ofthe subsurface, especially to make distinctions between lateral subsur-face features. The ERT distributions measured across the filled aban-doned meander reflected the transition from alluvial clay/silt andgravelly sand to the saturated gravel of the lower terrace. In this respect,a delineation of the assumed point bar, the channel, and the cutbankshould be possible (Fig. 2).
To obtain the two-dimensional spatial distribution of the electricalresistivity, we then subsequently inverted the measured apparent re-sistivity data using DC2DInvRes software (Günther et al., 2006; Rückeret al., 2006). Based on the gathered data, we generated a subsurfacemodel by statistical estimation of the electrical resistivity distribution.We continued the inversion procedure until the root mean squarevalue reached its minima.
3.2. Ground penetrating radar (GPR)
The GPR is based on changes in the dielectric properties of the sub-surface. The GPR surveys are conducted by pulling an antenna along theearth's surface and measuring at various frequencies (10 Hz to 1 GHz).As such, any inhomogeneities or layer boundaries reflect the emittedelectromagnetic signal. The receiver antenna subsequently registersthe reflected signal. Dielectrical contrasts originate from changes ofma-terial texture, water content, and the electrical conductivity of the porefluids. Variations of the water content especially affect the dielectricalproperties of the subsurface and cause radar reflections.
Alluvial environments often provide good conditions for the appli-cation of GPR to detect the architecture of deposits as demonstratedby several case studies (e.g., Bridge et al., 1998; Vandenberghe andvan Overmeeren, 1999; Bano et al., 2000; Anderson et al., 2003;Gourry et al., 2003; Froese et al., 2005).
The penetration depth ofGPR investigations is (apart from structuralsetup) mostly dependent on the frequency of the emitting antenna.Whereas low frequencies sample deeper layers, high frequenciesachieve a higher spatial resolution in shallower parts of the subsurface,but at the expense of penetration depth. In this study, we conductedGPR measurements along the indicated survey line using a 200-MHz
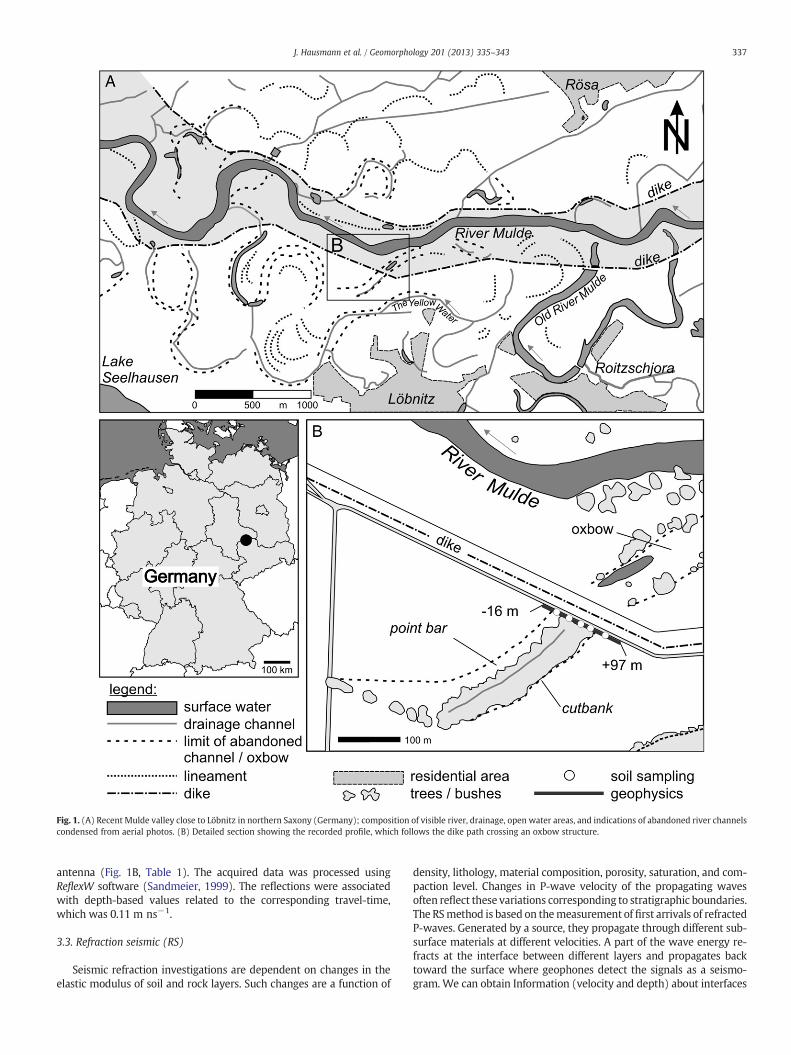
Fig. 1. (A) Recent Mulde valley close to Löbnitz in northern Saxony (Germany); composition of visible river, drainage, open water areas, and indications of abandoned river channelscondensed from aerial photos. (B) Detailed section showing the recorded profile, which follows the dike path crossing an oxbow structure.
337J. Hausmann et al. / Geomorphology 201 (2013) 335–343
antenna (Fig. 1B, Table 1). The acquired data was processed usingReflexW software (Sandmeier, 1999). The reflections were associatedwith depth-based values related to the corresponding travel-time,which was 0.11 m ns−1.
3.3. Refraction seismic (RS)
Seismic refraction investigations are dependent on changes in theelastic modulus of soil and rock layers. Such changes are a function of
density, lithology, material composition, porosity, saturation, and com-paction level. Changes in P-wave velocity of the propagating wavesoften reflect these variations corresponding to stratigraphic boundaries.The RSmethod is based on themeasurement of first arrivals of refractedP-waves. Generated by a source, they propagate through different sub-surface materials at different velocities. A part of the wave energy re-fracts at the interface between different layers and propagates backtoward the surface where geophones detect the signals as a seismo-gram. We can obtain Information (velocity and depth) about interfaces
Fig. 2. Assumed cross section of the internal geomorphological structure of the oxbow in the study area according to Eissmann (1994) and field observations.
338 J. Hausmann et al. / Geomorphology 201 (2013) 335–343
from the first arrivals of the refracted P-waves. Refracted S-waves canalso be analyzed. However, their generation is more difficult becausethey must simultaneously be horizontally emitted in both directionsfor each shot position. Accordingly, the elimination of P-waves requiresa treatment of the resulting values in the seismogram. Besides, P-waveseismic refraction offers the possibility of analyzing the seismogramwith respect to surface waves.
An increase in density, and therefore in P-wave velocity, is a nec-essary precondition of this method, which in turn thereby preventsthe detection of layers with inverse velocity gradients (low velocitylayers). Another limitation of RS is the inability to resolve thin layers,especially in greater depths. From first arrival travel-time curves,so-called hidden layers cannot be distinguished. Nevertheless, RS is acommonly used method, e.g., for differentiating sediment types andbedrock (Schrott et al., 2003; Yamakawa et al., 2012). Furthermore,RS is applied in combination with other geophysical methods for de-tection of fluvial features (Otto and Sass, 2006).
Given the subsurface setting in the area of the abandoned mean-der, we assume that gravel from the lower terrace acts as a refractor.Therefore, we can determine soil thickness and delineate lateral fea-tures, whereas inverse velocity structures (e.g., the infilling) may beimpossible to detect.
At the field site, we conducted refraction seismic measurementsalong the path with 4 Geometrics Geodes and 96 4.5-Hz geophoneswith 1-m spacing (Table 1). We used a plastic hammer and a metalplate to induce the signal. The geophone positions remained fixed dur-ing acquisition. Measurements were gathered at offset distances of 16,8, and 4 mon both profiles, every 2 mwithin the spread and condensedto 1 mwhile passing the filled channel.We then picked the P-wave firstarrivals using ReflexW software (Sandmeier, 1999). Afterward, weperformed tomographic inversions of P-wave travel-time curves usingRa/TT2dTomo software (Günther, 2005).
3.4. Multichannel analysis of surface waves (MASW)
The use of surfacewavemethods has been recently deployed in geo-morphological investigations (Socco et al., 2010; Coulouma et al., 2012;Yamakawa et al., 2012), especially bymeans of multichannel analysis ofsurface waves (MASW; Park et al., 1999). This method utilizes the dis-persive features of surface waves, primarily Rayleigh-waves, which
Table 1Geometrical parameters of applied geophysical methods for ERT (Wenner-α), GPR, RS, and
Method Profile length[m]
Channel number Ma[m
ERT 96 96 –
GPR 88 – –
RS 96 96 16MASW 96 24 4 a
a Shot distance was set to 1 m inside and 2 m outside of the meander structure.
make up two-thirds of the induced seismic signal. Depending on the fre-quency, they propagate through different depthswith certain phase ve-locities, mainly influenced by density and rigidity of the subsurface.
We processed the surface wave records to obtain dispersion curves,i.e., the ratio between frequency and phase velocity, which depends onthe S-wave velocities of the subsurface. Accordingly, we subsequentlyinverted the curves in order to estimate a one-dimensional S-wave ve-locity profile. After this, we arranged the one-dimensional results nextto each other generating pseudo-two-dimensional sections (Xia et al.,2000). Contrary to the RS method, inverse velocity structures affectthe dispersive characteristics of the Rayleigh-wave. Therefore, theMASW technique could providemore reliable and detailed informationof S-wave velocity distribution and features. Given the similarmeasure-ment setup, the seismic record can be analyzed according to both RSand MASWmethods.
Hence, we also acquired surface wave data from the refraction sur-vey using this identical setup. With an additional 24 geophones, we ex-tended the profile in a northwesterly direction. Taking near-field effectsinto account, we chose source offsets of 4 and 8 m for everymid-spreadposition (Dikmen et al., 2010). Furthermore, we combined the resultingdispersion curves of both offsets to increase the bandwidth frequencyand to resolve shallower and deeper subsurface layers (Park andShawver, 2009). We performed measurements at 2-m intervals, withthe source being located northwest of the spread. Afterwards, we re-duced the seismic records obtaining 49 seismograms with 24 tracesand a spread length of 23 m for each shot position and offset (Table 1).
For each offset shot position, we extracted the fundamental modedispersive characteristics of the seismogram using the SeisImager/SWsoftware package (Geometrics, 2012). Then we picked the energymaxima and combined the dispersion curve for the correspondingmid-spread position of the 4- and 8-m offsets. The inversion wasperformed using a genetic algorithm according to Parolai et al. (2005),Picozzi et al. (2005), Pilz et al. (2010), and Boxberger et al. (2011).Based on a six-layer starting model and a predefined search area(Table 2), the algorithm searches for a global solution during eachmodel generation, employing genetic operations (namely crossover,elite selection, and dynamic mutation). The algorithm stopped the iter-ations after 50 generations resulting in minimummisfits of mostly b3%between measured and calculated dispersion curves. Then we interpo-lated the depth steps of the resulting one-dimensional S-wave velocity
MASW.
x. offset]
Spacing[m]
Shot distance[m]
Stacks–
1 – –
Const. – –
1 1 and 2a 3nd 8 1 2 3
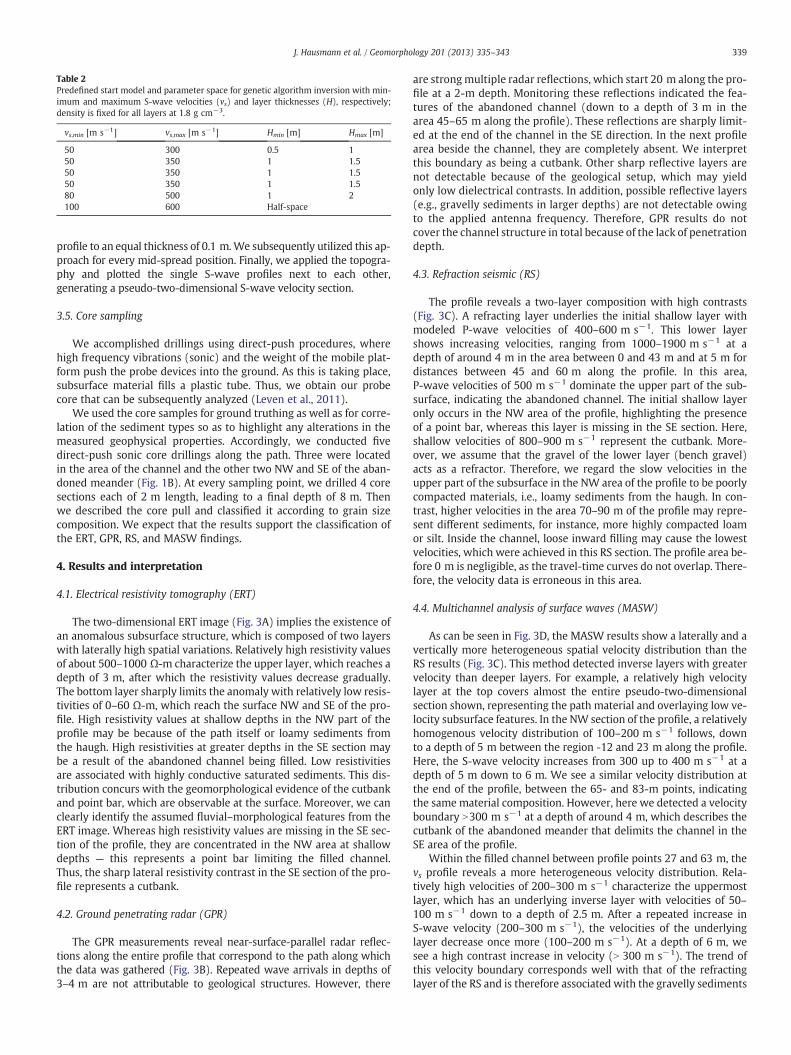
Table 2Predefined start model and parameter space for genetic algorithm inversion with min-imum and maximum S-wave velocities (vs) and layer thicknesses (H), respectively;density is fixed for all layers at 1.8 g cm−3.
vs,min [m s−1] vs,max [m s−1] Hmin [m] Hmax [m]
50 300 0.5 150 350 1 1.550 350 1 1.550 350 1 1.580 500 1 2100 600 Half-space
339J. Hausmann et al. / Geomorphology 201 (2013) 335–343
profile to an equal thickness of 0.1 m.We subsequently utilized this ap-proach for every mid-spread position. Finally, we applied the topogra-phy and plotted the single S-wave profiles next to each other,generating a pseudo-two-dimensional S-wave velocity section.
3.5. Core sampling
We accomplished drillings using direct-push procedures, wherehigh frequency vibrations (sonic) and the weight of the mobile plat-form push the probe devices into the ground. As this is taking place,subsurface material fills a plastic tube. Thus, we obtain our probecore that can be subsequently analyzed (Leven et al., 2011).
We used the core samples for ground truthing as well as for corre-lation of the sediment types so as to highlight any alterations in themeasured geophysical properties. Accordingly, we conducted fivedirect-push sonic core drillings along the path. Three were locatedin the area of the channel and the other two NW and SE of the aban-doned meander (Fig. 1B). At every sampling point, we drilled 4 coresections each of 2 m length, leading to a final depth of 8 m. Thenwe described the core pull and classified it according to grain sizecomposition. We expect that the results support the classification ofthe ERT, GPR, RS, and MASW findings.
4. Results and interpretation
4.1. Electrical resistivity tomography (ERT)
The two-dimensional ERT image (Fig. 3A) implies the existence ofan anomalous subsurface structure, which is composed of two layerswith laterally high spatial variations. Relatively high resistivity valuesof about 500–1000 Ω-m characterize the upper layer, which reaches adepth of 3 m, after which the resistivity values decrease gradually.The bottom layer sharply limits the anomaly with relatively low resis-tivities of 0–60 Ω-m, which reach the surface NW and SE of the pro-file. High resistivity values at shallow depths in the NW part of theprofile may be because of the path itself or loamy sediments fromthe haugh. High resistivities at greater depths in the SE section maybe a result of the abandoned channel being filled. Low resistivitiesare associated with highly conductive saturated sediments. This dis-tribution concurs with the geomorphological evidence of the cutbankand point bar, which are observable at the surface. Moreover, we canclearly identify the assumed fluvial–morphological features from theERT image. Whereas high resistivity values are missing in the SE sec-tion of the profile, they are concentrated in the NW area at shallowdepths — this represents a point bar limiting the filled channel.Thus, the sharp lateral resistivity contrast in the SE section of the pro-file represents a cutbank.
4.2. Ground penetrating radar (GPR)
The GPR measurements reveal near-surface-parallel radar reflec-tions along the entire profile that correspond to the path along whichthe data was gathered (Fig. 3B). Repeated wave arrivals in depths of3–4 m are not attributable to geological structures. However, there
are strongmultiple radar reflections, which start 20 m along the pro-file at a 2-m depth. Monitoring these reflections indicated the fea-tures of the abandoned channel (down to a depth of 3 m in thearea 45–65 m along the profile). These reflections are sharply limit-ed at the end of the channel in the SE direction. In the next profilearea beside the channel, they are completely absent. We interpretthis boundary as being a cutbank. Other sharp reflective layers arenot detectable because of the geological setup, which may yieldonly low dielectrical contrasts. In addition, possible reflective layers(e.g., gravelly sediments in larger depths) are not detectable owingto the applied antenna frequency. Therefore, GPR results do notcover the channel structure in total because of the lack of penetrationdepth.
4.3. Refraction seismic (RS)
The profile reveals a two-layer composition with high contrasts(Fig. 3C). A refracting layer underlies the initial shallow layer withmodeled P-wave velocities of 400–600 m s−1. This lower layershows increasing velocities, ranging from 1000–1900 m s−1 at adepth of around 4 m in the area between 0 and 43 m and at 5 m fordistances between 45 and 60 m along the profile. In this area,P-wave velocities of 500 m s−1 dominate the upper part of the sub-surface, indicating the abandoned channel. The initial shallow layeronly occurs in the NW area of the profile, highlighting the presenceof a point bar, whereas this layer is missing in the SE section. Here,shallow velocities of 800–900 m s−1 represent the cutbank. More-over, we assume that the gravel of the lower layer (bench gravel)acts as a refractor. Therefore, we regard the slow velocities in theupper part of the subsurface in the NW area of the profile to be poorlycompacted materials, i.e., loamy sediments from the haugh. In con-trast, higher velocities in the area 70–90 m of the profile may repre-sent different sediments, for instance, more highly compacted loamor silt. Inside the channel, loose inward filling may cause the lowestvelocities, which were achieved in this RS section. The profile area be-fore 0 m is negligible, as the travel-time curves do not overlap. There-fore, the velocity data is erroneous in this area.
4.4. Multichannel analysis of surface waves (MASW)
As can be seen in Fig. 3D, the MASW results show a laterally and avertically more heterogeneous spatial velocity distribution than theRS results (Fig. 3C). This method detected inverse layers with greatervelocity than deeper layers. For example, a relatively high velocitylayer at the top covers almost the entire pseudo-two-dimensionalsection shown, representing the path material and overlaying low ve-locity subsurface features. In the NW section of the profile, a relativelyhomogenous velocity distribution of 100–200 m s−1 follows, downto a depth of 5 m between the region -12 and 23 m along the profile.Here, the S-wave velocity increases from 300 up to 400 m s−1 at adepth of 5 m down to 6 m. We see a similar velocity distribution atthe end of the profile, between the 65- and 83-m points, indicatingthe same material composition. However, here we detected a velocityboundary N300 m s−1 at a depth of around 4 m, which describes thecutbank of the abandoned meander that delimits the channel in theSE area of the profile.
Within the filled channel between profile points 27 and 63 m, thevs profile reveals a more heterogeneous velocity distribution. Rela-tively high velocities of 200–300 m s−1 characterize the uppermostlayer, which has an underlying inverse layer with velocities of 50–100 m s−1 down to a depth of 2.5 m. After a repeated increase inS-wave velocity (200–300 m s−1), the velocities of the underlyinglayer decrease once more (100–200 m s−1). At a depth of 6 m, wesee a high contrast increase in velocity (N 300 m s−1). The trend ofthis velocity boundary corresponds well with that of the refractinglayer of the RS and is therefore associated with the gravelly sediments
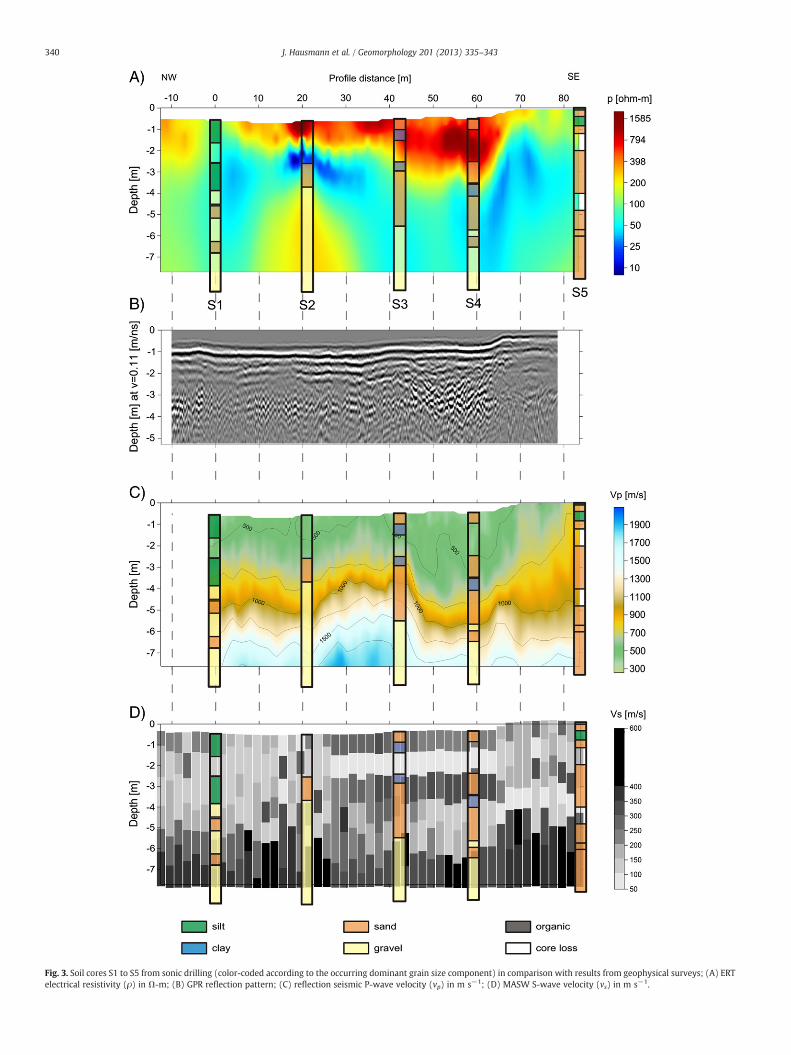
Fig. 3. Soil cores S1 to S5 from sonic drilling (color-coded according to the occurring dominant grain size component) in comparison with results from geophysical surveys; (A) ERTelectrical resistivity (ρ) in Ω-m; (B) GPR reflection pattern; (C) reflection seismic P-wave velocity (vp) in m s−1; (D) MASW S-wave velocity (vs) in m s−1.
340 J. Hausmann et al. / Geomorphology 201 (2013) 335–343
341J. Hausmann et al. / Geomorphology 201 (2013) 335–343
of the lower layer (bench gravel), which clearly defines the channelstructure. Because of the velocity distribution within the channel,we assume that inward filling occurs down to a depth of 3.5 m;whereas the uppermost layer is composed of anthropogenic sedimentmaterials, and the underlying layer is made up of restored alluvial silt.These sharply contrasting deposits overlay fluvial sediments of theabandoned channel, which reaches down to a depth of 6 m. Thisdepth represents the bottom of the channel.
4.5. Core sampling
The soil sampling results reflect the geological setting of the area(Fig. 3). We found path-filling material in the uppermost parts of allcores. In the NW and SE areas of the abandoned meander (cores S1and S5), loamy and silty materials represent haugh sediments andalluvial clay, respectively. In the NW section, this layer reaches to adepth of 3.3 m and, in the SE section, to a depth of 3.4 m. Here, moresandy materials characterize this layer. Sand and gravel mixtures un-derlay the haugh sediments in theNWregion. Sandy layerswith variousgrain sizes characterize the subsurface region in the SE. Within theabandoned meander, we found a similar sediment composition. Sandyand clayey materials of the haugh characterize the uppermost layersof cores S2 and S3. An underlying layer (composed of sandwith varyinggrain sizes) initially merges with stream gravel (gravel bars) and thenwith gravel in the lower terrace at a depth of 5–6 m. This phenomenonis observable in nearly all of the core samples. In the channel region(core S4), we observed a different composition. Inward filling withloamy sand is observable to a depth of 3 m, which corresponds to thehaugh boundary of the adjacent sampling points. Beneath a thin organiclayer, we drilled a banded sandy loammixture, indicating limnic condi-tions inside the channel. The next layer is composed of sand and gravel,merging into gravel of the lower bench at a depth of 6 m.
5. Discussion
The results reflect the different dependencies of each method onvarious physical properties of the subsurface. However, we can delin-eate fluvial–morphological features of the abandoned meander in allimages (Fig. 3). By comparing individual results with each other, somevariations in results achieved were revealed between the methods(Fig. 4). The ERT measurements are mainly dependent on the watercontent of the subsurface (Hoffmann and Dietrich, 2004). Thus, wehave to understand the detected boundaries as resistivity contrasts,from high to low, in unsaturated sediments. Hence, themapped bound-aries of the point bar, channel, and cutbank (from NW to SE) may notmatch the real boundaries that we recorded or may yield results thatvary somewhat (are generally lower) using RS and MASW methods.The anomalous resistivity structure at around 20 m along the profileand occurring at a depth of 4 m may be an indicator of gravelly layers.Such layers were also found in the core sample S2 (Fig. 3A). While per-haps not representing an inversion artifact, this anomaly shows howev-er that those layers under a depth of 4 m are not detectable using theWenner-α configuration or ERT in general because of water saturation.Moreover, the high resistivity boundary (200 Ω-m) seems to correlatewith inward filling in the channel section, as clearly exposed by theMASWmethod (Fig. 3D). Owing to the small-scale resistivity variationsof the subsurface, we could not reach the actual target depth. TheERT method delineates the path on which the measurements wereconducted as well as the inwardly filled region, as is indicated by thehigh resistivities (700–1600 Ω-m). As a result, the ERT image does notreveal the real depth of the meander structure but can be used to char-acterize the overall extent and degree of infilling.
The GPR results support the ERT findings and vice versa (Fig. 3A, B).Here, the investigated reflective layer correspondswell to the high elec-trical resistivity boundary along the entire profile (Fig. 4). Therefore,
GPR measurements also seem to map the limits of the infilling, resolv-ing any uncertainties connected with ERT measurements.
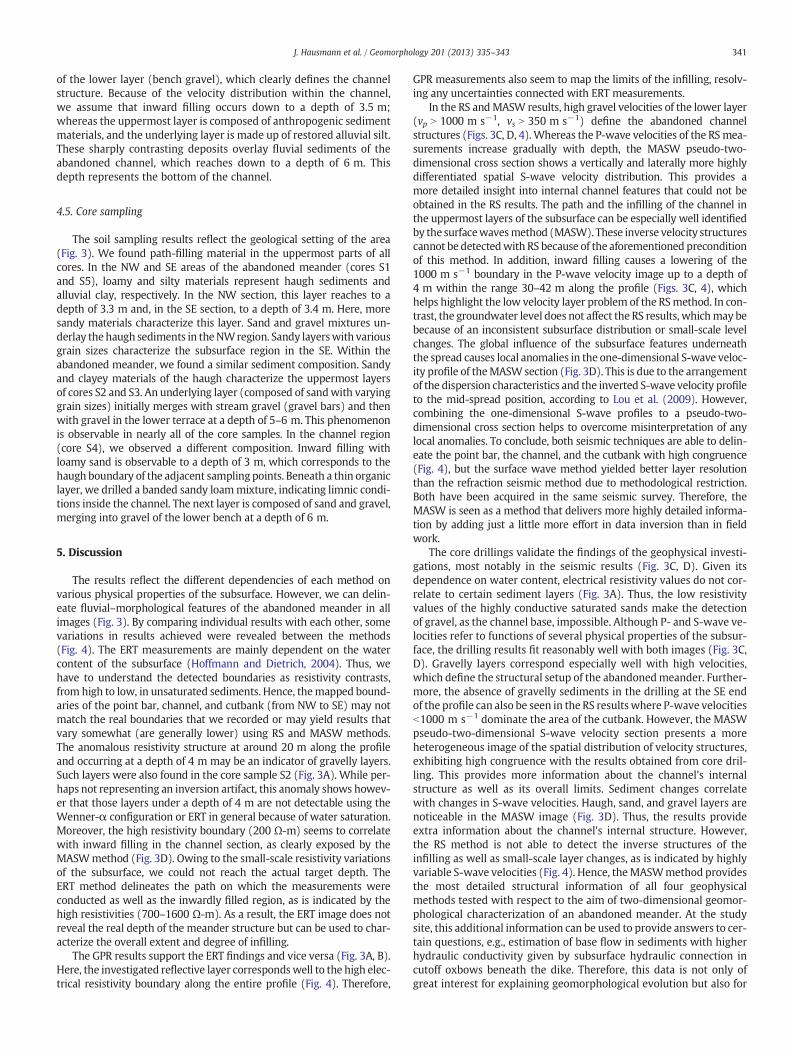
In the RS andMASW results, high gravel velocities of the lower layer(vp N 1000 m s−1, vs N 350 m s−1) define the abandoned channelstructures (Figs. 3C, D, 4). Whereas the P-wave velocities of the RSmea-surements increase gradually with depth, the MASW pseudo-two-dimensional cross section shows a vertically and laterally more highlydifferentiated spatial S-wave velocity distribution. This provides amore detailed insight into internal channel features that could not beobtained in the RS results. The path and the infilling of the channel inthe uppermost layers of the subsurface can be especially well identifiedby the surfacewavesmethod (MASW). These inverse velocity structurescannot be detectedwith RS because of the aforementioned preconditionof this method. In addition, inward filling causes a lowering of the1000 m s−1 boundary in the P-wave velocity image up to a depth of4 m within the range 30–42 m along the profile (Figs. 3C, 4), whichhelps highlight the low velocity layer problem of the RSmethod. In con-trast, the groundwater level does not affect the RS results, whichmay bebecause of an inconsistent subsurface distribution or small-scale levelchanges. The global influence of the subsurface features underneaththe spread causes local anomalies in the one-dimensional S-wave veloc-ity profile of theMASW section (Fig. 3D). This is due to the arrangementof the dispersion characteristics and the inverted S-wave velocity profileto the mid-spread position, according to Lou et al. (2009). However,combining the one-dimensional S-wave profiles to a pseudo-two-dimensional cross section helps to overcome misinterpretation of anylocal anomalies. To conclude, both seismic techniques are able to delin-eate the point bar, the channel, and the cutbank with high congruence(Fig. 4), but the surface wave method yielded better layer resolutionthan the refraction seismic method due to methodological restriction.Both have been acquired in the same seismic survey. Therefore, theMASW is seen as a method that delivers more highly detailed informa-tion by adding just a little more effort in data inversion than in fieldwork.
The core drillings validate the findings of the geophysical investi-gations, most notably in the seismic results (Fig. 3C, D). Given itsdependence on water content, electrical resistivity values do not cor-relate to certain sediment layers (Fig. 3A). Thus, the low resistivityvalues of the highly conductive saturated sands make the detectionof gravel, as the channel base, impossible. Although P- and S-wave ve-locities refer to functions of several physical properties of the subsur-face, the drilling results fit reasonably well with both images (Fig. 3C,D). Gravelly layers correspond especially well with high velocities,which define the structural setup of the abandonedmeander. Further-more, the absence of gravelly sediments in the drilling at the SE endof the profile can also be seen in the RS resultswhere P-wave velocitiesb1000 m s−1 dominate the area of the cutbank. However, the MASWpseudo-two-dimensional S-wave velocity section presents a moreheterogeneous image of the spatial distribution of velocity structures,exhibiting high congruence with the results obtained from core dril-ling. This provides more information about the channel's internalstructure as well as its overall limits. Sediment changes correlatewith changes in S-wave velocities. Haugh, sand, and gravel layers arenoticeable in the MASW image (Fig. 3D). Thus, the results provideextra information about the channel's internal structure. However,the RS method is not able to detect the inverse structures of theinfilling as well as small-scale layer changes, as is indicated by highlyvariable S-wave velocities (Fig. 4). Hence, theMASWmethod providesthe most detailed structural information of all four geophysicalmethods tested with respect to the aim of two-dimensional geomor-phological characterization of an abandoned meander. At the studysite, this additional information can be used to provide answers to cer-tain questions, e.g., estimation of base flow in sediments with higherhydraulic conductivity given by subsurface hydraulic connection incutoff oxbows beneath the dike. Therefore, this data is not only ofgreat interest for explaining geomorphological evolution but also for
Fig. 4. Depth distribution and joint interpretation of the geomorphological structures based on MASW S-wave velocity (vs) in m s−1; also included isoline of refraction seismicP-wave velocity (vp) in m s−1, ERT electrical resistivity (ρ) at ~200 Ω-m, and GPR reflections.
342 J. Hausmann et al. / Geomorphology 201 (2013) 335–343
geotechnical site assessment and for evaluating the impact on the pro-tection capacity of the dike in case of a flood event.
6. Conclusion
In this study,we performed amultimethod investigation of geomor-phological features of an abandoned meander of the River Mulde usingelectrical resistivity tomography (ERT), ground penetrating radar (GPR),refraction seismic (RS), and multichannel analysis of surface waves(MASW). Only by combining thesemethodswere we able to character-ize and delineate all subsurface features of the abandonedmeander, in-cluding a point bar, a channel, a cutbank, and the structure of the infillarea. The comparison of results from each method helps support ourparticular findings concerning the subsurface characteristics of themeander.
Using the same survey line, the results of the ERT and GPR methodsshowed differences compared to seismic methods, especially for depthresolution and imaging of the channel's internal structures. Joint inter-pretation of ERT and GPR data helped solve uncertainties concerningnear-surface structures. Even though both methods did not reach theintended target depth, the shape of the infilling of the abandoned chan-nel could be delineated, providing some spatial information about itslateral and horizontal extent. Low electrical resistivities of the saturatedsands and gravels, the lack of dielectrical contrasts, as well as the insuf-ficient penetration depth of the applied antenna frequency preventedthe detection of deeper subsurface layers using ERT and GPR methods.However, the ERT and GPR images correlated well with the infill struc-turemapped byMASW. The RS andMASWdata revealed a similar trendof high velocities. Via core samplings, we could correlate these high ve-locities with gravelly sediments and validate the findings of the seismicmethods. The RS results were not able to detect inverse velocity layersof the infilling or the path because of methodical limitations. TheMASW results showed a laterally and a vertically more heterogeneousspatial distribution of velocity structures in which the findings fromsonic core sampling fit reasonably well.
Although themeasured physical properties of each technique do notcorrespond to certain materials, a qualitative interpretation of subsur-face features based on combined geophysical methods is a powerfultool for the characterization of geomorphological structures, giventheir noninvasive and time/cost-efficient nature. Any disadvantages ofa single method can be compensated for by using a combined interpre-tation of the different geophysical techniques. Additional information
from core samples is indispensable for validation and classification ofthe results.
We found that MASW in particular delivered extra detailed infor-mation about the channel's internal structure with respect to lateraland vertical resolutions. This significant benefit may advance theuse of this method in geomorphological investigations. Results fromthis method expand upon the data obtained from refraction seismicsurveys without any considerable additional cost, time, or personnelexpenditure. Existing seismic refraction data sets can also be analyzedwith respect to surface waves.
Acknowledgments
The presented study is part of the MuSaWa project (multi-scaleS-wave tomography for exploration and risk assessment of develop-ment sites). Hence, the authors would like to thank the German Minis-try of Education and Research (BMBF) and theGermanResearch Society(DFG) for funding this research (03G0745).Wewould also like to thankthe respective local authorities for permitting access to the study area.
Additional thanks to the co-authors for providing data and ideas, aswell as to the technicians Andreas Schoßland, Helko Kotas, and MarcoPohle for their excellent fieldwork and support. The editor and re-viewers are acknowledged for their constructive comments helping toimprove the manuscript.
References
Anderson, K.B., Spotila, J.A., Hole, J.A., 2003. Application of geomorphic analysis andground-penetrating radar to characterization of paleoseismic sites in dynamic allu-vial environments: an example from southern California. Tectonophysics 368(1–4), 25–32.
Bano, M., Marquis, G., Niviere, B., Maurin, J.C., Cushing, M., 2000. Investigating alluvialand tectonic features with ground-penetrating radar and analyzing diffractionspatterns. Journal of Applied Geophysics 43 (1), 33–41.
Boxberger, T., Picozzi, M., Parolai, S., 2011. Shallow geology characterisation usingRayleigh and Love wave dispersion curves derived from seismic noise array mea-surement. Journal of Applied Geophysics 75, 345–354.
Bridge, J., Collier, R., Alexander, J., 1998. Large-scale structure of Calamus River deposits(Nebraska, USA) revealed using ground-penetrating radar. Sedimentology 45 (6),977–986.
Chambers, J.E., Wilkinson, P.B., Wardrop, D., Hameed, A., Hill, I., Jeffrey, C., Loke, M.H.,Meldrum, P.I., Kuras, O., Cave, M., Gunn, D.A., 2012. Bedrock detection beneathriver terrace deposits using three-dimensional electrical resistivity tomography.Geomorphology 177, 17–25.
Clifford, J., Binley, A., 2010. Geophysical characterization of riverbed hydrostratigraphyusing electrical resistance tomography. Near Surface Geophysics 8 (6), 493–501.
343J. Hausmann et al. / Geomorphology 201 (2013) 335–343
Coulouma, G., Samyn, K., Grandjean, G., Follain, S., Lagacherie, P., 2012. Combining seis-mic and electric methods for predicting bedrock depth along a Mediterranean soiltoposequence. Geoderma 170, 39–47.
Crook, N., Binley, A., Knight, R., Robinson, D.A., Zarnetske, J., Haggerty, R., 2008. Electricalresistivity imaging of the architecture of substream sediments. Water Resources Re-search 44, W00D13.
Dikmen, U., Arisoy, M.Ö., Akkaya, I., 2010. Offset and linear spread geometry in theMASW method. Journal of Geophysics and Engineering 7, 211–222.
Eissmann, L., 1994. Grundzüge der Quartärgeologie Mitteldeutschlands (Sachsen,Sachsen-Anhalt, Südbrandenburg, Thüringen). Altenbg. nat. wiss. Forsch., 7,pp. 55–135.
Froese, D.G., Smith, D.G., Clement, D.T., 2005. Characterizing large river history with shal-low geophysics: Middle Yukon River, Yukon Territory and Alaska. Geomorphology 67(3–4), 391–406.
Geometrics, 2012. SeisImager/SWSurfaceWave Data Analysis Software.www.geometrics.com (05.07.2012).
Gourry, J.C., Vermeersch, F., Garcin, M., Giot, D., 2003. Contribution of geophysics to thestudy of alluvial deposits: a case study in the Val d'Avaray area of the River Loire,France. Journal of Applied Geophysics 54 (1–2), 35–49.
Günther, T., 2005. An Algorithm for Refraction Tomography. Available online at www.resistivity.net (05.07.2012).
Günther, T., Rücker, C., Spitzer, K., 2006. Three-dimensional modelling and inversion ofDC resistivity data incorporating topography — II. Inversion. Geophysical JournalInternational 166, 506–517.
Hoffmann, R., Dietrich, P., 2004. An approach to determine equivalent solutionsto the geoelectrical 2D inversion problem. Journal of Applied Geophysics 56,79–91.
Leven, C., Weiß, H., Vienken, T., Dietrich, P., 2011. Direct-Push-Technologien -Effiziente Untersuchungsmethoden für die Untergrunderkundung. Grundwasser16, 221–234.
Lou, Y., Xia, J., Liu, J., Xu, Y., Liu, Q., 2009. Research on the middle-of-receiver-spread as-sumption of the MASW method. Soil Dynamics and Earthquake Engineering 29,71–79.
Otto, J.C., Sass, O., 2006. Comparing geophysical methods for talus slope investigationsin the Turtmann valley (Swiss Alps). Geomorphology 76, 257–272.
Park, C.B., Shawver, J.B., 2009. MASW survey using multiple source offsets. ExtendedAbstracts, 22nd EEGS Symposium on the Application of Geophysics to Engineeringand Environmental Problems, pp. 639–649.
Park, C.B., Miller, R.D., Xia, J., 1999. Multichannel analysis of surface waves. Geophysics64, 800–808.
Parolai, S., Picozzi, M., Richwalski, S.M., Milkereit, C., 2005. Joint inversion of phase veloc-ity dispersion and H/V ratio curves from seismic noise recordings using a genetic al-gorithm, considering higher modes. Geophysical Research Letters 32, L01303.
Picozzi, M., Parolai, S., Richwalski, S., 2005. Joint inversion of H/V ratios and dispersioncurves from seismic noise: estimating the S-wave velocity of bedrock. GeophysicalResearch Letters 32, L11308.
Pilz, M., Parolai, S., Picozzi, M., Wang, R., Leyton, F., Campos, J., Zschau, J., 2010. Shearwave velocity model of the Santiago de Chile basin derived from ambient noisemeasurements: a comparison of proxies for seismic site conditions and amplifica-tion. Geophysical Journal International 182 (1), 355–367.
Rein, A., Hoffman, R., Dietrich, P., 2004. Influence of natural time-dependent variationsof electrical conductivity on DC resistivity measurements. Journal of Hydrology285, 215–232.
Rücker, C., Günther, T., Spitzer, K., 2006. Three-dimensionalmodelling and inversionofDC re-sistivity data incorporating topography— I. Modelling. Geophysical Journal International166, 495–505.
Sandmeier, K.J., 1999. Reflex, Program for Processing and Interpretation of Reflectionand Transmission Data. Version 6.0. www.sandmeier-geo.de (02.07.2012).
Schrott, L., Sass, O., 2008. Application of field geophysics in geomorphology: advancesand limitations exemplified by case studies. Geomorphology 93, 55–73.
Schrott, L., Hufschmidt, G., Hankammer, M., Hoffmann, T., Dikau, R., 2003. Spatial distri-bution of sediment storage types and quantification of valley fill deposits in analpine basin, Reintal, Bavarian Alps, Germany. Geomorphology 55, 45–63.
Socco, L.V., Jongmans, D., Boiero, D., Stocco, S., Maraschini, M., Tokeshi, K., Hantz, D.,2010. Geophysical investigation of the Sandalp rock avalanche deposits. Journalof Applied Geophysics 70, 277–291.
Van Dam, R., 2012. Landform characterization using geophysics — recent advances, ap-plications, and emerging tools. Geomorphology 137, 57–73.
Vandenberghe, J., van Overmeeren, R.A., 1999. Ground penetrating radar images ofselected fluvial deposits in the Netherlands. Sedimentary Geology 128 (3–4),245–270.
Xia, J., Miller, R.D., Park, C.B., Ivanov, J., 2000. Construction of 2-D vertical shear-wavevelocity field by the multichannel analysis of surface wave technique. In: Powers,M.H., Ibrahim, A.B., Cramer, L., Wynn, J.C. (Eds.), Proceedings of the Symposiumon the Application of Geophysics to Engineering and Environmental Problems(SAGEEP 2000). Environmental and Engineering Geophysical Society, WheatRidge, CO, pp. 1197–1206.
Yamakawa, Y., Kosugi, K., Masaoka, N., Sumida, J., Tani, M., Mizuyama, T., 2012. Combinedgeophysical methods for detecting soil thickness distribution on a weathered granitichillslope. Geomorphology 145–146, 56–69.
Copyright © 2022 FDOKUMEN