Miles de millones ganados con las materias primas - Multiwatch
Upload
worldagroforestryCategory
view
0download
0
Future Meander Bend Migration and Floodplain Development Patterns Near River Miles 200 to 191 of the Sacramento River Phase III Report
- 1 -
FUTURE MEANDER BEND MIGRATION AND FLOODPLAIN DEVELOPMENT
PATTERNS NEAR RIVER MILES 200 TO 191 OF
THE SACRAMENTO RIVER PHASE III REPORT
Eric W. Larsen
REPORT FOR DUCKS UNLIMITED March 31, 2006

Future Meander Bend Migration and Floodplain Development Patterns Near River Miles 200 to 191 of the Sacramento River Phase III Report
- 2 -
Contents Executive summary..................................................................................................................... 4
1.0 Introduction.......................................................................................................................... 5
2.0 Existing Conditions.............................................................................................................. 6
2.1 Site Description................................................................................................................ 6 2.2 2004 channel alignment ................................................................................................... 7
3.0 Future Predictions ................................................................................................................ 8
3.1 Introduction...................................................................................................................... 8 3.2 Methods............................................................................................................................ 8 3.3 Prediction Results ............................................................................................................ 9
3.3.1 Area Reworked ....................................................................................................... 10 3.4 Summary of modeled scenarios ..................................................................................... 11
3.4.0 Calibration................................................................................................................ 12 3.4.1 Scenario 1: Simulation 2004-2054 with current conditions and no simulated groins........................................................................................................................................... 13 3.4.2 Scenario 2: Simulation 2004-2054 with current conditions and simulated groins .. 14 3.4.3 Scenario 3: Simulation 2004-2054 with restraint removed at Park and no simulated groins................................................................................................................................. 15 3.4.4 Scenario 4: Simulation 2004-2054 with restraint removed at Park and simulated groins................................................................................................................................. 16 3.4.5 Scenario 5: Simulation 2004-2054 with current conditions and simulated extended groins................................................................................................................................. 17
4.0 Discussion..................................................................................................................... 18
4.1 Comparison with previous study .................................................................................... 18 4.2 Discussion of current results........................................................................................... 19 4.3 Rate of area reworked ..................................................................................................... 21 4.4 Migration rate.................................................................................................................. 22 4.5 Extended bank restraint to simulate extended groins ..................................................... 23 4.6 Extended bank restraint at the State Park Site ................................................................ 24
5.0 References.......................................................................................................................... 25

Future Meander Bend Migration and Floodplain Development Patterns Near River Miles 200 to 191 of the Sacramento River Phase III Report
- 3 -
List of Figures
Figure 1 Location of the Sacramento River and the study reach.................................................... 6
Figure 2 Study reach with the locations of the existing bank restraints, the 1997 and 2004 channel centerlines, and the pump location .................................................................................... 7
Figure 3 GIS geology and vegetation layer. (CDWR, 1995; UCD LASR lab.) ............................. 8
Figure 4 Example of area reworked graph (Bend 5)..................................................................... 10
Figure 5 Bend delineations ........................................................................................................... 11
Figure 6 Calibration ...................................................................................................................... 12
Figure 7 Scenario 1: 50-year simulated migration with current conditions and no simulated groins............................................................................................................................................. 13
Figure 8 Scenario 2: Simulation 2004-2054 with current conditions and simulated groins......... 14
Figure 9 Scenario 3: Simulation 2004-2054 with restraint removed at Park and no simulated groins............................................................................................................................................. 15
Figure 10 Scenario 4: Simulation 2004-2054 with restraint removed at Park and simulated groins............................................................................................................................................. 16
Figure 11 Scenario 5: Simulation 2004-2054 with current conditions and simulated extended groins............................................................................................................................................. 17
Figure 12 Comparison between current study results and 2005 study results.............................. 18
Figure 13 Images of all scenarios compared................................................................................. 20
Figure 14 Rate of area reworked for each bend by scenario......................................................... 21
Figure 15 Summary of migration rate for scenarios 1-5............................................................... 22
Figure 16 Area reworked with scenarios 1, 2, and 5 near and downstream from the pump ........ 23
List of Tables
Table 1 Definition of simulations ................................................................................................... 9
Table 2 Bend lengths .................................................................................................................... 23

Future Meander Bend Migration and Floodplain Development Patterns Near River Miles 200 to 191 of the Sacramento River Phase III Report
- 4 -
Executive summary
The issue being investigated This report describes analyses to study the meander migration patterns 50 years into the future near River Miles 200 to 191 of the Sacramento River. Previous studies have been done at this location to document the channel dynamics near the location of the M&T pumping plant (Larsen and Cui 2004; Larsen 2005). The current report describes work that extends the previous work. The previous studies analyzed the meander migration dynamics 50 years into the future starting with a channel location in 1997 and reported migration tendencies with a simulation of proposed groins in place. The work described in the current report developed and used new data, consisting of a 2004 channel centerline, and also simulated migration for 50 years into the future with and without simulation of the placement of groins proposed in 2005. An additional scenario (Scenario 5) shows the patterns of migration with the placement of an additional groin (called extended groins in this report) near the pump. In addition, simulations were performed with bank restraint removed near the location of the State Park upstream from the M&T pump site. The methods and model used and key assumptions The details of modeling techniques, the background on the meander migration model, and key assumptions are not repeated in this report and can be found in previous reports (Larsen and Cui 2004; Larsen 2005). In this report, the current calibration of the model, and five modeling scenarios, are described. Results For each of the five scenarios, maps were produced that show the migration patterns 50 years into the future, with channel locations at 5-yr increments. Graphs of rate of land reworked were also produced for each scenario at each bend. The patterns of land reworked were similar for scenarios 1 and 2. Simulations 3 and 4 show that there is significant area of land reworked at the State Park site, if the existing bank restraint near the Park is removed. Scenario 5 shows the pattern of land reworked with the extended groin scenario. Conclusions regarding the issues at the M&T pumps 1. Simulations 1 and 2 suggest that, with the eight dyke groin field, there will be continued
pressure on the west bank near the pumping plant site. The flow patterns due to meander-bend-scale channel curvature and planform shape suggest that the forces will continue to be on the west bank, and may lead to continued pressure to erode downstream of the placement of the original eight dyke groin field.
2. Simulations 1 (with no groins), 2 (eight dyke groin field), and 5 (nine dyke groin field), which show the channel migration, suggest that the placement of groins has little effect on the pattern or rate of meander-bend-scale migration of the bend downstream.
3. The meander modeling does not consider local affects of concentrated flows that may occur in the vicinity of the dykes as a result of the dyke configuration.

Future Meander Bend Migration and Floodplain Development Patterns Near River Miles 200 to 191 of the Sacramento River Phase III Report
- 5 -
1.0 Introduction
This report describes analyses to study the meander migration patterns 50 years into the future of the Sacramento River near River Miles 200 to 191. Previous studies have been done at this location to document the channel dynamics near the location of the M&T pumping plant (Larsen and Cui 2004; Larsen 2005). The current report describes work that extends the previous work. The previous studies analyzed the meander migration dynamics 50 years into the future starting with a channel location in 1997 (using data existing at that time) and reported migration tendencies with a simulation of proposed groins in place (an eight dyke groin field). The work reported in the current report developed and used new data, consisting of a 2004 channel centerline, and also simulated migration for 50 years into the future with and without simulation of the placement of the eight dyke groin field, and with a newly proposed nine dyke groin field. Simulation of future meander migration shows tendencies of the river dynamics at the scale of approximately a meander bend or meander wavelength. Mathematical modeling of geomorphic processes such as meander migration can provide information about tendencies; although such modeling can be accurate in predicting migration patterns, simulations are not expected to produce precise point-by-point predictions of future channel locations. For this reason, analyses results show patterns at the scale of one or two meander bends, and can best be used in combination with other information about site-specific dynamics. For example, near the location of the M&T pumping plant, the formation of a large sand and gravel bar is an important consideration that should be considered in combination with the meander migration tendencies. Scenario number one simulates meander migration with a variable erosion field, and simulates the meander migration patterns from the 2004 river planform to 50 years in the future. This, and the other simulation scenarios, include calibration and use a spatially variable erosion field. Scenario number two simulates the meander migration patterns with a simulated eight dyke groin field placed near the pump site, as proposed by Mussetter Engineering. Scenario numbers three and four simulate meander migration with removed bank restraints at the State Park site. This includes calibration, and modeling with (number 3) and without (number 4), the simulated groin placement near the pumping plant. Scenario number five simulates migration patterns with a nine dyke groin field.

Future Meander Bend Migration and Floodplain Development Patterns Near River Miles 200 to 191 of the Sacramento River Phase III Report
- 6 -
Figure 1 Location of the Sacramento River and the study reach.
2.0 Existing Conditions
2.1 Site Description The M&T pump site at about RM 192.75 is located on the upper Sacramento River, about 50 river miles south of Red Bluff, and about 150 river miles north of Sacramento. In most naturally migrating rivers, local meander migration is related to the shape of the local meander bend and to the shape of the river upstream (Johannesson and Parker 1985, 1989, Furbish 1991). To consider the local migration at the M&T site (RM 192.75), this report looks at a longer reach that includes a section of river upstream and downstream from the site, namely, from above Pine Creek (about RM 196) to below Golden State Island bend (about RM 191) (Figure 1). This reach, like much of the river between Colusa (RM 143) and Red Bluff (RM 243), contains some areas having a moderate amount of bank constraint where the river does not move, some areas that are migrating and evolving in relation to the bank constraint, and some areas that are evolving freely.

Future Meander Bend Migration and Floodplain Development Patterns Near River Miles 200 to 191 of the Sacramento River Phase III Report
- 7 -
Figure 2 shows the study reach with the locations of the existing bank restraints, the 1997 and 2004 centerlines, and the pump location. Areas that are black indicate areas that are erosion resistant. The existing restraints on channel migration (riprap) are shown as large black areas adjacent to the river. As the river continues to evolve, the unconstrained sections of the channel will tend to migrate and the constrained areas will migrate in a limited way according to their constraints. In some areas the river is “sliding along” the extreme eastern edge of the historic meander belt. This eastern edge of the meander belt zone has functioned as a geologic control and is shown in black in Figure 2. Because this area has been naturally resistant to erosion, the river in this vicinity has for the most part effectively “flattened out” maintaining contact with the geologic control.
2.2 2004 channel alignment In the previous modeling, the simulations commenced from a 1997 channel centerline, which was taken from data existing at the time of previous reports. For the current analyses, a new channel centerline was developed and used. Aerial photographs of the channel were used to digitize the banklines. From the digitized banklines, a channel centerline was determined. Figure 2 shows a comparison of the 1997 (dashed line) and 2004 centerlines (the solid line). Channel alignments are represented by the centerline of the channel, a line drawn approximately halfway between the banklines on an aerial photo.
Figure 2 Study reach with the locations of the existing bank restraints, the 1997 and 2004 channel centerlines, and the pump location
----- 1997 2004 Pump

Future Meander Bend Migration and Floodplain Development Patterns Near River Miles 200 to 191 of the Sacramento River Phase III Report
- 8 -
3.0 Future Predictions
3.1 Introduction Unconstrained meander bends tend to migrate naturally across the landscape (Brice 1977, Hooke 1984). Bend migration tends to follow patterns that can be described by mechanical laws of fluid flow and by other methods (Brice 1974, Ikeda et al. 1981, Hooke 1984). When such meander bend migration occurs, an individual bend tends to move, unless constrained, both downstream and cross-stream. In other words, while a bend will tend to migrate continuously downstream, at the same time, because of the cross-stream component of migration, it will tend to migrate cross-stream. As the bend migrates, it also changes shape.
One approach to understanding the future channel movement in the vicinity of the pump site is to model the future migration. As a recent report did for a reach of the river near the pump site (Larsen 2005), this report describes simulated channel migration using a channel migration model that is based on mathematical algorithms of physics-based relationships for flow and sediment transport – the main physical processes responsible for channel migration. Because the model is based on physical processes, it can predict the consequences of conditions, such as bank stabilization measures that have not existed in the past.
3.2 Methods Heterogeneous Erodibility Surface A spatial erodibility surface was developed from GIS data by using a geology layer and a vegetation layer (Figure 3). The geology surface dataset was obtained from the California Department of Water Resources (CDWR 1995). The vegetation coverage is based on a data set from the LASR lab at UC Davis. All geology surface types were assumed to be erodible, except for Qr (Riverbank formation shown in black), Qm (Modesto formation shown in black), and Qoc (Old channel deposits also shown in black) which represent non-erodible areas based on their soil properties, sometimes called areas of geologic constraint. The lighter and darker shadings show agricultural land and forest land respectively. The agricultural land was calibrated to erode roughly twice as fast as forest land. The dataset was converted to a 30 m grid based on erodibility potential. A map representing how certain land use areas erode at different rates was derived from this GIS
dataset. This erodibility surface was used as the basis for the calibration and the different
Figure 3 GIS geology and vegetation layer. (CDWR, 1995; UCD LASR lab.)

Future Meander Bend Migration and Floodplain Development Patterns Near River Miles 200 to 191 of the Sacramento River Phase III Report
- 9 -
simulation scenarios. It was on this basic underlying erosion grid that the bank restraints shown in figure 2 were placed. In addition, the erosion was modified slightly during the calibration of the model for migration from 1980 to 2004 (the calibration period for the current modeling scenarios). Migration Modeling Following the procedures presented in the previous reports, Meander Bend and Gravel Bar Migration Near River Mile 192.75 of the Sacramento River (Larsen et al. 2004), and Future Meander Bend Migration And Floodplain Development Patterns Near River Miles 200 To 191 Of the Sacramento River (Larsen 2005), the model was calibrated for the study reach. A new calibration was done from 1980 to 2004 using the information from the new centerline.
3.3 Prediction Results Based on the input values for the hydraulic variables used in the previous study and the calibrated bank erosion values developed in the new calibration using the 2004 centerline, four predictions 50 years into the future were made. The first scenario predicted future channel movement with existing conditions, while the other scenarios predicted movement if different combinations of channel conditions were assumed.
Table 1 Definition of simulations
Scenario number
Simulated groins near pump site
Years Comments
None 1980-2004 Calibration
n1 None 2004-2054 Current conditions
n2 8 dyke groin field in place 2004-2054 Current conditions
except for groins
n3 None 2004-2054 Removed bank restraints at the State Park site
n4 8 dyke groin field in place 2004-2054 Removed bank restraints
at the State Park site
n5 Extended groins in
place 2004-2054
Current conditions except for extended
groins
Future Meander Bend Migration and Floodplain Development Patterns Near River Miles 200 to 191 of the Sacramento River Phase III Report
- 10 -
For analysis purposes, the reach was divided into discrete bend numbers 1 through 6 (Figure 4). Bend 4 is near the State Park Area. Bend 5 near the site of the M&T pump. “Bend 6” is actually a series of two bends that are best analyzed as a single unit.
3.3.1 Area Reworked For each channel migration scenario, the area of floodplain reworked by simulated migration was calculated. Newly reworked floodplain (land eroded on one bank and subsequently deposited along the other) plays an important ecological role in allowing the colonization of early-seral riparian vegetation communities. This calculation of area reworked suggests how different channel migration scenarios might affect future riparian forest development in the vicinity of the pumping plant. For the area reworked at an individual site, the time history of area reworked is presented. For example, the graph for Bend 5 in Figure 4 shows the area reworked in hectares (ha) in five-year time increments at the location of Bend 5 for scenarios 1-4. The lines in the graph show the pattern of land reworked through time for 50 years into the future with the different scenarios represented by different lines. This graph shows for a duration of 50 years, the rate of land reworked per year in each year. The area reworked is considered in the discussion. In this report, the metric system is used. One meter is 3.28 feet. One hectare (100 meters by 100 meters) is 2.47 acres.
Bend 5
0.00
0.10
0.20
0.30
0.40
0.50
0.60
0.70
0.80
5045403530252015105
Time (years)
Are
a re
wor
ked
per y
ear
(ha/
year
)
Scen 1Scen 2Scen 3Scen 4Scen 5
Figure 4 Example of area reworked graph (Bend 5)

Future Meander Bend Migration and Floodplain Development Patterns Near River Miles 200 to 191 of the Sacramento River Phase III Report
- 11 -
3.4 Summary of modeled scenarios Six main areas of focus were used for modeling. Bend 1 is the most northern area, near Pine Creek. Bend 4 is located near the State Park site. Bend 5 is near and downstream from the M&T pump site. “Bend 6” consists of two bends that are best analyzed as a single unit.
Figure 5 Bend delineations
1
2
3
4
5
6

Future Meander Bend Migration and Floodplain Development Patterns Near River Miles 200 to 191 of the Sacramento River Phase III Report
- 12 -
3.4.0 Calibration Starting with the observed 1980 and 2004 channel centerlines, calibration was done as described in a previous report (Larsen and Cui, 2004). There are recent developments of channel migration near bend 1 (Moroney, pers. com. 2006) that have not been considered in this report. In addition, calibration of bend 2 could be improved with recently available information (Henderson, pers. com. 2006). Because more precise calibration at these bends would not significantly affect the results near the pump site, further calibration was not done. In addition, alterations to the 2-yr flow estimate (Harvey, pers. com. 2006) were not used and results are not expected to significantly differ if a slightly altered discharge were used to calibrate and run the model. The following hydraulic input parameters (typifying hydraulic conditions at a 2-yr flow) were used.
• Discharge: 2265 cms (80,000 cfs) • Slope: 0.00042 m/m • Top width: 235 m (770 ft) • Average depth: 5.4 m (18 ft)
The light solid line is the 1980 observed channel centerline; the bold solid line is the 2004 observed channel centerline; the dashed line is the 2004 modeled channel centerline. The agreement between the observed and simulated 2004 channel is good in the vicinity of and immediately upstream of the M&T pumping plant site. These are the key places for calibration agreement in order to simulate future migration as it might affect the river near the pumping plant. Agreement in other areas is reasonable.
Figure 6 Calibration
1980 obs. 2004 obs. 2004 mod.

Future Meander Bend Migration and Floodplain Development Patterns Near River Miles 200 to 191 of the Sacramento River Phase III Report
- 13 -
3.4.1 Scenario 1: Simulation 2004-2054 with current conditions and no simulated groins Figure 7 shows the channel location with 50 years of simulated migration using the input parameters that were used for the calibration, and simulated from 2004 to 2054 with current conditions and no simulated groins in place. Migration patterns at each bend are shown with a single line used to represent a five - year increment of migration. The dashed line represents the channel location at the beginning of the simulation (2004).
Figure 7 Scenario 1: 50-year simulated migration with current conditions and no simulated groins

Future Meander Bend Migration and Floodplain Development Patterns Near River Miles 200 to 191 of the Sacramento River Phase III Report
- 14 -
3.4.2 Scenario 2: Simulation 2004-2054 with current conditions and simulated groins Figure 8 shows the channel location after 50 years of predicted migration 2004-2054 with current conditions and a simulated eight dyke groin field in place
Migration patterns at each bend are shown with a single line used to represent a five - year increment of migration. The dashed line represents the channel location at the beginning of the simulation (2004).
The simulations without simulated groins (Scenario 1) and with simulated groins (Scenario 2) show very similar migration patterns. This is discussed in the discussion section below.
Figure 8 Scenario 2: Simulation 2004-2054 with current conditions and simulated groins
Future Meander Bend Migration and Floodplain Development Patterns Near River Miles 200 to 191 of the Sacramento River Phase III Report
- 15 -
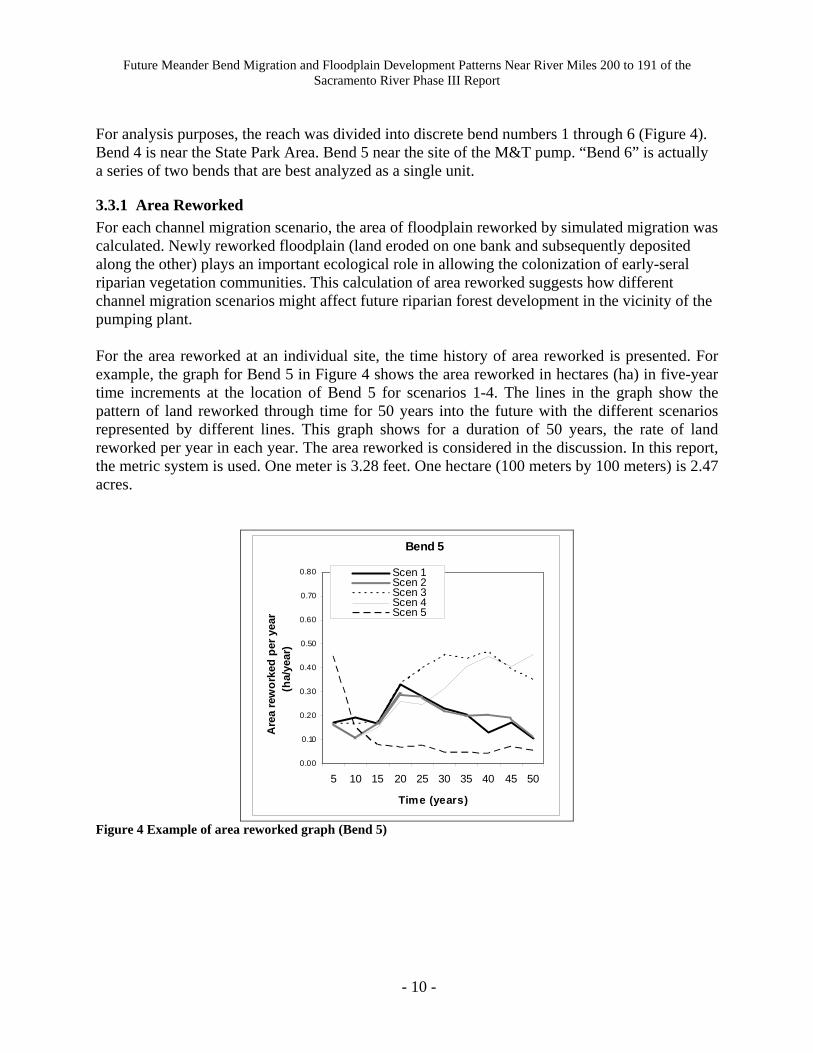
3.4.3 Scenario 3: Simulation 2004-2054 with restraint removed at Park and no simulated groins Figure 9 shows the channel location after 50 years of predicted migration with restraint removed at the State Park site and no simulated groins. With the removal of bank restraint near the State Park area, the 50-year prediction for the areas near the Park and near the pump suggests that the channel will migrate more than it would in the previous two scenarios. .
Figure 9 Scenario 3: Simulation 2004-2054 with restraint removed at Park and no simulated groins

Future Meander Bend Migration and Floodplain Development Patterns Near River Miles 200 to 191 of the Sacramento River Phase III Report
- 16 -
3.4.4 Scenario 4: Simulation 2004-2054 with restraint removed at Park and simulated groins Figure 10 shows the channel location after 50 years of predicted migration with restraint removed at Park and with simulated groins. With the removal of bank restraint near the State Park area and simulated groins, the 50-year prediction for the areas near the Park and near the pump are very similar to the patterns without the groins in place (Scenario 3).
Figure 10 Scenario 4: Simulation 2004-2054 with restraint removed at Park and simulated groins

Future Meander Bend Migration and Floodplain Development Patterns Near River Miles 200 to 191 of the Sacramento River Phase III Report
- 17 -
3.4.5 Scenario 5: Simulation 2004-2054 with current conditions and simulated extended groins Figure 11 shows the channel location after 50 years of predicted migration 2004-2054 with current conditions and simulated groins in place and extended downstream to simulate the placement of a ninth groin (Mussetter, 2006).
Migration patterns at each bend are shown with a single line used to represent a five - year increment of migration. The dashed line represents the channel location at the beginning of the simulation (2004).
Figure 11 Scenario 5: Simulation 2004-2054 with current conditions and simulated extended groins

Future Meander Bend Migration and Floodplain Development Patterns Near River Miles 200 to 191 of the Sacramento River Phase III Report
- 18 -
4.0 Discussion
4.1 Comparison with previous study Simulation of the groins near the M&T pump site was done using the same simulated groin placement that was used in the previous study (Larsen 2005; figure 12). The main differences in the two studies are that the modeling was done from 2004 to 2054 in the current study (and from 1997 to 2047 in the previous study) and that the new runs (reported in the current report) were recalibrated with the new data. Erosion fields were calibrated slightly differently for the new modeling, providing a closer fit between the observed 2004 channel location and the simulated 2004 channel location. In the current study, the channel was calibrated to have a greater erosion rate near and downstream from the pump site. The comparison of predictions of 1997-2047 and those of 2004-2054 shows that future migration patterns reflect the change in the erosion field, with greater simulated migration occurring near and downstream from the pump site in the current (2004-2054) simulation modeling.
Scenario 2 Current study 2004-2054 Scenario 2 Larsen 2005 study 1997-2047 Figure 12 Comparison between current study results and 2005 study results

Future Meander Bend Migration and Floodplain Development Patterns Near River Miles 200 to 191 of the Sacramento River Phase III Report
- 19 -
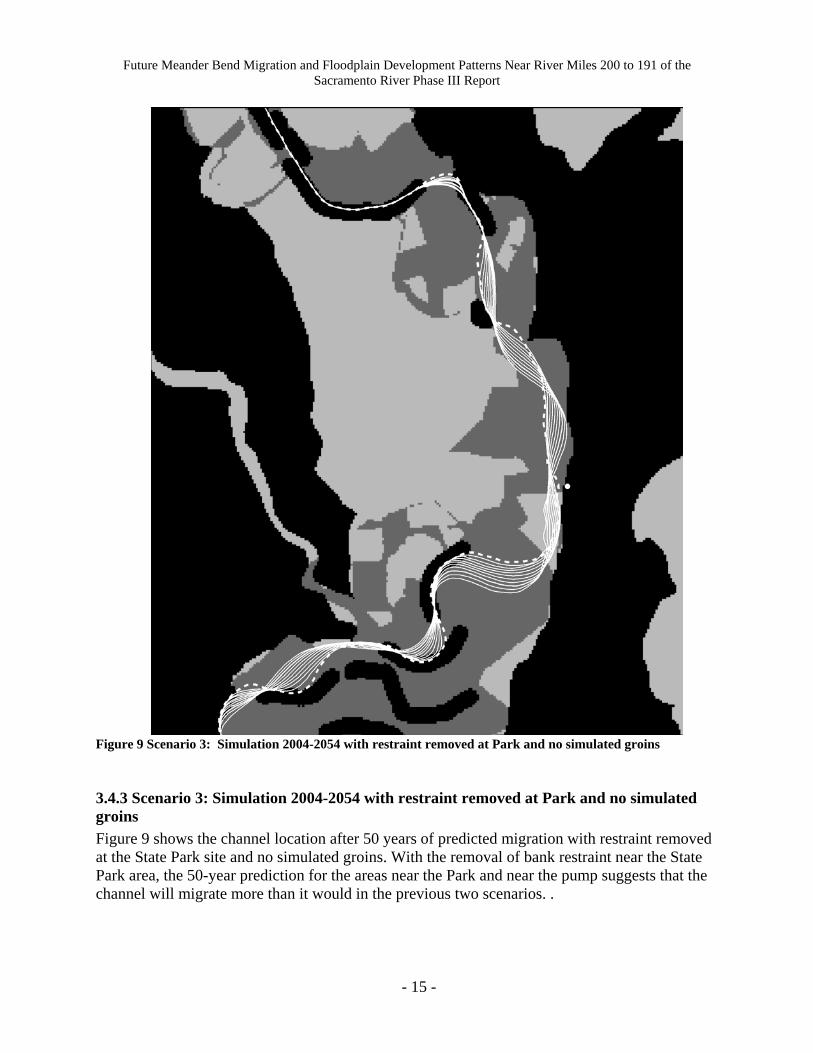
4.2 Discussion of current results The modeling in the current study shows that the migration patterns are not significantly different for the simulation with the groins in place and without the groins in place (compare scenario 1 with scenario 2; and compare scenario 3 with 4 in figure 12 below). In practice, groin placement could be designed that would limit migration at the pump site (Pers.comm. Mussetter Engineering 2005). Subsequent to the modeling of scenarios 1-4, an additional scenario was modeled (scenario 5) to simulate the placement of an additional groin that would limit the movement suggested in scenarios 1 and 2. What the meander migration modeling shows, using the same placement of simulated groins as in the previous study, is that the tendencies of the migration patterns are for the west bank to continue to move westward. The simulations show the migration occurring downstream from the end of the groins. This is the tendency of the meander migration pattern, independent of other measures like dredging or bar excavation. The migration simulation is most effectively used to consider the forces due to one aspect of the river dynamics – the dynamics of flow and bank erosion patterns resulting from the flow patterns due to channel curvature and planform shape. Figure 13 gives a summary of the graphs previously shown separately for each scenario. The migration patterns are very similar for all the scenarios, except for the migration in Bends 4 and 5 when the constraints near the State Park are removed (scenarios 3 and 4).
Future Meander Bend Migration and Floodplain Development Patterns Near River Miles 200 to 191 of the Sacramento River Phase III Report
- 20 -
Figure 13 Images of all scenarios compared
Scenario 1 Scenario 2 Scenario 3
Scenario 4 Scenario 5

Future Meander Bend Migration and Floodplain Development Patterns Near River Miles 200 to 191 of the Sacramento River Phase III Report
- 21 -
4.3 Rate of area reworked The rate of area reworked by a single bend gives some indication of the dynamism of the area due to natural meander migration, and in other studies has been used to reflect the ecosystem benefits of natural meandering. Figure 13 shows graphs of the rate of area reworked in each bend segment over time. On each graph, the rates are shown for scenarios 1-5. (Note that the scale for the y-axis for bend 6 differs significantly from the others.) Figure 14 Rate of area reworked for each bend by scenario
Bend 1
0.00
0.10
0.20
0.30
0.40
0.50
0.60
0.70
0.80
5045403530252015105
Time (years)
Are
a re
wor
ked
per y
ear
(ha/
year
)
Scen 1Scen 2Scen 3Scen 4Scen 5
Bend 2
0.00
0.10
0.20
0.30
0.40
0.50
0.60
0.70
0.80
5045403530252015105
Time (years)
Are
a re
wor
ked
per y
ear
(ha/
year
)
Scen 1Scen 2Scen 3Scen 4Scen 5
Bend 3
0.00
0.10
0.20
0.30
0.40
0.50
0.60
0.70
0.80
5045403530252015105
Time (years)
Are
a re
wor
ked
per y
ear
(ha/
year
)
Scen 1Scen 2Scen 3Scen 4Scen 5
Bend 4
0.00
0.10
0.20
0.30
0.40
0.50
0.60
0.70
0.80
5045403530252015105
Time (years)
Are
a re
wor
ked
per y
ear
(ha/
year
)
Scen 1Scen 2Scen 3Scen 4Scen 5
Bend 5
0.00
0.10
0.20
0.30
0.40
0.50
0.60
0.70
0.80
5045403530252015105
Time (years)
Are
a re
wor
ked
per y
ear
(ha/
year
)
Scen 1Scen 2Scen 3Scen 4Scen 5
Bend 6
0.00
0.20
0.40
0.60
0.80
1.00
1.20
1.40
1.60
1.80
2.00
5045403530252015105
Time (years)
Are
a re
wor
ked
per y
ear
(ha/
year
)
Scen 1Scen 2Scen 3Scen 4Scen 5

Future Meander Bend Migration and Floodplain Development Patterns Near River Miles 200 to 191 of the Sacramento River Phase III Memo – Internal Draft
- 22 -
For bends 1, 2, 3, and 6, there is very little difference in the rate of land reworked over time in any of the scenarios. For scenarios 3 and 4, at bends 4 and 5, the differences in rate of area reworked are distinct. This is due to the modeling of allowing unconstrained migration into the State Park area when removing bank constraint was simulated. For scenario 5, the migration is limited in bends 4 and 5.
4.4 Migration rate
Figure 15 Summary of migration rate for scenarios 1-5
Scenario 1
0.0
1.0
2.0
3.0
4.0
5.0
6.0
7.0
5045403530252015105Time (years)
Ave
rage
mig
ratio
n ra
te(m
/yea
r)
1 23 45 6
Scenario 2
0.0
1.0
2.0
3.0
4.0
5.0
6.0
7.0
5045403530252015105
Time (years)
Ave
rage
mig
ratio
n ra
te(m
/yea
r)
1 23 45 6
Scenario 3
0.0
1.0
2.0
3.0
4.0
5.0
6.0
7.0
5045403530252015105
Time (years)
Ave
rage
mig
ratio
n ra
te(m
/yea
r)
1 23 45 6
Scenario 4
0.0
1.0
2.0
3.0
4.0
5.0
6.0
7.0
5045403530252015105
Time (years)
Ave
rage
mig
ratio
n ra
te(m
/yea
r)
1 23 45 6
Scenario 5
0.0
1.0
2.0
3.0
4.0
5.0
6.0
7.0
5045403530252015105
Time (years)
Ave
rage
mig
ratio
n ra
te(m
/yea
r)
1 23 45 6
Future Meander Bend Migration and Floodplain Development Patterns Near River Miles 200 to 191 of the Sacramento River Phase III Memo – Internal Draft
- 23 -
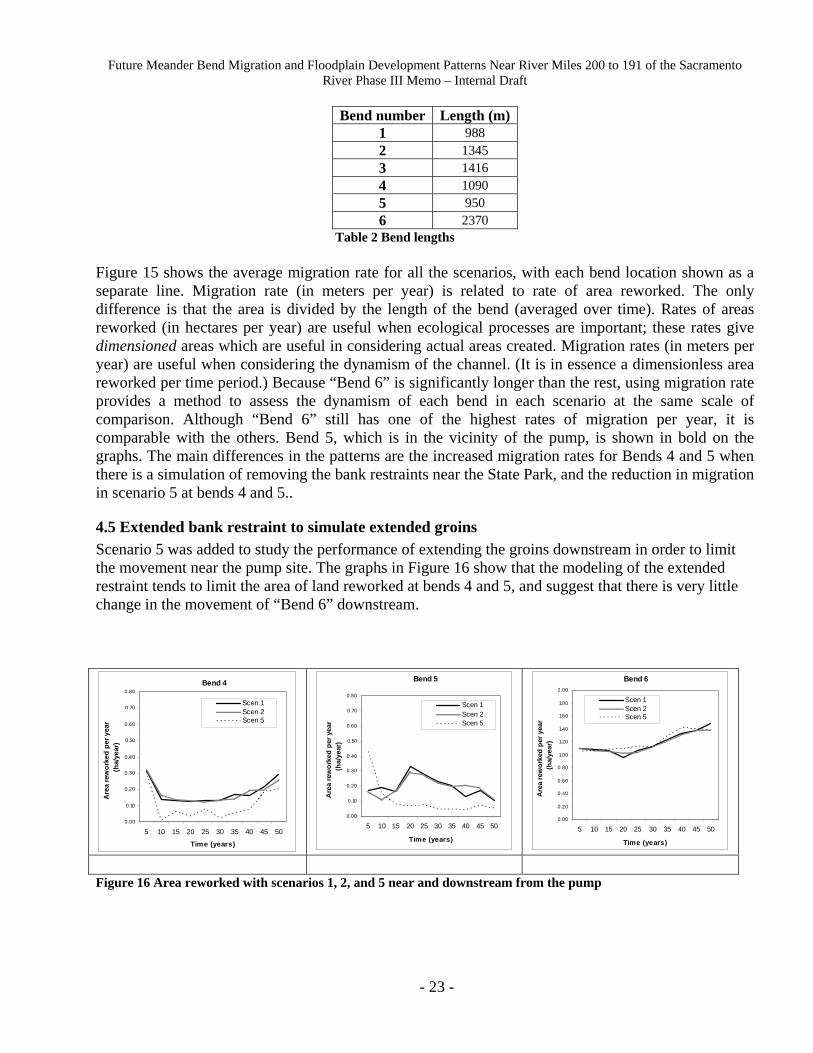
Bend number Length (m)1 988 2 1345 3 1416 4 1090 5 950 6 2370
Table 2 Bend lengths Figure 15 shows the average migration rate for all the scenarios, with each bend location shown as a separate line. Migration rate (in meters per year) is related to rate of area reworked. The only difference is that the area is divided by the length of the bend (averaged over time). Rates of areas reworked (in hectares per year) are useful when ecological processes are important; these rates give dimensioned areas which are useful in considering actual areas created. Migration rates (in meters per year) are useful when considering the dynamism of the channel. (It is in essence a dimensionless area reworked per time period.) Because “Bend 6” is significantly longer than the rest, using migration rate provides a method to assess the dynamism of each bend in each scenario at the same scale of comparison. Although “Bend 6” still has one of the highest rates of migration per year, it is comparable with the others. Bend 5, which is in the vicinity of the pump, is shown in bold on the graphs. The main differences in the patterns are the increased migration rates for Bends 4 and 5 when there is a simulation of removing the bank restraints near the State Park, and the reduction in migration in scenario 5 at bends 4 and 5..
4.5 Extended bank restraint to simulate extended groins Scenario 5 was added to study the performance of extending the groins downstream in order to limit the movement near the pump site. The graphs in Figure 16 show that the modeling of the extended restraint tends to limit the area of land reworked at bends 4 and 5, and suggest that there is very little change in the movement of “Bend 6” downstream.
Bend 4
0.00
0.10
0.20
0.30
0.40
0.50
0.60
0.70
0.80
5045403530252015105
Time (years)
Are
a re
wor
ked
per y
ear
(ha/
year
)
Scen 1Scen 2Scen 5
Bend 5
0.00
0.10
0.20
0.30
0.40
0.50
0.60
0.70
0.80
5045403530252015105
Time (years)
Are
a re
wor
ked
per y
ear
(ha/
year
)
Scen 1Scen 2Scen 5
Bend 6
0.00
0.20
0.40
0.60
0.80
1.00
1.20
1.40
1.60
1.80
2.00
5045403530252015105
Time (years)
Are
a re
wor
ked
per y
ear
(ha/
year
)
Scen 1Scen 2Scen 5
Figure 16 Area reworked with scenarios 1, 2, and 5 near and downstream from the pump

Future Meander Bend Migration and Floodplain Development Patterns Near River Miles 200 to 191 of the Sacramento River Phase III Memo – Internal Draft
- 24 -
4.6 Extended bank restraint at the State Park Site An estimate was made of the future channel migration pattern (from the 2004 channel centerline) considering the design of the extended bank restraint at the State Park site. In coordination with Mussetter Engineering (pers. comm. Mike Harvey, 2006) potential designs for additional bank restraint at the State park site were considered to be an extension of the existing rock revetment at the site. Modeling of this small scale change in area of bank restraint was smaller than the scale of modeling in the meander migration model; therefore modeling of extended restraint at the State Park site was not done.

Future Meander Bend Migration and Floodplain Development Patterns Near River Miles 200 to 191 of the Sacramento River Phase III Memo – Internal Draft
- 25 -
5.0 References Brice, J. C. 1974. Evolution of Meander Loops. Geological Society of America Bulletin 85:581-586. Brice, J. C. 1977. Lateral migration of the middle Sacramento River, California. USGS Water-
resources investigations 77-43:1-51. CDWR. 1995. Memorandum Report: Sacramento River Meander Belt Future Erosion Investigation.
The Resources Agency, California Department of Water Resources, Sacramento, California. Furbish, D. J. 1991. Spatial autoregressive structure in meander evolution. Geological Society of
America Bulletin 103:1576-1589. Harvey, Mike. 2006. Mussetter Engineering. Personal communication. Henderson, A. 2006. Personal communication. Hooke, J. M. 1984. Changes in river meanders: A review of techniques and results of analysis.
Progress in Physical Geography 8:473-508. Ikeda, S., G. Parker, and K. Sawai. 1981. Bend Theory of River Meanders. Part 1. Linear
development. Journal of Fluid Mechanics 112:363-377. Johannesson, H., and G. Parker. 1985. Computer Simulated migration of meandering rivers in
Minnesota. Report for the Minnesota Department of Transportation. Minneapolis, Minnesota. Johannesson, H., and G. Parker. 1989. Linear theory of river meanders. in S. Ikeda and G. Parker,
editors. River Meandering. American Geophysical Union, Washington, D.C. Larsen, E. W., 2005. Meander Bend Migration and Floodplain Development Patterns near River Miles
200 to 191 of the Sacramento River. Report for Duck's Unlimited. Larsen, E. W., and Y. Cui, 2004. Meander Bend and Gravel Bar Migration near River Mile 192.75 of
the Sacramento River. Report for Duck's Unlimited. Moroney, K. 2006. Personal communication. Mussetter Engineering. 2005. Personal communication. Mussetter, Engineering, 2006. Two-Dimensional Modeling to Evaluate Potential River Training
Works at M&T Pumping Plant Sacramento River, Rm 192.5 (2005 Topography and Bed Material). Report to Duck's Unlimited.
Copyright © 2022 FDOKUMEN