Aspects of the fluvial geomorphology of the eastern Kimberley ...
318
University of Wollongong Research Online University of Wollongong esis Collection University of Wollongong esis Collections 1997 Aspects of the fluvial geomorphology of the eastern Kimberley Plateau, Western Australia Rainer Wende University of Wollongong Research Online is the open access institutional repository for the University of Wollongong. For further information contact the UOW Library: [email protected] Recommended Citation Wende, Rainer, Aspects of the fluvial geomorphology of the eastern Kimberley Plateau, Western Australia, Doctor of Philosophy thesis, School of Geosciences, University of Wollongong, 1997. hp://ro.uow.edu.au/theses/1965
-
Upload
khangminh22 -
Category
Documents
-
view
0 -
download
0
Transcript of Aspects of the fluvial geomorphology of the eastern Kimberley ...
University of WollongongResearch Online
University of Wollongong Thesis Collection University of Wollongong Thesis Collections
1997
Aspects of the fluvial geomorphology of the easternKimberley Plateau, Western AustraliaRainer WendeUniversity of Wollongong
Research Online is the open access institutional repository for theUniversity of Wollongong. For further information contact the UOWLibrary: [email protected]
Recommended CitationWende, Rainer, Aspects of the fluvial geomorphology of the eastern Kimberley Plateau, Western Australia, Doctor of Philosophythesis, School of Geosciences, University of Wollongong, 1997. http://ro.uow.edu.au/theses/1965

ASPECTS OF THE FLUVIAL GEOMORPHOLOGY OF THE EASTERN KIMBERLEY PLATEAU, WESTERN
AUSTRALIA
A thesis submitted in fulfilment of the requirements for the award of the degree
DOCTOR OF PHILOSOPHY
from
THE UNIVERSITY OF WOLLONGONG
by
RAINER WENDE (Magister Artium, Aachen)
School of Geosciences
1997

This work has not been submitted for a higher degree at any other University or Institution and, unless acknowledged, is m y own work
Rainer Wende
i
ABSTRACT
Rivers on the eastern Kimberley Plateau in monsoonal northwestern Australia reveal
incised and steepened bedrock and boulder-bed reaches downstream of low gradient
mixed alluvial-bedrock sections. This study investigates causes for this downstream
steepening, describes forms and processes in the bedrock channel reaches, and examines
a variety of alluvial anabranching systems found alternating with non-alluvial channel
reaches. It concludes with an investigation of the Quaternary chronology of the region's
alluvial deposits flanking the rivers.
Bedrock channels cut by hydraulic plucking of joint-blocks into the region's well-
jointed and only gently deformed sandstones reveal channel morphologies shaped by
high magnitude floods and they clearly reflect strong geological control. Along the
Durack River, clusters of imbricated boulders comprising rock slabs up to 1 m thick, 8 m
wide, and 13 m long provide evidence of bedrock erosion and transport during extreme
floods. Based on estimates of balanced resisting and driving forces, flow velocities
needed to initiate the motion of such large rock slabs are estimated.
In contrast are the region's sand-bed reaches where steep-sided tree-lined ridges
subdivide the total channel into well defined anabranches shaped by more frequent lower
magnitude floods. It is argued that the ridges form to compensate for the less efficient
flow conditions associated with these densely vegetated alluvial reaches. They may also
be related to the development of secondary currents.
The morphology, sedimentology, and T L chronology of alluvial surfaces flanking
rivers on the Kimberley Plateau suggest that the later half of the Holocene was
characterized by floodplain construction and channel contraction. Complementary T L
chronologies of alluvium and dune sands in the east Kimberley provide evidence of
fluvial activity in Isotope Stage 3, aeolian activity during the Last Glacial Maximum, and
renewed fluvial activity in the early Holocene.

ii
ACKNOWLEDGMENTS
I am especially grateful to Gerald Nanson who provided direction, valuable advice and
inspiration during m y tenure at the University of Wollongong. His steady readiness for
discussion and the numerous constructive comments and suggestions on earlier versions
of this study were very helpful for m y work. I would also like to thank him for giving m e
the opportunity for independent research and for the scientific advancement I have
received through him. Special thanks are also due to David Price and Jose Abrantes for
thermoluminescence dating.
Christin Obermeier-Wende, m y wife, participated in all aspects of this project
including many long weeks in the field. Her enthusiastic help and much needed moral
support contributed a great deal to the successful completion of this project Many
thanks! I a m also grateful to m y parents Johanna and Gerhard Wende for their continual
support and encouragement. Special thanks are due to Frank Ahnert for helpful
suggestions and for his inspiring lectures which gready influenced m y geomorphic
thinking.
Peter Clews and Michael Whitting of the Water Authority of Western Australia,
Kununurra Office, provided discharge data and logistic support. P a m and Trevor Squire
as well as John Christie gave, besides occasional technical support, great company in the
field making work along the Durack River much more enjoyable. For permission to work
on their properties I am grateful to the Sinnamon family and many others. I a m especially
grateful to the Aboriginal people of the East Kimberley for their understanding and co
operation, particularly Tiger Moore, Topsy Moore, T o m White, Rony McCale, Jeff
Chunuma, and Reginald Birch.
This project was funded by Australian Research Council grants to Gerald Nanson and
David Price. The University's own Quaternary Environmental Change Research Centre
provide further support. Uranium series dating was conducted as part of ongoing
collaborative work with Henk Heijnis of the Australian Nuclear Science and Technology

ill
Organisation (ANSTO) at Lucas Heights, Sydney. The financial support provided by an
Overseas Postgraduate Research Award and an University of Wollongong Postgraduate
Research Award allowed me to complete this thesis.
My fellow postgraduate students (Jenny Atchison, Maria Coleman, Chris Doyle, He
Qing Huang, David Kennedy, Jerry Maroulis, Lynne McCarthy, Ali Rassuli, Stephen
Tooth, Richard Walsh, and David Wheeler) provided encouragement and support in very
different ways in the office and elsewhere. Special thanks are due to Brendan Brooke and
Robert Wray. Thanks also to Jacqueline Shaw, Carol Nanson, and Manuela Abrantes for
their help and hospitality. Furthermore, thank you to the many people in the School of
Geosciences who provided technical support during my postgraduate student career in
Wollongong. In particular Geoff Black, David Carrie, Chris Chafer, John Marthick,
David Martin, Richard Miller, and Penny Williamson. Last but not least, I would like to
thank the friendly and competent administrative staff of the University, particularly Aapo
Skorolis for his speedy and straightforward support when needed.
iv
TABLE OF CONTENTS
Abstract i
Acknowledgements ii
Table of Contents iv
List of Figures viii
List of Tables xii
List of Symbols xiti
1. I N T R O D U C T I O N 1
1.1 Scope of research 1
1.2 Study area and regional setting of the Kimberley Plateau 3
1.2.1 Geological overview 5
1.2.2 Morphographic overview 10
1.2.3 Geomorphic history 13
1.2.4 Soils and vegetation 17
1.2.5 Relevant aspects of the contemporary climate 18
1.2.6 Palaeoclimate 21
1.3 General knowledge of the fluvial geomorphology of the Kimberley
Plateau 22
1.4 Regional discharge regime 25
2. OUTLINE OF THE METHODS USED 31
2.1 Morphometric data source, measurement and analysis 31
2.2 Observations and measurements in the field 34
2.3 Analytical techniques 35
2.3.1 Sediment analysis 35
2.3.2 Thermoluminescence dating 36
2.3.3 Uranium-Thorium dating 37
3. REGIONAL MORPHOLOGICAL ANALYSIS OF THE STUDY AREA 39
3.1 General description of the morphology 39
3.2 Morphometric analysis 44
3.2.1 Spatial pattern of drainage density, local relief and mean
slope 46
3.2.2 Correlation between morphometric variables 52
3.2.3 Hypsometric curves 54
3.3 Drainage pattern 56
3.3.1 Description 56
v
3.3.2 Lithologic and structural controls 57
3.3.3 Water gaps and pattern change 62
3.4 Basin morphometry 63
3.5 Summary of Chapter 3 71
4. L O N G I T U D I N A L V A L L E Y PROFILES A N D G R A D I E N T S 73
4.1 Profile description and distribution of channel types 75
4.1.1 Stream-gradient index 77
4.1.2 Distribution of channel types 81
4.1.3 Waterfalls 84
4.2 Controls on profile steepening 86
4.2.1 General considerations and definition of terms 86
4.2.2 Episodic baselevel change and profile steepening 89
4.2.3 Evidence for lithologic controls on profile steepening 93
4.2.4 Other possible factors 97
4.3 Incision laws and area-gradient relationships 101
4.3.1 Bedrock incision laws 101
4.3.2 Area - gradient relationships in the study area 103
4.4 Simulations of profile evolution and their implications for the study
streams 106
4.5 Evidence for slow rates of profile change 110
4.7 Summary of Chapter 4 113
5. FORM AND PROCESS IN BEDROCK CHANNELS: HYDRAULIC
PLUCKING AND CHANNEL MORPHOLOGY 116
5.1 Study sites 117
5.2 Processes of bedrock channel erosion 119
5.2.1 Hydraulic plucking 120
5.2.2 Evidence for other erosional processes 124
5.2.3 Classification of bedrock channels 127
5.3 Channel bed morphology and strata dip 129
5.3.1 General model after Miller 129
5.3.2 Channel bed morphologies associated with hydraulic
plucking in the study area 131
5.4 Hydraulic analysis of bedrock erosion at Jack's Hole 139
5.4.1 Hydraulic calculations 141
5.4.2 Palaeodischarge estimates 143
5.4.3 Flood frequency 148
5.4.4 Discussion 150
5.5 Summary 151
vi
6. FORM AND PROCESS IN BEDROCK CHANNELS: BOULDER
BEDFORMS 153
6.1 Terminology and general description 154
6.1.1 Classifications of erosional and depositional bedforms in
bedrock channels 154
6.1.2 Imbricated boulder bedforms 155
6.2 Field characteristics of giant boulder bedforms along the Durack
River 158
6.3 Threshold conditions for entrainment of large rock slabs 166
6.3.1 Rectangular block on flat channel bed 169
6.3.2 Rectangular block upstream of a positive bedrock step 170
6.3.3 Rectangular block imbricated against a positive bedrock
step 173
6.3.4 Considerations about particle motion at Jack's Hole 176
6.4 Summary 177
7. ANABRANCHING ALLUVIAL RIVERS: RIDGE-FORMING
CHANNELS 179
7.1 Study sites 180
7.2 Morphology of ridges and channels 183
7.3 Ridge sedimentology 189
7.3.1 Ridges 189
7.3.2 Channelfill 193
7.3.3 Flanking alluvium 194
7.3.4 Comparison of grain sizes 195
7.4 Stream flow and sediment transport 197
7.4.1 Hydraulic characteristics 197
7.4.2 Specific stream power and channel pattern 201
7.4.3 Channel adjustment 203
7.5 Ridge and channel formation 204
7.5.1 Accretion based processes 205
7.5.2 Avulsion-based erosional processes 209
7.6 The Chapman River confluence 210
7.7 Summary 215
8. QUATERNARY STRATIGRAPHY A N D CHRONOLOGY OF
FLANKING ALLUVIAL SURFACES 217
8.1 Study sites and some comments on TL dating 219
8.2 General character of flanking all uvial surfaces and relevant
mechanisms of floodplain construction and erosion 222

vii
8.2.1 General character of flanking alluvial surfaces in the study
area 222
8.2.2 Relevant mechanisms of floodplain construction and
erosion 224
8.3 Study sites along the Durack River and tributaries 225
8.3.1 Edith Pool and Karunjie Creek 225
8.3.2 Fine Pool 230
8.3.3 Horse Creek and Campbell Creek 233
8.5 Study sites elsewhere on the Kimberley Plateau 235
8.4.1 Drysdale River 235
8.4.2 Woodhouse River 237
8.4.3 Gipp River 238
8.4.4 Hann River 238
8.5 Summary of results from the Kimberley Plateau and conclusions 239
8.6 Evidence for late Quaternary environmental change from the eastern
Kimberley 242
8.6.1 Description of study sites 243
8.6.2 Stratigraphy and chronology of Cabbage Tree Creek
alluvium 245
8.6.3 Dune stratigraphy and age 249
8.6.4 Discussion and conclusions 250
9. CONCLUSIONS A N D O U T L O O K FOR FUTURE STUDIES 253
REFERENCES 259
APPENDICES
A. Hydrometric records of selected stations in the Kimberley region i
B . Morphometric data of selected drainage basins on the southern Karunjie
Plateau ii
C . Design rainfall diagram iv
D . Estimation of design floods for the Durack River at Jack's Hole using the
Rational Method v
E . Derivation of the critical entrainment velocity for a rectangular block on a
nearly horizontal channel bed vii
F. Criterion for the centre of a thin rock slab being at level with the edge of a
rock step x
G . Grain size data xiv
H . Thermoluminescencedata xx

viii
LIST OF FIGURES
Fig. 1.1. Physiographic division of the Kimberley Plateau and location of 4 study area
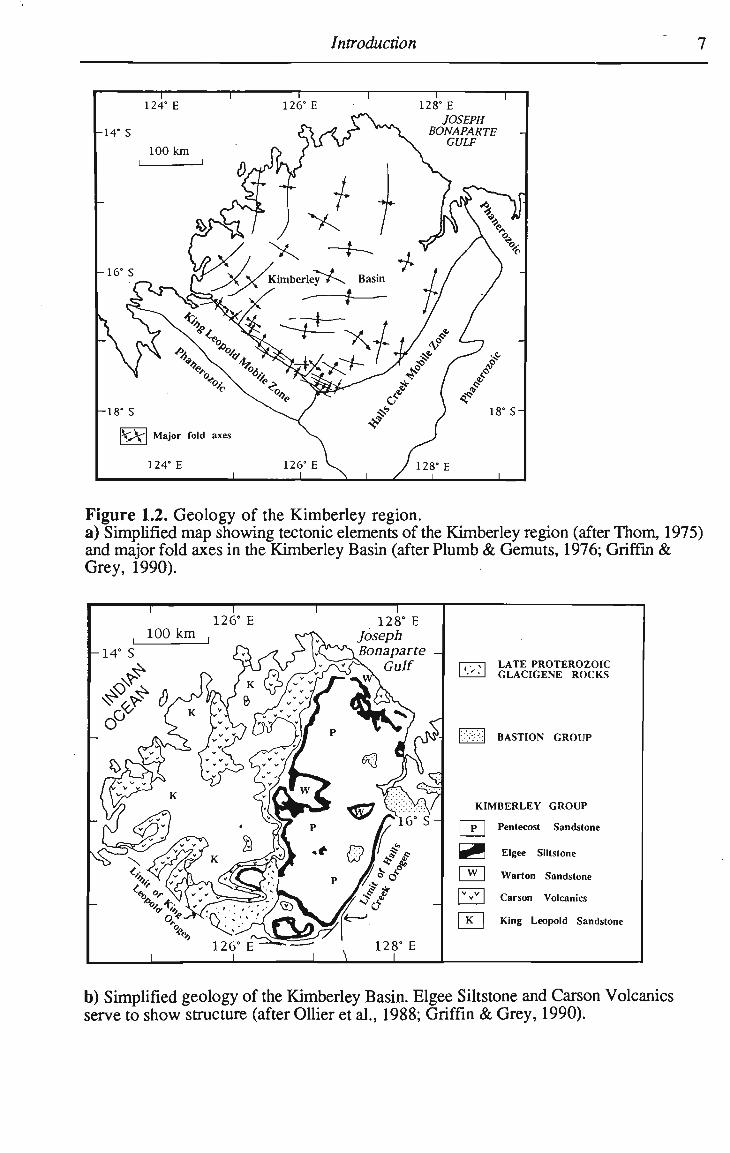
Fig. 1.2. Geology of the Kimberley region
a) Simplified map showing tectonic elements of the Kimberley 7 region b) Simplified geology of the Kimberley Basin 7
Fig. 1.3. Contour map of the Kimberley Plateau and adjoining areas 12 Fig. 1.4. Major drainage of the Kimberley Plateau 13
Fig. 1.5. Selected climate parameters for the Kimberley Plateau
a) Median annual rainfall 20
b) Average annual evaporation 20
c) Percentages of annual rainfall from tropical cyclones on the 20 Kimberley Plateau
d) Rainfall intensity map for a one hour rainfall with an average 20 recurrence interval of 50 years
Fig. 1.6. Streamflow data for the Durack River at Karunjie a) Time weighted stream discharge duration curve 28
b) Peak wet season flows 28
c) Preliminary flood frequency curve (monthly series) 28 Fig. 1.7. Discharge data Kimberley region
a) Plot of mean annual peak discharge versus drainage area 29
b) Plot of maximum recorded discharge per unit area versus drainage 29 area Plot of measured drainage density versus estimated drainage density 34 using the line intersection method
Study area with sample grid superimposed and projected topographic 40 profiles
Geology of the study area
a) Generalized geological map of the study area 41
b) Generalized geological profiles 42
Generalized stratigraphic column of the Karunjie Plateau showing 42 principal caprocks
Spatial pattern of morphometric parameters
a) drainage density 47
b) local relief 47
c) mean slope 47
Fig. 3.5. Ingrown meanders along the lower Salmond River 51
Fig. 3.6. Hypsometric curves for the Durack River, Salmond River, and Bindoola Creek basins
a) Proportion of total basin area versus elevation above sea level 55
b) Proportion of total basin area versus proportion of maximum 55 basin elevation
Fig.
Fig.
Fig.
Fig.
Fig.
2.1
3.1
3.2
3.3.
3.4.
IX
Fig. 3.7. Drainage pattern and geology a) Major drainage pattern of the study area 58 b) Generalized geological map showing relationship between 59 geology and drainage pattern
Fig. 3.8. Oblique aerial photo of the water gap along Bindoola Creek 61 Fig. 3.9. Location of selected drainage basins used in morphometric analysis 65 Fig. 3.10. Basin length as a function of basin area 68 Fig. 3.11. Basin perimeter as a function of basin area 68 Fig. 3.12. Basin area as a function of mainstream length 68 Fig. 3.13. Relationship between relief ratio and basin area 69 Fig. 3.14. Relationship between mean valley gradient and basin area 69 Fig. 3.15. Scatterplot of basin area versus basin relief 69 Fig. 3.16. Scatterplot of basin area versus (a) basin relief, (b) mean valley 70
gradient, and (c) basin relief Fig. 4.1. Longitudinal valley and interfluve profiles: (a) Durack River, (b) 76
Salmond River, (c) Bindoola Creek Fig. 4.2. SeinUogarithmic long profiles showing stream gradient index: (a) 80
Durack River, (b) Salmond River, (c) Bindoola Creek showing Fig. 4.3. Valley and channel types along the Durack River (four photographs) 83 Fig. 4.4. Waterfalls in the study area: a) Bindoola Falls; (b) Durack Falls 85 Fig. 4.5. Regrading of stream profile initiated by a drop in baselevel 90 Fig. 4.6. Long profiles showing D * values: (a) Durack River; (b) Salmond 91
River; (c) Bindoola Creek Fig. 4.7. Long profile of a tributary along the lower Durack River showing 92
stream gradient index and D* value Fig. 4.8. Valley long profiles showing rock units and direction of strata dip 95
along profiles: a) Durack River, b) Salmond River, c) Bindoola Creek
Fig. 4.9. Durack River near Karunjie (three photographs) 100 Fig. 4.10. Plot of drainage area versus valley gradient
a) All 45 streams selected for the morphometric analysis in Chapter 3 105 b) Only those streams located upstream of the steepened lower 105 reaches along the Durack River c) Only those streams located along the steepened lower reaches of 105 the Durack River d) Only those streams located along the Salmond River 105
Fig. 4.11. Schematic diagram showing influence of a resistant layer on long 107 profile evolution of a stream subject to baselevel lowering at a constant rate
Fig. 5.1. The gorge side-slope of Bindoola Creek downstream of Bindoola 118 Falls
Fig. 5.2. Location of study sites 118 Fig. 5.3. Schematic diagram showing lift, drag, and gravitational forces 121
acting on a loose in-situ joint block subject to flow parallel to the channel bed
Fig. 5.4. S-forms along the Durack River a) Flute marks on joint block along the lip of the Durack Falls 126 b) Sculptured bedrock at Jack's Hole 126
Fig. 5.5. S E M image of a cross section of a fluted and polished sandstone 126 Fig. 5.6. Tentative classification of bedrock streams based on the dominant 128
channel forming process Fig. 5.7. Control of strata dip and bed thickness on the morphology of 130
channels Fig. 5.8. Geomorphology, cross and longitudinal profiles of the study reach 132
at Jack's Hole on the Durack River Fig. 5.9. Dip channel reach at Jack's Hole along the Durack River (three 133
photographs) Fig. 5.10. Diagrams after Sneed and Folk (1958) showing the shape of (a) 25 137
transported and (b) 25 in-situ rock blocks Fig. 5.11. View of a dip channel reach of a small tributary of the Pentecost 140
River Fig. 5.12. Rectangular depression in the channel bed of a tributary of Bindoola 140
Creek Fig. 5.13. View of Durack Falls along the Durack River 140 Fig. 5.14. Plot of estimated largest palaeoflood to have occurred at the Durack 149
River study site Fig. 6.1. Schematic diagrams showing boulder deposits associated with 156
bedrock steps: (A) single boulder imbricated against bedrock step; (B) stoss side boulder cluster, (C) step covering boulder cluster, (D) combined boulder cluster
Fig. 6.2. Single boulder imbricated against positive bedrock step 159 Fig. 6.3. Stoss side cluster 159 Fig. 6.4. Step covering cluster 159 Fig. 6.5. Geomorphology, cross and longitudinal profiles of the study reach 161
at Jack's Hole on the Durack River Fig. 6.6. M a p of pattern of erosional steps associated with boulder clusters at 162
Jack's Hole, Durack River Fig. 6.7. Oblique aerial photo showing trains of step covering boulder 165
clusters along oblique linear steps Fig. 6.8. Schematic diagram of rows of step covering boulder clusters formed 165
along linear steps Fig. 6.9. Schematic diagram showing principal forces acting on a rectangular 167
rock block: (A) resting on a flat rock-bed; (B) imbricated against a positive rock-step
Fig. 6.10. Schematic diagrams showing alternative modes of motion for a very 172 platy rock block located ahead of a positive rock-step: (A) by pivoting about its downstream point of support; (B) by saltation without overturning
Fig. 7.1. Location of study sites 181 Fig. 7.2. Morphological map of the study channel reach on the Durack River 182
near Karunjie Fig. 7.3. Ridge-forming anabranching channel reach near Karunjie
a) Detailed morphological map 184 b) Surveyed cross sections and water surface elevations of selected 185 floods
Fig. 7.4. View along Anabranch #3 186 Fig. 7.5. Surveyed longitudinal profiles along selected anabranches 188
Fig. 7.6. Longitudinal and transverse profiles along infilled Anabranch #2 188
XI
Fig. 7.7. Photograph and illustrative drawing of an excavated section along a 190 ridge
Fig. 7.8. Stratigraphic logs of: (a) the ridge exposure in Figure 7.7; (b) 191 flanking ridges and infilled channel along Anabranch #2
Fig. 7.9. Cumulative frequency distribution curves of sediment samples from 194 an infilled anabranch
Fig. 7.10. Grain size of sediment samples: (a) from the bed material and 196 flanking alluvium; (b) from ridges
Fig. 7.11. Time-weighted stream discharge duration curves for the Durack 199 River at Nettopus Pool
Fig. 7.12. The position of the ridge-forming anabranching river on a slope- 202 discharge plot
Fig. 7.13. Schematic diagram illustrating the possible relationship between 207 secondary currents and ridge formation
Fig. 7.14. Schematic diagram illustrating common situations of anabranch 210 development by avulsion
Fig. 7.15. Anabranching channel reach at Fine Pool on the Durack River a) M a p of the confluence of the Durack and Chapman Rivers 212 b) Surveyed cross-sections at Fine Pool 212 c) Aerial view of Fine Pool 213 d) View along secondary channel on western island 213
Fig. 7.16. Generalized vertical profiles of islands and levees at Fine Pool 214 Fig. 7.17. Cumulative frequency curves of sediment samples: (a) from 214
flanking alluvium; (b) from the islands at Fine Pool Fig. 8.1. Location of study sites 220 Fig. 8.2. Schematic diagram illustrating morphology and typical sedimentary 223
architecture of alluvium flanking streams on the Kimberley Plateau Fig. 8.3. M a p showing sample locations, core diagrams, and surveyed 227
sections of the Edith Pool and Karunjie Creek sites Fig. 8.4. M a p showing sample locations, core diagrams, and surveyed 232
section of the Fine Pool site Fig. 8.5. M a p showing sample locations, core diagrams, and surveyed 234
sections of the Horse Creek and Campbell Creek sites Fig. 8.6. M a p showing core diagrams and surveyed section of selected sites 236
on the Kimberley Plateau Fig. 8.7. Location of Cabbage Tree Creek alluvium and nearby climbing dune 244 Fig. 8.8. Downstream sequence of sections showing the stratigraphy of 247
exposed alluvium along Cabbage Tree Creek Fig. 8.9. Surveyed stratigraphic section running west-east from the base to 249
the top of the climbing dune near Cabbage Tree Creek
LIST OF TABLES
xii
Tab. 1.1. Stratigraphy of m e Kimberley Group of the Kimberley Basin 9 succession
Tab. 1.2. Monthly discharge coefficients 26
a) Durack River, Nettopus Pool
b) Bindoola Creek, Mt. Edith
Tab. 2.1. Pearson's r correlation matrix of surrogate measures of drainage 33 density
Tab. 2.2. Pearson's r correlation matrix of surrogate measures of drainage 33 density and directly measured drainage densities
Tab. 3.1 List of morphometric variables determined for lOx 10 k m sample 45 squares
Tab. 3.2 Selected morphometric characteristics 48
Tab. 3.3 Selected morphometric parameters calculated for major rock units 48
Tab. 3.4 Pearson's r correlation matrix of morphometric variables 53
Tab. 3.5 Spearman's rank correlation coefficient of morphometric 53 variables
Tab. 3.6 List of morphometric parameters determined for selected 64 drainage basins
Tab. 3.7 Pearson's r correlation matrix of morphometric variables 64 determined for selected drainage basins
Tab. 4.1 Isotopic and age data for conglomerates 112
Tab. 4.2 T L data and ages for conglomerates 112
Tab. 5.1 Coefficients C N of the uplift force for various dip angles of the 123 bedding joints
Tab. 5.2 Summary table of the dimensions of transported and in-situ rock 137 slabs at Jack's Hole along the Durack River
Tab. 5.3 Height of highest water-surface elevation indicator and 144 corresponding geometry of Cross Sections 1 and 4
Tab. 5.4 Approximate recurrence interval and flow velocities of selected 147 discharges at Cross Section 4 and corresponding maximum thickness of joint blocks likely to be uplifted
Tab. 6.1. Classification of depositional and erosional bedforms in bedrock 155 and boulder-bed channels
Tab. 6.2. Summary of size and shape characteristics of 50 large boulders 161 forming boulder clusters at Jack's Hole on the Durack River
Tab. 6.3. Comparison of critical velocities needed to entrain rock blocks of 170 differing shapes by sliding, pivoting, or hydraulic plucking
Tab. 6.4. Critical velocities needed to entrain a block of differing shape by 171 pivoting from a position ahead of a low rock-step
Tab. 7.1. Summary of morphometric and local flow characteristics for two 200 study cross-sections: (a) Cross section A-A'; (b) Cross section B-B'
LIST OF SYMBOLS
basin or drainage area
cross sectional area
surface area parallel and perpendicular to flow
empirical constants
angles
velocity head coefficient
coefficients of lift and drag
long, intermediate, and short axis of particle
drainage density
rate of vertical erosion
total rate of vertical erosion
erosion rates of abrasion, corrosion, and
hydraulic plucking
modal elevation
elongation ratio
lift, drag, and weight force
friction force, normal force
Froude number
constant of gravity
specific weight of water
height above datum
basin relief
minimum height above datum
m a x i m u m height above datum
height of rock step
stream length
length of sample traverse
basin length
mainstream length
wavelength
moment arms
Manning's n
coefficient of static friction
basin perimeter
discharge
relief ratio
local relief
relative relief
ruggedness number
hydraulic radius
density of water and solid
mean slope
mean valley gradient
local valley gradient
stream gradient
mean flow velocity, critical velocity, average
velocity, instantaneous velocity
channel width
1
1. INTRODUCTION
The study area is part of the Kimberley region of monsoonal northwestern Australia.
This region remains one of the most remote parts of the Australian continent with large
areas remaining difficult to access. Despite early work by Jennings and Sweeting (1963),
Jennings (1975), the C S I R O (Stewart et al., 1960; Wright, 1964; Paterson, 1970) and
geological mappers (e.g. Derrick, 1969; Gellatiy andSofoulis, 1969; Roberts and Perry,
1969; Plumb and Veevers, 1971; Gellatiy, et al., 1975), the geomorphology of the region
until recently had received no detailed investigation. Studies carried out during the
Kimberley Research Project, Western Australia 1988 (e.g. Goudie and Sands, 1989;
Allison and Goudie, 1990; Goudie, et al., 1990; Gillieson, et al., 1991; Goudie, et al.,
1992; Allison, et al., 1993; Goudie, et al., 1993) were some of the first to be conducted
in depth, but the short duration of that expedition limited the topics that could be
investigated. Consequently, knowledge of the region's fluvial geomorphology and its
flow regime history remains limited, especially in an area known as the Kimberley
Plateau. The need for further geomorphological research into Australia's inland and
tropical monsoon regions, including the Kimberley, was recently highlighted in a review
by Tooth and Nanson (1995) and this dissertation is a contribution towards correcting
this deficiency.
1.1 Scope of research
This study examines aspects of the fluvial geomorphology of the eastern Kimberley
Plateau (Fig. 1.1) with special emphasis placed on Quaternary and contemporary fluvial
forms and processes. However, in a landscape as old as the Kimberley Plateau, aspects
of long-term landscape evolution and large-scale landscape morphology have a profound
influence on contemporary fluvial landforms and consequently are included by way of
introduction to the more detailed work that follows. In addition to redressing the lack of
scientific information on the Kimberley region, the area warrants detailed
Introduction 2
geomorphological investigation for several other reasons. Firstly, it offers a variety of
fluvial landforms, in particular bedrock channels and a variety of alluvial anabranching
systems, the like of which have not been studied there or elsewhere. Secondly, the
Kimberley region is strongly under the influence of the Australian monsoon and the
alluvial deposits of the region should reveal a picture of changing monsoon conditions in
the late Quaternary. Thirdly, the region offers an excellent opportunity to study the
geomorphology of the monsoon tropics in an area not affected by intense utilisation and
alteration by humans. The specific objectives are:
a) To determine and quantify, at a landscape scale, the fluvial character of the study area
including the influence of variable lithology and baselevel history on the development of
the longitudinal profiles of the main streams as a means of explaining the spatial
distribution of bedrock and alluvial channels.
b) To ascertain quantitatively the forms and mechanisms of bedrock channel erosion by
hydraulic plucking, possibly the most important process of stream erosion in this region
characterized by high magnitude flood events.
c) To determine the character, formation, and maintenance of ridge-forming anabranching
channels, a dominant type of alluvial channel in the region.
d) To provide an interpretation of late Quaternary and contemporary flow regimes using
evidence from the stratigraphy and chronology of alluvial deposits flanking the rivers.
Chapter 1 provides a regional overview with brief reviews of the local geology,
geomorphology, soils, vegetation, and landscape history. Chapter 2 lists methods used in
this study, and Chapter 3 documents and quantifies morphological characteristics of the
study area and its fluvial systems at a basin scale. Chapter 4 describes the distribution of
channel types along the main rivers, links the occurrence of bedrock and alluvial channels
Introduction 3
to changes in valley gradients, and investigates controls on the development of
longitudinal valley profiles as a means of explaining constraints on stream gradients and
channel types. Chapters 5 and 6 describe, at a reach scale, form and process in the
bedrock channels of the study area, and Chapter 7 examines the existence and formation
of sand ridges that characterize the alluvial anabranching channels of the region. Chapter
8 presents the stratigraphy and chronology of alluvial deposits within the wider study
area and discusses them in the context of changes in the region's late Quaternary climate
and flow regime. Chapter 9 summarizes the results and presents conclusions including
proposals for future research.
1.2 Study area and regional setting of the Kimberley Plateau
The Kimberley was subdivided by Jutson (Jutson, 1934) into three physiographic
divisions: the North Kimberley, Fitzroyland and Ordland (Fig. 1.1). The latter two
correspond roughly to the areas commonly referred to as the West Kimberley and the
East Kimberley, respectively.
The North Kimberley Division was further subdivided by Wright (1964) into the
Kimberley Plateau Province and the Kimberley Foreland Province, the first characterized
by a plateau-and-cuesta landscape developed on horizontal or weakly deformed rocks of
variable resistance, the latter by cuestas and hogbacks formed on steeply dipping rocks
facing outwards from the Plateau region. Beard (1979) presented a comprehensive
physiographic division of the Kimberley region based on unpublished work by K.A.
Plumb. In this system, five regions or sub-provinces are listed for the Kimberley Plateau
Province: the Prince Regent Plateau, the Gibb Hills and the Karunjie Plateau, as well as
two regions of minor extent, the Glenroy Plains and the Cockburn Ranges (Fig. 1.1).
These principal physiographic divisions, which have been used in most regional studies,
are used throughout this study.

Introduction 4
-14° S
124° E
100 km i — i
126° E 128° E
TIMOR SEA \ ----^
- ^
A r<$~. i
c ^
14* S-
•68e
^
, #
• V.' ' I /flr'
e^
,-"/ Karunjie Plateau
^ ^
-16° S NORTH S ! KIMBERLEY
,'£*! KIMBERLEY V V ~ \ » P L A T E A U
'\ Cockburn ^ T Ranges J i6° s^
^ > <c, °*5 N%.„-'•O^GIenroy'v. V
Boundary of Division
— — Boundary of Province
-18° S Boundary of Sub-province
^. . — Line encloses Durack River, Salmond '.•'-• River and Bindoola Creek basins o o ~ Gibb Hills
126° E J I
18° S-
Figure 1.1. Physiographic division of the Kimberley Plateau (after Beard, 1979) and location of study area.
However, the physiographic scheme outlined above is not the only one in use. In a
recent attempt to unify the physiographic divisions of Australia, Jennings & Mabbutt
(1986) distinguished 11 individual regions for the area known as the Kimberley
Province, and three of these regions, the Kimberley Plateau, the Drysdale Lowlands and
the Couchman Uplands, correspond to the Kimberley Plateau Province as defined by
Wright (1964). This system has been reproduced as a geomorphological division of
Western Australia in the Western Australian Year Book (e.g. Wyrwoll, 1992). Although
the intentions of Jennings and Mabbutt are understandable, two concerns are apparent.
Introduction 5
Firsdy, the term 'Kimberley Plateau' is used for a lower hierarchical level than previously
and this is a source of confusion. Secondly, the division is only weakly connected to
other existing systems and at a scale of 1:21.5 million the published map does not permit
a clear differentiation of the designated regions. Nevertheless, the two systems can be
roughly correlated. The Kimberley Plateau region of Jennings and Mabbutt basically
represents the Prince Regent Plateau, Karunjie Plateau, Cockburn Ranges and Glenroy
Plains, as presented by Beard (1979), while the Drysdale Lowlands and Couchman
Uplands correspond roughly to a portion of his Gibb Hills region.
In this dissertation, the wider study area is the eastern Kimberley Plateau Province, but
more detailed morphometric and field based investigations focused on the southern part of
the Karunjie Plateau (Fig. 1.1). The study area comprises the catchments of the Durack
and Salmond Rivers and Bindoola Creek, with the majority of field study sites located
along the Durack River. The selection of these sites was based on the existence of a
gauging station run by the Water Authorities of Western Australia on the middle reach of
the Durack River, and reasonable vehicle access to this part of the river. Aerial and
ground reconnaissance was conducted and demonstrated that the fluvial forms at these
selected sites are not unique but are representative of many river reaches in the region.
1.2.1 Geological overview
The general geology of the Kimberley has been described by Veevers (1967; 1984a;
1984b), D o w & Gemuts (1969), Plumb & Gemuts (1976), and various authors
contributing to the Memoirs 2 and 3 published by the Geological Survey of Western
Australia (1975; 1990) and to the Explanatory Notes of the 1:250 000 geological map
series.
The physiographic province of the Kimberley Plateau is generally underlain by rocks
of the Proterozoic Kimberley Basin. This ancient basin overlies the Kimberley Block and
forms a part of the North Australian Craton. To the south, the Kimberley Basin is
bordered by the Hall's Creek Province which consists of two Proterozoic orogenic belts,
the Hall's Creek and King Leopold Mobile Zones (Fig. 1.2a). These zones contain
Introduction 6
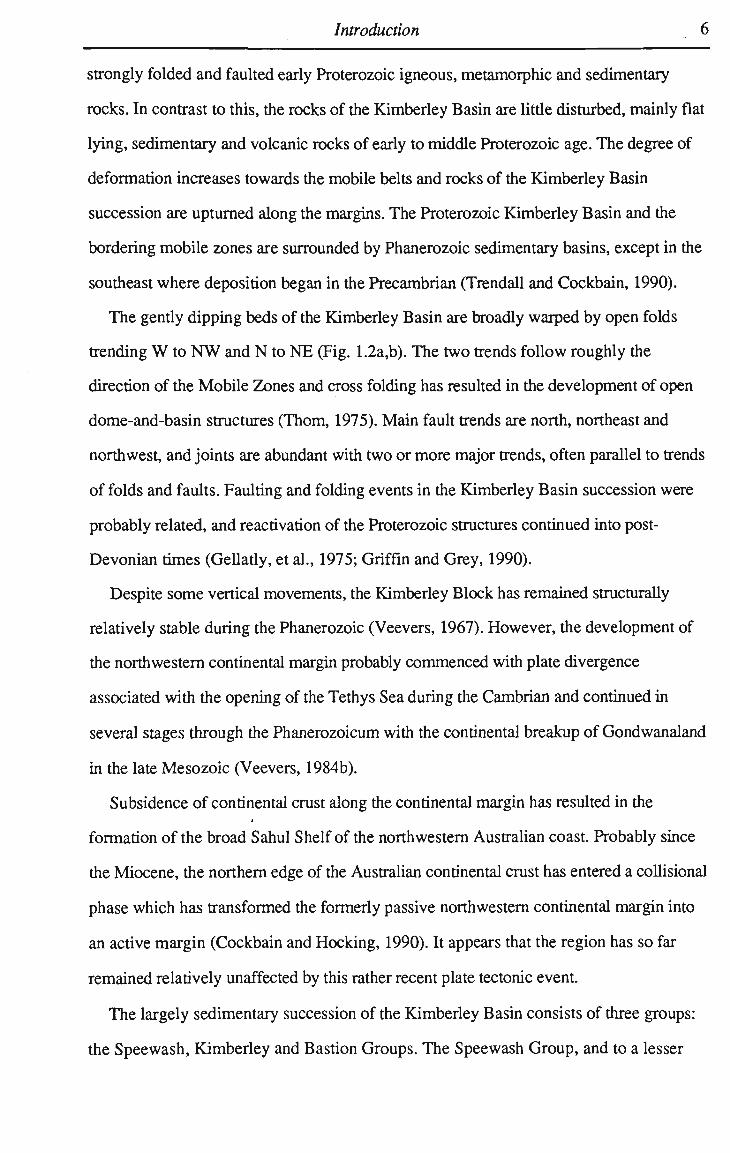
strongly folded and faulted early Proterozoic igneous, metamorphic and sedimentary
rocks. In contrast to this, the rocks of the Kimberley Basin are littie disturbed, mainly flat
lying, sedimentary and volcanic rocks of early to middle Proterozoic age. The degree of
deformation increases towards the mobile belts and rocks of the Kimberley Basin
succession are upturned along the margins. The Proterozoic Kimberley Basin and the
bordering mobile zones are surrounded by Phanerozoic sedimentary basins, except in the
southeast where deposition began in the Precambrian (Trendall and Cockbain, 1990).
The gently dipping beds of the Kimberley Basin are broadly warped by open folds
trending W to NW and N to NE (Fig. 1.2a,b). The two trends follow roughly the
direction of the Mobile Zones and cross folding has resulted in the development of open
dome-and-basin structures (Thom, 1975). Main fault trends are north, northeast and
northwest, and joints are abundant with two or more major trends, often parallel to trends
of folds and faults. Faulting and folding events in the Kimberley Basin succession were
probably related, and reactivation of the Proterozoic structures continued into post-
Devonian times (Gellatiy, et al., 1975; Griffin and Grey, 1990).
Despite some vertical movements, the Kimberley Block has remained structurally
relatively stable during the Phanerozoic (Veevers, 1967). However, the development of
the northwestern continental margin probably commenced with plate divergence
associated with the opening of the Tethys Sea during the Cambrian and continued in
several stages through the Phanerozoicum with the continental breakup of Gondwanaland
in the late Mesozoic (Veevers, 1984b).
Subsidence of continental crust along the continental margin has resulted in the *
formation of the broad Sahul Shelf of the northwestern Australian coast. Probably since
the Miocene, the northern edge of the Australian continental crust has entered a collisional
phase which has transformed the formerly passive northwestern continental margin into
an active margin (Cockbain and Hocking, 1990). It appears that the region has so far
remained relatively unaffected by this rather recent plate tectonic event.
The largely sedimentary succession of the Kimberley Basin consists of three groups:
the Speewash, Kimberley and Bastion Groups. The Speewash Group, and to a lesser
Introduction 7
Figure 1.2. Geology of the Kimberley region. a) Simplified map showing tectonic elements of the Kimberley region (after Thorn, 1975) and major fold axes in the Kimberley Basin (after Plumb & Gemuts, 1976; Griffin & Grey, 1990).
100 km , 126° E
-14° S
^
128" E Joseph Bonaparte
Gulf LATE PROTEROZOIC GLACIGENE ROCKS
BASTION GROUP
KIMBERLEY GROUP
pi Pentecost Sandstone
Elgee Siltstone
[ w I Warton Sandstone
]"v I Carson Volcanics
| K | King Leopold Sandstone
b) Simplified geology of the Kimberley Basin. Elgee Siltstone and Carson Volcanics serve to show structure (after Oilier et al., 1988; Griffin & Grey, 1990).
Introduction 8
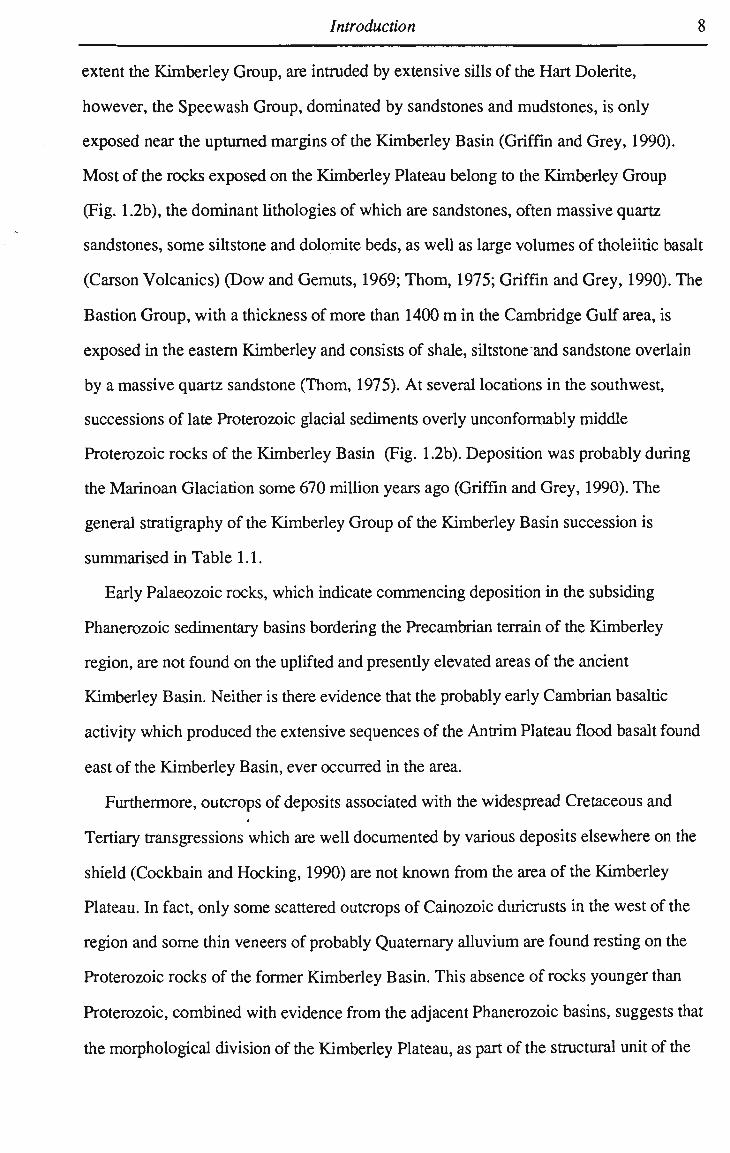
extent the Kimberley Group, are intruded by extensive sills of the Hart Dolerite,
however, the Speewash Group, dominated by sandstones and mudstones, is only
exposed near the upturned margins of the Kimberley Basin (Griffin and Grey, 1990).
Most of the rocks exposed on the Kimberley Plateau belong to the Kimberley Group
(Fig. 1.2b), the dominant lithologies of which are sandstones, often massive quartz
sandstones, some siltstone and dolomite beds, as well as large volumes of tholeiitic basalt
(Carson Volcanics) (Dow and Gemuts, 1969; Thorn, 1975; Griffin and Grey, 1990). The
Bastion Group, with a thickness of more than 1400 m in the Cambridge Gulf area, is
exposed in the eastern Kimberley and consists of shale, siltstone ^nd sandstone overlain
by a massive quartz sandstone (Thom, 1975). At several locations in the southwest,
successions of late Proterozoic glacial sediments overly unconformably middle
Proterozoic rocks of the Kimberley Basin (Fig. 1.2b). Deposition was probably during
the Marinoan Glaciation some 670 million years ago (Griffin and Grey, 1990). The
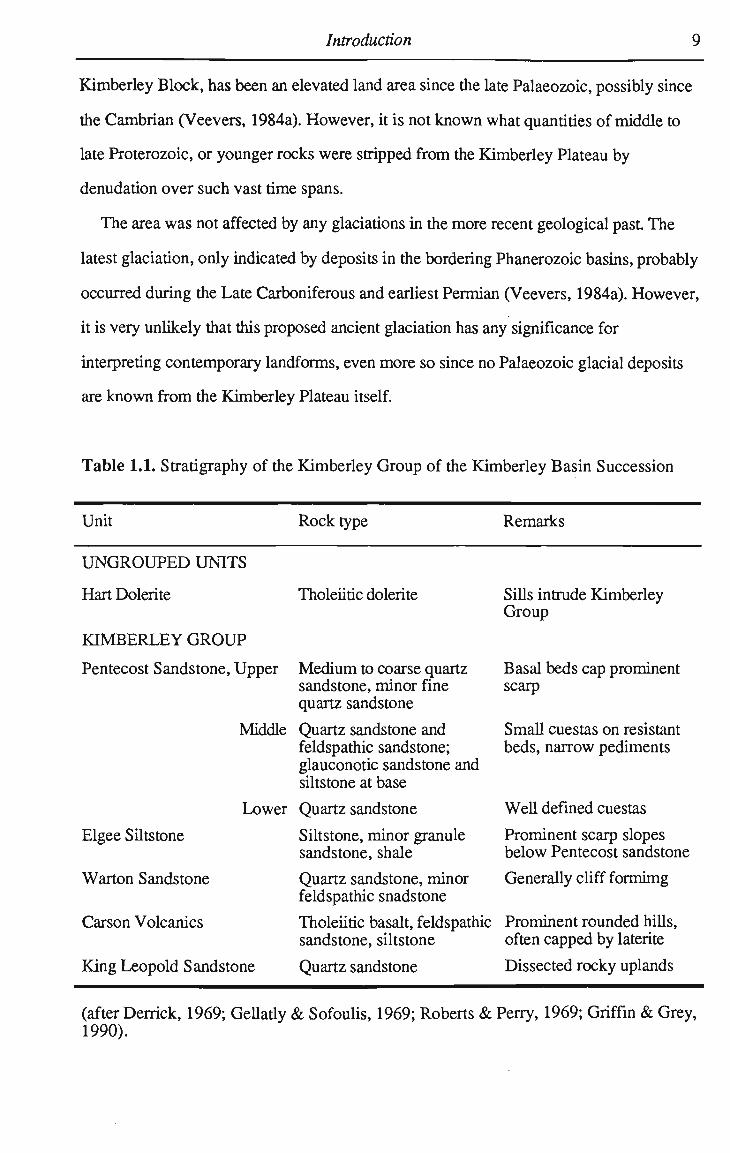
general stratigraphy of the Kimberley Group of the Kimberley Basin succession is
summarised in Table 1.1.
Early Palaeozoic rocks, which indicate commencing deposition in the subsiding
Phanerozoic sedimentary basins bordering the Precambrian terrain of the Kimberley
region, are not found on the uplifted and presently elevated areas of the ancient
Kimberley Basin. Neither is there evidence that the probably early Cambrian basaltic
activity which produced the extensive sequences of the Antrim Plateau flood basalt found
east of the Kimberley Basin, ever occurred in the area.
Furthermore, outcrops of deposits associated with the widespread Cretaceous and 4
Tertiary transgressions which are well documented by various deposits elsewhere on the
shield (Cockbain and Hocking, 1990) are not known from the area of the Kimberley
Plateau. In fact, only some scattered outcrops of Cainozoic duricrusts in the west of the
region and some thin veneers of probably Quaternary alluvium are found resting on the
Proterozoic rocks of the former Kimberley Basin. This absence of rocks younger than
Proterozoic, combined with evidence from the adjacent Phanerozoic basins, suggests that
the morphological division of the Kimberley Plateau, as part of the structural unit of the
Introduction 9
Kimberley Block, has been an elevated land area since the late Palaeozoic, possibly since
the Cambrian (Veevers, 1984a). However, it is not known what quantities of middle to
late Proterozoic, or younger rocks were stripped from the Kimberley Plateau by
denudation over such vast time spans.
The area was not affected by any glaciations in the more recent geological past The
latest glaciation, only indicated by deposits in the bordering Phanerozoic basins, probably
occurred during the Late Carboniferous and earliest Permian (Veevers, 1984a). However,
it is very unlikely that this proposed ancient glaciation has any significance for
interpreting contemporary landforms, even more so since no Palaeozoic glacial deposits
are known from the Kimberley Plateau itself.
Table 1.1. Stratigraphy of the Kimberley Group of the Kimberley Basin Succession
Unit Rock type Remarks
UNGROUPED UNITS
Hart Dolerite
KIMBERLEY GROUP
Pentecost Sandstone, Upper
Tholeiitic dolerite
Medium to coarse quartz sandstone, minor fine quartz sandstone
Elgee Siltstone
Warton Sandstone
Carson Volcanics
King Leopold Sandstone
Middle Quartz sandstone and feldspathic sandstone; glauconotic sandstone and siltstone at base
Lower Quartz sandstone
Siltstone, minor granule sandstone, shale
Quartz sandstone, minor feldspathic snadstone
Tholeiitic basalt, feldspathic sandstone, siltstone
Quartz sandstone
Sills intrude Kimberley Group
Basal beds cap prominent scarp
Small cuestas on resistant beds, narrow pediments
Well defined cuestas
Prominent scarp slopes below Pentecost sandstone
Generally cliff formimg
Prominent rounded hills, often capped by laterite
Dissected rocky uplands
(after Derrick, 1969; Gellatiy & Sofoulis, 1969; Roberts & Perry, 1969; Griffin & Grey, 1990).
Introduction 10
1.2.2 Morphographic overview
Descriptions of the general geomorphology and geomorphic history of the Kimberley
Plateau are included in the corresponding reports of the CSIRO Land Research Series
(Stewart, et al., 1960; Wright, 1964; Paterson, 1970) and the Explanatory Notes of the
1:250 000 geological map series (Derrick, 1969; Gellatiy and Sofoulis, 1969; Roberts
and Perry, 1969; Plumb and Veevers, 1971; Gellatiy, et al., 1975). Summary
descriptions for the whole Kimberley region are given by Beard (1979).
The gently dipping rocks of the ancient geological Kimberley Basin form a landscape
with an abundance of structural landforms, such as cuestas, horizontal plateaux and
mesas, which is commonly referred to as the physiographic province of the Kimberley
Plateau. In general, the landforms of the province are strongly influenced by the lithology
and attitude of the underlying bedrock. Sandstones are the predominant country rocks,
generally only covered by thin soils and an abundance of bold bedrock outcrops.
Extensive soil-covered plains are mostly developed on volcanic rocks. The Kimberley
Plateau has a drowned ria-type coast, especially in the west and northwest, but in the
northeast, cliffs are prominent and subaerial coastal margins are only narrow (Fig. 1.1).
Most of the western part of the Kimberley Plateau is occupied by the Prince Regent
Plateau (Fig. 1.1), generally a dissected, rugged landsurface with a strong structural
control on the topography. The King Leopold Sandstone is the predominant rock unit in
this physiographic sub-province (Fig. 1.2b). Major and minor streams are frequently
incised and precipitous gorges are common especially near the coast. The drainage is
often angular, reflecting the control of well developed joints. Further inland, parts of this
plateau province are only little dissected and form a gendy undulating landscape. The
second large physiographic unit of the western Kimberley Plateau is the Gibb Hills sub-
province (Fig. 1.1) which comprises gently sloping terrain of a low local relief, formed
mainly on volcanic rocks (Fig. 1.2b). Extensive soil-covered plains are common.
Introduction 11
Laterites are present throughout the sub-province with an abundance of small lateritic-
capped mesas.
The eastern Kimberley Plateau comprises the extensive Karunjie Plateau and the much
smaller sub-province of the Cockburn Ranges (Fig. 1.1). These rather similar landform
units are almost entirely formed on generally gentiy dipping sedimentary rocks with a
clear dominance of sandstones. The Cockburn Ranges, a dissected large mesa, is capped
by the resistant Cockburn Sandstone on top of shales of the Bastion Group. This mesa
rises abruptly nearly 600 m from the near coastal plains. To the west of the Cockburn
Ranges lies the adjoining Karunjie Plateau distinguished by structural plains and
numerous scarps of cuestas, plateaux and scattered mesas formed on sandstones of
varying resistance and interbedded siltstones. The western margin of this sub-province is
an almost continuous cuesta scarp which rises up to 100 m above the landsurface of the
Gibb Hills. Towards the north the Karunjie Plateau is bounded by a cliffed coastline with
steep slopes commonly dropping directiy into the sea, while in the northeast, the margins
to the adjoining coastal plains of the Cambridge Gulf are less well defined. To the south
and southeast, the sub-province approaches the upturned margins of the Kimberley Basin
with the spectacular hogbacks and parallel ridges of the Kimberley Foreland Province
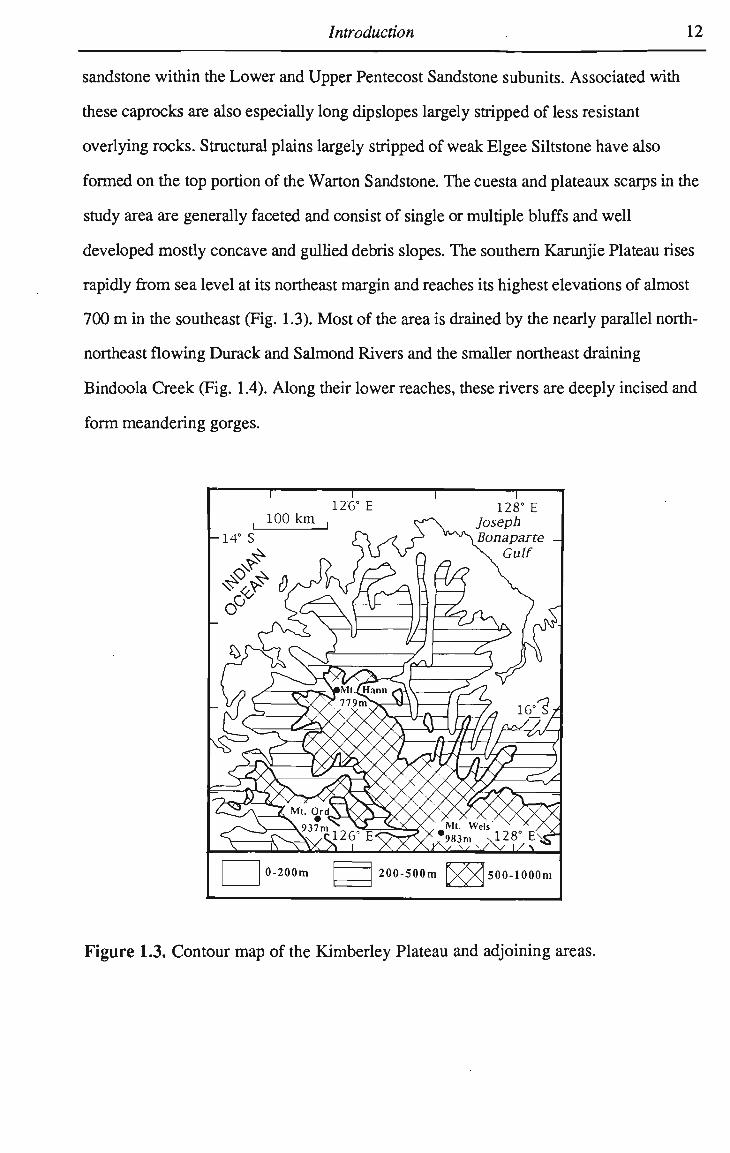
(Fig. 1.1). Most of the Karunjie Plateau lies between 200 and 500 m , with elevations
generally decreasing from south to north (Fig. 1.3). The Karunjie Plateau is formed
largely on Pentecost and Warton Sandstones, with narrow strips of Elgee Siltstone
generally only outcropping along the lower portions of slopes of well defined scarps
capped by Lower Pentecost Sandstone (Fig. 1.2b). Small patches of Bastion Group
sediments are found scattered across the Karunjie Plateau and they indicate that
Proterozoic Bastion Group sediments once covered the area. These outcrops occur only
in structural synforms such as small open basins.
The southern part of the Karunjie Plateau is dominated by structural landforms such as
cuestas and horizontal plateaux formed mainly on Pentecost Sandstone in a variety of
structural settings. A number of caprocks is involved in the formation of the structural
landforms of the study area, but the principal caprocks are layers of resistant quartz
3 0009 03204529 1
Introduction 12
sandstone within the Lower and Upper Pentecost Sandstone subunits. Associated with
these caprocks are also especially long dipslopes largely stripped of less resistant
overlying rocks. Structural plains largely stripped of weak Elgee Siltstone have also
formed on the top portion of the Warton Sandstone. The cuesta and plateaux scarps in the
study area are generally faceted and consist of single or multiple bluffs and well
developed mostly concave and gullied debris slopes. The southern Karunjie Plateau rises
rapidly from sea level at its northeast margin and reaches its highest elevations of almost
700 m in the southeast (Fig. 1.3). Most of the area is drained by the nearly parallel north-
northeast flowing Durack and Salmond Rivers and the smaller northeast draining
Bindoola Creek (Fig. 1.4). Along their lower reaches, these rivers are deeply incised and
form meandering gorges.
Figure 1.3. Contour map of the Kimberley Plateau and adjoining areas.
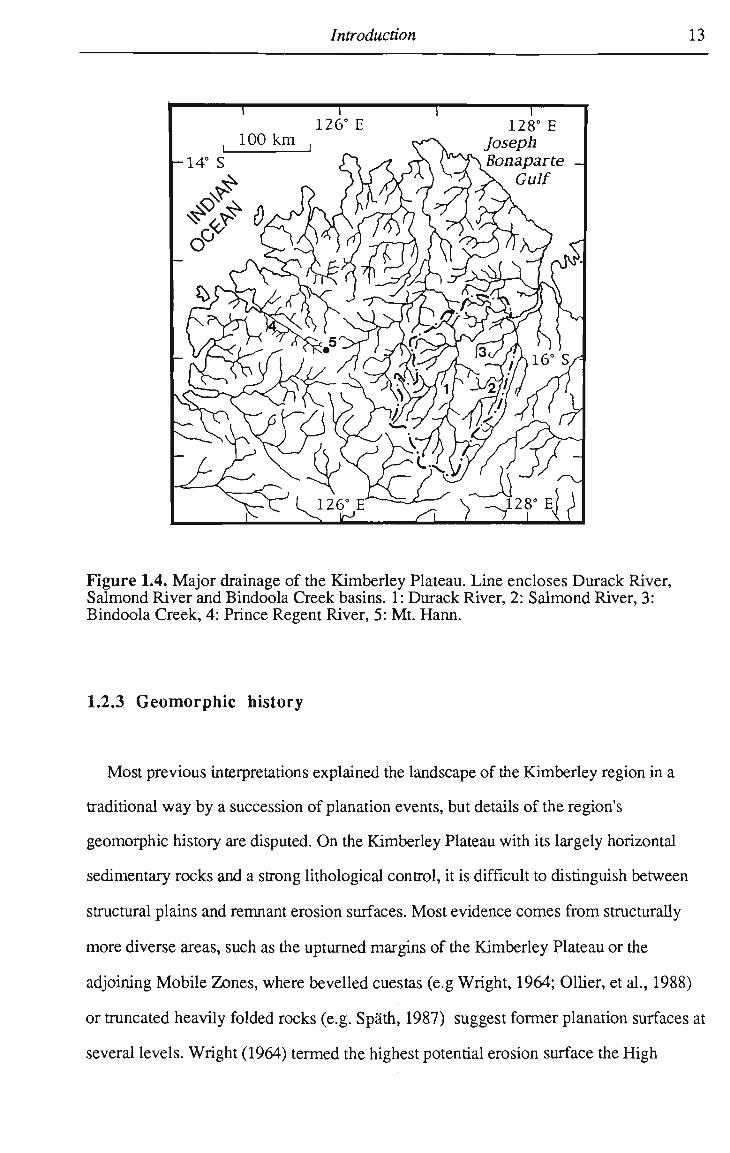
Introduction 13
Figure 1.4. Major drainage of the Kimberley Plateau. Line encloses Durack River, Salmond River and Bindoola Creek basins. 1: Durack River, 2: Salmond River, 3: Bindoola Creek, 4: Prince Regent River, 5: Mt. Harm.
1.2.3 Geomorphie history
Most previous interpretations explained the landscape of the Kimberley region in a
traditional way by a succession of planation events, but details of the region's
geomorphie history are disputed. O n the Kimberley Plateau with its largely horizontal
sedimentary rocks and a strong lithological control, it is difficult to distinguish between
structural plains and remnant erosion surfaces. Most evidence comes from structurally
more diverse areas, such as the upturned margins of the Kimberley Plateau or the
adjoining Mobile Zones, where bevelled cuestas (e.g Wright, 1964; Oilier, et al., 1988)
or truncated heavily folded rocks (e.g. Spath, 1987) suggest former planation surfaces at
several levels. Wright (1964) termed the highest potential erosion surface the High
Introduction 14
Kimberley Surface and suggested a mid-Jurassic or older origin for it Other workers
proposed a pre-Jurassic (Plumb and Gemuts, 1976), Triassic (Spath, 1987), and most
recently, a Precambrian (Oilier, et al., 1988) age. However, Twidale (1994) questioned
this latter interpretation and argued for the possibility of exhumation of Oilier et al.'s
(1988) proposed Proterozoic glaciated surface.
The major drainage of the Kimberley Plateau (Fig. 1.4) was possibly initiated on an
ancient landsurface (High Kimberley Surface?) warped in the distant geological past to
form an elongated dome with an axis orientated N W - S E (Oilier, et al., 1988). This
proposed deformation and uplift was possibly associated with the commencing
development of the northwestern continental margin in the early Palaeozoic up to the final
breakup of Gondwanaland in the Mesozoic. Isostatic response to deposition in the
subsiding basins and to denudation on the uplifted areas may have played an important
role.
T w o lower and younger possible planation surfaces, the L o w Kimberley and the
Fitzroy Surfaces, were seen by Wright (1964) to be related to uplift probably in the
Upper Jurassic / Lower Cretaceous and Upper Miocene, respectively, the latter possibly
associated with warping of the Kimberley Surfaces (High and L o w ) along a roughly
N W - S E trending axis. O n the Kimberley Plateau, this proposed Fitzroy Surface may only
be represented by narrow and deeply entrenched valleys which experienced further
incision following renewed uplift in the late Pliocene (Wright, 1964). In contrast to
Wright's suggestion of three phases of planation, Paterson (1970) proposed just a single
peneplain which was probably uplifted in several stages since the late Tertiary, while
Stewart et al. (1960) supposed a single uplift and/or warping of such a master surface in
the late Tertiary or early Pleistocene. Hays (1968) attempted to correlate four erosion
surfaces he had proposed earlier for the Northern Territory (Hays, 1967) with planation
levels in the Kimberley. This correlation was adopted by Plumb and Gemuts (1976), w h o
suggested that the latest main uplift of the region to its present level and the subsequent
development of the present-day valleys and gorges occurred in the late Miocene to early
Pliocene. However, the practice of extrapolation between planation surfaces has not
Introduction 15
remained unchallenged. Nott (1994) showed that the two youngest erosion surfaces
postulated by Hays for the north of the Northern Territory are, at least locally, structurally
controlled surfaces. Furthermore, Young (1992) has convincingly demonstrated the
limitations of the traditional cyclic method for the interpretation of the landforms in the
East Kimberley and has emphasized the importance of inherited geological constraints for
the evolution of the landforms such as continental rifting, basin geometry and
depositional style, variable diagenesis and relic weathering. This reinforces Ollier's
(1979) view that cyclical theories of landscape evolution in general are only of Umited use
in Australia and that an evolutionary geomorphology that sees the landscape as a whole
evolving through time would be more appropriate.
Duricrusts are found at various locations in the Kimberley Plateau province and
elsewhere in the region. Several studies exist that try to link landscape evolution with
silcrete and laterite deposits (e.g. Spath, 1979; 1983; 1987), but in general, the duricrusts
of the region appear to be only of limited use for the reconstruction of the geomorphie
history (Young, 1992). There are several reasons for this. Firstly, the duricrusts appear
to be lithology specific rather than age specific (Oilier, et al., 1988). This is even more
problematic since the duricrusts on the Kimberley Plateau and elsewhere in the region
have not been dated directly, although attempts exist to obtain some chronological control
(e.g. Spath, 1987). Secondly, there are only small scattered areas of duricrust which
makes their correlation difficult. Thirdly, duricrusts in Australia formed not only during
one well defined period, but at various times from the Jurassic through to the Tertiary
(Twidale, 1983), and even in the late Pleistocene and Holocene (Nanson, et al., 1991;
Young, 1994). However, various phases of deep weathering may have altered the
landforms of the Kimberley Plateau through time, but to what extent, especially the
abundant highly siliceous rocks of the Kimberley Plateau were affected, is unclear.
Geological evidence indicates that the Kimberley Plateau has remained an elevated
landsurface since the late Palaeozoic, possibly the Cambrian. However, long-lasting
denudation, possibly with several phases of uplift and periods of distinct weathering,
formed a landscape which strongly reflects the lithological and structural controls of the
Introduction 16
underlying bedrock. But just when this continuous denudational period was initiated, and
how much of the present landscape is represented by relic landforms, is not known.
However, a limiting age for the landforms is given by the assumed Permian glaciation of
the region, but as deposits of this glaciation have not been identified on the Kimberley
Plateau they must have been stripped from the area since then, and with them probably
most of the relic landforms dating back as far. This restricts the maximum possible age of
the landforms, excluding those that were exhumed at a later stage, to the early Mesozoic.
In Australia, any landform dating back as far is considered as Gondwanan (Twidale &
Campbell, 1993b; 1995).
During such a vast span of time for continuous denudation, significant quantities of
sediment were removed from the Kimberley Plateau. However, the absence of any
reliable stratigraphic markers, such as sediments relating to Mesozoic or Tertiary marine
transgressions evident for elsewhere in northern Australia, makes any reconstruction of
the vertical motions of the Kimberley Block and its denudational history difficult. Uplift
since the Mesozoic may have occurred in the Palaeocene and Eocene, as is indicated by
large quantities of detrital sediments on the shelf (Veevers, 1984b). The latest phases of
uplift of the Kimberley Plateau, outlined before, have been hypothesized by various
authors for the late Tertiary, which, apparently, coincides in time with the commencing
collisional phases of Australia's northern margin. Renewed stream incision and the
development of deeply entrenched valleys and gorges may be the result of this uplift
The long time scales of landform evolution in areas such as the Kimberley Plateau
pose many problems for the interpretations of such landscapes (Wyrwoll, 1988). With
traditional theories of landscape evolution it is often difficult to explain the significant
components of the landscape which appear to be of great antiquity. Alternative ideas,
such as concepts of unequal denudational activity (Twidale, 1991) and therefore unequal
rates of changes across the landsurface, may help to explain the survival of some ancient
elements in the landscape. Similarly, Oilier (1979) argued that the concept of dynamic
equilibrium would be not applicable to large parts of Australia since much of it is an
historic relic. On the Kimberley Plateau, the abundance of bedrock outcrops in the
Introduction 17
landscape is certainly evidence that weathering-limited denudation is widespread.
However, the occurrence of regolith covered slopes and the paucity of thick
autochthonous regolith covers indicates transport-limited denudation, and this is strong
evidence for the likely existence of a long-term dynamic equilibrium for at least parts or
subsystems of such a landscape (Ahnert, 1994).
1.2.4 Soils and vegetation
The soils and vegetation of the Kimberley Plateau were described in the CSIRO Land
Research Series (Speck, 1960a; Speck, 1960b; Rutherford, 1964; Speck and Lazarides,
1964; Perry, 1970; Stewart, 1970) and by Beard (1979). Furthermore, a detailed soil
map (scale 1:2 000 000) of the Kimberley region with explanatory notes (McArthur and
Wright, 1967) was published as part of the Atlas of Australian Soils and an
'interpretative' soil map is available in the Atlas of Australian Resources (1980). These
latter works follow the Factual Key, or Northcote codings, while earlier works are based
on the Great Soil Groups.
O n the Kimberley Plateau, shallow, skeletal, stony sandy to loamy soils with uniform
texture are the chief soils on sandstone. Shallow, often stony, hard-setting red duplex
(texture contrast) soils occur on many slopes. O n volcanic rocks, friable red earths and
neutral to acid red and yellow earths are predominant, and on gently sloping terrain or
depressions, cracking clay soils can form extensive plains often showing a gilgai micro
relief (cf. Goudie, et al., 1992). Sands with uniform texture profiles are characteristic of
levees or floodplains. Especially on gently undulating country developed on shales and
sandstone in the southeast of the region, hard-setting sandy loams or loams with motded
yellow clayey subsoils associated with mottled yellow duplex soils and sandy soils are
widespread. M a n y soils on the Kimberley Plateau are leached and c o m m o n soils of the
Great Soil Groups are Red and Yellow Earths and Lateritic Podzoilic soils. Ferruginous
concretions are widespread, but massive laterites are not common.
The vegetation of the Kimberley Plateau is dominated by grasses, often tall grasses
(>100 c m ) which generally form a closed layer. Scattered trees and shrubs are present,
Introduction 18
but the canopy they form is generally open with most trees below 10 m in height. Due to
higher average rainfall in the northwest of the area, the trees here are generally taller and
more densely spaced than those further southwest. According to Beard (1979), the
vegetation can be classified as high-grass savanna woodland (Eucalyptus
tetrodontat'Eucalyptus miniata alliance) which is the characteristic vegetation of the
widespread sandstone country with its skeletal soils and laterite residuals. High-grass
savanna woodland of the Eucalyptus tectificalEucalyptus grandifolia alliance is typical on
basalt and dolerite country. However, in the southern part of the Karunjie Plateau (Fig.
1.1), curly spinifex with a low savanna woodland of Eucalyptus phoenicea/Eucalyptus
ferruginea sub-alliance is widespread. The trees are poorly developed and generally less
tall than further northwest Locally Acacia spp. becomes prominent Along major rivers
and creeks, the Eucalyptus papuana (this species is now referred to as Eucalyptus sp.
'£" in the Kimberley region) alliance occurs, often fringed by Eucalyptus alba,
Eucalyptus apodophylla and Melaleuca leucadendron, with Pandanus aquaticus and
Barringtonia acutangula also common. Along major streamlines trees are often tall and
densely spaced whereas on broader alluvial surfaces the trees are frequently widely
spaced with only few shrubs or low trees in a parkland setting. Minor waterways are
lined by Eucalyptus polycarpalEucalyptus apodophylla alliances with a well developed
and dense low tree and shrub layer and an abundance of Grevillea and Melaleuca species.
Although only of minor extent, communities of Adansonia gregorii (boab or bottle tree)
and Eucalyptus grandifolia can form distinctive components of the vegetation, in
particular on alluvium and on shale scarps.
1.2.5 Relevant aspects of the contemporary climate
Summary descriptions of the general climatic conditions in the Kimberley region are
given in the CSIRO Australia Land Research Series (Slayter, 1960; Fitzpatrick and
Arnold, 1964; Slayter, 1970), the Climatic Adas of Australia (Bureau of Meteorology,
1988), and by Beard (1979).
Introduction 19
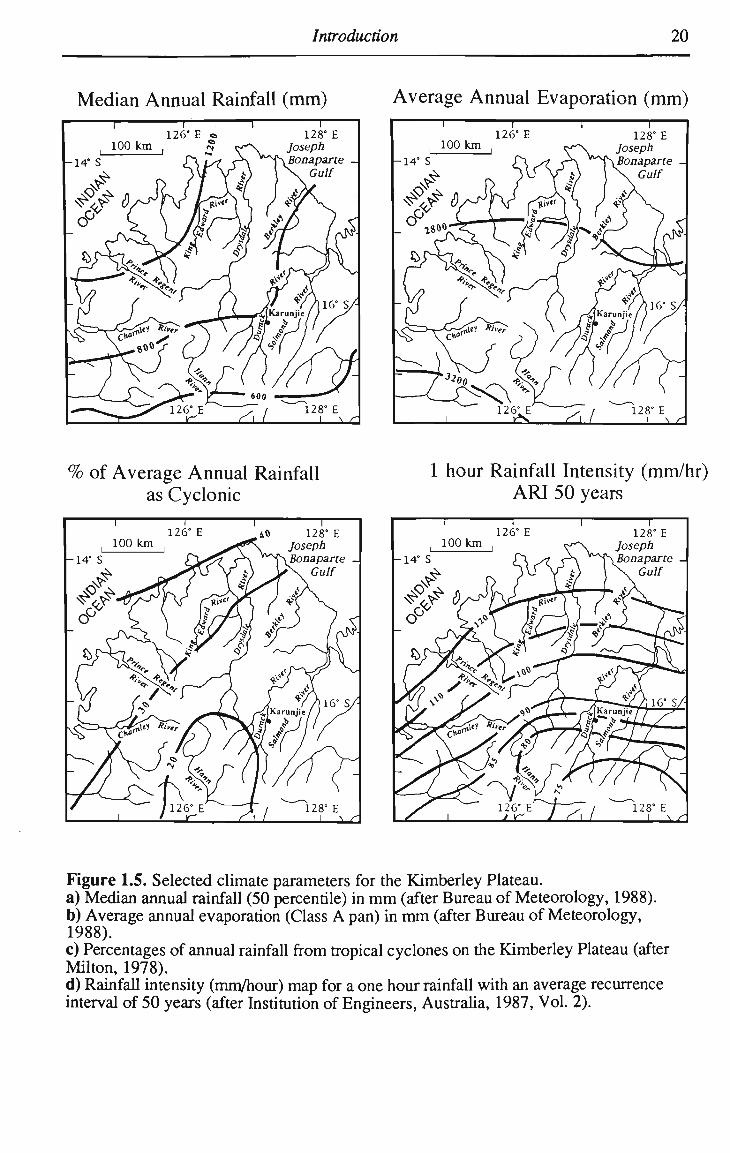
The Kimberley Plateau lies within the seasonally dry tropics with a summer
(November-April) rainfall regime. The summer months are generally hot and humid with
heavy periodic rains, while during winter (May-October) dry, mild to warm and generally
rainless conditions prevail. The variability of rainfall is moderate for the region and
median annual rainfall exceeds 1200 m m in the northwestern Kimberley and decreases
inland to less than 800 m m at the south-eastern margins of the Kimberley Plateau (Fig.
1.5a). Average annual pan evaporation varies from 2400 to 3200 m m from north to
south, resulting in a strongly negative annual water balance for the entire region (Fig.
1.5b). Mean monthly temperatures are generally above 18°C and mean monthly
maximum temperatures above 27 °C throughout the year. In the climatic classification
system of Koppen, the contemporary climate of the Kimberley Plateau is best described
as an A w savanna climate (cf. Gentilli, 1986) that grades into a BSh climate towards the
south.
The climate of the region is largely controlled by the seasonal shift of the anticyclonic
belt which extends across the Australian continent. In the winter half of the year, the
system moves northwards and dry southeasterly winds dominate with stable weather and
little cloud cover. During summer this anticyclonic belt moves southwards and a
monsoonal depression develops over northern Australia with westerly winds prevailing
over the northwestern part of the continent. Inland incursions of moist tropical maritime
air result in a hot wet season with much of the rainfall originating from tropical
depressions, thunderstorms and the monsoon trough. Very heavy rain and flooding are
often the result of disturbances associated with tropical cyclones which affect the
Kimberley region on average about once a year (Lourensz, 1981). The path taken and
intensity of the tropical cyclonic rainfall are subject to a high variability, however, they
are responsible for a large portion of the total annual rainfall in the Kimberley region,
especially in the western and northwestern coastal regions (Milton, 1978) (Fig. 1.5c).
Furthermore, daily rainfall associated with tropical cyclones in northwestern Australia is
significandy greater than that produced by other systems and extreme rainfall events are
generally related to such storms (Canterford and Pierrehumbert, 1977).
Introduction 20
Median Annual Rainfall ( m m ) Average Annual Evaporation ( m m )
% of Average Annual Rainfall 1 hour Rainfall Intensity (mm/hr) as Cyclonic A R I 50 years
Figure 1.5. Selected climate parameters for the Kimberley Plateau. a) Median annual rainfall (50 percentile) in m m (after Bureau of Meteorology, 1988). b) Average annual evaporation (Class A pan) in m m (after Bureau of Meteorology, 1988). c) Percentages of annual rainfall from tropical cyclones on the Kimberley Plateau (after Milton, 1978). d) Rainfall intensity (mm/hour) map for a one hour rainfall with an average recurrence interval of 50 years (after Institution of Engineers, Australia, 1987, Vol. 2).
Introduction 21
Event related rainfall data is often more meaningful than are average values, especially
for the flow characteristics of rivers. Regional estimates of magnitude and frequency of
hourly rainfall intensities are available from the Bureau of Meteorology and the Australian
Rainfall and Runoff guide published by the Institution of Australian Engineers (1987).
For example, Figure 1.5d shows regional estimates of rainfall intensities for a one hour
rainfall event with a return period of about 50 years. The influence of tropical cyclones
and thunderstorms as highly efficient rainfall producing mechanisms is reflected in the
high intensities along the northwestern coast Representative rainfall intensities near
Karunjie homestead located in the central part of the study area (Figs. 1.1,1.5d) were
prepared by the Bureau of Meteorology as a set of rainfall intensity-frequency-duration
curves (Appendix C). However, limitations of these design rainfalls arising from the low
density of 24 hour rainfall recording stations with often only relatively short periods of
record in the region, should be kept in mind. These problems are made even worse
because the effective area of rainstorms is likely to be small compared to the network of
recording stations and variation in rainfall intensity over different parts of the affected area
can be great
1.2.6 Palaeoclimate
To date, little is known about the Cainozoic climate of northwestern Australia (cf.
Galloway and K e m p , 1981; K e m p , 1981; Kershaw, 1988; Wyrwoll, 1993). Moist
tropical climates, possibly coincident with phases of deep weathering, are indicated by
palaeobotanical evidence which suggests that rainforest covered most of Australia until
the Miocene (Kemp, 1981; Martin, 1981). This period was probably followed by a
transitional phase until the Pliocene which saw an overall trend of increasing aridity and
cooling (Galloway and K e m p , 1981; Cockbain and Hocking, 1990). However, for
northwestern Australia, it remains unclear whether a considerably wetter climate than that
of today persisted into the late Tertiary or even the Early Pleistocene (Wyrwoll, 1993).
The climatic variations during the Quaternary, which had a strong impact on landform
evolution in glacial and periglacial environments elsewhere, affected the landscape
Introduction 22
forming processes of this region most likely through variations in the moisture regime.
The broad climatic history has very likely been dominated by a series of drier and wetter
phases associated with the glacials and interglacials respectively, similar to those reported
elsewhere in Australia (e.g. Nanson, et al., 1992), although the details for northern
Australia remain largely unclear (Wyrwoll, 1993). From a consideration of the
atmospheric circulation controls, it seems to be reasonable to assume drier conditions for
glacial stages and wetter conditions for interglacial stages (Wyrwoll, 1993). The lower
sea levels which were associated with the glacial periods, especially well documented for
the Last Glacial M a x i m u m (Andel, et al., 1967; Webster and Streten, 1978), led to the
exposure of large parts of the shallow continental shelf of northwestern Australia and
subsequent largely reduced sea areas to the north. In combination with an expanded
influence of the subtropical high pressure system during these periods, this is likely to
have resulted in a much weakened northwest monsoon, less frequent local thunderstorms
and a reduced occurrence of tropical cyclones and, therefore, a markedly reduced annual
precipitation in northern Australia (Colhoun, 1991). In periods of high sea levels and a
more southerly location of the anticyclonic belt, it seems to be reasonable to assume that
the prevailing climatic conditions were similar to those of today, but variation in the
intensity of the northwestern monsoon and the associated precipitation might have been
great (Wyrwoll, 1993). Further details of the late Quaternary climatic history of
northwestern Australia will be discussed in the relevant sections of this study.
1.3 General knowledge of the fluvial geomorphology of the Kimberley Plateau
Most information about the river systems of the Kimberley Plateau originates from
brief descriptions in surveys or reports like those of the C S L R O Land Series or the
Explanatory Notes for the 1:250 000 Geological M a p Series. Specific studies of fluvial
morphology and process have been conducted in neighbouring areas, for example the
studies of palaeofloods by Gillieson et al. (1991) and Wohl et al. (1994a, 1994c), and of
bedrock channel incision by Wohl (1993). The dynamics of tidal rivers and estuarine
Introduction 23
floodplains in the region have been the subject of several studies (e.g. Wright, et al.,
1973; 1975; Coleman and Wright 1978; Callahan, 1986), but these works are not of
concern here.
Jutson (1914; 1934) provided the first descriptions of some principle characteristics of
the river systems, such as the striking abundance of narrow gorges and water gaps, and
the conspicuous roughly radial arrangement of the main streams from about M t Hann
Q^ig. 1.4). Subsequent workers added more detailed observations and in essence these
studies may be summarised as follows. Uplift of the region (Late Tertiary?) has resulted
in the latest period of stream incision with the formation of incised valleys, some of them
in the form of spectacular gorges. Strong structural control on the drainage pattern is
apparent in most of the dissected region (Stewart, et al., 1960), especially for minor
streams (Gellatiy and Sofoulis, 1969; Roberts and Perry, 1969; Gellatiy, et al., 1975).
The most impressive example of a large river controlled by a zone of weakness in the
bedrock is the almost straight Prince Regent River (Fig. 1.4) which has developed along
a more than 100 k m long lineament on the western Kimberley Plateau (Stewart, et al.,
1960; Plumb and Gemuts, 1976). However, some major streams further east on the
Kimberley Plateau lack obvious structural control, and meandering gorges along rivers
such as the Drysdale, Forrest, Salmond and Durack Rivers (Fig. 1.4) were interpreted as
being inherited from rivers which once meandered across an ancient land surface
(Derrick, 1969; Gellatiy and Sofoulis, 1969; Roberts and Perry, 1969; Plumb and
Veevers, 1971; Gellatiy, et al., 1975; Plumb and Gemuts, 1976). However, it is now
widely accepted that ingrown meanders, as occur in the study area, do not retain
planforms inherited from ancient rivers that meandered across a planation surface, but are
'autogenic' forms (Twidale and Campell, 1993a, p.166-171).
Previous interpretations of the meandering gorges along the Durack and Salmond
Rivers as the result of stream rejuvenation may have been partly motivated by the
occurrence of long flat stream profiles found upstream of the incised lower parts of these
rivers. Young and Young (1992, p.98-99) investigated longitudinal profiles of some
rivers draining the western Kimberley Plateau (Fig. 1.1) and found surprisingly little
Introduction 24
reflection of lithological changes from Sandstones to Volcanics along the gently sloping
parts of these profiles. In traditional climatic geomorphology (cf. Tricart and Cailleux,
1972; Garner, 1974; Biidel, 1977) such gently sloping stream reaches were generally
seen as indicative of tropical weathering and tropical hydrologic regimes. However,
Young & Young (1992, p.151) highlighted the problems of traditional concepts of
climato-gentic zones and demonstrated that the diversity of sandstone landforms found
within a single morphogenetic region matches, or even exceeds that found between
different regions. Fluvial processes in particular are capable of producing similar forms
under various climatic settings and many fluvial forms can be considered as aclimatic
(Baker and Twidale, 1991).
The extensive body of literature concerned with tropical geomorphology, including the
traditional ideas and their limitations, have recendy received a detailed review by Thomas
(1994), Traditional concepts of tropical rivers suggested shallow valleys and a lack of
bedload as typical characteristics. For example, in Biidel's (1977) classification of
homogenous morphogenetic regions based on a climatic zonation, the Kimberley Plateau
was mapped as part of the zone of excessive planation in the outer tropics. Characteristics
for the rivers of this zone are, supposedly, a lack of coarse material in the bedload and an
absence of stream incision. Rapids and waterfalls along the rivers are caused by outcrops
of unweathred bedrock which are considered to be very stable in position. The apparent
inability of the rivers to actively incise into bedrock was attributed to the lack of coarse
bedload which could function as 'tools' for mechanical erosion. For the morphology of
tropical streams, the chemical weathering of bedrock beneath the channel bed was
regarded as most important and the main process of valley development and stream
incision was, therefore, seen as an extension of wash processes across the valley floor
(Bremer, 1971). However, many studies on tropical landforms are from remnants of
Gondwanaland, and Wirthman (1985) suggested that the apparent lack of stream incision
and the abundance of rapids and waterfalls in some rivers (cf. Biidel, 1957; Tricart,
1965) may actually be the result of the exposure of very resistant rocks by long lasting
denudation rather than the result of tropical climate per se.
Introduction 25
In the last decades, the concepts of traditional tropical geomorphology have been
gready revised and new themes of research have emerged (Gupta, 1993). Many
contemporary studies of tropical geomorphology and fluvial geomorphology in general,
recognise the lithological and structural constraints on fluvial forms and the importance of
seasonal rainfall and high magnitude floods on fluvial processes. In areas of high flood
potential, such as regions subject to tropical storms, the imprint on channel and valley
form from large flood events may persist under suitable basin physiography and geology
for long periods of time (Gupta, 1983; 1988). However, resistance factors play an
important role for flood erosion (Baker, 1988) and while bedrock channels may be
subject to exceptional and permanent channel changes, alluvial channel reaches in the
same region may recover rapidly from such destructive flood events.
Along the rivers on the Kimberley Plateau, both alluvial and bedrock channel reaches
occur, often alternating. Furthermore, the region is subject to tropical storms
characterized by very intense rainfalls. Besides lithology and geological structure, floods
of different magnitude and frequency may therefore prove to be of particular importance
in controlling the channel morphology of alluvial and bedrock reaches in this tropical
environment.
1.4 Regional discharge regime
In the Kimberley region, the number of discharge gauging stations is low, with most
stations having only short periods of record, and many stations being not rated at present.
As a consequence, the amount of published discharge data for the region is only small.
O n the southern Karunjie Plateau, the study area proper, there are only two gauging
stations, one on Bindoola Creek and the other one on the Durack River near Karunjie.
The discharges recorded at the station at Bindoola Creek are published, but the station
ceased operation in 1979 after only 10 years of record. N o data has been published for
the station on the Durack River, however, a preliminary rating curve is available for this
station, but discharge values presented here should be viewed with some caution.
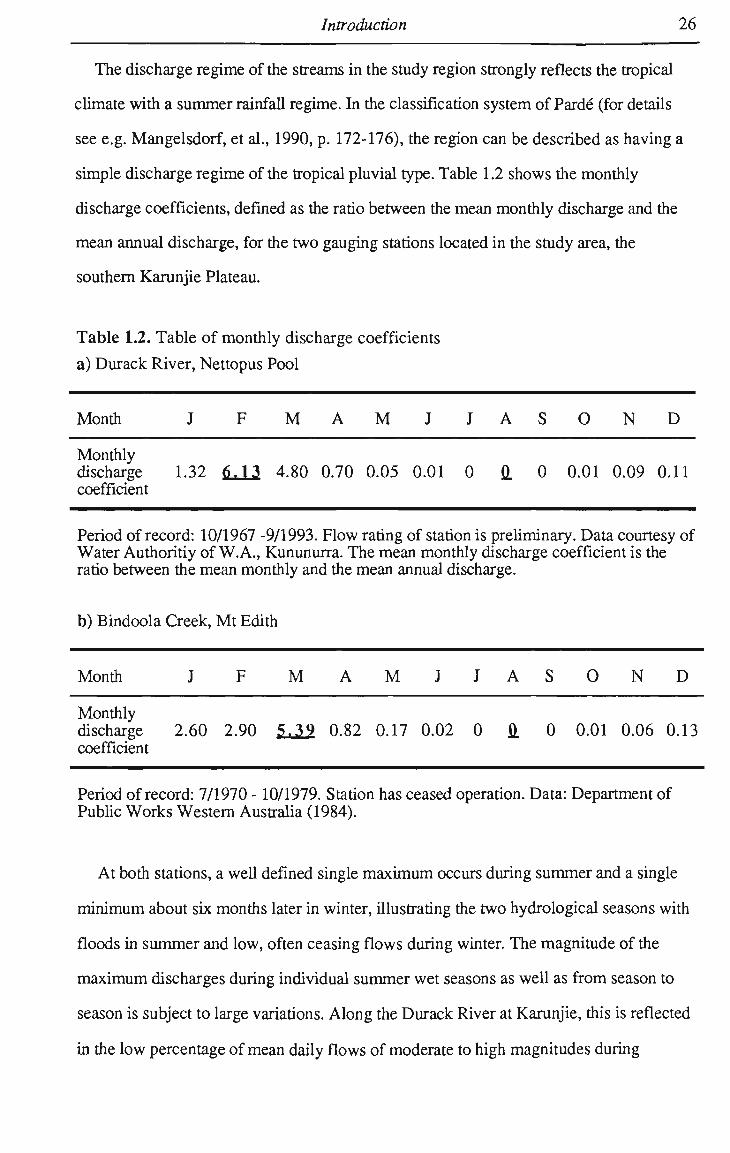
Introduction 26
The discharge regime of the streams in the study region strongly reflects the tropical
climate with a summer rainfall regime. In the classification system of Parde (for details
see e.g. Mangelsdorf, et al., 1990, p. 172-176), the region can be described as having a
simple discharge regime of the tropical pluvial type. Table 1.2 shows the monthly
discharge coefficients, defined as the ratio between the mean monthly discharge and the
mean annual discharge, for the two gauging stations located in the study area, the
southern Karunjie Plateau.
Table 1.2. Table of monthly discharge coefficients
a) Durack River, Nettopus Pool
Month
Monthly discharge coefficient
J F
1.32 6.13
M A M J
4.80 0.70 0.05 0.01
J
0
A
Q.
S
0
O N D
0.01 0.09 0.11
Period of record: 10/1967 -9/1993. Flow rating of station is preliminary. Data courtesy of Water Authoritiy of W.A., Kununurra. The mean monthly discharge coefficient is the ratio between the mean monthly and the mean annual discharge.
b) Bindoola Creek, Mt Edith
Month
Monthly discharge coefficient
J
2.60
F
2.90
M A M J J
5,39 0.82 0.17 0.02 0
A
o
S
0
O N D
0.01 0.06 0.13
Period of record: 7/1970 - 10/1979. Station has ceased operation. Data: Department of Public Works Western Australia (1984).
At both stations, a well defined single maximum occurs during summer and a single
minimum about six months later in winter, illustrating the two hydrological seasons with
floods in summer and low, often ceasing flows during winter. The magnitude of the
maximum discharges during individual summer wet seasons as well as from season to
season is subject to large variations. Along the Durack River at Karunjie, this is reflected
in the low percentage of mean daily flows of moderate to high magnitudes during
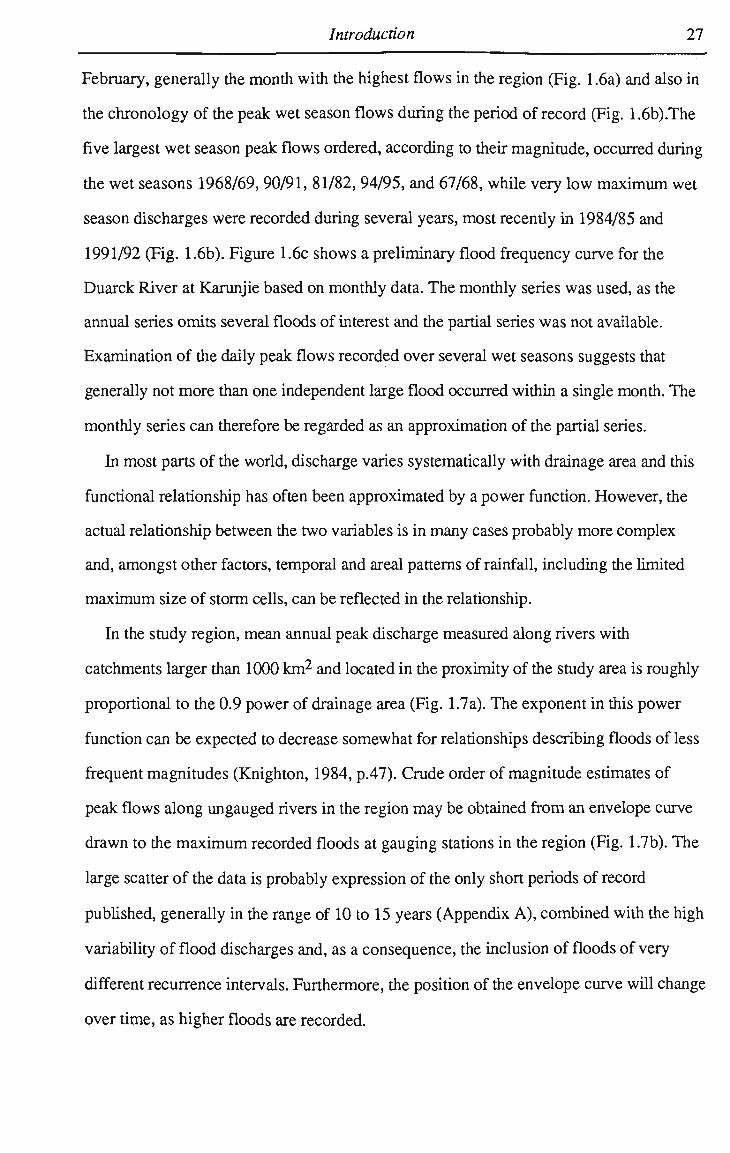
Introduction 27
February, generally the month with the highest flows in the region (Fig. 1.6a) and also in
the chronology of the peak wet season flows during the period of record (Fig. 1.6b).The
five largest wet season peak flows ordered, according to their magnitude, occurred during
the wet seasons 1968/69,90/91, 81/82, 94/95, and 67/68, while very low maximum wet
season discharges were recorded during several years, most recentiy in 1984/85 and
1991/92 (Fig. 1.6b). Figure 1.6c shows a preliminary flood frequency curve for the
Duarck River at Karunjie based on monthly data. The monthly series was used, as the
annual series omits several floods of interest and the partial series was not available.
Examination of the daily peak flows recorded over several wet seasons suggests that
generally not more than one independent large flood occurred within a single month. The
monthly series can therefore be regarded as an approximation of the partial series.
In most parts of the world, discharge varies systematically with drainage area and this
functional relationship has often been approximated by a power function. However, the
actual relationship between the two variables is in many cases probably more complex
and, amongst other factors, temporal and areal patterns of rainfall, including the limited
maximum size of storm cells, can be reflected in the relationship.
In the study region, mean annual peak discharge measured along rivers with
catchments larger than 1000 km2 and located in the proximity of the study area is roughly
proportional to the 0.9 power of drainage area (Fig. 1.7 a). The exponent in this power
function can be expected to decrease somewhat for relationships describing floods of less
frequent magnitudes (Knighton, 1984, p.47). Crude order of magnitude estimates of
peak flows along ungauged rivers in the region may be obtained from an envelope curve
drawn to the maximum recorded floods at gauging stations in the region (Fig. 1.7b). The
large scatter of the data is probably expression of the only short periods of record
published, generally in the range of 10 to 15 years (Appendix A), combined with the high
variability of flood discharges and, as a consequence, the inclusion of floods of very
different recurrence intervals. Furthermore, the position of the envelope curve will change
over time, as higher floods are recorded.
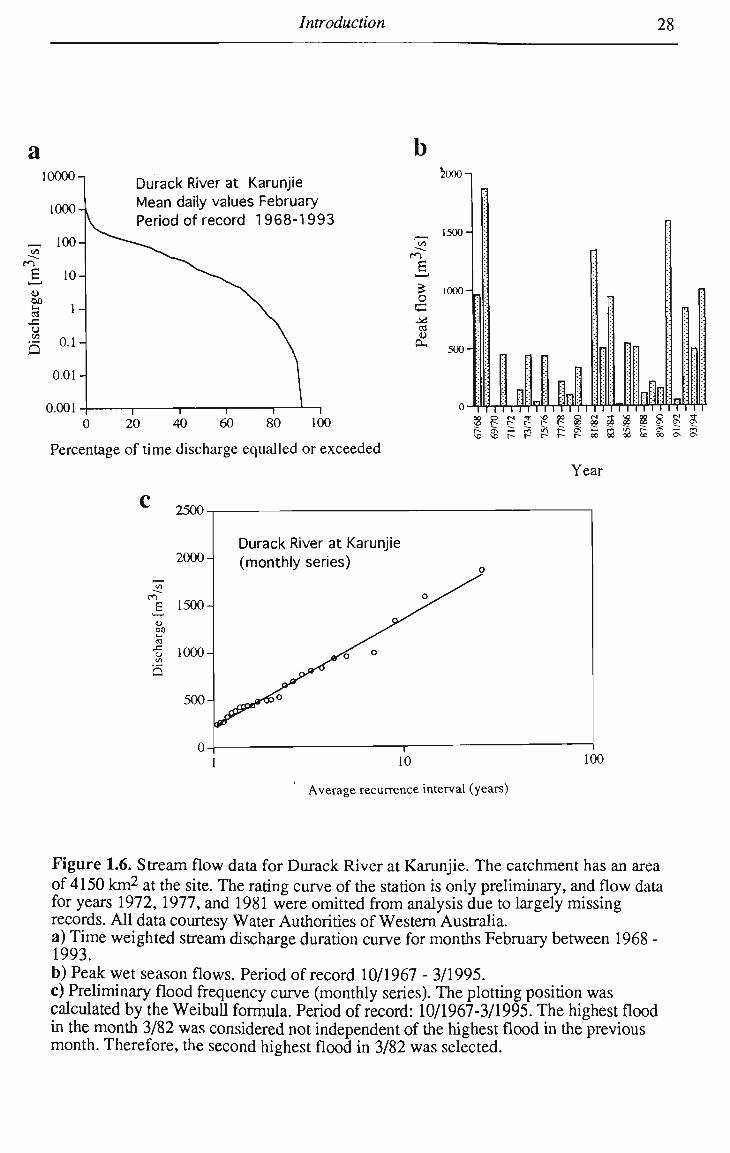
Introduction 28
a b Durack River at Karunjie Mean daily values February Period of record 1968-1993
en
B
o
a 0-
iooo-i
1500'
1000-
500-
ij.lp rr 40 60 80 100
Percentage of time discharge equalled or exceeded
IT I 'i' I T T T T I T'l"!' I TTTT'I'T'I'
Year
2500-
2000-
£ 1500
0) 00
u 1000-
500-
0-
Durack River at Karunjie (monthly series)
10 100
Average recurrence interval (years)
Figure 1.6. Stream flow data for Durack River at Karunjie. The catchment has an area of 4150 k m 2 at the site. The rating curve of the station is only preliminary, and flow data for years 1972, 1977, and 1981 were omitted from analysis due to largely missing records. All data courtesy Water Authorities of Western Australia. a) Time weighted stream discharge duration curve for months February between 1968 -1993. b) Peak wet season flows. Period of record 10/1967 - 3/1995. c) Preliminary flood frequency curve (monthly series). The plotting position was calculated by the Weibull formula. Period of record: 10/1967-3/1995. The highest flood in the month 3/82 was considered not independent of the highest flood in the previous month. Therefore, the second highest flood in 3/82 was selected.
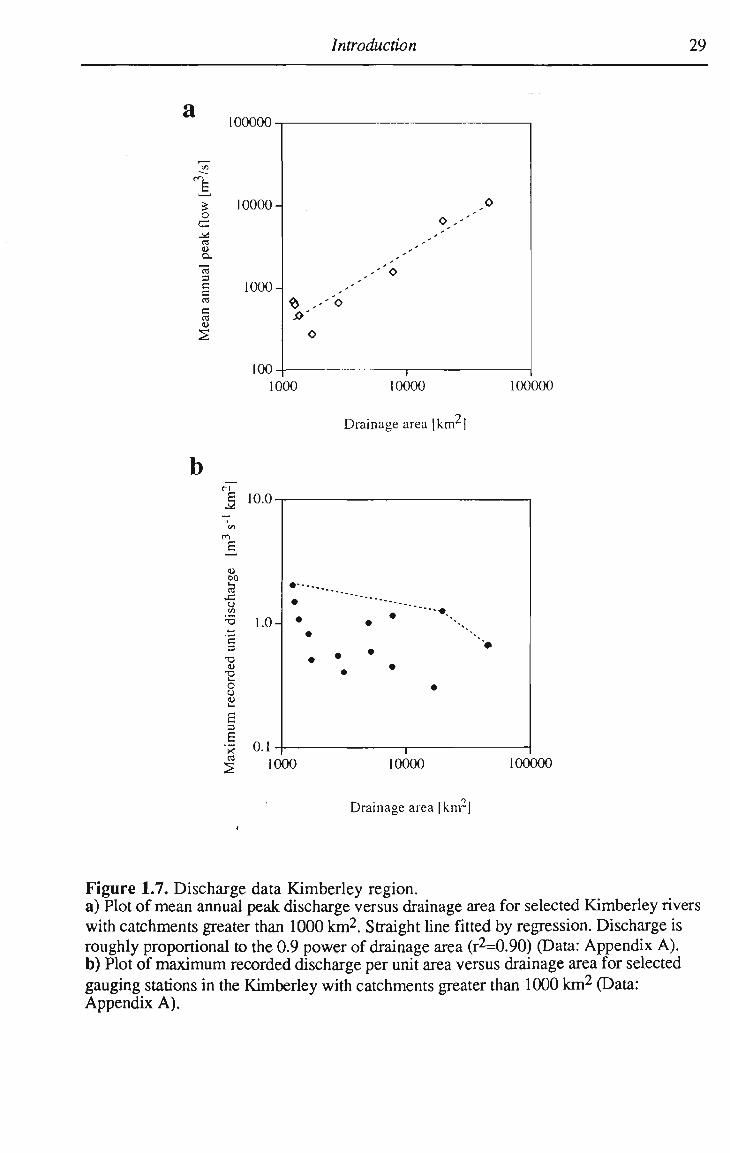
Introduction 29
a
b
l00000
o
<a u CL.
"5 c c c 03 1)
10000-
1000-
1000 10000
Drainage area [km2]
100000
10.0
00
c 3
-o
•s o u u E E "S
s
1000 10000 100000
Drainage area [knrj
Figure 1.7. Discharge data Kimberley region. a) Plot of mean annual peak discharge versus drainage area for selected Kimberley rivers with catchments greater than 1000 km2. Straight line fitted by regression. Discharge is roughly proportional to the 0.9 power of drainage area (r2=0.90) (Data: Appendix A) . b) Plot of maximum recorded discharge per unit area versus drainage area for selected gauging stations in the Kimberley with catchments greater than 1000 k m 2 (Data: Appendix A ) .
Introduction 30
Estimates of both magntitude and frequency of floods may be obtained from flood
frequency analysis conducted for individual stations (Fig. 1.6c), however, most streams
in the region are ungauged and the generally only short periods of record make estimates
of rare high magnitude floods unreliable. An alternative represent simple design methods
which are based on observed regional data from all suitable stations. A full description of
such methods is provided in a guide to flood estimation published by the Institution of
Engineers Australia (1987). For catchments on the eastern Kimberley Plateau, the
Australian Institute of Engineers recommends the Rational Method which is based upon
data from 17 drainage basins ranging in size from 29.6 to 44 900 km2. To estimate peak
flows, the Rational Method uses estimates of regional average rainfall intensities
(Appendix C) of the same recurrence interval as the flow event. This method was used to
estimate the magnitude of design floods for selected recurrence intervals for a study site
along the Durack River. Details about the calculations are given in Appendix D and the
results will be discussed later in this study.
2. OUTLINE OF THE METHODS USED
2.1 Morphometric data source, measurement and analysis
The availability of published maps and air photographs for the region is restricted to
small and medium scale topographic maps, geological maps and aerial photos. The most
detailed available topographic maps have a scale of 1:100 000 (Series R611) and a
contour interval of 20 m. These maps were compiled from aerial photographs (approx.
scale 1:82 000) produced in the 1960's and were detail annotated in the 1970's. The most
recent maps are 1:250 000 topographic maps of the 1501 Series which were derived from
the older R611 maps. A n earlier version of the 1:250 000 topographic maps series
(R502) was based on aerial photography (approx. scale 1:50 000) conducted in 1948-49.
The available geological maps (1:250 000) were compiled from these aerial photographs
as well.
The morphometric variables determined in this study and the methods used to obtain
the data are defined at the appropriate locations in the text. Some additional general
information on the methods used is given in the following section.
The morphometric data obtained in this study were largely determined from the 1:100
000 topographic maps which represent the best readily available sources for medium to
small scale morphometric analysis. However, for drainage basins larger than 100 km2,
basin area, basin perimeter, and basin length were determined from the 1:250 000
topographic maps. For the purpose of this study, the accuracy of the data obtained from
these smaller scaled maps was considered to be sufficient.
The various methods to obtain morphometric data from topographic maps and their
problems have been the subject of numerous studies (e.g. Gardiner, 1975; Gardiner,
1981). As generally recommended, in this study, area was measured with a polar
planimeter and measurements of length were made using an opisometer, except for local
valley gradient where a divider set to 2 m m was used.
Outline of the methods used 32
The quadrat sampling method was employed for the determination of certain
morphometric variables specified in the text. For this purpose, a quadrat size of 10 x 10
k m was chosen which is sufficiendy large to include valley bottom and interfluves in the
sample area and, therefore, to provide meaningful values of measures involving relief.
The Australian M a p Grid served as superimposed sample grid. Since there is no
systematic relationship between this geographic map grid and the measured morphometric
parameters the sampling method using regularly spaced quadrats was not considered
problematic.
Drainage density (Horton, 1945), or quadrat drainage density, was estimated from
surrogate measures which allow a more rapid determination than conventional methods
(cf. McCoy, 1971; Mark, 1974; Richards, 1979). In this study, three surrogate indices
for drainage density, the number of intersections of a sample line with the drainage
network, the number of stream junctions and the number of stream sources per quadrat
were measured for all 10 x 10 k m quadrats. The topological measures were simply
counted for each sample square, and the line intersection method involved the counting of
intersections (N) of a sample traverse with the blue line drainage network. A gridded 2 by
2 k m sample traverse with a total length (1) of 120 k m per 1 0 x 1 0 k m sample square was
used. The three variables were determined for all 192 sample squares covering the study
area and, as expected, the correlation between all variables is high (Tab. 2.1). These
surrogate measures of drainage density were then compared with values for drainage
density determined conventionally as the total length of streams (blue line network) per
area for 10 randomly chosen sample squares (Tab. 2.2). All correlations between
measured drainage density and the surrogate measures were significant with the best
results obtained with the line intersection method, the method used in this study.
To convert the number of line intersections per unit length into drainage density
values, the result was multiplied by a correction coefficient. Mark (1974) recommended a
theoretically and empirically derived correction coefficient of 1.57, and using this
coefficient, a good fit between drainage density and line intersections is obtained in this
study as well (Fig. 2.1).
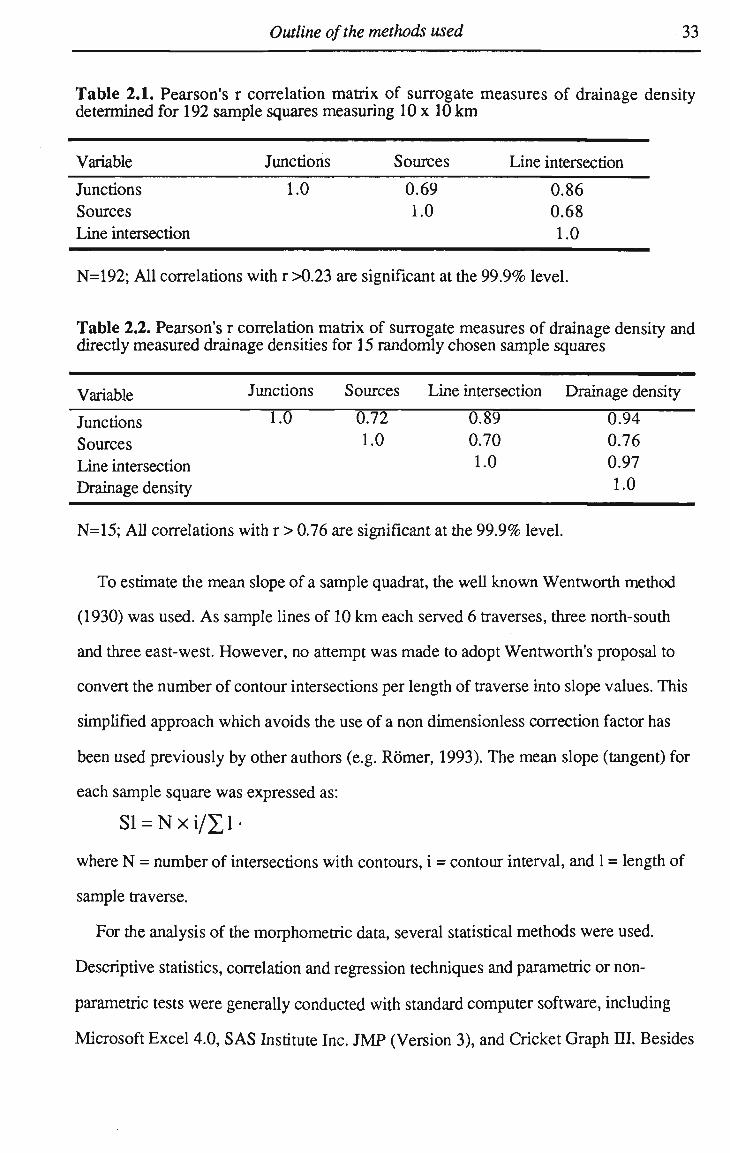
Outline of the methods used 33
Table 2.1. Pearson's r correlation matrix of surrogate measures of drainage density determined for 192 sample squares measuring 10 x 10 k m
Variable
Junctions
Sources
Line intersection
Junctions
1.0
Sources
0.69
1.0
Line intersection
0.86
0.68
1.0
N=192; All correlations with r >0.23 are significant at the 99.9% level.
Table 2.2. Pearson's r correlation matrix of surrogate measures of drainage density and direcdy measured drainage densities for 15 randomly chosen sample squares
Variable
Junctions
Sources
Line intersection
Drainage density
Junctions
1.0
Sources
0.72
1.0
Line intersection
0.89
0.70
1.0
Drainage density
0.94
0.76
0.97
1.0
N=15; All correlations with r > 0.76 are significant at the 99.9% level.
To estimate the mean slope of a sample quadrat, the well known Wentworth method
(1930) was used. As sample lines of 10 k m each served 6 traverses, three north-south
and three east-west. However, no attempt was made to adopt Wentworth's proposal to
convert the number of contour intersections per length of traverse into slope values. This
simplified approach which avoids the use of a non dimensionless correction factor has
been used previously by other authors (e.g. Romer, 1993). The mean slope (tangent) for
each sample square was expressed as:
Sl = Nxi/£l<
where N = number of intersections with contours, i = contour interval, and 1 = length of
sample traverse.
For the analysis of the morphometric data, several statistical methods were used.
Descriptive statistics, correlation and regression techniques and parametric or non-
parametric tests were generally conducted with standard computer software, including
Microsoft Excel 4.0, S A S Institute Inc. J M P (Version 3), and Cricket Graph III. Besides
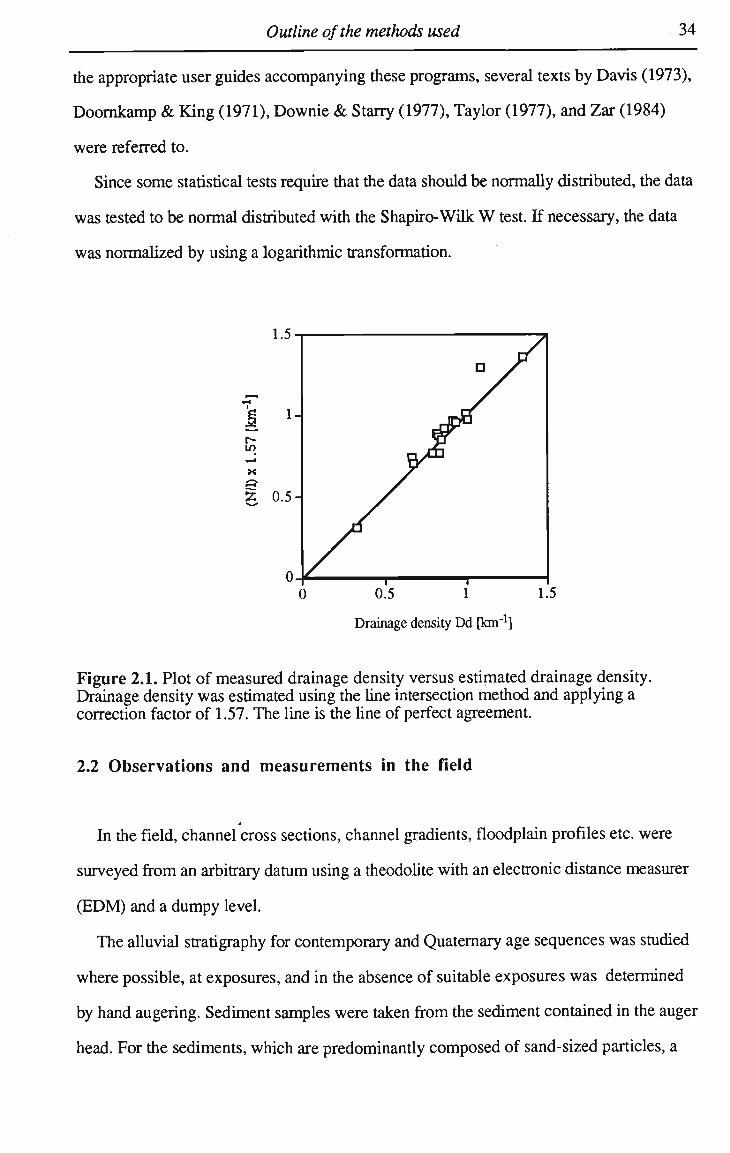
Outline of the methods used 34
the appropriate user guides accompanying these programs, several texts by Davis (1973),
D o o m k a m p & King (1971), Downie & Starry (1977), Taylor (1977), and Zar (1984)
were referred to.
Since some statistical tests require that the data should be normally distributed, the data
was tested to be normal distributed with the Shapiro-Wilk W test. If necessary, the data
was normalized by using a logarithmic transformation.
r-m
2 0.5-
1 1.5
Drainage density Dd [km"1]
Figure 2.1. Plot of measured drainage density versus estimated drainage density. Drainage density was estimated using the line intersection method and applying a correction factor of 1.57. The line is the line of perfect agreement.
2.2 Observations and measurements in the field
In the field, channel cross sections, channel gradients, floodplain profiles etc. were
surveyed from an arbitrary datum using a theodolite with an electronic distance measurer
(EDM) and a dumpy level.
The alluvial stratigraphy for contemporary and Quaternary age sequences was studied
where possible, at exposures, and in the absence of suitable exposures was determined
by hand augering. Sediment samples were taken from the sediment contained in the auger
head. For the sediments, which are predominantly composed of sand-sized particles, a
Outline of the methods used 35
hand lens and texture chart were used to determine roughly the dominant grain-size class
and the degree of sorting. Colour was recorded by use of a Munsell colour chart on dry
sediment. Selected sediment samples were collected for detailed size analysis in the
laboratory. The size of boulders (long, intermediate and short axes) was measured with a
tape measure and boulder inclination (imbrication) determined with a geological
(Brunton) compass.
Sediment samples for thermoluminescence dating (TL) were taken from freshly
cleaned exposure surfaces using open ended metal tubes which were immediately
wrapped in black plastic to preserve the environmental moisture content and to avoid
further light exposure. Some T L samples were collected by cutting a block from the unit
of interest, and where no suitable exposures were present, T L samples were taken by
hand augering. In the latter cases, a sample at required depth was extracted from sediment
contained in the augerhead and sealed in black plastic bags. Care was taken to avoid
contamination of the samples and all samples were taken from homogenous deposits with
no dissimilar material within a radius of at least 30 cm. For samples taken by hand
augering this was assured by restricting this method to thick homogenous sandy
floodplain deposits.
A type N Schmidt hammer was used to determine surface hardness of rocks. It is a
spring-loaded device which records rebound values dependent on the compressive
strength of the test material. Recorded rebound values are transformed into compressive
strength values using the calibration graph provided with the instrument (details in Day
and Goudie, 1977).
2.3 Analytical techniques
2.3.1 Sediment analysis
Sieve analysis. The particle size determination was conducted by sieving.
Recommendations on sample preparation, sieving procedures, and grain size analysis are
Outline of the methods used 36
numerous, and in this study standard sieving procedures as outlined by Folk (1974),
Lindholm (1987), and McManus (1988) were followed.
Bulk splitting of sample sizes was done using riffle boxes. Where necessary, organic
matter was removed using hydrogen peroxide and carbonates were removed using dilute
hydrochloric acid. Material finer than 4 phi was separated by wet sieving with calgon
used as dispersal agent and the silt-clay content of the total sample was determined from
the weight loss, although, most samples consisted almost entirely of clean sand. The
oven dried samples were dry sieved on a vibration shaker using a nest of sieves with a
0.5 phi subdivision and a shaking time of 20 minutes. Grain size distributions were
analysed using standard graphical methods (e.g. Folk and Ward, 1957; Folk, 1974;
Lindholm, 1987; McManus, 1988) and statistical measures as defined by Folk and Ward
(1957) were calculated in the phi system.
Organic matter content. The content of organic matter was estimated for some
samples from the weight loss resulting from a one hour combustion at 500°C. The dry
samples was weighed, combusted, cooled in an desiccator and again weighed. The
organic matter content is expressed as the percentage weight of the original sample. For
samples with a high sand content, such as the samples analysed here, the combustion
method yields sufficiently accurate results (Schachtschabel, et al., 1989).
2.3.2 Thermoluminescence dating
Thermoluminescence (TL) dating was used in this study to determine the age of sandy
alluvium flanking rivers in the study region. All T L dating of sediments was carried out
by David Price in the T L Dating Laboratory of the University of Wollongong. Most
samples were dated using essentially the combined regenerative additive quartz coarse-
grain technique as modified by Readhead (1984; 1988). A few younger samples were
analysed using the additive method as described by Aitken (1985). A comprehensive
description of T L dating methods and applications is given by Aitken (1985), and the
method used in the Wollongong Laboratory was described in detail by Nanson et al.
(1991).
Outline of the methods used 37
Sedimentary T L dating is based on the acquisition of long term stable storage of T L
energy by crystalline minerals contained within the sediment, with quartz being the most
commonly used luminescent mineral employed in this dating process. The energy
originates primarily from a weak radiation flux delivered by long-lived isotopes (U, Th,
K ) present in the surrounding sediment and by cosmic radiation, and it is stored in form
of electrons trapped at sites of lattice charge disequilibrium, or simply electron traps. The
dating method requires that previously accumulated T L is removed from sand grains by
exposure to sunlight during the process of transport. After burial the T L begins to built
up again at a rate dependant on the site specific radiation flux. The period since the last
exposure to sunlight of a sediment may, therefore, be determined from the total amount
of stored T L energy (the palaeodose P) and the rate at which the energy was acquired (the
annual radiation dose A R D ) according to
TLAge = P/ARD.
Given sufficient time, a sedimentary deposit may accumulate a radiation dose large
enough to cause the electron traps in the quartz to become filled and hence a T L saturation
point is reached. This sets a practical upper limit for this dating technique. As a
consequence, only minimum T L ages can be determined for T L saturated sediment
samples, with the actual age of the sample possibly very much older.
2.3.3 Uranium-Thorium dating
Uranium-series disequilibrium dating was used in this study to estimate the absolute
age of two samples of ferruginous conglomerates of fluvial origin. In addition to the
Uranium/Thorium (U/Th) dating of these samples, the cemented sandy matrix of the
conglomerates was also T L dated which provided an independent check of these dates.
This work forms part of ongoing research and a full account on the dating method used,
the results obtained, and their interpretation will be published at a later stage.
The U/Th dating was carried out by Dr. H. Heijnis at the Australian Nuclear Science
and Technology Organisation (ANSTO), Sydney. Descriptions of Uranium-series dating,
its methods and various applications are given by Ku, (1976), Schwarcz and Gascoyne
Outline of the methods used 38
(1984), or can be found in the comprehensive volume edited by Ivanovisch and Harmon
(1992). The method of dating Fe/Mn oxyhydroxides and oxides has been described in
detail by Short at al. (1989) and Nanson et al. (1991).
In general, uranium-series disequilibrium dating methods are based on the decay or
growth of uranium parent and daughter nuclides. The method of interest here is based on
the accumulation of decay products of uranium in a sample under the assumption that the
sample remained closed to nuclide migration (closed-system behaviour). If no daughter
products were present at the time of formation of the sample its age can be determined
from measured ratios of relevant isotopes (230Th / 2 3 4 U dating method). Correction
techniques have to be applied if the presence of detrital 2 3 8 U , 2 3 4 U and 2 3 0 Th in the
sample is indicated.
The secondary mineral accumulations of Fe/Mn oxyhydroxides and oxides dated in
this study had to be corrected for detrital components, and therefore, total and leach
analysis were conducted for both samples. Corrected secondary mineral 2 3 4 U / 2 3 8 U and
2 3 0Th / 2 3 2Th activity ratios where derived from plots of the appropriate isotope ratios, a
commonly used method (e.g. Short, et al, 1989).
The ages determined by this method represent the timing of uranium precipitation, and
therefore, if correct, can not exceed the ages of the host sediment, in this case, the age of
the conglomerate.
3. REGIONAL MORPHOLOGICAL ANALYSIS OF THE STUDY AREA
3.1 General description of the morphology
The study area on the southern Karunjie Plateau comprises the drainage basins of the
Durack River, the Salmond River, and that of Bindoola Creek with a total drainage area
of about 20 000 k m 2 (Fig. 3.1). At the northeastern margin of the study area, these
streams join the macro tidal west arm of the Cambridge Gulf estuary, which extends
northwards for about 100 k m before it reaches the open waters of the Joseph Bonaparte
Gulf (Fig. 3.1). The study area is dominated by sedimentary rocks of the Kimberley
Group, mosdy sandstones and interbedded siltstones (Fig. 3.2). The sedimentary strata
are horizontal to gently folded, in places cross-folded into broad dome-and-basin
structures. The variable resistance and the structural attitude of the underlying strata
exerts a strong control upon the landforms. Plateaux, mesas, structural benches and
plains are typical landform elements where strata are horizontal. Where they are dipping,
a cuesta landscape with steep cuesta-front scarps and gentle dip slopes is found. The
caprocks in the study area are generally resistant sandstone layers which frequendy form
cliffs along the scarps of cuestas and plateaux, while the gentler lower scarp slopes (cf.
Schmidt, 1987) are formed of weaker sandstones or siltstones. The main caprocks in the
study area are the Upper Pentecost Sandstone, in particular its basal beds (Fig. 3.2b,
Bluff Face Range, east of Karunjie), the Lower Pentecost Sandstone, and the Warton
Sandstone (Fig. 3.3). However, the latter is only dissected below its base at the eastern
margin of the study area, where the associated scarp separates the Karunjie Plateau from
the neighbouring Gibb Hill subprovince underlain by Carson Volcanics (Figs. 1.1, 3.2).
High scarps capped by Lower Pentecost Sandstone have gende lower scarp slopes
formed on Elgee Siltstone, with the narrow outcrops of the latter generally marking the
position of these scarps (Fig. 3.2a).
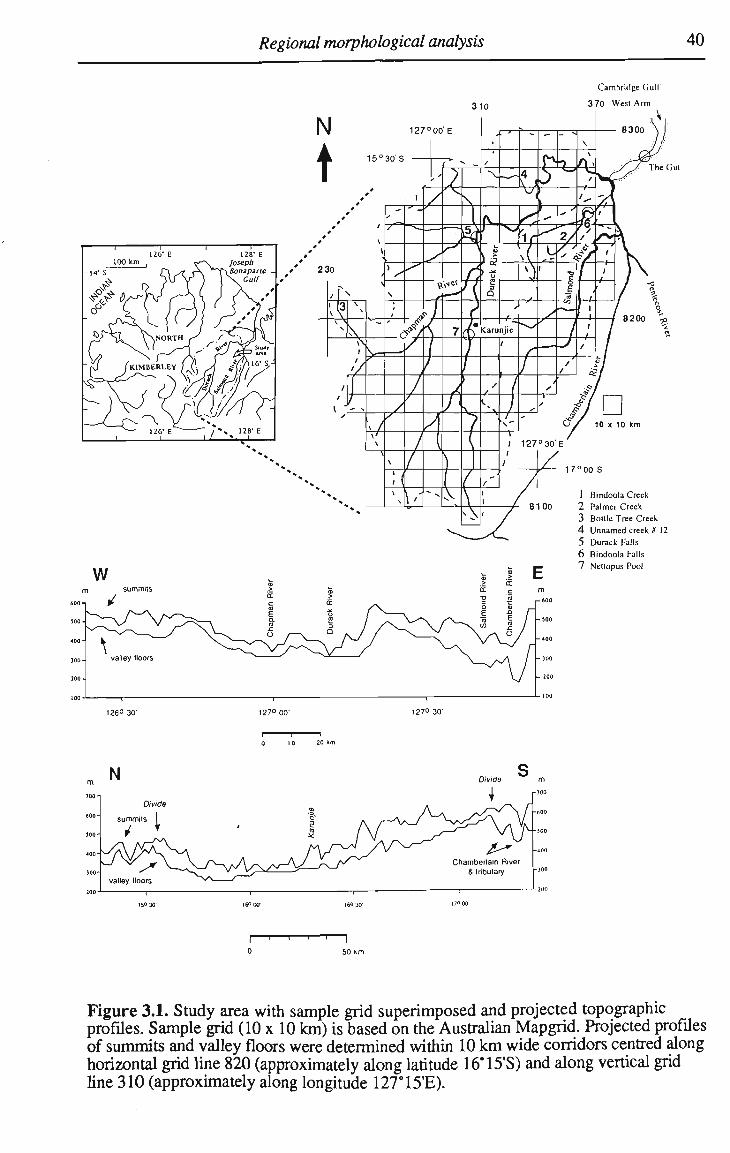
Regional morphological analysis 40
Cambridge Gulf
370 West Arm
126° 30' 127° 00' 127° 30'
I l I 0 io 20 km
150 30' 160 off 16° 30' 17° 00
0 50 km
Figure 3.1. Study area with sample grid superimposed and projected topographic profiles. Sample grid (10 x 10 km) is based on the Australian Mapgrid. Projected profiles of summits and valley floors were determined within 10 k m wide corridors centred along horizontal grid line 820 (approximately along latitude 16°15'S) and along vertical grid line 310 (approximately along longitude 127°15'E).
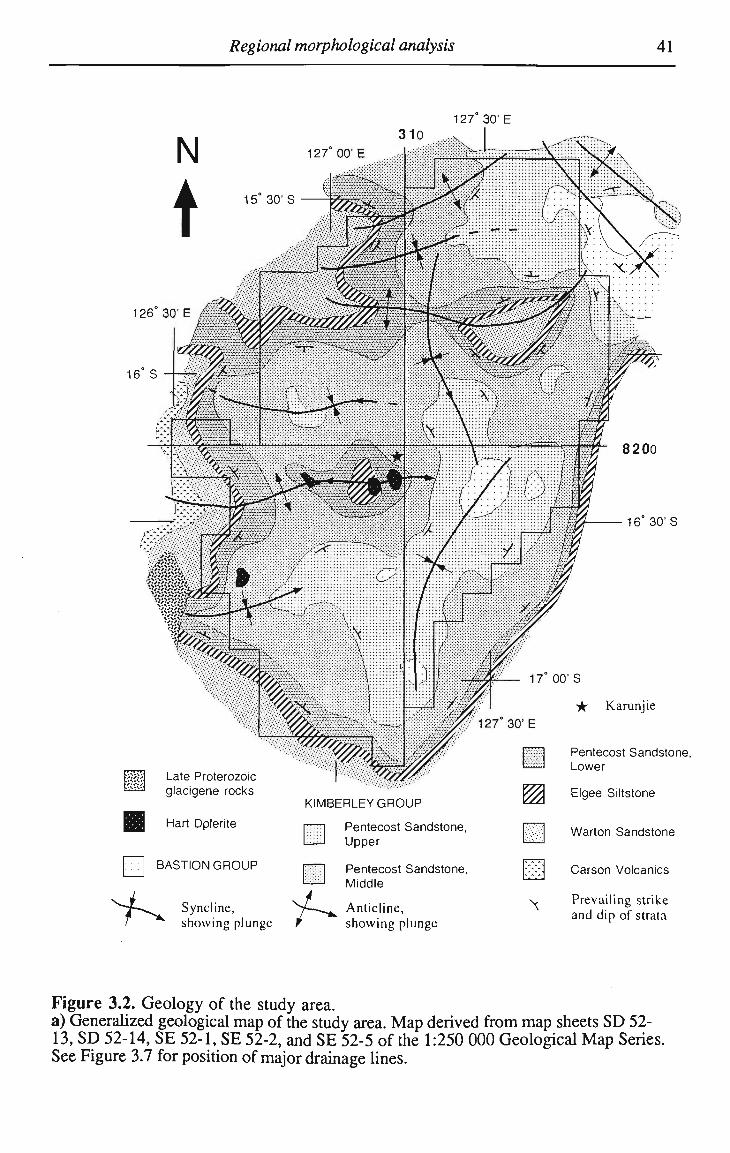
Regional morphological analysis 41
126° 30'E d "*%
16 S
8200
m Late Proterozoic glacigene rocks
Hart Dplerite
BASTION GROUP
KIMBERLEY G R O U P
^ Syncline, showing plunge ^
Pentecost Sandstone, Upper
Pentecost Sandstone, Middle
Anticline, showing plunge
N
00'S
it Karunjie
Pentecost Sandstone, Lower
Elgee Siltstone
Warton Sandstone
Carson Volcanics
Prevailing strike and dip of strata
Figure 3.2. Geology of the study area. a) Generalized geological map of the study area. Map derived from map sheets S D 52-13, S D 52-14, SE 52-1, SE 52-2, and SE 52-5 of the 1:250 000 Geological Map Series. See Figure 3.7 for position of major drainage lines.

Regional morphological analysis 42
126° 30'
16° 00' 16° 30'
30 km
H Hart Dolerite I I Upper Pentecost Sandstone t<#yj Lower Pentecost Sandstone |||f| Warton Sandstone
Hllll MedenaFormation IfH Middle Pentecost Sandstone £21 ^lgee Siltstone _ [~~A\ Carson Volcanics
W&j King Leopold Sandstone
Figure 3.2. cont. b) Generalized geological profiles. Profiles were determined along horizontal grid line 820 (approximately along latitude 16°15'S) and along vertical grid line 310 (approximately along longitude 127°15'E). Topographic information is based on 1:100 000 topographic map sheets (R611 Series) and geological information is based on the 1:250 000 Geological M a p Series.
500m
BASTION G R O U P
Upper Pentecost Sandstone
Middle Pentecost Sandstone
Lower Pentecost Sandstone
Elgee Siltstone
Warton Sandstone
Carson Volcanics
Figure 3.3. Generalized stratigraphic column of the Karunjie Plateau showing principal caprocks. The thickness of the rock units is the maximum thickness as given by Roberts & Perry (1969), and Derrick (1969).
Regional morphological analysis 43
The slopes formed in the Lower Pentecost Sandstone can be prominendy benched,
indicating the occurrence of resistant layers of quartz sandstone near the base and the top
of this rock subunit At the southeastern margin of the study area, the sedimentary rocks
are upturned and the steeply dipping resistant sandstones form hogbacks, while the less
resistant rocks form long intervening valleys (Fig. 3.2b). This contrasts with the
northeastern margin of the study area, where the strata are gently downfolded to form a
basin-like structure. As a consequence, the margin of the Karunjie Plateau is not marked
by an escarpment here, but the transition to the adjacent coastal plains of the Cambridge
Gulf estuary is somewhat more gradual.
To illustrate topography, projected topographic profiles of the summits and the valley
floors were determined along two 10 k m wide corridors extending from west to east and
from south to north across the study area (Fig. 3.1). The highest summits decrease from
650 m in the south to about 450 m in the north, while in an E - W direction the highest
summits have roughly the same height of about 500-600 m (Fig. 3.1). Stewart et al.
(1960) suggested that the upper structural surface east of Karunjie (Fig. 3.2, Bluff Face
Range), which lies at an elevation of about 500 m , could represent a remnant of a Tertiary
land surface. East of the Karunjie Plateau, the existence of a former erosional surface at
about this level is indicated by a more or less uniform summit level developed on rocks
showing a varying degree of tilt (Young, 1992), but how this erosional surface relates to
the structural surfaces on the Kimberley Plateau remains unclear.
In the central part of the study area, the subparallel Durack and Chapman Rivers flow
along gently sloping plains developed on siltstones and weak sandstones of the Middle
Pentecost Sandstone (Figs. 3.1, 3.2). To the west, this elongated area of low relief is
bounded by the precipitous scarp of the Bluff Face Range (Fig. 3.2). In a survey on the
lands and pastoral resources of the Kimberley Plateau, Speck (1960c) used the term
'Karunjie Land System' to describe such an assemblage of plains and sandstone scarps.
This term was chosen because of the comparatively large extent of this type of country
near the homestead of Karunjie. The development of these structural plains in the central
Regional morphological analysis 44
part of the study area appears to be associated with the retreat of the westward facing
scarp capped by the Upper Pentecost Sandstone (Fig. 3.2).
A conspicuous feature of the topographic profiles is the greater stream incision of the
Chamberlain River compared to that of the subparallel Durack River (Fig. 3.1). The
Chamberlain River, located east of the study area, is a classic example of a strike stream
and it flows for more than 150 km along the base of a spectacular scarp (Elgee Cliffs)
along a valley eroded into the weak Elgee Siltstone. The pronounced difference in the
elevation between the Durack and the Chamberlain Rivers is present even near their
headwaters where the latter has incised some 200 m below the valley of the Durack
River. This is even more remarkable as the Durack River clearly has the larger drainage
basin and both streams share the same regional baselevel. This suggests that an impulse
of stream incision propagated upstream to the headwaters of the Chamberlain River
which has not been transmitted to the same extent upstream along the Durack River.
Indeed, on maps, aerial photos, and in the field, it is evident that greater fluvial dissection
and a higher topographic relief exits along the eastern fringes of the southern Karunjie
Plateau than is present in the central parts further to the west. One main objective of this
section is to quantify this observation and to investigate, on a basin scale, possible
controlling factors such as lithologic differences or baselevel changes.
3.2 Morphometric analysis
Morphometric analysis in geomorphological studies, especially for fluvial forms, has
evolved to a fairly unified and coherent field of study since its beginnings early this
century (Gardiner and Park, 1978). The relationships between individual landform or
drainage basin parameters are investigated here in order to focus on fluvial processes in
the context of landscape evolution. Morphometry is primarily employed to quantitatively
characterize the long-term fluvial forms of the study area.
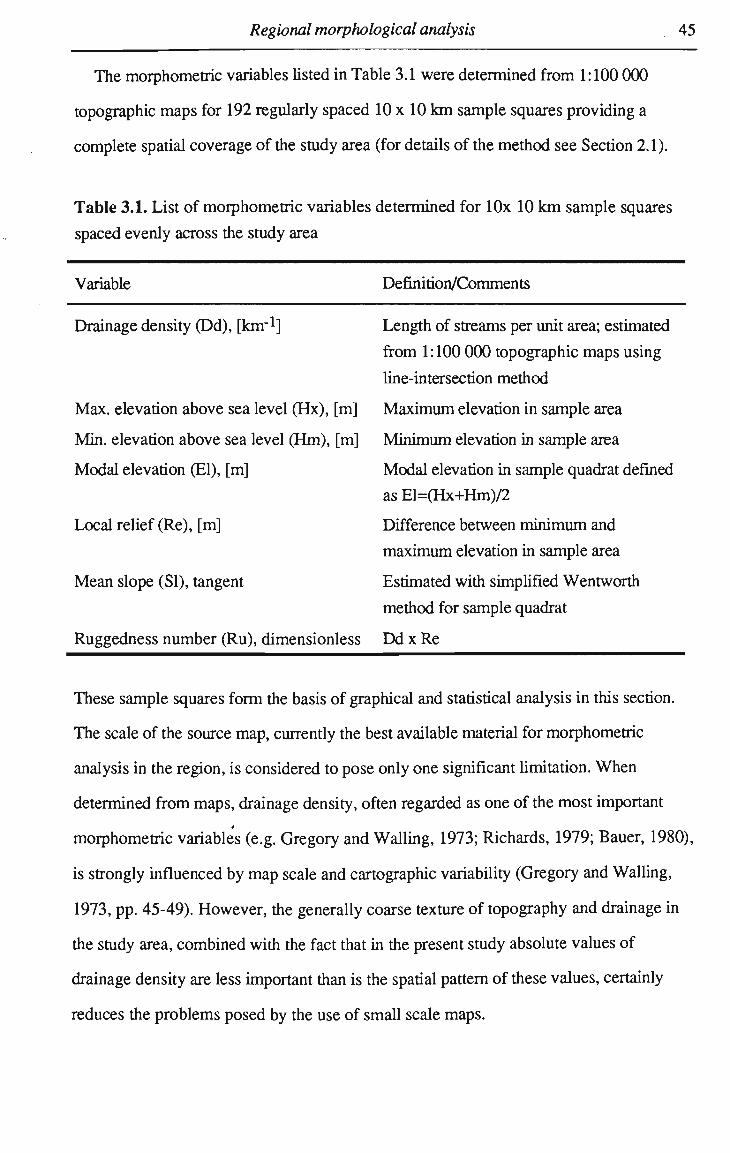
Regional morphological analysis 45
The morphometric variables listed in Table 3.1 were determined from 1:100 000
topographic maps for 192 regularly spaced 10 x 10 k m sample squares providing a
complete spatial coverage of the study area (for details of the method see Section 2.1).
Table 3.1. List of morphometric variables determined for lOx 10 km sample squares
spaced evenly across the study area
Variable Definition/Comments
Drainage density (Dd), [km-1] Length of streams per unit area; estimated
from 1:100 000 topographic maps using
line-intersection method
Max. elevation above sea level (Hx), [m] Maximum elevation in sample area
Min. elevation above sea level (Hm), [m] Minimum elevation in sample area
Modal elevation (El), [m] Modal elevation in sample quadrat defined
as El=(Hx+Hm)/2
Local relief (Re), [m] Difference between minimum and
maximum elevation in sample area
Mean slope (SI), tangent Estimated with simplified Wentworth
method for sample quadrat
Ruggedness number (Ru), dimensionless D d x Re
These sample squares form the basis of graphical and statistical analysis in this section.
The scale of the source map, currently the best available material for morphometric
analysis in the region, is considered to pose only one significant limitation. W h e n
determined from maps, drainage density, often regarded as one of the most important
morphometric variables (e.g. Gregory and Walling, 1973; Richards, 1979; Bauer, 1980),
is strongly influenced by map scale and cartographic variability (Gregory and Walling,
1973, pp. 45-49). However, the generally coarse texture of topography and drainage in
the study area, combined with the fact that in the present study absolute values of
drainage density are less important than is the spatial pattern of these values, certainly
reduces the problems posed by the use of small scale maps.
Regional morphological analysis 46
3.2.1 Spatial pattern of drainage density, local relief and m e a n slope
A. Drainage density
In the study area, the mean drainage density, based on the blue-line network of the
1:100 000 topographic maps and expressed as the mean value of the regularly spaced 10
x 10 k m sample squares, measures 0.9 k m / k m 2 (Tab. 3.2). Besides being largely a result
of the map scale, this rather low density is also likely to be a reflection of the lithological
and topographical constraints of the sandstone country. The range of drainage density
values of the sample squares is narrow and the spatial distribution of the values does not
reveal a clear pattern. However, high values occur in the Salmond River basin and low
values in the central and eastern parts of the Durack River basin, which results in
different mean drainage densities for these two (Fig. 3.4a, Tab. 3.2).
A possible climatic factor controlling drainage density on a regional scale is rainfall
intensity (cf. Chorley and Morgan, 1962), or as a substitute mean annual rainfall (cf.
Gregory and Gardiner, 1975). In the study area, rainfall decreases from the coast inland
(Fig. 1.5a,d), and any change of drainage densities linked to these climatic variations
should show a similar pattern. However, Figure 3.4a does not reveal any such
relationship. Furthermore, at this scale of the observation, any present influence of
climate on the spatial distribution of drainage density is likely to be only very subde and
probably not detectable, particularly as marked climatic contrasts do not occur in the
study area.
Lithology, another possible controlling factor on drainage density, does not appear to
have had any great influence on the spatial variation either. Visual comparison of the
spatial pattern of the drainage density (Fig. 3.4a) with the geology of the study area (Fig.
3.2) gives no immediate indication that lithology is a controlling factor. However, if the
data is sorted according to lithological units (Tab. 3.3), the mean drainage density values
for the Lower Pentecost and the Warton Sandstones are slighdy lower than those for the
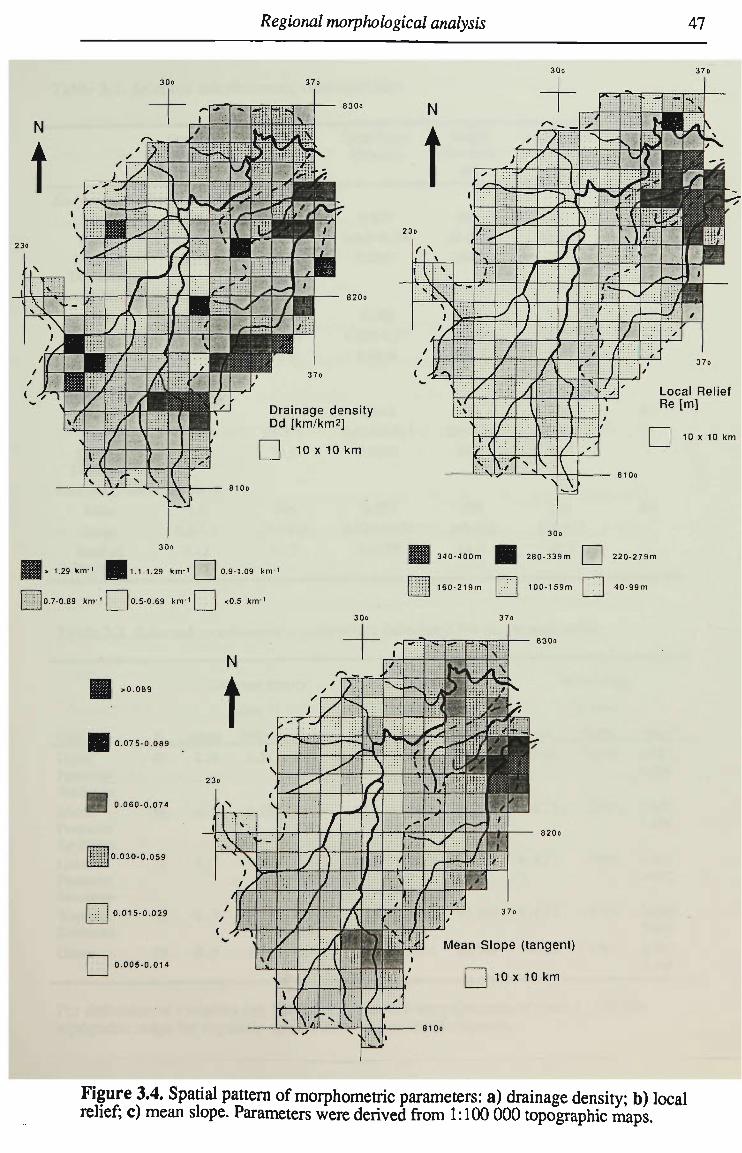
Regional morphological analysis 47
300 37o
Drainage density Dd [km/km2]
[ | 10x10 km
Local Relief Re [m]
10 x 10 kn
30o
> 1.29 km' i H1.1-1.29 km-1 I j 0.9-1.09 km"'
0.7-0.89 km-1 0.5-0.69 km"1 <0.5 km'1 U
340-400m I 280-339m 220-27
160-219m ;| 100-159m 40-99r
30o
0.075-0.089
0.060-0.074
;ij; 0.030-0.059
0.015-0.029
• •.. 05-0.014
8200
Mean Slope (tangent)
| | 10 x 10 km
Figure 3.4. Spatial pattern of morphometric parameters: a) drainage density; b) local relief; c) mean slope. Parameters were derived from 1:100 000 topographic maps.
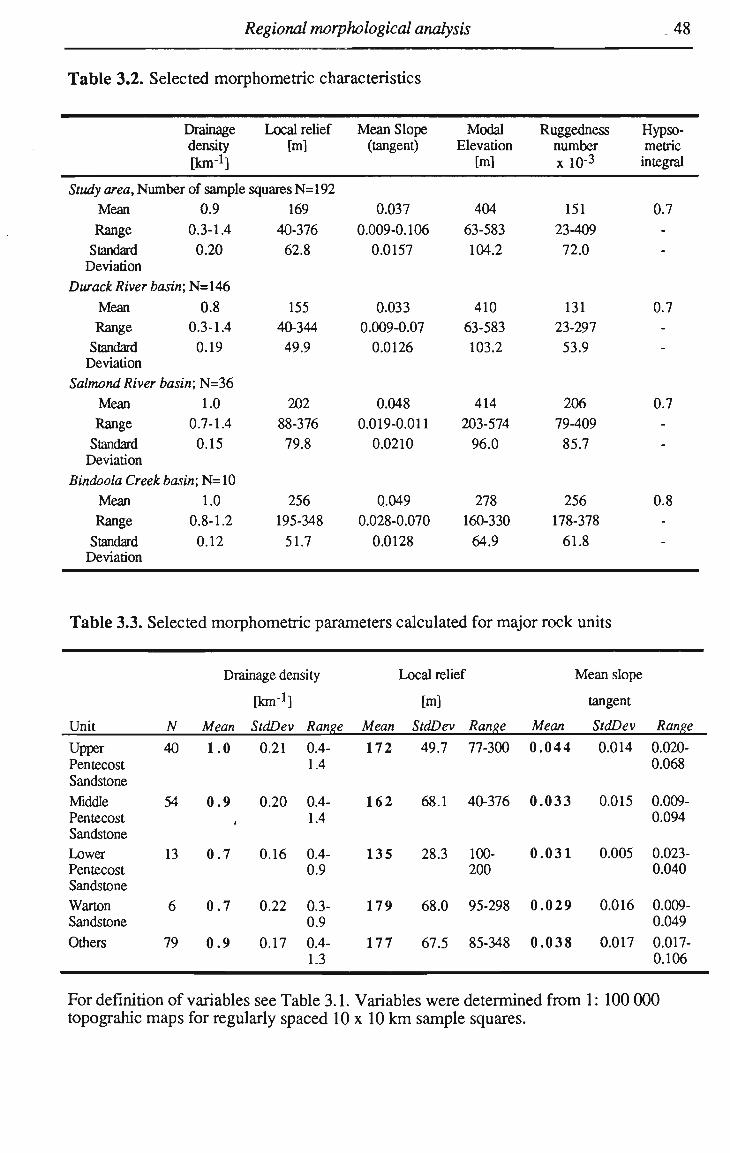
Regional morphological analysis 48
Table 3.2. Selected morphometric characteristics
Drainage density [km4]
Study area, Number of sample
Mean 0.9
Range
Standard Deviation
0.3-1.4
0.20
Durack River basin; N=146
Mean
Range
Standard Deviation
0.8 0.3-1.4
0.19
Salmond River basin; N=36
Mean
Range
Standard Deviation
1.0 0.7-1.4
0.15
Bindoola Creek basin; N=10
Mean
Range
Standard Deviation
1.0 0.8-1.2
0.12
Local relief [m]
squares N=192
169
40-376
62.8
155 40-344
49.9
202 88-376
79.8
256 195-348
51.7
Mean Slope (tangent)
0.037
0.009-0.106
0.0157
0.033
0.009-0.07
0.0126
0.048
0.019-0.011
0.0210
Q.049
0.028-0.070
0.0128
Modal Elevation
[m]
404 63-583
104.2
410 63-583
103.2
414 203-574
96.0
278 160-330
64.9
Ruggedness number x 10"3
151 23-409
72.0
131 23-297
53.9
206 79-409
85.7
256 178-378
61.8
Hypsometric integral
0.7 -
-
0.7 -
-
0.7 -
-
0.8 -
-
Table 3.3. Selected morphometric parameters calculated for major rock units
Unit
Drainage density Local relief Mean slope
[km'1] [m] tangent
N Mean StdDev Range Mean StdDev Range Mean StdDev Range
Upper Pentecost Sandstone
Mddle Pentecost Sandstone Lower Pentecost Sandstone Warton Sandstone
Others
40
54
13
6
79
1.0
0.9 4
0.7
0.7
0.9
0.21
0.20
0.16
0.22
0.17
0.4 1.4
0.4 1.4
0.4 0.9
0.3 0.9
0.4 1.3
172 49.7 77-300 0.044 0.014 0.020-0.068
162 68.1 40-376 0.033 0.015 0.009-0.094
135 28.3 100- 0.031 0.005 0.023-200 0.040
179 68.0 95-298 0.029 0.016 0.009-0.049
177 67.5 85-348 0.038 0.017 0.017-0.106
For definition of variables see Table 3.1. Variables were determined from 1: 100 000 topograhic m a p s for regularly spaced 10 x 10 k m sample squares.
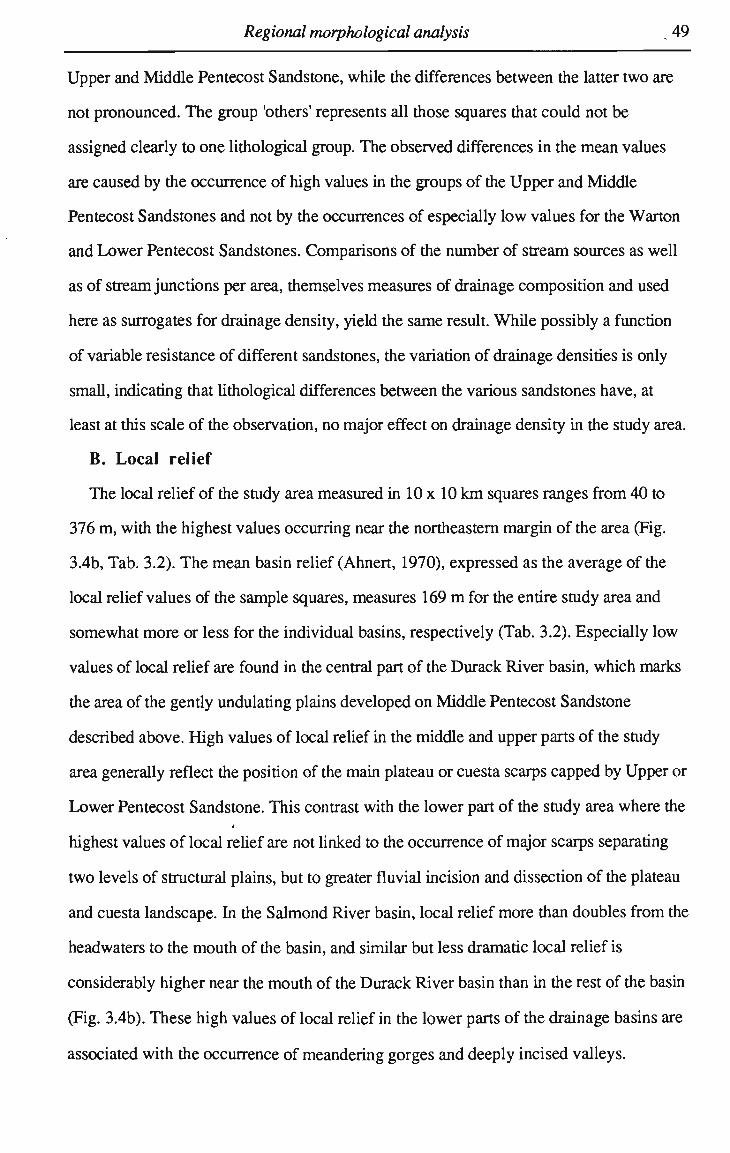
Regional morphological analysis 49
Upper and Middle Pentecost Sandstone, while the differences between the latter two are
not pronounced. The group 'others' represents all those squares that could not be
assigned clearly to one lithological group. The observed differences in the mean values
are caused by the occurrence of high values in the groups of the Upper and Middle
Pentecost Sandstones and not by the occurrences of especially low values for the Warton
and Lower Pentecost Sandstones. Comparisons of the number of stream sources as well
as of stream junctions per area, themselves measures of drainage composition and used
here as surrogates for drainage density, yield the same result. While possibly a function
of variable resistance of different sandstones, the variation of drainage densities is only
small, indicating that lithological differences between the various sandstones have, at
least at this scale of the observation, no major effect on drainage density in the study area.
B. Local relief
The local relief of the study area measured in 10 x 10 km squares ranges from 40 to
376 m, with the highest values occurring near the northeastern margin of the area (Fig.
3.4b, Tab. 3.2). The mean basin relief (Ahnert, 1970), expressed as the average of the
local relief values of the sample squares, measures 169 m for the entire study area and
somewhat more or less for the individual basins, respectively (Tab. 3.2). Especially low
values of local relief are found in the central part of the Durack River basin, which marks
the area of the gently undulating plains developed on Middle Pentecost Sandstone
described above. High values of local relief in the middle and upper parts of the study
area generally reflect the position of the main plateau or cuesta scarps capped by Upper or
Lower Pentecost Sandstone. This contrast with the lower part of the study area where the 4
highest values of local relief are not linked to the occurrence of major scarps separating
two levels of structural plains, but to greater fluvial incision and dissection of the plateau
and cuesta landscape. In the Salmond River basin, local relief more than doubles from the
headwaters to the mouth of the basin, and similar but less dramatic local relief is
considerably higher near the mouth of the Durack River basin than in the rest of the basin
(Fig. 3.4b). These high values of local relief in the lower parts of the drainage basins are
associated with the occurrence of meandering gorges and deeply incised valleys.
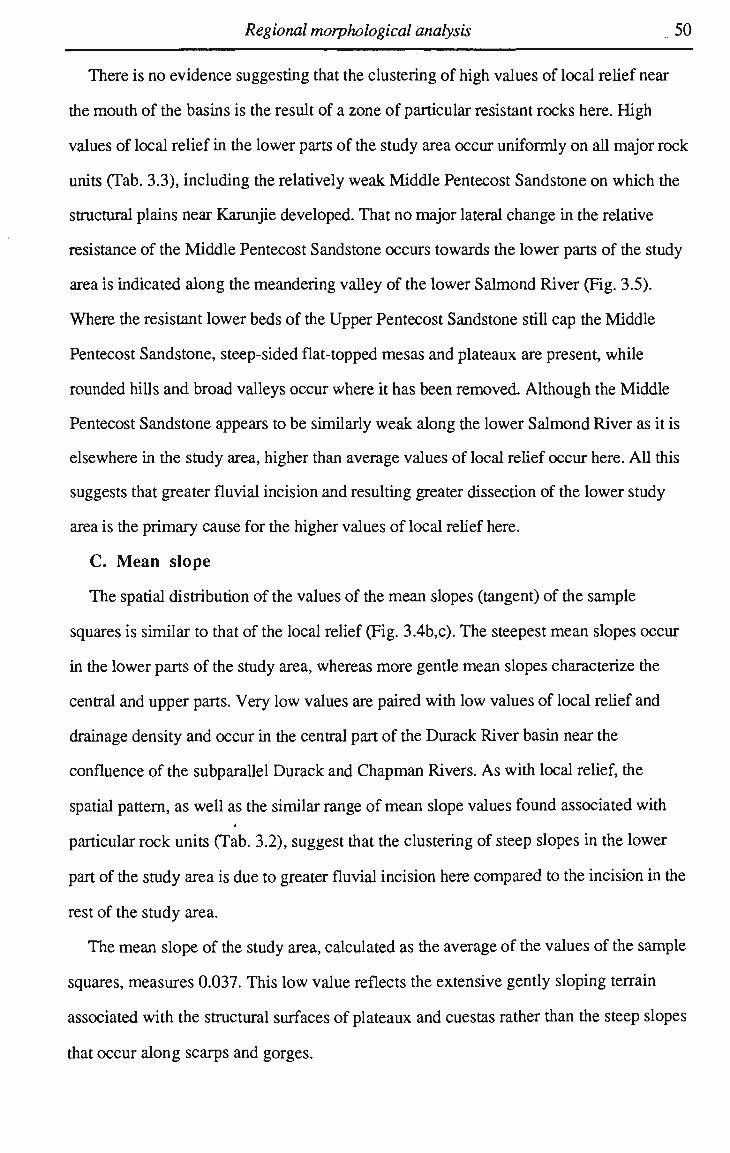
Regional morphological analysis 50
There is no evidence suggesting that the clustering of high values of local relief near
the mouth of the basins is the result of a zone of particular resistant rocks here. High
values of local relief in the lower parts of the study area occur uniformly on all major rock
units (Tab. 3.3), including the relatively weak Middle Pentecost Sandstone on which the
structural plains near Karunjie developed. That no major lateral change in the relative
resistance of the Middle Pentecost Sandstone occurs towards the lower parts of the study
area is indicated along the meandering valley of the lower Salmond River (Fig. 3.5).
Where the resistant lower beds of the Upper Pentecost Sandstone still cap the Middle
Pentecost Sandstone, steep-sided flat-topped mesas and plateaux are present, while
rounded hills and broad valleys occur where it has been removed. Although the Middle
Pentecost Sandstone appears to be similarly weak along the lower Salmond River as it is
elsewhere in the study area, higher than average values of local relief occur here. All this
suggests that greater fluvial incision and resulting greater dissection of the lower study
area is the primary cause for the higher values of local relief here.
C. Mean slope
The spatial distribution of the values of the mean slopes (tangent) of the sample
squares is similar to that of the local relief (Fig. 3.4b,c). The steepest mean slopes occur
in the lower parts of the study area, whereas more gentle mean slopes characterize the
central and upper parts. Very low values are paired with low values of local relief and
drainage density and occur in the central part of the Durack River basin near the
confluence of the subparallel Durack and Chapman Rivers. As with local relief, the
spatial pattern, as well as the similar range of mean slope values found associated with 4
particular rock units (Tab. 3.2), suggest that the clustering of steep slopes in the lower
part of the study area is due to greater fluvial incision here compared to the incision in the
rest of the study area.
The mean slope of the study area, calculated as the average of the values of the sample
squares, measures 0.037. This low value reflects the extensive gently sloping terrain
associated with the structural surfaces of plateaux and cuestas rather than the steep slopes
that occur along scarps and gorges.
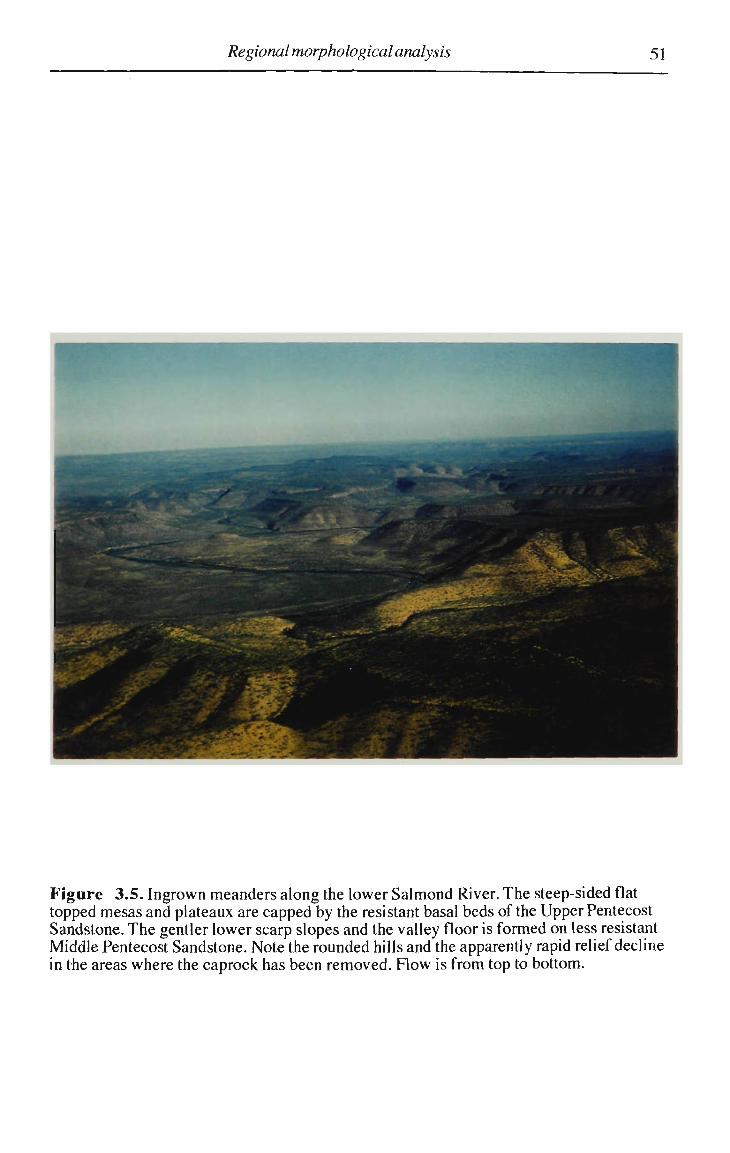
Regional morphological analysis 51
Figure 3.5. Ingrown meanders along the lower Salmond River. The steep-sided flat topped mesas and plateaux are capped by the resistant basal beds of the Upper Pentecost Sandstone. The gentler lower scarp slopes and the valley floor is formed on less resistant Middle Pentecost Sandstone. Note the rounded hills and the apparently rapid relief decline in the areas where the caprock has been removed. Flow is from top to bottom.
Regional morphological analysis 52
The higher mean slope values (average value of sample squares) of the Salmond River
and Bindoola Creek drainage basins compared to that of the Durack River basin indicate
their proportionally more intense dissection and steeper slopes, especially in the lower
parts of the catchments (Tab. 3.2).
3.2.2 Correlation between morphometric variables
The relationship between the morphometric variables was measured with a product-
moment analysis for the variables which showed a normal distribution of their data,
generally only achieved after log-transformation (Tab. 3.4). For the original data,
especially those variables for which normalization was unsuccessful, a Spearman rank
correlation test was conducted (Tab. 3.5). The correlation matrix (Tab. 3.4) indicates that
mean slope (SI) is strongly related to local relief (Re) and to drainage density (Dd) within
the study area. The positive correlation between drainage density and the ruggedness
number (Ru, the product of Re and Dd) is even higher with R u accounting for about 6 4 %
of the variation of the mean slope. This high correlation is an expression of the
geometrical relationships between the three variables, where the mean slope is
proportional to the product of valley density and local relief (Ahnert, 1970). This
relationship explains the relatively steep mean slopes in the lower part of the Salmond
River basin (Fig. 3.4c) which is characterized by a high local relief combined with a
higher than average drainage density. This latter combination results in the significant
correlation between drainage density and local relief for the entire study area (Tab. 3.4).
It has previously been suggested that, during the evolution of a drainage basin,
drainage density increases with increasing relief (e.g. Schumm, 1956), reaches maximum
values when relief is greatest and decreases in later stages when relief declines (e.g.
Strahler, 1958; Abrahams, 1972). Abrahams (1972, p. 632) postulated that, 'as relief is
erosionally reduced and valley-side slopes become less steep, the ability for channel
processes to scour and maintain ultimate tributary valleys diminishes'. The low drainage
densities found in the central part of the Durack basin could, therefore, be conditioned by
the low relief of the landscape here which itself is due to the absence of fluvial incision.
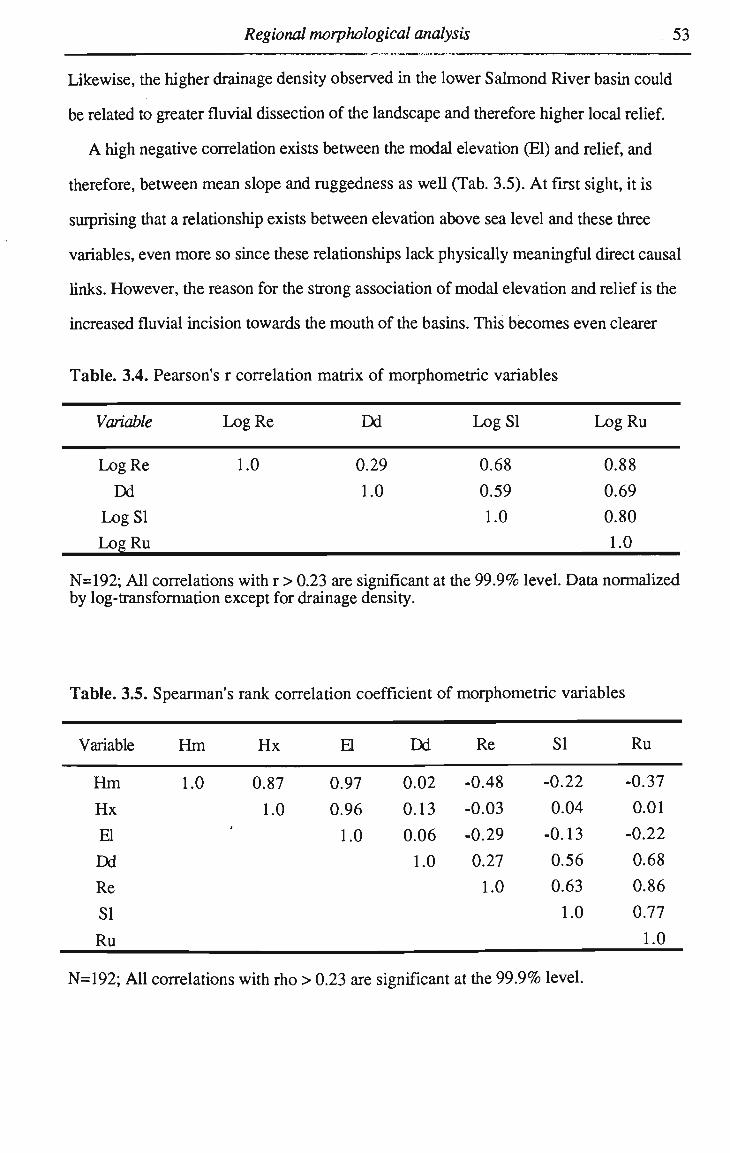
Regional morphological analysis .. 53
Likewise, the higher drainage density observed in the lower Salmond River basin could
be related to greater fluvial dissection of the landscape and therefore higher local relief.
A high negative correlation exists between the modal elevation (El) and relief, and
therefore, between mean slope and ruggedness as well (Tab. 3.5). At first sight, it is
surprising that a relationship exists between elevation above sea level and these three
variables, even more so since these relationships lack physically meaningful direct causal
links. However, the reason for the strong association of modal elevation and relief is the
increased fluvial incision towards the mouth of the basins. This becomes even clearer
Table. 3.4. Pearson's r correlation matrix of morphometric variables
Variable Log R e D d Log SI L o g R u
Log Re 1.0
Dd
Log SI
LogRu _ _
N=192; All correlations with r > 0.23 are significant at the 99.9% level. Data normalized by log-transformation except for drainage density.
0.29
1.0
0.68
0.59
1.0
0.88
0.69
0.80
1.0
Table. 3.5. Spearman's rank correlation coefficient of morphometric variables
Variable
Hm
Hx El
Dd Re
SI
Ru
Hm
1.0
Hx
0.87
1.0 4
e
0.97
0.96
1.0
Dd
0.02
0.13
0.06
1.0
Re
-0.48
-0.03
-0.29
0.27
1.0
SI
-0.22
0.04
-0.13
0.56
0.63
1.0
Ru
-0.37
0.01
-0.22
0.68
0.86
0.77
1.0
N=192; All correlations with rho > 0.23 are significant at the 99.9% level.
Regional morphological analysis 54
when relief, mean slope and ruggedness are correlated with the minimum elevation (Hm)
and the maximum elevation (Hx) instead of the modal elevation (Tab. 3.5). The strong
negative relationships with the minimum elevation indicate that local relief and the
strongly correlated mean slope and ruggedness increase with decreasing elevation above
sea level of the lowest point in the sample quadrat. In contrast, no significant correlation
exists between drainage density, local relief, or mean slope, and the m a x i m u m elevation
above sea level which represents the height of the interfluves in the sample quadrat. This
underlines the observation made earlier that the higher local relief in the lower parts of the
drainage basins is linked to greater stream incision here and that it is not the product of
monadnocks or scarps of resistant rock standing above a level area.
Mean slope and local relief are generally strongly correlated to mean denudation rates
(Ahnert, 1970; Summerfield and Hulton, 1994) and it may therefore be inferred that the
lower parts of the study area are currendy denuded at a higher rate than the gently sloping
middle and upper parts of the study area. Such increased denudation rates in the lower
parts of the study area would be the result of the greater fluvial dissection here providing
the relief necessary for mechanical denudational processes to operate effectively.
3.2.3 Hypsometric curves
The hypsometric curves in Figure 3.6 were derived from the distribution of modal
elevation values (Elv) and show that only a small proportion of the area of the basins is at
low elevations. The curves resemble closely the hypsometric curve of a 'youthful' plateau
region with deeply incised canyons obtained by Strahler (1952, Fig. 21, p.1139) and
those for small drainage basins in the eroding Perth A m b o y badlands in the early stages
of their erosion (Schumm, 1956, Figs. 19, 20). Furthermore, the high percentages of
area under the curves, or the hypsometric integrals (Strahler, 1952; cf. Pike and Wilson,
1971), indicate a dissected surface of low relief rather than a broad level surface with
isolated relief features.
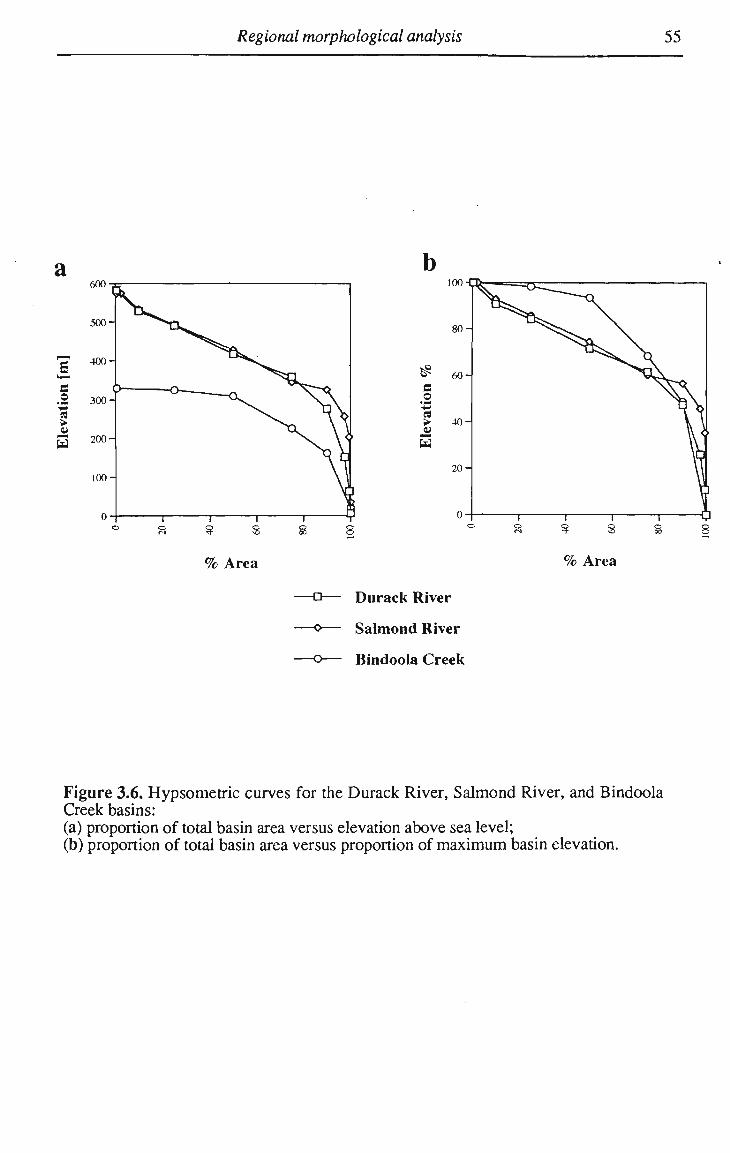
Regional morphological analysis 55
b
% Area
100
B
.2 a >
W
Durack River
Salmond River
Bindoola Creek
% Area
Figure 3.6. Hypsometric curves for the Durack River, Salmond River, and Bindoola Creek basins: (a) proportion of total basin area versus elevation above sea level; (b) proportion of total basin area versus proportion of maximum basin elevation.
Regional morphological analysis 56
3.3 Drainage pattern
Drainage patterns are influenced by various factors such as climate, lithological
variations and geological structure, but the latter is often regarded as the single most
important factor (e.g. Summerfield, 1991, p. 405-411). In areas of horizontal or gently
folded sedimentary rocks, such as the study area, drainage pattern is often controlled by
the spatial distribution of relatively weak and resistant rocks. In the absence of strong
structural and lithological controls, like in areas of horizontal and uniform rocks, a
dendritic drainage pattern usually develops. Areas of tilted or folded sedimentary rocks
are often characterized by a parallel or trellis drainage pattern, while in cross folded
regions, annular, radial and centripetal drainage patterns can occur. A rectangular
drainage pattern is regarded as indication for a preferential valley development along lines
of weakness such as faults or joints in the country rock. While it is generally accepted
that drainage pattern can be influenced by lithology and geological structure, it has proven
difficult to statistically demonstrate this influence on the topological properties of drainage
networks (cf. Mock, 1971; Abrahams and Flint, 1983). M a n y studies of drainage
network analysis have, therefore, concentrated on the description and interpretation of the
'normal' states of a drainage pattern and on 'drainage anomalies' as the means for
interpreting geological structure (e.g. Chorley, et al., 1984; Deffontaines and Chorowitz,
1991; Pubellier, et al., 1994). In this sense, drainage anomalies can be defined as local
deviations from a 'normal' or expected drainage pattern which is in accordance with the
known regional structure and topography (Howard, 1967).
3.3.1 Description
The drainage pattern of the major drainage lines on the southern Karunjie Plateau is
subparallel with the main streams running in northeasterly directions (Fig. 3.7a). This is
also the dominant fold trend in the area and the exerted structural influence along this
alignment is especially prominent along the eastern margin of the Plateau, the
Regional morphological analysis 57
Chamberlain River forming a spectacular example (Fig. 3.7b). M a n y of the major
tributaries of the main northeast running streams of the study area have more or less
dendritic drainage patterns. This pattern is generally found in areas underlain by nearly
horizontal and homogenous strata and often reflects a lack of structural guidance.
Elsewhere in the study area, streams such as Bottle Tree Creek, the headwaters of the
Chapman River, or Bindoola and Palmer Creeks, reveal trellis patterns (Fig. 3.7a).
Along their courses, many streams follow the contact of rocks of different resistance. For
example, along its lower part, the Durack River frequendy follows low scarps formed at
the contact of Lower and Middle Pentecost Sandstone (Fig. 3.7b). However, in places,
rivers have cut through the steep front scarps of sandstone cuestas (Fig. 3.8).
3.3.2 Lithologic and structural controls
In the study area, horizontal to weakly folded and cross folded sedimentary rocks of
variable resistance are the predominant country rock (Fig. 3.6b). Consequently, drainage
patterns ranging from dendritic to subparallel and trellis are present and can be regarded
as normal. Furthermore, small areas with annular or even radial and centripetal drainage
can be expected in association with the occurrences of structural domes and basins. The
study area has experienced long lasting denudation and there is widespread evidence for
an adjustment of the drainage to the underlying geology. Lithologic and structural control
on the drainage patterns of the study area is generally associated with the occurrence of
weakly inclined sandstones and siltstones, and a differential erosion of these successions.
As a result, there is an abundance of strike streams, or stream reaches in the study area.
The lack of prominent rectangular drainage suggests a general absence of extensive joint
or fault control on drainage development, although locally many streams clearly exploit
existing fractures in the underlying rock (Fig. 3.8).
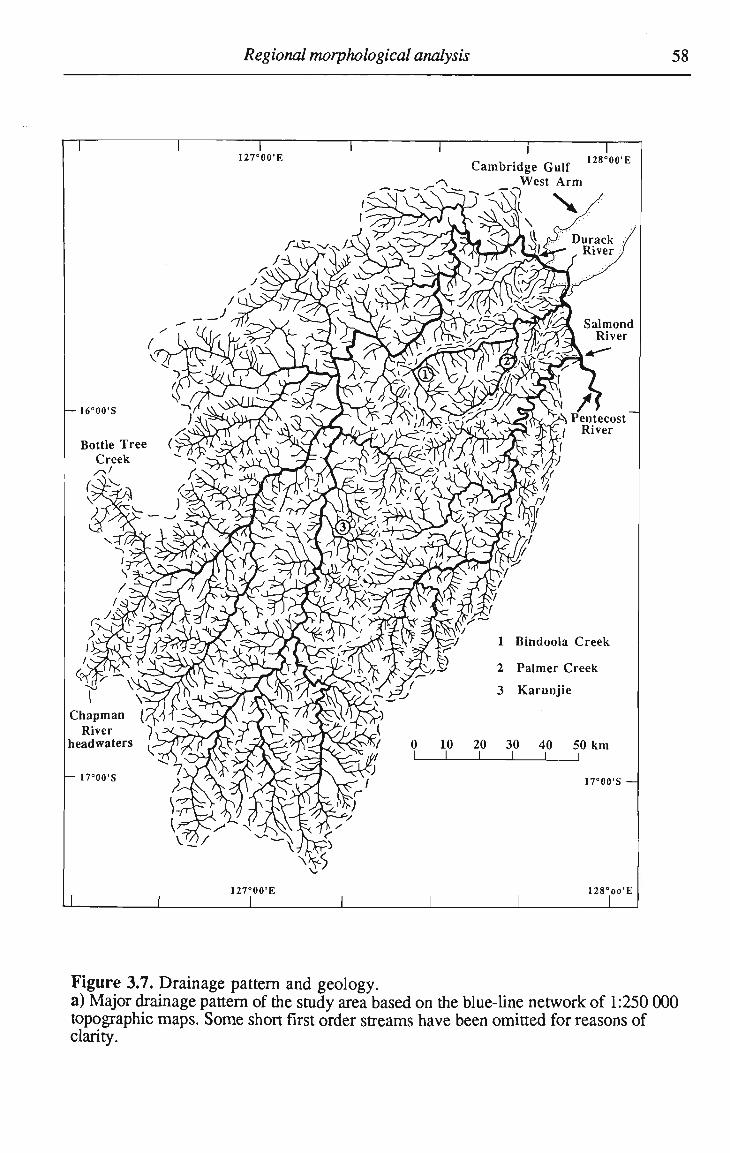
Regional morphological analysis 58
—16°00'S
Bottle Tree ( Creek
127°00'E Cambridge Gulf
West Arm
128°00'E
Chapman ( River ")
headwaters
— I7°00'S
^ Pentecost / River
1 Bindoola Creek
2 Palmer Creek
3 Karunjie
0 10 20 30 40 50 km I I i
17°00'S —
127°00'E 128°oo'E
Figure 3.7. Drainage pattern and geology. a) Major drainage pattern of the study area based on the blue-line network of 1:250 000 topographic maps. Some short first order streams have been omitted for reasons of clarity.
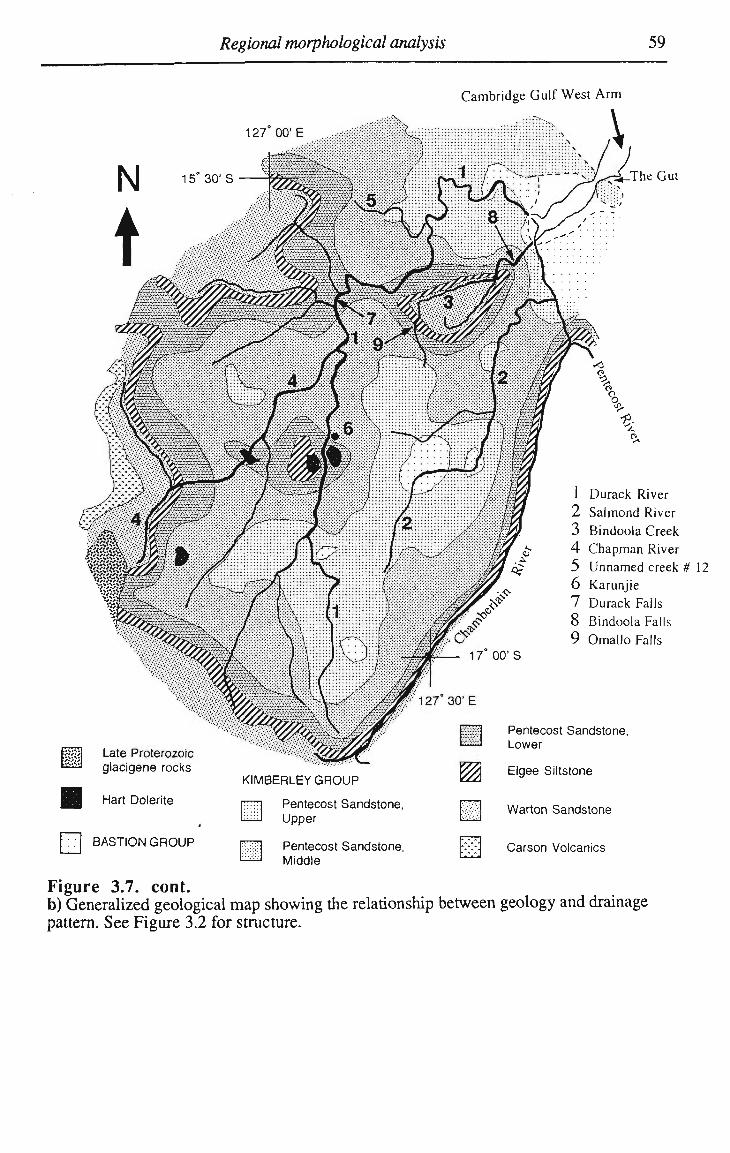
Regional morphological analysis 59
Cambridge Gulf West Arm
The Gut
Durack River
Salmond River
Bindoola Creek
Chapman River
Unnamed creek # 12
Karunjie
Durack Falls
Bindoola Falls
Omallo Falls
|?ggj Late Proterozoic ^ s giacigene rocks
g Hart Dolerite
fTTj BASTION GROUP
KIMBERLEY G R O U P
Pentecost Sandstone, Upper
Pentecost Sandstone, Middle
Pentecost Sandstone, Lower
Elgee Siltstone
Warton Sandstone
Carson Volcanics
Figure 3.7. cont. b) Generalized geological map showing the relationship between geology and drainage pattern. See Figure 3.2 for structure.
Regional morphological analysis 60
The influence of variable rock resistance and the influence of fractures on some
drainage pattern in the study area, will be briefly illustrated on two examples. In the
upper half of its drainage basin, Bindoola Creek in the northeast of the study area has a
trellis to annular drainage pattern and has an asymmetric distribution in the number and
length of tributaries found on either side of the two main drainage lines (Fig. 3.7a). This
drainage pattern is associated with the erosion of a dome-like structure produced by cross
folding (Figs. 3.2,3.7b). Bindoola Creek and its major tributary Palmer Creek follow
strike valleys flanked on one side by dip slopes developed on resistant Warton Sandstone
and on the other side by steep cuesta scarps facing towards the centre of the domal
structure. These scarps are capped by the resistant Lower Pentecost Sandstone and
underlain by Elgee Siltstone. The location of the streams at the immediate base of these
scarps and the pronounced asymmetry of the strike valleys suggest that the streams are
laterally migrating, causing homoclinal shifting of the strike valleys, a well known
process in dipping strata of alternating weak and resistant layers (e.g. Summerfield,
1991, p. 407). Just downstream of its confluence with Palmer Creek, Bindoola Creek
cuts through the cuesta scarp in a narrow passage, or water gap, located near the axis of
the E to N E trending anticline which forms a part of the domal structure. Inspection of
aerial photos and field evidence indicates that incision here occurred along a line of
weakness in the sandstone (Fig. 3.8).
A similar control on the drainage is represented by the trellis like drainage pattern of
the upper Chapman River and its northern tributary Bottle Tree Creek (Fig. 3.7b). Both
streams are strike streams which run along the base of a scarp capped by Lower
Pentecost Sandstone. Immediately downstream of their confluence, the combined stream
cuts eastwards through the front scarp of the cuesta, coincident in association with a fault
and the axis of an E - W trending and eastwards plunging anticline (Figs. 3.2, 3.7; see
also 1:250 000 Geological Series, Sheet S E 52-1).

Regional morphological analysis 61
Figure 3.8. Oblique aerial photo of the water gap along Bindoola Creek. Flow is from top to bottom. Note the partly fracture controlled course of the tributary in the foreground.
Regional morphological analysis 62
3.3.3 Water gaps and pattern change
In the study area, numerous water gaps are found along streams of a wide range of
stream-orders. Examples are the water gap along Bindoola Creek (Fig. 3.8), or the one
along the Chapman River described above. Another example is found west of Karunjie,
where the northwards running Durack River cuts across an east-west orientated double
plunging anticline (Figs. 3.2., 3.7b). Here, a small gorge has formed in the exposed
upper members of the Lower Pentecost Sandstone. The water gaps on the Kimberley
Plateau were previously interpreted as evidence for drainage superimposition from a
former northeast-dipping planation surface (e.g. Derrick, 1969; Roberts and Perry, 1969;
cf. also Section 1.3), however, the existence of actual remnants of such a hypothetical
former planation surface (cf. Oilier, et al., 1988) has not been demonstrated as yet. What
can be said with certainty is that the water gaps are not the result of antecedence, as this is
ruled out by the great age of the folding. Therefore, they may be interpreted as evidence
for epigenetic, or superimposed drainage, however, the nature of the former higher level
of land surface from which the drainage might have been superimposed remains
unknown. Some water gaps may also be the result of headward erosion of streams
transverse to geological structure, possibly along faults or pervasive joints (Fig. 3.8).
Several sharp changes in stream direction are present in the drainage pattern of the study
area (Fig. 3.7a) and some of these could possibly represent elbows of capture. However,
such stream capture may actually be a rather rare event in drainage evolution, despite the
extensive coverage it has received in the literature (Bishop, 1995).
Nevertheless, where significant quantities of crust have been removed by long lasting
denudation, it appears to be reasonable to assume that various drainage alterations have
occurred through time. Furthermore, it has to be considered that structural or lithological
influences of a formerly higher crustal level may still be reflected locally in the present
drainage networks. Especially in regions subject to long-lasting continuous denudation,
such as the Kimberley Plateau, manifold opportunities for drainage realignment are likely
Regional morphological analysis 63
to have occurred, adding considerable uncertainties and complexity to the reconstruction
of individual drainage evolutions (Bishop, 1995).
3.4 Basin morphometry
Previously in this study, the morphometric characteristics of the study area, including
the spatial pattern of local relief and mean slope, were investigated. Amongst other
things, it was shown that higher than average values of local relief and mean slope in the
lower portions of the study area near the mouth of the principal drainage basins were
probably largely a product of greater fluvial incision downstream. In this section,
additional morphometric characteristics of the drainage basins are investigated and basic
functional relationships between selected variables established.
The morphometric variables listed in Table 3.6 were determined for 45 drainage basins
ranging in size from 6 to 14 000 km2. The larger basins in the selection comprise the
Durack River, Salmond River and Bindoola Creek basins, as well as most of their larger
sub-basins (Fig. 3.9). Smaller tributary basins were included from various parts of the
study area and their selection was based on a suitably located contour, or spot height,
close to their junction with the parent stream. This selection criterion is not systematically
related to any factor controlling drainage basin character and avoids personal bias.
Furthermore, when determining the local valley gradient near the valley mouth, this
condition helped to keep interpolation between contours minimal.
Table 3.7 shows the Pearson's correlation coefficients for the morphometric variables
determined for the selected drainage basins. All variables were successfully normalized
except variable mainstream length (Ls). However, the distribution of Log Ls is nearly
normal and a Spearman's rank correlation analysis using the original data yielded the
same significance levels as the product-moment correlation. Therefore, only the
Pearson's r coefficients are presented and further discussed here.
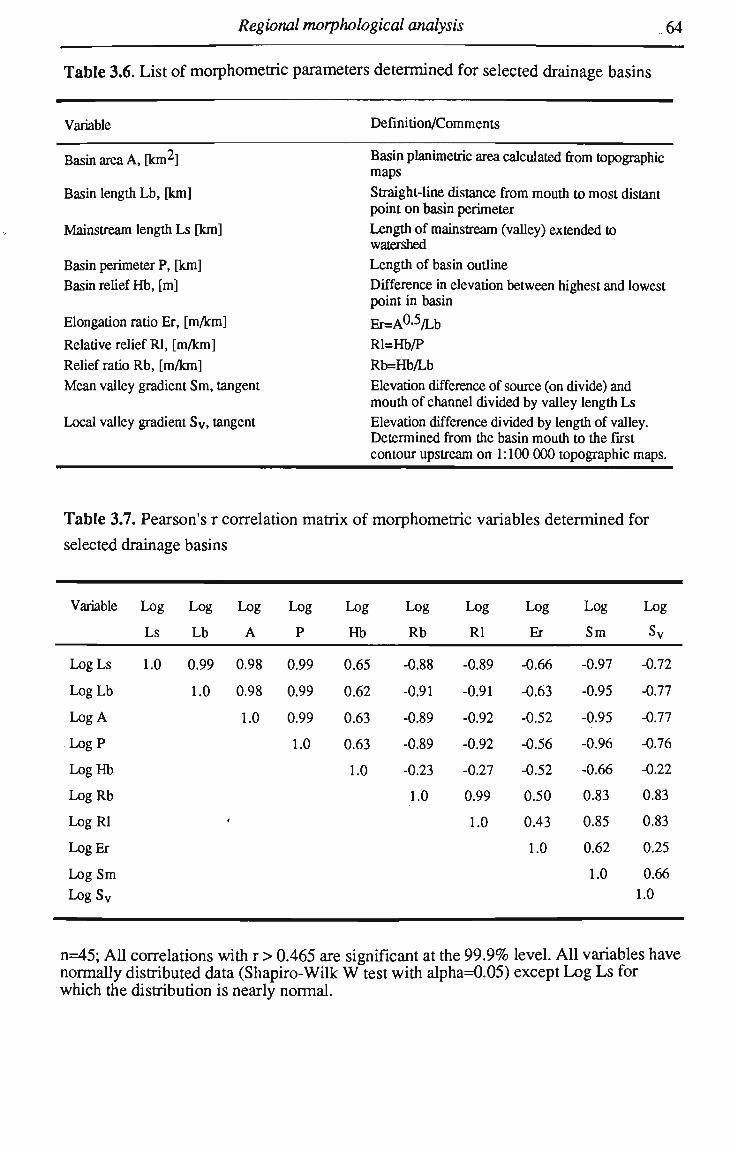
Regional morphological analysis 64
Table 3.6. List of morphometric parameters determined for selected drainage basins
Variable Definition/Comments
Basin area A, [km2]
Basin length Lb, [km]
Mainstream length Ls [km]
Basin perimeter P, [km]
Basin relief Hb, [m]
Elongation ratio Er, [m/km]
Relative relief Rl, [m/km]
Relief ratio Rb, [m/km]
Mean valley gradient Sm, tangent
Local valley gradient Sv, tangent
Basin planimetric area calculated from topographic maps
Straight-line distance from mouth to most distant point on basin perimeter
Length of mainstream (valley) extended to watershed Length of basin outline
Difference in elevation between highest and lowest point in basin
Er=A°-5/Lb
Rl=Hb/P
Rb=Hb/Lb
Elevation difference of source (on divide) and mouth of channel divided by valley length Ls
Elevation difference divided by length of valley. Determined from the basin mouth to die first contour upstream on 1:100 000 topographic maps.
Table 3.7. Pearson's r correlation matrix of morphometric variables determined for
selected drainage basins
Variable
LogLs
Log Lb
Log A
LogP
LogHb
LogRb
LogRl
LogEr
Log Sm
L o g S v
Log
Ls
1.0
Log
Lb
0.99
1.0
Log
A
0.98
0.98
1.0
4
Log
P
0.99
0.99
0.99
1.0
Log
Hb
0.65
0.62
0.63
0.63
1.0
Log
Rb
-0.88
-0.91
-0.89
-0.89
-0.23
1.0
Log
Rl
-0.89
-0.91
-0.92
-0.92
-0.27
0.99
1.0
Log
Er
-0.66
-0.63
-0.52
-0.56
-0.52
0.50
0.43
1.0
Log
Sm
-0.97
-0.95
-0.95
-0.96
-0.66
0.83
0.85
0.62
1.0
Log
Sv
-0.72
-0.77
-0.77
-0.76
-0.22
0.83
0.83
0.25
0.66
1.0
n=45; All correlations with r > 0.465 are significant at the 9 9 . 9 % level. All variables have normally distributed data (Shapiro-Wilk W test with alpha=0.05) except L o g Ls for which the distribution is nearly normal.

Regional morphological analysis 65
t 127° 30' E
26 ( >
16° 00' S —
17
127° 30' E
vides
divides of tributary basins
reference number of basin
Figure 3.9. Location of selected drainage basins used in morphometric analysis. Numbers refer to basins listed in Appendix B. Basins grouped as being located in the 'lower' part of the study area which is characterized by a higher than average local relief comprise basins 25 to 29, and 35 to 45. All other basins form the 'upper' group, except the two principal basins of the study area, the Durack (1) and the Salmond River basin (30), which were excluded from this grouping.

Regional morphological analysis 66
The correlation coefficients are generally high, often for geometrical reasons. In the
study area, basin area (A) is highly correlated with its associated measures mainstream
length (Ls), basin length (Lb) and basin perimeter (P) (Tab. 3.7). M e a n valley gradient
(Sm) is, by definition, highly correlated to mainstream length, and for mostly geometric
reasons, to basin length, basin perimeter, elongation ratio (Er), and basin area as well.
The significant correlation between basin relief (Hb) and mean valley gradient reflects the
fact that the highest points within the basins occur generally along the main divides with
summit levels similar to those close to the headwaters of the trunk streams. In contrast to
the mean gradient, the local valley gradient (Sv) near the mouth of the basin is not
significantiy correlated with basin relief (Hb). However, local gradient is highly
correlated to basin area and its associated measures (basin length, basin perimeter, and
mainstream length) (Tab. 3.7). A s a consequence, local gradient is also highly correlated
to relief ratio and relative relief, with some improvement of the correlation resulting from
the inclusion of basin relief. A s no direct geometrical relationship exists between local
gradient and basin area or associated measures, the observed significant correlations
could indicate process based relationships. This possibility will be further investigated in
the next chapter, after additional evidence has been presented.
D u e to the geometrically caused high correlation between basin area and basin
perimeter, the two commonly used measures derived from basin relief, relative relief (Rl)
and relief ratio (Rh), are strongly correlated to each other. It can be noted in passing that,
in future studies in the region, the easily determined variable basin length could be used
to estimate the more rjme intensive variables basin area and basin perimeter. Similarly,
relief ratio is probably preferred over relative relief for much the same reason.
The shape of the basins is generally elongated (Appendix B ) , and basin length as well
as basin perimeter increase proportional to the square root of basin area (Figs. 3.10,
3.11). Drainage area itself increases with mainstream length proportional to the 1.7
power (Fig. 3.12), a c o m m o n functional relationship between these two variables which
can be used to replace drainage area with distance from the divide (cf. Howard, et al.,
1994; Seidl, et al., 1994).
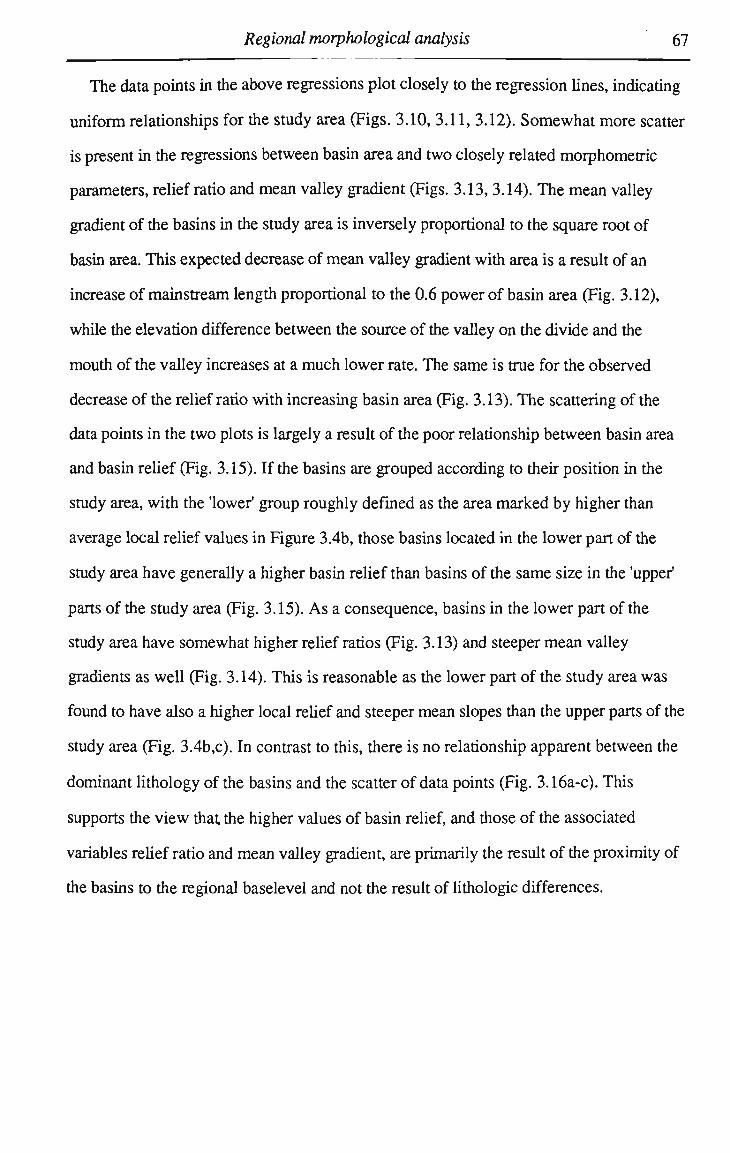
Regional morphological analysis 67
The data points in the above regressions plot closely to the regression lines, indicating
uniform relationships for the study area (Figs. 3.10, 3.11, 3.12). Somewhat more scatter
is present in the regressions between basin area and two closely related morphometric
parameters, relief ratio and mean valley gradient (Figs. 3.13, 3.14). The mean valley
gradient of the basins in the study area is inversely proportional to the square root of
basin area. This expected decrease of mean valley gradient with area is a result of an
increase of mainstream length proportional to the 0.6 power of basin area (Fig. 3.12),
while the elevation difference between the source of the valley on the divide and the
mouth of the valley increases at a much lower rate. The same is true for the observed
decrease of the relief ratio with increasing basin area (Fig. 3.13). The scattering of the
data points in the two plots is largely a result of the poor relationship between basin area
and basin relief (Fig. 3.15). If the basins are grouped according to their position in the
study area, with the 'lower' group roughly defined as the area marked by higher than
average local relief values in Figure 3.4b, those basins located in the lower part of the
study area have generally a higher basin relief than basins of the same size in the 'upper1
parts of the study area (Fig. 3.15). A s a consequence, basins in the lower part of the
study area have somewhat higher relief ratios (Fig. 3.13) and steeper mean valley
gradients as well (Fig. 3.14). This is reasonable as the lower part of the study area was
found to have also a higher local relief and steeper mean slopes than the upper parts of the
study area (Fig. 3.4b,c). In contrast to this, there is no relationship apparent between the
dominant lithology of the basins and the scatter of data points (Fig. 3.16a-c). This
supports the view that the higher values of basin relief, and those of the associated
variables relief ratio and mean valley gradient, are primarily the result of the proximity of
the basins to the regional baselevel and not the result of lithologic differences.

Regional morphological analysis 68
E M 42 J 43
60 C u B w cS OQ
100 J
10-J
1-
L b = 1.66 A0- 5
r = 0.98 u. /
Jf j M-
. j p + is$M-
y*v yd. '
^/ "fa P
+4pV y*^4_
I I I I 10 100 1000 10000 100000
Basin area A [km2]
Figure 3.10. Basin length (Lb) as a function of basin area (A).
1000
E
u *-» <u
E •c u a c cs CQ
100
10-
P = 3.93 A0-54
r = 0.997
-1 1 1000 10000 100000
M
a a c '35 C3
CQ
0000-
1000-
100-
10-
1-
A = 0.56Ls17 / r = 0.98 yjf
it
JK jf
i •• i
Basin area [km2]
10 100 1000
Mainstream length Ls [km]
Figure 3.11. Basin perimeter (P) as a function of basin area (A).
Figure 3.12. Basin area (A) as a function of mainstream length (Ls).
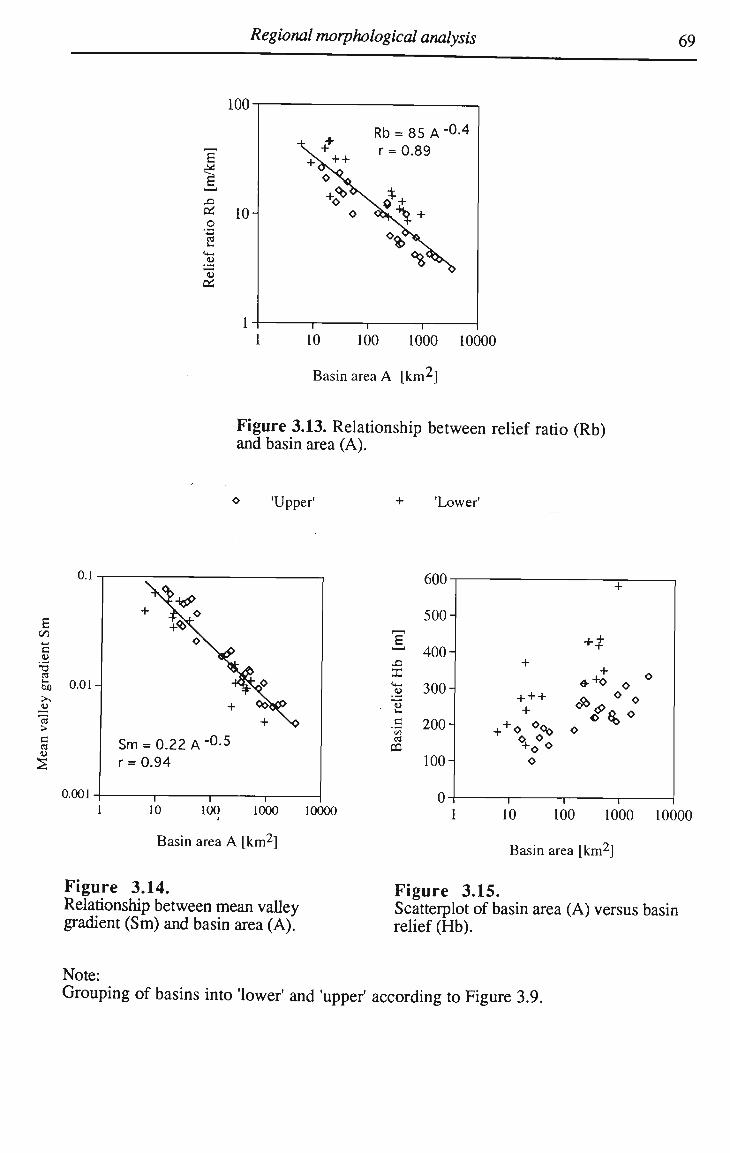
Regional morphological analysis 69
100
£
43
* 10 _o
u OS
0
1
Rb = 85 A"0-4
r = 0.89
i i
10 100 1000 10000
Basin area A [km^]
Figure 3.13. Relationship between relief ratio (Rb) and basin area (A).
o 'Upper' 'Lower'
E +-1
B <D
2
>^ jy > c «
0.01-
0.001-
+<©\ ©\
+
Sm = 0.22 A "°-5
r = 0.94
•• i - i
^
1 1 10 100 1000 10000
4
Basin area A [km2]
Figure 3.14. Relationship between mean valley gradient (Sm) and basin area (A).
43
X u 13
a CQ
uuu
500-
400-
Wl-
200-
100-
o-
+
+ + +
+0° o
+
+$
*+o 0 o
< *
©
1 1
1 10 100 1000 10000
Basin area [km2]
Figure 3.15. Scatterplot of basin area (A) versus basin relief (Hb).
Note: Grouping of basins into 'lower' and 'upper' according to Figure 3.9.
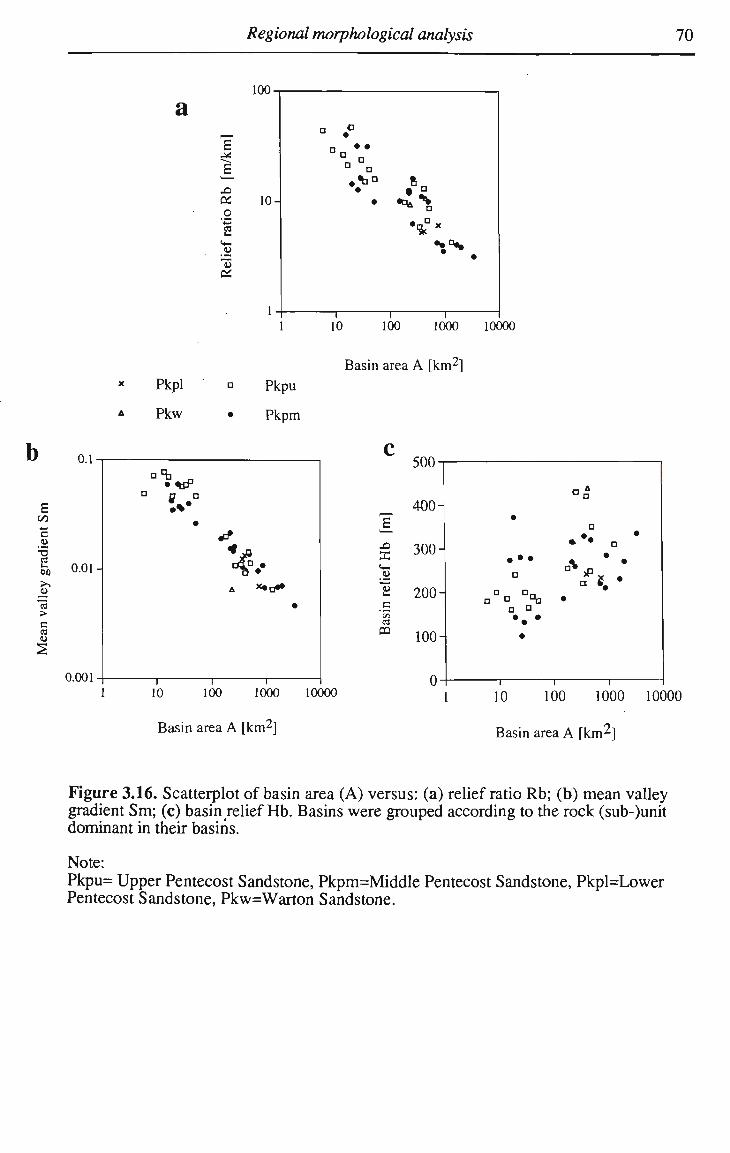
Regional morphological analysis 70
a E 44
4=
O '•C
S «*-o "o
10-
1-
° .°
• •
i
•s4
i i
10 100 1000 10000
Pkpl
Pkw
Pkpu
Pkpm
Basin area A [km2]
E
C
T5 OS u M
>> JU > c CS
u
0.01-
0.001-
a B a
•
i
•^
•
1 1
soc
io 100 1000 10000
Basin area A [km2]
43
X u
CQ
400-
300-
200-
100-
04
S
• *• Q
• •
0 D n
— I 1 1
10 100 1000 10000
Basin area A [km^]
Figure 3.16. Scatterplot of basin area (A) versus: (a) relief ratio Rb; (b) mean valley gradient Sm; (c) basin relief Hb. Basins were grouped according to the rock (sub-)unit dominant in their basins.
Note: Pkpu= Upper Pentecost Sandstone, Pkpm=Middle Pentecost Sandstone, Pkpl=Lower Pentecost Sandstone, Pkw=Warton Sandstone.

Regional morphological analysis 71
3.5 Summary of Chapter 3
The sedimentary strata of the southern Karunjie Plateau are only moderately deformed
and consist of vertical sequences of rocks of variable resistance. Differential weathering
and erosion of alternating layers of resistant and less resistant rocks have produced a
landscape dominated by structural landforms such as cuestas and plateaux. The main
caprocks in the study area are Upper and Lower Pentecost Sandstones and Warton
Sandstone, while the less resistant rocks are Middle Pentecost Sandstone and Elgee
Siltstone. The drainage is dendritic where rocks are horizontal, but shows strong
structural control where the sedimentary rocks are deformed. Of particular prominence
are strike streams, or stream reaches. Numerous water gaps where streams cut through
cuesta scarps occur in the study area and they indicate probable superimposition of the
drainage from higher levels of the crust. Fractures seem to have only limited control on
drainage pattern in the study area, although locally many streams clearly exploit existing
lines of weakness in the underlying rock.
The study area is generally characterized by widely spaced valleys, a moderate local
relief and usually gende mean slopes. The lower portions of the main drainage basins can
be identified as areas with a higher than average local relief and associated steeper mean
slopes. This is primarily the result of greater fluvial incision near the northeastern margin
of the study area, also indicated by the occurrence of incised gorges and the low
percentage of land at low elevations. This impulse of stream incision has apparently not
affected the central and upper portions of the study area, or possibly only to a lesser
degree, and this clearly distinguishes these from the lower portions. D u e to greater fluvial
incision along their trunk streams, tributary basins located in the lower part of the study
area are characterized by higher relief ratios and steeper mean valley gradients than those
further upstream.
The incision of the trunk streams draining the study area was triggered by downcutting
of the Cambridge Gulf West A r m estuary, as the latter is the baselevel for all streams in
Regional morphological analysis 72
the study area. O n its way north the Cambridge Gulf estuary cuts across several
topographic ridges in narrow gorges with figurative names such as 'The Gut' and The
Gorge' (Fig. 3.1), although the (now) estuarine channel could easily have bypassed these
'obstacles'. The summits of these ridges formed on resistant Upper Pentecost, Lower
Pentecost, or Warton Sandstones are about 200 to 300 m above sea level. According to
geological maps, the maximum water depth in the Cambridge Gulf estuary is only about
40 to 60 m even at a distance of about 100 k m downstream from the mouth of the Durack
River. Furthermore, the geological profiles and the occurrence of numerous bedrock
islands suggest that the estuarine sedimentary cover on top of the Proterozoic rocks
forming the valley floor is generally only thin along the tidal channel. All this indicates
that significant fluvial incision of the Cambridge Gulf valley had occurred prior to the
latest transgression and subsequent drowning in the Holocene. The cause and the timing
of this phases of downcutting remains as yet unclear, but this aspect of the long-term
landscape evolution of the region is beyond the scope of this study. Fluvial incision along
major valleys was possibly related to uplift and/or warping of the region in the late
Tertiary as has been proposed by several authors (e.g. Stewart et al., 1960; Plumb and
Gemuts, 1976). But it should be noted that as yet no stratigraphic markers have been
identified on the Kimberley Plateau which would permit a reliable reconstruction of the
region's vertical movements (relative to sea level) since the Palaeozoic.
4. LONGITUDINAL VALLEY PROFILES AND GRADIENTS
Generally, gradients of rivers and their valleys decrease downstream resulting in
concave longitudinal (long) profiles (e.g. Knighton, 1984). This characteristic profile
form reflects the processes of sediment transport and erosion and their functional
relationship to factors such as stream discharge (e.g. Kirkby, 1971). However, most
long profiles are not smooth but reveal breaks of slope in their profiles. Such knickpoints
(cf. Howard, et al., 1994) are either associated with a steepening or flattening of the
profile and correspondingly may be described as either convex or concave. The shape of
the respective profile segments upstream and downstream of such knickpoints can be
either concave, straight, or convex.
Convex knickpoints and profile steepening can be due to many factors with baselevel
changes or differential erosion of rocks of contrasting resistance among the more
common explanations. In the long-term evolution of a fluvial landscape valley gradients
may change with time and gradient can be seen as a dependant variable (Schumm, 1977).
Valley gradients may change due to erosion or sediment deposition and generally have the
tendency to adjust towards a continuity of sediment transport, or dynamic equilibrium
between removal and supply of load (Ahnert, 1994). Viewed over a shorter time interval
valley gradient is not self-adjusted by the river, but determined by its long geological
history and, therefore, imposes constraints on river morphology and behaviour (Church,
1992). Under such conditions inherited pronounced changes of valley gradient can
induce variations of all aspects of channel morphology (Ferguson and Ashworth, 1991).
Based on the differences in morphology, the dominant processes, and the time scales
of adjustment, stream channels may be classified into bedrock and alluvial and the latter
further into sand bed (fine bed) and gravel bed (coarse bed) (Howard, 1980; Howard,
1987). Howard et al. (1994) argue that for coarse-bed channels a further distinction could
be made between live bed gravel and threshold gravel. Knighton (1984) proposes a
similar classification and suggests the term boulder-bed for channels composed of very
Longitudinal valley profiles 74
large particles which move only infrequendy during high magnitude floods. Boulder-bed
channels are often found in association with bedrock channels and they may have similar
time scales of adjustment.
The distribution of bedrock and alluvial channels along a stream is linked to the
relationship between the potential bedload removal rate, largely a function of gradient,
and the rate of sediment supply to the stream by transport from upstream and by local
erosion (Ahnert, 1994; cf. Pickup, 1975). In simple terms, where more material is
removed by the stream than is supplied to it, bedrock channels are likely to occur, while
along reaches where sediment supply is greater or equal to the rate of removal alluvial
channels are found. Such a relationship may also be expressed in terms of threshold
concepts (cf. Schumm, 1979), in particular the concept of critical stream power (Bull,
1979). Where stream power exceeds critical power along a reach erosion takes place and
bedrock may be exposed along the channel. Bedrock channels are present in the steep
headwater reaches of many streams draining mountainous areas, while alluvial channels
are found typically along the middle and lower parts of stream profiles where gradients
are lower. The local steepening of river profiles due to changes in downstream baselevel
conditions or outcrops of resistant rocks can also lead to bedrock floored channels, in
particular where rates of stream erosion and/or sediment yield are low.
Besides being either alluvial or bedrock many channels are in fact mixed alluvial-
bedrock channels (Howard, et al., 1994), where alluvial reaches alternate with bedrock
reaches (e.g. Miller, 1991a; Wohl, 1992a; 1993). The relative abundance of such mixed
channels suggests that they are not just short-lived transitional features but possibly 4
equilibrium forms with channel gradients adjusted to provide sediment transport as well
as bedrock erosion (Howard, 1996). Mixed alluvial-bedrock channels may occur in a
number of situations: where the rates of bedrock incision are low and stream gradients are
not much steeper than for alluvial streams under similar conditions; where a bedrock
channel becomes partially mantied by alluvium due to climatic variations or land use
changes; where a former alluvial channel is partially converted into a bedrock channel due
Longitudinal valley profiles 75
to changes in sediment supply; or where steepening occurs ahead of an advancing head of
rejuvenation (Howard, et al., 1994; Howard, 1996).
Along the principal streams draining the study area such mixed alluvial-bedrock
channels occur upstream of steepened lower reaches where bedrock and boulder-bed
channels dominate. In the following, the long profiles of the main trunk streams will be
analysed, reasons for steepening of the downstream profiles investigated, and
implications for the distribution of channel types in the study area discussed.
4.1 Profile description and distribution of channel types
The valley long profiles and the profiles along the interfluves in Figure 4.1 were
determined from 1:100 000 topographic maps. The length of the interfluve profiles was
adjusted to those of the valleys by measuring the height of the interfluves at a given
stream length perpendicular to the valley axis. The interfluve profiles were smoothed by
omitting deep passes occurring along the profiles. As the valleys in the study area are
generally without any significant alluvial fills and the streams do not meander within their
valleys, the valley long profiles can be regarded as approximations of the average stream
profiles as well. Furthermore, even along largely alluvial channel reaches the sediment
cover is only thin and discontinuous and valley gradients therefore define those of the
bedrock thalweg. In the remainder of this chapter the term stream gradient generally
refers to the average local stream gradient which is assumed equal to the average local
valley gradient (Sv).
All three long profiles have prominendy steepened lower reaches (Fig. 4.1a-c),
characterized also by an increase in the elevation difference between the divides and the
valley floors. This agrees with observations made earlier that relief increases towards the
mouths of the study basins (Chapter 3). The profile shape of these steepened lower
reaches is straight or, in the case of the Durack River, slightly convex. The transition
between the gende middle reaches and the steepened lower reaches is marked by a well-
defined convex knickpoint along Bindoola Creek, while along the Durack and Salmond
Rivers this transition is somewhat more gradual. Along the Durack River, the point of
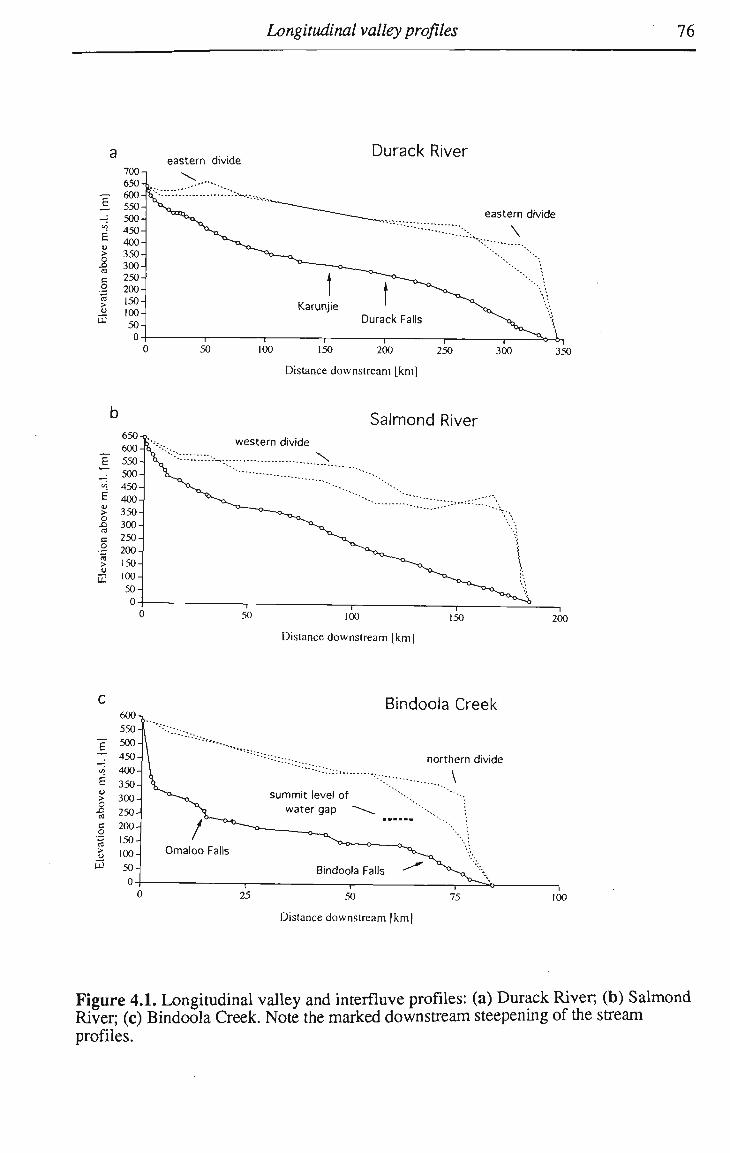
Longitudinal valley profiles 76
2
UJ
> o a c O
>
« c o u
2
eastern divide Durack River
eastern divide
\
300 350
Distance downstream [km]
Salmond River western divide
200
Distance downstream [km|
Bindoola Creek «»-*... 550-
500-
450-
400-
350-
300-i
250-
200-
150-
100-
50-
0-
c
*•" • " • ' • • - • . " - . .
\ "*""""'**--
Omaloo Falls
25
" ""**--*r;*--.
summit level of water gap *--
Bindoola Falls
r 50
northern divide
\
^ > > cs>o« 75
1 100
Distance downstream |km|
Figure 4.1. Longitudinal valley and interfluve profiles: (a) Durack River, (b) Salmond River; (c) Bindoola Creek. Note the marked downstream steepening of the stream profiles.
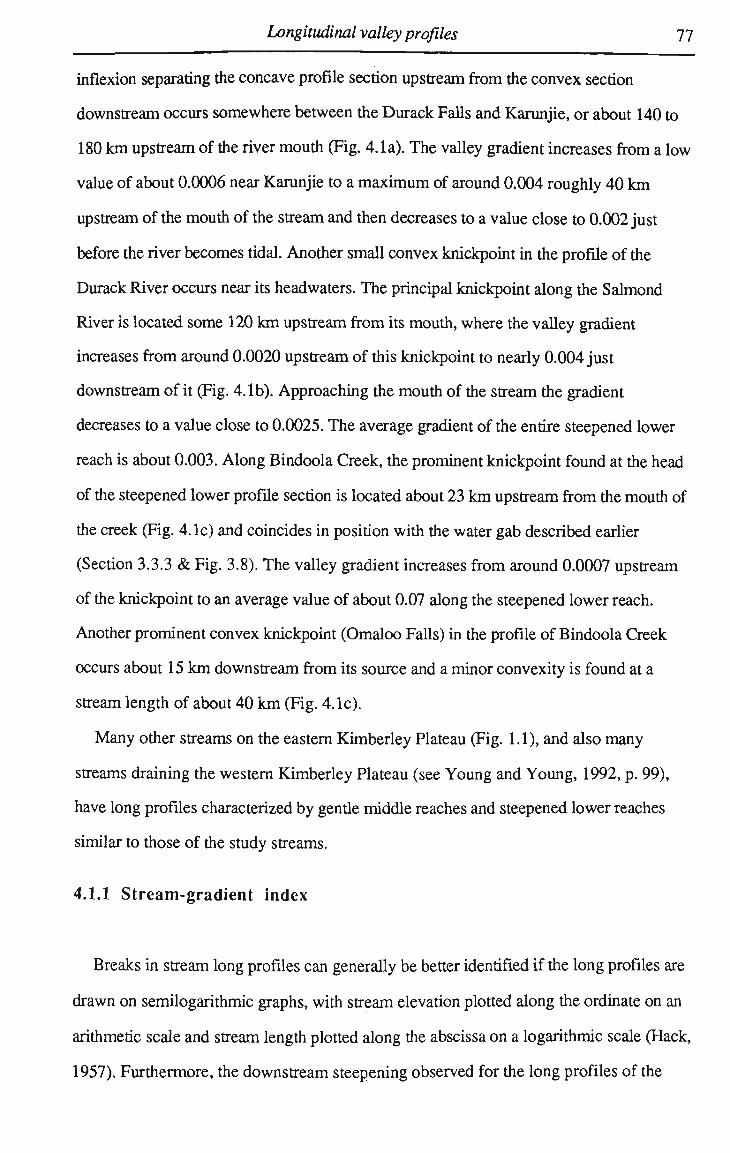
Longitudinal valley profiles 77
inflexion separating the concave profile section upstream from the convex section
downstream occurs somewhere between the Durack Falls and Karunjie, or about 140 to
180 k m upstream of the river mouth (Fig. 4.1a). The valley gradient increases from a low
value of about 0.0006 near Karunjie to a maximum of around 0.004 roughly 40 k m
upstream of the mouth of the stream and then decreases to a value close to 0.002 just
before the river becomes tidal. Another small convex knickpoint in the profile of the
Durack River occurs near its headwaters. The principal knickpoint along the Salmond
River is located some 120 k m upstream from its mouth, where the valley gradient
increases from around 0.0020 upstream of this knickpoint to nearly 0.004 just
downstream of it (Fig. 4.1b). Approaching the mouth of the stream the gradient
decreases to a value close to 0.0025. The average gradient of the entire steepened lower
reach is about 0.003. Along Bindoola Creek, the prominent knickpoint found at the head
of the steepened lower profile section is located about 23 k m upstream from the mouth of
the creek (Fig. 4.1c) and coincides in position with the water gab described earlier
(Section 3.3.3 & Fig. 3.8). The valley gradient increases from around 0.0007 upstream
of the knickpoint to an average value of about 0.07 along the steepened lower reach.
Another prominent convex knickpoint (Omaloo Falls) in the profile of Bindoola Creek
occurs about 15 k m downstream from its source and a minor convexity is found at a
stream length of about 40 k m (Fig. 4.1c).
Many other streams on the eastern Kimberley Plateau (Fig. 1.1), and also many
streams draining the western Kimberley Plateau (see Young and Young, 1992, p. 99),
have long profiles characterized by gende middle reaches and steepened lower reaches
similar to those of the study streams.
4.1.1 Stream-gradient index
Breaks in stream long profiles can generally be better identified if the long profiles are
drawn on semilogarithmic graphs, with stream elevation plotted along the ordinate on an
arithmetic scale and stream length plotted along the abscissa on a logarithmic scale (Hack,
1957). Furthermore, the downstream steepening observed for the long profiles of the
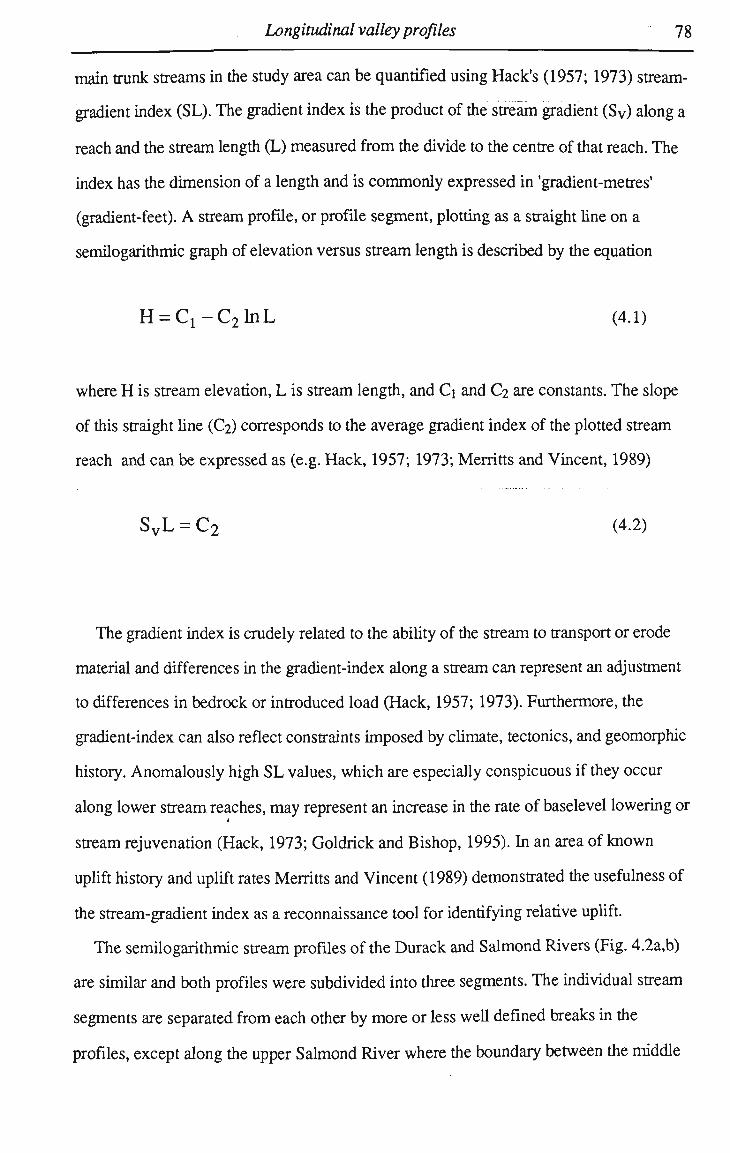
Longitudinal valley profiles 78
main trunk streams in the study area can be quantified using Hack's (1957; 1973) stream-
gradient index (SL). The gradient index is the product of the stream gradient (Sv) along a
reach and the stream length (L) measured from the divide to the centre of that reach. The
index has the dimension of a length and is commonly expressed in 'gradient-metres'
(gradient-feet). A stream profile, or profile segment, plotting as a straight line on a
semilogarithmic graph of elevation versus stream length is described by the equation
H = C1-C2lnL (4.1)
where H is stream elevation, L is stream length, and d and C2 are constants. The slope
of this straight line (C2) corresponds to the average gradient index of the plotted stream
reach and can be expressed as (e.g. Hack, 1957; 1973; Merritts and Vincent, 1989)
SVL = C2 (4.2)
The gradient index is crudely related to the ability of the stream to transport or erode
material and differences in the gradient-index along a stream can represent an adjustment
to differences in bedrock or introduced load (Hack, 1957; 1973). Furthermore, the
gradient-index can also reflect constraints imposed by climate, tectonics, and geomorphie
history. Anomalously high SL values, which are especially conspicuous if they occur
along lower stream reaches, may represent an increase in the rate of baselevel lowering or
stream rejuvenation (Hack, 1973; Goldrick and Bishop, 1995). In an area of known
uplift history and uplift rates Merritts and Vincent (1989) demonstrated the usefulness of
the stream-gradient index as a reconnaissance tool for identifying relative uplift.
The semilogarithmic stream profiles of the Durack and Salmond Rivers (Fig. 4.2a,b)
are similar and both profiles were subdivided into three segments. The individual stream
segments are separated from each other by more or less well defined breaks in the
profiles, except along the upper Salmond River where the boundary between the middle

Longitudinal valley profiles 79
and upper segment is less clear (see also Fig 4.6). To each of these segments a straight
line was fitted by linear regression and the average SL value for each reach was
determined from the slope of the regression line (Eq. 4.1). Along both profiles the SL
values increase in a downstream direction, with the fourfold increase of the average
gradient index from the gentie middle reaches to the steepened lower reaches being
especially prominent. However, along most of the lower Durack River, characterized by
an average gradient index of about 600 gradient-m, stream gradient actually increases
with increasing stream length and decreases downstream only along the last 40 k m of the
profile. Correspondingly, the local gradient index (measured between two data points of
the profile) increases from a value of about 240 gradient-m immediately downstream of
the Durack Falls to a maximum value of 1280 gradient-m at about 40 k m upstream of the
river's mouth and then decreases to a value of 580 gradient-m near the mouth of the river
(Fig. 4.2). Furthermore, due to the logarithmic horizontal scale the lower profile
segments of the Durack and the Salmond Rivers, both comparatively long rivers, are very
compressed (Fig. 4.2) and therefore appear smoother as compared with the profiles
drawn on arithmetic graphs (Fig. 4.1). Nevertheless, along both semilogarithmic profiles
(Fig. 4.1a,b) a clear break occurs between the fairly straight middle segments and the
much steeper lower segments. Conspicuously, the knickpoint in the profile of the Durack
River occurs at a location where the only known waterfall (Durack Falls) along the stream
is found. In the natural stream profile, however, the gradient of the stream starts to
increase with distance downstream from about 40 k m above these falls, but this
steepening of the profile is only very subtle.
As with the Durack and Salmond Rivers the semilogarithmic long profile of Bindoola
Creek was divided into three segments (Fig. 4.2 c). The average S L values for the
individual segments are similar to those found along the corresponding segments on the
Durack and Salmond Rivers. The pronounced increase of the gradient index from the
gende middle to the steep lower section on Bindoola Creek is sixfold. As it is interrupted
by a short sections with steeper than average logarithmic slopes, however, the middle
segment of the profile only roughly forms a straight line. This and other locally high SL
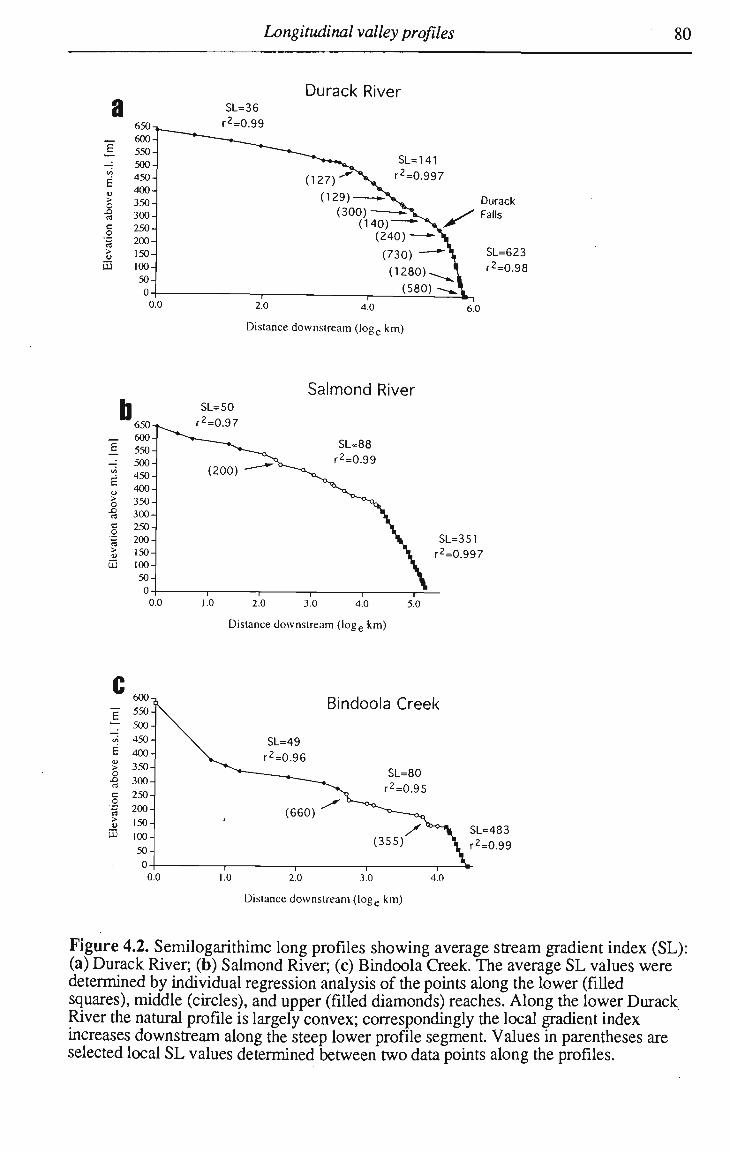
Longitudinal valley profiles 80
a Durack River
_ h
c/i
E u
> 0 -O a
e O a >
s
650-,
600 -|
550-
500-
450-
400-
350-
300-
250-
200-
150-
100-50-0-
> o JZ
a c O UJ
SL=36
r2=0.99
SL=141 r2=0.997
Durack Falls
SL=623
r2=0.98
Distance downstream (loge km)
650-
600-
550-
500-
450-
400-
350-
300-
250-
200-
150-
100-
50-
n-0
SL=50 ^ ^ r2=0.97
(200)
0 1.0 2.0
Salmond River
SL=88 r2=0.99
3.0 4.0 5.0
SL=351 r2=0.997
Distance downstream (loge km)
Bindoola Creek
SL=80 r2=0.95
SL=483 r2=0.99
1.0 2.0 3.0 4.0
Distance downstream (loge km)
Figure 4.2. Semilogarithimc long profiles showing average stream gradient index (SL): (a) Durack River; (b) Salmond River; (c) Bindoola Creek. The average SL values were determined by individual regression analysis of the points along the lower (filled squares), middle (circles), and upper (filled diamonds) reaches. Along the lower Durack River the natural profile is largely convex; correspondingly the local gradient index increases downstream along the steep lower profile segment. Values in parentheses are selected local S L values determined between two data points along the profiles.
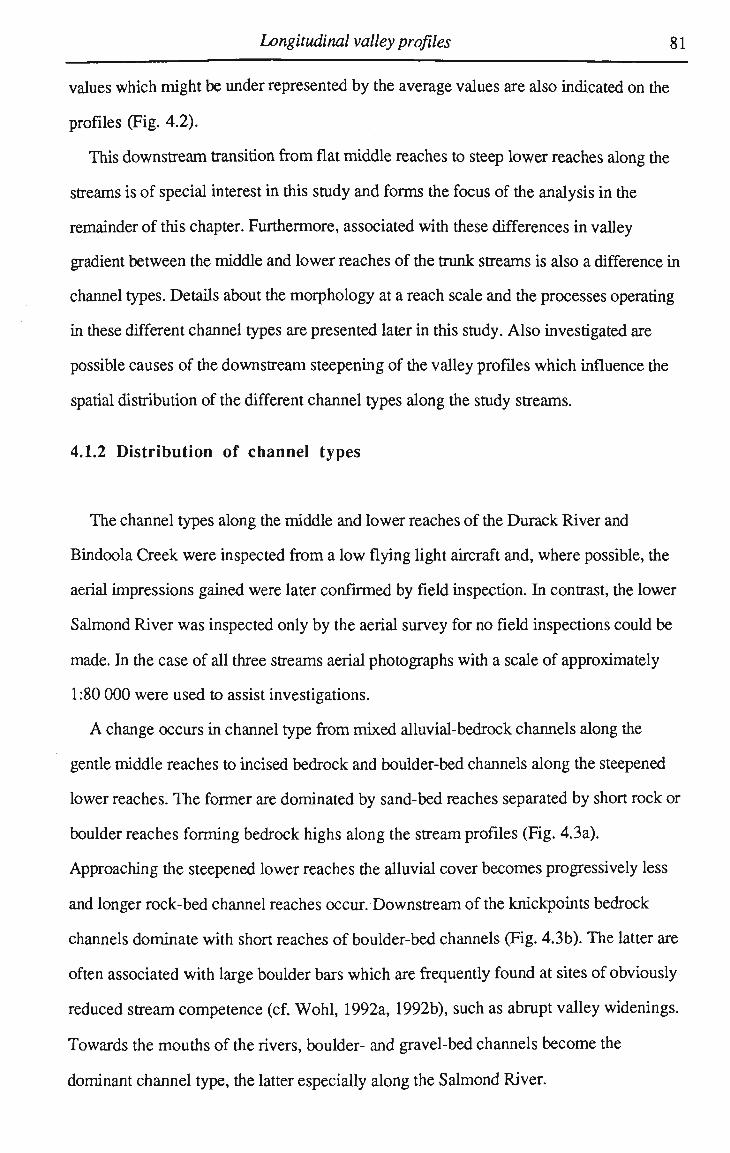
Longitudinal valley profiles 81
values which might be under represented by the average values are also indicated on the
profiles (Fig. 4.2).
This downstream transition from flat middle reaches to steep lower reaches along the
streams is of special interest in this study and forms the focus of the analysis in the
remainder of this chapter. Furthermore, associated with these differences in valley
gradient between the middle and lower reaches of the trunk streams is also a difference in
channel types. Details about the morphology at a reach scale and the processes operating
in these different channel types are presented later in this study. Also investigated are
possible causes of the downstream steepening of the valley profiles which influence the
spatial distribution of the different channel types along the study streams.
4.1.2 Distribution of channel types
The channel types along the middle and lower reaches of the Durack River and
Bindoola Creek were inspected from a low flying light aircraft and, where possible, the
aerial impressions gained were later confirmed by field inspection. In contrast, the lower
Salmond River was inspected only by the aerial survey for no field inspections could be
made. In the case of all three streams aerial photographs with a scale of approximately
1:80 000 were used to assist investigations.
A change occurs in channel type from mixed alluvial-bedrock channels along the
gentle middle reaches to incised bedrock and boulder-bed channels along the steepened
lower reaches. The former are dominated by sand-bed reaches separated by short rock or
boulder reaches forming bedrock highs along the stream profiles (Fig. 4.3a).
Approaching the steepened lower reaches the alluvial cover becomes progressively less
and longer rock-bed channel reaches occur. Downstream of the knickpoints bedrock
channels dominate with short reaches of boulder-bed channels (Fig. 4.3b). The latter are
often associated with large boulder bars which are frequently found at sites of obviously
reduced stream competence (cf. Wohl, 1992a, 1992b), such as abrupt valley widenings.
Towards the mouths of the rivers, boulder- and gravel-bed channels become the
dominant channel type, the latter especially along the Salmond River.

Longitudinal valley profiles 82
The steepened lower reaches of the Durack and the Salmond Rivers are associated
with the occurrence of ingrown meanders (Figs. 4.3c, 3.5) which may be indicative of
slow rates of incision (Chorley, et al., 1984, p. 312). However, the hanging valleys
associated with some smaller tributaries (Fig. 4.3d) suggest that these smaller streams are
not capable of incising at the same rate as the trunk streams.
Along the Durack River, the downstream transition from river reaches dominated by
sand-bed alluvial channels to reaches dominated by bedrock and boulder-bed channels
occurs approaching Durack Falls; the transition appears to be associated with an increase
of valley gradient to a value above approximately 0.001. Such a comparatively low
gradient threshold possibly reflects a low sediment yield conditioned by the widespread
occurrence of resistant sandstones in the river's drainage basin.
Figure 4.3. (Overleaf) Valley and channel types along the Durack River.
a) Mixed alluvial-bedrock channel near Karunjie about 185 km upstream from the river
mouth. View is towards the east. Note the plains developed on Middle Pentecost
Sandstone and the escarpment (Bluff Face Range) capped by Upper Pentecost
Sandstone visible in the background.
b) Incised bedrock and boulder-bed channel about 75 k m upstream from the mouth of
the river. The width of the channel is approximately 500 m. Note the alternating cut
banks and the boulder bar between the meander bends. The country rock is Upper
Pentecost Sandstone.
c) Ingrown meander bend about 40 k m upstream from the mouth. Note the well
developed slip-off slopes and cut banks along the river, and also along its entering
tributary. The height of the cliff is approximately 160 m. The river is incised into
Upper Pentecost Sandstone.
d) Hanging tributary valleys 40-60 m above the lower Durack River about 20 k m
upstream from its mouth. The length of the incised section of the tributary valley is
approximately 500 m. The country rock is Upper Pentecost Sandstone.

Longitudinal valley profiles 83
< M ^ , • « •
'•'• ;^Hjlt-> • ' • • • ' - • ^ ^
•P
T^- * .JJWBC*. m.CT •'
T ' V v -<•'•?.''••• :<J
1 *"
' •» fl
S'' 1 A, '• ^L
B- J
K -r
B' ^ V -
n .
g^f"'
•'-'
I '
_^^____
;#fe * 4- -* - -
» • »
VfeJ
HWBBMWHBMMMBBHWHRP^
Longitudinal valley profiles 84
4.1.3 Waterfalls
Special irregularities in long profiles of streams are waterfalls. On the topographic
maps only one waterfall (Omaloo Falls) is indicated along Bindoola Creek and no
waterfalls are indicated along the Durack and the Salmond Rivers. In the field, however,
at least one more waterfall can be identified along Bindoola Creek (4.4a) and one
waterfall along the Durack River (Fig. 4.4b). There are certainly more smaller falls along
the lower Durack River and there are probably also several falls along the lower Salmond
River, but their identification on existing aerial photos proves difficult
At Omaloo Falls (Figs. 3.7b, 4.1c) Bindoola Creek has a small catchment of only a
few tens of square kilometres and drops vertically approximately 20 m. The falls are
associated with the front scarp of a cuesta, locally known as the N e w York Jump Ups,
capped by Lower Pentecost Sandstone and underlain by Elgee Siltstone. Some 60 k m
downstream of the Omaloo Falls are the Bindoola Falls (Figs. 3.7b, 4.4a), a vertical drop
of about 16 m along Bindoola Creek which has a catchment of roughly 700 k m 2 at the
site. The falls are formed in quartzite beds near the top of the Lower Pentecost Sandstone
with the creek incised into the latter for a short distance downstream of the falls (Fig.
4.4a).
Figure 4.4. (Overleaf) Waterfalls in the study area.
a) Bindoola Falls along Bindoola Creek about 20 k m upstream from its mouth. The
width of the falls is approximately 200 m. The falls are cut into Lower Pentecost
Sandstone. Note the angular forms resulting from hydraulic plucking of joint blocks.
b) Durack Falls. Note the dry anabranch on the western side of the channel. The circle
marks the site where a sample of the ferruginous conglomerate was taken. This is
approximately 600 m downstream of the lip of the middle, or main, anabranch of the
falls. The country rock is Lower Pentecost Sandstone.
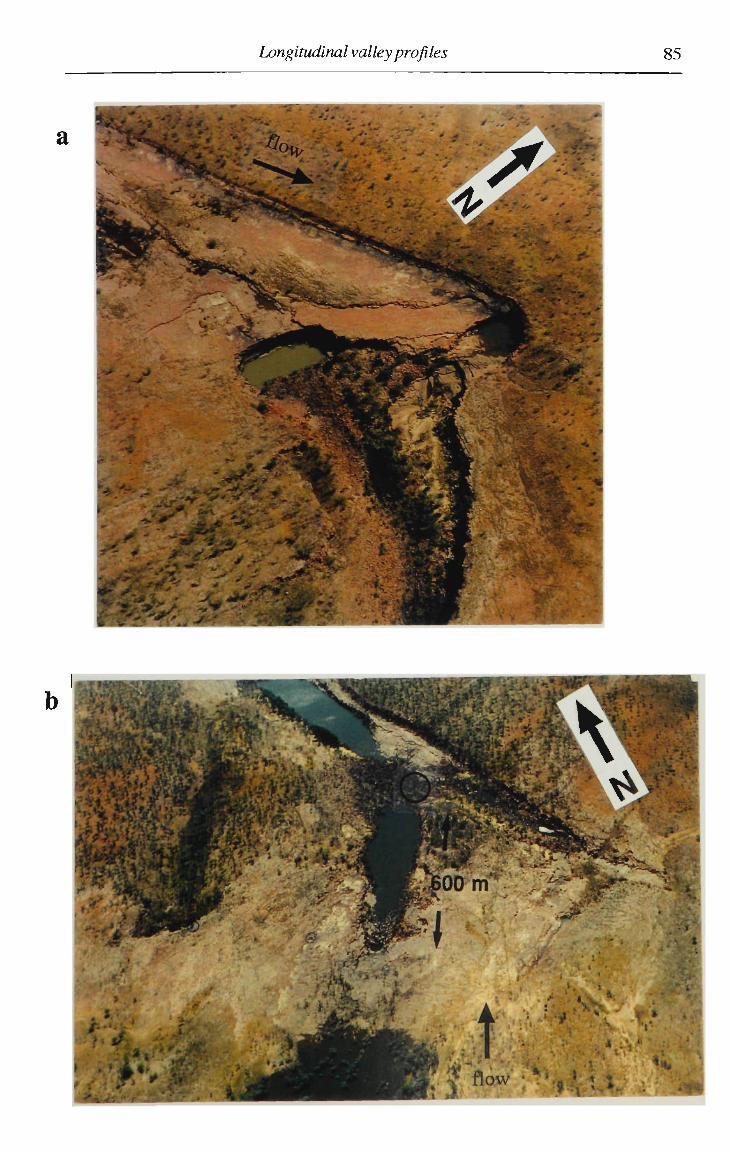
Longitudinal valley profiles 85
a
Longitudinal valley profiles 86
Likewise, the Durack Falls (Figs. 3.7b, 4.4b) are formed in these upper quartzite beds of
the Lower Pentecost Sandstone and here the Durack River with a local catchment of
approximately 10 000 k m 2 drops vertically by about 10 m. At Bindoola and Durack Falls
the Lower Pentecost Sandstone is thickly bedded and dips (< 5°) obliquely upstream
relative to the course of the streams. In the classification of waterfalls proposed by
Alexandrowicz (1994) all three waterfalls can be describe as being of the type related to
very thick layers of sandstone and formed on nearly horizontal beds (Type 2A). Only
Omaloo and Bindoola Falls, however, show signs of undercutting but, as was
demonstrated by Young (1985) for waterfalls in southeastern Australia, undermining of a
caprock is only one of several mechanism leading to the formation and retreat of
waterfalls. As an aside it may be noted that the Durack Falls, as well as Bindoola Falls,
are divided into at least two anabranches, a common feature of waterfalls in the
Kimberley region and elsewhere (cf. Ahnert, 1994). Furthermore, the occurrence of
vertical cliffs only on the down-dip side of the incised streams may indicate unilateral
stream migration towards the down-dip side. Such lateral migration of the Durack Falls
towards the east (down-dip) may have resulted in the abandonment of an anabranch on
the western (up-dip) side of the falls (Fig. 4.4b). Other scenarios, however, such as
changes in the flow regime of the river possibly linked to climatic variations, are also
possible.
4.2 Controls on profile steepening
4.2.1 General considerations and definition of terms
In general terms, a fall of baselevel at the mouth of a stream results in stream incision
which then propagates upstream, but the details of the stream's response may vary with
factors such as the nature of the baselevel lowering, hydraulic characteristics of the
stream, and the nature of the bedrock into which the stream is incising (cf. Holland and
Pickup, 1976; Gardner, 1983; Schumm, et al., 1987; Merritts and Vincent, 1989).
Provided that baselevel is constant for a period of time long enough to allow any impulse
Longitudinal valley profiles 87
of incision triggered by a previous phase of relative uplift to be transmitted to the head of
a stream, this stream may reach a state of 'grade' (Mackin, 1948) where no net erosion or
deposition occurs along the profile. At a landscape scale, however, neither baselevel nor
environmental conditions are likely to be constant long enough to allow vertical stream
erosion to ceases completely along an entire large river system and in particular in the
steep headwater region. Nevertheless, erosion rates along individual channel reaches, or
even along entire profiles, m a y become small enough to justify the assumption of a more
or less stable long profile. Such a stream or reach will be alluvial and is characterized by a
pure transport equilibrium whereby no significant net erosion or deposition occurs along
the profile (Ahnert, 1994). The equilibrium gradient in alluvial channels is largely
determined by the dominant discharge, sediment load, and sediment calibre (Howard,
1980, 1987).
A stream subject to baselevel lowering at a constant rate for a sufficiendy long time
may reach a state where its profile is lowered parallel to itself, thereby maintaining a
constant profile form. Incision rates along such a profile are uniform and equal to that of
baselevel lowering, indicating the existence of a dynamic equilibrium (Gilbert, 1877;
Ahnert, 1954; Hack, 1960) between stream incision and baselevel lowering. Theoretical
modelling of hill slope profile development indicates that the relaxation time needed to
reach a dynamic equilibrium on the entire slope increases with increasing slope length and
also with increasing resistance of the bedrock (Ahnert, 1994). Similarly, large rivers,
especially those incising into resistant rocks, probably have very long relaxation times. If
these exceed the time for which rates of baselevel lowering and environmental conditions
are constant, a situation where the entire profile is lowered parallel to itself in a steady
state is never reached. Examples of river systems with apparently very long relaxation
times are found in the highlands of southeastern Australia where very slow rates of
stream incision and headward migration of knickpoints were determined from evidence
provided by Tertiary basalts (Young and McDougall, 1993; Nott, et al., 1996a). The
early phases of adjustment of landforms towards a dynamic equilibrium, however,
generally proceed very rapidly (Ahnert, 1987a; 1994) and while equilibrium may not be
Longitudinal valley profiles 88
realized along an entire long profile it m a y well apply to sections of the profile and to
subsystems of the wider fluvial process-response system.
The occurrence of incised steep bedrock and boulder-bed channels, as well as the
occurrence of a high local relief, steep hill slopes, and hanging tributaries in the lower
part of the study area, indicate that the main streams are actively incising along their lower
reaches. Clearly, such incision can only have taken place in association with baselevel
lowering at the mouth of the streams, but the details about the temporal change in
baselevel are not known. The characteristic downstream transition from flat middle
reaches to steep lower reaches observed for the study streams can be the result of several
different scenarios. Some potential explanations are outlined. (1) It has been proposed
(e.g. Plumb and Gemuts, 1976) that the Kimberley Plateau wassubject to distinct phases
of planation and uplift, and the low gradient middle reaches of the study streams could
therefore represent uplifted remnants of profiles formed during a previous long period of
baselevel stability. (2) Hack (1957,1973) reported that downcutting streams have steeper
equilibrium profiles along sections cut through more resistant rocks. Supposing that the
profiles of the study streams are steady-state profiles, downstream steepening could be a
response to a downstream increase in rock resistance. (3) Resistant rock layers can result
in the development of knickpoints along downcutting streams (e.g. Lobeck, 1939, p.
197) and where such knickpoints become the sites of retarded downcutting they form
local baselevel controls for upstream reaches. In such situations profile reaches upstream
of an outcropping resistant layer may flatten, while at the same time the profile
downstream of the knickpoint continues to incise and steepen (Howard, 1980). The
cuesta and plateaux landscape of the study area reflects the influence of alternating
resistant and weak rock layers on landform development and it appears plausible that
resistant layers also affect the evolution of the stream profiles. Further possible
explanations for the steepening of the profiles, at least in principle, are downstream
changes in discharge or sediment characteristics. Elsewhere it has been demonstrated that
active tectonic deformation can result in a steepening of stream gradients leading to the
development of convexities in the longitudinal profiles (e.g. Burnett and Schumm,
Longitudinal valley profiles 89
1983). Along their lower reaches the trunk streams in the study area flow largely down-
dip as they converge towards a structural depression (Figs. 3.2a, 3.7b), but such basin
structures are the result of cross folding during the major folding events in Precambrian
times (Griffin and Grey, 1990) and any significant tectonic deformation or faulting that
could be related to the steepened lower long profiles of the study streams is not known to
have occurred in the more recent geological past. In consideration of the potential
explanations oudined above the long profiles of the study streams are n o w investigated
for clues to the cause(s) for their downstream steepening.
4.2.2 Episodic baselevel change and profile steepening
According to traditional concepts, episodic baselevel change may result in stream
rejuvenation where a formerly graded stream is divided by a headward cutting knickpoint
into a steepened lower reach adjusting to the new baselevel and a gently sloping stable
upper reach still graded to the former baselevel (Fig. 4.5). Along-such a rejuvenated
stream it may be possible to estimate the amount of baselevel lowering by downvalley
extrapolation of the gentle reach upstream of the head of rejuvenation. T o obtain such a
hypothetical former stream profile from a logarithmic long profile Goldrick and Bishop
(1995) suggested extrapolation of a straight line fitted to the gende upstream profile
segment. At any point downstream of the knickpoint the elevation difference (D*)
between this hypothetical profile and the actual profile can then be calculated (Fig. 4.6a-
c). In studies on stream profiles, however, it can prove difficult to differentiate profile
steepening induced by rejuvenation of a graded stream from steepening caused by other
factors. According to Goldrick and Bishop (1995) it may be possible to identify profile
steepening due to a fall in baselevel (or accelerated baselevel lowering in the case of a
former steady-state profile) by a comparison between the values of D * for streams with a
c o m m o n baselevel, such as a trunk stream and its tributary at their junction. Accordant
values provide evidence for baselevel change and the D * value provides an estimate of the
amount of baselevel fall; disparate values, however, cannot be taken as evidence that
baselevel change has not occurred (Goldrick and Bishop, 1995). In the following this
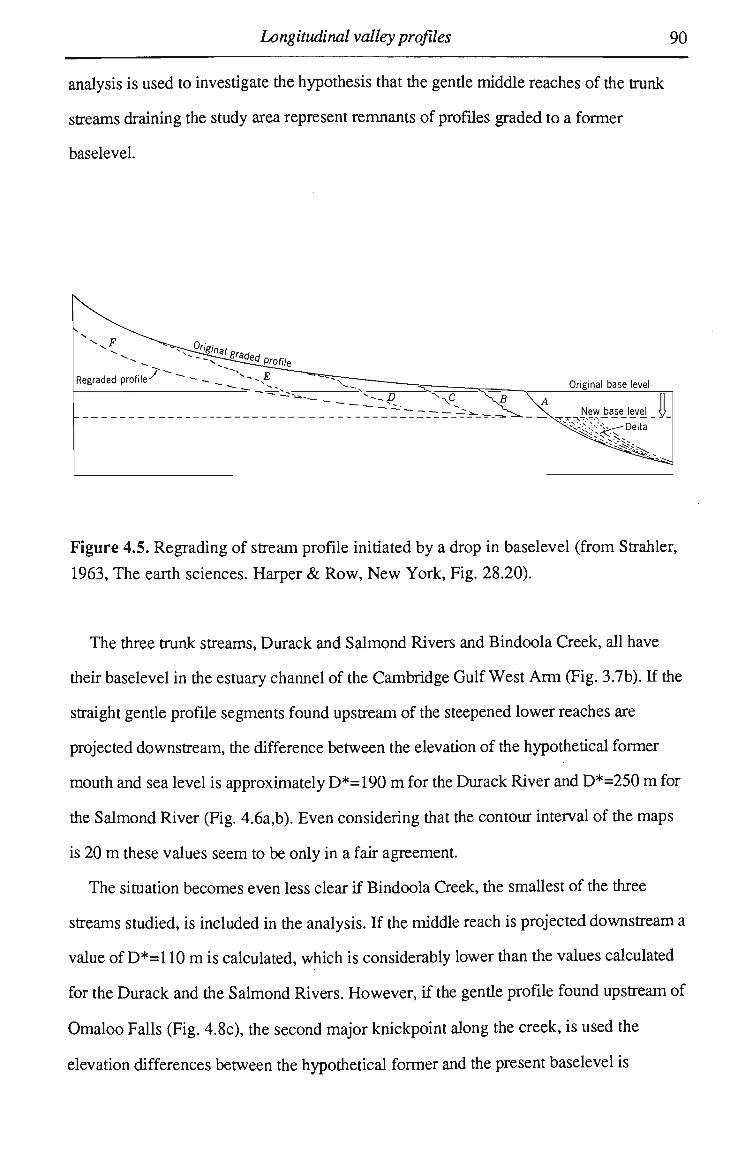
Longitudinal valley profiles 90
analysis is used to investigate the hypothesis that the gende middle reaches of the trunk
streams draining the study area represent remnants of profiles graded to a former
baselevel.
Figure 4.5. Regrading of stream profile initiated by a drop in baselevel (from Strahler,
1963, The earth sciences. Harper & Row, N e w York, Fig. 28.20).
The three trunk streams, Durack and Salmond Rivers and Bindoola Creek, all have
their baselevel in the estuary channel of the Cambridge Gulf West A r m (Fig. 3.7b). If the
straight gentle profile segments found upstream of the steepened lower reaches are
projected downstream, the difference between the elevation of the hypothetical former
mouth and sea level is approximately D*=190 m for the Durack River and D*=250 m for
the Salmond River (Fig. 4.6a,b). Even considering that the contour interval of the maps
is 20 m these values seem to be only in a fair agreement.
The situation becomes even less clear if Bindoola Creek, the smallest of the three
streams studied, is included in the analysis. If the middle reach is projected downstream a
value of D*=l 10 m is calculated, which is considerably lower than the values calculated
for the Durack and the Salmond Rivers. However, if the gende profile found upstream of
Omaloo Falls (Fig. 4.8c), the second major knickpoint along the creek, is used the
elevation differences between the hypothetical former and the present baselevel is
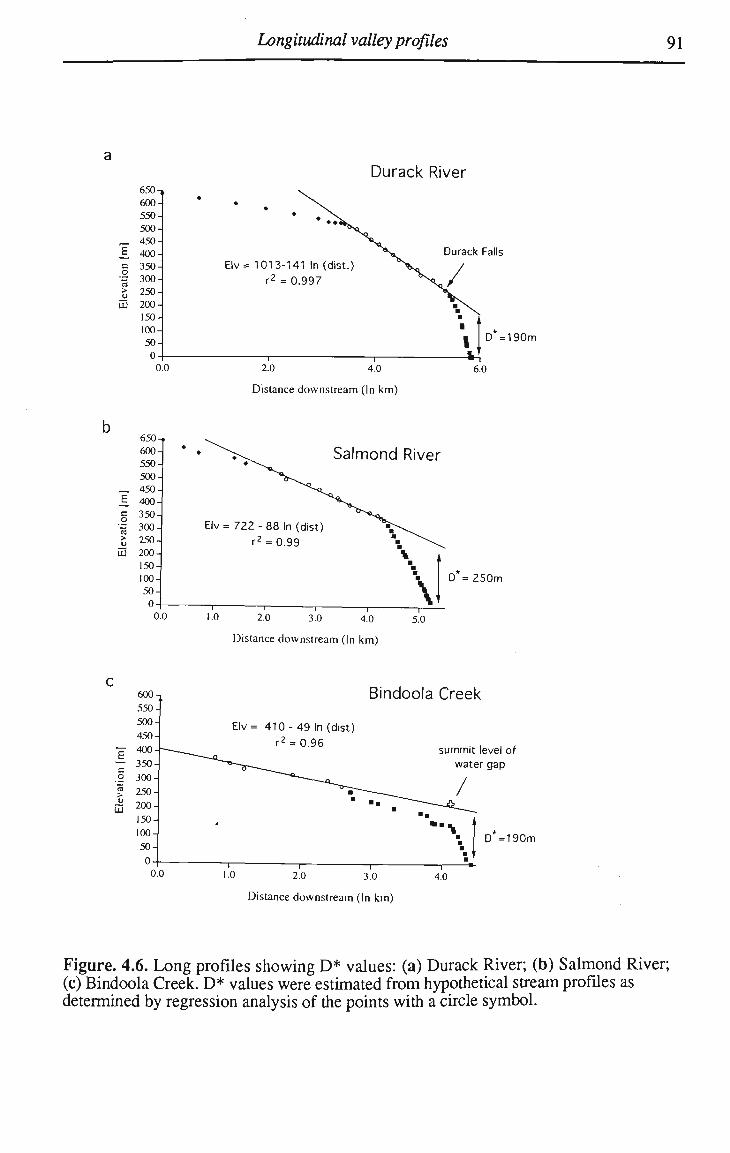
Longitudinal valley profiles 91
Durack River 650 > 600 550 500
_ 450 iL 400 S 350-J o •S 300
E3 200 150-100 50-J 0 0 '.0
Elv= 1013-141 ln(dist.)
r2 = 0.997
2.0 4.0
Distance downstream (In km)
Durack Falls
650-f 600 550 500-
_ 450-M. 400 g 350^ ~ 300 > 250 E 200-
150 100 50
"i
Salmond River
Elv = 722 - 88 In (dist)
r2 = 0.99
D = 250m
i - i i — 1 r —
0.0 1.0 2.0 3.0 4.0 5.0
Distance downstream (In km)
Bindoola Creek
Elv= 410-49 In (dist)
r2 = 0.96 summit level of
water gap
/
D =190m
2.0 3.0 4.0
Distance downstream (In km)
Figure. 4.6. Long profiles showing D* values: (a) Durack River; (b) Salmond River; (c) Bindoola Creek. D * values were estimated from hypothetical stream profiles as determined by regression analysis of the points with a circle symbol.
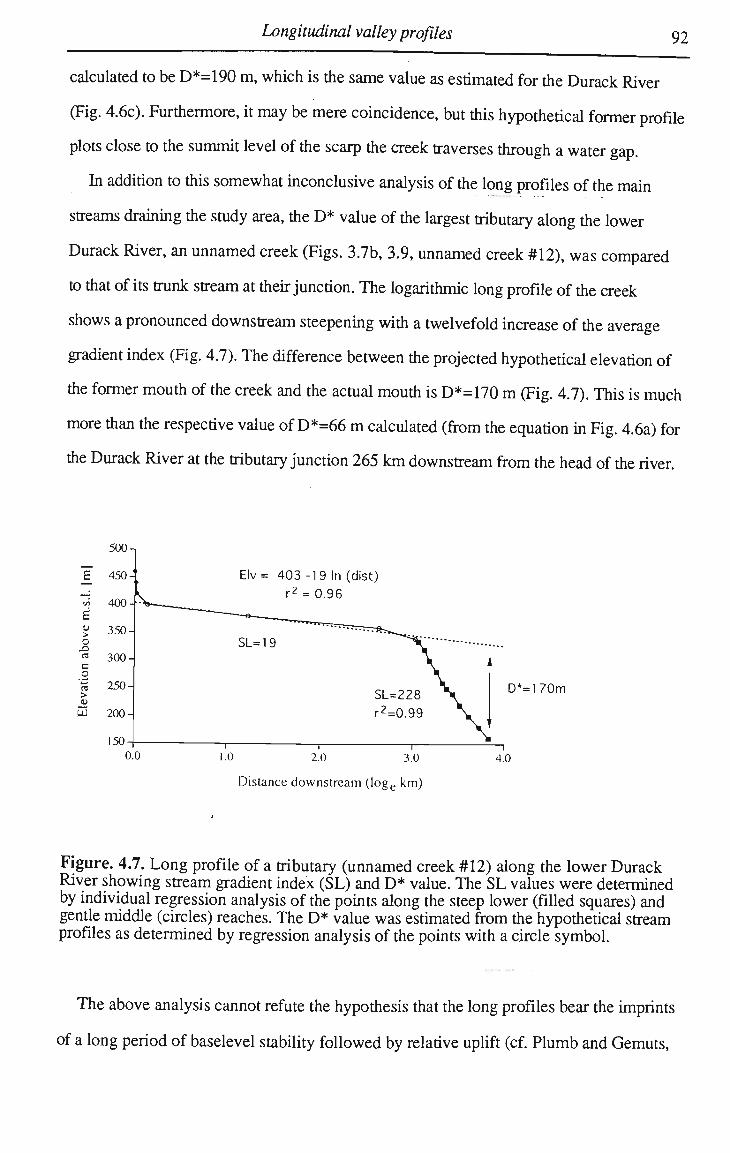
Longitudinal valley profiles 92
calculated to be D*=190 m, which is the same value as estimated for the Durack River
(Fig. 4.6c). Furthermore, it may be mere coincidence, but this hypothetical former profile
plots close to the summit level of the scarp the creek traverses through a water gap.
In addition to this somewhat inconclusive analysis of the long profiles of the main
streams draining the study area, the D* value of the largest tributary along the lower
Durack River, an unnamed creek (Figs. 3.7b, 3.9, unnamed creek #12), was compared
to that of its trunk stream at their junction. The logarithmic long profile of the creek
shows a pronounced downstream steepening with a twelvefold increase of the average
gradient index (Fig. 4.7). The difference between the projected hypothetical elevation of
the former mouth of the creek and the actual mouth is D*=170 m (Fig. 4.7). This is much
more than the respective value of D*=66 m calculated (from the equation in Fig. 4.6a) for
the Durack River at the tributary junction 265 km downstream from the head of the river.
500-,
E 450-
tn 400-
Elv= 403-19 In (dist)
r2 = 0.96
5J
> c X)
a c o >
350-
UU 200
300
250 D*=170m
Distance downstream (loge km)
Figure. 4.7. Long profile of a tributary (unnamed creek #12) along the lower Durack River showing stream gradient index (SL) and D * value. The SL values were determined by individual regression analysis of the points along the steep lower (filled squares) and gentle middle (circles) reaches. The D * value was estimated from the hypothetical stream profiles as determined by regression analysis of the points with a circle symbol.
The above analysis cannot refute the hypothesis that the long profiles bear the imprints
of a long period of baselevel stability followed by relative uplift (cf. Plumb and Gemuts,
Longitudinal valley profiles 93
1976), but given the disparate D * values, it appears unlikely that the flat middle sections
of the streams represent true remnants of profiles graded to a former baselevel.
Furthermore, even if it is assumed that stream rejuvenation has occurred, the analysis
indicates that the amount of such an hypothetical fall in baselevel cannot readily be
estimated by downstream extension of the gentie middle reaches of the trunk streams in
the study area.
4.2.3 Evidence for lithologic controls on profile steepening
This section investigates whether the long profiles of the study streams show evidence
for a relationship between profile steepening and differences in rock resistance. The
location of the boundaries of the rock units outcropping along the streams were
determined from 1:250 000 Geological maps (Fig. 4.8). In addition to this the attitude of
the strata relative to the flow direction of the streams was recorded.
A. Adjustment to differences in bedrock resistance
Along their steepened lower reaches, the Durack River and Bindoola Creek are largely
incised into resistant Lower and Upper Pentecost Sandstones, while the lower Salmond
River is cut mainly into the weaker Middle Pentecost Sandstone (Fig. 4.8). These
differences in bedrock resistance may partly explain the higher average gradient index
values of the lower reaches of the Durack River and Bindoola Creek when both are
compared to the average gradient index of the lower Salmond River (Fig. 4.2a-c).
Furthermore, the apparent differences in valley morphology between the lower Durack
River (Fig. 4.3c) and the lower Salmond River (Fig. 3.5) may also be linked to such
lithological differences.
A detailed study indicates, however, that the downstream steepening of the stream
long-profiles is most likely not an expression of an equilibrium adjustment by the rivers
to any coincidental downstream increase in rock resistance along all three streams. In
their steepened lower profile reaches as well as along their gentle middle reaches, these
individual streams cut across various rock units without any pronounced effect on their
Longitudinal valley profiles 94
profiles (Figs. 4.8). Furthermore, the weak Middle Pentecost Sandstone as well as the
resistant Upper and Lower Pentecost Sandstones are found not only along the steepened
lower reaches of the trunk streams, characterized by high average SL values between 350
to 620 gradient-metres, but also along the gender middle reaches with average SL values
of less than 150 (Figs. 4.2, 4.8). The morphological analysis of the study area conducted
in the previous chapter provided no evidence for the existence of a 'zone of especially
resistant rocks' in the lower part of study area which could explain the coincidental
steepening of all three study streams.
B. Association between knickpoint location and resistant rock layers
The position of boundaries between rock units as shown on geological maps
represents their generalized location on the landsurface. Due to the fact that the bedrock in
the study area is stratified and only gendy deformed, the transition between two rock
units outcropping along a (natural) stream bed can actually occur at a significantly
different location than is shown on maps; where strata is horizontal or dips upstream, the
boundary on the stream bed is likely to occur some distance upstream, and where strata
dips downstream the boundary is likely to occur further downstream. While not
considered to pose a problem for the above analysis, the actual position of rock outcrops
becomes important when investigating for any association of knickpoints with outcrops
of resistant rock layers. For the Durack River and Bindoola Creek, the rock units
outcropping in the vicinity of the knickpoints were therefore confirmed in the field; for
the Salmond River this was not possible.
Along the study streams the breaks in the profiles separating gentle profile reaches
upstream from steepened reaches downstream appear to occur near the top of outcrops of
resistant sandstones; namely Warton, Lower Pentecost, and Upper Pentecost Sandstones
(Figs. 4.2, 4.8). These rocks are also the main caprocks of cuesta and plateau scarps in
the region (Fig. 3.3). The principal knickpoint in the long profile of the Durack River is
located close to Durack Falls (Fig. 4.2a) and it occurs in the top portion of the resistant
Lower Pentecost Sandstone (Fig. 4.8a). Upstream from the falls, stream gradients are
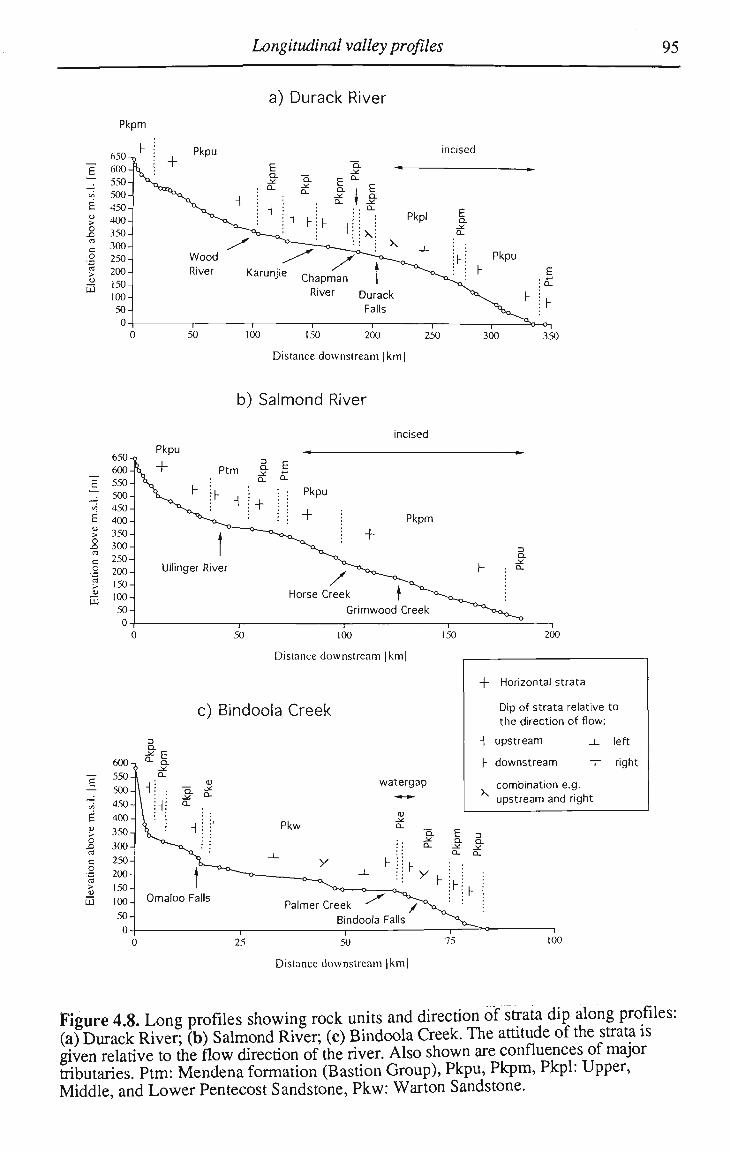
Longitudinal valley profiles 95
o
a
UJ
a) Durack River
Pkpm
650
600
550
500
450
400-
350-
300
250
200-
150-
100
50
0
0
incised
300 350
600
j=
t/i
E u 0
a c 0
a u LU
550-
500-
450-
400-
350-
300-
250-
200-
150-
100-
50-
0-
Distance downstream [km]
b) Salmond River
incised
Ullinger River
Horse Creek j Grimwood Creek
50 100 150 200
Distance downstream [km]
c) Bindoola Creek
watergap
+
H h
X
Horizontal strata
Dip of strata relative to the direction of flow:
upstream _i_ left
downstream -r right
combination e.g. upstream and right
Distance downstream [km]
Figure 4.8. Long profiles showing rock units and direction of strata dip along profiles: (a) Durack River; (b) Salmond River, (c) Bindoola Creek. The attitude of the strata is given relative to the flow direction of the river. Also shown are confluences of major tributaries. Ptm: Mendena formation (Bastion Group), Pkpu, Pkpm, Pkpl: Upper, Middle, and Lower Pentecost Sandstone, Pkw: Warton Sandstone.
Longitudinal valley profiles 96
low and the landsurface of low relief adjacent to the river, described in more detail in the
previous chapter, is formed on comparatively little resistant Middle Pentecost Sandstone.
However, outcrops of Lower Pentecost Sandstone (associated with broad anticlines) near
the Chapman River confluence and upstream of Karunjie (Figs. 3.2, 3.7b, 4.8a) suggest
that much of the thalweg of the Durack River valley is formed on top of this sandstone
rather than in the overlying less resistant Middle Pentecost Sandstone.
The pronounced knickpoint along the lower course of Bindoola Creek is formed on
Warton Sandstone (Figs. 4.8 c) and it coincides in location withthe water gap cut
through a cuesta scarp capped by resistant Lower Pentecost Sandstone (Fig. 3.7b,
Section 3.3.3). Upstream of the knickpoint, the creek has nowhere significantly incised,
but instead flows as a strike stream along the contact between Warton Sandstone and the
far less resistant Elgee Siltstone. Further upstream along Bindoola Creek, the prominent
knickpoint at Omaloo Falls is associated with the cuesta scarp capped by Lower Pentecost
Sandstone (New York Jump Ups) (Figs. 3.7b, 4.8c). The knickpoint at the head of the
steepened lower reach of the Salmond River appears to occur in the top portion of the
Upper Pentecost Sandstone (Fig. 4.8b).
All of the above suggest that the occurrence of the principal knickpoints in the profiles
of the trunk streams could be related to outcrops of resistant rock layers acting as local
baselevel controls for the upstream low gradient stream reaches. The fact that the strata
underlying the study area are gently cross-folded and in particular the occurrence of a
basin-like structure at the northeastern margin of the study area (Figs. 3.2, 3.7b) towards
which the three trunk streams converge (the head of the Cambridge Gulf West A r m is
situated in the centre of this basin), however, add a considerable degree of complexity to
the question for the actual effects of such (deformed) resistant rock layers on profile
evolution.
Along their incised and steepened lower reaches, the Durack River and Bindoola
Creek cut across the Upper Pentecost Sandstone without any pronounced effect on their
profiles, while along the Salmond River the outcrop of this sandstone appears to be
related to the occurrence of the principal knickpoint along its profile (Fig. 4.8). In an

Longitudinal valley profiles 97
attempt to explain this apparent contradiction, possible differences in erosive power due
to differences in channel geometry or specific discharge, or differences in the erodibility
of the bedrock could be proposed. Regarding the erodibility of bedrock, attitude of the
strata is possibly of importance. The Upper Pentecost Sandstone dips largely
downstream along the lower Durack River and Bindoola Creek, but it is essentially
horizontal in the vicinity of the knickpoint along the Salmond River (Fig. 4.8).
Furthermore, a small convex knickpoint in the profile of the Durack River upstream of
Karunjie appears to be related to upstream dipping outcrops of Lower Pentecost
Sandstone (Fig. 4.8) and, as mentioned earlier, the two waterfalls along Bindoola Creek
and the falls along the Durack River occur where strata dip has an upstream component.
As will be shown, where streams erode by hydraulic plucking the effective dip of the
strata relative to the slope of the channel appears indeed to be anTmpbrtant factor
determining the rock's resistance to erosion; where outcropping sandstones are horizontal
or dip upstream, they appear to be more resistant than in situations where they dip
downstream.
4.2.4 Other possible factors
Other possible factors that could cause the lower sections of long profiles to be
steepened are downstream changes in sediment supply or discharge. However, the
occurrence of steepened lower reaches along all studied streams (Figs. 4.2a-c, 4.7b),
although they are very different in size and cut through different rocks, seems to rule out
such downstream changes as a general cause for the steepened lower reaches.
It may be argued that, similar to the situation on hill slopes (Ahnert, 1987b), the
failure of local discharge to increase with increasing drainage area or channel length as a
result, for example, of transmission losses or only partially contributing drainage areas
(Yair, et al., 1978), could result in convex equilibrium long profiles. Any such changes
in the relationship between drainage area and discharge, however, are not apparent for the
region (Fig. 1.7a) and are very unlikely given the fact that rainfall increases towards the
coast (downstream) in these catchments. Furthermore, pronounced changes in the rate at
Longitudinal valley profiles 98
which drainage area increases with distance downstream are not evident for the principal
streams in the study area (Fig. 3.7). Moreover, there is no indication that the downstream
steepening of the stream profiles is triggered by entry of major tributaries (Figs. 3.7,
4.8).
It is well known that local gradient in alluvial channels is closely related to the size of
the bed material (e.g. Hack, 1957) and it has been demonstrated that locally supplied
coarse bed material can effectively control stream gradients (e.g. Howard and Dolan,
1981; Howard, et al., 1994). Along the steepened and incised lower reaches of the study
streams, coarse material is supplied to the rivers by local erosion, from steep tributaries,
or collapse of vertical gorge walls. The nature of the locally supplied coarse material is
related to the properties of the exposed rocks, and differences in the size of the supplied
material are likely to influence gradients of threshold gravel or boulder-bed channel
reaches along the study streams. The steepened lower profile reaches of the study
streams, however, are dominated by bedrock channels and the gradients of such channels
are largely determined by the erosional history of the streams and the distribution of
bedrock resistance along the channels (Howard, 1987). Stream sections characterized by
bedrock or very coarse bed material also occur along the middle reaches of the trunk
streams which are, as a whole, dominated by sand-bed channels, yet gradients remain
low along these reaches (Fig. 4.9a-c). For example, near Karunjie (Fig. 3.7b) the Durack
River flows in a boulder-bed channel associated with an expansion bar (Baker, 1984)
formed downstream of a small gorge cut through an anticline in the Lower Pentecost
Sandstone (Figs. 4.8, 4.9a-c). The valley profile along the middle reach of the Durack
River is constrained by such bedrock and boulder-bed channel sections and the low
gradient of the reach permits the occurrence of long sand-bed alluvial channel sections
along this part of the profile.
Longitudinal valley profiles 99
Figure 4.9. (Overleaf) Durack River near Karunjie.
a) Aerial view of Nettopus Pool, the only hydrometric station along the Durack River,
during a peak flow of about 1600 m3/s on 13 February 1991. This flood was the second
highest since records began in 1967. The width of the channel in the foreground is about
170 m and the water depth in the bedrock channel cut into Lower Pentecost Sandstone is
about 9 m. 'A' marks the location of the photograph shown in (b) at the downstream end
of this incised channel reach. Note the plains largely developed on Middle Pentecost
Sandstone in the background. Photo and data courtesy of P. Clews, Water Authorities of
Western Australia.
b) Downstream of Nettopus Pool. Note the stripped bedrock surfaces and the large
boulder deposits on the right hand side of the photo. 'A' indicates the approximate
location of a conglomerate sample taken from the boulder bar flanking the river. 'B'
indicates the location of the photograph shown in (c).
c) Large imbricated boulders downstream of Nettopus Pool. Hydraulic plucking of joint
blocks appears to be an important erosional process along this channel reach (see also
photograph above).

Longitudinal valley profiles 100
a
'— lJ ' ~- "* ' "'i- , i ' -- . '-'• fX-^% •--* •
Longitudinal valley profiles 101
4.3 Incision laws and area-gradient relationships
Howard (1980) simulated the effects of a resistant rock layer on long profile
evolution, while Howard et al. (1994) modelled the evolution of a profile subject to
episodic uplift. Implications of these simulations for the interpretation of the profiles of
the study streams are discussed at the end of this chapter. The functional relationship
used to described stream erosion into bedrock in these simulations is briefly oudined
below and some profile parameters are evaluated for the study area.
Fluvial downcutting is an essential mechanism of landscape evolution, but to date, no
universal law of channel erosion into bedrock exists. Several different approaches to
quantify stream incision into bedrock have been pursed (e.g. Foley, 1980; Howard and
Kerby, 1983; Bonneau and Snow, 1992; Annandale, 1995) and the various processes by
which channels erode may require more than one law to adequately address the problem
(Seidl and Dietrich, 1992).
4.3.1 Bedrock incision laws
The rate of scour along bedrock streams is related to the detachment capacity of the
flow which depends on various factors such as rock erodibility, specific discharge,
channel gradient, sediment flux, and possibly grain size of sediment in transport
(Howard, et al., 1994). Although there may not be a universal law of fluvial erosion into
bedrock the rate of incision (E) may be approximated by the product of drainage area (A)
and stream (valley) gradient (Sv) each raised to an exponent (m, n), and a constant (k)
accounting for several factors including bed erodibility, magnitude and frequency
characteristics of the flow, and sediment type and load (e.g. Howard, 1987; Seidl, et al.,
1994; Willgoose, et al., 1994)
E = kAmSvn (4.4)
Such an equation is physically meaningful and it can be related to general transport and
Longitudinal valley profiles 102
erosion theories (Howard, et al., 1994; Willgoose, et al., 1994). A s the exponents in
Equation 4.4 are expression of various factors which scale with drainage area or slope,
such as discharge, the coefficients m and n may vary with basin and channel
characteristics and the erosional processes.
Howard and Kerby (1983) studied bedrock channels in shale badlands and suggested
that channel incision is proportional to the dominant bed shear-stress. A n incision model
based on this assumption and derived using c o m m o n functions of fluvial hydraulics and
hydraulic geometry can be expressed by Equation 4.4 with the exponents m=0.3 and
n«0.7, giving a ratio m/n close to 0.4 (Howard, et al., 1994). A n alternative model
assumes the rate of channel incision into bedrock as proportional to stream power with
the ratio of m/n (Eq 4.4) being close to unity (Seidl and Dietrich, 1992). Indeed, incision
rates of bedrock channels in Hawaii indicate they are proportional to simply a product of
drainage area and channel gradient, suggesting the exponents m and n in Equation 4.4 be
close to unity (Seidl, et al., 1994). For basins where the dominant or channel forming
discharge is directiy proportional to drainage area, the rate of channel erosion is then
direcdy proportional to stream power per unit length.
Implied in Equation 4.4 is that for streams with uniform and constant incision rates
along their profiles (E=const.), which can be interpreted as a dynamic equilibrium
between the rates of incision and relative uplift, a relationship between gradient and
drainage area exists of the form (e.g. Howard, et al., 1994; Willgoose, et al., 1994)
SvAj = const. (4.5)
or rearranged
Sv oc A"j (4.6)
where the exponent j=m/n for an incision law as described by Equation (4.4). In general,
such a relationship between stream gradient and basin area, or associated measures such
as stream length or stream order, has been often reported (e.g. Hack, 1957; 1973; Flint,
Longitudinal valley profiles 103
1974; Tarboton, et al., 1989) and it can be explained and quantitatively expressed with
the physical processes that lead to channel erosion (e.g. Howard and Kerby, 1983;
Howard, et al., 1994; Willgoose, 1994; Willgoose, et al., 1991; 1994). A close
relationship between drainage area and gradient, however, may not only be found where
relative uplift and stream incision are in a dynamic equilibrium; but also where streams
are at grade. The transport capacity of a stream can be approximated by a power function
of drainage area and gradient essentially in the form of Equation 4.4 (e.g. Kirkby, 1971;
Seidl and Dietrich, 1992; Howard, 1994) and the assumption of continuous sediment
transport implies that gradient is proportional to drainage area as is expressed in Equation
4.6. Furthermore, gradient may also be proportional to drainage area in situations where
relief and stream gradients decline with time (Willgoose, 1994), although a more
appropriate functional description of this situation may in fact be a relationship
incorporating, besides area and gradient, the mean elevations above a local or regional
baselevel (Willgoose, 1994; Willgoose, et al., 1994).
Form the above discussion it follows that if a stream is assumed to be in an
equilibrium where incision equals lowering of the respective baselevel, then the ratio m/n
can be determined from a plot of stream gradient versus basin area (Eq. 4.6). However, a
relationship between drainage area and local gradient not only occurs along a steady state
equilibrium profile, but also where a profile is at grade, or in situations of declining
gradient with time. Therefore, no conclusions can be drawn from the existence of such a
relationship about the evolutionary state of a profile or catchment (cf. Willgoose, 1994).
Nevertheless, for channels, or channel reaches characterized by a disequilibrium between
stream incision and rate of baselevel lowering this relationship is likely to be less clear.
4.3.2 Area - gradient relationships in the study area
For the 45 basins used for the morphological analysis in the previous chapter (Fig.
3.9) the stream gradients (approximated by the local valley gradients Sv) near the mouth
of the basins were determined from 1:100 000 topographic maps with a contour interval
of 20 m (Appendix B). Figure 4.10a shows a plot of stream gradient (Sv) versus basin
Longitudinal valley profiles 104
area (A) for all streams. Despite the large scatter of the data points, a clear relationship
exists between gradient and drainage area. Furthermore, if only the streams located along
the Durack River upstream of the Durack Falls are selected the relationship becomes
much closer (Fig. 4.10b), with gradient inversely proportional to the 0.5 power of
drainage area. For streams located downstream of the Durack Falls the relationship is less
clear, but the trend in the data suggests that gradients decrease with increasing drainage
area at a somewhat lower rate than the 0.5 power (Fig. 4.10c).
Along the Salmond River only three of the analysed streams were located above the
principal knickpoint and, therefore, only a plot including streams above and below the
knickpoint is presented (Fig. 4.10d). A s with the lower Durack River, the relationship is
only fair and the trend suggest a slightly lower exponent (integer) of the power function.
The apparendy somewhat different exponents in the power functions indicated for the
streams located above and below the principal knickpoints could originate from factors
such as differences in the erosional processes, or differences in basin and channel
characteristics. The large scatter of the data points in the plot for streams located below
the knickpoints (Fig. 4.10c,d) could be the result of differences in erosional history, rock
resistance, or possibly also of unequal rates of stream incision. Indeed, the hanging
valleys of some smaller tributaries located along the steepened lower reach of the Durack
River indicate disparate incision rates between these tributaries and their trunk stream
(Fig. 4.3d). The scale of the maps used and the rather coarse contour interval of 20 m,
however, considerably restrict the quality of the data, especially where the gradients of
tributary streams are strongly steepened a short distance upstream of their mouth, as is
the case for some streams in the lower part of the study area. The apparent differences in
the quality of the area-gradient relationships for streams located upstream and those
located downstream of the principal knickpoints should, therefore, be viewed with some
caution.
For the area above the Durack Falls, Figure 4.10b indicates that the gradient of a
stream near its mouth is, on average, proportional to the 0.5 power of its drainage area at
the locality. This could mean that, at least for this part of the study area, the ratio of the
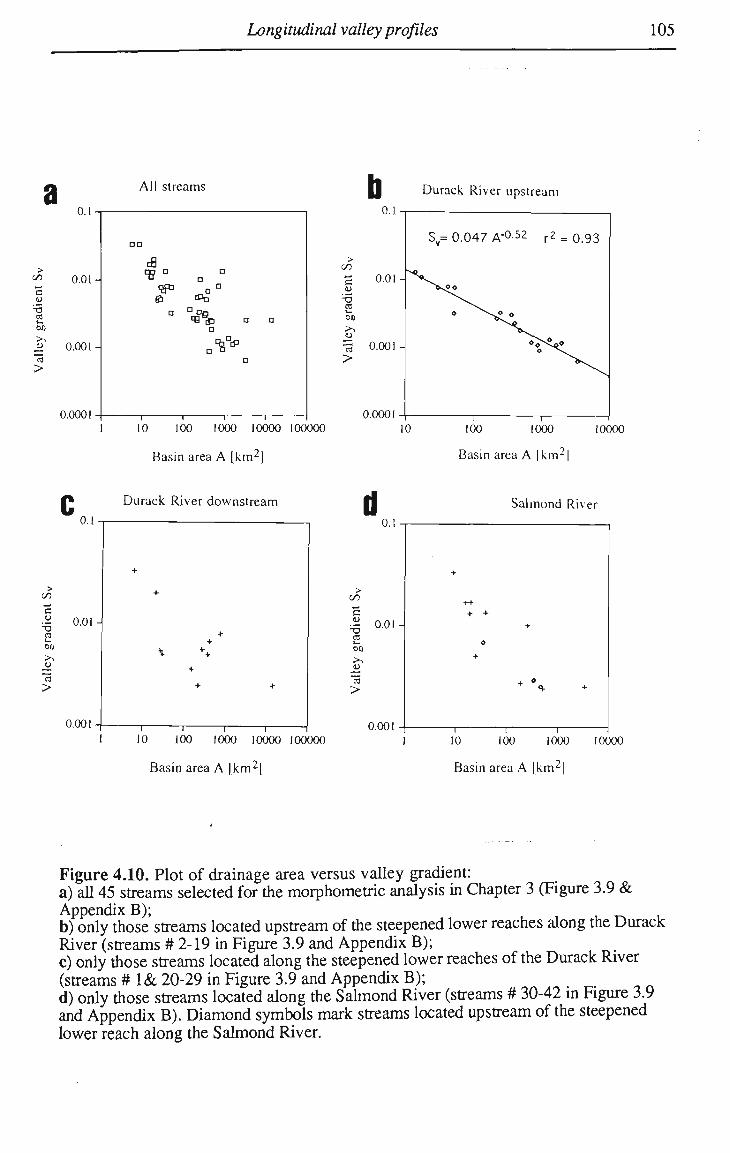
Longitudinal valley profiles 105
All streams Durack River upstream
>
c u
1
>
0.01-
0.001-
DO
&
CffJ
B G
a a
DJ?s tElp a a
D
1 1 1 1 10 100 1000 10000 100<
O.OOOl
Basin area A [km2j
100 1000 10000
Basin area A (km2]
|* Durack River downstream
0.1 Salmond River
> C/2
c u
13 >
0.01
0.001 r r 000 10000 100000
Basin area A [km2[
100 1000
Basin area A [km2j
0000
Figure 4.10. Plot of drainage area versus valley gradient: a) all 45 streams selected for the morphometric analysis in Chapter 3 (Figure 3.9 & Appendix B); b) only those streams located upstream of the steepened lower reaches along the Durack River (streams # 2-19 in Figure 3.9 and Appendix B); c) only those streams located along the steepened lower reaches of the Durack River (streams # 1 & 20-29 in Figure 3.9 and Appendix B); d) only those streams located along the Salmond River (streams # 30-42 in Figure 3.9 and Appendix B). Diamond symbols mark streams located upstream of the steepened lower reach along the Salmond River.
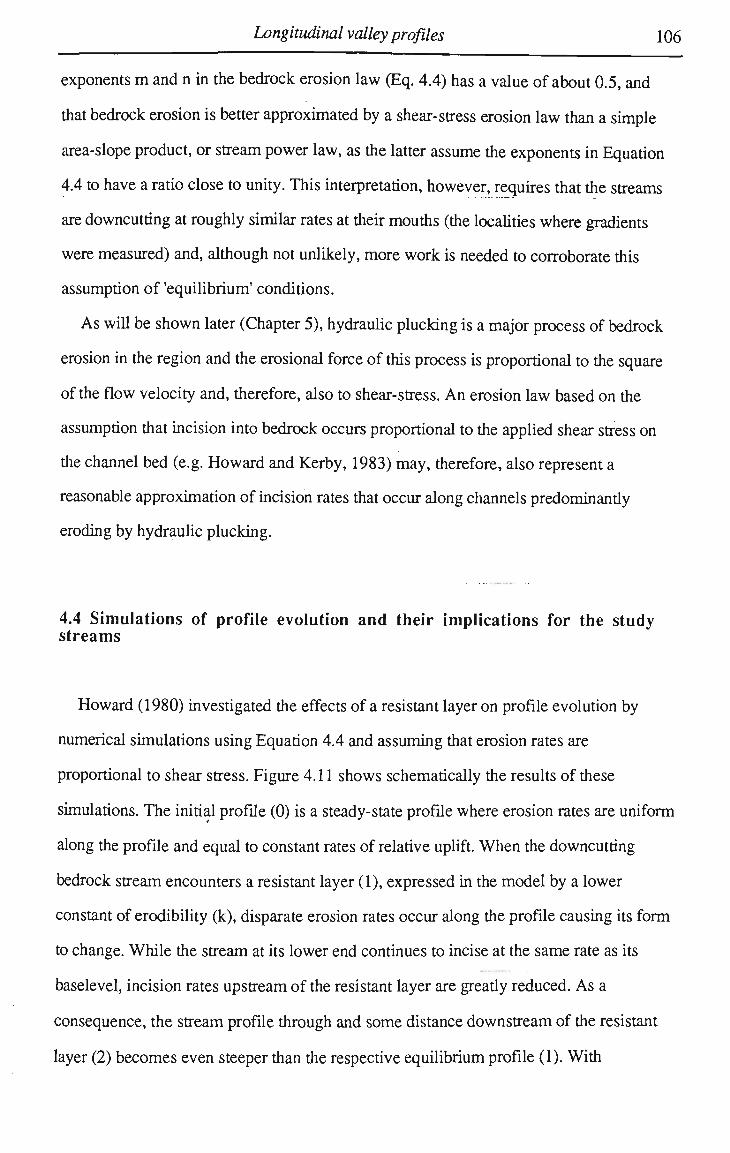
Longitudinal valley profiles 106
exponents m and n in the bedrock erosion law (Eq. 4.4) has a value of about 0.5, and
that bedrock erosion is better approximated by a shear-stress erosion law than a simple
area-slope product, or stream power law, as the latter assume the exponents in Equation
4.4 to have a ratio close to unity. This interpretation, however, requires that the streams
are downcutting at roughly similar rates at their mouths (the localities where gradients
were measured) and, although not unlikely, more work is needed to corroborate this
assumption of 'equilibrium' conditions.
As will be shown later (Chapter 5), hydraulic plucking is a major process of bedrock
erosion in the region and the erosional force of this process is proportional to the square
of the flow velocity and, therefore, also to shear-stress. A n erosion law based on the
assumption that incision into bedrock occurs proportional to the applied shear stress on
the channel bed (e.g. Howard and Kerby, 1983) may, therefore, also represent a
reasonable approximation of incision rates that occur along channels predominandy
eroding by hydraulic plucking.
4.4 Simulations of profile evolution and their implications for the study streams
Howard (1980) investigated the effects of a resistant layer on profile evolution by
numerical simulations using Equation 4.4 and assuming that erosion rates are
proportional to shear stress. Figure 4.11 shows schematically the results of these
simulations. The initial profile (0) is a steady-state profile where erosion rates are uniform
along the profile and equal to constant rates of relative uplift. W h e n the downcutting
bedrock stream encounters a resistant layer (1), expressed in the model by a lower
constant of erodibility (k), disparate erosion rates occur along the profile causing its form
to change. While the stream at its lower end continues to incise at the same rate as its
baselevel, incision rates upstream of the resistant layer are gready reduced. As a
consequence, the stream profile through and some distance downstream of the resistant
layer (2) becomes even steeper than the respective equilibrium profile (1). With
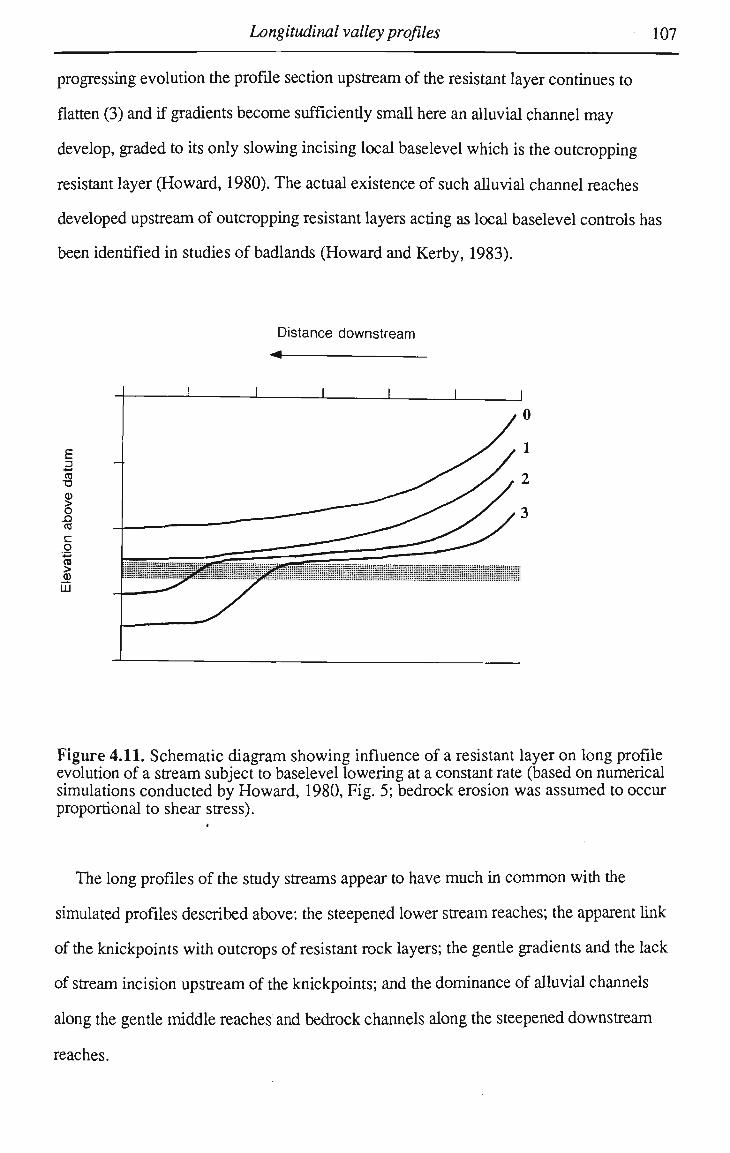
Longitudinal valley profiles 107
progressing evolution the profile section upstream of the resistant layer continues to
flatten (3) and if gradients become sufficientiy small here an alluvial channel may
develop, graded to its only slowing incising local baselevel which is the outcropping
resistant layer (Howard, 1980). The actual existence of such alluvial channel reaches
developed upstream of outcropping resistant layers acting as local baselevel controls has
been identified in studies of badlands (Howard and Kerby, 1983).
Distance downstream
E
•o
> o n co c ,o HI
Figure 4.11. Schematic diagram showing influence of a resistant layer on long profile evolution of a stream subject to baselevel lowering at a constant rate (based on numerical simulations conducted by Howard, 1980, Fig. 5; bedrock erosion was assumed to occur proportional to shear stress).
The long profiles of the study streams appear to have much in c o m m o n with the
simulated profiles described above: the steepened lower stream reaches; the apparent link
of the knickpoints with outcrops of resistant rock layers; the gende gradients and the lack
of stream incision upstream of the knickpoints; and the dominance of alluvial channels
along the gentle middle reaches and bedrock channels along the steepened downstream
reaches.
Longitudinal valley profiles 108
Based on the results of Howard's (1980) simulations, some important conclusions
may be drawn about the long profiles of the main streams of the study area, (a) The
development of the gentle middle reaches of the study streams could be the result of
resistant rock layers acting as local baselevel controls for these reaches. This would
explain the apparent association of knickpoints with outcrops of resistant layers and also
the disparate values of hypothetical baselevel lowering determined for the study streams
by downstream extrapolation of their gende middle reaches. This interpretation implies
that the principal knickpoint acting as local baselevel control for the upstream lying gende
profile reach along the Durack River is eroded only very slowly. As will be shown, slow
rates of incision and headward retreat of the Durack Falls are indeed indicated along the
Durack River, (b) The low gradient mixed alluvial-bedrock channels found along the
middle reaches of the trunk streams could be interpreted as stream reaches adjusted to low
rates of incision or headward retreat of their local baselevels. (c) The steepened and
incised lower reaches of the trunk streams could have developed under conditions of
constant baselevel lowering, in other words, the constant lowering of their parent valley
(now the Cambridge Gulf West Arm).
In summary, the combination of continuous incision near the mouth and retarded
erosion along outcrops of resistant rock layers further upstream could have caused
progressive profile steepening and increased fluvial incision along the lower stream
reaches. This could explain the greater local relief and the greater fluvial dissection
characteristic for the lower part of the study area (Chapter 3), a hypothesis that does not
require a period of accelerated or renewed downcutting of a common baselevel (the valley 4
of the Cambridge Gulf West Arm). One may speculate whether an isostatic response to
denudational unloading on land and loading by sedimentation in offshore basins could
have been the mechanism to account for long lasting and constant downcutting along the
region's rivers.
The above hypothesis that the stream profiles reflect the effects of local baselevel
controls and possible isostatic adjustment is, however, only one interpretation of the
available evidence. An alternative explanation is that the long profiles bear the imprint of
Longitudinal valley profiles 109
uplift after a long period of baselevel stability. Such stream rejuvenation has been
proposed for the region including the study area (e.g. Plumb and Gemuts, 1976), but it
should be noted that such claims for episodic uplift were largely inferred from
geomorphie evidence shown here to be ambiguous.
Howard et al. (1994), again using Equation 4.4 to describe bedrock erosion, modelled
the evolution of a largely graded alluvial stream subject to brief episodes of uplift. A m o n g
their findings is the important fact that gradients can gradually steepen well in advance of
a headward cutting knickpoint (cf. Holland and Pickup, 1976; Gardner, 1983). A s a
consequence, the uplift of graded alluvial channel reaches can convert them to bedrock or
mixed alluvial bedrock channels, even along relatively gende parts of their profiles well
upstream of prominentiy steepened lower reaches (Howard, et al., 1994). The occurrence
of mixed alluvial-bedrock channels along the low gradient middle reach of the Durack
River could be interpreted in this way. Furthermore, the different values of hypothetical
baselevel lowering determined for the study streams by downstream extrapolation of their
gende middle reaches, could be an expression of such a gradual steepening of the gende
stream reaches in advance of an upstream migrating head of rejuvenation. However,
without independent evidence for episodic uplift, this remains a hypothesis.
It has been demonstrated elsewhere that a combination of baselevel changes and
variable rock resistance can be responsible for profile steepening and knickpoint
development and that these factors influence, besides gradient, also channel morphology
which in turn affects channel hydraulics and sediment transport (Wohl, et al., 1994b).
Similarly, the downstream transition from gentle middle reaches to steepened lower
reaches observed along the trunk streams draining the study area may be the result of a
combination of various factors such as an episodic change of the regional baselevel
leading to stream rejuvenation and controls exerted on the downcutting streams by layers
of resistant rock. However, as mentioned, no stratigraphic markers have been identified
on the Kimberley Plateau, including the study area, which would permit a reliable
reconstruction of tectonic movements of the Kimberley Plateau during the Mesozoic and
Cainozoic. Any future detailed studies on the long-term landscape evolution of the
Longitudinal valley profiles 110
Kimberley Plateau will require close investigation of the offshore sedimentary record
and, if possible, the application of absolute age dating techniques would appear to be the
most promising approach.
4.5 Evidence for slow rates of profile change
Some indication for slow rates of stream incision and the longevity of the present
phase of erosion comes from isolated patches of cemented fluvially transported sands and
gravels found associated with boulder deposits flanking present-day bedrock channels.
The investigation of such ferruginous conglomerates is part of ongoing research and only
preliminary results can be presented here. At two sites along the Durack River, just below
the Durack Falls and at Nettopus Pool near Karunjie (Fig. 3.7), the likely ages of these
fluvial deposits were determined by uranium series (U/Th) dating of Fe/Mn
hydroxides/oxides and also by thermoluminescence (TL) dating of cemented sand
forming the matrix of these conglomerates. The T L age should give an indication of the
time when the sand was deposited and the U/Th age when the sand and gravel were
subsequently cemented. However, for the two samples presented only rninimum T L ages
could be determined as these samples were T L saturated (see Chapter 2).
The sample from the Durack Falls comes from a site near the confluence of the central
and the eastern anabranch (Fig. 4.4b). At the site, patches of ferruginous conglomerate
are found in association with imbricated large boulders on a bedrock bench about 2-3 m
above the lowest point in the nearby channel bed and some 600 m downstream from the
base of the Falls. Imbrication of the boulders indicates that they were deposited by flow
along the eastern anabranch, suggesting a planform of the falls at deposition similar to the
one observed today. The sample yields a U/Th age of about 150 ka (Tab. 4.1) and a
corresponding T L age of greater than about 100 ka. (Tab. 4.2). Even allowing for some
uncertainties related to technical problems associated with the dating of such materials,
the considerable age of the sample is indicated by the results of these two independent
dating techniques. This suggests that most of the stream incision observed just
downstream of the lip of the Durack Falls occurred prior to about 100-150 ka ago.
Longitudinal valley profiles 111
Furthermore, it indicates only minor amounts of headward migration of the falls during
the last 150 thousand years or so. If it is assumed that the Durack River has eroded its
600 m trench from the sample site to the present location of the falls (Fig. 4.4b) since the
formation of the conglomerates, a mean recession rate of about 4 m per thousand years is
calculated. In fact, the actual rate of recession of the Durack Falls is likely to have been
less because the cementation of the conglomerate may have occurred well after deposition
of the large boulders and boulder deposition may have been well after retreat of the face
of the falls upstream of the sample point. This indicates that the mean retreat rate of the
Durack Falls during the late Pleistocene was at least an order of magnitude less than the
estimated rates of postglacial recession of the Niagara Falls in North America (Tinkler, et
al., 1994) and possibly even less than the low rates of headward extension estimated for
the Shoalhaven Gorge in southeastern Australia (Nott, et al., 1996a), a river of about half
the catchment size of the Durack River.
The second dating site is from a large expansion boulder-bar found on the eastern side
of the present channel just downstream of Nettopus Pool (Fig. 4.9b), a lhtle gorge near
Karunjie (Figs. 3.7,4.9a). The lowest point of the present bedrock channel is only about
4-5 m below the top of the boulder bar which itself rests on bedrock. On the boulder bar
ferruginous cemented conglomerate is found filling gaps between imbricated boulders
similar to the dated deposits found at Durack Falls. The U/Th and TL ages determined for
the conglomerate at Nettopus Pool are about 220 ka and greater than about 100 ka,
respectively (Tabs. 4.1, 4.2). This suggest a considerable age for these boulder deposits
and this implies slow rates of channel incision of probably less than 23 mm per thousand 4
years.
How the formation of these ferruginous conglomerates relates to flow regime, or
climatic changes is not yet clear. However, the sample sites are within the reach of
present-day fast flowing floodwaters during rare high magnitude events. Under the
present flow regime such relatively fine grained conglomeratic gravels as well as sandy
alluvium are rare and if present, are probably subject to continuous reworking. It appears
to be that such conglomerates with their sandy matrix could only have formed at these
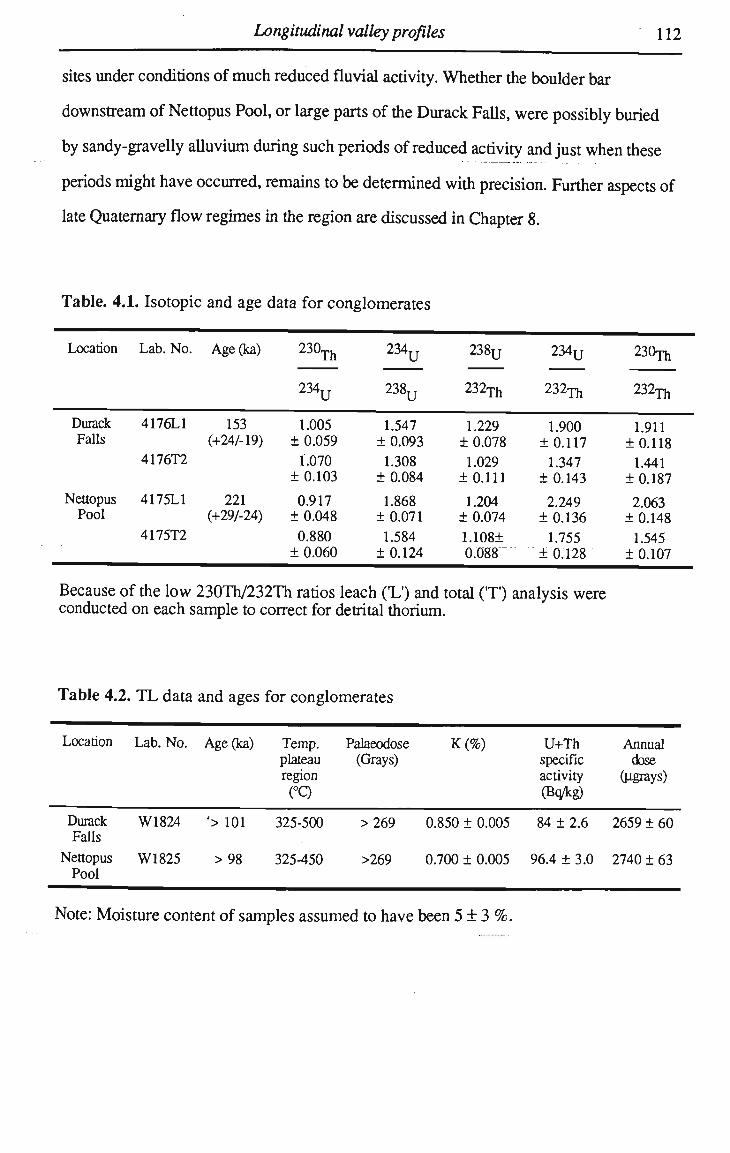
Longitudinal valley profiles 112
sites under conditions of much reduced fluvial activity. Whether the boulder bar
downstream of Nettopus Pool, or large parts of the Durack Falls, were possibly buried
by sandy-gravelly alluvium during such periods of reduced activity and just when these
periods might have occurred, remains to be determined with precision. Further aspects of
late Quaternary flow regimes in the region are discussed in Chapter 8.
Table. 4.1. Isotopic and age data for conglomerates
Location
Durack Falls
Nettopus Pool
Lab. No.
4176L1
4176T2
4175L1
4175T2
Age(ka)
153 (+24/-19)
221 (+29/-24)
230Th
2 3 4u 1.005
± 0.059 1.070
± 0.103
0.917 ± 0.048 0.880
± 0.060
2 3 4u
2 3 8u 1.547 ± 0.093 1.308
± 0.084
1.868 ± 0.071 1.584
± 0.124
238TJ
232Th
1.229 ± 0.078 1.029 ±0.111 1.204 ± 0.074 1.108± 0.088"
234TJ
232Th
1.900 ±0.117 1.347
± 0.143
2.249 ± 0.136 1.755
± 0.128
230rh
2 3 2 ^
1.911 ±0.118 1.441
± 0.187
2.063 ± 0.148 1.545
± 0.107
Because of the low 230Th/232Th ratios leach ('L') and total ( T ) analysis were conducted on each sample to correct for detrital thorium.
Table 4.2. T L data and ages for conglomerates
Location Lab. No. Age (ka) Temp. Palaeodose plateau (Grays) region
CQ
K(%) U+Th specific activity (BoAg)
Durack W1824 Falls
Nettopus W1825 Pool
Annual dose
(ugrays)
'> 101 325-500 > 269 0.850 ± 0.005 84 ± 2.6 2659 ± 60
>98 325^50 >269 0.700 ± 0.005 96.4 ± 3.0 2740 ±63
Note: Moisture content of samples assumed to have been 5 ± 3 %.
Longitudinal valley profiles 113
4.7 Summary of Chapter 4
Incision of the rivers draining the southern Karunjie Plateau has been controlled by the
long-term downcutting of the parent stream, the Cambridge Gulf West Arm. This former
river is temporarily transformed into an estuarine channel during periods of sea level rise,
with the latest such event being the Holocene transgression. At present, the head of the
Cambridge Gulf West A r m is a depositional zone, as indicated by the occurrence of a fan-
delta at the mouth of the Durack River, but deposition associated with the Holocene
transgression has not yet influenced the rivers upstream of the tidal limit. The reason for
and timing of the downcutting along the West A r m valley remain largely unclear, but it
possibly resulted from uplift proposed to have occurred during the late Miocene to early
Pliocene (Plumb and Gemuts, 1976). However, considering the apparendy very low
rates of vertical and headward stream erosion indicated for parts of the Durack River, an
earlier than late Tertiary initiation of this phase of downcutting appears to be well
possible.
In response to downcutting of the West A r m valley, the rivers draining the study area
have deeply incised into bedrock along their lower reaches, producing a land surface of
high local relief and steep hill slopes. In this deeply dissected lower part of the study
area, the trunk streams are characterized by bedrock and coarse bed-material channels.
The coarse material along these channels originates from lateral and vertical stream
erosion, transport from upstream, and also from local tributary input, some possibly in
form of debris flows. S o m e distance upstream, however, stream gradients are much
reduced and the relief of the surrounding landscape is generally low, with high relief only
occurring along the scarps of plateaux and cuestas. Along these gende reaches, the trunk
streams exhibit mixed alluvial-bedrock channels where the gradients of the dominant
alluvial sections are largely constrained by the low valley gradients. The transition
between gende middle reaches and steep lower reaches is abrupt in the case of Bindoola
Creek, but more gradual for the Salmond and the Durack Rivers. Near the upper limit, or
Longitudinal valley profiles 114
head of the steepened lower reaches small waterfalls occur along the Durack River and
Bindoola Creek, but stream gradients are also steepened somewhat above the falls. These
waterfalls, as well as the knickpoints in the long profiles separating the low gradient
middle reaches from the steepened lower reaches, occur in outcrops of resistant
sandstone layers, namely the Upper Pentecost, Lower Pentecost, and Warton
Sandstones.
At least two principal scenarios are possible as explanation for the downstream
transition of flat middle reaches to steepened lower reaches, characteristic not only of the
trunk streams in the study area, but also for many other streams on the Kimberley
Plateau.
(1) Along the incising streams outcrops of resistant rock layers act as local baselevel
controls for upstream lying stream reaches. The resistant bedrock causes rates of vertical
erosion to differ along the profiles; low rates and correspondingly low gradients occur
upstream of the local baselevel controls while higher rates of erosion and correspondingly
steeper gradients occur downstream of them. Howard (1996) suggested that mixed
alluvial-bedrock channels may represent an equilibrium form with gradients adjusted to
joint requirements of bedrock erosion and onward sediment transport. Correspondingly,
the mixed alluvial-bedrock channels occurring along the low gradient middle reaches of
the trunk streams draining the study area possibly reflect such an adjustment to slow
(constant?) rates of downcutting of their local baselevels.
(2) The second scenario is that the profiles resulted from an episode of uplift and
rejuvenation of the drainage. In this case, the gende middle reaches of the study streams
still bear the imprint of a previous long phase of baselevel stability, but they are not true
remnants of profiles graded to a former (regional) baselevel. Instead the have been
steepened in advance of the headward cutting knickpoint of rejuvenation, resulting in the
conversion of formerly graded alluvial stream reaches to mixed alluvial-bedrock reaches.
Clearly, more work is needed before the long-term evolution of the studied rivers can
be outlined with confidence. Further evidence is needed to substantiate the hypothesis
that the knickpoints are caused by outcrops of resistant rocks and that they act as local
Longitudinal valley profiles 115
baselevel controls for upstream reaches. With regard to the rejuvenation hypothesis, the
relative change of land-sea levels during the Cainozoic and Mesozoic must be elucidated
as a whole for the area of the Kimberley Plateau.
Whether rejuvenation, local baselevel control, or a combination of both, the
characteristic downstream transition from low gradient middle reaches to steepened lower
reaches undoubted reflects differences in erosion potentials along these streams.
Conditioned by this downstream increase in gradients is a downstream transition from a
dominance of sand-bed channels along the gende middle reaches of the trunk streams to a
dominance of bedrock and boulder-bed channels along the steepened lower reaches. In
the following chapters forms and processes in these different channel types are examined
on a reach scale.

116
5. FORM AND PROCESS IN BEDROCK CHANNELS: HYDRAULIC PLUCKING AND CHANNEL MORPHOLOGY
One of the most striking features of many bedrock and boulder-bed channels in the
study area is the abundance of angular forms such as rectangular cross sections, stepped
channel beds, and deposits of transported angular boulders. Along the Durack River,
these angular channel morphologies are not only found along the steep lower reaches of
the river, but also along many short bedrock and boulder-bed reaches in its only gently
sloping mid section. The occurrence of such angular channel morphologies is linked to
the material properties of the sandstones into which the channels are incised and in
particular the ubiquitous jointing of the sandstones by two sets of joints which are
roughly perpendicular to each other. Joint-block separation appears characteristic for
most of the resistant sandstone layers exposed in the study area including the frequendy
outcropping quartzite beds of the Upper and Lower Pentecost Sandstone (Fig. 5.1). As
evidenced by the striking prominence of angular channel morphologies, many streams in
the study area erode into these and other resistant well jointed sandstones predominantly
by step-by-step removal of rectangular joint blocks forming the rock mass. While this
erosional process of hydraulic plucking is certainly not the only process by which the
channels incise into bedrock, it appears to be a very important if not the dominant
process, especially where resistant quartzite beds are exposed. A s a consequence,
channel morphologies along many stream reaches are profoundly influenced by the
attitude of the strata the streams are incising into. In this chapter the process of hydraulic
plucking and its influence on channel erosion are reviewed, and the impact of strata dip
on channel-bed morphology is illustrated with examples from the study area.
Furthermore, the magnitude of flow events capable of forming a selected channel reach
are investigated and the implications of this are discussed.
Hydraulic plucking and channel morphology 117
5.1 Study sites
The main study site in this and the following chapter is located close to Jack's Hole, a
dry season waterhole along the Durack River about 35 k m downstream of Durack Falls
(Fig. 5.2). This site was selected for the detailed study of forms associated with
hydraulic plucking and for hydraulic analysis because of the presence of spectacular
depositional and erosional bedforms, and reasonable vehicle access. However, the site is
by no means exceptional, but, as confirmed by extensive aerial and ground
reconnaissances, is representative for many channel reaches in the region. Other study
sites include the Durack Falls and Nettopus Pool along the Durack River, Bindoola Falls
and a small tributary about 5 k m upstream of the falls along Bindoola Creek, and a small
tributary creek of the Pentecost River near its confluence with the Cambridge Gulf West
A r m (Fig. 5.2).
The erosional features described below are closely linked to the abundant outcrops of
quartzite beds of the Upper and Lower Pentecost Sandstone. Generally, these sandstones
are well-jointed and medium to thickly (0.1 - 1 m ) bedded, but locally very thick (1-3 m )
beds can occur. Ground water movement is largely restricted to joints and bedding
planes, since the pore spaces in the sandstones are often filled with quartz overgrowths, a
characteristic of various resistant sandstones in the region (Young, 1986). The joints are
frequendy open, and chemical weathering of the sandstones is indicated by the presence
of re-precipitated silica in the form of speleothems and flow stones.
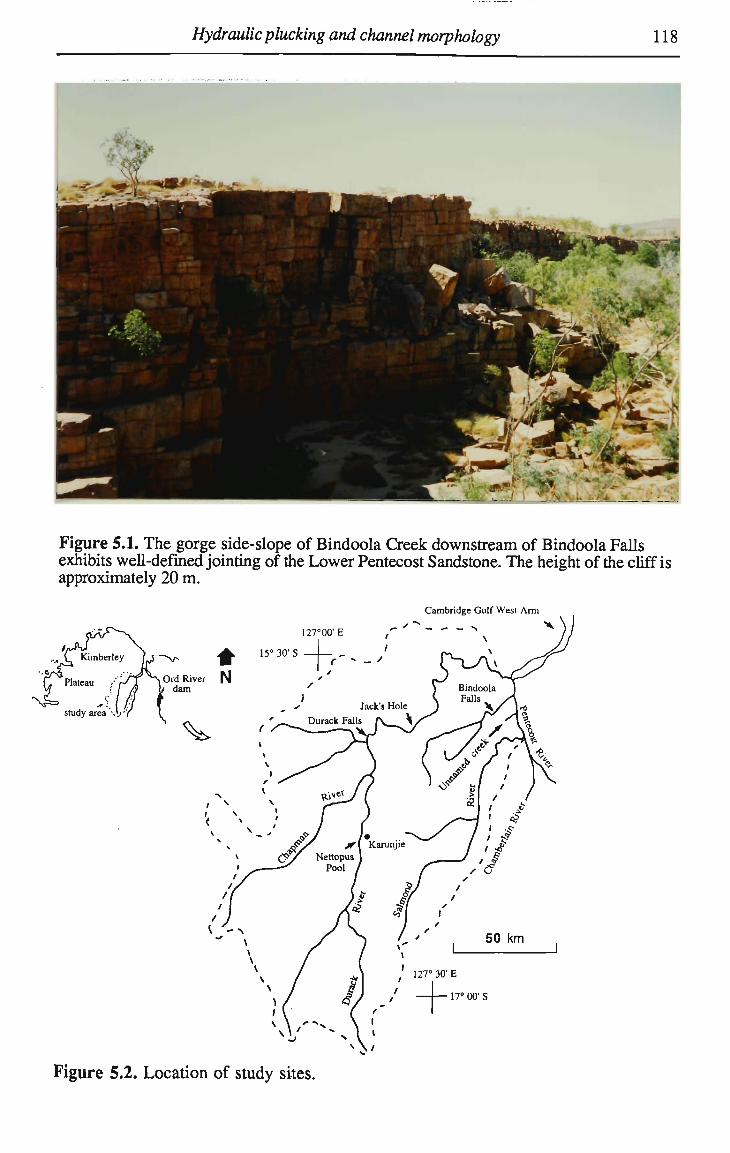
Hydraulic plucking and channel morphology 118
Figure 5.1. The gorge side-slope of Bindoola Creek downstream of Bindoola Falls exhibits well-defined jointing of the Lower Pentecost Sandstone. The height of the cliff is approximately 20 m.
Cambridge Gulf West Arm
^ - _ _ > x
Figure 5.2. Location of study sites.

Hydraulic plucking and channel morphology 119
5.2 Processes of bedrock channel erosion
Processes acting in alluvial rivers are well studied, but much less well are those the
acting in bedrock systems. The thresholds of erosion and transport in most bedrock and
boulder-bed channels are very much higher than in alluvial channels. Furthermore,
bedrock channels are much more likely to be shaped by rare high magnitude floods than
are alluvial systems. It is difficult to observe and monitor the actual processes of bedrock
erosion resulting from high magnitude flows in natural streams and, as a consequence,
only a few process based models of bedrock erosion exist (e.g. Foley, 1980). However,
characteristic erosional and depositional features found along such channels can be
indicative of the dominant fluvial processes operating during very large floods.
Bedrock erosion results from a combination of weathering and erosional processes
that cause the decomposition, disintegration, and the removal of rock. Sediment abrasion,
hydraulic plucking, and possibly the physical damage of the rock by imploding cavitation
bubbles (Allen, 1982, Vol. 1, p. 69-74; Baker, 1988) can cause the mechanical
destruction and removal of bedrock. The chemical action of water (corrosion) results in
the direct erosion of rock by dissolution. Furthermore, chemical and biochemical
weathering of bedrock works to reduce the resistance of the rock against the physical
erosional processes mentioned above. The contribution of individual erosional processes
to the total rate of bedrock erosion along a channel reach depends largely on the material
properties of the channel boundaries which control the resistance thresholds, and on the
hydraulic conditions that control the erosive capability and sediment transport capacity of
the stream. In some channels, this relationship can be quantified by correlating the rate of
energy dissipation of the flow to an erodibility classification of the rock mass
(Annandale, 1995).
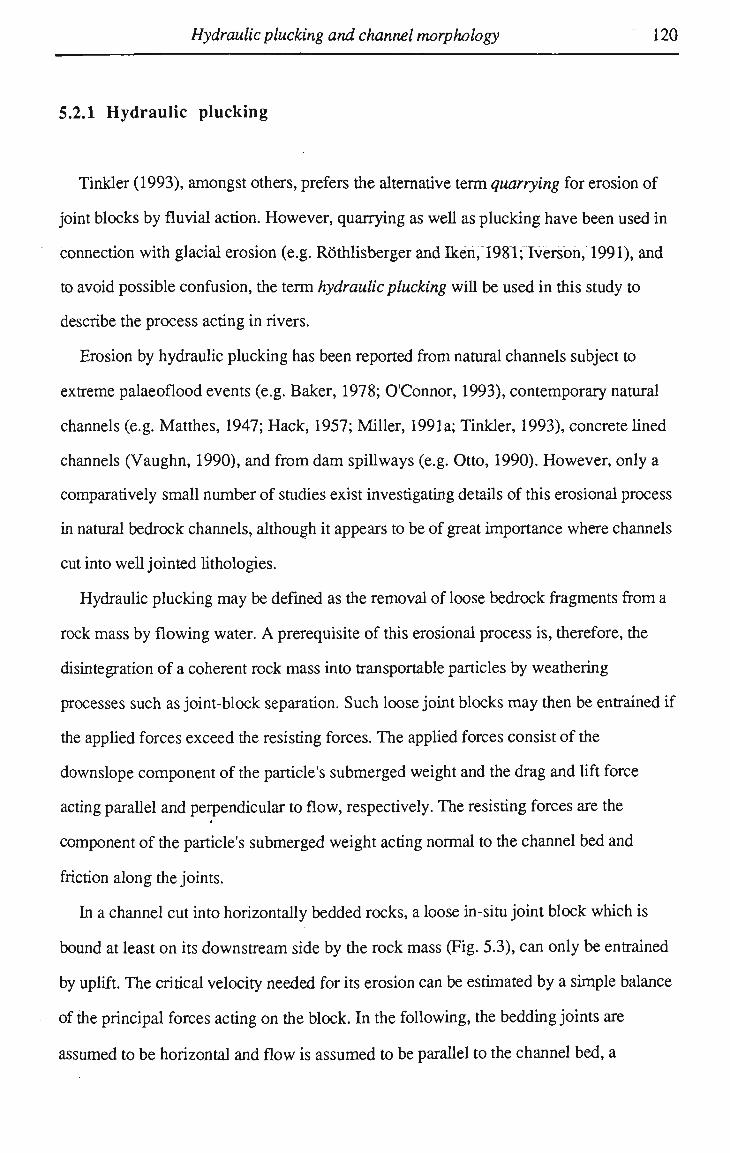
Hydraulic plucking and channel morphology 120
5.2.1 Hydraulic plucking
Tinkler (1993), amongst others, prefers the alternative term quarrying for erosion of
joint blocks by fluvial action. However, quarrying as well as plucking have been used in
connection with glacial erosion (e.g. Rothlisberger and Bcen,1981; Tverson, 1991), and
to avoid possible confusion, the term hydraulic plucking will be used in this study to
describe the process acting in rivers.
Erosion by hydraulic plucking has been reported from natural channels subject to
extreme palaeoflood events (e.g. Baker, 1978; O'Connor, 1993), contemporary natural
channels (e.g. Matthes, 1947; Hack, 1957; Miller, 1991a; Tinkler, 1993), concrete lined
channels (Vaughn, 1990), and from dam spillways (e.g. Otto, 1990). However, only a
comparatively small number of studies exist investigating details of this erosional process
in natural bedrock channels, although it appears to be of great importance where channels
cut into well jointed lithologies.
Hydraulic plucking may be defined as the removal of loose bedrock fragments from a
rock mass by flowing water. A prerequisite of this erosional process is, therefore, the
disintegration of a coherent rock mass into transportable particles by weathering
processes such as joint-block separation. Such loose joint blocks may then be entrained if
the applied forces exceed the resisting forces. The applied forces consist of the
downslope component of the particle's submerged weight and the drag and lift force
acting parallel and perpendicular to flow, respectively. The resisting forces are the A
component of the particle's submerged weight acting normal to the channel bed and
friction along the joints.
In a channel cut into horizontally bedded rocks, a loose in-situ joint block which is
bound at least on its downstream side by the rock mass (Fig. 5.3), can only be entrained
by uplift. The critical velocity needed for its erosion can be estimated by a simple balance
of the principal forces acting on the block. In the following, the bedding joints are
assumed to be horizontal and flow is assumed to be parallel to the channel bed, a
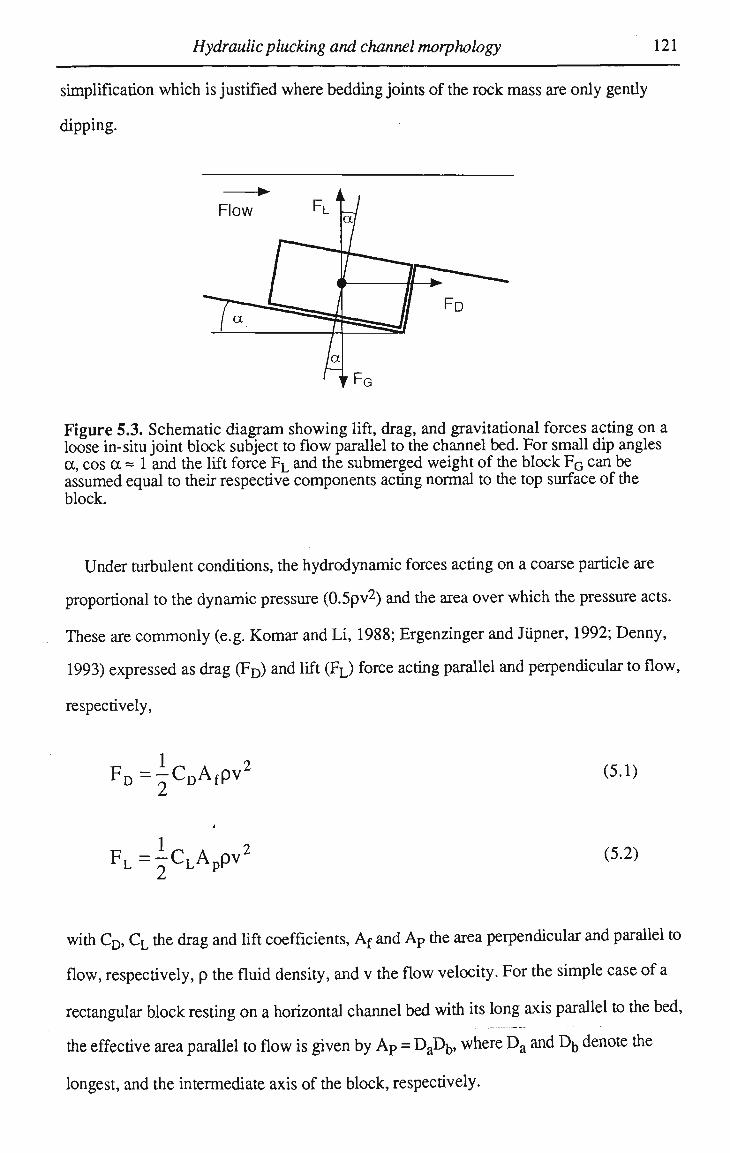
Hydraulic plucking and channel morphology 121
simplification which is justified where bedding joints of the rock mass are only gentiy
dipping.
Figure 5.3. Schematic diagram showing lift, drag, and gravitational forces acting on a loose in-situ joint block subject to flow parallel to the channel bed. For small dip angles a, cos a ~ 1 and the lift force F L and the submerged weight of the block F G can be assumed equal to their respective components acting normal to the top surface of the block.
Under turbulent conditions, the hydrodynamic forces acting on a coarse particle are
proportional to the dynamic pressure (0.5pv2) and the area over which the pressure acts.
These are commonly (e.g. Komar and Li, 1988; Ergenzinger and Jupner, 1992; Denny,
1993) expressed as drag (FD) and lift (FL) force acting parallel and perpendicular to flow,
respectively,
FD=|cDAfpv2
4
FL=|cLAppv2
with CD, CL the drag and lift coefficients, Af and AP the area perpendicular and parallel to
flow, respectively, p the fluid density, and v the flow velocity. For the simple case of a
rectangular block resting on a horizontal channel bed with its long axis parallel to the bed,
the effective area parallel to flow is given by AP = DaDb, where Da and J\ denote the
longest, and the intermediate axis of the block, respectively.
(5.1)
(5.2)
Hydraulic plucking and channel morphology 122
For blocks which are bound by smooth open joints, the resisting force against uplift
will be largely controlled by the submerged weight F G of a rectangular block which is
given by
FG=(Ps-p)gDaL\Dc (5.3)
where ps is the density of the block, g is the acceleration due to gravity, Dc is the shortest
side of the block, and all other parameters are as defined above.
An estimate of the critical velocity of uplift of the block may be obtained from a
balance of the applied to resisting forces. Ignoring friction along the vertical joints, this
balance is simply F L=F G which, solving for the critical velocity vc, yields
,2_2(Ps-p)gDc P c,
y . = v . ,~__L. (5A)
The critical velocity of uplift is thus proportional to the square-root of the thickness of the
block, while the long and intermediate axis of the block only affect the shape dependant
lift coefficient In engineering, it is common practise to use stability criterion inferred by
such a balance of the vertical forces to determine the minimum thickness of rock slabs for
lining chutes and spillways (e.g. Renius, 1986; Fiorotto and Rinaldo, 1992).
Scaled hydraulic models have been used by several authors to investigate the hydraulic
interaction of flowing water with fractured rock. While most studies have concentrated on
bedrock scour downstream of dam outlets, which involves erosion due to impinging
plunging water jets (e.g.Yuditskii, 1969), Renius (1986) investigated the pressure
differences around blocks caused by water flowing parallel to the surface. The situation
modelled in the latter study probably most closely approximates the general conditions
prevailing in natural bedrock channels, while the other studies are more applicable to the
special case of scour downstream of waterfalls (e.g. plunge pools).
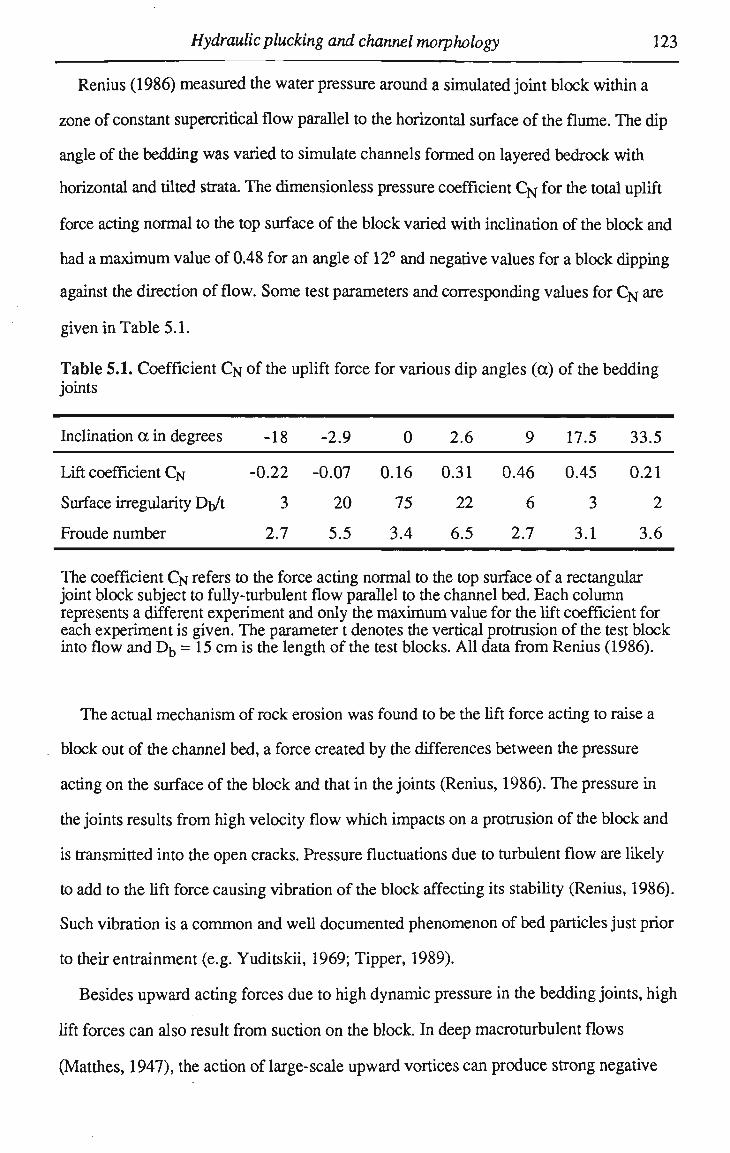
Hydraulic plucking and channel morphology 123
Renius (1986) measured the water pressure around a simulated joint block within a
zone of constant supercritical flow parallel to the horizontal surface of the flume. The dip
angle of the bedding was varied to simulate channels formed on layered bedrock with
horizontal and tilted strata. The dimensionless pressure coefficient 0 ^ for the total uplift
force acting normal to the top surface of the block varied with inclination of the block and
had a m a x i m u m value of 0.48 for an angle of 12° and negative values for a block dipping
against the direction of flow. Some test parameters and corresponding values for C ^ are
given in Table 5.1.
Table 5.1. Coefficient C N of the uplift force for various dip angles (a) of the bedding joints
Inclination a in degrees
Lift coefficient C N
Surface irregularity DbA
Froude number
-18
-0.22
3
2.7
-2.9
-0.07
20
5.5
0
0.16
75
3.4
2.6
0.31
22
6.5
9
0.46
6
2.7
17.5
0.45
3
3.1
33.5
0.21
2
3.6
The coefficient C N refers to the force acting normal to the top surface of a rectangular joint block subject to fully-turbulent flow parallel to the channel bed. Each column represents a different experiment and only the maximum value for the lift coefficient for each experiment is given. The parameter t denotes the vertical protrusion of the test block into flow and D b = 15 c m is the length of the test blocks. All data from Renius (1986).
The actual mechanism of rock erosion was found to be the lift force acting to raise a
block out of the channel bed, a force created by the differences between the pressure
acting on the surface of the block and that in the joints (Renius, 1986). The pressure in
the joints results from high velocity flow which impacts on a protrusion of the block and
is transmitted into the open cracks. Pressure fluctuations due to turbulent flow are likely
to add to the lift force causing vibration of the block affecting its stability (Renius, 1986).
Such vibration is a c o m m o n and well documented phenomenon of bed particles just prior
to their entrainment (e.g. Yuditskii, 1969; Tipper, 1989).
Besides upward acting forces due to high dynamic pressure in the bedding joints, high
lift forces can also result from suction on the block. In deep macroturbulent flows
(Matthes, 1947), the action of large-scale upward vortices can produce strong negative
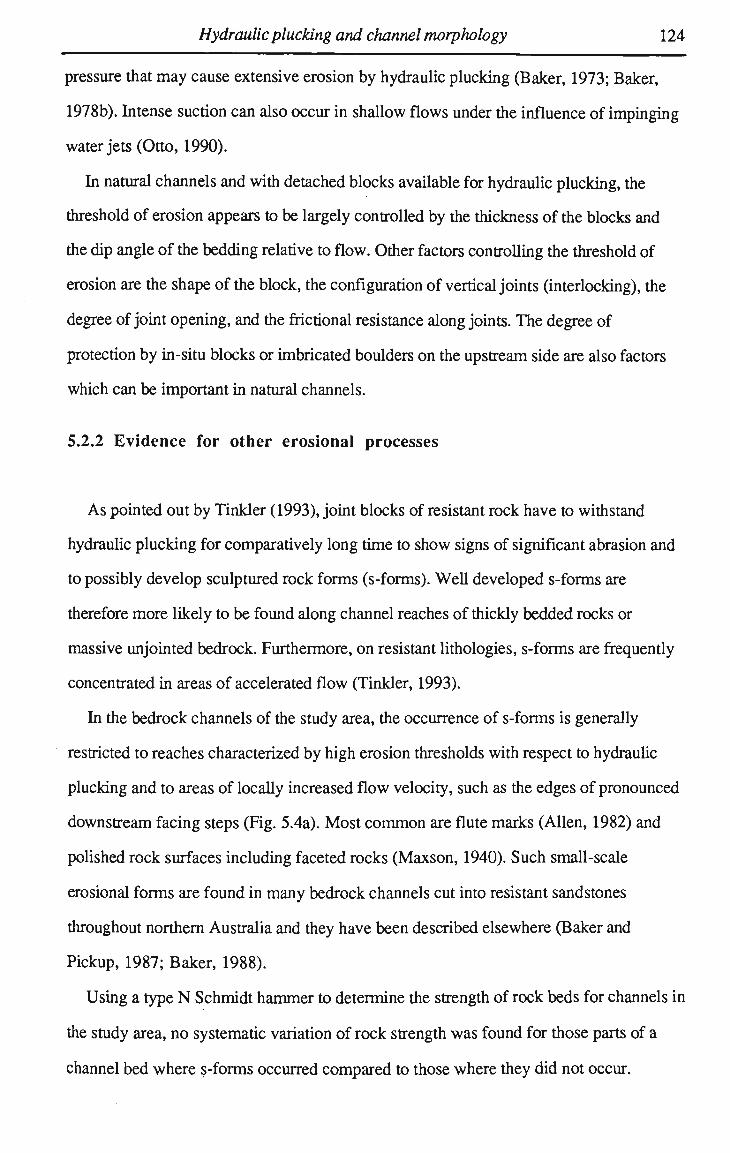
Hydraulic plucking and channel morphology 124
pressure that m a y cause extensive erosion by hydraulic plucking (Baker, 1973; Baker,
1978b). Intense suction can also occur in shallow flows under the influence of impinging
water jets (Otto, 1990).
In natural channels and with detached blocks available for hydraulic plucking, the
threshold of erosion appears to be largely controlled by the thickness of the blocks and
the dip angle of the bedding relative to flow. Other factors controlling the threshold of
erosion are the shape of the block, the configuration of vertical joints (interlocking), the
degree of joint opening, and the frictional resistance along joints. The degree of
protection by in-situ blocks or imbricated boulders on the upstream side are also factors
which can be important in natural channels.
5.2.2 Evidence for other erosional processes
As pointed out by Tinkler (1993), joint blocks of resistant rock have to withstand
hydraulic plucking for comparatively long time to show signs of significant abrasion and
to possibly develop sculptured rock forms (s-forms). Well developed s-forms are
therefore more likely to be found along channel reaches of thickly bedded rocks or
massive unjointed bedrock. Furthermore, on resistant lithologies, s-forms are frequendy
concentrated in areas of accelerated flow (Tinkler, 1993).
In the bedrock channels of the study area, the occurrence of s-forms is generally
restricted to reaches characterized by high erosion thresholds with respect to hydraulic
plucking and to areas of locally increased flow velocity, such as the edges of pronounced
downstream facing steps (Fig. 5.4a). Most c o m m o n are flute marks (Allen, 1982) and
polished rock surfaces including faceted rocks (Maxson, 1940). Such small-scale
erosional forms are found in many bedrock channels cut into resistant sandstones
throughout northern Australia and they have been described elsewhere (Baker and
Pickup, 1987; Baker, 1988).
Using a type N Schmidt hammer to determine the strength of rock beds for channels in
the study area, no systematic variation of rock strength was found for those parts of a
channel bed where s-forms occurred compared to those where they did not occur.
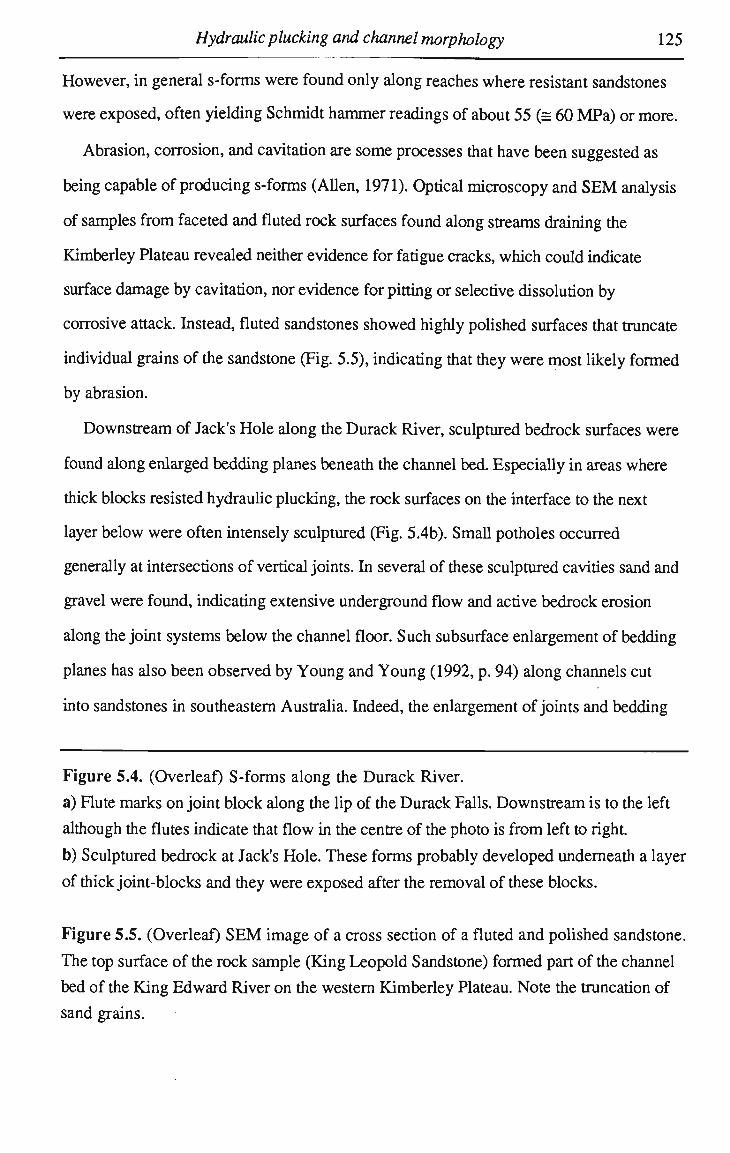
Hydraulic plucking and channel morphology 125
However, in general s-forms were found only along reaches where resistant sandstones
were exposed, often yielding Schmidt hammer readings of about 55 (= 60 M P a ) or more.
Abrasion, corrosion, and cavitation are some processes that have been suggested as
being capable of producing s-forms (Allen, 1971). Optical microscopy and S E M analysis
of samples from faceted and fluted rock surfaces found along streams draining the
Kimberley Plateau revealed neither evidence for fatigue cracks, which could indicate
surface damage by cavitation, nor evidence for pitting or selective dissolution by
corrosive attack. Instead, fluted sandstones showed highly polished surfaces that truncate
individual grains of the sandstone (Fig. 5.5), indicating that they were most likely formed
by abrasion.
Downstream of Jack's Hole along the Durack River, sculptured bedrock surfaces were
found along enlarged bedding planes beneath the channel bed Especially in areas where
thick blocks resisted hydraulic plucking, the rock surfaces on the interface to the next
layer below were often intensely sculptured (Fig. 5.4b). Small potholes occurred
generally at intersections of vertical joints. In several of these sculptured cavities sand and
gravel were found, indicating extensive underground flow and active bedrock erosion
along the joint systems below the channel floor. Such subsurface enlargement of bedding
planes has also been observed by Young and Young (1992, p. 94) along channels cut
into sandstones in southeastern Australia. Indeed, the enlargement of joints and bedding
Figure 5.4. (Overleaf) S-forms along the Durack River.
a) Flute marks on joint block along the lip of the Durack Falls. Downstream is to the left
although the flutes indicate that flow in the centre of the photo is from left to right
b) Sculptured bedrock at Jack's Hole. These forms probably developed underneath a layer
of thick joint-blocks and they were exposed after the removal of these blocks.
Figure 5.5. (Overleaf) SEM image of a cross section of a fluted and polished sandstone.
The top surface of the rock sample (King Leopold Sandstone) formed part of the channel
bed of the King Edward River on the western Kimberley Plateau. Note the truncation of
sand grains.
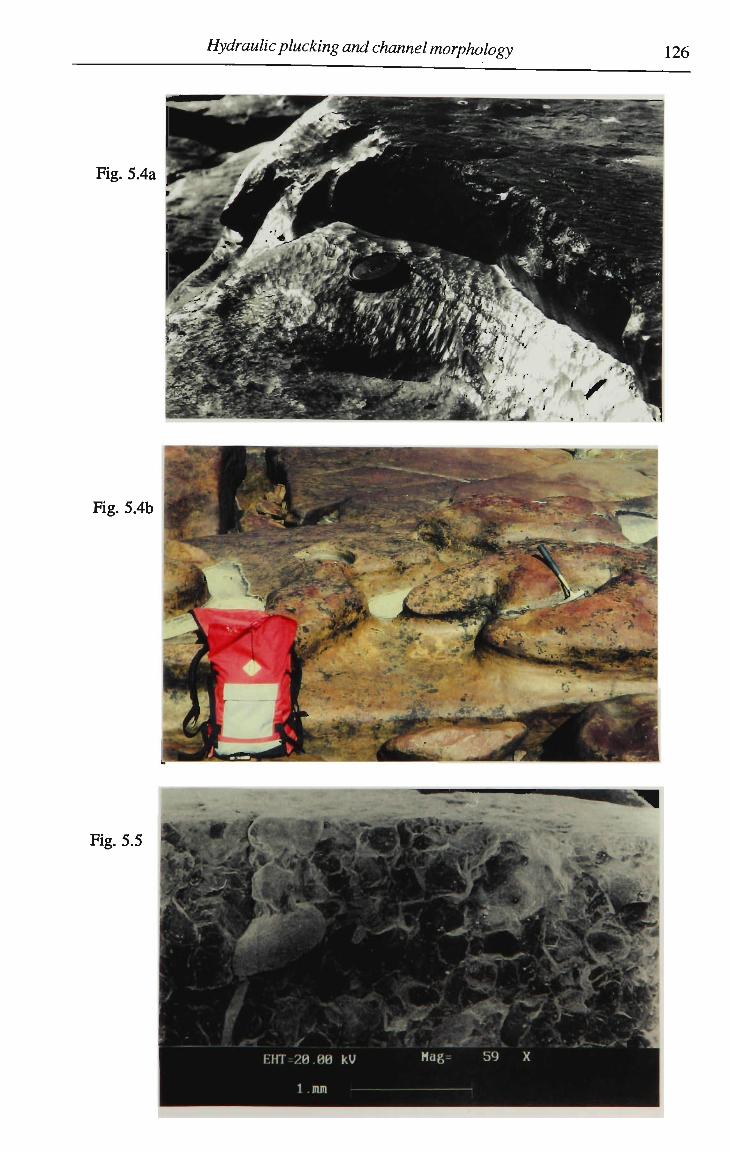
Hydraulic plucking and channel morphology 126
Fig. 5.4a
Fig. 5.4b I

Hydraulic plucking and channel morphology 127
planes is probably a widespread process in channels cut into jointed rock, a mechanism
that must partially erode the blocks and make them more susceptible to erosion by
hydraulic plucking.
5.2.3 Classification of bedrock channels
A tentative classification of bedrock channels may be based on the acting erosional
processes. Along a channel reach, the total rate of vertical channel erosion E T can be
expressed as the sum of the erosion rates of the individual processes
ET=EA+EC+EP (5.5)
where EA, Ec, and EP are the net erosion rates of the principal erosional processes
abrasion, corrosion, and hydraulic plucking, respectively. If required, the local
contribution of other processes such as cavitation may simply be added to Equation 5.5.
Dividing Equation 5.5 by E j yields the relative contribution of the individual erosional
processes to the total rate of incision
EA/ET + EC/ET + EP/ET = 1 (5.6)
This allows bedrock channels to be classified according to their dominant erosional
process. For the case of three principle erosional processes, Equation 5.6 can be
presented in form of a ternary diagram (Fig. 5.6). O n such a diagram, channels
predominantly eroded by hydraulic plucking plot near the lower left comer, while
channels dominated by abrasional erosion are located more towards the top of the
diagram. Channels mainly incising by chemical erosion are found near the bottom right
comer (Fig. 5.6). Generally, channels dominated by differing erosional processes should
also be associated with different characteristic erosional bedforms and channel
morphologies. For examples, stepped rock beds with an abundance of angular forms are
characteristic of channels eroded by hydraulic plucking, while smoothed forms and an

Hydraulic plucking and channel morphology 128
abundance of sculptured bedforms are often associated with extensive abrasion.
Smoothed bedforms are also characteristic of bedrock channels formed by corrosion. In
some cases, meandering narrow chasms, similar to those formed by a stream of clear
water flowing over an ice surface, could be related to a dominance of dissolution along
their rock bed.
In contrast to channels on the eastern Kimberley Plateau, large potholes and other well
developed s-forms are abundant along some channels in the west of the Kimberley
Plateau (Fig. 1.1), especially where very thickly bedded quartz sandstones of the King
Leopold Sandstone outcrop (Fig. 1.2). Here, abrasion appears to be a more important
process of bedrock erosion than further east and, as a consequence, channels reveal an
abundance of rounded erosional bedforms. O n the ternary diagram in Figure 5.6 these
streams would plot closer to the top of the diagram than would the streams on the eastern
Kimberley Plateau.
100%
% Erosion by hydraulic plucking
Vo Erosion by abrasion
100%
100%
% Erosion by corrosion
Figure 5.6. Tentative classification of bedrock streams based on the dominant channel forming process. The percent value represents the respective contribution of the individual erosional processes to the total rate of erosion (=100%).
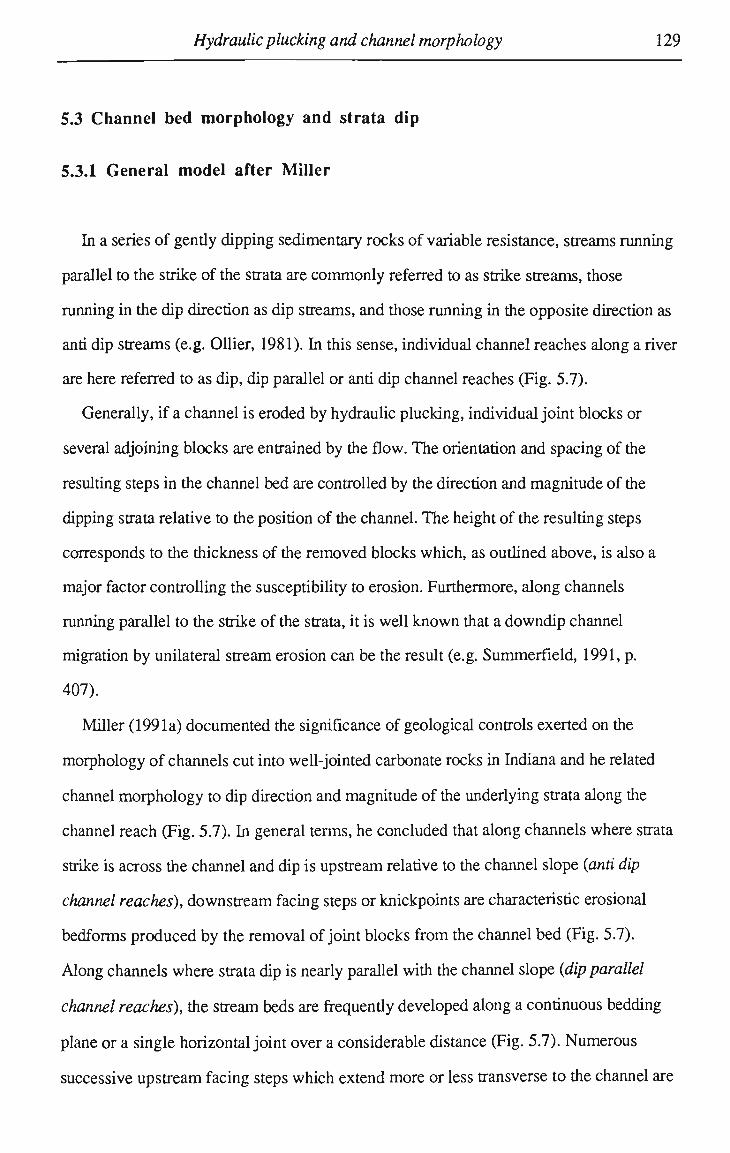
Hydraulic plucking and channel morphology 129
5.3 Channel bed morphology and strata dip
5.3.1 General model after Miller
In a series of gendy dipping sedimentary rocks of variable resistance, streams running
parallel to the strike of the strata are commonly referred to as strike streams, those
running in the dip direction as dip streams, and those running in the opposite direction as
anti dip streams (e.g. Oilier, 1981). In this sense, individual channel reaches along a river
are here referred to as dip, dip parallel or anti dip channel reaches (Fig. 5.7).
Generally, if a channel is eroded by hydraulic plucking, individual joint blocks or
several adjoining blocks are entrained by the flow. The orientation and spacing of the
resulting steps in the channel bed are controlled by the direction and magnitude of the
dipping strata relative to the position of the channel. The height of the resulting steps
corresponds to the thickness of the removed blocks which, as outlined above, is also a
major factor controlling the susceptibility to erosion. Furthermore, along channels
running parallel to the strike of the strata, it is well known that a downdip channel
migration by unilateral stream erosion can be the result (e.g. Summerfield, 1991, p.
407).
Miller (1991a) documented the significance of geological controls exerted on the
morphology of channels cut into well-jointed carbonate rocks in Indiana and he related
channel morphology to dip direction and magnitude of the underlying strata along the
channel reach (Fig. 5.7). In general terms, he concluded that along channels where strata
strike is across the channel and dip is upstream relative to the channel slope (anti dip
channel reaches), downstream facing steps or knickpoints are characteristic erosional
bedforms produced by the removal of joint blocks from the channel bed (Fig. 5.7).
Along channels where strata dip is nearly parallel with the channel slope (dip parallel
channel reaches), the stream beds are frequendy developed along a continuous bedding
plane or a single horizontal joint over a considerable distance (Fig. 5.7). Numerous
successive upstream facing steps which extend more or less transverse to the channel are
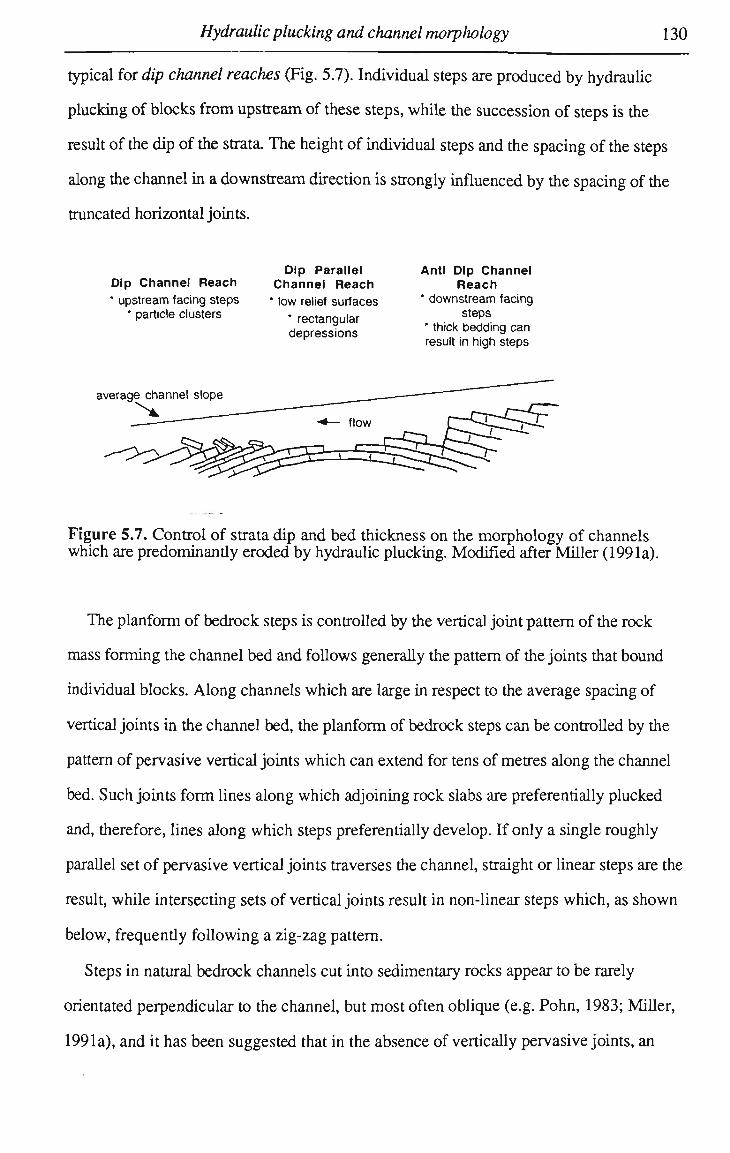
Hydraulic plucking and channel morphology 130
typical for dip channel reaches (Fig. 5.7). Individual steps are produced by hydraulic
plucking of blocks from upstream of these steps, while the succession of steps is the
result of the dip of the strata. The height of individual steps and the spacing of the steps
along the channel in a downstream direction is strongly influenced by the spacing of the
truncated horizontal joints.
Dip Channel Reach
* upstream facing steps * particle clusters
Dip Parallel Channel Reach * low relief surfaces
* rectangular depressions
Anti Dip Channel Reach
* downstream facing steps
* thick bedding can result in high steps
average channel slope
Figure 5.7. Control of strata dip and bed thickness on the morphology of channels which are predominandy eroded by hydraulic plucking. Modified after Miller (1991a).
The planform of bedrock steps is controlled by the vertical joint pattern of the rock
mass forming the channel bed and follows generally the pattern of the joints that bound
individual blocks. Along channels which are large in respect to the average spacing of
vertical joints in the channel bed, the planform of bedrock steps can be controlled by the
pattern of pervasive vertical joints which can extend for tens of metres along the channel
bed. Such joints form lines along which adjoining rock slabs are preferentially plucked
and, therefore, lines along which steps preferentially develop. If only a single roughly
parallel set of pervasive vertical joints traverses the channel, straight or linear steps are the
result, while intersecting sets of vertical joints result in non-linear steps which, as shown
below, frequendy following a zig-zag pattern.
Steps in natural bedrock channels cut into sedimentary rocks appear to be rarely
orientated perpendicular to the channel, but most often oblique (e.g. Pohn, 1983; Miller,
1991a), and it has been suggested that in the absence of vertically pervasive joints, an
Hydraulic plucking and channel morphology 131
orientation of vertical joints oblique to the channel would facilitate more rapid erosion
than would joints perpendicular to the channel (Pohn, 1983). Erosional bedrock steps
frequendy exhibit a rather complex planform pattern which can be due to many factors,
like an irregular fracture pattern or differential erosion across the channel. For example,
blocks, not yet detached from the bedrock mass by an open horizontal joint, or groups of
adjoining blocks that are too thick to be removed, can remain little affected by hydraulic
plucking, while adjacent areas of the channel bed with a lower threshold of erosion are
eroded at a higher rate.
5.3.2 Channel bed morphologies associated with hydraulic plucking in the study area
Hydraulic plucking is a very important process of bedrock channel erosion in the
streams draining the study area, especially in the presence of well-jointed highly
indurated sandstones. The morphology of channel beds of creeks with only small
catchments, as well as those of large rivers with catchments of thousands of square
kilometres, is dominated by the right-angled forms produced by hydraulic plucking of
joint blocks. Characteristically stepped channel bed morphologies found along the
streams can generally be related to the dip direction of the sandstones relative to the
channel.
Dip channel reaches. A dip channel reach immediately downstream of Jack's Hole
along the Durack River (Fig. 5.2) reveals spectacular erosional and depositional features
linked to channel erosion by hydraulic plucking. The channel reach forms a bedrock high
downstream of a large pool (Jack's Waterhole) along the river. Flow derived from a
catchment of about 12 000 km 2, is funnelled through a 500 m wide by 1.5 k m long gorge
cut into Lower Pentecost Sandstone (Fig. 5.8). Strata strike (S05E) is slightly oblique to
the channel, and strata dip (~2-3N) is steeper than the average channel gradient of about
0.002. Locally, the channel bed can be much steeper, with the steepest section found
along the eastern side of the study reach, where a gradient of about 0.015 prevails for
several hundred metres (Fig. 5.8).
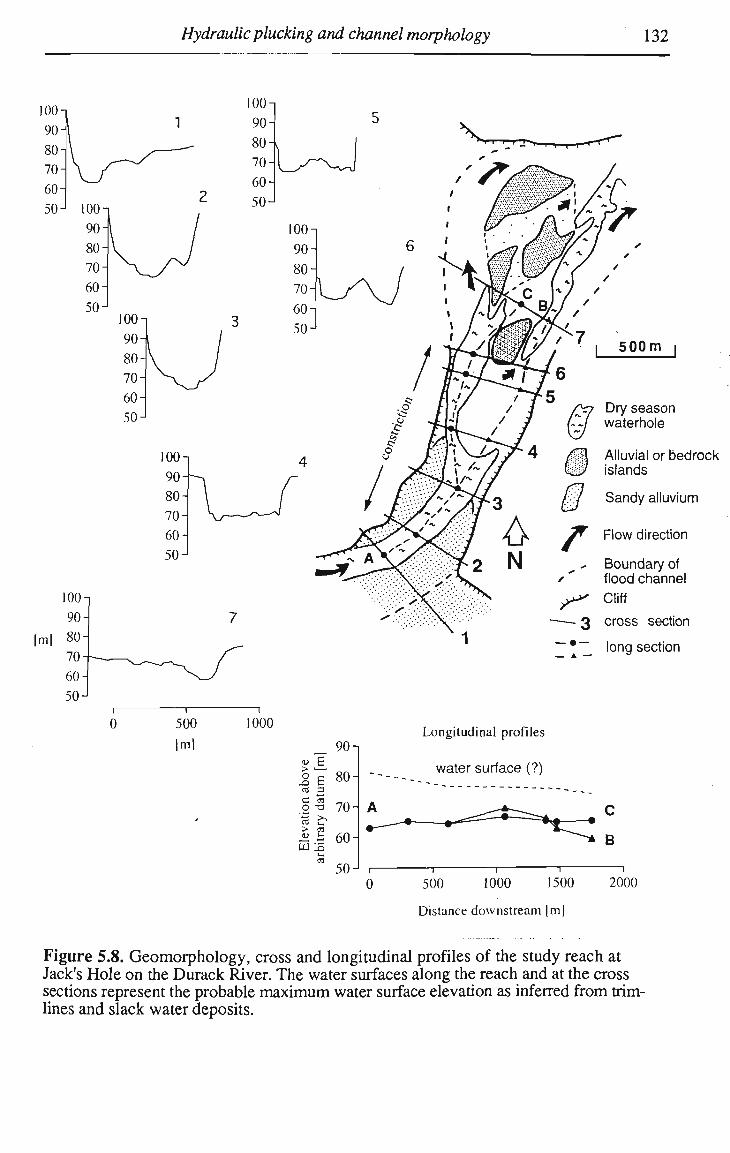
Hydraulic plucking and channel morphology 132
/ •
y /-x/ / 7 f 1 6
'§ § 0 r ^
— 3 — •— — A —
5 0 0 m |
Dry season waterhole
Alluvial or bedrock islands
Sandy alluvium
Flow direction
Boundary of flood channel Cliff
cross section
long section
m
2 E rt 3 c a O "O > a
90 -i
80-
70
60-
50
Longitudinal profiles
water surface (?)
B
500 1000 1500
Distance downstream |m|
2000
Figure 5.8. Geomorphology, cross and longitudinal profiles of the study reach at Jack's Hole on the Durack River. The water surfaces along the reach and at the cross sections represent the probable maximum water surface elevation as inferred from trim-lines and slack water deposits.
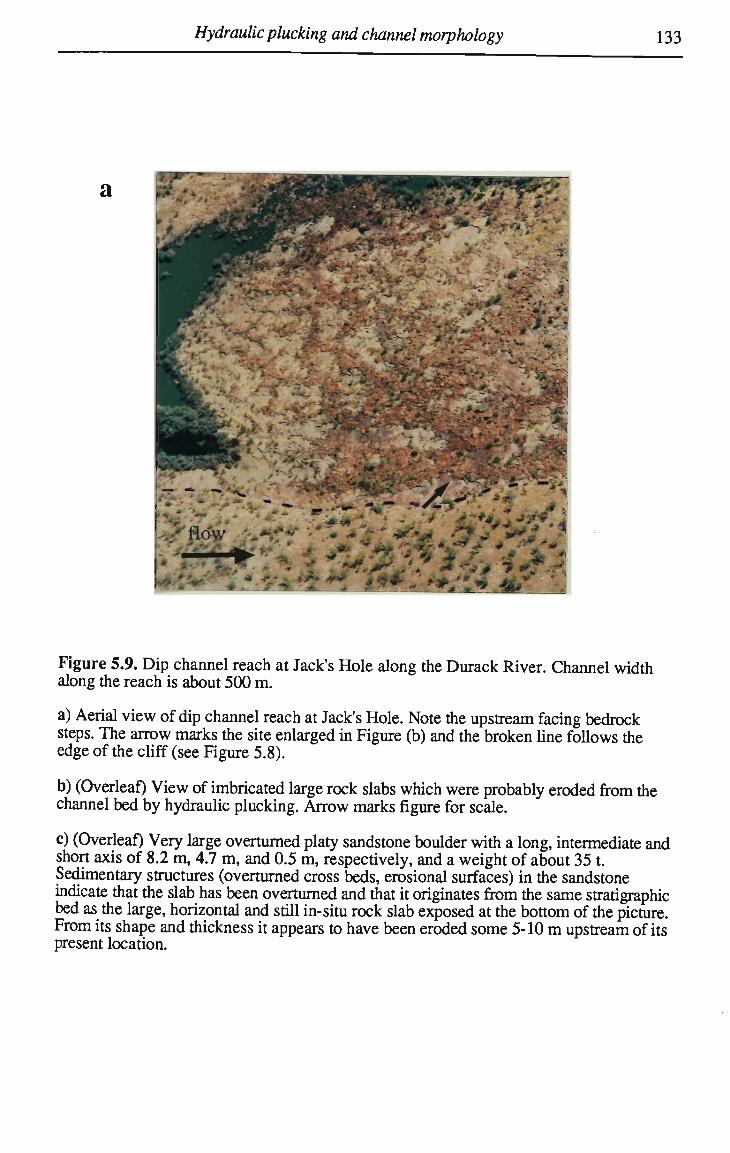
Hydraulic plucking and channel morphology 1 33
Figure 5.9. Dip channel reach at Jack's Hole along the Durack River. Channel width along the reach is about 500 m.
a) Aerial view of dip channel reach at Jack's Hole. Note the upstream facing bedrock steps. The arrow marks the site enlarged in Figure (b) and the broken line follows the edge of the cliff (see Figure 5.8).
b) (Overleaf) View of imbricated large rock slabs which were probably eroded from the channel bed by hydraulic plucking. Arrow marks figure for scale.
c) (Overleaf) Very large overturned platy sandstone boulder with a long, intermediate and short axis of 8.2 m, 4.7 m , and 0.5 m, respectively, and a weight of about 35 t. Sedimentary structures (overturned cross beds, erosional surfaces) in the sandstone indicate that the slab has been overturned and that it originates from the same stratigraphic bed as the large, horizontal and still in-situ rock slab exposed at the bottom of the picture. From its shape and thickness it appears to have been eroded some 5-10 m upstream of its present location.
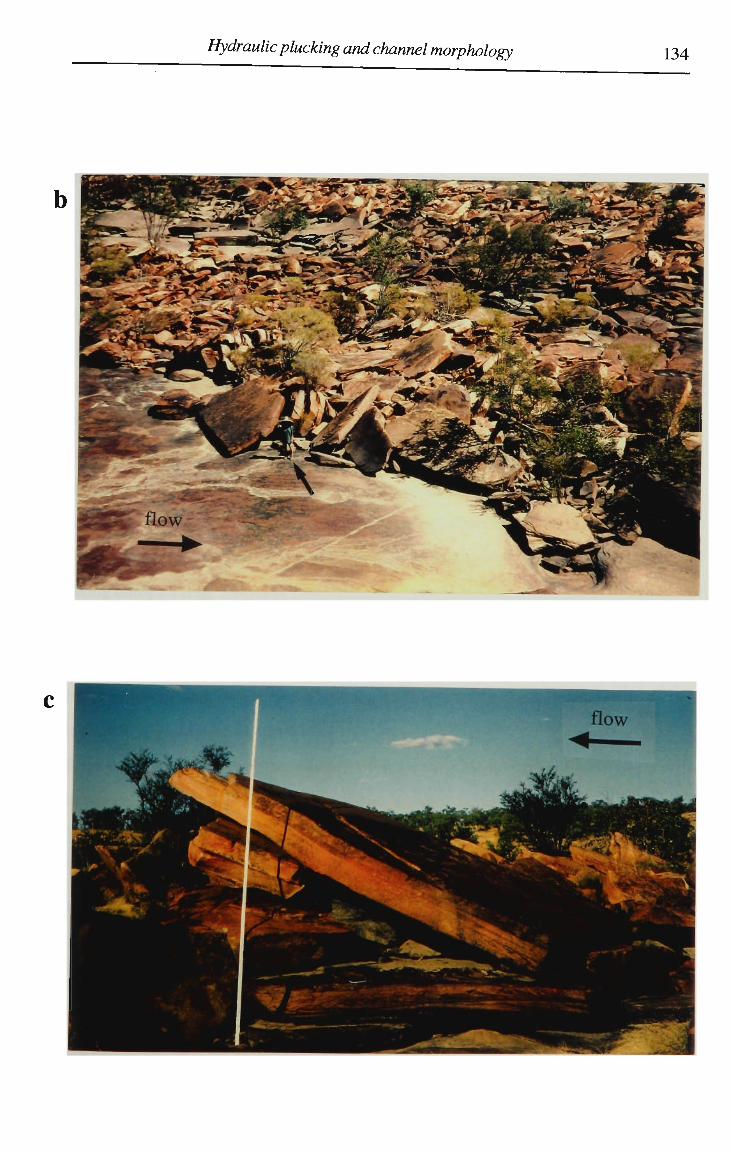
Hydraulic plucking and channel morphology 134
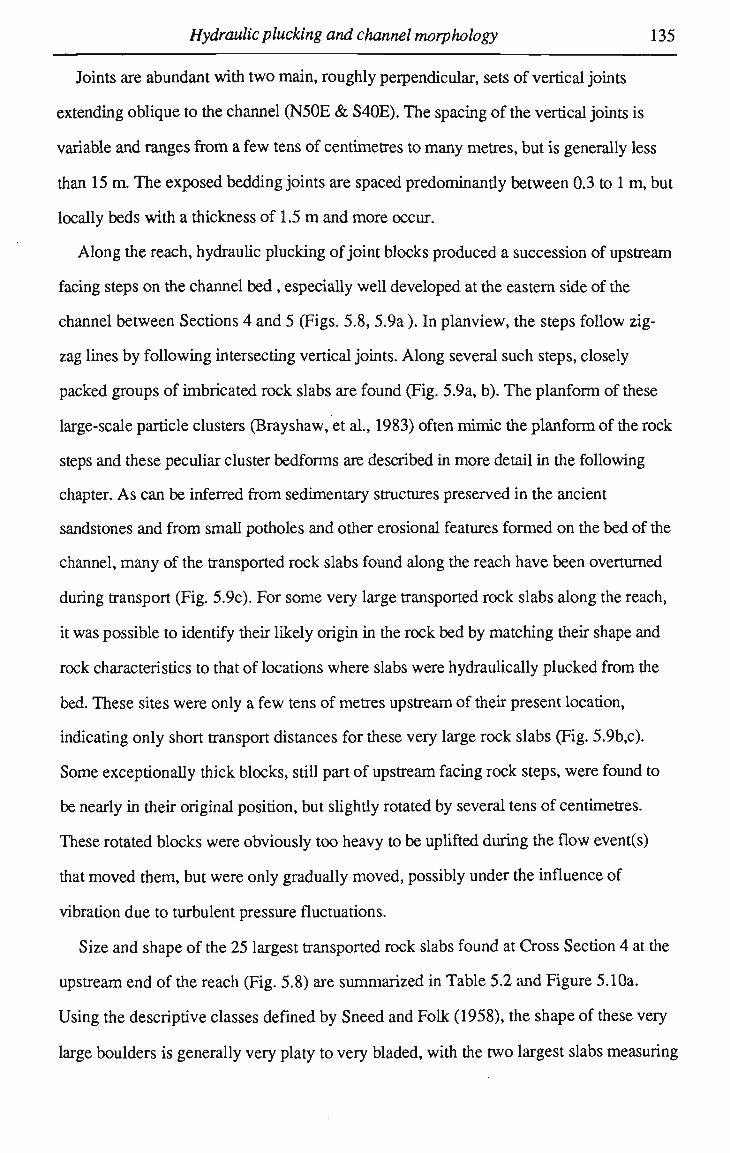
Hydraulic plucking and channel morphology 135
Joints are abundant with two main, roughly perpendicular, sets of vertical joints
extending oblique to the channel (N50E & S40E). The spacing of the vertical joints is
variable and ranges from a few tens of centimetres to many metres, but is generally less
than 15 m. The exposed bedding joints are spaced predominandy between 0.3 to 1 m, but
locally beds with a thickness of 1.5 m and more occur.
Along the reach, hydraulic plucking of joint blocks produced a succession of upstream
facing steps on the channel bed, especially well developed at the eastern side of the
channel between Sections 4 and 5 (Figs. 5.8, 5.9a). In planview, the steps follow zig
zag lines by following intersecting vertical joints. Along several such steps, closely
packed groups of imbricated rock slabs are found (Fig. 5.9a, b). The planform of these
large-scale particle clusters (Brayshaw, et al., 1983) often mimic the planform of the rock
steps and these peculiar cluster bedforms are described in more detail in the following
chapter. A s can be inferred from sedimentary structures preserved in the ancient
sandstones and from small potholes and other erosional features formed on the bed of the
channel, many of the transported rock slabs found along the reach have been overturned
during transport (Fig. 5.9c). For some very large transported rock slabs along the reach,
it was possible to identify their likely origin in the rock bed by matching their shape and
rock characteristics to that of locations where slabs were hydraulically plucked from the
bed. These sites were only a few tens of metres upstream of their present location,
indicating only short transport distances for these very large rock slabs (Fig. 5.9b,c).
Some exceptionally thick blocks, still part of upstream facing rock steps, were found to
be nearly in their original position, but slighdy rotated by several tens of centimetres.
These rotated blocks were obviously too heavy to be uplifted during the flow event(s)
that moved them, but were only gradually moved, possibly under the influence of
vibration due to turbulent pressure fluctuations.
Size and shape of the 25 largest transported rock slabs found at Cross Section 4 at the
upstream end of the reach (Fig. 5.8) are summarized in Table 5.2 and Figure 5.10a.
Using the descriptive classes defined by Sneed and Folk (1958), the shape of these very
large boulders is generally very platy to very bladed, with the two largest slabs measuring
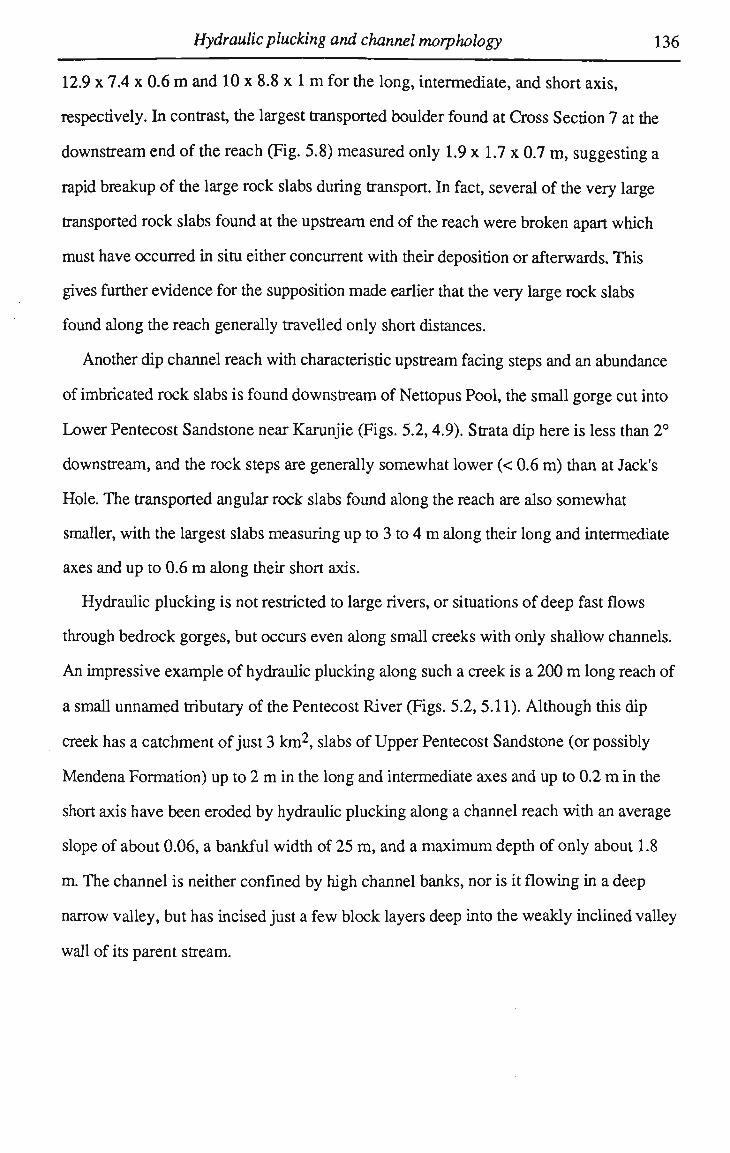
Hydraulic plucking and channel morphology 136
12.9 x 7.4 x 0.6 m and 10 x 8.8 x 1 m for the long, intermediate, and short axis,
respectively. In contrast, the largest transported boulder found at Cross Section 7 at the
downstream end of the reach (Fig. 5.8) measured only 1.9 x 1.7 x 0.7 m , suggesting a
rapid breakup of the large rock slabs during transport. In fact, several of the very large
transported rock slabs found at the upstream end of the reach were broken apart which
must have occurred in situ either concurrent with their deposition or afterwards. This
gives further evidence for the supposition made earlier that the very large rock slabs
found along the reach generally travelled only short distances.
Another dip channel reach with characteristic upstream facing steps and an abundance
of imbricated rock slabs is found downstream of Nettopus Pool, the small gorge cut into
Lower Pentecost Sandstone near Karunjie (Figs. 5.2,4.9). Strata dip here is less than 2°
downstream, and the rock steps are generally somewhat lower (< 0.6 m ) than at Jack's
Hole. The transported angular rock slabs found along the reach are also somewhat
smaller, with the largest slabs measuring up to 3 to 4 m along their long and intermediate
axes and up to 0.6 m along their short axis.
Hydraulic plucking is not restricted to large rivers, or situations of deep fast flows
through bedrock gorges, but occurs even along small creeks with only shallow channels.
An impressive example of hydraulic plucking along such a creek is a 200 m long reach of
a small unnamed tributary of the Pentecost River (Figs. 5.2, 5.11). Although this dip
creek has a catchment of just 3 km2, slabs of Upper Pentecost Sandstone (or possibly
Mendena Formation) up to 2 m in the long and intermediate axes and up to 0.2 m in the
short axis have been eroded by hydraulic plucking along a channel reach with an average
slope of about 0.06, a bankful width of 25 m , and a maximum depth of only about 1.8
m. The channel is neither confined by high channel banks, nor is it flowing in a deep
narrow valley, but has incised just a few block layers deep into the weakly inclined valley
wall of its parent stream.
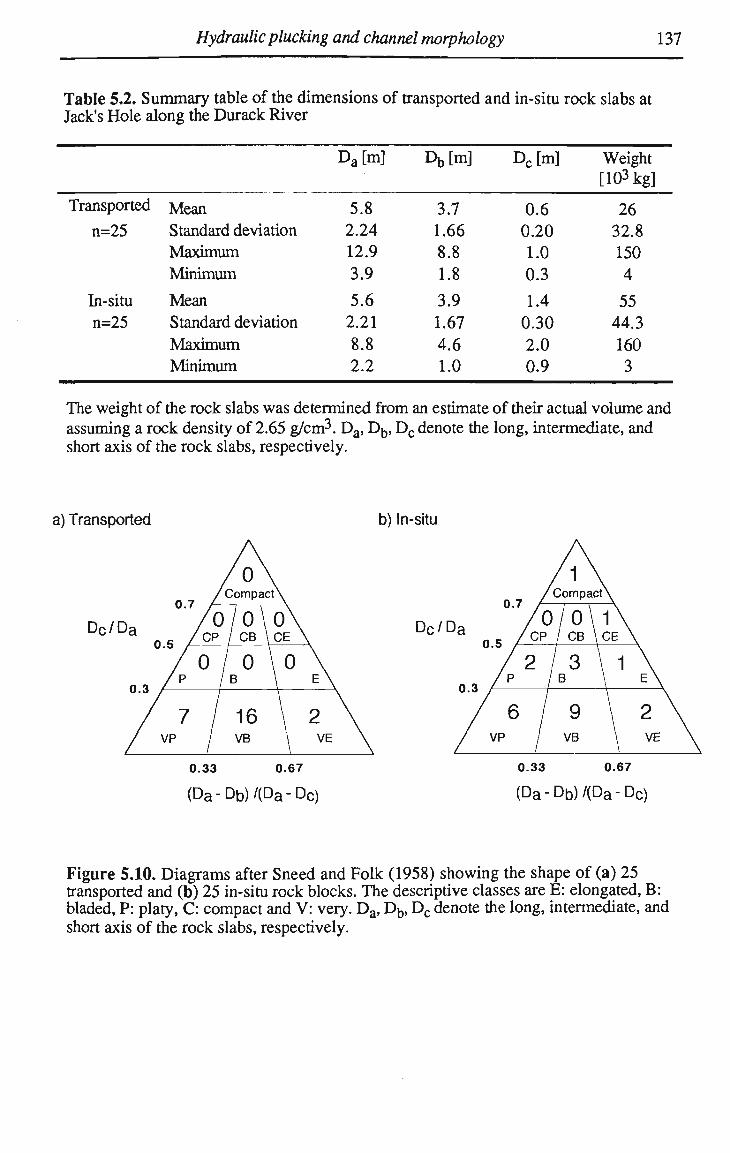
Hydraulic plucking and channel morphology 137
Table 5.2. Summary table of the dimensions of transported and in-situ rock slabs at Jack's Hole along the Durack River
Transported
n=25
In-situ n=25
Mean Standard deviation Maximum Minimum
Mean Standard deviation Maximum Minimum
D a[m]
5.8 2.24 12.9 3.9
5.6 2.21 8.8 2.2
Db[m]
3.7 1.66 8.8 1.8
3.9 1.67 4.6 1.0
D c[m]
0.6 0.20 1.0 0.3
1.4 0.30 2.0 0.9
Weight [103 kg]
26 32.8 150 4
55 44.3 160 3
The weight of the rock slabs was determined from an estimate of their actual volume and assuming a rock density of 2.65 g/cm3. Da, Db, D c denote the long, intermediate, and short axis of the rock slabs, respectively.
a) Transported b) In-situ
0 0.7 A
Dc/Da o s / 0
/ 0 I /p /
/ 7 / / VP /
CompactX
/o\ / CB ' 0 B
16 VB
\CE \
\o \ \ E \
\ 2 \ \ VE \
0.33 0.67
(Da-Db)/{Da-DC)
0.7 A-Dc/Da
BS /£_ / 2 / /P /
/ 6 / / VP /
CompactX
/o\i\ / CB \ CE N
' 3 B
9 VB
\ 1 E \
2 \ VE \
0.33 0.67
(Da-Db)/(Da-DC)
Figure 5.10. Diagrams after Sneed and Folk (1958) showing the shape of (a) 25 transported and (b) 25 in-situ rock blocks. The descriptive classes are E: elongated, B: bladed, P: platy, C: compact and V: very. Da, Db, D c denote the long, intermediate, and short axis of the rock slabs, respectively.
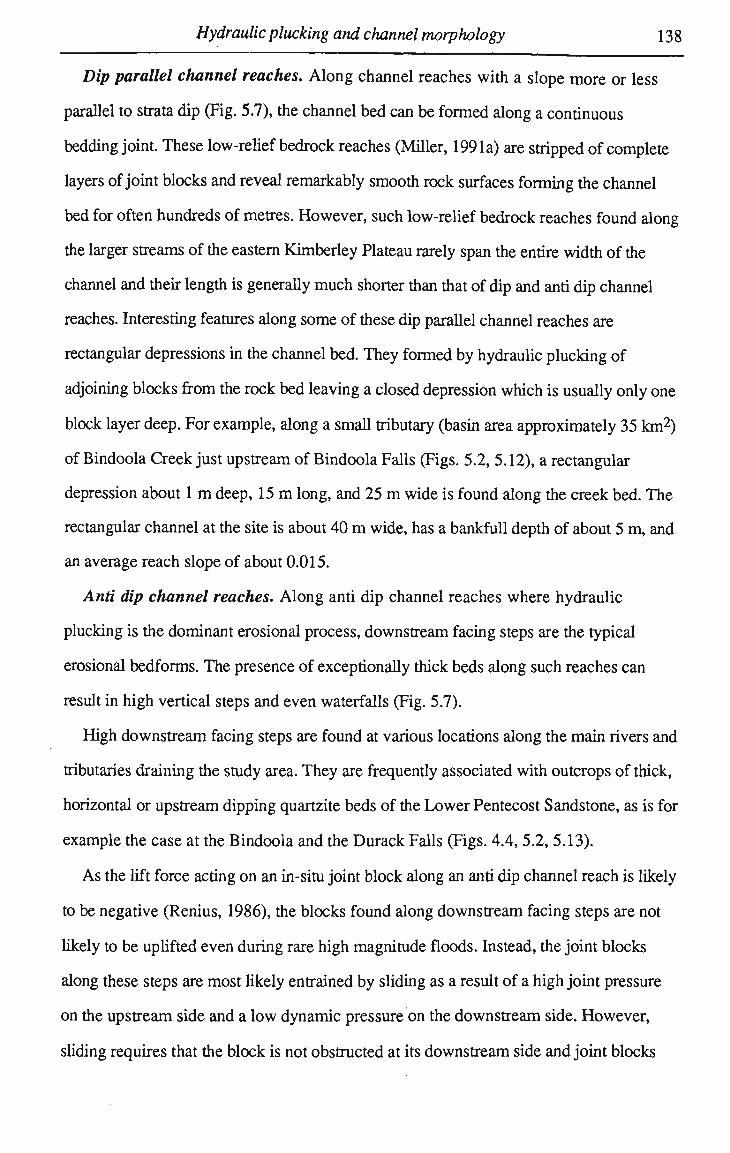
Hydraulic plucking and channel morphology 138
Dip parallel channel reaches. Along channel reaches with a slope more or less
parallel to strata dip (Fig. 5.7), the channel bed can be formed along a continuous
bedding joint. These low-relief bedrock reaches (Miller, 1991a) are stripped of complete
layers of joint blocks and reveal remarkably smooth rock surfaces forming the channel
bed for often hundreds of metres. However, such low-relief bedrock reaches found along
the larger streams of the eastern Kimberley Plateau rarely span the entire width of the
channel and their length is generally much shorter than that of dip and anti dip channel
reaches. Interesting features along some of these dip parallel channel reaches are
rectangular depressions in the channel bed. They formed by hydraulic plucking of
adjoining blocks from the rock bed leaving a closed depression which is usually only one
block layer deep. For example, along a small tributary (basin area approximately 35 km 2 )
of Bindoola Creek just upstream of Bindoola Falls (Figs. 5.2, 5.12), a rectangular
depression about 1 m deep, 15 m long, and 25 m wide is found along the creek bed. The
rectangular channel at the site is about 40 m wide, has a bankfull depth of about 5 m, and
an average reach slope of about 0.015.
Anti dip channel reaches. Along anti dip channel reaches where hydraulic
plucking is the dominant erosional process, downstream facing steps are the typical
erosional bedforms. The presence of exceptionally thick beds along such reaches can
result in high vertical steps and even waterfalls (Fig. 5.7).
High downstream facing steps are found at various locations along the main rivers and
tributaries draining the study area. They are frequently associated with outcrops of thick,
horizontal or upstream dipping quartzite beds of the Lower Pentecost Sandstone, as is for
example the case at the Bindoola and the Durack Falls (Figs. 4.4, 5.2, 5.13).
As the lift force acting on an in-situ joint block along an anti dip channel reach is likely
to be negative (Renius, 1986), the blocks found along downstream facing steps are not
likely to be uplifted even during rare high magnitude floods. Instead, the joint blocks
along these steps are most likely entrained by sliding as a result of a high joint pressure
on the upstream side and a low dynamic pressure on the downstream side. However,
sliding requires that the block is not obstructed at its downstream side and joint blocks
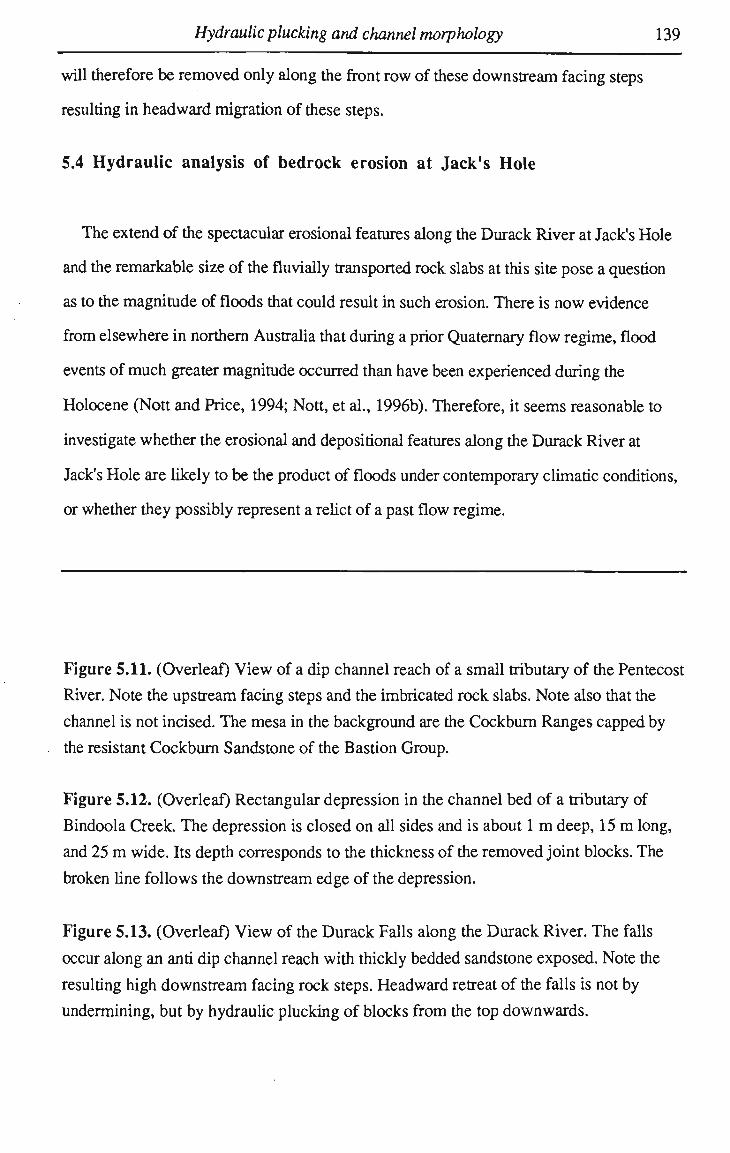
Hydraulic plucking and channel morphology 139
will therefore be removed only along the front row of these downstream facing steps
resulting in headward migration of these steps.
5.4 Hydraulic analysis of bedrock erosion at Jack's Hole
The extend of the spectacular erosional features along the Durack River at Jack's Hole
and the remarkable size of the fluvially transported rock slabs at this site pose a question
as to the magnitude of floods that could result in such erosion. There is now evidence
from elsewhere in northern Australia that during a prior Quaternary flow regime, flood
events of much greater magnitude occurred than have been experienced during the
Holocene (Nott and Price, 1994; Nott, et al., 1996b). Therefore, it seems reasonable to
investigate whether the erosional and depositional features along the Durack River at
Jack's Hole are likely to be the product of floods under contemporary climatic conditions,
or whether they possibly represent a relict of a past flow regime.
Figure 5.11. (Overleaf) View of a dip channel reach of a small tributary of the Pentecost
River. Note the upstream facing steps and the imbricated rock slabs. Note also that the
channel is not incised. The mesa in the background are the Cockburn Ranges capped by
the resistant Cockburn Sandstone of the Bastion Group.
Figure 5.12. (Overleaf) Rectangular depression in the channel bed of a tributary of
Bindoola Creek. The depression is closed on all sides and is about 1 m deep, 15 m long,
and 25 m wide. Its depth corresponds to the thickness of the removed joint blocks. The
broken line follows the downstream edge of the depression.
Figure 5.13. (Overleaf) View of the Durack Falls along the Durack River. The falls
occur along an anti dip channel reach with thickly bedded sandstone exposed. Note the
resulting high downstream facing rock steps. Headward retreat of the falls is not by
undermining, but by hydraulic plucking of blocks from the top downwards.
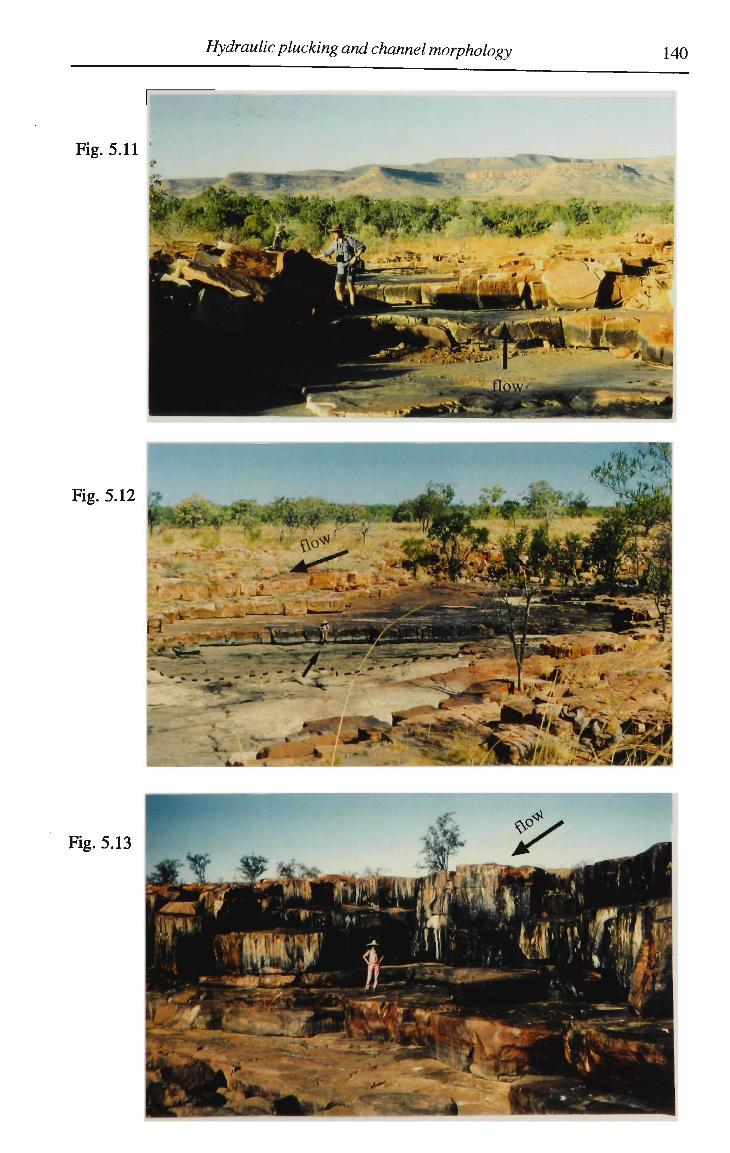
Hydraulic plucking and channel morphology 140
Fig. 5.11
Fig. 5.12 •
Fig. 5.13
Hydraulic plucking and channel morphology 141
5.4.1 Hydraulic calculations
In many palaeohydraulic studies, deposits of transported boulders have been used to
reconstruct flood events (e.g. Costa, 1983; Williams, 1983). In a similar way, the flow
velocities and discharges of palaeofloods that resulted in hydraulic plucking of large rock
slabs along the channel reach downstream of Jack's Hole are estimated in this study
using the stability criterion for joint blocks subject to large lift forces. The stability of a
joint-bounded, in-situ rock slab under the influence of a large lift force is largely
controlled by the thickness of the block, and the minimum instantaneous velocity needed
for its removal can be estimated using Equation 5.4 and uplift coefficients determined
(Renius, 1986) (Tab. 5.1). However, as these uplift coefficients have not been verified
for a wide range of flow conditions in natural bedrock channels, calculations of critical
entrainment velocities should be viewed with some caution.
The thickness of the eroded large rock slabs at Jack's Hole ranges from 0.3 m to 1 m,
with a mean value of 0.6 m (Tab. 5.2). The lift coefficient in Equation 5.4 that
corresponds to a dip angle of 2-3° along the reach is C L = 0 . 3 (Tab. 5.1). Taking the
density of the block as ps=2.65 g/cm3, that of water as p=l g/cm3, and the acceleration
due to gravity as g=9.8 m/s2, the minimum velocity vc needed to hydraulically pluck a
large rock slab with a thickness of Dc=0.3 m, 0.6 m, and 1.0 m along the channel reach
is calculated to be about 6 m/s, 8 m/s, and 10 m/s, respectively.
In order to obtain a better estimate of the maximum flow velocities that occurred along
the reach, the size of 25 loose, but still in-situ joint blocks was determined (Tab. 5.2,
Fig. 5.10b). Only those blocks were selected which were clearly detached along all four
vertical joints and along the horizontal bedding joint, and which had no apparent tendency
for interlocking with neighbouring blocks. The range of values of the long and
intermediate axes, as well as of the weight of these in-situ blocks is similar to that of the
transported rock slabs. However, the in-situ blocks are clearly thicker than the
transported rock slabs resulting in a somewhat more compact shape (Tab. 5.2, Fig.

Hydraulic plucking and channel morphology 142
5.10a,b). A comparison of the thickness of the transported rock slabs with the thickness
of the in-situ blocks indicates that a minimum thickness of about l m was required for
blocks to resist hydraulic plucking. This suggests that a maximum local velocity of about
10 m/s occurred along the reach.
The critical velocities (vc) calculated here represent maximum instantaneous velocities,
but to relate the critical velocity to a particular discharge at a cross section, a value for the
mean flow velocity is needed Any such correction has to consider velocity fluctuations
due to turbulence, as turbulent velocity (pressure/force) fluctuations can generate large
transient lift forces which may, using average values, lead to an underestimation of the
erosive power of flows (Fiorotto and Rinaldo, 1992). One way of addressing this
problem is by expressing the instantaneous velocity (VJ) as sum of the time-averaged
velocity (vav) and a fluctuating component (v') (e.g. Razvan, 1989; Carling and Grodek,
1994).
Vi=vav+V (5.7a)
The fluctuating component (V) may be expressed as some multiple of the standard
deviation of the velocity distribution, and taking v'= 3kv va v (e.g. Razvan, 1989; Carling
and Grodek, 1994), the instantaneous velocity can be reduced to a time-averaged flow
velocity according to:
vav=Vi/(l + 3kv) (5.7b)
The factor kv depends on the intensity of macroturbulence and Razvan (1989, p. 362)
gives values ranging from 0.08 to 0.1 for 'normal' turbulence up to extreme values of
0.5 to 0.6 beneath a hydraulic jump.
Selecting a moderate value of kv=0.1 to account for the turbulence at the study site, the
instantaneous critical velocity needed to hydraulically pluck a i m thick rock slab along
the study reach (vc=10 m/s) is reduced to a time averaged flow velocity (Eq. 5.7b) of just

Hydraulic plucking and channel morphology 143
under 8 m/s. Accordingly, those needed to erode 0.3 and 0.6 m thick blocks reduce to
about 4 and 6 m/s, respectively. However, the relationship between local instantaneous
flow velocities and mean values at a cross section is not only influenced by velocity
fluctuations due to turbulence, but also by the lateral and vertical velocity profiles. During
fully turbulent flood flows along the study reach, the variation of roughness and depth
across the channel will almost certainly result in variations of local flow velocity. Areas
of fast flowing water can be expected to form over smooth bedrock surfaces while
reduced velocities are likely to occur over boulder deposits. As has been observed in
bedrock channels elsewhere, flow across the channel can be subdivided into locallized
threads of fast critical or supercritical flow bounded by areas where slower subcritical
flow prevails (pers. com. Tinkler, 1996). From the above discussion it follows that the
corresponding (overall) mean flow velocities across the entire channel may be somewhat
lower than the estimates of the average flow velocities obtained from Equation 5.7b.
5.4.2 Palaeodischarge estimates
In general, if the stage of a palaeoflood can be inferred from indirect evidence, the
magnitude of the palaeodischarge can be estimated (Baker, et al., 1983). Typical
indicators of water-surface elevation are flood debris, slack-water deposit (Baker, 1987),
trim-lines separating water-scoured banks below from unaffected banks above (Foley, et
al., 1984; Carling and Grodek, 1994), and the highest elevation of flood deposited
gravels (Baker, 1973; Carling and Grodek, 1994). Along the channel reach at Jack's
Hole, a variety of evidence was used to determine the likely water surface elevation of the
highest peak flow. At the upstream end of the reach (Fig. 5.8, Cross Sections 1-3),
sandy alluvium is found flanking the channel and the top of these deposits provides a
reasonable stage indicator (Tab. 5.3). The maximum height of the alluvium generally
coincides with trim-lines found along the valley slopes. Above these lines, weathered
rock debris and thin skeletal soils are found, while below the trim-line, a bedrock surface
without colluvial cover is exposed. At the downstream end of the reach (Fig. 5.8, Cross
Sections 5-7), sandy slack-water deposits found on a bedrock island dividing the channel
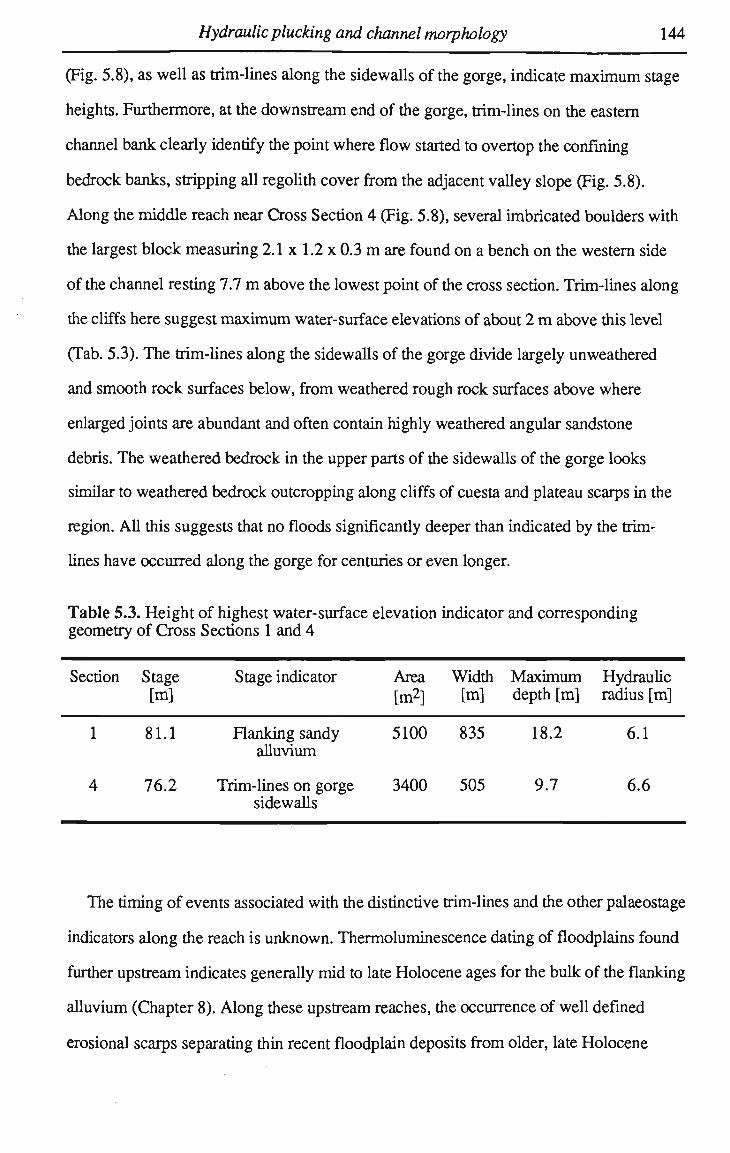
Hydraulic plucking and channel morphology 144
(Fig. 5.8), as well as trim-lines along the sidewalls of the gorge, indicate maximum stage
heights. Furthermore, at the downstream end of the gorge, trim-lines on the eastern
channel bank clearly identify the point where flow started to overtop the confining
bedrock banks, stripping all regolith cover from the adjacent valley slope (Fig. 5.8).
Along the middle reach near Cross Section 4 (Fig. 5.8), several imbricated boulders with
the largest block measuring 2.1 x 1.2 x 0.3 m are found on a bench on the western side
of the channel resting 7.7 m above the lowest point of the cross section. Trim-lines along
the cliffs here suggest maximum water-surface elevations of about 2 m above this level
(Tab. 5.3). The trim-lines along the sidewalls of the gorge divide largely unweathered
and smooth rock surfaces below, from weathered rough rock surfaces above where
enlarged joints are abundant and often contain highly weathered angular sandstone
debris. The weathered bedrock in the upper parts of the sidewalls of the gorge looks
similar to weathered bedrock outcropping along cliffs of cuesta and plateau scarps in the
region. All this suggests that no floods significantiy deeper than indicated by the trim-
lines have occurred along the gorge for centuries or even longer.
Table 5.3. Height of highest water-surface elevation indicator and corresponding geometry of Cross Sections 1 and 4
Section
1
4
Stage [m]
81.1
76.2
Stage indicator
Flanking sandy alluvium
Trim-lines on gorge sidewalls
Area [m2]
5100
3400
Width [m]
835
505
Maximum depth [m]
18.2
9.7
Hydraulic radius [m]
6.1
6.6
The timing of events associated with the distinctive trim-lines and the other palaeostage
indicators along the reach is unknown. Thermoluminescence dating of floodplains found
further upstream indicates generally mid to late Holocene ages for the bulk of the flanking
alluvium (Chapter 8). Along these upstream reaches, the occurrence of well defined
erosional scarps separating thin recent floodplain deposits from older, late Holocene
Hydraulic plucking and channel morphology 145
alluvium, give evidence for significantiy larger flood events along the Durack River than
have been observed in historic times. Furthermore, from streams elsewhere in the region,
the occurrence of large late Holocene floods is documented by slackwater sediments that
were dated using radiocarbon and thermoluminescence dating techniques (Gillieson, et
al., 1991; Wohl, et al., 1994a, 1994c).
In the attempt to obtain a reasonable first estimate of the palaeodischarge
corresponding to the inferred m a x i m u m flow depths at Jack's Hole, the particular
geometry of the study reach may be of use. The reach forms a local constriction in width
and depth (Tab. 5.3) which is followed by a channel expansion (Fig. 5.8). For
discharges above a certain value, the reach could, therefore, function as a natural critical-
flow control allowing simple discharge estimates. Details about the conditions under
which a certain channel geometry can form a control are discussed elsewhere (e.g.
Henderson, 1966) and only the general principle is outiined here. For low discharges,
flow can pass through the gorge largely unaffected by the constriction. If, however,
discharge increases, a situation will be reached where critical flow (Froude number Fr=l)
will occur at the constriction as this allows the maximum discharge per unit width for a
given specific head. For even higher discharges, flow will remain critical at the most
constricted point of the gorge but water will back up ahead of the constriction, thus
increasing the specific head of the flow to the level required to maintain discharge
continuity. Upstream of any such constriction in a channel such backwater effects can
result in the deposition of slack-water deposits (Patton, et al., 1979; Baker, 1987). At the
Jack's Hole site, the sandy alluvium found upstream of the gorge section (Fig. 5.8a)
could be interpreted in this way. Furthermore, the inferred maximum water surface
profile shows a clear drop from Cross Section 1 to Cross Section 4 despite a rise in bed
level of about 3.6 m and a reduction is cross sectional area of more than 3 0 % (Tab. 5.3,
Fig. 5.8 ). This suggests that flow was subcritical at Section 1 as the water surface slope
would rise at Section 2 if it were supercritical. Downstream of Cross Section 4, however,
the channel gradient on the eastern side of the channel steepens markedly (Fig. 5.8), thus
promoting locallized supercritical flow here. If this is so, flow has to pass through critical
Hydraulic plucking and channel morphology 146
somewhere upstream close to the point of a change in channel gradient (Fig. 5.8). All this
suggests that during extreme floods along the study reach, flow is likely to approach
critical flow depth close to the site of maximum constriction near Cross Section 4, thus
allowing discharge to be estimated using a relationship between discharge and the Froude
number of the flow.
The Froude number (Fr) can be defined in a general form by the expression (e.g.
Institution of Engineers Australia, 1987, p. 56)
Fr = (ahQ2w/gAc
3)°"5 (5.8a)
where Q is discharge, w is channel width, Ac is cross sectional area, g is gravitational
acceleration, and ah is the velocity head coefficient accounting for nonuniform velocity
distribution in a subdivided channel. In channels with a simple cross section the velocity
head coefficient is commonly assumed to be cth=1.0, but in streams with compound
cross sections where significant overbank flow occurs at times of high flow, the value of
ah can be significantly greater than unity (e.g. Chow, 1959; Institution of Engineers
Australia, 1987). The discharge corresponding to critical flow (Fr=l) at a cross section
can be calculated by rearranging Equation 5.8a according to
Q = (gAc3/ahw)
0'5 (5.8b)
If it is assumed that critical flow (Fr=l) prevailed at Cross Section 4 during the
palaeoflood(s) that left the trim-lines along the sidewalls of the gorge, the corresponding
discharge can be estimated from Equation 5.8b. For a cross sectional area of Ac=3400
m 2, a channel width of w=505 m (Tab. 5.3), and with g=9,8 m/s and an=1.0, the
palaeodischarge is estimated to about Q=28 000 m3/s. Applying the continuity equation
(Q = vA c), a flood of such a magnitude would have a (overall) mean flow velocity of
about 8 m/s at the Section (Tab. 5.4). This mean velocity is identical to the estimate of the
average flow velocity (vav) obtained earlier from consideration of observed erosion by
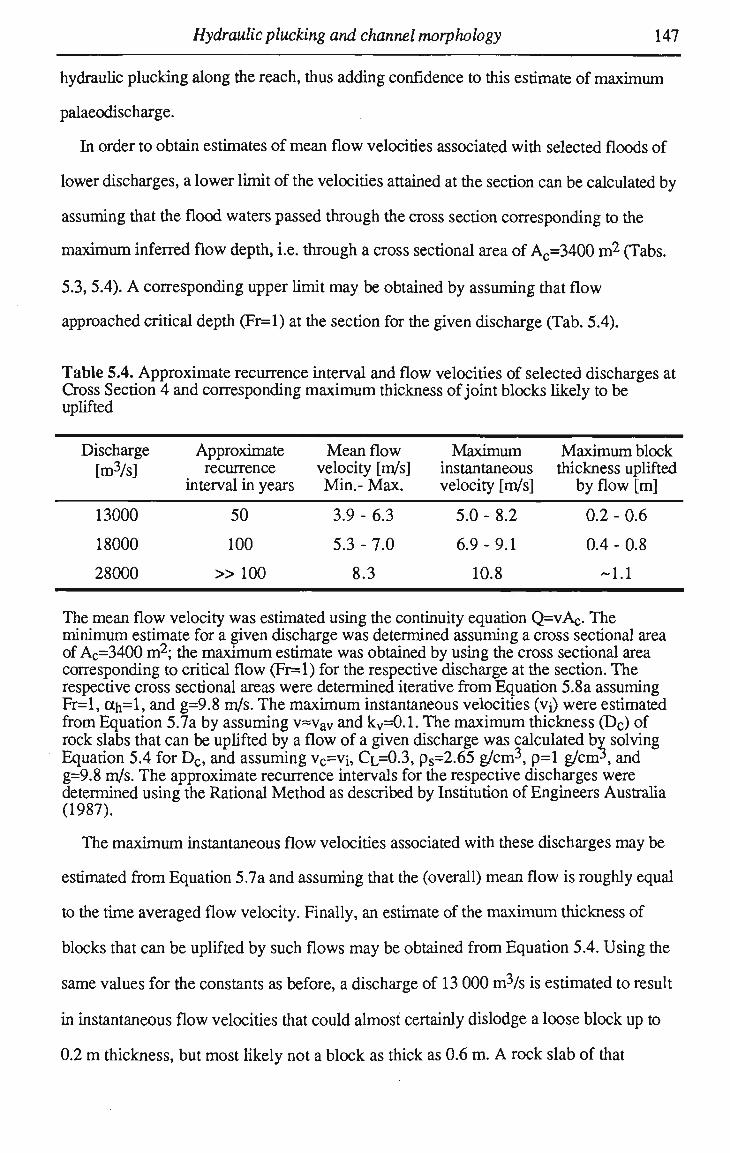
Hydraulic plucking and channel morphology 147
hydraulic plucking along the reach, thus adding confidence to this estimate of maximum
palaeodischarge.
In order to obtain estimates of mean flow velocities associated with selected floods of
lower discharges, a lower limit of the velocities attained at the section can be calculated by
assuming that the flood waters passed through the cross section corresponding to the
maximum inferred flow depth, i.e. through a cross sectional area of Ac=3400 m2 (Tabs.
5.3,5.4). A corresponding upper limit may be obtained by assuming that flow
approached critical depth (Fr=l) at the section for the given discharge (Tab. 5.4).
Table 5.4. Approximate recurrence interval and flow velocities of selected discharges at Cross Section 4 and corresponding maximum thickness of joint blocks likely to be uplifted
Discharge Approximate Mean flow Maximum Maximum block [m3/s] recurrence velocity [m/s] instantaneous thickness uplifted
interval in years Min.- Max. velocity [m/s] by flow [m]
13000 50 3.9-6.3 5.0 - 8.2 0.2-0.6
18000 100 5.3-7.0 6.9-9.1 0.4-0.8
28000 » 100 8.3 10.8 -1.1
The mean flow velocity was estimated using the continuity equation Q=vAc. The minimum estimate for a given discharge was determined assuming a cross sectional area of Ac=3400 m
2 ; the maximum estimate was obtained by using the cross sectional area corresponding to critical flow (Fr=l) for the respective discharge at the section. The respective cross sectional areas were determined iterative from Equation 5.8a assuming Fr=l, ah=l, and g=9.8 m/s. The maximum instantaneous velocities (vO were estimated from Equation 5.7a by assuming v«vav and kv=0.1. The maximum thickness (Dc) of rock slabs that can be uplifted by a flow of a given discharge was calculated by solving Equation 5.4 for Dc, and assuming vc=vi, C L = 0 . 3 , ps=2.65 g/cm
3, p=l g/cm3, and g=9.8 m/s. The approximate recurrence intervals for the respective discharges were determined using the Rational Method as described by Institution of Engineers Australia (1987).
The maximum instantaneous flow velocities associated with these discharges may be
estimated from Equation 5.7a and assuming that the (overall) mean flow is roughly equal
to the time averaged flow velocity. Finally, an estimate of the maximum thickness of
blocks that can be uplifted by such flows may be obtained from Equation 5.4. Using the
same values for the constants as before, a discharge of 13 000 m3/s is estimated to result
in instantaneous flow velocities that could almost certainly dislodge a loose block up to
0.2 m thickness, but most likely not a block as thick as 0.6 m. A rock slab of that
Hydraulic plucking and channel morphology 148
thickness can probably be eroded by a flood in the order of 18 000 m3/s, while the uplift
force created by a discharge of approximately 28 000 m3/s could be large enough to raise
a i m thick block out of the channel bed (Tab. 5.4). By all means, these values represent
only rough estimates of average conditions, and flow velocities reached locally during
such large flood events may vary significantly from point to point on the cross section.
5.4.3 Flood frequency
The catchment at the study site is ungauged and the only gauging station on the river is
located some 100 k m further upstream but has not yet been rated. Generally, stream flow
and rainfall data for the region are temporally and spatially sparse and, therefore, large to
extreme flood estimations are difficult to obtain. The approximate recurrence intervals of
the discharges of interest were determined using the Rational Method which is the
recommended regional method of flood estimation for ungauged catchments in the
Kimberley region (Institution of Engineers Australia, 1987). To estimate peak flows, this
method uses an estimated regional average rainfall intensity of the same recurrence
interval as the flow event. For the study area, such intensity-frequency-duration rainfall
estimates were prepared by the Australian Bureau of Meteorology (Appendix C), and
using these, the magnitudes of peak flows of selected recurrence intervals were
determined for the Durack River at Jack's Hole (Appendix D ) . The analysis indicates that
a 13 000 m3/s flood represents approximately a one in 50 year event, a 18 000 m3/s flood
a one in 100 year event, and a 28 000 m3/s flood a rare and extreme event, probably
approaching something like the probable maximum flood (PMF) (Tab. 5.4). Estimates of
the P M F based on climatological and hydrological principles are not available for the
study site. However, an estimate for the P M F along the Ord River was prepared for a
dam located some 150 k m east of the study site (Fig. 5.2). The Ord River D a m catchment
extents over an area of 46 000 k m 2 and is estimated to receive a probable maximum peak
flow of 125 500 m3/s, or 2.73 m3s"1km-2, over a 5 day period (Wark, 1982).
Multiplying this flow rate by the catchment area of the Durack River at Jack's Hole yields
a sort of 'minimum P M F estimate' of Q » 33 000 m3/s at the site. It may be considered a
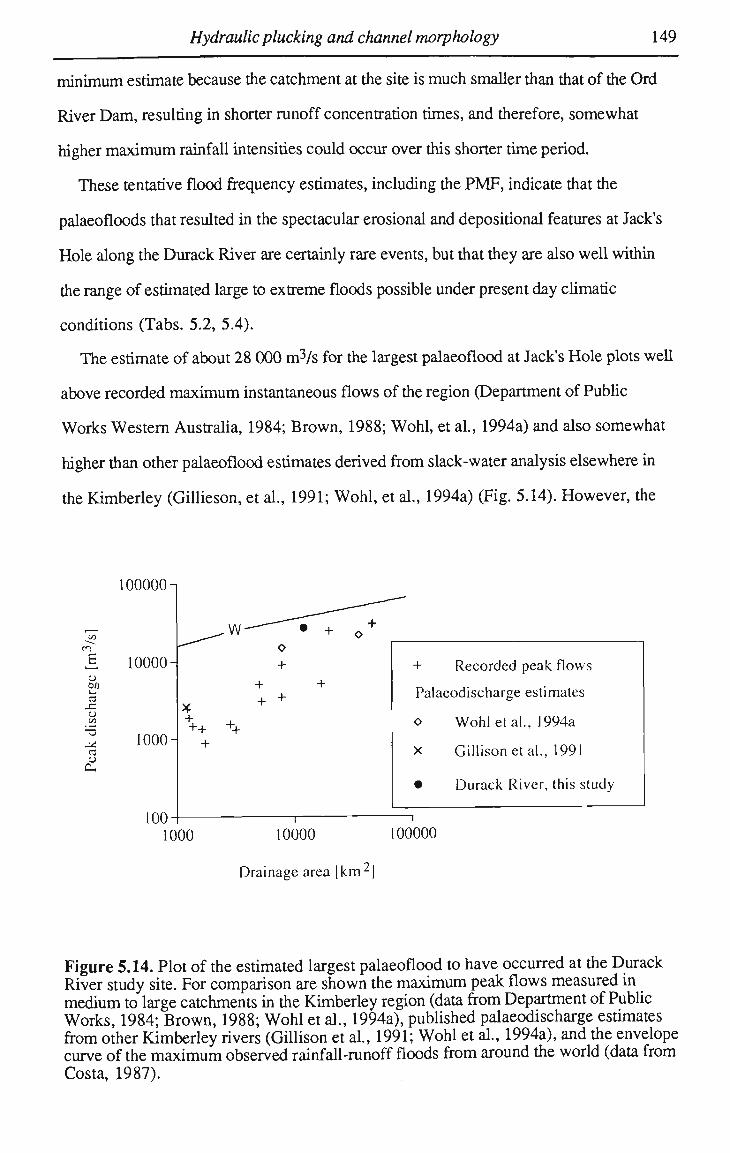
Hydraulic plucking and channel morphology 149
minimum estimate because the catchment at the site is much smaller than that of the Ord
River Dam, resulting in shorter runoff concentration times, and therefore, somewhat
higher maximum rainfall intensities could occur over this shorter time period.
These tentative flood frequency estimates, including the PMF, indicate that the
palaeofloods that resulted in the spectacular erosional and depositional features at Jack's
Hole along the Durack River are certainly rare events, but that they are also well within
the range of estimated large to extreme floods possible under present day climatic
conditions (Tabs. 5.2, 5.4).
The estimate of about 28 000 m3/s for the largest palaeoflood at Jack's Hole plots well
above recorded maximum instantaneous flows of the region (Department of Public
Works Western Australia, 1984; Brown, 1988; Wohl, et al., 1994a) and also somewhat
higher than other palaeoflood estimates derived from slack-water analysis elsewhere in
the Kimberley (Gillieson, et al., 1991; Wohl, et al., 1994a) (Fig. 5.14). However, the
CO
E o
u
^. a
a.
100000-1
£. 10000
1000
100
+
+
+ +
+ +
1000 I0000
Drainage area |km2|
+ Recorded peak flows
Palaeodischarge estimates
o
X
•
Wohletal., 1994a
Gillisonetal, 1991
Durack River, this study
— I
100000
Figure 5.14. Plot of the estimated largest palaeoflood to have occurred at the Durack River study site. For comparison are shown the maximum peak flows measured in medium to large catchments in the Kimberley region (data from Department of Public Works, 1984; Brown, 1988; Wohl et al., 1994a), published palaeodischarge estimates from other Kimberley rivers (Gillison et al., 1991; Wohl et al., 1994a), and the envelope curve of the maximum observed rainfall-runoff floods from around the world (data from Costa, 1987).
Hydraulic plucking and channel morphology 150
palaeoflood estimate of this study is still below the envelope curve of maximum rainfall-
runoff floods from around the world (Costa, 1987) (Fig. 5.14), which is also very
similar to the envelope curve for 100 year recurrence interval floods from elsewhere in
Australia (Finlayson and McMahon, 1988).
5.4.4 Discussion
Along many channel reaches on the eastern Kimberley Plateau in northwestern
Australia, hydraulic plucking appears to be a very important, if not dominant, process of
bedrock channel erosion. This process is responsible for the characteristic stepped
channel bed morphologies with the direction and magnitude of dip of the well-jointed
sandstones controlling channel morphology. Successions of upstream facing bedrock
steps which promote the accumulation of cluster bedforms of large imbricated boulders,
low-relief bedrock surfaces, and successions of downstream facing steps, can all be
explained as a result of these controls.
Estimated hydraulic requirements for hydraulic plucking of loose blocks can be
compared to existing hydraulic conditions along a selected channel reach and the
magnitude and frequency of channel forming flood events can be approximated. For
example, along the bedrock channel reach at Jack's Hole, flood events that could result in
the erosion of rock slabs with a thickness of 0.3 m, which is about the thickness of the
thinnest beds exposed at the site, can be expected to occur only about once in 50 years.
Those that could uplift blocks up to a thickness of 0.6 m only occur about once in 100
years. Blocks thicker than l m can apparendy resist hydraulic plucking along the reach,
thus restricting channel erosion by this process to areas of thinner bedded rocks. A
crucial factor for the rate of erosion is the time required to produce a layer of loose blocks
on the surface of the channel bed. If this time span is longer than the average recurrence
interval of a flood capable of removing those blocks, the actual rate of channel erosion
will be controlled by the rate of formation of open bedding joints. Along such channels,
the actual rate of channel erosion becomes weathering limited. However, if an unlimited
supply of loose rock slabs is present along a reach, erosion by hydraulic plucking
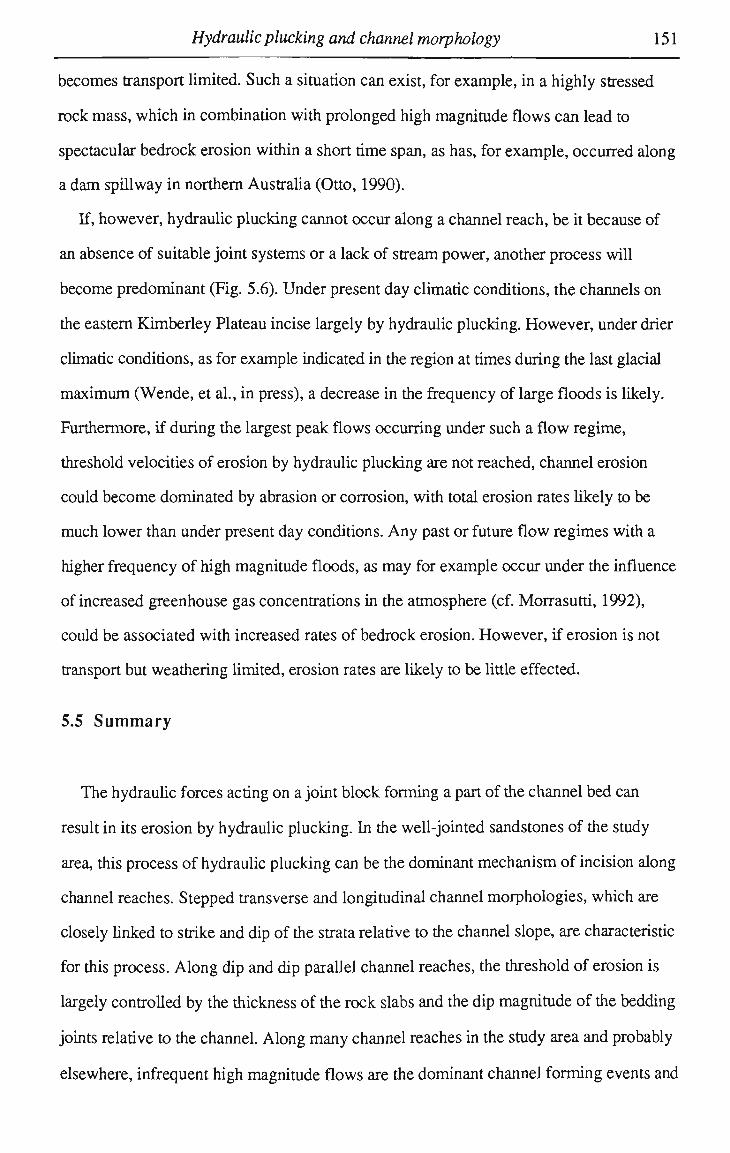
Hydraulic plucking and channel morphology 151
becomes transport limited. Such a situation can exist, for example, in a highly stressed
rock mass, which in combination with prolonged high magnitude flows can lead to
spectacular bedrock erosion within a short time span, as has, for example, occurred along
a dam spillway in northern Australia (Otto, 1990).
If, however, hydraulic plucking cannot occur along a channel reach, be it because of
an absence of suitable joint systems or a lack of stream power, another process will
become predominant (Fig. 5.6). Under present day climatic conditions, the channels on
the eastern Kimberley Plateau incise largely by hydraulic plucking. However, under drier
climatic conditions, as for example indicated in the region at times during the last glacial
maximum (Wende, et al., in press), a decrease in the frequency of large floods is likely.
Furthermore, if during the largest peak flows occurring under such a flow regime,
threshold velocities of erosion by hydraulic plucking are not reached, channel erosion
could become dominated by abrasion or corrosion, with total erosion rates likely to be
much lower than under present day conditions. Any past or future flow regimes with a
higher frequency of high magnitude floods, as may for example occur under the influence
of increased greenhouse gas concentrations in the atmosphere (cf. Morrasutti, 1992),
could be associated with increased rates of bedrock erosion. However, if erosion is not
transport but weathering limited, erosion rates are likely to be little effected.
5.5 S u m m a r y
The hydraulic forces acting on a joint block forming a part of the channel bed can
result in its erosion by hydraulic plucking. In the well-jointed sandstones of the study
area, this process of hydraulic plucking can be the dominant mechanism of incision along
channel reaches. Stepped transverse and longitudinal channel morphologies, which are
closely linked to strike and dip of the strata relative to the channel slope, are characteristic
for this process. Along dip and dip parallel channel reaches, the threshold of erosion is
largely controlled by the thickness of the rock slabs and the dip magnitude of the bedding
joints relative to the channel. Along many channel reaches in the study area and probably
elsewhere, infrequent high magnitude flows are the dominant channel forming events and
Hydraulic plucking and channel morphology 152
flows of moderate magnitude are neither directiy significant for the morphology of the
channels, nor for the rate of incision of the channels into bedrock.
Under different flow regimes, the frequency of large flood events which exceed the
threshold of erosion by hydraulic plucking is likely to be different, and this could not
only affect total erosion rates, but also the spatial and temporal pattern of the dominant
process of bedrock erosion. For the study area, it is reasonable to assume that climatic
changes caused variations in the flow regime of the rivers, and it seems to be likely that
the dominant processes of erosion and the actual rates of incision have varied
considerably with time.
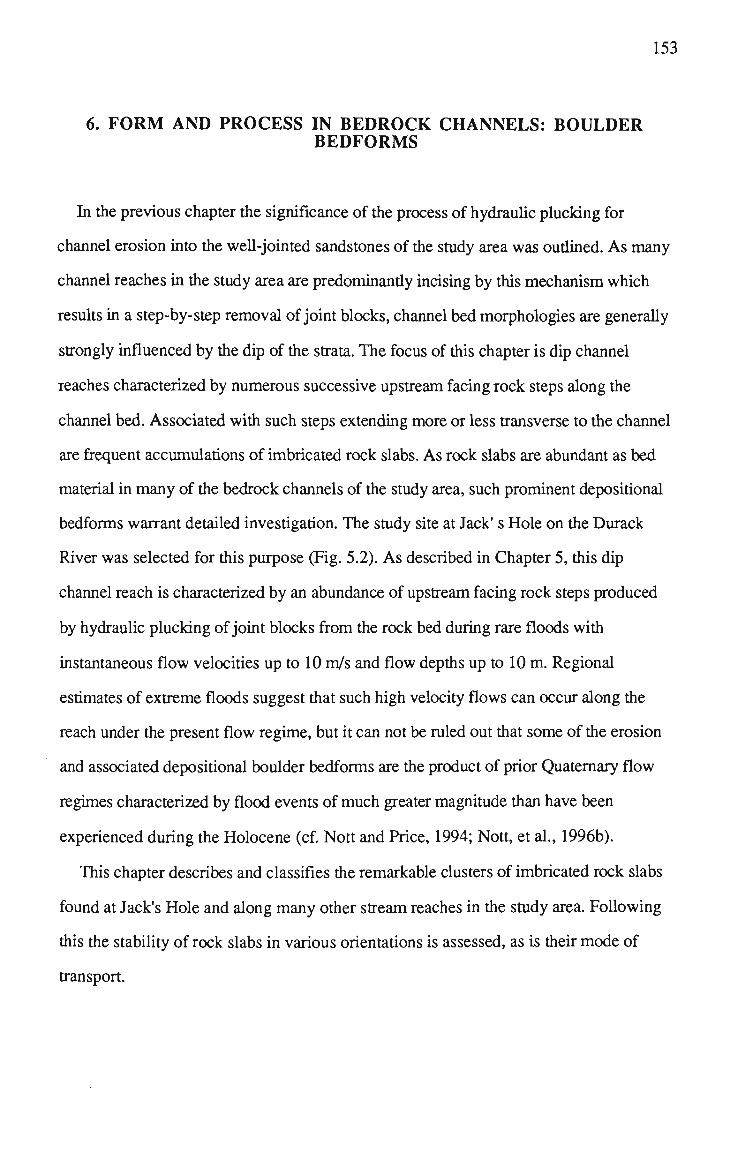
6. FORM AND PROCESS IN BEDROCK CHANNELS: BOULDER BEDFORMS
In the previous chapter the significance of the process of hydraulic plucking for
channel erosion into the well-jointed sandstones of the study area was outiined. A s many
channel reaches in the study area are predominandy incising by this mechanism which
results in a step-by-step removal of joint blocks, channel bed morphologies are generally
strongly influenced by the dip of the strata. The focus of this chapter is dip channel
reaches characterized by numerous successive upstream facing rock steps along the
channel bed. Associated with such steps extending more or less transverse to the channel
are frequent accumulations of imbricated rock slabs. A s rock slabs are abundant as bed
material in many of the bedrock channels of the study area, such prominent depositional
bedforms warrant detailed investigation. The study site at Jack' s Hole on the Durack
River was selected for this purpose (Fig. 5.2). As described in Chapter 5, this dip
channel reach is characterized by an abundance of upstream facing rock steps produced
by hydraulic plucking of joint blocks from the rock bed during rare floods with
instantaneous flow velocities up to 10 m/s and flow depths up to 10 m. Regional
estimates of extreme floods suggest that such high velocity flows can occur along the
reach under the present flow regime, but it can not be ruled out that some of the erosion
and associated depositional boulder bedforms are the product of prior Quaternary flow
regimes characterized by flood events of much greater magnitude than have been
experienced during the Holocene (cf. Nott and Price, 1994; Nott, et al., 1996b).
This chapter describes and classifies the remarkable clusters of imbricated rock slabs
found at Jack's Hole and along many other stream reaches in the study area. Following
this the stability of rock slabs in various orientations is assessed, as is their mode of
transport.
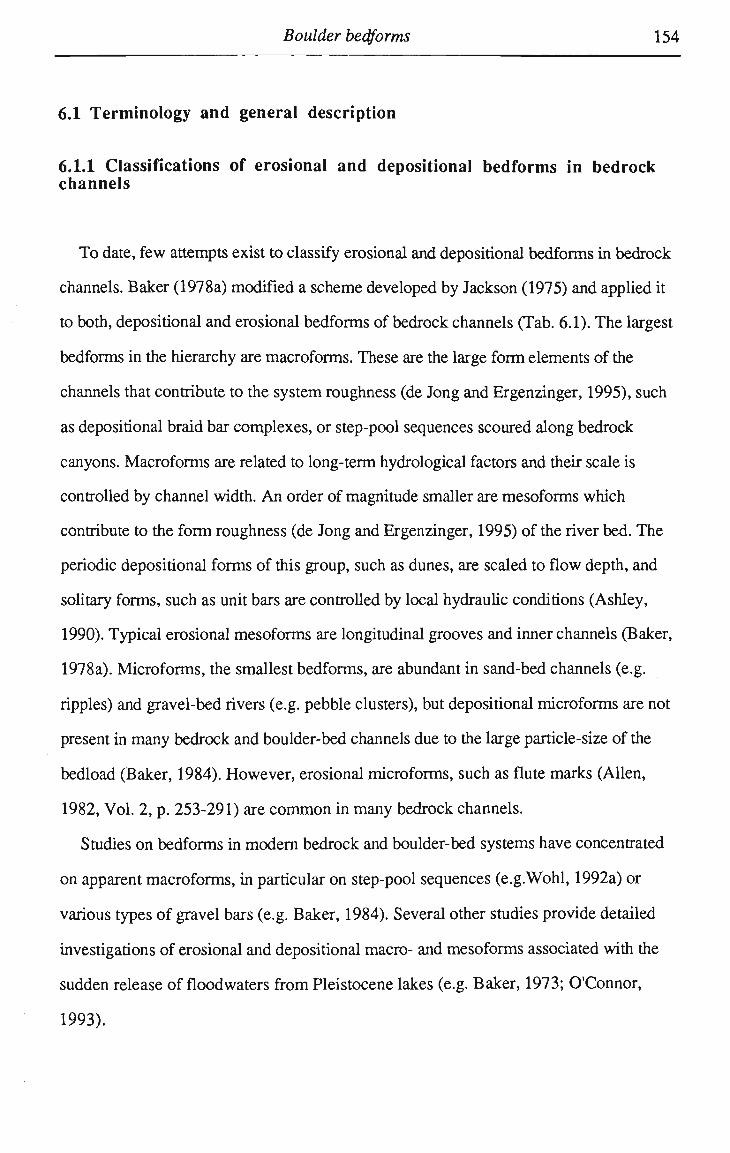
Boulder bedforms 154
6.1 Terminology and general description
6.1.1 Classifications of erosional and depositional bedforms in bedrock channels
To date, few attempts exist to classify erosional and depositional bedforms in bedrock
channels. Baker (1978a) modified a scheme developed by Jackson (1975) and applied it
to both, depositional and erosional bedforms of bedrock channels (Tab. 6.1). The largest
bedforms in the hierarchy are macroforms. These are the large form elements of the
channels that contribute to the system roughness (de Jong and Ergenzinger, 1995), such
as depositional braid bar complexes, or step-pool sequences scoured along bedrock
canyons. Macroforms are related to long-term hydrological factors and their scale is
controlled by channel width. A n order of magnitude smaller are mesoforms which
contribute to the form roughness (de Jong and Ergenzinger, 1995) of the river bed. The
periodic depositional forms of this group, such as dunes, are scaled to flow depth, and
solitary forms, such as unit bars are controlled by local hydraulic conditions (Ashley,
1990). Typical erosional mesoforms are longitudinal grooves and inner channels (Baker,
1978a). Microforms, the smallest bedforms, are abundant in sand-bed channels (e.g.
ripples) and gravel-bed rivers (e.g. pebble clusters), but depositional microforms are not
present in many bedrock and boulder-bed channels due to the large particle-size of the
bedload (Baker, 1984). However, erosional microforms, such as flute marks (Allen,
1982, Vol. 2, p. 253-291) are c o m m o n in many bedrock channels.
Studies on bedforms in m o d e m bedrock and boulder-bed systems have concentrated
on apparent macroforms, in particular on step-pool sequences (e.g.Wohl, 1992a) or
various types of gravel bars (e.g. Baker, 1984). Several other studies provide detailed
investigations of erosional and depositional macro- and mesoforms associated with the
sudden release of floodwaters from Pleistocene lakes (e.g. Baker, 1973; O'Connor,
1993).
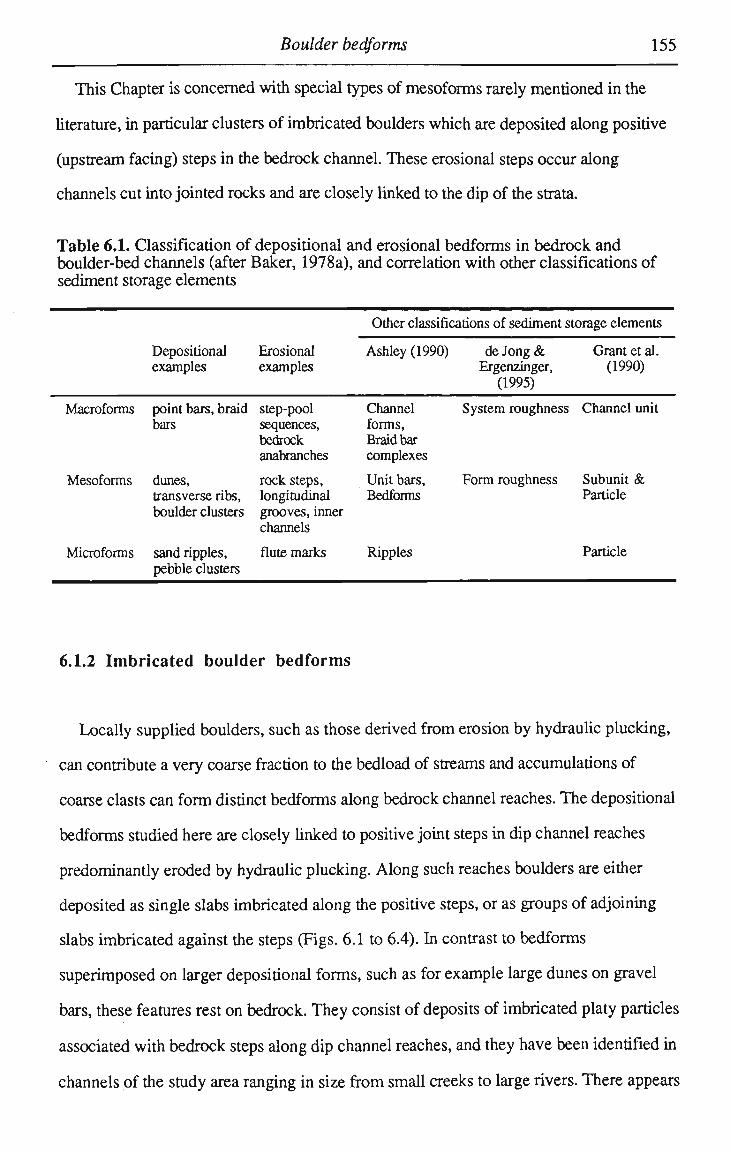
Boulder bedforms 155
This Chapter is concerned with special types of mesoforms rarely mentioned in the
literature, in particular clusters of imbricated boulders which are deposited along positive
(upstream facing) steps in the bedrock channel. These erosional steps occur along
channels cut into jointed rocks and are closely linked to the dip of the strata.
Table 6.1. Classification of depositional and erosional bedforms in bedrock and boulder-bed channels (after Baker, 1978a), and correlation with other classifications of sediment storage elements
Macroforms
Mesoforms
Microforms
Depositional examples
point bars, braid bars
dunes, transverse ribs, boulder clusters
sand ripples, pebble clusters
Erosional examples
step-pool sequences, bedrock anabranches
rock steps, longitudinal grooves, inner channels
flute marks
Other classifications of sediment storage elements
Ashley (1990)
Channel forms, Braid bar complexes
Unit bars, Bedforms
Ripples
de Jong & Ergenzinger,
(1995)
System roughness
Form roughness
Grant et al. (1990)
Channel unit
Subunit & Particle
Particle
6.1.2 Imbricated boulder bedforms
Locally supplied boulders, such as those derived from erosion by hydraulic plucking,
can contribute a very coarse fraction to the bedload of streams and accumulations of
coarse clasts can form distinct bedforms along bedrock channel reaches. The depositional
bedforms studied here are closely linked to positive joint steps in dip channel reaches
predominantly eroded by hydraulic plucking. Along such reaches boulders are either
deposited as single slabs imbricated along the positive steps, or as groups of adjoining
slabs imbricated against the steps (Figs. 6.1 to 6.4). In contrast to bedforms
superimposed on larger depositional forms, such as for example large dunes on gravel
bars, these features rest on bedrock. They consist of deposits of imbricated platy particles
associated with bedrock steps along dip channel reaches, and they have been identified in
channels of the study area ranging in size from small creeks to large rivers. There appears
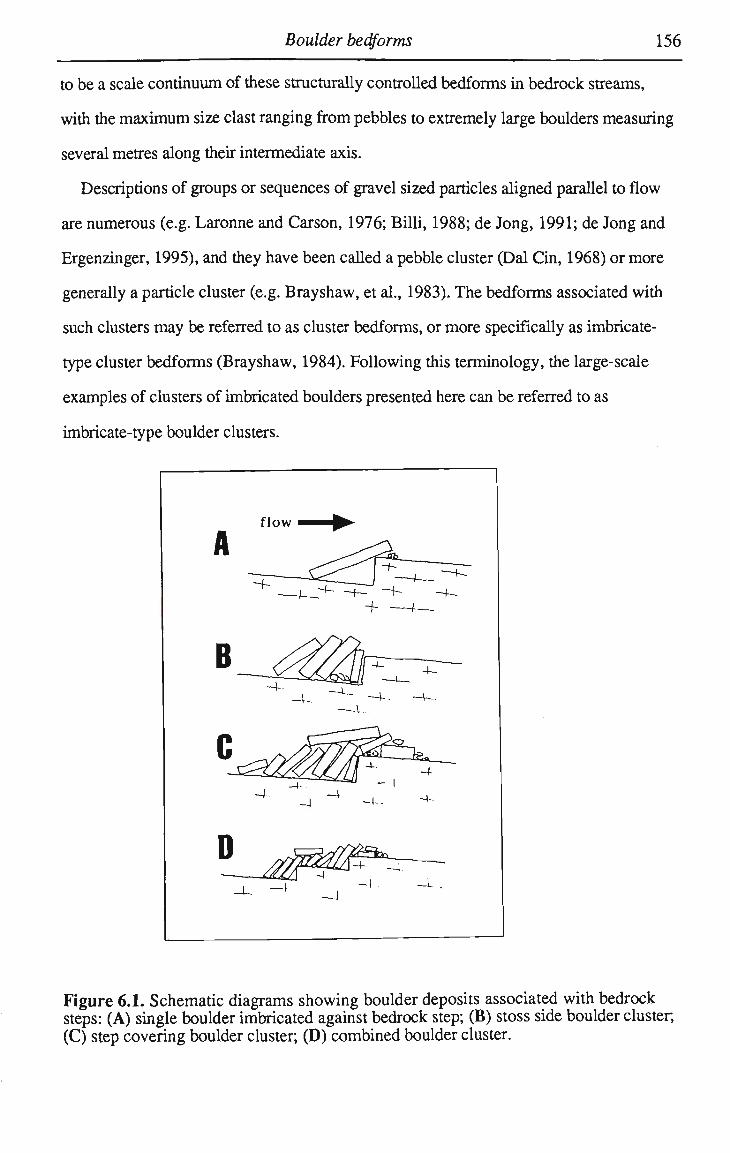
Boulder bedforms 156
to be a scale continuum of these structurally controlled bedforms in bedrock streams,
with the maximum size clast ranging from pebbles to extremely large boulders measuring
several metres along their intermediate axis.
Descriptions of groups or sequences of gravel sized particles aligned parallel to flow
are numerous (e.g. Laronne and Carson, 1976; Billi, 1988; de Jong, 1991; de Jong and
Ergenzinger, 1995), and they have been called a pebble cluster (Dal Cin, 1968) or more
generally a particle cluster (e.g. Brayshaw, et al., 1983). The bedforms associated with
such clusters may be referred to as cluster bedforms, or more specifically as imbricate-
type cluster bedforms (Brayshaw, 1984). Following this terminology, the large-scale
examples of clusters of imbricated boulders presented here can be referred to as
imbricate-type boulder clusters.
Figure 6.1. Schematic diagrams showing boulder deposits associated with bedrock steps: (A) single boulder imbricated against bedrock step; (B) stoss side boulder cluster, (C) step covering boulder cluster; (D) combined boulder cluster.
Boulder bedforms 157
Generalizing, a succession of three principle kinds of deposits associated with bedrock
steps have been identified in channels of various sizes : (1) Single clasts are imbricated
against positive steps in the bedrock channel, although several such clasts m a y be aligned
along the step (Figs. 6.1 A, 6.2, 5.11). (2) Subsequent accumulation of clasts on the
stoss side of the step leads to the development of contact type of imbrication (Johansson,
1976) in the form of an imbricated stoss side boulder cluster (Figs. 6. IB, 6.3). The
downstream end of these clusters is generally the bedrock step, but where the first clast
located upstream of the bedrock step projects downstream beyond the step, minor
deposits of finer grained material are often found in the lee of this clast (3) The third
principle kind of accumulation is a large step covering boulder cluster which extends
upstream and downstream of this step, obscuring its position (Figs. 6.1C, 6.4). Along a
succession of bedrock steps, stoss side or step covering clusters can extend far upstream
such that they link up with other boulder clusters to form combined boulder clusters
(Fig. 6. ID).
T o describe the geometry of cluster bedforms, Brayshaw (1984) distinguished
between stoss side, obstacle clasts, and the wake, or lee side of the cluster. H e found that
the relative length of stoss to lee side is largely dependant on the shape characteristics of
the sediment. Where imbrication occurs, long trains of clasts can form on the stoss side
of an initial obstacle, which is not necessarily the largest particle in the cluster. For
structurally influenced clusters, the positive step in the channel represents the obstacle
that initiated deposition. In general with gravel clusters, stoss side accumulations grow
by deposition on the upstream side while lee side deposits grow in a downstream
direction. M a n y boulder clusters consist only of stoss side accumulation. However,
minor deposits of much smaller calibre are generally found in the lee of individual large
clasts forming a train of imbricated boulders. Step covering clusters exhibit a lee side, but
the lee deposits frequently form only a minor part of the whole cluster. Generally they are
just a short tail deposit of small boulders, gravel and sand downstream of the last large
boulder. In combined boulder clusters, however, it is difficult to define a lee side since a
potential initial obstacle can often not be clearly identified. They can, in fact, form
Boulder bedforms 158
elongated deposits (longitudinal boulder bars) that resemble in shape central bars typically
found in braided rivers carrying a coarse bedload.
The planform of stoss side and step covering boulder clusters is often closely linked to
the planform of bedrock steps along which they are deposited. A regular pattern of
bedrock steps can result in an even partem of cluster bedforms. As mentioned previously
however, bedrock steps in natural channels often have a complex pattern and the
planforms of boulder clusters that mimic those steps are therefore also highly variable.
6.2 Field characteristics of giant boulder bedforms along the Durack River
Along the dip channel reach at Jack's Hole on the Durack River (Fig. 6.5), large
hydraulically plucked rock slabs showing contact type imbrication are frequently
deposited on the stoss side of upstream facing steps (Figs. 6.3, 6.4). They represent an
extremely coarse fraction of the bedload along the channel reach. The shape of most of
these boulders is very platy to very bladed (cf. Sneed and Folk, 1958) which is largely
the result of the joint spacing in the local source rock (Tab. 6.2). The large boulders have
on average a long axis of more than 4 m and exceptional clasts are nearly 13 m long.
Alignment of individual clasts forming the imbricate type boulder clusters is
predominantly with the long axis transverse and the intermediate axis parallel to flow;
only about ten percent of the large clasts are aligned with the long axis parallel to flow.
Figure 6.2. (Overleaf) Single boulder imbricated against positive bedrock step. Note the likely origin of this rock slab in the foreground.
Figure 6.3. (Overleaf) Stoss side cluster. Note the absence of lee deposits. The bedrock step has a height of about 1 m.
Figure 6.4. (Overleaf) Step covering cluster. The cluster has a total length of 18 m and a height of 2.5 m . The bedrock step with a height of about 1 m is completely covered. The accumulation of boulders on the stoss side of the step is 6.5 m long. Downstream of the step, the cluster can be subdivided into a stoss and wake deposit separated by an obstacle clast (3.1 x 1.5 x 0.7 m ) . The wake side is 4.5 m long, while the stoss side is 6 m long and links up with the accumulations upstream of the step.
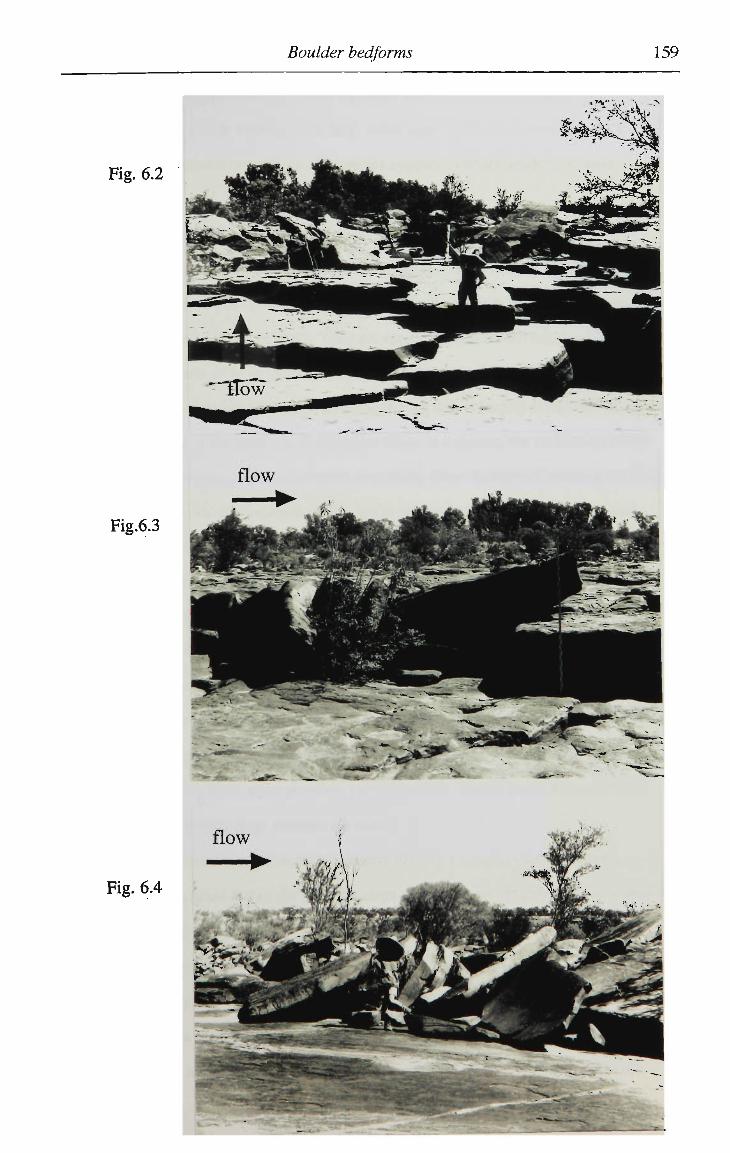
Boulder bedforms 159
Fig. 6.2
flow
Fig.6.3
Fig. 6.4
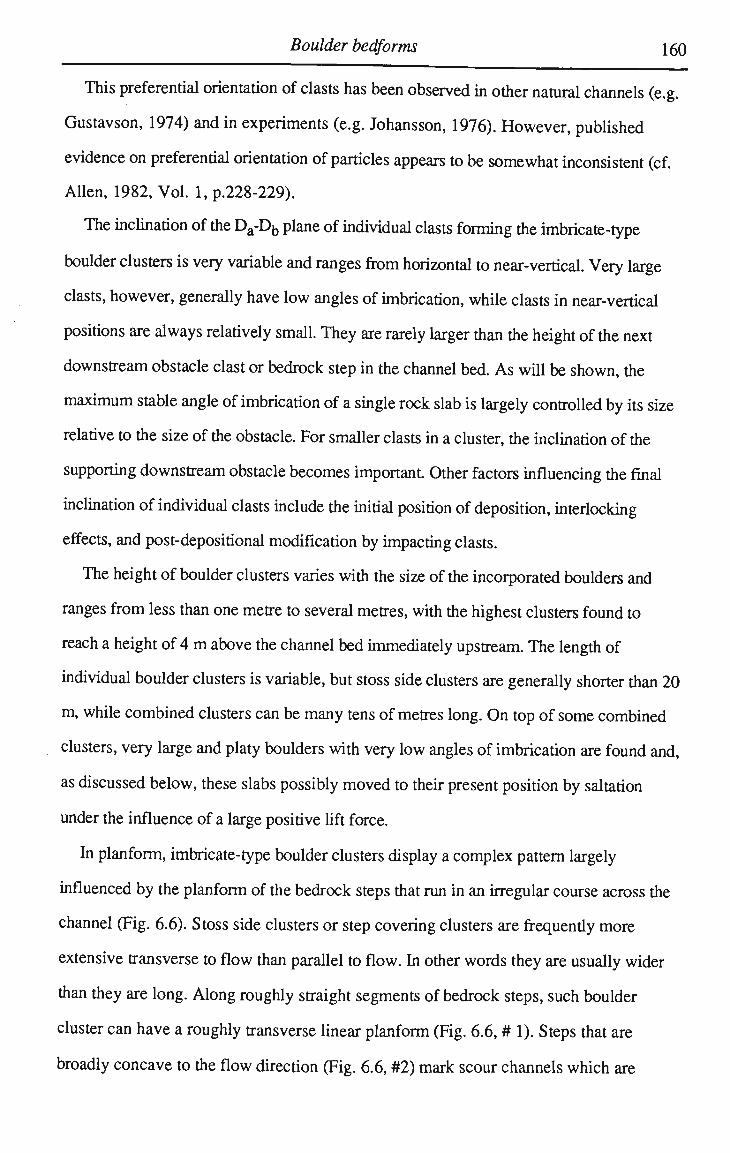
Boulder bedforms 160
This preferential orientation of clasts has been observed in other natural channels (e.g.
Gustavson, 1974) and in experiments (e.g. Johansson, 1976). However, published
evidence on preferential orientation of particles appears to be somewhat inconsistent (cf.
Allen, 1982, Vol. 1, p.228-229).
The inclination of the D a - D b plane of individual clasts forming the imbricate-type
boulder clusters is very variable and ranges from horizontal to near-vertical. Very large
clasts, however, generally have low angles of imbrication, while clasts in near-vertical
positions are always relatively small. They are rarely larger than the height of the next
downstream obstacle clast or bedrock step in the channel bed. As will be shown, the
maximum stable angle of imbrication of a single rock slab is largely controlled by its size
relative to the size of the obstacle. For smaller clasts in a cluster, the inclination of the
supporting downstream obstacle becomes important Other factors influencing the final
inclination of individual clasts include the initial position of deposition, interlocking
effects, and post-depositional modification by impacting clasts.
The height of boulder clusters varies with the size of the incorporated boulders and
ranges from less than one metre to several metres, with the highest clusters found to
reach a height of 4 m above the channel bed immediately upstream. The length of
individual boulder clusters is variable, but stoss side clusters are generally shorter than 20
m, while combined clusters can be many tens of metres long. O n top of some combined
clusters, very large and platy boulders with very low angles of imbrication are found and,
as discussed below, these slabs possibly moved to their present position by saltation
under the influence of a large positive lift force.
In planform, imbricate-type boulder clusters display a complex pattern largely
influenced by the planform of the bedrock steps that run in an irregular course across the
channel (Fig. 6.6). Stoss side clusters or step covering clusters are frequendy more
extensive transverse to flow than parallel to flow. In other words they are usually wider
than they are long. Along roughly straight segments of bedrock steps, such boulder
cluster can have a roughly transverse linear planform (Fig. 6.6, # 1). Steps that are
broadly concave to the flow direction (Fig. 6.6, #2) mark scour channels which are
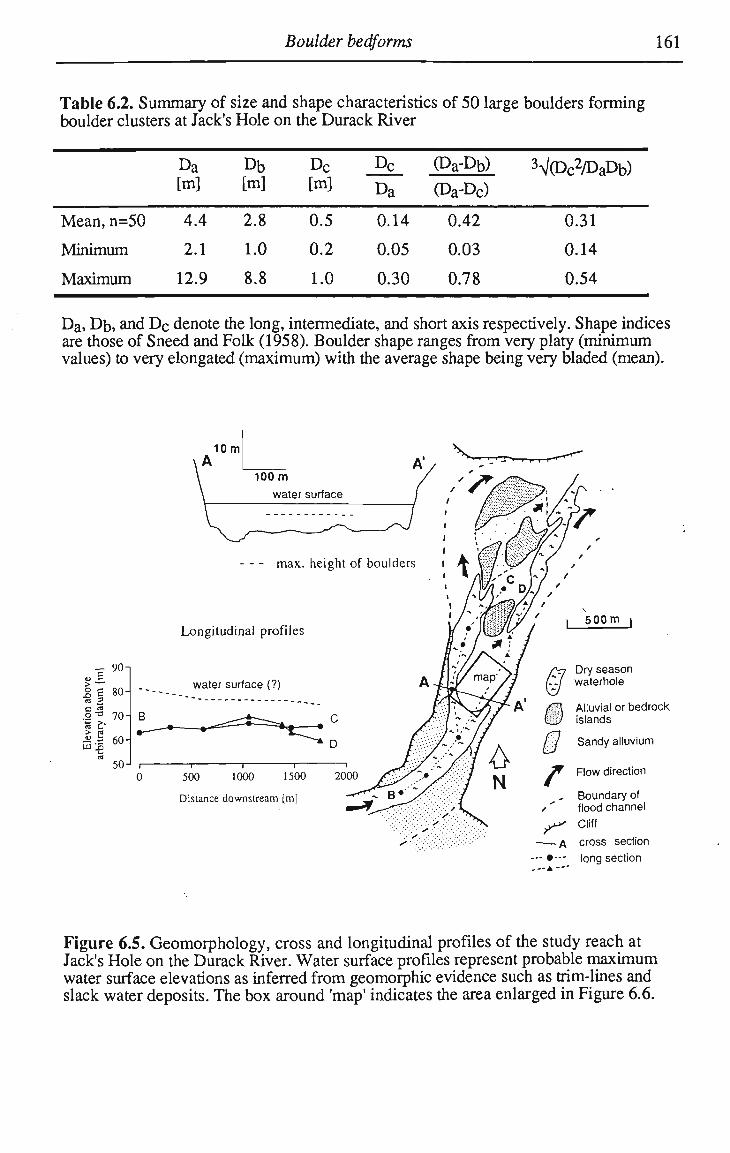
Boulder bedforms 161
Table 6.2. Summary of size and shape characteristics of 50 large boulders forming boulder clusters at Jack's Hole on the Durack River
Mean, n=50
Minimum
Maximum
D a
[m]
4.4
2.1
12.9
Db [m]
2.8
1.0
8.8
D c
[m]
0.5
0.2
1.0
Dc
D a
0.14
0.05
0.30
(Da-Db)
(Da-Dc)
0.42
0.03
0.78
3V(Dc2/DaDb)
0.31
0.14
0.54
Da, Db, and D c denote the long, intermediate, and short axis respectively. Shape indices are those of Sneed and Folk (1958). Boulder shape ranges from very platy (minimum values) to very elongated (maximum) with the average shape being very bladed (mean).
1 £ 80-« s e n .2"0 70H « fr > cd
jS.S 60-to x>
a 50J r
10m
100 m
water surface
max. height of boulders I *Y %j V.
Longitudinal profiles
water surface (?)
500 1000 1500
Distance downstream [m]
2000
I 5 0 0 m |
Dry season waterhole
Alluvial or bedrock islands
Sandy alluvium
Flow direction
Boundary of flood channel
•^ Cliff
- — A cross section
• •-- long section -A
Figure 6.5. Geomorphology, cross and longitudinal profiles of the study reach at Jack's Hole on the Durack River. Water surface profiles represent probable maximum water surface elevations as inferred from geomorphie evidence such as trim-lines and slack water deposits. The box around 'map' indicates the area enlarged in Figure 6.6.
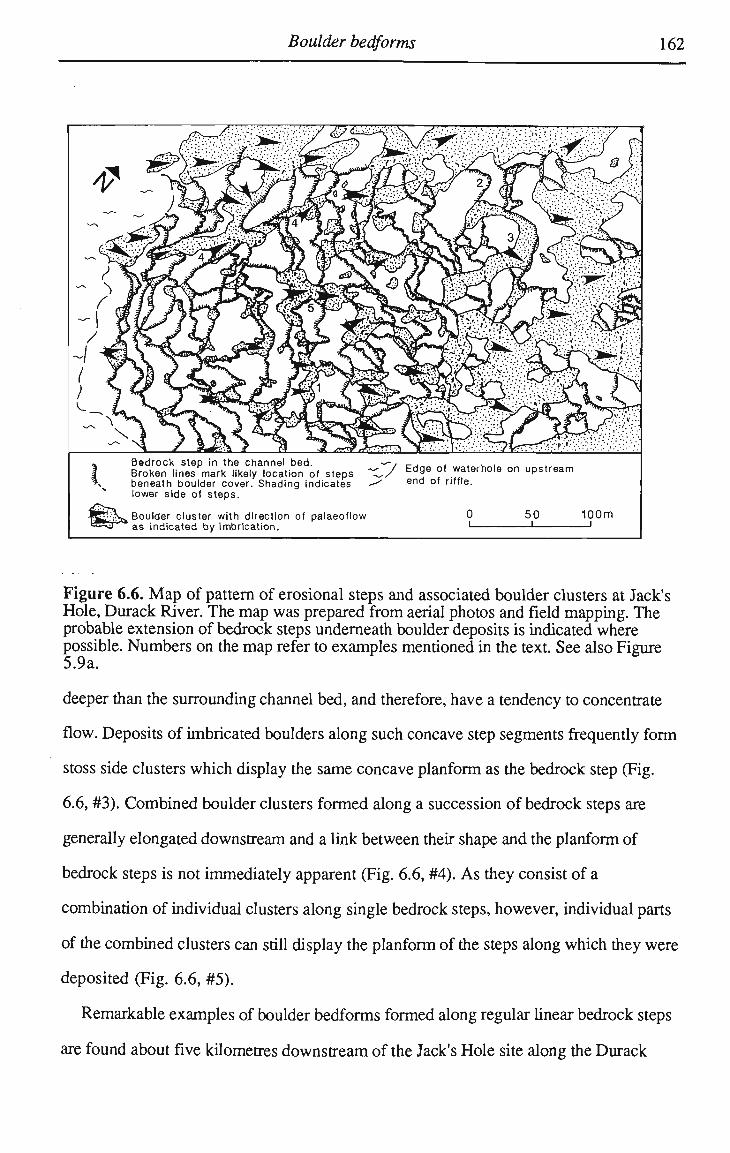
Boulder bedforms 162
Figure 6.6. M a p of pattern of erosional steps and associated boulder clusters at Jack's Hole, Durack River. The map was prepared from aerial photos and field mapping. The probable extension of bedrock steps underneath boulder deposits is indicated where possible. Numbers on the map refer to examples mentioned in the text See also Figure 5.9 a.
deeper than the surrounding channel bed, and therefore, have a tendency to concentrate
flow. Deposits of imbricated boulders along such concave step segments frequendy form
stoss side clusters which display the same concave planform as the bedrock step (Fig.
6.6, #3). Combined boulder clusters formed along a succession of bedrock steps are
generally elongated downstream and a link between their shape and the planform of
bedrock steps is not immediately apparent (Fig. 6.6, #4). As they consist of a
combination of individual clusters along single bedrock steps, however, individual parts
of the combined clusters can still display the planform of the steps along which they were
deposited (Fig. 6.6, #5).
Remarkable examples of boulder bedforms formed along regular linear bedrock steps
are found about five kilometres downstream of the Jack's Hole site along the Durack
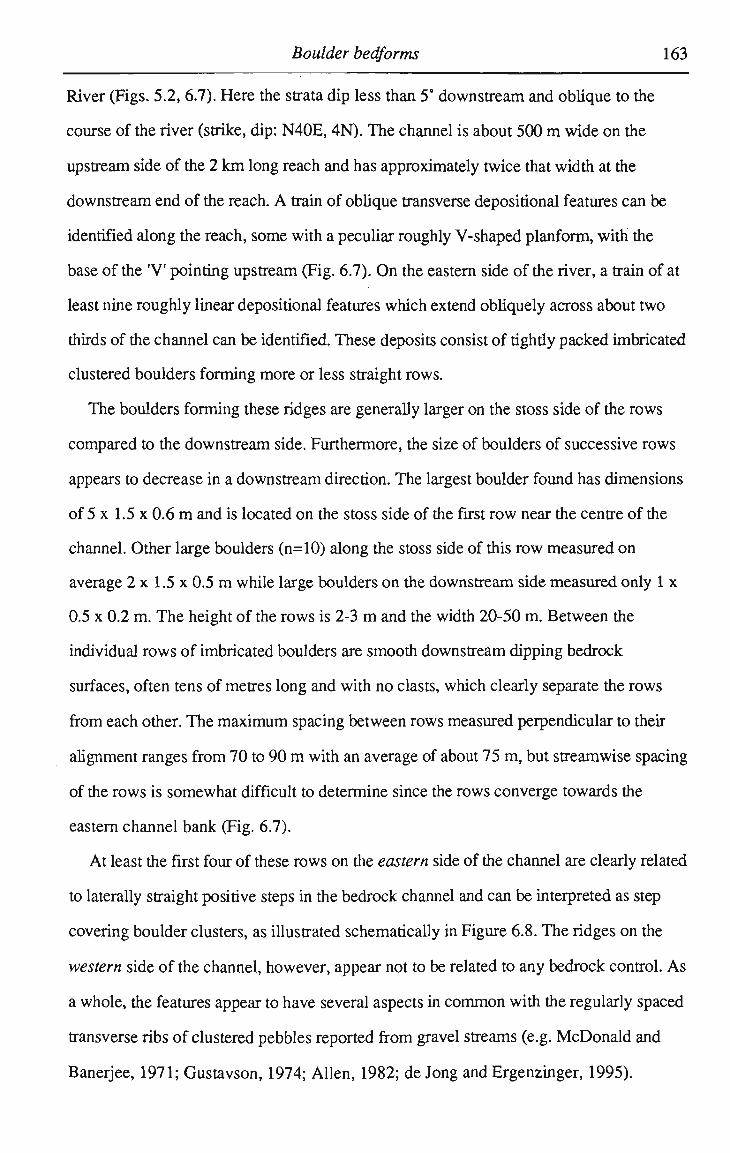
Boulder bedforms 163
River (Figs. 5.2,6.7). Here the strata dip less than 5° downstream and oblique to the
course of the river (strike, dip: N40E, 4N). The channel is about 500 m wide on the
upstream side of the 2 k m long reach and has approximately twice that width at the
downstream end of the reach. A train of oblique transverse depositional features can be
identified along the reach, some with a peculiar roughly V-shaped planform, with the
base of the 'V pointing upstream (Fig. 6.7). O n the eastern side of the river, a train of at
least nine roughly linear depositional features which extend obliquely across about two
thirds of the channel can be identified. These deposits consist of tighdy packed imbricated
clustered boulders forming more or less straight rows.
The boulders forming these ridges are generally larger on the stoss side of the rows
compared to the downstream side. Furthermore, the size of boulders of successive rows
appears to decrease in a downstream direction. The largest boulder found has dimensions
of5x 1.5x0.6m and is located on the stoss side of the first row near the centre of the
channel. Other large boulders (n=10) along the stoss side of this row measured on
average 2 x 1.5 x 0.5 m while large boulders on the downstream side measured only 1 x
0.5 x 0.2 m. The height of the rows is 2-3 m and the width 20-50 m. Between the
individual rows of imbricated boulders are smooth downstream dipping bedrock
surfaces, often tens of metres long and with no clasts, which clearly separate the rows
from each other. The maximum spacing between rows measured perpendicular to their
alignment ranges from 70 to 90 m with an average of about 75 m, but streamwise spacing
of the rows is somewhat difficult to determine since the rows converge towards the
eastern channel bank (Fig. 6.7).
At least the first four of these rows on the eastern side of the channel are clearly related
to laterally straight positive steps in the bedrock channel and can be interpreted as step
covering boulder clusters, as illustrated schematically in Figure 6.8. The ridges on the
western side of the channel, however, appear not to be related to any bedrock control. As
a whole, the features appear to have several aspects in common with the regularly spaced
transverse ribs of clustered pebbles reported from gravel streams (e.g. McDonald and
Banerjee, 1971; Gustavson, 1974; Allen, 1982; de Jong and Ergenzinger, 1995).
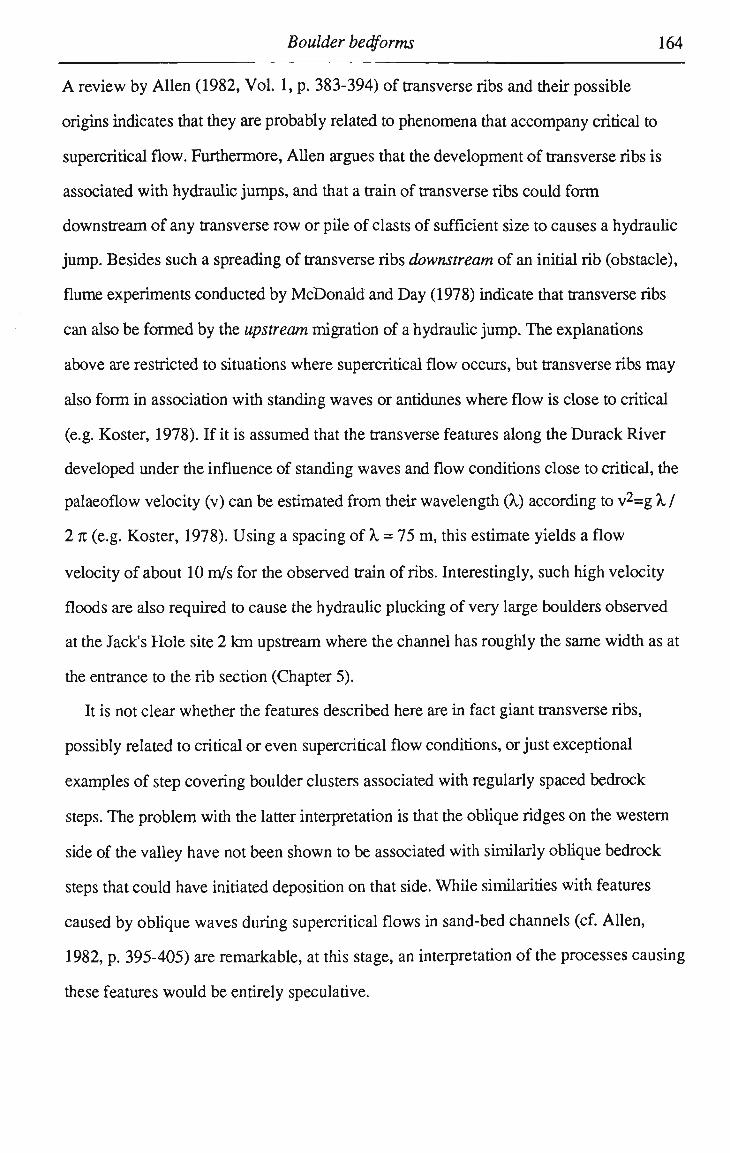
Boulder bedforms 164
A review by Allen (1982, Vol. 1, p. 383-394) of transverse ribs and their possible
origins indicates that they are probably related to phenomena that accompany critical to
supercritical flow. Furthermore, Allen argues that the development of transverse ribs is
associated with hydraulic jumps, and that a train of transverse ribs could form
downstream of any transverse row or pile of clasts of sufficient size to causes a hydraulic
jump. Besides such a spreading of transverse ribs downstream of an initial rib (obstacle),
flume experiments conducted by McDonald and Day (1978) indicate that transverse ribs
can also be formed by the upstream migration of a hydraulic jump. The explanations
above are restricted to situations where supercritical flow occurs, but transverse ribs may
also form in association with standing waves or antidunes where flow is close to critical
(e.g. Koster, 1978). If it is assumed that the transverse features along the Durack River
developed under the influence of standing waves and flow conditions close to critical, the
palaeoflow velocity (v) can be estimated from their wavelength (X) according to v2=g X. /
2 n (e.g. Koster, 1978). Using a spacing of X = 75 m , this estimate yields a flow
velocity of about 10 m/s for the observed train of ribs. Interestingly, such high velocity
floods are also required to cause the hydraulic plucking of very large boulders observed
at the Jack's Hole site 2 k m upstream where the channel has roughly the same width as at
the entrance to the rib section (Chapter 5).
It is not clear whether the features described here are in fact giant transverse ribs,
possibly related to critical or even supercritical flow conditions, or just exceptional
examples of step covering boulder clusters associated with regularly spaced bedrock
steps. The problem with the latter interpretation is that the oblique ridges on the western
side of the valley have not been shown to be associated with similarly oblique bedrock
steps that could have initiated deposition on that side. While similarities with features
caused by oblique waves during supercritical flows in sand-bed channels (cf. Allen,
1982, p. 395-405) are remarkable, at this stage, an interpretation of the processes causing
these features would be entirely speculative.

Boulder bedforms 165
Figure 6.7. Oblique aerial photo showing trains of step covering boulder clusters along oblique linear steps (darker stripes) separated by smooth bedrock surfaces free of any sediment (lighter patches). The very dark areas are bodies of standing water present at the time of the photograph during the dry season.
Figure 6.8. Schematic diagram of rows of step covering boulder clusters formed along linear steps on the eastern side of the channel.
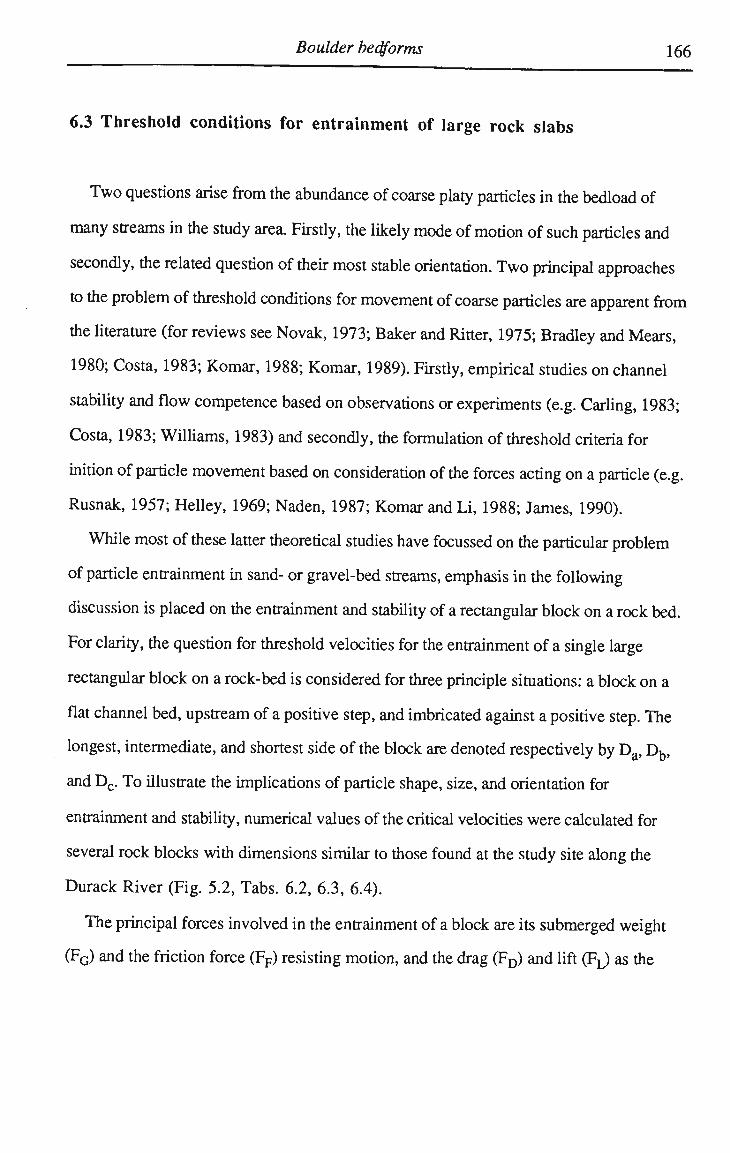
Boulder bedforms 166
6.3 Threshold conditions for entrainment of large rock slabs
Two questions arise from the abundance of coarse platy particles in the bedload of
many streams in the study area. Firstly, the likely mode of motion of such particles and
secondly, the related question of their most stable orientation. T w o principal approaches
to the problem of threshold conditions for movement of coarse particles are apparent from
the literature (for reviews see Novak, 1973; Baker and Ritter, 1975; Bradley and Mears,
1980; Costa, 1983; Komar, 1988; Komar, 1989). Firsdy, empirical studies on channel
stability and flow competence based on observations or experiments (e.g. Carling, 1983;
Costa, 1983; Williams, 1983) and secondly, the formulation of threshold criteria for
inition of particle movement based on consideration of the forces acting on a particle (e.g.
Rusnak, 1957; Helley, 1969; Naden, 1987; Komar and Li, 1988; James, 1990).
While most of these latter theoretical studies have focussed on the particular problem
of particle entrainment in sand- or gravel-bed streams, emphasis in the following
discussion is placed on the entrainment and stability of a rectangular block on a rock bed.
For clarity, the question for threshold velocities for the entrainment of a single large
rectangular block on a rock-bed is considered for three principle situations: a block on a
flat channel bed, upstream of a positive step, and imbricated against a positive step. The
longest, intermediate, and shortest side of the block are denoted respectively by Da, Db,
and Dc. To illustrate the implications of particle shape, size, and orientation for
entrainment and stability, numerical values of the critical velocities were calculated for
several rock blocks with dimensions similar to those found at the study site along the
Durack River (Fig. 5.2, Tabs. 6.2, 6.3, 6.4).
The principal forces involved in the entrainment of a block are its submerged weight
(FG) and the friction force (FF) resisting motion, and the drag (FD) and lift (Fj) as the
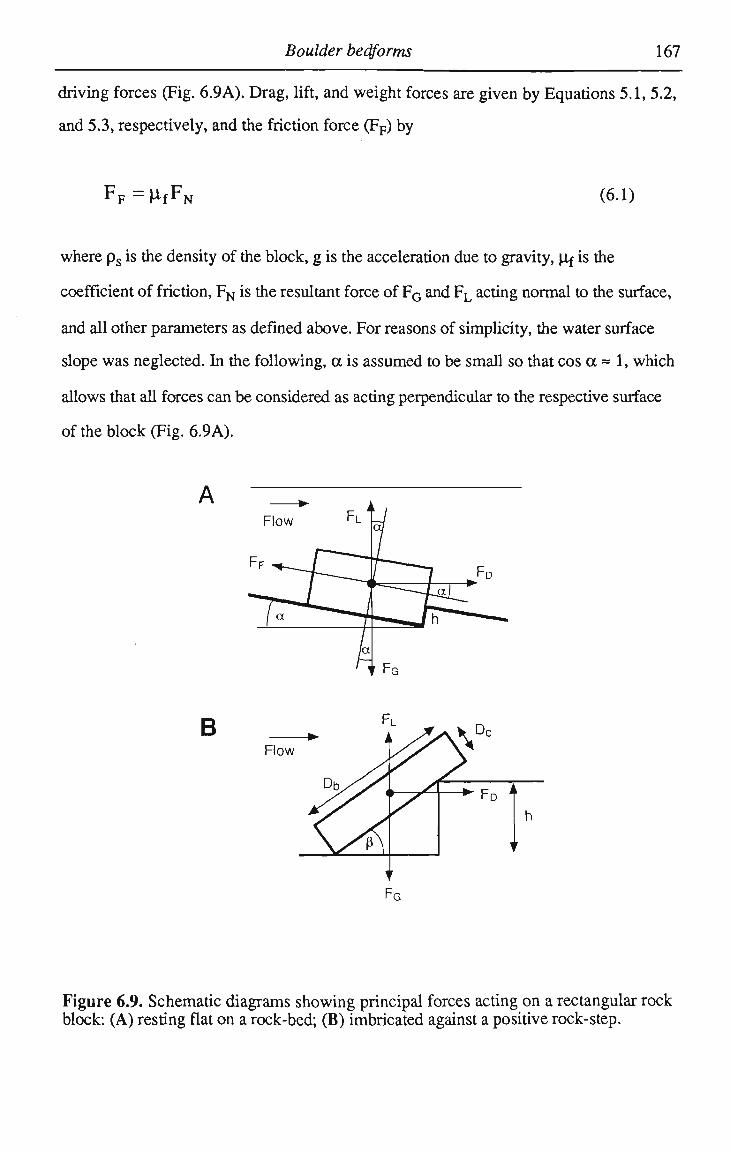
Boulder bedforms 167
driving forces (Fig. 6.9A). Drag, lift, and weight forces are given by Equations 5.1,5.2,
and 5.3, respectively, and the friction force (FF) by
FF=HfFN (6.1)
where ps is the density of the block, g is the acceleration due to gravity, Uf is the
coefficient of friction, F N is the resultant force of F G and F L acting normal to the surface,
and all other parameters as defined above. For reasons of simplicity, the water surface
slope was neglected. In the following, a is assumed to be small so that cos a * 1, which
allows that all forces can be considered as acting perpendicular to the respective surface
of the block (Fig. 6.9A).
Figure 6.9. Schematic diagrams showing principal forces acting on a rectangular rock block: (A) resting flat on a rock-bed; (B) imbricated against a positive rock-step.
Boulder bedforms 168
For the coefficient of static friction Of in Equation (6.1) of a platy rock on a flat rock
bed Carling (1995) and Carling and Grodek (1994) used p.f=0.9, while Bradley and
Mears (1980) as well as Allen (1942) suggested a value of 0.6. The higher value appears
to be preferable, especially considering the likelihood that even on a smooth bed some
minor interlocking can occur due to the surface roughness of the block and the channel
bed.
The drag coefficient C D (Eq. 5.1) for a rectangular block subject to flows of high
Reynolds numbers (RolO 6 ) varies with the shape of the block and its orientation. Platy
to compact rock blocks characteristically have values between 1.0 and 1.2 QHoerner,
1965; Engineering Sciences Data, 1976), the latter value being used for platy rock blocks
in this study and elsewhere (e.g. Carling and Grodek, 1994).
Somewhat more problematic is the question for the appropriate empirically determined
lift coefficient C L (Eq. 5.2). As with drag, lift depends, under given flow conditions, on
shape and orientation of the rock block. Table 5.1 gives some information on likely lift
coefficients for rectangular blocks which are part of the channel bed. Litde is known
about the appropriate lift coefficients for the situation of a platy block resting on a flat
rock bed. In view of the absence of experimental data for this case, however, a
reasonable assumption may be to use the lift coefficients determined by Renius (1986) for
the similar case of flow parallel to the surface of a jointed rock mass (Tab. 5.1) (cf.
Carling and Grodek, 1994; Carling, 1995).
Of importance, especially for the mode of motion of the rock blocks (sliding, pivoting,
or saltation), is the location of the centre of pressure, or point of attack, of drag and lift
relative to the centre of gravity of the block. However, for reasons of simplicity, in this
study lift and drag are assumed to act at the centre of the block (cf. Komar and Li, 1988).
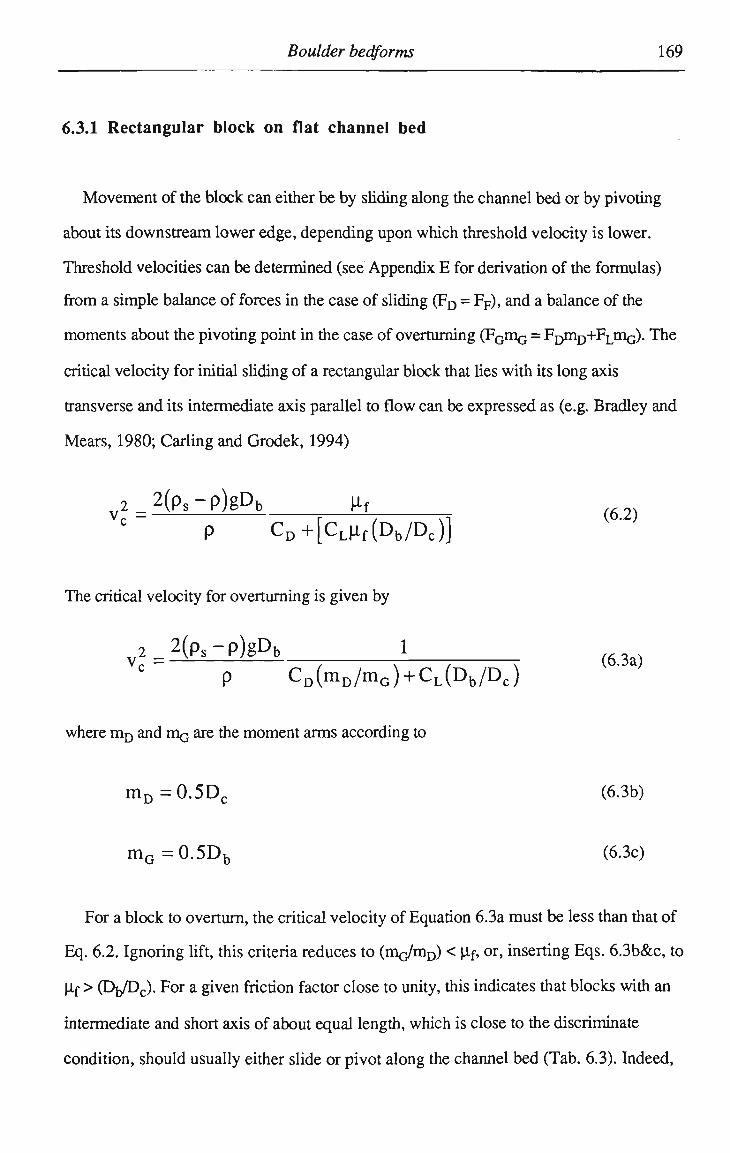
Boulder bedforms 169
6.3.1 Rectangular block on flat channel bed
Movement of the block can either be by sliding along the channel bed or by pivoting
about its downstream lower edge, depending upon which threshold velocity is lower.
Threshold velocities can be determined (see Appendix E for derivation of the formulas)
from a simple balance of forces in the case of sliding (FD = FF), and a balance of the
moments about the pivoting point in the case of overturning (FQHIQ = Frjmrj+FLmQ). The
critical velocity for initial sliding of a rectangular block that lies with its long axis
transverse and its intermediate axis parallel to flow can be expressed as (e.g. Bradley and
Mears, 1980; Carling and Grodek, 1994)
y2 = 2(ps ~ P)gD b \±f (62)
p C D + [ C L j a f ( D b / D c ) ]
The critical velocity for overturning is given by
v 2 = 2(Ps-p)gDb 1 p C D ( m D / m G ) + CL(Db/Dc)
where m D and % are the moment arms according to
mD=0.5Dc (6.3b)
mG=0.5Db (6.3c)
For a block to overturn, the critical velocity of Equation 6.3a must be less than that of
Eq. 6.2. Ignoring lift, this criteria reduces to (mo/mo) < flf, or, inserting Eqs. 6.3b&c, to
|if > (Df/D,,). For a given friction factor close to unity, this indicates that blocks with an
intermediate and short axis of about equal length, which is close to the discriminate
condition, should usually either slide or pivot along the channel bed (Tab. 6.3). Indeed,
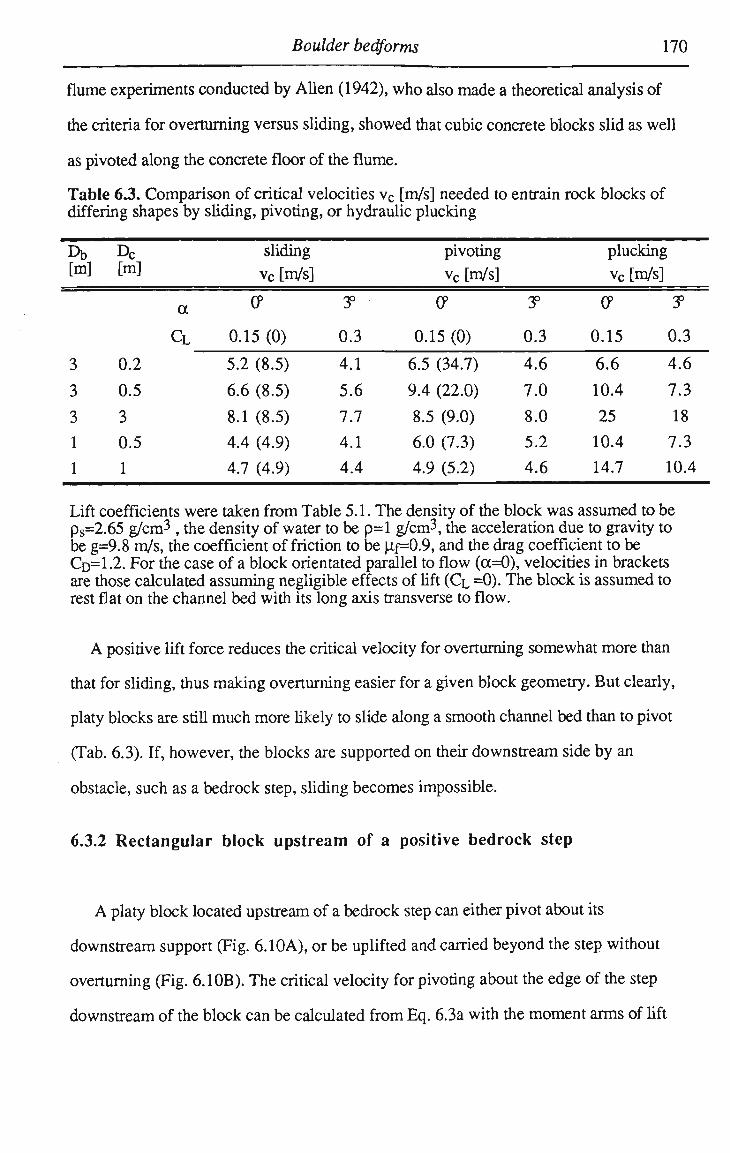
Boulder bedforms 170
flume experiments conducted by Allen (1942), who also made a theoretical analysis of
the criteria for overturning versus sliding, showed that cubic concrete blocks slid as well
as pivoted along the concrete floor of the flume.
Table 6.3. Comparison of critical velocities vc [m/s] needed to entrain rock blocks of differing shapes by sliding, pivoting, or hydraulic plucking
Db D c sliding pivoting plucking
M M vc[m/s] vc[m/s] vc [m/s]
0.2
0.5
3
0.5
1
a
C L
CP
0.15 (0)
5.2 (8.5)
6.6 (8.5)
8.1 (8.5)
4.4 (4.9)
4.7 (4.9)
y
0.3
4.1
5.6
7.7
4.1
4.4
CP
0.15 (0)
6.5 (34.7)
9.4 (22.0)
8.5 (9.0)
6.0 (7.3)
4.9 (5.2)
y
0.3
4.6
7.0
8.0
5.2
4.6
CP
0.15
6.6
10.4
25
10.4
14.7
y
0.3
4.6
7.3
18
7.3
10.4
Lift coefficients were taken from Table 5.1. The density of the block was assumed to be ps=2.65 g/cm
3 , the density of water to be p=l g/cm3, die acceleration due to gravity to be g=9.8 m/s, the coefficient of friction to be u.f=0.9, and the drag coefficient to be C D = 1 . 2 . For the case of a block orientated parallel to flow (ct=0), velocities in brackets are those calculated assuming negligible effects of lift (Q, =0). The block is assumed to rest flat on the channel bed with its long axis transverse to flow.
A positive lift force reduces the critical velocity for overturning somewhat more than
that for sliding, thus making overturning easier for a given block geometry. But clearly,
platy blocks are still much more likely to slide along a smooth channel bed than to pivot
(Tab. 6.3). If, however, the blocks are supported on their downstream side by an
obstacle, such as a bedrock step, sliding becomes impossible.
6.3.2 Rectangular block upstream of a positive bedrock step
A platy block located upstream of a bedrock step can either pivot about its
downstream support (Fig. 6.10A), or be uplifted and carried beyond the step without
overturning (Fig. 6.10B). The critical velocity for pivoting about the edge of the step
downstream of the block can be calculated from Eq. 6.3a with the moment arms of lift

Boulder bedforms 171
and weight remaining the same as given in Eq. 6.3c, and that for the drag modified to
include the step height h to become
mD=0.5Dc-h (6.3d)
If the step is higher than the level of the line of attack of the drag force (h > 0.5DC), the
block can not pivot under the sole influence of the drag force. In this situation, the block
can only be entrained if the lift force exceeds the submerged weight of the particle. The
critical entrainment velocity then becomes that of hydraulic plucking which can be
obtained from a balance of the vertical forces (FL=FG) with friction along the vertical
joints considered negligible. This is equivalent to ignoring drag (CD=0) in Equation 6.3a,
which then reduces to Equation 5.4. As mentioned, the critical velocity of plucking is
proportional to the square-root of the thickness of the block, while the long and
intermediate axes of the block only affect the shape dependant lift coefficient
For small step heights h, the critical velocity of pivoting is only litde higher than that
for pivoting on a plane bed and for compact blocks it remains well below the critical
velocities of plucking (Tabs. 6.3, 6.4). For very platy blocks, however, plucking may
not require much higher velocities than are needed for pivoting (Tabs. 6.3, 6.4),
indicating the possibility of entrainment without overturning of these blocks.
Table 6.4. Critical velocities vc [m/s] needed to entrain a block of differing shape by pivoting from a position ahead of a low rock-step with height h
D b [ m ]
3 3 3 3 1 1
D c [ m ]
0.2 0.5 1 3 0.5 1
h[m]
0.05 0.2 0.2 0.2 0.2 0.2
vc [m/s]
4.6 7.3 9.2 8.5 6.7 5.6
The lift coefficient was assumed to be 0 = 0 . 3 which corresponds to a dip angle of about a=3°. All other constants as noted in Table 6.3. The block is assumed to rest flat on the channel bed with its long axis transverse to flow.
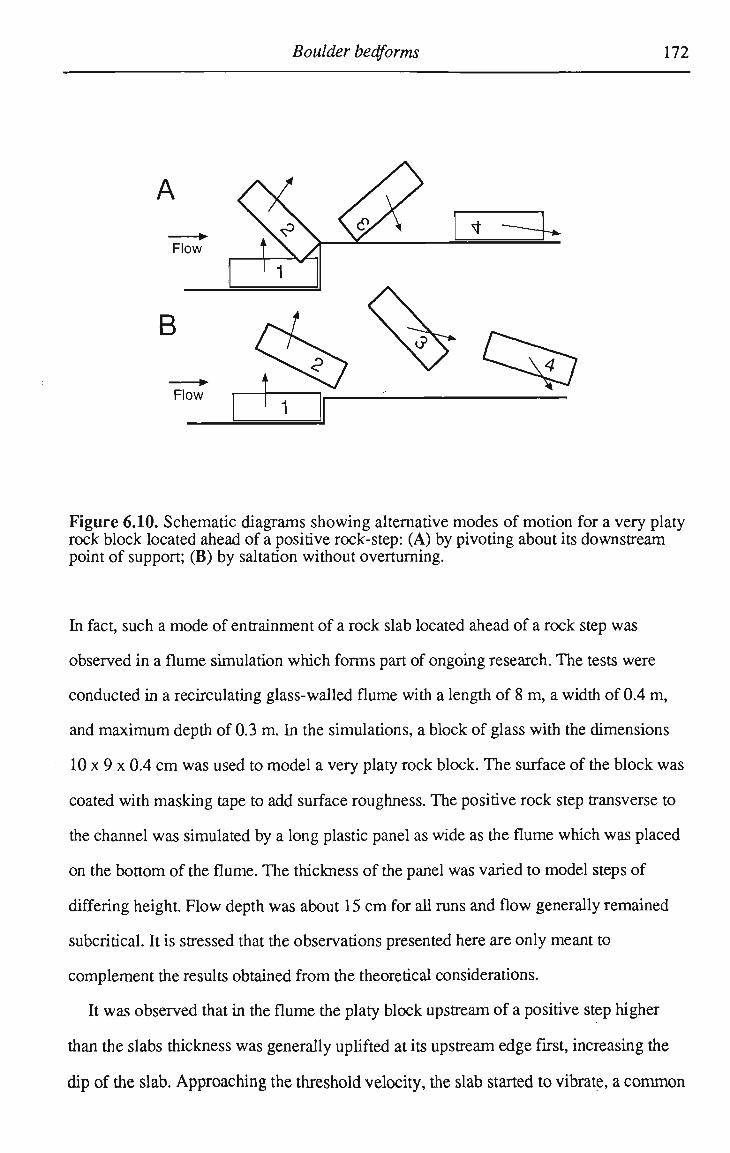
Boulder bedforms 172
Figure 6.10. Schematic diagrams showing alternative modes of motion for a very platy rock block located ahead of a positive rock-step: (A) by pivoting about its downstream point of support; (B) by saltation without overturning.
In fact, such a mode of entrainment of a rock slab located ahead of a rock step was
observed in a flume simulation which forms part of ongoing research. The tests were
conducted in a recirculating glass-walled flume with a length of 8 m, a width of 0.4 m,
and maximum depth of 0.3 m. In the simulations, a block of glass with the dimensions
10 x 9 x 0.4 c m was used to model a very platy rock block. The surface of the block was
coated with masking tape to add surface roughness. The positive rock step transverse to
the channel was simulated by a long plastic panel as wide as the flume which was placed
on the bottom of the flume. The thickness of the panel was varied to model steps of
differing height. Flow depth was about 15 c m for all runs and flow generally remained
subcritical. It is stressed that the observations presented here are only meant to
complement the results obtained from the theoretical considerations.
It was observed that in the flume the platy block upstream of a positive step higher
than the slabs thickness was generally uplifted at its upstream edge first, increasing the
dip of the slab. Approaching the threshold velocity, the slab started to vibrate, a common
Boulder bedforms 173
and well documented motion of particles just prior to entrainment (Tipper, 1989). W h e n
the instantaneous velocity exceeded the threshold, the slab rapidly pivoted about its upper
downstream edge, overturned, and was pushed back onto the channel bed. During the
process the slab was displaced only a short distance downstream, generally only one or
two slab lengths beyond the step (Fig. 6.10A). In other flume studies, such pivoting has
been observed to be a c o m m o n mode of initial motion and transport of particles of
various shapes (e.g. Carling, et al., 1992). If, however, the slab was located upstream of
a low step with a height in the order of the thickness of the slab or less, the slab was
frequently entrained and displaced without being flipped over. As in the situation of the
high step described above, the slab started to pivot about its downstream support, but
instead of being overturned, the slab was released from the step. While the slab was then
uplifted even further and also displaced significantiy downstream, its inclination against
the flow increased to a maximum just before it started to sink back to the channel bed,
gradually returning to a flow parallel orientation (Fig. 6.10b). It has been argued, that
under the influence of a strong lift force, platy particles can 'jump' away from the channel
bed (Johansson, 1976), or that they can be transported in a state of quasi-suspension
(Bradley, et al., 1972). However, initial motion and transport by saltation appears to be
the exception, even for platy particles (Carling, et al., 1992), and the occurrence of
saltation may be restricted to very platy slabs and high-magnitude flow events, when the
effects of lift are significant.
6.3.3 Rectangular block imbricated against a positive bedrock step
For a very platy rock slab, this situation can be subdivided into two principle cases. In
the first case, the level of attack of the drag force is below the edge of the step (Fig.
6.9B). In this situation, the slab can only be entrained if the lift force is positive and the
resultant force acts away from the channel bed. Alternatively, the drag force could
become negative, i.e. directed upstream, such as in regions of strong back flow. In the
second principle cases, the level of attack of the drag force is above the edge of the step,
and the slab can be entrained by a positive drag force. If, however, the line.along which
Boulder bedforms 174
the lift and the gravitational forces act is located behind, or downstream of the step, the
slab is unstable. In such situations, the slab is likely to pivot under the influence of its
o w n weight, or during flows of low velocities.
For a thin rock slab, the criterion for the level of the drag force being below the edge
of the step can be approximated by (see Appendix F for details)
sinP<h/0.5Db (64)
For imbrication angles as defined by Equation 6.4, the slab is relatively stable as it can
only be entrained under the influence of a large positive lift force or a negative drag force.
Appropriate lift coefficients for the particular case of a rectangular block imbricated
against a positive transverse step are not available, but the force coefficients listed in
Table 5.1 indicate that the lift force is likely to be negative, Le. to act towards the channel
bed. This suggests that a platy rock slab with an imbrication angle smaller than given by
Equation 6.4 could only be entrained if the drag force becomes negative.
The actual flow past the block and over the positive step is likely to be complex, with
flow separation occurring in three dimensions. A n additional important factor are
certainly the large velocity fluctuations created by the high turbulence intensity at the step
and the slab. Allen (1982, Vol. 2,101-131) outlined the likely effects of a positive step
across the channel bed on the turbulent flow. A zone of flow separation and back flow is
characteristically found ahead of the step, with high bed pressures occurring near the
point of separation. Such high bed pressure (low velocity) is also typically found ahead
of isolated large particles on the channel bed together with high velocities at the flanks of
the particle (Brayshaw, et al., 1983). According to Brayshaw et al. (1983), a spherical
particle located upstream of such a stationary particle can experience higher positive lift
forces than a single unobstructed particle, but the effects of particle shape were not
included in their study. Field evidence from gravel streams elsewhere suggests that
locallized flow patterns can even result in the upstream migration of gravel-sized particles
from clusters (de Jong, 1991), indicating the importance of locallized flow pattern for

Boulder bedforms 175
particle entrainment. Nevertheless, it is well documented that imbricated particles are
generally more stable than the same particles not in imbricated positions (e.g. Laronne
and Carson, 1976; Brayshaw, 1984; Carling, et al., 1992). Similarly, rock slabs
imbricated in stable positions against positive bedrock steps (Eq. 6.4) are likely to be
more stable than the same slabs in other orientations. For an imbricated very platy block,
the critical velocity for entrainment may even be higher than that required to pluck a slab
of equal size from the channel bed. The comparatively low velocities needed to cause
erosion by hydraulic plucking of such a rock slab support this view (Tab. 6.3).
Summarizing the discussion above, the critical entrainment velocity and the mode of
motion of a rectangular block on a rock bed are strongly influenced by the shape and
orientation of the block. O n a smooth bed, a platy block will slide while a compact block
could pivot at the same critical velocity (Tab. 6.3). If the bed dips weakly downstream,
the platy block will be entrained at a lower velocity than a more compact block. In the
presence of a positive step transverse to the channel, most blocks will tend to pivot about
their downstream support. O n downstream dipping beds, however, very platy blocks
located ahead of low positive steps can also move by saltation. Platy blocks imbricated
against a positive step are either fairly unstable or very stable, the threshold angle
primarily determined by the height of the step and the length of the intermediate axis of
the block. For a given step, or obstacle height, short platy blocks can have steeper
imbrication angles than long blocks before they become unstable and eventually pivot
under the influence of their own weight.
From these theoretical considerations, it may be concluded that once a platy block has
been dislodged from the channel bed by hydraulic plucking, it probably overturns and
then slides along the channel bed (Fig. 6.10a). At the next downstream obstacle, which is
likely to be a boulder cluster, it will pivot again, this time probably to a stable imbricated
position (Fig. 6.1A-D). Alternatively, very platy blocks may even saltate after being
plucked (Fig. 6.10b) and they could be deposited at locations significantly above the
average level of the rock bed, such as on top of bars or large clusters (Fig. 6.1C).
Boulder bedforms 176
6.3.4 Considerations about particle motion at Jack's Hole
It is evident that the extremely coarse fraction of the bedload along parts of the Durack
River can only be moved during exceptional flood events. Such events are also necessary
to activate erosion of thick rock slabs by hydraulic plucking, the process that produces
the typical stepped channel morphologies along dip channel reaches. Based on the
previous discussion about entrainment thresholds, the probable mode of motion of large
rock slabs subsequent to their lifting out of the channel bed at Jack's Hole may be
oudined. Once a platy block is hydraulically plucked from the rock bed, it probably
overturns about its downstream contact with the rock mass. Overturned blocks,
recognized by erosion features such as potholes on their under side, are relatively
common in the cluster bedforms at the site. The overturned block is then either imbricated
against an obstacle, such as a step, or come to rest parallel to the channel bed. Isolated
platy to bladed boulders deposited flat lying on the channel bed are, however, very rare at
the study sites, supporting the finding that the critical velocity for sliding is smaller than
that needed for their plucking (Eqs. 6.2 & 5.4, Tab. 6.3).
Platy boulders imbricated against a positive step with an imbrication angle in the stable
range as defined by Eq. 6.4, can only be entrained by flows with velocities considerably
higher than those needed to entrain the particles resting parallel on the channel bed. If
their threshold of entrainment is even higher than that for the hydraulic plucking of blocks
forming the bedrock step itself, such boulder clusters formed along upstream facing steps
may delay further erosion of those steps. The size and likely longevity of boulder
clusters, and also their impact on the flow hydraulics of floods below threshold
conditions, makes these combined erosional and depositional features important fluvial
forms along certain reaches of the Durack River.
Boulder bedforms 111
6.4 Summary
Along channel reaches where the joint system of a rock mass produces layers of platy
to bladed rocks which dip gentiy downstream relative to the channel slope, hydraulic
plucking can be a very effective erosional process if threshold values of erosion are
exceeded during flood events. Threshold values are largely controlled by the degree of
inclination of the rock mass relative to the channel slope and by the platiness of the rock
slabs. Generally, a thin slab of rock is more easily eroded than a thicker slab with the
same surface area because the thin plate has the smaller submerged weight but the same
effective area for the uplift forces to act on. If threshold values for hydraulic plucking are
high and exceeded only by rare floods, erosional and depositional bedforms formed
during such events are likely to persist unaltered for long periods of time.
Hydraulic plucking along dip channel reaches produces characteristic positive steps in
the channel bed which are, in height and planform, largely controlled by the joint pattern
of the exposed rock mass. These typical erosional bedforms present obstacles for coarse
bedload particles which slide, pivot, or, in exceptional cases, even saltate along the
channel bed. Locally plucked platy boulders, or clasts supplied from further upstream,
are imbricated against the steps and subsequent accumulation of further rock slabs leads
to the development of stoss side clusters. Boulder clusters can extend laterally reflecting
the general pattern of the steps. They can also increase in length by lee-side deposition,
and such step covering clusters can link up with other clusters further upstream or
downstream to form longitudinal boulder deposits.
Threshold values for incipient motion of boulders deposited in imbricate-type cluster
bedforms are most likely to be higher than those for boulders resting parallel on the
channel bed. Importantly, it seems possible that threshold values for imbricated clasts can
exceed those required for bedrock erosion by hydraulic plucking. Stable cluster bedforms
can then delay or even prevent further erosion along the protected bedrock steps which
could decrease the total rate of erosion along the channel reach.

Boulder bedforms 178
Due to the conspicuous periodical occurrence of many stoss side and step covering
clusters, it seems a likely supposition that the spacing of the erosional rock steps and the
subsequent development of depositional boulder clusters are both controlled by local
hydraulic conditions similar to those causing the development of dunes in alluvial
channels. Clearly, more field studies and experimental investigations are needed to
explain, quantify, and classify the processes and forms of bedrock channels.
7. ANABRANCHING ALLUVIAL RIVERS: RIDGE-FORMING CHANNELS
A s described, the region's streams frequently occupy bedrock or boulder-bed
channels, especially along their steepened and incised downstream reaches. However,
along the middle reaches, stream gradients are much reduced and sand-bed alluvial
channels dominate, although they alternate with bedrock reaches. These alluvial sections
are frequently straight, confined by bedrock valley sides, and are laterally stable. Bedrock
outcropping in places along the bed indicates that they are not vertically accreting. Along
the Durack River and many other rivers on the Kimberley Plateau these channels formed
in sandy alluvium typically reveal a multi-channel planform, often of the ridge-forming
anabranching type (Nanson and Knighton, 1996). This latter type of alluvial channel is
the focus of this chapter.
Anabranching rivers form a highly diverse group of streams that, despite their
widespread occurrence, remain the last major category of alluvial system to be thoroughly
described and explained (Nanson and Knighton, 1996). They consist of multiple
channels separated by vegetated semi-permanent alluvial islands or ridges, and provide a
marked contrast to rivers that flow in single channels in order to maintain an efficient
conveyance of water and sediment. It is well understood that alluvial rivers generally
respond to changes in environmental conditions by adjusting their hydraulic geometry
and planform with the result that river morphology can vary across a wide spectrum.
Anabranching rivers are no exception and as a consequence they add greatly to the
diversity of river systems.
In a recent analysis of basic hydraulic relationships for alluvial channels, Nanson and
Huang (in press) show that, in situations where there is little opportunity to increase
channel slope, conversion from a single to a semi-permanent system of multiple channels
can cause a reduction in width and overall boundary resistance, thereby maintaining or
enhancing water and sediment throughput. They argue that Australia provides a
continental setting conducive to the formation of numerous anabranching rivers. Very
Ridge-forming channels 180
low relief, within channel vegetation, and a semi-arid to arid environment with declining
flow discharges and increasing sediment concentrations downstream, all act to favour
anabranching. Cohesive sediments and tree-lined banks permit a narrow channel form
that maintains water and sediment conveyance for the maximum distance downstream.
This chapter examines the existence of sand-dominated ridge-forming anabranching
rivers in the study area (Fig. 7.1). It describes their channel and ridge morphology,
sedimentology and stratigraphy, discusses stream flow and sediment transport, and
proposes mechanisms for their formation and continued existence as an equilibrium
channel form.
7.1 Study sites
Along the middle reaches of the Durack River sand-bed channels dominate, typically
revealing a multi-channel planform. Such alluvial channels usually alternate with short
bedrock reaches, the latter generally coincident with bedrock highs along the thalweg and
narrowing of the valley. The within-channel growth of shrubs and large trees, especially
Melaleuca leucadendron, is widespread, and the channel banks are composed of well
vegetated fine to medium sand. Floodplains are discontinuous, their occurrence generally
restricted to wider sections of valley often linked to major tributary junctions. Due to the
dominance of sandstones in the catchments, the sandy floodplains are generally starved
of silt, and the alluvial reaches of channel have beds of medium-sized sand. At the
downstream end of many alluvial channel reaches, large permanent waterholes are found.
These represent transitional areas separating alluvial channels upstream from bedrock
channels downstream.
The main study site at an elevation of approximately 300 m above sea-level is an
anabranching ridge-forming reach of the Durack River near Karunjie homestead (Fig.
7.1). A major drainage system for the region, the catchment has an area of some 4200
km2. The surrounding landscape is of low local relief and the average valley slope is
about 0.0006. Upstream and downstream of the study reach, the channel is cut into
bedrock and deposits of very large fluvially transported boulders provide evidence for the
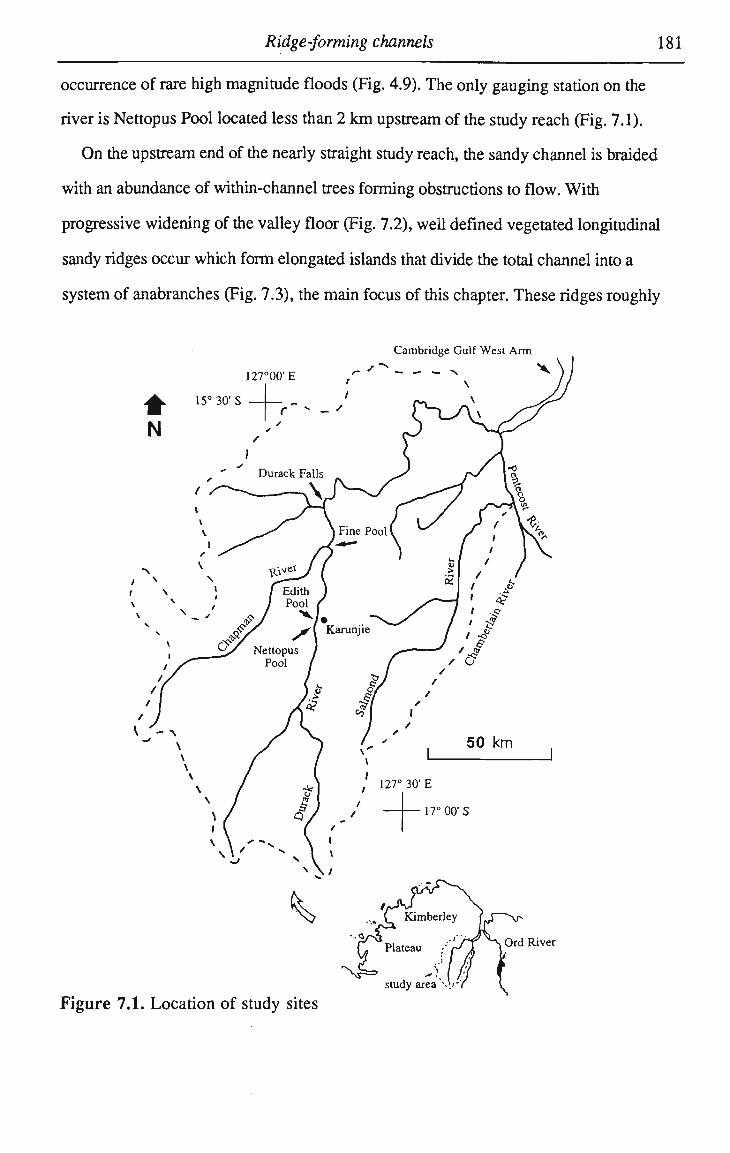
Ridge-forming channels 181
occurrence of rare high magnitude floods (Fig. 4.9). The only gauging station on the
river is Nettopus Pool located less than 2 k m upstream of the study reach (Fig. 7.1).
O n the upstream end of the nearly straight study reach, the sandy channel is braided
with an abundance of within-channel trees forming obstructions to flow. With
progressive widening of the valley floor (Fig. 7.2), well defined vegetated longitudinal
sandy ridges occur which form elongated islands that divide the total channel into a
system of anabranches (Fig. 7.3), the main focus of this chapter. These ridges roughly
127°00' E
Cambridge Gulf West Arm
'~* - - -
Plateau
study area "Or
Ord River
Figure 7.1. Location of study sites
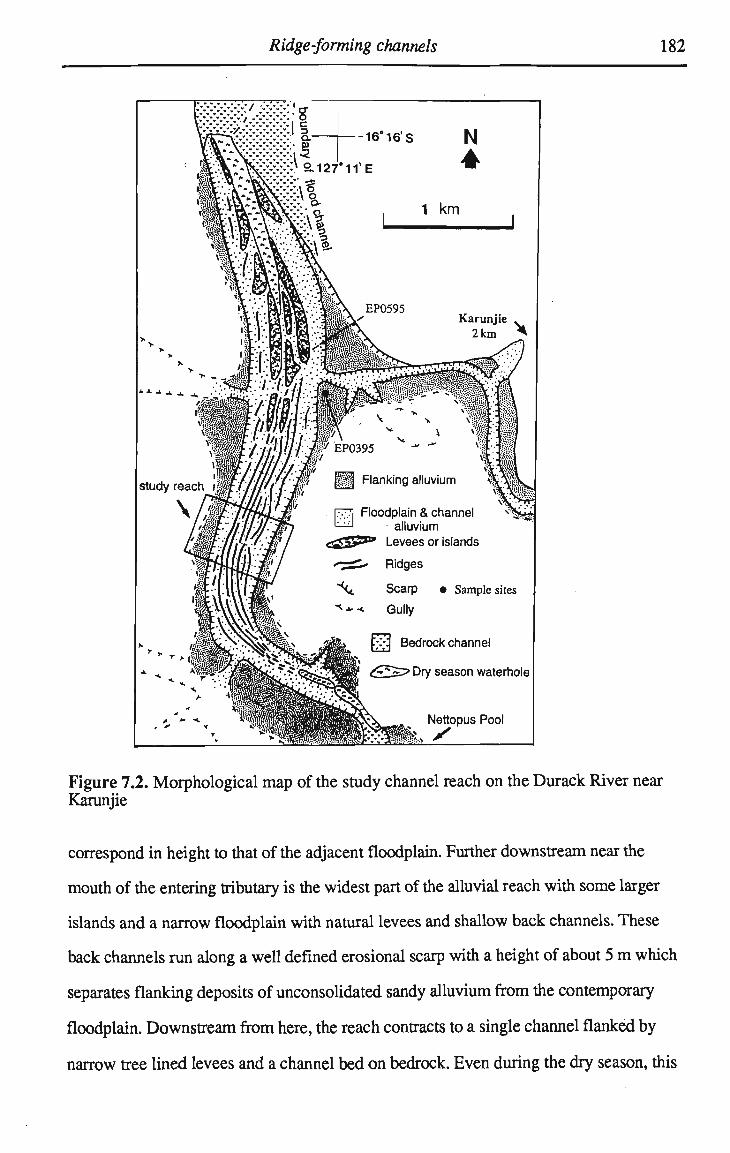
Ridge-forming channels 182
Figure 7.2. Morphological map of the study channel reach on the Durack River near Karunjie
correspond in height to that of the adjacent floodplain. Further downstream near the
mouth of the entering tributary is the widest part of the alluvial reach with some larger
islands and a narrow floodplain with natural levees and shallow back channels. These
back channels run along a well defined erosional scarp with a height of about 5 m which
separates flanking deposits of unconsolidated sandy alluvium from the contemporary
floodplain. Downstream from here, the reach contracts to a single channel flanked by
narrow tree lined levees and a channel bed on bedrock. Even during the dry season, this
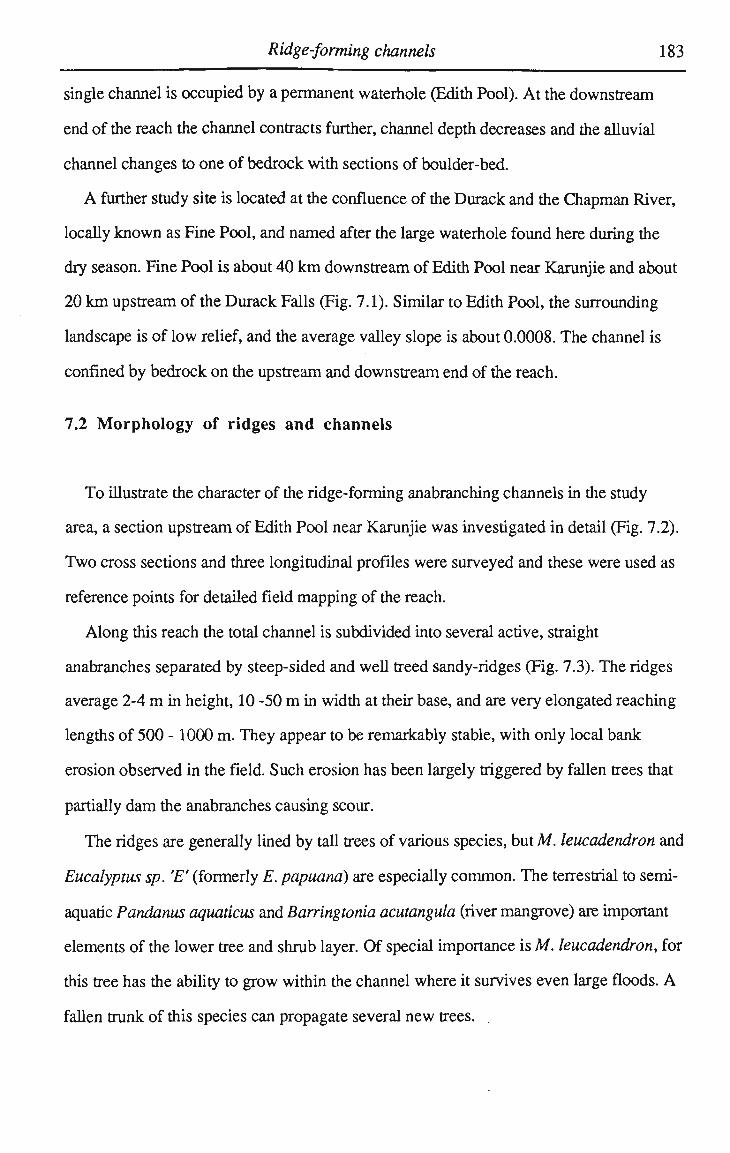
Ridge-forming channels 183
single channel is occupied by a permanent waterhole (Edith Pool). At the downstream
end of the reach the channel contracts further, channel depth decreases and the alluvial
channel changes to one of bedrock with sections of boulder-bed.
A further study site is located at the confluence of the Durack and the Chapman River,
locally known as Fine Pool, and named after the large waterhole found here during the
dry season. Fine Pool is about 40 k m downstream of Edith Pool near Karunjie and about
20 k m upstream of the Durack Falls (Fig. 7.1). Similar to Edith Pool, the surrounding
landscape is of low relief, and the average valley slope is about 0.0008. The channel is
confined by bedrock on the upstream and downstream end of the reach.
7.2 Morphology of ridges and channels
To illustrate the character of the ridge-forming anabranching channels in the study
area, a section upstream of Edith Pool near Karunjie was investigated in detail (Fig. 7.2).
T w o cross sections and three longitudinal profiles were surveyed and these were used as
reference points for detailed field mapping of the reach.
Along this reach the total channel is subdivided into several active, straight
anabranches separated by steep-sided and well treed sandy-ridges (Fig. 7.3). The ridges
average 2-4 m in height, 10 -50 m in width at their base, and are very elongated reaching
lengths of 500 -1000 m. They appear to be remarkably stable, with only local bank
erosion observed in the field. Such erosion has been largely triggered by fallen trees that
partially dam the anabranches causing scour.
The ridges are generally lined by tall trees of various species, but M. leucadendron and
Eucalyptus sp. '£" (formerly E. papuana) are especially common. The terrestrial to semi-
aquatic Pandanus aquaticus and Barringtonia acutangula (river mangrove) are important
elements of the lower tree and shrub layer. Of special importance is M. leucadendron, for
this tree has the ability to grow within the channel where it survives even large floods. A
fallen trunk of this species can propagate several new trees.
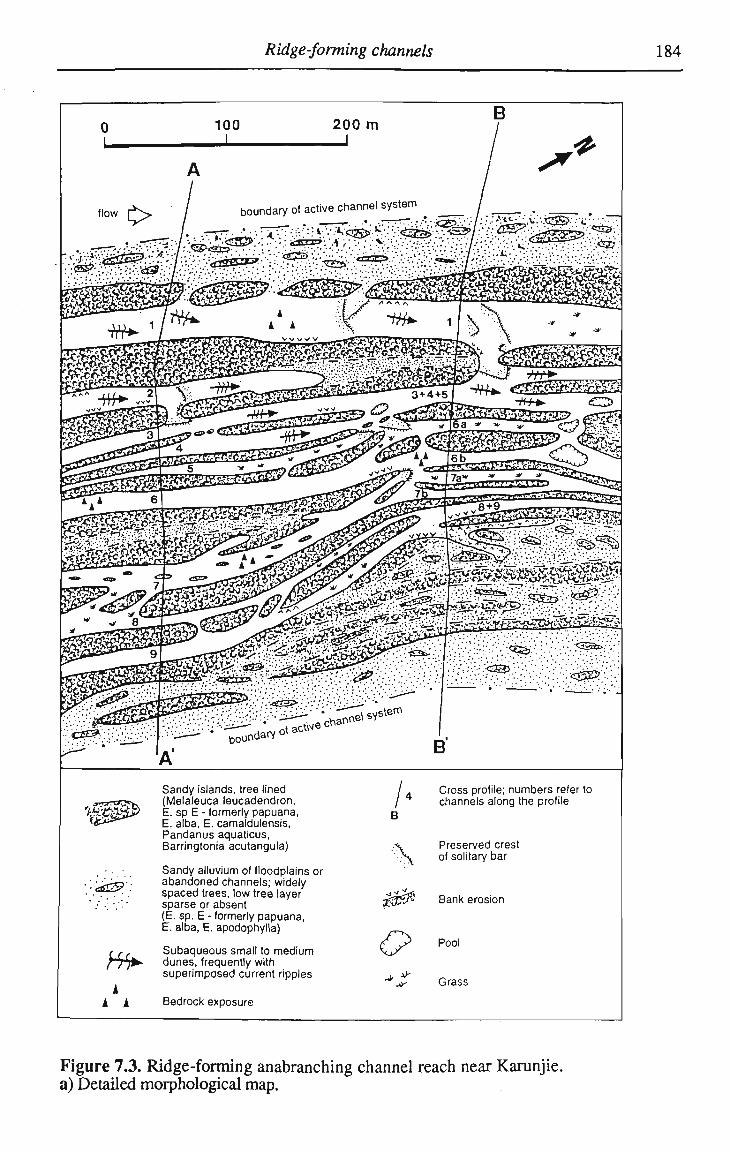
Ridge-forming channels 184
^i^^r^^^y^i?
:•;:-.••-rnr::.:••:•:.•.::•. «S2? •.•••
-mm
•a£2?':
H*» i
i i
Sandy islands, tree lined (Melaleuca leucadendron, E. sp E - formerly papuana, E. alba, E. camaldulensis, Pandanus aquaticus, Barringtonia acutangula) Sandy alluvium of floodplains or abandoned channels; widely spaced trees, low tree layer sparse or absent (E. sp. E - formerly papuana, E. alba, E. apodophylla) Subaqueous small to medium dunes, frequently with superimposed current ripples Bedrock exposure
Cross profile; numbers refer to channels along the profile
Preserved crest of solitary bar
3f35J$ Bank erosion
Pool
jit *
~* jy Grass
Figure 7.3. Ridge-forming anabranching channel reach near Karunjie. a) Detailed morphological map.
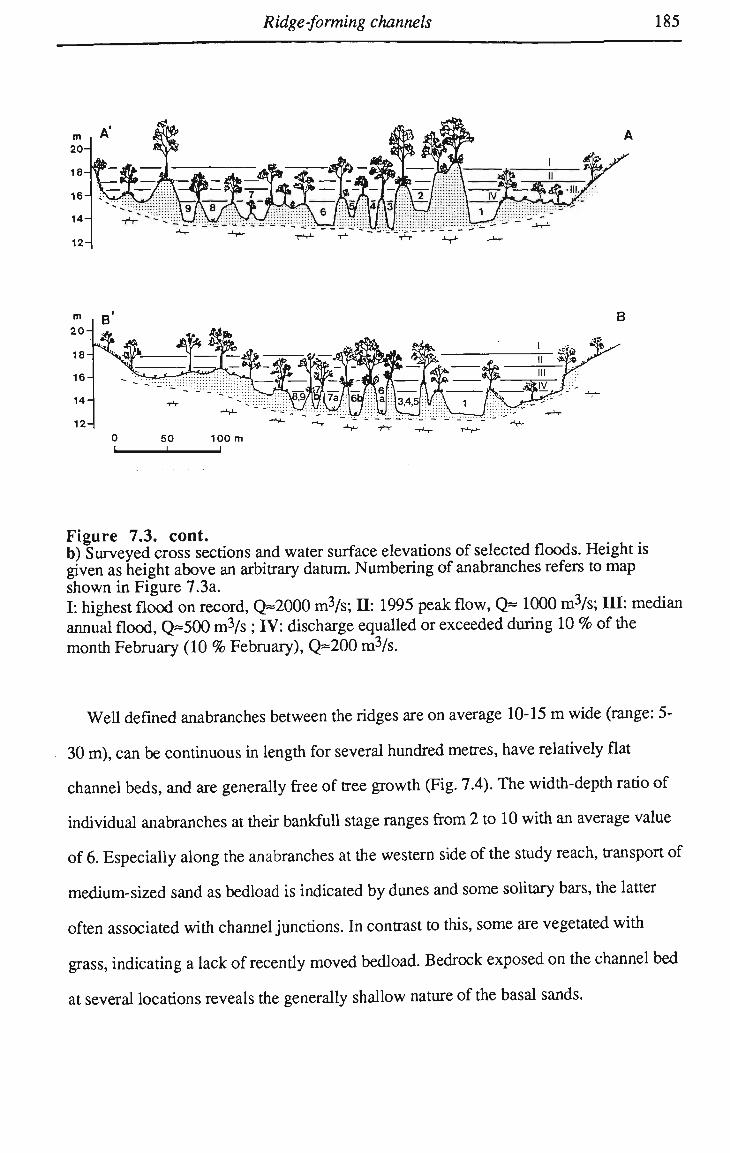
Ridge-forming channels 185
m 20-
1 8-
16-
14-
12-
B'
0
*$*^$
j T
50 100
=-/T— f \6t 7a a 3,4,£
Figure 7.3. cont. b) Surveyed cross sections and water surface elevations of selected floods. Height is given as height above an arbitrary datum. Numbering of anabranches refers to map shown in Figure 7.3a. I: highest flood on record, Q«2000 m3/s; H: 1995 peak flow, Q « 1000 m3/s; IH: median annual flood, Q»500 m3/s ; rV: discharge equalled or exceeded during 10 % of the month February (10 % February), Q«200 m3/s.
Well defined anabranches between the ridges are on average 10-15 m wide (range: 5-
30 m ) , can be continuous in length for several hundred metres, have relatively flat
channel beds, and are generally free of tree growth (Fig. 7.4). The width-depth ratio of
individual anabranches at their bankfull stage ranges from 2 to 10 with an average value
of 6. Especially along the anabranches at the western side of the study reach, transport of
medium-sized sand as bedload is indicated by dunes and some solitary bars, the latter
often associated with channel junctions. In contrast to this, some are vegetated with
grass, indicating a lack of recently moved bedload. Bedrock exposed on the channel bed
at several locations reveals the generally shallow nature of the basal sands.
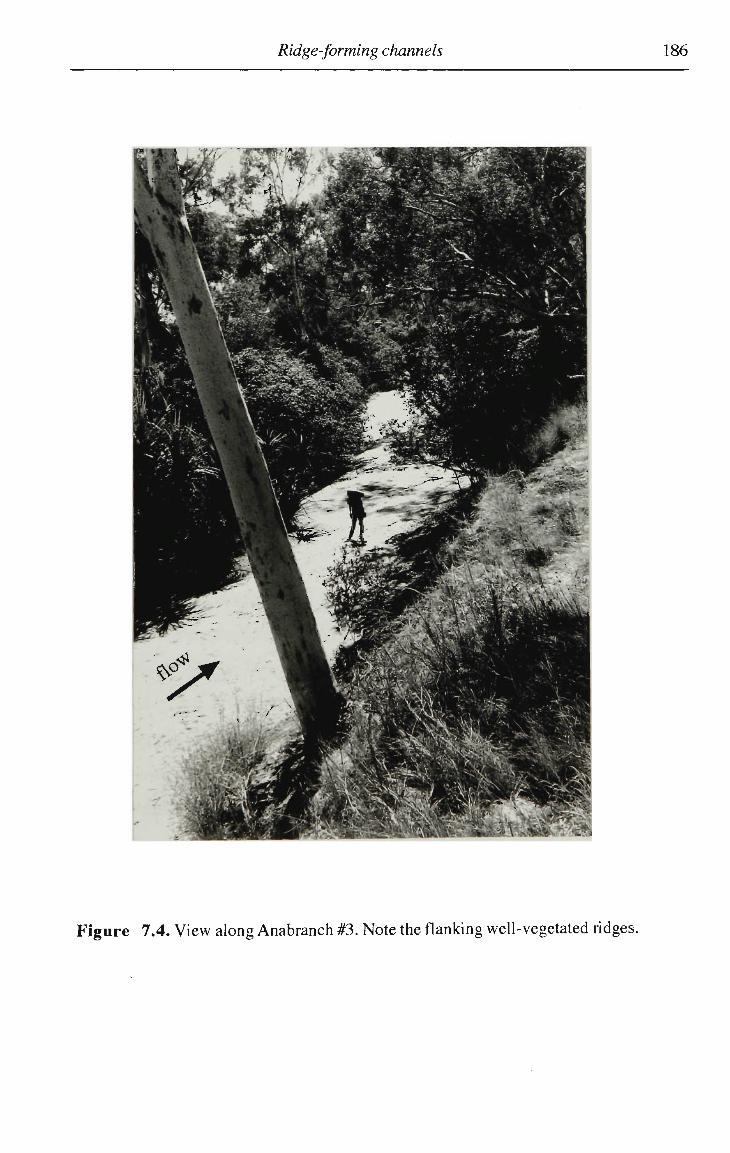
Ridge-forming channels 186
Figure 7.4. View along Anabranch #3. Note the flanking well-vegetated ridges.
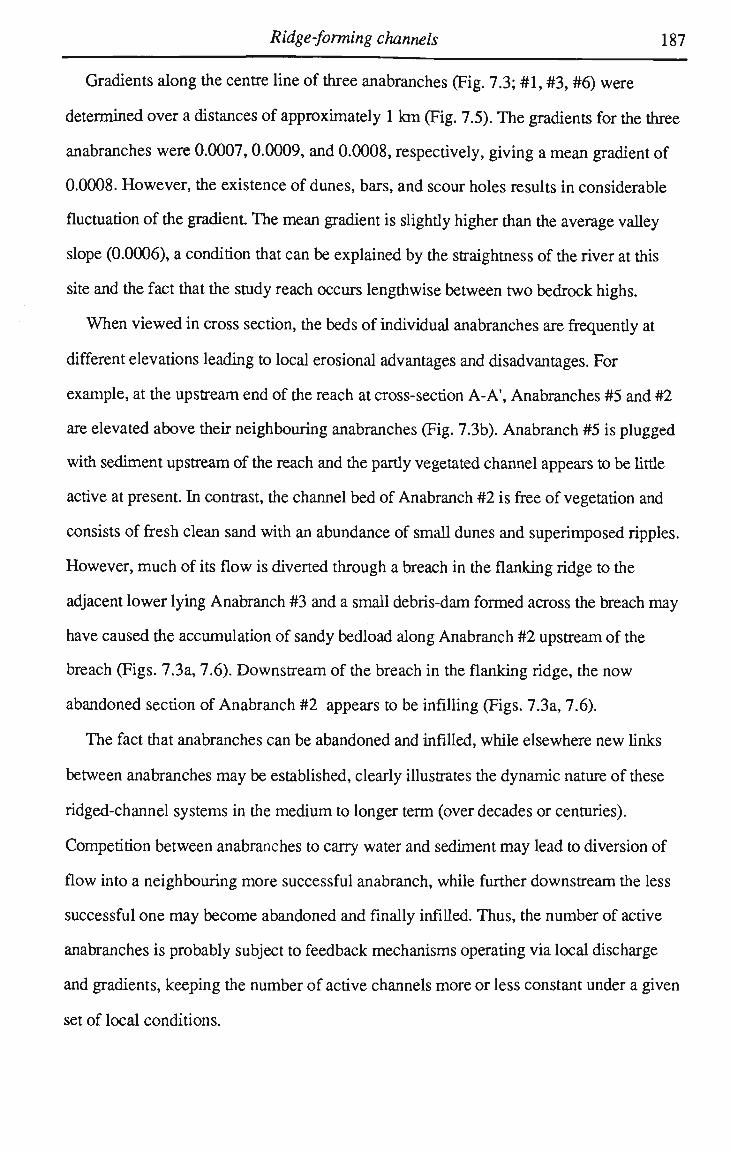
Ridge-forming channels 187
Gradients along the centre line of three anabranches (Fig. 7.3; #1, #3, #6) were
determined over a distances of approximately 1 k m (Fig. 7.5). The gradients for the three
anabranches were 0.0007,0.0009, and 0.0008, respectively, giving a mean gradient of
0.0008. However, the existence of dunes, bars, and scour holes results in considerable
fluctuation of the gradient The mean gradient is slighdy higher than the average valley
slope (0.0006), a condition that can be explained by the straightness of the river at this
site and the fact that the study reach occurs lengthwise between two bedrock highs.
W h e n viewed in cross section, the beds of individual anabranches are frequendy at
different elevations leading to local erosional advantages and disadvantages. For
example, at the upstream end of the reach at cross-section A-A1, Anabranches #5 and #2
are elevated above their neighbouring anabranches (Fig. 7.3b). Anabranch #5 is plugged
with sediment upstream of the reach and the partly vegetated channel appears to be litde
active at present. In contrast, the channel bed of Anabranch #2 is free of vegetation and
consists of fresh clean sand with an abundance of small dunes and superimposed ripples.
However, much of its flow is diverted through a breach in the flanking ridge to the
adjacent lower lying Anabranch #3 and a small debris-dam formed across the breach may
have caused the accumulation of sandy bedload along Anabranch #2 upstream of the
breach (Figs. 7.3a, 7.6). Downstream of the breach in the flanking ridge, the now
abandoned section of Anabranch #2 appears to be infilling (Figs. 7.3a, 7.6).
The fact that anabranches can be abandoned and infilled, while elsewhere new links
between anabranches may be established, clearly illustrates the dynamic nature of these
ridged-channel systems in the medium to longer term (over decades or centuries).
Competition between anabranches to carry water and sediment may lead to diversion of
flow into a neighbouring more successful anabranch, while further downstream the less
successful one may become abandoned and finally infilled. Thus, the number of active
anabranches is probably subject to feedback mechanisms operating via local discharge
and gradients, keeping the number of active channels more or less constant under a given
set of local conditions.
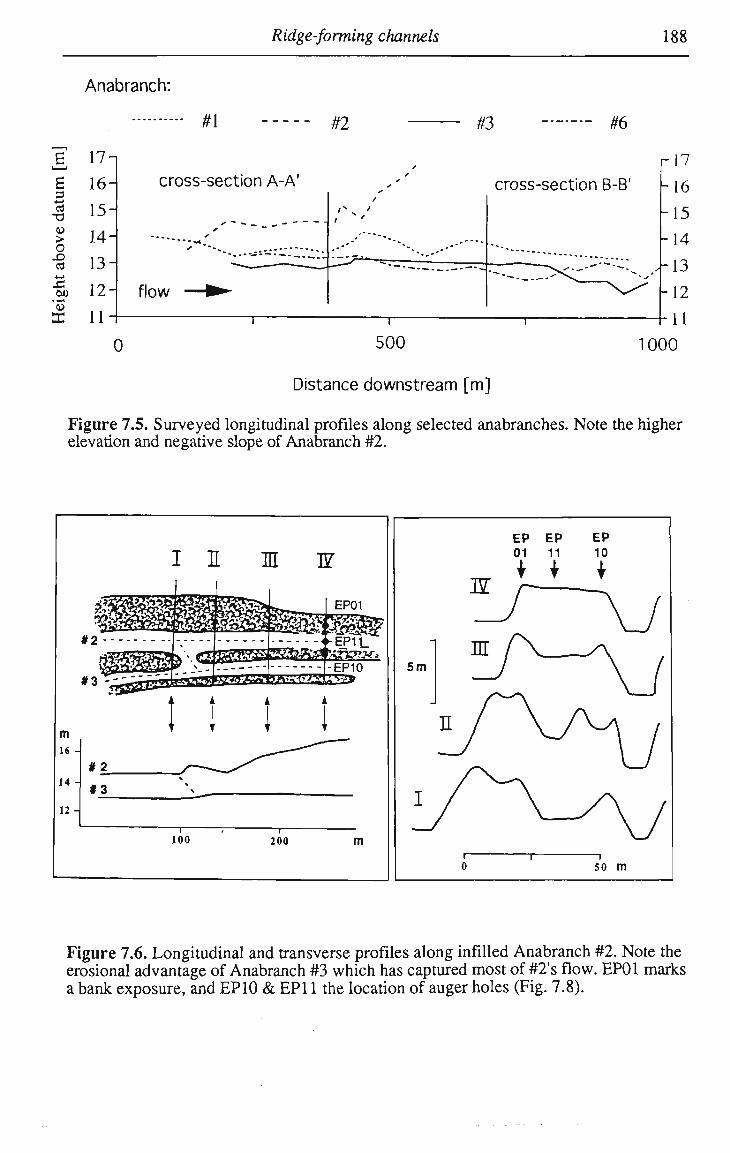
Ridge-forming channels 188
Anabranch:
£ <$ •a
> o x> +-• X! CJQ
• «
X
#1 #2
17-
16-
15-
14-
13-
12 H flow
11
cross-section A-A'
0
#3 #6
cross-section B-B'
'N. >
r-17
-16
-15
-14
-13
-12
11
500 1000
Distance downstream [m]
Figure 7.5. Surveyed longitudinal profiles along selected anabranches. Note the higher elevation and negative slope of Anabranch #2.
I I HI W
m 16 -
14 -
12-
#2
#3
-<HEP11_
-EP10 JS&tP-'*?* i/.T£«€ft»**W»
A A A A
Mil
100 200 m
5m
— i
so m
Figure 7.6. Longitudinal and transverse profiles along infilled Anabranch #2. Note the erosional advantage of Anabranch #3 which has captured most of #2's flow. EP01 marks a bank exposure, and EP10 & EP11 the location of auger holes (Fig. 7.8).
Ridge-forming channels 189
7.3 Ridge sedimentology
The stratigraphy of the ridges was investigated at eroded bank cuts, in hand excavated
sections, and with the use of a hand auger. In the field, grain size was estimated using a
hand lens and comparator chart, and the colour of the dry sediment was determined with
a Munsell colour chart. Detailed texture was determined by dry sieving in the laboratory,
statistical parameters of grain size were obtained from graphical measures and percent
organic matter determined by loss-on-ignition (see also Chapter 2).
The study streams, as with most streams in the region, transport predominandy a
bedload of medium sand with the largest particles consisting of coarse to very coarse
sand. Alluvium flanking the rivers is generally fine to very fine sand with a low
percentage of silt. Ridge and floodplain deposits are generally very consistent both
vertically and laterally.
7.3.1 Ridges
Figure 7.7 shows a section hand excavated along the ridge separating Anabranches #2
and #3, some 200 m upstream of cross-section A-A1 (Fig. 7.3). The ridge crest is well
vegetated with tall trees, shrubs, and grasses and the surface of the ridge is covered with
organic litter, or in places, a thin veneer of recentiy deposited clean, very fine sand. The
main face of the exposure is aligned parallel to the ridge crest and to the primary direction
of the flow, while the short face at the downstream end of the section extends transverse
to the ridge and the flow. The most distinctive features of this and other exposures, are
thin dark brown layers of fine to very fine sand and organic detritus which mark the
contact surfaces of beds of clean, light brown to brown very fine to medium sand (Figs.
7.7, 7.8a). The boundary of the dark brown layers is generally sharper on the lower
surface whereas the contact can be gradational on the upper surface . Neither the dark
layers nor the lighter coloured beds of clean sand show any flow structures except for
some very localized, faint and irregular parallel laminations. The dark brown colour
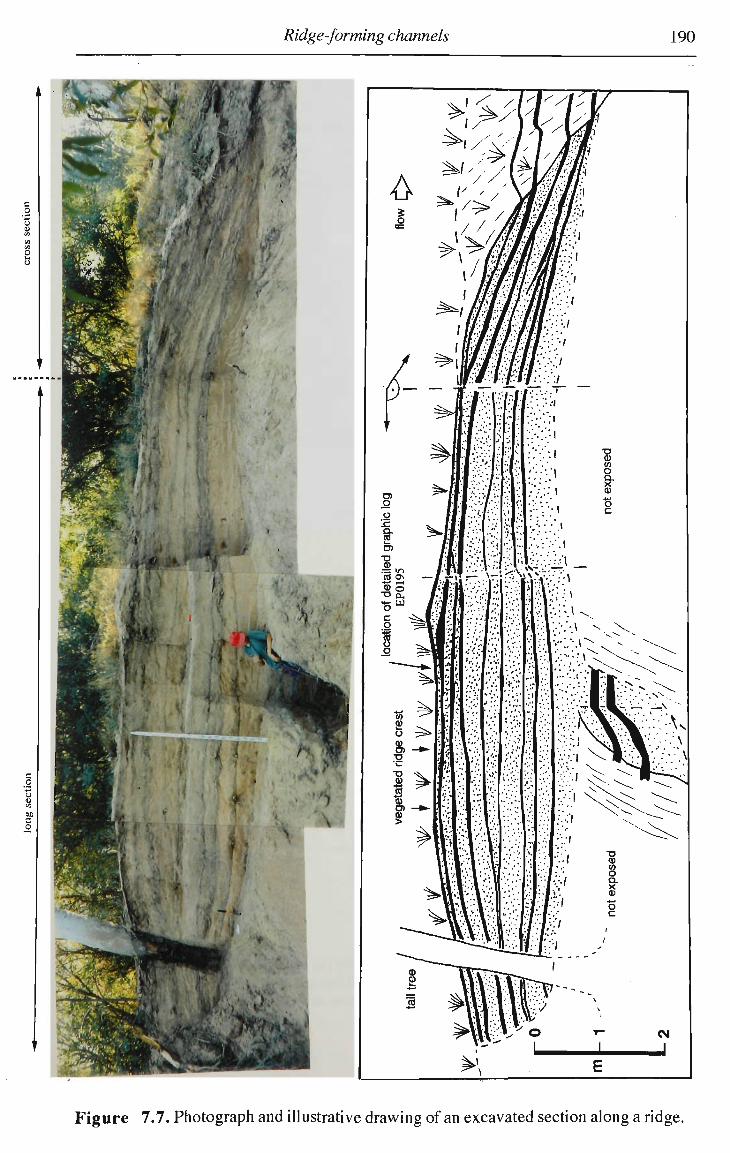
Ridge-forming channels 190
Figure 7.7. Photograph and illustrative drawing of an excavated section along a ridge.
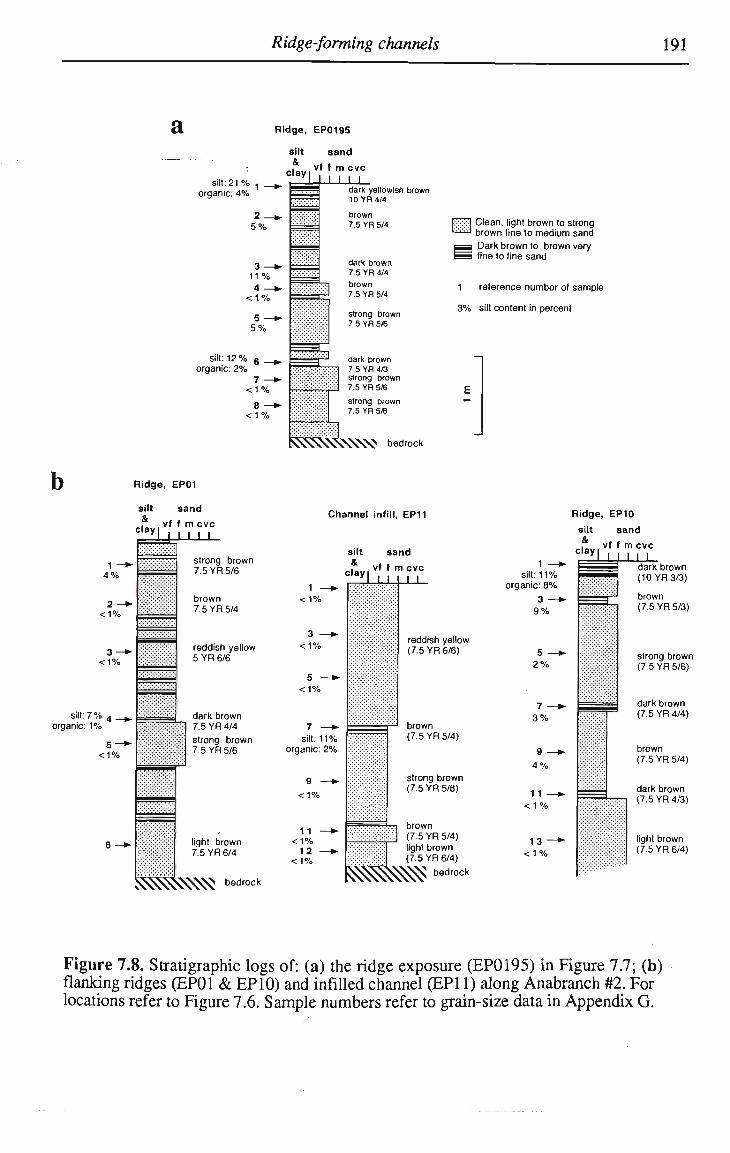
Ridge-forming channels 191
a Ridge, EP0195
sill: 21 % 1
organic: 4 %
silt
& clay i
2 _ 5%
3 —4 11% 4 —I
< 1 %
5 —l 5%
Silt: 1 2 % organic: 2 %
7 — < 1 %
< 1 %
sand
vf f m cvc
I I I I dark yellowish brown 10 YH 4/4
brown 7.5 YR 5/4
dark brown 7.5 YR 4/4 brown 7.5 YR 5/4
strong brown 7.5 YR 5/6
it^1 dark brown 7.5 YR 4/3 strong brown 7.5 YR 5/6 strong brown 7.5 YR 5/6
Clean, light brown to strong brown line to medium sand
Dark brown to brown very fine to fine sand
1 reference number of sample
3% silt content in percent
^NSSSJ^N>CS> bedrock
Ridge, EP01
silt sand
cfay.vf»mcvc
1 -4%
2 -<1%
3 -<1%
silt: 7% 4 _ organic: 1%
5-<1%
I | I I I I
strong brown 7.5 Y R 5/6
brown 7.5 Y R 5/4
reddish yellow 5 Y R 6/6
dark brown 7.5 Y R 4/4
strong brown 7.5 Y R 5/6
light brown 7.5 YR 6/4
Channel infill, EP11
silt sand
^ r : i p v ' c
<i%
3 -<1%
5 -<1%
silt: 1 1 % organic: 2 %
9 —*-
<1%
11 <1% 12
<1%
S S S S K K ^ drock
reddish yellow \ (7.5 Y R 6/6)
J brown (7.5 Y R 5/4)
strong brown (7.5 Y R 5/8)
T brown (7.5 YR 5/4) light brown (7.5 YR 6/4)
RSssmsbedock
Ridge, EP10
1 — » silt: 1 1 %
organic: 8 %
3 — » 9%
5 -2 %
silt
& clay i
7 -3 %
9 -4 %
11 -< 1 %
13 -< 1 %
sand
vf f m cvc
^
J_L dark brown (10YR3/3)
brown (7.5 Y R 5/3)
strong brown (7.5 Y R 5/6)
dark brown (7.5 Y R 4/4)
brown (7.5 Y R 5/4)
dark brown (7.5 Y R 4/3)
light brown (7.5 Y R 6/4)
Figure 7.8. Stratigraphic logs of: (a) the ridge exposure (EP0195) in Figure 7.7; (b) flanking ridges (EP01 & EP10) and infilled channel (EP11) along Anabranch #2. For locations refer to Figure 7.6. Sample numbers refer to grain-size data in Appendix G.
Ridge-forming channels 192
of the layers originates from a higher organic matter content, but in absolute terms, the
content is still low, generally only a few percent 0?ig. 7.8a). Furthermore, the darker
layers often consist of somewhat finer sediment with a higher percentage of silt
In a longitudinal direction, the bedding of the sandy units is roughly horizontal and
parallel, although some beds of clean sand are wavy to lenticular. At the downstream
end, some of the dark layers can be traced beyond the exposure along the sloping side of
the ridge where they appear as small breaks in the slope (Fig. 7.7). Viewed transverse to
the crest line, the dark layers in the section dip away from the crest of the ridge and
downwards towards the adjacent anabranch. As they do so they sometimes converge
resulting in roughly wedge-shaped bodies of clean sand between two successive dark
layers. The uppermost dark layer in the exposure forms the present surface layer of the
ridge which is interlaced by small roots and mixed with leaves and other organic litter.
Using this topmost layer as a present-day analog, each dark layer found lower in the
exposure can be seen to represent a former surface of this ridge and therefore a buried
palaeosol with a higher content of organic matter resulting from vegetation growth and
Utter accumulation at the time of its formation. These palaeosols may have formed over
several years or even decades of relatively low flows. In contrast, the beds of clean sand
represent flood units probably formed by single flood events, or possibly by a series of
floods that occurred over a short time interval allowing little time for the accumulation of
organic material.
The exposure reveals useful evidence as to the origin of the ridges. The stratigraphy
indicates that such ridges form predominantly by vertical accretion, although they are
probably lengthen by downstream accretion as indicated by current shadows behind trees
and at the downstream end of many ridges. At the upstream end of the exposure, the
continuation of the beds around the partly buried trunk of a live eucalypt tree indicates
that deposition of much of the ridge post-dates this tree which is somewhere between 20
and 50 years old. Aerial photographs (1:50 000) of the study reach taken in 1949 show
that the channel pattern composed of anabranches separated by vegetated ridges existed
some 50 years ago. In combination, this evidence demonstrates that the ridge in Figure
Ridge-forming channels 193
7.7 is not a remnant excised from a formerly more extensive floodplain as is shown to
occur elsewhere in the study area, but that it has formed by vertical accretion within an
alluvial channel characterized with an existing ridged-pattern.
7.3.2 Channel fill
Figure 7.8b shows the sediment logs of infilling Anabranch #2 and its flanking ridges
(Figs. 7.3a, 7.6). The stratigraphy at Sites EP10 (a ridge), EP11 (an infilled channel),
and along the channel was determined with a hand auger, while EP01 (a ridge) is
exposed in an eroded bank cut The ridges on each side of the infilled anabranch reveal
the typical sequence of thin layers of dark brown very fine to fine sand which alternate
with thicker beds of clean, brown very fine to medium sand. Upstream of its abandoned
section, Anabranch #2 between these ridges (Figs. 7.3a, 7.6) contains some 1-2 m of
clean reddish-yellow medium sand with the largest grains up to the size of coarse to very
coarse sand. At Site EP11, this former anabranch is completely infilled with several
metres of clean fine to medium sand (Figs. 7.6,7.8b, 7.9). Small dunes and ripples
preserved in recendy deposited sand at the top of the sequence suggest that probably most
of the sand was transported as bedload. However, at depth, two brown layers of fine
sand with a higher content of silt and organic matter are present, indicating that infilling
of the channel was interrupted by periods of relative inactivity which permitted the
growth of grass and the accumulation of organic litter in the channel. Several anabranches
with grass covered beds and apparently reduced channel activity have been observed
along the study reach (Fig. 7.3a), and some of these channels may be in their early stages
of channel abandonment and subsequent infill.
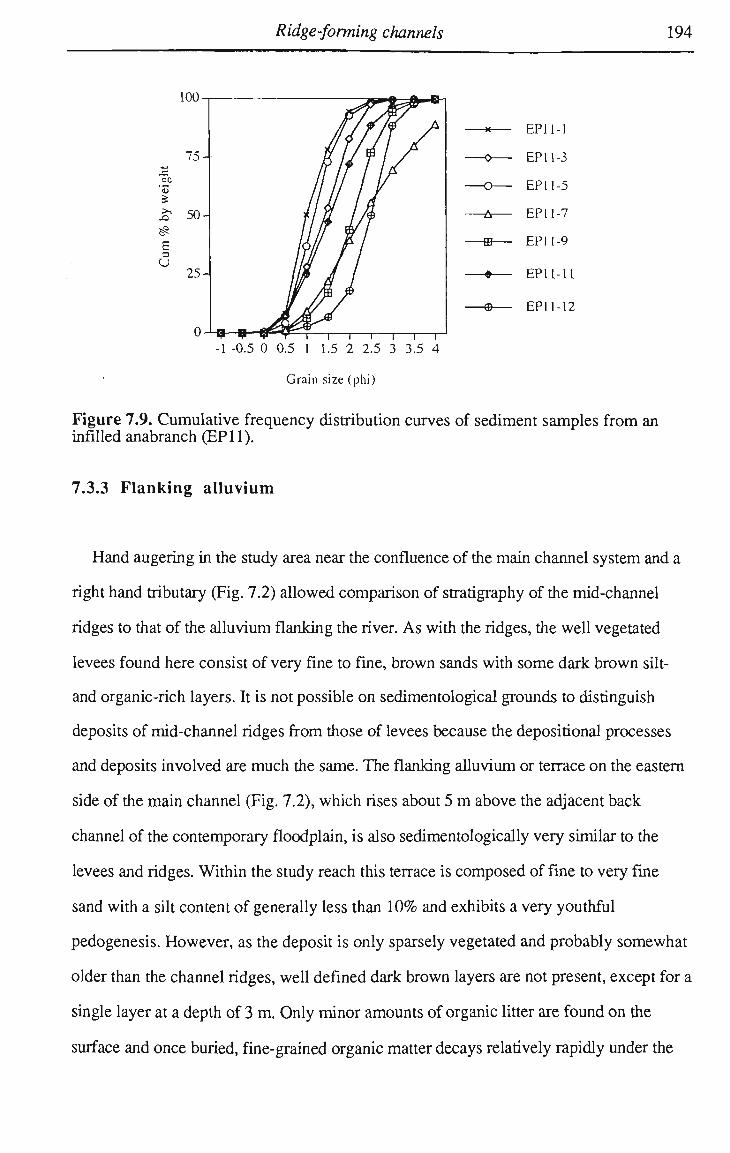
Ridge-forming channels 194
u
E U
-1 -0.5 0 0.5 1 1.5 2 2.5 3 3.5 4
-ffi-
-®-
EP11-1
EP11-3
EP11-5
EP11-7
EP11-9
EPlt-tl
EPI1-12
Grain size (phi)
Figure 7.9. Cumulative frequency distribution curves of sediment samples from an infilled anabranch (EP11).
7.3.3 Flanking alluvium
Hand augering in the study area near the confluence of the main channel system and a
right hand tributary (Fig. 7.2) allowed comparison of stratigraphy of the mid-channel
ridges to that of the alluvium flanking the river. As with the ridges, the well vegetated
levees found here consist of very fine to fine, brown sands with some dark brown silt-
and organic-rich layers. It is not possible on sedimentological grounds to distinguish
deposits of mid-channel ridges from those of levees because the depositional processes
and deposits involved are much the same. The flanking alluvium or terrace on the eastern
side of the main channel (Fig. 7.2), which rises about 5 m above the adjacent back
channel of the contemporary floodplain, is also sedimentologically very similar to the
levees and ridges. Within the study reach this terrace is composed of fine to very fine
sand with a silt content of generally less than 1 0 % and exhibits a very youthful
pedogenesis. However, as the deposit is only sparsely vegetated and probably somewhat
older than the channel ridges, well defined dark brown layers are not present, except for a
single layer at a depth of 3 m. Only minor amounts of organic litter are found on the
surface and once buried, fine-grained organic matter decays relatively rapidly under the
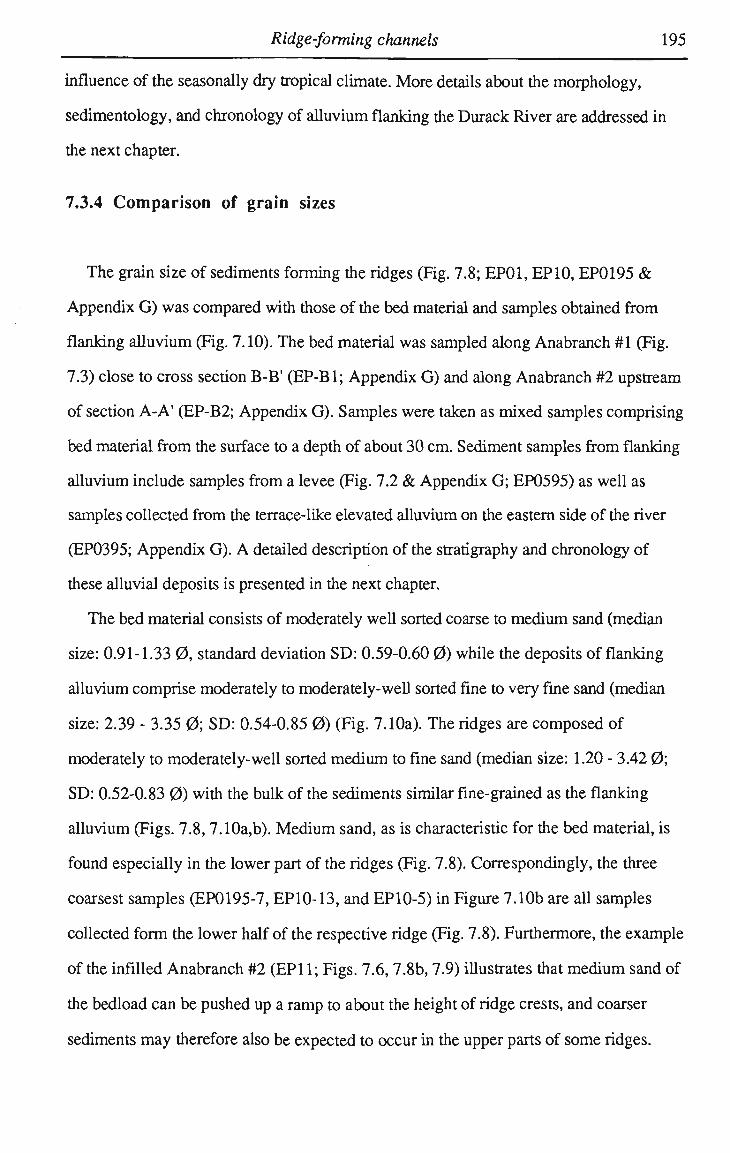
Ridge-forming channels 195
influence of the seasonally dry tropical climate. More details about the morphology,
sedimentology, and chronology of alluvium flanking the Durack River are addressed in
the next chapter.
7.3.4 Comparison of grain sizes
The grain size of sediments forming the ridges (Fig. 7.8; EP01, EP10, EP0195 &
Appendix G ) was compared with those of the bed material and samples obtained from
flanking alluvium (Fig. 7.10). The bed material was sampled along Anabranch #1 (Fig.
7.3) close to cross section B-B' (EP-B1; Appendix G ) and along Anabranch #2 upstream
of section A-A' (EP-B2; Appendix G). Samples were taken as mixed samples comprising
bed material from the surface to a depth of about 30 cm. Sediment samples from flanking
alluvium include samples from a levee (Fig. 7.2 & Appendix G; EP0595) as well as
samples collected from the terrace-like elevated alluvium on the eastern side of the river
(EP0395; Appendix G). A detailed description of the stratigraphy and chronology of
these alluvial deposits is presented in the next chapter.
The bed material consists of moderately well sorted coarse to medium sand (median
size: 0.91-1.33 0, standard deviation SD: 0.59-0.60 0 ) while the deposits of flanking
alluvium comprise moderately to moderately-well sorted fine to very fine sand (median
size: 2.39 - 3.35 0; SD: 0.54-0.85 0 ) (Fig. 7.10a). The ridges are composed of
moderately to moderately-well sorted medium to fine sand (median size: 1.20 - 3.42 0;
SD: 0.52-0.83 0 ) with the bulk of the sediments similar fine-grained as the flanking
alluvium (Figs. 7.8,7.10a,b). Medium sand, as is characteristic for the bed material, is
found especially in the lower part of the ridges (Fig. 7.8). Correspondingly, the three
coarsest samples (EP0195-7, EP10-13, and EP10-5) in Figure 7.10b are all samples
collected form the lower half of the respective ridge (Fig. 7.8). Furthermore, the example
of the infilled Anabranch #2 (EP11; Figs. 7.6,7.8b, 7.9) illustrates that medium sand of
the bedload can be pushed up a ramp to about the height of ridge crests, and coarser
sediments may therefore also be expected to occur in the upper parts of some ridges.
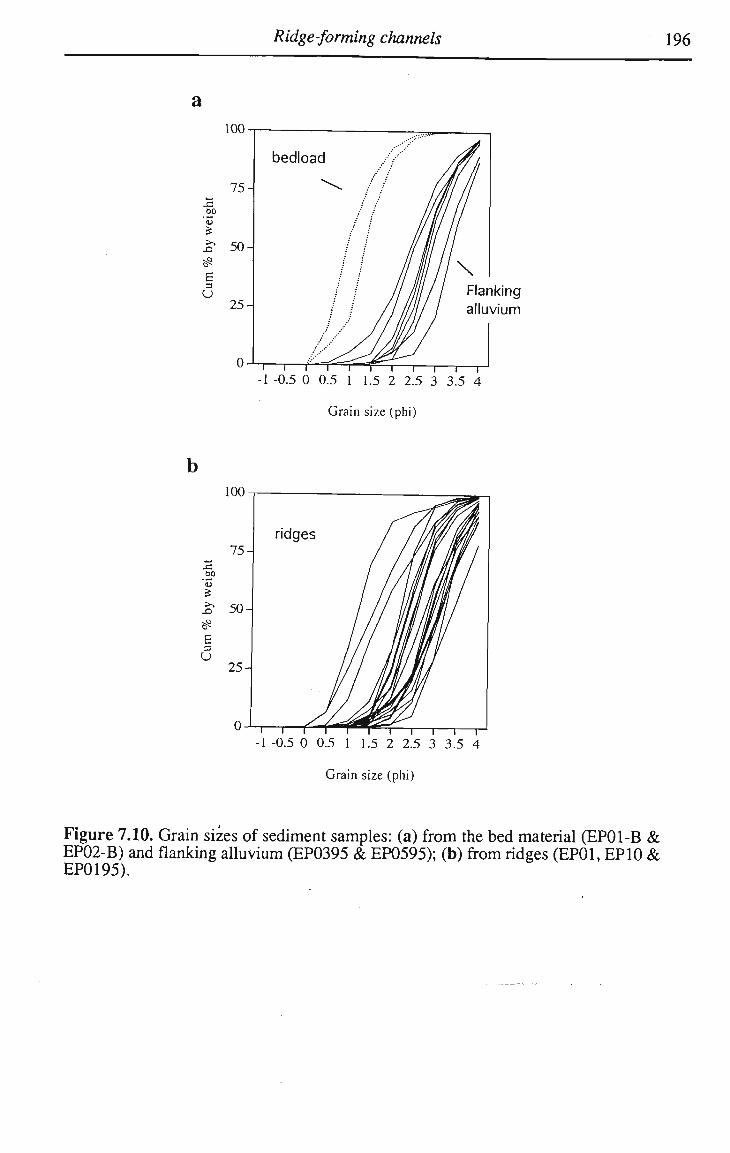
Ridge-forming channels 196
100
JS
on '5 XI
E
u
75 •
50-
25-
bedload
"i i i i i i i i — i — i — r -1 -0.5 0 0.5 1 1.5 2 2.5 3 3.5 4
Grain size (phi)
00
XI
E 3
U
" T — i — i — i — r •1 -0.5 0 0.5 1 1.5 2 2.5 3 3.5 4
Grain size (phi)
Figure 7.10. Grain sizes of sediment samples: (a) from the bed material (EP01-B & EP02-B) and flanking alluvium (EP0395 & EP0595); (b) from ridges (EP01, EP10 & EP0195).
Ridge-forming channels 197
7.4 Stream flow and sediment transport
A flow hydrograph has been recorded 2 km upstream of the top of the study reach
since 1967, but the data are unpublished and rating of the station is preliminary and of
relatively poor quality (pers. com. P. Clews, Water Authorities of Western Australia.).
However, for the purpose of this study the measured streamflow provides a much better
estimate than would be available otherwise. Between the station and the study reach, only
a few small gullies enter the trunk stream. This is not enough to significantiy affect the
estimated discharges at the study reach.
7.4.1 Hydraulic characteristics
The discharge regime of the Durack River strongly reflects the regions tropical climate
with a summer-rainfall flood regime (see Section 1.4, Tab. 1.2a). The largest recorded
flood (Q= 2000 m3/s) was only about 4 times larger than the median annual flood, but
this low ratio may only reflect the short 28 year record.
The study reach along the Durack River near Karunjie was visited for field work
during the dry seasons of 1993, 1994, and 1995. Debris lines, left by the peak flow of
the 1994/1995 wet season were used to estimate the water surface elevations for a given
discharge along the study reach. The recorded peak flow of this wet season was about
1000 m3/s, which is the fourth highest flood recorded. At cross-section A-A', this flood
reached a stage height of approximately 17.2 m, and at cross-section B-B', of about 17.0
m above the same arbitrary datum (Fig. 7.3b).
The mean flow velocities at the cross-sections were calculated from the continuity
equation
Q = vAc (7.1)
where Q=discharge (m3/s) in the total channel, v=mean velocity (m/s), and Across-
sectional area (m2) for the stage height at the respective cross-section (Tab. 7.1).
Ridge-forming channels 198
Combining the continuity equation with the well known Manning formula
v = n-'S^RV (7.2)
yields
nS"V2 = ACQ_1R2/3 (7.3)
where R=hydraulic radius (m), S is channel gradient, and n is the Manning roughness
parameter.
With the surveyed average channel gradient of 0.0008, this equation yields a
Manning's n of about 0.050 at cross-section A-A', and one of n=0.045 at cross-section
B-B' for the 1995 peak flow measured just upstream. The stage heights of other
discharges of interest were determined individually for each cross-section by keeping the
roughness parameter and the gradient constant for each cross-section (Tab. 7.1). The
various shortcomings of this simplistic approach are acknowledged here, including the
likely variation of n with flow stage, especially due to the changing effect of vegetation
on flow resistance. Flow resistance at discharges below bankfull may therefore be
somewhat reduced due to a reduced contact of the flow with the vegetation growing on
the ridges, but at the same time this reduction of flow resistance may be partly
compensated for by a relative increase in bed roughness along the anabranches.
Nevertheless, the numerical values presented here are meant only to illustrate the flow
characteristics of the ridge-form anabranching study channel and for this purpose the
quality of the data is considered to be sufficient
The time-weighted stream discharge duration curve of the mean daily values measured
between 1968 and 1993 shows that for 9 0 % of the time during February or March (the
months with the highest flows) discharge is less than 200 m3/s and water surface levels
are well below the top of the ridges (Figs. 7.3b, 7.11 & Tab. 7.1). During these months,
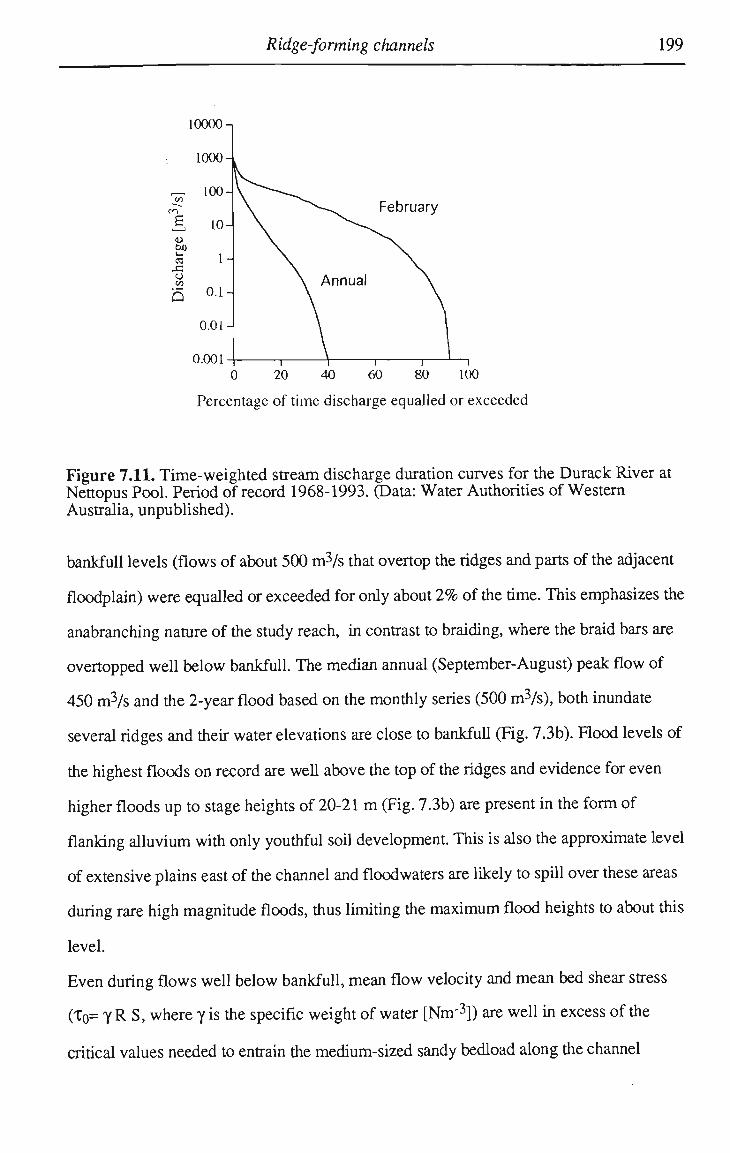
Ridge-forming channels 199
lOOOO-i
1000-
r— 100-
CJU 1— 03
o
0.01-
0.001
February
20 40 60 80 100
Percentage of time discharge equalled or exceeded
Figure 7.11. Time-weighted stream discharge duration curves for the Durack River at Nettopus Pool. Period of record 1968-1993. (Data: Water Authorities of Western Australia, unpublished).
bankfull levels (flows of about 500 m3/s that overtop the ridges and parts of the adjacent
floodplain) were equalled or exceeded for only about 2 % of the time. This emphasizes the
anabranching nature of the study reach, in contrast to braiding, where the braid bars are
overtopped well below bankfull. The median annual (September-August) peak flow of
450 m3/s and the 2-year flood based on the monthly series (500 m3/s), both inundate
several ridges and their water elevations are close to bankfull (Fig. 7.3b). Flood levels of
the highest floods on record are well above the top of the ridges and evidence for even
higher floods up to stage heights of 20-21 m (Fig. 7.3b) are present in the form of
flanking alluvium with only youthful soil development. This is also the approximate level
of extensive plains east of the channel and floodwaters are likely to spill over these areas
during rare high magnitude floods, thus limiting the maximum flood heights to about this
level.
Even during flows well below bankfull, mean flow velocity and mean bed shear stress
(To= Y R S, where y is the specific weight of water [Nnr3]) are well in excess of the
critical values needed to entrain the medium-sized sandy bedload along the channel
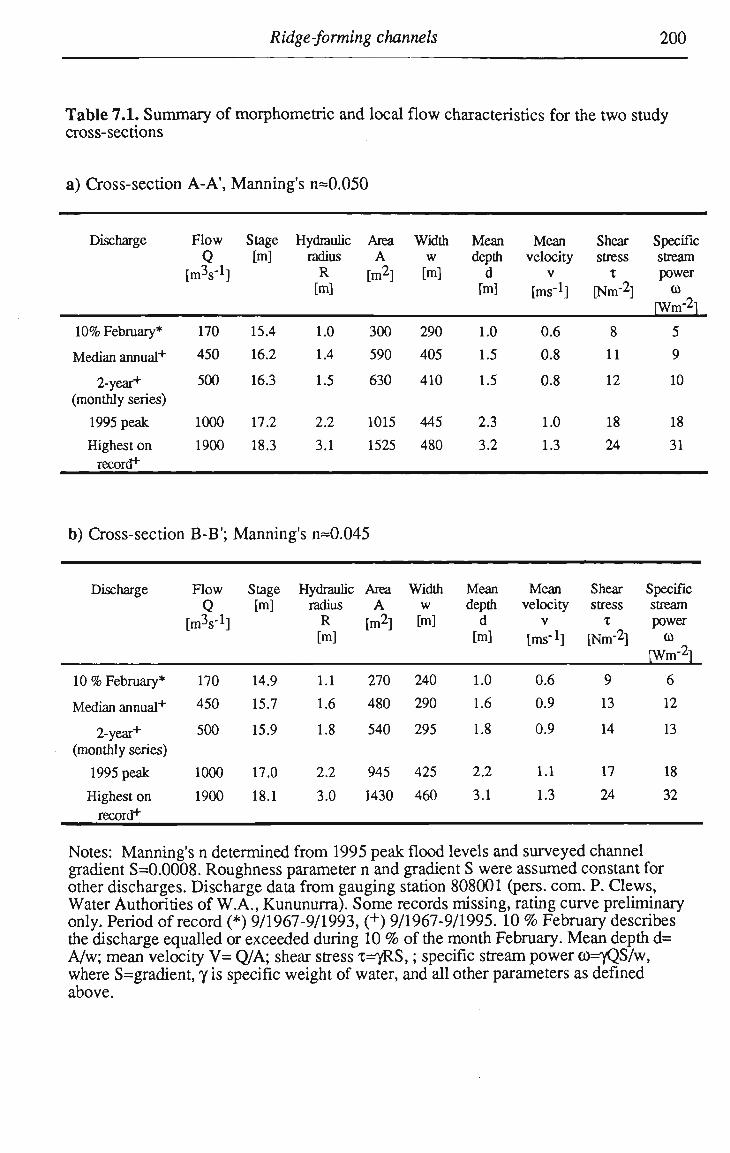
Ridge-forming channels 200
Table 7.1. Summary of morphometric and local flow characteristics for the two study cross-sections
a) Cross-section A-A', Manning's n=0.050
Discharge
1 0 % February*
Median annual+
2-year+
(monthly series)
1995 peak
Highest on
record+
Flow
Q tmV1]
170
450
500
1000
1900
Stage [m]
15.4
16.2
16.3
17.2
18.3
Hydraulic radius R [m]
1.0
1.4
1.5
2.2
3.1
Area A
rm'2i
300
590
630
1015
1525
Width w [m]
290
405
410
445
480
Mean depth d [m]
1.0
1.5
1.5
2.3
3.2
Mean velocity
V
[ms-1]
0.6
0.8
0.8
1.0
1.3
Shear stress
X
[Nnr2]
8
11
12
18
24
Specific stream power
CO
[Wnf2l
5
9
10
18
31
b) Cross-section B-B'; Manning's n=0.045
Discharge
10 % February*
Median annual+
2-year+
(monthly series)
1995 peak
Highest on
record"*"
Flow Q
[mV1]
170
450
500
1000
1900
Stage [m]
14.9
15.7
15.9
17.0
18.1
Hydraulic radius R [m]
1.1
1.6
1.8
2.2
3.0
Area A [m2l
270
480
540
945
1430
Width w [m]
240
290
295
425
460
Mean depth d [m]
1.0
1.6
1.8
2.2
3.1
Mean velocity
V
[ms"1]
0.6
0.9
0.9
1.1
1.3
Shear stress T
[Nnr2]
9
13
14
17
24
Specific stream power
CO
[Wm"2]
6
12
13
18
32
Notes: Manning's n determined from 1995 peak flood levels and surveyed channel gradient S=0.0008. Roughness parameter n and gradient S were assumed constant for other discharges. Discharge data from gauging station 808001 (pers. com. P. Clews, Water Authorities of W.A., Kununurra). Some records missing, rating curve preliminary only. Period of record (*) 9/1967-9/1993, (+) 9/1967-9/1995. 10 % February describes the discharge equalled or exceeded during 10 % of the month February. Mean depth d= A/w; mean velocity V = Q/A; shear stress T=*yRS,; specific stream power CO=TQS/W, where S=gradient, y is specific weight of water, and all other parameters as defined above.
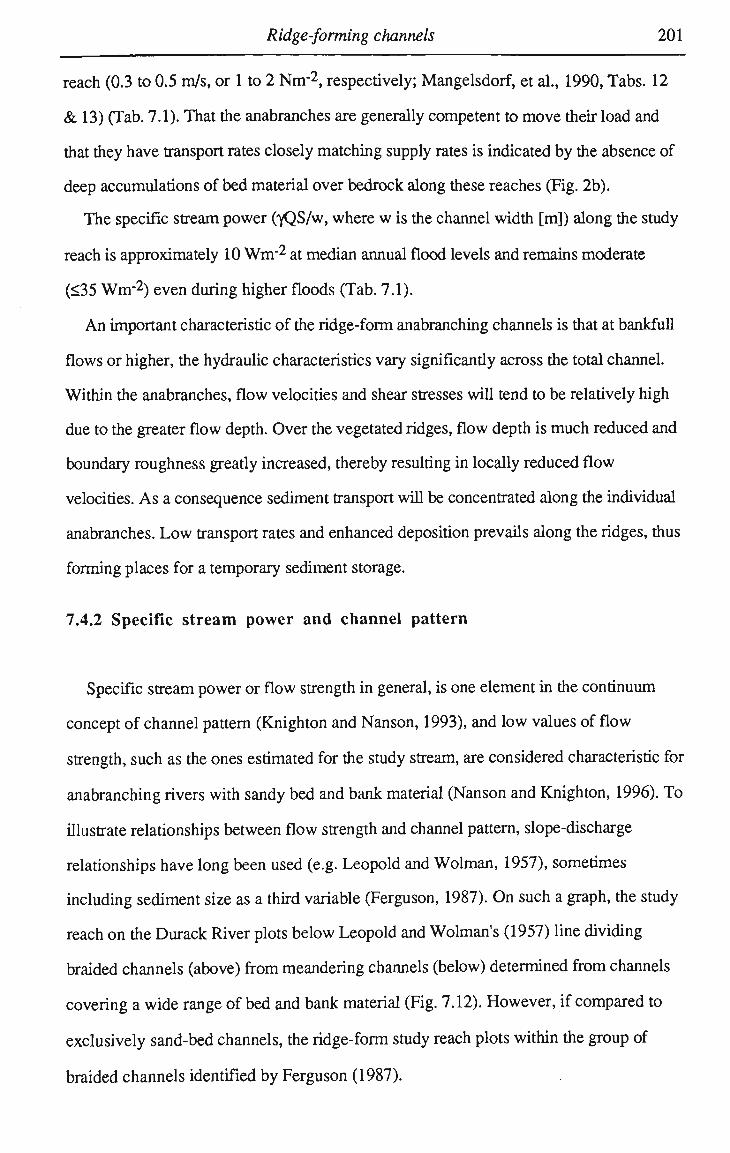
Ridge-forming channels 201
reach (0.3 to 0.5 m/s, or 1 to 2 Nnr 2 , respectively; Mangelsdorf, et al., 1990, Tabs. 12
& 13) (Tab. 7.1). That the anabranches are generally competent to move their load and
that they have transport rates closely matching supply rates is indicated by the absence of
deep accumulations of bed material over bedrock along these reaches (Fig. 2b).
The specific stream power (yQS/w, where w is the channel width [m]) along the study
reach is approximately 10 W n r 2 at median annual flood levels and remains moderate
(<35 W n r 2 ) even during higher floods (Tab. 7.1).
A n important characteristic of the ridge-form anabranching channels is that at bankfull
flows or higher, the hydraulic characteristics vary significantly across the total channel.
Within the anabranches, flow velocities and shear stresses will tend to be relatively high
due to the greater flow depth. Over the vegetated ridges, flow depth is much reduced and
boundary roughness greatly increased, thereby resulting in locally reduced flow
velocities. As a consequence sediment transport will be concentrated along the individual
anabranches. L o w transport rates and enhanced deposition prevails along the ridges, thus
forming places for a temporary sediment storage.
7.4.2 Specific stream power and channel pattern
Specific stream power or flow strength in general, is one element in the continuum
concept of channel pattern (Knighton and Nanson, 1993), and low values of flow
strength, such as the ones estimated for the study stream, are considered characteristic for
anabranching rivers with sandy bed and bank material (Nanson and Knighton, 1996). To
illustrate relationships between flow strength and channel pattern, slope-discharge
relationships have long been used (e.g. Leopold and Wolman, 1957), sometimes
including sediment size as a third variable (Ferguson, 1987). O n such a graph, the study
reach on the Durack River plots below Leopold and Wolman's (1957) line dividing
braided channels (above) from meandering channels (below) determined from channels
covering a wide range of bed and bank material (Fig. 7.12). However, if compared to
exclusively sand-bed channels, the ridge-form study reach plots within the group of
braided channels identified by Ferguson (1987).
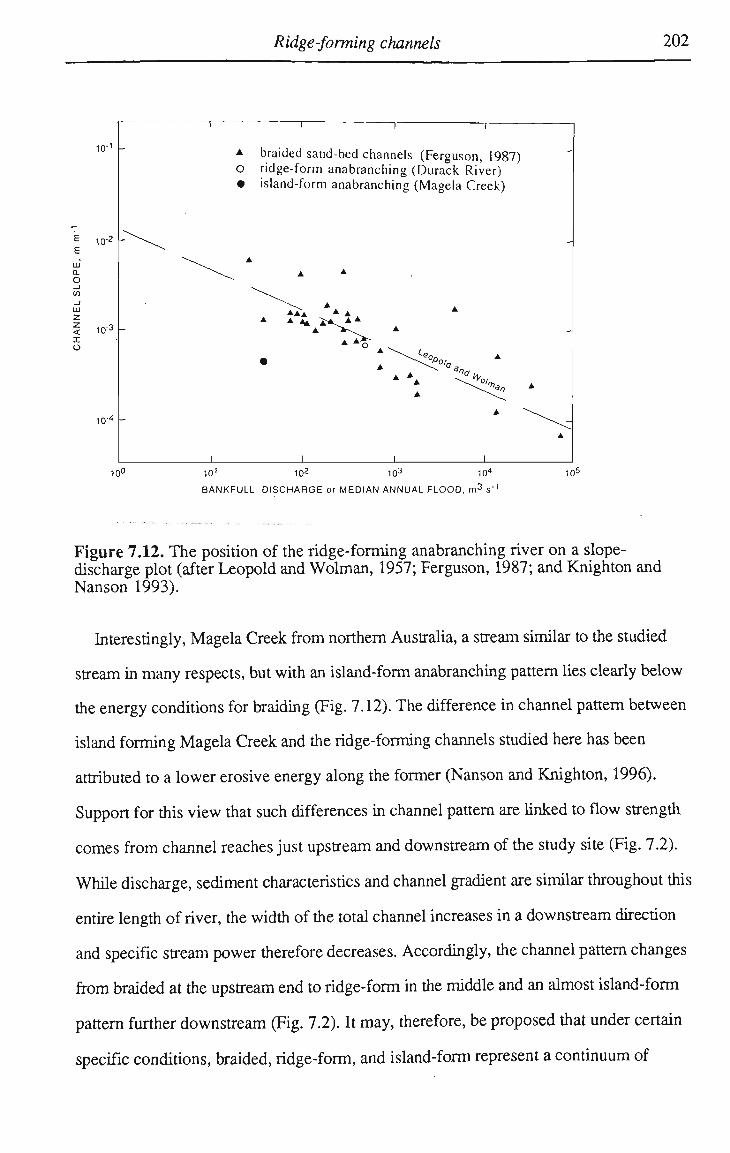
Ridge-forming channels 202
* braided sand-bed channels (Ferguson, 1987) o ridge-form anabranching (Durack River) • island-form anabranching (Magela Creek)
i i i i
10° 101 102 103 104 105
BANKFULL DISCHARGE or MEDIAN ANNUAL FLOOD, m3 s"1
Figure 7.12. The position of the ridge-forming anabranching river on a slope-discharge plot (after Leopold and Wolman, 1957; Ferguson, 1987; and Knighton and Nanson 1993).
Interestingly, Magela Creek from northern Australia, a stream similar to the studied
stream in many respects, but with an island-form anabranching pattern lies clearly below
the energy conditions for braiding (Fig. 7.12). The difference in channel pattern between
island forming Magela Creek and the ridge-forming channels studied here has been
attributed to a lower erosive energy along the former (Nanson and Knighton, 1996).
Support for this view that such differences in channel pattern are linked to flow strength
comes from channel reaches just upstream and downstream of the study site (Fig. 7.2).
While discharge, sediment characteristics and channel gradient are similar throughout this
entire length of river, the width of the total channel increases in a downstream direction
and specific stream power therefore decreases. Accordingly, the channel pattern changes
from braided at the upstream end to ridge-form in the middle and an almost island-form
pattern further downstream (Fig. 7.2). It may, therefore, be proposed that under certain
specific conditions, braided, ridge-form, and island-form represent a continuum of
Ridge-forming channels 203
channel pattern determined by flow strength relative to bank resistance. A similar
sequence of channel pattern change has been reported by Smith and Smith (1980) from a
gravel-bed stream in Canada. There, a single braided channel reach is linked with an
anabranching reach by a transitional zone consisting of vegetated elongated silt islands
surrounded by gravel-bed braided channels, and the change in pattern appears to be
linked to a decline in gradient along the reach. However, more detailed studies of ridge-
and island forming anabranching rivers are needed to substantiate any such relationships.
7.4.3 Channel adjustment
Nanson and Knighton (1996) in their general account of anabranching rivers reasoned
that streams m a y form relatively narrow and deep anabranches in order to concentrate
flow and shear stress. In situations where it is not possible to increase channel slope, this
would enable rivers to transport sediment and water more efficiendy than in a shallower
and wider single channel. Using basic hydraulic relationships, Nanson and Huang (in
press) demonstrate that multiple channels may indeed have such an advantage over their
single channel counterparts, but only under conditions where vegetation or cohesive bank
sediment will allow multiple low width-depth ratio channels to form.
The study river significantly increases in width when it enters the alluvial reach just
downstream of a bedrock reach (Fig. 7.2). This may require adjustment of channel
gradient or channel form in order to maintain sediment transport. However, the stream is
already nearly straight and flows with a veneer of sandy bed material over bedrock, with
little possibility of steepening its gradient. In addition, the presence of within-channel
vegetation in this widened section of valley may also influence the formation of ridges,
for it is well known that riparian vegetation can influence fluvial processes, and vice
versa. The distribution of the riparian vegetation in semi-arid regions is largely controlled
by the availability of water (Hupp and Osterkamp, 1996), and dense woody vegetation is
generally only found within or close to channels. In the seasonally arid study region,
wide obstruction-free sandy channels are not present, for channels generally contain trees
and shrubs, frequendy with accumulations of flood debris on their upstream side. Such

Ridge-forming channels 204
within-channel vegetation and associated debris barriers can be the major if not dominant
source for channel roughness in dryland rivers (Graeme and Dunkerley, 1993), and
within-channel tree growth may therefore result in a significant reduction of mean flow
velocities. As sediment transport is a power function of mean flow velocity with
exponents ranging from 3 to 6 (Colby, 1964; Karim and Kennedy, 1990), the presence
of within-channel vegetation may increase boundary roughness and reduce flow velocity
to levels where sediment throughput is no longer maintained and depositional adjustment
occurs. As slope can not be increased in the study channel, deposition of ridges or
islands in the channel will lead to a reduction in total channel width. The resulting
increase in depth and flow velocity will serve two purposes. Firsdy, it leads to an
increase in the rate of sediment transport per unit width, adjusting total sediment
discharge to rates of sediment supply from upstream. Secondly, an increase in flow depth
and this with a highly mobile bed will help to prevent vegetation from establishing on the
bed and obstructing the flow.
In the study stream, the deposition of ridges seems to be a response to locally reduced
transport capacity caused by increased valley width and excessive within-channel tree
growth.
7.5 Ridge and channel formation
Anabranching systems can be produced either by avulsion-based or accretion-based
processes (Nanson and Knighton, 1996). In accreting systems, the breaching of levees
and associated deposition of crevasse-splays has been widely observed to initiate the
development of new levee-flanked channels on the floodplain (e.g. Smith and Smith,
1980; Smith, 1983; Smith, et al, 1989). However, anabranches can also be scoured into
the floodplain by floodwaters concentrated on the lower parts of the floodplain (Brizga
and Finnlayson, 1990), and incision of such new channels can occur by headward
cutting (Schumann, 1989; Miller, 1991). Anabranch development by avulsion involves
the diversion of channel flow into a new channel or palaeochannel at a lower level on the
Ridge-forming channels 205
floodplain. Characteristically, such new channels are separated from the main channel by
a remnant of a formerly contiguous floodplain.
Accretion-based processes lead to the development of semi-permanent islands (or
ridges) of approximately floodplain height within the channel. These islands were never
part of a former floodplain, but formed by accretion of within-channel features. Most of
the ridges along the study reach and at many other locations in the region appear to be the
product of such within-channel accretion, a process which is the main focus of this
study. However, at several sites in the region, erosion based processes seem to be
responsible for the development of multiple channels divided by elongated islands
excised from the floodplain. These islands are morphologically and sedimentologically
very similar to the ridges described above. For the sake of completeness, erosional
anabranches are discussed at the end of this section.
7.5.1 Accretion based processes
Along most anabranching reaches in the study area, the dividing ridges form by
vertical accretion thereby dividing the total channel system. Sedimentological similarities
suggest that ridges and levees form by similar depositional processes. At flow stages in
excess of bankfull, flow in an anabranch spills across the adjacent ridges where flow
competence is reduced by sharply reduced depths and by vegetation, and the coarser
fraction of the suspended load is deposited. However, while this is a simple explanation
for the vertical accretion and maintenance of existing ridges to a height of about that of the
floodplain, the question remains as to what causes the formation of the ridges in the first
place. It is proposed here that several interacting factors trigger the development of
streamlined ridges.
Vegetation. Vegetation appears to be essential in several ways. Firstly, trees
growing within the channel act as obstructions to flow and promote lee-side deposition in
the form of a tail of sandy sediment. The resultant downstream extension of such current
shadows from one tree to the next probably provides the initial ridge-forming conditions.
Furthermore, along several streams of the study region, uprooted M. Leucadendron trees
Ridge-forming channels 206
were observed deposited aligned parallel to flow and supporting lines of new trees on
their trunks. Commonly these fallen trees were already largely covered by sandy deposits
and sand shadows were also found downstream of them. Secondly, once the ridges have
formed, tree growth and associated root mats make them more stable, for otherwise they
would disintegrate during floods.
Within the total channel, vegetation growth and sediment transport appear to be subject
to a mutual interaction. The vegetation on the ridges reduces mean flow velocities,
triggers deposition and vertical accretion which leads subsequentiy to reduced flooding of
the ridges and further vegetation growth. This in turn results in increased flow depth and
greater velocities and bed shear stresses in the anabranches which become zones of
higher sediment transport and more frequent bed mobility. As a consequence, the growth
of vegetation along the anabranches is hampered and the channels are left as sandy-
floored conduits largely free of obstructions. The number and size of anabranches
appears to be determined by the hydraulics of flow (Nanson and Huang, in press).
Sediment. The inferred vertical accretion of the ridges requires that there is sufficient
sandy sediment transported in suspension by turbulent mixing, for the ridges are usually
too steep-sided to receive bedload. This suspended sediment must also be readily
deposited in areas where flow velocities are reduced. Therefore, an abundance of fine to
medium sands in the sediment load appears to be beneficial for ridge development.
Flow regime. The highly seasonal flow regime of the rivers provides conditions
leading to within-channel tree growth (especially M. leucadendron) along the seasonally
dry sections of the sandy channel bed. Frequent overbank flows during the wet season
promote the vertical accretion of ridges and a range of flows guarantee irrigation of the
riparian vegetation.
Secondary flow. In wide straight rivers, longitudinal bedforms known as sand
ribbons or streaks (Vanoni, 1946) have been widely observed and their formation has
been attributed to secondary flow in the form of pairs of counter-rotating longitudinal
vortices (e.g. Karcz, 1966; Culbertson, 1967; see also review by Allen, 1982, Vol. 2,
pp. 1-52). Several such pairs of cells spaced across the flow produce alternating regions
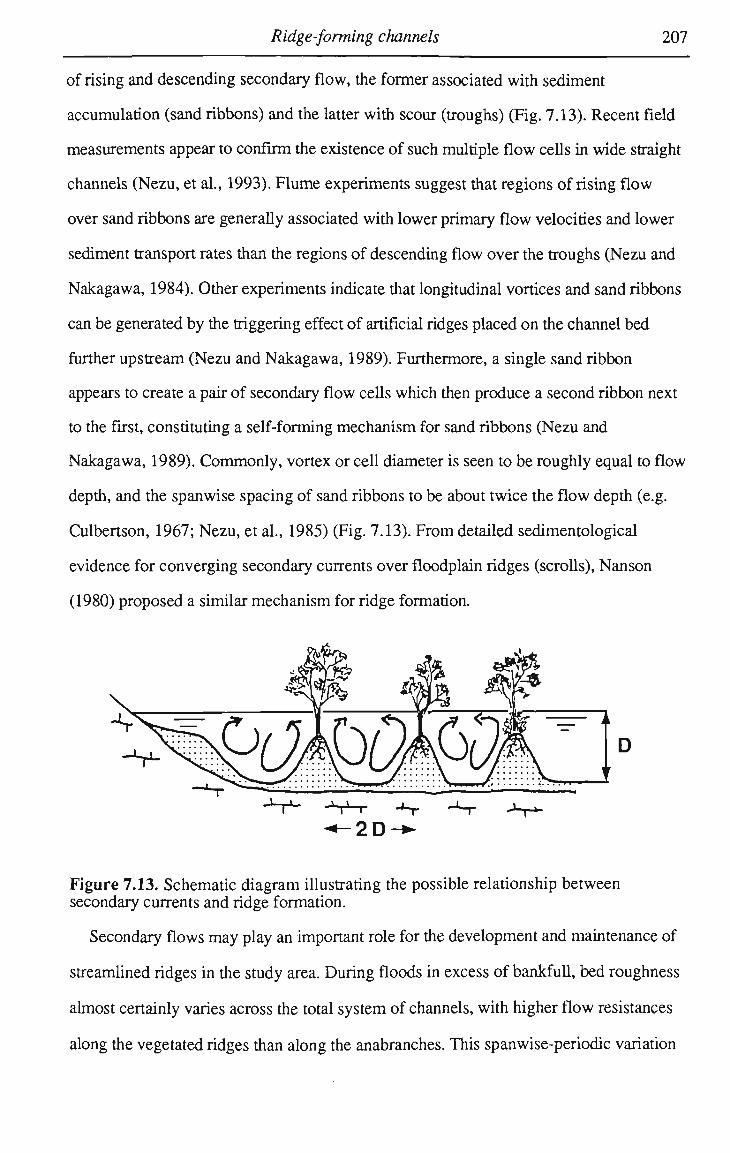
Ridge-forming channels 207
of rising and descending secondary flow, the former associated with sediment
accumulation (sand ribbons) and the latter with scour (troughs) (Fig. 7.13). Recent field
measurements appear to confirm the existence of such multiple flow cells in wide straight
channels (Nezu, et al., 1993). Flume experiments suggest that regions of rising flow
over sand ribbons are generally associated with lower primary flow velocities and lower
sediment transport rates than the regions of descending flow over the troughs (Nezu and
Nakagawa, 1984). Other experiments indicate that longitudinal vortices and sand ribbons
can be generated by the triggering effect of artificial ridges placed on the channel bed
further upstream (Nezu and Nakagawa, 1989). Furthermore, a single sand ribbon
appears to create a pair of secondary flow cells which then produce a second ribbon next
to the first, constituting a self-forming mechanism for sand ribbons (Nezu and
Nakagawa, 1989). Commonly, vortex or cell diameter is seen to be roughly equal to flow
depth, and the spanwise spacing of sand ribbons to be about twice the flow depth (e.g.
Culbertson, 1967; Nezu, et al., 1985) (Fig. 7.13). From detailed sedimentological
evidence for converging secondary currents over floodplain ridges (scrolls), Nanson
(1980) proposed a similar mechanism for ridge formation.
-•-2D-*-
Figure 7.13. Schematic diagram illustrating the possible relationship between secondary currents and ridge formation.
Secondary flows may play an important role for the development and maintenance of
streamlined ridges in the study area. During floods in excess of bankfull, bed roughness
almost certainly varies across the total system of channels, with higher flow resistances
along the vegetated ridges than along the anabranches. This spanwise-periodic variation

Ridge-forming channels 208
of roughness is by itself sufficient to cause variations of mean flow velocities and
probably also secondary circulations (Allen, 1982, Vol. 2, pp. 9-11). Such secondary
currents will ensure that sediment is not only transported downstream in the anabranches,
but that a proportion of it is swept to each side of the channel where the coarser fraction
of the suspended load may than be deposited along the low-velocity zones over the
ridges.
Secondary currents may also help to explain the longitudinal growth of the ridges and
their transverse frequency within the total channel system. As in the flume experiments
described above, an initial 'ridge', such as a line of trees linked by a series of sandy
current shadows, m a y trigger the development of helical flow cells and the subsequent
downstream growth of an initial ridge. In rum, the eventual growth of stabilising
vegetation would strengthen the secondary circulation and promote further vertical and
downstream accretion along the ridge. In addition, the secondary flows created by a ridge
have been shown in a flume to trigger the accumulation or erosion of sediment along lines
parallel to this ridge (Nezu and Nakagawa, 1989). In this respect, the diameter of the
cells of secondary flow generated could influence the width of the anabranch and the
spacing of the ridges. Measurements in laboratory flumes (Nezu at al., 1985; Nezu and
Nakagawa, 1989) and in straight wide rivers (Nezu et al., 1993) indicate that the diameter
of a pair of counter-rotating secondary flow cells is approximately equal to twice the flow
depth. Along the study reach, the maximum flow depths during the largest floods on
record are about 5 m (Fig. 7.3b). The average bed width of the anabranches (10-15 m ) is
about 2-3 times this flow depth, remarkably close to the ideal width expected for
anabranches containing a pair of longitudinal vortices with a vortex diameter equal to
flow depth (Fig. 7.13).
Although it appears likely that secondary circulations influence the development and at
least the initial spacing of channel ridges, answers for the exact mechanisms involved and
for the scaling of flow cells relative to flow depth will have to await flume studies and
field measurements under controlled conditions.
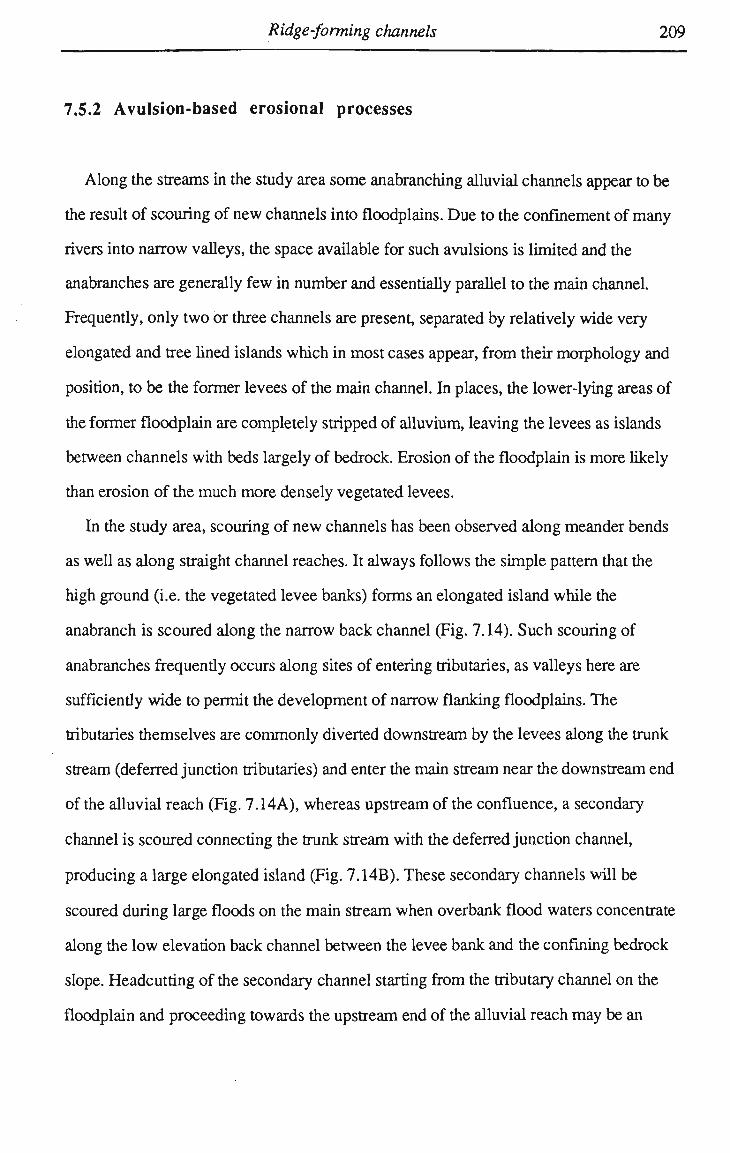
Ridge-forming channels 209
7.5.2 Avulsion-based erosional processes
Along the streams in the study area some anabranching alluvial channels appear to be
the result of scouring of new channels into floodplains. Due to the confinement of many
rivers into narrow valleys, the space available for such avulsions is limited and the
anabranches are generally few in number and essentially parallel to the main channel.
Frequently, only two or three channels are present separated by relatively wide very
elongated and tree lined islands which in most cases appear, from their morphology and
position, to be the former levees of the main channel. In places, the lower-lying areas of
the former floodplain are completely stripped of alluvium, leaving the levees as islands
between channels with beds largely of bedrock. Erosion of the floodplain is more likely
than erosion of the much more densely vegetated levees.
In the study area, scouring of new channels has been observed along meander bends
as well as along straight channel reaches. It always follows the simple pattern that the
high ground (i.e. the vegetated levee banks) forms an elongated island while the
anabranch is scoured along the narrow back channel (Fig. 7.14). Such scouring of
anabranches frequendy occurs along sites of entering tributaries, as valleys here are
sufficiendy wide to permit the development of narrow flanking floodplains. The
tributaries themselves are commonly diverted downstream by the levees along the trunk
stream (deferred junction tributaries) and enter the main stream near the downstream end
of the alluvial reach (Fig. 7.14A), whereas upstream of the confluence, a secondary
channel is scoured connecting the trunk stream with the deferred junction channel,
producing a large elongated island (Fig. 7.14B). These secondary channels will be
scoured during large floods on the main stream when overbank flood waters concentrate
along the low elevation back channel between the levee bank and the confining bedrock
slope. Headcutting of the secondary channel starting from the tributary channel on the
floodplain and proceeding towards the upstream end of the alluvial reach may be an

Ridge-forming channels 210
important process, as is suggested by observations of anabranch development made
elsewhere (Miller, 1991).
Some tributaries join their trunk channels not only at deferred junctions downstream of
their mouth, but also through an additional breach in the levee directly opposite the
tributary mouth (Fig. 7.14B). Such breaks in the main levees may form as a result of
isolated large floods along the entering tributaries when the tributary's flood waters spill
over the main levee into the trunk channel (Fig. 7.14B).
Figure 7.14. Schematic diagram illustrating common situations of anabranch development by avulsion. Typically, anabranches are scoured into the narrow floodplains leaving the high ground of the well-vegetated levees along the main channels standing as elongated islands. Floods from the tributaries may lead to the formation of an additional more direct breach in the levee opposite the mouth of the tributary valley.
7.6 The Chapman River confluence
An unusual example of an anabranching channel reach is found at Fine Pool (Fig.
7.15), a large dry season waterhole along the Durack River some 40 km downstream of
Karunjie (Fig. 7.1). The two prominent islands here are the likely remnants of former
more extensive levees. Just upstream of those islands enters the Chapman River with a
basin area of some 3400 km2. Above the confluence, the Durack River with a basin area
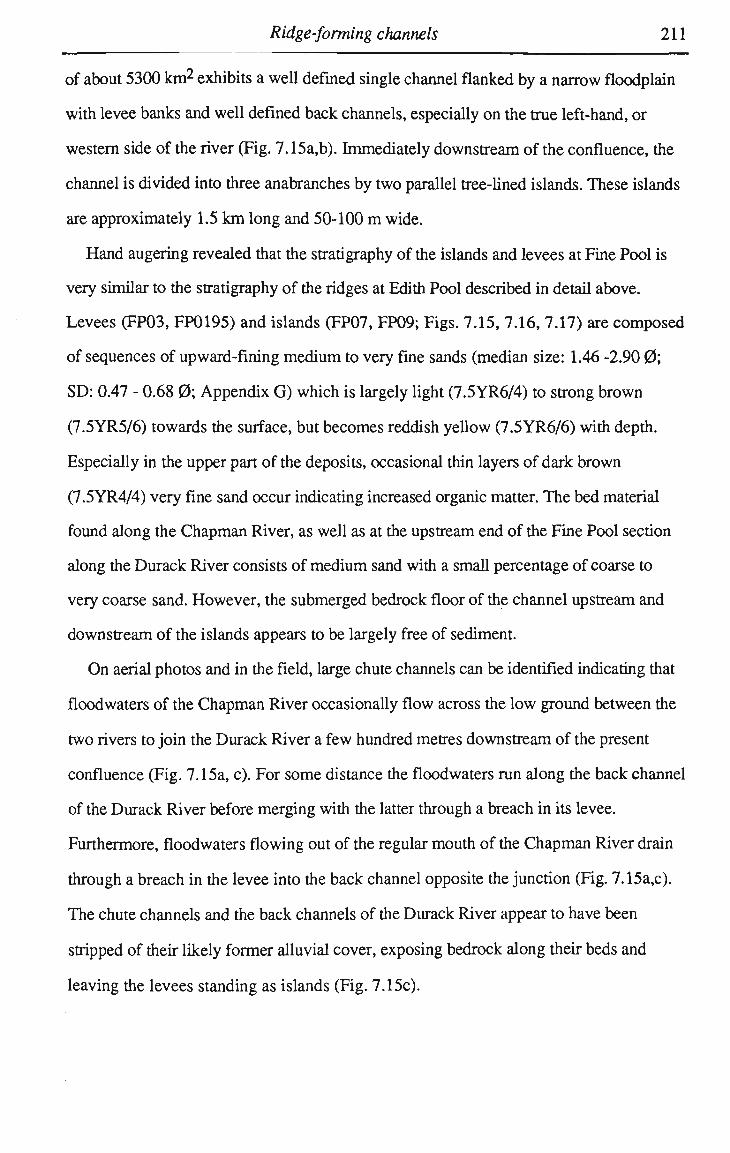
Ridge-forming channels 111
of about 5300 k m 2 exhibits a well defined single channel flanked by a narrow floodplain
with levee banks and well defined back channels, especially on the true left-hand, or
western side of the river (Fig. 7.15a,b). Immediately downstream of the confluence, the
channel is divided into three anabranches by two parallel tree-lined islands. These islands
are approximately 1.5 k m long and 50-100 m wide.
Hand augering revealed that the stratigraphy of the islands and levees at Fine Pool is
very similar to the stratigraphy of the ridges at Edith Pool described in detail above.
Levees (FP03, FP0195) and islands (FP07, FP09; Figs. 7.15, 7.16, 7.17) are composed
of sequences of upward-fining medium to very fine sands (median size: 1.46 -2.90 0;
SD: 0.47 - 0.68 0; Appendix G ) which is largely light (7.5YR6/4) to strong brown
(7.5YR5/6) towards the surface, but becomes reddish yellow (7.5YR6/6) with depth.
Especially in the upper part of the deposits, occasional thin layers of dark brown
(7.5YR4/4) very fine sand occur indicating increased organic matter. The bed material
found along the Chapman River, as well as at the upstream end of the Fine Pool section
along the Durack River consists of medium sand with a small percentage of coarse to
very coarse sand. However, the submerged bedrock floor of the channel upstream and
downstream of the islands appears to be largely free of sediment.
O n aerial photos and in the field, large chute channels can be identified indicating that
floodwaters of the Chapman River occasionally flow across the low ground between the
two rivers to join the Durack River a few hundred metres downstream of the present
confluence (Fig. 7.15a, c). For some distance the floodwaters run along the back channel
of the Durack River before merging with the latter through a breach in its levee.
Furthermore, floodwaters flowing out of the regular mouth of the Chapman River drain
through a breach in the levee into the back channel opposite the junction (Fig. 7.15a,c).
The chute channels and the back channels of the Durack River appear to have been
stripped of their likely former alluvial cover, exposing bedrock along their beds and
leaving the levees standing as islands (Fig. 7.15c).
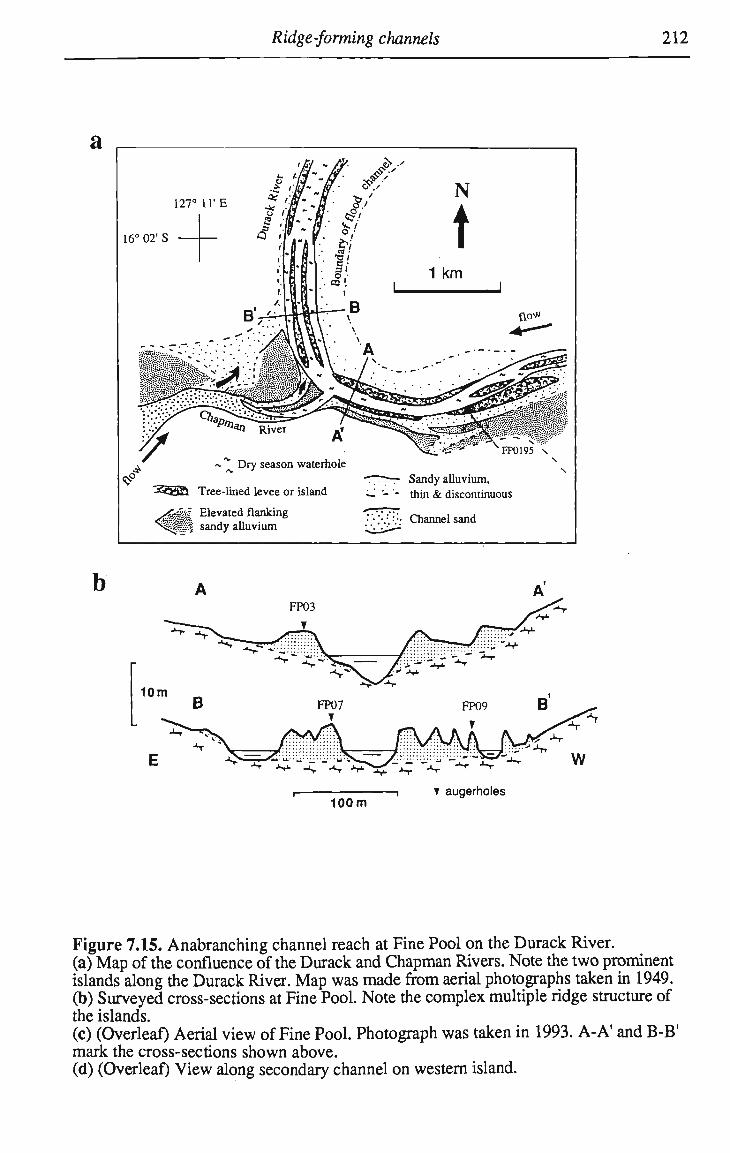
Ridge-forming channels 212
a
127° 11'E
16° 02' S
J^OSSS Tree-lined levee or island
<ggjgf Elevated flanking •®ii§ sandy alluvium
<S-' FP0195 \
Sandy alluvium, — - - thin & discontinuous
•''• .'•/.•'•• Channel sand
10m
100m T augerholes
Figure 7.15. Anabranching channel reach at Fine Pool on the Durack River. (a) M a p of the confluence of the Durack and Chapman Rivers. Note the two prominent islands along the Durack River. Map was made from aerial photographs taken in 1949. (b) Surveyed cross-sections at Fine Pool. Note the complex multiple ridge structure of the islands. (c) (Overleaf) Aerial view of Fine Pool. Photograph was taken in 1993. A-A* and B-B' mark the cross-sections shown above. (d) (Overleaf) View along secondary channel on western island.
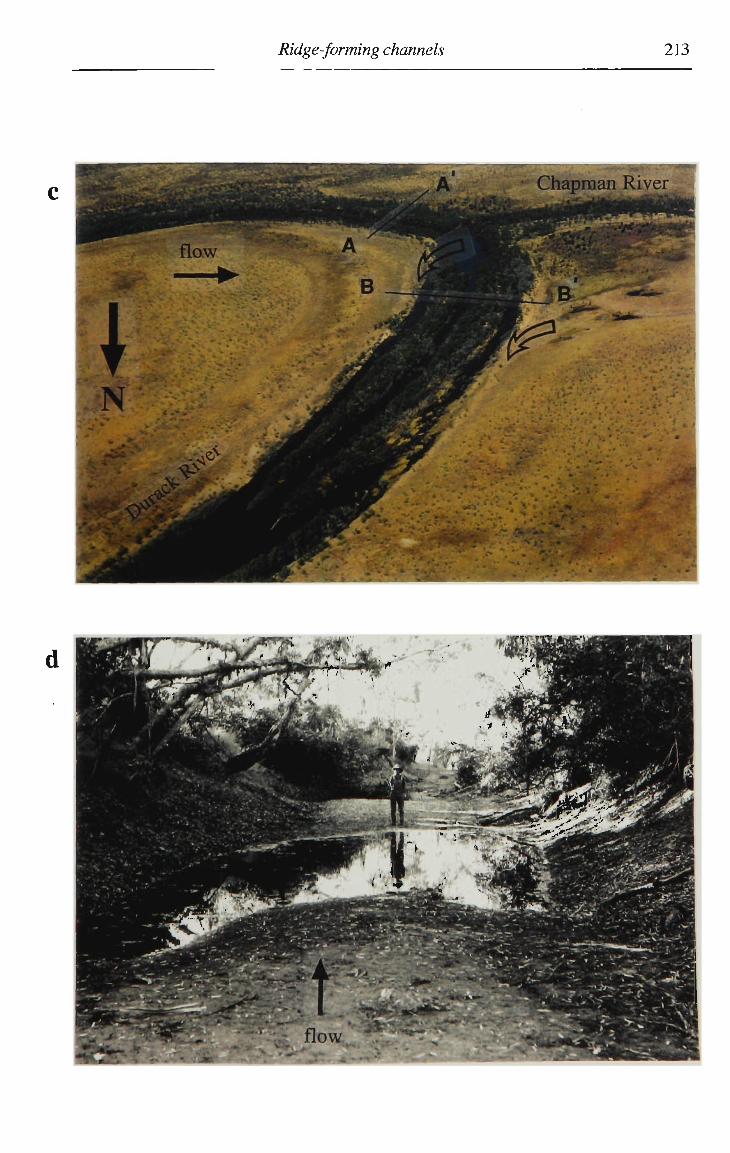
Ridge-forming channels 213
rtt^i
iJ?lfe-ye.]
• ' IT
.) .#1 : V
!
I*** "J > -rf".-'
I
f flow
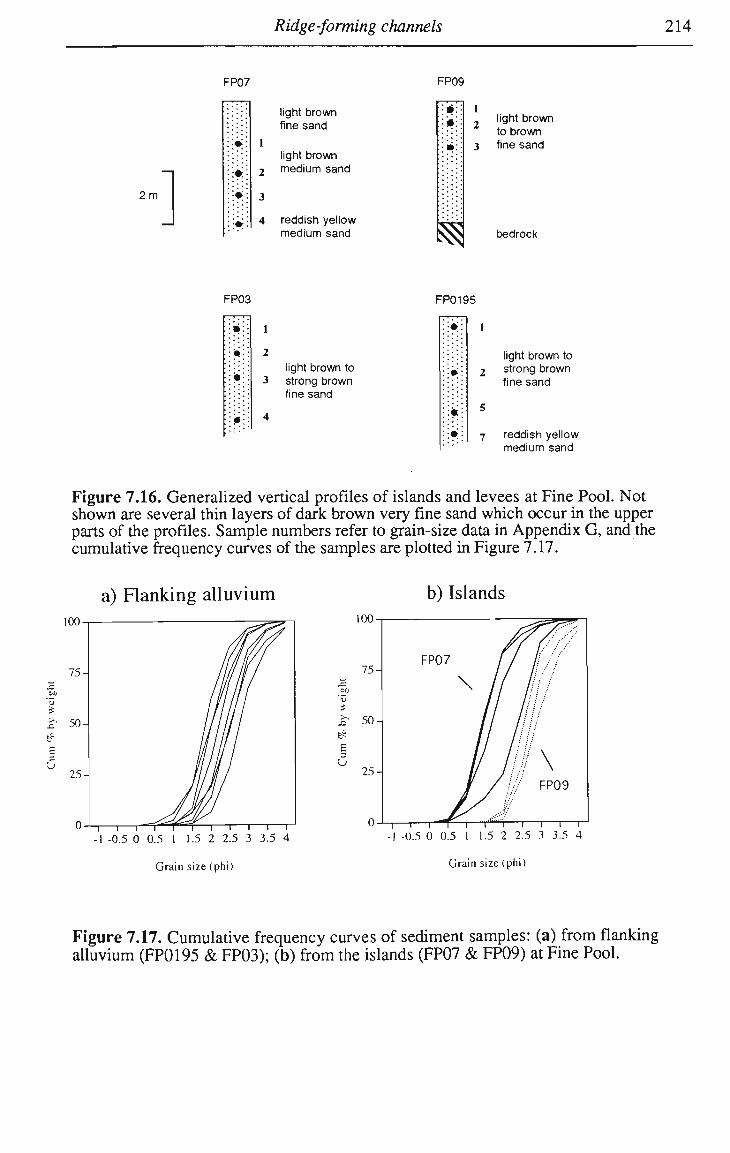
Ridge-forming channels 214
FP07 FP09
2m
light brown fine sand
light brown medium sand
reddish yellow medium sand
1 light brown to brown
3 fine sand
bedrock
FP03 FP0195
1
2 light brown to
3 strong brown fine sand
light brown to 2 strong brown
fine sand
7 reddish yellow medium sand
Figure 7.16. Generalized vertical profiles of islands and levees at Fine Pool. Not shown are several thin layers of dark brown very fine sand which occur in the upper parts of the profiles. Sample numbers refer to grain-size data in Appendix G, and the cumulative frequency curves of the samples are plotted in Figure 7.17.
a) Flanking alluvium b) Islands
- | — i — i — i — I — i — i i i i r -1 -0.5 0 0.5 1 1.5 2 2.5 3 3.5 4
Grain size (phi)
E
u
Grain size (phi)
Figure 7.17. Cumulative frequency curves of sediment samples: (a) from flanking alluvium (FP0195 & FP03); (b) from the islands (FP07 & FP09) at Fine Pool.
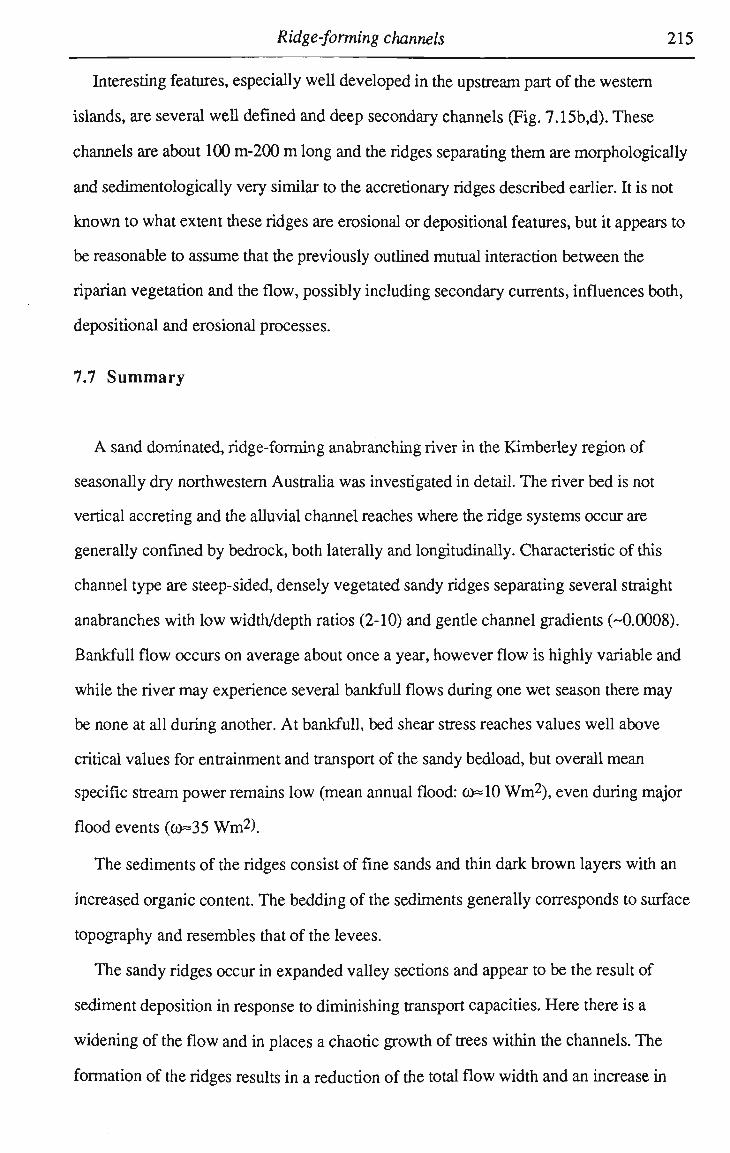
Ridge-forming channels 215
Interesting features, especially well developed in the upstream part of the western
islands, are several well defined and deep secondary channels (Fig. 7.15b,d). These
channels are about 100 m-200 m long and the ridges separating them are morphologically
and sedimentologically very similar to the accretionary ridges described earlier. It is not
known to what extent these ridges are erosional or depositional features, but it appears to
be reasonable to assume that the previously outlined mutual interaction between the
riparian vegetation and the flow, possibly including secondary currents, influences both,
depositional and erosional processes.
7.7 S u m m a r y
A sand dominated, ridge-forming anabranching river in the Kimberley region of
seasonally dry northwestern Australia was investigated in detail. The river bed is not
vertical accreting and the alluvial channel reaches where the ridge systems occur are
generally confined by bedrock, both laterally and longitudinally. Characteristic of this
channel type are steep-sided, densely vegetated sandy ridges separating several straight
anabranches with low width/depth ratios (2-10) and gende channel gradients (~0.0008).
Bankfull flow occurs on average about once a year, however flow is highly variable and
while the river may experience several bankfull flows during one wet season there may
be none at all during another. At bankfull, bed shear stress reaches values well above
critical values for entrainment and transport of the sandy bedload, but overall mean
specific stream power remains low (mean annual flood: 0>=10 W m 2 ) , even during major
flood events (o>=35 W m 2 ) .
The sediments of the ridges consist of fine sands and thin dark brown layers with an
increased organic content. The bedding of the sediments generally corresponds to surface
topography and resembles that of the levees.
The sandy ridges occur in expanded valley sections and appear to be the result of
sediment deposition in response to diminishing transport capacities. Here there is a
widening of the flow and in places a chaotic growth of trees within the channels. The
formation of the ridges results in a reduction of the total flow width and an increase in
Ridge-forming channels 216
water depth, mean flow velocity, and bed shear to levels sufficient to maintain or enhance
sediment transport.
The ridges themselves seem to form as the product of an interaction between abundant
within-channel vegetation and flow, possibly under the influence of secondary flow cells.
Lines of current shadows formed in the lee of within-channel trees appear to represent an
initial stage of ridge formation, followed by vertical accretion of the ridges to about
floodplain height. For flows exceeding bankfull, the total flow system is transversely
subdivided into zones of restricted flow velocities over the vegetated ridges and zones of
enhanced flow velocities over the vegetation-free anabranching channels. This spanwise
variation of local flow resistance, flow velocity, and bed shear stress promotes further
sediment accumulation and vegetation growth along ridges, while along anabranches
sediment transport rates and bed mobility are increased and trees are prevented from
establishing growth. A s a consequence, what would otherwise be a chaotic mix of
channels and trees becomes an ordered system of linear well-vegetated ridges and
unobstructed channels.
Anabranches separated from each other by very elongated and tree lined islands also
form by channel avulsion separating the levees from the rest of the narrow floodplain.
Scour of new channels occurs generally along the back channels of these floodplains
during large floods along the main channel and probably also as a result of floods along
entering tributaries.
Regardless of the mechanism, the formation of ridge-form channels organizes riparian
vegetation into a linear pattern, reduces flow resistance and maintains sediment transport
in many tropical rivers of northern Australia.
217
8. QUATERNARY STRATIGRAPHY AND CHRONOLOGY OF FLANKING ALLUVIAL SURFACES
In the study area, the occurrence of alluvial surfaces is largely restricted to the low
gradient sand-bed reaches found along the region's mixed alluvial-bedrock rivers.
Existing alluvial surfaces are generally narrow and discontinuous and they occur only
where the valley floors are wide enough to permit a body of sediment to accumulate
adjacent to the active river. Along such reaches, terrace-like features are often found
separated by scarps up to several metres high from adjacent narrow floodplains. These
terraces are not related to changes in the regional baselevel, such as eustatic sea level
fluctuations during the Quaternary, for they occur along reaches of river remote from any
coastal influences and upstream of long incised bedrock and boulder-bed reaches, nor are
they the product of tectonism (Chapters 1 & 4). Stream gradients along these alluvial
reaches are commonly constrained by outcrops of resistant bedrock that are almost
certainly eroded only slowly, a view supported by the mid to late Pleistocene ages
determined for boulder bars found nearly level with the thalweg of the Durack River
(Chapter 4). A s a consequence, these terraces must be related to other factors such as
extreme floods, possible complex response mechanisms (Schumm and Parker, 1973), or
Quaternary climate changes associated with changes to the monsoon in northwestern
Australia.
Terrace-like features have been shown to be the result of large floods, either by partial
stripping of flanking alluvium (e.g. Baker, 1977; Nanson, 1986; Miller and Parkinson,
1993), or by rebuilding of elevated alluvial surfaces during the wanning stages of large
floods (Gupta, 1983). Such floodplain formation and associated periodic destruction can
produce alluvial surfaces at very different elevations with a complex assemblage of
sediment bodies of varying age. The effects of large floods on the form and sediment
composition of the alluvial reaches appears particularly relevant for the study area, for the
region's much more resistant bedrock and boulder-bed reaches retain evidence for very
large and potentially destructive floods (Chapters 5 & 6). Furthermore, numerous valley
Quaternary 218
constrictions are found along the streams in the study area and it has been observed that
catastrophic erosion of valley fills can be associated with flood flows emerging from such
constrictions (Miller and Parkinson, 1993).
Neither the stratigraphy, nor the chronology of the alluvial surfaces in the study area
or elsewhere on the Kimberley Plateau have previously been investigated. In fact besides
isolated studies on palaeofloods using slackwater deposits (Gillieson, et al., 1991; Wohl,
et al., 1994a; 1994c), the only published chronology of late Quaternary alluvium in the
region originates from a creek at the margin of the Great Sandy Desert about 200 k m
southwest of Fitzroy Crossing (Wyrwoll, et al., 1992) (Fig. 8.1). However, in progress
are detailed investigations of floodplain and terrace deposits along the Fitzroy River
(University of Western Australia) and along the Ord River near Kununurra (University of
Wollongong) (Fig. 8.1), the two river systems in the region which potentially contain the
best preserved record of Quaternary flow regime changes.
Little is known about the late Pleistocene and Holocene history of the northwestern
Australian monsoon and it remains somewhat controversial whether the early to mid
Holocene saw increased monsoon activity in northern Australia when compared to the
late Holocene (Nanson, et al., 1991; 1993; 1995; Nott and Price, 1994; Nott, et al.,
1996b), or whether it was vice versa (Wyrwoll, et al., 1986; 1992). Besides being well
recorded in fluvial deposits (e.g. Nanson, et al., 1993; Nott, et al., 1996b), the onset of
monsoonal activity in northern Australia in the very late Pleistocene to early Holocene is
also indicated by strontium isotope variations in single valve ostracods from the Gulf of
Carpentaria in northeastern Australia (McCulloch, et al., 1989). More recent findings
from the eastern Kimberley (Wende, et al., in press), some of which are presented
below, also indicate monsoon activity in this region by the early Holocene.
A n original major objective of this study was to investigate in detail the stratigraphy
and chronology of alluvial deposits on the Kimberley Plateau for evidence of phases of
fluvial activity during the mid to late Pleistocene and Holocene. However, an early
reconnaissance of available alluvial sequences supported by their thermoluminescence
(TL) dating revealed that there appears to be very little Quaternary alluvium retained in
Quaternary 219
most of these bedrock valleys on the Kimberley Plateau. The valleys have probably been
affected by extensive erosion during the Holocene. For this reason, Cabbage Tree Creek
(Fig. 8.1) located about 150 k m east of the Durack River and not on the Kimberley
Plateau was selected for a detailed investigation, for here a more extensive alluvial record
of late Quaternary fluvial activity is found. Furthermore, at the Cabbage Tree Creek site,
evidence gained form the alluvial deposits can be complemented by evidence for aeolian
activity from a nearby dune.
Following some general remarks about limitations of the T L dating technique when
dating young alluvium and a general description of the character of floodplains in the
study area, the mechanisms of floodplain construction and erosion relevant here are
briefly reviewed. Then, details about the stratigraphy and age of alluvial deposits on the
Kimberley Plateau are presented and discussed. Finally, the stratigraphy and chronology
of the alluvial and adjacent aeolian deposits found at Cabbage Tree Creek are presented
and the results discussed in light of late Quaternary environmental changes in the region.
8.1 Study sites and some comments on TL dating
Alluvial surfaces were investigated along the Durack River at Fine and Edith Pool, and
along Karunjie Creek a short distance upstream of its confluence with the Durack River
(Fig. 8.1). Further study sites in the Durack River catchment are located along the lower
Horse Creek, a tributary between Edith and Fine Pool, and along Campbell Creek near
Ellenbrae homestead (Fig. 8.1). Samples for reconnaissance T L dating of alluvium found
elsewhere on the Kimberley Plateau were collected along the Gipp River, the Harm
River, the Drysdale River, and the Woodhouse River. At the Cabbage Tree Creek site
(Fig. 8.1) in the eastern Kimberley a more detailed chronology of floodplain alluvium
and adjacent aeolian sands was established.
A total of 34 T L dates were obtained from flanking alluvium and 3 T L dates from
aeolian sands near Cabbage Tree Creek. Organic materials suitable for conventional
radiocarbon dating, such as wood or charcoal, were only found in obviously m o d e m or
very young sediments, rendering the use of this method of no value in this study.
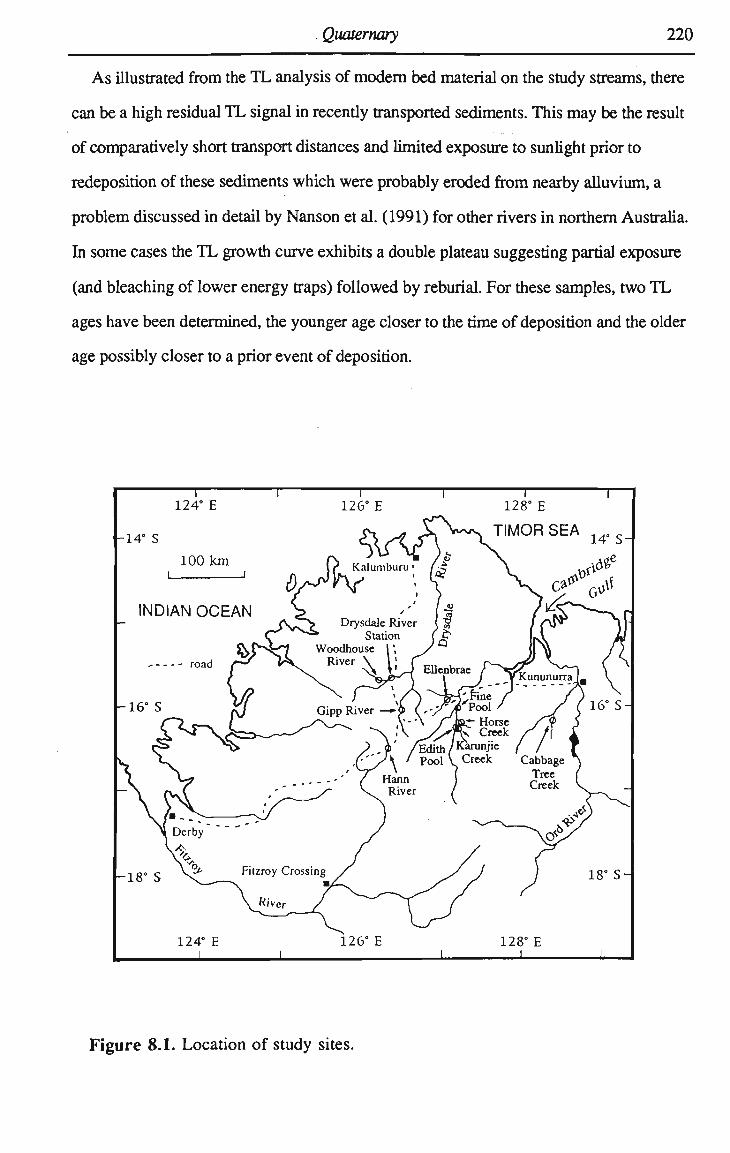
• Quaternary 220
As illustrated from the T L analysis of m o d e m bed material on the study streams, there
can be a high residual T L signal in recently transported sediments. This may be the result
of comparatively short transport distances and limited exposure to sunlight prior to
redeposition of these sediments which were probably eroded from nearby alluvium, a
problem discussed in detail by Nanson et al. (1991) for other rivers in northern Australia.
In some cases the T L growth curve exhibits a double plateau suggesting partial exposure
(and bleaching of lower energy traps) followed by reburial. For these samples, two T L
ages have been determined, the younger age closer to the time of deposition and the older
age possibly closer to a prior event of deposition.
Figure 8.1. Location of study sites.
Quaternary 111
For all samples, the surface residual TL, or T L starting point' at the time of
deposition, was assumed to be that measured following exposure to a laboratory U V
sunlamp, except for the three aeolian samples from the Cabbage Tree Creek site which
were surface corrected using m o d e m equivalents (Appendix H ) . The surface residual
correction using a sunlamp was applied uniformly to all alluvial samples, because suitable
m o d e m sediments yielding a consistent residual were not available. This laboratory
method almost certainly results in an overcorrection and the T L ages determined should
therefore be regarded as maximum values. By how much the age of a sample is
overestimated depends on the T L the sample retained at the time of deposition and the
annual radiation dose delivered to the sample. However, the older the sediment the less
significant the surface residual correction should become, for it will probably only
represent a smaller proportion of the total age. This may be illustrated with the help of an
example. A sample (W1840) collected from the floodplain flanking the Drysdale River
(Figs. 8.1, 8.6) yielded a maximum palaeodose (using the sunlamp method) of 21.4 ±
3.1 grays, resulting in a T L age of 13.3 ± 2.0 ka (Appendix H ) , while a sample (W1838)
collected nearby at a depth of 3 m from a tree-lined ridge yielded a maximum palaeodose
of 1.0 ± 0.3 grays which would yield an age of 2.2 ± 0.6 ka (Appendix H ) . The latter
sample showed evidence for incomplete T L bleaching (a double plateau) suggesting that
the maximum palaeodose given above refers to a previous depositional event and that the
palaeodose referring to the latest deposition is likely to be even less (0.4 ± 0.2 grays,
Appendix H ) which would give an age of 0.8 ± 0.4 ka. Assuming that neither age is
correct and in fact the ridge sample was deposited very recendy, its maximum palaeodose
can be used to define the maximum 'TL starting point' of the older sample W 1 8 4 0 (as
opposed to the correction using a sunlamp). The resulting reduction of the palaeodose of
the floodplain sample W 1 8 4 0 by up to 1.3 grays is almost certainly too high, but it would
lead to a 'surface corrected' T L age of less than 1 ka younger than the maximum age
(13.3 ± 2.0 ka) calculated using the sunlamp determined residual for this sample; a
difference well within the level of uncertainty assigned to the maximum age. Although
most likely negligible for older samples, for samples yielding T L ages of only a couple of
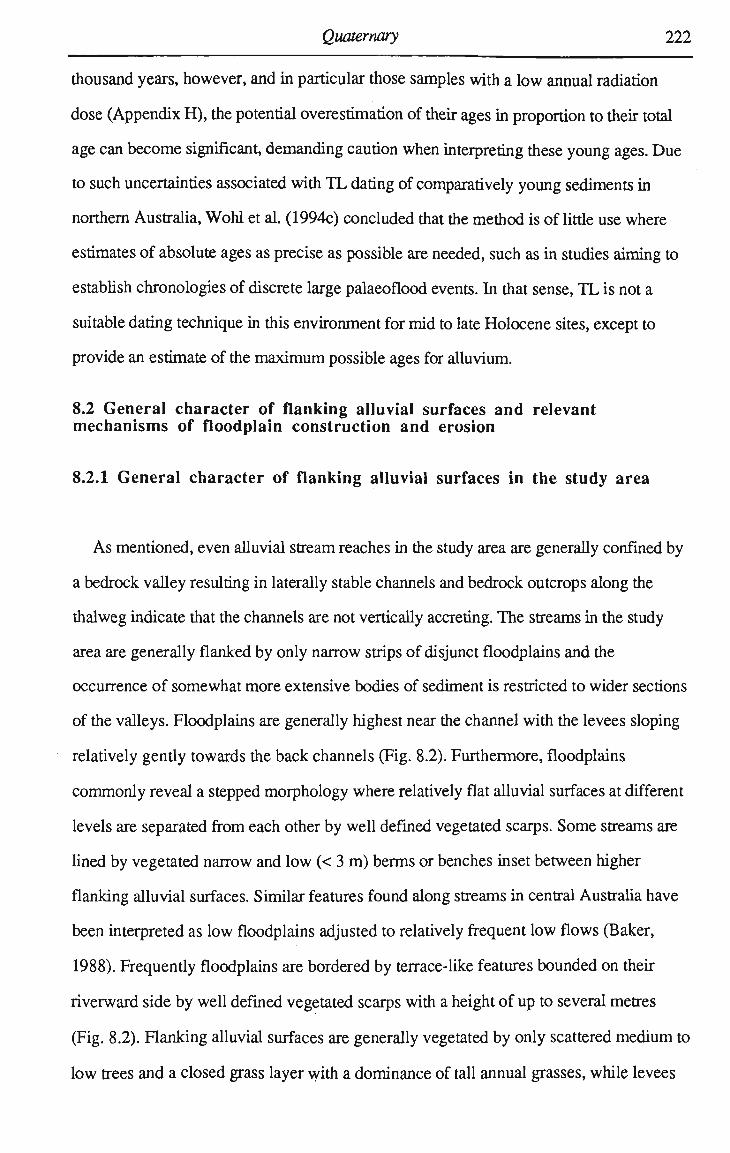
Quaternary 222
thousand years, however, and in particular those samples with a low annual radiation
dose (Appendix H ) , the potential overestimation of their ages in proportion to their total
age can become significant, demanding caution when interpreting these young ages. Due
to such uncertainties associated with T L dating of comparatively young sediments in
northern Australia, Wohl et al. (1994c) concluded that the method is of little use where
estimates of absolute ages as precise as possible are needed, such as in studies aiming to
establish chronologies of discrete large palaeoflood events. In that sense, T L is not a
suitable dating technique in this environment for mid to late Holocene sites, except to
provide an estimate of the m a x i m u m possible ages for alluvium.
8.2 General character of flanking alluvial surfaces and relevant mechanisms of floodplain construction and erosion
8.2.1 General character of flanking alluvial surfaces in the study area
As mentioned, even alluvial stream reaches in the study area are generally confined by
a bedrock valley resulting in laterally stable channels and bedrock outcrops along the
thalweg indicate that the channels are not vertically accreting. The streams in the study
area are generally flanked by only narrow strips of disjunct floodplains and the
occurrence of somewhat more extensive bodies of sediment is restricted to wider sections
of the valleys. Floodplains are generally highest near the channel with the levees sloping
relatively gently towards the back channels (Fig. 8.2). Furthermore, floodplains
commonly reveal a stepped morphology where relatively flat alluvial surfaces at different
levels are separated from each other by well defined vegetated scarps. Some streams are
lined by vegetated narrow and low (< 3 m ) berms or benches inset between higher
flanking alluvial surfaces. Similar features found along streams in central Australia have
been interpreted as low floodplains adjusted to relatively frequent low flows (Baker,
1988). Frequently floodplains are bordered by terrace-like features bounded on their
riverward side by well defined vegetated scarps with a height of up to several metres
(Fig. 8.2). Flanking alluvial surfaces are generally vegetated by only scattered medium to
low trees and a closed grass layer with a dominance of tall annual grasses, while levees

Quaternary 223
are densely vegetated by tall trees, shrubs and grasses (see Section 1.2.4. for details
about species). Towards the valley side, alluvial deposits of floodplains or topographic
terraces either lap smoothly onto the gradually rising land surface, or end abrupdy at the
base of steep rock slopes. The sediments forming the flanking alluvium consist generally
of fine to very fine or silty sand, commonly upward fining and where exposed are
frequendy weakly indurated, at least when dry.
Figure 8.2. Schematic diagram illustrating morphology and typical sedimentary architecture of alluvium flanking streams on the Kimberley Plateau. Architectural elements (after Miall, 1992): OF: overbank fines, predominantly fine to very fine sand; SB: sandy bedforms of crevasse splays and sand sheets; C H : channel; D A : downstream accretion, predominantly sand shadows deposited in lee of sandy ridges.
At natural exposures, flanking alluvium in the study area and elsewhere on the
Kimberley Plateau appears homogenous with a lack of flow structures even at depth.
Because lateral migration of most of these streams is inhibited by bedrock, their
floodplains are formed largely by vertical accretion (Fig. 8.2). In the genetic classification
proposed by Nanson and Croke (1992), floodplains in the study area roughly match their
category of 'confined vertical-accretion sandy floodplains'. However, they differ from
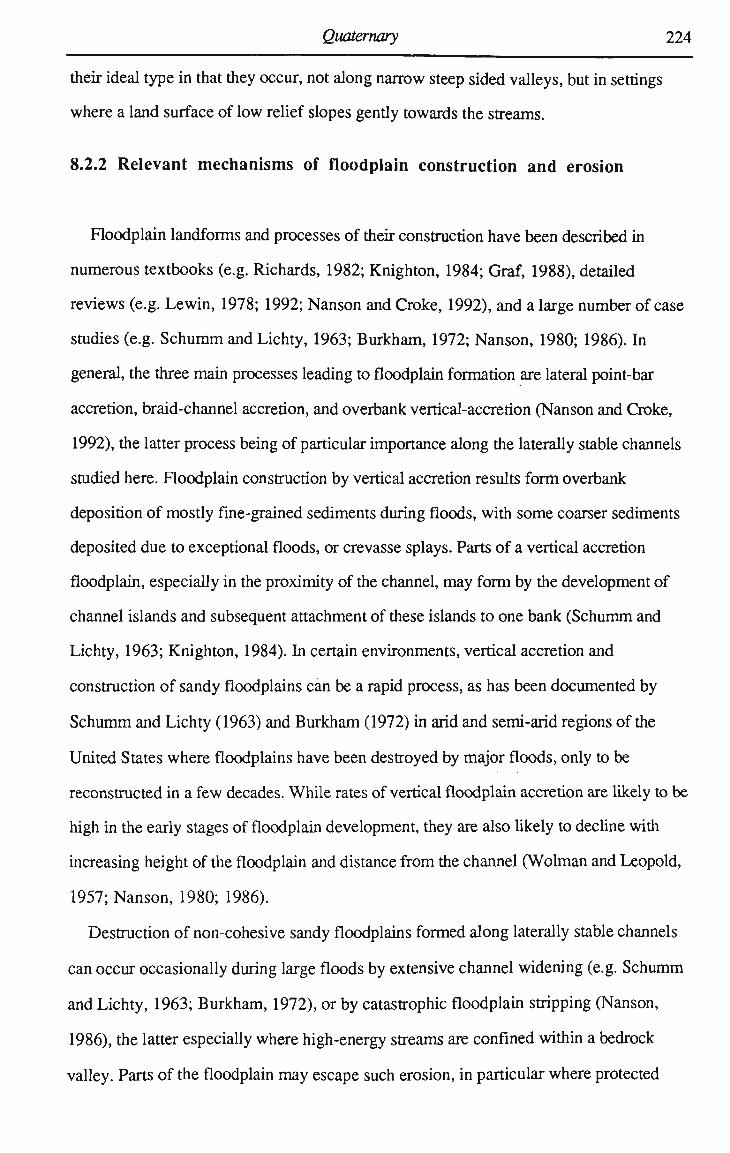
Quaternary 224
their ideal type in that they occur, not along narrow steep sided valleys, but in settings
where a land surface of low relief slopes gendy towards the streams.
8.2.2 Relevant mechanisms of floodplain construction and erosion
Floodplain landforms and processes of their construction have been described in
numerous textbooks (e.g. Richards, 1982; Knighton, 1984; Graf, 1988), detailed
reviews (e.g. Lewin, 1978; 1992; Nanson and Croke, 1992), and a large number of case
studies (e.g. S c h u m m and Lichty, 1963; Burkham, 1972; Nanson, 1980; 1986). In
general, the three main processes leading to floodplain formation are lateral point-bar
accretion, braid-channel accretion, and overbank vertical-accretion (Nanson and Croke,
1992), the latter process being of particular importance along the laterally stable channels
studied here. Floodplain construction by vertical accretion results form overbank
deposition of mostly fine-grained sediments during floods, with some coarser sediments
deposited due to exceptional floods, or crevasse splays. Parts of a vertical accretion
floodplain, especially in the proximity of the channel, may form by the development of
channel islands and subsequent attachment of these islands to one bank (Schumm and
Lichty, 1963; Knighton, 1984). In certain environments, vertical accretion and
construction of sandy floodplains can be a rapid process, as has been documented by
Schumm and Lichty (1963) and Burkham (1972) in arid and semi-arid regions of the
United States where floodplains have been destroyed by major floods, only to be
reconstructed in a few decades. While rates of vertical floodplain accretion are likely to be
high in the early stages of floodplain development, they are also likely to decline with
increasing height of the floodplain and distance from the channel (Wolman and Leopold,
1957; Nanson, 1980; 1986).
Destruction of non-cohesive sandy floodplains formed along laterally stable channels
can occur occasionally during large floods by extensive channel widening (e.g. Schumm
and Lichty, 1963; Burkham, 1972), or by catastrophic floodplain stripping (Nanson,
1986), the latter especially where high-energy streams are confined within a bedrock
valley. Parts of the floodplain may escape such erosion, in particular where protected
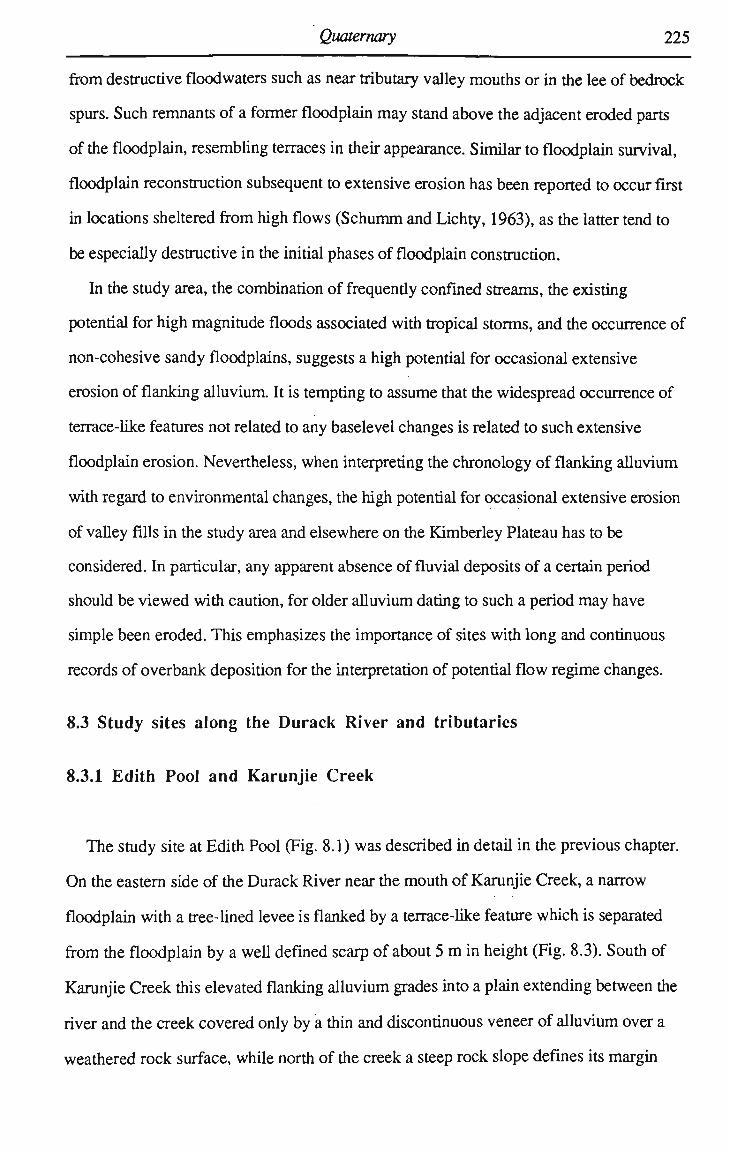
Quaternary 225
from destructive floodwaters such as near tributary valley mouths or in the lee of bedrock
spurs. Such remnants of a former floodplain may stand above the adjacent eroded parts
of the floodplain, resembling terraces in their appearance. Similar to floodplain survival,
floodplain reconstruction subsequent to extensive erosion has been reported to occur first
in locations sheltered from high flows (Schumm and Lichty, 1963), as the latter tend to
be especially destructive in the initial phases of floodplain construction.
In the study area, the combination of frequendy confined streams, the existing
potential for high magnitude floods associated with tropical storms, and the occurrence of
non-cohesive sandy floodplains, suggests a high potential for occasional extensive
erosion of flanking alluvium. It is tempting to assume that the widespread occurrence of
terrace-like features not related to any baselevel changes is related to such extensive
floodplain erosion. Nevertheless, when interpreting the chronology of flanking alluvium
with regard to environmental changes, the high potential for occasional extensive erosion
of valley fills in the study area and elsewhere on the Kimberley Plateau has to be
considered. In particular, any apparent absence of fluvial deposits of a certain period
should be viewed with caution, for older alluvium dating to such a period may have
simple been eroded. This emphasizes the importance of sites with long and continuous
records of overbank deposition for the interpretation of potential flow regime changes.
8.3 Study sites along the Durack River and tributaries
8.3.1 Edith Pool and Karunjie Creek
The study site at Edith Pool (Fig. 8.1) was described in detail in the previous chapter.
O n the eastern side of the Durack River near the mouth of Karunjie Creek, a narrow
floodplain with a tree-lined levee is flanked by a terrace-like feature which is separated
from the floodplain by a well defined scarp of about 5 m in height (Fig. 8.3). South of
Karunjie Creek this elevated flanking alluvium grades into a plain extending between the
river and the creek covered only by a thin and discontinuous veneer of alluvium over a
weathered rock surface, while north of the creek a steep rock slope defines its margin
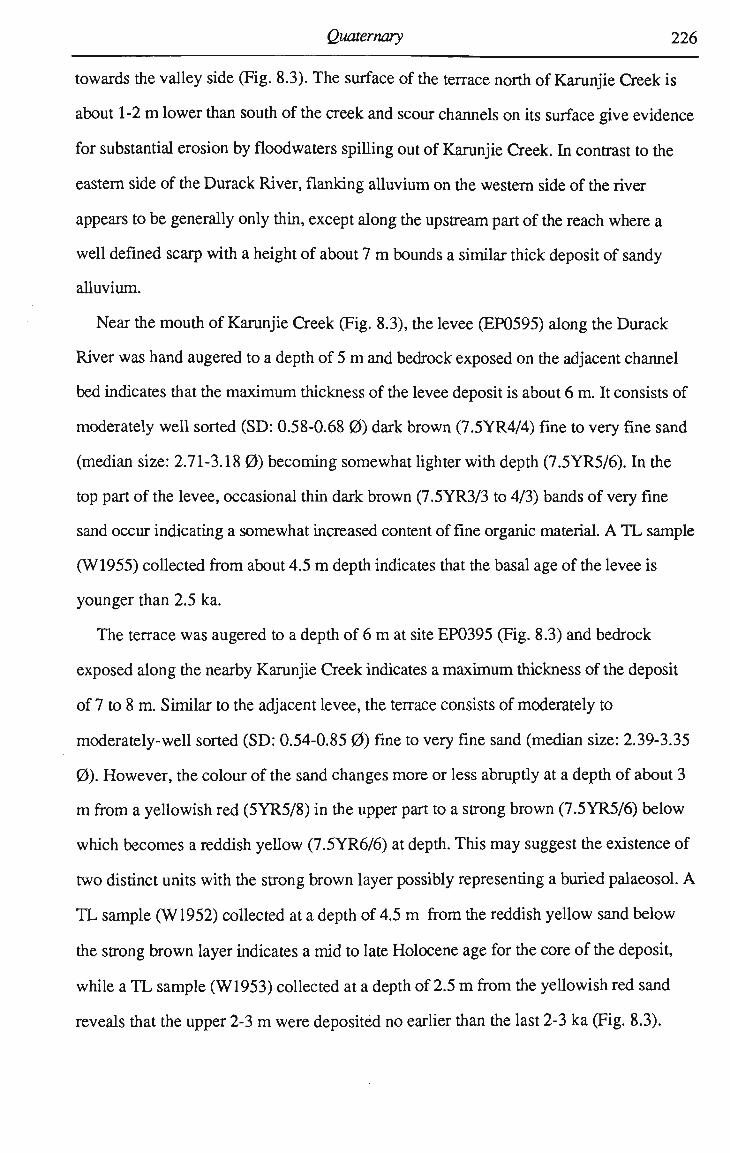
Quaternary 226
towards the valley side (Fig. 8.3). The surface of the terrace north of Karunjie Creek is
about 1-2 m lower than south of the creek and scour channels on its surface give evidence
for substantial erosion by floodwaters spilling out of Karunjie Creek. In contrast to the
eastern side of the Durack River, flanking alluvium on the western side of the river
appears to be generally only thin, except along the upstream part of the reach where a
well defined scarp with a height of about 7 m bounds a similar thick deposit of sandy
alluvium.
Near the mouth of Karunjie Creek (Fig. 8.3), the levee (EP0595) along the Durack
River was hand augered to a depth of 5 m and bedrock exposed on the adjacent channel
bed indicates that the maximum thickness of the levee deposit is about 6 m. It consists of
moderately well sorted (SD: 0.58-0.68 0 ) dark brown (7.5YR4/4) fine to very fine sand
(median size: 2.71-3.18 0 ) becoming somewhat lighter with depth (7.5YR5/6). In the
top part of the levee, occasional thin dark brown (7.5 YR3/3 to 4/3) bands of very fine
sand occur indicating a somewhat increased content of fine organic material. A T L sample
(W1955) collected from about 4.5 m depth indicates that the basal age of the levee is
younger than 2.5 ka.
The terrace was augered to a depth of 6 m at site EP0395 (Fig. 8.3) and bedrock
exposed along the nearby Karunjie Creek indicates a maximum thickness of the deposit
of 7 to 8 m. Similar to the adjacent levee, the terrace consists of moderately to
moderately-well sorted (SD: 0.54-0.85 0 ) fine to very fine sand (median size: 2.39-3.35
0). However, the colour of the sand changes more or less abrupdy at a depth of about 3
m from a yellowish red (5YR5/8) in the upper part to a strong brown (7.5YR5/6) below
which becomes a reddish yellow (7.5YR6/6) at depth. This may suggest the existence of
two distinct units with the strong brown layer possibly representing a buried palaeosol. A
T L sample (W1952) collected at a depth of 4.5 m from the reddish yellow sand below
the strong brown layer indicates a mid to late Holocene age for the core of the deposit
while a T L sample (W1953) collected at a depth of 2.5 m from the yellowish red sand
reveals that the upper 2-3 m were deposited no earlier than the last 2-3 ka (Fig. 8.3).
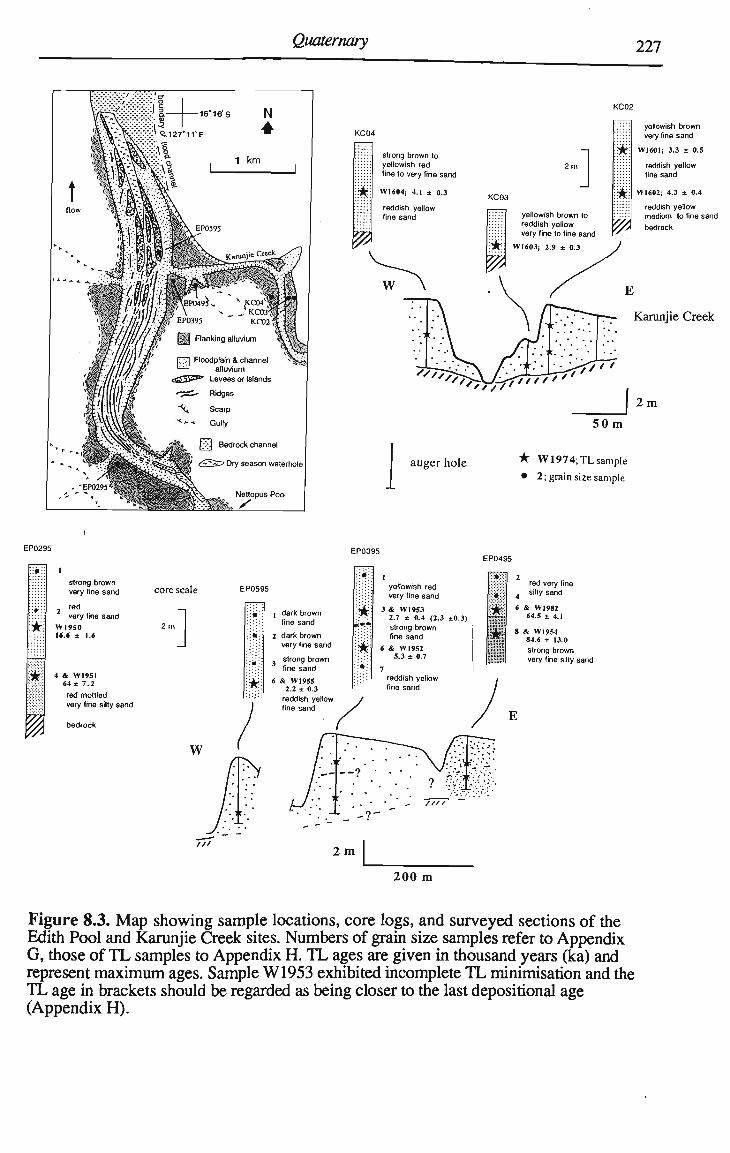
Quaternary 227
KC02
Bedrock channel
Dry season waterhole
Netlopus Pool
KC04
strong brown to yellowish red fine to very line sand
WI604; 4.1 ± 0.3
reddish yellow fine sand
2m
yellowish brown to reddish yellow very line to line sand
WI603; 2.9 ± 0.3
;*
•
'/)
yellowish brown very fine sand
W1601; 3.3 ± 0.5
reddish yellow fine sand
W1602; 4.3 ± 0.4
reddish yellow medium to fine sand
bedrock
Karunjie Creek
2 m
auger hole
50m
-k W1974;TLsample
• 2; grain size sample
EP0295 EP0395
strong brown very tine sand
1 red very tine sand
WI950 16.6 ± 1.6
4 & WI9SI 64 ± 7.2
red mottled very fine silty sand
bedrock
core scale EP0595
EP0495
yellowish red very fine sand
3 & WI953 2.7 ± 0.4 (2.3 ±0.3) strong brown fine sand
:•:*:'••.
*
red very fine . silty sand
6 & W1982 64.5 ± 4.1
8 & W1954 84.6 ± 13.0 strong brown very fine silty sand
200 m
Figure 8.3. M a p showing sample locations, core logs, and surveyed sections of the Edith Pool and Karunjie Creek sites. Numbers of grain size samples refer to Appendix G, those of T L samples to Appendix H. T L ages are given in thousand years (ka) and represent maximum ages. Sample W1953 exhibited incomplete T L minimisation and the T L age in brackets should be regarded as being closer to the last depositional age (Appendix H ) .
Quaternary 228
Interestingly, the T L sample (W1953) collected nearer to the surface of the terrace
indicates incomplete T L minimisation (Appendix H ) suggesting that this sediment was
eroded from very young alluvium probably found only a comparatively short distance
upstream of its present location.
The young ages of the basal sediments of the levee and the terrace suggest that if there
was any flanking alluvium dating to the first part of the Holocene, it has been eroded and
reworked prior to deposition of the present alluvium. Furthermore, the nearly identical
T L ages determined for the base of the levee and the terrace sands just above the layer of
brown sand occurring at a depth of approximately 3 m (Fig. 8.3), suggest that the upper
part of the terrace formed over a similar period as the levee (EP0595) nearer to the
channel. One possible interpretation of this evidence is that the younger upper part of the
terrace was deposited like a 'terrace veneer' (Brakenridge, 1984; 1988) blanketing a
former (partially stripped?) floodplain. Furthermore, erosion is more likely to occur on
the lower part of the floodplain than on the much more densely vegetated levees, or the
alluvium of the terrace feature which is partially protected from erosion due to its location
in the pocket of the tributary valley mouth. Such preferential erosion of the low areas of
the floodplain in combination with net accretion on the levee and the terrace may have
resulted in an incremental increase of relief difference across the flanking alluvium.
In addition to the alluvium along the Durack River, alluvium flanking Karunjie Creek
was studied at a site (KC02-04) about 1.5 k m upstream of the creek's mouth (Fig. 8.3).
The well defined creek is about 10 to 15 m wide, has a rock bed and is flanked by sandy
alluvium which rises to about 6 m above the channel bed. Several disjunct benches at
different elevations occur along the channels, some of which are covered by scattered low
trees. At the study site (Fig. 8.3), the creek is flanked (KC02 & K C 0 4 ) by several metres
of fine to very sand which is strong brown (7.5YR5/6) to yellowish brown (10YR5/4)
near the surface and reddish yellow (7.5YR6/6 to 5YR6/8) at depth. O n the eastern side
of the creek, a narrow, relatively flat alluvial surface at an elevation about 3 m above the
channel bed extends for several hundred metres along the channel. The surface of this
bench is vegetated with scattered low trees and it slopes gently away from the channel.
Quaternary 229
Like the adjacent alluvium, the bench consists of yellowish brown very fine to fine sand
that becomes reddish yellow at depth (KC03). Four T L samples collected from the
flanking alluvium indicate that even the basal sands are no older than about 4 to 5 ka (Fig.
8.3). Furthermore, the basal sediments of the bench along the channel (sample: W1603)
appear to be somewhat younger than the basal sands of the higher elevation floodplain
(samples: W 1 6 0 2 & W1604). This suggests that the bench formed within a wider
channel inset between somewhat older late Holocene alluvium.
A small pocket of late Pleistocene sediments (EP0495) is found near the mouth of
Karunjie Creek some 200 m east of Site EP0395 (Fig. 8.3). The surface of this deposit
slopes gently toward the east which may indicate that it was deposited by floods along the
Durack River rather than Karunjie Creek. The alluvium is poorly exposed along two
small gullies which seem to have formed at the margins of this small patch of older
alluvium, for the latter is exposed only on one side along each of the two parallel gullies
(Fig. 8.3). The sediment is about 6-7 m thick near Karunjie Creek, but decreases in
thickness with distance from the creek, as is indicated by exposed bedrock along the
gullies. Augering of the deposit (EP0495) revealed two units of slightly weathered and
indurated silty sand separated by a clear boundary which occurs at a depth of about 2.5
m. The upper unit of moderately sorted (SD: 0.83-0.91 0 ) red (2.5YR4/8) silty sand
(median size: 3.60-3.71 0 ) gave a T L age of 64.5 ± 4.1 ka (W1982), while a sample
(W1954) collected from the lower unit of poorly sorted (SD: 1.32 0 ) strong brown
(7.5YR5/6) to yellowish red-mottled (5YR5/8) silty sand (median size: 3.66 0) yielded a
T L age of 84.6 ± 13.0 ka (Fig. 8.3).
Older alluvium was also found on the western side of the Durack River, where the
sediments (EP0295) of a topographic terrace bounded by a well defined vegetated scarp
(~ 7 m high) are exposed along a gully (Fig. 8.3). Similar to the narrow strip of
floodplain found here, the alluvial surface slopes gently away from the river. T w o
distinct units of very fine to silty sand resting on bedrock are exposed along the gully.
The lower unit consists of strongly indurated somewhat weathered white-mottled, red
(2.5YR5/8) silty sand (median size: 3.61 0; SD: 0.98 0 ) and gave a T L age of 64 ± 7.2
Quaternary 230
ka (W1951). Above this unit are about 5 m of slighdy indurated moderately well sorted
(SD: 0.64-0.66 0 ) red (2.5YR4/8) very fine sand (median size: 3.13-3.45 0 ) with a
strong brown (7.5YR4/6) colour near the surface. A sample (W1950) collected from a
depth of 3.5 m , which is also 3.5 m above the surface of the adjacent floodplain, yielded
a T L age of 16.6 ±1.6 ka. Abundant flood debris observed during field work in 1995
indicated that the maximum stage height of the 1994/95 wet season peak flood, the fourth
highest in 30 years of record, remained about 1 m below from where the sample was
taken. Whether this could indicate that floods of significant magnitude occurred along the
Durack River as early as 16 ka is unclear, not least since the cross section geometry of the
Durack River at the time of deposition may have been very different from what it is
today. Nevertheless, the alluvium suggests some postglacial monsoon activity along the
river as early as the very late Pleistocene and, as will be shown, this is not the only site
where fluvial activity at about this time is recorded.
Interestingly, the age of the lower unit at Site EP0295 is identical with the age
determined for the upper unit at Site EP0495 on the eastern side of the river (Fig. 8.3)
and these dates fall in the time span of Oxygen Isotope Stage 4 to early Stage 3. Based on
extensive T L chronologies of various fluvial sequences in northern Australia, Stage 4
was probably a period of fluvial inactivity, while Stage 3, although not a major fluvial
episode in the tropics, had flow regimes probably somewhat enhanced when compared to
late Holocene activity (pers. com. Nanson, 1996). Just how the alluvium along the
Durack River at Edith Pool relates to the overall very scanty picture of Pleistocene fluvial
activity in northern Australia is not clear.
8.3.2 Fine Pool
A general description of the study site at Fine Pool (Fig. 8.1) along the Durack River
was given in the previous chapter. For about 2 k m upstream of its confluence with the
Chapman River, the western side of the Durack River is flanked by a narrow floodplain
nearer to the channel and a terrace-like feature bound by a well defined vegetated scarp
(Fig. 8.4). The surface of the terrace feature is at a similar elevation to the top of the
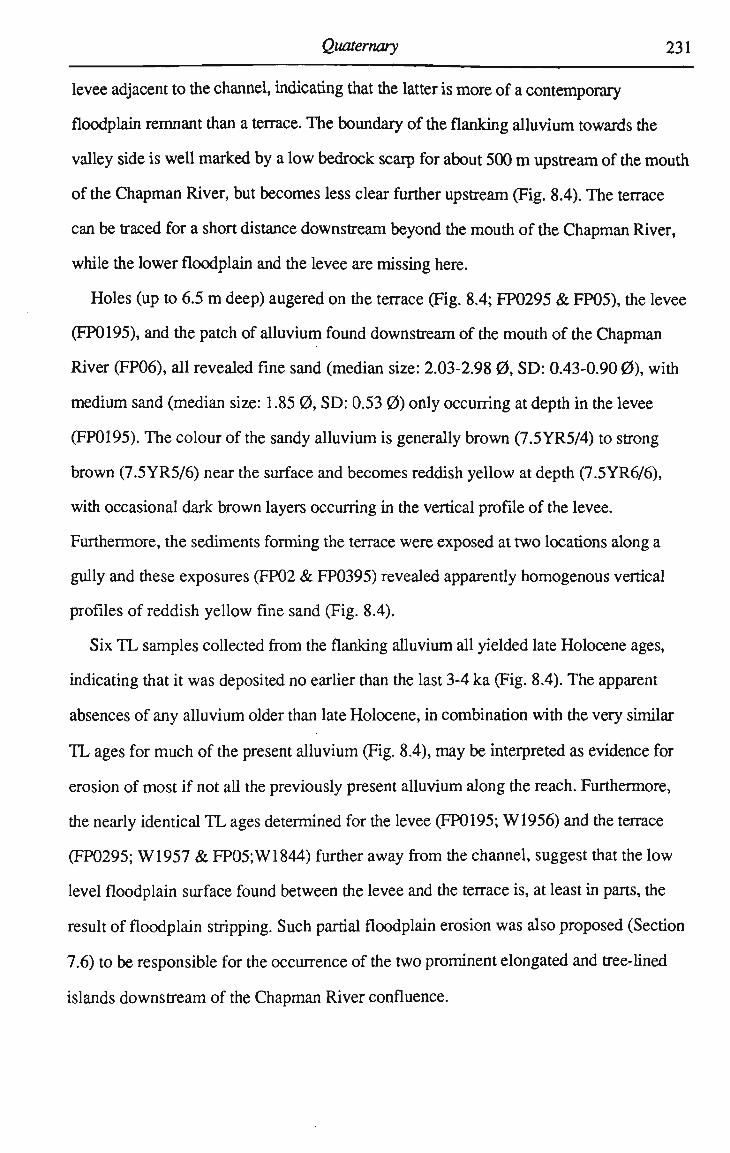
Quaternary 231
levee adjacent to the channel, indicating that the latter is more of a contemporary
floodplain remnant than a terrace. The boundary of the flanking alluvium towards the
valley side is well marked by a low bedrock scarp for about 500 m upstream of the mouth
of the Chapman River, but becomes less clear further upstream (Fig. 8.4). The terrace
can be traced for a short distance downstream beyond the mouth of the Chapman River,
while the lower floodplain and the levee are missing here.
Holes (up to 6.5 m deep) augered on the terrace (Fig. 8.4; FP0295 & FP05), the levee
(FP0195), and the patch of alluvium found downstream of the mouth of the Chapman
River (FP06), all revealed fine sand (median size: 2.03-2.98 0, SD: 0.43-0.90 0 ) , with
medium sand (median size: 1.85 0, SD: 0.53 0 ) only occurring at depth in the levee
(FP0195). The colour of the sandy alluvium is generally brown (7.5YR5/4) to strong
brown (7.5YR5/6) near the surface and becomes reddish yellow at depth (7.5YR6/6),
with occasional dark brown layers occurring in the vertical profile of the levee.
Furthermore, the sediments forming the terrace were exposed at two locations along a
gully and these exposures (FP02 & FP0395) revealed apparendy homogenous vertical
profiles of reddish yellow fine sand (Fig. 8.4).
Six T L samples collected from the flanking alluvium all yielded late Holocene ages,
indicating that it was deposited no earlier than the last 3-4 ka (Fig. 8.4). The apparent
absences of any alluvium older than late Holocene, in combination with the very similar
T L ages for much of the present alluvium (Fig. 8.4), may be interpreted as evidence for
erosion of most if not all the previously present alluvium along the reach. Furthermore,
the nearly identical T L ages determined for the levee (FP0195; W1956) and the terrace
(FP0295; W 1 9 5 7 & FP05;W1844) further away from the channel, suggest that the low
level floodplain surface found between the levee and the terrace is, at least in parts, the
result of floodplain stripping. Such partial floodplain erosion was also proposed (Section
7.6) to be responsible for the occurrence of the two prominent elongated and tree-lined
islands downstream of the Chapman River confluence.
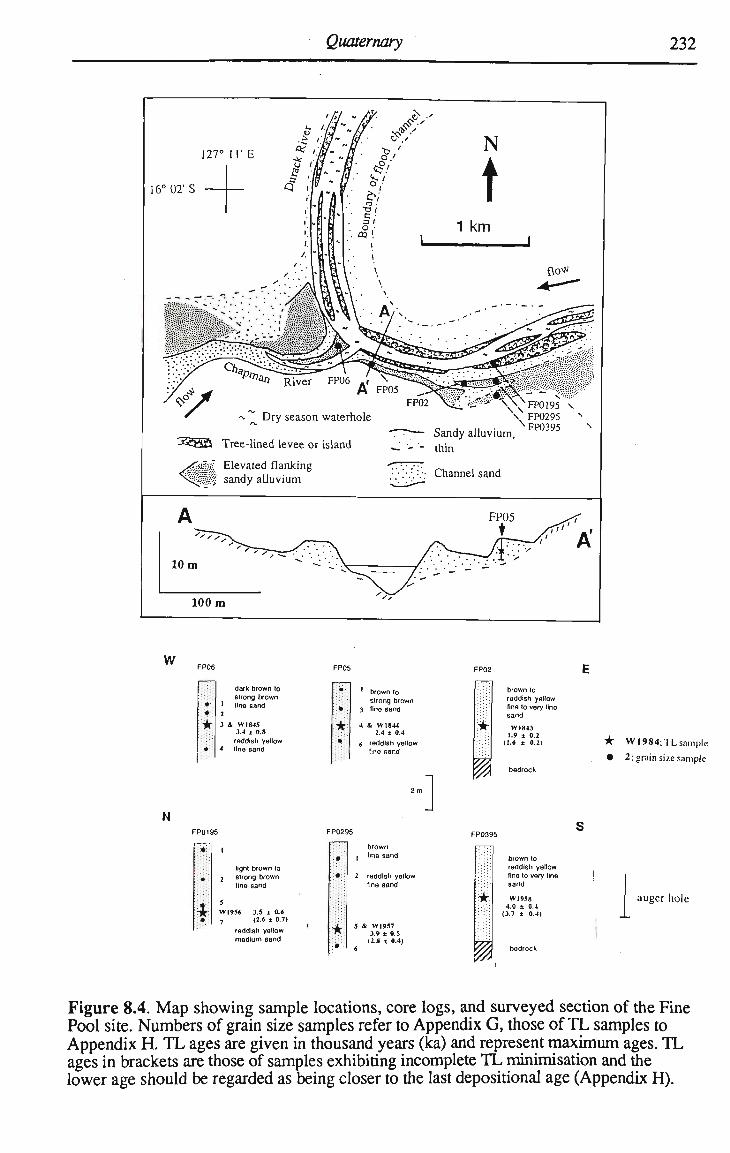
Quaternary 232
Dry season waterhole
•^iSfi Tree-lined levee or island ;_ •_ •- triin
\\NFP0195 \ \ FP0295 s
Sandy alluvium,
SJgif Elevated flanking if sandy alluvium '•'•'.•:.'•;: Channel sand
W
N
FP05
• dark brown to strong brown
1 fine sand 2 3 & WI845
3.4 i 0.8 reddish yellow
4 fine sand
: : • • :
• ' • * : ' •
M :•':
' brown to strong brown
3 fine sand
4 & VV1844 2.4 ± 0.4
d reddish yellow fine sand
']
brown to reddish yellow line to very fine sand
W1843 1.9 ± 0.2
II.» 1 0.2) * W l 984; TL sample
• 2; grain size sample
>
: < • • :
t
1
light brown lo 2 strong brown
fine sand
5 W1956 3.5 ± 0.6 7 (2.6 ± 0.7)
reddish yellow medium sand
•
• • •
•
brown 1 tine sand
2 reddish yellow tine sand
5 & WI957 3.9 ± 0.5 |2.8 ± 0.4|
6
brown to reddish yellow fine to very line sand
WI958 4.0 1 0.4 (3.7 ± 0.4)
auger hole
Figure 8.4. M a p showing sample locations, core logs, and surveyed section of the Fine Pool site. Numbers of grain size samples refer to Appendix G, those of T L samples to Appendix H. T L ages are given in thousand years (ka) and represent maximum ages. T L ages in brackets are those of samples exhibiting incomplete T L minimisation and the lower age should be regarded as being closer to the last depositional age (Appendix H).
Quaternary 233
Several of the samples (W1843, W1956, W1957, W1958) of Fine Pool alluvium
showed incomplete T L minimisation, probably indicative of redeposition of alluvium
eroded only a comparatively short distances upstream. The two T L ages determined for
the samples, the older age regarded as being closer to the original age of the sediment
before it was eroded and the younger age closer to its last depositional age (pers. com.
Price, 1996), suggest periodic reworking of the late Holocene alluvium flanking the
river. Recent reworking of alluvium along the reach is indicated by scour holes and
patches of fresh sand on the low ground of the floodplain.
8.3.3 Horse Creek and Campbell Creek
The study site along Horse Creek, a small tributary of the Durack River between Edith
Pool and Fine Pool (Fig. 8.5), is located about 2 k m upstream of its confluence with the
Durack River and close to where the track leading to Karunjie homestead crosses the
creek. At the site, the creek has a well defined 10-15 m wide sandy channel with frequent
exposures of bedrock along its bed. It is flanked by a variable number of narrow alluvial
surfaces at different levels, with the lower levels only sparsely vegetated suggesting
recent mobility. The two highest levels on the southern side of the channel can be traced
for several hundred metres along the creek. Holes augered on each of these surfaces (Fig.
8.5) revealed brown (7.5YR5/4) fine sand near the surface on both levels, underlain by
about 4 m of yellowish red (5YR5/8) fine sand at the higher level (HC05) and about 3 m
of reddish yellow (5YR6/6) fine sand at the lower level (HC04). T L dating of these
alluvial surfaces indicates that the sediments on the upper surface where deposited no
earlier than about 4-5 ka (sample: W1600) ago, while the sediments on the level below
were deposited within the last 1-2 ka (samples: W1598, W1599).
Alluvium flanking Campbell Creek (Fig. 8.5) was sampled for T L dating at a road
crossing near Ellenbrae homestead. At the crossing, the well defined sandy creek is about
50 wide and bedrock is exposed along its bed. The top of the high stage floodplain on the
western side of the creek is about 6 m above the channel bed, while on the eastern side, it
Quaternary 234
EB01
2m
^
red line to very tine sand
W1836; S.g ± 0.6
bedrock
w Ellenbrae
Campbell Creek
S/SS///// bedrock
2m 1
127°00' E
Cambridge Gulf West Ann
^ ^ \
scale of cross section
2m
50 m
auger hole
HC05
w
yellowish red line sand
W1600; 4.5 ± 0.4 HC04
reddish yellow line sand
W15SW; 1.6 ± 0.2
VV1599; 1.6 ± 0.2
^ bedrock
Horse Creek
N
"7?
••/
Figure 8.5. M a p showing sample locations, core logs, and surveyed sections of the Horse Creek and Campbell Creek sites. Numbers of T L samples refer to Appendix H and T L ages are maximum ages given in thousand years (ka).

Quaternary 235
is about 1 m lower. A hole augered on the western floodplain revealed about 2 m of red
fine to very fine sand yielding a basal age of 5-6 ka (W1836; Fig. 8.5), indicating that net
floodplain deposition occurred at this level during the second half of the Holocene.
8.5 Study sites elsewhere on the Kimberley Plateau
To investigate whether alluvium flanking rivers elsewhere on the Kimberley Plateau is
similar young as is indicated for most of the alluvium studied along the Durack River and
its tributaries, a reconnaissance dating of alluvium along four other rivers was conducted.
The study sites are located in the physiographic province of the Gipp Hills (see Section
1.2), a generally soil covered land surface of low relief formed largely on flat lying to
gendy dipping Carson Volcanics. If not mentioned otherwise, Carson Volcanics also
form the bedrock at the study sites described below.
8.4.1 Drysdale River
The study site along the Drysdale River (Figs. 8.1) is located near Drysdale homestead
and about 1km upstream of the site where the Kalumburu road (together with the Gipp
River road the only two roads on the Kimberley Plateau) crosses the river. At the study
site, the Drysdale River reveals an anabranching ridge-form pattern with several tree-lined
and very elongated sandy ridges extending continuously for many hundred metres along
the channel. Furthermore, a well defined vegetated bench lines the southern side of the
channel and this alluvial surface may constitute a low stage floodplain (Fig. 8.6). Four
holes were augered into the ridges and the bench revealing mostly dark brown (10YR3/3)
to strong brown (7.5YR4/6) fine sand (median size: 2.21-2.89 0; SD: 0.51-0.93 0 ) ,
which grades into a reddish yellow (7.5YR6/8) slighdy coarser sand at depth. Bedrock is
exposed along the channel bed some distance upstream and downstream of the site,
indicating that the sandy valley fill at the site is only thin. The channel train is flanked on
both sides of the river by flat topped alluvial surfaces about 10 m above the lowest point
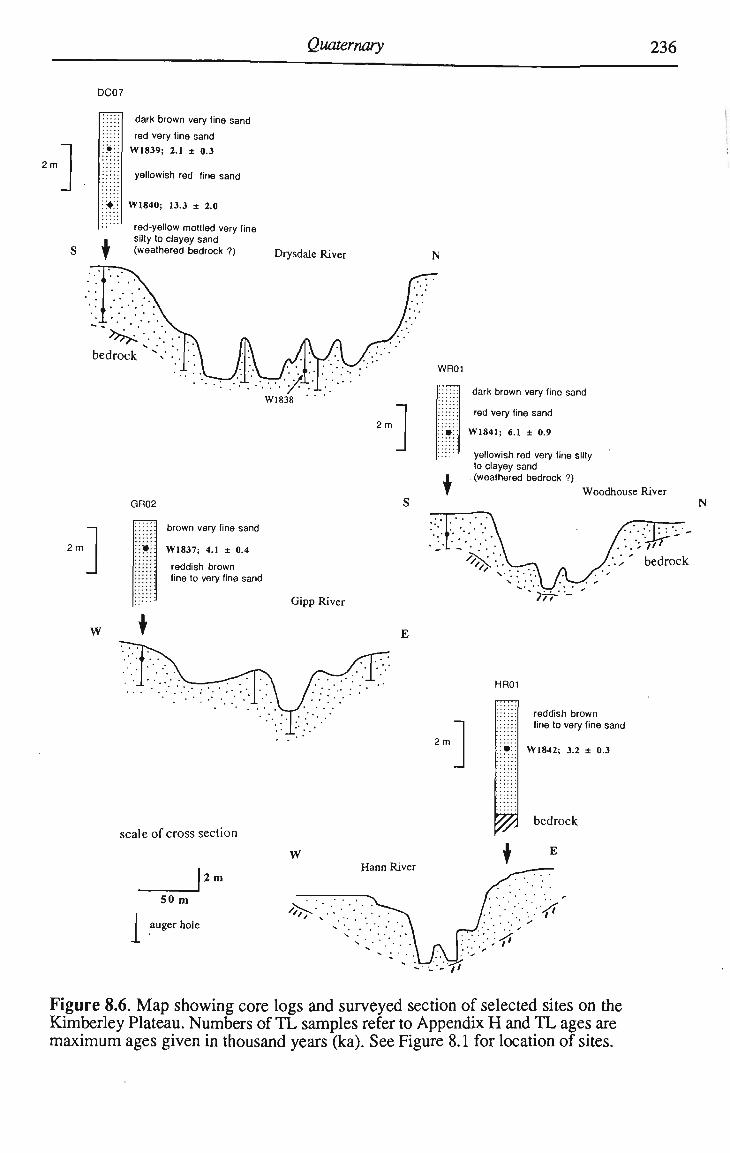
Quaternary 236
DC07
2m
•
dark brown very line sand
red very fine sand
W1839; 2.1 ± 0.3
yellowish red fine sand
W1840; 13.3 ± 2.0
red-yellow mottled very fine silty to clayey sand (weathered bedrock ?) Drysdale River
bedrock
GR02
2m ] w
brown very fine sand
W1837; 4.1 ± 0.4
reddish brown fine to very fine sand
Gipp River
WR01
•
dark brown very fine sand
red very fine sand
W1841; 6.1 ± 0.9
yellowish red very fine silty to clayey sand (weathered bedrock ?)
Woodhouse River N
. J 7 7 '
bedrock
HR01
scale of cross section
2 in
I 50 m
auger hole
reddish brown fine to very fine sand
W1842; 3.2 ± 0.3
Figure 8.6. M a p showing core logs and surveyed section of selected sites on the Kimberley Plateau. Numbers of T L samples refer to Appendix H and T L ages are maximum ages given in thousand years (ka). See Figure 8.1 for location of sites.
Quaternary 237
in the channel (Fig. 8.6). O n the southern side of the river, this high floodplain grades
into extensive plains allowing flood waters to spread out. Flood debris rapped around
trees on the floodplain gives evidence of recent flooding.
A 5 m hole (DC07) was augered on the southern floodplain revealing a gradually
changing sediment sequence consisting of dark brown (7.5YR4/3; SD: 0.70 0 ) very fine
sand (median size: 3.28 0 ) near the surface, a red (2.5YR4/8) very fine sand (median
size: 3.20 0; SD: 0.70 0 ) in the middle, and a yellowish red (5YR5/8) fine sand (median
size: 2.98 0; SD: 0.81 0 ) at depth. Bedrock exposed along gullies indicates that the
thickness of the alluvium decreases quickly with distance from the channel. A T L sample
(W1839) collected from the red very fine sand at a depth of 1.5 m yielded a maximum
age of 2.1 ± 0.3 ka, while a sample (W1840) collected from the yellowish red fine sand
at a depth of 4.2 m gave a T L age of 13.3 ± 2.0 ka. It is not clear whether the alluvium at
the site represents a continuous record of overbank deposition, or whether an erosional
unconformity occurs within the sequence. Only extensive trenching at the site may
resolve this question. Nevertheless, the lower sample gives further evidence for fluvial
activity on the Kimberley Plateau as early as the very late Pleistocene.
8.4.2 W o o d h o u s e River
Alluvium along the Woodhouse River (Figs. 8.1,8.6) was sampled about 3 km
upstream of its confluence with the Drysdale River which is about 8 k m upstream of the
sample site described above. At the study site, the bed of the Woodhouse River is
covered by a thin veneer of sandy to pebbly alluvium and the channel is flanked by
narrow strips of tree-lined sandy alluvium standing about 2 m above the channels. The
active channel and the benches are inset between the steep and well vegetated slopes
leading to the adjacent higher floodplain at an elevation of about 6 m above the channel
bed (Fig. 8.6). Bedrock exposed along several gullies indicates that the thickness of the
flanking alluvium decreases quickly with distance from the river. The floodplain on the
southern side of the river was augered to a depth of about 3 m where indurated clayey
sand was encountered, probably representing weathered bedrock as is indicated along

Quaternary 238
exposures in nearby gullies. The floodplain consists of dark brown (7.5YR4/3) very fine
sand near the surface and red (2.5YR4/8) very fine sand below. A sample (W1841)
collected at a depth of 2 m gave a T L age of 6.1 ± 0.9 ka (Fig. 8.6), providing evidence
for at least some mid Holocene activity along the Woodhouse River.
8.4.3 Gipp River
Alluvium flanking the Gipp River (Figs. 8.1, 8.6) was investigated downstream of the
Gipp River crossing along the Kalumburu road. Here, the Gipp River has a straight, well
defined 15-20 m wide and 4 m deep sandy channel which appears to be laterally stable.
About 500 m upstream of the study reach, the river flows in a bedrock channel cut into
resistant sandstone, suggesting a small thickness for the sandy valley fill at the study site.
The Gipp River has a vegetated floodplain with well developed levees lined by tall and
mature Eucalyptus trees inset between alluvial surfaces standing about 6 m above the
channel, or 2 m above the top of the levees. The stream carries a bedload of medium to
coarse sand and the levees consist of upwards fining medium to very fine sand. This is
brownish in the top part and becomes lighter with depth. A hole augered on the flanking
alluvial surfaces on the western side of the river (GR02) revealed brown (7.5YR5/4) very
fine sand near the surface and reddish brown (2.5YR4/4) fine to very fine sand at depth.
A single T L sample (W1837) at a depth of about 1 m gave a maximum age of 4.1 ± 0.4
ka, indicating mid to late Holocene deposition. It appears reasonable to assume that much
of the alluvium nearer to the channel was also deposited during the later half of the
Holocene.
8.4.4 Hann River
The study site on the Hann River (Figs. 8.1, 8.6) is located just upstream of the river
crossing along the Gipp River road. At the site, the straight sand-bed river is divided into
two 10-15 m wide subchannels by an elongated sandy tree-lined ridge with a height of
about 2 m. O n the eastern side of the river, a tree-lined bench reaching to an elevation
Quaternary 239
about 3 m above the channel bed can be traced for several hundred metres along the river.
The adjacent high stage floodplain rises about 5 m above the bench, or low floodplain,
and 8 m above the channel bed, but is somewhat lower on the other side of the river (Fig.
8.6). Bedrock outcrops on the channel bed and bedrock exposures along gullies
dissecting the floodplain indicate a maximum thickness of less than 8 m for the flanking
alluvium. A n exposure of floodplain sediments along a gully on the eastern side of the
river (Fig. 8.6, H R 0 1 ) revealed a vertical profile of about 5 m of apparently homogenous
reddish brown (2.5YR4/4) fine to very fine sand. A T L sample (W1842) collected from a
depth of about 3 m indicates that much of the alluvium at the study site was deposited no
earlier than 3.2 ± 0.3 ka.
8.5 Summary of results from the Kimberley Plateau and conclusions
Floodplains along the Durack River and elsewhere on the Kimberley Plateau are
commonly overbank vertical-accretion sandy floodplains occurring along laterally stable
streams. Such non-cohesive floodplains are relatively weak and can be subject to periodic
destruction and rebuilding, especially where situated in a confining bedrock valley
(Nanson, 1986; Nanson and Croke, 1992). Natural climatic oscillations affecting flow
regime and stabilizing floodplain vegetation may also result in alternating phases
dominated by floodplain accretion or erosion (Schumm and Lichty, 1963; Nanson and
Croke, 1992).
A total of 26 T L samples were obtained from alluvial surfaces flanking various
streams on the Kimberley Plateau (Figs. 8.3 to 8.6). Most samples dated to the period of
the mid to late Holocene, suggesting that much of the alluvium found along the streams
was deposited during the later half of the Holocene. Older alluvium was only found at
Edith Pool along the Durack River (Fig. 8.3), apparently in locations sheltered from
destructive floods, and at the Drysdale River near Drysdale crossing (Fig. 8.6) where
flood waters can spread across extensive plains.
Terrace-like features standing several metres above the back channels of the narrow
floodplains at Edith Pool (Fig. 8.3) and Fine Pool (Fig. 8.4) along the Durack River
Quaternary 240
yielded similar late Holocene ages as were obtained for the base of the levees at the sites.
This suggest that these topographic terraces are not the product of significantiy different
flow regimes, but formed by floodplain deposition and erosion under the same climatic
and hydrological conditions. Terraces along streams can be the work of large floods
(Gupta, 1988) and it appears very likely that high magnitude flows during the late
Holocene played a decisive role in the formation of the terraces found along the Durack
River. Besides the morphological and chronological evidence for flood erosion gained
from these features, the bedrock and boulder-bed channel reaches along the Durack River
provide definite evidence for occasional very large flood events, although the timing of
these events remains unknown. Furthermore, the palaeoflood records of several streams
in the Kimberley region provide evidence for the occurrence of several major floods
during the late Holocene, with discharges per unit area greater than equivalent maximum
gauged discharges in the area, although still substantially less than world record values
(Gillieson, et al., 1991; Wohl, et al., 1994a, 1994c). Whether such late Holocene floods,
which apparently also significantly modified the sandy floodplains along the Durack
River, reached the same magnitude as floods earlier in the Holocene or Pleistocene is not
clear.
The oldest Quaternary sediments thus far located on the Kimberley Plateau occur as a
small patch of alluvium at Edith Pool, situated in a location apparently sheltered from
destructive large floods (EP0495; Fig. 8.3), and in a terrace-like feature (EP0295) on the
opposite side of the river. The basal unit at Site EP0495 dates at c. 85 ka, while the unit
above yields an age of c. 65 ka, the same age as determined for the basal unit at Site
EP0295 across the river. Postglacial fluvial activity along the Durack River as early as c.
16 ka is indicated by the basal ages of the upper unit at Site EP0295. The only other site
on the Kimberley Plateau where very late Pleistocene to early Holocene alluvium has
been located is on the Drysdale River, where the high stage floodplain yields a basal age
of c. 13 ka (Fig. 8.6).
The observed lack of significant alluvial deposits dating to the first half of the
Holocene at the study sites may simply be due to a lack of fluvial activity during these
Quaternary 241
periods. Rivers elsewhere in northern Australia, however, experienced not only
significant but even enhanced fluvial activity during the early and mid Holocene when
compared to the late Holocene (Nanson, et al., 1993; 1995; Nott, et al., 1996b; Wende,
et al., in press). It appears therefore not unreasonable to assume that the rivers on the
Kimberley Plateau were active during this period as well, an assumption supported by the
two latest Pleistocene T L dates (13-16 ka) obtained for alluvium on the Durack River
(Fig. 8.3; Site EP0295) and the Drysdale River (Fig. 8.6; Site D C 7 ) , and three mid
Holocene dates (6.1-5.3 ka) from the Woodhouse River, the Durack River, and
Campbell Creek (Figs. 8.3 to 8.6). Assuming the rivers draining the Kimberley Plateau
were active in the first half of the Holocene, the apparent phase of floodplain construction
in the latter half of the Holocene could mean that large floods during the last few
thousands years were not as effective in reworking flanking alluvium as floods around 3-
6 ka, the approximate basal age of several alluvial surfaces studied. Furthermore, the
occurrence of tree-lined low floodplains inset between somewhat older late Holocene
alluvium along Karunjie Creek (Fig. 8.3) and Horse Creek (Fig. 8.5) could indicate
channel narrowing during the late Holocene. Such benched or stepped floodplains are
common features along streams in the region and as the T L dating indicates, much of the
present alluvium is late Holocene in age. It is tempting to assume that this indicates a
regional trend for floodplain construction and channel narrowing during the late
Holocene, possibly associated with a late Holocene reduction in monsoon activity
proposed for northern Australia (e.g. Nanson, et al., 1993; Nott, et al., 1996b).
However, it is clear that evidence obtained from the alluvium flanking the streams on the
Kimberley Plateau by itself is by no means conclusive; the observed pattern may simply
reflect the spatial and temporal high variability of large flood events in the region.
Quaternary 242
8.6 Evidence for late Quaternary environmental change from the eastern Kimberley
A site with a comparatively long palaeoenvironmental record has been identified at
Cabbage Tree Creek, located about 150 k m east of Edith Pool along the Durack River
(Figs. 8.1, 8.7). The site has special significance, for here chronological evidence from
fluvial deposits can be complemented by evidence from aeolian features. Datable evidence
for aeolian activity is rare in the region. The nearest dune fields of the Great Sandy Desert
are located some 200 k m south of the study site, and other dunes in the region have only
been described for coastal settings (e.g. Lees, et al., 1992). Furthermore, there is no
geomorphie evidence for extensive floodplain erosion along the lower Cabbage Tree
Creek, but the alluvial sequences exposed along the creek appear to provide a continuous
record of late Quaternary overbank deposition.
A s yet, only a few records exist of Quaternary climatic history of the monsoon areas
of northern Australia and these are mosdy from the northeastern part of the continent
(e.g. Kershaw, 1978; Shulmeister, 1992). A s a consequence, the climatic history of
northwestern Australia has been interpreted from very few sites or extrapolated from sites
beyond the region. Furthermore, evidence indicating significant activity of the rivers in
monsoonal northern Australia and extending into central Australia in the early Holocene
(Kershaw, 1978; Nanson, etal., 1991; 1993; 1995; Shulmeister, 1992; Nott and Price,
1994) contrasts with results obtained from swamp and alluvial sequences along the
northern margin of the Great Sandy Desert (Wyrwoll, et al., 1986; 1992), and evidence
for aridity during the Last Glacial Maximum ( L G M ) in eastern tropical Australia (e.g.
Kershaw, 1978) has been challenged from data obtained near Darwin (Nott and Price,
1994). The dating of aeolian or fluvial deposits, indicating particular phases of aridity or
enhanced fluvial activity, can provide useful information about palaeoclimates (Kershaw
and Nanson, 1993) and is essential for the development of absolute chronologies.

Quaternary 243
8.6.1 Description of study sites
The alluvial sequences and adjacent dune are located in a wide northeast trending
valley which is occupied by the Dunham River and its major tributary Cabbage Tree
Creek (Fig. 8.7). The valley is underlain by Palaeozoic rocks and is bordered to the west
by the Kimberley Foothills, a series of cuestas and hogbacks formed on faulted and
folded Carpentarian rocks, and to the east by the sudden rise of a high scarp bounding the
interbedded Adelaidean age sandstone and siltstone of the Carr Boyd Ranges (Plumb,
1968). To the south, the valley narrows considerably with the rise of the dissected cuesta
and rounded hills of the Ragged Ranges consisting of Upper Devonian conglomerate,
quartz sandstone and silty quartz sandstone. The Dunham valley is about 10 k m wide and
Cainozoic sediments, especially Quaternary alluvium, forms a wide and flat valley floor.
Sandy weathering products from the surrounding ranges are abundant in these valley
deposits which are vegetated with scattered low trees and perennial tussock grasses
thereby limiting present deflation. However, under more arid and windy conditions these
sandy deposits appear to form an abundant source of dune sand. Numerous embayments
along the dissected scarps of the surrounding ranges promote the accumulation of aeolian
deposits in the form of small and mostly vegetated sand patches.
Cabbage Tree Creek drains parts of the Ragged Ranges to the south, and in its middle
and lower course runs for some 12 k m northwards along the floor of the Dunham Valley
before merging with the Dunham River. The present stream carries a bedload of gravel
and coarse-grained sand in a wide largely braided channel, but in places a well defined
single channel is bordered by high vertical banks. About 3 k m upstream of it's
confluence with the Dunham River, the alluvial sequences studied here are exposed along
the present stream banks.
Approximately 7 k m southeast of the study site along Cabbage Tree Creek, a climbing
dune is found representing the only prominent dune in the Dunham valley. It has
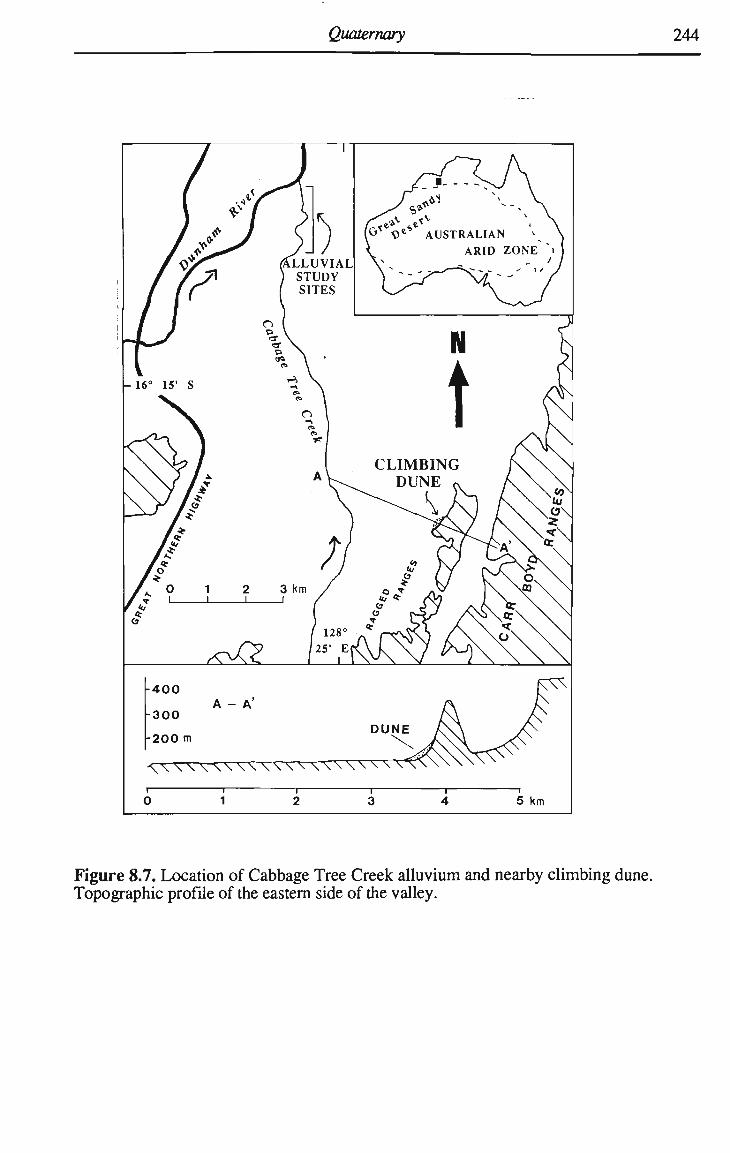
Quaternary 244
Figure 8.7. Location of Cabbage Tree Creek alluvium and nearby climbing dune. Topographic profile of the eastern side of the valley.
Quaternary 245
accumulated in the southeastern comer of a wide open embayment within a dissected
outcrop of the Ragged Ranges which extends parallel to the escarpment of the Carr Boyd
Ranges (Fig. 8.7). Orographically influenced local winds have led to the accumulation of
this sand body during periods of enhanced aeolian activity, probably during drier climatic
phases, characterized by reduced vegetation cover in the Dunham valley and on the
surface of the dune itself (Wende, et al., in press). It appears that frequent local northerly
winds have shifted sand derived from the channels and floodplains of the Dunham Valley
across the open valley floor. In proximity to the northern end of the Ragged Ranges,
where wind speeds are progressively reduced, sand has accumulated on the lower portion
of the southeastern slope of a broad hill. Seasonal southeasterly winds, dominant during
the dry season and a potential cause of deflation, are only effective outside the wind
shadow of the obstructing hill, while monsoonal westerly winds transport the sand
further up the slope. Although the surface of the dune seems to be moderately mobile
under present day conditions, the bulk of the sand body is stable and, as shown below,
appears to contain a useful record of phases of pronounced dune activity.
8.6.2 Stratigraphy and chronology of Cabbage Tree Creek alluvium
The stratigraphy of the alluvial deposits along Cabbage Tree Creek (Fig. 8.7) was
recorded at exposures, and samples for grain size and T L analysis were taken directly
from these bank cuts.
The alluvial sequences exposed along the lower Cabbage Tree Creek generally consist
of channel deposits of imbricated rounded pebbles with a clast supporting fabric overlain
by two distinct units of overbank deposits with poorly developed sedimentary structures,
separated by an abrupt contact (Fig. 8.8).
The lower of the two units is characterized by indurated reddish-white mottled, silty
sand (median size: 3.8 0 ) with occasional calcareous nodules (< 5 cm) and an abundance
of root traces in the form of living roots and substantial rhizoConcretions. The uppermost
unit consist of several metres of mostly weakly cemented red silty sand (median size: 3.7
0 ) , with a diffuse boundary to the overlying sequences of present-day overbank
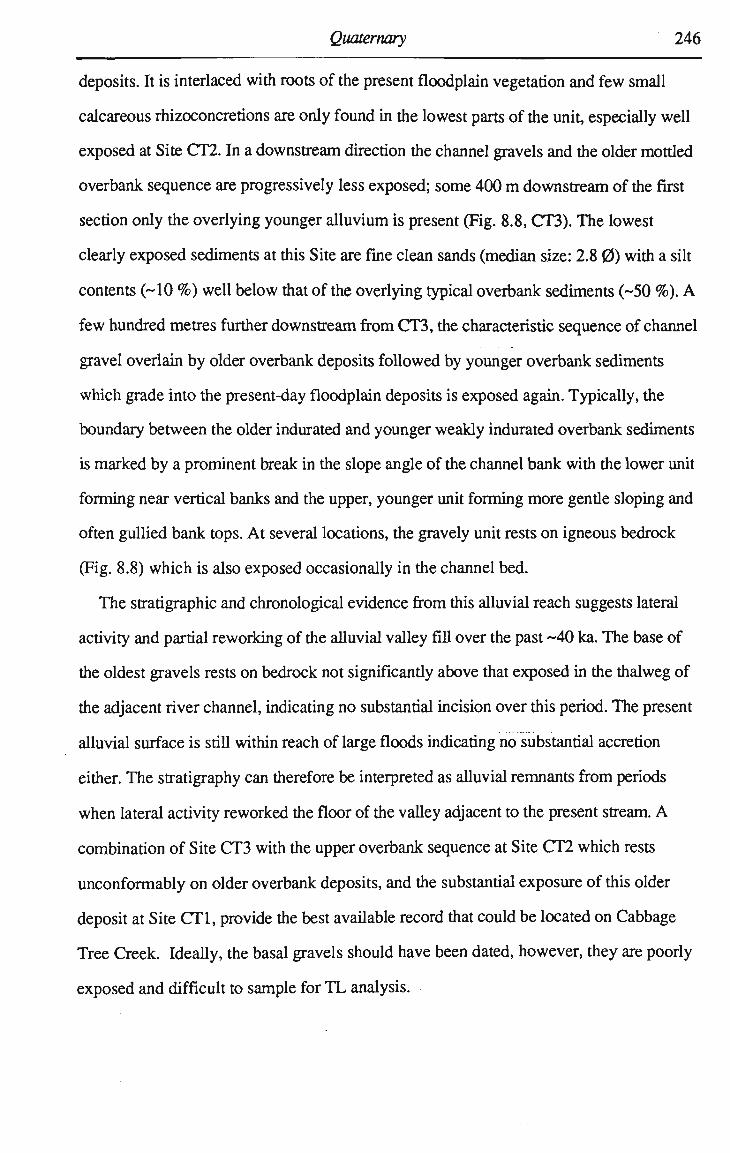
Quaternary 246
deposits. It is interlaced with roots of the present floodplain vegetation and few small
calcareous rhizoconcretions are only found in the lowest parts of the unit, especially well
exposed at Site CT2. In a downstream direction the channel gravels and the older mottled
overbank sequence are progressively less exposed; some 400 m downstream of the first
section only the overlying younger alluvium is present (Fig. 8.8, CT3). The lowest
clearly exposed sediments at this Site are fine clean sands (median size: 2.8 0 ) with a silt
contents (~10 % ) well below that of the overlying typical overbank sediments (~50 % ) . A
few hundred metres further downstream from CT3, the characteristic sequence of channel
gravel overlain by older overbank deposits followed by younger overbank sediments
which grade into the present-day floodplain deposits is exposed again. Typically, the
boundary between the older indurated and younger weakly indurated overbank sediments
is marked by a prominent break in the slope angle of the channel bank with the lower unit
forming near vertical banks and the upper, younger unit forming more gentle sloping and
often gullied bank tops. At several locations, the gravely unit rests on igneous bedrock
(Fig. 8.8) which is also exposed occasionally in the channel bed.
The stratigraphic and chronological evidence from this alluvial reach suggests lateral
activity and partial reworking of the alluvial valley fill over the past ~40 ka. The base of
the oldest gravels rests on bedrock not significantly above that exposed in the thalweg of
the adjacent river channel, indicating no substantial incision over this period. The present
alluvial surface is still within reach of large floods indicating no substantial accretion
either. The stratigraphy can therefore be interpreted as alluvial remnants from periods
when lateral activity reworked the floor of the valley adjacent to the present stream. A
combination of Site C T 3 with the upper overbank sequence at Site C T 2 which rests
unconformably on older overbank deposits, and the substantial exposure of this older
deposit at Site CT1, provide the best available record that could be located on Cabbage
Tree Creek. Ideally, the basal gravels should have been dated, however, they are poorly
exposed and difficult to sample for T L analysis.
Quaternary 247
I8AEJ6
5 4' S co
r-S S- co
|3AEj6
4 4
CM ,-' co ,-
CM _;
52
|eAEj6
PUBS
His S~ ABJO
s« or 2 >
s* rr s^cr ° > f >• <o in "^ in
i — i — i — r
z o <
a x
s >. .2 m S M
CC 'co
O T3 E.S
S °
a> J= .-
-n t ai
E O — CNJ CO
4 4 4 4 in m (O . CO , N P
« n ;- o > in S ai
o +1 CM a>
5 oi
9-E
a.3 >. o \- -a
Illlfll! HI
3N30010H 3N30OlSI31d 31V1 »0OUa33
Figure 8.8. Downstream sequence of sections showing the stratigraphy of exposed alluvium along Cabbage Tree Creek. Numbers of TL samples refer to Appendix H and TL ages are given in thousand years (ka).
Quaternary 248
Eight T L samples taken along the exposure yielded ages of 37.4 ± 6.1 and 37.0 ± 3.1
ka for the lower fine grained alluvial sequence and ages between 12.6 ± 1.0 and 5.3 ±
0.4 ka for the upper sequence (Fig. 8.8). It appears from weathering characteristics that
the -37 ka fines are overbank deposits associated with the underlying bedload gravels. At
Site CT2, the two dates close to the boundary with the underlying older fine alluvium
indicate substantial overbank deposition during the early Holocene, a conclusion
supported by the lowermost two T L dates from Site CT3. The overlying overbank
sequence at Site C T 3 indicates what is a continuation of this wet phase or what could be a
later phase of substantial fluvial activity and rapid sedimentation in the middle Holocene
and ending at about 5-6 ka. Only about 1.8 m of overbank material has been deposited
along the study reach since then.
It is noteworthy that while the Pleistocene alluvium on Cabbage Tree Creek contains
basal gravels, the Holocene fluvial activity only emplaced overbank fines along the study
reach. This may mean that the Holocene fluvial period was not as vigorous as that at
about 37 ka.
The late Pleistocene dates of the older alluvium indicate fluvial deposition prior to 35
ka which coincides with Subpluvial Stage 3, a phase of important fluvial activity in
southeastern Australia, but relatively weak activity in northern Australia (Kershaw, 1978;
Nanson, et al., 1992). N o fluvial activity is apparent along Cabbage Tree Creek during
the L G M , generally regarded as a phase of reduced temperatures and increased aridity in
northern Australia (Kershaw, 1978; Williams, 1985; Colhoun, 1991). Evidence at
Cabbage Tree Creek for returning fluvial activity in the early and middle Holocene
conforms with findings from other rivers affected by the monsoon in northern and central
Australia (Kershaw, 1978; Williams, 1985; Colhoun, 1991; Nanson, et al., 1991; 1992;
1993; 1995; Nott and Price, 1994; Nott, et al., 1996b).
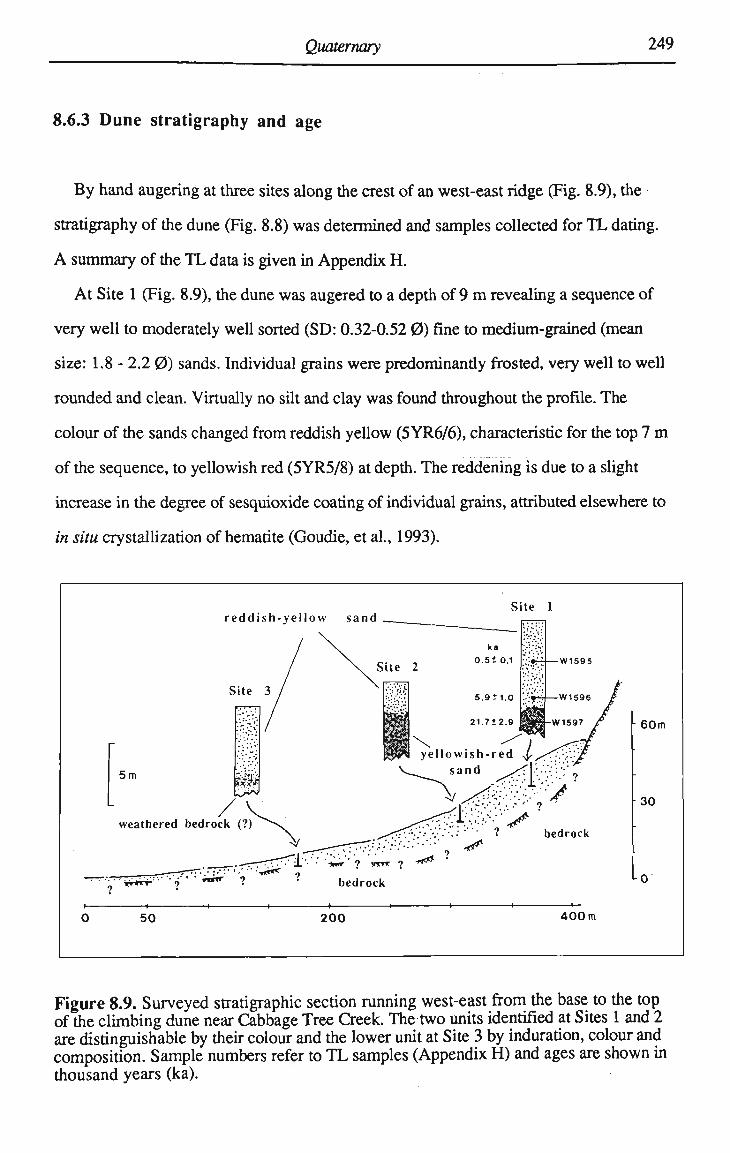
Quaternary 249
8.6.3 D u n e stratigraphy and age
By hand augering at three sites along the crest of an west-east ridge (Fig. 8.9), the
stratigraphy of the dune (Fig. 8.8) was determined and samples collected for T L dating.
A summary of the T L data is given in Appendix H.
At Site 1 (Fig. 8.9), the dune was augered to a depth of 9 m revealing a sequence of
very well to moderately well sorted (SD: 0.32-0.52 0 ) fine to medium-grained (mean
size: 1.8 - 2.2 0 ) sands. Individual grains were predominantly frosted, very well to well
rounded and clean. Virtually no silt and clay was found throughout the profile. The
colour of the sands changed from reddish yellow (5YR6/6), characteristic for the top 7 m
of the sequence, to yellowish red (5YR5/8) at depth. The reddening is due to a slight
increase in the degree of sesquioxide coating of individual grains, attributed elsewhere to
in situ crystallization of hematite (Goudie, et al., 1993).
i 1 1 1 i 1 1 1 1 —
0 50 200 400m
Figure 8.9. Surveyed stratigraphic section running west-east from the base to the top of the climbing dune near Cabbage Tree Creek. The two units identified at Sites 1 and 2 are distinguishable by their colour and the lower unit at Site 3 by induration, colour and composition. Sample numbers refer to T L samples (Appendix H ) and ages are shown in thousand years (ka).

Quaternary 250
The characteristics of the sequences augered at Sites 2 and 3 are very similar to those
of the sequence at Site 1. The change of colour at Site 2 occurs at a depth of 2.5 m but is
not apparent in the sequence at Site 3. Below a depth of 6.2 m in the profile at Site 3, the
interface to weathered bedrock is probably indicated by indurated red (2.5YR5/8) poorly
sorted medium-grained silty to clayey sand.
The T L ages obtained from the sequence at Site 1 are stratigraphically consistent (Fig.
8.9). The lower unit characterized by the redder colour was deposited at around 22 ka
indicating that the dune has been at this location since at least the L G M . Above this unit,
the upper 6-7 m of the dune were active during the last 6 ka, with the top 3 to 4 m active
within the last 500 years. The absence of early Holocene T L ages suggest that there was
insignificant aeolian activity at this time. However, it is not clear, whether additional sand
was deposited during the mid to late Holocene or whether older in-situ sand has been
progressively reworked. Reworking of older deposits could also be the reason for the
apparent absence of early Holocene units. The results are, however, probably best
interpreted together with the complementary evidence obtained from the adjacent alluvial
deposits.
8.6.4 Discussion and conclusions
The chronology of the climbing dune and adjacent alluvium presented agrees with the
general albeit scanty picture of the late Pleistocene to Holocene climatic history of
northern Australia. However, information specific to the region is sparse and the record
of monsoon activity, especially during the early Holocene is still unclear (Wyrwoll,
1993).
A wetter phase is indicated by the alluvial unit along Cabbage Tree Creek yielding T L
ages of 37 ka, coincident with the end of the subpluvial in Oxygen Isotope Stage 3,
proposed by Nanson et al. (1992) as a wet phase in Australia (although relatively minor
in northern Australia). Increased aridity associated with enhanced aeolian activity
probably characterized the region during the L G M , as evidenced by deposits that date at
close to this time in the climbing dune. The apparent absence of fluvial activity during this
Quaternary 251
period in the alluvium of Cabbage Tree Creek is further support for the assumption of
drier conditions during the L G M .
Evidence for pronounced aeolian activity at the maximum of the last glacial period is
recorded in the Australian continental dunefield (Wasson, 1989) and in terrestrial dunes
of the Cape Range region in Western Australia (Wyrwoll, et al., 1993). Recendy
obtained luminescence ages from ridges of linear desert dunes in the Fitzroy River
estuary indicate very late Pleistocene to very early Holocene ages for their emplacements
(Goudie, et al., 1993), which was previously inferred to have occurred sometime
between 25 and 7 ka (Jennings, 1975). Furthermore, widespread dune activity between
24-17 ka, coincident with the L G M and associated low sea level, is provided by the
activity of coastal dunefields in northern Australia (Lees, et al., 1990).
In the eastern Kimberley region, increased aridity and pronounced deflation is
indicated by a Late Pleistocene aeolian sequence (~18 ka BP, radiocarbon dated) of fine
silty material in a rock shelter (Dortch, 1977; Lees, et al., 1992) located just 30 to 40 k m
east of the dune in the Dunham valley. The T L dates presented here provide further
evidence for a drier phase and increased aeolian activity during the L G M in the eastern
Kimberley.
Wetter conditions appear to have returned to the region during the early to mid
Holocene and increased fluvial activity resulted in deposition of alluvium at Cabbage Tree
Creek, yielding T L ages between 12 and 6-5 ka. Very late Pleistocene to early Holocene
fluvial activity in the region is also recorded in alluvium flanking the Durack River at
Edith Pool and the Drysdale River at Drysdale homestead. Furthermore, in regions of
northeastern Australia, the early to mid Holocene period saw significantly wetter
monsoonal conditions than those which prevailed during the late Pleistocene and the mid
to late Holocene (Kershaw, 1986; Nanson, et al., 1991; 1993), effects that appear to
have extended into central Australia at this time (Nanson, et al., 1995). Expanded plunge
pools near Darwin indicate much higher flood discharges from the early to mid Holocene
than at present (Nott and Price, 1994; Nott, et al., 1996b). Monsoon activity at 12 ka is
apparently also recorded in sediments found in the Fitzroy Trough near the northern
Quaternary 252
margin of the Great Sandy Desert (Wyrwoll, 1993) and by 1 4 C dated sediments of 12-11
ka along the Fitzroy River (pers. com. Wyrwoll, 1995). However, these findings are at
odds with results obtained earlier from the Great Sandy Desert itself that suggest subdued
fluvial activity for this period (Wyrwoll, et al., 1986; 1992; Wyrwoll, 1993). It would
appear that not all the palaeodata for the Holocene in this region are pointing in the same
direction, and that further work is required.
Consideration must be given to the possibility that activity of the dune could be the
result of vegetation disturbance due to human induced fire. However, the complementary
evidence of fluvial and aeolian activity for this region in the Holocene at least, suggests
that if fire played a role, then it was probably in association with periods of reduced
moisture when the vegetation became more flammable.
In summary, aeolian activity is indicated for the period of the L G M and to a lesser
extent for the mid to late Holocene. Dated alluvial deposits along adjacent Cabbage Tree
Creek indicate substantial fluvial activity during Oxygen Isotope Stage 3 and again from
the early to mid Holocene, with reduced activity during the late Holocene. These results
support other evidence from northern Australia for intense monsoon activity in
northwestern Australia during the early to mid Holocene and agree well with recent
general reconstructions of the activity of the Australian monsoon (Wasson and Donnelly,
1991). However, there is a need for further comparative investigations with palaeodata,
particularly from the Great Sandy Desert.
253
9. CONCLUSIONS AND OUTLOOK FOR FUTURE STUDIES
The trunk streams draining the southern Karunjie Plateau can be divided into two
distinctly different zones. The stream's middle courses are relatively weakly incised and
of low gradient, while their lower courses are deeply incised and significantiy steeper.
For example, the gradient of the Durack River along its middle course between Karunjie
and the Durack Falls averages 0.8 m/km, whereas from the falls to its mouth the mean
gradient more than doubles to 2 m/km. The low-gradient middle sections of the trunk
streams consist of long sand-bed reaches, commonly of the ridge-forming anabranching
type, which alternate with short bedrock or boulder-bed reaches. This contrasts with the
mink streams' steepened lower sections where bedrock and boulder-bed channels are
predominant.
In this study, selected aspects of the fluvial landforms on the southern Karunjie
Plateau were investigated including the characteristic downstream steepening of the
longitudinal profiles of the trunk streams. Particular attention was given to the forms and
processes of the region's bedrock channels and to the alluvial ridged channels found
along the low gradient middle reaches of the trunk streams. Furthermore, the stratigraphy
and chronology of alluvial deposits flanking streams in the region was studied primarily
with regard to late Quaternary flow-regime changes. Some of the specific conclusions of
this study are summarized below.
(A) Incision of the rivers draining the southern Karunjie Plateau has been controlled
by long-term downcutting of the parent stream, the Cambridge Gulf West Arm. The
reason and timing for the downcutting of the West A r m valley remains largely unclear,
but it must have occurred prior to the valley's drowning by the Holocene transgression
and obviously not in association with the numerous episodes of high sea levels associated
with the Pleistocene interglacials (Chappell and Shackleton, 1986). This downcutting
possibly resulted from uplift proposed to have occurred during the late Miocene-early
Conclusions and outlook 254
Pliocene (e.g. Plumb and Gemuts, 1976). However, considering the apparently very low
rates of vertical and headward stream erosion along the Durack River (Chapter 4)
initiation of this phase of stream incision appears more likely to have occurred earlier than
late Tertiary.
A possible explanation for the anomalous long profiles of the trunk streams is that
their evolution has been influenced by outcropping resistant layers of the Warton
Sandstone and the Lower and Upper Pentecost Sandstones, each acting as local baselevel
controls for stream reaches lying upstream. These sandstones are clearly resistant, for
they form the main caprocks of the surrounding cuesta and plateau landscape. According
to this interpretation, the low-gradient mixed alluvial-bedrock reaches would have
developed upstream of only very slowly eroding outcrops of resistant rocks. In contrast,
the steepened lower reaches of the trunk streams would have formed due to a
combination of continuing incision of the lowermost parent stream (Cambridge Gulf
West A r m ) and retarded erosion in the areas of the outcropping resistant rocks upstream.
For this interpretation the assumption of downstream baselevel lowering at a constant rate
is sufficient.
A n alternative explanation for the characteristic downstream steepening of the trunk
streams is that the long profiles bear the imprint of uplift after a long phase of baselevel
stability, a hypothesis put forward by several researchers (e.g. Plumb and Gemuts,
1976). Even assuming that such episodic uplift has actually occurred, it appears unlikely
that the gently sloping middle reaches represent true remnants of profiles graded to a
former regional baselevel. There are at least two reasons supporting this conclusion.
Firstly, downstream extrapolation of curves fitted to the gende middle reaches yields
disparate values of hypothetical uplift for the study streams. Secondly, the occurrence of
mixed alluvial-bedrock channels and the evidence of stream erosion by hydraulic
plucking along the gently sloping middle sections of the trunk streams indicate that these
reaches are not in a state of grade, but that they are eroding although probably only very
slowly. Perhaps, these low-gradient mixed alluvial-bedrock reaches represent parts of
former graded long profiles which have been steepened marginally in advance of
Conclusions and outlook 255
headward cutting rejuvenated stream reaches. More work is needed before the long-term
long profile evolution of the trunk streams draining the southern Karunjie Plateau can be
outlined with confidence.
(B) The region's bedrock channels reveal an abundance of angular forms such as
rectangular cross sections, stepped channel beds, and deposits of transported angular
boulders. All of these suggest that hydraulic plucking is an important if not the dominant
process of stream incision into the region's well-jointed and gently deformed sandstones.
These bedrock channels cut by hydraulic plucking reveal characteristic erosional and
depositional bedforms and clearly reflect controls imposed by bedrock geology. Along
the downcutting streams on the southern Karunjie Plateau, channel morphology changes
with strata dip in a similar way as it changes along streams developed in well-jointed
carbonate rocks elsewhere (Miller, 1991a). Numerous positive (upstream facing) rock
steps are typical erosional forms for channel reaches where joints in the bedrock produce
layers of platy to bladed slabs which dip gently downstream relative to the channel slope.
Along stream reaches where stratigraphic dip and channel slope are roughly parallel, the
channel bed is frequendy formed along a distinct bedding joint over a considerable
distance and reveals a smooth surface of low relief. Downstream facing steps form
typically along reaches where the dip direction of the strata is upstream.
Upstream facing bedrock steps, characteristic erosional bedforms along dip channel
reaches, initiate the deposition of coarse platy particles of the bedload which slide, pivot,
or m a y even saltate along the channel bed. Resulting depositional bedforms are of three
types: deposits of single clasts leaning on rock steps, clusters of imbricated boulders
formed only on the stoss side of steps, and clusters which extend upstream and
downstream beyond the steps. The periodic occurrence of erosional rock steps and
depositional boulder clusters seems to indicate a hydraulic control of these bedforms.
Along a channel reach on the Durack River, spectacular erosional bedforms provide
evidence of extensive erosion by hydraulic plucking. At Jack's Hole, slabs of rock up to
1 m thick, 9 m wide, 13 m long, and weighing up to 150 tons were eroded from the
Conclusions and outlook 256
channel bed and subsequently deposited in imbricated position as clustered bedforms. A
peak palaeoflood estimate determined using trim-lines and assuming critical flow along
the reach compares well with evidence obtained from joint blocks which were lifted out
of the channel bed by hydraulic plucking. The analysis suggests that floods with
discharges up to approximately 28 000 m3/s, or 2.3 m3/skm2, and local flow velocities
up to 10 m/s occurred at the site. This peak palaeoflood estimate plots below the envelope
curve based on world record values (Costa, 1987), but it is somewhat higher than
maximum gauged discharges in the Kimberley and also higher than palaeoflood estimates
from elsewhere in the region (Gillieson, et al., 1991; Wohl, et al., 1994a). Estimates of
large to extreme design floods based on contemporary regional rainfall characteristics
suggest that hydraulic plucking of joint blocks up to the size of the largest transported
rock slabs found along the reach could occur under present day climatic conditions.
However, it can not be ruled out that some erosion of joint-blocks occurred under a prior
Quaternary flow regime characterized by flood events of much greater magnitude than
have been observed during the Holocene (cf. Nott and Price, 1994; Nott, et al., 1996b).
Nevertheless, this analysis demonstrates the importance of rare high magnitude floods for
bedrock channel erosion on the Kimberley Plateau.
(C) Along the gently sloping middle reaches of the trunk streams, sand-bed channel
reaches alternate with short non-alluvial bedrock reaches. These sand-dominated alluvial
channel reaches commonly reveal very elongated, steep-sided and tree-lined ridges
subdividing the total channel into well defined anabranches. The formation of these sandy
ridges effectively results in a reduction of the total flow width and an associated increase
in water depth and mean flow velocity, thereby enhancing the onward transport of
sediment load. The ridges themselves seem to form as a product of interaction between
the flow, possibly under the influence of secondary flow cells, and an abundance of
within channel vegetation. The ridges appear to compensate for less efficient flow
conditions associated with these densely vegetated alluvial reaches.

Conclusions and outlook 257
Anabranches separated from each other by very elongated treed islands can also form
by scouring of new channels into a floodplain, particular in widened valley sections near
tributary junctions.
(D) The morphology, sedimentology, and thermoluminescence (TL) chronology of
alluvial surfaces flanking the gently sloping middle sections of the rivers on the
Kimberley Plateau provide evidence that these alluvial valley-fills have been formed
during the second half of the Holocene. The largely mid to late Holocene T L ages
obtained for this flanking alluvium may be interpreted as evidence of removal of earlier
deposits in these relatively confined bedrock valleys and could suggest a higher and more
erosive flow regime in the early Holocene.
The T L chronology of alluvium in the eastern Kimberley provides evidence for fluvial
activity at ~37 ka (Subpluvial Stage 3), for returning fluvial activity in the early to mid
Holocene (~12-5 ka), and probably reduced activity in the late Holocene. The chronology
of an adjacent dune indicates aeolian activity for the Last Glacial M a x i m u m (~22 ka) and
the mid to late Holocene (~6 ka to the present). Fluvial activity at 16 -13 ka is also
recorded in alluvium along the Durack River and the Drysdale River providing tentative
evidence for postglacial monsoon activity on the Kimberley Plateau as early as the very
late Pleistocene. These results conform well with other findings in northern Australia
(Nanson et al. 1991; 1993; 1995; Nott and Price, 1994; Nott et al., 1996b), but reduced
fluvial activity during the late Holocene contrasts results from further south in the Great
Sandy Desert (Wyrwoll, et al. 1986; 1992).
In a region so poorly understood scientifically as is the Kimberley Plateau in
northwestern Australia, opportunities for future fluvial research abound. Studies are
needed to elucidate the long term regional landscape evolution, in particular the region's
Mesozoic and Cainozoic relative sea-land movements. Concerning the latter question, the
investigation of the offshore sedimentary record and of landscapes adjacent to the
Kimberley Plateau is likely to be most promising. Regarding stream erosion of bedrock,
Conclusions and outlook 258
more quantitative details about the important process of hydraulic plucking, as well as the
formation and stability of cluster bedforms comprising large rock slabs, could be
obtained form experimental work and field measurements, the latter for example by
monitoring of lift forces acting on large platy particles in natural streams during floods
(cf. Ergenzinger and Jupner, 1992). Similarly, flume experiments could be used to
investigate the proposed mechanisms for the formation and maintenance of the sandy
ridges in the studied variety of anabranching alluvial streams. Additional work is also
needed to quantify the extreme river discharges that have occurred in the region. Finally,
further studies on the stratigraphy and chronology of alluvial deposits flanking rivers in
the region are needed to obtain a more detailed picture of changing monsoon activity in
the late Quaternary. While Quaternary deposits are sparse on the Kimberley Plateau,
streams peripheral to the plateau, such as the Ord and Fitzroy Rivers, offer extensive
alluvial sections for analysis.
REFERENCES
Abrahams, A.D., 1972. Factor analysis of drainage basin properties: evidence for stream
abstraction accompanying the degradation of relief. Water Resources Research, 8:
624-633.
Abrahams, A.D. and Flint, J.-J., 1983. Geological controls on the topological properties
of some trellis channel networks. Geological Society of America Bulletin, 94: 80-91.
Ahnert, F., 1954. Zur Frage der riickschreitenden Denudation und des dynamischen
Gleichgewichts bei morphologischen Vorgangen. Erdkunde, 8: 61-64.
Ahnert, F., 1970. Functional relationship between denudation, relief and uplift in large
mid-altitude drainage basins. American Journal of Science, 268: 243-263.
Ahnert, F., 1987a. Approaches to dynamic equilibrium in theoretical simulations of slope
development. Earth Surfaces Processes and Landforms, 12: 3-15.
Ahnert, F., 1987b. Process-response models of denudation at different spatial scales.
Catena Supplement, 10: 31-50.
Ahnert, F., 1994. Equilibrium, scale and inheritance in geomorphology.
Geomorphology, 11: 125-140.
Aitken, M.J., 1985. Thermoluminescence dating. Academic Press, London.
Alexandrowicz, Z., 1994. Geologically controlled waterfall types in the Outer
Carpathians. Geomorphology, 9: 155-165.
Allen, J., 1942. A n investigation of the stability of bed materials in a stream of water.
Journal of the Institute of Civil Engineers, 5: 1-34.
Allen, J.R.L., 1971. Transverse erosional marks of mud and rock: their physical basis
and geological significance. Sedimentary Geology, 5: 167-385.
Allen, J.R.L., 1982. Sedimentary structures: their character and physical basis (2
volumes). Elsevier, Amsterdam.
Allison, R.J. and Goudie, A.S., 1990. Rock control and slope profiles in a tropical
limestone environment: the Napier Range of Western Australia. The Geographical
Journal, 156:200-211.
Allison, R.J., Goudie, A.S. and Cox, N.J., 1993. Geotechnical properties of rock
masses: their control on slope form and mechanisms of change along the Napier
Range, Western Australia. Geomorphology, 8: 65-80.
Andel, T.H.v., Heath, G.R., Moore, T.C. and McGeary, D.F.R., 1967. Late
Quaternary history, climate and oceanography of the Timor Sea, northwestern
Australia. American Journal of Science, 265: 737-758.
Annandale, G.W., 1995. Erodibility. Journal of Hydraulic Research, 33: 471-495.
References 260
Ashley, G.M., 1990. Classification of large-scale subaqueous bedforms: a new look at
an old problem. Journal of Sedimentary Petrology, 60: 160-172.
Atlas of Australian Resources, 1980. Volume 1, soils and land use. Third series,
Canberra.
Baker, V.R., 1973. Erosional forms and processes for the catastrophic Pleistocene
Missoula floods in eastern Washington. In: Morisawa, M . (Ed.), Fluvial
geomorphology. State University of N e w York, Binghamton, pp. 123-148.
Baker, V.R., 1977. Stream-channel response to floods with examples from central
Texas. Geological Society America Bulletin, 88:1057-1071.
Baker, V.R., 1978a. Large-scale erosional and depositional features of the Scabland
floods. In: Baker, V.R. and Nummedal, D. (Eds.), The Channeled Scabland.
National Aeronautics and Space Administration, Washington (DC), pp. 81-115.
Baker, V.R., 1978b. Paleohydraulics and hydrodynamics of Scabland floods. In: Baker,
V.R. (Ed.), Catastrophic flooding: The origin of the Channeled Scabland. Dowden,
Hutchinson & Ross, Strondsburg (Pa), pp. 255-275.
Baker, V.R., 1984. Flood sedimentation in bedrock fluvial systems. In: Koster, E.H.
and Steel, R.J. (Eds.), The sedimentology of gravels and conglomerates (Canadian
Society of Petroleum Geologists Memoir 10), pp. 87-98.
Baker, V.R., 1987. Paleoflood hydrology and extraordinary flood events. Journal of
Hydrology, 96: 79-99.
Baker, V.R., 1988. Flood erosion. In: Baker, V.R., Kochel, R.C. and Patton, P.C.
(Eds.), Flood geomorphology. Wiley, N e w York, pp. 81-95.
Baker, V.R. and Pickup, G., 1987. Flood geomorphology of the Katherine Gorge,
Northern Territory, Australia. Geological Society of America Bulletin, 98: 635-646.
Baker, V.R. and Ritter, D.F., 1975. Competence of rivers to transport coarse bedload
material. Geological Society of America Bulletin, 86: 975-978.
Baker, V.R. and Twidale, C.R., 1991. The reenchantment of geomorphology.
Geomorphology, 4: 73-100.
Baker, V.R., Kochel, R.C, Patton, P.C. and Pickup, G., 1983. Palaeohydrologic
analysis of Holocene flood slack-water sediments. Special Publications International
Association of Sedimentologists, 6: 229-239.
Bauer, B., 1980. Drainage density-an integrative measure of the dynamics and the quality
of watersheds. Zeitschrift fur Geomorphologie N.F., 24: 262-272.
Beard, J.S., 1979. Kimberley. Vegetation Survey of Western Australia, 1:1 000 000
Vegetation Series Explanatory Notes to Sheet 1, University of Western Australia
Press, Nedlands.
Billi, P., 1988. A note on cluster bedform behaviour in a gravel-bed river. Catena, 15:
473-481.
References 261
Bishop, P., 1995. Drainage rearrangement by river capture, beheading and diversion.
Progress in Physical Geography, 19: 449-473.
Bonneau, P.R. and Snow, R.S., 1992. Character of headwaters adjustment to base level
drop, investigated by digital modeling. Geomorphology, 5: 475-478.
Bradley, W.C. and Mears, A.I., 1980. Calculations of flows needed to transport coarse
fraction of Boulder Creek alluvium. Geological Society of America Bulletin, 91:
1057-1090.
Bradley, W . C , Fahnenstock, R.K. and Rowekamp, E.T., 1972. Coarse sediment
transport by flood flows on Knik River, Alaska. Geological Society of America
Bulletin, 83: 1261-1284.
Brakenridge, G.R., 1984. Alluvial stratigraphy and radiocarbon dating along the Duck
River, Tennessee: implications regarding flood-plain origin. Geological Society of
America Bulletin, 95:9-25.
Brakenridge, G.R., 1988. River flood regime and floodplain stratigraphy. In: Baker,
V.R., Kochel, R.C. and Patton, P.C. (Eds.), Flood geomorphology. Wiley, N e w
York, pp. 139-156.
Brayshaw, A.C, 1984. Characteristics and origin of cluster bedforms in coarse-grained
alluvial channels. In: Koster, E.H. and Steel, R.J. (Eds.), Sedimentology of Gravels
and Conglomerates (Canadian Society of Petroleum Geologists Memoir 10), pp. 77-
85.
Brayshaw, A . C , Frostick, L.E. and Reid, I., 1983. The hydrodynamics of particle
clusters and sediment entrainment in coarse alluvial channels. Sedimentology, 30:
137-143.
Bremer, H., 1971. Fliisse, Flachen- und Stufenbildung in den feuchten Tropen.
Wurzburger Geographische Arbeiten, 35: 1-194.
Brizga, S.O. and Finnlayson, B.L., 1990. Channel avulsion and river metamorphosis:
the case of the Thomson River, Victoria, Australia. Earth Surfaces Processes and
Landforms, 15: 391-404.
Brown, J.A.H., 1988. Flood propability in the Kimberley Region, Western Australia.
Proc. Hydrology and Water Resources Symposium 1-3 February 1988, Australian
National University, Canberra, pp. 59-64.
Biidel, J., 1957. Die 'Doppelten Einebenungsflachen' in den feuchten Tropen. Zeitschrift
fur Geomorphologie N.F., 1: 201-231.
Biidel, J., 1977. Klima-Geomorphologie. Gebriider Borntraeger, Berlin.
Bull, W.B., 1979. Threshold of critical power in streams. Geological Society of America
Bulletin, 90, Part I: 453-464.
Bureau of Meteorology, 1988. Climatic Adas of Australia. Commonwealth of Australia,
Canberra.
References 262
Burkham, D.E., 1972. Channel changes of the Gila River in Safford Valley, Arizona
1846-1970. United States Geological Survey Professional Paper, 655-G: 1-24.
Burnett, A.W. and Schumm, S.A., 1983. Alluvial river response to neotectonic
deformation in Louisiana and Mississippi. Science, 222: 49-50.
Callahan, S., 1986. Damming leads to new islands in the Ord? Search, 17: 211-213.
Canterford, R.P. and Pierrehumbert, C.L., 1977. Frequency distributions of heavy
rainfalls in tropical Australia. Hydrology Symposium 1977: The hydrology of
northern Australia, Brisbane, 28-30 June, pp. 119-124.
Carling, P.A., 1983. Threshold of coarse sediment transport in broad and narrow natural
streams. Earth Surfaces Processes and Landforms, 8: 1-18.
Carling, P.A., 1995. Flow-separation berms downstream of a hydraulic jump in a
bedrock channel. Geomorphology, 11: 245-253.
Carling, P. A. and Grodek, T., 1994. Indirect estimation of ungauged peak discharges in
a bedrock channel with reference to design discharge selection. Hydrological
Processes, 8:497-511.
Carling, P.A., Kelsey, A. and Glaister, M.S., 1992. Effects of bed roughness, particle
shape and orientation on initial motion criteria. In: Billi, P., Hey, R.D., Thome, C R .
and Tacconi, P. (Eds.), Dynamics of gravel-bed rivers. Wiley, N e w York, pp. 23-39.
Chappell, J. and Shackleton, N.J., 1986. Oxygen isotopes and sea level. Nature, 324:
137-140.
Chorley, R.J. and Morgan, M.A., 1962. Comparison of morphometric features, Unaka
mountains Tennessee and North Carolina, and Dartmoor, England. Geological
Society of America Bulletin, 72:17-34.
Chorley, R.J., Schumm, S.A. and Sudgen, D.E., 1984. Geomorphology. Methuen,
London.
Chow, V.T., 1959. Open-channel hydraulics. McGraw-Hill, N e w York.
Church, M., 1992. Channel morphology and typology. In: Calow, P. and Petts, G.E.
(Eds.), The rivers handbook, volume 1, Blackwell, Oxford, pp. 126-143.
Cockbain, A.E. and Hocking, R.M., 1990. Phanerozoic. In: Western Australia
Geological Survey (Ed.), Geology and Mineral Resources of Western Australia
(Memoir 3), pp. 750-755.
Colby, B.R., 1964. Sand discharge and mean-velocity relationships in sandbed streams.
United States Geological Survey Professional Paper, 462A: 1-47.
Coleman, J.M. and Wright, L.D., 1978. Sedimentation in an arid macrotidal alluvial
river system: Ord River, Western Australia. Journal of Geology, 86: 621-642.
Colhoun, E.A., 1991. Climate during the Last Glacial Maximum in Australia and N e w
Guinea. Australian and N e w Zealand Geomorphology Group Special Publications, 2:
1-71.
References 263
Costa, J.E., 1983. Paleohydraulic reconstruction of flash-flood peaks from boulder
deposits in the Colorado Front Range. Geological Society of America Bulletin, 94:
986-1004.
Costa, J.E., 1987. A comparison of the largest rainfall-runoff floods in the United States
with those of the People's Republic of China and the World. Journal of Hydrology,
96: 101-115.
Culbertson, J.K., 1967. Evidence of secondary circulation in an alluvial channel. United
States Geological Survey Professional Paper, 575-D: 214-216.
Dal Cin, R., 1968. Pebble clusters: their origin and utilization in the study of palaeo-
currents. Sedimentary Geology, 2: 233-241.
Davis, J.C, 1973. Statistics and data analysis in geology. Wiley, N e w York.
Day, M.J. and Goudie, A.S., 1977. Field assessment of rock hardness using the
Schmidt Test Hammer. British Geomorphological Research Group Technical Bulletin,
18: 19-29.
de Jong, C , 1991. A reappraisal of the significance of obstacle clasts in cluster bedform
dispersal. Earth Surfaces Processes and Landforms, 16: 737-744.
de Jong, C. and Ergenzinger, P., 1995. The interrelations between mountain valley form
and river-bed arrangement. In: Hickin, E.J. (Ed.), River geomorphology. Wiley,
N e w York, pp. 55-91.
Deffontaines, B. and Chorowitz, J., 1991. Principles of drainage basin analysis from
multisource data: application to the structural analysis of the Zaire Basin.
Tectonophysics, 194: 237-263.
Denny, M.W., 1993. Air and water: the biology and physics of life's media. Princeton
University Press, Princeton.
Department of Public Works Western Australia, 1984. Streamflow records of Western
Australia to 1982, volume 3, Perth.
Derrick, G.M., 1969. Ashton, Western Australia. 1:250 000 Geological Series
Explanatory Notes SD52-13, Bureau of Mineral Resources, Geology and
Geophysics, Canberra.
Doornkamp, J.C. and King, C.A.M., 1971. Numerical analysis in geomorphology: an
introduction. Edward Arnold, London.
Dortch, C.E., 1977. Ancient grooved stone axes from an alluvial terrace on Stonewall
Creek, Kimberley, Western Australia. Journal of the Royal Society of Western
Australia, 60: 23-30.
Dow, D.B. and Gemuts, I., 1969. Geology of the Kimberley region, Western Australia;
East Kimberley. Geological Survey of Western Australia Bulletin, 120:1-135.
Downie, N.M. and Starry, A.R., 1977. Descriptive and inferential statistics. Harper &
Row, N e w York.
References 264
Engineering Sciences Data, 1976. Fluid mechanics, external flow, volume 2.
Engineering Sciences Data Unit, London.
Ergenzinger, P. and Jupner, R., 1992. Using C O S S Y (CObble Satellite SYstem) for
measuring the effects of lift and drag forces. Erosion and Sediment Transport
Monitoring Programmes in River Basins, Proceedings of the Oslo Symposium,
August 1992, IAHS Publication, 210: 41-49.
Ferguson, R.I., 1987. Hydraulic and sedimentary controls of channel pattern. In:
Richards, K.S. (Ed.), River channels. Blackwell, Oxford, pp. 129-158.
Ferguson, R. and Ashworth, P., 1991. Slope-induced changes in channel character
along a gravel-bed stream: the Allt Dubhaig, Scotland. Earth Surfaces Processes and
Landforms, 16: 65-82.
Finlayson, B.L. and McMahon, T.A., 1988. Australia v the World: a comparative
analysis of streamflow characteritics. In: Warner, R.F. (Ed.), Fluvial geomorphology
of Australia. Academic Press, Sydney, pp. 17-40.
Fiorotto, V. and Rinaldo, A., 1992. Fluctuating uplift and lining design in spillway
stilling basins. Journal of Hydraulic Engineering, 118: 578-596.
Fitzpatrick, E.A. and Arnold, J.M., 1964. Climate of the West Kimberley area. CSIRO
Australia Land Research Series, 9: 76-102.
Flint, J.J., 1974. Stream gradient as a function of order, magnitude and discharge. Water
Resources Research, 10: 969-973.
Foley, M.G., 1980. Bed-rock incicion by streams. Geological Society of America
Bulletin, 91(Part 2): 2189-2213.
Foley, M.G., Doesburg, J.M. and Zimmerman, D.A., 1984. Paleohydrologic techniques
with environmental applications for siting hazardous waste facilities. In: Koster, E.H.
and Steel, R.J. (Eds.), Sedimentology of gravels and conglomerates (Canadian
Society of Petroleum Geologists Memoir 10), pp. 99-108.
Folk, R.L., 1974. Petrology of sedimentary rocks. Hemphill, Austin.
Folk, R.L. and Ward, W . C , 1957. Brazos river bar: a study in the significance of grain
sixe parameters. Journal of Sedimentary Petrology, 27: 3-26.
Galloway, R.W. and Kemp, E.M., 1981. Late Cainozoic environments in Australia. In:
Keast, A. (Ed.), Ecological Biogeography of Australia. Junk, The Hague, pp. 53-80.
Gardiner, V., 1975. Drainage basin morphometry. British Geomorphological Research
Group Technical Bulletin, 14: 1-48.
Gardiner, V., 1981. Drainage basin morphometry. In: Goudie, A. (Ed.),
Geomorphological techniques. Allen & Unwin, London, pp. 47-55.
Gardiner, V. and Park, C.C, 1978. Drainage basin morphometry. Progress in Physical
Geography, 2: 1-35.
References 265
Gardner, T.W., 1983. Experimental study of knickpoint and longitudinal profile
evolution in cohesive, homogeneous material. Geological Society of America Bulletin,
94: 664-672.
Garner, H.F., 1974. The origin of landscapes. Oxford University Press, N e w York.
Gellatiy, D.C and Sofoulis, J., 1969. Drysdale and Londonderry, Western Australia.
1:250 000 Geological Series Explanatory Notes SD/52-5 and 9, Bureau of Mineral
Resources, Geology and Geophysics, Canberra.
Gellatiy, D.C, Derrick, G.M. and Plumb, K.A., 1975. The geology of the Lansdowne
1:250 000 sheet area, Western Australia, Australia Bureau of Mineral Resources,
Geology and Geophysics, Report 152, Canberra.
Geological Survey of Western Australia, 1975. The Geology of Western Australia,
Memoir 2. Perth.
Geological Survey of Western Australia, 1990. Geology and Mineral Resources of
Western Australia, Memoir 3. Perth.
Gilbert, G.K., 1877. Report on the geology of the Henry Mountains Washington.
United States Government Printing Office, Washington.
Gillieson, D., Smith, D.I., Greenaway, M . and Ellaway, M., 1991. Flood history of the
limestone ranges in the Kimberley region, Western Australia. Applied Geography, 11:
105-123.
Goldrick, G. and Bishop, P., 1995. Differentiating the roles of lithology and uplift in the
steepening of bedrock river long profiles: an example from southeastern Australia.
Journal of Geology, 103: 227-231.
Goudie, A.S. and Sands, M.J.S., 1989. The Kimberley Research Project, Western
Australia 1988: a report. The Geographical Journal, 155:161-166.
Goudie, A.S., Viles, H , Allison, R., Day, M., Livingstone, I. and Bull, P., 1990. The
geomorphology of the Napier Range, Western Australia. Transactions Institute
Bristish Geographers N.S., 15: 308-322.
Goudie, A.S., Sands, M.J.S. and Livingstone, I., 1992. Aligned linear gilgai in the
West Kimberley District, Western Australia. Journal of Arid Environments, 23:157-
167.
Goudie, A.S., Stokes, S., Livingstone, I., Bailiff, I.K. and Allison, R.J., 1993. Post-
depositional modification of the linear sand ridges of the West Kimberley area of
north-west Australia. The Geographical Journal, 159: 306-317.
Graeme, D. and Dunkerley, D.L., 1993. Hydraulic resistance by the River Red Gum,
Eucalyptus camaldulensis, in ephemeral desert streams. Australian Geographical
Studies, 31: 141-154.
Graf, W.L., 1988. Fluvial processes in dryland rivers. Springer, Berlin.
Gregory, K.J. and Gardiner, V., 1975. Drainage density and climate. Zeitschrift fur
Geomorphologie N.F., 19: 287-298.
References 266
Gregory, K.J. and Walling, D.E., 1973. Drainage basin form and process: a
geomorphological approach. Edward Arnold, London.
Griffin, TJ. and Grey, K., 1990. Kimberley Basin. In: Western Australia Geological
Survey (Ed.), Geology and Mineral Resources of Western Australia (Memoir 3), pp.
293-304.
Gupta, A., 1983. High-magnitude floods and stream channel response. Special
Publications International Association of Sedimentologists, 6: 219-227.
Gupta, A., 1988. Large floods as geomorphie events in the humid tropics. In: Baker,
V.R., Kochel, R.C. and Patton, P.C (Eds.), Flood geomorphology. Wiley, N e w
York, pp. 301-315.
Gupta, A., 1993. The changing geomorphology of the humid tropics. Geomorphology,
7: 165-186.
Gustavson, T.C, 1974. Sedimentation on gravel outwash fans, Malaspina glacier
foreland, Alaska. Journal of Sedimentary Petrology, 44: 374-389.
Hack, J.T., 1957. Studies of longitudinal stream profiles in Virginia and Maryland.
United States Geological Survey Professional Paper, 294-B: 45-97.
Hack, J.T., 1960. Interpretation of erosional topography in humid temperate regions.
American Journal of Science, 258-A: 80-97.
Hack, J.T., 1973. Stream-profile analysis and stream-gradient index. United States
Geological Survey Research Journal, 1: 421-429.
Hays, J., 1967. Land surfaces and laterites in the north of the Northern Territory. In:
Jennings, J.N. and Mabbutt, J.A. (Eds.), Landform Studies from Australia and N e w
Guinea. Australian National University Press, Canberra, pp. 182-210.
Hays, J., 1968. Geomorphology (Bonaparte Gulf Basin). Bureau of Mineral Resources,
Geology and Geophysics Bulletin, 97:138-140.
Helley, E.J., 1969. Field measurement of the initiation of large bed particle motion in
Blue Creek near Klamath, California. United States Geological Survey Professional
Paper, 562-G: 1-19.
Henderson, F.M., 1966. Open channel flow. Macimillian, N e w York.
Hoerner, S.F., 1965. Fluid dynamic drag. Hoerner Fluid Dynamics, Bricktown (NJ).
Holland, W.N. and Pickup, G., 1976. Flume study of knickpoint development in
stratified sediment. Geological Society of America Bulletin, 87:76-82.
Horton, R.E., 1945. Erosional development of streams and their drainage basins-
hydrophysical approach to quantitative morphology. Geological Society of America
Bulletin, 56: 275-370.
Howard, A.D., 1967. Drainage analysis in geologic interpretation: a summation. Bulletin
American Association of Petroleum Geologists, 51: 2246-2259.
Howard, A.D., 1980. Thresholds in river regimes. In: Coates, D.R. and Vitek, J.D.
(Eds.), Thresholds in Geomorphology. Allen and Unwin, Boston, pp. 227-258.

References 267
Howard, A.D., 1987. Modelling fluvial systems: rock, gravel and sand bed channels. In:
Richards, K.S. (Ed.), River channels. Blackwell, Oxford, pp. 69-94.
Howard, A.D., 1994. A detachment-limited model of drainage basin evolution. Water
Resources Research, 30: 2261-2285.
Howard, A.D., 1996. Gradient control in mixed alluvial-bedrock rivers (Abstract).
Proceedings Bedrock Channel Conference, Colorado State University, Pingree Park
Campus, August 29 - September 1,1996 (unpublished).
Howard, A.D. and Dolan, R., 1981. Geomorphology of the Colorado River in the
Grand Canyon. Journal of Geology, 89: 269-298.
Howard, A.D. and Kerby, G., 1983. Channel changes in badlands. Geological Society
of America Bulletin, 94: 739-752.
Howard, A.D., Dietrich, W.E. and Seidl, M.A., 1994. Modeling fluvial erosion on
regional to continental scales. Journal of Geophysical Research, 99: 13971-13986.
Hupp, C R . and Osterkamp, W.R., 1996. Riparian vegetation and fluvial geomorphie
processes. Geomorphology, 14: 277-295.
Institution of Engineers Australia, 1987. Australian rainfall and runoff (2 volumes).
Institution of Engineers, Barton (ACT).
Ivanovich, M . and Harmon, R.S. (Eds.), 1992. Uranium-series disequilibrium:
applications to earth, marine, and environmental sciences. Claredon Press, Oxford.
Iverson, N.R., 1991. Potential effects of subglacial water-pressure fluctuations on
quarrying. Journal of Glaciology, 37: 27-36.
Jackson, R.G.I., 1975. Hierarchical attributes and a unifying model of bed forms
composed of cohesionless material and produced by shearing flow. Geological
Society of America Bulletin, 86: 1523-1533.
James, C.S., 1990. Prediction of entrainment conditions for nonuniform noncohesive
sediments. Journal of Hydraulic Research, 28: 25-41.
Jennings, J.N. and Mabbutt, J.A., 1986. Physiographic outlines and regions. In: Jeans,
D.N. (Ed.), The natural environment-Australia, a geography, volume 1. Sydney
University Press, Sydney, pp. 80-96.
Jennings, J.N. and Sweeting, M.M., 1963. The limestone ranges in the Fitzroy Basin,
Western Australia. Bonner Geographische Abhandlungen, 32: 1-60.
Johansson, C.E., 1976. Structural studies of frictional sediments. Geografiska Annaler,
58A: 201-301.
Jutson, J.T., 1914. A n outline of the physiographical geology (physiography) of
Western Australia. Geological Survey Western Australia Bulletin, 61:1-240.
Jutson, J.T., 1934. The physiography (geomorphology) of Western Australia.
Geological Survey Western Australia Bulletin, 95: 1-366.
Karcz, I., 1966. Secondary currents and the configuration of a natural stream bed.
Journal of Geophysical Research, 71: 3109-3112.
References 268
Karim, M.F. and Kennedy, J.F., 1990. Menu of coupled velocity and sediment-
discharge relations for rivers. Journal of Hydraulic Engineering, 116: 978-996.
Kemp, E.M., 1981. Tertiary palaeogeography and the evolution of Australian climate. In:
Keast, A. (Ed.), Ecological Biogeography of Australia. Junk, The Hague, pp. 33-49.
Kershaw, A.P., 1978. Record of last interglacial-glacial cycle from northeastern
Queensland. Nature, 272: 159-161.
Kershaw, A.P., 1986. Climatic change and Aboriginal burning in north-east Australia
during the last two glacial/interglacial cycles. Nature, 322:47-49.
Kershaw, A.P., 1988. Australasia. In: Huntley, B. and Webb, T.I. (Eds.), Vegetation
history. Kluwer, Rotterdam, pp. 237-306.
Kershaw, A.P. and Nanson, G.C, 1993. The last full glacial cycle in the Australian
region. Global and Planetary Change, 7: 1-9.
Kirkby, M.J., 1971. Hillslope process-response models based on the continuity
equation. In: Brunsden, D. (Ed.), Slopes form and process. Institute of British
Geographers Special Publication 3, London, pp. 15-30.
Knighton, D., 1984. Fluvial forms and processes. Edward Arnold, London.
Knighton, D.A. and Nanson, G.C, 1993. Anastomosis and the continuum of channel
pattern. Earth Surfaces Processes and Landforms, 18: 613-625.
Komar, P.D., 1988. Sediment transport by floods. In: Baker, V.R., Kochel, R.C. and
Patton, P.C. (Eds.), Flood geomorphology. Wiley, N e w York, pp. 97-111.
Komar, P.D., 1989. Flow-competence evaluations of the hydraulic parameters of floods:
an assessment of the technique. In: Beven, K. and Carling, P.A. (Eds.), Floods:
hydrological, sedimentological and geomorphological implications. Wiley, N e w
York, pp. 107-134.
Komar, P.D. and Li, Z., 1988. Applications of grain-pivoting and sliding analyses to
selective entrainment of gravel and to flow-competence evaluations. Sedimentology,
35: 681-695.
Koster, E.H., 1978. Transverse ribs: their characteristics, origin, and paleohydraulic
significance. In: Miall, A.D. (Ed.), Fluvial sedimentology (Canadian Society of
Petroleum Geologists Memoir 5), pp. 161-186.
Ku, T.-L., 1976. The Uranium-series methods of age determinantion. Annual Review of
Earth and Planetary Sciences, 4: 347-379.
Laronne, J.B. and Carson, M.A., 1976. Interrelationships between bed morphology and
bed-material transport for a small, gravel-bed channel. Sedimentology, 23: 67-85.
Lees, B.G., Lu, Y. and Head, J., 1990. Reconnaissance thermoluminescence dating of
northern Australian coastal dune systems. Quaternary Research, 34: 169-185.
Lees, B.G., Yarichou, L. and Price, D.M., 1992. Thermoluminescence dating of dunes
at Cape St. Lambert, East Kimberley, northwestern Australia. Marine Geology, 106:
131-139.
References 269
Leopold, L.B. and Wolman, M.G., 1957. River channel patterns: braided, meandering
and straight. United States Geological Survey Professional Paper, 282-B: 39-85.
Lewin, J., 1978. Floodplain geomorphology. Progress in Physical Geography, 2: 408-
437.
Lewin, J., 1992. Floodplain construction and erosion. In: Calow, P. and Petts, G.E.
(Eds.), The rivers handbook, volume 1. Blackwell, Oxford, pp. 144-161.
Lindholm, R., 1987. A practical approach to sedimentology. Allen & Unwin, Boston.
Lobeck, A.K., 1939. Geomorphology. McGraw-Hill, N e w York.
Lourensz, R.S., 1981. Tropical cyclones in the Australian region, July 1909 to June
1980. A G P S , Canberra.
Mackin, J.H., 1948. Concept of the graded river. Geological Society of America
Bulletin, 59: 463-512.
Mangelsdorf, J., Scheuermann, K. and WeiB, F.-H., 1990. River morphology.
Springer, Berlin.
Mark, D.M., 1974. Line intersection method for estimating drainage density. Geology,
2: 235-236.
Martin, H.A., 1981. The Tertiary flora. In: Keast, A. (Ed.), Ecological biogeography of
Australia. Junk, The Hague, pp. 391-406.
Matthes, G.H., 1947. Macroturbulence in natural stream flow. Transactions of the
American Geophysical Union, 28: 255-262.
Maxson, J.H., 1940. Fluting and faceting of rock fragments. Journal of Geology, 48:
717-751.
McArthur, W . M . and Wright, M.J., 1967. Explanatory data for Sheet 9, Kimberley
Area; Atlas of Australian Soils. CSIRO and Melbourne University Press, Melbourne.
McCoy, R.M., 1971. Rapid measurement of drainage density. Geological Society of
America Bulletin, 82: 757-762.
McCulloch, M.T., De Dekker, P. and Chivas, A.R., 1989. Strontium isotope variations
in single ostracod valves from the Gulf of Carpentaria, Australia: a
paleoenvironmental indicator. Geochimica et Cosmochimica Acta, 53: 1703-1710.
McDonald, B.C. and Banerjee, I., 1971. Sediments and bedforms on a braided outwash
plain. Canadian Journal of Earth Sciences, 8: 1282-1301.
McDonald, B.C. and Day, T.J., 1978. An experimental flume study on the formation of
transverse ribs. Geological Survey of Canada, Paper 78-1A: 441-451.
McManus, J., 1988. Grain size determination and interpretation. In: Tucker, M. (Ed.),
Techniques in sedimentology. Blackwell, Oxford, pp. 63-85.
Merritts, D. and Vincent, K.R., 1989. Geomorphie response of coastal streams to low,
intermediate, and high rates of uplift, Mendocino triple junction region, northern
California. Geological Society of America Bulletin, 101: 1373-1388.

References 270
Miall, A.D., 1992. Alluvial deposits. In: Walker, R.G. and James, N.P. (Eds.), Facies
models: response to sea level change. Geological Association of Canada, St John's,
pp. 119-142.
Miller, A.J. and Parkinson, D.J., 1993. Flood hydrology and geomorphie effects on
river channels and flood plains: the flood of November 4-5,1985, in the South
Branch Potomac River basin of West Virgina. United States Geological Survey
Bulletin, 1981: E1-E96.
Miller, J.R., 1991a. The influence of bedrock geology on knickpoint development and
channel-bed degradation along downcutting streams in south-central Indiana. Journal
of Geology, 99: 591-605.
Miller, J.R., 1991b. Development of anastomosing channels in south-central Indiana.
Geomorphology, 4: 221-229.
Milton, D., 1978. The rainfall from tropical cyclones in Western Australia. Geowest
(Working Papers of the Department of Geography University Of Western Australia),
13: 1-61.
Mock, S.J., 1971. A classification of channel links in stream networks. Water Resources
Research, 7: 1558-1566.
Morassutti, M.P., 1992. Australian runoff scenarios from a runoff climate model.
International Journal of Climatology, 12: 797-813.
Naden, P., 1987. A n erosion criterion for gravel-bed rivers. Earth Surfaces Processes
and Landforms, 12: 83-93.
Nanson, G.C, 1980. Point bar and floodplain development of the meandering Beatton
River, northeastern Bristish Columbia, Canada. Sedimentology, 27: 3-29.
Nanson, G.C, 1986. Episodes of vertical accretion and catastrophic stripping: a model
of disequilibrium flood-plain development Geological Society of America Bulletin,
97: 1467-1475.
Nanson, G.C. and Croke, J.C, 1993. A genetic classification of floodplains.
Geomorphology, 4: 459-486.
Nanson, G.C. and Huang, H.Q., in press. Anabranching rivers: divided efficiency
leading to fluvial diversity. In: Miller, A. and Gupta, A. (Eds.), Varieties of fluvial
forms. Wiley.
Nanson, G.C. and Knighton, A.D., 1996. Anabranching rivers: their cause, character
and classification. Earth Surfaces and Landforms, 21: 217-239.
Nanson, G.C, Price, D.M., Short, S.A., Young, R.W. and Jones, B.G., 1991.
Comparative uranium-thorium and thermoluminescence dating of weathered
Quaternary alluvium in the tropics of northern Australia. Quaternary Research, 35:
347-366.
Nanson, G.C, Price, D.M. and Short, S.A., 1992. Wetting and drying of Australia over
the past 300 ka. Geology, 20: 791-794.
References 111
Nanson, G.C, East, T.J. and Roberts, R.G., 1993. Quaternary stratigraphy,
geochronology and evolution of the Magela Creek catchment in the monsoon tropics
of northern Australia. Sedimentary Geology, 83: 277-302.
Nanson, G.C, Chen, X.Y. and Price, D.M., 1995. Aeolian and fluvial evidence of
changing climate and wind patterns during the past 100 ka in the western Simpson
Desert, Australia. Palaeogeography, Palaeoclimatology, Palaeoecology, 113: 87-102.
Nezu, I. and Nakagawa, H., 1984. Cellular secondary currents in straight conduit.
Journal of Hydraulic Engineering, 110: 173-193.
Nezu, I. and Nakagawa, H., 1989. Self forming mechanism of longitudinal sand ridges
and troughs in fluvial open-channel flows. Proc. 23rd Congress International
Association for Hydraulic Research, Ottawa, p. B65-B72.
Nezu, I., Nakagawa, H. and Torninaga, A., 1985. Secondary currents in a straight
channel flow and the relation to its aspect ratio. In: Bradbury et al. (Eds.), Turbulent
Shear Flow 4, Springer, Berlin, pp. 246-260.
Nezu, I., Torninaga, A. and Nakagawa, H., 1993. Field measurements of secondary
currents in straight rivers. Journal of Hydraulic Engineering, 119: 598-614.
Nott, J., 1994. Long-term landscape evolution in the Darwin region and its implications
for the origin of landsurfaces in the north of the Northern Territory. Australian Journal
of Earth Sciences, 41: 407-415.
Nott, J. and Price, D.M., 1994. Plunge pools and paleoprecipitation. Geology, 22:
1047-1050.
Nott, J., Young, R.W. and McDougall, I., 1996a. Wearing down, wearing back, and
gorge extension in the long-term denudation of a highland mass: quantitative evidence
from the Shoalhaven Catchment, southeast Australia. Journal of Geology, 104: 224-
232.
Nott, J.F., Price, D.M. and Bryant, E.A., 1996b. A 30 000 year record of extreme
floods in tropical Australia from relict plunge-pool deposits: implications for future
climate change. Geophysical Research Letters, 23: 379-382.
Novak, I.D., 1973. Predicting coarse sediment transport: the Hjulstrom curve revisited.
In: Morisawa, M . (Ed.), Fluvial geomorphology. State University of N e w York,
Binghamton, pp. 13-25.
O'Connor, J.E., 1993. Hydrology, hydraulics and geomorphology of the Bonneville
Flood. Geological Society of America Special Paper, 274: 1-83.
Oilier, CD., 1979. Evolutionary geomorphology of Australia and Papua-New Guinea.
Transactions Institute Bristish Geographers, 4: 516-539.
Oilier, CD., 1981. Tectonics and landforms. Longman, London.
Oilier, CD., Gaunt, G.F.M. and Jurkowski, I., 1988. The Kimberley Plateau, Western
Australia, a Precambrian erosion surface. Zeitschrift fur Geomorphologie N.F., 32:
239-246.
References 272
Otto, B., 1990. The effect of high in-situ rock stresses on the scour potential of sheet-
jointed rocks below two dams in Australia. In: Rossmanith, H.P. (Ed.), Mechanics of
jointed and faulted rock. Balkema, Rotterdam, pp. 899-904.
Paterson, S.J., 1970. Geomorphology of the Ord-Victoris area. CSIRO Land Research
Series, 28: 83-91.
Patton, P.C, Baker, V.R. and Kochel, R.C, 1979. Slackwater deposits: a geomorphie
technique for the interpretation of fluvial paleohydrology. In: Rhodes, D.P. and
Williams, G.P. (Eds.), Adjustments of the fluvial systems. Kendall/Hunt, Dubuque
(Iowa), pp. 225-253.
Perry, R.A., 1970. Vegetation of the Ord-Victoria area. CSIRO Australia Land Research
Series, 28: 104-119.
Pickup, G., 1975. Downstream variations in morphology, flow conditions and sediment
transport in an eroding channel. Zeitschrift fur Geomorphologie N.F., 19: 443-459.
Pike, R.J. and Wilson, S.E., 1971. Elevation-relief ratio, hypsometric integral, and
geomorphie area-altitude analysis. Geological Society of America Bulletin, 82: 1079-
1084.
Plumb, K.A., 1968. Lissadell, Western Australia. 1:250 000 Geological Series
Explanatory Notes SE/52-2, Bureau of Mineral Resources, Geology and Geophysics,
Canberra.
Plumb, K.A. and Gemuts, I., 1976. Precambrian geology of the Kimberley region,
Western Australia. 25th International Geological Congress Excursion Guide 44c.
Sydney.
Plumb, K.A. and Veevers, J.J., 1971. Cambridge Gulf, Western Australia. 1:250 000
Geological Series Explanatory Notes SD/52-14, Bureau of Mineral Resources,
Geology and Geophysics, Canberra.
Pohn, H.A., 1983. The relationship of joints and stream drainage in flat-lying rocks of
south-central N e w York and northern Pennsylvania. Zeitschrift fur Geomorphologie
N.F., 27: 375-384.
Pubellier, M., Deffontaines, B., Quebral, R. and Rangin, C , 1994. Drainage network
analysis and tectonics of Mindanao, southern Philippines. Geomorphology, 9: 325-
342.
Razvan, E., 1989. River intakes and diversion dams (Developments in Civil Engineering
25), Elsevier, Amsterdam.
Readhead, M L . , 1984. Thermoluminescence dating of some Australian sedimentary
deposits, unpublished PhD thesis, Australian National University.
Readhead, M.L., 1988. Thermoluminescence dating study of quartz in aeolian sediments
from southeastern Australia. Quaternary Science Review, 7: 257-264.
Renius, E., 1986. Rock erosion. Water Power and D a m Construction, 38: 43-48.
References 111
Richards, K.S., 1979. Prediction of drainage density from surrogate measures. Water
Resources Research, 15: 435-442.
Richards, K.S., 1982. Rivers: Form and process in alluvial channels. Methuen, London.
Roberts, H.G. and Perry, W.J., 1969. Mount Elizabeth, Western Australia. 1:250 000
Geological Series Explanatory Notes SE/52-1, Bureau of Mineral Resources,
Geology and Geophysics, Canberra.
Romer, W., 1993. Die Morphologie des Alkalikomplexes von Jacupiranga und seiner
Umgebung. Aachener Geographische Arbeiten, 26: 1-300.
Rothlisberger, H. and Iken, A., 1981. Plucking as an effect of water-pressure variations
at the glacier bed. Annals of Glaciology, 2: 57-62.
Rusnak, G.E., 1957. The orientation of sand grains under conditions of 'unidirectional'
fluid flow. Journal of Geology, 65: 384-409.
Rutherford, G.K., 1964. Soils of the West Kimberley area. CSIRO Australia Land
Research Series, 9: 119-133.
Schachtschabel, P., Blume, H.-P., Briimmer, G., Hartge, K.-H. and Schwertmann, U.,
1989. Lehrbuch der Bodenkunde. Enke, Stuttgart.
Schmidt, K.-H., 1987. Factors influencing structural landforms dynamics on the
Colorado Plateau: about the necessity of calibrating theoretical models by empirical
data. Catena Supplement, 10: 51-66.
Schumann, R.R., 1989. Morphology of Red Creek, Wyoming, an arid-region
anastomosing channel system. Earth Surfaces Processes and Landforms, 14: 277-
288.
Schumm, S.A., 1956. Evolution of drainage systems and slopes in badlands at Perth
Amboy, N e w Jersey. Geological Society of America Bulletin, 67: 597-646.
Schumm, S.A., 1977. The fluvial system. Wiley, N e w York.
Schumm, S.A., 1979. Geomorphie thresholds: the concept and its applications.
Transactions Institute Bristish Geographers N.S., 4: 485-515.
Schumm, S.A. and Lichty, R.W., 1963. Channel widening and flood-plain construction
along Cimarron River in Southwestern Kansas. United States Geological Survey
Professional Paper, 352-D: 71-88.
Schumm, S.A. and Parker, R.S., 1973. Implications of complex response of drainage
systems for Quaternary alluvial stratigraphy. Nature Physical Science, 243: 99-100.
Schumm, S.A., Mosley, M.P. and Weaver, W.E., 1987. Experimental fluvial
geomorphology. Wiley, N e w York.
Schwarcz, H. and Gascyne, M., 1984. Uranium-series dating of Quaternary deposits.
In: Mahaney, W.C. (Ed.), Quaternary dating methods (Developments in Palaeotology
and Stratigraphy 7), Elsevier, Amsterdam, pp. 33-51.
Shulmeister, J., 1992. A Holocene pollen record from lowland tropical Australia. The
Holocene, 2: 107-116.
References 274
Seidl, M.A. and Dietrich, W.E., 1992. The problem of channel erosion into bedrock.
Catena Supplement, 23:101-124.
Seidl, M.A., Dietrich, W.E. and Kirchner, J.W., 1994. Longitudinal profile
development into bedrock: an analysis of Hawaiian channels. Journal of Geology,
102: 457-474.
Short, S.A., Lowson, R.T., Ellis, J. and Price, D.M., 1989. Thorium-uranium
disequilibrium dating of Late Quaternary ferruginous concretions and rinds.
Geochimica et Cosmochimica Acta, 53: 1379-1389.
Slayter, R.O., 1960. Climate of the North Kimberley area, W.A.. CSIRO Australia Land
Research Series, 4: 12-19.
Slayter, R.O., 1970. Climate of the Ord-Victoria area. CSIRO Australia Land Research
Series, 28: 62-74.
Smith, D.G., 1983. Anastomosed fluvial deposits: modem examples from Western
Canada. In: Collinson, J.D. and Lewin, J. (Eds.), M o d e m and ancient fluvial systems
(Special Publications of the International Association of Sedimentologists 6),
Blackwell, Oxford, pp. 155-168.
Smith, D.G. and Smith, N.D., 1980. Sedimentation in anastomosed river systems:
examples from alluvial valleys near Banff, Alberta. Sedimentology, 50:157-164.
Smith, N.D., Cross, T.A., Dufficy, J.P. and Clough, S.R., 1989. Anatomy of an
avulsion. Sedimentology, 36: 1-23.
Sneed, E.D. and Folk, R.L., 1958. Pebbles in the lower Colorado River, Texas, a study
in particle morphogenesis. Journal of Geology, 66: 114-150.
Spath, H., 1979. Laterite und Lateritstufen in Nordwestaustralien. Zeitschrift fur
Geomorphologie N.F. Supplement, 33: 57-71.
Spath, H., 1983. Flachenbildung in Nordwestaustralien. Geookodynamik, 4: 191-208.
Spath, H , 1987. Landform development and laterites in northwestern Australia.
Zeitschrift fiir Geomorphologie N.F. Supplement, 64: 163-180.
Speck, N.H., 1960a. Soils of the North Kimberley area, W.A.. CSIRO Australia Land
Research Series, 4: 33-40.
Speck, N.H., 1960b. Vegetation of the North Kimberley area, W.A.. CSIRO Australia
Land Research Series, 4: 41-63.
Speck, N.H., 1960c. Land systems of the North Kimberley area ,W.A.. CSIRO
Australia Land Research Series, 4:71-85.
Speck, N.H. and Lazarides, M., 1964. Vegetation and pastures of the West Kimberley
area. CSIRO Australia Land Research Series, 9: 140-174.
Stewart, G.A., 1970. Soils of the Ord-Victoria area. CSIRO Australia Land Research
Series, 28: 92-103.
Stewart, G.A., Twidale, C R . and Bradley, J., 1960. Geomorphology of the North
Kimberley. CSIRO Australia Land Research Series, 4: 26-32.
References 275
Strahler, A.N., 1952. Hypsometric (area-altitude) analysis of erosional topography.
Geological Society of America Bulletin, 63: 1117-1142.
Strahler, A.N., 1958. Dimensional analysis applied to fluvially eroded landforms.
Geological Society of America Bulletin, 69: 279-300.
Strahler, A.N., 1963. The earth sciences. Harper & Row, N e w York.
Summerfield, M.A., 1991. Global geomorphology. Longman, London.
Summerfield, M.A. and Hulton, N.J., 1994. Natural controls of fluvial denudation rates
in major world drainage basins. Journal of Geophysical Research, 99(B7): 13871-
13883.
Tarboton, D.G., Bras, R.L. and Rodriguez-Iturbe, I., 1989. Scaling and elevation in
river networks. Water Resources Research, 25: 2037-2052.
Taylor, P.J., 1977. Quantitative methods in geography. Houghton Mifflin, Boston.
Thorn, J.H., 1975. Kimberley Region. In: Geological Survey of Western Australia
(Ed.), The Geology of Western Australia (Memoir 2), pp. 160-193.
Thomas, M.F., 1994. Geomorphology in the tropics. Wiley, Chichester.
Tinkler, K.J., 1993. Fluvially sculpted rock bedforms in Twenty Mile Creek, Niagara
Peninsula, Ontario. Canadian Journal of Earth Sciences, 30: 945-953.
Tinkler, K.J., Pengelly, J.W., Parkins, W.G. and Asselin, G., 1994. Postglacial
resession of Niagara Falls in relation to the Great Lakes. Quaternary Research, 42: 20-
29.
Tipper, J.C, 1989. The equilibrium and entrainment of a sediment grain. Sedimentary
Geology, 64: 167-174.
Tooth, S. and Nanson, G.C, 1995. The geomorphology of Australia's fluvial systems:
retrospect, perspect and prospect. Progress in Physical Geography, 19: 35-60.
Trendall, A.F. and Cockbain, A.E., 1990. Introduction. In: Western Australia
Geological Survey (Ed.), Geology and Mineral Resources of Western Australia
(Memoir 3), pp. 291-293.
Tricart, J., 1965. Le modele des regions chaudes, forets et Savanes. Paris.
Tricart, J. and Cailleux, A., 1972. Introduction to climatic geomorphology. Longman,
London.
Twidale, C.R., 1971. Structural landforms. Australian National University Press,
Canberra.
Twidale, C.R., 1983. Australian laterites and silcretes; ages and significance. Revue de
Geomorphologie Dynamique et Geographie Physique, 24: 35-45.
Twidale, C.R., 1991. A model of landscape evolution involving increased and increasing
relief amplitude. Zeitschrift fur Geomorphologie N.F., 35: 85-109.
Twidale, C.R., 1994. Gondwanan (Late Jurrassic and Cretaceous) palaeosurfaces of the
Australian craton. Palaeogeography, Palaeoclimatology, Palaeoecology, 112: 157-
186.
References 276
Twidale, C R . and Campbell, E.M., 1993a. Australian landforms: structure, process and
time. Gleneagles, Adelaide.
Twidale, C R . and Campbell, E.M., 1993b. Remnants of Gondwana in the Australian
landscape. In: Findlay, R.H., Unrug, J., Banks, M.R. and Veevers, J.J. (Eds.),
Gondwana 8: assembly, evolution and dispersal. Balkema, Rotterdam, pp. 573-583.
Twidale, C R . and Campbell, E.M., 1995. Pre-Quaternary landforms in the low latitude
context: the example of Australia. Zeitschrift fur Geomorphologie N.F., 12:17-35.
Vanoni, V.A., 1946. Transportation of suspended sediment by water. Transactions of
the American Society of Civil Engineers, 111: 67-133.
Vaughn, D.M., 1990. Flood dynamics of a concrete-lined, urban stream in Kansas City,
Missouri. Earth Surfaces Processes and Landforms, 15: 525-537.
Veevers, J. J., 1967. The Phanerozoic geological history of northwest Australia. Journal
Geological Society Australia, 14: 253-271.
Veevers, J.J., 1984a. History of the Great Western Plateau. In: Veevers, J.J. (Ed.),
Phanerozoic earth history of Australia. Clarendon Press, Oxford, pp. 149-168.
Veevers, J.J., 1984b. Morphotectonics of the divergent or rifted margins. In: Veevers,
J.J. (Ed.), Phanerozoic earth history of Australia. Clarendon Press, Oxford, pp. 168-
210.
Wark, R.J., 1982. Flood design practise in W.A., Proceedings of the workshop on
spillway design (1981: Melbourne). Australian Water Resources Research Council
Conference Series 6, Canberra, pp. 223-233.
Wasson, R.J., 1989. Desert dune building, dust raising and palaeoclimate in the
Southern Hemisphere during the last 280 000 years. C L I M A N Z 3: Proceedings of the
Third Symposium on the Late Quaternary Climatic History of Australasia, Canberra,
CSIRO Division of Water Resources, pp. 123-137.
Wasson, R.J. and Donnelly, T.H., 1991. Palaeoclimatic reconstructions for the last
30,000 years in Australia - a contribution to prediction of future climates. CSIRO
Division of Water Resources Technical Memorandum, 91/3, Canberra.
Webster, P.J. and Streten, N.A., 1978. Late Quaternary ice age climates of tropical
Australasia: interpretations and reconstructions. Quaternary Research, 10: 279-309.
Wende, R., Nanson, G.C. and Price, D.M., in press. Aeolian and fluvial evidence for
late Quaternary environmental change in the east Kimberley, Western Australia.
Australian Journal of Earth Sciences.
Wentworth, C.K., 1930. A simplified method of determining the average slope of land
surfaces. American Journal of Science, 20:184-194.
Willgoose, G., 1994. A physical explanation for an observed area-slope-elevation
relationship for catchments with declining relief. Water Resources Research, 30: 151-
159.
References 277
Willgoose, G., Bras, R.L. and Rodriguez-Iturbe, I., 1991. Results from a new model of
river basin evolution. Earth Surfaces Processes and Landforms, 16: 237-254.
Willgoose, G., Bras, R.L. and Rodriguez-Iturbe, I., 1994. Hydrogeomorphology
modelling with a physically based river basin evolution model. In: Kirkby, M.J.
(Ed.), Process models and theoretical geomorphology. Wiley, Chichester, pp. 271-
294.
Williams, G.P., 1983. Paleohydrological methods and some examples from Swedish
fluvial environments. Geografiska Annaler, 65A: 227-243.
Williams, M.A.J., 1985. Pleistocene aridity in tropical Africa, Australasia and Asia. In:
Douglas, I. and Spencer, T. (Eds.), Environmental change and tropical
geomorphology. Allen and Unwin, London, pp. 219-233.
Wirthmann, A., 1985. Offene Fragen der Tropengeomorphologie. Zeitschrift fur
Geomorphologie N.F. Supplement, 56: 1-12.
Wohl, E.E., 1992a. Gradient irregularity in the Herbert Gorge of northeastern Australia.
Earth Surfaces Processes and Landforms, 17: 69-84.
Wohl, E.E., 1992b. Bedrock benches and boulder bars: floods in the Burdekin Gorge of
Australia. Geological Society of America Bulletin, 104:770-778.
Wohl, E.E., 1993. Bedrock incision along Piccaninny Creek, Australia. Journal of
Geology, 101:749-761.
Wohl, E.E., Fuertsch, S.J. and Baker, V.R., 1994a. Sedimentary records of late
Holocene floods along the Fitzroy and Margaret Rivers, Western Australia. Australian
Journal of Earth Sciences, 41: 273-280.
Wohl, E.E., Greenbaum, N., Schick, A.P. and Baker, V.R., 1994b. Controls on
bedrock channel incision along Nahal Paran, Israel. Earth Surfaces Processes and
Landforms, 19: 1-13.
Wohl, E.E., Webb, R.H., Baker, V.R. and Pickup, G., 1994c. Sedimentary flood
records in the bedrock canyons of rivers in the monsoonal region of Australia. Water
Resources Papers Engineering Research Center Colorado State University, 107:1-
102.
Wolman, M.G. and Leopold, L.B., 1957. River flood plains: some observations on their
formation. United States Geological Survey Professional Paper, 282-C: 87-107.
Wright, L.D., Coleman, J.M. and Thorn, B.G., 1973. Processes of channel
development in a high-tide range environment: Cambridge Gulf-Ord River Delta,
Western Australia. Journal of Geology, 81: 15-41.
Wright, L.D., Coleman, J.M. and Thorn, B.G., 1975. Sediment transport and
deposition in a macrotidal river channel, Ord River, Western Australia. In: Cronin,
L.E. (Ed.), Estuarine research, volume 2. Academic Press, London, pp. 309-321.
Wright, R.L., 1964. Geomorphology of the West Kimberley area, W.A. CSIRO Land
Research Series, 9: 103-118.
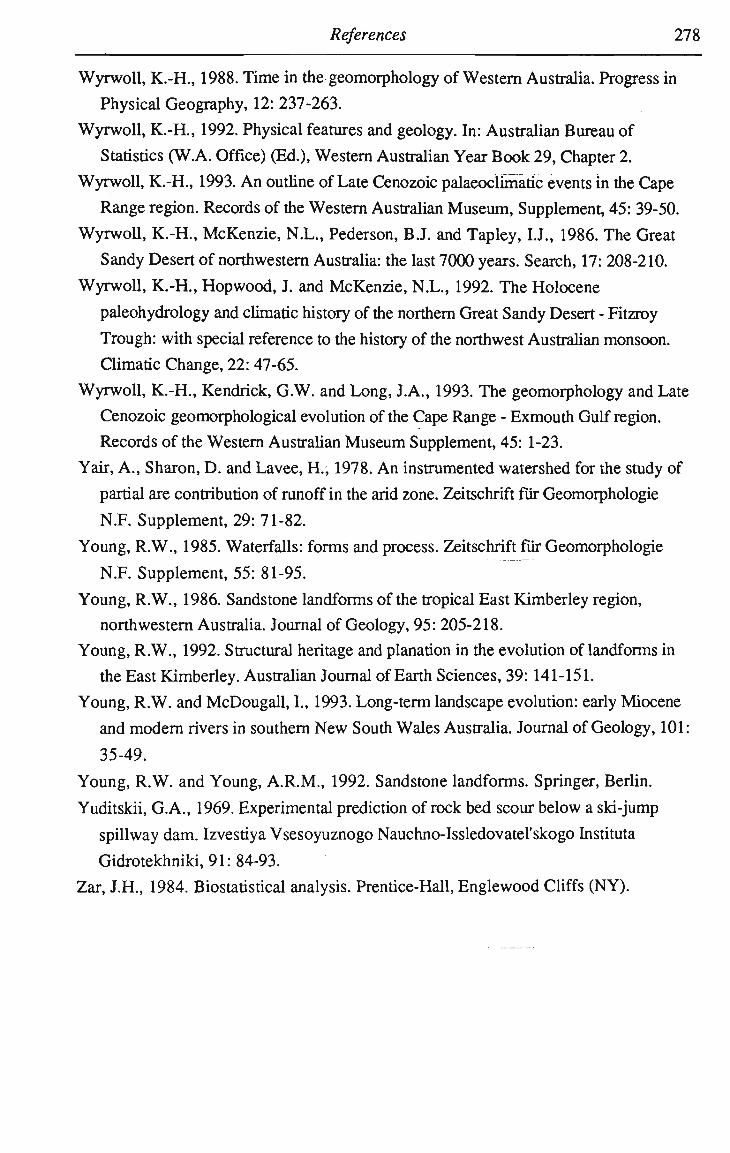
References in
Wyrwoll, K.-H., 1988. Time in the geomorphology of Western Australia. Progress in
Physical Geography, 12: 237-263.
Wyrwoll, K.-H., 1992. Physical features and geology. In: Australian Bureau of
Statistics (W.A. Office) (Ed.), Western Australian Year Book 29, Chapter 2.
Wyrwoll, K.-H., 1993. A n outline of Late Cenozoic pdaeoclimatic events in the Cape
Range region. Records of the Western Australian Museum, Supplement, 45: 39-50.
Wyrwoll, K.-H., McKenzie, N.L., Pederson, B.J. and Tapley, I.J., 1986. The Great
Sandy Desert of northwestern Australia: the last 7000 years. Search, 17: 208-210.
Wyrwoll, K.-H., Hopwood, J. and McKenzie, N.L., 1992. The Holocene
paleohydrology and climatic history of the northern Great Sandy Desert - Fitzroy
Trough: with special reference to the history of the northwest Australian monsoon.
Climatic Change, 22:47-65.
Wyrwoll, K.-H., Kendrick, G.W. and Long, J.A., 1993. The geomorphology and Late
Cenozoic geomorphological evolution of the Cape Range - Exmouth Gulf region.
Records of the Western Australian Museum Supplement, 45: 1-23.
Yair, A., Sharon, D. and Lavee, H., 1978. A n instrumented watershed for the study of
partial are contribution of runoff in the arid zone. Zeitschrift fur Geomorphologie
N.F. Supplement, 29: 71-82.
Young, R.W., 1985. Waterfalls: forms and process. Zeitschrift fur Geomorphologie
N.F. Supplement, 55: 81-95.
Young, R.W., 1986. Sandstone landforms of the tropical East Kimberley region,
northwestern Australia. Journal of Geology, 95: 205-218.
Young, R.W., 1992. Structural heritage and planation in the evolution of landforms in
the East Kimberley. Australian Journal of Earth Sciences, 39:141-151.
Young, R.W. and McDougall, I., 1993. Long-term landscape evolution: early Miocene
and modem rivers in southern N e w South Wales Australia. Journal of Geology, 101:
35-49.
Young, R.W. and Young, A.R.M., 1992. Sandstone landforms. Springer, Berlin.
Yuditskii, G.A., 1969. Experimental prediction of rock bed scour below a ski-jump
spillway dam. Izvestiya Vsesoyuznogo Nauchno-Issledovatel'skogo Instituta
Gidrotekhniki, 91:84-93.
Zar, J.H., 1984. Biostatistical analysis. Prentice-Hall, Englewood Cliffs (NY).
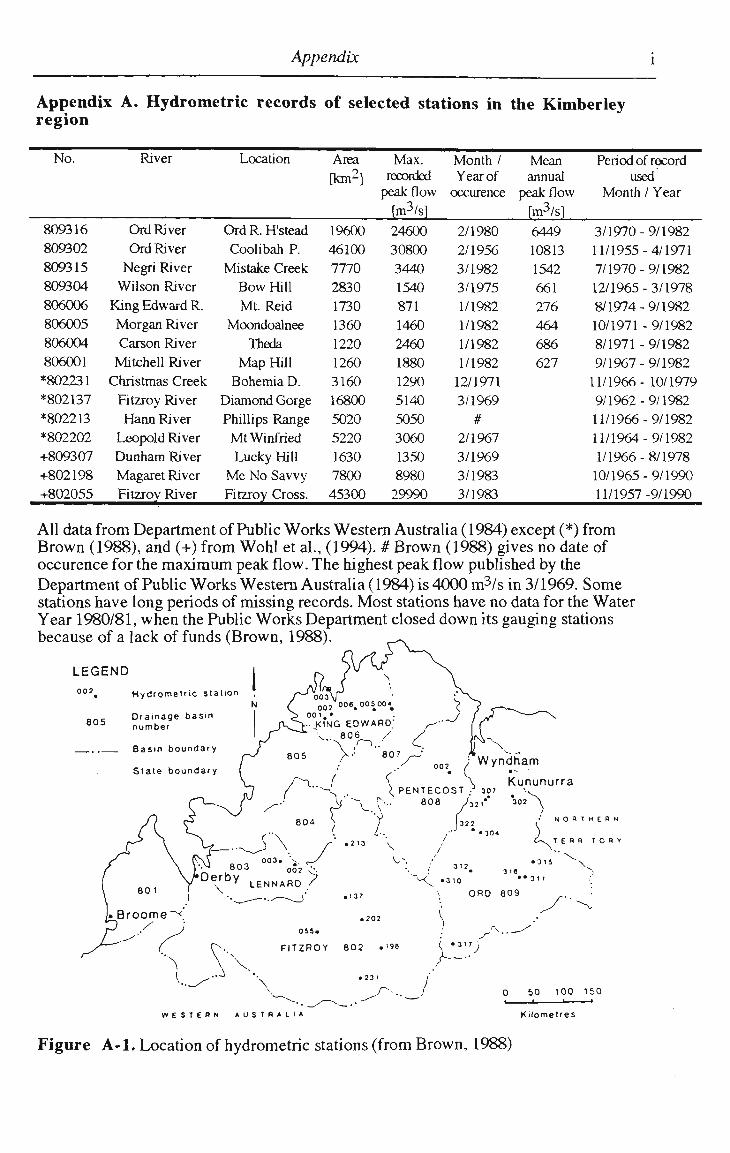
Appendix
Appendix A. Hydrometric records of selected stations in the Kimberley region
No.
809316
809302
809315
809304
806006
806005
806004
806001
*802231
*802137
*802213
*802202
+809307
+802198
+802055
River
Ord River
Ord River
Negri River
Wilson River
King Edward R.
Morgan River
Carson River
Mitchell River
Christmas Creek
Fitzroy River
Hann River
Leopold River
Dunham River
Magaret River
Fitzroy River
Location
Ord R. H'stead
Coolibah P.
Mistake Creek
Bow Hill
Mt. Reid
Moondoalnee
Theda
Map Hill
Bohemia D.
Diamond Gorge
Phillips Range
MtWinfried
Lucky Hill
Me No Savvy
Fitzroy Cross.
Area
[km2]
19600
46100
7770
2830
1730
1360
1220
1260
3160
16800
5020
5220
1630
7800
45300
Max. recorded peak flow
[m3/s]
24600
30800
3440
1540
871 1460
2460
1880
1290
5140
5050
3060
1350
8980
29990
Month / Year of occurence
2/1980
2/1956
3/1982
3/1975
1/1982
1/1982
1/1982
1/1982
12/1971
3/1969
# 2/1967
3/1969
3/1983
3/1983
Mean annual
peak flow
fm3/s]
6449
10813
1542
661
276 464 686 627
Period of record used
Month / Year
3/1970 - 9/1982
11/1955-4/1971
7/1970-9/1982
12/1965-3/1978
8/1974-9/1982
10/1971-9/1982
8/1971 - 9/1982
9/1967 - 9/1982
11/1966- 10/1979
9/1962-9/1982
11/1966-9/1982
11/1964-9/1982
1/1966 - 8/1978
10/1965-9/1990
11/1957-9/1990
All data from Department of Public Works Western Australia (1984) except (*) from Brown (1988), and (+) from Wohl et al., (1994). # Brown (1988) gives no date of occurence for the maximum peak flow. The highest peak flow published by the Department of Public Works Western Australia (1984) is 4000 m3/s in 3/1969. Some stations have long periods of missing records. Most stations have no data for the Water Year 1980/81, when the Public Works Department closed down its gauging stations because of a lack of funds (Brown, 1988).
LEGEND
° 0 2, Hydrometric station
Drainage basin number
Basin boundary
State boundary
N O R T H E R N
TERRITORY
W E S T E R N A U S T R A L I A Kilometres
Figure A-1. Location of hydrometric stations (from Brown, 1988)

Appendix ii
Appendix B. Morphometric data of selected drainage basins on the southern Karunjie Plateau
Ref. #
1 2 3 4 5 6 7 8 9 10 11 12 13 14 15 16 17 18 19 20 21 22 23 24 25 26 27 28 29 30 31 32 33 34 35 36 37 38 39 40 41 42 43 44 45
Basin
Durack River
W o o d River
W o o d R. headwaters
unnamed creek # 1
unnamed creek #2
Durack R. headwaters
unnamed creek #3
unnamed creek #4
Karunjie Creek
Royston Creek
unnamed creek #5
Chapman River
Chapman R. headwaters
Bottle Tree Creek
Neil Creek
Blackfellow Creek
unnamed creek #6
unnamed creek #7
Ellenbrae Creek
unnamed creek #8
unnamed creek #9
unnamed creek# 10
Bamboo Creek
unnamed creek #11
unnamed creek #12
Nyia Creek
unnamed creek #13
unnamed creek #14
Wilson Creek
Salmond River
Salmond R. headwaters
unnamed creek #15
Ullinger River
unnamed creek #16
unnamed creek #17
Horse Creek
Pheasant Creek
unnamed creek #19
unnamed creek #20
unnamed creek #21
Grimwood Creek
unnamed creek #22
Bindoola Creek
Bindoola Cr. headwaters
Palmer Creek
Basin area A
[km2]
14000
1960
875 710 53 1300
17 14 220 490 42 3380
405 365 250 930 30 52 1630
740 150 26 220 29 370 410 20 6 270 3400
470 35 340 184 9 510 20 25 39 16 260 19 915 435 231
Mainstream length Ls [km]
344 85 58 62 12 98 8 8 26 42 9 129 45 42 41 80 9.5 16 70 54 20 8 31 9 45 52 6 4.5 37 185 45 10 56 30 7 50 11.5
10 10 7 36 8.5 84 41 58
Basin length Lb [km]
206 70 52 51.8
11.2
72 7.5 7
22.3
32 9.7 106 45 42 41 80 8.4 14.4
56.5
38 18.3
7.8 24.8
8 29.5
32 5.1 4.1 29.3
118 36.8
10.8
37.5
25.8
6.8 40.3
9.9 8.8 8.8 6.8 26.5
8 58.3
41 33.5
Basin perimeter P [km]
720 215 140 125 29 180 19 17 68 95 28 340 105 105 83 175 23 36 185 135 53 20 68 22 90 103 20 10 73 303 100 28 101 63 15 103 21 22 25 18 73 19 150 115 83
Basin relief Hb[m]
670 270 210 220 180 310 160 185 269 320 190 335 241 220 259 284 200 143 230 232 185 100 315 131 328 420 240 180 430 628 248 164 220 254 200 350 143 280 278 273 430 371 583 438 316
Relief ratio [m/km]
3.3 3.8 4.0 4.2 16.1
4.3 21.3
26.4
12.1
10.0
19.6
3.2 5.4 5.2 6.3 3.6 23.8
9.9 4.1 6.1 10.1
12.8
12.7
16.4
11.1
13.1
47.1
43.9
14.7
5.3 6.7 15.2
5.8 9.8 29.4
8.7 14.4
31.8
31.6
40.1
16.2
46.4
10.0
10.7
9.4
Relative relief [m/km]
0.9 1.3 1.5 2 6 1.7 8.4 10.8
3.9 3.3 6.7 0.9 2.2 2.1 3.1 1.6 8.6 3.9 1.2 1.7 3.4 5.0 4.6 5.9 3.6 4.1 12.0
18.0
5.8 2.0 2.4 5.8 2.1 4.0 13.3
3.3 6.8 12.7
11.1
15.1
5.8 19.5
3.8 3.8 3.8
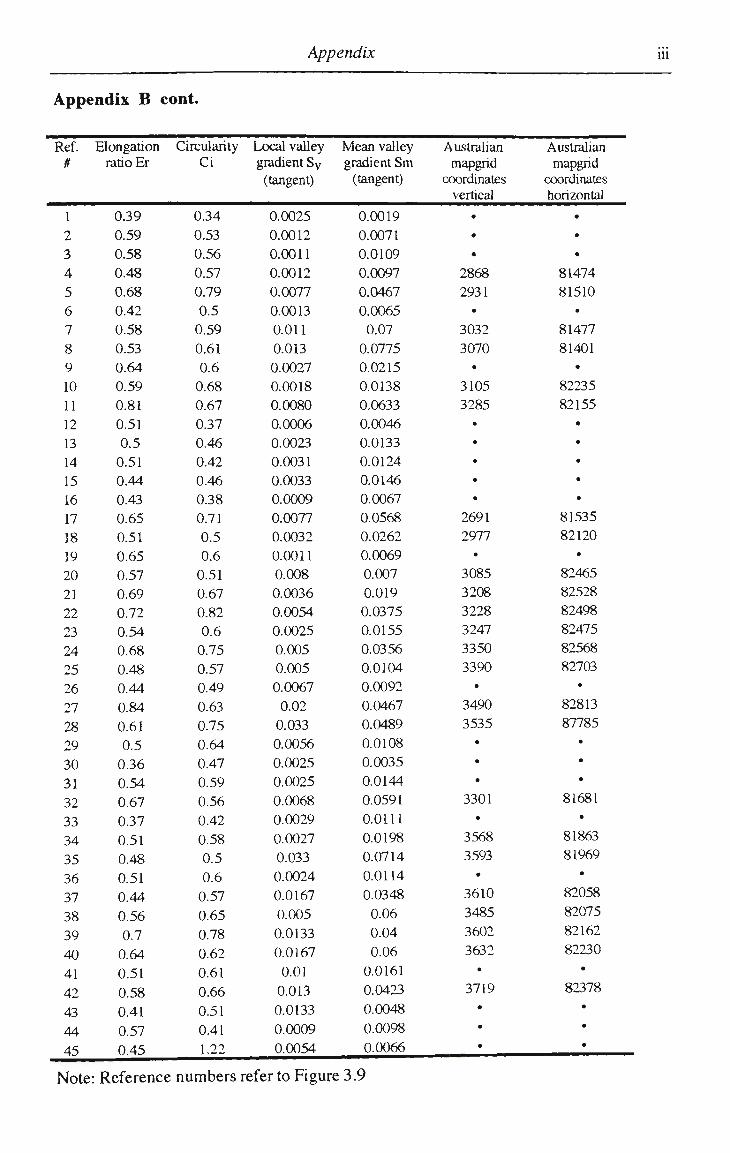
Appendix in
Appendix B cont.
Ref. Elongation Circularity Local valley Mean valley Australian Australian # ratio Er Ci gradient S v gradient Sm mapgrid mapgrid
(tangent) (tangent) coordinates coordinates vertical horizontal
1 2 3 4 5 6 7 8 9 10 11 12 13 14 15 16 17 18 19 20 21 22 23 24 25 26 27 28 29 30 31 32 33 34 35 36 37 38 39 40 41 42 43 44 45
0.39
0.59
0.58
0.48
0.68
0.42
0.58
0.53
0.64
0.59
0.81
0.51
0.5 0.51
0.44
0.43
0.65
0.51
0.65
0.57
0.69
0.72
0.54
0.68
0.48
0.44
0.84
0.61
0.5 0.36
0.54
0.67
0.37
0.51
0.48
0.51
0.44
0.56
0.7 0.64
0.51
0.58
0.41
0.57
0.45
0.34
0.53
0.56
0.57
0.79
0.5 0.59
0.61
0.6 0.68
0.67
0.37
0.46
0.42
0.46
0.38
0.71
0.5 0.6 0.51
0.67
0.82
0.6 0.75
0.57
0.49
0.63
0.75
0.64
0.47
0.59
0.56
0.42
0.58
0.5 0.6 0.57
0.65
0.78
0.62
0.61
0.66
0.51
0.41
1.22
0.0025
0.0012
0.0011
0.0012
0.0077
0.0013
0.011
0.013
0.0027
0.0018
0.0080
0.0006
0.0023
0.0031
0.0033
0.0009
0.0077
0.0032
0.0011
0.008
0.0036
0.0054
0.0025
0.005
0.005
0.0067
0.02
0.033
0.0056
0.0025
0.0025
0.0068
0.0029
0.0027
0.033
0.0024
0.0167
0.005
0.0133
0.0167
0.01
0.013
0.0133
0.0009
0.0054
0.0019
0.0071
0.0109
0.0097
0.0467
0.0065
0.07
0.0775
0.0215
0.0138
0.0633
0.0046
0.0133
0.0124
0.0146
0.0067
0.0568
0.0262
0.0069
0.007
0.019
0.0375
0.0155
0.0356
0.0104
0.0092
0.0467
0.0489
0.0108
0.0035
0.0144
0.0591
0.0111
0.0198
0.0714
0.0114
0.0348
0.06
0.04
0.06
0.0161
0.0423
0.0048
0.0098
0.0066
•
•
•
2868
2931 •
3032
3070 •
3105
3285
2691
2977 •
3085
3208
3228
3247
3350
3390 •
3490
3535 •
•
•
3301
•
3568
3593
•
3610
3485
3602
3632
•
3719
•
•
•
•
•
•
81474
81510 •
81477
81401 •
82235
82155 •
•
•
•
•
81535
82120 *
82465
82528
82498
82475
82568
82703
•
82813
87785
•
•
•
81681
•
81863
81969
•
82058
82075
82162
82230
•
82378
•
•
•
Note: Reference numbers refer to Figure 3.9
Appendix iv
Appendix C. Design rainfall intensity diagram
am
DESIGN RAINFALL INTENSITY DIAGRAM
LOCATION 16.275 S 127.175 E * NEAR.. Karunjie
• ENSURE TEE COORDINATES tM THOSE BEqUWlOT, S D O DATA Q BASED ON THK3 A M NOT TH! UJCA710N NAME.
ISSUED B^ANUARY 1996 REF.-FN4304
(RAl Dill UU». Ul HO, HJH, 1131 U7. £0, UUJ
PREPARED BY — HYDROMETEOROLOG1CAL ADVISORY SERVICE — MELBOURNE
(C) COMMONWEALTH OF AUSTRALIA, BUREAU OF METEOROLOGY 1987
Symbol: A B C D E F G Average Recurrence
Interval (Years): 1 3 5 10 20 50 100
ion 3011 IH 2H aa «H
DURATION IN HOURS OR MINUTES
2*11
\
HB
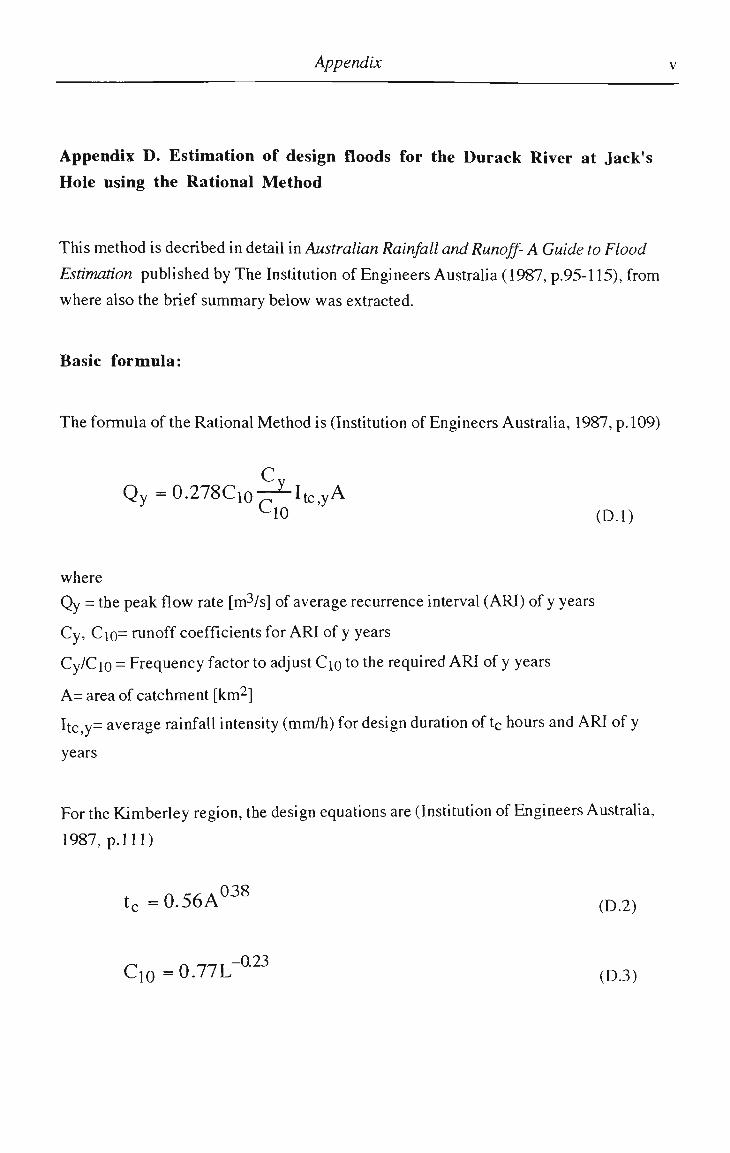
Appendix v
Appendix D . Estimation of design floods for the Durack River at Jack's
Hole using the Rational Method
This method is decribed in detail in Australian Rainfall and Runoff- A Guide to Flood
Estimation published by The Institution of Engineers Australia (1987, p.95-115), from
where also the brief summary below was extracted.
Basic formula:
The formula of the Rational Method is (Institution of Engineers Australia, 1987, p. 109)
cy Qy=0.278C10-^Itc,yA
M O (D.l)
where
Qy = the peak flow rate [m3/s] of average recurrence interval (ARI) of y years
Cy, Cio= runoff coefficients for ARI of y years
Cy/Cio = Frequency factor to adjust Cio to the required ARI of y years
A = area of catchment [km2]
Itc,y= average rainfall intensity (mm/h) for design duration of tc hours and ARI of y
years
For the Kimberley region, the design equations are (Institution of Engineers Australia,
1987, p.lll)
tc=0.56A038
(D.2)
Cio=0.77L * (D3)
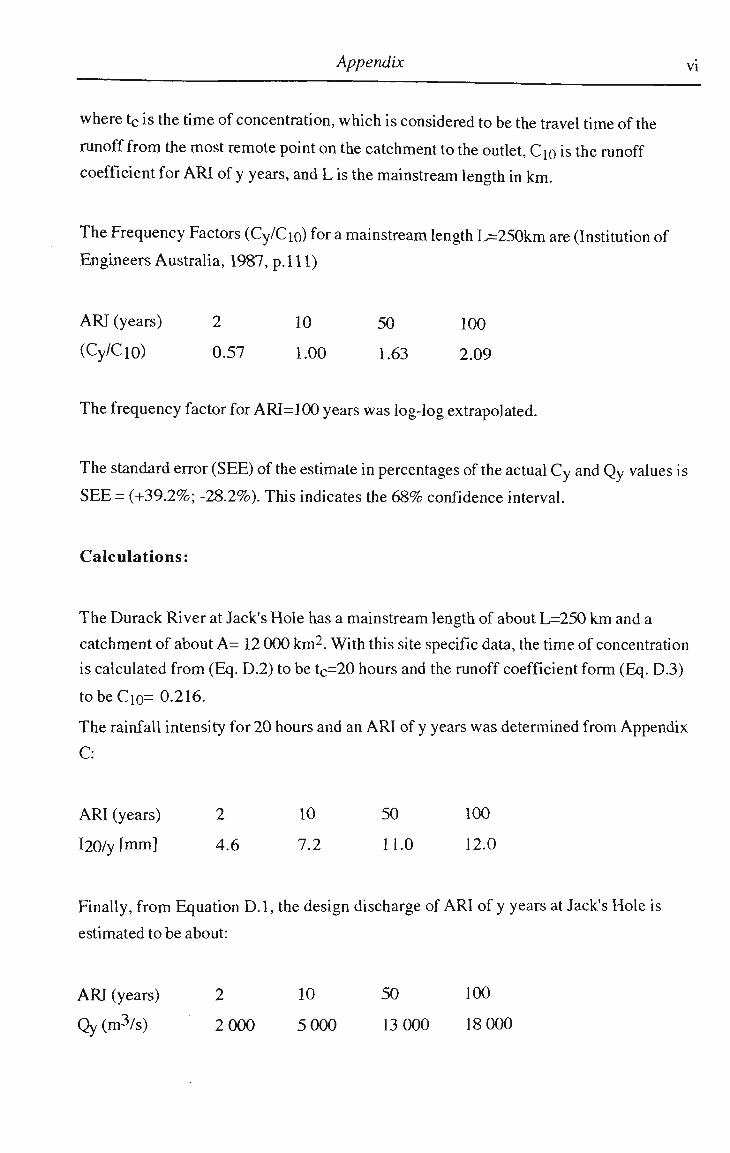
Appendix vi
where tc is the time of concentration, which is considered to be the travel time of the
runoff from the most remote point on the catchment to the outlet, Cio is the runoff
coefficient for ARI of y years, and L is the mainstream length in km.
The Frequency Factors (Cy/Cio) for a mainstream length L=250km are (Institution of
Engineers Australia, 1987, p.Ill)
ARI (years) 2 10 50 100
(Cy/Cio) 0.57 1.00 1.63 2.09
The frequency factor for ARF=100 years was log-log extrapolated.
The standard error (SEE) of the estimate in percentages of the actual Cy and Qy values is
SEE = (+39.2%; -28.2%). This indicates the 6 8 % confidence interval.
Calculations:
The Durack River at Jack's Hole has a mainstream length of about L=250 km and a
catchment of about A = 12 000 km2. With this site specific data, the time of concentration
is calculated from (Eq. D.2) to be tc=20 hours and the runoff coefficient form (Eq. D.3)
tobeCio= 0.216.
The rainfall intensity for 20 hours and an ARI of y years was determined from Appendix
C:
ARI (years) 2 10 50 100
l20/y[mm] 4.6 7.2 11.0 12.0
Finally, from Equation D.l, the design discharge of ARI of y years at Jack's Hole is
estimated to be about:
ARI (years) 2 10 50 100
Qy(m3/s) 2 000 5 000 13 000 18 000
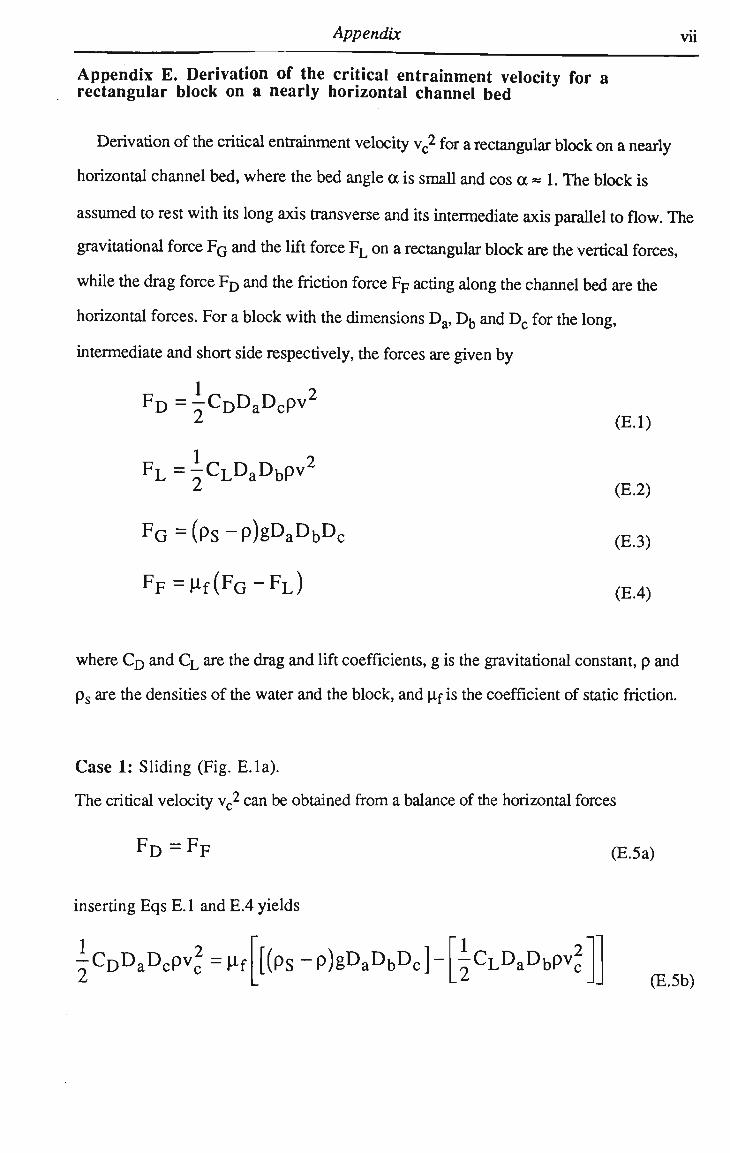
Appendix vii
Appendix E. Derivation of the critical entrainment velocity for a rectangular block on a nearly horizontal channel bed
Derivation of the critical entrainment velocity vc2 for a rectangular block on a nearly
horizontal channel bed, where the bed angle a is small and cos a » 1. The block is
assumed to rest with its long axis transverse and its intermediate axis parallel to flow. The
gravitational force F G and the lift force F L on a rectangular block are the vertical forces,
while the drag force F D and the friction force F F acting along the channel bed are the
horizontal forces. For a block with the dimensions Da, D b and D c for the long,
intermediate and short side respectively, the forces are given by
FD=±CDDaDcpv2
FL=^CLDaDbpv2
FG=(Ps-p)gDaE>bE><
FF=MFG-FL)
(E.1)
(E.2)
(E.3)
(E.4)
where C ^ and C L are the drag and lift coefficients, g is the gravitational constant, p and
ps are the densities of the water and the block, and Lif is the coefficient of static friction.
Case 1: Sliding (Fig. E.la).
The critical velocity vc2 can be obtained from a balance of the horizontal forces
FD - F F (E.5a)
inserting Eqs E. 1 and E.4 yields
icDDaDcpv2=^f [(Ps-p)gDaDbDc]- icLDaDbpv
2
(E.5b)
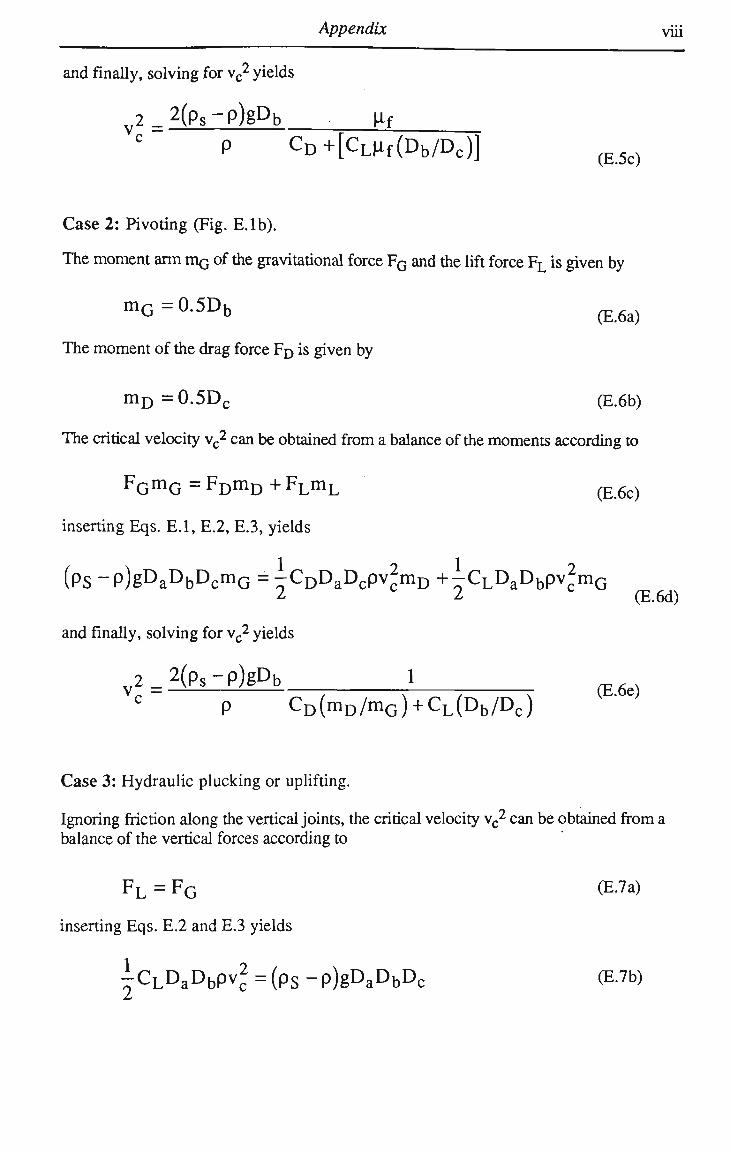
Appendix viii
and finally, solving for v c2 yields
2_2(ps-p)gDb fr
P CD+[CLMDb/Dc)] v c
(E.5c)
Case 2: Pivoting (Fig. E.lb).
The moment arm VOQ of the gravitational force FG and the lift force FL is given by
mG=05Db (E.6a)
The moment of the drag force F^ is given by
mD=0.5Dc (E.6b)
The critical velocity vc2 can be obtained from a balance of the moments according to
FGmG = FDmD + FLmL ^ 6c)
inserting Eqs. E.l, E.2, E.3, yields
(ps -p)gDaDbDcmG =-CDDaDcpv2mD +-CLDaDbpv
2mG * ^ (E.6d)
and finally, solving for vc2 yields
v2 = 2(ps-p)gDb 1 p CD(mD/mG) + CL(Db/Dc) c
Case 3: Hydraulic plucking or uplifting.
Ignoring friction along the vertical joints, the critical velocity vc2 can be obtained from a
balance of the vertical forces according to
FL = FG (E.7a)
inserting Eqs. E.2 and E.3 yields
±CLDaDbpv2 =(ps -p)gDaDbDc (E.7b)
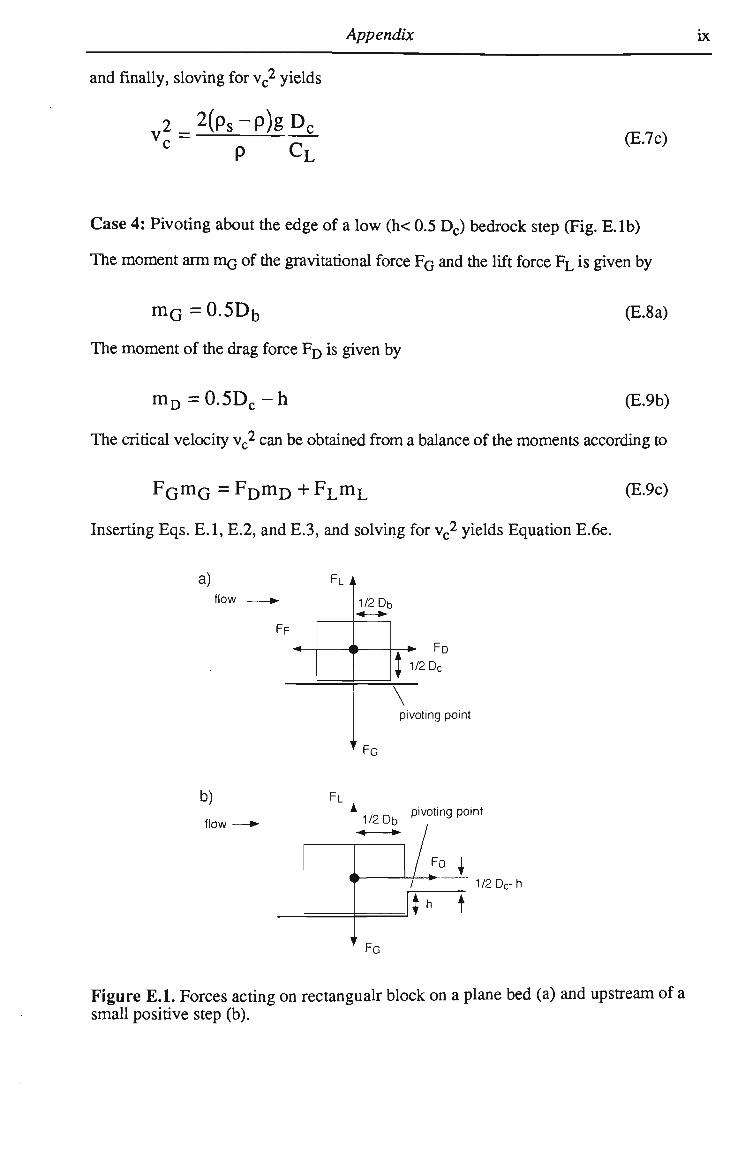
Appendix ix
and finally, sloving for vc2 yields
2_2(Ps~p)gDc vc =
CL
(E.7c)
Case 4: Pivoting about the edge of a low (h< 0.5 Dc) bedrock step (Fig. E.lb)
The moment arm TOQ of the gravitational force FQ and the lift force FL is given by
m G =0.5Db
The moment of the drag force FD is given by
(E.8a)
mD=0.5Dc-h (E.9b)
The critical velocity vc2 can be obtained from a balance of the moments according to
FGmG = FDmD + FLmL (E.9c)
Inserting Eqs. E.l, E.2, and E.3, and solving for vc2 yields Equation E.6e.
a) FLA flow 1/2 D b
•*—•
t 1/2 D FD
\ pivoting point
FG
b)
flow
F L i
<
'
k1/2Db
W
r F G
pivoting point
/
/;M / * 1/
^ t 1/2Dc-h
Figure E.l. Forces acting on rectangualr block on a plane bed (a) and upstream of a small positive step (b).
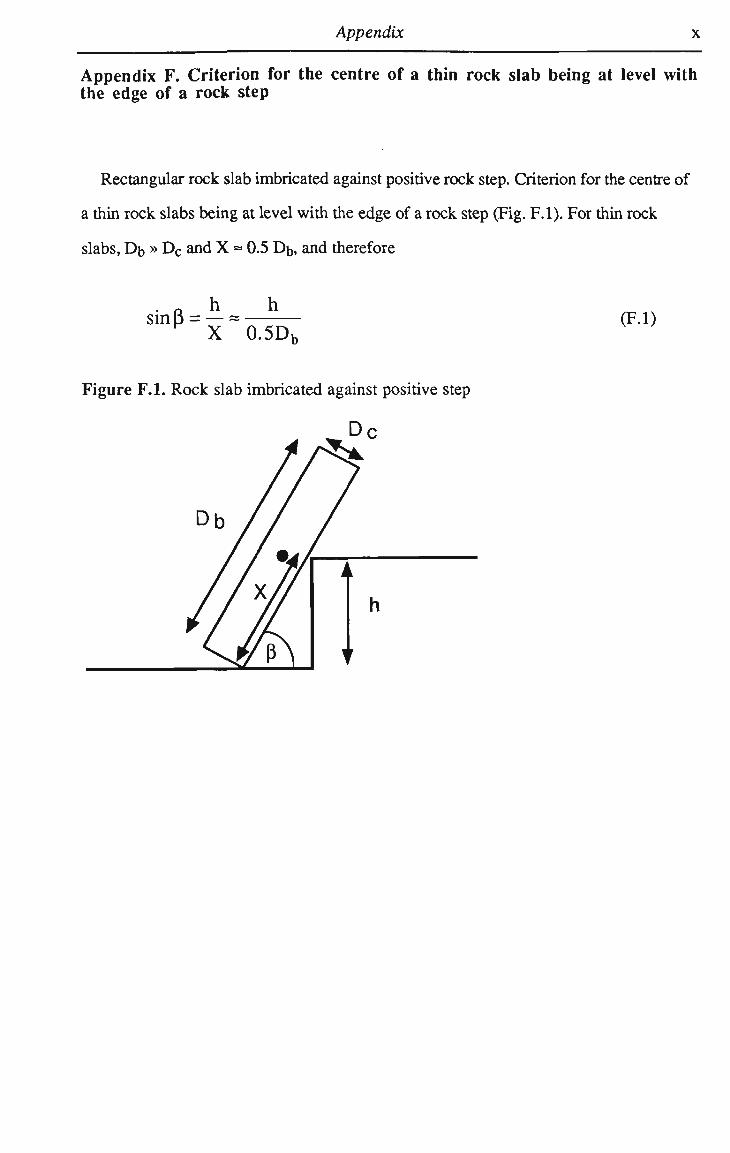
Appendix x
Appendix F. Criterion for the centre of a thin rock slab being at level with the edge of a rock step
Rectangular rock slab imbricated against positive rock step. Criterion for the centre of
a thin rock slabs being at level with the edge of a rock step (Fig. F.l). For thin rock
slabs, Db » Dc and X ~ 0.5 Db, and therefore
• a h h
sinp = — ~ X 0.5Db (F.l)
Figure F.l. Rock slab imbricated against positive step
Dc
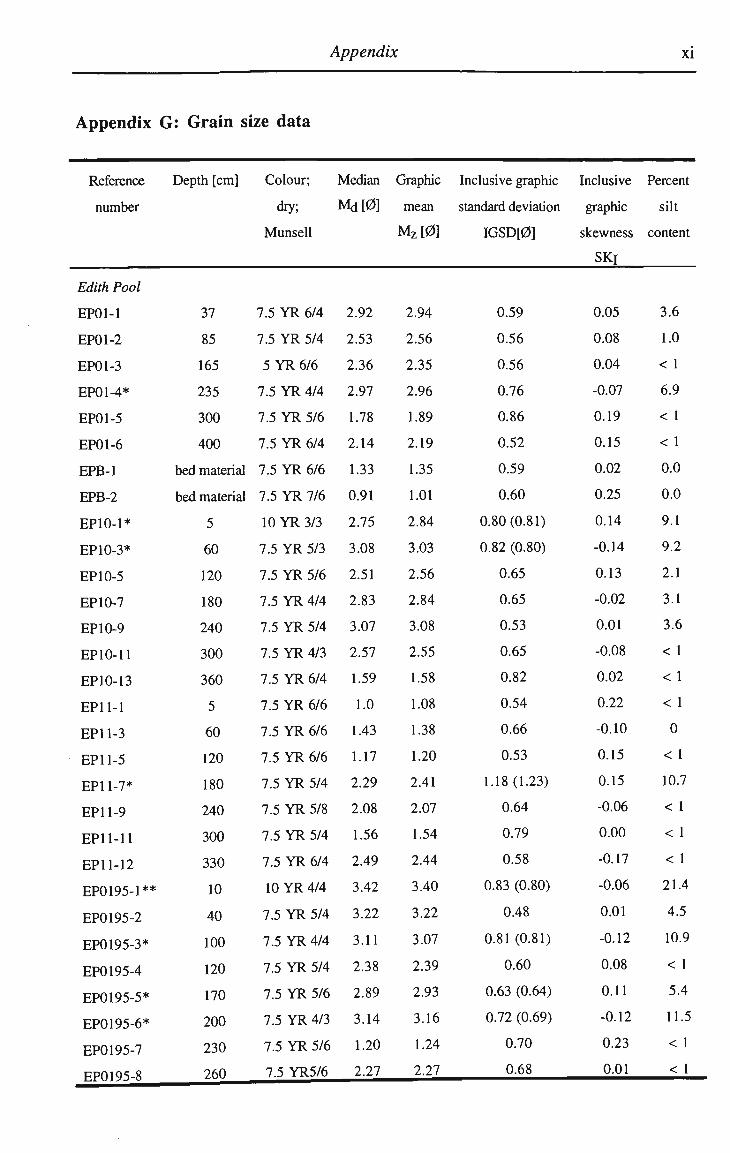
Appendix xi
Appendix G: Grain size data
Reference
number
Edith Pool
EP01-1
EP01-2
EP01-3
EP01-4*
EP01-5
EP01-6
EPB-1
EPB-2
EP10-1*
EP10-3*
EP10-5
EP10-7
EP10-9
EP10-11
EP10-13
EP11-1
EP11-3
EP11-5
EP11-7*
EP11-9
EP11-11
EP11-12
EP0195-1**
EP0195-2
EP0195-3*
EP0195-4
EP0195-5*
EP0195-6*
EP0195-7
EP0195-8
Depth [cm]
37
85
165
235
300
400
bed material
bed material
5
60
120
180
240
300
360
5
60
120
180
240
300
330
10
40
100
120
170
200
230
260
Colour;
dry;
Munsell
7.5 Y R 6/4
7.5 Y R 5/4
5YR6/6
7.5 YR 4/4
7.5 YR 5/6
7.5 YR 6/4
7.5 YR 6/6
7.5 YR 7/6
10 YR 3/3
7.5 YR 5/3
7.5 YR 5/6
7.5 YR 4/4
7.5 YR 5/4
7.5 YR 4/3
7.5 YR 6/4
7.5 YR 6/6
7.5 YR 6/6
7.5 YR 6/6
7.5 YR 5/4
7.5 YR 5/8
7.5 YR 5/4
7.5 YR 6/4
10 YR 4/4
7.5 YR 5/4
7.5 YR 4/4
7.5 YR 5/4
7.5 YR 5/6
7.5 YR 4/3
7.5 YR 5/6
7.5 YR5/6
Median
Mdt0]
2.92
2.53
2.36
2.97
1.78
2.14
1.33
0.91
2.75
3.08
2.51
2.83
3.07
2.57
1.59
1.0
1.43
1.17
2.29
2.08
1.56
2.49
3.42
3.22
3.11
2.38
2.89
3.14
1.20
2.27
Graphic
mean
Mz[0]
2.94
2.56
2.35
2.96
1.89
2.19
1.35
1.01
2.84
3.03
2.56
2.84
3.08
2.55
1.58
1.08
1.38
1.20
2.41
2.07
1.54
2.44
3.40
3.22
3.07
2.39
2.93
3.16
1.24
2.27
Inclusive graphic
standard deviation
IGSD[0]
0.59
0.56
0.56
0.76
0.86
0.52
0.59
0.60
0.80 (0.81)
0.82 (0.80)
0.65
0.65
0.53
0.65
0.82
0.54
0.66
0.53
1.18(1.23)
0.64
0.79
0.58
0.83 (0.80)
0.48
0.81 (0.81)
0.60
0.63 (0.64)
0.72 (0.69)
0.70
0.68
Inclusive
graphic
skewness
SKi
0.05
0.08
0.04
-0.07
0.19
0.15
0.02
0.25
0.14
-0.14
0.13
-0.02
0.01
-0.08
0.02
0.22
-0.10
0.15
0.15
-0.06
0.00
-0.17
-0.06
0.01
-0.12
0.08
0.11
-0.12
0.23
0.01
Percent
silt
content
3.6
1.0
< 1
6.9
< 1
< 1
0.0
0.0
9.1
9.2
2.1
3.1
3.6
< 1
< 1
< 1
0
< 1
10.7
< 1
< 1
< 1
21.4
4.5
10.9
< 1
5.4
11.5
< 1
< 1
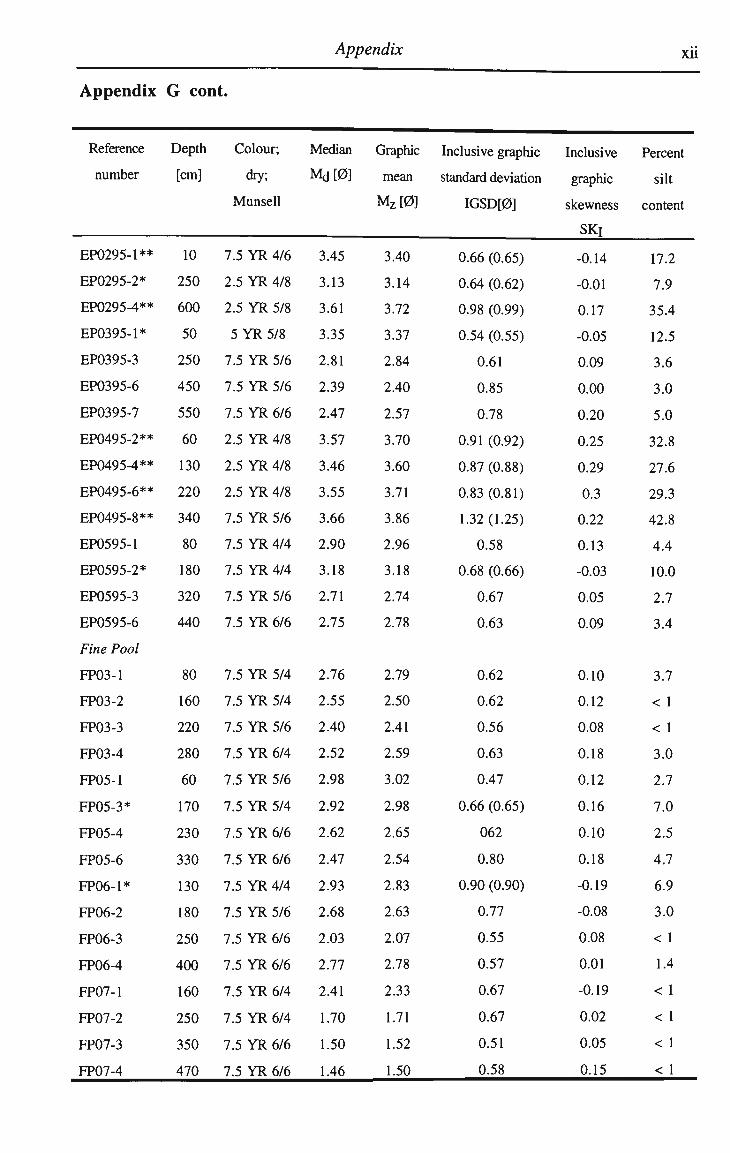
Appendix
Appendix G cont.
Reference Depth Colour; Median Graphic Inclusive graphic Inclusive Percent
number [cm] dry; M d [0] mean standard deviation graphic silt
Munsell M z [0] IGSD[0] skewness content
SKi
EP0295-1**
EP0295-2*
EP0295-4**
EP0395-1*
EP0395-3
EP0395-6
EP0395-7
EP0495-2**
EP0495-4**
EP0495-6**
EP0495-8**
EP0595-1
EP0595-2*
EP0595-3
EP0595-6
Fine Pool
FP03-1
FP03-2
FP03-3
FP03-4
FP05-1
FP05-3*
FP05-4
FP05-6
FP06-1*
FP06-2
FP06-3
FP06-4
FP07-1
FP07-2
FP07-3
FP07-4
10
250
600
50
250
450
550
60
130
220
340
80
180
320
440
80
160
220
280
60
170
230
330
130
180
250
400
160
250
350
470
7.5 Y R 4/6
2.5 Y R 4/8
2.5 Y R 5/8
5YR5/8
7.5 Y R 5/6
7.5 Y R 5/6
7.5 Y R 6/6
2.5 Y R 4/8
2.5 Y R 4/8
2.5 Y R 4/8
7.5 Y R 5/6
7.5 Y R 4/4
7.5 Y R 4/4
7.5 Y R 5/6
7.5 Y R 6/6
7.5 Y R 5/4
7.5 Y R 5/4
7.5 Y R 5/6
7.5 Y R 6/4
7.5 Y R 5/6
7.5 Y R 5/4
7.5 Y R 6/6
7.5 Y R 6/6
7.5 Y R 4/4
7.5 Y R 5/6
7.5 Y R 6/6
7.5 Y R 6/6
7.5 Y R 6/4
7.5 Y R 6/4
7.5 Y R 6/6
7.5 Y R 6/6
3.45
3.13
3.61
3.35
2.81
2.39
2.47
3.57
3.46
3.55
3.66
2.90
3.18
2.71
2.75
2.76
2.55
2.40
2.52
2.98
2.92
2.62
2.47
2.93
2.68
2.03
2.77
2.41
1.70
1.50
1.46
3.40
3.14
3.72
3.37
2.84
2.40
2.57
3.70
3.60
3.71
3.86
2.96
3.18
2.74
2.78
2.79
2.50
2.41
2.59
3.02
2.98
2.65
2.54
2.83
2.63
2.07
2.78
2.33
1.71
1.52
1.50
0.66 (0.65)
0.64 (0.62)
0.98 (0.99)
0.54 (0.55)
0.61
0.85
0.78
0.91 (0.92)
0.87 (0.88)
0.83 (0.81)
1.32 (1.25)
0.58
0.68 (0.66)
0.67
0.63
0.62
0.62
0.56
0.63
0.47
0.66 (0.65)
062
0.80
0.90 (0.90)
0.77
0.55
0.57
0.67
0.67
0.51
0.58
-0.14
-0.01
0.17
-0.05
0.09
0.00
0.20
0.25
0.29
0.3
0.22
0.13
-0.03
0.05
0.09
0.10
0.12
0.08
0.18
0.12
0.16
0.10
0.18
-0.19
-0.08
0.08
0.01
-0.19
0.02
0.05
0.15
17.2
7.9
35.4
12.5
3.6
3.0
5.0
32.8
27.6
29.3
42.8
4.4
10.0
2.7
3.4
3.7
< 1
< 1
3.0
2.7
7.0
2.5
4.7
6.9
3.0
< 1
1.4
<1
< 1
< 1
< 1
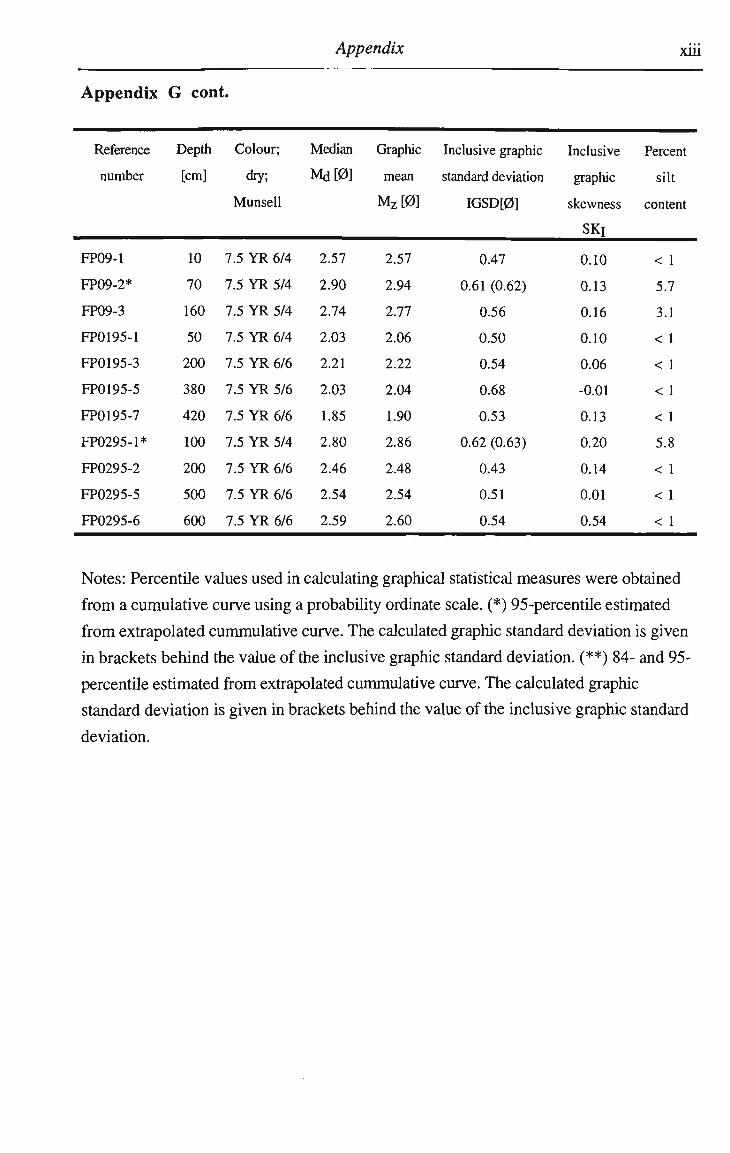
Appendix xiii
Appendix
Reference
number
FP09-1
FP09-2*
FP09-3
FP0195-1
FP0195-3
FP0195-5
FP0195-7
FP0295-1*
FP0295-2
FP0295-5
FP0295-6
G cont.
Depth
[cm]
10
70
160
50
200
380
420
100
200
500
600
Colour;
dry;
Munsell
7.5 Y R 6/4
7.5 Y R 5/4
7.5 Y R 5/4
7.5 Y R 6/4
7.5 Y R 6/6
7.5 Y R 5/6
7.5 Y R 6/6
7.5 Y R 5/4
7.5 Y R 6/6
7.5 Y R 6/6
7.5 Y R 6/6
Median
Md[0]
2.57
2.90
2.74
2.03
2.21
2.03
1.85
2.80
2.46
2.54
2.59
Graphic
mean
M z [ 0 ]
2.57
2.94
2.77
2.06
2.22
2.04
1.90
2.86
2.48
2.54
2.60
Inclusive graphic
standard deviation
IGSD[0]
0.47
0.61 (0.62)
0.56
0.50
0.54
0.68
0.53
0.62 (0.63)
0.43
0.51
0.54
Inclusive
graphic
skewness
SKI
0.10
0.13
0.16
0.10
0.06
-0.01
0.13
0.20
0.14
0.01
0.54
Percent
silt
content
<1
5.7
3.1
< 1
< 1
< 1
< 1
5.8
< 1
< 1
< 1
Notes: Percentile values used in calculating graphical statistical measures were obtained
from a cumulative curve using a probability ordinate scale. (*) 95-percentile estimated
from extrapolated cummulative curve. The calculated graphic standard deviation is given
in brackets behind the value of the inclusive graphic standard deviation. (**) 84- and 95-
percentile estimated from extrapolated cummulative curve. The calculated graphic
standard deviation is given in brackets behind the value of the inclusive graphic standard
deviation.
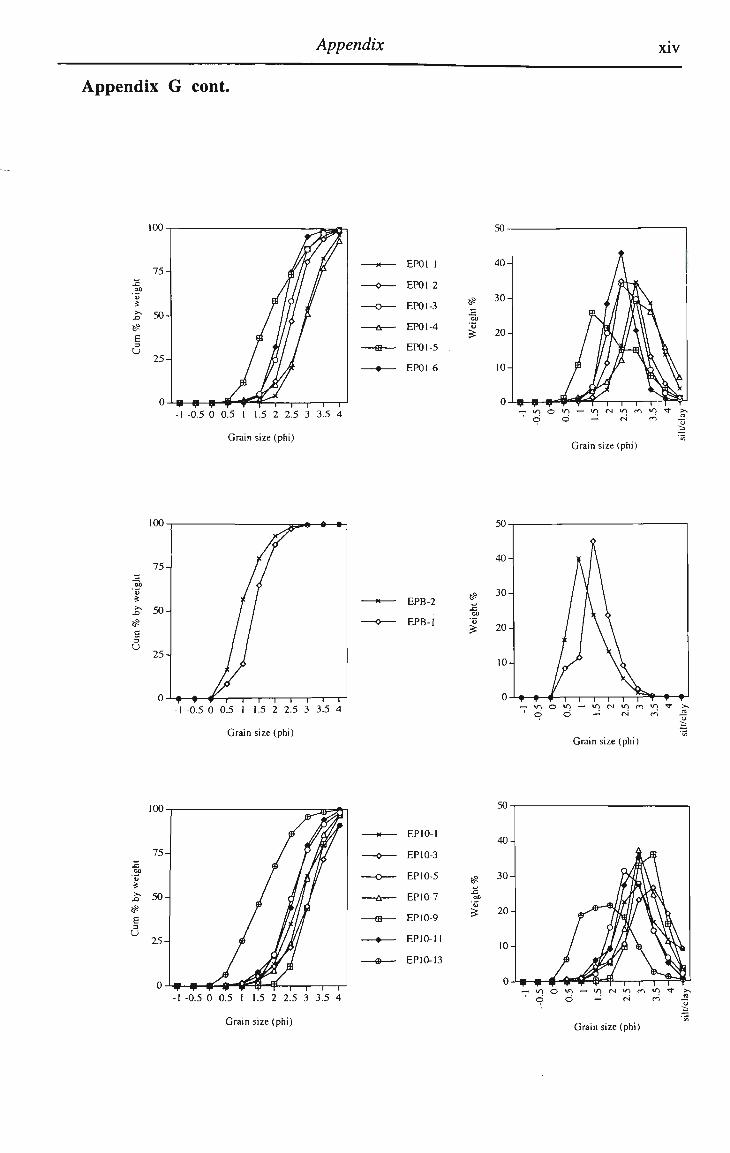
Appendix xiv
Appendix G cont.
100
e U
- i — i — r — i — r -1 -0.5 0 0.5 1 1.5 2 2.5 3 3.5 4
Grain size (phi)
EP01-1
EP01-2
EPOl-3
EPOl-4
EP01-5
EP01-6
#
£
40-
30-
20-
10^
A
Ipjk nJ M\ / IAO\\ LWM
'T P Vy"T*T i i i i TY-1
' O O —• (N nS
Grain size (phi)
100
E a
u
n i i i i i r -1 -0.5 0 0.5 1 1.5 2 2.5 3 3.5 4
Grain size (phi)
EPB-2
EPB-1
£
40-
30-
20-
10-
A
w r\
t t f 1 1 1 1 1 I T f t — u-io»o—'lor^uimv^^t >. o — <*i -S
Grain size (phi)
E
U
-1 -0.5 0 0.5 1 1.5 2 2.5 3 3.5 4
Grain size (phi)
EP10-1
EP10-3
EP10-5
EP10-7
EP10-9
EP10-11
EP10-13
Grain size (phi)
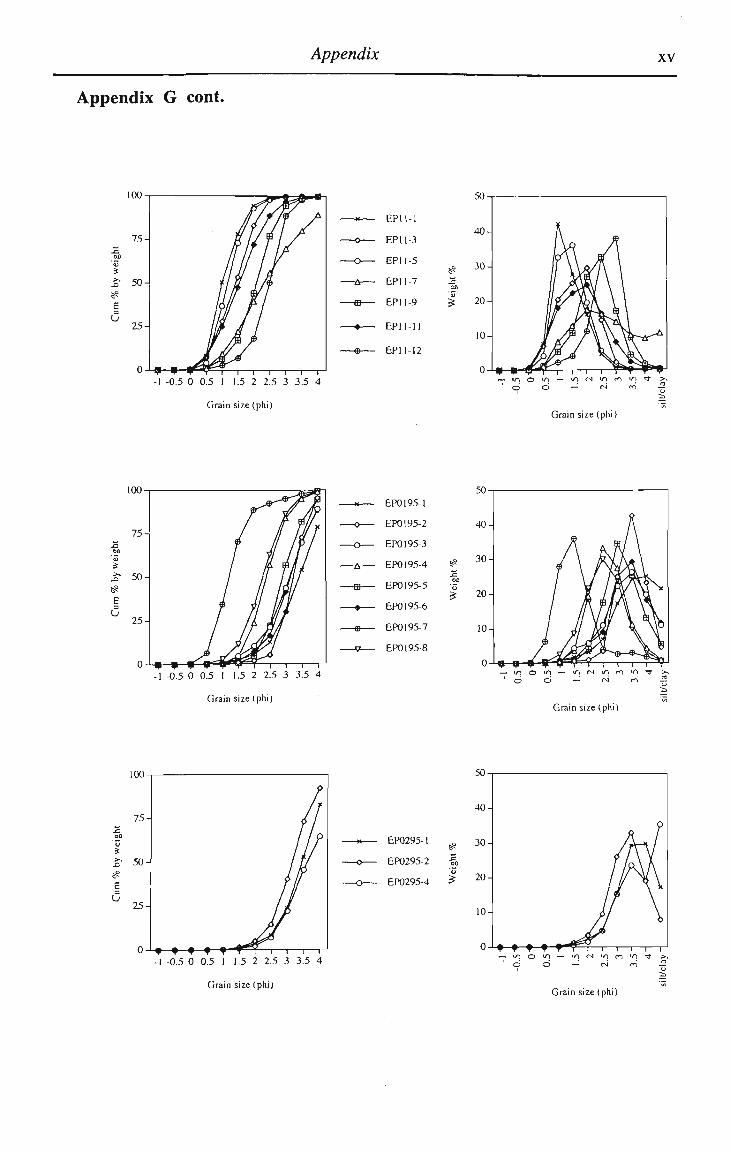
Appendix xv
Appendix G cont.
100
E a U
" i — i — i — i — i — r -1 -0.5 0 0.5 1 1.5 2 2.5 3 3.5 4
Grain size (phi)
EP11-1
EPU-3
EP11-5
EP11-7
EP11-9
EP11-11
EP11-12
#
£
40-
30-
20-
10-
K
fwA \ yP$J\ \
i^C HP W ff"Tl 1 1 1 P r ?*?
m o <o d d
in c v-i n »o *t >. - <N cn S
Grain size (phi)
100
E
U
T — i — r -1 -0.5 0 0.5 1 1.5 2 2.5 3 3.5 4
Grain size (phi)
EPO195-1
EPO195-2
EP0195-3
EPO 195-4
EPO 195-5
EPO 195-6
EPO 195-7
EPO 195-8
Grain size (phi)
6
u
- i — I — i — r -1 -0.5 0 0.5 1 1.5 2 2.5 3 3.5 4
Grain size (phi)
EP0295-1 »
EP0295-2 l0
EP0295-4 £
Grain size (phi)
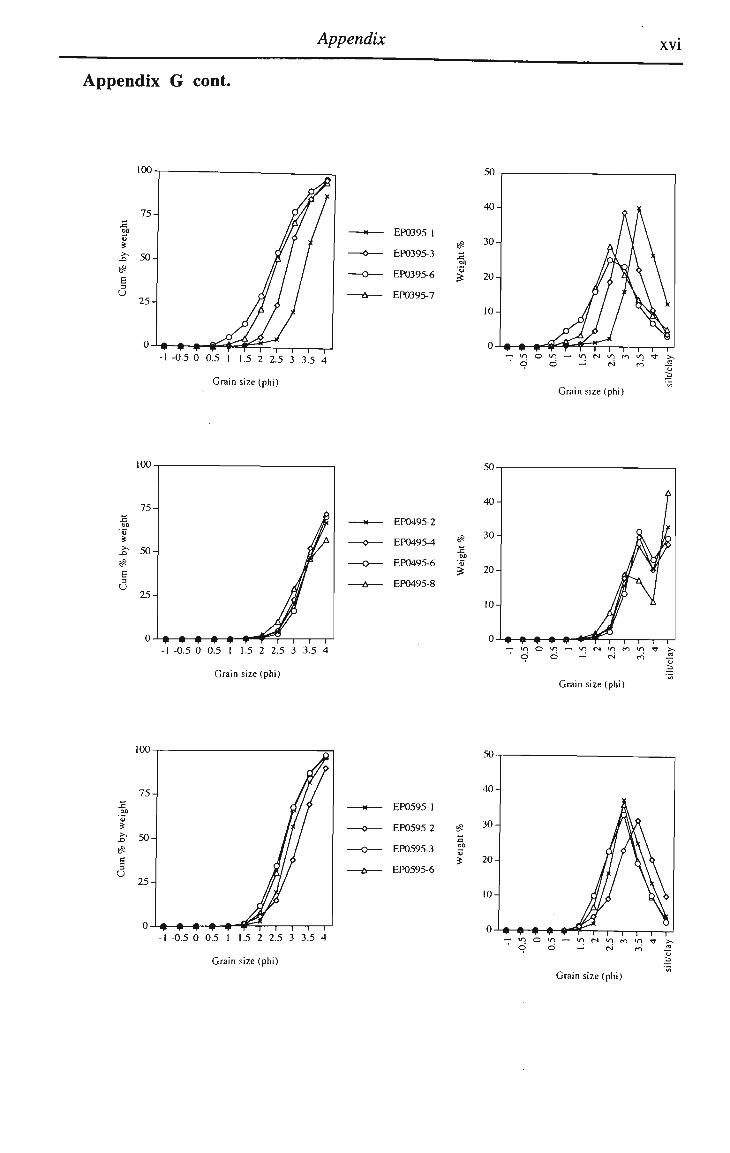
Appendix xvi
Appendix G cont.
100
E 3
U
M
6
- EP0395-1
- EP0395-3
- EP0395-6
• EP0395-7
-S
Grain size (phi)
50
40
30
20-
10
Grain size (phi)
100
EP0495-2
EP0495-4
EP0495-6
EP0495-8
-1 -0.5 0 0.5 1 1.5 2 2.5 3 3.5 4
Grain size (phi) Grain size (phi)
100
S
u
- i — i — i — r -1 -0.5 0 0.5 I 1.5 2 2.5 3 3.5 4
Grain size (phi)
EP0595-1
EP0595-2
EP0595-3
EP0595-6
Grain size (phi)
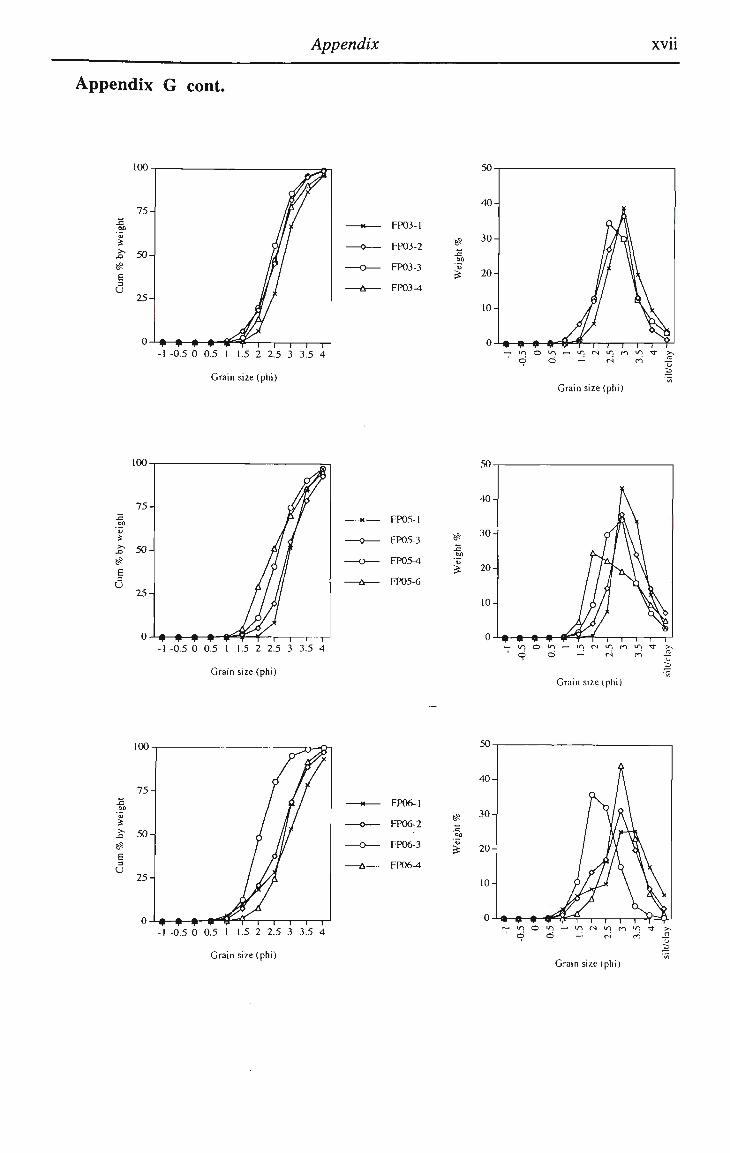
Appendix xvu
Appendix G cont.
100
E =3
u
FP03-1
FP03-2
FP03-3
FP03-4
-1 -0.5 0 0.5 1 1.5 2 2 5 3 3.5 4
Grain size (phi)
^ 00
£
40-
30-
20-
10-
0-
PM
fl\
J\ • P ^ P ' V T I I i i i T
' d d —• (S cn
Grain size (phi)
FP05-1
FP05-3
FP05-4
FP05-6
-1 -0.5 0 0.5 1 1.5 2 2.5 3 3.5 4
Grain size (phi)
^
40-
30-,
20-
10-
K
m\\
j\ • • • * ^ ^ " V "T I I I I I — »rt o ' d
in — U"l <N «n r*"> »n -<t O — m Ji
Grain size (phi)
E 3
U
T — i — I — i — i — r -1 -0.5 0 0.5 1 1.5 2 2.5 3 3.5 4
Grain size (phi)
FP06-1
FP06-2
FP06-3
FP06-4
£ 20
Grain size (phi)
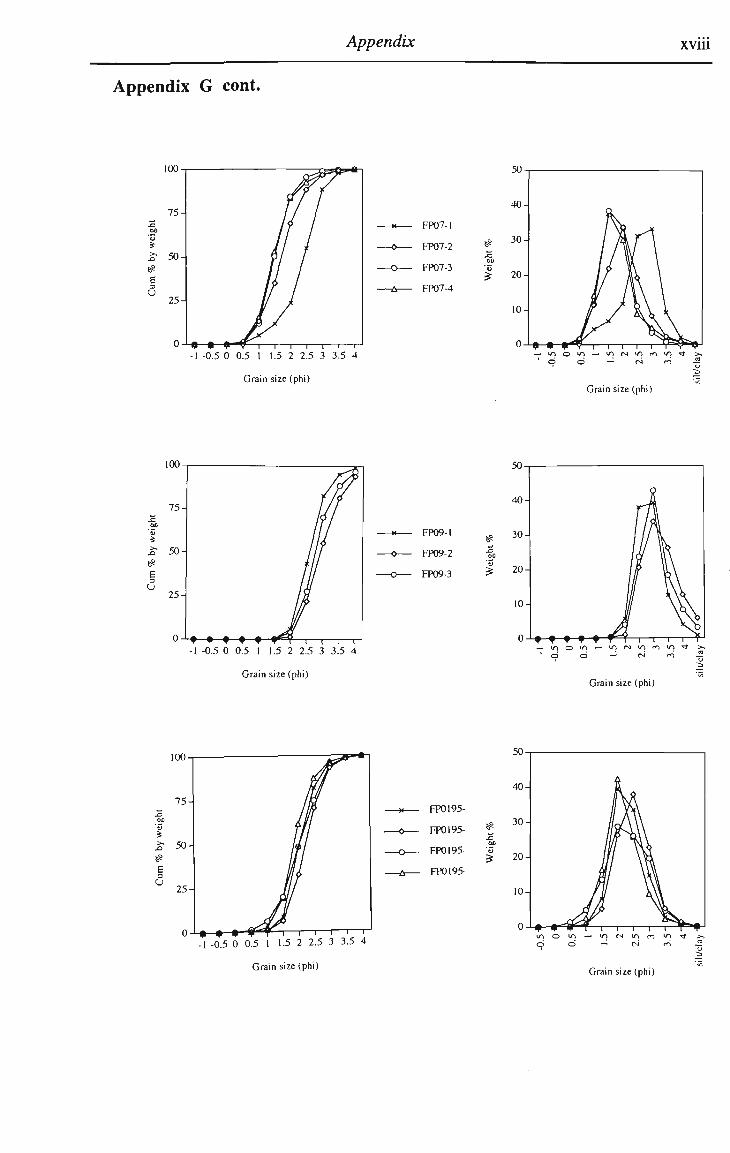
Appendix xviii
Appendix G cont.
FP07-1
FP07-2
FP07-3
FP07-4
- i — i — i — i — r -1 -0.5 0 0.5 1 1.5 2 2.5 3 3.5 4
Grain size (phi)
£ DC
'5
40-
30 -
20-
10-
ikr\
f\ • 8 V*Y i i i i i Vs^fl ~ in © in — i N "n ci wi 9 >, 1 d d — <N ci .2
Grain size (phi)
100
E 3
u
-1 -0.5 0 0.5 1 1.5 2 2.5 3 3.5 4
Grain size (phi)
FP09-1
FP09-2
FP09-3
f=S
s 3=
40-
30-
20-
10-
2
A i if i w
/ \ '"•"• f • • T I 1 1 1 1 1 — in © in -* in <s in m in ' d d —• c «i
Grain size (phi)
100
E 3
u
-1 -0.5 0 o!5 1 1-5 2 2.5 3 3.5 4
Grain size (phi)
FP0195-
FP0195-
FP0195-
FP0195-
Grain size (phi)
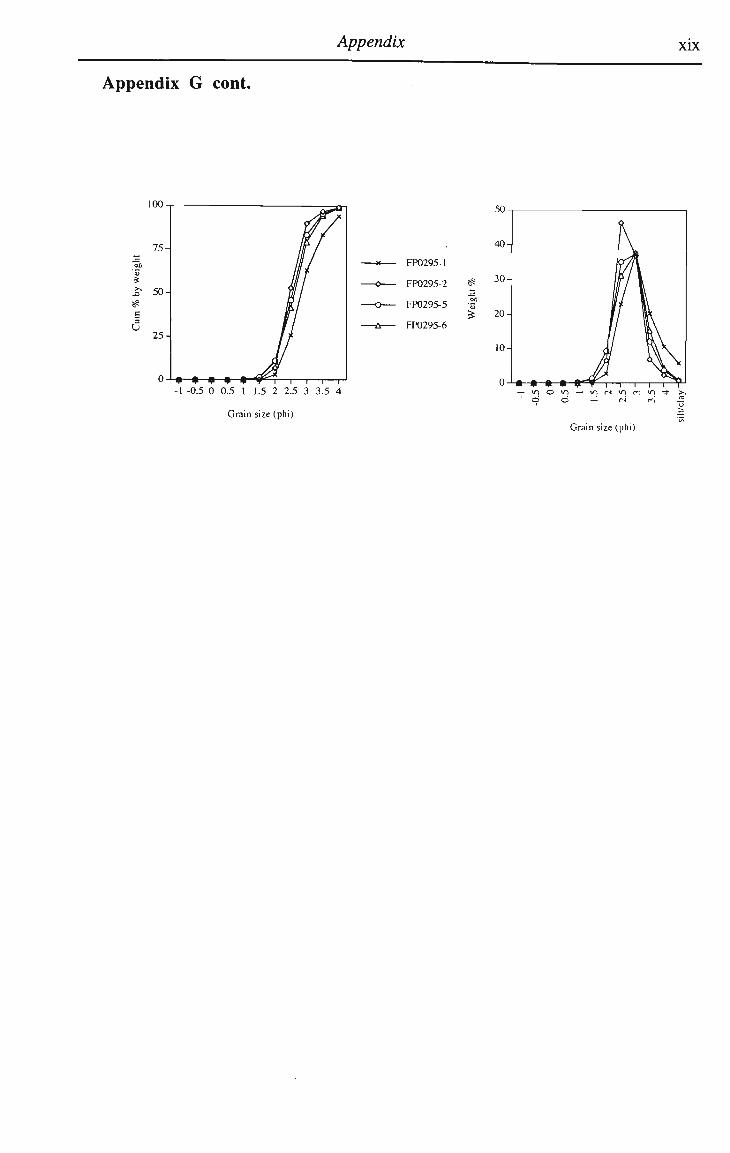
Appendix xix
Appendix G cont.
100
E 3
u
-1 -0.5 0 0.5 1 1.5 2 2.5 3 3.5 4
Grain size (phi)
FP0295-1
FP0295-2
FP0295-5
FP0295-6
Grain size (phi)
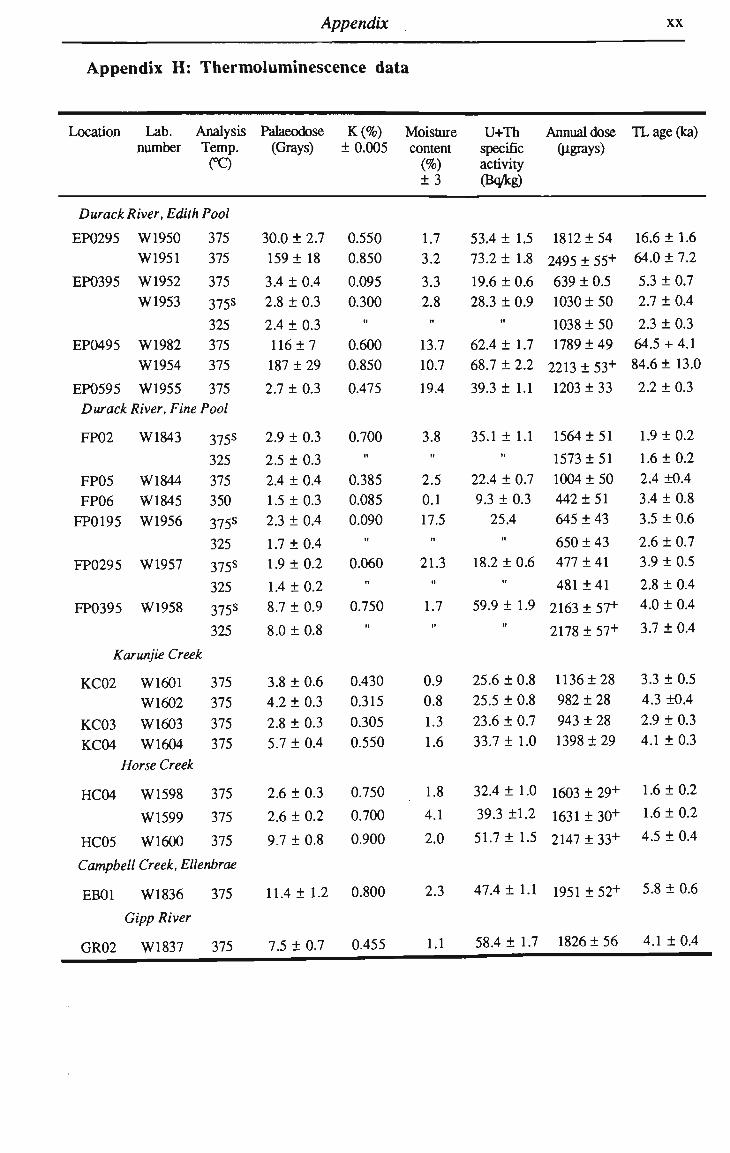
Appendix xx
Appendix H: Thermoluminescence data
Location Lab. number
Analysis Temp.
CQ
Durack River, Edith Pool
EP0295
EP0395
EP0495
EP0595
W1950
W1951
W1952
W1953
W1982
W1954
W1955
375 375
375
375s
325 375 375
375 Durack River, Fine Pool
FP02
FP05
FP06
FP0195
FP0295
FP0395
W1843
W1844
W1845
W1956
W1957
W1958
375s
325 375 350
375s
325
375s
325
375s
325
Karunjie Creek
KC02
KC03
KC04
W1601
W1602
W1603
W1604
Horse Creek
HC04
HC05
W1598
W1599
W1600
375 375 375 375
375
375
375
Campbell Creek, Ellenbrae
EB01
i
GR02
W1836
jipp River
W1837
375
375
Palaeodose (Grays)
30.0 ± 2.7
159 ± 18
3.4 ± 0.4
2.8 ± 0.3
2.4 ± 0.3
116 ±7 187 ± 29
2.7 ± 0.3
2.9 ± 0.3
2.5 ± 0.3
2.4 ± 0.4
1.5 ±0.3
2.3 ± 0.4
1.7 ± 0.4
1.9 + 0.2
1.4 ± 0.2
8.7 ± 0.9
8.0 ± 0.8
3.8 ± 0.6
4.2 ± 0.3
2.8 ± 0.3
5.7 ± 0.4
2.6 ± 0.3
2.6 ± 0.2
9.7 ± 0.8
11.4 ± 1.2
7.5 ± 0.7
K(%) ±0.005
0.550
0.850
0.095
0.300 II
0.600
0.850
0.475
0.700 n
0.385
0.085
0.090 n
0.060 ti
0.750 II
0.430
0.315
0.305
0.550
0.750
0.700
0.900
0.800
0.455
Moisture content
(%)
±3
1.7 3.2
3.3 2.8
II
13.7
10.7
19.4
3.8 II
2.5 0.1 17.5 n
21.3 n
1.7 n
0.9 0.8 1.3 1.6
1.8
4.1
2.0
2.3
1.1
U+Th specific activity (Bqfcg)
53.4 ± 1.5
73.2 ± 1.8
19.6 ± 0.6
28.3 ± 0.9 II
62.4 ± 1.7
68.7 ± 2.2
39.3 ± 1.1
35.1 ± 1.1 n
22.4 ± 0.7
9.3 ± 0.3
25.4 n
18.2 ± 0.6 II
59.9 ± 1.9 II
25.6 ± 0.8
25.5 ± 0.8
23.6 ± 0.7
33.7 ± 1.0
32.4 ± 1.0
39.3 ±1.2
51.7 ± 1.5
47.4 ± 1.1
58.4 ± 1.7
Annual dose (ugrays)
1812 ±54
2495 ± 55+
639 ± 0.5
1030 ± 50
1038 ± 50
1789 ± 49
2213 ± 53+
1203 ± 33
1564 ±51
1573 ± 51
1004 ±50
442 ±51
645 ±43
650 ± 43
477 ±41
481 ±41
2163 ± 57+
2178 ± 57+
1136 ±28
982 ± 28
943 ± 28
1398 ± 29
1603 ± 29+
1631 ± 30+
2147 ± 33+
1951 ± 52+
1826 ± 56
TLage(ka)
16.6 ± 1.6
64.0 ± 7.2
5.3 ± 0.7
2.7 ± 0.4
2.3 ± 0.3
64.5 + 4.1
84.6 ± 13.0
2.2 ± 0.3
1.9 ± 0.2
1.6 ± 0.2
2.4 ±0.4
3.4 ± 0.8
3.5 ± 0.6
2.6 ± 0.7
3.9 ± 0.5
2.8 ± 0.4
4.0 ± 0.4
3.7 ± 0.4
3.3 ± 0.5
4.3 ±0.4
2.9 ± 0.3
4.1 ± 0.3
1.6 ± 0.2
1.6 ± 0.2
4.5 ± 0.4
5.8 ± 0.6
4.1 ± 0.4
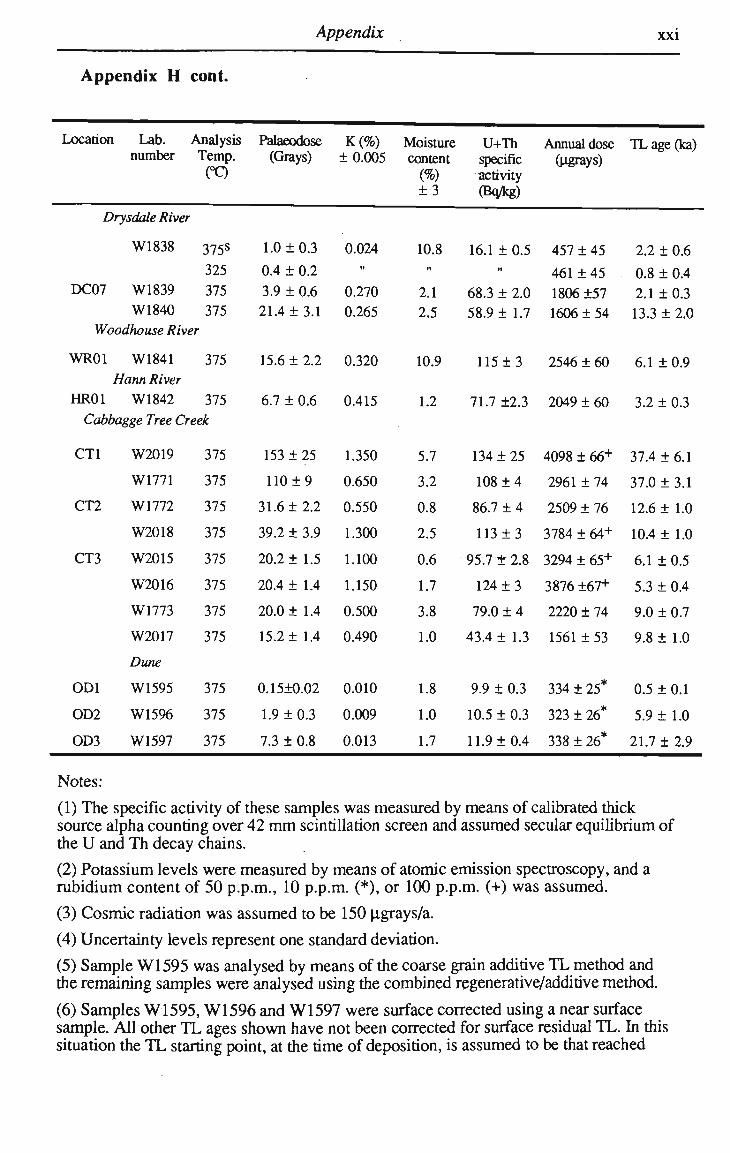
Appendix xxi
Appendix H cont.
Location Lab. number
Drysdale River
DC07
W1838
W1839
W1840
Analysis Temp. (°Q
375s
325 375 375
Woodhouse River
WR01 W1841
Hann River
HR01 W1842
375
375 Cabbagge Tree Creek
CT1
CT2
CT3
OD1
OD2
OD3
W2019
W1771
W1772
W2018
W2015
W2016
W1773
W2017
Dune
W1595
W1596
W1597
375
375
375
375
375
375
375
375
375
375
375
Palaeodose (Grays)
1.0 ± 0.3
0.4 ± 0.2
3.9 ± 0.6
21.4 ±3.1
15.6 ± 2.2
6.7 ± 0.6
153 ± 25
110 ±9
31.6 ±2.2
39.2 ± 3.9
20.2 ± 1.5
20.4 ± 1.4
20.0 ± 1.4
15.2 ± 1.4
0.15±0.02
1.9 ± 0.3
7.3 ± 0.8
K(%) ±0.005
0.024 n
0.270
0.265
0.320
0.415
1.350
0.650
0.550
1.300
1.100
1.150
0.500
0.490
0.010
0.009
0.013
Moisture content
(%) ±3
10.8 n
2.1 2.5
10.9
1.2
5.7
3.2
0.8
2.5
0.6
1.7
3.8
1.0
1.8
1.0
1.7
U+Th specific activity (Bq/kg)
16.1 ± 0.5 n
68.3 ± 2.0
58.9 ± 1.7
115 ±3
71.7 ±2.3
134 ± 25
108 ±4
86.7 ± 4
113 ±3
V5:T±2.S
124 ±3
79.0 ± 4
43.4 ± 1.3
9.9 ± 0.3
10.5 ± 0.3
11.9 ±0.4
Annual dose (ugrays)
457 ± 45
461 ±45
1806 ±57
1606 ±54
2546 ± 60
2049 ±60
4098 ± 66+
2961 ± 74
2509 ± 76
3784 ± 64+
3294 ± 65+
3876 ±67+
2220 ± 74
1561 ± 53
334 ± 25*
323 ± 26*
338 ± 26*
TLage(ka)
2.2 ± 0.6
0.8 ± 0.4
2.1 ±0.3
13.3 ± 2.0
6.1 ± 0.9
3.2 ± 0.3
37.4 ± 6.1
37.0 ± 3.1
12.6 ± 1.0
10.4 ± 1.0
6.1 ± 0.5
5.3 ± 0.4
9.0 ± 0.7
9.8 ± 1.0
0.5 ± 0.1
5.9 ± 1.0
21.7 ± 2.9
Notes:
(1) The specific activity of these samples was measured by means of calibrated thick source alpha counting over 42 m m scintillation screen and assumed secular equilibrium of the U and Th decay chains. (2) Potassium levels were measured by means of atomic emission spectroscopy, and a rubidium content of 50 p.p.m., 10 p.p.m. (*), or 100 p.p.m. (+) was assumed.
(3) Cosmic radiation was assumed to be 150 u,grays/a.
(4) Uncertainty levels represent one standard deviation.
(5) Sample W1595 was analysed by means of the coarse grain additive T L method and the remaining samples were analysed using the combined regenerative/additive method.
(6) Samples W1595, W1596 and W1597 were surface corrected using a near surface sample. All other T L ages shown have not been corrected for surface residual TL. In this situation the T L starting point, at the time of deposition, is assumed to be that reached
Appendix xxu
following exposure to a laboratory sunlamp. This is almost certainly an overcorrection and the ages determined therefore should be regarded as maximum values.
(7) Sample W2019 exhibited a large amount of scatter which is reflected in the high uncertainty level in the age.
(8) 's' These samples exhibit a stepped temperature plateau relationship which is indicative of incomplete T L minimisation prior to deposition, or, partial re-exposure following deposition (pers. com. David Price, 1995). The ages derived from the lower temperature plateau should be regarded as being closer to last depositional age and the value determined from the higher temperature region as a remnant of the deposition prior to that phase.