Sea bottom geomorphology of multi-species spawning aggregation sites in Belize
12
MARINE ECOLOGY PROGRESS SERIES Mar Ecol Prog Ser Vol. 405: 243–254, 2010 doi: 10.3354/meps08512 Published April 29 INTRODUCTION A spawning aggregation is a large grouping of fishes gathered for the purpose of reproduction. Epinephelus striatus (Nassau grouper) is the most well-studied aggregating species in the Caribbean. E. striatus, like many other grouper and snapper species, concentrate their total annual reproductive output by migrating rel- atively long distances to spawn in specific places dur- ing only restricted times. These (and other species that use the same strategy) are defined as transient spawn- ers (as opposed to resident spawners that migrate only short distances and spawn nearly every day) (Domeier & Colin 1997). As a result of their longevity, slow growth, and great age and size at maturity, adequate protection of top-level predatory fishes is necessary. Such protection is today often focused on establishing marine protected areas (MPAs), particularly at spawn- ing aggregation sites. Reef fish spawning aggregations (FSAs) are highly vulnerable to overfishing since they re-occur at the same sites and times each year. Once discovered by fishers, they can be rapidly extirpated (Sadovy de Mitcheson et al. 2008). Some heavily exploited sites have reformed given adequate protection (e.g. Ne- meth 2005; Whaylen et al. 2004) but given overall trends, there are only a few active Epinephelus striatus FSA sites remaining in the Caribbean. Belize still retains several and thus serves as an excellent study site to evaluate the physical characteristics of FSA sites such that they might be predicted in other areas and protected within MPAs prior to their exploitation. Creating, zoning and regulating new MPAs can be politically difficult and time consuming. Given the threat of overexploitation and biodiversity loss, how- ever, some no-take MPAs have been designated based on opportunistic political circumstances, but before all pertinent scientific information on essential fish habitat, particularly spawning habitat, is known. Such actions can lead to faulty MPA design and improperly estab- lished boundaries and regulations. For example, an ag- gregation of black grouper was discovered less than © Inter-Research 2010 · www.int-res.com *Email: [email protected] Sea bottom geomorphology of multi-species spawning aggregation sites in Belize Shinichi Kobara*, William D. Heyman Department of Geography, Texas A&M University, College Station, Texas 77843-3147, USA ABSTRACT: Large, commercially important coral reef fishes such as Nassau grouper Epinephelus striatus are known to spawn at specific places and times in a so-called transient fish spawning aggre- gation (FSA). Traditional E. striatus spawning sites also serve as multi-species FSA sites. Many sites have been extirpated by overfishing or have shown dramatic declines. The objectives of this paper are to: (1) characterize the sea bottom geomorphology of all known transient FSA sites in Belize; (2) provide an evaluation of the multi-species aspects of known FSA sites; and (3) evaluate a prediction of 2 potential FSA sites based on the relationship between seafloor characteristics and fish aggrega- tions. The reef structures surrounding FSA sites were defined in relation to their depth and proxim- ity to shelf edges, deep water, reef channels, and reef promontory tips. All (n = 14) transient FSAs occurred at convex-shaped reef structures jutting out over steep walls into deep water. All FSA sites were located <100 m from shelf edges and <200 m from reef promontory tips, and at a mean of 78 ± 62 m from 100 m depth. Geomorphologically distinctive features at known FSAs allowed us to iden- tify 2 new multi-species FSA sites exhibiting similar characteristics. All the primary FSA sites in Belize are reef promontories, but the reasons why fish aggregate at these sites remain unclear. KEY WORDS: Spawning aggregation · Geomorphology · Belize · Conservation · Reef fish · Grouper · Snapper Resale or republication not permitted without written consent of the publisher
Transcript of Sea bottom geomorphology of multi-species spawning aggregation sites in Belize

MARINE ECOLOGY PROGRESS SERIESMar Ecol Prog Ser
Vol. 405: 243–254, 2010doi: 10.3354/meps08512
Published April 29
INTRODUCTION
A spawning aggregation is a large grouping of fishesgathered for the purpose of reproduction. Epinephelusstriatus (Nassau grouper) is the most well-studiedaggregating species in the Caribbean. E. striatus, likemany other grouper and snapper species, concentratetheir total annual reproductive output by migrating rel-atively long distances to spawn in specific places dur-ing only restricted times. These (and other species thatuse the same strategy) are defined as transient spawn-ers (as opposed to resident spawners that migrate onlyshort distances and spawn nearly every day) (Domeier& Colin 1997). As a result of their longevity, slowgrowth, and great age and size at maturity, adequateprotection of top-level predatory fishes is necessary.Such protection is today often focused on establishingmarine protected areas (MPAs), particularly at spawn-ing aggregation sites.
Reef fish spawning aggregations (FSAs) are highlyvulnerable to overfishing since they re-occur at the
same sites and times each year. Once discovered byfishers, they can be rapidly extirpated (Sadovy deMitcheson et al. 2008). Some heavily exploited siteshave reformed given adequate protection (e.g. Ne-meth 2005; Whaylen et al. 2004) but given overalltrends, there are only a few active Epinephelus striatusFSA sites remaining in the Caribbean. Belize stillretains several and thus serves as an excellent studysite to evaluate the physical characteristics of FSA sitessuch that they might be predicted in other areas andprotected within MPAs prior to their exploitation.
Creating, zoning and regulating new MPAs can bepolitically difficult and time consuming. Given thethreat of overexploitation and biodiversity loss, how-ever, some no-take MPAs have been designated basedon opportunistic political circumstances, but before allpertinent scientific information on essential fish habitat,particularly spawning habitat, is known. Such actionscan lead to faulty MPA design and improperly estab-lished boundaries and regulations. For example, an ag-gregation of black grouper was discovered less than
© Inter-Research 2010 · www.int-res.com*Email: [email protected]
Sea bottom geomorphology of multi-speciesspawning aggregation sites in Belize
Shinichi Kobara*, William D. Heyman
Department of Geography, Texas A&M University, College Station, Texas 77843-3147, USA
ABSTRACT: Large, commercially important coral reef fishes such as Nassau grouper Epinephelusstriatus are known to spawn at specific places and times in a so-called transient fish spawning aggre-gation (FSA). Traditional E. striatus spawning sites also serve as multi-species FSA sites. Many siteshave been extirpated by overfishing or have shown dramatic declines. The objectives of this paperare to: (1) characterize the sea bottom geomorphology of all known transient FSA sites in Belize; (2)provide an evaluation of the multi-species aspects of known FSA sites; and (3) evaluate a predictionof 2 potential FSA sites based on the relationship between seafloor characteristics and fish aggrega-tions. The reef structures surrounding FSA sites were defined in relation to their depth and proxim-ity to shelf edges, deep water, reef channels, and reef promontory tips. All (n = 14) transient FSAsoccurred at convex-shaped reef structures jutting out over steep walls into deep water. All FSA siteswere located <100 m from shelf edges and <200 m from reef promontory tips, and at a mean of 78 ±62 m from 100 m depth. Geomorphologically distinctive features at known FSAs allowed us to iden-tify 2 new multi-species FSA sites exhibiting similar characteristics. All the primary FSA sites inBelize are reef promontories, but the reasons why fish aggregate at these sites remain unclear.
KEY WORDS: Spawning aggregation · Geomorphology · Belize · Conservation · Reef fish · Grouper ·Snapper
Resale or republication not permitted without written consent of the publisher
Mar Ecol Prog Ser 405: 243–254, 2010
100 m outside a newly designated MPA in Florida (Ek-lund et al. 2000). Further compounding the error, theMPA was limited to 18 m depth contour, while the blackgrouper FSA was found in waters between 18 and 28 mdeep. To avoid such a situation, the critical first step mustbe for scientists to quickly and accurately assess thosegeophysical characteristics that promote the forma-tion of FSA sites and to situate MPAs around them.
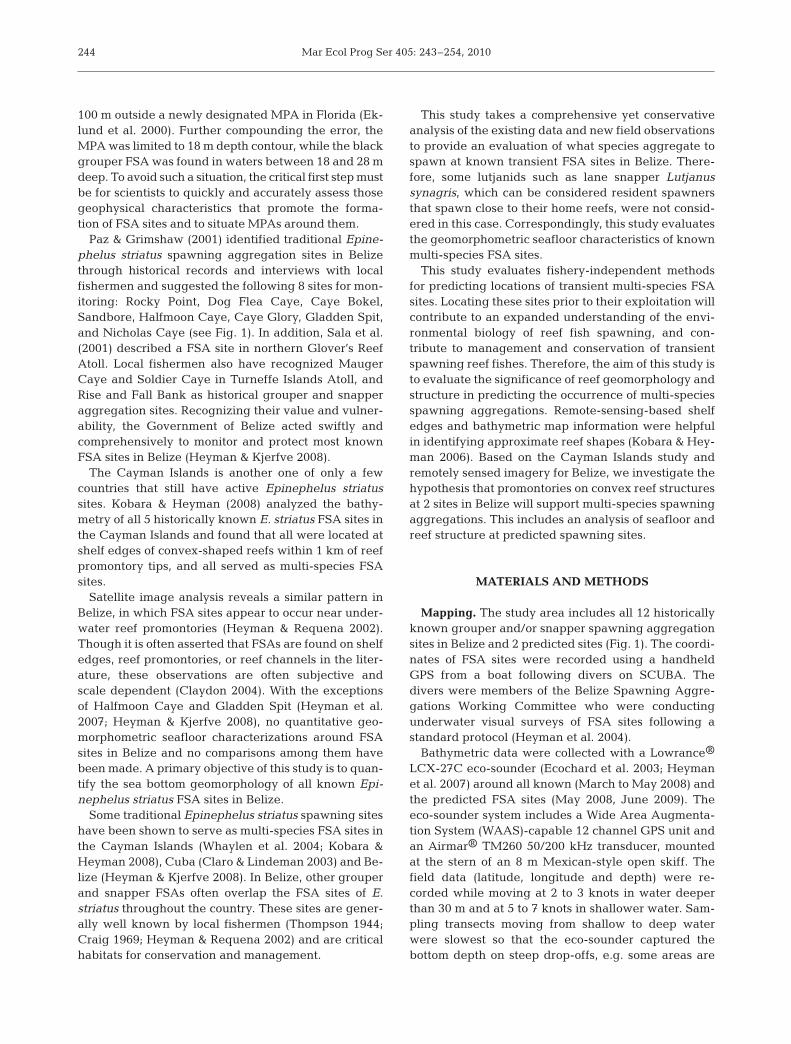
Paz & Grimshaw (2001) identified traditional Epine-phelus striatus spawning aggregation sites in Belizethrough historical records and interviews with localfishermen and suggested the following 8 sites for mon-itoring: Rocky Point, Dog Flea Caye, Caye Bokel,Sandbore, Halfmoon Caye, Caye Glory, Gladden Spit,and Nicholas Caye (see Fig. 1). In addition, Sala et al.(2001) described a FSA site in northern Glover’s ReefAtoll. Local fishermen also have recognized MaugerCaye and Soldier Caye in Turneffe Islands Atoll, andRise and Fall Bank as historical grouper and snapperaggregation sites. Recognizing their value and vulner-ability, the Government of Belize acted swiftly andcomprehensively to monitor and protect most knownFSA sites in Belize (Heyman & Kjerfve 2008).
The Cayman Islands is another one of only a fewcountries that still have active Epinephelus striatussites. Kobara & Heyman (2008) analyzed the bathy-metry of all 5 historically known E. striatus FSA sites inthe Cayman Islands and found that all were located atshelf edges of convex-shaped reefs within 1 km of reefpromontory tips, and all served as multi-species FSAsites.
Satellite image analysis reveals a similar pattern inBelize, in which FSA sites appear to occur near under-water reef promontories (Heyman & Requena 2002).Though it is often asserted that FSAs are found on shelfedges, reef promontories, or reef channels in the liter-ature, these observations are often subjective andscale dependent (Claydon 2004). With the exceptionsof Halfmoon Caye and Gladden Spit (Heyman et al.2007; Heyman & Kjerfve 2008), no quantitative geo-morphometric seafloor characterizations around FSAsites in Belize and no comparisons among them havebeen made. A primary objective of this study is to quan-tify the sea bottom geomorphology of all known Epi-nephelus striatus FSA sites in Belize.
Some traditional Epinephelus striatus spawning siteshave been shown to serve as multi-species FSA sites inthe Cayman Islands (Whaylen et al. 2004; Kobara &Heyman 2008), Cuba (Claro & Lindeman 2003) and Be-lize (Heyman & Kjerfve 2008). In Belize, other grouperand snapper FSAs often overlap the FSA sites of E.striatus throughout the country. These sites are gener-ally well known by local fishermen (Thompson 1944;Craig 1969; Heyman & Requena 2002) and are criticalhabitats for conservation and management.
This study takes a comprehensive yet conservativeanalysis of the existing data and new field observationsto provide an evaluation of what species aggregate tospawn at known transient FSA sites in Belize. There-fore, some lutjanids such as lane snapper Lutjanussynagris, which can be considered resident spawnersthat spawn close to their home reefs, were not consid-ered in this case. Correspondingly, this study evaluatesthe geomorphometric seafloor characteristics of knownmulti-species FSA sites.
This study evaluates fishery-independent methodsfor predicting locations of transient multi-species FSAsites. Locating these sites prior to their exploitation willcontribute to an expanded understanding of the envi-ronmental biology of reef fish spawning, and con-tribute to management and conservation of transientspawning reef fishes. Therefore, the aim of this study isto evaluate the significance of reef geomorphology andstructure in predicting the occurrence of multi-speciesspawning aggregations. Remote-sensing-based shelfedges and bathymetric map information were helpfulin identifying approximate reef shapes (Kobara & Hey-man 2006). Based on the Cayman Islands study andremotely sensed imagery for Belize, we investigate thehypothesis that promontories on convex reef structuresat 2 sites in Belize will support multi-species spawningaggregations. This includes an analysis of seafloor andreef structure at predicted spawning sites.
MATERIALS AND METHODS
Mapping. The study area includes all 12 historicallyknown grouper and/or snapper spawning aggregationsites in Belize and 2 predicted sites (Fig. 1). The coordi-nates of FSA sites were recorded using a handheldGPS from a boat following divers on SCUBA. Thedivers were members of the Belize Spawning Aggre-gations Working Committee who were conductingunderwater visual surveys of FSA sites following astandard protocol (Heyman et al. 2004).
Bathymetric data were collected with a Lowrance®
LCX-27C eco-sounder (Ecochard et al. 2003; Heymanet al. 2007) around all known (March to May 2008) andthe predicted FSA sites (May 2008, June 2009). Theeco-sounder system includes a Wide Area Augmenta-tion System (WAAS)-capable 12 channel GPS unit andan Airmar® TM260 50/200 kHz transducer, mountedat the stern of an 8 m Mexican-style open skiff. Thefield data (latitude, longitude and depth) were re-corded while moving at 2 to 3 knots in water deeperthan 30 m and at 5 to 7 knots in shallower water. Sam-pling transects moving from shallow to deep waterwere slowest so that the eco-sounder captured thebottom depth on steep drop-offs, e.g. some areas are
244
Kobara & Heyman: Geomorphology of spawning aggregation sites
nearly vertical between 30 and 200 m. When it was dif-ficult to detect the depth along steeply sloping reefs,the boat was allowed to drift until the eco-sounderdetected the bottom anew. Due to variable sea condi-tions, the intervals between transects crossing shelfedges were not always the same but were always<50 m apart. All data points on each transect line wererecorded at intervals of 0.5 to 4 m.
All data were transformed to comma-delimited textfiles using a simple conversion program (slg2txt.exe)that comes with the SonarViewer program down-loaded from the Lowrance site (www.lowrance.com/en/Donwloads/Sonar-Log-Viewer-SLV/). Data were thenparsed and loaded into spreadsheets. All invalid depthand position data were removed, and then all individ-ual transect data were combined into a single file. Datawere collected using proprietary Lowrance Mercatorcoordinates so they had to be transformed to geo-
graphical longitude and latitude usingthe WGS84 datum, and then importedinto ArcGIS 9.3 (Heyman et al. 2007). Alldata were projected in UTM 16 North.Triangulated irregular network (TIN)models were created from the masspoints using the 3D analyst extension ofArcGIS (Ecochard et al. 2003).
Geospatial analysis: In order to stan-dardize, simplify, and facilitate compar-isons of the 3D morphometrics, the hori-zontal and vertical aspects of all FSAsites were analyzed separately. The reefstructures surrounding them were de-fined in relation to their depth, curvature(concave, convex or flat), aspect (orienta-tion) relative to prevailing northeasterlytrade winds (windward or leeward), andproximity to shelf edges, deep water,reef channels, and reef promontory tips.
To standardize shape comparisons ofhorizontal curves among FSA sites, theselection of a contour that would becomparable for all sites was required.Since the depth of each FSA site varied,we selected the shelf-edge contour ateach site for comparison purposes,rather than selecting a specific depthcontour. First, TIN models were con-verted into raster data sets, then slopeswere calculated using the spatial ana-lyst function of ArcGIS. Shelves slopedgently (<10°), until they reached theshelf edges where slopes increasedabruptly to 20–45°. We selected 20° asthe dividing slope that delimitated theshelf-edge contour line. The shelf-edge
contour lines were smoothed using a GIS function with300 m tolerance (the polynomial approximation withexponential kernel algorithm). The shortest Euclidiandistances between the FSA sites and 4 geomorphome-tric parameters were measured: (1) shelf edges per-pendicular to sites, (2) the turning point of shelf-edgelines, (3) 100 m depth, and (4) reef channels.
The measurement and visible recognition of shelf-edge reef promontories is scale dependent. Within a100 m buffer circle around each FSA site, most shelfedges would be perceived as straight. A 5 km buffer,however, would show too much variation in shelf edgestructure beyond the scale of individual shelf promon-tories. A 2 km buffer could include land in some cases,and a 0.5 km buffer would not properly show theknown Gladden Spit reef promontory. A 1 km radiusbuffer circle around each FSA site was thus selectedempirically as a scale for the comparative analysis of
245
Fig. 1. The 12 historically known ( ) and 2 predicted ( ) fish spawning aggre-gation sites in Belize. Coral reef area data are derived from the Belize eco-
system map (Meerman & Sabido 2001)
Mar Ecol Prog Ser 405: 243–254, 2010
individual promontory shapes in Belize and a previousstudy in the Cayman Islands (Kobara & Heyman 2008).In addition, we calculated the sinuosity of shelf edgecontour lines within a 1 km buffer circle surroundingeach FSA site using ArcGIS. Sinuosity (curviness) is ameasure of deviation between the length of a path be-tween 2 points and the length of the shortest possiblepath. Sinuosity (S) is calculated as follows: S = L t/Lsf,whereby Lt is the total length of the line and Lsf is thedistance between the start and finish locations.
The bottom depth and slope were calculated fromthe bathymetric data described above. All the verticalprofiles of the FSA sites were derived using the profilefunctions in ArcGIS 3D Analyst. Transects were drawnperpendicular to the shelf edge from a point located100 m inshore from the shelf edges, through the FSAsite, to the deepest water the eco-sounder could read.All vertical profile data were plotted at the same scaleon a single set of axes for comparative purposes.
FSA species information. Spawning occurrence wasestablished by observations of gamete release (Do-meier & Colin 1997). Additionally, indirect evidence forthe occurrence of FSAs includes observations of a 3-foldincrease in the number of fish over non-reproductivetimes, observation of courtship behavior, and courtshipcoloration changes (Domeier & Colin 1997; Samoilys1997). During underwater visual surveys, divers usingunderwater slates recorded the number of fishes andtheir courtship and spawning behaviors. The numbersof dives varied between locations.
We critically examined the best available direct andindirect evidence for the occurrence of FSAs. We re-moved any records that could not be corroborated byat least 2 independent sources of information, in orderto be as conservative as possible in our reporting. Peakspawning season and moon phase for each specieswere summarized from literature reports, primarilyfrom Belize and were thus not specific to each site.
Prediction of FSA sites: Shelf-edge lines derivedfrom a classified satellite image were used to identifypotential FSA sites based on the approximate shapeof reef promontories and shelf edges (Heyman & Re-quena 2002; Kobara & Heyman 2006). There are sev-eral reef promontories occurring at different scales.FSA sites in Turneffe Atoll are located at the northend, the east-facing reefs, and the south end of ex-tended reefs (Fig. 1). A similar pattern occurred inLighthouse Reef Atoll; however, the south end hasnot been fished. We considered the south end, theSouth Point, as a potential FSA site. In addition,around Long Caye, Glover’s Reef Atoll, a reef extendssoutheast, which is similar in shape to HalfmoonCaye, Lighthouse Reef Atoll. This area (Long Caye)was also projected and monitored as a potentialspawning aggregation site (Fig. 1).
RESULTS
Geospatial characteristics of FSA sites in Belize
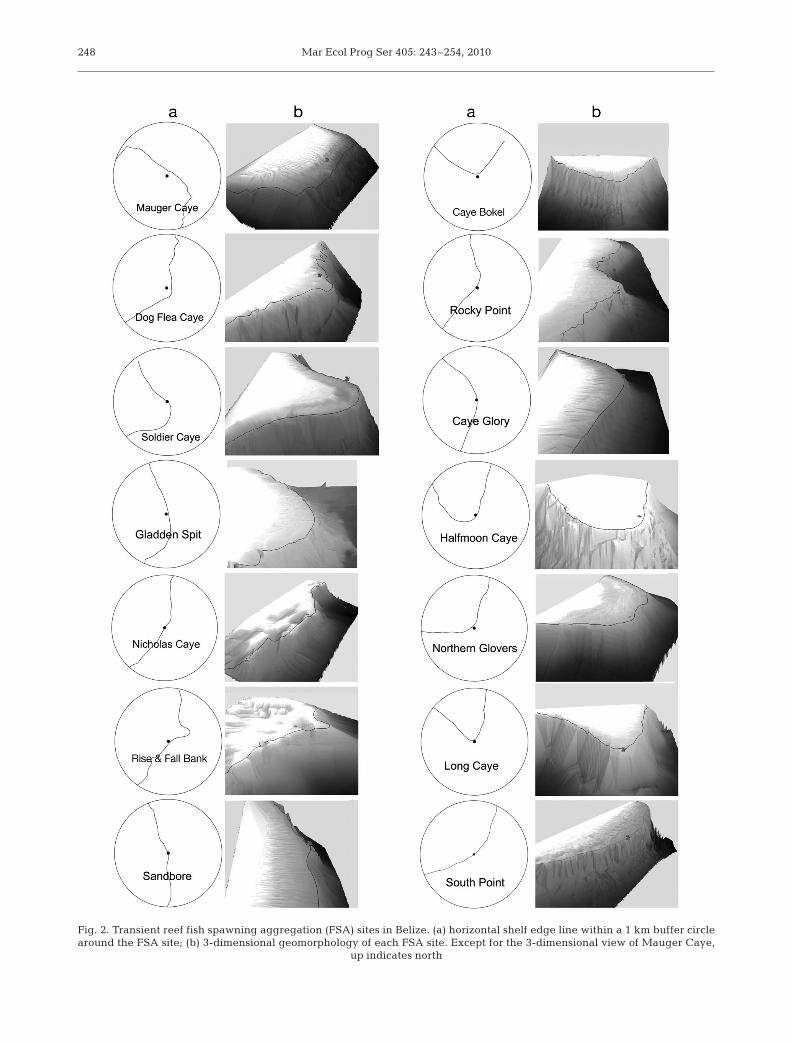
All of the 12 known Epinephelus striatus FSA siteswere located on convex reefs, near shelf edges andwithin 1 km of the tips of reef promontories. All sites(means ± SD) were located within 95 m (30 ± 29 m) ofthe steep shelf-edge contour line and within 550 m(182 ± 164 m) of reef promontory turning points(Table 1, Fig. 2). All sites were found in 20 to 80 mwater depth (41 ± 21 m) and located within 250 m (78 ±62 m) of the nearest 100 m depth contour lines (Table 1,Fig. 3). FSA sites were all more than 1 km away fromthe nearest reef channel except Nicholas Caye (640 mfrom channel). FSAs occurred within all types of reefs:7 on atoll reefs, 4 on barrier reefs, and 1 on a bank reef.
Sinuosity was used to describe the relative curvinessof shelf edge contours in this study. Most sites havehighly curved reefs (Fig. 2), and their sinuosity valuesare correspondingly high (1.34 ± 0.35, Table 1). OnlySandbore has low sinuosity (1.05, Table 1) indicatingonly very limited shelf edge curve. Interestingly, how-ever, the promontory shape is clearer at both smallerand larger scales. There is a small promontory (orbump), with a radius of ~300 m. The broad curvingshelf edge of the northeast portion of the LighthouseReef Atoll has its inflection point just at the bump. Theobtuse promontory shape is more clearly visible usinga 2 or 3 km buffer circle (Fig. 2).
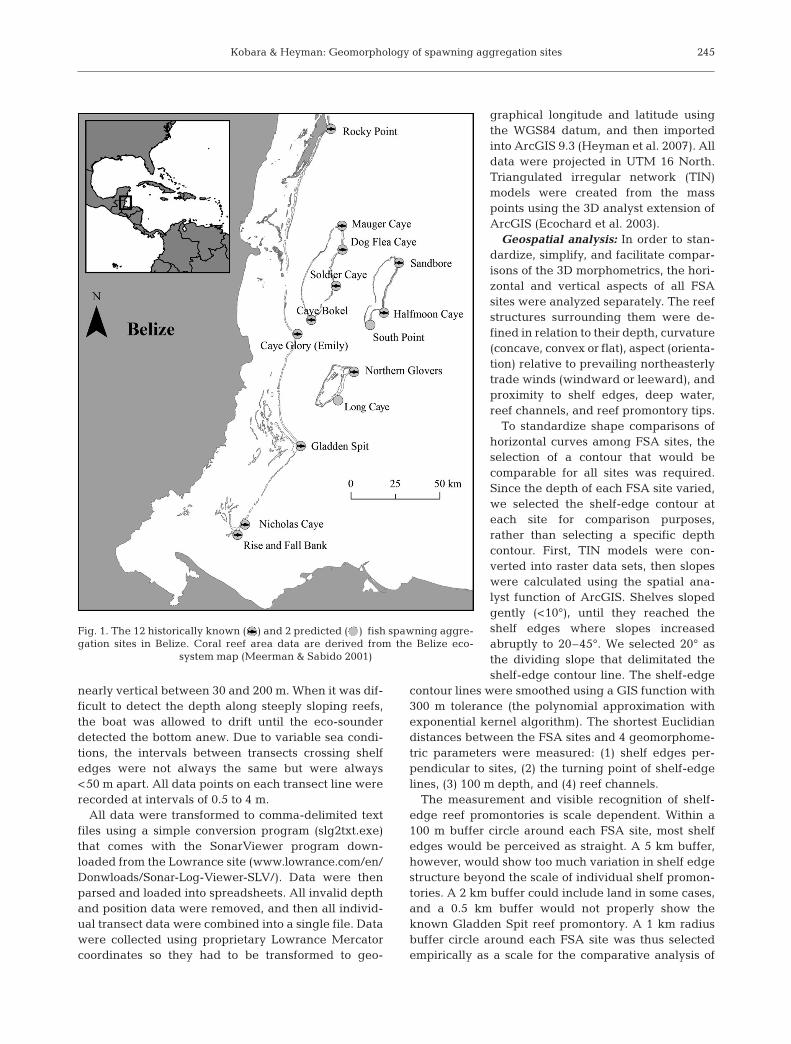
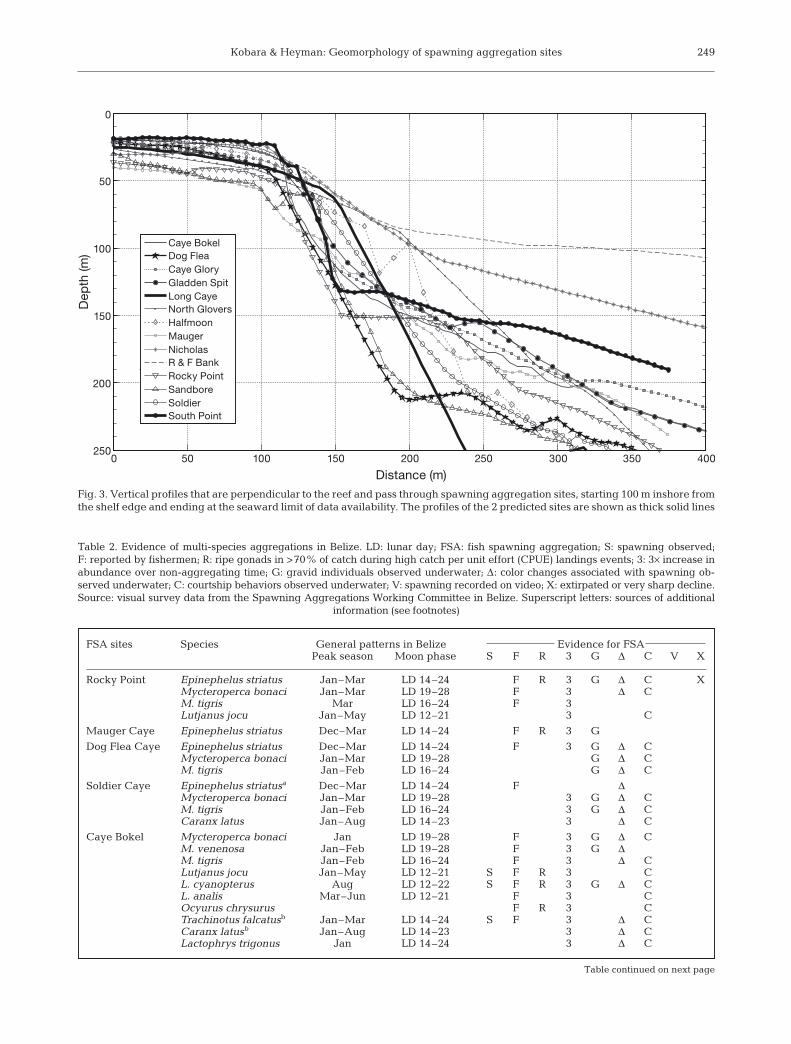
Vertical profiles through all FSA sites were plottedon a single set of axes for comparative purposes. AllFSA sites were located around the seaward shelf edgeswith slopes steeper than 45°. All sites were adjacent towater depth >100 m (Fig. 3). Except Rise and Fall Bankand Nicholas Caye, all reefs dropped steeply from theshelf edge to at least 150 or 200 m. Rise and Fall Bank,and Nicholas Caye dropped steeply, but to around 80or 100 m where the slope became gentler (around 8 to12 and 15 to 18°, respectively). The shallower slopingshelves extended a distance of 1000 m from the bottomedge to a depth of 250 m. In addition, Rise and FallBank and Nicholas Caye FSA sites had 5 to 10 m verti-cal bumps near to the shelf edge (Fig. 3).
Multi-species aspects of FSA sites in Belize
Four of the 12 sites were confirmed multi-speciesFSAs using direct evidence of spawning (Table 2).Multiple indirect indicators of spawning behaviors(e.g. color change, 3 times higher density, courtshipbehavior) for at least 2 species were observed at 10 ofthe 12 sites. Mycteroperca bonaci (Black grouper) andM. tigris (Tiger grouper) were observed to share all of
246

Kobara & Heyman: Geomorphology of spawning aggregation sites
the 10 known sites with Epinephelus striatus at all ofthe 10 known sites. Gladden Spit harbors aggregationsof at least 17 species from 9 families, including ser-ranids, lutjanids, ostraciids and carangids (Heyman &Kjerfve 2008) and served as a conceptual model forother sites. Caye Bokel, Halfmoon Caye and SouthPoint also support FSAs for serranids, lutjanids, caran-gids and ostraciids (Table 2).
Two aspects of the predicted sites
One of the 2 predicted sites, South Point was con-firmed as a multi-species FSA using direct evidence ofspawning (Table 2). Mycteroperca tigris, M. bonaci,Caranx ruber (bar jack) and Lactophrys trigonus(trunkfish) were observed to spawn at South Point, con-firming the presence of transient FSAs. C. ruber had agroup spawning of 25 to 30 individuals at 18:10 h on 29May 2002. L. trigonus exhibited haremic spawning of75 individuals at 5:55 pm on 21 March 2003. M. tigriswere observed to spawn repeatedly on 5 and 6 April2002 when 300 to 400 individuals, aggregated in hare-mic groups of 5 to 10 females surrounding individualmale-guarded territories, spawned in repeated haremicspawning rushes. M. bonaci were observed in rela-tively large groups, 200 to 250 individuals on 4 and6 February 2002 at South Point and exhibited courtshipbehavior and color changes. Multiple indirect indica-tors (gravid individuals, color changes associated withspawning, and courtship behaviors) of M. bonaci and
Epinephelus striatus were observed at Glover’s LongCaye during visual observations on 9 January 2002.Subsequent to our prediction and field observations,conversations with local fishers revealed that Glover’sLong Caye was already known to them as an aggrega-tion site for Caranx latus (horse eye jack) and Lutjanusanalis (mutton snapper) in April and May.
The aggregations at the 2 predicted sites were lo-cated on convex reefs, near shelf edges and within1 km of the tips of reef promontories. Both sites were lo-cated within 33 m of shelf edges with slopes steeperthan 45°, between 25 and 35 m water depths at the shelfedge, proximal to deep walls exceeding 120 m (Fig. 3).
DISCUSSION
Geomorphological characterization
This study provides a comparative geomorphometricanalysis of 12 transient FSAs in Belize. They all occurat geomorphologically similar and somewhat predict-able locations. Secondarily, the study has gathered evi-dence that 11 Epinephelus striatus FSA sites in Belizeharbor transient multi-species FSAs. Finally, based onthe geomorphologic search image, 2 previously un-known transient FSA sites were predicted; one wasverified as a multi-species FSA site with direct evi-dence of spawning and the other appears to be a multi-species FSA site, with indirect evidence for 2 species.As is the case in the Cayman Islands (Kobara & Hey-
247
Location Shape Depth (m) Distance (m) to SinuosityFSA bottom Shelf edge Shelf edge Horizontal Nearest 100 m
inflection point reef channel depth contour
RP Convex 80 48 28 245 – 7 1.11MG Convex 41 70 93 550 – 128 1.40DF Convex 23 39 87 140 – 122 1.27SC Convex 26 30 5 167 3800 65 1.11CB Convex 83 29 31 31 2500 9 1.39SB Convex 50 53 5 40 – 50 1.05HC Convex 30 35 15 245 3120 85 1.96NG Convex 60 47 45 45 2000 55 1.49CG Convex 33 35 5 5 – 50 1.17GS Convex 31 38 40 270 – 90 1.16NC Convex 25 22 7 160 640 98 1.08RF Convex 20 26 30 465 – 250 1.26
GL Convex 45 33 30 40 1400 35 2.22SP Convex 21 22 1 140 1950 45 1.11
Mean 41 38 30 182 2200 78 1.34SD 21 13 29 164 1055 62 0.35
Table 1. Geomorphometric parameters of reef fish spawning aggregation sites in Belize. Known sites: RP: Rocky Point; MG:Mauger Caye; DF: Dog Flea Caye; SC: Soldier Caye; CB: Caye Bokel; SB: Sandbore; HC: Halfmoon Caye; NG: Northern Glover;CG: Caye Glory, Emily; GS: Gladden Spit; NC: Nicholas Caye; RF: Rise and Fall Bank. Predicted sites: GL: Glover’s Long Caye;
SP: South Point
Mar Ecol Prog Ser 405: 243–254, 2010248
Fig. 2. Transient reef fish spawning aggregation (FSA) sites in Belize. (a) horizontal shelf edge line within a 1 km buffer circlearound the FSA site; (b) 3-dimensional geomorphology of each FSA site. Except for the 3-dimensional view of Mauger Caye,
up indicates north
Kobara & Heyman: Geomorphology of spawning aggregation sites 249
0 50 100 150 200 250 300 350 400250
200
150
100
50
0
Distance (m)
Dep
th (m
)
Caye BokelDog FleaCaye GloryGladden SpitLong CayeNorth GloversHalfmoonMaugerNicholasR & F BankRocky PointSandboreSoldierSouth Point
Fig. 3. Vertical profiles that are perpendicular to the reef and pass through spawning aggregation sites, starting 100 m inshore fromthe shelf edge and ending at the seaward limit of data availability. The profiles of the 2 predicted sites are shown as thick solid lines
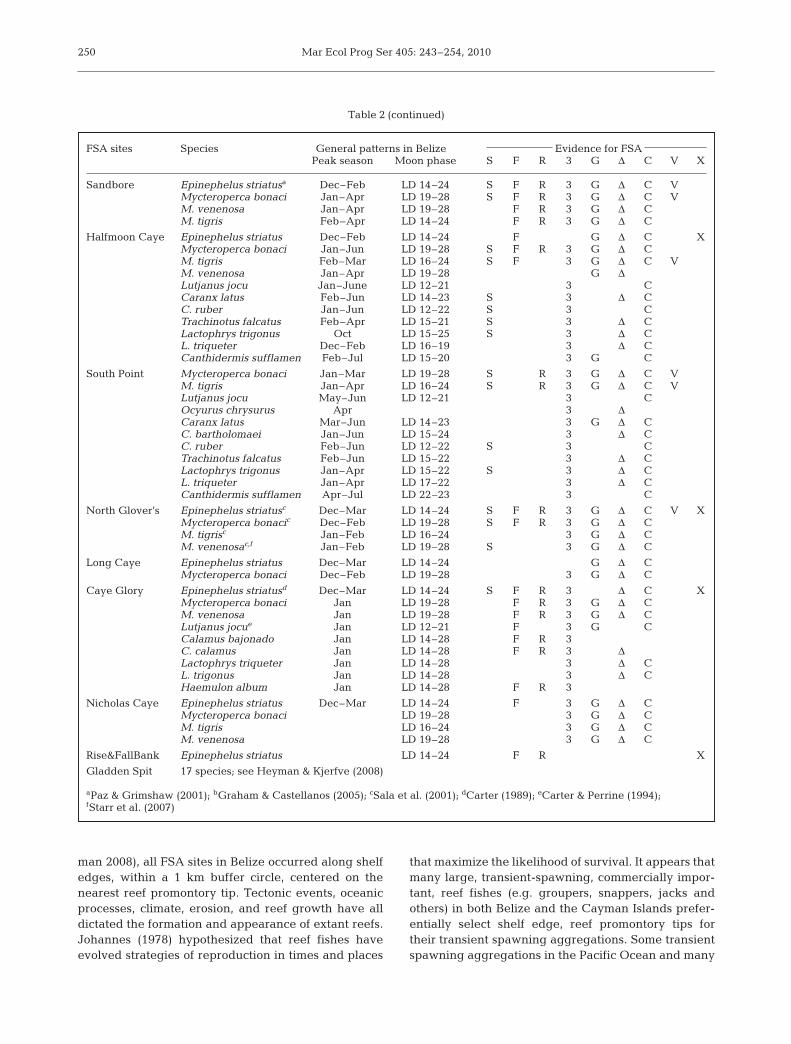
FSA sites Species General patterns in Belize Evidence for FSAPeak season Moon phase S F R 3 G Δ C V X
Rocky Point Epinephelus striatus Jan–Mar LD 14–24 F R 3 G Δ C XMycteroperca bonaci Jan–Mar LD 19–28 F 3 Δ CM. tigris Mar LD 16–24 F 3Lutjanus jocu Jan–May LD 12–21 3 C
Mauger Caye Epinephelus striatus Dec–Mar LD 14–24 F R 3 G
Dog Flea Caye Epinephelus striatus Dec–Mar LD 14–24 F 3 G Δ CMycteroperca bonaci Jan–Mar LD 19–28 G Δ CM. tigris Jan–Feb LD 16–24 G Δ C
Soldier Caye Epinephelus striatusa Dec–Mar LD 14–24 F ΔMycteroperca bonaci Jan–Mar LD 19–28 3 G Δ CM. tigris Jan–Feb LD 16–24 3 G Δ CCaranx latus Jan–Aug LD 14–23 3 Δ C
Caye Bokel Mycteroperca bonaci Jan LD 19–28 F 3 G Δ CM. venenosa Jan–Feb LD 19–28 F 3 G ΔM. tigris Jan–Feb LD 16–24 F 3 Δ CLutjanus jocu Jan–May LD 12–21 S F R 3 CL. cyanopterus Aug LD 12–22 S F R 3 G Δ CL. analis Mar–Jun LD 12–21 F 3 COcyurus chrysurus F R 3 CTrachinotus falcatusb Jan–Mar LD 14–24 S F 3 Δ CCaranx latusb Jan–Aug LD 14–23 3 Δ CLactophrys trigonus Jan LD 14–24 3 Δ C
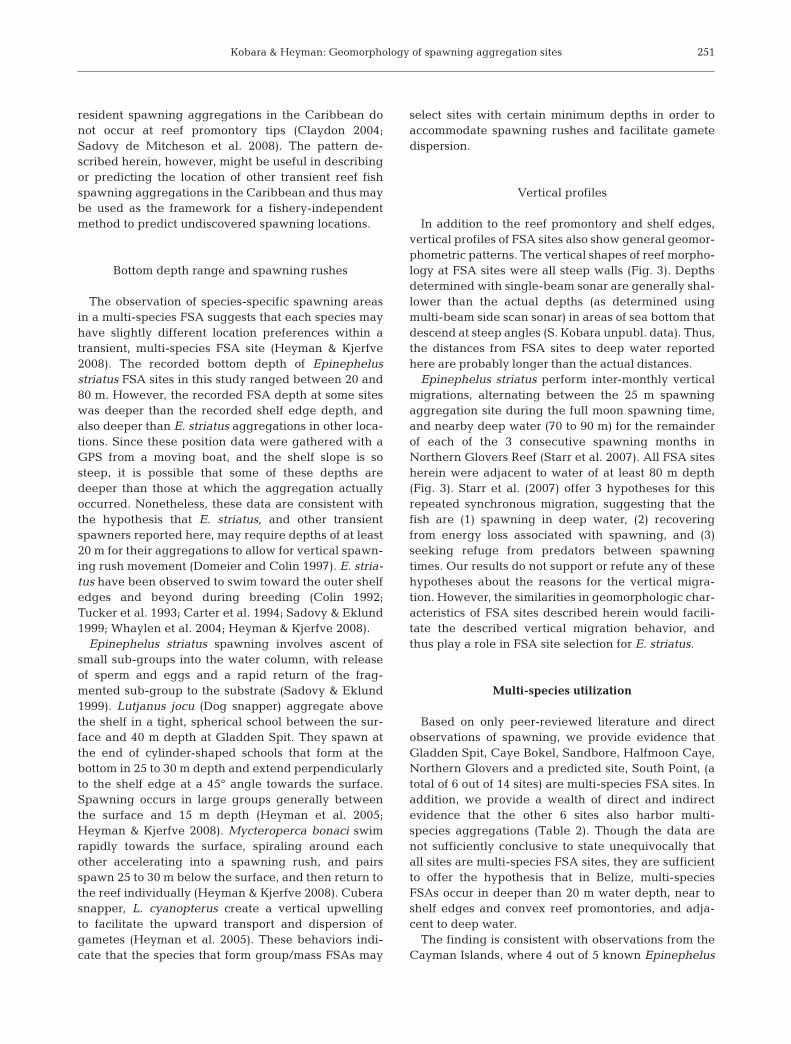
Table 2. Evidence of multi-species aggregations in Belize. LD: lunar day; FSA: fish spawning aggregation; S: spawning observed; F: reported by fishermen; R: ripe gonads in >70% of catch during high catch per unit effort (CPUE) landings events; 3: 3× increase inabundance over non-aggregating time; G: gravid individuals observed underwater; Δ: color changes associated with spawning ob-served underwater; C: courtship behaviors observed underwater; V: spawning recorded on video; X: extirpated or very sharp decline.Source: visual survey data from the Spawning Aggregations Working Committee in Belize. Superscript letters: sources of additional
information (see footnotes)
Table continued on next page
Mar Ecol Prog Ser 405: 243–254, 2010
man 2008), all FSA sites in Belize occurred along shelfedges, within a 1 km buffer circle, centered on thenearest reef promontory tip. Tectonic events, oceanicprocesses, climate, erosion, and reef growth have alldictated the formation and appearance of extant reefs.Johannes (1978) hypothesized that reef fishes haveevolved strategies of reproduction in times and places
that maximize the likelihood of survival. It appears thatmany large, transient-spawning, commercially impor-tant, reef fishes (e.g. groupers, snappers, jacks andothers) in both Belize and the Cayman Islands prefer-entially select shelf edge, reef promontory tips fortheir transient spawning aggregations. Some transientspawning aggregations in the Pacific Ocean and many
250
FSA sites Species General patterns in Belize Evidence for FSAPeak season Moon phase S F R 3 G Δ C V X
Sandbore Epinephelus striatusa Dec–Feb LD 14–24 S F R 3 G Δ C VMycteroperca bonaci Jan–Apr LD 19–28 S F R 3 G Δ C VM. venenosa Jan–Apr LD 19–28 F R 3 G Δ CM. tigris Feb–Apr LD 14–24 F R 3 G Δ C
Halfmoon Caye Epinephelus striatus Dec–Feb LD 14–24 F G Δ C XMycteroperca bonaci Jan–Jun LD 19–28 S F R 3 G Δ CM. tigris Feb–Mar LD 16–24 S F 3 G Δ C VM. venenosa Jan–Apr LD 19–28 G ΔLutjanus jocu Jan–June LD 12–21 3 CCaranx latus Feb–Jun LD 14–23 S 3 Δ CC. ruber Jan–Jun LD 12–22 S 3 CTrachinotus falcatus Feb–Apr LD 15–21 S 3 Δ CLactophrys trigonus Oct LD 15–25 S 3 Δ CL. triqueter Dec–Feb LD 16–19 3 Δ CCanthidermis sufflamen Feb–Jul LD 15–20 3 G C
South Point Mycteroperca bonaci Jan–Mar LD 19–28 S R 3 G Δ C VM. tigris Jan–Apr LD 16–24 S R 3 G Δ C VLutjanus jocu May–Jun LD 12–21 3 COcyurus chrysurus Apr 3 ΔCaranx latus Mar–Jun LD 14–23 3 G Δ CC. bartholomaei Jan–Jun LD 15–24 3 Δ CC. ruber Feb–Jun LD 12–22 S 3 CTrachinotus falcatus Feb–Jun LD 15–22 3 Δ CLactophrys trigonus Jan–Apr LD 15–22 S 3 Δ CL. triqueter Jan–Apr LD 17–22 3 Δ CCanthidermis sufflamen Apr–Jul LD 22–23 3 C
North Glover’s Epinephelus striatusc Dec–Mar LD 14–24 S F R 3 G Δ C V XMycteroperca bonacic Dec–Feb LD 19–28 S F R 3 G Δ CM. tigrisc Jan–Feb LD 16–24 3 G Δ CM. venenosac,f Jan–Feb LD 19–28 S 3 G Δ C
Long Caye Epinephelus striatus Dec–Mar LD 14–24 G Δ CMycteroperca bonaci Dec–Feb LD 19–28 3 G Δ C
Caye Glory Epinephelus striatusd Dec–Mar LD 14–24 S F R 3 Δ C XMycteroperca bonaci Jan LD 19–28 F R 3 G Δ CM. venenosa Jan LD 19–28 F R 3 G Δ CLutjanus jocue Jan LD 12–21 F 3 G CCalamus bajonado Jan LD 14–28 F R 3C. calamus Jan LD 14–28 F R 3 ΔLactophrys triqueter Jan LD 14–28 3 Δ CL. trigonus Jan LD 14–28 3 Δ CHaemulon album Jan LD 14–28 F R 3
Nicholas Caye Epinephelus striatus Dec–Mar LD 14–24 F 3 G Δ CMycteroperca bonaci LD 19–28 3 G Δ CM. tigris LD 16–24 3 G Δ CM. venenosa LD 19–28 3 G Δ C
Rise&FallBank Epinephelus striatus LD 14–24 F R X
Gladden Spit 17 species; see Heyman & Kjerfve (2008)
aPaz & Grimshaw (2001); bGraham & Castellanos (2005); cSala et al. (2001); dCarter (1989); eCarter & Perrine (1994); fStarr et al. (2007)
Table 2 (continued)
Kobara & Heyman: Geomorphology of spawning aggregation sites
resident spawning aggregations in the Caribbean donot occur at reef promontory tips (Claydon 2004;Sadovy de Mitcheson et al. 2008). The pattern de-scribed herein, however, might be useful in describingor predicting the location of other transient reef fishspawning aggregations in the Caribbean and thus maybe used as the framework for a fishery-independentmethod to predict undiscovered spawning locations.
Bottom depth range and spawning rushes
The observation of species-specific spawning areasin a multi-species FSA suggests that each species mayhave slightly different location preferences within atransient, multi-species FSA site (Heyman & Kjerfve2008). The recorded bottom depth of Epinephelusstriatus FSA sites in this study ranged between 20 and80 m. However, the recorded FSA depth at some siteswas deeper than the recorded shelf edge depth, andalso deeper than E. striatus aggregations in other loca-tions. Since these position data were gathered with aGPS from a moving boat, and the shelf slope is sosteep, it is possible that some of these depths aredeeper than those at which the aggregation actuallyoccurred. Nonetheless, these data are consistent withthe hypothesis that E. striatus, and other transientspawners reported here, may require depths of at least20 m for their aggregations to allow for vertical spawn-ing rush movement (Domeier and Colin 1997). E. stria-tus have been observed to swim toward the outer shelfedges and beyond during breeding (Colin 1992;Tucker et al. 1993; Carter et al. 1994; Sadovy & Eklund1999; Whaylen et al. 2004; Heyman & Kjerfve 2008).
Epinephelus striatus spawning involves ascent ofsmall sub-groups into the water column, with releaseof sperm and eggs and a rapid return of the frag-mented sub-group to the substrate (Sadovy & Eklund1999). Lutjanus jocu (Dog snapper) aggregate abovethe shelf in a tight, spherical school between the sur-face and 40 m depth at Gladden Spit. They spawn atthe end of cylinder-shaped schools that form at thebottom in 25 to 30 m depth and extend perpendicularlyto the shelf edge at a 45° angle towards the surface.Spawning occurs in large groups generally betweenthe surface and 15 m depth (Heyman et al. 2005;Heyman & Kjerfve 2008). Mycteroperca bonaci swimrapidly towards the surface, spiraling around eachother accelerating into a spawning rush, and pairsspawn 25 to 30 m below the surface, and then return tothe reef individually (Heyman & Kjerfve 2008). Cuberasnapper, L. cyanopterus create a vertical upwellingto facilitate the upward transport and dispersion ofgametes (Heyman et al. 2005). These behaviors indi-cate that the species that form group/mass FSAs may
select sites with certain minimum depths in order toaccommodate spawning rushes and facilitate gametedispersion.
Vertical profiles
In addition to the reef promontory and shelf edges,vertical profiles of FSA sites also show general geomor-phometric patterns. The vertical shapes of reef morpho-logy at FSA sites were all steep walls (Fig. 3). Depthsdetermined with single-beam sonar are generally shal-lower than the actual depths (as determined usingmulti-beam side scan sonar) in areas of sea bottom thatdescend at steep angles (S. Kobara unpubl. data). Thus,the distances from FSA sites to deep water reportedhere are probably longer than the actual distances.
Epinephelus striatus perform inter-monthly verticalmigrations, alternating between the 25 m spawningaggregation site during the full moon spawning time,and nearby deep water (70 to 90 m) for the remainderof each of the 3 consecutive spawning months inNorthern Glovers Reef (Starr et al. 2007). All FSA sitesherein were adjacent to water of at least 80 m depth(Fig. 3). Starr et al. (2007) offer 3 hypotheses for thisrepeated synchronous migration, suggesting that thefish are (1) spawning in deep water, (2) recoveringfrom energy loss associated with spawning, and (3)seeking refuge from predators between spawningtimes. Our results do not support or refute any of thesehypotheses about the reasons for the vertical migra-tion. However, the similarities in geomorphologic char-acteristics of FSA sites described herein would facili-tate the described vertical migration behavior, andthus play a role in FSA site selection for E. striatus.
Multi-species utilization
Based on only peer-reviewed literature and directobservations of spawning, we provide evidence thatGladden Spit, Caye Bokel, Sandbore, Halfmoon Caye,Northern Glovers and a predicted site, South Point, (atotal of 6 out of 14 sites) are multi-species FSA sites. Inaddition, we provide a wealth of direct and indirectevidence that the other 6 sites also harbor multi-species aggregations (Table 2). Though the data arenot sufficiently conclusive to state unequivocally thatall sites are multi-species FSA sites, they are sufficientto offer the hypothesis that in Belize, multi-speciesFSAs occur in deeper than 20 m water depth, near toshelf edges and convex reef promontories, and adja-cent to deep water.
The finding is consistent with observations from theCayman Islands, where 4 out of 5 known Epinephelus
251
Mar Ecol Prog Ser 405: 243–254, 2010
striatus FSA sites harbored multi-species FSAs (Kobara& Heyman 2008). E. striatus share their sites in theCayman Islands with FSAs of other groupers (e.g.Mycteroperca tigris) and snappers (e.g. Lutjanus ana-lis). For example, the west end of Little Cayman is awell-documented multi-species FSA site that includesaggregations of several species of serranids, lutjanids,and carangids. All 4 multi-species FSA sites in theCayman Islands share the same geomorphologic char-acteristics as those described herein for Belize (Kobara& Heyman 2008).
Predicting potential FSA sites
It is well documented that scientists are far morelikely to find out about FSA sites from fishers, thenfrom any other source of information (Johannes 1998;Colin et al. 2003). As far as we are aware, South Point,Lighthouse Reef Atoll was the first transient multi-species FSA site discovered by fishery-independentpredictions based on geomorphology. Indeed, the exactlocation was predicted based solely on observations ofa Landsat image — an area that appeared to be a reefpromontory jutting out over a steep shelf. Furtherstudy provided herein illustrates that the site is indeedgeomorphologically similar to other FSA sites in Belize,occurring near the shelf edge of a windward-facingreef promontory, more than 20 m deep, adjacent to asteep wall and proximal to deep water (Fig. 3).
Geospatial scale
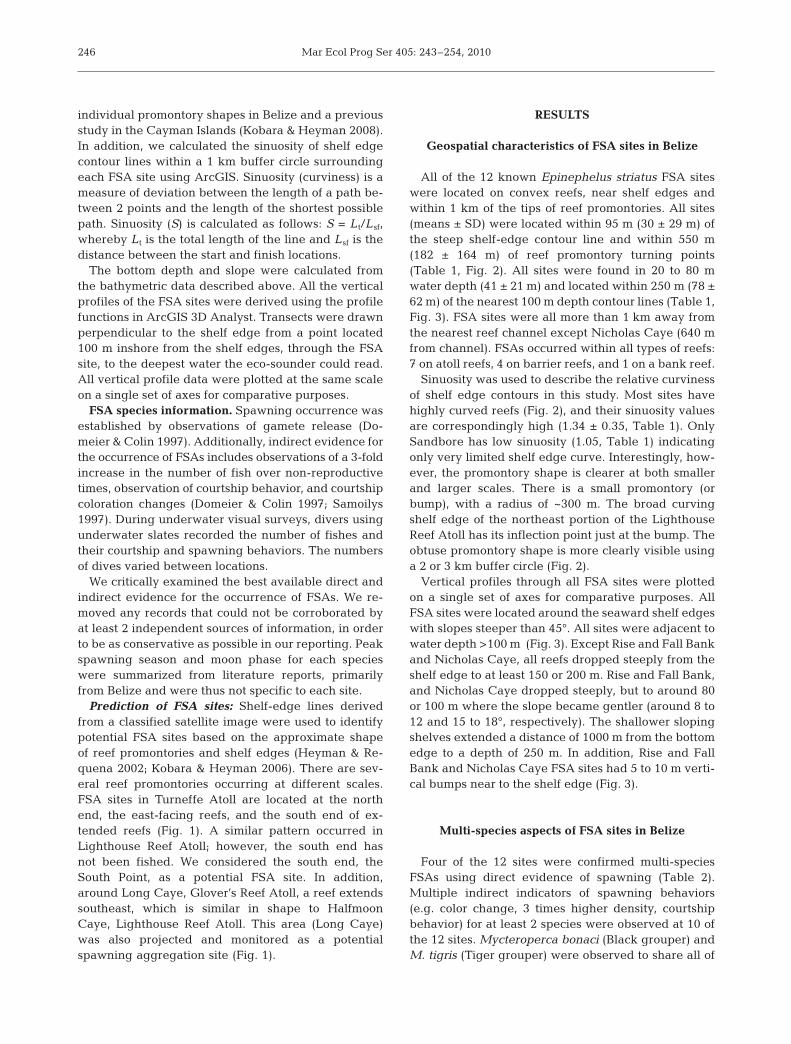
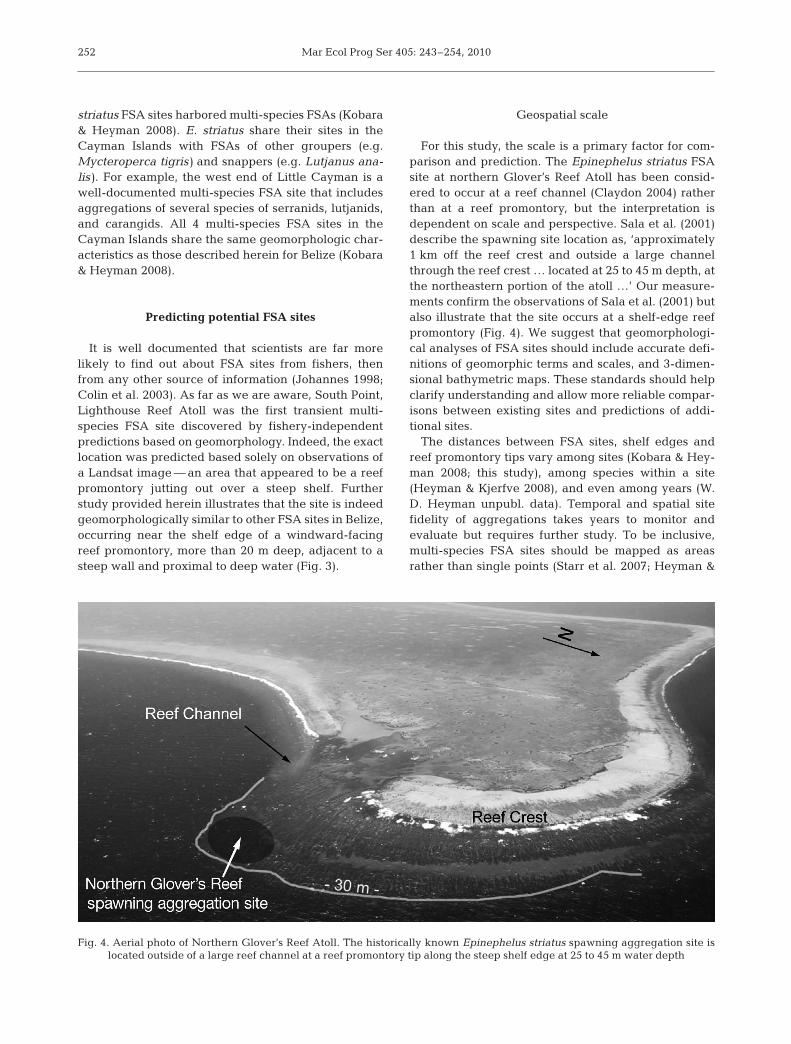
For this study, the scale is a primary factor for com-parison and prediction. The Epinephelus striatus FSAsite at northern Glover’s Reef Atoll has been consid-ered to occur at a reef channel (Claydon 2004) ratherthan at a reef promontory, but the interpretation isdependent on scale and perspective. Sala et al. (2001)describe the spawning site location as, ‘approximately1 km off the reef crest and outside a large channelthrough the reef crest … located at 25 to 45 m depth, atthe northeastern portion of the atoll …’ Our measure-ments confirm the observations of Sala et al. (2001) butalso illustrate that the site occurs at a shelf-edge reefpromontory (Fig. 4). We suggest that geomorphologi-cal analyses of FSA sites should include accurate defi-nitions of geomorphic terms and scales, and 3-dimen-sional bathymetric maps. These standards should helpclarify understanding and allow more reliable compar-isons between existing sites and predictions of addi-tional sites.
The distances between FSA sites, shelf edges andreef promontory tips vary among sites (Kobara & Hey-man 2008; this study), among species within a site(Heyman & Kjerfve 2008), and even among years (W.D. Heyman unpubl. data). Temporal and spatial sitefidelity of aggregations takes years to monitor andevaluate but requires further study. To be inclusive,multi-species FSA sites should be mapped as areasrather than single points (Starr et al. 2007; Heyman &
252
Fig. 4. Aerial photo of Northern Glover’s Reef Atoll. The historically known Epinephelus striatus spawning aggregation site is located outside of a large reef channel at a reef promontory tip along the steep shelf edge at 25 to 45 m water depth
Kobara & Heyman: Geomorphology of spawning aggregation sites
Kjerfve 2008), and protected areas should includeboth the larger area and some buffer area aroundthem to ensure that all species are offered spawningprotection.
Nicholas Caye and Sandbore imply the importanceof promontory tip location and shape that can be foundwithin a 1 km buffer circle of a spawning aggregationsite. With consideration of this scale and distance fromreef promontory tips, South Point and Long Caye arelogical candidates. These reef promontory sites mayalso attract multiple species for spawning because oftheir distinctive facilitation of the dispersal of eggs andlarvae.
Although this study shows that the primary FSAsites in Belize are reef promontories, the reasons whyfish aggregate at these sites remain unclear. Spawn-ing sites for transient spawning fishes may be selectedprimarily to simplify the task of widely spaced malesand females locating one another (Zaiser & Moyer1981, Shapiro et al. 1988). Group spawning species,particularly serranids, lutjanids, and carangids, maytherefore choose these geomorphologically distinctivelocations. The sites differentiated by the fish fromsurrounding areas may be learned by younger indi-viduals from more experienced adults (Shapiro et al.1988).
Reef promontories might confer some convergentgenetic advantage for larval transport. Severalauthors have suggested that reef fishes spawn at sitesexposed to strong currents to ensure the maximumdispersal of larvae and reduce benthic predation(Johannes 1978; Colin et al. 1987). Heyman & Kjerfve(2008), for example, reported that Gladden Spit hadtwice the current speed and 3 times the directionalvariability of currents compared to an adjacent, non-promontory site. We believe that promontory sites doenhance dispersal but that sites with slightly differentmorphology and/or at different scales may confer dif-ferent oceanographic regimes to which various suitesof species may adapt. The relationships betweenocean currents, reef geomorphology, FSA site selec-tion and larval transport are poorly understood yetdeserving of additional research.
However, there seems to be a more complex rela-tionship between the selection of FSAs, site fidelity,and local currents. There are transient FSAs in thewider Caribbean that occur at sites that cannot be de-fined as promontories within a 1 km buffer circle. TheLutjanus analis aggregation at Riley’s Humps in theFlorida Cayes, for example, is a non-promontoryspawning aggregation site (Lindeman et al. 2000).Regional differences and scale differences need to becarefully evaluated and defined before regional gen-eralities about locations of transient multi-species FSAsites can be deduced.
CONCLUSION
Our data provide the most extensive record to date ofthe geomorphology of grouper and snapper multi-species FSAs. Before this study, it was suggested thatEpinephelus striatus FSA sites occur both at reef pro-montories and at other sites that were not promontoriesbut these descriptive observations did not include adefining scale. Our study used a standard 1 km bufferaround reef promontories and demonstrated that 14multi-species FSAs occur near the shelf edge at con-vex-shaped reef structures jutting out over steep wallsinto deep water. Understanding the geomorphology ofFSAs might provide a fishery-independent way tolocate potential transient FSA sites in other locations.Analysis of geomorphological characteristics using thetechniques developed for Belizean FSAs are nowbeing applied to other regions in the Caribbean to testthe generality of our model for predicting the locationof multi-species FSAs.
Acknowledgements. A special thanks is extended to local fish-ermen and guides, E. Cuevas, E. Cuevas Jr., A. (Sonny) Gar-butt and K. Modera, for data collection. We thank many fishersfor their traditional ecological knowledge of FSA sites inBelize, particularly K. K. Nunez, A. (Fox) Nunez, C. (Mr. Jack)Young, J. Cabral (deceased), and many others. We thank N.Requena for geomorphology data at Rocky Point, AmbergrisCaye. Thanks to the Fisheries Department of Belize for per-mission to conduct this research. This study was funded in partby McDaniel Chair Funds from J. Rooker and from a grant toTexas A&M University from R. A. Stanford.
LITERATURE CITED
Carter J (1989) Grouper sex in Belize. Nat Hist 89:60–69Carter J, Marrow GJ, Pryor V (1994) Aspects of the ecology
and reproduction of Nassau grouper, Epinephelus striatus,off the coast of Belize, Central America. Proc Gulf CaribbFish Inst 43:64–111
Carter J, Perrine D (1994) A spawning aggregation of dogsnapper, Lutjanus jocu (Pisces, Lutjanidae) in Belize, Cen-tral America. Bull Mar Sci 55:228–234
Claro R, Lindeman KC (2003) Spawning aggregation sites ofsnapper and grouper species (Lutjanidae and Serranidae)on the insular shelf of Cuba. Gulf Caribb Res 14:91–106
Claydon J (2004) Spawning aggregations of coral reef fishes:characteristics, hypotheses, threats and management.Oceanogr Mar Biol Annu Rev 42:265–302
Colin PL (1992) Reproduction of the Nassau grouper, Epi-nephelus striatus (Pisces, Serranidae) and its relationshipto environmental conditions. Environ Biol Fishes 34:357–377
Colin PL, Shapiro DY, Weiler D (1987) Aspects of the repro-duction of two groupers, Epinephelus guttatus and E.striatus in the West Indies. Bull Mar Sci 40:220–230
Colin PL, Sadovy YJ, Domeier ML (2003). Manual for thestudy and conservation of reef fish spawning aggrega-tions. www.icriforum.org/
253

Mar Ecol Prog Ser 405: 243–254, 2010
Craig AK (1969) The grouper fishery of Cay Glory, BritishHonduras. Ann Assoc Am Geogr 59:252–263
Domeier ML, Colin PL (1997) Tropical reef fish spawningaggregations: defined and reviewed. Bull Mar Sci 60:698–726
Ecochard JB, Heyman WD, Requena N, Cuevas E, Biasi FB(2003) Case study: mapping Half Moon Caye’s reef usingthe adaptive bathymetric system. www.reefresilience.org/
Eklund AM, McClellan DB, Harper DE (2000) Black grouperaggregations in relation to protected areas within theFlorida Keys National Marine Sanctuary. Bull Mar Sci 66:721–728
Graham RT, Castellanos DW (2005) Courtship and spawningbehaviors of carangid species in Belize. Fish Bull 103:426–432
Heyman WD, Requena N (2002) Status of multi-species spawn-ing aggregations in Belize. The Nature Conservancy. PuntaGorda, Belize
Heyman WD, Kjerfve B (2008) Characterization of transientmulti-species reef fish spawning aggregations at Gladdenspit, Belize. Bull Mar Sci 83:531–551
Heyman WD, Azueta J, Lara O, Majil I and others (2004)Spawning aggregation monitoring protocol for the Meso-American Reef and the wider Caribbean. Version 2.0.Meso-American Barrier Reef Systems Projects, Belize City
Heyman WD, Kjerfve B, Graham RT, Rhodes KL, Garbutt L(2005) Spawning aggregations of Lutjanus cyanopterus(Cuvier) on the Belize barrier reef over a 6 year period. JFish Biol 67:83–101
Heyman WD, Ecochard JLB, Biasi FB (2007) Low-cost bathy-metric mapping for tropical marine conservation: a focuson reef fish spawning aggregation sites. Mar Geod 30:37–50
Johannes RE (1978) Reproductive strategies of coastal marinefishes in the tropics. Environ Biol Fishes 3:65–84
Johannes RE (1998) Government-supported, village-basedmanagement of marine resources in Vanuatu. OceanCoast Manag 40:165–186
Kobara S, Heyman WD (2006) Caribbean-wide geospatialanalysis of the location of transient reef fish spawningaggregation sites using remote sensing. Proc Gulf CaribbFish Inst 59:463–466
Kobara S, Heyman WD (2008) Geomorphometric patterns ofNassau grouper (Epinephelus striatus) spawning aggre-gation sites in the Cayman Islands. Mar Geod 31:231–245
Lindeman KC, Pugliese R, Waugh GT, Ault JS (2000) Devel-opmental patterns within a multispecies reef fishery: man-
agement applications for essential fish habitats and pro-tected areas. Bull Mar Sci 66:929–956
Meerman J, Sabido W (2001) Central American ecosystemsmap: Belize. CCAD/World Bank/Programme for Belize,Belize City
Nemeth RS (2005) Population characteristics of a recoveringUS Virgin Islands red hind spawning aggregation follow-ing protection. Mar Ecol Prog Ser 286:81–97
Paz M, Grimshaw T (2001) Status report on Nassau groupersfor Belize, Central America. Workshop report ‘Towards asustainable management of Nassau groupers in Belize’.Green Reef, Belize City
Sadovy Y, Eklund AM (1999) Synopsis of biological data onthe Nassau Grouper, Epinephelus striatus (Bloch, 1792),and the Jewfish, E. itajara (Lichtenstein, 1822). NOAATechnical Report NMFS 146. US Department of Com-merce, Seattle, WA
Sadovy de Mitcheson Y, Cornish A, Domeier M, Colin PL,Russell M, Lindeman KC (2008) A global baseline forspawning aggregations of reef fishes. Conserv Biol 22:1233–1244
Sala E, Ballesteros E, Starr RM (2001) Rapid decline of Nassaugrouper spawning aggregations in Belize: fishery man-agement and conservation needs. Fisheries (Bethesda) 26:23–30
Samoilys MA (1997) Periodicity of spawning aggregations ofcoral trout Plectropomus leopardus (Pisces: Serranidae) onthe northern Great Barrier Reef. Mar Ecol Prog Ser 160:149–159
Shapiro D, Hensley D, Appeldoorn R (1988) Pelagic spawningand egg transport in coral-reef fishes: a skeptical over-view. Environ Biol Fishes 22:3–14
Starr RM, Sala E, Ballesteros E, Zabala M (2007) Spatialdynamics of the Nassau grouper Epinephelus striatus in aCaribbean atoll. Mar Ecol Prog Ser 343:239–249
Thompson EF (1944) The fisheries of British Honduras. DevWelfare West Indies Bull no. 21, Advocate, Bridgetown
Tucker JW, Bush PG, Slaybaugh ST (1993) Reproductive pat-terns of Cayman Islands Nassau grouper (Epinephelusstriatus) populations. Bull Mar Sci 52:961–969
Whaylen L, Pattengill-Semmens CV, Semmens BX, Bush PG,Boardman MR (2004) Observations of a Nassau grouper,Epinephelus striatus, spawning aggregation site in LittleCayman, Cayman Islands, including multi-species spawn-ing information. Environ Biol Fishes 70:305–313
Zaiser MJ, Moyer JT (1981) Notes on the reproductive behav-ior of the lizardfish Synodus ulae at Miyake-jima, Japan.Japan J Ichthyol 28:95–97
254
Editorial responsibility: John Choat, Townsville, Australia
Submitted: June 25, 2009; Accepted: January 16, 2010Proofs received from author(s): April 13, 2010