The geomorphology of coarse clastic surfaces in arid ...
375
• • •
-
Upload
khangminh22 -
Category
Documents
-
view
1 -
download
0
Transcript of The geomorphology of coarse clastic surfaces in arid ...

Durham E-Theses
The geomorphology of coarse clastic surfaces in arid
environments
Rosser, Nicholas John
How to cite:
Rosser, Nicholas John (2002) The geomorphology of coarse clastic surfaces in arid environments, Durhamtheses, Durham University. Available at Durham E-Theses Online: http://etheses.dur.ac.uk/3745/
Use policy
The full-text may be used and/or reproduced, and given to third parties in any format or medium, without prior permission orcharge, for personal research or study, educational, or not-for-pro�t purposes provided that:
• a full bibliographic reference is made to the original source
• a link is made to the metadata record in Durham E-Theses
• the full-text is not changed in any way
The full-text must not be sold in any format or medium without the formal permission of the copyright holders.
Please consult the full Durham E-Theses policy for further details.
Academic Support O�ce, Durham University, University O�ce, Old Elvet, Durham DH1 3HPe-mail: [email protected] Tel: +44 0191 334 6107
http://etheses.dur.ac.uk

The geomorphology of coarse clastic surfaces in arid environments
Nicholas John Rosser
The copyright of this thesis rests with the author.
No quotation from it should be published without
his prior written consent and information derived
from it should be acknowledged.
'i B JUN 2U03
This thesis is submitted in accordance with the regulations for the degree of Doctor of Philosophy in the University of
Durham, Department of Geography, 2002.

Declaration
I confirm that no part of the material presented in this thesis has previously been
submitted by me or any other person for a degree in this or any other university. In all
cases, where it is relevant, material from the work of others has been acknowledged.
The copyright of this thesis rests with the author. No quotation from it should be published
without prior written consent and information derived from it should be acknowledged.
Signed:
Date:
- ii -

The geomorphology of coarse clastic suriaces in arid environments
Thesis submitted in accordance with the regulations for Doctor of Philosophy Department of Geography
University of Durham 2002
Nicholas John Rosser
Abstract
This study explores the linkages between slope form and slope process in arid environments. In doing so, questions of the development of slopes in arid environments are examined. The age of many arid environment surfaces, combined with the sporadic nature of formative events, means that long-term surface and slope development remains an elusive question in geomorphology. Deserts have inspired many of the most enduring theories of landscape evolution and continue to provide a test-bed for new and emerging ideas in geomorphology. The clast-mantled surface of the northeast Jordan Badia presents an ideal opportunity to study the links between surface character and slope processes in arid environments. The northeast Badia also provides an opportunity to explore theories of slope development and the behaviour of earth surface systems.
The nature of the clast covered ground surface has been assessed using a new digital aerial photography and image analysis technique. A field study of surface processes has been used to explore links between surface form and slope process. Additionally, a computer based simulation of long-term modification of the spatial distribution of surface clast has been undertaken. Given the subtle variation in earth surface form between disparate locations, a new semi-quantitative method of locating sample sites has been developed. The characterization of surface form has identified statistically significant relationships between ground surface character and two-dimensional slope form. Systematic variations in ground surface configuration, both within and between basalt flows, are found to be indicative of the action of slope processes.
The first study of ground surface hydrology in the northeastern Badia has been undertaken. The results from a series of rain-storm simulation experiments show subtle but significant links between the action of surface processes and variations in ground surface form. The controls on surface process are diverse and vary in significance with position in the landscape. A combination of ground surface characterization and process studies has identified several interesting geomorphological phenomena The surfaces exhibit systematic variations in structure and organization. Homeostatic links between form and process are clearly apparent, which suggests that surface form influences and is influenced by process action via a process of positive feedbacks.
Given the sporadic and infrequent recurrence of formative events in arid environments, a modelling approach has been developed to understand the long-term, spatial dynamics of the ground surface. The model has been used to simulate structure in the surface clast arrangement and the sensitivity of surface organization to physically constrained variations in model parameters. The model also allows the surfaces to be considered as self-organizing earth surface systems. The model results provide new insights into the process-form linkages in operation on clast-mantled arid surfaces. The model results provide new ways of examining and understanding the dynamics of clast mantled arid surfaces and have implications for the application of self-organization in geomorphology.
- iii -

Acknowledgeme111fts
The research in this thesis has only been made possible by the help and guidance which I
have received from numerous sources over the last three years. First of all I would like to
thank my Mum and Dad for providing constant support throughout my various
geographical exploits. Second, I would like to thank my supervisors, Professor Bob Allison
and Or David Higgitt. Bob has been an effervescent source of enthusiasm and ideas
throughout my studies. Dave has been instrumental, inspiring many of the ideas and
approaches developed in this thesis. I would particularly like to thank Dave for being
sympathetic when I dropped his digital camera from the kite, 100 m above the River Wear,
and to Bob for providing a replacement!
The fieldwork for this thesis was based at Safawi, Jordan. This was possible only through
the kind assistance of the Jordan Badia Research Development Programme (JBRDP).
The continuing support of H.R.H. Prince Hassan bin Talal, H.H. Sharifa Zein bint Nasser,
programme director Mohammed Shahbaz, Or Salim AI-Oun and Or Roderic Dutton, was
kindly appreciated. For the majority of my fieldwork, my sole companions in the desert
were the drivers of the JBDRP. Although we never had enough common language for me
to explain why I was doing what I was doing, nonetheless without their immense
knowledge of the northeast Badia this work would have been significantly more
challenging. Of the drivers R'wayed Abu Sammi and Abu Abdullah Sliman deserve
particular thanks, but also Rhalib, Mohammed Fal'hor, Abu Abdullah, Abu Rasha, Allah,
Fa'lha Abu Rasha and Abdullah, were all fantastic. In addition, the staff of the JBRDP in
Safawi: Rida, Ouda, Shaheen, Salah, Saad, lsmael Abu Rashed, Moufaq, Nadhal,
Nadhal, Ali, Abu Mohammed, Mohammed Striman, Majidt, Khalid, Khalid and Mohammed
made my various periods of fieldwork in Jordan an enjoyable and unforgettable
experience. In addition, the staff of the JBRDP in Amman were invaluable in making
things happen even when they, under normal conditions, perhaps should not. In particular
I would like to thank Salah and Achmed for getting me, and the rainfall simulator, onto a
plane that had already departed from Amman! I apologise for the spelling of everyone's
name and inevitably missing some people out. Everyone's humour and support was
greatly appreciated!
In Amman, the Centre for British Research in the Levant provided a welcome home from
home, in addition to the loan of the Monopod camera boom and field equipment. Although
not used to geomorphologists the staff, Or Bill Finlayson, Sam, Charlie, Mohammed and
Nadja, were incredibly supportive and helpful throughout my fieldwork.
- iv-

Valuable assistance in the field was greatly appreciated. I would particularly like to thank
Cate Noble for keeping my feet on the ground during the kite aerial photography, Or Alex
Wasse for his enthusiasm for desert expeditions, Ann Furr for providing a realistic view of
life in the Badia, in addition to assistance in the field from James Grove, Tanya Mills,
Simon Nelis and my brother Jonathan and now sister, Joh.
In Durham the staff and students of the Department of Geography have been a constant
source of help and support. I am indebted to the Department of Geography for providing
my studentship over the past three years. In the laboratories, Derek Coates, Frank
Davies, lan Dennison, Andrew Hudspeth, Eddie Million, Brain Priestley and Neil Tunstall
have all been excellent. The staff of the department office, in particular Derek Hudspeth
and Christine Bones have been invaluable in helping to arrange fieldwork in Jordan. I
have benefited greatly from working and living in a vibrant postgraduate community. A
particular mention goes to Andy Mills, Sarah Hamilton, Kathrin Blaufuss, Vicky Holliday
and John Thompson, in addition to Katherine Arrell, Helen Dunsford, Joe Holden, Richard
Johnson, Kay MacManus, Damien Laidler, Laura Park and Matt Wright.
Many elements of this thesis would not have been possible without the expertise of
several people. In particular I would like to thank Or Tom Sherratt, now of the Department
of Biology, Carleton University, Ottawa, for his generous help and time with the code for
the cellular automata model. Or Nick Cox has, as ever, been a constant source of
guidance, enthusiasm and wit on statistical techniques throughout my time at Durham.
Also, I would like to thank Or Louise Bull, Professor Tim Burt, Or lan Evans and Or Jeff
Warburton for their ideas and advice.
I have had the opportunity to discuss my research with many people outside of Durham.
In the field, discussions with Professor Stephen Wells, of the DRI, Nevada, were a great
inspiration. Closer to home, the opportunity to discuss my work with Professor Anthony
Parsons and Professor Jean Poesen were also greatly appreciated. Comments after the
presentation of this research at the IAG, Tokyo, 2001, provided valuable ideas for the
completion of this thesis.
-V-

list of Contents
Title page
The geomorphology of coarse clastic surfaces in arid environments .................................. i
Declaration .................................................................................................................... ii
Abstract ......................................................................................................................... iii
Acknowledgements ...................................................................................................... iv
List of Contents ............................................................................................................. vi
List of Tables ................................................................................................................ xi
List of Figures .............................................................................................................. xiii
List of Plates .............................................................................................................. xviii
Notation ....................................................................................................................... xx
Field site locations and names ................................................................................. xx
Chapter 4 Notation - Surface characterization ......................................................... xxi
Chapter 5 Notation - Surface hydrology .................................................................. xxii
Chapter 6 Notation - Modelling .............................................................................. xxiii
List of appendices ...................................................................................................... xxiv
Chapter 1: Introduction
1.1 Aims and Objectives
1.2
1.3
1.4
Background and justification of thesis
The northeastern Jordanian Badia
Organization of the thesis
1
3
4
5
6
1.5 The Jordan Badia Research and Development Programme 7
Chapter 2: The physical environment of the northeast Badia 8
2.1 Field site location 9
2.2
2.2.1
2.2.2
2.2.3
2.3
2.3.1
2.3.2
2.3.3
2.4
2.4.1
2.4.2
2.4.3
Geology
Geological stratigraphy and history
Structural geology
The Harrat Ash-Shaam Super Group
Climate
Regional Climate
Climate of the study site
Climate change
Geomorphology
Topography
Geomorphological classification
Slope forms
11
12
13
15
18
18
20
23
27
27
30
33
-vi -

2.4.4
2.4.5
2.4.6
2.5
Sediments
Clastic surfaces
Evidence of process action in the northeastern Badia
Conclusion
Chap~ell" 3: Si~e selec~io1111, dlesc~rup~ion and sampH01g
3.1 Introduction
3.2 Methodological considerations
3.2.1 Introduction
3.2.2 Scale
3.2.3 Location
3.2.4 Adequacy
3.3
3.3.1
3.3.2
3.3.3
3.3.4
3.3.5
3.3.6
3.4
3.4.1
3.4.2
3.4.3
3.4.4
3.4.5
3.4.6
3.4.7
3.4.8
3.4.9
3.5
Site selection
Introduction
Regional scale
Catchment scale
Slope profile scale
Plot scale
Subplot scale
Site descriptions
CC - site description
CV - site description
ST - site description
SW 1 and SW2 - Marab Swayed
SW1 -site description
SW2 - site description
GW1 and GW1- Qa'a al Buqei'wiya
GW1 -site description
GW2 - site description
Conclusions
Chapter 4: The characte~ristics of groll.Dnd surface form
4.1 Introduction
4.2
4.2.1
4.2.2
4.2.3
Previous work
Work in the Badia
Studies from beyond the Badia
Recommendations for experimental design
34
38
40
44
45
46
47
47
47
54
55
58
58
59
61
67
71
74
75
77
81
85
89
90
91
94
96
98
100
101
102
103
103
106
110
- vii-

4.3 Design of surface characterization technique
4.3.1 Image capture
4.3.2 Image processing
4.3.3 Data analysis
4.4 Results
4.4.1 Features indicative of process action
4.4.1.1 Rounding and texture
4.4.1.2 Clast sorting and size
4.4.1.3 Ground cover
4.4.1.4 Appropriate statistics
4.4.1.5 Multivariate analysis
Influence of geology and slope on ground surface 4.4.2 character
4.4.3 Spatial characteristics
4.4.3.1 Nearest neighbour analysis
4.4.3.2 Theissen polygon analysis
4.4.3.3 Fractal dimension analysis
4.4.3.4 Clast orientation
4.5 Discussion
Chapter 5: Hydrological processes
5.1 Introduction
5.2
5.2.1
5.2.2
5.2.3
5.3
5.3.1
5.3.2
5.3.3
5.4
5.4.1
5.4.2
5.4.3
5.5
5.5.1
Background
Previous work on hydrological processes on clastic semi-arid slopes
The use of rainfall simulation to examine hydrological processes in semi -arid areas
Rainfall simulator and the choice of appropriate equipment
Experimental design
Characteristics of the rainfall simulator design
Field plot design
Rainfall characteristics of the northeastern Badia
Monitoring of storm events in the northeastern Badia
Semi-arid storm events beyond the Badia
Design of experimental storm
Experimental procedure
Results
General observations
111
111
118
125
128
128
128
131
136
143
144
149
160
162
166
170
173
176
181
182
183
183
184
185
187
187
190
191
193
195
196
200
202
202
- viii -

5.5.2 General quantitative observations 206
5.5.3 Rainfall partitioning and infiltration 209
5.5.4 Sediment transfer 214
5.5.5 Heterogeneity in surface hydrology 215
5.6 Slope profile hydrology 216
5.6.1 Straight profile 217
5.6.2 Concave slope 225
5.6.3 Convex profile 229
Combined influence of slope and ground cover on 5.6.4 surface hydrology 234
5.7 Discussion 235
5.8 Conclusions 238
Chapter 6: Modelling the development of coarse clastic surfaces in arid environments 240
6.1
6.2
6.3
6.4
6.5
3.5.1
3.5.2
3.5.3
3.5.4
6.6
6.7
3.7.1
3.7.2
3.7.3
3.7.4
3.7.5
3.7.6
6.8
6.9
Chapter 7:
7.1
7.2
Aims and objectives 241
Background 241
Modelled structures on clastic surfaces 244
Theoretical background to self-organizing systems in geomorphology 246
Model design 251
Construction of the cellular automata model 251
Model output 258
Model code and function 258
Model experimental set-up 260
General model observations 261
Quantitative model analysis 267
Run Set 1 -The influence of cover percentage 267
Run set 2 - Influence of angle of friction 275
Run set 3 - The influence of clast sorting 284
Run set 4- The influence of slope angle 291
Run set 5 -The influence of edge weighting 297
Run set 6 - The influence of randomly generated model conditions 303
Discussion 307
Conclusions 310
Conclusion 311
Summary of thesis 312
Original contribution to knowledge 313
- ix-

7.3
7.4
References
Extension to previous studies
Recommendations for further research
320
325
328
-X-

list of Tables
Chapter 2: The physical environment of the northeast Badia
Table 2.1 A summary of the Harrat Ash-Shaam Super Group of basalts (after Tarawneh et al., 2000) 16
Table 2.2 Basalt types and mineral properties (after Tarawneh et al., 2000) 18
Table 2.3 Temperature characteristics of the northeastern Badia (after Kirk, 1997) 20
Table 2.4 Studies into Holocene climatic change in the field area and surrounding region 25
Table 2.5 Holocene climate change and relative geomorphic activity 26
Table 2.6 An overview of soils on the northeastern Jordanian basalt plateau 37
Table 2. 7 Clast size distribution parameters and sorting by basalt type (after Allison and Higgitt, 1998b) 38
Table 2.8 Ground coverage by basalt type (from Higgitt and Allison, 1998b) 39
Table 2.9 Influence of slope position on ground surface configuration (after Higgitt and Allison, 1999a) 40
Chapter 3: Site selection, description and sampling
Table 3.1 Examples of coarse clastic surface measures employed in characterization 52
Table 3.2 Studies of the influence of coarse clastic material on slope process 56
Table 3.3 Field site names and description of investigation 76
Chapter 4: The characteristics of ground surface form
Table 4.1 Image analysis derived clast measures 126
Table 4.2 Variation of ground surface cover with plot position 137
Table 4.3 Variation in ground surface character with slope position 142
Table 4.4 Table of appropriate surface characteristics developed (after Dunkerley, 1996) 143
Table 4.5 Correlation coefficient of appropriate statistics and slope variables (sign if indicated in italics) 144
Table 4.6 Multiple regression diagnostics between slope and ground cover variables (P < 0.0001 for all regression models) 146
Table 4.7 Variation in intermediate axis length for Abed, Bishriyya and Madhala basalts by three characterization techniques 149
Table 4.8 Clast sorting by basalt type 151
Table 4.9 Percentage ground surface cover between basalts, by different surface characterization techniques 152
-xi-

Table 4.10 R squared values for least squares correlations between slope and ground surface cover variables 154
Chapter 5: Hydrological processes
Table 5.1 Rainfall simulation plot locations 190
Table 5.2 Plot experiments, summary statistics 208
Table 5.3 Standard deviation in hydrological response as influenced by slope position 215
Table 5.4 Correlation statistics- straight profile 219
Table 5.5 Correlation statistics- concave profile 226
Table 5.6 Correlation statistics- convex profile 231
Table 5.7 Multiple regression analysis between slope, ground cover and surface hydrology variables 234
Chapter 6: Modelling the development of coarse clastic surfaces in arid environments
Table 6.1 Model parameters and variables 253
Table 6.2 Clast interaction outcomes 254
Table 6.3 Example of run set-up conditions and outcomes 256
Table 6.4 Flow diagram of model operation 259
Table 6.5 Run set configurations 260
Table 6.6 Model variable constants 260
Table 6.7 Set 1 -Run configuration 268
Table 6.8 Run configurations- Set 2 276
Table 6.9 Proportional ratio of small : medium: large clast sizes- Runs 64- 72 284
Table 6.10 Proportional ratios of small : medium : large clasts, and run-set configurations- Runs 64- 72 285
Table 6.11 Run configurations- Runs 73- 102. 292
Table 6.12 Calculation of edge, area and volume weighting 298
Table 6.13 Run configurations- Runs 103- 108 298
Table 6.14 Run configurations- Runs 109-114 299
Table 6.15 Influence of weighted means on surface Lock 299
Table 6.16 Org and fractal dimension relative to weighting type 301
Table 6.17 Run set configurations- Run set 6 303
Table 6.18 Influence of randomly generated run configurations on surface Lock 304
Table 6.19 y2-0rg and box fractal dimension - Run sets 115- 119 305
- xii -

Usa of Figures
Chapter 2: The physical environment of the northeast Badia
Figure 2.1 Location of the northeastern Jordanian Badia desert 10
Figure 2.2 Detailed location of the Harrat region of the Jordanian Badia 11
Figure 2.3 Stratigraphic column for the northeastern Badia 12
Figure 2.4 Structural Geology of Jordan (after Quennell, 1958) 15
Figure 2.5 Map of the geology of the study area 17
Figure 2.6 Distribution of rainfall across the Badia 21
Figure 2.7 Total daily evaporation versus rainfall 22
Figure 2.8 LandSat TM- Safawi- and surrounding area of northeastern Badia-Bands 7, 4, 2; path 173, Row 32.12N, Date 29.03.92 (Huntings Technical Services) 29
Figure 2.9 Block diagram of the geomorphological attributes of the basalt flow surface of the northeastern Badia 31
Figure 2.10 Slope profiles measured in the eastern Badia (after Allison and Higgitt, 1998) 33
Figure 2.11 Particle size characteristics of Qa'a and Marab features (after Allison et al., 2000) 35
Figure 2.12 Sketch diagram illustrating associations between slope, sediment thickness and the nature of boulder exposure (after: Allison and Higgitt, 1998) 36
Chapter 3: Site selection, description and sampling
Figure 3.1 Scale boundaries, theoretical and applied to the northeastern Badia 50
Figure 3.2 Process scale versus observation scale (after Bloschl and Sivapalan, 1995) 53
Figure 3.3 LandSat TM imagery- Marab Swayed 60
Figure 3.4 Location of DEM survey area relative to Marab Swayed 61
Figure 3.5 Shaded relief image of DGPS derived DEM of Marab Swayed (view oriented southeast, area of view is approximately 8 km2
) 63
Figure 3.6 Profile extraction at 228 locations, from the DGPS derived DEM (view oriented west, area of view is approximately 8 km2
} 64
Figure 3.7 An example of profile toe point adjustment using a geomorphological map 65
Figure 3.8 Kernel density estimate of ken. par for 228 profiles 66
Figure 3.9 Identification of atypical ground coverfrom aerial imagery 69
Figure 3.10 Detailed DGPS derived DEM, with 1.5 times vertical exaggeration, with 2 m contours 70
Figure 3.11 Example (midpoint of profile ST) of the location of the surface characterization plot within the 100 m altitude aerial image 72
- xiii-

Figure 3.12 Example of the location of hydrology plots within the surface characterization plot and mean surface characteristics for each plot (example- CV middle) 73
Figure 3.13 CC- Slope profile form description 77
Figure 3.14 CC- Geomorphological map, illustrating profile location 78
Figure 3.15 CC - 100 m altitude aerial image, showing profile location 79
Figure 3.16 CC- sediment surface photographs (scale in mm) 79
Figure 3.17 CV- Slope characteristics 81
Figure 3.18 CV- Geomorphological map of profile location 82
Figure 3.19 CV- 100 m altitude aerial images. The arrow indicates slope direction and the scale bar = 1 0 m 83
Figure 3.20 CV- sediment surface images (scale in mm) 83
Figure 3.21 ST- Profile characteristics 85
Figure 3.22 ST- Geomorphological map showing profile location 86
Figure 3.23 ST- 100 m altitude aerial images. Arrow points down slope and scale bar= 10 m 87
Figure 3.24 ST- Sediment surface photographs (scale in mm) 87
Figure 3.25 Location of SW1 and SW2 at Marab Swayed 89
Figure 3.26 SW1 -Profile characteristics 90
Figure 3.27 SW2 - Slope profile characteristics 92
Figure 3.28 LandSat TM image of Qa'a al Buqei'wiya, highlighting the location of GW1 and GW2 94
Figure 3.29 Location and extent of profiles GW1 and GW2 at Qa'a al Buqei'wiya 95
Figure 3.30 GW1 -Slope profile characteristics 96
Figure 3.31 GW2- Slope profile characteristics 98
Chapter 4: The characteristics of ground surface form
Figure 4.1 Measurements of surface clasts (after Allison and Higgitt, 1998) 103
Figure 4.2 Image capture apparatus 117
Figure 4.3 Image analysis procedure 119
Figure 4.4 Sample results from image processing 121
Figure 4.5 Triangular theorem image thresholding 122
Figure 4.6 Binary math morphology 123
Figure 4. 7 Measurement precision of the image analysis technique 127
Figure 4.8 Adaptation of Crofts (1974) description of planimetric clast form 128
Figure 4.9 Variation of particle shape and texture with slope- all plots, grouped by plot position 129
Figure 4.10 Kernel density estimate of intermediate axis length (STM) 131
Figure 4.11 Normalized frequency distributions of intermediate axis lengths for all plots, grouped by plot position 132
- xiv-

Figure 4.12 Example of normalized probability distribution of intermediate axis length (profile ST) 134
Figure 4.13 Box plot of the coefficient of variation for all 29 plots, by plot position down-slope (the box represents the interquartile range, intersected by the median, the whiskers show the upper and lower adjacent values, and observed points outside the adjacent values are indicated by dots 135
Figure 4.14 Down-slope variation in ground surface cover as calculated from image analysis and hand-counting techniques (points are connected with a cubic spline to emphasize the nature of down-slope change between methods) 138
Figure 4.15 Relationship between percentage ground surface cover and the standard deviation of ground surface cover at five plot positions down-slope 139
Figure 4.16 Variation in clast shape and texture between basalt types 150
Figure 4.17 Ground surface variation - rectilinear slope profile (ST) 156
Figure 4.18 Ground surface variation- convex slope profile (CV) 158
Figure 4.19 Ground surface cover- concave slope profile (CC) 159
Figure 4.20 The description of two dimensional pattern (after Evans, 1967) 161
Figure 4.21 Down-slope change in R( 1) nearest neighbour value 165
Figure 4.22 Example of Thiessen polygon net (SW1 L) 166
Figure 4.23 Variation of Tvert down-slope- all sites 167
Figure 4.24 Variation of Tvert down-slope- SW1 168
Figure 4.25 Down-slope variation in box fractal dimension 172
Figure 4.26 Clast orientation - all clasts at all sites (n = 21230) 173
Figure 4.27 Kernel density estimate of the persistence of modes in clast major axis orientation - profile CC 175
Chapter 5: Hydrological processes
Figure 5.1 Rainfall simulator design 188
Figure 5.2 Rainfall simulator water pump system 189
Figure 5.3 Experimental plot (left) and plot lip (right). Scale marker is 0.1 m square 191
Figure 5.4 Individual rainstorm events monitored in the northeastern Badia (1 0.01.01 - 20.06.01) 194
Figure 5.5 Drop size distribution from monitored storm events in the northeastern Badia 195
Figure 5.6 Adjustment of runoff to applied rainfall during a 60 mm h'1 rainfall simulation 197
Figure 5. 7 Simulated rainfall hydrograph 199
Figure 5.8 Relationship between drop size D50 and simulated rainfall intensity 199
Figure 5.9 Standing water accumulation (trial experiment) 203
Figure 5.10 Diagrams of various wetting perimeters 206
-XV-

Figure 5.11 Mean runoff, applied rainfall and all individual samples taken at all 27 plots 206
Figure 5.12 Hortonian infiltration regression curves at the 9 experimental sites. Mean infiltration curves have been derived from the three experiments at each plot position. 211
Figure 5.13 Hortonian infiltration regression curves, grouped by plot position 212
Figure 5.14 Relationship between rainfall intensity and mean sediment yield 214
Figure 5.15 Mean runoff hydrographs for straight profile 222
Figure 5.16 Straight slope standardized variables 224
Figure 5.17 Runoff hydrographs for concave profile 227
Figure 5.18 Concave profile - standardized variables 228
Figure 5.19 Runoff hydrographs for the convex slope profile 229
Figure 5.20 Convex profile - standardized variables 233
Chapter 6: Modelling the development of coarse clastic surfaces in arid environments
Figure 6.1 Example model outputs: runs 40, 41, 93 and 115 263
Figure 6.2 Run 1 - Org and Lock, median values connected by a cubic spline 264
Figure 6.3 Expapp model (solid line) and standard exponential model (dashed line) applied to Run 1 265
Figure 6.4 Kernel density estimate of box fractal dimensions for all runs, showing mean and initial condition and box fractal dimensions for the 4 example model outputs 266
Figure 6.5 The variation of y2-Lock, for runs 1 - 30, with cover percentage and clast size 269
Figure 6.6 Variation of k-Lock, with clast size and cover percentage 270
Figure 6.7 Variation of Org with cover percentage, as influenced by clast size 271
Figure 6.8 Box fractal dimension - set 1 273
Figure 6.9 Model output images runs 21 - 30 274
Figure 6.10 Calculation of friction angle 276
Figure 6.11 Influence of angle of friction on y2-Lock 277
Figure 6.12 Changing ratio of friction forces with increased clast size 278
Figure 6.13 K values - rates of change to a stable state under variable friction angles. 279
Figure 6.14 Runs 31 -40 Variable angle of friction, indicated by the arrow for small clasts 280
Figure 6.15 Run set 2- The influence of friction angle on y2-0rg 281
Figure 6.16 Box fractal dimension - Run set 2. 282
Figure 6.17 Variation of final stable state (y2-Lock) with coefficient of variation (left); Relationship between k-Lock and the coefficient of variation (right) 286
Figure 6.18 Expapp curves fitted to small, medium and large clast behaviour- 288
- xvi-

Run 71
Figure 6.19 The relationship between coefficient of variation and y2-0rg, and box fractal dimension 288
Figure 6.20 Final model output runs 67- 72 290
Figure 6.21 Influence of slope angle on Lock- Runs 73- 82. The value of slope value is labeled on each line 293
Figure 6.22 Relationship between slope angle and the rate of change to stable state 294
Figure 6.23 Relationship between slope angle and y2-0rg, small and medium clast sizes 295
Figure 6.24 Output images Run set 4 296
Figure 6.25 The influence of edge weighting and clast size on surface form. Final model output- Run set 5 302
Figure 6.26 Model output images- Run set 6 306
- xvii-

list of P~ates
Chapter 2: The physical environment of the northeast Badia
Plate 2.1 General view of the northeastern Jordanian Badia, showing open coarse clast dominated surfaces 32
Plate 2.2 Isolated volcanic peaks at Qa'a Selma, surrounded by an extensive Qa'a feature 32
Plate 2.3 Carbonate accretions on the undersides of basalt clasts 43
Chapter 3: Site selection, description and sampling
Plate 3.1 Oblique photograph of boulder surface 67
Plate 3.2 Example of a drainage channel vegetation growth 68
Plate 3.3 CC- Oblique photograph of profile 80
Plate 3.4 CC- Example of ground surface cover (example CCM) 80
Plate 3.5 CV- Oblique photograph looking over profile 84
Plate 3.6 CV- Example of ground surface cover (CVM) 84
Plate 3. 7 ST- Oblique photograph looking down profile from crest (pickup in distance for scale) 88
Plate 3.8 ST- Example of ground surface coverage (STM) 88
Plate 3.9 SW1 -Oblique photograph looking across profile, looking west down the Marab Swayed catchment towards Safawi 91
Plate 3.10 SW 1 - Example of ground cover with noticeable non-random clast distributions (SW1 M) 91
Plate 3.11 SW2 - Profile location taken from profile base looking upslope to the crest on the horizon. The Marab floor in the foreground is dominated by coarse sediments. 93
Plate 3.12 SW2- Typical ground surface coverage, showing a high degree of clast rounding (SW2M) 93
Plate 3.13 GW1 - Oblique photograph looking from the crest down the profile, with Qa'a AI Buqui'wiya in the distance. (Monopod camera boom in the foreground for scale) 97
Plate 3.14 GW1 -Example of ground surface cover (GW1 M). Of note is the distinctly non random clast distribution at the lower points of the slope profile 97
Plate 3.15 GW2- Oblique photograph of the toe of profile, monopod camera boom for scale 99
Plate 3.16 GW2- Image showing an example of ground surface coverage (GW2M) 99
Chapter 4: The characteristics of ground surface form
Plate 4.1 Examples of 12 m and 120 m aerial images 112
- xviii-

Plate 4.2 Camera calibration chart for DC240 114
Plate 4.3 Monopod camera boom at Marab Swayed 115
Plate 4.5 The variation of aeolian sediment deposition with increasing distance from the perimeter of Marab Swayed 141
Plate 4.6 Down-slope change in the presence of surface pattern- SW1 169
Plate 4. 7 Pattern at different scales, with different clast sizes 170
Chapter 5: Hydrological processes
Plate 5.1 The rainfall simulator in the Badia
Plate 5.2 Preferential flow pathways, Qa'a AI Buqei'wiya
Chapter 6: Modelling the development of coarse clastic surfaces in arid environments
200
213
Plate 6.1 A non random clast arrangement 243
Plate 6.2 Examples of clast surface structures in the northeastern Badia (all images oriented downslope) 262
- xix-

Symbols are defined where they are introduced. The corresponding SI units are the
kilogram (kg), the metre (m), the litre (I) and the second (s). Some of the more commonly
used symbols are the following:
Field site locations and names
Site name Plot position on slope profile Site code
Concave (CC) { Top CCT Middle CCM Bottom CCB
{ Top CVT Convex (CV) Middle CVM
Bottom CVB
{ Top STT Straight (ST) Middle STM
Bottom STB
Top SW1T Upper SW1U
Swayed, site 1 (SW1) Middle SW1M Lower SW1L Bottom SW1B
Top SW2T Upper SW2U
Swayed, site 2 (SW2) Middle SW2M Lower SW2L Bottom SW2B
Top GW1T Upper GW1U
Qa'a al Buqei'wiya, site 1 (GW1) Middle GW1M Lower GW1L Bottom GW1B
Top GW2T Upper GW2U
Qa'a al Buqei'wiya, site 2 (GW2) Middle GW2M Lower GW2L Bottom GW2B
-XX-

Chapter 4 Notation ~ Surface characte~rization
Variable Type Description
Gcp Ground Percentage clast ground cover(%)
Edge Tot cover Total edge length of all clasts (m) (derived from
Cvb image Coefficient of variation
b analysis plot)
Intermediate axis (m)
ken.par Kennedy parameter
UpslpAngle Mean angle of slope 10 m above plot (degrees)
PltAngle Slope Plot angle (degrees)
PltDist variables Distance of plot from slope crest (m)
Curv Slope curvature (angle of slope 1 Om above plot minus angle of slope 1 Om below plot)
Tvert Standard deviation of number of vertices of Theissen
Spatial polygon network
R(l) analysis Nearest neighbour statistic variables
Fbox Box fractal dimension of exposed sediment area
VolwMb Volume weighted mean intermediate axis (m)
AreawMb Weighted Surface area weighted mean intermediate axis (m) means
EdgewMb Edge length weighted mean intermediate axis (m)
Gcpplot Percentage clast ground cover(%)
Plot statistics
EdgeTotplot (derived from Total clast edge length (m) rainfall
simulation plot Bp lot area) Mean intermediate axis (m)
Time Time into experiment (s)
ucam Uncorrected arithmetic mean intermediate axis
~ Mise. Multiple regression beta statistic
Significance level
Standard deviation
- xxi-

Chapter 5 Notation Q Surface hydro~ogy
Variable
f
e
k
t
Rmean
Rmax
Rtot
Smean
Smax
Tstart
Tmax
Type
Hortonian infiltration
Runoff variables
Sediment variables
} Timings
Description
Infiltration capacity (mm h-1}
Final infiltration rate (mm h-1)
Initial infiltration rate (mm h-1)
Exponential coefficient
Constant
Time (s)
Mean run off (mm h-1)
Maximum runoff recorded (mm h-1)
Total runoff recorded (mm h-1}
Mean sediment yield (g h-1)
Maximum sediment yield recorded (g h-1)
Total sediment delivered (g)
Time to start of runoff (s)
Time to maximum runoff (s)
- xxii-

Chapter 6 Notation g Modelling
Variable
Matsize
Totcl
small rocks
medium rocks
ITmax
Sang le
p(small)
p(medium)
p(large)
Diagonal friction (fdiag)
Description
Width and length of the cellular automata array
Total number of clasts which defines cover percentage when combined with Matsize
} Defines clast size sorting, and number of large clasts when combined with Totcl
Number of iteration steps
Angle of slope
} Probability of clast moving
Friction between diagonal cells, upslope
Double diagonal friction (Dfddiag) Friction between a cell and two diagonal upslope occupied cells
Lateral friction (flat)
Org
Lock
Expapp
k-Lock
y1-Lock
Y2-Lock
k-Org
y1-0rg
y2-0rg
Cvb
N, S, E, W, NE, NW, SE and SW
RMSE
Friction across slope between two cells
} Measures of model behaviour, defined in section 6.5.2
Asymptotic approach to equilibrium model
Rate of change in Expapp for Lock
Estimated initial value of Lock in Expapp
Estimated final value of Lock in Expapp
Rate of change in Expapp for Org
Estimated initial value of Org in Expapp
Estimated final value of Org in Expapp
Coefficient of variation of clast size
Relative cell positions
Root mean squared error
- xxiii-

list of appendices
A CD - ROM accompanies this thesis containing the appendices. The appendices are
constructed in web-page format and are designed to be viewed in a standard web
browser. The CD contains two sections:
1. Raw 12 m altitude images, used in Chapter 4
2. Cellular automata clast surface model, developed in Chapter 6
The pages contain instructions on how to view the images and run the cellular model. To
view the appendices double-click on the Title.html icon in the Appendices folder and follow
the instructions. Click the clast to return to the contents page.
- xxiv-

Chapter 1: Introduction
- 1 -

Chapter 1: Introduction
Chapter 1: Introduction
This thesis is concerned with form, process and the dynamics of evolution of rocky
deserts. Rocky deserts present an intriguing geomorphological situation, combining the
complexity of rock mantled surfaces with the intricacy of desert pavements and the
dynamics of an actively developing drainage system. Our understanding of desert
evolution suffers due to the sporadic nature of formative events and the slow rates of
geomorphic change in arid environments. Landscape evolution continues to pose a series
of elusive problems in geomorphology. The relationship between desert surface
configuration and slope process activity is poorly understood and often hindered by a
deficiency of accurate field data. The surfaces of the northeast Jordanian Badia Desert
present an ideal opportunity to explore a dynamic, complex and intriguing arid
geomorphological setting. The desert surfaces are largely undisturbed, presenting surface
configurations which appear to be the result of a long sustained period of process action.
Subtle links exist between both slope form, the character of the surface rocks and their
configuration, geology and geomorphological context. Linkages are complex, with
evidence of intricate feedbacks and dependencies between form and process. The results
of this thesis, which explores these links, can be used to explore theories of slope
development and apply these to the behaviour of earth surface systems in arid
environments.
The purpose of this research is to develop a comprehensive understanding of the
geomorphology of the desert landscape of the north eastern Badia. No previous study has
attempted to combine a detailed understanding of the spatial variation in surface character
with an assessment of the equally diverse influence of surface process action. A
homeostatic link whereby surface form acts to alter process action and conversely, the
action of processes acts to alter surface form, is suggested below. Peculiar surface
features such as a notable level of spatial organization in the distribution of surface clasts
manifested in clear surface patterns, have not previously been studied or documented.
Previous work has identified the presence of systematic variations in surface character
and linked to slope morphology and geology. This work has as yet failed to explain or link
this variation to formative processes responsible for the modification of the slope surface
character. This study develops a series of highly innovative techniques which precisely
assess the variations in character of the desert surfaces. This is combined by a detailed
and extensive study of surface hydrology as the principal mechanism of surface
modification. When combined with a cellular modelling approach the results of this study
- 2 -

Chapter 1: Introduction
have numerous implications for our understanding of earth surface systems and desert
geomorphology.
1.1 Aims and Objectives
This study has a series of primary research aims:
i. examine the variations in ground surface character and configuration of arid
coarse clastic surfaces;
ii. examine the variation in slope hydrology and process action on arid coarse clastic
surfaces;
iii. explore the linkages between ground surface character, slope profile form and
surface process action;
iv. use a detailed study of slope form and process as a basis for understanding the
temporal development of clast surface organization;
v. apply the results of a model of surface dynamics, to aid the understanding of
surface and landscape development.
To fulfil the aims of this thesis, a series of specific objectives were developed;
i. design an appropriate research framework within which the variation of surface
form and process action can be examined;
ii. develop a method of surface characterization which derives surface measures
which are applicable to both the action of slope processes and surface dynamics;
iii. design a suitable method of quantifying spatial variations in surface hydrology and
the influence of ground surface character on slope process;
iv. develop a stochastic model which simulates the spatial organization and
modification of surfaces, as dictated by the spatial variation in surface character
identified in the field.
- 3 -

Chapter 1: Introduction
1.2 Background and justification of thesis
The study of desert slope processes and slope evolution has been restricted by a
deficiency of accurate data with which to constrain models of landscape evolution (Nash,
2000). The long-term interaction between process and materials on rocky desert surfaces
is poorly understood (Abrahams, et al., 1994), possibly due to the difficulty of access in
such hostile environments. lt is argued that an understanding of many, if not the majority
of geomorphological systems in deserts, must begin with an awareness of slope
processes (Abrahams et al., 1994). Desert surfaces are commonly regarded as highly
sensitive and responsive geomorphic systems from which valuable indicators of
geomorphological activity can be derived (Haft, 2001 ). The sensitivity of desert slope
surfaces to disturbance and the interaction between form and process are of paramount
importance to understanding a desert landscape, no where less than in the north eastern
Badia.
Desert slopes are commonly mantled with a coarse layer of debris or rock fragments that
is either weathered out from the underlying geology, or fallen from a superincumbent rock
face (Abrahams et al., 1994). The form of coarse clastic surfaces is diverse and the
processes acting upon them equally complex. Studies have addressed various aspects of
the geomorphology of coarse clast mantled slopes in arid environments (Abrahams and
Parsons, 1992; Poesen and Lavee, 1994; Allison and Higgitt, 1998). The critical
geomorphological distinction in this study is the absolute size of surface clasts and the
nature of the underlying sediments. The surface clasts are massive relative to the size of
the grains of the underlying sediments, distinguishing them from rock-fragment mantled
surfaces. The second major distinction is the environment within which the surfaces are
found. The climate is arid, with sporadic and infrequent high magnitude formative events,
which have been suggested to hold a significant and unique influence over surface form
and modification (Darn, 1994).
Geomorphological research on coarse clastic surfaces is largely based on three separate
themes: surface characterization (Dunkerley, 1995; Vincent and Sadah, 1995); the study
of slope hydrology and hydraulics (Parsons and Abrahams, 1994 ); and the study of whole
slope evolution (Friend et al., 2001 ). The integration of these themes in the literature is
rarely attempted and is often only tentative. Only a few authors have attempted to
understand the relationship between two-dimensional slope form and ground surface
variation or tried to draw together studies of surface character, process action and two
dimensional slope form development (Brown and Dunkerley, 1996; Allison and Higgitt,
-4-

Chapter 1: Introduction
1998). An overriding consideration which has emerged from previous work is the
complexity and diversity of controls on coarse clastic surface geomorphology. The way in
which the surface is characterized must be appropriate to the objective of the study, a
notion termed adequacy by Dunkerley (1994). A holistic understanding of the slope
surface geomorphology in the northeastern Badia is beyond the scope of this thesis, but a
significant advance to our knowledge of desert geomorphology can be made by
examining the interactions between slope, surface form and the influence of formative
processes on the evolution of this environment.
Several attempts have been made to model the behaviour and development of coarse
clastic surfaces (Ahnert, 1994; Tribe and Church, 1999). Although commonly simplistic,
modelling has been found to generate alternative explanations of geomorphological
features which cannot be described by a conventional reductionist analysis (Harrison,
2001 ). Non-linear behaviour and the development of emergent properties in landscape
are two examples amongst many (Phillips, 1999). The intricacies of the environment
studied in this thesis lend themselves to this alternative approach. With a detailed
understanding of form and process tentative suggestions about surface dynamics and
slope evolution can be made. The data can be applied to explore wider theories of the
behaviour and dynamics of earth surface systems.
1.3 The northeastern Jordanian Badia
The area studied within this thesis is the northeastern Badia desert of Jordan. This
environment, dominated by extensive lava flows of the Harrat Ash-Shaam Basaltic Super
Group, has historically been viewed as a hostile environment. Some refer to the region as
Bilad esh-Shaytan, or the Land of the Devil (Helms, 1981 ). Bender ( 1968) described a
complex series of intercalated basalts of various ages and mineralogies. The lava flows
are comprised of a suite of basalts that have created a complex mosaic of distinct land
surface configurations (AIIison et al., 2000). The basalts emanate from the north in Syria
at Jebel Druz and traverse contemporary boundaries to reach the margins of the Nafudha
Desert 180 km to the south in Saudi Arabia. The region, defined by the limits of the basalt
flows, represents 11,200 km2, which is over 14% of Jordan's land mass (Dutton, 1998).
- 5 -

Chapter 1: Introduction
1.4 Organization of the thesis
The thesis begins with a detailed discussion of the geomorphology of the northeastern
Badia (Chapter 2). Questions with regard to the contemporary geomorphology of the
region are raised, providing a context for the research presented in this thesis.
Chapter 3 describes the sampling methodology used. In a landscape where variations in
surface form are subtle an appropriate method of sample site selection is required. A
nested series of scales upon which the research is based is developed, allowing the
results of plot-based studies to be considered and extrapolated to the wider landscape. A
full description of the sample sites is provided.
Chapter 4 explores the relationships between surface form and slope. A new automated
aerial digital image analysis technique is developed, which generates highly detailed
measures of the in situ character of the surface form. The results generated are found to
perform more favourably than conventional measures of surface form previously used
both in the northeastern Badia and beyond. Relationships which examine the influence of
slope controlled processes, specifically surface hydrology, in modifying the surfaces are
explored. The results generated are considered in the context of whole slope profile.
Chapter 5 presents the first study of slope hydrology on the surfaces of the northeastern
Badia. A series of rainfall simulation experiments have been undertaken which examines
the role of hydrological activity. The results are used to demonstrate the control of local
surface configuration and whole slope profile form on surface hydrology. The data
collected are designed to provide a vital understanding of rainfall partitioning and runoff
generation in the northeastern Badia.
Chapter 6 develops a cellular automata model to understand the spatial modification of
clastic surfaces in arid environments. The surface characterization (Chapter 4) and
experiments on surface hydrology (Chapter 5) identify several features of the landscape
which show non-linear behaviour that cannot be explained by conventional reductionist
approaches. A model, which simulates the movements of surface clasts and the
structures which they form as a self-organizing system is developed. The dynamics of the
surfaces observed in the field are tested against a hypothesis of iterative surface
modification using the model. The results have significant implications for the
understanding of the dominant controls and interactions on coarse clastic desert surfaces.
Additionally, the results are used to assess the value of self-organizing systems as a
geomorphological tool.
- 6 -

Chapter 1: Introduction
Chapter 7 provides a concluding synthesis of the findings of the surface characterization,
surface hydrology and modelling. The original contribution made by this research is
discussed and the advances made to previous research are described. In conclusion
recommendations for further study are made.
1.5 The Jordan Badia Research and Development Programme
The pressure of rapid population growth and the need to develop the more inhospitable
extremes of Jordanian territory, including the northeastern Badia, led to the formation of
the Jordan Badia Research and Development Programme (JBRDP). The programme was
established in 1994, under the aegis of the Higher Council for Science and Technology in
Jordan and the Royal Geographical Society with the Institute of British Geographers in the
UK (Dutton, 1998). The remit of the project is to gain a better understanding of the natural
resources of the northeastern Badia and use this as the basis to guide future sustainable
development to the benefit of the local population. This thesis contributes to ongoing
research into the understanding of the natural environment of the northeastern Badia. The
field research conducted within this thesis was only made possible by the kind assistance
of the JBRDP and the staff at the Safawi Field Centre and in Amman. lt is hoped that the
findings, in addition to their contribution to geomorphology, will be complementary to the
remit of the JBRDP.
- 7 -

Chapter 2: The physical environment of the northeast Badia
- 8 -

Chapter 2: The physical environment of the northeast Badia
Chapter 2: Thie !Physical envoro1111ment of the northeast Badia
Rates of geomorphological change, the subtlety of spatial variations in process-form
relationships and the hostile nature of the Badia environment have resulted in a limited
understanding of the region. Issues arising from previous work fall into three categories.
First, there is a need to quantify the variations in landforms. Second, processes are poorly
understood. Slope hydrology and hydraulic erosion are important in modifying the
landscape but there are limited quantitative measures of activity in the field. Third, the link
between form and process and the evolution of the environment is not well understood.
Several characteristics of the landscape show a subtle link between form, process and
land surface age.
2.1 Field site location
The arid margin of Jordan, termed the Badia, extends from Saudi Arabia in the south to
Syria in the north. The western limit is the Rift Valley Mountains, while to the east is the
border with
environment with little or no permanent vegetation, infrequent precipitation and
intermittent surface water (AIIison et al., 2000). Another commonly used term is Al-ldrisi: a
terrain mantled with stone, steppe and sands (Starky and EI-Daly, 2000). The Badia
region is diverse and can be sub-divided into distinct areas: the Arhd es-Sawwan (the
Lands of Flint) in the west; the ai-Hamad limestone and chert plains in the east; and the
sand flanks of Wadi Rum and the Nafudha Desert to the south (Betts, 1998; Helms,
1981). This study is concerned with the northeast Badia, known locally as the Harrat or
Hauran, meaning rocky lava field. The region is characterized by low undulating hills
which are covered by basalt boulders. The study area encompasses the Harrat basalts,
which fall within the present borders of the Hashemite Kingdom of Jordan, (Figure 2.1 and
Figure 2.2). The environment, dominated by the extensive lava flows of the Harrat Ash
Shaam Basaltic Super Group, or North Arabian Volcanic Province, has historically been
viewed as a hostile environment. Some refer to the region as Bilad esh-Shaytan, or the
Land of the Devil (Helms. 1981 ). Bender (1968) termed the region Nordostjordanische
Deckenbasalte, describing a complex series of intercalated basalts of various ages and
mineralogies. The lava flows are comprised of basalts that have created a complex
mosaic of distinct land surface configurations (AIIison et al., 2000). The basalts emanate
from the north in Syria at Jebel Druz and traverse national boundaries to reach the
- 9 -

Chapter 2: The physical environment of the northeast Badia
margins of the Nafudha Desert, some 180 km to the south in Saudi Arabia, flanking the
Azraq and Sirhan depressions to the west and east respectively. The region, defined by
the limits of the basalt, represents some 11 200 km2, which is over 14% of Jordan's land
mass (Dutton, 1998). Described as an island within the deserts of the apex of Arabia, the
region's harsh terrain has constrained travel (Helms, 1981 ). The Black Barrier has been
seen as a deterrent to passage and also to scholarly study (Baly and Tushingham, 1971;
Helms, 1981).
33°
~Extent of lava fields in Jordan
D Land above 1 OOOm
ISRAEL
32°
Dead Sea
--- Highways
JORDAN
31 °
\ ' (
' )
30°N I ' )
' I
. I .
/ (
' I ' I
,/
' I
I '
I '
.. --·----
37°
SAUDI ARABIA
0 kilometres 100
38° 39°
Figure 2.1 Location of the northeastern Jordanian Badia desert
- 10-

Chapter 2: The physical environment of the northeast Badia
0 50
SYRIA
Jabal al Manasif
~
N
& f
D Pans and Fans ARABIA
Figure 2.2 Detailed location of the Harrat region of the Jordanian Badia
2.2 Geology
At the regional scale the stratigraphy and structure is complex. The surface geology of the
exposed rocks is relatively simple and well understood (Bender, 1968; Tarawneh et al.,
2000) . The Arava Rift and the associated phases of deposition of sedimentary and
igneous rocks have formed a diverse regional geology. The stratigraphy and structure are
closely related. A detailed history of the geological setting of the region is beyond the
scope of this thesis but comprehensive discussions are presented by Bender (1968),
Burden (1959) and Quennell (1951 ). What follows is a brief description of the geological
succession and key periods of geological activity which have had an influence upon the
- 11 -

Chapter 2: The physical environment of the northeast Badia
northeastern Badia and are relevant to this study.
2.2.1 Geological stratigraphy and history
Sedimentary rocks cover most of Jordan, with rock depth increasing to the north and east
where progressively younger sediments are exposed {AIIison et al., 2000). Plutonic and
metamorphic rocks are exposed in the far south of the country (Bender, 197 4 ). The
country represents a transition between distinct geological units. A stratigraphic column of
the geological succession in the northeastern Badia (Figure 2.3) illustrates the range of
exposed deposits across the country and is vital for understanding the context of the
northeastern Badia.
(.)
0 N 0 z w (.)
(.)
0 N 0 en w ~
(.)
0 N 0 w <C _J
<C 0...
z ~ a: CO ~ <C (.) w a: 0...
<80
<20 } Undifferentitated Quaternary ~~g } Pleistocene
:::_....,.~"""'"-""""'-"'-i'"i <50 Pleistocene · Oligocene <60
~...:........~"1 <60 r--~-.::-'"1
40
} Eocene · Palaeocene 25
16 } Palaeocene · Maestrichtian
11 }Maestrichtian · Campanian -5-
.. } ''"""''" • T """""
~ }cooomooioo
~ }l••" ''""""'
~}Triassic 180 }westphalian · Visean
130} - Lower · Middle Cambrian 120
•ro }PP",,,.,.,,;, - Eruptive Rocks
D Fine, medium and coarse sandstone conglomerate
Dolomite
Mar I
Slate, greywacke, epimetamorphic conglomerate
Plutonite, dyke rocks
~ Chert
Figure 2.3 Stratigraphic column for the northeastern Badia
- 12-

Chapter 2: The physical environment of the northeast Badia
Terrestrial sedimentation was limited until the Late Jurassic and early Cretaceous, after
which the Kurnub sandstones were emplaced over the entire area within the Jordanian
borders. The Kurnub sandstones are poorly consolidated exposures of the Nubian type
sandstone, identified by Shaw (194 7) in Wadi Hathira and later further east by Quennell
(1951 ). Gradual marine transgression by the Bitlis Ocean during the Cretaceous, a part of
the Tethys Sea, laid down interbedded limestones and marls, termed the Ajlun series; the
deepest deposits of the Ajlun series beds are found to the northwest. They thin to the
south and to the east. Above the Ajlun series is the Belqa series, a result of constant
sedimentation throughout the Upper Cretaceous, Palaeocene, Eocene and into the
Oligocene. The period of deposition of the Belqa series was characterized by terrestrial
emergence. The period experienced tilting, uplift and the formation of likely peneplanation
surfaces which today slope into the Wadi Sirhan depression (AIIison et al., 2000).
Sedimentation continued from the Mesozoic era into the Cainozoic, with no break in the
sedimentary sequence. Clastic and marine carbonates, comprising marls, limestone and
dolomitic limestone characterize sedimentation from the period. Carbonate deposition
continued into the Tertiary and Quaternary providing the sequences that today form one of
the region's major aquifers.
The most important units in terms of the contemporary geomorphology of the northeast
Badia are the Late Tertiary and Early Quaternary Lava fields of the Harrat (Guba and
Mustafa, 1988). The deposition of lavas occurred in two dominant periods. The first phase
bridged the Late Oligocene and Early Miocene. The lava flows of this period were
intrusions of transitional to theolitic basalts. The second, more extensive, period produced
many of the expansive lava fields present today. The basalts are mildly to strongly alkaline
and responsible for much of the topography (Tarawneh et al., 2000). The stratigraphy of
the Badia has various geomorphological implications. The proximity of unconsolidated
sedimentary deposits presents an extensive source of aeolian material. Of note are the
Hammada to the east and northwest and the Nafudha Desert to the south. Second, the
stratigraphy supports aquifers which can influence the surface hydrology and hence
geomorphology. Third, and most importantly, the basalt lava fields dominate the landforms
of the region.
2.2.2 Structural geology
The structure of Jordan is dominated by the Dead Sea Rift System (Quennell, 1956,
1984 ). The influence of the plate boundary propagates beyond the limit of the rift valley
itself (Burdon, 1959). There have been two main periods of structural instability. First, a
- 13-

Chapter 2: The physical environment of the northeast Badia
northerly displacement of 62 km during the early Miocene, and then a second, movement
of 45 km during the late Pliestocene (Burdon, 1959), identified by Quennell (1951) from
the lateral displacement of wadi incisions. Palaeomagnetic data confirms this two-stage
movement of the Arabian plate and the subsequent vulcanicity seen in the Harrat (Barberi
et al., 1979). There is some debate about the timing and magnitude of the movements
(Burdon, 1959) but the influence of the rifting dominates the regional structural geology.
Large scale rifting and the associated sinistral strike slip faulting which developed on the
eastern flanks of the rift valley are central to understanding the evolution of the basalt
surfaces of the Harrat.
The Oligocene witnessed uplift followed by tilting of marine sediments to the east.
Drainage has since rejuvenated, feeding both west into the Jordan Valley and east into
the Wadi Sirhan depression. Each successive downward movement and opening of the
rift system has adjusted the river base level, capturing drainage systems that previously
fed Wadi Sirhan and the EI-Jafr Basin (Beheiry, 1969). Lateral faulting is apparent,
oriented away from the Jordan Valley east into the Badia. East to west faults are traceable
for distances of up to 50 km, and north to south striking slip fracture zones are present
(Quennell, 1984). Faults channel dyke intrusions which act as conduits for igneous
material. Fault sets tend to focus volcanism and concentrate the development of dykes
into linear features. Dominant fault directions are east-to-west, northwest to southeast and
east-north-east to west-south-west. Though vertical displacement is not pronounced,
present day drainage patterns are controlled by geological structure (Guba and Mustafa,
1988). The basalts of the Badia not only comprise flood basalts which emanate directly
from the Druz complex in Syria, but also locally extruded dykes sills and volcanic cones
(Figure 2.4).
- 14-

Chapter 2: The physical environment of the northeast Badia
-- I ---- I' ------
,/'
I /
) ,,/
.------/"
- - - - - - Basalt extent
----------- Volcanic fissures
---Faults
Figure 2.4 Structural Geology of Jordan (after Quennell, 1958)
2.2.3 The Harrat Ash-Shaam Super Group
Moffat ( 1988) has shown that there were extensive extrusive basaltic eruptions throughout
Syria and northern Jordan from as early as 13.7 ± 0. 7 Ma. Activity continued to less than
0.1 Ma. Carbon-14 dating of organics found within recent basalts places minor events to
less than 4000 years B.P. at Jebel Druz (De Vries and Barendsen, 1954). The plateau
upon which the flows have been laid is bounded to the west by the Golan, which stretches
eastwards to the southern edge of the Damascus Basin. Bender (1968) proposed a
chronology of basalt emplacement in the region. The initial flows originated from fissures
and are alkali olivine in nature. The resulting deposits were thin and horizontally bedded.
Later flows were more viscous and are responsible for the present day local relief
emanating from the dominant south-southeast to north-northwest striking faults (340°), at
- 15-

Chapter 2: The physical environment of the northeast Badia
an angle normal to the south Palmyra zone of faulting (Quennell, 1984 ).
The resulting wedge of basalt is some 1500 m thick in southern Syria and gradually
reduces in depth as it flanks the eastern margin of the Sirhan depression in Saudi Arabia.
Quennell (1984) suggests the loading inferred by the basalt would have been
considerable and may have encouraged under-thrusting. Various attempts to create a
chronosequence of basalt flow emplacement have been made (van der Boom and
Suwwan, 1966; Bender, 1968; Quennell, 1984; Guba and Mustafa, 1988; lbrahim, 1993;
Tarawneh et al., 2000; llani et al., 2001 ). The formation comprises a complicated series of
discrete flows, each with a distinct mineralogy. A summary of these studies shows a
complex series of groups and subgroups of flows (Table 2.1 ). In the field further
differentiation between the surface characteristics of individual flows within one basalt
type is apparent.
eo- "C CO Q) 0
Cl) Ol~ ·.: ...... Q)~ Cl)
Cl ....;c:O c. fO ros:o iij ... :g~~ c( -~ I :2: ro " Cl
~ ,_f-(ii 0 QJ"O 0 ;!::: c Cl) ~ ro (!)
Formation (after Tarawneh et al., 2000)
~ 0.1 -1.45 Ma ro
E Fadha Vesicular Basalt (FA) Bishriyya (BY) B6/5 Q)
-ro ::J a Wadi Manasif Basalt (WMF) B6
Aritayn Volcaniclasics (AT) Rimah (RH) Bt 2.01 - 2.94 Ma
Hassan Scoriaceous (HN) Bt ---------···-- ---------- ·---- --
Q) c Q) (.) 0
Mahadda Basalt (M) As far B5 1.96-3.41 Ma
~ Madhala olivine Pyric Basalt (MOB) B5/4
Hasimyya Aphanitic Basalt (HAB) B5 ~ ro :e Q)
Ushayib Olivinv Pyroxene Pyric Basalt (UB) B5 f-Q)
-ro ::=!..
Ufayhim Xenolithic Basalt B6/5
Q)
Salaman Flood Basalt (SN) Safawi (SW) B5/4 8.45-9.3 Ma c Q) Ol 0 Q)
Abed Olivine Pyric Basalt (AOB) B5 z Q) c Q) (.)
.Q Ali Doleritic Trachy1ic Basalt (AI) B5
0::
Continental I Marine Sedimentation
Quirma Calcareous Sandstone Formation (QCS) tt4
Wisad (WD) B4 9.37-10.53 Ma
Table 2.1 A summary of the Harrat Ash-Shaam Super Group of basalts (after Tarawneh et al., 2000)
- 16-

Chapter 2: The physical environment of the northeast Badia
Today the basalts retain the lateral extent of their original emplacement. Flows lineate
around fault systems and create dendritic and lobate forms where they pinch out (Figure
2.5). The basalt surface cover is continuous, interrupted in the landscape by wash and
aeolian sediment deposits in topographic lows and lower reaches of drainage networks.
Basalts can be differentiated both through petrology and age but also surface character
and appearance on the ground (Saffarini et al., 1985; Allison et al., 2000) and from
remotely sensed imagery (Tansey, 2000). The basalts exposed at the surface comprise
basic lava flows, dyke systems, pyroclasts, and volcanic centres, including shield and
strata-volcanoes, fissure effusions, chains of volcanoes, maars, tuff pipes and flood lava
(Bender, 1958; lbrahim, 1993; Tarawneh et al., 2000).
The research presented in this thesis considers a selection of basalts which are chosen
on the diversity in surface character and slope form variation. The geological
characteristics of the basalts are in part responsible for their present day surface form.
The selected basalts have a range of ages (8.9 Ma to less than 0.1 Ma) and a range of
mineral compositions. The basalts under consideration in this study are the Abed,
Madhala and Bishriyya, in addition to the previously studied Salaman and Scoriaceous
deposits (Table 2.2).
D Tertiary sediments, mainly marts and limestones
D Recent alluvial deposits, sands, gravels etc.
• Cretacious limestones
• Quaternary pelitic sediments
I I Miocene basalt flows (neogene)
Ill;; Pliocene basalt llows (neogene)
• Quaternary tufts
m Quaternary basal flows
~Dykes
Figure 2.5 Map of the geology of the study area
N
f ktlometres 50
- 17-

Basalt Age
Abed 8.9Ma
Salaman 8.45 Ma
Chapter 2: The physical environment of the northeast Badia
Characteristics
Olivine picric mineralogy. Large angular boulder with b-axis 0.3 m
- 0.4 m underlain by loose orange fine sediments. Mineralogy is
principally olivine phyric, holocystalline, porphyritic and typically
microvesicular in texture. Minerals include olivine, plagioclase and
pyroxene, apatite and zircon.
Extensive but thin flood basalt. Surface dominated by small basalt
clasts interspersed by a few larger clasts. Virtually no exposed
sediments. Highly weathered. Fine grained holocrystalline with
porphyritic and amygdloidal textures. Very similar mineralogy to
Abed
Madhala 1.96-3.41 Ma
Olivine picric. Medium sized clasts, with sediments exposed
between fragments. A fine to medium grained melancratic,
vesicular-amygdaloidal, porphyritic basaltic lava. Mineralogy is
comprised mainly of microphenocrysts with some iddingsite and
serpentine.
Bishriyya
Scoriaceous
deposits
0.1-1.45Ma
< 0.5 Ma
Large ridge of intact vesicular bedrock. Surface are dominated by
large clasts with spaces occupied by smaller, more angular clasts.
Comprised of olivine phenocrysts and plahioclase, with trachytic
and variolitic textures.
Found around the more recent volcanic cones. Highly vesicular
basalt of olivine iddingsite phyric composition olivine.
Table 2.2 Basalt types and mineral properties (after Tarawneh et al., 2000)
2.3 Climate
2.3.1 Regional Climate
Jordan represents a zone of transition between the diverse environments of the arid
interior of the Arabian Peninsula, and the eastern Mediterranean. The region is
characterized between Saharan-Arabian and Syrian Steppe (Dutton, 1998). In Koppen's
classification the region is represented as BWhs and BShs (Lamb, 1972), where 8 is dry
climate, BS is steppe, BW desert, dry season in summer, and h dry and hot with mean
annual temperatures over 1 0°C. The moisture scale in the area is considered semi-arid to
arid, with temperatures commonly in excess of 38°C, mirrored by equally large diurnal
temperature variability.
- 18-

Chapter 2: The physical environment of the northeast Badia
Seasonal variations in the climate of the region are attributed to large scale meteorological
fluctuations, dictated by the seasonal geographic displacement of weather systems
(Wigley and Farmer, 1982). The wet winter season is characterised by cyclonic
disturbance and low pressure over the Mediterranean. Higher pressures further east
associated with the Siberian high dominate climatic patterns via a shift in the Polar Front
Jet stream allowing the transport of cold air to the region (Perry, 1981). During the spring
the Subtropical Jet Stream migrates north from the Tropic of Cancer. This pushes
associated cold air masses into the region, reducing precipitation. During winter and
spring 'Cyprus Lows' dominate precipitation characteristics over the north Arabian
peninsular (Krown, 1966; Lamb, 1968). Generally, if subsident conditions persist over
Cyprus, then dry winter conditions prevail over the Middle East but if cyclonic conditions
move east, westerlies predominate and precipitation occurs. Orographic effects are of
particular importance under these conditions (FAO, 1962).
During early summer the influence of the Polar Front and its associated westerlies is
negligible. The influence of sub-tropical ridges of high pressure becomes dominant.
Convergence of strengthening easterly jet streams is associated with upper air
convergence causing widespread subsidence across the Middle Eastern desert areas.
The summer and winter months are considered to have stable climatic conditions but it is
the transitional months where significant variation in climate between years is seen. The
spring and autumn months are the periods of the year which experience high magnitude
storm-events (Perry, 1981).
The region experiences a marked precipitation gradient (Dottridge, 1998). Rainfall
decreases from west to east and also from north to south. The east - west gradient is
attributable to increasing penetration into the arid Arabian interior, combined with the
adiabatic heating of moist westerly air on the lee of slopes bounding the eastern flank of
the Jordan Valley. The north - south transition is tied directly to the track of depressions
from the Mediterranean (Shehadeh, 1985).
The region is characterized by both large scale high velocity winds and low magnitude
daily variations which operate at a more local scale. Large scale events have a significant
geomorphological influence across the region. The Khamseen, for example, transports
large quantities of sediments (Yaalon and Ganor, 1979). Khamseen depressions arise
along the lntertropical Front, originating as Sudanese Depressions, which are then carried
to the coast of the Mediterranean by westerlies. In May and June the depressions tend to
follow a path north of Nigeria to Lower Egypt and, if they are strong enough, will continue
up into the Syrian Desert (Dubief, 1979). Yaalon and Ganor (1979) in a survey of dust
storms in Jerusalem noted a dominant source direction of 270° and high wind speeds of
- 19-

Chapter 2: The physical environment of the northeast Badia
up to 60 km h-1. Dust storms have high particulate concentrations of up to 10 tonnes km-3
,
visibilities of less than 300 m and a spatial cover of over 5 000 km2. The duration of such
storms can be up to 50 h. Mineral analysis found that the sediments could be traced back
to the weathering environments of the Sahara. Over 80% of the storms surveyed in
Jerusalem were sourced to a southwesterly origin. Many other authors have found similar
magnitudes of dust concentration in the region (Dan and Yaalon, 1966; Dubief, 1979;
Ganor and Mamane, 1982; Jones et al., 1986).
Easterly winds are rare (Yaalon and Ginzbourg, 1966). Easterlies with velocities of 56 km
h-1 have been measured, with visibility as low as a few metres. Yaalon and Ginzbourg
(1966) concluded that the easterlies are responsible for the movement of large amounts of
material over small distances. There has been no attempt to investigate the influence of
aeolian transport or erosion of sediments in the northeastern Badia. Analysis of sediments
in topographic lows in the northeastern Badia indicates high levels of carbonates and
other exogenously derived material.
2.3.2 Climate of the study site
High-resolution data for the period August 1994 to the summer of 1996 collected in the
northeastern Badia echoes the temporal pattern of climatic variations on the regional
scale (Kirk, 1997) (Table 2.3). Both large seasonal and large diurnal temperature ranges
are apparent. Temperature has a profound influence on moisture and weathering regimes
and is therefore of importance to considerations of the long-term weathering of the
surfaces of the northeastern Badia.
Diurnal temperature range
Time of lowest hourly temperatures
Highest standard deviation in mean daily temperatures
Lowest standard deviation in mean daily temperatures
Highest recorded temperature
Lowest recorded temperature
4 am to 6 am
December to January (3 to 4 °C)
Table 2.3 Temperature characteristics of the northeastern Badia (after Kirk, 1997)
Rainfall in the northeastern Badia region is directly related to altitude and distance from
-20-

Chapter 2: The physical environment of the northeast Badia
the slopes of Jebel Druz (Kirk, 1997). Long-term monitoring since the 1960s indicates a
general decrease in the total amount of rainfall but also pronounced annual fluctuations in
rainfall totals. The standard deviation at three of the most consistent monitoring stations is
in excess of 45% of the mean, though the deviation has tended to reduce in recent years.
Orographic effects reduce local scale variability (Kirk, 1997). At sites further from the
Jebel Druz foot-slopes, variability in rainfall is less and rainfall totals are more constant
attributed to the stabilizing effect of the increased proximity to these sites of the arid
interior (Dottridge, 1998) (Figure 2.6). Sites in the north and west of the study area, for
example Umm EI-Quttayn and Dayr EI-Kahf, have high annual rainfalls of 113 mm and
112 mm respectively. Sites further east and south, for example those at Safawi and
Azraq, have significantly lower mean annual rainfalls of 76.1 mm and 67.3 mm
respectively.
N
f 0 kilometres
ISRAEL
Jerusalem •
100
SYRIA
"' ... ....--_.,..,. ... ~ ..
-.,., .. _.,..,. .. ,.-
·,, SAUDI ARABIA '\ ·, .,
·, ., J 0 R D AN ·,,
./ .. -- .. ----- ... /'
I I
/
I -· . _____ .. -
-·
'\ '.> Precipitation (millimetres)
/.
,,..,· D <50
I ; !WJso -1oo
~ 100-150
D 1so-2oo
D 2oo-2so
D 2so-soo
• >500
- 21 -

Chapter 2: The physical environment of the northeast Badia
Figure 2.6 Distribution of rainfall across the Badia
Evaporation potential across the region is large, ranging from an annual rate of 1 800 mm
a·1 to 2 000 mm a·1, resulting in an annual excess of evaporation over rainfall. High
magnitude individual storms reverse this general trend. In extreme cases (Kirk, 1997),
(Figure 2. 7) the result is overland flow generation.
20
15 -;;;-~ a; E
E c: ·~ 10
c: .'2 <ii 0 Cl_
"' > w
5
0
Augus1 Sep1ember
-.--------- Evapora1ion
--- Rainfall
-· .. : ' .\ : ~ : \/ .. \
~ . ' ' ... • 1\ ... . ' ..... . . . .. .
If I I . . . --
Oc1ober
. ..
Figure 2.7 Total daily evaporation versus rainfall (1994)
.
There is a seasonal change in rainfall. The highest-magnitude events occur during the
spring and autumn months. The remainder of the wet season is dominated by high
frequency, low-magnitude rainfall events, amounting to longer periods of drizzle with
hourly rainfall totals of less than 0.5 mm h-1. High-magnitude events are infrequent and
localized and hence data is sparse. lntensities have been measured up to 60 mm h-1 (17th
January, 1994). Storms rarely last for more than 20 to 30 minutes. Cellular convective
storms produce highly localized, high-intensity rainfall. Data shows that the nature of
storms is random, both spatially and temporally (Kirk, 1998). The drop size and kinetic
energy of rainfall are important for considering the nature of formative events and the
importance of antecedent conditions between rainfall events.
Desiccating winds add to the harsh nature of the Badia environment (AIIison et al., 2000).
Although the region is seen to receive winds from all directions, there are distinct and
consistent patterns with both daily and seasonal variability operating over a distinct
-22-

Chapter 2: The physical environment of the northeast Badia
seasonal split (Kirk, 1997}. In the summer months the dominant wind direction is
northeasterly, with highest velocities during the evening and night. A significant shift in
direction to the northwest follows early morning temperature rises, usually via the north
but sometimes via the south (Kirk, 1997). During the winter the wind pattern is
considerably different. Nocturnal winds are predominantly from the east and south and
only occasionally from the north or west. Daytime temperature rises results in a shift, via
the south such that the midday winds are from the south and southwest, which shifts back
via the south during the evening. As with temperature, the transitional intervening months
experience a combination of often erratic nature of the winter and summer conditions.
Wind direction during rainstorm events is often from the northwest (318°), showing the
influence of the Mediterranean weather systems on the region's climate. Wind direction is
also seen to have a significant control the contribution of aeolian sediment supply and
deposition, with diverse sediment source areas surrounding the region. Wind speeds are
highly variable and therefore difficult to generalize, even using data at 1 h resolution (Kirk,
1997).
Topographic factors affecting climate are not well understood. The proximity of the
massive Arava Rift valley to the west of the study site may act to complicate the
topographic controls on local climate. Models of the influence of steep sided valleys on
airflow suggest the wind direction can be significantly altered by pressure perturbations
induced by the valley topography (Bullard et al., 2000). The influence of
thermotopographic anabatic and katabatic winds are also of particular importance, given
the dominating slopes and regional temperature gradients associated with Jebel Druz to
the north in Syria (Thorson and Bender, 1985). Prevailing winds have also been observed
to be channelled by drainage networks in the field, often transporting sediments back up
into the catchment. More locally, the distinct surface character of the basalt flows, both in
terms of roughness and albedo may be significant in locally affecting wind regimes. The
variable roughness of surfaces in arid environments has been established elsewhere
(Goudie et al., 1999). Evidence of the local control of surface geomorphology is seen
through the formation and persistence of dust devils above the reflective Qa'a surfaces,
but their instantaneous collapse when they traverse clast dominated surfaces (Cooke et
al., 1993). Dust devils are a common phenomenon in the northeastern Badia.
2.3.3 Climate change
There is no continuous record of climatic variability but cautious inferences can be made
from studies undertaken in neighbouring areas. Over the time-scale of the emplacement
of the basalts there were periods of wetter and drier climate (Shehaded, 1985). In a
comprehensive summary of regional climate change, Roberts (1982) was only able to
-23-

Chapter 2: The physical environment of the northeast Badia
identify 152 Carbon-14 dates, from the Levant, Iran, Greece, Turkey, Arabian, Egypt,
Sudan and the Caucuses. The dates closest to the northeastern Badia region were
collected in the Jordan Valley which, due to its tectonic setting, should be considered an
anomaly (Neev and Emery, 1967). Archaeological evidence suggests that the area has
been regularly populated since prehistory (Garrard et al., 1975). Rain fed agriculture
struggles in the present climatic conditions.
Numerous studies in the region have examined climatic change through various
approaches. The link between the climate of the northern Arabian Peninsula and
Mediterranean Basin has allowed several authors to extrapolate between regions.
Advances in techniques, such as thermoluminescence dating, have allowed the study of
climate change in, for example, sedimentary features and archaeological sites (Grove,
2000; Mercier and Valladas, 1994; Valladas, 1992). The intensity of geomorphic activity
varies with climate. A series of studies have been undertaken in and around the region
which have examined the nature of climatic variability during the Holocene (Table 2.4). A
tentative suggestion which accumulates work from around the region into a picture of
variable geomorphic activity during the Holocene is made in Table 2.5. Table 2.4
demonstrates periods of both increased and decreased geomorphic activity relative to the
conditions experienced today. The variation in geomorphic activity has many implications
for the understanding of the nature of landforms in the region.
-24-

Author
Carmi et al. (1971)
lsaar and Briuns (1983)
Briuns and Yaalon (1979)
Thiede (1978)
Moeyersons et al. (1999)
Abed and Yaghan (2000)
Touchan and Hughes (1999)
Neev and Emery (1967)
Butzer (1958)
Chapter 2: The physical environment of the northeast Badia
Nature of study Principal findings
Study of silt and clast sequences in marsh Dating of deposits to 20 ka suggests considerable reduction in water supply
deposits in the Sinai at Wadi Feiran, in the area.
Combined study of aquifer geochemistry and Multi annual period of drought, followed by period of higher humidity.
changes in pluvial-aeolian deposition
Study of the origin of the Neviot series loess in Alternating periods of moister and drier conditions in the Upper Pleistocene
the southern Negev and Sinai and Holocene. Deposits similar in character to those of the present day
Khamseen
Study of planktonic foraminiferal faunas and Increased summer and winter sea surface temperatures - at the last glacial
water temperatures on the Levantine coast maximum at approximately 18°C and 25 °C
Sedimentation in karstic shafts in eastern Egypt A humid phase. or at least less arid phase in the first half of the Holocene
Lisan Pleistocene lake sediments in the Jordan Cole dry climate during the Last Glacial Maximum. Similarities between
valley
Dendrochronology at sites around Jordan
Dating of the Dead Sea valley floor
findings and the monsoon conditions which affected North African Sahara,
Arabia and South East Asia - a good possibility of monsoon rain reaching
the interior of the southern Levant (p. 31)
Short 3 to 4 year periods of drought
Distinct wetter and warmer conditions 17 ka - 10 ka, but complicated by
the dynamics of valley rifting and down-faulting
Combined study of historical, archaeological and Derives sequence of wet and dry periods, and relates finding to variables
geomorphological sources rainfall
Hukriede and Wiesemann (1968) Study of calcareous sediments at El Jafr, central Date of sedimentation phase to 27.7 ± 0.870 ka, corresponding to the
Jordan Badia middle of the Late Pleistocene Glacial
Kaiser et al. (1973) Damascus Basin- stratigraphic study Last glacial maximum dominated by a cold dry climate
Goodfriend and Magoritz (1988) Damascus Basin- study of pedogenic carbonate Last glacial maximum dominated by a cold dry climate
nodules
Table 2.4 Studies into Holocene climatic change in the field area and surrounding region

ro '6 ro
CO -en ro <I> .s::. t 0 c <I> £ ._ 0
c <I> E c 0 ...... ·:;; c <I>
-ro (.) ·u; >. .s::. 0. <I> .s::. I-N ...... 2 0. ro .s::. u
I 0 0 M ...
0 0 N ...... I
0 If) 00 N
0 If) 00 N I
0 0
~
O' 0
"' "' I 0 0 0
" 0 0 0
" I 0 0 00 00
0 0 00 00 I
0 0 If) 0 ...
0 0 0 N ...
0 0
~ ...
Short term fluctuations with average rainfall higher than present. Cold spells caused the Black Sea and Nile to freeze (1 ,000 B.P). The last century has seen a marked climatic deterioration, with rainfall decrease of between 1 and 15 %, a fall in lake levels and a decrease in the volume of the Nile.
Similar rainfall as today, but characterised by marked small fluctuations. Periods of higher humidity occurred around 1,800 and 1,500 B.P., but were opposed by drought conditions, notably around 1,400 B.P.
Decrease in precipitation during the 5th millennium B.P. led in to a long period of variable climatic conditions. Average rainfall slightly less than that of today, interrupted by one distinct moist spell around 3,200 B.P.
The Neolithic moist period. Higher rainfall than at present, in addition to higher local temperatures. If evaporation was correspondingly high then conditions were effectively Pluvial. There were notable sudden decreases in rainfall shortly after 5,600 and 4850 B. P.
Markedly more precipitation throughout this period.
A humid relapse associated with the last glacial advance and temperatures increased. Rainfall conditions were typically less than those of the present.
A period of increased precipitation, witnessed a readvance of the ultimately disappearing Pleistocene glaciers, with lower temperatures to at least as far south as 33°N.
Period following the close of the Pleistocene wet period. Aeolian processes dominant. Temperatures and rainfall lower than at present, reaching a minimum at around 14000 B.P.
c: 0
u:O:: ·- Q. -·-111 ... E ~ :.: Q)
U"C
en c 0
I :-e
I "0 <)--1 c
0 (.)
c <I> en <I> ...... 0..
o....{> I I I I
I
'--i>
<}---;
<l----1 I I I
~ I
I I I
<1-'
......
I
I> I I
<I> ...... -<I> lll 5: ...... 0 ~_J
~ ·s: ·;:::
<.I os <.I
:a e-0 e 0
>- ~ - Q.() ·s: ~ :0::: .~ CJ ... IV os
'il 'jij .. CJ 'tl C) = 0 os
~ 0 Q.() ..c = Q. os ... .c 0 <.I
E ~ ... 0 os Q) e
(!) ;.:= <.I ~
= ~ <.I
.Si 0
::c 1.1')
N .£ .c os
E-<

Chapter 2: The physical environment of the northeast Badia
The effects of climate variations can be considered in terms of the geomorphology of the
northeastern Badia. Oberlander's (1972) study of similar basalt surfaces in the Mojave
Desert, California, suggested that the geomorphology of rock-mantled slopes may well
present relic features of a previous climate. Dating of sediment deposits, combined with
the summary of recent regional climatic variations, suggests that during the recent past
rates of geomorphological change may have been higher than at present.
Grove (2000), in a preliminary study into the palaeo-environmental change in the
northeastern Badia, used detailed stratigraphy calibrated with thermoluminescence dating
through a core of in-washed sediment pan (Qa'a) deposits. Coarse inter-bedded clastic
deposits and fining-up sequences were noted throughout the 4 m of the stratigraphy. The
date at the base of the Qa'a, at the contact with the underlying bedrock, was 18 ka. No
clear periodicity in sediment deposition was noted from the section, reflecting the sporadic
nature of formative events. Process action at or shortly after the last glacial maximum may
have been of sufficient magnitude that all previously in-washed sediments were removed.
If this is the case it may be reasonable to assume that such an intensity of processes
would also be capable of significantly altering the surfaces of any previous climatic
controlled ground surface configuration. Any variation in surface configuration may be a
reflection of process action since the last glacial maximum and not as a direct time
dependant change incurred by basalt age, as proposed by Allison and Higgitt (1998). This
may explain the poor relationship between surface configuration and basalt age.
2.4 Geomorphology
The present day geomorphology must be examined within the context of recent and long
term climatic fluctuations (AIIison et al., 2000). For example, warmer and moister climes
may have encouraged a more active weathering regime (Bull, 1991 ). Desiccation of
exposed basalt and additional moisture in the soil would have promoted accelerated rates
of bedrock weathering. Ghost stones and deep-rooted weathering profiles in the field are
potential evidence of this (AIIison et al., 1993). The discussion here focuses first on
topography, then defines a geomorphological classification of the region and finally goes
on to examine slope forms and soils.
2.4.1 Topography
Topographically the region is characterized by low undulating, rounded hills. Local relief
-27-

Chapter 2: The physical environment of the northeast Badia
ranges from 7 m to 50 m. Relief appears to be linked to the age and lateral extent of the
basalt flows (AIIison and Higgitt, 1998). Elevation differences across the basalt plateau are
pronounced, ranging from 1200 m above sea level in the north on the foot slopes of Jebel
Druz, with a decline in absolute relief to less than 400 m above sea level on the Saudi
Arabian border in the south. Isolated volcanic centres such as Jebel AI-Arityan (32° 05' N
36° 52') form localized topographic highs up to 100 m above the surrounding ground.
Landsat TM images show the lineation of such peaks along structural faults and fissures
(Figure 2.8). The undulation of the present ground surface is a reflection of the initial form
of the coalesced basalt flows and the subsequent evolution of drainage networks.
Development of wadi, networks which feed into topographic closed depressions, is directly
related to basalt age. Greater levels of connectivity, local relief differences and
sedimentation occur on the older basalts, again a feature which can be identified from the
Landsat TM image (Figure 2.8). The north - south relief difference dictates drainage. Wadi
Rajil rises in the Syrian hills and flows through Jordan, often being directed by basalt
levees parallel to the margins of contiguous lava flows, whose route is structurally
dictated.
- 28-

Chapter 2: The physical environment of the northeast Badia
Figure 2.8 LandSat TM- Safawi- and surrounding area of northeastern Badia- Bands 7, 4, 2; path 173, Row 32.12N, Date 29.03.92 (Huntings Technical Services)

Chapter 2: The physical environment of the northeast Badia
2.4.2 Geomorphological classification
Geomorphologically the landscape can be split into two fundamental units: the slopes and
the sediment deposits in topographic lows (AIIison and Higgitt, 1998). The whole
landscape can be further sub-divided into a number of geomorphological units (Figure
2.9).
Slopes are dominated by a coarse, clastic boulder cover. For the purposes of this study,
basalt surface blocks are referred to as clasts and the underlying fines are termed
sediments. The surfaces present an open matrix with large, well varnished, rounded clasts
(Plate 2.1 and Plate 2.2). The undersides of clasts are commonly clad with a saucer
shaped carbonate accretion. In places clasts are covered with lichens but there is a clear
gradient in the abundance of lichens based on topography and rainfall. Lichens locally
have an orientation bias to the north facing sides of clasts. The variation in the
configuration of clasts on the surface is complex (AIIison and Higgitt, 1998). Variations
occur with slope, basalt type, and position within the drainage network. The sizes, degree
of rounding, burial and sorting of clasts all vary systematically (AIIison et al., 2000).
Additionally, the surfaces often exhibit a distinctly non-random clast distribution. There has
been no attempt to link the nature of the spatial character of the clasts on the surfaces to
basalt type, slope, ground surface cover, or process activity. Closed topographic
depressions are in-filled by sediments.
-30-

Chapter 2: The physical environment of the northeast Badia
Exposed bedrock outcrop Sediments overlain by basalt clasts
Spatial structure in clast arrangement Weathered bedrock
Low slooe anoles
Flow path ways devoid of clasts
___..--r-- Variable sediment thickness
Variable exposure of surface clasts
Evidence of overland flow
Basalt clasts within sediment profile Layered sediments in topographic lows
Figure 2.9 Block diagram of the geomorphological attributes of the basalt flow surface of the northeastern Badia

Chapter 2: The physical environment of the northeast Badia
Plate 2.1 General view of the northeastern Jordanian Badia, showing open coarse clast dominated surfaces
Plate 2.2 Isolated volcanic dyke ridge at Qa'a Selma, surrounded by an extensive Qa'a feature
- 32-

Chapter 2: The physical environment of the northeast Badia
2.4.3 Siope forms
The northeastern Badia has a range of slope profile configurations, which have been
linked to geological controls (AIIison and Higgitt, 1998). lt has previously been suggested
that profile form is related to the development of drainage network connectivity and lava
ridge denudation (AIIison et al., 2000). Slope forms are thought to represent a continuum,
from concave to convex slopes with increasing maturity (AIIison and Higgitt, 1998). The
younger flows show concave slope form. Bishriyya basalts comprise distinct vertical
accretions of lava in ridges and sills (Figure 2.1 0). The Scoriaceous lavas, which
represent the youngest deposits, form cone structures with highly concave slopes. The
oldest flows of the Madhala and the Abed show more convex profiles. In the context of the
overall plateau, slope form changes are associated with lave ridge denudation and the
drainage evolution. The rapid weathering of young basalts, the removal of material from
steep slope sections and the successive downcutting due to drainage incision contribute
to this variation in form. Examples of the profiles surveyed by Allison and Higgitt (1998)
are shown in Figure 2.1 0.
Figure 2.10 Slope profiles measured in the eastern Badia (after Allison and Higgitt, 1998)
E :- 40 .c Ol Q) 30 I
20
10
0 0 100 200 300
Distance (m)
400 500 600
A: Abed basalt; B: Madhala basalt; C: Bishriyya basalt; D: Scouracious materials and remnant volcanic cones
The profiles surveyed by Alii son and Higgitt ( 1998) had their toe positions located in a
range of drainage features including wadis, Qa'a and Marab. There was no differentiation
between profiles at different points in a drainage network. No work has been undertaken
to assess the degree to which drainage development and the position of the slope profile
-33-

Chapter 2: The physical environment of the northeast Badia
within a drainage network relates to slope form. Slope profile form acts as a critical control
on dictating whole slope dynamics. With such a pronounced diversity in profile forms the
resulting slope hydrology is likely to be equally diverse. Only with a full understanding of
slope form and surface character variation can whole slope profile hydrology be fully
understood.
2.4.4 Sedlimen~s
Sediments are found in topographic depressions as in-washed deposits underlying the
clast dominated slopes. Sediment pans accumulate in topographic lows to where large
amounts of mobile sediments are transferred during rain events. The closed depressions
result in water loss through evaporation and infiltration. Sedimentation is extensive. The
size range of pans is also significant, ranging from the massive Qa'a El Jafr greater than
25 km in diameter, to smaller features, just tens of metres across. Sediments pans are
categorized into two distinct morphological types: Qa'a and Marab.
Qa'a are closed topographic depressions where runoff accumulates. Water either
evaporates or percolates into the sediment infill, leaving clays and silts in thin laminations.
The particle size of surface sediments reduces across Qa'a surfaces. Areas of the Qa'a
surface close to slopes or inflowing wadis display more coarse fragments, gradually fining
across the feature. Qa'a often display desiccated surfaces. Qa'a sediments exhibit
banding of coarse and fine materials. Sediments are highly weathered. Fining up
sequences and variations in sediment colour indicate diverse inputs and variable
sediment transport mechanisms.
Marab have coarse surface particle sizes, often contain an active channel bed at their
base and are laterally constricted by steep sided slopes. Bed-form structures indicate the
transport of large amounts of water. Marab also play an important role in the storage of
water in the region. Marab contain significant concentrations of zeolite in their sediments
(lbrahim, 1993). Marab frequently display standing water for significant periods of time
after rainfall events. Marab surfaces are some of the first places to develop vegetation
during the spring months. Sediment infill also contains rock, often of boulder sizes, around
which there is considerable scour, demonstrating the massive volumes of velocities of
flow and resultant transport capacity when in flood. Marab are regarded as open systems.
They freely drain either into wadis normally where a geological constriction forces the
adjustment of their course, or they feed into Qa'a features. Marab sediments are very
different to Qa'a. Coarse gravels, in addition to sand, silts and clay have pronounced
layering in Marab deposits, representing the flashy and extreme nature of Marab flood
- 34-

Chapter 2: The physical environment of the northeast Badia
events (Grove, 2000) . There is a distinction in particle size between Marab and Qa'a
(Figure 2.11 ), with a dominance of coarse silts and sands in the Marab.
The occurrence and development of Qa'a and Marab can be related to the age and
evolution of the drainage development of the basalt surfaces as seen on the Landsat TM
image (Figure 2.8). Qa'a and Marab are found more frequently on the older basalt
surfaces. The loosely compacted surfaces of Qa'a and Marab provide a source of aeolian
sediment. Surrounding topography channels both water and wind, making both Qa'a and
Marab surfaces dynamic zones of sediment supply, transfer and storage.
100
90
80
0> 70 c
"' "' "' 60 Q_
Q)
0> 50 "' c
Q)
~ 40 Q)
Q_
30
20
10
0
6~1m
Fine
.... ''
.. ·······
20~m
, ,
60~m
, , , ,
Fine
' , '
,
,
, ,
Mini- Qa
----------- Marab
---- Qa
200~m 600~m 2mm 6mm
Fine
Gravel
Figure 2.11 Particle size characteristics of Qa'a and Marab features (after Allison et al., 2000)
The presence and nature of slope sediments varies with slope form. The clastic surfaces
present significant aerodynamic roughness to windblown sediments. Evidence of intense
weathering in the Badia is also apparent. Allison and Higgitt (1998) propose a model of
the down-slope variation in sediment depth and surface clasts (Figure 2.12). The model
suggests slope crests have little sediment and clasts therefore stand proud of the surface.
Sediment depth increases progressively downslope, indicating increased sediment
deposition. The downslope nature of the clast configuration on the surface changes,
showing increasing clast burial downslope profiles (Higgitt and Allison, 1999b). The Allison
and Higgitt (1998) model raises several questions. The increase in depth of sediments
has not been quantitatively derived. Plateau areas, which are large expanses that bridge
between drainage networks and slope crests, may support significant depths of sediment.
Sediment depth is dictated by the presence of swales and hollows across the slopes. The
distribution of surface sediments in the field seems more complex than the proposed
- 35-

Chapter 2: The physical environment of the northeast Badia
model. Allison and Higgitt (1998) use the surface configuration of clasts as a relative
indicator of sediment transport. The implication is that the nature of sediment dynamics is
further complicated by topography and drainage. A systematic spatial sampling framework
is needed to generate a clearer understanding of the surfaces and how their form relates
to the development of drainage networks.
~ ~ ~ ~ m ~ u > c c
-Toe slope- 8 ------Mid·slope----- 8 ~Slope crest-
Pan
Bedrock
Toe slope
Approximate location of boulder plots
m ~ ~ ~ 0 ~ ~ ~
Basalt weathering
profile
Lower slope Mid-slope Upper slope
exposed
Top slope
Figure 2.12 Sketch diagram illustrating associations between slope, sediment thickness and the nature of boulder exposure (after: Allison and Higgitt, 1998)
Slope sediments in the northeastern Badia are generally fine grained, with typical size
fractions ranging from clay loams to silty clays, with in excess of 50 % clay and 30 % silt
(Fisher et al., 1966). The particle size distribution of the sediments has a critical
importance on transport and erosion by aeolian and hydraulic action. Clear evidence of
pedogenesis is evident in the field. Gypsum is clearly visible deep in the weathering
horizon indicating the movement of water. Spherically weathered ghost stones, desiccated
bedrock, re-deposition into cracking structures and limited bioturbation are all in evidence.
Soil surfaces also show considerable variation. Some exhibit small clasts of basalt or
carbonate, forming a continuous cover similar to a desert pavement mosaic (Dixon, 1994).
Others have clay fines, sealed and then crusted and cracked (Kirk, 1997). Larger
particles, mainly gravels, tend to be focussed around the perimeters of clasts. The
presence of a vesicular horizon, similar to that noted by McFadden et al. (1998) and
Brown and Dunkerely (1996) is present but not continuous across the landscape.
Carbonates are present in clast base accretions and also within lenses in the sediments.
-36-

Chapter 2: The physical environment of the northeast Badia
Where topography concentrates water, sediments alter. Areas which regularly become
inundated or experience overland flow, for example ephemeral pathways between
depressions and wadis, show considerably more surface carbonate accretions.
Soils in the northeastern Badia are relatively thin, poorly developed and closely linked to
the underlying geology, characteristic of many arid zone soil formations (Morman, 1959,
Wieder et al., 1985). Soils and sediments are deep red brown (1 05YR 4/4-6/6) (Kirk,
1997), though this varies between basalt flows. Soil depths are highly variable and their
nature is dependent on slope position, geology, and local relief and the subsequent up
slope contributing areas (AIIison and Higgitt, 1998). Soil types are relatively uniform, most
of which fall under the Camborthid classification (Table 2.6) (Huntings Technical Services
Soil Surveys, 1965).
Soil taxonomic
subgroups
Typic Camborthoid
Soil description
Deep silty-sandy clay loam, compacted at depth with basalt stones and gravel at 0.5m, often with hard capped vesicular surface --------- -------------------
Colour
7.5-5YR 5/6-4/6 or
10-9YR 5/6
Xeretic Heavy silty clay loam to clay. Strong platy 7_5_5YR Camborthid to wedge structure but lacking 516_416 _______ s.:._lic:.ck--'e'-n-"-sid~s_. Often COf!lpacted at de(:>'-th ____ _
Xerochreptic Camborthid
Silty clay loam to silty clay, often with moderate sub-angular blocky structure. Developed from limestone alluvium,
_____ .ccb_cc_ec_c_o.:._m_i_ng._ sandy and gravely with de[>th
Typic Calciorthid
Deep very gravely silt loam to sandy clay loam to clay loam. Large soft to moderately hard calcareous concentration producing a calcic horizon from about 0.2m depth. Common
7.5-10YR 5/6-4/6
7.5-5YR 5/6-4/6
Location and
geomorphology
Across the region, basalt rock mantle
beneath
Flat to gently sloping Qa'a features and alluvial plains
Small localised concentrations, but more common on the southern flank of the basalt flows
Wide wadi surfaces, caliche
beds, sometimes
marab with
_______ manganese conce_-'-n'-tr-'-'at=io:..:.n=s ____________ _
Typic Torriorthent Unstructured, extremely gravely coarse sand to sandy clay loam, poorly sorted
7.5-5YR 5/6-4/6
Wadi and marab beds in the north of the region
Table 2.6 An overview of soils on the northeastern Jordanian basalt plateau (Huntings Technical Services, 1965)
Present day soils and sediments may not be representative of present soil forming
processes in action but may be relics of past climates (AI-Hamoud et al., 1995). Kirk
(1998) suggested that the formation of the soils in the northeastern Badia is more complex
than was previously thought. The presence of calcareous nodules and the predominance
of silt-sized quartz grains in the soil matrix imply exogenous sources of sediment supply to
the region (Kirk, 1998). Consideration of aeolian processes, in particular high magnitude
events, suggests the likelihood of the influx of aeolian material to the northeastern
- 37-

Chapter 2: The physical environment of the northeast Badia
Jordanian Badia (Bruins and Yaalon, 1979).
Issues of slope, playa and plateau connectivity can be extended to the cross-contour
continuity of slope processes. Swales and hollows and the presence of Qa'a deposits on
elevated plateau surfaces tends to concentrate flow in topographic lows on the side
slopes of the incised drainage network. The plateau does not drain uniformly into adjacent
wadi networks. The dominant form of flow may be concentrated into small flow pathways,
rather than sheet flood which flows across the width of a slope. Evidence for the
concentration of overland flow into pathways is seen in the spring months, when
vegetation grows predominantly on routes of preferential water flow, commonly in very
subtle topographic depression. A key question is to what extent do the profiles surveyed
represent either an active zone of flow concentration and intense process, or conversely a
swale where less intense flow is experienced? Additionally significant microtopography
has been observed in the northeastern Badia.
2.4.5 Clastic Sllnfaces
There are significant differences in the character and configuration of the clastic surface
cover with geology and slope (AIIison et al., 2000). Variations in the mean intermediate
axis between locations show distinct differences in surface character between basalt
types. The oldest flows, the Abed, have a mean intermediate axis dimension of 0.16 m,
compared to 0.105 m on the younger Scoriaceous deposits. Variation in surface cover
relates to jointing structures of the basalt, as a control on the nature of weathering, rather
than a temporal change (AIIison and Higgitt, 1998). Abed basalts have a larger mean
surface area (0.32 ± 0.08 m2) and greater edge lengths (0.66 ± 0.11 m) than any of the
other basalts studied. The degree of sorting, shown by use of the coefficient of variation
and the clast size distribution characteristics also varies between basalts (Table 2. 7).
-38-

Chapter 2: The physical environment of the northeast Badia
Basalt IViean Standard deviation IVlean Cvb
Standard deviation skewness (skewness) (Cvb)
Abed 0.71 0.80 34.83 5.88
Bishriyya 1.41 0.50 37.81 10.99
Mad ha la 1.07 0.62 36.83 6.61
Scoriaceous 1.52 0.58 43.97 19.93
Cleared 1.11 0.59 43.97 6.61
Table 2.7 Clast size distribution parameters and sorting by basalt type (after Allison and Higgitt, 1998b)
The oldest Abed surfaces exhibit clast size distributions with the lowest levels of
skewness (0. 71) when compared to the Scoriaceous surfaces (1.51 ). The preferential
removal of smaller clasts either hydraulically or through weathering on the older slopes is
thought to account for the depletion of the tail of the distribution. The results presented by
Allison and Higgitt (1998) show a preferential sorting on the older slopes, with fewer
smaller clasts in the distribution. Attempts to gain a precise measure of percentage rock
fragment coverage from clast axis dimensions have included the use of an elliptical
function to derive the surface area of each individual clast, rather than calculations based
on mean clast sizes (Higgitt and Allison, 1999a). This technique is successful, as clear
differences in surface character are noted between basalt types (Table 2.8). This degree
of surface cover variation is also reflected in remote sensing imagery, whereby the
spectral reflectance of each basalt flow surface has a unique signature which can be used
to delimit the flow extent (Tansey, 1999).
Basalt Mean Ground Cover(%) Standard deviation
Abed 50.77 14.27
Bishriyya 46.44 21.71
Madhala 39.61 15.30
Scoriaceous 19.68 13.11
Table 2.8 Ground coverage by basalt type (from Higgitt and Allison, 1998b)
Systematic variation of surface character within individual basalts and down slope profiles
has been studied (AIIison and Higgitt, 1998). Links with slope form are less clear than
those identified between geologies. Data presented by Allison and Higgitt (1998), when
- 39-

Chapter 2: The physical environment of the northeast Badia
aggregated by basalt type, present systematically varying patterns of surface cover with
distance downslope. On the Bishriyya and Scoracious deposits, the intermediate diameter
is at its highest at the upper and middle slope plots, which then reduces consistently
downslope. The Abed flows show a continual rise in clast size towards the lower slope
position, while the Madhala slopes show little discernable spatial differentiation in surface
character. lt is suggested that slope form controls clast surface character, which leads to a
temporal variation as slope form evolves (Higgitt and Allison, 1998; Allison and Higgitt,
1998). The locus of maximum slope coincides with the largest mean intermediate clast
axis dimensions. Slope gradient and skewness are not significantly related, limiting the
application of the suggestion that there is a preferential removal of finer clasts on steeper
slopes.
A clear decline in percentage ground surface cover is apparent downslope {AIIison and
Higgitt, 1998). The younger Bishriyya and Scoracious slopes show a peak ground surface
coverage at the upper slope position, whilst the surfaces of the Abed and Madhala display
a steady decline in ground cover downslope. There are differences between toe and crest
positions, explained by the location of the toe plot either in or on the boundary of the
adjoining wadi, Marab or Qa'a (AIIison et al., 2000). Little or no ground cover is not
unusual at slope profile toe sites, attributed to the deposition of slope sediments and
intense periodic fluvial scour.
Clast exposure above the slope sediments reduces downslope (Higgitt and Allison,
1999b). Consistent variations in clast burial are also noted on the variable slope forms
between geologies (Higgitt and Allison, 1999). Statistically significant univariate
correlations are found between exposure and slope length, height, curvature, shape, but
not gradient (Table 2.9).
Slope position Mean ground Standard Mean exposure Standard cover(%) deviation (%) deviation
Crest 42.9 17.1 69.5 11.7
Upper 48.1 14.9 65.6 10.7
Middle 40.9 16.1 58.2 11.9
Lower 38.7 18.4 55.8 12.5
Toe 16.9 9.0 37.4 6.5
Table 2.9 Influence of slope position on ground surface configuration (after Higgitt and Allison, 1999a)
Data previously presented appears to show a downslope link between clast exposure and
profile shape. Clast exposure indicates the degree to which sediments are mobilised and
-40-

Chapter 2: The physical environment of the northeast Badia
redeposited further downslope (Higgitt and Allison, 1999b).
2.4.6 Evidence of process action in the northeastern Badia
There is much evidence in the field to suggest the nature of processes that are
responsible for the nature of surface processes and geomorphic change. Two studies
have been undertaken into direct process action in the northeastern Badia. Kirk ( 1997)
examined the role of rainfall in acting to promote soil crust development, and Warburton
(1998) conducted a pilot study into the variable rates of infiltration on various sediment
surfaces across the region. Infiltration is highly variable and sporadic (Warburton, 1998).
With sparse and erratic rainfall, runoff and ephemeral flow is short lived and irregular.
Infiltration into channel alluvium and the desert surfaces is highly variable, a feature
common to such desert surfaces (Warburton, 1998; Agnew and Anderson, 1992). Wadi
flows have not been quantified, but the displacement and removal of massive boulders, up
to 1 m in diameter, has been observed. Trim lines on the slopes surrounding wadi beds
also indicate high levels of flow in the wadi channels. Surface runoff has been reduced in
recent years due to the construction of dams and the use of surface water for irrigation in
the head waters. A reservoir was constructed in Jordan, across Wadi Rajil in 1980 but this
is known to have only filled twice in between its emplacement and 1998 (Dottridge, 1998).
Rainfall simulation experiments undertaken in the region on agricultural land by Kirk
(1997) indicate the importance of surface rock fragments on controlling infiltration, surface
seal development and the rapid speed of run off generation.
An intuitive assessment of the dynamics of the northeastern Badia might imply an inert
and inactive environment. Heavily varnished clasts, low levels of water and moisture, and
the sporadic and infrequent occurrence of flood or storm events suggest a dormant
environment. A more detailed examination of the geomorphology has revealed a greater
degree of surface clast sorting with slope, a systematic variation of slope form with age,
heavily incised wadi networks and massive accumulations of redeposited weathered
material, indicating a greater level of geomorphic activity, either at present or in the past.
The nature of events that are responsible for the features described remains unknown.
Large volumes of overland flow would be expected to initiate rill and gully development
(Horton, 1945). Scour and deformation of the sediments maybe expected around surface
clasts (Bunte and Poesen, 1993). A greater differentiation between slope sediment
source, transport and deposition zones might be expected (Yair, 1990). None of the
features is continually apparent or prevalent in the northeastern Badia.
Taking surface hydrology as the most influential process (AIIison and Higgitt, 1998),
formative events maybe characterised into two broad groups. First, low-magnitude high-
- 41 -

Chapter 2: The physical environment of the northeast Badia
frequency rainfall, and second, high-magnitude low-frequency storm-events (Kirk, 1997).
The relative geomorphological influence of the two types of event is not understood in the
northeastern Badia, nor is the clarity of the distinction between them. Previous research
elsewhere upon the influence of surface clasts on slope hydrology has noted both a
positive (Abrahams and Parsons, 1991; Valentin and Casanave, 1992; Brakensiek and
Rawls, 1994) and a negative influence (Hinckley, 1980; Brackensiek and Rawls, 1994).
Positive (van Asch, 1980; Wilcox et al., 1988; Poesen and I nglemo-Sanchez, 1992) and
negative effects (Box, 1981; Collinet and Valentin, 1984; Simanton et al., 1984) on
sediment dynamics have also been recorded. The slopes of the northeast Badia are
indicative of a predominantly negative series of feedbacks between surface form and
process. High concentrations of slope sediments suggest a negative feedback which acts
to restrict the erosion and removal of the slope sediments. The lack of geomorphological
evidence of high magnitude events on the slopes suggests that their formative influence is
muted by the clast cover.
Evidence is available in the field which suggests the nature of surface modification (AIIison
et al., 2000). A preferential sorting of the clast population to the base of the slopes
indicates the removal of the smaller clasts of the population, probably by the hydraulic
action of overland flow. Second, a non-random, often structured distribution of the clasts
on the surface has also been noted. Surface clasts must have moved to form these
structures, as there is no other logical explanation for this structured positioning. Allison
and Higgitt ( 1998) used surface clasts as a relative measure of sediment transport but this
does not explain the spatial organization of the surfaces. If a close link between process
and form is assumed, an iterative mechanism of clast movement is favoured. An iterative
mechanism of surface modification is supported by the modification or muting of process
action by the surface configuration. Clasts are relatively massive objects which cannot be
mobilised through direct transport by flow (Poesen, 1987). With significant climatic change
and the ages of the surface, what today is considered a large scale event may only be a
small scale event in the geomorphological history of the surface evolution.
The nature of the surface cover character has been previously shown to vary in several
ways down slope profiles. The shape of individual clasts and the nature of the whole
ground surface cover changes (Higgitt and Allison, 1999a). Field observation has also
noted the presence of a distinctly non-random distribution of surface clasts (Higgitt and
Allison, 1999a). Several mechanisms of movement can be suggested which have resulted
in the downslope variation observed. The iterative movement of clasts can be suggested
to be based upon the downslope settling or toppling of clasts after a small scale vertical
disturbance or displacement. Although hydraulic action may not be of sufficient magnitude
to entrain movement, it may be sufficient to instigate clast instability, through for example
-42-

Chapter 2: The physical environment of the northeast Badia
runoff creep (Abrahams et al., 1994). Several studies have identified the interaction
between a deformable sediment surface clasts or obstacles, such as clasts (Bunte and
Poesen, 1994; Schitling, 1955). Scour around the clast perimeter in a similar manner may
lead to undercutting, which in turn may destabilise a clast, promoting the clast to subside
into the resulting scour hole.
With gravity, the preferential re-settling direction of clasts will be downslope. The product
of multiple iterative movements is the down-slope migration of clasts. Several potential
geomorphic mechanisms for a mechanism of instigating an iterative movement in the
northeastern Badia are evident. First, analysis of the slope sediments in the Badia shows
high levels of clays and silts (AIIison et al., 2000) . The expansion and contraction of the
clays with wetting may promote vertical displacement of clasts (Springer, 1958). In this
instance low-magnitude events which wet the surface but do not generate overland flow
may have a significant geomorphic effect in acting to displace surface clasts, through
surface saturation. Second, significant levels of carbonate accretion have been noted on
the undersides of surface clasts (Plate 2.3). The preferential precipitation of carbonates
beneath clasts may again prompt an iterative vertical displacement of clasts, though no
empirical evidence of this is available.
Plate 2.3 Carbonate accretions on the undersides of basalt clasts
Very low ground surface temperatures and the relatively high levels of moisture in the
surface sediments during the winter may prompt ice needle growth beneath clasts, again
instigating a slight vertical displacement. Direct testing of these mechanisms in the field is
difficult due their scale of action.
-43-

Chapter 2: The physical environment of the northeast Badia
2.5 Conclusion
The northeastern Badia represents a diverse and dynamic environment. The interplay of
climate and geology has resulted in a unique and complex geomorphology. Previous work
has identified significant links between slope form and ground surface cover, pointing
tentatively towards slope hydrology as the key formative influence on surface
configuration. The actual process mechanisms of surface dynamics and clast movements
are less clear, but field observations suggest iterative changes over a long time period.
Location and the influence of drainage patterns and basalt type influence slope form. The
linkage between geological age and slope form is less clear and has been based on a
limited sample both in terms of spatial and statistical significance. Several questions arise
which need to be addressed if this landscape is to be understood in greater depth and
allow links between form and process to be explored.
The nature of the geological control on surface character has been previously studied,
raising issues of scale, sampling adequacy and what constitutes an appropriate measure
of surface. The subtlety of variation in surface character is clear but a significant degree of
local scale heterogeneity, or noise, is apparent which cannot easily be accounted for. The
degree to which this variability can be linked to slope or geological controls needs to be
addressed. The varying degree of drainage development, the age of the surfaces and the
variation in slope profile form are all controls on surface character but their relative
influence and importance is not well understood. There is a requirement for a precise and
detailed study of surface geomorphology. The study should be undertaken in a manner
which accounts for the subtlety of variation in surface form in the northeastern Badia. The
study should derive measures of the surface which are appropriate to the processes
which act to modify the surfaces.
-44-

Chapter 3: Site selection, description and sampling
-45-

Chapter 3: Site selection, description and sampling
Chapter 3: Site seieciion, description and sampling
3.1 lntmduction
The main objective of this chapter is to select and describe the sample sites used within
this study. There are three sets of issues that relate to sample site selection. First, scale,
location and adequacy of sites in the context of the whole northeastern Badia, second, an
appropriate scaled framework for data collection, and third, the specific locations for data
collection and their geomorphological characteristics.
The approach developed in this thesis is based a hypothesis of surface dynamics which is
developed on three key considerations which have come to light in a review of research
previously undertaken in the Badia. First, scale appears to be of critical importance, both
in terms of surface variability, process action and the scale of investigation. A nested
hierarchy is developed as a framework within which semi-quantitative links between scale
boundaries can be considered. The scaled approach aims to strike a balance between the
fine scale precision necessary to detect the systematic surface variability, against a
sample size which is large enough to be statistically and spatially significant. Second,
location relative to both geology and drainage development appears to have a profound
influence on the ground surface configuration. Low level aerial imagery reveals a complex
mosaic of ground surface coverage, dictated by microtopographic variations and the
presence of bedrock exposures. A systematic method of positioning a sample site is
necessary, such that site location can be considered in the context of the larger natural
system. If a sample location can be definitely known not to be atypical then comparisons
can be drawn between sites in similar situations with confidence. Finally, the approach of
the study must be appropriate to both the nature of geomorphological processes in the
northeastern Badia and the objective of the study. Change is very subtle and the surface
appears to be highly complex. Measurement of relevant aspects of surface form and
behaviour is essential.
Given the subtle levels of variability in surface coverage, the sporadic and subtle nature of
surface modification, direct observation of process is difficult. The sampling technique
developed here aims to locate sites which can be considered statistically within the
context of the wider geomorphological system. The location for both surface
characterisation and experiments on surface hydrology is suggested to have a significant
influence over the results generated, and therefore must be selected carefully.
-46-

Chapter 3: Site selection, description and sampling
3.2 Methodological considerations
3.2. ~ Introduction
Scale, location and adequacy have been widely discussed elsewhere (Schumm, 1991;
Dunkerley, 1994; Bloschl, and Sivapalan, 1995). A comprehensive review of each is
beyond the scope of this research. Studies concerned with coarse clastic surfaces
(Poesen et al., 1990, semi-arid slope hydrology (Parsons and Abrahams, 1992) and clast
surface modeling (Ahnert, 1994) provide reviews of a range of work which has in part
addressed issues of scale, location and adequacy. Previous work is used as the basis for
the construction of an appropriate methodology for the research presented in this thesis.
3.2.2 Scale
The importance of scale in the northeastern Badia can be explained by use of an
example. Variation in clast surface configuration occurs between plot positions at various
points down a slope profile. Surface configuration varies systematically with slope form
and geology. Variation in surface character is measured as small changes in the mean
character of a number of clasts in a sample from a series of plots. Additionally, minute
variations are apparent between clasts within each sample at each plot location. This local
variation, or heterogeneity, is of a similar magnitude to the systematic downslope variation
in surface character. In the northeastern Badia the scale of variation in surface character
is commonly not of the same scale at which the surfaces are easily characterised. Very
small changes in mean surface character are only apparent between disparate locations.
Understanding the scales at which variability occurs, the scale at which the surfaces can
be characterised and linking between these scales is important.
The consideration of scale falls into three broad categories. The scale of variation in the
landscape form; the scale of process action; and the scale of investigation. The scale(s) at
which the surfaces are studied is ultimately a balance between the precision of
measurement against the size of the sample taken. Ideally all surface clasts would be
measured in an infinite level of detail.
The features of the landscape warrant subdivision into a series of scale boundaries,
defined by the nature of variability in landforms, the logistical constraints of investigation
and adequacy of the sample collected. This is used to examine the interactions between
various components of the landscape. As a framework for examining the scale of form
variation and the scale of process variation, a nested hierarchy of scales has been
developed (Figure 3.1 ). The hierarchy is based upon the hypothetical scale boundaries
proposed by Bloschl and Sivapalan ( 1995) and Poesen et al. (1994) and is applied to the
-47-

Chapter 3: Site selection, description and sampling
specific context of the northeastern Badia. A discussion of each of the scale divisions
describes the scale boundaries and the dominant controls on the geomorphology of the
northeastern Badia in this framework.
Regional scale
At the regional scale the northeastern Badia is considered within the context of
the climate and structural geology. The climate of the northeastern Badia is
linked with continental scale meteorology, which is dominated by the transition
between the Mediterranean and arid interior climates of the Levant. The large
scale topographic features of the Arava Rift and Jebel Druz are highly
influential. The structural geology has been shown to dictate the location of
various rock types in the region. Combined with climate, the relative position of
sedimentary and igneous deposits influences the location of aeolian sediment
supplies and potential zones of dust accretion, respectively.
ii Catchment scale
At the catchment scale the importance of basalt type and drainage development
influences the configuration of slope form and surface character. Additionally it
has been suggested that drainage evolution is related to basalt age and
mineralogy and may hence dictate slope form (Higgitt and Allison, 1999a).
Additionally, local topographic controls on climate have been noted, including
the tendency of dust devils to form over reflective Qa'a surfaces, and the
channelling of winds in the wadi networks.
iii Slope profile scale
At the slope profile scale, mean variations in ground surface cover are
significant, suggesting the influence of variable slope process action. lt is
suggested that only by understanding variation in surface form at the slope
profile scale can an understanding of the landscape be gained (AIIison and
Higgitt, 1998). Process has been suggested to vary in a similar manner to the
variation in surface form down slope profiles.
-48-

Chapter 3: Site selection, description and sampling
iv Plot scale
The plot scale is in effect the scale of investigation; surface characterisation and
field experiments on surface hydrology are logistically constrained to this scale.
Local heterogeneity is of importance and it is here that a balance between
sample size and the precision of the measurement technique must be sought.
v Subplot scale
The subplot scale, on a surface with such subtle variability in form, is potentially
the most significant in terms of dictating variations in process response.
Variations in interactions between the surface clasts, the underlying sediments
and any slope processes at the subplot scale may result in variability at higher
scales.
The scale boundaries described are not exclusive and their boundaries are by no means
fixed. The hierarchy provides a useful framework within which the various components of
the landscape and their interactions can be understood. Process at one scale may have a
profound influence on the character of another scale. An example of this is the concept of
emergence, whereby the cumulative action of process at one scale results in features or
properties at a higher level which are not discernable from the character of the individual
components at the smaller scale. Interdependence between scales works both up and
down the hierarchy. For example, Allison and Higgitt (1998) have shown that whole slope
profile form influences local ground surface configuration. The systematic variation in
ground surface cover may also influence the whole slope hydrology. Each of the scales
identified has a specific link to the geomorphology of the northeastern Badia, which
broadly defines a scale of variation in the landscape geomorphology.
-49-

Hypothetical scales (after Bloschl & Sivapalan,
1995)
Chapter 3: Site selection, description and sampling
Holon name (approximate area)
Region
(104 to106 m2)
Catchment
(102 to 106 m2)
Whole slope profile
(10° to 102 m2)
Plot
(10-2 to 101 m2)
Subplot
(10-6 to 10°m2)
Scales in the northeastern Badia
Figure 3.1 Scale boundaries, theoretical and applied to the northeastern Badia
Several studies have adopted a hierarchy of scales to extrapolate and up-scale results
(Kirkby et al., 1996). Two factors restrict the validity of extrapolation between scales when
-50-

Chapter 3: Site selection, description and sampling
applied to the northeastern Badia. First, up or down scaling must account for the degree
of variability in character at each scale on the surface in question. For example, the
degree of variability in clast size at a scale maybe more significant than a mean size as a
control on surface hydrology (Dunkerley, 1996). Second, is the issue of linking two
dimensional measures of geomorphology to a three dimensional understanding of
landscape. Slope profiling, for example, is commonly employed to gain an understanding
of the distribution of slope forms in a given landscape. The relationship between the
numbers of profiles necessary to gain a robust approximation of the three-dimensional
character of a landscape is not clear given the apparently arbitrary profile location
commonly used. Profile location is of particular importance where drainage development
influences slope form. The validity of extrapolating two dimensional data to a three
dimensional understanding of landscape is questionable and should only be undertaken
with caution. Finally, there is the issue of emergence. A reductionist study at the plot scale
may not reveal emergent properties at higher echelons in the scale hierarchy. Given the
apparent complexity on the surfaces of the northeastern Badia some consideration of this
effect is necessary.
Scale of investigation applies to both surface characterisation and surface hydrology. In
terms of surface hydrology, this is a balance between local scale variability, which in semi
arid environments is generally high (Agnew and Anderson, 1992), and the logistical
constraints of plot size. No previous work on surface hydrology has been undertaken on
the clast mantled slopes of the northeastern Badia. Basing a sampling framework on a
theoretical degree of variability in surface hydrology is dangerous. Instead, it is suggested
that a close link between surface form to surface process exists, as is suggested in the
northeastern Badia by Higgitt and Allison (1999). A considerable volume of work is
available to support the link between clastic surface configuration and the processes in
action on that surface (Poesen and Lavee, 1994). The assumption that process response
will vary in a similar manner and with a similar degree of variability as surface form
appears sensible. The scale of investigation for this study is based on the findings of the
previous work on surface form variation. As a more detailed example, surface
characterisation provides a basis on which to define the scale of investigation. Given the
previous volume of work conducted in the Badia an estimate of an appropriate scale of
investigation can be made.
There is no standard method of assessing or characterising coarse clastic surfaces, but it
has received much attention. A wealth of literature is available on appropriate sample size
needed to gain a statistically significant understanding of coarse clastic surfaces (Diplas &
Fripp, 1991; Wolcott & Church, 1991; Gale & Hoare, 1992; Dunkerley, 1994). The result is
-51 -

Chapter 3: Site selection, description and sampling
a disparity in methods and approaches adopted, with no apparent consistency. Table 3.1
summarises the approach from twelve studies of coarse clastic surfaces. There is both a
disparity in the sample number considered to be adequate to gain statistical significance,
the way in which the sample site is located and the measurements taken.
Author Sample size Sample area Measurement type and location
Perez (1986) 25 > 25mm 5cm x 5cm ucam
50.8mm x Cooke and Reeves (1976) 50> 5mm ucam
50.8mm
McFadden et al. (1987) 50> 8mm ucam
Grid based Abrahams et al. (1988) 200 ucam
sample
Grid intersection Abrahams and Parsons (1991) 56-70 > 2mm ucam
sample selection
50- 200, > 2mm diameter 5cm x 1 Ocm (long Abrahams et al. (1995) ucam
at grid intersections axis down-slope)
2m x2m,
Allison & Higgitt (1998) All clasts in 4m2 quadrat
regularly spaced All exposed dimensions Mean= 67.8
relative to slope
6 plots evenly
Brown & Dunkerley (1996) 50 spaced down- Mean diameter
slope
AI Farraj and Harvey, (2000) Semi-qualitative I quantitative
Friend et al. (2000) Stratified random sample
Photograph projected on a
Box (1981) grid to calculate cover Stone weight per unit area, in
percentage - sieving to seven sieve units.
calculate size distributions.
Grid node count of rocks in 1 - 1.2 m2plot
Uncorrected median Nyssen et al. (2002)
quad rat intermediate diameter
ucam:- uncorrected arithmetic mean intermediate axis
Table 3.1 Examples of coarse clastic surface measures employed in characterization
Blocshl and Sivapalan (1995) provide an intuitive understanding of the balance between
process and observation scales (Figure 3.2). If the process, or feature, under observation
is larger than the extent of the sample frame then this will appear as a trend. Conversely,
if the process is smaller than the resolution of the observation, then it will appear as noise
in the data. To overcome this Russo and Jury (1987) suggest an adaptation of the Nyquist
frequency, developed for assessing the highest frequency (fn) that can be detected in a
given data set of spacing (d) (Equation 3.1 ).
-52-

Chapter 3: Site selection, description and sampling
Eq. 3.1
Applied to the northeastern Badia, the wavelength of spacing of regular microtopography
dictates an appropriate scale of sample size. A sample should be of a size or extent which
is significant both statistically to calculate clast size population and spatially such the
heterogeneity or structure can be understood.
Q)
~ en en en Q) (..)
e a...
trend
.. ·'~~~~+H . ...... : ... : ... : ... :
... ' .... ''·:·:·: .• !:.~ ... '· .. ::l· .• ,:·:··.;.·''::::::!.·'' .. ::::.::·: ... !i :.·:.:.i.
1
J:::i:::(' ' ' . . . .. . i ... ::: :i:::l:~~~: : !···l:::l·tt·:l··:l···!·: Jim!IJ1JfP' commensurate ,j:i
· ' II;J,;I []l~f ftP'' noise
Observation scale
Figure 3.2 Process scale versus observation scale (after Bloschl and Sivapalan, 1995)
The scaled approach developed above is used as the basis for this investigation. Specific
scales of variation and scales of investigation are discussed further in the design of the
surface characterization and the surface hydrology experiments in Chapters 4 and 5.
-53 -

Chapter 3: Site selection. description and sampling
3.2.3 Loca~ion
Location and scale in the northeastern Badia are closely related. The importance of
location is best explained by means of an example. A square plot is randomly positioned
in the northeastern Badia. Within this quad rat the character of the ground surface cover is
influenced by the position of the plot relative to the whole slope profile and the nature of
the underlying geology. The issue of location is, therefore, how representative of the
landscape or area as a whole is that plot on that profile? A link between slope form and
drainage, and geology and drainage development has been suggested (AIIison et al.,
2000). Controls on the geomorphology are dictated by the location and relative position of
each other and therefore cannot be considered independent. Any selected profile is likely
to be only one slope form in a spectrum of slope forms on one basalt type.
There appears to be a complex interaction between slope, geology, drainage and age is
suggested. Slope form has been linked to basalt age (AIIison and Higgitt, 1998). The
variation in slope form may merely be a reflection of different states of drainage evolution
with basalt age. The variation or range of slope forms within a single geology and the
reasons for this variation has not as yet been assessed. Given the transition of slope form
with catchment and drainage development, it would be expected that profile form may
vary accordingly (Selby, 1993). Allison and Higgitt (1998) developed a systematic method
of locating plots relative to a whole slope profile but no robust method of locating profiles
within a drainage system or region has been developed. A standard profile form was
assumed to be characteristic of each basalt, so profile position or location within a single
basalt flow was not considered important. The ease with which the results from one place
can be extrapolated to another depends on how similar they are, or moreover how well
the difference in controlling factors is understood.
Location is a simple concept but one that appears commonly overlooked when positioning
plots. Standardized plot based studies can easily be undertaken but, the importance of
location relative to the larger landscape system is rarely considered. The northeastern
Badia provides an extreme circumstance, given the geological and temporal nature of the
environment, but emphasizes the importance of considering relative location. Given the
importance of basalt type and age and therefore drainage development, a systematic or
quantitative method of positioning a profile in a given drainage location is required.
Several methods of defining profile location have been proposed (Pitty, 1969) but none
has been used to develop a quantitative method of using two dimensional profile forms to
assess three dimensional landscape character. A method is developed below using
Young's (1961) division of landscape in combination with a GPS derived DEM of the
-54-

Chapter 3: Site selection, description and sampling
selected field area in the Badia. The method allows a systematic slope profile selection
and hence profiles can be considered in the context of the wider system.
3.2.4 Adequacy
Dunkerley (1994) discusses the use of appropriate sampling measures, which he termed
adequacy. The character of coarse mantled desert surfaces may be partly relict slope
forms of a previous environment (Dohrenwend, 1994). Nonetheless, slope surface
character is seen to vary systematically with position relative to the hillslope, irrespective
of whether the slope is a relict feature or indicative of contemporary slope process
(Dunkerley, 1995). Spatially varying surface cover influences many aspects of slope
hydrology and sediment dynamics (Poesen et al., 1994) (Table 3.2). Coarse clastic
surfaces present a complex geomorphic system. The influence of surface clasts on slope
process is multifaceted but nonetheless a close, albeit complex link between surface form
and process is suggested. The implication is that any description or characterisation of the
stone surface must be sensitive to both the spatial variability in the attributes of the
surface which affect the action of formative processes. With a lack of previous research in
the region and on similar surfaces, determination of what is adequate must be based on a
hypothesis of surface dynamics. A consideration of adequacy in the research design is
necessary to ensure that the components of the investigation are both complementary
and appropriate to the context of the northeastern Badia.
1t is expected that the clast cover on the northeastern Badia surfaces has many if not all of
the influences of rock fragments on slope hydrology found elsewhere (Table 3.2). A
further complication is the feedback between form and process. Only a few examples of
research exist whereby the relationship between process and form is considered to be
homeostatic (Higgitt and Allison, 1999a). The subtle nature of variability, the apparently
sporadic nature of formative events and the longevity of the surfaces in the northeastern
Badia adds further complication. Adequate sampling and characterisation will yield results
with greater significance and application. The importance of adequate sampling applies
not only to the characterisation of the form variability of the surfaces but also to any
assessment of process variability.
-55-

Influential factor
Clast size
Surface area coverage
Chapter 3: Site selection, description and sampling
Author(s)
Poesen (1987)
Direct influence
Transport thresholds during
concentrated overland flow
Yair and Lavee (1979); Lavee Nature of rainfall partitioning
& Poesen (1994)
Abrahams and Parsons (1994) Surface hydraulics
Larmuth (1978) Radiation balance and surface
temperature
Poesen et al. (1990); Valentin
(1994)
Armouring of surface to
Geometry of clast arrangement Dunkerley et al. (2001)
raindrop impact
Effectiveness of laminar flow
across the surface
Nature of perimeter contact
between rock and sediment
Clast character
Surface roughness
Jean et al. (2000)
Brakensiek and Rawls (1994)
Valentin ( 1994)
Poesen & lngelmo-Sanchez
(1992)
El Boushi and Davis (1969)
Childs and Flint (1990)
Goossens ( 1994)
Darboux et al. (2002)
Ponding
Run off generation
Controls infiltration
Depression storage
Absorption
Aerodynamic roughness
Ponding
Table 3.2 Studies of the influence of coarse clastic material on slope process
Dunkerley (1994) argues that adequacy goes beyond statistical significance. Numerous
authors have addressed issues of sampling and associated significance in coarse clastic
materials (Kellerhals and Bray, 1971; Hey and Thorne, 1986; Church et al., 1987; Diplas
and Fripp, 1992; Gale and Hoare, 1992). Much of the previous work is devoted to
statistically significant methods of deriving the full particle size distribution, such that
comparative measures, for example the d84 , can be derived. The development of 'rules'
for sample size, as suggested by, for example, Gal and Hoare (1992), are commonly
inapplicable to many real-world situations. The majority of methods of grain size analysis
available are tailored to a full clast size distribution description. The levels of detail are
commonly not required, nor essential for the purposes of investigation (Dunkerley, 1994).
Adherence to methods devoted to gaining statistical adequacy alone does not ensure that
meaningful results will be obtained (Dunkerley, 1994). Adequacy is linked to the purpose
of the investigation, in addition to statistical considerations. Given the range of research
-56-

Chapter 3: Site selection, description and sampling
questions posed in this thesis, a number of criteria of sampling adequacy may be
necessary.
A second component of adequacy is the degree to which a sample represents the
material from which it was taken. Consideration is not only given to the statistical elements
but also the geomorphic and sedimentologic character. A method of classification should
be able to discern between the variable influence of processes. The choice of
characterisation must be guided by an understanding, or hypothesis of, the dominant
controls on the condition of the material. Geometric or geomorphic character of the
sediment may therefore be just as important as standard size distributions. These
considerations have long been discussed in sedimentology (Billi and Paris, 1992).
A final construct of adequacy addressed by Dunkerley ( 1994) is the applicability of the
resulting data to the research questions. Dunkerley (1994) cites the example of describing
a rock fragment surface using a single cover percentage in studies of surface hydrology,
an approach which is commonly adopted (Poesen & Lavee, 1994). A surface comprised
of only small clasts giving a certain percentage cover will have a very different
hydrological response to one that has an equal cover but is comprised of fewer, larger
clasts. Perimeter length may be of more relevance in this instance as an indicator of
surface character relative to slope hydrology and may indeed perform better in statistical
analysis.
-57-
Chapter 3: Site selection, description and sampling
3.3 Site selection
3.3.1 Introduction
A nested sample site selection approach was developed for the Badia. The scale
hierarchy is based on a range of remote sensing, field surveying and field experiment
data. Quantitative and qualitative links between scale holons are made such that the
location of the field sites can be considered in the context of the wider natural system. The
hierarchy is based at five spatial scales. A qualitative assessment of a regional DEM and
satellite imagery is made. A local DEM is constructed in the field from which a large
number of slope profiles are systematically extracted. Analysis of slope form variation
gives an assessment of the variability of slope forms at the field site, from which
representative sample site locations are selected. Detailed aerial imagery and DEMs are
used in combination to assess the influence of microtopography. Atypical
microtopography and atypical ground cover can be identified and sites repositioned.
The sites selected in this research are designed to test within and between basalt
variations in surface form and process. The first objective is to assess the variation of
surface character and process within one basalt type. This encompasses variation in
surface character on five slopes, three of which are quantitatively located such that their
profile form can be considered within the context of the whole lava flow. Two further
slopes are selected randomly for comparison. A second set of profiles are selected on two
other basalts, the Madhala and the Bishriyya. This is used for comparison between basalt
types. The method developed is relatively rapid so a total of seven sites, each with five
sample points were assessed. Five sites are located in one basalt type, the Abed, to
assess the variation of surface character variation within one basalt type. Two further sites
are located on Bishriyya and Madhala basalts for comparison. This allows between basalt
comparisons. There is need to link surface character to surface process. To achieve this,
a series of 27 rainfall simulation experiments are undertaken to assess both local
heterogeneity and variability in surface hydrology at nine locations on three slope profiles.
The influence of slope form and surface character on surface process can be examined.
-58-

Chapter 3: Site selection, description and sampling
3.3.2 Regional scale
The largest scale of sample site selection is based on two factors. A qualitative
assessment of site location is achieved through a visual assessment of a regional digital
elevation model (DEM), based on 1 :50000 map data, held as part of the JBRDP GIS
archive, and LandSat Thematic Mapper image (Huntings Technical Services, 1992). The
LandSat TM imagery illustrates the proximity of the sites relative to topographic features
and drainage networks. An overlay of sedimentary deposits illustrates the location of Qa'a
and Marab. After a field reconnaissance to identify potential field sites, the DEM was used
to assess the suitability of the location of each, considering ground disturbance, geology,
access, location of sites relative to drainage features or sediment deposits and the
location of previous research. Using these approaches three field areas were considered.
One, Marab Swayed, was selected as the main focus for the study, with the remaining two
sites at or near Qa'a al Buqei'wiya acting to act as comparisons between geologies. An
example of the LandSat imagery (Figure 3.3) shows the distinction between basalt types
as determined by variations in spectral reflectance. A variable degree of drainage
development can be seen between basalt flows. Some basalts exhibit greater definition in
wadi networks, whereas others show a higher concentration of sediment deposits. The
Abed basalts were chosen as the primary location for this study for several reasons.
Drainage is well developed, and hence a variety of slope forms are apparent as dictated
by incision. The basalt also exhibits an open and diverse clast matrix between locations
so variations in form and process should be relatively clear.
The two areas used within this study have been previously selected as key type sites in
the Badia (AIIison et al., 1998). The sites are found to be qualitatively good examples of
their kind, showing a minimal degree of anthropogenic disruption of the ground surface.
By using the sites in this study, the value of comparisons between the findings of this
thesis and the previous research is enhanced. The sites exhibit three basalt types and a
range of drainage features, including Qa'a, Marab and incised wadi networks.
-59-

Chapter 3: Site selection, description and sampling
(Bands 7, 4, 2; path 173, Row 32.12N, Date 29.03.92; Huntings Technical Services)
Figure 3.3 LandSat TM imagery- Marab Swayed

Chapter 3: Site selection , description and sampling
3.3.3 Catchment scale
The second stage of site selection is based on a highly accurate DEM of the selected field
area at Marab Swayed. The DEM is used to identify slope profile location through a
quantitative assessment of slope form variation within a region of the catchment. lt is at
this scale that a quantitative link is required between slope form and location given the
direct link between form and process. An area of Marab Swayed was selected to examine
the influence of various slope forms within one basalt type and covered a reach which
marked a transition between the wadi network and the Marab deposits (Figure 3.4).
/
N
A
I - -l..J
Iraqi Border- 120 km
' \
\
\ ~-... \ t-· _ _.
• l .--- L --- -- -- Approximate area of DEM l>ttarab SWayed ,
(
0 0.5 t --·\ Legend
/
2 3 lfilometers
Roads Sediment deposits
Tracks 10 m contour
/ : /" , I
f -
(
(j
' :)
Figure 3.4 Location of DEM survey area relative to Marab Swayed
A highly detailed local DEM was created for this part of the field site. The DEM was
derived from an extensive differential global positioning system (DGPS) survey using a
Leica Differential GPS System 300. The advantage of the system is the speed of data
collection, the ability to survey with only one operative, the high degree of precision in the
- 61 -

Chapter 3: Site selection, description and sampling
z-plane and the continuous collection of data points. A temporary bench mark was
established on a bedrock outcrop at Marab Swayed as a fixed base-station location. For a
period of a week prior to the DEM survey the base-station was placed at the bench mark
to gain an accurate location. Ambiguities at the base station location were considered to
be less than 0.01 m in x, y and z planes. The bench mark was tied into six local spot
heights, previously established by the Royal Jordanian Geographical Centre (RJGC) as a
control. WGS84 was preferred over the local co-ordinate system employed by the RJGC
(the Jordanian Transverse Mercator (JTM)). WGS84 is compatible with the GIS archive
held by the Jordan Badia Research and Development Programme and is commonly
supported in GIS. Data was archived daily and post-processed in Safawi. A DEM was
created for each day of the survey period such that accuracy could be assessed and any
erroneous points could be resurveyed the following day.
After field trials and comparisons with survey results from EDM Total Station surveys, the
vertical precision of the GPS was found to be of the order of 0.15 m after gee-correction.
The latitude and longitude precision was of the order of 0.05 m. This precision of
measurement was obtained for continuous roaming with the rover downloading at 2 s
epoch intervals, in addition to greater accuracy for specific time tagged point locations
such as bench marks. A 3 km by 2 km section of the Marab Swayed drainage system was
surveyed over a period of ten days. Transects at 15 m spacing aligned both north to south
and a second set east to west were walked across the whole area. A second series of
surveys were undertaken in which features were mapped with the GPS, including ridges,
breaks of slope, wadi channels, the Marab perimeter and wadi channel deposits. This is
used to create a DEM and geomorphological map for whole area. The combination of the
two survey approaches provides both a continuous general coveracross the whole survey
area and precise detail of key features in the landscape. The resulting data set
represented over 45,000 points to a precision of 0.15 m at an average spacing of less
than 13 m across an area of 6 km2. The survey data was imported directly into ArcGIS
8.5, gee-corrected for ionospheric effects and transformed to the WGS84 co-ordinate
system. A surface was then interpolated between the survey points using a kriging
method, (ESRI, 2002). Distances between test points on the DEM were accurate to 99.9%
of the actual distance measured in the field with an EDM in x, y and z planes. A view of
the resulting surface is shown in Figure 3.5.
-62-

Chapter 3: Site selection , description and sampling
Figure 3.5 Shaded relief image ofDGPS derived DEM ofMarab Swayed (view oriented southeast, area of view is approximately 8 km2)
The local DEM is used to derive slope form variation in the Marab Swayed region of the
northeastern Badia. A slope profile extraction procedure was developed in ArcGIS 8.5
based upon the landscape division proposed by Young (1974). The DEM I GIS allowed
the automated identification of the drainage divide and thalweg, using the steepest slope
function (ESRI, 2002). A profile base line, a line equidistant from the thalweg and the
drainage divide, was overlain (Young, 1974). Slope profiles were then extracted from the
surface at roughly 10 m intervals at an angle normal to the profile base line, avoiding
atypical topography with the toe location on the thalweg and the crest location at the
drainage divide. The profile delimitation is illustrated in Figure 3.6, where the thalweg is
represented as a blue line, the profile baseline as a green line, the drainage divide as a
red line and the extracted profiles as a black lines, with a blue marker at the toe and a red
marker at the crest of each. A total of 228 profiles were extracted from this area (Figure
3.6).
- 63 -

Chapter 3: Site selection, description and sampling
Figure 3.6 Profile extraction at 228 locations, from the DGPS derived DEM (view oriented west, area of view is approximately 8 km2)
A geomorphological map, developed from the DEM, was then used to examine the
location of each profile. Within this study a slope profile of interest was defined as the
slope between the drainage divide and the thalweg at an angle normal to the slope profile
base line, over clast mantled ground. The study is concerned primarily with linking clast
surface form to process. Processes are considered to be significantly different beyond the
limits of the boulder cover and these areas are excluded. The active channel or thalweg
only occupies a small portion of the wadi bed width. The transport of clasts in the wadi
and deposition of finer fluvial sediments clearly defines the boundary of slope relative to
channel processes. The boundary was surveyed and overlain in a geomorphological map.
The slope profile toe locations were trimmed such that they traverse only the clast
mantled portion of the slopes. This was achieved using the geomorphological map as an
overlay in the profile extraction GIS (Figure 3. 7). The toe position and form of the lower
slopes has been shown to have a profound effect on measures of slope form (Young,
1974). This method allowed a consistent and systematic method of profile delimitation.
-64 -

Legend
Thalweg
Slope profile baseline
Drainage divide
Extracted profiles
Profile toe
Profile crest
Adjusted profile toe
Chapter 3: Site selection , description and sampling
• • • 11 I tl I ! ' I t .. . ,. till v V V V
V. ~ ~
a: • '
V v ~ 'lL
Gravels
Active wadi channel
aastic wadi deposit
Marab surfaoe
Bedrock outcrop
Cliff
Break of slope
Smooth break of slope
Sharp slope break
Figure 3.7 An example of profile toe point adjustment using a geomorphological map
-65-

Chapter 3: Site selection , description and sampling
The profile extraction generated a two dimensional slope with the origin based at the
adjusted toe location, with height and distance from this origin as x and y coordinates. The
slope height length integral, termed the Kennedy Parameter (ken .par) , was calculated for
each of the 228 profiles generated in this manner to assess slope form variation (AIIison
and Goudie, 1990). Profiles of concave, convex, rectilinear and irregular form were all
found to be present within the survey area. Relative relief differences between toe and
crest locations is variable, ranging from 0.84 m to a maximum of 25.3 m, with a mean
height of 14.36 m. Slope length ranges from 17.6 m to 422.1 m, with a mean length of
150.0 m. Mean whole slope angles range from 0.22° to a maximum of 30.8°, with a mean
value of 8.14°, for all 228 profiles surveyed. Slope form is seen to vary between concave
and convex, showing two distinct modes focused around ken.par values of 0.461 and
0.630. The bimodal profile distribution represents the either concave or convex slope
forms of the sinuous wadi channel. lt appears unreasonable to describe typical slope
morphology purely in terms of the underlying geology, as previously suggested by Allison
& Higgitt (1998) . A mean ken.par for all 228 profi les surveyed of 0.534 suggests no
0.115)
and the bimodal distribution of slope forms shows a large variation in profile form (Figure
3.8). The variation in slope form and the geomorphological implications are discussed
further in Chapters 4 and 5.
3
0
0.2
I I
I I
I I
I
I I
I
I I
I
I I
I
I
I I
I
I I
I
I I
0.425
I
I I
I I
0.4
I I
,- -..
0.5 0.575
'
0.6 ken.par
' ' '
' \ \
\
\ \
\ \ \ \ \ \
\ ·
\ \ \
Figure 3.8 Kernel density estimate of ken.par for 228 profiles
\ \ \ \
\ \
0.8
- 66-

Chapter 3: Site selection , description and sampling
For the purposes of sample site selection five potential slope profiles were selected to
represent the diversity in ken.par value. Three profiles were selected for the detailed study
of slope hydrology and surface form variation.
3.3.4 Slope profile scale
Observation in the field suggests considerable heterogeneity in ground surface clast
cover. Anthropogenic disturbance appears important at this scale. Ground disturbance
tends to be concentrated around fertile sediment deposits and strategic points. Surface
clasts are cleared by Bedu for shelter and camping grounds. Geological anomalies, such
as rock outcrops, down slope profiles and archaeological structures, such as desert kites
(Helms, 1981 ), are commonplace. These features are very difficult to identify from the
ground. Plate 3.1 illustrates the same area section of the field site as that shown in Figure
3.9, but reveals none of the surface structures that are seen in the aerial image.
Plate 3.1 Oblique photograph of boulder surface
The role of slight variations in topography is difficult to visualise in the field. During winter
months overland flow is concentrated into pathways which connect plateau surfaces to the
wadi network. Flow pathways form in hollows on the wadi side slopes. The concentration
of vegetation growth locates flow pathways shortly after the wet winter season (Plate 3.2).
-67-

Chapter 3: Site selection , description and sampling
Plate 3.2 Example of a drainage channel vegetation growth
A method which combines an assessment of topographic variation with a visual
representation of the surface was developed to assess the nature of the ground surface
and small-scale variation in microtopography. The approach developed employs low-level
digital aerial imagery and a highly detailed DEM of the slope. A reconnaissance in the field
identified ten potential profile sites. At all of the sites the spacing of survey points in the
DEM was increased to an average 2 m separation using DGPS. Vertical digital aerial
imagery was obtained for each profile slope. The camera height was maintained at
roughly 100 m above the ground, giving the image a ground pixel diameter of 0.12 m and
cover of 100 m by 150 m. To account for slope the images were gee-corrected to 10 ·
uniformly spaced ground control points, which were surveyed with the DGPS. The
resulting image was overlaid on the DEM in ArcGIS 8.1, to assess the variation in ground
surface cover and identify any anomalies in the clast cover (Figure 3.9). The aerial images
demonstrate the presence of geological features which are difficult to identify on the
ground. Variations in ground cover related to swales and hollows across the slope profile.
Using the qualitative method of assessment, three profiles were selected from a sample of
ten. They were chosen firstly for their diversity of profile forms and secondly for the
continuity and consistency in ground surface coverage.
-68-

Image location and extent
)' 0 0.15 0.3 0.6 I I I I I I I I I
(a) location of example of aerial image; (b) Aerial digital image, captured from a
camera height of 100 m, showing a whole concave slope profile (Profile CC). The arrow indicates the direction of slope.
Key:
(1) Location of camera for image in Figure 3.5 and approximate field of view represented by white lines; (2) Geological anomaly; (3) Wadi bed at slope toe; (4) Bedrock outcrop at slope crest.
Chapter 3: Site selection, description and sampling
Figure 3.9 Identification of atypical ground cover from aerial imagery

Chapter 3: Site selection, description and sampling
Figure 3.10 Detailed DGPS derived DEM, with 1.5 times vertical exaggeration, wit 2 m contours
The area of the DEM is approximately 30 000 m2. The variation in microtopography cannot easily be seen in the field. The only indication is given by grasses growing preferentially in
topographic lows on side slopes during spring. Colour is applied to emphasise mic.rotopographic variability.
)' 0 0.15 0.3 0.6 I I I I I I I I I
Trial profiles

Chapter 3: Site selection, description and sampling
3.3.5 Plot scale
Plot location at the slope scale loosely follows the methodology developed by Allison and
Higgitt (1998). This method systematically locates plots at five points down the slope
profile at set intervals. Plots are located at the crest (Top), the midpoint (Middle) and toe
(Bottom), with two additional plots evenly spaced in between, named upper (Upper) and
lower (Lower). Considerable success in identifying the absolute changes in ground
surface form from slope crest to toe has been previously achieved with this sampling
framework (AIIison et al., 2000). The use of five sample points retains enough resolution
to examine surface form variability, without measuring all clasts on a profile. The selected
profiles are located on the DEM, total profile surface length is calculated and plot locations
systematically located at even intervals down the profile length. The aerial images are
then used to verify the suitability of each plot position relative to atypical ground surface
coverage. The co-ordinates of plot location are downloaded to the DGPS as waypoints,
which can then be navigated to and relocated in the field.
The field based research in this thesis is two-fold: first surface characterization, and
second, an assessment of surface hydrology. The two strands of the research require
different methods of plot location. The surface characterization technique (Chapter 4) is
based on a plot area of roughly 8 m by 6 m, a total of 32 m2. This plot is qualitatively
located again using the high altitude image obtained from 100 m for each slope (Figure
3.11 ), and the high resolution DEM. This mechanism avoids atypical ground surface cover
and other anomalies on the surface. The experiments on surface hydrology (Chapter 5)
are logistically restricted by plot size to an area of 0.5 m2, 0.5 m by 1.0 m. To assess the
degree of heterogeneity in surface hydrology three experiments at three separate plots
were conducted at each sample point. A plot of this size is subject to heterogeneity in
surface hydrology, irrespective of the presence and variation of surface clast cover
(Agnew and Anderson, 1992). The heterogeneity of ground surface coverage, especially
where a non-uniform surface distribution is present, can only act to exacerbate this effect.
- 71 -

Chapter 3: Site selection, description and sampling
(A) - clast removal in preferential flow path; (B) atypical ground disturbance
Figure 3.11 Example (midpoint of profile ST) ofthe location of the surface characterization plot within the 100 m altitude aerial image
A quantitative method of locating the plots used to examine the surface hydrology was
developed. The objective was to delimit a plot of 0.5 m2, within which the ground surface
cover represents the mean ground surface cover of the whole image analysis plot (32m2}.
At the crest, toe and mid-point of the three slope profiles selected, 10 randomly located
plots of dimensions 0.5 m by 1.0 m were positioned within the area of the image analysis
plot. A basic measure of surface form for each plot was derived, using the method
developed in Chapter 4. Surface hydrology plots are always oriented with their long axis
downslope. The three plots with the closest mean percentage ground coverage, mean
edge length and mean intermediate axis dimensions to that of the whole surface of the
characterization area were selected for the surface hydrology experiments (Figure 3.12).
Each hydrology plot can then be considered to be statistically representative of the mean
character of the surface at that sample point on the slope profile. The co-ordinates of the
four corners of the selected plots were located within ArcGIS 8.1, and then navigated to in
the field using the DGPS.
- 72-

Chapter 3: Site selection, description and sampling
Plot Whole 1 2 3 4 5 6 7 8 9 10 image
Percentage 35.88 67.89 22.14 41 .65 36.40 33.67 50.54 37.62 57.93 55.00 39.64 cover(%)
Mean edge 0.479 0.556 0.602 0.337 0.462 0.501 0.764 0.446 0.655 0.563 0.462 length (m)
Mean 0.125 0.298 0.462 0.527 0.201 0.169 0.155 0.487 0.552 0.110 0.722 intermediate axis (m)
Figure 3.12 Example of the location of hydrology plots within the surface characterization plot and mean surface characteristics for each plot (example- CV middle)
- 73-

Chapter 3: Site selection, description and sampling
3.3.6 Subplot scale
Although it is not necessary to further define a link to a lower scale than the plot, the sub
plot remains of critical importance. The sub-plot scale is that at which the level of variation
between individual clasts is apparent and is the scale at which many of the processes on
the surface act. lt is at the sub-plot scale that the surface characterization and surface
hydrology addresses variability in surface form and process through high precision and
accuracy of measurement. The nature of the study is such that small scale variations in
form and process can be aggregated up to the plot scale, to evaluate geomorphological
variations between disparate locations. 1t is hoped that the precision of the techniques
employed is such that data at the sub-plot scale that is of relevance, and is appropriate to
the investigation, can be collected from the plot scale.
The development of a semi-quantitative, nested sampling strategy based on a
consideration of scale, location and adequacy has selected a series of 7 sites, with a total
of 35 sample points. Within the sampling framework, variations both within and between
basalt types can be assessed. Three sites have been selected to specifically explore the
link between slope form and process in the context of a single basalt. Additionally, sample
sites have been selected such that comparisons between surface form can be compared
between geologies. Logistical limitations and the requirement for highly accurate and
detailed data mean that not all experiments, specifically the surface hydrology, can be
conducted within the scope of this study. The approach favours a concentration of
intensive studies at a series of statistically selected sites, rather than aggregated statistics
more crudely collected from qualitatively located plot locations.
- 74-

Chapter 3: Site selection, description and sampling
3.4 Site descriptions
The role of each site selected for the study has a different purpose. The level of
investigation at each site varies due to the purpose of the investigation at each slope
profile, which is ultimately dictated by logistical constraints (Table 3.3). Sites CC, CV and
ST are the focus of the investigation. CC, CV and ST are abbreviations of concave,
convex and straight, respectively, referring to the slope form of each profile. At each of the
three profiles surface character and surface hydrology are assessed. The location of the
sites allows comparison both within and between basalt types, on a variety of slope forms.
At the remainder of sites surface character is assessed alone. A greater level of
description is given at sites CC, CV and ST, which is of relevance to the extrapolation of
results from the surface hydrology characterisation. The description of each site includes
location, topography, slope form, geology, geomorphological setting, ground photographs,
and in addition at CC, CV, and ST, sediment character and large scale aerial images of
the whole slopes are presented.
-75-

Chapter 3: Site selection, description and sampling
Site Sample Name Surface Surface hydrology point characterisation
Concave cc Top CCT X X
Middle CCM X X
Bottom CCB X X
Convex CV Top CVT X X
Middle CVM X X
Bottom CVB X X
Straight ST Top STT X X
Middle STM X X
Bottom STB X X
Swayed 1 SW1 Top SW1T X
Upper SW1U X
Middle SW1M X
Lower SW1L X
Bottom SW1B X
Swayed 2 SW2 X
Top SW2T X
Upper SW2U X
Middle SW2M X
Lower SW2L X
Bottom SW2B X
Qa'a al Buqei'wiya GW1 1
Top GW1T X
Upper GW1U X
Middle GW1M X
Lower GW1L X
Bottom GW1B X
Qa'a al Buqei'wiya GW2 2
Top GW2T X
Upper GW2U X
Middle GW2M X
Lower GW2L X
Bottom GW2B X
Total 29 9
Table 3.3 Field site names and description of investigation
-76-

Chapter 3: Site selection, description and sampling
3.4.1 CC D site description
CC was selected to assess the link between surface form and surface character on a
concave profile form (Figure 3.13). The profile crest is located on a bedrock outcrop,
where jointing structures and rockfalls are evident. At the crest location the ground surface
is dominated by bedrock and large angular clasts. The surface of the slope is typical of
Aded basalt, exhibiting an open matrix of sharp, well varnished clasts, with a large mean
size. The nature of surface character changes downslope and in places is distinctly non
randomly distributed. The profile toe is at the margin of the wadi bed and is clearly defined
by a rapid change in ground cover and slope angle (Figure 3.14). No evidence of ground
disturbance is apparent. Vegetation is all but non-existent throughout the year. Figure
3.15 is a high altitude aerial image (1 00 m) of the profile location, showing nearby
geological anomalies and the structures in the wadi bed at the slope toe. A noticeable
transition in the ground surface sediment character is apparent (Figure 3.16), with fine
basalt fragments at the crest, whereas fine light coloured silts and clays dominate the toe
locations. Plate 3.3 is an oblique photograph of the profile. Plate 3.4 is a low level image
(12 m) of the profile midpoint.
30 Slope characteristics:
c 0
20
~..-....
ro E > .......... Q)
w 10
0 0
Length (m) 99.38 Height (m) 25.34 ~n.~r 0.~2 Orientation (degrees) 171
20 40 60 Distance (m)
Figure 3.13 CC- Slope profile form description
80 100
- 77-

' ' ' \
I \ I
\ I
J
Legend
,-,--,.
0 30
Chapter 3: Site selection, description and sampling
Profile
60 120
Gravels
Active wadi channel
Clastic wadi deposit
Marab surface
Bedrock outcrop
Clff
Break of slope
Smooth break of slope
,-. .,'b 71
~ '". ~
'·· _'ti\. ,J " ' ·,I
180
v .... __ v'--___,v...__ .. v_--J#\1 Sharp slope break 0 c ·~ 0.3 4m contours I I I I I
Figure 3.14 CC - Geomorphological map, illustrating profile location
- 78-

........ ------------------------------------------------ ~---
Figure 3.15 CC- 100 m altitude aerial image, showing profile location
. - - ~ ~· -,~~ ,.,:..r .... ~-!" .~;..;. .... ,~; ';A"'l!-'f:{\"!.·:·· - ·'·. - . ' : . .. """'· • -;:;r?J>·}t..';"~~; ~,-.~ __ .-:,:·r-: · •. -. ~ ·. ·..; ,,... ~~ •• · "' .. -~~· .... !-i ,~...,:~ .. "'~"'~,......tit" ~- ..... ...~~ . .. .. - .... _.'!; ~ 'lJ.. ... c-~:,~...!- ·~':. Y{l··'·~-)'i~\. ··> _.,_> ~ :. ,_··-~ · :- ..... :~ .... ~-- ... _ ... ~- '•.l) v':~ t..:,...,-. . • !.1' ~-~ "'A~·~':IIt-.- ~ ; ""'':~ , ~V ~ t-::~ .... ~~·"(.:-:-;"" • . ~ • . ~ : ; ._-:~, ~·c
1 _..-<'(•· ... -~,- '-.:} . ~~ "}, ~ .. ~ ,-.. .~. /'.~-\~~···~ ··ll'' ~:):.-~~,( .;~· ._"'/:~•'):· -~ .;. . ~!~· :lv~~. ~ .· . -.. --· .· _,_""~ -~ .. ·-.; .. -,· . ..,_ . - . .,. ..... ~ "' ~ : ~ ·,~·,.::l~·~)ti·:~<,~_;-4:£:-~~;;~! ._ .... :~ ... -~ . . ·". ~- .:, • . '-"·.-.. ·~L ,,, '""-:.0~.:' >. • • ~·' ~--•
. . ... ~. .... ~ .::--" .. ~~--\ "'!ti.,~,.n· :0,"}~--""?;,. . . "1.: ~-~~~« 0€~ .... - -w....-:t. ·~"7 • . ~ ..... ..,., "'~. ~,,~~ .. . ~~~§~r-::, .. ;i.:.·:-.... _c-~':-i-;-~?k":::..·~:'(·.}.'-.. ~ .. ..: ' !t'i. ·• ·-::~
... """"· .... ·-~· / .... _·...:~- ;1'· ··-~- , __ 1;.".!,. :x ..... .,.,. -=-"--.111 .. - , ..... _ ...... "'T">:: -~~7 . .. ..... ... • .... ~ • • ~ -~ . -~. ~·. ·---1.!!. ~ ...... ~ ... ~~ ···- - . ~ :'!:~···· - ·-
1.-~···~ -;; ·~ii'":;.-,. ~-. '. -.. ·,..;-._;. ~~~7-
,. •• r ... tJ ~,- ..;&1 ::tr.<~: 1' .. ·.• ~~~: ~:·~ ,_ ~ .-'· :"t~4:·-..!'-~o~.: .. ., ~' ~- ~·· ~?'i ..,. .. : ~Ill. 4i{r.r:..-, ... ~.""· ¥. .... ~-~;'\. '4 r.:.,.... .... , ...
¥. .: ,,--- :1~~\~,-~,- ..... t.4";! • ~~~ -~-:":':~-;;.. •• .;. ·.; .. :~. ;_· . .. : ........ •t ~ ; .. ·.~ l: ~i'!·~~~~·,';l-..... ~i-~·~-:··~.i'~·'.:: . ·'-.;,\~··.:,.,.~-~-.:: . . .. -.~ . 'N'. i.~l . .... . .,. _... ·~ -- .. Jl"-~ . .. ~ - ..
~ • ., v'~~~ .• ><--...:· -/'?') ._, -..' ~- > ••. · _,. ~·· ••• ~. ""1Y ~ .. ~P.t' ·:.<-s-~~ ' ~ .~,;~ ...... 7:.'l..· ... ; • 1 ••. ;' ... ~ . ; .-· ~ • -~~~ -·~ • '; -;;- ; ~ .... , ..... -~~-:-- . · .. • . .._ .. _. .. ;.-.. -~ ~. ·-~-:.--: •. ;-: .~ >: ::-' ': : ~ --'\1~~ ~ '"itlt~~~~-... : c;·. ~- .-;-... -r-1 . •• ...., ............ :_ .... {. ~·· .·.•,; i'~ ·-~ ... -- ':! ",...:1_ .. . . ~-. ~ :;.- • ~ ....... "''' "'• . -s •Vg·~ ~,~ i';:' .. ..,,; ... ..:-.:. .;'-"·: ~~t:· ,. -:~ .__ ... ".i:,Af:r.:;;-: ,~ .... ~ .... ~ .. Jt:···~-. ~ . .: ... ~· .......... ···~\-; ..... ~;. 4 • '_ ••• ·~ :. •• ~ •• •• ··."" '::.~ •" ..... :" .....
~ .. tt.·.·:~-~-.cd!.·l• ... ·:~ : ... :,:·.~:-.t · •... · ......... ' ;:-.:",-; .. ~--- ·-. · • ,r'f"JP'-- · • ... •. • .: .. ~ . -" )" ;_. •,~ .. 1 .• • -.,.. ~,- ••:" .... "!-... :-. • • ~ -~ ......... 1.• .... ' - ·~> ,_ .. '··. ····- ' . ~--··--. -· .• , _w • .• .., .,...,./. -,--. ~ ', ..., .=".... •• ~.. "' • ~ • • • .- -: ••• ~ ... • , .... . "*'fi.!.:;' ~ ;o.> .; l"' .~~:• . ~ .. _. .. -:, .;. .,; r ;_ ._..._ ,. ; • : . . • · ·;; '-~._ • - ., __ 'Jl' "•· .• -~· ":"f·( .. -:,,. .... _. ..... ..... >...,."'!,, .-.. ·#':~ ..... ...-: ~ ·, ..... ·!·- '\.' -. -4i.! .... , ... "'. f' • . ' \ . ' . . . .: '. .... ;: .· . ·--.jf .. ~:· ·;.• . )" + . ~ .;c, .. ' . . . ... .. :, ·· ..... -'·>-,; :, .. -~·-~ •' ,.-..· .. \# ,..~,.··':\• ~ ·:. A " • ,· ' 0 :;..)~• ·.=--!'!:~ 7,. • •J • -:-;.~'!o :~ T~~t• - .... -~ . ~·· .. } . .. "'~ ...... c profile . ' · .. :.., .<.:. '1':'.~ re........... .~:~··' : •. : . .. ' . \ ~' -~~)' ' ·• ~ . .~ -. ··.. • ·. ;/:.:.>_.::: ... _ ..... ·--~~-=·~· .... -:~ ~3" -~. • # ·' \ " • , l .. •._: ... ' . .,. -· · -~~~-·"r~ ..-.:\·:• I .... ...,_-.~.t'., .. i"' ;4._':',~~~ ...... ..,....... •_. ~) ~!=-' • • ~· -;. ... { f .L,;~ •. ~ .. •','•..- '.:"'~~~, .. "'',~~"' ~ ....... it l'. ~- :~\ .· ~:<. :..~·. !_!:: .. · . .. ~ ., "".~.~~i"'~· .. ·~~·~,-·1>~:;._,."':" .... :" ~-~ r ·.~:.:.~:·-...·,.· :;_ • ,··· r ·;."· ·,·:.!~·: ···~~ ... ~.lt-~-~
. -..' . ...,. • .. ·~ ~4. ... ~ .. (_,-... "'•'"" CJ'!" '1., .. -.::--! .,~ . ~~-<--~~'-\":1 & .. ,,b .... -.. •.j- ... ;:-t·f':'·'' -~1-~, to.··!(:~:~.~~·~ .. ' ~ ;. ; p; -o;:~ v~ · ... · r~·· . ' -·: ;', ';• .~:i" ''!:: -;t.? -~ ~- ··: ~~ ·:·~:-r. ~ .. --~·, •- • " ~ ..... > .• '·' • A t . ~. • ~ • i • '-t\ · ...... • ~, "i:.•},~ ... ~·-·l"·f:\t~ c ·; . . T.. \ ., I • • • • ~ \..!' • '1, ~ • ·L'-·· ~ •.. 'iO>.~~· • -. - ,"',.·-t. • · .• ~~ "·*· • .';Jirr..&:., ... ~ ~-- ~ ·~;.·..;·.· t~~~---· .·
~- .,..·~- .,; :!.'· .. ~. ·, .. j.·~~--~---~~~~~ :.;.;'t~~~~;S''t~-~~~-:~ . .:.:t~. ~ . , , • ' • .:" ·l..c: •. 1 • • ~'\ no ~ ~ ~
. , - . . •, .-; . ';".~- ~~ "':'• ~ :.~'J.l'i-"'t~· ~ -. ..:;::i. • -.' , .,. ' . u - -~ ..,.. ·t-• • ~ .... • . \ ~o.:~ .... +. ······~ ¥:. '1~·~-~~~- ~.;. ·l· ' ~ ~ ~ f .... . ;> • ~ -~.!>. • ~ .... ., .. I.·.. • ~... '1•·c. • i:..:.t.-: ;~: .· ·&t ... ;. :. ,
11- ·. . • • .• , • . • . • ~- t • "'" l.'"lil~~- .:!~. tr. . • ...... ,~ ... ~~'<! t· .. , .. ,~~ ,:~ ~.~ ,.,}~ ~ ... • >& ., .... ,) •.• ,j,-~\ • •"'. • ~ • • "· "', ~ · ~~"·' •,1"'1-~ *""'! ..... ·.·,•" ... rJ • 'I··J ..... ., ... , .,';:/~_'-''~ .. " .. "" . ' , ... -.:. , ( 'i: ..,..~~ ·.,\. \ . ! _· . . · • '~ •. • , , ._' ,. ~-I s.,.. "'- . .' . ..... ... . -_, ..
I " , .. .,. • '.. - : ' • ..-: '1 ,4'1. • .,\,) 0
' • •• . .. • '1 ~~~ -~ ·~ • • . "" ·. L. .. ·,.··: _ · .. ~.}.:"~·f.9. n:t v," ...._. Ill" ' ·' 1 .. ._.. '·'· • -~.,· • ' . ~ ''l-.~ •. ~! ;. / ·~_-\.1. •. -...'1.\' ,~ ~... .. 4 -
Chapter 3: Site selection, description and sampling
Figure 3.16 CC- sediment surface photographs (scale in mm)

Chapter 3: Site selection , description and sampling
Plate 3.3 CC - Oblique photograph of profile
Plate 3.4 CC- Example of ground surface cover (example CCM)
- 80 -

Chapter 3: Site selection, description and sampling
3.4.2 CV- site description
CV is a convex profile site specifically selected to look at the linkage between form and
process on a convex slope (Figure 3.17). Its location is close to ST and CV, such that the
geology can be considered the same. The slope is located on a basalt outcrop which is
incised on two sides by deep wadi channels (Figure 3.18, Plate 3.5). The profile toe is
bounded by an abrupt transition to wadi bed gravels and a distinct break of slope. The
ground surface is typical of the Abed basalt exhibiting an open matrix with large clasts
(Plate 3.6). A distinct variation in both clast and sediment surface character is noted
between the crest, midpoint and toe plot locations (Figure 3.19). There is only limited
evidence of carbonate deposits both at and beneath the surface (Figure 3.20). There is
considerable evidence of gypsum deposits at the margin of the weathered bedrock in the
soil profile.
15 Slope characteristics:
Height (m) 46.08 Length (m) 12.02 ken.par 0.649 Orientation (degrees) 205
...-... E 10 .......... c 0
+=' ro > Q)
w 5
0 0 20 40 60
Distance (m)
Figure 3.17 CV- Slope characteristics
- 81 -

Chapter 3: Site selection, description and sampling
7 "::-
X '?
0 ~ l "o X ~ \ f\
1 + L7 J '. }- \J
80 120
Legend
Gravels
Active wodi channel
Clastic wadi deposit
Mnrab surface
Bedrock outcrop
Cliff
Break of slope
Smooth break of slope
II.Y.-....M.v-~v-,_...ljv~___Jjv Sharp slope break
4m contours 0 0.15 0.3
I I I I n~
I I
Figure 3.18 CV- Geomorphological map of profile location
\ \
\
\ -">._ \
\ \ -· \ J~ "'\
i
\
-82-

Figure 3.19 CV -100 m altitude aerial images. The arrow indicates slope direction and the scale bar = 10 m
Chapter 3: Site selection, description and sampling
Figure 3.20 CV- sediment surface images (scale in mm)

Chapter 3: Site selection, description and sampling
r , - - - -- - - ~ • - ~ . . ~- • ~ 1.> I
~i·~~ ~~~- 4-j..:p- ~~or--; • .:=~~<· ~: ,'f .. ;..' ~·5 .·.;~t. ~-~~~ ~~~~.-~~-· ... ~~. };~1~~---.p~·-,·~···l·=!-~- ~-~-;t~f;·l .. : ":4£ ~~ .i.~·/··"
Plate 3.5 CV - Oblique photograph looking over profile
Plate 3.6 CV- Example of ground surface cover (CVM)
-84-

Chapter 3: Site selection, description and sampling
3.4.3 ST- site description
ST was selected as a test of the relationship between slope form and process on an effectively
rectilinear or straight profile (Figure 3.21). As such this location acts as a control for the other
sites in this study, where the complication of convexity or concavity is absent. The crest of ST is
at a bedrock outcrop, but at a significantly lower angle than that at CV (Figure 3.22). The profile
shows variation in surface character between the crest and the toe location, with considerable
evidence of non-random clasts distributions (Figure 3.23, Plate 3.8). The clast cover is typical of
Abed basalt surfaces (Plate 3.8, Plate 3. 7). Considerable ground disturbance is apparent at the
toe location. The bottom plot location was carefully positioned to avoid such disturbance. The
ground surface at the slope crest is dominated by carbonate nodules and fine basalt fragments,
whereas the toe of the slope has significant aeolian deposits (Figure 3.24).
20 Slope characteristics:
15
.-E -§ 10 ~ ro > (l)
w
5 -
0
0
Length (m) Height (m) ken.par Orientation (degrees)
50
204.71 19.14 0.494 335
100
Distance (m)
Figure 3.21 ST- Profile characteristics
150 200
- 85-

a b
I )g'U V
p
f b
l <> " {
c i:. -
...._ I' <i
V" '<l. 7
V "v i ~ 0 62.5 125 250
Legend
f_;~:i:{t.:\~:~[f~:i:·/fi:=i5:·j(~~ Gravels
~ Active wadi channel
.. .. •
V V y
Clastic wadi deposit
Marab surface
Bedrock outcrop
., ._ Cliff
V V
Break of slope
Smooth break of slope
Sharp slop.e break
4m contowrs
Chapter 3: Site selection, description and sampling
\
a x-*
375
Figure 3.22 ST - Geomorphological map showing profile location
-86-

Figure 3.23 ST -100 m altitude aerial images. Arrow points downslope and scale bar = 10 m
Chapter 3: Site selection, description and sampling
Figure 3.24 ST- Sediment surface photographs (scale in mm)

Chapter 3: Site selection, description and sampling
Plate 3.7 ST- Oblique photograph looking down profile from crest (pickup in distance for scale)
Plate 3.8 ST -Example of ground surface coverage (STM)
- 88-

Chapter 3: Site selection, description and sampling
3.4.4 SW1 and SW2 - Marab Swayed
Sites SW1 and SW2 were located at Marab Swayed (Figure 3.25), avoiding ground
disturbance and atypical microtopography. The two sites act as comparisons for the
results of the surface characterization generated from CV, CC and ST and allow within
basalt comparisons to be made on a larger sample of slope profiles. The two profiles are
located further down the Marab Swayed catchment, where the channel of the Marab is
less constricted and the side slopes are significantly shallower .
N
A 0 0.2 0.4 0.8 1.2 1.6 w w Kilometers
• ST
Legend
Tracks and Roads
10 m contour
Sediment depoSits
Figure 3.25 Location of SW1 and SW2 at Marab Swayed
-89-

Chapter 3: Site selection, description and sampling
3.4.5 SW1 - site description
The crest of profile SW1 is located on a bedrock outcrop. The profile is on one of the
series of truncated spurs on the Marab side slopes as it becomes progressively
constricted up catchment (Figure 3.25). The profile toe is located on the flanks of the
Marab surface, in an exposed position (Plate 3.9). The profile is effectively rectilinear
(Figure 3.26), and exhibits some of the best evidence of non-random distribution of
surface clasts (Plate 3.1 0). Variations in ground surface cover are visible in the field
between disparate plot positions downslope. The surface is typical of Abed basalt, with
some a greater level of lichen growth (Plate 3.1 0). Additionally, aeolian deposits are more
significant at the toe, as are carbonate nodules.
15 Slope characteristics:
10
5
0
0
Height (m) Length (m) ken.par Orientation (Degrees)
100
12.16 252.51 0.514 210
Distance (m) 200
Figure 3.26 SW1- Profile characteristics
-90-
300

Chapter 3: Site selection, description and sampling
Plate 3.9 SWt- Oblique photograph looking across profile, looking west down the Marab Swayed catchment towards Safawi
Plate 3.10 SWt- Example of ground cover with noticeable non-random clast distributions (SWtM)
3.4.6 SW2- site description
- 91 -

Chapter 3: Site selection, description and sampling
Profile SW2 is the longest and shallowest angled slope used in this study. The profile
crest is positioned on a bedrock platform at the drainage divide of Marab Swayed and the
toe is located at the Marab edge (Plate 3.11 ). The profile form is rectilinear (Figure 3.27).
The definition of the Marab edge is not clear as clasts become progressively deeper
buried to the slope toe. Evidence of inundation by standing water at the toe locations is
apparent. Scour marks around clasts indicate high velocity overland flow. The site shows
some variation in surface character, but this is not as marked as that seen at SW1, or
further up the catchment. The clasts at the site appear to be smaller and have a more
rounded texture than those at the other sites (Plate 3.12). The underlying sediments
throughout the slope profile are fine silts and clays with few carbonate or aeolian deposits
apparent.
-E -...... ..c 0> ·a; I
6 Slope characteristics:
4
2
0 0
Height (m) Length (m) ken.par Orientation (degrees)
200
5.16 489.61 0.436 007
Distance (m) 400
Figure 3.27 SW2 - Slope profile characteristics
600
- 92-

Chapter 3: Site selection , description and sampling
Plate 3.11 SW2 - Profile location taken from profile base looking upslope to the crest on the horizon. The Marab floor in the foreground is dominated by coarse sediments.
Plate 3.12 SW2- Typical ground surface coverage, showing a high degree of clast rounding (SW2M)
-93-

Chapter 3: Site selection, description and sampl ing
3.4.7 GW1 and GW1- Qa'a al Buqei'wiya
The sites at Qa'a al Buqei 'wiya were selected to enable comparison between two further
basalt types. The location of Qa'a al Buqei'wiya relative to Marab Swayed and Safawi is
shown in Figure 3.29. The site locations (Figure 3.29) were selected in the field , avoiding
atypical microtopography and atypical ground surface cover. Both profiles are located on
the northern margin of the Qa'a. The two profiles are based on separate basalts, GW1 on
the Bishriyya, and GW2 on the Madhala, the limits of which can be identified on the
LandSat TM image (Figure 3.28).
(Bands 7, 4, 2; path 173, Row 32. 12N, Date 29.03 .92; Huntings Technical Services)
Figure 3.28 LandSat TM image of Qa'a al Buqei'wiya, highlighting the location of GWl and GW2
-94-

Chapter 3: Site selection, description and sampling
\?
~
~
'
~ '
p X
e, I ~
\) '· "'~
;~'l
I
~ f
"\
~ )~~ ( / kJ
)/ //
/"
!l) (_
~~
,,
~
'~? 't-
''u 0!?
'1 p- -(!' ~ /!J
;;f~ J ...{ ~ (?J f"i;~~ n v1 ~ ...--=-l (::::::::::::/"' \\ ~ J ~ .... ~ ,~ ... c ' )' / "' ((,
o ~. \ \ .A' P 1. · \\ ( ~~ ) - )~ ~"\,_ \~ ~ /,,' )) ~--"" .') 1- r ~) ---~~ "\(, /~ \L -j' ··)· I j) ~ ( k 'i- b ~~ :\·\ ~ ~ 1\
1 t--,. ~ ' 0 / 1 ~ f j "~ . \ •. ' . . =;;:l:~\~·--.. ~~ }r ¥ J #( \ ~J . l ". ., = ··"" Jw \ ~-·")V~( ·· J , J ' . Legend
"""
/\ ~-·
I \ ,.)
/rJ '
· ...... ""'\ ,..,- {
'1
,., 'f7•
)A -~,--..,....,~,'~ I \' ~ \ \' ' ~ , ··~ ~~ i/'\f1\. 0 ~ 1 2 4 ' 6 8 _ - -~ ·~~ D Sediment deposits
y~"-,. . _ . .. .. K1lo~eters ~, \~ 1 Om contour
Figure 3.29 Location and extent of profiles GWl and GW2 at Qa'a al Buqei'wiya

Chapter 3: Site selection, description and sampling
3.4.8 GW1 -site description
Profile GW1 is the only profile in this study located on Bishriyya basalt. The ground cover
is characterized by typically rounded and well sorted clasts. The sediment surface is
mantled in places by carbonate nodules, which at points form continuous pavement in
between clasts. The profile crest is located on an exposed dyke of bedrock. The toe of the
profile is located on the margin of the fine Qa'a sediment deposits (Plate 3.13).
Organization in the clast surface is apparent (Plate 3.14). The profile is positioned in the
northern corner of the Qa'a, in a relatively enclosed and sheltered location. The surface
sediment exhibits a notable vesicular layer or horizon at points, especially around the
margins and beneath surface clasts. Clasts are in parts faced with lichens which tend to
be oriented to the north. The levels of ground disturbance in the area are low. The profile
is relatively long and shallow (Figure 3.30) and is typical of the slopes on the Bishriyya
basalt surrounding Qa'a AI Buqei'wiya.
-E -..... .c. .Q"l Q.)
I
15 Slope characteristics:
10
5
0
0
Height (m) Length (m) ken.par Orientation (degrees)
11.51 220.24 0.414 125
100 Distance (m)
Figure 3.30 GW1- Slope profile characteristics
200
-96-

Chapter 3: Site selection, description and sampling
Plate 3.13 GW1 - Oblique photograph looking from the crest down the profile, with Qa'a AI Buqui'wiya in the distance. (Monopod camera boom in the foreground for scale)
Plate 3.14 GW1- Example of ground surface cover (GW1M). Of note is the distinctly non random clast distribution at the lower points of the slope profile
-97-

Chapter 3: Site selection, description and sampling
3.4.9 GW2 - site description
Profile GW2 is located on the Madhala basalt, which shows the greatest departure in
surface form from the other surfaces previously described. The profile form tends to
convexity (Figure 3.31 ). The surfaces appear to be dominated by a bi-modal distribution of
surface clast sizes. Large clasts are interspersed by smaller fragments (Plate 3.16). The
clasts are commonly faced with lichens, which are oriented to the north. Clasts are both
angular and rounded and there is a clear variation in surface character from the crest to
the bottom of the profile. The slope profile is located on the northern margin of the Qa'a.
The profile crest is located on a bedrock outcrop and the toe is located on the edge of a
wadi which feeds directly into Qa'a AI Buqei'wiya. The profile shows no evidence of
ground disturbance (Plate 3.15, Plate 3.16).
-E -..... ..c .!2> Q)
I
6
4
2
0
0
Slope characteristics:
Height (m) Length (m) ken.par Orientation (degrees)
50
6.24 133.11 0.55 136
Distance (m) 100
Figure 3.31 GW2- Slope profile characteristics
-98-
150

Chapter 3: Site selection, description and sampling
Plate 3.15 GW2 - Oblique photograph of the toe of profile, monopod camera boom for scale
Plate 3.16 GW2- Image showing an example of ground surface coverage (GW2M)
-99-

Chapter 3: Site selection, description and sampling
3.5 Conclusions
A semi-quantitative method of sample sites selection has been developed based on both
previous work, field observations and a consideration of the issues of scale, location and
adequacy. The need for a scaled approach to studying the surfaces of the Badia is
important. Location is the dominant control on surface form. A method of systematically
locating sample sites has therefore been developed. The method allows the results
generated from the plots to be considered in the context of the wider geomorphological
system of the northeastern Badia. The use of adequate methods of characterizing both
the variations in surface form and the nature of surface processes within the sampling
framework has been discussed. The sampling framework has been designed such that
the scale of investigation at each level in the hierarchy is of relevance to the formative
influence which dictates surface form.
- 100-

Chapter 4: The characteristics of ground surface form
- 101 -

Chapter 4: The characteristics of ground surface form
Chapter 4: The characteristics of ground suuiace form
4.1 Introduction
Links between surface form, slope process and landscape evolution on coarse clastic
desert surfaces are poorly understood (Vincent and Sadah, 1995). Only by gaining a
detailed and appropriate characterisation of contemporary form can links between form
and process be explored further (Dunkerley, 1994). Attempts to characterize coarse
clastic surfaces have produced a diverse and inconsistent range of methods and
approaches (Poesen and Lavee, 1994). Adequate techniques of sampling and surface
characterization vary between both the location and the purpose of the investigation
(Dunkerley, 1995). The slopes of the northeastern Badia show a marked and systematic
variation of ground surface cover has been related to slope form, geology and position in
the landscape (AIIison et al., 2000).
The aim of this chapter is to characterise the variation in the surface geomorphology of
the northeastern Badia. More specifically the analysis is designed to develop an
understanding of the controls on the form of the boulder mantled surfaces, through an
analysis of surface features which are indicative of process action. The influence of
geology has previously been noted, but during the site selection a considerable variation
in the nature of slope forms was noted (Chapter 3). The relative influence of slope form
compared to the influence of geology is explored below. Finally, an assessment of the
spatial character of surface clast organisation is discussed. This is designed to look at the
spatial properties of structures on the surfaces, which in this context have only received
very limited attention.
The aim of the chapter is further clarified by a series of objectives which form the structure
for the discussion of results. The principal objectives are: to assess the nature of surface
character indicative of modification by slope process action; to examine and differentiate
the role of slope and geology on ground surface configuration; and to examine the spatial
characteristics of the surfaces as an indicator of the nature of slope surface dynamics.
This chapter explores this variability further by developing a new image based technique
for characterising the in situ nature of coarse clastic surfaces. The method develops highly
detailed information on surface via a wide variety of variables. The technique developed
operates at a level of measurement precision normally achieved at the plot scale ( 1 o-2 to
101 m2}, but here applied to a large spatial area of the order of 50 m2 is used. The results
- 102-

Chapter 4: The characteristics of ground surface form
presented are generated from the seven profile sites, selected and described in Chapter
3.
4.2 Previous work
4.2.1 Work in the Badia
The nature of the surface clasts in the northeastern Badia is the clearest link between the
geomorphology and the underlying geology (AIIison et al. , 2000; Tansey et al., 1996).
Allison and Higgitt (1998) developed an assessment of ground surface cover which
developed variables of direct relevance to surface processes, specifically slope hydrology.
The method employed a measuring clasts in a 4 m2 square quadrat if the intermediate
axis exceeds 0.1 m. A quadrat base technique was favored above a grid-node sampling
framework. The bias induced by the higher probability of larger clasts falling beneath grid
nodes is of greater significance than the potential misrepresentation of small scale
variability in surface character in the quadrat technique (AIIison and Higgitt, 1998). Each
clast was measured in major, minor and intermediate axis dimensions in addition to the
length of the convex upper and lower clast perimeters, which were later used to derive
clast burial approximations (Figure 4.1 ).
Side elevation
•-.·axl.,__ I I I 1 Upper curved
a·axia
Lower curved a·axls
Plan form
•-a·axls- 1 I I
End eleVItlon
b·axls ·-1 Upper curved 1 b·axls 1 I I
Lower curved b·axis
Exposed part of clast
"" GrouO<I sur1ace
::"'<'7/~---
Angle of slope
Figure 4.1 Measurements of surface clasts (after Allison and Higgitt, 1998)
The measures derived by the hand-counting method were used to equate averaged
ground cover characteristics for the whole quad rat area, a widely used measure of clastic
surface form. For example, an approximation to percentage ground cover was derived
- 103-

Chapter 4: The characteristics of ground surface form
using an elliptical function to derive the surface area of each individual clast. The
cumulative total estimates clast cover percentage (Higgitt and Allison, 1998, p. 17 4 ). The
authors argue that this method generates a more precise measure of the actual
percentage ground cover when compared to calculations derived from the mean clast size
for the whole quad rat.
The approximation of variables, for example percentage ground surface cover, rests upon
several assumptions of the clast and surface form. First, the surface area of the clast is
assumed to be synonymous with the area of a planar surface projection of the major and
intermediate axis. As such, the statistic assumes that all clasts reside in or on the
sediment, with both the major and intermediate axis lying parallel to the ground surface.
The degree to which this approximation corresponds to the actual planimetric ground
surface cover has not been assessed, nor has the collinearity between clast burial and
size and ground surface cover. Second, the contact perimeter, or clast edge length, which
is a covariate of planimetric area, has been cited as a critical control on slope hydrology,
providing a route for the exchange of gas and liquid between the sediment and surface
(Poesen et al., 1994 ). Under this characterization method the statistic assumes that clasts
are buried to their maximum perimeter. For example, a perfectly spherical clast is
assumed to be buried to exactly half of its diameter; its edge length is therefore equal to
the circumference. Third, clasts are assumed to have perfectly elliptical form about their
major and minor axis. From observation clasts in the Badia are frequently faceted and
angular.
The implication of the assumptions of the hand-counting method mean that if the statistic
is employed to relate surface form to hydrology, contact perimeters and their influence
maybe overestimated where clasts stand proud of the sediment surface and have the
converse effect where clasts are buried. The statistic may not be appropriate for
examining surface hydrology or infiltration. The statistic is more applicable to examining
sediment areas exposed to raindrop impact which is of importance in the open surface
matrix of the northeastern Badia, but less useful for examining the role of clast-sediment
contact perimeters on slope hydrology.
A wide range of results generated from quadrats at 5 plot positions on 25 profiles has
been reported, and later summarized by Allison et al. (2000). The number of clasts
recorded in each quadrat ranged from 13 to 151 with a mean of 67.8. This variation in
clast number reflects both the underlying geology and relative position of the quadrat
down the slope profile (Alii son et al., 2000). The extent to which the variability between
plots reflects local heterogeneity in surface cover has not been assessed. Conceptual
- 104-

Chapter 4: The characteristics of ground surface form
problems with the use of a quadrat to assess surface form variations are apparent. As
slope length decreases the quadrat size approaches the length of the sampling interval
between quadrats. Variability between quadrats may become masked though the relative
size of the quadrat to the whole slope length is perhaps negligible on slopes as long as
those described here. The previous technique employed a minimum clast size filter at 0.1
m intermediate axis, for ease and speed of data collection. There is substantial
documented evidence of the importance of the finest fraction of the clast population (< 0.1
m intermediate axis) in controlling water partitioning between the surface and underlying
sediments on coarse clastic surfaces (Poesen and Lavee, 1994). A more detailed
resolution of characterization may be more appropriate for understanding the links
between surface form and surface hydrology.
A final consideration is that of adequacy of the technique and type of statistics which are
generated. The quadrat method is a destructive bulk sampling approach, and not an in
situ assessment of surface form. lt is the in situ character of the surface which influences
and is influenced by formative process action. Measures based upon a bulk sample may
not be useful or significant as a direct measure of the in situ character of the undisturbed
surface. Work on similar surfaces beyond the Badia has used both bulk sampling
techniques and aerial planimetry to generate an assessment of coarse clastic surface
form.
- 105-

Chapter 4: The characteristics of ground surface form
4.2.2 S~Uidies fll'"om beyond ~he Badia
Dunkerley (1996) identifies that, given the diverse influence of stone cover on surface
process, little attention is commonly paid to the selection of appropriate methods for
characterizing these surfaces relative to the objectives of the study. Two broad
approaches to characterizing coarse clastic surfaces have been developed. The first bulk
destructive sampling and the second, planimetric assessment of surface form.
The primary application of bulk sampling is to assess the absolute variation in clast size
distribution between locations. Reviews of sampling procedures, for example Wolcott and
Church (1991), Diplas and Fripp (1991) and Dunkerley (1994) highlight the problems
associated with measurements and sampling procedures undertaken to quantify coarse
sediment samples. Problems include the choice of process appropriate measures, the
nature with which the sample location is positioned in space and the statistical
significance of the sample taken. Comprehensive reviews of sampling coarse clastic
materials which are beyond the scope of this study are provided by Church et al. (1987),
Wolcott and Church (1991), Gale and Hoare (1992) and Dunkerley (1994, 1995). Sample
size, or number of clasts is commonly regarded as the main limitation in experimental
design for bulk sampling coarse sediments. Dunkerley ( 1995) argues that the nature of
the clast size distribution around the mean value is of far greater value than the central
tendency of the clasts size distribution. lt remains to be seen whether it is the statistical
significance of the number of clasts in a sample, or the aerial extent of the surface
characterized which dictates the sample size required in the northeastern Badia.
Dunkerley (1994) argues in a study of rocky dryland surfaces that considerations of
statistical bias must be considered in sample collection. Dunkerley (1994) highlights the
debates surrounding the over-representation of the coarsest fraction of a sediment sample
if sampled using the grid node intersection technique, later adopted by Higgitt and Allison
( 1998). Conversion criteria to correct this error have been discussed by Kellerhals and
Bray (1971 ), Diplas and Fripp (1992), and Church et al. (1987). Dunkerley (1995) argues
that the bias is not a constant within a data set, as it varies with the character of the
sample population. Topographically controlled variation in rock surface cover, as
demonstrated by Alii son et al. (2001) in the northeastern Badia and Brown and Dunkerley
(1996) at Fowlers Gap, Australia, and the work of Vincent and Sadah (1995a, 1995b,
1996a, 1996b) in Saudi Arabia, may be masked by the bias incurred by the sampling
technique. An adequate bias correction should be applied which is specific to the surface
in question. The power of inferential statistics increases with sample size, but simply
collecting a larger sample is logistically difficult (Wolcott and Church, 1990). Wolman
- 106-
-----------

Chapter 4: The characteristics of ground surface form
( 1954) suggests that samples greater than 100 kg are needed to gain statistical
significance. Additionally, there is the issue of sample availability. Can a large enough
number of clasts be collected in an aerial radius that is small enough to be considered
homogenous (Dunkerley, 1994)?
To overcome the effects of sample misrepresentation techniques that do not rely on full
size distributions of sediments have been developed. This commonly involves sampling
the coarse fraction of the whole sample. For example, Bradley et al. (1972) used a
constant search method, whereby all stones collected within a twenty minute period were
measured and then the 50 largest averaged to represent the coarseness of bed material,
similar to a random walk strategy (Wohl et a/., 1996). Random walk methods usually
produce repeatable if not accurate results. The variability of result is consistent and hence
negligible (Wohl et a/., 1996). Again, by sub-sampling much of the detail in the data which
may provide a valuable measure of surface form is lost. In the case of the northeastern
Badia, where surface variability is very subtle the use of such a sampling technique may
not be suitable to identify systematic surface variability. Melton (1965), in a study of debris
covered hillslopes in Arizona employed semi-quantitative surface characterization criteria.
A measure of the clast intermediate axis was accompanied by a five class description of
roundness, lithology, the degree of chemical weathering, degree of cementing by caliche
and burial. Samples were collected from the steepest parts of the slopes and points
located by an undefined procedure termed 'randomisation'. On surfaces such as those of
the northeastern Badia where variability in form is so slight a qualitative method of
characterisation may not able to differential between sites.
There is a paucity of work within semi-arid slope hydrology which has examined the role
of the spatial clast distribution on hydraulics and sediment dynamics. Jean et al. (2000)
and work from the study of bluff bodies in boundary layer theory and hydraulics, for
example Schitchling (1955), are the only studies where this is considered in a quantitative
manner. The spatial distribution of clasts is often only mentioned briefly (Abrahams and
Parsons, 1994 ), and observations are not commonly substantiated. A more favored
approach to characterizing the surfaces remains the simplistic mean percentage clast
cover or intermediate axis dimensions (Bunte and Poesen, 1993). In the northeastern
Badia where surface clasts are pose prominent individual obstacles to slope processes a
consideration of the spatial character of the surface may be beneficial. Additionally, a
marked degree of surface organization and structure has been observed. Spatial
arrangement of clasts is therefore an important consideration.
- 107-

Chapter 4: The characteristics of ground surface form
The second technique of surface characterization, the planimetric in situ form, has been
adopted less widely than the bulk sampling approach. Several studies have examined the
undisturbed in situ character of surfaces, particularly in respect to surface and slope
evolution. Friend et al. (2000), in a study of boulder-dominated colluvial slopes, employs
measures of size (major axis), clast volume (undefined), elongation (intermediate : minor
axis ratio), angularity (qualitative), to link geological age to surface cover character. Friend
et al. (2000) also uses macro-fabric analysis to generate Eigenvalues which identify the
alignment and arrangement effects of slope processes, but with little success. The clast
supported structure of the boulder mantled slopes studied inhibits boulder realignment by
slope process action. The weak statistics returned are perhaps not surprising.
Eignenvalue analysis may however be more applicable on surfaces where between-clast
contacts are minimal, freely allowing realignment, as potentially occurs in the northeastern
Badia. lbbeken et al. (1998) show clast orientation to be a strong indicator of alluvial fan
development at Hanaupah Fan, Death Valley. Additionally, clast position and titling has
been linked to rates of geomorphic activity on clastic desert surfaces by Sena et al.
(1994).
The dearth of literature that has addressed relative spatial position is not surprising. On
rock fragment dominated surfaces the distinction between what is, and what isn't a clast,
is less clear than in the northeastern Badia. At the catchment scale ground surface cover
maybe considered to be homogenous as the nature of variation maybe insignificant as an
influence of catchment hydrology. The spatial distribution of clasts on rock fragment
surfaces may not be of great importance in dictating flow hydraulics, where finer, less
distinct fragments dominate. The surfaces of the northeastern Badia represent a much
greater polarity in particle sizes. Boulders (clasts) are relatively massive compared to the
unstructured underlying silt clay sediments (AIIison et al., 2001). The position and
organization of clasts in the open surface matrix may be of more significance on these
surfaces as a control on overland flow hydraulics.
The in situ form of coarse clastic semi-arid surfaces has received some attention. An
aerial, synoptic or planimetric representation of landforms has benefits for morphometry,
monitoring and modelling in geomorphology. Planimetric assessments of coarse clastic
materials have been developed to approximate clast size distributions (Macloed, in press;
Dunkerley, 1994). Clast planimetry assessments are scale independent and can be
applied from the microscopic to the macroscopic (Kellerhals et al., 1975). The approach
conventionally uses a scaled aerial photograph or sketch diagram of the surface from
which measurements are derived and as such the technique is non-destructive. The
technique only measures the exposed portion of the in situ clast, an assessment which
- 108-

Chapter 4: The characteristics of ground surface form
may yield a more appropriate characterization of the surface relative to slope process
action. On surfaces with a distinct polarity in clasts sizes between the underlying fines and
the surface clasts, as in the northeastern Badia, a planimetric view is able to differentiate
the characteristics of the surface which act as obstacles to slope flow processes. Edge
lengths, clast size and percentage ground surface cover are seen as critical controls on
surface processes (Poesen and Lavee, 1994).
Examples of planimetric approaches to coarse clastic surface assessments are numerous
(Dunkerley, 1995; Church et al., 1987; AI-Farraj and Harvey, 2000). Dunkerley (1995)
employed aerial photographs of rock covered surfaces to examine the granulometry of
various clastic surfaces. The commonly heavily skewed nature of particle size distribution
is suggested to have a profound influence and control over behavior at the surface
(Dunkerley, 1996). Sorting and clast population structure are critical. lbbeken et al. {1998)
adopt a photo-sieving technique based on digitized photographs obtained from 3 m
height, vertically above the surface. Fourier analysis was used to assess the clast size
parameters but no attempt was made to compare the results generated to those derived
from mechanical sieving techniques. AI-Farraj and Harvey, (2000), in a study of desert
pavement surface terrace and fan surfaces in Oman and UEA, developed a semi
qualitative characterization technique for classifying pavement characteristics. Variables
include the degree of pavement development, clast sorting, relative clast size, clast
shape, fracturing of clast and surface texture. Oblique photographs of 1 m2 plots were
used to derive the overall particle size range, by point sampling at 100 intervals, in
addition to axis and roundness measurements of the 25 largest clasts within the plot. AI
Farraj and Harvey, (2000) recognise the limitations of the technique in assessing
conventional descriptive statistics of particles size distributions due to camera distortion
and the effects of clast burial, but highlight the value to assessing the nature of the relative
changes between sites (AI-Farraj and Harvey, 2000).
A second stream of research has developed the use of automated image analysis to
assess grain size distributions but none have been undertaken on photography of
undisturbed arid clastic surfaces. Two dimensional image analysis is based on a
planimetric projection of particles derives statistics on clast perimeter, dimensions, texture
and area. Examples include Wunsam and Bowman, (2001) and Cheng et al. (2000).
Comparisons with conventional sieving techniques have been undertaken by Fernlund
(1998) Bozdag and Karpuz (1997) and Dunkerley (1995). Techniques applied directly to
geomorphological applications tend to use manually digitised binary overlays of
conventional film photography (Dunkerley, 1995; Diepenbroek et al., 1992), which is both
time consuming and looses precision of measurement.
- 109-

Chapter 4: The characteristics of ground surface form
4.2.3 RecommeD11dlations for experimental design
A planimetric assessment of surface form appears the most appropriate approach to
studying the slopes of the northeastern Badia. The specific geomorphology of the
northeastern Badia lends itself to this approach in several ways. First, the clasts present
themselves as spatially distinct elements on the surface. Their colour, spacing and size
enable them to be clearly distinguished from the sediment surface in-between and below.
Differentiating between individual clasts and the sediments should be easy. Second,
evidence that the surfaces experience overland flow is a key component of contemporary
and potentially previous surface conditions. The planimetric perspective is an ideal
viewpoint from which to assess in situ process-specific surface characteristics. Spatial
heterogeneity and surface microtopography have been cited as important controls on both
process action and influence. The spatial extent of the area of the surface in consideration
is therefore important. Sample size in previous studies is highly variable between plots.
Consideration of a larger number of clasts would ensure the statistical significance of clast
size distribution from all plots. The nature of variability between distal and proximal sites is
slight. Therefore the resolution of sampling and measurement is vital to bolster the
stability of the data generated. Weak correlations between previously measured variables
imply that a greater range of more appropriate measures of the surface would be
beneficial. Third, previous techniques are predominantly destructive. The geometry of
distinct surface clasts and their specific influence on both hydraulics and hydrology has
received little attention at the slope scale. A non-destructive technique would in addition
allow repeat measurements and hence monitoring of the surfaces through time and
between field successive field experiments.
- 110-

Chapter 4: The characteristics of ground surface form
4.3 Design of surface clharacterization technique
The requirement for the surface characterization technique stipulates both an extensive
sample, in terms of aerial cover and statistical significance, and a high precision of
measurement such that small clasts size fraction can be considered. The technique
described below aims to combine a planimetric assessment of the in situ surface
character using low altitude high resolution aerial digital imagery, combined with an
automated analysis procedure. The technique is described below in three parts, image
capture, image processing and data analysis.
4.3.1 Image capture
The aerial extent of the sample or image is determined by the presence of structured
microtopography in the northeastern Badia. Step-like features have been observed
(Higgitt and Allison, 1999a) which appear to coalesce and tessellate to form polygonal
structures. A consideration of the structure wavelength, discussed previously with
reference to the Nyquist frequency (Chapter 3), is used here as the minimum extent of the
sample size. Observations in the field suggest that the dimensions of structures are never
greater than 1.5 m by 2.0 m of continuous width. A sample area with a width of at least 4
m exceeds the recommendation of the Nyquist frequency in this context, such that the
area contained within the sample can be considered homogenous. The image capture
technique developed below uses an image of ratio of 6 : 4 width to height, so sample
width and height should always exceed 4 m.
The camera altitude dictates the aerial cover of the sample. The method developed below
allows the camera to be held at altitudes of between 2 and 120 m. The precision of data
collected is therefore a function of the resolution of the camera. An ideal level in precision
of measurement was selected. Previous work in the northeastern Badia rounded
measurements to the nearest 0.01 m, so a precision equivalent or in excess of this is
desired. A simple laboratory experiment shows the equivalent ground dimension of the
image pixels with increasing camera height is expressed by camera height = 1233.3
x pixel width + 1. 632 (,-2 = 0.999). This relationship determines the height from
which suitable images can be captured, such that individual clasts can be identified and
differentiated. A linear relationship between image area and camera height is expressed
by camera height = 0.0922 x image area + 4.376 (,-2 = 0.987). This
relationship is used to determine the optimum altitude for image capture. A height of 12 m
was selected as this returned an image of over 6 m by 9 m, whilst maintaining a pixel
- 111 -

Chapter 4: The characteristics of ground surface form
dimension on the ground of less than 0.01 m, returning measurements of clasts to within
99 % of their actual dimensions, measured by calipers.
High altitude images were captured from 120 m for each site to establish the continuity of
ground cover and to identify features not apparent from the ground , such as lineations,
geological anomalies and bedrock outcrops which were employed in the site selection
procedure described in Chapter 3. Examples of both the 12 m and 100 m altitude images
demonstrate the range of camera altitudes achievable (Plate 4.1 ). The 12 m image
demonstrates the clarity of the images obtained using this technique. The contrast
between the surface clasts and the sediments is notable with a high resolution and large
aerial cover. The technique is flexible in that the equipment can be maneuvered across
the surfaces whilst capturing images with only two field operatives. The captured image
file format can be imported directly into standard Microsoft Windows TM based image
analysis package for processing, without the need for developing or scanning. This can be
undertaken in the field. 12 m altitude images were captured at the Top, Upper, Middle,
Lower and Bottom plots.
Plate 4.1 Examples of12 m and 120 m aerial images
Recent developments in digital camera technology have resulted in digital image quality
approaching that of film based photography at minimal cost. Digital imaging has the
advantage of instant picture viewing after capture and has effectively no limit on the
number of pictures that can be captured . The choice of digital camera was made on the
basis of charged couple device (CCD) resolution, which dictates the resolution of the final
images, lens quality and colour accuracy, which controls the quality of the image, software
support and cost. The Kodak DC range of commercially available digital cameras has
- 112-

Chapter 4: The characteristics of ground surface form
camera mounting software that enables fully functional remote control of all camera
features, via serial connection to a remote laptop. The laptop enables real time viewing of
captured imagery allowing targeting and brightness corrections to be undertaken in the
field. The use of Nickel Metal Hydride batteries and 128 Mb CompactFiash ™ memory
cards means that the selected camera can be used for a full day in the field, collecting
over 1 00 maximum resolution images.
The camera finally chosen was a Kodak DC240 Zoom, and later a ruggedized Kodak
DC5000. The DC240 has a sensor resolution of 1344 x 971 pixels, with the maximum
image resolution of 1280 x 960 pixels, in 24-bit colour (Shortis and Beyer, 1996). In a
comparison of three Kodak digital cameras of varying price and resolution, Ahmed and
Chandler ( 1999) noted the surprisingly favourable results returned from the cheapest 'off
the shelf' lower resolution Kodak DC40 digital camera (0.38 million pixels), when
compared to the more conventional reflex camera bodied Kodak DCS420 and DCS460
(1.5 million and 6 million pixels, respectively), more commonly used for photogrammetry.
The DC240 and DC5000 return similarly favourable results (Shortis and Beyer, 1996).
Although a photogrammetric camera calibration is beyond the scope of this investigation,
its importance is recognised. Ideally a full photogrammetric calibration of the internal
camera geometry would be undertaken, as described by Chandler and Padfield (1996),
but the levels of precision required for this study do not justify this (Ahmed and Chandler,
1996). The more simplistic ISO 12233 camera resolution and imaging accuracy tests
(VFA) using the DC240 show minimal geometric distortion at either the wide or the
telephoto end of the lens (Plate 4.2a, b), and high visual resolution for high contrast
objects (Plate 4.2c), and accurate clean and well saturated colour preservation (Plate 4.2).
Radial lens distortion is cited in Ahmed and Chandler (1999) as significant for all three
cameras assessed, with the most severe displacement on the image fringe. A 39 mm
zoom is used here to minimise this radial image distortion. The images used within this
study were then cropped to 85% of their width and height to eliminate the most
significantly distorted areas of the image.
- 113-

Chapter 4: The characteristics of ground surface form
(c) Colour target (d) ISO 12233 ("WG-18") resolution target
Plate 4.2 Camera calibration chart for DC240*
The lens has an aperture of F I 2.8, and focal length equivalent to 39 to 117 mm. The
weight of the camera with batteries is 0.35 kg. The requirement for the camera to be of the
order of 10 to 15 m above the ground is a relatively unexplored altitude that resides below
conventional aircraft based aerial but above ground based photography. Three techniques
were employed to hold the camera at this height, with a mixed range of success. First, a
13 m carbon fiber camera boom, named a 'Monopod', was deployed (Plate 4.3). This
system returned very favorable results. The boom was able to lift the camera to a height
of over 10 m, without obscuring the image. The system was very stable in low winds and
could be transported and erected by two field operatives at each site in less than half an
hour. Consistency in altitude and image area between sites was easy to obtain with this
method. A high degree of control over altitude was found to be beneficial during the
calibration stage of the technique development. Images could be sampled at precise 1 m
intervals, up to 10 m. There are several disadvantages of using the boom system. Image
capture was undertaken as close to midday as possible to reduce the effects of oblique
shadowing on the surfaces. During this period the boom cast a shadow across the image.
• http://www.imaging-resource.com/PRODS/DC240/240PICS.HTM
- 114-

Chapter 4: The characteristics of ground surface form
The shadowing was later found to be problematic in the image analysis, but could be later
removed with for example Paint Shop Pro TM. lt is difficult to prevent the vast array of
cables and wires that support the boom from becoming entangled on the boulders during
transportation . Walking across the area to be photographed during the set-up procedure
also potentially disturbs the boulder surface. The monopod requires five solid ground
anchor points to hold the boom to the ground. On sites where sediments are thin , weak or
hardened, establishing a reliable ground fixing is found to be difficult. Flexibility and time is
the systems downfall. The apparatus has to be dismantled entirely between plots,
meaning that one slope of five plots would take one day to photograph, which is a similar
time to the hand counting technique previously used .
Plate 4.3 Monopod camera boom at Marab Swayed
The latter two methods used the same principle of hoisting the camera. A helium balloon
and an aerofoil kite are found to provide a stable camera platform. A 2 m diameter helium
ball, tethered to a fixed ground point was employed in the northeastern Badia. The balloon
provides approximately 2.5 kg of vertical lift and is capable of holding the camera at a
range of altitudes that is only limited by the cable length, which in this instance is 125 m. A
helium blimp was chosen in preference to a hot air balloon due to size limitations (Aber et
al., 2002). UK aviation laws restrict the maximum size of unlicensed tethered aircraft;
calculations suggest that a balloon capable of supporting the payload of the digital camera
work exceed the legal size limit as defined by Air Navigation Order 1989 (Statutory
Instrument No 1989 I 2004) and the Rules of the Air Regulations 1991 (Statutory
- 115-

Chapter 4: The characteristics of ground surface form
Instrument No 1991 I 243 7). The benefits of the balloon system were the reduced
shadow cast on the ground surface which was invisible on the majority of images and the
flexibility of movement. The range of heights allows ground cover of up to 40000 m2 from
an altitude of 100 m, in addition to a high degree of control at low levels. The balloon
faired less well in moderate to high winds as the lift was low relative to the lateral forces
on the helium sphere exerted by the wind. The sharp boulder surface was also not
welcoming to the delicate balloon membrane. Additionally three field operatives were
required to fill the balloon and position the camera above the plot locations.
The final and most successful method of supporting the camera was found to be an
aerofoil kite. Increasing enthusiasm for KAP (kite aerial photography) provides a large
resource base on the design and operation of a kite based aerial photography (Benton,
2001 - 2002). A Stratascoop Ill, constructed by Greens Kites of Burnley, UK, was
employed due to its high flying angle and infamous lifting force, controlled by a single 250
kg breaking strength nylon cord. This kite is capable of flying in a wide range of wind
speeds and provides a stable, vibration free platform. The kite can easily be operated by
two field operatives enabling walking across rough terrain whilst capturing images.
Limitations of this method are primarily related to the consistency and strength of wind.
Low wind conditions of below 5 km h(1 do not provide adequate lift, and conversely high
wind conditions generate excessive lift.
The balloon and kite techniques employed the same method of attaching the camera to
the kite line. The camera was supported in a Picavet cradle (Picavet, 1912). The cradle
was attached 25 m below the kite on the line, such that the kite was always at least 25 m
from the ground and above turbulent air (Figure 4.2). This also has the effect of reducing
the angle of the kite line between the operator and the camera, minimizing the possibility
of image obstruction by either operator or cable. The Picavet cradle holds the axis of the
camera vertical, irrespective of the angle of the tether line, counteracts rotation and acts to
dampen vibration. Ballast was fixed to the cradle to adjust the camera axis normal to the
local slope angle. The camera was controlled directly from the ground via a 125 m serial
cable connection to a laptop. The functionality of the camera enables reviewing of
captured images by the operator, such that the camera can be precisely located above a
desired position. Images were viewed as captured to ensure quality and position. Images
were saved to the hard disk of the laptop in Tagged Image File Format (.tif), with minimal
compression to maximize image quality.
- 116-

1 - Differential GPS
2 - Field operator
3 - Laptop with camera control
4 - Kodak DC240 digital camera
5- Picavet camera cradle
6- Stratascoop Ill aerofoil kite
7- Serial cable and kite line
Chapter 4: The characteristics of ground surface form
4
Figure 4.2 Image capture apparatus
Image location and scale calibration was achieved in the field with differential GPS
(DGPS) surveying of ground control points, which were visible in the captured images in
the real time view on the laptop. Under favorable satellite availability, the DGPS was
found to return accuracies in the order of 0.02 m in x and y axis, from a 3 epoch Time
Tagged Point position (Leica, 1997). Photogrammetric ground markers where fixed to the
sediment surface within the area of the image. A distribution of at least 10 markers was
used in each image to identify position, orientation and contour directions. The positions
derived were then used to scale the images and position them in the field area during the
image processing procedure within ArcGIS 8.1 . Images were always scaled using ground
- 117-

Chapter 4: The characteristics of ground surface form
markers rather than estimations of camera height for increased accuracy. Cropped and
gee-corrected images were imported directly into the image processing.
4.3.2 Image processing
The image processing technique measures the planimetric extent of the exposed clast
from a aerial perspective. Clasts are identified as individual objects from which
appropriate measurements can be derived. The colour and contrast of the surfaces
suggests that the most fruitful method of analysis would be based on analysis of binary
data. For each pixel within the image it can be considered either to represent a clast or
sediment within a binary overlay (FFA, 2000) The chosen software must be able to
perform image processing and thresholding on colour intensities, such that rock and
sediment can be differentiated. The selection of software was also based of its ability to
generated appropriate statistics. The majority of commercially available image analysis
software is aimed purely at deriving size and population distributions of objects and
therefore treat objects as individuals whose juxtaposition is not of importance. An
assessment of in situ surface form requires this spatial data.
PC_Image, produced by Foster Findlay and Associates, UK, was found to be the most
suitable package for this purpose. The software is capable of importing images directly
and enables significant control on filters and measurements by the user. Results are
exported directly into a .dat format which can be imported to a statistics package such as
Stata or SPSS. The image analysis procedure followed a sequence of steps that was
applied to each captured image (Figure 4.3). The analysis procedure is split into four
sections; image calibration, image enhancement, binary processing and finally object
measurement.
- 118-

Chapter 4: The characteristics of ground surface form
§ Import raw .TIFF file
~ ...... .0
Cii Calibrate image scale using ground markers (.)
Q) 0> ro E Set image orientation
Select region of interest (ROI)
c a> Gaussian convolution smoothing filter E Q) (.) c
~ Linear contrast stretch c Q)
Q) 0> ro E Edge enhancement
0> c ·u; Cl) Q) (.) 0 .... a. jij Image math c en
c Q)
E Q) .... ::I Cl)
ro Q)
:::2:
Discrete object count
Object measurement
Figure 4.3 Image analysis procedure
Image calibration rescales the image using the photogrammetric ground markers within
the captured image. Known distances between the 10 photogrammetric markers were
input into PC_Image, from which a ratio of pixel width to meters is calculated.
Subsequently all measurements taken from the image are in meter units. The image is
- 119-

Chapter 4: The characteristics of ground surface form
rotated relative to slope, such that down-slope is set at 0°, again using the
photogrammetric ground markers.
The second stage of the procedure optimises the colour and brightness distribution of the
image to aid in the separation of clasts. A region of interest (ROI) is drawn as a rectangle
with 85 % of the images width and height, centred on the image center point. By only
assessing the area contained within the ROI the effects of radial distortion around the
image edge are minimized (Ahmed and Chandler, 1996). Two filters are used on the
image to enhance the differentiation between the sediments and clasts. First, a Gaussian
convolution smoothing filter was passed over the image (Gonzalez and Woods, 1992).
The Gaussian filter has the effect of blurring and removing noise from the image, without
loosing the clarity of the object edges. On the Badia surfaces a Gaussian convolution
tends to smooth shadows and surface pitting texture between opposed boulder faces and
acts to reduce the presence of lichens on boulders and granular textures on the sediment
surfaces, further differentiating between clasts and sediments (Figure 4.3). A
disadvantage is that small mono-pixel clasts may be lost, but no meaningful measures
can be derived from objects of this size.
The second type of filter employed is a non-linear Sobel edge detection filter (Gonzalez
and Woods, 1992). The filter acts to sharpen the boundaries between sediments and
clasts. The filter is constructed from kernel of 3 x 3 pixels and hence operates over a small
area of the image at a time (cropped image area is 1088 x 816 pixel). The filter is as a
result not affected by gradual changes in grey level intensity across the image inferred by
lighting differences. Only local edge data rather than wider scale trends in the image are
enhanced. The effect of this filter on the Badia images is the development of distinct
boundaries between clast and sediments, in addition to further smoothing colour and
texture with clasts and sediments (Figure 4.4). This filter acts to make both the clasts and
the sediment exhibit a more uniform colour spectrum, easing their separation.
After filtering, a linear contrast stretch is performed on the image which enhances the
colour difference between the dark boulders and the relatively light sediments (Figure
4.4 ). The contrast stretch was found to identify the underlying sediments in a tightly
constricted spike at the high end of the color spectrum, representing a lighter coloration.
The distinction of sediment color is more tightly constricted color distribution than the
clasts. Clasts are multifaceted, clad with lichen and often shadowed, explaining the
increased range of color. Once a characteristic sediment color spectrum has been
identified, all other areas of the surface cover can be considered to be clasts.
- 120-

Chapter 4: The characteristics of ground surface form
Original image
Gaussian smoothing filter
Sobel edge detection filter
Binary overlay
Figure 4.4 Sample results from image processing
The distinction between clasts and sediments on the image is identified statistically using
a thresholding procedure based on a triangulation algorithm (FFA, 2000) (Figure 4.5). A
line between the maximum frequency of grey levels (bmax) and minimum frequency of grey
levels (bmin) is constructed. The distance between the line and the histogram (b) is
calculated for all values between bmax and bmax· The point at which bmax intersects the
histogram is the threshold value (b0 ).
- 121 -
L_ _____________ - -

30000
(/l
(jj
.g_ 20000 '+-0 .._ Q) .0 E ::::l z
10000
0
0
Chapter 4: The characteristics of ground surface form
Bo ~bmax
j" . ' I ~
. ~ I . . \ J . . t
: I \ i I \
\_ 50 100 150 200 250
Grey level of pixels
Figure 4.5 Triangular theorem image thresholding
Thresholding places a binary layer over the image. The binary is a grid layer at the
resolution of the image that contains values = 1 if the value of the equivalent pixel is
above the threshold value, and a value = 0 if the pixel value falls beneath the threshold.
The binary overlay represents the aerial extent of the clasts (1 = clast). The distinct colour
variation between the sediment and boulders made this stage of the analysis straight
forward. The binary overlay gives a close representation of the presence or absence and
shape of a clast. The series of filtering operations described above is found to return the
highest precision between the initial image and the resulting binary overlay of all
combinations attempted. The accuracy of the binary is visually assessed and found to
consistently return a high correlation between the original image and the resulting binary
layer. The filters are run in sequence via a macro embedded in PC_Image, automating the
image processing procedure.
The third stage of the image analysis procedure is a series of morphological operations
conducted on the binary overlay, commonly termed binary math (Figure 4.6).
- 122-

Chapter 4: The characteristics of ground surface form
Morphological operation Result Images
Dilation
+
Erosion
+
Opening
+
Closing
+
Exo-skeletonisation
Breaking Erosion to 1 pixel Conditional dilation Separation by contacct line
Identification of infection points Breaking, via tunneling
Figure 4.6 Binary math morphology
Binary math is intended to remove errors and noise in the binary overlay. The application
of binary math is now described. First, a process whereby all single cell totally surrounded
by cells with value = 1 are 'filled' as they are assumed to be erroneous points or holes.
The close proximity of adjacent clasts on occasion results in agglomeration of neighboring
- 123-

Chapter 4: The characteristics of ground surface form
clasts in the overlay, such that areas of sediments can be infilled as clast. These areas
are manually reverted to sediment. The binary is then cleaned using a series of operations
termed erosion and dilation (Figure 4.6). In combination these filters act to remove mono
pixel clasts and edge noise. Additionally an automated procedure to 'break' agglomerated
clasts was developed. Breaking objects involves a process termed exoskeletonisation
which dissects two clasts at inflection points on the clast perimeter (FFA, 2000). The
dissection automatically slices the agglomeration at the inflection point, deleting a single
line of clasts, until to two objects are separated. The results of the procedure are visually
checked after completion. Ultimately a combination of methods is required to produce
satisfactory results for each image. Final manual checks of each image are made to
ensure the accuracy of the techniques deployed. Manual correction is required for around
0.5 % of clast contacts, undertaken using a digitizing tablet operating within PC_Image.
The result of this operation is a binary layer considered to be a close approximation to the
aerial extent of the clasts on the slope surface. Measurements of the individual clasts can
be obtained from this layer.
- 124-

Chapter 4: The characteristics of ground surface form
4.3.3 IData analysis
Appropriate object measures were selected according to their relevance to slope process
in the northeastern Badia (Table 4.1 ). Object measures are split into three broad
categories. First, those which are specific to individual clasts, for example intermediate
axis length. Second, those which apply to the whole image, for example percentage clast
cover. Third, statistics which describe the spatial character of the in situ surface, for
example clast orientations and clast centroid position. Spatial statistics are calculated in
ArcGIS 8.1. Spatial analysis involved the creation Thiessen polygon nets and nearest
neighbour statistics around a point pattern derived from the centroid of each clast.
Additionally, the box fractal dimension for the binary layer was derived using Harfa 4.0,
which provides a further description of the spatial character of the surfaces (Zmeskal et
al., 2001 ).
The mean number of clasts analysed in each image was 1157. A total of 26 individual
object measures for each clast, in addition to 22 additional measures for the whole image
and spatial statistics were derived. From the primary measures of clast form further
secondary measures were calculated, for example total edge length for the whole image
area, resulting in a total of over 70 variables for each plot position. The data were
combined with measures of slope derived from the DGPS slope profile survey and dummy
variables are introduced for geological variables. Additional variables included height,
length and ken.par. The resulting data set of over 6 million numbers was analysed in
lntercooled STATA 7.0. Prior to analysis the dataset was filtered. All clasts with an area
less than 4 times that of one pixel or cell were dropped from the analysis. The form of
clasts smaller than this size is dictated more by the resolution of the original image than
the clast shape itself, so no meaningful statistics can be derived from these objects. The
nature of the dataset allows data to be grouped as plot specific results, aggregated
between plot positions over all sites, to individual profiles, or to individual slope forms.
Additionally the data can be sorted by any variable, upon which filters can be applied.
- 125-

Chapter 4: The characteristics of ground surface form
Name Measurement Morphological definition Units
type
Image area Q)
Total calibrated image area m2 Ol ro E
Object number Q) Number of clasts # 0 ..c
Area percent ~
% of image covered by objects %
Area Area of each clast m2
Perimeter Clast perim ieter m
Length Major axis length m
(.)
Breadth -.:: Intermediate axis length orthogonal to major axis m ·o Q) a.
Equivalent circle en (;) Radius of circle with equal area as the object area m ro
Minimum radius u
Minimum distance from centroid to edge m
Maximum radius Maximum distance from centroid to object edge m
Mean radius Mean distance from centroid to object edge m
Convex perimeter Perimeter of the convex hull of the object m
Centroid X Centre of gravity of object in x plane m
Centroid Y Centre of gravity of object in y plane m
Object I Hole Object = 1 , hole = 0 #
Mean Feret Mean diameter of object seen from al l angles m
Max Feret ro Maximum diameter of object seen from all angles m -ro "0
Min Feret ro Minimum diameter seen from all angles m ~ a.
Diameter if object seen from 0° orientation Feret (0) (f) m
Feret (45) Diameter if object seen from 5° orientation m
Feret (90) Diameter if object seen from 90° orientation m
Feret (135) Diameter if object seen from 135° orientation m
Orientation Orientation of length relative to calibrated mage radians
orientation
Table 4.1 Image analysis derived clast measures
- 126-

Chapter 4: The characteristics of ground surface form
A series of calibration tests were undertaken to assess the precision of measurement of
the image analysis technique and in addition the results were compared to those
generated using the hand counting technique. The precision of measurement of the image
analysis reduced with increased camera altitude as the pixel ground dimension increase.
Shapes ranging in size from 0.02 m to 0.2 m in width were photographed at 2 m intervals
between 2 and 28 m altitude. A standard measure of image analysis accuracy was used
to compare dimensionless area and perimeter of objects of known dimensions,
conventionally using object circularity (4 x area I perimeter2) (FFA, 2000). Calibration
objects measured were found to represent 90% of the actual object dimensions at heights
of up to 28 m, for objects as small as 0.02 m intermediate axis. 99% accuracy in the ratio
of measured to actual dimensions was found at a camera height of 12 m (Figure 4. 7).
Tests were also undertaken to assess the degree to which camera orientation influenced
the measurements taken, but no effect was found.
~ 100 0
~ 99 .Q (/) c Q)
E :u a; Ol .... ill "0
~ 95 ::J (/)
ro Q)
E .9 ro ::J t> ro -0 0
~ 0::: 90
0 10 12 20 30 Camera height (m)
Figure 4.7 Measurement precision of the image analysis technique
- 127-

Chapter 4: The characteristics of ground surface form
4.4 Results
The results of the surface characterisation are presented in three sections. First, evidence
of process modification of the clast and the surface configuration is discussed. Second,
the influence of both slope form and geology is considered. Third , the spatial character of
the clast surfaces is presented .
4.4.1 Features indicative of process action
4.4.1.1 Rounding and texture
Clast rounding and texture has been analyzed. A quantitative adaptation of Croft's (1974)
matrix of planimetric particle shape and form has been developed. The matrix plots
sphericity or elongation, as defined by the ratio of the intermediate to the major axis,
against the roundness or smoothness as a measure of edge roughness. Additionally
Macloed (in press) has developed a similar matrix of clast roundness and angularity,
based on Eigenshape analysis. A quantitative adaptation of Croft's ( 197 4) matrix can be
applied to photographs of coarse clasts, based on the object measures derived by the
image analysis procedure. The matrix describes clast elongation as the ratio of the
intermediate (b) to major (a) axis, and crenulation or texture as the ratio of a perfect circle
of equal intermediate axis to the actual area of the clast (Figure 4.7).
Area of circle with equivalent b axis
Actual surface area
1 ..... ----0
.. - - • ... - - • ~ - - • ~ - - • .... - - •
Q Elongation a
Figure 4.8 Adaptation of Crofts (1974) description of planimetric clast form
- 128 -

Chapter 4: The characteristics of ground surface form
The adaptation of Crofts ( 197 4) shape description to the planimetric measures derived
from the image analysis shows a distinct variation down-slope in particle shape and
texture (Figure 4.9). Clasts become progressively more round in planimetric form and less
textured down-slope. The intensity of hydraulic process action at the slope bottom maybe
enhanced due to greater volumes of overland flow and sediment load at this location.
Levels of attrition and abrasion between clasts and sediments may account for smoother,
more rounded clasts.
~
c .Q 1§ ::J c Q) .._ ~ Q) .._ ::J x Q) I-
0.9
. Bottom
0.88
. Lower
. Middle 0.86
. Top
0.84
. Upper
0.82
0.66 0.67 0.68 0.69 Clast Elongation
Figure 4. 9 Variation of particle shape and texture with slope - all plots, grouped by plot position
The relative difference between plot locations suggests a complex relationship between
clast shape and texture and location down-slope. The Top plot appears to return a slightly
spurious degree of clast texture, implying that clasts are more textured than those at the
neighbouring Upper plot. The Top plot is commonly located on or near to a bed rock
outcrop. Particle smoothing is a function of the degree of physical and chemical
weathering . The larger clasts at crest locations may be considered inert or immobile due
to their size, limiting rolling due to high angularity, the lack of deformable underlying
sediments, the low levels of overland flow due to absence of a significant up-slope area or
the locking into the bedrock joint structure. The clasts still remain exposed to alteration by
weathering, but may only move position much less frequently than at other slope
positions. The exposed surfaces maybe heavily modified by weathering processes, but
- 129-

Chapter 4: The characteristics of ground surface form
not by hydraulic action. In the field this suggestion is supported by high levels of desert
varnish on clast surfaces at profile tops. Analysis of the larger clast sizes at the top of the
slope profile commonly show a higher degree of rounding than for the smaller size
fractions, supporting this suggestion. An example of this phenomenon is the preferential
smoothing and rounding of larger clasts at CVT (convex profile, Top plot); clasts with
intermediate axis > 0.15 m have a mean crenulation = 0.886 and mean elongation = 0.760, whereas clasts with intermediate axis < 0.15 m have a mean crenulation = 0.861
and mean elongation = 0.633. On the lower slope positions no such distinction by clast
size in rounding or smoothing is found. Clasts here are potentially more mobile and
susceptible to alteration by process action. Surface clasts are more uniform in shape and
texture, irrespective of size. A logical assumption would be that this is a result of either
increased action of slope processes, due to the increased up-slope area at these
locations, or weathering due to increased levels of moisture down-slope.
The gradual increase in clast rounding and smoothing has several implications for
understanding the nature of slope processes in action. The change in clast form suggests
an increasing intensity of attrition or weathering processes down-slope, showing a link
between ground surface character and plot position. Given the consistent variation in clast
shape and rounding down-slope, it is suggested that the surfaces are not mature. No
asymptotic degree of rounding or smoothing is apparent across the whole length of any of
the profiles surveyed. The nature of the down-slope change can also be used to infer the
type of processes acting to modify the surfaces. If a clast is picked randomly from the
slope, the condition of the shape and texture of that clast could be confidently predicted
from its location on the profile. Clasts in close proximity show a similar degree of
modification or conditioning. If a catastrophic mechanism of surface modification and clast
movement was a dominant control on surface form, less consistency in the variation in
clast shape and rounding would be expected between each plot location. An alternative
mechanism of clast movement is iterative surface modification. Under this condition all
clasts at each location would experience a similar intensity of processes, as dictated by
slope position.
- 130-
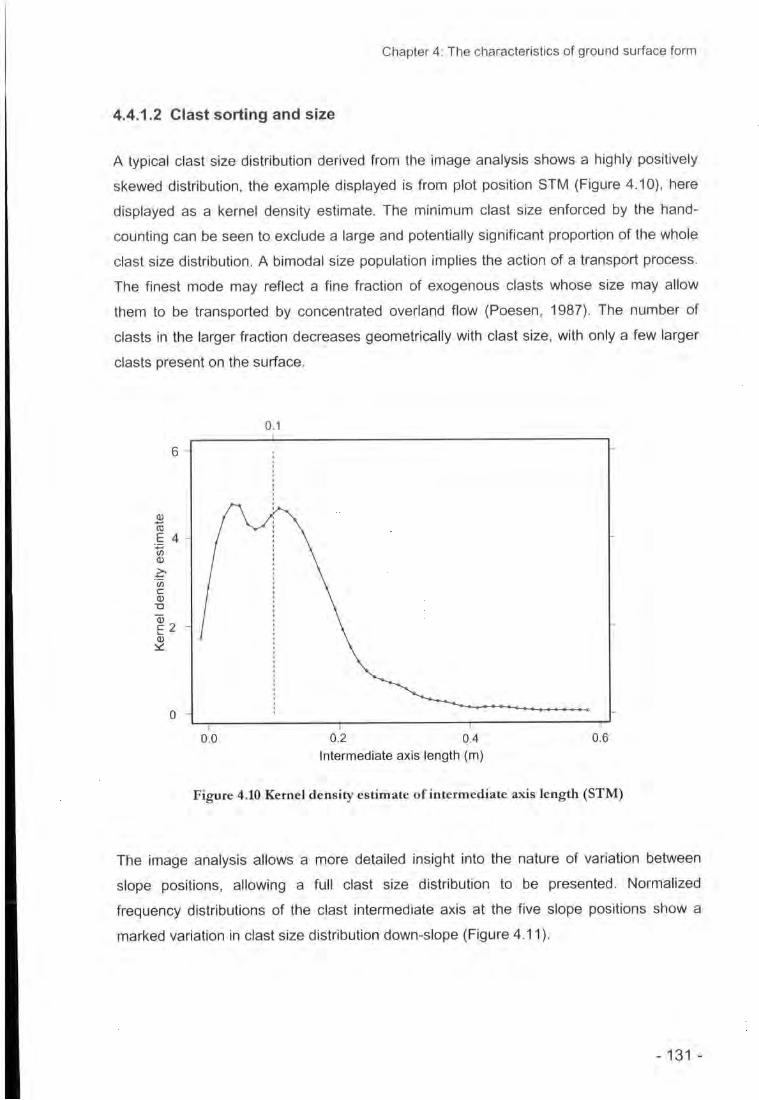
Chapter 4: The characteristics of ground surface form
4.4.1.2 Clast sorting and size
A typical clast size distribution derived from the image analysis shows a highly positively
skewed distribution, the example displayed is from plot position STM (Figure 4.1 0), here
displayed as a kernel density estimate. The minimum clast size enforced by the hand
counting can be seen to exclude a large and potentially significant proportion of the whole
clast size distribution. A bimodal size population implies the action of a transport process.
The finest mode may reflect a fine fraction of exogenous clasts whose size may allow
them to be transported by concentrated overland flow (Poesen, 1987). The number of
clasts in the larger fraction decreases geometrically with clast size, with only a few larger
clasts present on the surface.
6
Q)
-ro E 4 ~ Q)
~ ·u; c Q) '0
Q) E2 Q)
~
0
0.1
0.0 0.2 0.4 0.6
Intermediate axis length (m)
Figure 4.10 Kernel density estimate of intermediate axis length (STM)
The image analysis allows a more detailed insight into the nature of variation between
slope positions, allowing a full clast size distribution to be presented. Normalized
frequency distributions of the clast intermediate axis at the five slope positions show a
marked variation in clast size distribution down-slope (Figure 4.11 ).
- 131 -

en :!: c ::l
>-(.) c Q) ::l er Q)
~ '0 Q)
.!:::! m E L..
0 z
Chapter 4: The characteristics of ground surface form
Top Upper 1 1
0.5
0 0
0.05 0.2 0.4 0.6 0.05 0.2 0.4 0.6
Middle Lower 1 1
0.5 0.5
0 0
0.05 0.2 0.4 0.6 0.05 0.2 0.4 0.6
Bottom 1
0.5
0
0.05 0.2 0.4 0.6
Intermediate axis (m)
Figure 4.11 Normalized frequency distributions of intermediate axis lengths for all plots, grouped by plot position
An increasingly constricted clast population distribution towards the bottom of the slope is
identified. Bottom plot locations exhibit a smaller proportion of the population in the finest
clast size fraction with intermediate axis less than 0.1 m. Equally, the proportion of clasts
in the largest size fraction (> 0.4 m) seen at the higher plots reduces down-slope. The
preferential sorting and removal of finer clasts at the lower slope locations (Lower and
Bottom) is clear. At the Lower and Bottom locations transport capacity of overland flow
- 132-

Chapter 4: The characteristics of ground surface form
would be higher due to increased up-slope area, and concentrated overland flow may act
to remove the finer clast fraction (Poesen, 1994). Additionally, there is a reduced influence
of bedrock on clast size in the down-slope portions of the profile.
The clast distribution alters from a leptokurtic to a platykurtic distribution from Top to
Bottom of the slope profile. The proportion of clasts in the finest fraction reduces notably
between the Top and Upper plots, but the proportion in the larger clast fraction appears
more persistent down the profile. If clasts are large they tend to remain large, implying that
the modification of the surfaces is again limited, potentially as a result of the resilience of
the basalt to weathering.
Further analysis of clast distribution identifies an increased level of normality in population
distribution down-slope, suggesting that the action of slope process acts to focus the clast
population distribution around a mean value. Normalized probability plots of intermediate
axis length for the Top and Bottom plot positions demonstrate the change in the style of
the clast size distribution down-slope (Figure 4.12). The distribution of clasts becomes
less irregular towards the bottom of the slope profile, with both fine and coarse fractions
becoming tightly constricted to a normal distribution, indicated by the dashed line.
- 133-

Ui' ::::::.. E
I ..0 ...__.. tL C1l E L..
0 z
Chapter 4: The characteristics of ground surface form
I I I I I
1.00- Top H;
0.75 -
0.50 -
0.25 -
,fit-lift
/ ~~* ,
" .... , ....... .," # .,.. r
----~ .," ~ .," #
~ ~
j ," ,// ~ ....
-
-
-
0.00 - ,. -~~~-----------.------------·~ --------------~----------~, 0.00 0.25 0.50 0.75 1.00
Empirical P[i] = i/(N+1)
1.00
0.75
Ui' ::::::.. E
I ..0 ...__.. tL 0.50 C1l E L..
0 z
0.25
0.00
0.00 0.25 0.50 0.75 1.00
Empirical P[i] = i/(N+1)
Figure 4.12 Example of normalized probability distribution of intermediate axis length (profile ST)
A further indicator of slope process is the nature of the size distribution of clasts between
slope positions. The coefficient of variation (Equation 4.1) is employed as a relative
indicator of clast population dispersion down-slope. This analysis is performed on the
- 134-

Chapter 4: The characteristics of ground surface form
intermediate axis, as a less spurious measure of clast size. A lower value of Cvb indicates
a more tightly constricted distribution of clast sizes, suggesting a greater degree of sorting
(Figure 4.13).
where: Cvb = coefficient of variation
a = standard deviation of intermediate axis length
b =intermediate axis length
n = number of clasts
60
- -
50 c 0
:;:; ro
·.::::: ro > - 40 0 -c Q)
"(3
~ Q) 0 0 30 -
- -
20
Top Upper
0
EJ Middle
Plot location
(Eq.4.1)
Lower Bottom
Figure 4.13 Box plot of the coefficient of variation for all29 plots, by plot position down-slope (the box represents the interquartile range, intersected by the median, the whiskers show the
upper and lower adjacent values, and observed points outside the adjacent values are indicated by dots
The analysis of the coefficient of variation suggests a more complex down-slope change
in surface form that described so far. Median values of Cvb appear to reduce towards the
toe of the slope but the nature of variation does not follow the gradual change as seen
- 135-

Chapter 4: The characteristics of ground surface form
previously. Attempts to relate this variation directly to mean slope angle, mean distance
down-slope or other averaged slope variables only yields weak correlations. No
association is found with the loci of maximum slope angle. Top, Middle and Bottom plots
follow a trend of increasing clast sorting and a tendency for the variation of Cvb to focus
around the median towards to bottom on the slope. The Upper and Lower plots, return a
lower degree of clast sorting, as represented by a higher value of Cvb. No single slope
variable can explain the nature of this variation.
The implication is that the nature of the clast population is controlled by multiple
interdependent factors. Additionally, given the inherent complexity of the surfaces is it
perhaps unreasonable to expect a linear change in all characteristics of the surface or
clast form with slope. Furthermore, the averaging of results generated from the 7 sites
masks the already established diversity between the various slope forms and geologies.
Clasts are modified to a more uniform intermediate axis length, mirrored to a certain
degree by a reduced value of Cvb.
4.4. ~ .3 Ground cover
Percentage ground surface cover varies systematically with slope position in the
northeastern Badia (AIIison et al., 2000). The previous method was an indirect
approximation of percentage ground cover derived from an estimation of the exposed
clast surface area derived from an elliptical function placed around the major and
intermediate axis. Conversely the image analysis examines the actual ground cover, at
pixel ground resolution of greater than 0.01 m, over a much large sample area.
Aggregated statistics of all 19 plots on the Abed basalt suggest that a maximum clast
cover percentage is found at the Upper plot position (Table 4.2). Analysis of variance
(ANOVA) indicates a significant difference in ground cover between the slope locations,
where F = 42.49 far exceeds the critical value of 2. 7 41 for degrees of freedom 4 to 28.
Results of ANOVA undertaken on axis dimensions should be viewed with caution. ANOVA
assumes a normal distribution in variables. Axis dimensions are commonly highly skewed,
so the significance in difference may be an artifact of the varying clast size distribution
down-slope. The results largely agree with those derived by Higgitt and Allison (1998) for
Abed basalts (Table 4.2). The absolute differences between plot positions appear more
subtle when derived from the data collected from the image analysis. The only notable
difference between locations is at the Bottom plot position, which from the image analysis
shows a 4% increase in ground surface cover from the Lower plot position. Conversely
Higgitt and Alii son ( 1998) report a significant fall in ground surface cover between the
- 136-

Chapter 4: The characteristics of ground surface form
same two plot positions. Additionally, the hand-counting technique undertaken by Allison
and Higgitt (1998) returns mean percentage ground cover 3.3 % higher than the image
analysis technique.
Slope position
Top
Upper
Middle
Lower
Bottom
Mean
ANOVA
Ground cover
Mean ground cover(%) (a
in brackets)
(Image analysis)
39.074 (7.334)
42.536 (6.703)
34.817 (8.577)
25.815 (10.090)
29.555 (9.044)
33.806 (1 0.159)
df F
28 42.49
Mean ground cover (%)
after: Higgitt and Allison
(1998)
42.88 (17.08)
48.11 (14.94)
40.98 (16.02)
38.65 (18.42)
16.96 (9.00)
37.516 (12.092)
Probability
0.000
Table 4.2 Variation of ground surface cover with plot position
To investigate this discrepancy and ascertain whether this is a function of method or
location, the hand-counting procedure was undertaken on the image analysis plots at all
19 sites on the Abed basalt at Marab Swayed. The location of the hand-counting
technique was positioned using the procedure of Allison and Higgitt (1998). A surprising
diversity in results emerges from the different techniques of surface characterisation
employed (Figure 4.14). The result suggests that the hand-counting has a tendency to
overestimate percentage ground cover by up to 15%. The discrepancy previously seen at
Bottom plot positions appears to be a function of profile location rather than technique, as
the hand-counting at the image analysis plots produces a similar variation between plots
as the image analysis. The ellipse approximation to calculate ground surface cover
generated from the image analysis derived intermediate axis shows a similar result to that
presented by Allison and Higgitt (1998).
- 137-

.... Q) > 0 u "0 c ::::l e
60
C> 40 Q) C> .£9 c Q) u .... Q)
a..
20
-·-&·-
......... ,e. ....... .
---G--
Chapter 4: The characteristics of ground surface form
Image analysis
Ellipse approximation of image analysis intermediate axis
Higgitt and Alii son ( 1998) hand-counting
Hand-counting of image plots
~~
--- -c .,......-·-0........ -· ........ CY". ........ ··a.·································a
Crest Upper
.......
Middle
Plot location
········ ... ·.
Lower Toe
Figure 4.14 Down-slope variation in ground surface cover as calculated from image analysis and hand-counting techniques (points are connected with a cubic spline to emphasize the
nature of down-slope change between methods)
The discrepancy observed can be attributed to both the sample site position and the
method of measurement. Despite the hand-counting eliminating the finer clast fraction
percentage ground cover appears consistently higher when derived using this method.
This is attributed to two primary causes. First, the ellipsoid approximation assumes an
idealized clast shape, with a perfect ellipsoid form. lt is clear from an examination of the
images of the surface that clasts are commonly faceted and angular and therefore in a
planimetric projection the majority of clasts have a lower surface area than an ellipse of
equivalent major and minor axis lengths. Secondly, the ellipse approximation assumes
clasts are positioned such that both the major and minor axes are exposed above the
sediment surface. The surface area of clasts which are submerged such that the major
and intermediate axes are not exposed will return an exaggerated surface area, leading to
an increase in the ground surface cover of the plot. The variation in ground surface cover
between plot locations is consistent with a modification of the surface character by slope
processes. The decrease in percentage ground cover runs in parallel with the alteration of
- 138-

Chapter 4: The characteristics of ground surface form
the clast size distribution, shape and texture variation. Increased attrition between clasts,
the preferential removal of fine clasts and enhanced weathering due to highly moisture
levels may account for this.
In addition to absolute values of surface character, the degree of variation in surface cover
at a given plot position varies systematically with slope. In the example of ground surface
cover, values returned at Bottom plot positions are highly variable between profiles. The
decrease in the degree of variation downslope is reflected by a strong relationship
between the percentage ground cover and the standard deviation of percentage ground
surface cover (Figure 4.15).
10 ""Cl c ::J 0 .... 0> <I> 0> 9 ro -c <I> .... () <I> .... > <I> 0 c.u c <I> 8 () c ro .Q't: - ::J ro en ·:; <I>
""Cl ""Cl 7 .... ro
""Cl c ro
U5 6
',~Bottom r2 = 0.976 RMSE = 0.242 n = 29 .... ..
25
.. .. .... .... .... .. .... .... .. Lower o ',,
30
.... .... .. .. ', 0 Middle .... .... .... ....
35
.... .. .... .... .... .. .... .... ....
Upper "'0',,
40
Percentage ground cover(%)
.. .... .... .. .... .... 0'
Top ' .. , .... ....
45
Figure 4.15 Relationship between percentage ground surface cover and the standard deviation of ground surface cover at five plot positions down-slope
Bottom plot positions, as those with the lowest percentage ground surface cover, exhibit
the highest standard deviation of ground surface cover. If percentage ground surface
cover is a function of surface modification as is suggested, the increase in standard
deviation in percentage ground surface cover down-slope suggests that slope processes
are not convergent. Slope processes act to create diversity in surface character rather
than tending to converge to one type of surface configuration. Again this implies the
complexity of the surfaces, with multiple interdependent factors acting to create a non
linear response of the surfaces to slope process. Additionally a homeostatic relationship
between form and process in suggested. Surface character is modified by process, but
equally process is modified by form.
- 139-

Chapter 4: The characteristics of ground surface form
There is abundant field evidence to suggest that Bottom plot positions undergo a greater
diversity of formative processes. Water marks are frequently apparent on clast perimeters
at profile toes, suggesting inundation by standing water either in the over bank in the wadi
channel or as water standing in Qa'a or Marab. Dust devils scour the surfaces of the Qa'a
and Marab resulting in the entrainment of a large amount of material, both via saltation
and entrainment. The smooth playa surfaces of the Marab or Qa'a present little
aerodynamic roughness (0.00013 - 0.00015 m, Lancaster et al., 1991 ). Conversely the
boulder mantled slopes present considerable roughness (0.1480- 0.02860 m, Lancaster
et al., 1991 ). The roughness of the clastic surfaces is of particular importance in disrupting
the critical zone of aeolian transport, in the saltation layer (Nickling, 1987). The result of
this is massive deposition at the Bottom plot position on the slope at the boundary of Qa'a
and Marab features (Plate 4.5). Deposition has been observed to be further enhanced by
the topography channelling of local winds by the incised wadi networks. lt is suggested
that in addition to being influenced by slope process and run-off, surface character a toe
locations is further complicated by a greater intensity of other processes than is
experienced at the up-slope locations.
- 140-

Chapter 4: The characteristics of ground surface form
Aeolian deposition the day after a large dust
storm event. Three photographs taken from
(A) 2 m, (B) 10 m and (C) 25 m from the edge
of Marab Swayed, showing a marked
decrease in aeolian sediments with distance
from the pan surface
Plate 4.4 The variation of aeolian sediment deposition with increasing distance from the perimeter of Marab Swayed
Further detailed descriptors of surface character emphasise the nature of change
suggested above. Table 4.3 illustrates a range of clast and plot variables aggregated
between slope locations. Although general down-slope variations in clast surface appear
to be coherent with the variables previously presented, Table 4.3 highlights the complex
variation in clast surface character between slope locations. The resulting suggestion is
that the value of aggregated, or average statistics between sites, is somewhat limited. The
degree of variation indicated by the high standard deviation values illustrates the between
sites variability. Systematic differences due to location may mask within site variabi lity. To
proceed further therefore the data should be reanalysed by individual slopes and sites and
basalt types, allowing linkages between slope form and surface cover to be explored
further.
- 141 -

Chapter 4: The characteristics of ground surface form
-E E -..__ - ..__ <!) N <!) a. E Qi .s::: - E Cl ro .?:' <!) ·;::
N c ..__ <!) ·;:: E E ~ ro a. ~ -..__ <!) Vi Vi :::1 (/) (.) <!) Cl ro ro ..__ ")( Plot location a. ""0 (3 (3 "(3 ro
(/) <!) ..__ - c c c (/) Cii ro ro ro 0 ro - <!) <!) <!) ·eo
(sample size) 0 (3 I- ~ ~ ~ ~
Mean 26.67 8.54 0.023 0.48 0.76 0.17 Top (4521)
s.d. 9.74 1.27 0.027 0.41 0.26 0.12
Mean 36.93 11.43 0.016 0.50 0.73 0.16 Upper (2644)
s.d. 16.72 2.89 0.027 0.57 0.34 0.14
Mean 23.89 8.83 0.018 0.49 0.77 0.17 Middle (4919)
s.d. 11.36 3.28 0.025 0.45 0.28 0.13
Mean 30.43 8.16 0.013 0.42 0.79 0.15 Lower (3379)
s.d. 12.19 2.52 0.022 0.43 0.29 0.12
Mean 22.28 8.63 0.016 0.45 0.80 0.17 Toe (5852)
s.d. 6.99 2.49 0.016 0.27 0.21 0.09
Table 4.3 Variation in ground surface character with slope position
- 142-

Chapter 4: The characteristics of ground surface form
4.4. ~ .4 Appropriate s~a~is~ics
Analysis and correlation of single descriptors of slope and surface character have yielded
poor correlations, raising two issues. First, are the measures adopted appropriate to the
question being asked? Second, are the surface more complex, whereby the influence of
each control on surface form varies and is varied by the influence of other factors? A
series of weighted clast specific measures has been devised, under the recommendations
of Dunkerley (1996) (Table 4.4).
Statistic
Perimeter weighted mean diameter
(EdgewMb)
Area weighted mean diameter
(AreawMb)
Volume weighted mean diameter
(VolwMb)
Formula
11
:Ldi2 x=...:..:i=::..:...l __
11
:Ldi i=l
n
Idi3 X = -'-i=-'-1 __
" Idi2 i=l
" Idi4
x=...:..:i=::..:...l __ 11
Id;1 i=l
Table 4.4 Table of appropriate surface characteristics developed (after Dunkerley, 1996)
Correlations undertaken with these appropriate statistics yield higher levels of
significance, strongly supporting Dunkerley's (1996) suggestion of adequacy (Table 4.5).
- 143-

Chapter 4: The characteristics of ground surface form
Q) (.) c ro - ~ ~
Q) "'0
E' E' c;, 0 c a. E' - - ro
.r::: .:E - Q) Q) -0, ~ a. a.
Ol ~ 0 0 c "Q) Ui
~ .r::: Ol Ui '- I c Q) ro c Q) Q) ro q. $: a. a. 0 0 c 0 0 0 .r::: 0 U:i U:i a: ~
Q)
Statistic .::.::.
VolwiVIb 0.548 0.399 0.052 0.358 0.158 0.03
AreawiVIb 0.526 0.377 0.05 0.349 0.153 0.05
EdgewiVIb 0.482 0.341 0.037 0.327 0.135 0.088
b 0.129 0.095 0.002 0.082 0.027 0.04
Table 4.5 Correlation coefficient of appropriate statistics and slope variables (significant correlations (ex = 0.01 are indicated in bold, ex= 0.05, indicated in italics)
The transformation of the intermediate axis dimensions results in a higher level of
correlation between the surface character variable and the slope variables, than with any
of the other direct measures of surface form. VolwMb consistently generates the highest
levels of correlation, followed by AreawMb and lastly EdgewMb. Despite that fact that the
statistics return a greater significance using the data provided by the image analysis
questions are raised about their use. AreawMb and EdgewMb respectively attempt to gain
an approximation of a facet of clast form that is deemed more significant in controlling
slope hydrology. Actual measures of clast area, approximated by AreawMb, and clast
perimeter, approximated by EdgewMb, have been generated by the image analysis, but
correlation of the actual values with slope variables yields low levels of significance.
Variables are now considered in a multivariate analysis of the relationship between slope
form and surface character.
4.4.1.5 Multivariate analysis
In an attempt to relate surface character to slope form, multiple regression models have
applied to a selection of surface cover variables and slope variables. The suitability of the
variables available for multiple regression is somewhat questionable. Multiple regression
assumes normality of homogenous residuals. The range of slope data is highly restricted,
due to the low undulating topography. Only a few plot positions show any significant
departure from the mean low plot angle (3.3°). Chi squared tests undertaken on a range of
transformations suggest no significant gains are to be made through data transformation.
- 144-

Chapter 4: The characteristics of ground surface form
The bimodal distribution of slope profile shape, and the limited sample number (9 sites) is
restrictive, but the semi-quantitative method of sample sites selection acts to increase the
value of the statistics. The regression has been undertaken with both site specific slope
variables, for example plot angle and up-slope distance and area, in addition to whole
slope variables, for example slope length, slope height, ken.par, whole slope angle.
Independently, the two groups of variables yield poor results. When combined more
success is gained. Regression models constructed between three measures of surface
character, whole slope and plot variables yield significant correlations (Table 4.6).
- 145-

I
Chapter 4: The characteristics of ground surface form
Percentage cover Mean crenulation Mean elongation
Prob > F = Prob > F = Prob > F = r2= 0.652 r2= 0.647 r2= 0.652
0.00 0.000 0.00
.... .... .... 0 0 0 c .... c .... c .... .... .... ....
Q) UJ Q) UJ Q) UJ ·c::; "0 ·c::; "0 ·c::; "0 tE .... ~ tE .... ~ tE .... ~
CO CO CO Q) "0 Q) "0 Q) "0 0 c 0 c 0 c
(.) CO (.) CO (.) CO
U5 U5 U5 Variable
Slope length 0.102 0.00 1.500 -0.000 2.30e-06 -1.573 -0.000 1.79e-06 -1.587
Slope height 0.641 0.014 0.413 -0.004 0.000 -0.565 -0.002 0.000 -0.367
Plot angle 0.167 0.013 0.065 -0.001 0.000 -0.051 -0.001 0.000 -0.148
Slope angle 0.801 1.000 0.451 -0.000 0.000 -0.055 -0.003 0.000 -0.446
ken.par 64.405 0.000 0.499 -0.319 0.004 -0.611 -0.215 0.003 -0.525
Plot distance -0.056 0.000 -0.684 0.000 1.80e-06 0.538 0.000 1.41 e-06 0.456
down-slope
Constant -26.861 0.6716 1.145 0.003 0.883 0.002
Table 4.6 Multiple regression diagnostics between slope and ground cover variables (P < 0.0001 for all regression models)
(rx = 0.01, r2 = 0.487)

Chapter 4: The characteristics of ground surface form
Significant correlations are found between slope and plot variables and percentage cover
(r2 = 0.652), mean crenulation (r2 = 0.647) and mean elongation (r2 = 0.652). The
suggestion is that slope surface cover and clast shape can be directly linked to slope form
and plot slope character. The poor results of regression between solely slope and solely
plot angle measures suggests that cover percentage is not independently linked with
slope form, nor plot angle. Surface cover can only be understood if slope parameters and
plot statistics are considered within a multivariate regression model.
The normalised beta coefficients (11) indicate the relative strength of each of the predictor
variables within the regression model. Beta coefficients are measured in standard
deviations and are hence directly comparable between variables. Analysis of beta
coefficients suggests the dominant variables in the regression model. Notably slope length
and height consistently return the high 11 values. In the regression of percentage cover a
standard deviation increase in slope length would result in a 1.5 standard deviation
increase in predicted ground percentage cover, with the other values in the model held
constant. Slope dimensions are critical controls on ground surface cover within this model.
Additionally, ken.par appears to be influential. In the prediction of mean crenulation a
standard deviation increase in ken.par results in a 0.611 standard deviation decrease in
mean clast crenulation and correspondingly a 0.525 decrease in clast elongation.
Increasingly convex slopes tend to promote higher levels of clast edge smoothing. Again it
is dangerous to generalize from aggregated statistics. For example, ken.par values will
not report down-slope change as they are effectively aggregated across the whole slope.
A single ken.par value represents a range of slope angles down the slope profile, rather
than a local plot parameter that influences plot specific surface characteristics. Logically,
three slope crest locations with equal slope characteristics, for example plot angles and
distance down-slope, but diverse ken.par values would not be expected to be significantly
different. Therefore, regression of measures of whole slope form to predict local surface
character, which has already been shown to vary dramatically, appears paradoxical. To
further this analysis it is suggested that individual sites are considered in the context of
their specific slope form, angles and ground cover features. By examining the relationship
between slope and surface at this scale it is hoped that further linkages between process
and form can be identified.
Variations in clast shape, texture, size and sorting are all coherent with a model of
progressively increasing process action down-slope, supporting the suggestion that the
surface character is dictated by slope controlled hydrological processes. Spurious
variation in Top and Bottom plot positions can be accounted for by either the presence
- 147-

Chapter 4: The characteristics of ground surface form
and influence of bedrock and the additional influence of other formative processes
respectively.
The nature of variation between the Top and Bottom plots locations is consistent with
hypothesis of surface modification by slope hydrology but the nature of variability is
complex. lt is evident that the variation in surface character is complex. No single slope or
ground cover variable is able to generate a statistically significant explanation or clast
surface form at all plots surveyed. Either a high degree of local control, which is masked in
the aggregated statistics presented above, or alternatively the surfaces appear to exhibit a
non-linear nature of variation is surface character. Controls on surface form appear to
have a variable influence dependant on location.
- 148-

Chapter 4: The characteristics of ground surface form
4.4.2 lnfiiLDence of geology and slope on grou011d surface character
Within this study, the range of slope forms within one basalt type at Marab Swayed allows
the influence of slope and basalt to be examined. The influence of underlying geology is
manifested by a distinct difference between basalts, despite the variation of slope forms
(Table 4. 7).
Image analysis Hand count at image Hand count (after
(sample number) plots (sample number) Higgitt and Allison,
1998a)
Mean Mean Mean
intermediate 0 intermediate 0 intermediate 0
Basalt type axis (m) axi~Jr!l) axis (m)
0.123 0.1596 Abed 0.087 0.576 0.1624 0.143
(14354) (1347)
0.0915 0.1386 Bishriyya 0.073 0.585 0.1198 0.117
(3961) (506)
0.1025 0.1447 Mad ha la 0.098 0.602 0.1298 0.254
(3759) (488)
Table 4.7 Variation in intermediate axis length for Abed, Bishriyya and Madhala basalts by three characterization techniques
Mean intermediate axis generated by the image analysis is consistently lower than that
derived by the hand counting both on the image analysis plots and from the data
previously compiled by Higgitt and Allison (1998). To reiterate: the image analysis
measures the exposed axis; those dimensions of the clast portion which is exposed above
the sediment surface. Additionally, variation in results maybe attributed to the adequacy of
the sample size and the accuracy of measurement. Maximum clast sizes surveyed by the
two techniques reflect this. For example, on Abed basalts the mean intermediate axis of
the four largest clasts surveyed using hand counting was 0.423 m, whereas from the
image analysis this value is 0.752 m. The difference in results between techniques
suggests both the importance of sample area returning a representative bulk sample, in
addition to the role of any operator bias in plot selection.
Individual clast form also varies between basalts (Figure 4.16), which may be indicative of
either an increased exposure to modification of the clasts by weathering, or secondly, a
- 149-

Chapter 4: The characteristics of ground surface form
reflection of the resilience of the basalt mineralogy to weathering. The Bishriyya, as the
youngest flow (0.1 to 1.45 million years) has the most tightly constricted distribution of
clast shape and texture, whereas the oldest Abed (8.9 million years) and the Madhala
(1.96 to 3.41 million years) show an increased dispersion of clast shapes and textures
(Figure 4.16). A direct link between clast form and basalt age is not consistent. lt would
perhaps be unreasonable to assume that present surface clasts have been remained at
the surface for a period comparable to the age of the underlying basalt, and environment
that the clasts have experienced has been consistent. The variation in clast shape is
therefore more likely to be a result of basalt mineralogy and locally controlled modification
by weathering of the clasts.
I I I I
1 - I-
-·-·-·-·-·-·-·-·-·-·-·--------------Abed (14354)
I I
Bishriyya (3961) I I I 0.8- I 1--I I I Madhala (3759 Q) I
L.. -·-·-·-·r·~·-·-·-·-·-·-::J
x I I I Q)
I" The cross hairs meet at the 1- 11 -----~-~-11 I I I median. The length of the
I· cross hairs is the interquartile 0.6-11 I -lj
I range. The outside lines are
I· drawn at the upper and lower I I
adjacent values. Number of clasts in the sample in brackets
-·-·-·-·-·-·-·-·-·-·-·-0.4- ------------· -
I I I I
0.4 0.6 0.8 1.0 Elongation
Figure 4.16 Variation in clast shape and texture between basalt types
A comparison of clast size distributions, specifically skewness and Cvb, for individual
basalt types indicates a clear distinction in surface form between basalts (Table 4.8).
Results appear contradictory. Absolute values of Cvb are highest on the Abed when
generated using the image analysis, whereas the hand-counting contrary shows the clast
dispersion on the Bishriyya to be greatest. The coefficient of variation is strongly dictated
by the presence of the finer fraction in the clast population, which the hand counting
eliminates. Skewness is influenced in a similar manner, whereby the large number of
smaller clasts dominates the nature of the tail of the distribution in the finer clast fraction.
- 150-

Chapter 4: The characteristics of ground surface form
Analysis of variance shows that the difference between basalts in both Cvb and the
skewness of the distribution identified by the image analysis is significant.
Cvb (standard deviation) Skewness
Image analysis Higgitt and Image analysis Higgitt and
Basalt Allison (1998) Alii son ( 1998)
Abed 37.332 (8.134) 34.83 (5.88) 1.379 (0.869) 0.71 (0.80)
Madhala 35.556 (9.651) 36.83 (6.61) 1.557 (0.734) 1.07 (0.62)
Bishriyya 33.331 (9.176) 37.81 (10.99) 1.892 (0.729) 1.41 (0.5)
Table 4.8 Clast sorting by basalt type
A tentative temporal link between basalt age and clast population sorting is shown, which
appears to be opposite to the trend identified by Higgitt and Allison (1998). The clast size
population becomes progressively more dispersed, but less skewed with age, suggesting
that the surface character diverges to a less sorted and loosely constricted size
distribution. The change in the nature of the clast population demonstrates a temporal
modification of the surfaces, with the oldest surfaces supporting fewer finer clasts. The
ergodic treatment of the individual basalt flows assumes that all surfaces on all basalt
types follow the same evolutionary trajectory and each began with the same type of
ground surface cover from emplacement and that the nature of surface modification
experienced by all basalt has been similar. Given that the largest mean size of clasts
appears on the oldest Abed flows (Table 4.8), the suggestion of a gradual alteration of
surface clasts with time is incongruous; clasts cannot increase in size through time. The
trend may be a reflection of the more extensive weathering of larger clasts through time,
which then persist at the surface.
Evidence of slope processes indicates a temporal modification of the surface clasts
through enhanced clast smoothing and rounding with age. The sorting of the clast
population does not support the trend suggested by clast texture, showing a decrease in
clast population sorting with age. Additionally, the highest ground surface cover is found
on the older Abed flows (Table 4.9). Again the relative variability between sites is
consistent between characterization techniques, but the absolute values generated are
diverse.
- 151 -

Chapter 4: The characteristics of ground surface form
:§: ,..._ 00 E :§: (/) ::R ,..._
0 ·x ,..._ ~ 0> ::R ~ "C ::R L.. 0> ~ (/) '6 ro ~ Q) L.. c 0 .....
> Q) 0 (/) c L.. 0 c > :p a.. a. Q) Q) Ul u 0 0 ro Q)
L..
> '(ij u E Qi ro 0 "C (/) Cl a. u >. c "C ·x ro - a. 0
"C (ij ::J <i: c 0 E L.. ro c c 0 :§: ::J L..
~ - :§: ro L.. "C 0 a. -::J Cl c L.. a. 0 0 0 Q) ro Cl ro 0 c L..
Cl Q) Cl u 0 Cl ro Cl ;;:; Q) "C .£: "C :p Q) E ro Cl Cl '6 c c ro Cl ..... Cl ro (/) ::J E = c c ::J ro Q) I: g. 0 0 ·x c Q) L.. u L.. u Qi u Cl 0 Q) L.. L.. Q) Q) L.. "C ~ a. <!= Q) E c ::R a.
a.. 0 a. Q) - ~ 0 ro ro Basalt a.. a.. ~ ..c
Abed 38.179 50.77 57.882 44.296
(7.524) (14.27) (14.871) (8.954)
Madhala 27.414 49.61 42.518 38.741
(8.446) (15.30) (17.012) (9.756)
Bishriyya 24.788 46.44 37.139 30.617
(8.861) (21.71) (19.804) (11.251)
Table 4.9 Percentage ground surface cover between basalts, by different surface characterization techniques
Results from all methods of characterization show a consistent nature of variability
between the three basalts. The Bishriyya basalt shows the lowest percentage cover, but a
higher standard deviation. Absolute differences between basalts do overlap between
techniques, reflecting the subtle nature of variability on the surfaces and the resulting
necessity for a precise characterization technique. The results generated do not adhere to
a model of surface modification via attrition and weathering of clasts by hydrological
processes through time. Percentage ground surface cover increases in parallel with basalt
age, implying that older, presumably more mature slopes, are dominated by larger clasts.
No explanation for this phenomenon as a result of surface hydrology or process
modification appears to be available. The nature of variation is either as a result of
mineralogical variability dictating the nature of weathering and boulder exhumation, or a
more complex nature of development where the largest clasts persist at the surface, both
hypotheses which cannot be substantiated here. Considerable variation in basalt
mineralogy has been shown (Tarawneh et al., 2000). If this is the case, the temporal link
previously suggested may purely be an artifact of basalt mineralogy, which coincidental
with a temporal change related to basalt.
A direct link between geology, basalt age and the nature of the characteristic surface form
found on each basalt is complex, and at times surprising. Within the Abed basalt surveyed
- 152-

Chapter 4: The characteristics of ground surface form
in this study, a large diversity in slope profile forms has been identified. The influence of
slope position has been shown, but significant levels of standard deviation in the results
within each basalt type are apparent. The nature and variability of slope profile form and
ground surface character warrants further description.
A systematic variation in ground surface cover down-slope has been established by
aggregating results by plot position but a significant degree of variation which cannot be
explained purely in terms of geology or basic slope variables is still apparent. Least
squares correlation diagnostics between whole slope variables (length, height, ken.par)
and surface cover variables, or their normalised transformations, yield only poor levels of
significance. When the results are aggregated by whole slope, the only correlations of
note are between slope length and Cvb (r2 = 0.229), roundness (r2 = 0.06), crenulation (r2
= 0.06), circularity (r2 = 0.06) and perimeter (r2 = 0.05), at 7 profile locations, but none of
which are significant (significance values - a = 0.05 = 0.374, and a = 0.01 = 0.478).
Whole slope angle yields equally weak correlations with circularity (r2 = 0.04) and
crenulation (r2 = 0.05). Accordingly, slope height is poorly related to clast crenulation (r2 =
0.05) and clast roundness (r2 = 0.05). Grouping results by site location, and hence
geology, appears unable to describe the nature of variability between plots.
Disaggregating plots as independent points in the landscape yields a greater number of
significant least squares correlations between slope variables and ground surface cover
(Table 4.1 0). Here, each plot is considered independent, with its own local slope control.
The success of this method suggests that local controls on surface character are of great
importance, in addition to the overriding significance of geology, previously shown. All
variables return significant correlations, apart from the up-slope angle (the angle of slope
length 10 m above the plot position). Ground surface cover, clast sorting, clast size and
shape all relate significantly to both local (plot angle, slope curvature, plot distance down
slope, up-slope angle) and whole slope form variables (whole slope angle, ken.par, slope
height, slope length). By regrouping the variables to individual plots significant correlations
between slope and ground cover emerge. Local controls on form appear importance.
- 153-

Chapter 4: The characteristics of ground surface form
"0 Q) c ~ ::1 Q) 0 "0 ..... C')
C')'- Q) "0 Q) E Q) Q) > '-..C ..... c UlC 0')0 Q) ..... (;) en o ro u ..... C') ro ro ·- ro o
..... Q) .!: c o..c oiii 0~ :ij u c~ c"S c C') ~~ D ro en roe, ro c ro c Q) ::I > Q) ·- 0 :ij Q) Q) Q) 0
Variable a... en 0 ~~ 1-- ~ t; ~-w
Plot angle 0.397 0.413 0.141 0.128 0.561 0.341 Q) c. 0 Q) Slope curvature 0.404 0.390 0.007 0.174 0.685 0.608 -:c Ill ro Q) ·- Plot distance - ... o ro 0.382 0.580 0.058 0.137 0.108 0.038 .s::. > down-slope ~
Up-slope angle 0.036 0.010 0.017 0.000 0.002 0.036
Q) Whole slope 0.359 0.425 0.164 0.174 0.174 0.033 :c angle ro ·;:
ken. par 0.107 0.002 0.628 0.001 0.280 0.252 ro > Q) c. Slope length 0.257 0.312 0.362 0.417 0.041 0.000 0
"iii iii Slope height 0.003 0.026 0.553 0.025 0.379 0.300 u 0 Whole slope ...1 0.276 0.425 0.164 0.553 0.174 0.033 angle
(significance levels: a = 0.05 =italics; a = 0.01 =bold)
Table 4.10 R squared values for least squares correlations between slope and ground surface cover variables
The strength of the correlations between surface character and slope implies that a gravity
driven processes in this case hydraulics, are responsible for the condition of the
contemporary slope surface configuration. The significance of the each correlation can be
used to infer the nature of the dominant process in action. If both local slope and up-slope
length or influencing area is equally strongly significant, then the implication is that
hydraulic modification by overland flow is an important control on surface form. If slope or
gravity, on its own, is most significant then the importance of hydraulics maybe less clear.
Hydraulic action is controlled by both the slope of the point in question but is also
conditioned by the angle and length of the up-slope area. If slope is significant and up
slope variables are not, then an alternative model of surface modification is more
appropriate. An iterative alteration of surface form, via titling or toppling, the dominant
direction of which is controlled by slope maybe more a appropriate mechanism of surface
modification.
Hydrological processes both act and vary down the whole slope profile. If the significant
correlations discussed above stand true, then the change in surface character down a
- 154-

Chapter 4: The characteristics of ground surface form
slope profile should be closely linked to the form, or shape, of that profile. In this study the
selection of profile locations with significantly concave, convex and rectilinear profile forms
allows individual plots to be considered in the context of the whole profile. Even though
the discussion below is concentrating purely on one example of each profile, the semi
quantitative method of profile location enhances the validity of any extrapolation from
results generated from these sites.
The rectilinear slope profile was selected as a control location whereby down-slope
variation in surface character can be examined independently from any slope form
variation. The concave (CC) and convex (CV) profiles allows the examination of extreme
profile forms in the spectrum of profile surveyed at Marab Swayed.
- 155-

Chapter 4: The characteristics of ground surface form
Rectilinear profile (ST)
The rectilinear profile demonstrates a down-slope variation of clast and surface form
which indicates modification by surface processes (Figure 4.17). A long profile (> 200 m)
was deliberately chosen such that absolute differences in surface form between plot
positions would be clearly apparent, which is reflected below. Ground surface cover
reduces down-slope but the difference between the Top and Middle plot locations is more
pronounced than that between the Middle and the Bottom plots. The difference between
plot positions is also notable in the values of Cvb. which show a significantly lower value at
the Top plot than at plots further down-slope. Mean intermediate axis length does not
appear to follow a gradual change from Top to Bottom of the profile, with the Middle plot
position showing the lowest mean intermediate axis length. The behaviour of mean
intermediate axis dimensions maybe a reflection of the inadequacy of the measure in
assessing surface character in respect to slope processes.
E' -:E O'l ·a; I
20
15-
10-
5 -
0-
c 0 0.036 ~ ·;:: ro ~ 0.034 0
c Q)
·u 0.032 iE Q) 0 (.)
0
I I
I I
I
I
50 100 150
I I
I I
I
I I
Length (m)
I I
I
.,.
_0.135 " E ' - ' .~ X ro Q)
§ ~ 0.13 E .... Q)
c c ro Q)
~
' ' ' ' ' ' ~ ' , ' ,' ' , ' , ' , ' ,
' ,' ' , ' , ' , ' , -v'
0.125 ..,_-----.,.---------r 200 Top
-';$2, 0 38--....
" Q) > 0 36-t>
' ' ' "0 c ::J
~ 34 Q) Ol ro - 32 c Q) t> .... Q) a..
' ' ' ' ' ' ' ' '
Middle Plot position
' ' ' ' '
Bottom
0.03 -..,.~-------,-------,- 30 ~---- --- --""'
Top Middle Plot position
Bottom Top Middle Plot position
Figure 4.17 Ground surface variation- rectilinear slope profile (ST)
Bottom
The nature of down-slope change suggests an increasing intensity of process action
down-slope, attributable to an increased influencing up-slope area at the lower slope
- 156-

Chapter 4: The characteristics of ground surface form
positions. The relative difference in surface character between plots can also be used as a
surrogate for the variable action of surface processes. The change in surface character at
the Middle plot is not halfway between the condition of the Top and Bottom plots. On a
straight profile, if process intensity was linearly related to the volume of overland flow
passing over each point, then the intensity of process action would increase linearly with
distance down-slope as up-slope catchment area increases. Previously, a homeostatic
link between form and process has been suggested whereby the ground surface cover
acts to condition the processes acting on the slope, but not as yet tested in the
northeastern Badia (Higgitt and Alii son, 1998; Wainwright et al., 2000). The nature of
change on this profile supports this; percentage ground cover and the coefficient of
variation appear to approach an asymptotic value down-slope, which may be a stable
condition under which surface clasts control surface hydrology and its degree of surface
modification. The interaction between form and process and potential feedback
mechanisms in operation are discussed further below.
Convex profile- CV
Relative change in surface character down-slope on the convex profile in part adheres to
the pattern of variability observed on the rectilinear profile. Ground surface cover reduces
from the Top to the Bottom of the profile (Figure 4.18). In this instance a clear increase in
clast population sorting is also apparent from slope Top to Bottom. The relative difference
in surface character between plot positions is also of interest. There is a greater distinction
between the Top and Middle, as opposed to the Middle and Bottom plots, with the latter
exhibiting a similar level of ground surface cover and sorting. Due to the high slope angles
at the Middle and Bottom plot positions the velocity of overland flow at the Middle and
Bottom points may be greatest, accounting for an increase in sorting and a reduction in
ground surface cover. Again, mean clast intermediate axis is greatest at the profile
midpoint, suggesting that slope process action has little impact on down-slope clast size
variation. The variation in intermediate axis can be considered as a result of variable
process intensity down-slope due to increased volumes of overland flow. At the Middle
plot overland flow is rapidly accelerating due to the break in slope angle, possible
accounting for the apparently sudden drop in Cvb and percentage ground cover.
- 157-

15
Chapter 4: The characteristics of ground surface form
-E ~
U) ·x: (1l
0.125 /~ , ' , ' , ' ' , ' , ' , '
E' 10 , ' , ' $ 0.12 .!!?
.:E 0>
"Q) I
~
5
0 0 20 40 60
, ' "0 , ' Q) , ' , ' , ' , ' , ' , '
E
~ 0.115 , ' , '
~ , ~
0.11 ...,_-------.----------T' Top Bottom -~ 0.034
Length (m) ::R. ~ 37 .._
Middle Plot position
c 0
~ " ' Q) > 0 " ' ' ' ' -~ 0.032 ' ' ' ~ 36.5 c :J 0
' ' > 4--0
c ' ' ' ' '
' ' 0, 36 ' ' ' ' -~ 0.03
iE ' ' ' ' '
Q) 0> (1l
~ 35.5-' ' ' ' "'--------Q)
0 ()
0.028 T op
' -----001() ' .. ------Middle
Plot position
Bottom
(.) .._
8.: 35 Top Middle
Plot position
Figure 4.18 Ground surface variation- convex slope profile (CV)
Concave profile- CC
-----::::>
Bottom
A systematic variation in ground surface cover on the concave profile is apparent. The
variation of ground surface cover down the concave profile can again be explained as a
result of the variable action of processes (Figure 4.19). Clast population sorting increases
down-slope, but in this instance both mean intermediate axis and ground surface cover
show a different nature of change down-slope. The largest mean intermediate axes
dimension is found at the profile midpoint, as on the convex profile. Unusually on the
concave profile a larger ground surface cover is found at the Bottom plot position relative
to the Middle plot position. The relative influence of profile form can be used as an
explanation. At the profile midpoint the plot is located in the concavity of the slope.
Overland flow generated up-slope will have a high velocity, due to the high up-slope
angle, and hence will have an enhanced erosive potential. At the Bottom plot location,
where the slope angles are significantly lower, this erosive potential will be reduced. The
tendency of clasts to move will be reduced. Hence the removal of clasts out of this portion
of the slope will be lower than the transport of clasts in, increasing the ground surface
cover at the profile Bottom.
- 158-

.:E
Chapter 4: The characteristics of ground surface form
0.14
(/) ')( ro (!) 0.135
."ffi
A / '
/ ' / '
/ ' / '
/ ' / '
/ ' Ol ·a; "Cl (!)
E ._ / '
/ ' / ' I
-.0 > £
0.035
c 0 ~ 0.03 ·;:: ro > -0
~ 0.025 "l5 it: (!) 0 ()
0.02
0
" " " " " ~
Top
" " " " "
50 Length (m)
,.,-- ---" " "
Middle
Plot position
--- _..., --
100
Bo tom
(!) c 0.13 c ro (!)
~
0.125
.-45 ~ 0
._ (!) > 0 u
"Cl c :::J
9:l0 Ol (!) Ol ro -c (!)
e (!) a..
" ' '
/ ' / '
/ ' / '
~ ~
Top Middle Plot position
Bottom
' ' ' ' ' ' ' , ' " ' ; ' ,"
' " ' ; ' ," ' " ' ;" ' ;
'~"
35 ~-----------r------------r Top Middle
Plot position Bottom
Figure 4.19 Ground surface cover- concave slope profile (CC)
Having noted a significant variation in form with slope and a seemingly diverse response
of surface character relative to profile form, any conclusions about the control of slope
form on surface character must bare in mind the likely mechanism of surface alteration.
The above analysis focuses on the intensity of process modification of the surface,
predominantly hydraulic processes, whose intensity is dictated by slope and up-slope
area. Where the slope angles are highest the up-slope area is greater then the action of
processes most intense. As stated previously the most feasible mechanism of surface
modification is by an iterative process, whereby the cumulative influence of multiple small
scale movements results in the variations in ground surface cover seen. Testing a
hypothesis of hydraulic modification of the surfaces yields only insignificant results. There
is no clear relationship between various slope variables and the ground surface character.
Surface form variation suggests that the modification of the surface down-slope may
approach some form of stable state. The slope character does not follow a linear variation
from the Top to the Bottom of the profile but more normally approaches an asymptotic
- 159-

Chapter 4: The characteristics of ground surface form
state. Although based only on three plot sample locations this pattern appears to be
consistent. Conversely the standard deviation of many of the surface characteristics
increases down-slope. The suggestion is that if slope process increases down-slope, the
resulting surface modification resulting in a diversity of surface configurations, but these
configurations are themselves at a stable asymptotic configuration.
4.4.3 Spatia~ characteristics
Observations in the northeastern Badia have noted pattern and structure in the
arrangement of surface clasts. The presence and distinction of structure varies with
position down-slope, indicating that this organization maybe controlled by slope process
action. A structured surface may be more stable and enforce negative feedbacks on
process action. For example a locked series of polygons constructed from surface clasts
may act to inhibit overland flow. The low levels of significance in correlations identified
between surface form and slope variables are not capable of reflecting the modification of
process by form. No attempt to quantify or relate the presence of surface structure to the
action of processes on clastic semi-arid slopes has been undertaken, either in the
northeastern Badia or beyond. The only consideration of the spatial arrangement of
surface clasts in the context of coarse clastic semi-arid surfaces has been qualitative
(Abrahams and Parsons, 1994 ).
The presence of structure in landforms has been the focus of recent interest (Harrison,
2001 ). Structure is thought to be an emergent property indicative of self-organizing
processes in natural systems (Phillips, 1999). In a model of self-organization, pattern is
seen as both a cause and effect of process action and variability. The debate of self
organization in geomorphology has been limited to the lack of sufficient detail and depth of
data to support quantitative models of self-organizing processes (Baas, in press). The
image analysis allows the spatial character of the in situ nature of the surface to be
assessed at both a high resolution and over a large spatial extent which encompasses a
large sample size. The use of spatial statistics allows a quantitative assessment of spatial
distribution of surface clasts and therefore surface organization. A quantitative comparison
of structure between sites allows the presence and intensity of organization to be linked
directly to other geomorphological aspects of slope morphology.
The range of spatial analysis techniques has increased as technological advances in data
collection and analysis have developed. The lack of a statistical measure of similarity
between 2-dimensional patterns often turns researchers to a qualitative description of
pattern (Tribe and Church, 1999). A visual appraisal of similarity of structures and forms is
- 160-

Chapter 4: The characteristics of ground surface form
therefore commonly relied upon (Tribe and Church, 1999). Spatial pattern is complex and
methods of measurement vary between investigations with different objectives. An
appropriate range of techniques have been adopted below to develop a transferable
assessment of surface form between sites within the northeastern Badia. Pattern or
structure firstly warrants further clarification. lt is vital to consider the fundamental
properties of pattern prior to trying to quantify pattern.
The nature of pattern can be indicative of process action. Equidistant spacing suggests
repulsion between points, clustering suggests attraction and random spacing suggests no
form of interaction (Evans, 1967). The distribution of separation distances between the
neighboring objects can be indicative of the pattern of the distribution. A normal
distribution of distances suggests random spacing, a peaked distribution implies
regularity, a flattened distribution represents clustering. Evans (1967) proposed a
tetrahedral model of pattern description in two-dimensional space. Pattern in two
dimensional space has four properties: regularity, clustering, linearity and randomness
(Figure 4.20). Visually the surfaces of the northeastern Badia show linearity, some
clustering and a regularity in clast distribution; the distinction of which commonly
increases with distance down-slope.
Regular Regular linear
Random
Figure 4.20 The description of two dimensional pattern (after Evans, 1967)
The distinct clasts on the open matrix surfaces of the northeastern Badia lend themselves
to point pattern analysis. Several methods have been developed for the analysis of point
pattern data in two-dimensional space and much attention has been devoted to its
characterization (Diggle, 1983; Ripley, 1988; Fotheringham et al., 2000). The objective of
much of this work is to examine the degree and direction of departure of a pattern from
- 161 -

Chapter 4: The characteristics of ground surface form
complete spatial randomness (CSR). By definition the reduction of spatial data to a point
pattern loses attribute information of each object within the pattern, for example clast
shape or area. Point patterns are appropriate if the separation distances between points
are far greater than the objects that the points represent (Okabe et al., 1992).
Furthermore, the need to sample a population often incurs bias and inaccuracy in the
resultant estimated population characteristics (Greig-Smith, 1964; Berry and Marble,
1968; King, 1969; Pielou, 1975).
Geographical information systems (GIS) allow large numbers of spatially referenced data
to be analyzed in a spatial context, minimizing the necessity for sub-sampling a large
spatially extensive sample. Three approaches to understanding the variation in pattern
and structure in the Badia are described below: nearest neighbor analysis; Theissen
polygon analysis; and box fractal dimensions are used to describe the features of the
patterns observed. Nearest neighbour analysis is designed to assess the degree of
clustering. Additionally, a further spatially dependent measure of clasts form, clast
orientation is discussed.
4.4.3.1 Nearest neighbour analysis
The image analysis combined with the DGPS survey derives the centroid location of each
clast in WGS84 co-ordinates, to a precision of 0.01 m. Nearest neighbor analysis is
undertaken in ArcGIS 8.1, using the Nearest Neighbour Script, v. 1.8* (Brooks, 1998). The
resolution of the images means that up to the 81h nearest neighbor was commonly at only
1 pixel separation from the nearest 8 clasts, making the statistic meaningless. The
analysis is therefore undertaken on all clasts greater than 0.05 m intermediate axis, which
are separated by a distance greater than 0.02 m. The size threshold is also employed in
the Theissen polygon analysis below for the same reasoning. Observation in the field
indicates that structures are predominantly formed by the larger clasts on the surface, with
smaller clast filling gaps in between, so the size filter does not bias the nature of the
patterning measured.
Nearest neighbour analysis is undertaken initially on the binary overlay considering the
planimetric projection of each clast. The most successful differentiation between plot
positions is gained when the surface is reduced to a point pattern, despite the loss of clast
specific data. The analysis assumes firstly that the area covered by each image is
uniform, and that any variation is not a consequence of microtopographic variations in the
• download- http://arcscripts.esri.com/details.asp?dbid=1 0642
- 162-

Chapter 4: The characteristics of ground surface form
area itself but rather as a result of the interactions between the clasts in the image.
Second, the area is considered to have an infinite extent, or at least there is no boundary
that restricts the direction that clast separation distance measurements can be made. The
effects of boundary conditions are reduced with the large point data sets used, but the
effects can be corrected.
Measures of nearest neighbor distances are commonly employed to test whether a given
distribution represents a random form or the departure of the distribution from complete
spatial randomness (CSR). The ratio of the expected separation distance if the pattern
were random, to the actual measured mean separation distance is commonly employed
as a statistical measure of point pattern character (Fotheringham et a/., 2000).
The mean point to point separation distance in a random distribution is defined as follows.
Eq. 4.2
p(l) = o.sd-o s
where: d is the density of points and p(l) is the between point separation distance. d is
calculated as the total number of points in the unit area;
d=N A
Eq. 4.3
where N is the total number of points in the image area (A). Combing Equation 2 and
Equation 3 gives:
(/)--1_ p - 2Jd
Eq. 4.4
A comparison between 2-dimensional patterns is provided by the ratio of the mean
observed separation distance r (I) and that expected for a random distribution p(l):
R(l) = r(l) p(l)
Eq. 4.5
When R(l) tends to 1, the measured pattern approaches a random character. Statistically
significant departures to non-random distributions are defined by:
- 163-

Chapter 4: The characteristics of ground surface form
Eq. 4.6
1.0 ± z . o[R(I)]
where z is the standard deviate corresponding to the required level of significance, and a
is the standard deviation, defined below:
Eq. 4.7
u(R(/)] = 0.5228N-05
Commonly used values of significance for large point patterns give z = 1.96 for a= 0.05,
and z= 2.58 for a= 0.01 (Fotheringham et al., 2000). If the R(l) value generated falls
either above or below these limits then the pattern is taken to be non-random. A pattern
where all points are coincident returns a R(l) value equal to 0, 1 for a random pattern, and
a pattern where points form a perfect lattice structure can be shown to return an R(l) value
of 2.142 (Fotheringham et al., 2000).
The majority of clast distributions from the 29 plots studied showed a significant departure
to regularity, indicated by R(l) values > 1. Correlation analysis reveals no significant
relationship between the R(l) value and slope or ground cover variables. The analysis of
individual profiles reveals some degree of down-slope variation, but not at all sites (Figure
4.21 ). The Upper plot has a notable increase in R(l), and correspondingly Lower shows a
marked decrease in R(l). The median value of R(l) increases slightly between Top and
Bottom plot positions, suggesting a greater degree of surface organization of the clast
surface towards the Bottom of the slope profile. The pattern of change is not however
significant on all slopes surveyed, as seen in the high inter-quartile range at all sites.
- 164-

2
u ~ ~ 1ii 1.5
...... ::J 0 .0 ~ Ol
'Q) c 1ii (!) ...... ro (!)
z
0.5
Chapter 4: The characteristics of ground surface form
0
0
0
Top Upper Middle Lower Bottom
Figure 4.21 Down-slope change in R(l) nearest neighbour value
The analysis of nearest neighbor distances assesses clast spacing. Clasts spacing is both
a function of clast size, and surface structure. At Top plot positions the large clasts size
will increase and regulate the spacing between centroids. At Bottom plot positions the R(l)
Analysis of R(1) values must however taken with caution. The R(1) distance, to the
nearest neighbor, is, by definition, controlled clast size. Point patterns are generated from
centroids of clasts. If the mean size of clasts on the surface is d, then separation between
two clasts can be no less than:
d (2x-)
2
Eq. 4.8
Therefore, clasts cannot be clustered, as centroids will never be in close proximity. R(1)
values therefore tend to suggest regular patterns. A consideration of higher order
neighbors, beyond a separation of d, may yield a better understanding of pattern form, but
this is beyond the capability of the nearest neighbor algorithm.
- 165-

Chapter 4: The characteristics of ground surface form
4.4.3.2 Tlheisse1111 polygo1111 analysis
Okabe et al. (1992) give a full discussion of the application of and background to Thiessen.
polygons in spatial analysis. Here, Theissen polygons are constructed around the point
patterns generated from the binary overlays using the 'Thiessen' Arcscript within ArcView
3.1 30 Analyst extension* (Amman, 1998). The surface patterns appear to be constructed
primarily from the larger clast fraction, with the finer fraction infilling voids between larger
clasts. A large number of small clasts in the Thiessen polygon analysis would act to
heavily bias the results of the Thiessen polygon analysis. A comparison between tests
including and excluding the small clast fraction showed that a greater statistical distinction
between profiles and plot positions was achieved by excluding the finer fractions,
supporting the use of this clast size filter. The clast size filter employed for the nearest
neighbour analysis is used. Theissen polygons are computed such that the area defined
by the polygon is closer to the enclosed point (the clast centroid) than to any other point in
the point pattern, as described by Okabe et al. (1992) (Figure 4.22). The use of ArcView
3.1 GIS allows the rapid calculation of vertex number, vertex angles and Thiessen
polygon area. Edge effects in the construction of the Theissen network are overcome
within ArcView 3.1 by creating a buffer zone equal to 5% of the area contained within a
convex hull draw around the extent of the point pattern.
Figure 4.22 Example ofThiessen polygon net (SW1L)
·down load: http://arcscripts.esri.com/details.asp?dbid=1 0107
- 166-

Chapter 4: The characteristics of ground surface form
A further sub-sample to minimize edge effects was taken excluding all points whose
surrounding polygon was either on the edge of the pattern, or whose polygon form could
have been influenced by an arbitrary edge effect (Boots, 1987). The most successful
distinction of pattern and structured forms is found using the analysis of the standard
deviation of the number of vertices in each polygon net (Okabe et al., 1992). Thiessen
polygon analysis allows a comparison between images of different dimensions, areas and
scales. As the standard deviation of the number of Theissen vertices (Tvert) increases, the
point pattern tends to clustering; and conversely a reduction in Tvert sees the pattern
becomes more uniformly spaced. A consistent increase in Tvert down-slope is apparent
suggesting a greater degree of regularity and clustering in the spatial arrangement down
slope (Figure 4.23). The Top plot position is notably less organized than the four down
slope plots. A larger interquartile range in Tvert is also apparent at the Upper and Lower
plot positions.
- ,-----
1.3 - ,---(/) Q) u t - ,-----Q) > - ,---c Q) (/) (/) 1.2 .!!? ..c 1-.._ 0 .... Q) .0 E
1.1 :::J c .._ 0 c 0
:;:::; !tl _L ·:; Q) "0 1 "0 .... !tl 0 "0 c !tl
Ci5
0.9
Top Upper Middle Lower Bottom
Plot position
Figure 4.23 Variation ofT vert down-slope - all sites
As with the previous measures of surface character discussed, the aggregated statistics
for all plot positions hide the subtleties in the data set. The examination of individual slope
- 167-

Chapter 4: The characteristics of ground surface form
yields a more detailed understanding of down-slope variation. For example SW1 exhibits
the general trend indicated by the aggregated statistics, with some notable exceptions
(Figure 4.24).
0
1.3 -
0
t: Q) r:- 1.2 -
0 0
0
1.1 -'-r--------r------~-----~------r-' Top Upper Middle Lower Bottom
Plot position
Figure 4.24 Variation ofTven down-slope- SW1
Thiessen polygon analysis at SW1 shows an increase in clustering down-slope,
represented by an increase in Tvert· Interestingly the bottom plot does not adhere to a
gradual down-slope transition, showing an apparently marked reduction in the degree of
surface organisation. An examination of the original images captured at SW1 suggests
that at the Bottom plot position the low number of clasts limits the interactions and
contacts between rocks (Plate 4.5). Structures cannot be formed as there is not sufficient
density of cover of clasts. The implication is that structures arise from frictions between
clasts. Where the low density of cover reduces contacts between clasts are limited and
clasts are more free to move. The significant discrepancy between the Bottom plot
position and the plots up-slope indicates that a threshold of cover may dictate the
organization of the surface, below which structure cannot form. This threshold is clast size
dependent.
- 168-

Chapter 4: The characteristics of ground surface form
Plate 4.5 Down-slope change in the presence of surface pattern - SW1
- 169-

Chapter 4: The characteristics of ground surface form
4.4.3.3 Fractal dimension analysis
Observation in the field suggests that structure or pattern is a function of clast size.
Surface with large clasts have large structures, whereas surfaces with smaller clasts have
smaller structures (Plate 4.6). A scale free measure of structure or pattern would provide a
measure of organization which is independent of the clast size distribution.
Plate 4.6 Pattern at different scales, with different clast sizes
Numerous examples of the use of fractals in geomorphology have been published
including investigations into the fractal properties of landscape (Tingbao et al., 1993;
Rodrigues-lturbe and Rinaldo, 1997), the structure of surfaces (Butler et al., 2001 ), the
fracturing of weathering rocks (Ehlen, 2000) and the geomorphometry of river planform
(Stolum, 1998). Fractal dimension of semi-arid surfaces dominated by hydrological
process has been identified. Dunne et al. (1992) in an assessment of surface roughness
used the fractal dimension of a series of highly detailed contour profiles at set intervals
down-slope, noting an increase in fractal dimension with distance down-slope. Fractal
assessment of landforms is commonly regarded as closely linked to issues of chaos, self
organized criticality and emergence within geomorphology (Harrison, 2001 ).
The box dimension is used here as a measure of surface organization . Box fractal
dimension is calculated for the sediment areas between clasts. The fractal dimension of
- 170-

Chapter 4: The characteristics of ground surface form
the planimetric projection of clasts is constant, irrespective of spatial arrangement.
Conversely the fractal dimension of the interclast spaces will vary with clast organization.
Box fractal dimension was determined for the binary image overlays using custom written
fractal slope analysis software (HarFA v. 4.0) 1. An iterative process of overlaying the
image with a grid of varying size and counting grid squares which totally cover the
sediment area is used to determine box fractal dimension. Repeating this procedure with
various sizes grid spacing (1/ ) results in a logarithmic function of grid size (1/ ) and
number of boxes (N) needed to totally cover the object. The slope of the linear portion of
this function, Equation 8 gives the box fractal dimension (Fbox).
where; N = number of boxes
K "" size of the box
Fbox = box fractal dimension
Eq. 4.9
A higher fractal dimension is generated when the interclastic voids represent a greater
degree of self-similarity. Where there is a greater distinction between those areas that
have and those areas that do not have boulders is more apparent. Where the sediment
surface exhibits areas which are devoid of clasts the fractal dimension increases.
Conversely where only small areas of the sediment surface are exposed and free of clasts
the fractal dimension is low as the self-similarity between scales across the image is low.
Fractal dimension may in part be a derivative of clast size distribution, for example a
higher fractal dimension maybe expected from a surface with a broad clast size
distribution. If the fractal dimension increases in parallel with a progressive decrease in
the mean and standard deviation of the clast size distribution then the change in fractal
dimension could be attributable to the clast size range. Conversely, if fractal dimension
increases, but clast size remains constant or decreases in both mean and standard
deviation, then the variation in fractal dimension must be as a result of spatial surface
organization. This is found to be the case in the northeastern Badia (Figure 4.25).
1 http://www.fch.vutbr.cz/lectures/imagesci/harfa.htm
- 171 -

Chapter 4: The characteristics of ground surface form
1.8
T
c .Q (/) c Q)
E "0 1.6 ro -u ro ,_
'+-X 0 Ill
1.4
Top Upper Middle Lower Bottom
Plot position
Figure 4.25 Down-slope variation in box fractal dimension
lt is interesting to note that the analysis of box fractal dimensions shows a consistent
down-slope variation in sediment area complexity with slope. Again an asymptotic
relationship between distance down-slope could be suggested. Additionally, the standard
deviation in box fractal dimension appears to decrease from the Top to the Middle plot
positions and increase from the Middle to the Bottom plot positions. Again this may
represent some form of divergent behavior down-slope.
- 172-

Chapter 4: The characteristics of ground surface form
4.4.3.4 Clast orientation
Preferential clast orientation has been examined on boulder mantled slopes as an
indicator of overland flow process action (Vincent and Sadah, 1995; lbbeken et al., 1998;
Friend et al., 2000). In the northeastern Badia the preferential orientation of clasts may be
used to aid the understanding of surface modification by slope processes. A preferential
sorting across or down-slope may indicate alignment of clasts by flow processes. The in
situ assessment of the surface provided by the image analysis generates centroid location
and the position of the end points of the major and minor axis, from which clast orientation
can be derived. Again the clast size filter (intermediate axis > 0.05 m) is applied to remove
the smallest clast fragment. Orientation is more a function of the grid geometry rather than
the planimetry of the clast shape for clasts below this size. Basic visual assessment of raw
orientation data does not reveal the presence of modes in the data, and qualitative
comparison of preferential orientation between sites is ambiguous (Figure 4.26). There is
a tentative suggestion of four modes of orientation when the data is aggregated for all
sites, focussed at 35°, 70°, 120° and 155°, relative to down-slope (0°), with a symmetrical
distribution of orientations. Least square correlation yields only insignificant relationships
between clast orientation measures, suggesting that there is no systematic variation
across the landscape in clast orientation.
mean direction 90.0°
vector strength 0.629
Down-slope
Figure 4.26 Clast orientation- all clasts at all sites (n = 21230)
A statistical technique is employed below whereby the distribution of clast orientations is
progressively smoothed to an increasing degree, using a nonparametric density estimate
(Fisher, 1993). As the level of smoothing increases, only the most significant modes or
- 173-

Chapter 4: The characteristics of ground surface form
orientation trends are retained in the data. Mathematically the density estimate employed
is described as follows:
where;
, "(B-B) f(B)=(nhr'~w -17-i
e = direction of clast orientation
n = each individual clast
h = magnitude of smoothing or kernel halfwidth
w(9) = probability density function.
Eq.4.10
A probability density function with a bell shaped distribution with finite maximum and
minimum limits is employed as the most appropriate to apply to circular data (Fisher,
1993). The chosen density estimate is based on a quartic smoothing function (Silverman,
1986) (Equation 4.11 ).
Eq. 4.11
w(B) ~{~·9375(1- B')' -1s;es;1
The kernel density estimate was applied between 0 and 180° on clast major axis
orientation data. The smoothing kernel width (h) was varied at 1° intervals between 1° and
50°. After each smoothing iteration the number of modes, defined here is a density
estimate that is greater than both the estimate before and the estimate after, is calculated.
The number of modes detected is then plotted against the width of the smoothing kernel,
which gives a quantitative measure of the persistence or trend in clast orientation. The
number of modes can then be identified to specific orientation angles in the smoothed
data.
Analysis of the persistence of modes in orientation data does not reveal a conclusive
pattern of down-slope clast orientation for all slopes or plot positions. At some profiles
there is a suggestion of a greater persistence of a smaller number of modes in the data
towards the toe of the slope at several profiles, for example profile CC (Figure 4.27). The
asymptotic modal value decreases down-slope, suggesting a preferential alignment to a
smaller number of orientations. The orientation of clasts at the Top plot position commonly
stabilizes with between 6 and 3 modes (mean = 5.24), whereas the Bottom plot positions
- 174-

Chapter 4: The characteristics of ground surface form
stabilize within between 1 or 3 modes (mean = 2.21 ). The preferential orientation of clasts
is inconsistent. Modal orientations at Bottom plot positions tend to be either aligned across
contour or down the slope profile. The vector strength of this is however insignificant. For
example at SW2B, vector strength = 0.05, at an orientation of 002°, for a sample of 684
clasts (a = 0.05, significance level = 0.09). At other slope positions the orientation of clasts
is far more constricted around one value. For example at STB, vector strength = 0.46, at
005.6°, for a sample of 534 (a= 0.05, significance level= 0.08).
80
~ 40 "0
~ ~ 20 _ro 0 lil 10 .... QJCl .c 0 5. E=
3 2
::I z
80
~ 40 "0
~ ~ 20 _ro 0 lil 10" .... QJCl .c 0 5 E= ::I 3 z 2
80 IJ) 40 QJ "0
~ ~ 20 - ro 0 lil 10 .... QJ Cl .c 0 5 E=
3 ::I z 2"
0 0
0 00
0 0000
Top
0 5 10 15 20 25 30 35 40 45 Kernel halfwidth (degrees)
Middle
0 5 10 15 20 25 30 35 40 45 Kernel halfwidth (degrees)
Bottom
0 0 00
000000000000
00000000000 -
0 5 10 15 20 25 30 35 40 45 Kernel halfwidth (degrees)
Figure 4.27 Kernel density estimate of the persistence of modes in clast major axis orientation -profile CC
- 175-

Chapter 4: The characteristics of ground surface form
The non-parametric density estimation reveals a greater degree of slope controlled
organization, with a definite tendency for clasts to become more uniformly oriented about
a smaller number of modal directions down-slope. There is however no systematic
variation of the number or modes, or the orientations of the modes with slope or ground
cover variables using least squares regression, for slope profiles or individual plots.
4.5 Discussion
The study of mantled surfaces provides little consensus on their origin and dynamics
(Vincent and Sadah, 1995b). Broadly two hypotheses have been suggested. First, these
surfaces result from fluvial re-grading over time (Rahn, 1967; Parsons and Abrahams,
1984). Second that mantles are relict weathering forms (Oberlander, 1974). A detailed
study of surface character down slope profiles will allow the degree of surface modification
by fluvial activity to be assessed. A wide range of morphometric data on various aspects
of the form of boulder mantled slopes in northeastern Jordan has been presented.
Significant relationships between the ground surface character and geology, slope and
specific types of process have been established. There are a number of implications.
A large volume of evidence has been presented which shows a strong relationship
between surface form characteristics indicative of slope process action. Particle texture
and shape becomes progressively smoother and more rounded down-slope, implying that
clasts undergo a greater intensity of weathering processes downslope. The results
support a similar finding by Vincent and Sadah (1995), who identified an increase in clast
rounding and sphericity down two pediment profiles in Saudi Arabia. Significant
modification of the clast size distribution with distance down slope is apparent. The
distribution tends to become more normalized, and more tightly constricted about a mean
intermediate axis length. Surface form appears to be dictated by both the local context of
the plot, supporting Cooke and Reeves (1976) proposition that "the inclination of a slope is
related to the nature of debris generated on and carried across the surface". The research
in this study suggests that, in addition, both up-slope and whole slope controls on surface
form are of equal importance.
The consideration of adequate measures of surface character has been shown in the
northeastern Badia. Weighted means return more significant correlations than unweighted
mean clast dimensions, strongly supporting the suggestions of Dunkerley ( 1996). The
planimetric surface assessment allows actual characteristics of the surfaces, to which the
weighted means approximate, to be directly quantified and notable similarities are
- 176-

Chapter 4: The characteristics of ground surface form
apparent. Equally important are those measures of the surface which show no link to
either ground surface cover, or slope properties. The measures include the unweighted
intermediate axis, which is used as a standard coarse clastic surface measure. The
widespread use of mean intermediate axis dimension as an indicator of slope form relative
to process action therefore appears questionable.
Change down-slope in surface form is complex and often non-linear. The various
characteristics assessed show a different pattern of down-slope variability. lt is clear that
there is distinction between the Top and Bottom plot positions and the Upper, Middle and
Lower. The influence of bedrock outcrops and jointing structures as a control on surface
form at the slope crest is apparent. Clasts at this location remain exposed to modification
by weathering processes, but their size, angularity and lack of underlying sediments may
restrict clast movement. The surface examined here present a similar situation to the
boulder surfaces examined by Friend et al. (2000), where the surface is clast supported,
and hence shows little modification via clast movement. At the profile toe, in addition to
the formative influence of slope processes, a wider range of influencing factors maybe in
action. For example increased aeolian deposition on the limits of sediment pans.
Furthermore the low percentage ground surface cover commonly identified at Bottom plot
positions is such that the behaviour of spatial character of the clast surface does not
follow the gradual change in organization down-slope at the other four plots.
The nature of variability under several of the measures described appears to approach an
asymptotic level, suggesting some tendency to surface stability. As distance down-slope
increases, by definition the up-slope area and hence volume of overland flow collected
increases. If surface modification is a direct function of the volume of overland flow the
increase in surface modification would be expected to increase with overland flow volume.
Instead a stabilization of the degree of surface modification has been detected,
suggesting a negative feedback mechanism whereby the form of the surface acts to mute
the action of slope processes. An example of this feedback has been shown through the
analysis of the spatial nature of the surface character. Surface character has been shown
to become more organized down the slope profile. The organization of the surfaces
appears to be dictated by clasts becoming locked into nets and polygons. In a locked
configuration the surface clasts are not able to move. Polygons are commonly oriented
with their long-axis across the contour of the slope, forming step-like microtopography. A
stable state balancing the degree of surface organization against the modification of the
surface by overland may result in an optimum surface configuration.
- 177-

Chapter 4: The characteristics of ground surface form
The presence of a stable surface condition can be used to examine slope processes in
action. The original hypothesis proposed suggests that the surfaces are altered by the
iterative action of small scale adjustments in form, rather than as a result of catastrophic
modification during large scale events. Logically on an idealized straight profile, overland
flow volumes increase linearly down-slope. If the variation in surface modification does not
mirror this style of increase, it is questionable whether overland flow processes are
directly responsible for the variations seen. For example, if the dominant method of
surface adjustment is as a result of heave processes due to shrink and swell cycles, then
the variable intensity of overland flow will, to a point, have an influence. Heave processes
rely on moisture entering the surfaces, to which overland flow will contribute. Saturation of
the surface would mean that, irrespective of the increasing volumes of overland flow, the
degree to which the surface can be modified reaches an asymptotic level. On the portion
of the profile which does not experience saturation but has an increasing volume of
overland flow, a gradual increase in surface modification could be expected. After the
saturation point is reached then a more uniform degree of clast surface modification would
be expected. Again various process are in action on the slope. Surface modification is
multifaceted.
Surface modification appears to include a number of processes. First, the adjustment of
individual clast form, through weathering processes. Second, the adjustment of the clast
size distribution is apparent, which can be as a result of either the weathering out of the
finer fraction, or the removal of clasts through transport by overland flow, or the
mechanical weathering of clasts. Third, is the adjustment of the whole surface character,
for example the movement of clasts into organized structure. The processes responsible
for these types of modification are clearly as diverse as their influence on surface form. lt
is clear that a distinct variation these characteristics down-slope. Without field evidence
and monitoring of real events the relative importance of for example overland flow as a
mechanism of clast transport, or titling, relative to the displacement by a heave process is
not clear. The nature of spatial variation down-slope implies a slope, and therefore
hydrological control, on all of these processes. For example, during a rain event surface
wetting may act to displace a clast, the resettling of which may produce a small down
slope movement. The movement of the clast may cause a collision between two clasts,
acting to slightly modify the clast surface. The result of which is a slight reduction of
percentage ground surface cover, an increase in the volume of underlying sediment, and
a modification of the surface. Although this nature of change is very slight, the surfaces
support a continuous cover of clast and represent a massive range of ages. Small scale
change over a long period may therefore reasonably account for the variations in surface
form seen today.
- 178-

Chapter 4: The characteristics of ground surface form
The nature of variability in results between plot positions also raises interesting questions
with regards the evolution of the surfaces. The example of the percentage ground cover
shows that the variation in ground surface cover is greatest at the slope toe, reducing up
slope. If the Bottom and Lower plots are considered to be more mature or more greatly
modified surfaces, due to the presumably higher intensity of process action at these
locations, then a divergence in landform development is seen. The surfaces do not tend to
converge to one stable state but rather greater diversity in surface character is seen. Plot
studies at Marab Swayed have all been undertaken on a uniform geology whereby the
starting conditions are considered to be constant, such that any deviation away from this
is considered to be a result of post-emplacement modification by surface process action.
Contrary to the evidence which suggests that the surfaces are divergent forms, there is
also considerable evidence on convergence on these slopes. Clast sizes converge to a
more uniform distribution, whereby the level of dispersion in sizes reduces. Additionally,
clasts become progressively more rounded and more smoothed down-slope. Clast
orientation and the departure from complete spatial randomness in clast position all
appear to converge down-slope.
The influence of slope form has been separated from the influence of geology. A diversity
of slope forms within one geology has a profound influence of the nature of surface
character at various plot positions. Significant relationships can be found between the
local characteristics of a plot and the configuration of the ground surface at that point. A
greater level of understanding is gained from a whole slope consideration of the variation
in ground surface cover. lt is difficult to suggest a continuum of ground surface cover
variation with a variation in slope form character given the limited number of profiles
sampled in this study.
The influence of geology previously identified has been reiterated by the findings of this
study. lt is however clear that the degree of variation in surface form as a result of slope
profile form variation is as equally significant as the control of geology on ground surface
configuration. The link with surface age and surface character is less clear. Mean clast
intermediate axis length appears to increase with age, contradicting much work on
hydrology dominated surfaces, Poesen et al. (1990).
The spatial analysis of the surfaces provides the first insight into the organizational nature
of boulder mantled surfaces. A systematic variation in surface organization down-slope is
seen. The various methods of analysis adopted examine different aspects of the surface
- 179-

Chapter 4: The characteristics of ground surface form
spatial character. The degree of self-similarity of clast organization, as described by the
box fractal dimension, increases consistently down-slope. The use of the nearest
neighbour analysis appears limited in described the complexity of the patterns identified.
Surface structures are comprised of vertices commonly more than one clast in width. The
nearest neighbour analysis is not capable of differentiating between linear clustering
within the polygon vertices, and the wider form of the vertices. The Thiessen polygon
analysis is more successful, identifying clear down-slope alterations in the surface form.
Clast fabric, or orientation shows a marked down-slope variation, but no distinct alignment
to or across slope can be identified. The spatial statistics have managed to identify trends
in surface character that are not apparent in the other analyses conducted, and is hence
of benefit.
- 180-

Chapter 5: Hydrological processes
- 181 -

Chapter 5: Hydrological processes
Chapter 5: Hydrological processes
5.1 Introduction
This chapter aims to understand the links between contemporary slope hydrology and
surface form on coarse clastic desert surfaces. The chapter explores these links by
examining the control of local ground surface cover and two-dimensional slope form on
surface hydrology. Overland flow and hydraulic process are both critical controls on the
removal and transfer of sediments on coarse debris mantled slopes (Bryan, 1922, 1940;
Melton, 1965; Kirk by and Kirk by, 197 4; Abrahams and Parsons, 1994; Roux and Roos
1996). The relationship between contemporary surface process and slope form is less
well understood (Abrahams and Parsons, 1994 ). Abundant field evidence suggests that
hydrological processes are the main contemporary geomorphological agent acting to
modify the slopes of the northeastern Badia (AIIison et al., 2000) but the direct relationship
between surface form, process and two-dimensional slope has not been addressed, either
here or elsewhere. A homeostatic relationship between surface form and process activity
has been suggested (Higgitt and Allison, 1999a). The objectives of this chapter are to
highlight the nature of spatial variability in surface hydrology and in doing so to assess the
relationship between the surface character and slope form.
The hydrology of the slopes of the northeastern Badia is poorly understood. No previous
attempt has been made to look at the clast surface response to rainfall in the region. The
ground surface configuration of the northeastern Badia limits the extrapolation of results
obtained in other regions. The northeastern Badia experiences sporadic localized rainfall
(Kirk, 1998). High magnitude, low frequency rainfall events dominate geomorphological
change in the northeastern Badia (AIIison et al., 2000). The slopes are complex. The
variation in surface character appears to reflect a diverse series of processes which act to
modify the surfaces. Contemporary rates of surface modification appear to be slow. Direct
monitoring of the processes of surface modification is therefore not feasible within the
scope of this study.
This chapter firstly discusses and selects an appropriate method of process
characterization, using rainfall simulation. A storm simulation experiment is developed
which is designed to examine the degree of variation in surface response to rainfall across
the northeastern Badia. The experiment design is based on local climatic records, field
monitoring and previous simulation work, in addition to a series of trial experiments
undertaken in the northeastern Badia. Replicating high-magnitude rainfall events is
designed to identify any variations in surface response. The experimental design is
deliberately constrained to the simulation of events that have been monitored in the
- 182-

Chapter 5: Hydrological processes
northeastern Badia. The results are discussed in terms of the links between surface
hydrology and surface form variation. The principle objective of this series of experiments
is therefore to explore the linkages between contemporary slope hydrology and slope
form, rather than to provide a comprehensive understanding of slope hydrology. In
addition, the influence of two-dimensional slope form variation on whole slope hydrology is
assessed. The diversity of data generated by the image analysis technique (Chapter 4)
helps to demonstrate the apparently important controls on slope hydrology. The results
demonstrate a close link between surface form and process action, which has numerous
implications for the behavior and evolution of the northeastern Badia geomorphology.
5.2 Background
5.2.1 Previous work on hydrological processes on clastic semi~arid slopes
There is an extensive literature on the hydrology, hydraulics and sediment dynamics of
clastic or rock fragment mantled semi-arid surfaces (Abrahams et al., 1994; Poesen et al.,
1994). The presence of surface clasts can be considered as surface roughness. The
influence of surface roughness remains a complex and vexing question (Romkens et al.,
2002). When considering surface roughness, the logical assumption is that an increase
raises the resistance of soil to detachment by raindrop impact. Surface roughness also
acts to increase the storage capacity of rainwater and reduces the velocity of runoff,
lowering the erosive power of flow (Huang and Bradford, 1990). Conversely, it has been
shown that on rough surfaces flow tends to concentrate, thereby promoting scour,
headcut development and an increased tendency for rilling (Abrahams and Parsons,
1991; Helming et al., 1997). The balance of positive and negative influences of surface
roughness on slope hydrology is frequently site specific. The relationship is further
complicated by the action of surface seal and crust development (Kirk, 1997) in addition to
the antecedent soil water conditions (Torri et al., 1999).
Studies of rock fragment covered surfaces have shown similar findings. Many researchers
have identified that the presence of a rock fragment cover decreases the erosion
potential, relative to an unarmored surface (Lamb and Chapman, 1943; Grant and
Struchtemeyer, 1959; Jung, 1960; Dumas, 1965; Epstein and Grant, 1966; Meyer et al.,
1972; Box, 1981; Collinet and Valentin, 1984; Simanton et al., 1984). This is attributed the
increased protection of the surface from the action of rainfall, leading to a decrease in
surface sealing, an increased rate of infiltration, a decreased runoff and a resulting
decreased sediment yield. Rock fragment cover (Seginer et al., 1962; Dumas, 1965;
- 183-

Chapter 5: Hydrological processes
Meeuwig, 1970; Box, 1981; Simanton et al., 1984; Collinet and Valentin, 1984), rock
fragment size (Grant and Struchtemeyer, 1959; Yair and Lavee, 1979; Wilcox et al.,
1988), rock fragment cover geometry (Koon et al., 1970; Bunte and Poesen, 1994) and
soil matrix properties have all been identified as influential controls on flow and sediment
dynamics (Peosen at al., 1994 ). Additionally, the position of rock fragments relative to the
surface has been shown to be highly influential as a control on infiltration (Poesen et al.,
1990; Dunkerley, 1995).
The nature of variability in surface hydrology, specifically infiltration, in semi-arid areas
has previously been demonstrated (Biackburn, 1975; Sharma, et al., 1980; Yair and
Lavee, 1981; Berndtsson and Larson, 1987; Johnson and Gordon, 1988). The variability
in infiltration is mirrored in runoff generation (Smith and Herbert, 1979; Hawkins and
Cundy, 1987). One property that is thought to dictate the degree of variability is surface
character, specifically the presence of rock fragments (Abrahams and Parsons, 1991 ).
Hydrological processes have been cited as one component in the creation and
maintenance of desert pavement surfaces (Roux and Roos, 1986). Several studies have
highlighted the importance of overland flow and raindrop impact in modifying surface form
(Roux and Roos, 1986; Wainwright et al., 1999). Linkages between studies of rock
fragment covered surfaces and specific types of desert mantles or pavements are more
limited. The majority of these influencing factors vary considerably in the northeastern
Badia (AIIison et al., 2000). There is a need for surface hydrology to be assessed on the
coarse clastic surfaces in the northeastern Badia of Jordan to gain a more comprehensive
understanding of the regions geomorphology.
5.2.2 The use of rainfall simulation to examine hydrological processes in semi arid areas
Rainfall simulation has been used to study runoff generation, infiltration and sediment
dynamics in a diversity of environments. The technique has been applied to a wide range
of pedological, hydrological and geomorphological situations (Duley and Hays, 1932;
Young and Burwell, 1972; Bork and Rohdenburg, 1981; Bergkamp, 1998; Cerda, 1998;
Foster et al., 2000; Wainwright et al., 2000). Rainfall simulation has many advantages as
a method of understanding surface hydrology. The interaction between sediment and
water can be studied over a short period of time under highly controlled conditions both in
the field or the laboratory. With control over amount, intensity and duration, in addition to
drop size parameters (Coutinho and Tomas, 1995), energy characteristics (van Dijk et al.,
2002) and water chemistry (Borselli et al., 2001 ), experiments can be undertaken to
elucidate subtle levels of variability in surface hydrology. The control of intensity, energy,
- 184-

Chapter 5: Hydrological processes
drop-size and duration, at least, is required for successful rainfall simulation (Meyer,
1958). The technique has several advantages over other methods of quantifying surface
hydrology, many of which stem from replicating a natural events or processes.
The unpredictable, infrequent and random nature of storm events in the northeastern
Badia makes the real-time study of their influence on the landscape virtually impossible.
To be successful extensive instrumentation of whole catchments would be necessary
(Wainwright et al., 2000). Despite the infrequent nature of storms, it is often those with the
most infrequent return interval that are the most influential on the landscape (Kirk, 1997).
Rainfall simulation is not an exclusive tool that removes the need for monitoring real
events. Both should ideally work in tandem to gain a combined understanding of
landscape process, an approach adopted below.
5.2.3 Rainfall simulator and the choice of appropriate equipment
There is a broad range in the design and principles behind rainfall simulation and only
recently have attempts been made to standardize methods between investigations
(Parsons and Lascelles, 2000). Rainfall simulators fall into two broadly defined categories,
defined by the method of rain drop formation. The choice of simulator is dependant on the
ability to accurately recreate rainfall characteristics repeatedly. The aerial cover of
simulators ranges from the small infiltrometer with an area of only 0.15 m diameter, to the
large scale experiments using, for example, the 'EMIRE' Rainfall Simulator, covering an
area of 5 m by 10 m (Esteves et al., 2000). The first category of simulator, based on a
spray nozzle for drop creation, operates at high pressure and provides a wide range of
drop sizes with high kinetic energies sometimes in excess of natural rainfall (Battany and
Grismer, 2000). Stationary spray simulators tend to produce a conic distribution of rainfall
intensities to the plot (Hall, 1970), whereas simulators which employ a rotating nozzle
have an unavoidable periodicity in rainfall application which results in a notable variation
in response of the surface (Becher, 1994). The second type of simulator employs drop
formers, which include yarns, hypodermic needles, nylon cord and plastic tubes, all of
which operate under lower pressures. They tend to produce a more tightly constrained
distribution of drop sizes. Under this method of drop formation the kinetic energy of drops
is entirely determined by the rainfall drop height.
Several specific characteristics of rainfall simulation were required for this study, which
ultimately dictated the choice of simulation method. The main constraint on experimental
design was the subtly in variation of clast surface form. lt was assumed that the variation
in surface hydrology will be equally discrete. Therefore precision and consistency in the
- 185-

Chapter 5: Hydrological processes
replication of the characteristics of natural rainfall between experiments was of paramount
importance. There are only limited existing data with regard to the drop size distribution,
maximum intensities and durations of storm events in the northeastern Badia. Attempts to
gain a more detailed understanding of the drop size distribution and storm characteristics
in the northeastern Badia are discussed below. The ability to replicate the natural rainfall
in the northeastern Badia with the chosen rainfall simulator was of vital importance.
Equally a consistent distribution of rainfall across the plot between experiments is
imperative. Without a uniform rainfall distribution across the plot the influence of the
spatial distribution of surface clasts can be examined. The northeastern Badia frequently
experiences high winds throughout the day (Kirk, 1997). A method of restricting the
influence of wind on the rainfall drop area is therefore necessary. Finally, the storm
simulation developed uses a diverse range of rainfall intensities.
The specific requirements for rainfall simulation described all favor the use of a drip
screen rainfall simulator. Its compact design is easily transportable, rainfall parameters
are highly consistent between experiments (Holden, 2000) and water efficiency is good
(Sawyer-Bower and Burt, 1989). Wind can be shielded and precise changes in intensity
can be made rapidly. The small plots that this method uses (0.5 m2} are a potential
limitation of this technique when trying to overcome the influence of small scale
heterogeneity in surface character. lt is recognized that spatial variations in surface form
maybe overly reflected in a plot area of this size, but the use of several contiguous plots
within close proximity means that local heterogeneity can be assessed and accounted for
within the results.
- 186-

Chapter 5: Hydrological processes
5.3 IE)(perimental design
5.3. ~ Charac~eristics o~ the rain~all simulator design
A simulator based on the design described by Bowyer-Bower and Burt (1989) and
Robinson and Naghizadeh (1992) was employed for this study (Figure 5.1 ). The success
of the design is reflected in its frequent use by many workers (lmeson and Verstraten,
1986; Bowyer-Bower, 1993; Foster et a/., 2000; Holden, 2000). The simulator design was
modified for this study and field site conditions. Due to the large range and magnitude of
intensities of rainfall required, a pump driven water supply replaced the mamometer
previously used for generating the required intensities. This allowed rapid and precise
changes in intensity during the storm simulation. Analysis of drop size distributions using
both the mamometer and pump system revealed no discernable difference between the
two methods of water delivery. Ground surface temperatures in the northeastern Badia
had a range of over 50°C during the day, which altered the air pressure in the
mamometer, water tanks and drip screen. The flow gauge and pump allowed much
greater regulation and control of this effect. The range of intensities required cannot be
achieved on the mamometer without replacing the regulating pipe during the experiment.
Drops formers were constructed from Tygon tubing of 0.0023 m outside diameter and
0.007 m inside diameter, though which a 0.025 m length of 0.006 mm nylon was threaded
and crimped secure (Figure 5.1 ). In total 627 drop formers in 19 rows of 33 covered an
area of 1 x 0.5 m at an even spacing mounted in a Perspex tank with inside
measurements of 1 x 0.5 x 0.008 m. Each drop former was checked prior to each
experiment to ensure that it had not become blocked or dislodged in transport. A 0.004 x
0.004 m galvanized wire mesh was hung freely 0.2 m below the drop formers to
randomize the drop distribution. This meant that theoretically a maximum drop size of 4
mm could pass though the mesh. Water was held in a 25 I tank on the ground. Water was
taken from the only local water source, a shallow ground water aquifer at Tel Hassan,
Azraq. The source was kept constant between experiments. The effects of water
chemistry are recognized (Barton, 1994) but in the field site location there is no feasible
access to a distilled or rain water supply. The same water supply was used for all
experiments.
- 187-

1 m
5
4
1
2
Side view
~ Key:
1 - 25 I water tank
2 - Plot boundary
3 - Flow chute
4- Telescopic legs
5 - Flow control gauge
6 - Drop randomiser
7 - Drop former tank
8 - Spirit level
9- Water pipe
1 0 - 8 mm Perspex
11-0.7 mm 1.0., 2.3 O.D. Tygon tubing
12-0.55 mm nylon, pinched flat
0.~ m ~------ .• '·--
I' ~' 11 7 d "' 1 1,
4
Down-slope view
Drop former
J <1 10 \}0.08 m
Jr--- -~~{0.08 m ~~J0.08m
12<J 11
Figwe 5.1 Rainfall simulator design
1 r-o.5m
1 "1.8 m

Chapter 5- Hydrological processes
Placing the water tank on the ground provided greater stability to the simulator in high
winds, which meant that a greater drop height could be achieved. The simulator was
anchored to the ground using tensioned steal cables. Drop height from the central point of
the drip screen was kept constant at 1.8 m from the randomizing screen to the ground. A
re-circulating pump system, based on that described by Batteny and Griser (2000)
regulated flow to a range of 5 mm h.1 to 140 mm h-1. Calibration tests showed that a given
intensity could be recreated within ± 2 mm h-1. A selected flow rate on the flow gauge
(Figure 5.2) correlated well to the desired intensity, calculated from the output generated.
Water pressure was provided to the drop former tanks by a 12 V automotive fuel pump.
Fuel-pumps were found to give a very regular and stable discharge and run from a
standard car battery for a full day in the field. A fuel-pump has the disadvantage that they
are self-lubricating in that the fuel they pump oils the pump mechanism. The pump ceases
to work after pumping water for a long period, so required frequent drying and oiling. A
flow gauge and three-way bleed tap allowed precise control on flow rate (Figure 5.2). The
pump set-up also removed the need to keep pressurized constant head water Mariotte
reservoirs.
Drip screen
Flow gauge Bleed value
Reservoir
Figure 5.2 Rainfall simulator water pump system
The drop zone was shielded from wind and sunlight using a thick woolen canopy and
corrugated plastic sheeting. Intense sunlight on the plot surface increased evaporation, so
each plot was fully shaded to maintain consistency between experiments. The drip screen
was supported in an aluminum frame such that the drop height could be adjusted level on
plots of various angles.
- 189-

Chapter 5: Hydrological processes
5.3.2 Field plot design
The location of plot positions is designed to assess local heterogeneity in addition to the
influence of whole slope form variation (Table 5.1 ). Results when combined with those
generated from the surface characterization, can be assessed by any ground cover, slope
or hydrological variable, in addition to grouping by profile or plot position.
Slope Position Plot position name Number of replicated plots
ST Top STT 3
Middle STM 3
Bottom STB 3
cc Top CCT 3
Middle CCB 3
Bottom CCM 3
CV Top CVT 3
Middle CVM 3
Bottom CVM 3
Total 27
Table 5.1 Rainfall simulation plot locations
Plots were constructed the day prior to the experimental run. As a result the presence of
the plot did not alter the surface to any significant degree. Plots were bounded with
concrete walls approximately 0.2 m high and 0.075 m wide, such that the inside
dimension of the plot was exactly 0.5 x 1 m. The up-slope end of the plot was not
bounded. Concrete was molded over clasts and into cavities which crossed the boundary,
without disturbing the surface. The density of clast cover almost without exception meant
that plot boundaries traversed clasts. Where the bounding wall rested on the sediment
surface it was buried approximately 0.03 m beneath the surface, without disturbing the
plot area (Figure 5.3). This reduced lateral loss of water during experimental runs. The
concrete was left to air dry over night but shaded to limit cracking. The outside of the plot
wall was also packed with damp sediments during the experiment to further reduce lateral
water loss.
- 190-

Chapter 5: Hydrological processes
Figure 5.3 Experimental plot (left) and plot lip (right). Scale marker is 0.1 m square
The plot lip was constructed using concrete. Figure 5.3 shows the detailed structure of the
lip and runoff collection tray. The highly friable sediments were prone to collapsing both
during the construction of the lip and during the experimental run. During initial trials water
was found to seep back and beneath the concrete lip, rather than continuing over the
surface and down the flow chute. The best method of lip construction involved a sharp
step, approximately 0.3 m deep being cut vertically into the sediment to 0.6 m in width,
centered on the plot. A wooden casting mould was positioned vertically 0.2 m in front of
the step and liquid concrete poured into the void behind it. Once the concrete was tacky
the cast was removed and the aluminum runoff chute was pressed into the concrete to
leave an indent and overhang. The plot lip was left to dry overnight, the day prior to the
experiment. During the run the seal between the tray and the lip was waterproofed with
petroleum jelly and silicon gel. The contact between the lip and the sediment surface was
smoothed to ensure that it was water tight. Each plot used approximately 30 kg of
concrete and 25 I of water to construct. A hole below the lip was dug to house the runoff
chute and runoff sample bottles.
5.3.3 Rainfall characteristics of the northeastern Badia
The design of the rainfall simulation is based on rainfall characteristics both previously
observed and recently monitored in the region. By far the majority of rainfall events in the
Badia do not generate overland flow (Kirk, 1997). The cumulative effect of low intensity
rainfall events on surface geomorphology is poorly understood, whereas the action of high
magnitude events is more evident in the field. In order to assess the levels of spatially
variability in surface hydrology, the rainfall simulation was designed to force runoff
generation though storm simulation. The rainfall parameters used to design the
experiments employed in this research are taken from the northeastern Badia. Additional
data from beyond the region are discussed for comparison . The limitations of climatic data
- 191 -

Chapter 5: Hydrological processes
are recognised as a limiting factor in dictating the design of the experimental set-up.
Present rainfall data from the Badia does not record maximum intensity, drop size
distributions or storm durations (Kirk, 1997).
The highest resolution regional weather data available are hourly records for stations
administered by the Water Authority of Jordan (WAJ) and the Meteorological Department.
Automatic weather station (AWS) data for the winters of 1992/3 and 1993/4 monitored
rainfall at 15 minutes intervals (Kirk, 1997). The published rainfall intensity graphs for
Jordan are based on hourly records (Kirk, 1998). Field observations imply much higher
intensities than suggested by published data (Kirk, 1997). For example, Kirk (1998)
describes a storm of 42 mm h-1 on 181h December, 1993 (14 mm in 20 minutes). AWS
data suggests that the highest storm intensities lie between 40 and 60 mm h-1, but that the
majority of rainfall events comprise between 0.5 and 5 mm, which according to the rainfall
intensity diagrams published gives intensities of only 1- 15 mm h-1. Kirk (1998) suggests
that storms rarely last for more than 30 minutes; therefore much of the published data is
not representative of the storm events in the northeastern Badia.
Evaporation rates during summer months are in excess of 7.5 mm (Kirk, 1998), giving a
very strong negative water balance. This reduces to less than 5 mm per day in autumn
months, increasing the likelihood for a positive water balance. Kirk (1998) noted the high
degree of both annual and seasonal variability in rainfall totals. A standard deviation of
over 45% of the mean annual rainfall total is commonplace across the region. Over the
longer-term three gauges studied by Kirk ( 1997) show a more stable picture of annual
rainfall totals, averaging between 67.3 to 76.1 mm. Analysis of the magnitude and
frequency of storm events, using data generated from an AWS by Kirk (1997) shows that
the majority of storm events total less than 5 mm of rainfall. Conversely in high rainfall
year storms may frequently generate more than 10 mm of rainfall in one event. High
magnitude events are seen to occur towards the beginning of the wet season, whilst the
remainder of the season is dominated by much lower intensity, more frequent storms,
totaling 0.5 mm to 2 mm only. Kirk (1998) points out the danger in making generalisations
from such a localised sample. The presence of Jebel ai-Arab (Jebel Druz) is a key
topographic control on the nature rain storms. Rainstorms in the region are sporadic and
unpredictable (Kirk, 1997). The data suggests that there are some events with very high
intensities but with return intervals of a number of years which can potentially have the
greatest influence in modifying the landscape (Hudson, 1961; Kowal and Kassam, 1976;
Dorn, 1994).
- 192-

Chapter 5: Hydrological processes
5.4 Monitoring o1f storm events iD11 the northeas~em Badoa
The maximum resolution of storm data previously collected is 15 minutes (Kirk, 1997).
The data is too crude to give a detailed understanding of short, intense rainfall events.
The localized nature of convective storm cells mean that formative events are rarely
recorded by the limited number of gauges installed in the region. Some attempt to rectify
this was made during the six month field period at the start of 2001, whereby every
notable storm that occurred during the field period was recorded. A sampling interval of 1
minute was used to describe the nature of rain storms in more detail than previous
monitoring had allowed. Drop size samples were collected using the flower pellet method
for each storm monitored (Bentley, 1904 ). This, combined with various previous studies
from neighboring regions, was used as the basis for the simulation of the northeastern
Badia rainfall. The monitored storms were five events with a rainfall total in excess of 10
mm, collected between 10.01.01 and 20.06.01. The storms reflect a very wet year in the
northeastern Badia. Data from local gauging stations in the northeastern Badia do not
correspond to the monitored storms. Timings of neither storms nor rainfall totals match the
data recorded at the permanent monitoring sites in the northeastern Badia, showing the
inadequacy of the spatial cover of the monitoring network to measure intense localized
storm events.
A series of manually operated rain gauges were set up in the grounds of the Safawi Field
Center and the Marab Swayed field site. Rainfall was collected in three traps, each of 0.28
m diameter. The collected rainfall was manually siphoned and volumes measured at 60 s
intervals. Durations of storms ranged from 14 to 47 minutes and rainfall totals ranged from
10.7 mm to 27.3 mm (Figure 5.4). Within each storm there was a large variation in the
intensity of the rainfall. Storms often followed a pattern of slight rain, followed by heavy
intense rain, and then a final period of less intense rain. Figure 5.4 gives one minute
resolution intensities for each of the five storms recorded. Maximum intensities recorded
were of the order of 100 mm h-1 but this period of intensity only occurred over a limited
period of no greater than 10 min within the monitored storms.
- 193-

100
80
E g 60
100
80
20
Chapter 5: Hydrological processes
14.03.01 Max intensity = 100.8 mm h-1
Storm rainfall = 27.3 mm Duratrion = 47 min
Total number of drops= 8751 Drop D50 = 3.31 mm 06.04.01 Max intensity= 86.5 mm h-1
Storm rainfall = 13.5 mm
liillill 10 20 30 40
Time (min)
100
80
E g 60
20
50
10
100
80
~
E g 60 ~
l c ~ 40
·;;; a:
28.02.01 Max intensity = 97.8 mm h-1
Storm rainfall = 10.7 mm Duration = 15 min
20
''"'' 11 ill
I lilllllillllllil
60 10 20 30 40 Time (min)
Number of drops 05.05.01 Max intensity = 93.2 mm h' 1
Storm rainfall = 15.5 mm 100 Duration = 39 min
80
E g 60
20
60 10 20 30 40
11.03.01 Max intensity= 103.2 mm h-1
Storm rainfall = 15.9 mm Duration= 31 min
20 30 40 50 Time (min)
Time (min)
60
50
50
Figure 5.4 Individual rainstorm events monitored in the northeastern Badia (10.01.01 -20.06.01)
- 194-
60
60

Chapter 5: Hydrological processes
Drop size data was collected during these storm events using the flour pellet method
(Holden, 2000) (Figure 5.5). Pellets were collected in trays with a total surface area of
0.25 m2. Trays were exposed to rainfall for 20 sand then oven dried at 1 05°C for 4 hours.
A total of over 8500 drops were collected from the 5 storms. The sample also covered a
wide range of intensities and drop sizes at different rainfall intensities.
10000 Total number of drops = 8751 Drop D50 = 3.31 mm
- -- - -1000
,.-(f) 0..
- ,.--0 ..... '0 ,.---0 100 .....
,.--<1) .0 E ~ z -
10
0.5 1 1.5 2 2.5 3 3.5 4 4.5 5 5.5
Drop diameter (mm)
Figure 5.5 Drop size distribution from monitored storm events in the northeastern Badia
The data collected suggests that the 0 50 of the sample collected was 3.31 mm, within a
broadly bimodal distribution of drop sizes. The maximum drop size recorded was 5. 7 mm.
The measurements collected compare favorably with data collected from neighbouring
regions that experience convection cell ra infall such as the Negev (Kidron and Pick,
2000).
5.4.1 Semi-arid storm events beyond the Badia
To ensure that the rainfall monitoring undertaken in the northeastern Badia generated
reasonable data, the results were compared to similar studies in the Middle East and
other desert environments. There are numerous documented examples of large infrequent
rainstorms and associated flood events in dryland environments, several in the Middle
East (Greenbaum et al. , 1998). The role of infrequent cellular convective storms is seen
as critical component of slope hydrology in the Negev (Greenbaum et al., 2000). Storms in
the Negev tend to be sourced in either the Red Sea Trough (RST) , or the Mediterranean.
The Mediterranean storms bring mean intensities of 15 mm h-1, with peak values of 45
- 195-

Chapter 5: Hydrological processes
mm h-1. The RST storms are characterized by localized convective cells between 10 km
and several hundred kilometers in area, occurring mainly in autumn and spring. The
storms have high intensities, with a mean of 60 mm h-1, maximums of 120 mm h-1
, causing
major flood events (Greenbaum et a/., 2000). The highest maximum rainfall intensity was
reported by Lange et al. (2000), at the Nahal Zin experimental catchment, at 224 mm h-1.
Only 5% of storms in the Nahal Zin catchment generate overland flow and runoff. Small
rainfall totals monitored during such storm events, of between 12 and 19 mm do not
reflect the magnitude of subsequent flood events. The disparity between the monitored
rainfall and the observed flood reflects both the highly spatial and temporal nature of
storm events. High intensities rarely last for more than 8 minutes in the Negev (Kidron and
Yair, 2001 ). Rainfall totals vary by up to six times over a distance of only 150 m within a
convective storm cell. The local diversity in rainfall demonstrates that a low number of
disparate low resolution rain gauges would neither identify the durations or spatial extent
of such events. Beyond the Middle East, other authors have noted a similar style and
concentration of rainfall events. Osborne and Renard (1969) studying at the Walnut Gulch
experimental catchment in southeastern Arizona, noted the relatively high probability of
high magnitude events. Bull et al. (2002) note the importance of high magnitude events in
an intensely monitored catchment in southeastern Spain. The storms monitored in the
northeastern Badia, are therefore comparable to those found in neighboring and similar
regions.
5.4.2 Design of experimental storm
No previous rainfall simulation experiments have been undertaken on boulder mantled
surfaces. Prior to experimental design, a series of trial field experiments were undertaken
as a reconnaissance, using both single and multiple rainfall intensities. The results
demonstrate several factors which influence the design of the storm simulation. Firstly,
considerable local variation in times to runoff and ponding are noted between plots
separated by only short distances. Sediment yields are low for all intensities (< 0.004 kg
m-2 h-1), including intensities above 60 mm h-1
. Infiltration is low, requiring rainfall
intensities of roughly 6- 7 mm h-1 to generate standing water. When runoff commenced, a
stable state was quickly reached under constant rainfall intensity. An example is shown in
Figure 5.6, where a simulated rainfall intensity of 60 mm h-1 is mirrored by runoff
generated from the plot.
- 196-

Chapter 5: Hydrological processes
60 -·-·-·-·-·- ·-·- ·-·-·-·-·-·-·-·- ·-·- ·-·-·-· -·-·- ·-·-·-· "
" J:: E ~0 :::: Measured runoff 0 c ::l L...
"0 - · - ·- Applied rainfall c ro
~0 ·ro 0:::
0 ~------~~------~------~------~--------~------~ 0 200 400 600
Time (s) 800 1000 1200
Figure 5.6 Adjustment of runoff to applied rainfall during a 60 mm h-1 rainfall simulation
The observations from the trial experiments have several implications for the experimental
design. As Kirk (1998) suggests, in considering the nature of rainfall which has the most
effect of erosivity, it should be the period of maximum intensity that is of interest. Using
high intensity rainfall also forces the surface to respond. Processes under a high intensity
rainfall will be at their maximum, such that any difference in response should be equally
exaggerated. Conventional studies employing rainfall simulation tend to use single or
small numbers of discrete intensities in separate experiments. With the available data
from monitoring local storms, a simulation of a whole storm event is possible. This has
numerous advantages above simulating single intensities. First, a storm simulation is
more representative of a natural event. Sequencing of periods of variable intensity rainfall
has a profound effect on soil moisture antecedence. Undertaking a very high intensity
rainfall simulation on a dry surface may give unrealistic values for sediment removal.
Many of the observed and documented examples of storm events note the light to
medium rainfall prior to the highly intense storm maximum. Second, several previous
studies have undertaken a series of increasingly intense rainfall simulations, with a
recovery period in between events. From the storm monitoring it is clear that no such
period between changes in intensity exists under normal conditions. The lack of control
over antecedent conditions between experiments in the diverse temperatures of the
northeastern Badia , is a potential source of inconsistency.
The choice of a single intensity for simulation is often arbitrary with little quantitative
justification for the selection of that value. A simulation of a storm event approximated to
one recorded in the field is hence of no less value. This method is perhaps particularly
appropriate to the surfaces in question. Trial experiments have indicated that the surface
- 197-

Chapter 5: Hydrological processes
rapidly reaches a stable level of runoff generation during rainfall, reflected in sudden
changes in runoff when intensity is either increased or decreased. Due to the precise
nature of rainfall generated by the simulator, any known change in the application of
rainfall can be subtracted from the response of the surface with confidence. A model
storm hydrograph was therefore developed (Figure 5. 7).
Applied rainfall intensities were selected from the storms monitored by others (Kirk, 1997)
and those within this study. The duration of the storm was kept constant at 2100 s, with
three distinct periods of rainfall. An initial 600 s period of 17.5 mm h-1; 600 s of 100 mm h-
1; finally a 900 s period of 60 mm h-1 (Figure 5.7, fine line). The intensities were all
previously found to instigate runoff after 180 s, 48 s and 112 s respectively. The actual
simulator output was assessed during the simulator calibration, where the rainfall fell onto
steeply inclined corrugated plastic sheeting and channeled into a measuring cylinder,
recorded at 30 s intervals. Some lag times are apparent, especially during periods of
increasing rainfall intensities, but less so during decreases in intensity. Lag times are
attributed to the pressures equalizing between the pump and drop former tank, and the
time for the runoff to drain from the collection sheet to the measuring cylinder. Stable
intensities are achieved and maintained rapidly and could be obtained to a precision of± 2
mm h-1. The lag-time for the rainfall simulator to adjust to the changes in intensity meant
that the output from the simulator was more complex (Figure 5.7, dashed line). The actual
simulator output (Figure 5. 7, dashed line) was used in the calculations of runoff and
surface hydrology. Total rainfall for the simulated storm is 34.6 mm, which over the 0.5 m2
plot, is roughly 17.3 I of water.
J:: E E ->.
;t: (/) c Q)
c ro -c ro L..
"0 Q)
§ :::J (.)
ro u
120·
100
80
60
40
20
,'-- -, r············ ... ,.,(.,~ ... , ............... ~' ! ,' i\
I \ I I ; I
! I l 1
I ! ,, ~\,
·--- Output -mm h-1
........... Input - mm h-1
! I i ' ....................... ;.;.··~-·-··-·--..... ·7---, i I i i I i ! ' i i' i i I i ! I i i I ~ i I \\ !1 i \
.............. ,.------·---' ~ \
/," l ',,
0 ~----------~------~--------------~------~ 0 240 720 1200 1680 2160 2640
Time (s)
- 198-

Chapter 5: Hydrological processes
figure 5.7 Simulated rainfall hydrograph
Drop size distribution and rainfall energy calculations were undertaken for the simulated
storm using the flour pellet method. Mean drop size increased with intensity (Figure 5.8),
but leveled off after 70 mm h-1 at a mean 0 50 = 2.6 mm. Mean drop size is less than that
measured in the field. The distribution of drop sizes generated by the drip screen is
preferential to alternative methods of rainfall simulation.
E E f1l
3 -
2.5 -
0 2 -(!) N '(ii
Cl. e 0 1.5 -
1 -
.................................................................................................................... ;c;;.,. . ..;.--·--·...-·--·-ooG>--·--·'"'" r- 2.6
, q' I
I I
I I
I I
I I
I 0
0
, , , , , , ,
25
9' ,
.;:::>-----Cl"_.
50
Rainfall intensity (mm h-1}
75 100
Figure 5.8 Relationship between drop size Dso and simulated rainfall intensity
The mean rainfall kinetic energy was calculated. The drip screen mesh height was
maintained at 1.8 m above the ground for all simulations, although on steep plots this
height was obviously variable. At the mean intensity of the storm event simulated (51.5
mm h-1) represents a mean kinetic energy of 1.05 x 10⁻³ J m-2s-1 for a drop size with 0 50 =
2.6 mm (van Dijk et al., 2002) representing 68% of the kinetic velocity of rainfall at
terminal velocity, and 64% of the naturally occurring rainfall in the northeastern Badia.
Laws (1941) proposed an ideal drop height in excess of 9.4 m. Laws (1941) suggested
that for drops of 2 mm in diameter a drop height of 5 m was required and drops of 3 mm
required a height of 7.2 m to reach terminal velocity. The range of terminal velocities from
the rainfall simulator employed here, given the limited fall height, is of the order of 60 -
95% of that of natural rainfall. More severe erosion due to splash impact may be expected
under natural conditions.
The uniform application of rainfall to the plot was assessed by placing 20 beakers on the
plot and measuring water collected at a range of intensities. The distribution was highly
- 199-

Chapter 5: Hydrological processes
sensitive to the tank being level. Care was needed during the set up of the rainfall
simulator. No systematic variation in rainfall application was noted across the plot.
5.4.3 Experimental procedure
One rainfall simulation experiment was conducted per day at the plot positions.
Experiments were conducted before 11 am and after 2 pm to avoid the intense
temperatures during the middle of the day which were found to increase evaporation from
the plot, in addition to flexing the Perspex drop former tank. The rainfall simulator is shown
in Plate 5.1
Plate 5.1 The rainfall simulator in the Badia
-200-

Chapter 5: Hydrological processes
During each experiment runoff samples were collected from the flow-chute attached to the
down-slope end of the plot. The flow-chute was coated with petroleum jelly and angled
such that runoff and sediments flowed into the sample bottle. Sampling started as soon as
runoff commenced. Samples were collected for a period of 30 s, every 30 s until runoff
ceased at the end of the experiment. Pending time, time to runoff and time to completion
of runoff from the start of the experiment were recorded. Each experiment generated
around 30 runoff samples. Bottles were pump filtered though Watman Grade 1, 61 mm
filter papers, air dried and wrapped in aluminum foil for transportation back to the UK. In
the UK loss on ignition was undertaken on the samples (BS 1377, 1990). Filter papers
were ashed and the burnt weight subtracted from the sediment mass which was
calculated on a five figure balance. Particle size analysis of the sediment samples, where
possible, revealed no distinct pattern or variation in granulometry either during or between
experiments. Mean particle size was 46 IJm (standard deviation = 54 IJm), with 0 16:084
ranging from 0.18, to 0.0315 for 37 sediment samples. Particle size analysis was
hampered by the low levels of sediment collected (mean sediment load for over 1000
samples = 0.06 g).
-201 -

Chapter 5: Hydrological processes
5.5 Res11..0l~s
The results are presented in three sections. First, the general characteristics of infiltration,
runoff generation and sediment dynamics from simulated rainfall in the northeast Badia.
As the first series of rainfall experiments in the northeastern Badia these experiments
provide a valuable insight into the hydrological response of the surfaces. Second, the
control of the coarse clastic ground cover on slope hydrology and sediment dynamics is
examined. The results are then extrapolated to a whole slope understanding of the
relationship between surface configuration and process variability. Third, a discussion of
the results is presented, which draws together the data generated form the image analysis
and the surface hydrology experiments to gain a greater insight into the controls on slope
dynamics.
5.5.1 Genell"a~ olbsell"Va~ioll1ls
The rainfall simulation produced a diverse response in surface hydrology between
locations. Infiltration and runoff generation rates varied considerably between both
disparate and contiguous plots. Low levels of rainfall instigated runoff, though generally
significant runoff was only noted shortly after the onset of intense rainfall. Runoff is
Hortonian Overland Flow (HOF). The nature of surface wetting was dictated initially by the
shelter afforded to the surface by clasts, whereby overhangs sheltered areas of sediment
from raindrop impact. Standing water quickly developed in microtopographic depressions
and was often confined or dammed by clasts. Little or no clast surface storage was noted
due to the rounded convex and varnished nature of the clasts. Rainsplash tends to
transport surface particles (> 2 mm) which concentrated in the sheltered zones around the
clast perimeters.
Runoff was generated on all 27 experimental plots. Runoff developed when standing
water breached the boundaries of depressions and flowed either down though the plot or
out over the plot lip. Runoff was continuous but fluctuated and in some cases appeared to
closely mirror changes in rainfall intensity. Through the course of each experiment a larger
proportion of the plot area contributed to runoff and areas of standing water coalesced.
Sediment yields were generally very low. No hydraulic deformation of surface sediment,
for example scour, was noted within the plot. Fine surface organic matter was initially
transported from the surface and then in places some fine surface sediment became
detached as flow paths developed. Deposition of sediment from up-slope occurred in
areas of standing water. Flow was not always down the slope of the plot but dictated by
- 202-

Chapter 5: Hydrological processes
the local slope angle of the microtopographic step features. An example of the rapid
accumulation of standing water is given in a series of plot photographs in Figure 5.9.
Figure 5.9 Standing water accumulation (trial experiment)
-203-

Chapter 5: Hydrological processes
When rainfall application was halted runoff quickly ceased. Significant evaporation but
limited infiltration left standing surface water for up to two and a half hours after the
experiment, though this time varied. The removal of clasts from the surface after the
experiment revealed the pattern of infiltration into the surface. Wetted perimeters were
excavated and mapped after each experiment. Infiltration focused around the perimeters
of clasts but the covered sediment directly beneath the clasts was often found to be dry.
Previously desiccated areas with cracked crust surfaces showed the greatest wetting
depths (mean depth = 0.06 m). Areas where standing water had been present showed
very sharp wetting fronts. A steeper gradient in the wetting front was found at the
perimeter of partly submerged clasts. Where the clast stood proud of the surface the
boundary of subsurface wetting was less sharply defined. In areas where a crust or
desiccated crust was present, the wetted perimeter was found to be highly irregular,
whereas where the surface was dominated by unconsolidated fines the wetting front was
commonly more regular. Wetted perimeter emerges at the surface beneath part
submerged clast, such that the central area of covered sediment commonly remained dry.
Wetted depths increased down-plot slightly in areas devoid of clasts; at the plot lip, mean
depth = 0.12 m, 0.5 m up-slope mean depth = 0.095 m. Several notable patterns in the
depths and nature of sediment wetting was linked to the presence of surface clasts
(Figure 5.1 0).
-204-

Chapter 5: Hydrological processes
Sealing or crusted surface Irregular coarse fragmented surface
• Shallow wetting depth • Highly irregular but deep wetting
• Poorly defined wetting margin • Sharp wetted margin
Field sketch of a common situation with various clast positions and surface types
Key : ________ poorly defined wetting front
______ sharp wetting front
Scale : - l ___ l = 0.25 m
• Highly varied wetting depth relating to presence of clasts and their position
Submerged clast
• Shallow and gradual gradient on wetting
margin
• Dry area directly beneath clast
Exposed clast
/-- - -
• Deep sharp wetting close to
clast contact perimeter
• Dry area directly beneath clast
Figure 5.10 Diagrams of various wetting perimeters
- 205 -

Chapter 5: Hydrological processes
5.5.2 General quantitative observations
Variability in surface response is reflected in the diverse nature of infiltration, runoff
generation, maximum and timings between plots. The relationship between mean runoff
and applied rainfall for all 27 experiments shows the degree of dispersion in runoff
generated from the plots but the mean runoff generated from all 27 plots shows a logical
variation with the applied rainfall intensities (Figure 5.11 ). Summary statistics from all 27
experimental plots are detailed in Table 5.2.
150
:.c: ~ 100 -:t:: 0 c :::J '-
"0 c ro
~ 50 c ro
0:::
0
0 600
00
0 0
1200 Time (s)
- --- -Applied rainfall
·················Mean runoff
0 Individual samples
1800 2400
Figure 5.11 Mean runoff, applied rainfall and all individual samples taken at all27 plots
Runoff occurred after a mean time of 683 s after the onset of the experiment, 83 s after
the peak applied rainfall intensity. With a lag of approximately 390 s for the rainfall
simulator output to increase from 17.5 to 100 mm h-\ this represents a very rapid surface
response to a change in applied rainfall intensity. An intensity of 17.5 mm h-1 was found to
generate runoff after a mean time of 1 080 s during trial experiments, again demonstrating
the rapid response of the surfaces. The minimum time to runoff generation occurred at
390 s with the maximum after 930 s (Table 5.2). Times to maximum runoff varied
accordingly. Mean peak discharge, recorded as 66.9 mm h-\ was achieved after 1151 s,
with the minimum time-to-peak discharge occurring at 660 s and the maximum time to
peak runoff occurring after 1500 s. The maximum recorded runoff was 132 mm h-1 and the
minimum value was 28.6 mm h-1. Mean peak discharge is obtained 300 s after the
-206 -

Chapter 5: Hydrological processes
cessation of peak rainfall intensity. The lag time to mean peak discharge reflects the
increasing connection between areas of the plot as the volumes of standing water
accumulated. If maximum discharge is not achieved during the period of maximum
intensity, it is likely to be delayed by the reduced rainfall intensity in the latter stages of the
experiment.
Experiments in the northeastern Badia show that temporal variations in infiltration and
runoff generation vary greatly between plots. Some of the experimental plots show highly
responsive surface hydrology which closely reflects the rate of applied rainfall. The
correlation between applied rainfall and generated runoff varied greatly between plots. A
more muted response, showing both extensive lags and a poor correlation between rates
of runoff and rainfall application, were noted to generally occur towards the toe of the
slope profile. Deviation about the mean runoff increases with rainfall intensity. A lag-time
is evident between the onset of peak intensity and peak discharge. Runoff tails off rapidly
after the end of simulated rainfall. The rising limb of the hydrograph is more clearly
defined and abrupt than the falling limb, indicating the responsive nature of the surface.
Falling limbs are more sporadic and showed a greater level of variability in runoff.
-207-

Chapter 5 - Hydrological processes
~ Q) "'C ~ - .... -0 C'CI - "'C 0 C'CI 1: 1: "'C ::: 1: .... "'C Q) a:; 1: 1: .... :I ~ 1: E
Q) Q) 0 :I 0 Q) .... C'CI ~ - E ">. ">. 1: .... ~ .0 E
0 Cij 1:
0 "'C J:: E- :I E E 1: 1: "'C e-el: .... 1: Ill :I - ::::1-- 0 :I
Q) Q)-Q) ;.~ :I 1: 0 :I - Ill ";" 0 0 0 :I J:: .... .
~ .. Ill Cl E a> E l:.s::. .... c::: -c E -·- - E a. 1: - E-cfti -·;c a> E 0 C'CI
~'E iij"C ·- E Q) C'CI Q) ·-- - C'CI E 1: ·- C'CI- E ·- 1: ·- )("-E:;:- E~-0 0 C'CI- E a> E :I > o E Q) Q) ()]! "CC'CI> C'CI "'C-
0:: 0:: a::~ :::iE ·- Cl Q)-Q) :!:G) Cl ·- 1: Ill i=E~ :::!E~- :::!E- t-- >-- 1->- C/)1/l"'C Ill- 1- ·--
SIT 1 80.400 42.249 21.389 4929 0.059 1.653 0.059 0.213 11.590 1140 STT 2 66.000 41.249 14.890 3953 0.009 0.212 0.014 0.070 11.300 1080 STT 3 74.640 41.983 18.692 5073 0.223 6.468 0.427 1.496 11.220 1080 STM 1 40.800 31.469 9.331 3278 0.015 0.347 0.046 0.231 14.000 1140 STM 2 54.960 37.173 12.211 4182 0.124 0.335 0.040 0.207 12.130 1140 STM 3 53.760 27.500 10.055 2750 0.006 0.143 0.008 0.029 12.470 1200 STB 1 54.480 27.844 14.839 2996 0.044 0.845 0.102 0.458 11.070 1140 STB 2 28.560 18.400 8.321 2070 0.226 6.113 0.230 1.218 12.400 1350 STB 3 41.280 18.691 12.424 1947 0.048 1.205 0.074 0.312 13.010 1260 CCT 1 69.360 31.324 18.316 3785 0.019 0.558 0.040 0.201 9.180 1200 CCT 2 76.800 40.270 21.307 4027 0.016 0.391 0.044 0.201 15.300 1350 CCT 3 86.160 40.648 26.150 5081 0.047 1.421 0.048 0.131 13.090 1500 CCM 1 46.800 28.720 12.556 3590 0.045 1.347 0.061 0.262 11.300 1350 CCM 2 69.120 36.665 18.479 3972 0.016 0.417 0.436 0.204 12.000 1140 CCM 3 48.960 39.777 12.362 2554 0.084 1.854 0.109 0.581 11.450 1020 CCB 1 54.000 33.757 12.862 4155 0.055 1.751 0.060 0.232 10.110 1020 CCB 2 56.400 29.956 14.930 2746 0.123 2.708 0.089 0.369 10.470 1200 CCB 3 65.520 41.639 16.669 4870 0.041 1.116 0.060 0.264 8.390 1110 CVT 1 75.600 35.881 16.970 4173 0.013 0.403 0.020 0.213 9.110 660 CVT 2 55.200 28.412 13.923 3486 0.050 0.506 0.076 0.213 12.010 1140 CVT 3 103.200 39.545 20.568 3876 0.012 1.105 0.023 0.422 6.300 810 CVM 1 136.000 87.778 25.798 9399 0.153 4.064 0.108 0.181 11.300 930 CVM 2 106.800 71.647 24.504 5561 0.091 1.579 0.107 0.405 12.000 840 CVM 3 72.480 54.707 19.626 4321 0.053 1.043 0.012 0.359 12.000 1290 CVB 1 53.760 27.880 15.005 2091 0.014 0.244 0.012 0.258 11.300 1410 CVB 2 48.000 34.320 9.862 3432 0.025 0.584 0.056 0.201 11.000 1320 CVB 3 65.520 44.271 14.182 4796 0.012 0.299 0.025 0.205 10.560 1260
Mean 66.095 38.287 16.156 3966 0.060 1.434 0.088 0.338 11.336 1151
Table 5.2 Plot experiments, summary statistics

Chapter 5 - Hydrological processes
5.5.3 RainfaU partitioning and infiltration
Aggregated results from all experiments return a mean runoff coefficient of 0.223,
equivalent to 13.3 mm h-1 runoff under this storm hydrograph, indicating a mean steady
state infiltration rate of 46.1 mm h-1. Surface water storage was estimated immediately
after 10 of the 27 experiments. Standing water depths were also measured. Standing
water was commonly observed to accumulate over 75% of the exposed sediment areas.
Standing water reached a maximum depth of 27 mm, with a mean value of 13 mm.
Aggregated over the mean percentage of exposed sediment cover (52.9% of plot area for
all 27 plots) this represents 19.7% of the applied rainfall volume. Infiltration, taking
account of surface storage, therefore represents 58% of applied rainfall, with a mean
value of 36.2 mm h-1. Infiltration varies considerably between locations, but corresponds
well with previous studies in the region. For example, Warburton (1998) suggested a
mean infiltration rate of 24 mm h-1 for the Badia side slopes. The higher rate obtained here
is attributed to the presence of clasts. The experiments undertaken by Warburton (1998)
only considered interclast sediment areas.
Based on the calculations outlined above, rainfall partitioning from all 27 experimental
plots can be disaggregated as follows. Surface storage accounts for 19. 7%, infiltration
58.0% and runoff 22.3% of rainfall. Plot leakage is estimated at less than 5% of applied
rainfall, which was lost both though lateral leakage of surface storage, loss at the plot lip
and lateral infiltration beneath the plot boundaries.
Observation of infiltration processes from the rainfall simulation is complicated by the
coalescence of ponded areas, often represented by an oscillation of runoff about a mean
steady value. Runoff can therefore only be considered as quasi-stable (Holden, 2000),
whereas infiltration rates maybe stable or steady. Runoff as a surrogate for infiltration is
therefore not reliable on this type of surface with this plot size, but nonetheless provides
some interesting results. A series of twin-ring infiltration experiments was undertaken to
give a better estimation of water exchange at the surface. The use of infiltration rings
allows the calculation of steady state and maximum infiltration rates and is not subject to
the complexities of variable rainfall intensity in storm simulation. Three twin-ring infiltration
experiments were conducted in parallel at each of the nine slope positions to gain a
statistically robust sample. The data generated are averaged at each location, and
Hortonian type infiltration regression curves fitted (Equation 5.1 ).
(Eq. 5.1)
-209-

Chapter 5: Hydrological processes
f =.f.+((,- .l,_)e-k'
where : f = infiltration capacity
fc =final infiltration rate (asymptote)
fo = the initial infiltration
k = a constant
The Hortonian equation is fitted by a non-linear least squares method which seeks to
minimize the sum of squared deviations between the predicted and observed infiltration
rates. The application of a Hortonian-type equation is not without its limitations but is
preferred over the alternatives. The Hortonian type equation is favored above the Philip
equation, as the latter is seen only to be applicable after whole surface pending, which in
this instance only occurs in the latter stages of the experiment. As Slattery ( 1994) notes,
there are difficulties in applying the theoretical infiltration curve derived by Phi lip ( 1957).
The Hortonian model initially assumes infinite infiltration, until the rate equals the rainfall
intensity. After this point the infiltration curve dictates how much of the water enters the
surface and how much is diverted to overland flow. By their nature both the Philip and
Hortonian infiltration curves are forced though initial and final infiltration levels. Given the
relatively sporadic nature of infiltration calculations generated from the rainfall simulation,
this type of model is better suited to the more stable results generated by the ring
infiltration experiments.
An example of the Hortonian type infiltration curves are given in Figure 5.13. This
demonstrates the speed at which the infiltration rate stabilizes to a steady state. The final
mean infiltration value of 36.2 mm h-1, derived from the rainfall simulation, is also shown in
Figure 5.12.
-210-

<!)
-ro ..... c 0
~ ..... == <;::::
150
Chapter 5: Hydrological processes
stt ccb stm cvt stb cvm cct cvb cc m
c 50
0
0 600
36.2
-·-·-·-·-·-·-·-·-----·-·-·---·••••• ooooooooooooooooooooooo•••••••oooooooooouooooooooooooo••••••ooouooooooooooooooooooooooooooooooooooooooooooooooooo
1200 1800 2400 3000 3600 4200 4800 5400
Time (s)
Figure 5.12 Hortonian infiltration regression curves at the 9 experimental sites. Mean infiltration curves have been derived from the three experiments at each plot position.
Results from the ring infiltration experiments show a difference to those results generated
from the rainfall simulation. Mean steady state infiltration values gained from the ring
infiltration suggest a rate of 13 mm h-\ as opposed to a value of 36.2 mm h-1 derived from
the rainfall simulation. The difference in infiltration rates obtained is attributed to
differences in experimental procedure. The rainfall simulation experiments encompass a
relatively large plot area (0.5 m2), which includes both boulder and exposed sediments.
The ring infiltration experiments where undertaken over a small spatial area (0.02 m2}
which is not sufficient to include basalt fragments or clasts. The relative shape of the
circular infiltration plot and the rectangular rainfall simulation plot also means that edge
effects relative to the surface area are greater in the rainfall simulation experiments than
the infiltration. Given the low levels of lateral seepage of water from the rainfall simulation
plots, the difference in infiltration rates seen from the rainfall simulation is attributed to the
presence and variable nature of boulders within the experimental area. The presence and
nature of surface clasts is a key control on slope hydrology. A small degree of variability
may be attributable to the infiltration characteristics of the sediments at the various
locations. For example, Hortonian infiltration regression curves for the top, middle and
bottom plot locations, (Figure 5.13), show a decrease in infiltration capacity down-slope.
- 211 -

80 -
60 -
:.c 40 -E~ E2 -rl c (/) OOl :;::a ro= ~ '+= c
20
10
0
\ •. ., .... ·~·· ... \\. ·, ··· •..
Chapter 5: Hydrological processes
__ Top
Middle
Bottom
·,.:················· 00000001
''••••noonooooooooooooooooooooooooooooooooooooo•o•••••••••••••••••••••oooooooooooooooooooooooooo .. oooo••ooo ' ..... __ -·-·-·-·-·-·-·-·-·-·-·-·-·-·-·-·-·-·-·
600 1200 1800 2400 3000 3600 4200 4800 5400 Time (s)
Figure 5.13 Hortonian infiltration regression curves, grouped by plot position
Steady state infiltration and runoff relative to applied rainfall was observed to occur rapidly
after the start of the experiment at some plot positions. The abundance of standing water
suggests a limited infiltration capacity, which in turn generates relatively large quantities of
overland flow. Periods of stable runoff are characterized by a sporadic oscillation about a
mean value which is here attributed to the periodic fill and burst of micro-topographic lows
within the plots and the formation and development of preferential flow pathways (Plate
5.2). This type of behavior was seen to be particularly prevalent on surfaces with marked
step-like micro-topography which is commonly associated with surface structures. The
oscillations therefore are frequently not a reflection of the variable nature of the infiltration
but rather a complication of the rainfall simulation technique.
-212-

Chapter 5: Hydrological processes
Plate 5.2 Preferential flow pathways, Qa'a AI Buqei'wiya
- 213-

Chapter 5: Hydrological processes
5.5.4 Sediment transfer
Sediment yields from the experimental plots were generally low with several of the runoff
samples retaining so little sediment that the accuracy of the balance measurement was
less than the sediment mass. In these instance sediment mass was assumed to be zero.
The mean sediment yield for all 27 experiments was 1.43 g, with a maximum of 6.47 g
and a minimum of 0.14 g. As with runoff generation, sediment yields were seen to
fluctuate throughout the period of the experiment but again appear to oscillate around a
constrained mean value. Peak sediment yields occurred after a mean time of 900 s from
the beginning of the experiments which corresponds closely with the onset of peak rainfall
intensity though a high standard deviation of time to sediment maximums shows the
sporadic nature of sediment dynamics. A statistically strong link between mean runoff and
mean sediment yield (,-2 = 0.707, a= 0.01) and more significantly rainfall intensity and
mean sed iment yield was found (F igure 5.14).
......... :.c El .........
c:
"' Cl> E
~ "0 (ij ·:;;... c <IJ E "0 <IJ
(f)
r2 = 0.789 0.15 -Root mean squared error= 0.016 Sample number= 45
0.1
0.05
0
CIJ ~o~
o ~ ?~ 8 0 - o.. .e o o oo
0
0
50
0
~ 0'. 0 &J @ 0
Rainfall (mm h-1)
0
0
0
.e·
0 ~ - ~ ~ 0 0 ~ ·
Linear regression model: Smean = -0.006 + (0.001 X rainfall)
100
Figure 5.14 Relationship between rainfall intensity and mean sediment yield
0
Sediment yield is contro lled more directly by raindrop and splash detachment rather than
entrainment by overland flow, under these experimental conditions, though both are
significant factors. This suggestion is perhaps not surprising in a plot of 0.5 m2, where
overland flow is limited. The importance of the relationship between rainfall intensity may
- 214 -

Chapter 5: Hydrological processes
be reduced under natural conditions if ponding depths and up-slope area increase.
Raindrop impact absorption and the velocity of overland flow under natural conditions
maybe more important controls on surface sediment dynamics (Cerda, 1998). lt is also
interesting to note the increase in mean sediment yield variability with intensity. Higher
intensities tend to exaggerate differences in surface response between sites. The diversity
in surface response is attributed to the variable protection afforded to the surface by the
clast cover.
The generally low levels of sediment removal from the plots can be attributed to several
factors. The plot area in itself is relatively small and the surface sediments are commonly
crusted and rapidly seal after the onset of rainfall. The high frequency of low magnitude
events which are not sufficient to instigate overland flow, may act to increase surface
sealing, increasing this effect. Runoff on a plot of 0.5 m2 will never obtain significant
magnitude. Where concentrated overland flow does occur the volume of water is therefore
relatively small. Scour or rill development will be limited and hydraulic deformation of the
sediment bed is transport muted.
5.5.5 Heterogeneity in surface hydrology
Heterogeneity in surface hydrology is a commonly cited phenomenon in semi-arid
environments (Agnew and Andersen, 1992; Sharma et al., 1980). The results show
coherent levels of heterogeneity between plot locations but significant variation between
contiguous plots is still apparent. The diversity in surface response is attributed to both
variations in sediment character and ground surface clast cover, though this effect has
been minimized by using the image analysis based plot location method. Heterogeneity in
surface response can be linked to slope position.
Plot location Mean runoff a (mm h"1) Max runoff a (mm h"1
)
Top 19.02 28.74
Middle 14.59 21.60
Bottom 10.23 19.12
Table 5.3 Standard deviation in hydrological response as influenced by slope position
Table 5.3 shows standard deviation of hydrology statistics grouped by plot location. lt
suggests that slope position influences not only magnitude of runoff generation, but also
the nature of variability of surface response. Surface hydrology, as represented here by
- 215-

Chapter 5: Hydrological processes
mean runoff and maximum runoff appears to be more consistent between plot locations
towards the base of the slope profile.
An interesting and important question is raised as to whether this pattern is cause or effect
of slope hydrology? Surface form at the base of the slope profile may be modified by
slope process such that the response is more muted and less variable. For example,
increased volumes of runoff from the up-slope area increase attrition and the removal of
clasts from the slope toe. This process increases the area of exposed sediments for
infiltration, hence reducing volumes of runoff. Potential feedback mechanisms suggest
that the interrelationships between the controls of surface forms may vary between
locations and may be indicative of a homeostasis between form and process action.
Several distinctive trends in surface hydrology have been established by examining
generalized results from the rainfall and infiltration experiments. The results have
identified that around the mean trends of surface hydrology there is a significant degree of
variability between disparate plots. The image analysis of the surface characteristics has
identified an equally diverse ground configuration, as dictated by the presence and nature
of surface clasts.
5.6 Slope profile hydrology
Rock fragments often a contradictory effect on overland flow production and surface
hydrology (Poesen, 1994). The following section describes an examination of the
influence of ground surface cover and slope variables in the context of the two
dimensional slope profile. The systematic, down-slope changes in ground surface cover
have previously been linked to what is suggested to be slope dominated process action.
From a comparison of the experiments undertaken in this study it is clear that the
presence of surface clasts has a profound influence on surface hydrology. Rainfall
simulation and ring-infiltration experiments to examine the infiltration characteristics of the
surfaces return very different results for identical locations. The difference between the
experimental procedures is the inclusion of boulders within the area under examination.
The variation in surface hydrology is not purely a function of variability in sediments
between locations but is influenced by the presence and configuration of surface clasts.
Rainfall simulation repeatedly shows greater levels of variability between contiguous and
disparate locations, whereas more consistent results were obtained from the ring-
- 216-

Chapter 5: Hydrological processes
infiltration experiments. lt is suggested that presence of surface clasts greatly influences
the nature of surface hydrology, in a systematic manner.
Aggregated statistics whereby mean values are taken across all three experimental
slopes yield poor correlations between ground cover measures, hydrological measures
and sediment dynamics. For example mean runoff (Rmean) correlates with percentage clast
cover (Gcp) with an~ value of 0.0006 for all 27 plot locations. As was seen with the image
analysis results, more success is found when the data are grouped either into whole
slopes or plot positions. Results generated from image analysis on the area rainfall
simulation plot are also used to examine whether a more detailed description of the
surface at the plot scale provides a better understanding of plot hydrology. These are
compared to results generated form the larger image analysis plot.
5.6.1 Straight profile
The straight profile site provides a good example to test the relationship between ground
cover and hydrology without the added complication of a concave or convex slope profile
form. Changes in ground surface cover are now well understood at this site. Additionally,
the long length (204.7 m) of the profile may exaggerate absolute differences in form and
process due to slope controls. Regression analysis between slope controlled variables,
ground cover of both the rainfall simulation plots and the image analysis plots and slope
hydrology returns significant least squares correlations (Table 5.4).
Table 5.4 shows several statistically significant relationships between slope hydrology,
slope and ground cover. The majority of significant correlations relate measures of runoff
to the controlling variables, in Table 5.4 enclosed within the box. First, consistently
significant relationships are found between runoff and not sediment load. As previously
seen when considering the generalized statistics for all experiments (5.5.2), there is little
relationship between sediment yield, runoff or slope controls. Instead sediment yield is
strongly linked to applied rainfall intensity, suggesting the importance of splash
detachment. The low sediment yield is related to limited levels of runoff and hydraulic
deformation, as dictated by plot size. On the straight slope example, with there is no clear
correlation apparent between sediment yield variables and ground surface or slope
variables.
The second observation from these results is the poor relationship between the whole plot
derived statistics (Gcpp101, EdgeTotplot. Bptot) and the hydrology of that plot. Much greater
significance is achieved in comparisons between the image analysis derived statistics
- 217-

Chapter 5: Hydrological processes
{Gcp, EdgeTot;m. CVB;m. B;m) from the image analysis plot, a plot an order of magnitude
greater in area. This has several implications. Results generated from a small plot,
derived using the same image analysis methodology, do not correlate well with surface
hydrology. Poor correlations between surface cover character and surface hydrology
maybe explained as an inadequacy of sampling. The sample size maybe statistically
significant in terms of understanding particle size distribution, but in not of sufficient extent
to understand surface hydrology. Sample size and spatial extent is therefore of paramount
importance for studies which aim to use measures of surface character to understand
surface hydrology on these surfaces.
- 218-

Chapter 5- Hydrological processes
Variable name Variable Description type
Runoff Sediment Timings Percentage clast ground cover-Gcpplot en
Q) rainfall simulation plot(%) Variable Rmax Rmean RTot Smax Smean STet TRstart TRmax (5::0
-eo EdgeTotplot
CL·;:: Total edge length (m) Gcpplot
CO 1/) 0.039 0.019 0.006 0.026 0.000 0.041 0.087 0.015 > ()
~]2 Bplot Mean intermediate axis (m)
a..-- Edge T otplot 0.008 0.006 0.010 0.199 0.353 0.200 0.137 0.048 PltAngle Rainfall simulation plot angle (degrees) ro iii en
Bplot 0.000 0.031 0.026 0.123 0.113 0.134 0.068 0.001 Q) Mean angle of slope 10 m above plot UpslpAngle ::0
CO (degrees) PltAngle 0.547 0.797 0.690 0.032 0.016 0.015 0.035 0.544
·;:: CO
PltDist > Distance of plot from slope crest (m) Q)
Q)
0.. UpslpAngle 0.580 0.430 0.435 0.073 0.032 0.119 0.427 0.228 0.. 0 Slope curvature (and of the slope 10 m 0 Ci5
U5 PltDist 0.695 0.852 0.765 0.003 0.002 0.000 0.127 0.551 Curv above the plot, minus the angle of the slope 10 m below the plot)
Curv I 0.663 0.555 0.544 I 0.019 0.084 0.045 0.386 0.310 en Percentage clast ground cover- image Gcp
Q)
Gcp ::0 analysis plot(%)
0.731 0.698 0.663 0.017 0.007 0.044 0.313 0.413 -~ "0 !ii c Total edge length- image analysis plot :::l Edge Tot 0.681 0.588 0.572 0.039 0.016 0.075 0.372 0.333 Edge Tot > 0 1/)
.... (m) L.. ()
Q)
C"l~ >
CVB 0.744 0.745 0.699 0.010 0.004 0.031 0.280 0.448 0 1/l.!Q CVB u Coefficient of variation "ii) -ro "0
>- ..... B 8
c Mean intermediate length (m) (ijl/l 0.281 0.113 0.136 0.157 0.070 0.208 0.443 0.041 ~
0 cL.. .... ro Q) Cl Volume weighted mean intermediate > VolwMb 0.732 0.700 0.664 0.017 0.007 0.043 0.312 0.414 VolwMb en Q) 0 C)U
"Cii axis length (m) ro ~
E AreawMb 0.710 0.645 0.620 0.027 0.011 0.059 0.344 0.374 CO Area weighted mean intermediate axis c AreawMb CO
EdgewMb 0.661 0.552 0.542 0.046 0.020 0.085 0.387 0.085 Q) length (m) Cl CO Edge length weighted mean
ro Fractal 0.738 0.829 0.758 0.000 0.007 0.000 0.191 0.521 EdgewMb E - intermediate axis length (m) ~ 0.. 0.717 0.847 0.767 0.001 0.001 0.002 0.153 0.002 en Box fractal dimension for sediment
(f) Theissen Fractal -Q) eo_ :;:: .0 area
CO CO c. "i::
Standard deviation of number of Theissen
(f) CO >
vertices of Theissen polygon network Significance values : a= 0.05- italics; a= 0.01 -bold
Table 5.4 Correlation statistics- straight profile

Chapter 5 -Hydrological processes
Of the relationships described (Table 5.4 ), the diversity of significant variables is notable.
Slope, ground surface cover and spatial measures of the surface form all return
statistically significant values of (. The surfaces therefore present a complex system
whereby many factors appear to influence hydrology, though collinearity between
variables is inevitably apparent. Delimiting one variable from another appears difficult
given that the relationship and relative importance of variables changes between
locations. There is the role of surface form influencing process and process influencing
surface form. Differentiating geomorphological cause from effect in such a system where
variables are interdependent is difficult to achieve using field experiments such as this.
The rainfall simulation is designed to assess surface hydrology. The adjustment of the
surfaces through the movement of clasts or the reworking of the clast population though
weathering and erosion requires either a much greater magnitude of runoff, which may be
obtainable in a whole slope sheet flood, or a much longer time-frame, whereby the
movement process of clasts is iterative. The study of surface hydrology appears to be an
adequate measure of surface process variability, given the significant relationships
between slope form ground cover and plot hydrology variables.
The results presented for the straight slope profile compliment the suggestions made by
Dunkerley (1994). Dunkerley advocated the importance of considering appropriate
statistics that could be conceptually related to process action. Table 5.4 details the
correlations between slope hydrology and weighted means, as suggested by Dunkerley
(1994). VolwMb;m. AreawMb;m and EdgewMb;m show statistically significant relationships
with runoff variables (a = 0.05). lt is also interesting to note the increasing strength of the
correlations presented as the weighted mean approaches a volume approximation of clast
form (VolwMb;m). Edge length weighting (EdgewMb;m) and area weighting (AreawMb;m)
remain significant, but less so than VolwMb;m· This suggests the importance of both edge
length, previously suggested as a transition zone for water infiltration (Poesen and
lngelmo-Sanchez, 1992), clast area, which affords protection from raindrop impact
(Poesen and Lavee, 1994 ), and clast volume.
The relationship between clast volumes, despite being the most significant here, is less
clear. lt is suggested that this acts as a surrogate for both edge length, area and as a
hydraulic roughness element which acts to impede and channel flow. All of the weighted
means behave more significantly than the commonly cited crude mean intermediate axis
(B;m). again advocating the importance of appropriate statistics. lt is also interesting to
note that actual equivalent measures which Dunkerley's (1995) weighted means aim to
approximate, perform better than statistical approximations. For example EdgewMb;m ( = 0.66, whereas the image analysis derived EdgeTot;m r2 = 0.68. lt is reassuring that
-220-

Chapter 5: Hydrological processes
commonly employed percentage cover (Gcp) performs well, returning consistently high
levels of significance. Additionally, the degree of clast sorting, here represented by CVB;m,
is significant as a control on runoff. The implication of the results is that simplistic
measures of ground surface cover may not always be appropriate. Cover percentage,
weighted mean clast sizes and clast sorting all appear to be significant influences on
runoff generation and magnitude.
A further additional set of ground cover variables are the spatial statistics. In this example
Theissen polygon analysis (Theissen) and fractal dimension results return the second and
third highest degrees of significance as a control on Rmean. Rmax and Rrot· lt is interesting to
note here that although the experimental plot size chosen does not encompass an area of
spatial extent large enough to be considered homogenous, the hydrological response still
reflects the organizational structure of the surface. A consideration of the spatial extent of
the ground surface clast distribution is therefore important in this instance. The difficulty
with extrapolating from the analysis is the consideration as whether the spatial variables
are a cause or effect of surface hydrology. lt has been suggested that ground clast
structures can act as dams to impede runoff, particularly where polygonal networks of
clasts are present. Tightly locked clast structures will reduce the flow velocity and
sediment transport capacity, potentially encouraging infiltration, and further modification of
the clast surface. If a locking structure acts as a dam to flow, than it is likely that the
constriction to flow will be breached when the surface water overtops the clasts. This may
encourage scour erosion, and direct the flow into the sediment bed. Under a mechanism
such as this, does an organized surface self perpetuate its character by impeding flow,
reducing runoff and increasing infiltration? Is then a feature such as surface structure a
property of the surface that cannot be logically linked to the other variables considered, or
is it acting as a surrogate for another process? The link between surface pattern and
runoff is therefore an important consideration.
The most significant relationship was found between PltDist and Rmean (~ = 0.853),
suggesting the importance of slope profile form on slope process. PltDist, although here
presented as a site specific variable of slope, it is not a direct measure of slope at each
plot. For example, plot angle (PitAngle), can be conceptually linked to process action at a
point. An increased slope angle will increase runoff, as shown by the relationship between
PltAngle and Rmean (~ = 0.797). PltDist is not a physical control over process in the plot,
but here acts as a surrogate variable for down-slope controlled change in surface
character. The variable potentially represents both cause and effect. PltDist encompasses
the length of the up-slope over which runoff accumulates but also may represent the
modification of the surface by increasing process action down-slope. The strength of the
- 221 -

Chapter 5: Hydrological processes
relationship shows that a whole slope consideration of process action at a point is vital to
understanding slope hydrology in the Badia.
The results presented above indicate a highly variable surface hydrology down-slope. The
interplay between cause and effect present the surface as a self-organizing surface with a
degree of homeostasis acting to adjust form to process and vise versa. The variability in
surface hydrology can be seen clearly by examining the mean runoff hydrographs from
the rainfall simulations conducted at the three slope locations (Figure 5.15). The
hydrographs indicate an increasingly muted surface hydrology down-slope, with reduced
runoff maxima, increasing lag times, and reduced runoff and hence increased infiltration
towards to base of the slope.
80
60
:.c E E 40 -~ 0 c ::I
0:::
20
0
0
I
I
I
I
\
"
... ······ ... /.. ...._ ....
\
fp-............. ...: f I >
•.•• ·1
600 1200 Time (s)
\
\
'
-·-·-·-Top
---Middle
··················· Bottom
...-·················· ..... \
\ .. · ·\.··/
1800 2400
Figure 5.15 Mean runoff hydrographs for straight profile
The weak correlations between ground cover, slope and hydrology for the aggregated
statistics suggests that the relationship between the variables may change their influence
between sites. A method of exploring the linkages is by employing standardized results.
Analysis of variables standardized to mean values for the site allow the relative change in
hydrology to be assessed and conceptually linked to variations in slope form, ground
cover and slope angle. Standardized results based on site mean values allow
relationships to be explored at the local scale. Figure 5.16 illustrates hydrological results
for the straight profile. Here mean result from the three rainfall plots at each location are
standardized against the mean result for the whole slope profile. In this instance the
-222-

Chapter 5: Hydrological processes
results may appear slightly deceptive. Actual differences in morphology between plot
locations on the straight profile are very small. The analysis is more beneficial on the
convex and concave profiles where significant differences are apparent but data is given
here for comparison. Several notable trends are apparent from this data.
First, all runoff variables appear to decrease down-slope relating well with the decrease in
mean plot angle. Sediment transfer variables all vary consistently between plots.
Surprisingly increased up-slope angles appear to reduce sediment yields, potentially as
result of volumes of transferable sediments on the surface. If up-slope angle (here
measured over the 10 m of the profile directly above the plot) are high, then flow velocities
and sediment transport capacities will be high. Therefore at the middle plot location
available sediments may have been removed from the plot by a previous event with a
magnitude greater than at the other plot locations. Again it must be noted in this example
that the actual relative differences between sites are small, so conjectures such as this
should be treated with caution without further clarification. Timings appear consistent
down-slope, as do the relative differences between the runoff variables.
-223-

en Q)
:0 ctl
·;:: ctl > -o Q) N -o ...... ctl -o c 2 (j)
en Q)
:0 ctl
·;:: ctl > -o Q)
.t::! -o ...... ctl -o c ctl
Ci5
3
2
0
-1
3
2
0
-1
curv perc
Slope variables
pltagl upslangl
.. ·-····"-:: ~--::;:: :.::~,~ .. ~~~~~~:-~,.-~:·· -·· .,· .......-
"
Top Middle
smean sedmax
Sediment transfer variables
Top Middle
Bottom
stot
Bottom
3
en Q)
:0 -~ 2 ctl > -o Q)
:6 1 ...... ctl -o c ctl
Ci50
-1
3
~2 :0 ctl
·;:: ctl > -g 1 .t::! -o ...... ctl -o ~0
Ci5
-1
___ rmax ................. rmean -- -- - · rtot
Runoff variables
-·--·--·-.......... ,., ..... ,., ...........
Top Middle Bottom
-- tstart ················· tmax
Runoff timings
_____ ....., ..... , ...................................... =··~-
Top Middle Bottom
Figure 5.16 Straight slope standardized variables

Chapter 5: Hydrological processes
5.6.2 Concave slope
Slope controlled variation in ground surface cover is more complex on the convex and
concave profiles than on the straight profile surveyed in this study. lt is reasonable to
assume that slope hydrology is equally complex. A correlation analysis on the results from
the concave profile is detailed in Table 5.5. None of the correlations return statistically
significant results (a = 0.1 ), but the difference in relationships is still of interest.
Regression on variables from the concave slope profile returns lower significance values
than achieved on the straight profile. Significant relationships are still obtained between
Rmax and Gcp, Cvb;m. UpslpAngl (a = 0.1 ), and the weighted mean clast intermediate
diameters but none of these are strongly significant. There are no significant relationships
between Rmean. Rrot nor any of the slope or ground cover variables. Equally, sediment
yields and runoff timings all fail to return significant results. The correlation analysis above
explores the linearity of the relationship between variables. On the straight slope, change
in ground cover character was commonly found to be linear with distance down-slope.
The suggestion raised by the poor correlations on the concave example suggests that if
the relationship between variables is similar to that as on the straight profile, then the
nature of down-slope change is not linear. The image analysis of the ground surface cover
shows similar change, which relates less well on slopes with significant departures to
convexity or concavity. As has been previously shown on the straight slope example,
there are significant relationships between hydrology and both ground cover and slope
properties. On the concave profile, where the relationship between slope and ground
cover variables is more complex, it is perhaps therefore not surprising that the pattern of
down-slope variation in slope hydrology is more complex. The relationship between slope,
position on slope and ground cover on slope hydrology is therefore fundamentally
influenced by slope form. The importance of slope form is qualified by the consistent
significance of the profile curvature variable (Curv) and up-slope angle (UpslpAngle),
which returns statistically significant results for all three profiles for at least one of the
hydrology variables.
-225-

Chapter 5: Hydrological processes
Variable name Variable Description type
Runoff Sediment yield Timings Gcpplat en Percentage clast ground cover-(!) rainfall simulation plot(%) -o:o
Variable Rmax Rmean Rrot Smean Srot Smax Tstart T max - C1l
EdgeTotplat a. ·c Total edge length (m) C1l >
..... Gcp 0.535 0.040 0.228 0.059 0.050 0.309 0.033 0.221 Splot Mean intermediate axis (m) (!) > 0 PltAngle Rainfall simulation plot angle (degrees) (..) EdgeTot;m 0.035 0.001 0.100 0.070 0.107 0.059 0.130 0.011
""0 en
c (!) Mean angle of slope 10 m above plot
:::::1 Cvb;m 0.571 0.052 0.115 0.261 0.286 0.244 UpslpAngle :0 0 0.262 0.441 C1l (degrees) ..... ·~
<.9 B;m 0.250 0.015 0.194 0.001 0.005 0.193 0.013 0.036 PltDist > Distance of plot from slope crest (m)
(!) 0.. 0 Slope curvature (and of the slope 10 m
UpslpAngle 0.534 0.040 0.228 0.058 0.049 0.309 0.033 0.219 Curv U5 above the plot, minus the angle of the
(!) PltAngle 0.395 0.040 0.041 0.313 0.362 0.137 0.351 0.416 slope 10 m below the plot)
a. 0 en Percentage clast ground cover- image
U5 PltDist Gcp (!)
0.381 0.039 0.037 0.314 0.365 0.130 0.355 0.410 :0 analysis plot(%) C1l
Curv 0.572 0.052 0.115 0.261 0.285 0.245 0.261 0.440 I EdgeTot -~
Total edge length- image analysis plot > Q; (m)
-~ Theissen 0.008 0.003 0.030 0.175 0.234 0.003 0.257 0.106 >
CVB 0
Coefficient of variation -ro u
a. "0
(f) Fractal B c Mean intermediate length (m)
0.393 0.040 0.040 0.313 0.363 0.136 0.352 0.415 ::::l
e Cl Volume weighted mean intermediate
""0 VolwMb 0.578 0.052 0.120 0.256 0.279 0.250 0.254 0.439 VolwMb en (!) (J)
·u; axis length (m) - c >.
~re AreawMb 0.561 0.051 0.109 0.268 0.294 0.237 0.271 0.443 Cii Area weighted mean intermediate axis
·- (!) AreawMb c
a> E C1l
~ EdgewMb
QJ length (m)
0.529 0.050 0.091 0.283 0.315 0.215 0.294 0.444 Cl C1l Edge length weighted mean
EdgewMb E - intermediate axis length (m)
Fractal en Box fractal dimension for sediment
Cii~ :.;::::; .D area C1l C1l a.·;::
Standard deviation of number of Theissen
(f) C1l >
vertices of Theissen polygon network
Table 5.5 Correlation statistics- concave profile

Chapter 5: Hydrological processes
Analysis of mean runoff hydrographs generated by the three plots at each of the three
slope locations shows a distinct difference between sites (Figure 5.17). The first notable
feature of the data is the relative similarity between the plot locations. Top location returns
the maximum runoff and greatest volume of runoff. The bottom plot has the shortest lag
time in runoff generation, whereas the middle plot has the most muted response.
80
60
.c
E 40 E
~
~ 0 c ::J
0::: 20
0
\
\
'
-·-·-·-rap Middle
................... Bottom
12 0 1800 Time (s)
Figure 5.17 Runoffhydrographs for concave profile
The top plot shows a flashy response which closely mirrors the applied rainfall. This is
attributed to the low levels of underlying sediment and corresponding low infiltration rates.
The high slope angles at the top plot (top mean plot angle = 11.8° (middle mean plot angle
= 9.8°; bottom mean plot angle = 7.1°)) promote the rapid removal of standing water.
Exposed clasts standing proud of the surface cannot interlock and act to dam water flow
as efficiently as part submerged clasts. Variability in hydrological response also varies
down-slope. The hydrograph trace for the top and middle plots are arguably more variable
than that for the bottom plot location, again showing a more controlled and muted surface
hydrology at the base of the slope. The middle and bottom plots show similar behavior,
despite having quite different ground surface cover (middle Gcp = 36.8%; bottom Gcp = 40.8%) and slope angles (middle PltAngle = 9.4° ; bottom PltAngle = 7.1°). At the middle
plot high slope angles but low cover result in a very similar behavior as low slope angles
and high ground cover at the bottom plot Analysis of standardized means allows further
comparison between variables on the concave profile (Figure 5.18).
-227-

en
3
en ~2 .0 ro ·.::: ro >
~1 .!::::! "0 ..... ro "0 c JBO (f)
-1
3
~ 2 .0 ro ·.::: ro > "0 (!)
1 N '6 ..... ro "0 c 1B 0 (f)
-1
curv perc
Slope variables
-- pltagl _ . _. _ . upslangl
;· ...... "
--.. _ -~·=>:.;,:: ; ____ ... .. . .. ··········· " " " " "
Top Middle Bottom
smean sedmax stot
Sediment transfer variables
_____ .-·-· -·-·
Top Middle Bottom
3
en ~2 ro ·.::: ro >
"0 (!)
.!::::! "0 ..... ro "0 c
1B (f)0
3
en
~2 ro ·.::: ro >
- · - ·- · - rmean --- rmax
:.:,;·:·.::·:·wv--.. --.....-J:'Icc .• :
Top Middle
- ·- ·- · - tstart
"0
-~ 1 -i ·-·-·-·-·-·-"0 ..... ro
"0 c 1B 0 (f)
-1
Top Middle
Figure 5.18 Concave profile- standardized variables
................. rtot
Bottom
tmax
-~~-~·--·-·
Bottom

Chapter 5: Hydrological processes
Several key trends are apparent that can be explained in terms of the slope profile
morphology. Runoff variables are very similar for all plot locations. The most variable of
the slope morphology attributes on this profile up-slope angle. Up-slope angle appears to
have little direct effect on runoff variables down-slope, though again if anything, runoff
variables appear to reduce with increased up-slope angle at the middle plot location.
Sediment dynamics show a more complex picture. Maximum sediment load appears to
directly link with changes in up-slope angle. Increases in mean sediment yield and total
sediment yield also appear to correlate directly with relative increases in local mean plot
angle. Runoff and sediment timings appear to decrease down-slope, again possibly
suggesting a more muted response at the bottom slope locations.
5.6.3 Convex profile
Analysis of the runoff hydrographs of the convex profile again suggest the nature of
change in surface hydrology. The notable difference at this site is the behavior of the
middle plot. Here a highly variable and flashy hydrograph is apparent (Figure 5.19).
150
100 :c E E -:::::: 0 c :::J 50 0:::
0
0 600 1200 Time (s)
- ·- ·- · · Top
Middle
Bottom
1800
Figure 5.19 Runoff hydrographs for the convex slope profile
2400
In accordance with the pattern seen at the sites discussed thus far the top plot remains
responsive, in this case being the quickest to generate runoff. The relative degree of
variability in runoff appears to decrease down-slope, with the notable exception of the
central plot location. The middle plot location shows the highest levels of runoff and
accordingly the lowest levels of infiltration during simulated rainfall. The middle plot also
-229-

Chapter 5: Hydrological processes
shows the most rapid response to the onset of intense rainfall and conversely quickest
cessation of runoff after rainfall ends.
The middle plot on the convex slope is located effectively on the edge of a smooth convex
ridge. The up-slope area is an extensive plateau area with low gradients. The curvature of
the local slope is highly convex (Curv = -4.2), with an equally high up-slope angle (9.02°).
The resulting acceleration of large volumes of runoff collected on the plateau above
results in a highly active supply area. This contradicts the previously made suggestion that
the further down-slope, the more severe the modification of the surface by process
activity, and hence the more muted the hydrological response.
The nature of down-slope change observed brings into question what role the different
sections of the slope play. The slope bottom is commonly seen to act as a zone of
deposition, with extensive clast burial and surface organization. The crest of the slope
acts as a supply zone, whereby there are commonly little or no surface sediments. The
role of the central plot location varies with slope form and not just slope angle. In the case
of the straight slope the middle plot represents a transition between the top and the
bottom of the slope. On the concave profile the reducing slope angle and corresponding
change in ground surface cover means that this area is potentially dominated more by
deposition. On the convex slope the role of the middle location is reversed. The high slope
angles relative to the up-slope section of the slope mean that the middle slope location
acts as a supply zone. The surface has sediments transferred from above, in addition to
in-situ sediments, all of which are susceptible to removal due to the slope and potential
runoff volumes. The complexity of the variations in process action on the convex profile is
further reflected in the regression analysis. Again only a limited number of statistically
significant relationships are apparent (Table 5.6).
-230-

Chapter 5: Hydrological processes
Variable name Variable Description type
Runoff Sediment Timings I Percentage clast ground cover-Gcpplot Ul
Q) rainfall simulation plot(%) o:c - cu EdgeTotp1ot a.. "i:: Total edge length (m)
Rmax Rmean Rrot Smean Srot Smax Tstart T max cu >
Bplot Mean intermediate axis (m)
.__ Gcp 0.001 0.149 0.042 0.074 0.040 0.013 0.332 0.375 PltAngle Rainfall simulation plot angle (degrees)
(!) > Ul 0 0.433 0.289 0.242 0.323 0.279 0.179 0.002 0.452
Q) Mean angle of slope 10 m above plot 0 EdgeTot;m UpslpAngle :0
cu (degrees) -o -~ c 0.014 0.289 0.111 0.177 0.112 0.001 0.376 0.260 :l Cvb;m PltDist > Distance of plot from slope crest (m) 0 Q) .__ C) 0.401 0.779 0.456 0.657 0.500 0.102 0.227 0.015
c. B;m
0 Slope curvature (and of the slope 10 m Curv
en above the plot, minus the angle of the
UpslpAngle 0.154 0.006 0.025 0.026 0.033 0.097 0.137 0.569 slope 10 m below the plot)
(!) 0.106 0.000 0.007 0.006 0.011 0.077 0.178 0.551 Ul Percentage clast ground cover- image PltDist Gcp Q)
Cl.. :0 analysis plot(%) 0 cu U5 PltAngle 0.320 0.125 0.131 0.168 0.156 0.152 0.036 0.543 ·;::
cu Total edge length- image analysis plot Edge Tot >
Curv 0.523 0.592 0.408 0.567 0.459 0.178 0.043 0.232 Q; (m) >
CVB 0
Coefficient of variation ()
ro Fractal 0.071 0.009 0.001 0.000 0.002 0.061 0.212 0.528 "0 c
~ B ::l Mean intermediate length (m) Cl.. e
(/) Theissen 0.157 0.007 0.026 0.028 0.035 0.098 0.134 0.570 Ol Volume weighted mean intermediate VolwMb Ul
"Vi axis length (m) 0.141 0.575 0.281 0.422 0.299 0.018 0.378 0.071 >-
-o VolwMb ro (!) (/) c Area weighted mean intermediate axis
...... c AreawMb cu ~ cu
AreawMb 0.235 0.689 0.363 0.536 0.391 0.043 0.339 0.017 Q) length (m) .2' (!) (!) E
Ol cu Edge length weighted mean s:
EdgewMb 0.337 0.761 0.427 0.622 0.466 0.077 0.278 0.000 EdgewMb E - intermediate axis length (m)
Fractal Ul Box fractal dimension for sediment
C5Jl1 area :;::; ..0 cu cu a..·~
Standard deviation of number of Theissen
(/)CU >
vertices of Theissen polygon network
Table 5.6 Correlation statistics- convex profile

Chapter 5: Hydrological processes
The convex profile returns several significant correlations between Rmean. mean clast
intermediate diameter and its derivatives. There are also significant links between Smean
and T max· No significant correlations (a = 0.1) are apparent between sediment yields.
Surprisingly Rmax appears to be poorly related to all variables. Mean runoff does correlate
well with two variables {EdgewMb;m and B;m). lt is interesting the note the reversal of the
significance of the weighted mean values in this instance. Both convex and concave
profiles fail to return any significant relationships with either slope angle or distance
variables. The statistical significance of the samples collected could be questioned. The
regressions are based essentially on only three points in space. The methodology
discussed in Chapter 3, whereby the sample sites were carefully selected on key type
slope profiles and then the image analysis plot and three rainfall simulation plots were
statistically chosen as representative of that slope position. lt appears that the complexity
occurs as a result of slope form variation and not local scale heterogeneity in surface
character. The profiles can be considered individually to explain the nature of variation in
slope hydrology measured between slope positions.
Additional factors may influence the significance of the results generated. The slope
height and length (12.0 m and 46.1 m) are significantly less than on the straight site.
Therefore overall volumes of runoff generated due to the reduced up-slope catchment
area may result in less differentiation in form and process between the extremes of the
slope. Systematic variability may therefore be subjected more to the natural levels of
heterogeneity in surface behavior.
Aggregated statistics and linear regression are not sufficient to understand the variation in
surface hydrology observed between points. Standardized means again give a further
insight into the relationships between slope variables (Figure 5.20). The convex profile
presents a massive variation in profile curvature between plot locations. Additionally, a
significant variation in up-slope angle with distance down the slope profile is apparent.
The magnitude of the variation in up-slope angle may be reflected in a similar magnitude
of variation in surface hydrology. Runoff variables are all at a maximum at the central plot
location, supporting the claim that this area is strongly influenced by the up-slope
catchment and high local slope angles. Additionally, sediment yield variables appear to
mirror changes in up-slope angle. An increase in up-slope angle reduces the mean
sediment load, total sediment yield and to a lesser extent the mean maximum sediment
load. Time to runoff increases slightly at the middle plot location, and reduces at the slope
bottom. Time to maximum runoff increases down-slope.
-232-

3
(J) Q)
:0 2 CO ·;:: CO > "0 Q) N '6 ~
CO "0 c CO
Ci5 0
-1
(J) Q)
3
~ 2 ·;:: CO > "0 Q) N
'2 CO "0 c CO
Ci5 0
-1
............... curv ---- · perc
Top Middle
_ . _. _. pltagl -- upslangl
___ ... -··· .. ··
Bottom
3
(J) Q)
:0 2 CO
·;:: CO > "0
.~ "0 ~
CO "0 c
t3 0
-1
--- rmean
Top
--- smean ················ sedmax - ·- ·- .. stot (J) --- tstart
Sediment transfer variables
Top Middle Bottom
Q)
:03 CO
·;:: CO > "0 Q)
.!::! 2 'E
CO "0 c CO
w1
0
-1
Runoff timings
Top
Figure 5.20 Convex profile - standardized variables
................ rmax - ·- ·- · rtot
Middle Bottom
tmax
·-·-·-·-·-. _ ...............
Middle Bottom

Chapter 5: Hydrological processes
5.6.4 Combined influence of slope and ground cover on surface hydrology
The results generated from the analysis of individual plot locations reveal a complex
series of relationships between ground cover, slope and surface hydrology. The
interdependencies between variables change with the position of the plot on the slope
profile. The feedbacks between form and process further complicate the nature of down
slope change. In order to draw generalized conclusions with regards surface hydrology,
exploratory multiple regression was undertaken on the variables which have been
previously identified as influential. This approach yields significant results.
The variables which returned the most significant correlations during linear regression
analysis were used in the multiple regression. Models were generated to assess the
degree to which the variables of slope hydrology variables derived from the rainfall
simulation. The significance of the regression models was further enhanced by the
inclusion of the Pltdist variable, which potentially acts as a surrogate for other facets of the
slope geomorphology (Vincent and Sadah, 1995). The results of the multiple regress ions
are presented below in Table 5.7.
Hydrological Curvature CVB Theissen Pltdist constant Prob R2
variable >F
Runoffmean -2.102 2.518 46.385 -0.094 -75.384 0.000 0.763
:t:: 0 -2.184 2.632 11.198 -0.175 -7.892 0.000 0.591 c Runoffmax ::J 0:: -149.659 184.052 1784.413 -8.860 -2512.2 0.003 0.496
Totalrunoff
- Sed mean -0.003 0.003 0.046 0.000 -0.066 0.511 0.133 c
Q)
E Sedmax 0.001 -0.009 0.327 0.000 0.264 0.847 0.058
"0 Q) -0.060 0.061 -0.149 0.004 -0.282 0.839 0.060 (/) Sedtotal
(/) tstart -0.063 0.227 11.432 0.008 -8.571 0.113 0.278
Ol c 9.242 23.280 844.696 1.804 -700.78 0.001 0.553 .E t.nax i=
r:t. = 0.05 - bold, a = 0.1- italics
Table 5.7 Multiple regression analysis between slope, ground cover and surface hydrology variables
Three significant multiple regressions are apparent. lt is interesting to note the
hydrological indicators which correlate well with the applied regression. Sediment
dynamics all show poor and inadequate ~ values. The runoff variables all provide
promising regression, two of which are statistically significant. Using multiple regression
analysis it is apparent that mean levels of surface runoff can be statistically linked with
-234-

Chapter 5: Hydrological processes
confidence to slope, ground cover and an understanding of the spatial character of the
surface clast distribution. The ability to predict runoff generation from ground cover and
plot will allow a much greater understanding of surface dynamics and evolution.
Additionally, time to maximum runoff is well predicted by this model. Analysis of
heteroskedasticity, using a Cook-Weisberg test, returns a high probability (0.604),
suggesting the residuals are not heteroskedastic. A variance inflation test for collinearity
suggests a tolerance of 0.222, and residuals compare well with a normal distribution. This
apparent independence between variables has interesting implications for understanding
the interrelationships between variables. The importance of each variable is shown by a
significant reduction in the ,-2 value when any of the variables are removed from the model.
Combined multiple regression therefore returns greater levels of significance than a
consideration of single linear regression between runoff and slope form or ground cover
variables. This provides a valuable insight into slope hydrology in the Badia, which is now
discussed below.
5. 7 Discussion
The rainfall experimental undertaken in this study provides the first insight into slope
hydrology on the boulder mantled surfaces of the northeast Badia. Distinct spatial
variability between contiguous and disparate locations has been identified. Variability in
surface hydrology can be systematically linked with both conventional measures of ground
cover in addition to new types of data generated with the image analysis, in addition to
slope form. For example, in several instances the spatial data concerned with the relative
arrangement of surface clasts correlates with a greater degree of significance with
changes in surface hydrology than conventional measures of surface form. Several
interesting facets of the landscape have been identified.
The rainfall simulations show that splash detachment plays a critical role in dictating
sediment mobilization. Hydrological response to applied rainfall is increasingly muted with
distance down-slope. The variation in surface hydrology is a reflection of not just ground
cover, but a combined influence of slope and ground cover variables. Hydrology at a point
on the slope is dictated by not only the local conditions, for example ground cover, but
also by the situation of that plot within the context of the whole slope profile. The relative
position of a point on a profile links with both slope form and local slope angles. The
measures of plot distance down-slope and slope angles perform as variables indicative of
-235-

Chapter 5: Hydrological processes
altered surface form which is in turn dependant on slope control. The reworking of
sediments is suggested here as a critical control on this variation.
Sediment movement is linked directly with overland flow hydraulics and hence hydrology.
Increased runoff volumes act to increase the transport of surface sediments. Where flow
velocities reduce, deposition increases. lt has been shown that hydrology is influenced by
ground cover. lt is suggested that ground cover is influenced by surface hydrology, via the
reworking of sediments. Deposition of sediments to areas of ponded water is instigated by
lower slope angles and structured clast cover which acts to inhibit flow processes,
supported by disparities between ring infiltration and rainfall simulation experiments. The
ring infiltration indicates a decreasing level of infiltration down-slope. The rainfall
simulation similarly suggests a decreasing level of infiltration at the base of the slopes,
which can only in part be attributed to a slight increase in infiltration capacity. Slope base
hydrology is generally characterized by a greater level of standing water and ponding.
Factors that influence the occurrence of ponding include slope angle and the spatial
arrangement of surface clasts. Where polygonal networks in the clast surface
arrangement are apparent, they act to dam surface water, increasing ponding depths.
The processes identified at the scale of the rainfall simulation experiments are seen to be
of insufficient magnitude to modify the boulder surfaces over anything other than large
timescales. The experiments by their nature and extent are not sufficient to generate the
magnitude of process action to move clasts by direct transport action. The apparent
control of clast cover on surface hydrology, either directly or indirectly, suggests that flow
velocities would never reach the magnitude sufficient to transport clasts by entrainment,
and there is no evidence in the field of this. This adheres to Cooke's (1972) suggestion
that although overland flow and slope hydrology may maintain the character of
contemporary pavement surfaces, they cannot, by definition, be the process primarily
responsible for their initial formation (Vincent and Sadah, 1995). The development of the
surfaces is more complex than purely based hydraulic transport of surface clasts, or runoff
creep (Abrahams et al., 1994).
Surfaces appear to be well drained. There appears to be a good degree of connectivity
down the slope profile with evidence of lateral drainage into preferential flow paths. Flow
pathways are not common. To support this Hortonian overland flow tends to promote rill
and gully development (Horton, 1945), where flow becomes concentrated as dictated by
microtopographic variations. No rill or gully networks are apparent in the northeastern
Badia. Depth, velocity and routing of overland flow are controlled by the roughness of the
clastic surface. Movement of clasts and adjustment of the spatial nature of the surfaces by
-236-

Chapter 5: Hydrological processes
hydraulic action therefore appears unlikely. There is some evidence to suggest hydraulic
transport of clasts does occur in areas of concentrated overland flow but this does not
account for the uniform cross contour nature of down-slope change in ground cover
identified by the image analysis. An alternative method of surface adjustment and clast
transport is suggested.
Several features of the surface indicate that the nature of change in ground cover is as a
result of iterative process action. Complex interactions between multiple factors have all
been shown to influence slope hydrology. The nature of the interactions between slope,
surface and process varies. Slope, surface and process activity are all interdependent.
The nature of change of both surface form and process response is often found to be
gradual down-slope and continuous across the contours of the slope profile. The case for
iterative process action and surface adjustment is further supported by the nature of the
surfaces. The distribution of clasts on the surface is surprisingly continuous, given both
the absolute age and the range of ages of the surfaces. The massive nature of the surface
clasts suggests that they can rarely be moved by flow processes. Poesen ( 1987) identified
that clasts up to 0.1 m in diameter could be transported by concentrated overland flow
processes. Movement by shrink, swell and resettling of the underlying sediments, or even
ice needle action seems more feasible. The iterative modification of the surface is
suggested to be in part at least dictated by slope hydrology. Slope angle influences the
tendency for a lifted clast to resettle down-slope during a swell cycle. Ground cover
influences the degree to which clasts contact and lock together. Up-slope angle, down
slope distance and slope curvature, potentially influence the modification of the local
surface by dictating the intensity of process action at that point. Slope angle is a control on
more than just the rate of process action, as is conventionally used in slope hydrology.
Surface patterning could also be suggested to play an important role here. If a locked
structure acts to dam the flow of water, then infiltration may increase as a result of the
increased levels of standing ponding. If enhanced infiltration into the surface increases the
degree of shrink and swell and surface modification, then a patterned surface may tend to
self-perpetuate its own form, via a positive feedback. This may explain the visual
assessment that in many instances there either clear structure and pattern, or conversely
no pattern at all. This suggestion is not supported by the gradual down-slope increase in
surface organization identified by the image analysis (Chapter 4). Factors which positively
influence such modification, for example, those which encourage iterative clast
movement, can be seen to self perpetuate.
An example of this is the redistribution of coarse surface fragments by rain splash impact,
as was witnessed in many of the experiments undertaken. Exposed sediment areas
-237-

Chapter 5: Hydrological processes
undergo rainfall impact which acts to detach coarse surface fragments. A tendency for
these fragments to relocate in the shelter zones around the sediment contact perimeter of
clast was noted, especially where surface clasts remain exposed from the sediment
surface. Analysis of wetting fronts relative to coarse sediment surfaces and exposed
clasts suggest a greater degree of infiltration into the surface; a factor that is supported by
the increased infiltration rates generated by the rainfall simulation. With increased
infiltration in the subsurface sediment, the greater the degree of clay swell and hence the
greater the magnitude of clast uplift. Clasts then settle with gravity, potentially fractionally
moving down-slope and raising themselves though the sediments, affording more shelter
for the accumulation of surface fines. Clast settling is a gravity driven process, an
acceleration force and hence undergoes a geometric rate of change. Any variability in
surface behavior is therefore exacerbated though surface form adjustment.
The changes in surface character identified by the image analysis are not all focused on
the movement of clasts. Evidence is also presented that shows increasing rounding and
smoothing of clast texture down-slope. The nature of clast shape alternation can be
explained by the assessment of the surface hydrology. Increased volumes of water at
slope base increases the down-slope potential for attrition and abrasion by entrained
sediments. Clast sorting was shown to relate well with slope angle. Here the influence of
up-slope angles is suggested to influence local runoff velocities and hence preferential
removal of the finer clast from the surface.
5.8 Conclusions
Several conclusions can be drawn with regards the hydrological behavior of the surfaces
of the Badia.
1. Surfaces appear to be active. Links between surface form, slope and process
suggest a close synergy between variables showing that the surface activity
adjusts and responds to present day process action.
2. Surface hydrology is highly variable between locations but can be linked to slope
form and ground cover.
3. Understanding the hydrology of whole slope profiles appears to be important. Any
generalized understanding of slope hydrology must take into account the degree
of variability in slope hydrology as influenced by ground cover and slope form.
-238-

Chapter 5: Hydrological processes
5. Slash detachment is a dominant control on sediment entrainment and
mobilization.
6. An assessment of the spatial nature of surface clast distribution yields significant
correlations with surface hydrology. Surface organization is therefore a vital
control and effect on slope hydrology. In turn, the presence of surface
organization appears to be systematically linked to slope processes.
7. Sediment yields, under even high rainfall intensities, are low. Significant and rapid
re-deposition of large volumes of sediment only occurs as a result of hydraulic
detachment and deformation of the sediments in areas of concentrated overland
flow.
8. The presence of surface clasts dictates the nature of slope hydrology.
9. The local hydrological response of the surfaces decreases down-slope. Process
intensity, in terms of up-slope catchment area and presumably increased flow
depths and velocities, means that process action is greatest towards to toe of
slope profiles. Process modifies form. The most significantly modified slope
locations at the base of the slope are less responsive, suggesting a negative
feedback loop, acting to diminish or mute the influence of flow processes.
10. The slopes of the Badia are not necessarily dominated by high-magnitude low
frequency events, but may be more sensitive to the iterative action of high
frequency low-magnitude variations than previously suggested.
The results presented above give a detailed insight into slope hydrology. The dominant
processes which act to modify the surfaces and the ground cover characteristics may not
be hydraulic. Direct measurement of iterative processes over the time scales involved in
the Badia is not feasible. In order to understand the dynamics of surface modification a
different approach is required. The next chapter builds on the data generated from the
characterization of ground surface variation and the appraisal of surface hydrology
presented in this chapter and examines the suitability of considering the surfaces to be
dictated by iterative, alternation processes.
-239-

Chapter 6: Modelling the development of coarse clastic surfaces in arid environments
-240-

Chapter 6: Modelling
Chapter 6: Modelling the development of coarse clastic surfaces in arid environments
6.1 Aims and objectives
This chapter aims to simulate the spatial modification of coarse clastic desert surfaces as
a self-organizing system. In doing so, an iterative mechanism of clast surface modification
is tested. Clast surface modification and movement is clearly apparent in the northeastern
Badia but an understanding of nature of surface clast movement is limited due to the rates
and scales of modification of contemporary surface forms. A computer simulation
approach is presented in this chapter which aims to build upon the findings of the surface
characterization and process studies. The purpose of the model is to test ideas of self
organization as a method of understanding surface dynamics in the northeastern Badia.
The first part of the chapter outlines the nature of characteristics of the surface which
indicate the nature of surface dynamics in the northeastern Badia, in the light of evidence
presented in Chapters 4 and 5. The section highlights the features of the surface which
lend themselves to a modelling approach to explore the nature surface dynamics. A
discussion of similar coarse clastic systems in geomorphology follows, providing a
discussion of the methods employed in modelling the dynamics of such systems. An
appropriate modelling approach is then developed. The nature of the surfaces lends
themselves to a cellular modelling approach. The model is used in a parametric study,
which assesses the sensitivity of the model to variation alterations in starting conditions
and controlling variables. The variables used in the parametric study are selected upon
their ability to represent specific geomorphological variations noted in the northeastern
Badia in this thesis. The model output is compared to geomorphological phenomena
observed in the northeastern Badia and raises several key questions for understanding
the geomorphological evolution of the surfaces.
6.2 Background
The surface features of the northeastern Badia are indicative of the processes which have
lead to their formation. Significant relationships have been identified between surface
processes and surface forms (Chapter 5). The apparent organization that the surfaces
exhibit is a peculiar geomorphological phenomenon which has not been previously been
documented. Mechanisms of surface modification appear to be complex. There is both a
modification of the nature of the individual clasts, in addition to the alteration of the spatial
arrangement of surface clasts. Subtle links between form, slope and process have been
-241 -

Chapter 6: Modelling
detailed in many aspects of contemporary surface character. The action of surface
processes appears closely linked to variation in ground surface form and slope. In some
instances the nature of surface form remains vexing. Surfaces with similar ground cover,
slope and clast form commonly exhibit different spatial arrangements of clasts. Some form
of spatial modification or reorganization of the surface is therefore happening.
Geomorphologically, the departure of the arrangement of surface clasts from a completely
random distribution holds a significant influence over flow routing, hydraulics and
hydrology (Abrahams and Parsons, 1991; Jean et al., 1999). In a theoretical context, the
presence and apparent systematic variation of clast surface organization, patterning or
structure is an indicative characteristic of a self-organizing system (SOS) (Phillips, 1999).
If self-organizing systems are an appropriate method of understanding the surfaces of the
northeastern Badia, then the results of this model of surface dynamics has many
implications for the contemporary geomorphology.
In the light of the results discussed in Chapter 4 and 5, a greater understanding of the
processes in action and the processes responsible for the formation of the clastic surfaces
of the northeastern Badia can be made, which helps in the design of a modelling
approach. Subtle variations in land surface configuration and process action on the slopes
of the northeastern Badia have been shown both in this thesis and elsewhere (AIIison et
al., 2000). A close symbiosis between form and process is evident. The nature of
interactions between clasts is complex and varies between locations, with no obvious
overriding control of one individual or single set of variables, commonly manifested
through non-linear behaviour. By their nature the controls on surface form and process
interact. They influence and are influenced by each other. The apparent control afforded
by the clast surface on hydrology suggests that the mechanism of clast movement is likely
to be a result of iterative small scale movements, rather than large scale displacements
during catastrophic events. Given the age of the surfaces, the small scale movements
may only occur after what in the present context is a high-magnitude event but over the
timeframe of whole surface development these events can only be considered a small
scale iterative change. Constant climatic forcing is unlikely to have been the case in this
region (Chapter 2), so the temporal change in surface character may have been more
complex.
Several potential movement mechanisms of clasts exist, based upon field observations
(Chapter 2). The nature of the movement of surface clasts is controlled by features of the
surface which can be approximated to only a few factors. The features can be modelled
without a significant degree of over simplification. The surfaces of the northeastern Badia
also exhibit some surprising and peculiar features. Clast cover has been shown to have a
-242-

Chapter 6: Modelling
non-random distribution, often demonstrated through the presence of structures and
patterns on the surface (Plate 6.1 ). The features can be thought of as locking structures,
governed by clasts coming into contact and jamming into fixed positions. lt is this type of
features which is suggested to be indicative of a SOS.
Plate 6.1 A non-random clast arrangement
The assessment of the northeastern Badia landscape in this study has highlighted several
parallels between the behaviour of this environment and that of systems which are
believed to show a tendency to self-organize. This includes a non-linear relationship
between slope, surface and hydrological variables (dynamics), the presence of structure
or pattern (emergence) and evidence of negative feedback mechanisms which modify
form I process interactions. The suggestion of a homeostatic relationship between form
and process has been raised in the context of the northeastern Badia (Higgitt and Allison,
1999a) and in the wider and more general context of desert pavements (Wainwright et al.,
1999). The nature and behaviour of the northeastern Badia slopes is complex. Multiple
interdependent factors appear to dictate the form and behaviour of the surfaces, which
through a reductionist approach, cannot easily be understood. Statistically significant
relationships have been identified in this thesis but the degree of variability and
unexplained deviation persists between both locations and the methods of surface
characterization. The presence of pattern and the variable nature of surface organization
have shown more significant relationships between form and process than conventional
measures of surface character in several instances. The combination of these results with
-243-

Chapter 6: Modelling
the observation of spatial organization suggests that considering the surface as a SOS
may yield a more detailed understanding of surface form variation, which is beyond
explanation using a simple reductionist approach. The comparison of the model output to
the slopes of the northeastern Badia and other similar geomorphological situations, allows
further discussion of self-organizing systems in geomorphology.
5.3 Modelled structures on clastic surfaces
Regular and geometric arrangements of surface stones, similar in appearance to those in
the northeastern Badia, are common features of many unvegetated alpine and polar
hillslopes (Werner and Hallet, 1993). The principle feature of the landforms is the marked
order which contrasts with the apparent disorder of the natural world. These surfaces are
considered sorted due to the characteristic textural distinction between the surface stones
and finer soils or sediments beneath. The presence of pattern or structure has been
observed in several environments, many beyond the periglacial environment
(Schweinfurth, 1964; Rohdenburg and Walkther, 1968; Rolshoven, 1976; Washburn,
1979; Wilson and Clark, 1991 ). The diversity of environments in which structured features
are found reflects a diversity of processes responsible for their formation (Ahnert, 1994).
For example, Ahnert cites features at the hot springs at Waiotapu on the North Island of
New Zealand, where the periglacial processes responsible for the formation of sorted
alpine stripes are not in action. With such diversity in forcing mechanisms, the consistency
in the resultant form suggests that the actual process that instigates movement is
irrelevant to the final form. Alternatively, it is the resulting movement and interaction of the
systems components that is of far greater importance in dictating the final form. There is
also evidence to suggest that pattern forms are dynamic, whereby form changes on a
seasonal basis. Structure may therefore be more accentuated at certain times of the year.
If structure is sensitive to climate as suggested, then structure may also alter with
variations in process action, inferred by topography, for example. Topographic controls
are known to influence the form of periglacial stripes (Hall, 1998). Pattern is therefore not
a discrete entity, but rather a continuum between structure and disorder (Ahnert, 1994).
Several computer based simulations of sedimentary structures have been developed
(Naden, 1987; Anderson, 1990; Werner and Fink, 1993; Werner and Hallet, 1993; Ahnert,
1994; Tribe and Church, 1999). The simulations aim to study the development of natural
structure or surface modification, as a result of process action that dictates the frequency
and nature of clast interactions. By simulating boulder pattern as a series of stochastic
movements, the development of surface forms can be assessed.
-244-

Chapter 6: Modelling
Ahnert (1994) developed a random walk model, such that the probability of each stone
moving location is determined by the status of neigh boring cells. Ahnert ( 1994) bases his
model on locking rather than friction. Once a clast is in locked by other clasts its position is
static and cannot be moved. A clast is considered locked when neighboured by two clasts
that when combined form either a straight line or an obtuse angle. Ahnert's model is
based on a surface with negligible gradient and hence the direction of clast movement is
random. Ahnert ( 1994) found that the nature of the initial distribution of clasts is not
important as a control over the evolution of the surface. Cover dictated the nature of
pattern formation and the speed with which the surface established what is considered to
be a stable state. His model does not consider the influence of variable clast size and the
variable frictions and movements associated. The model is successful in replicating the
structures which the authors observed in the field, but as Tribe and Church (1999) point
out, there is currently no rigorous measure of similarity between two-dimensional patterns.
Tribe and Church (1999) adopt a more complex approach to simulating gravel bedforms,
again using an iterative kinematic simulation of object movement. Bedload clasts are
represented by a population of rigid circular disks of various sizes which undergo elastic
collisions without transferring momentum, such that there is no knock-on effect between
clasts. Clasts again lock into position, here dictated by the angle with which they contact
immobile clasts. Clasts can be deflected or rotated around immobile clasts which simulate
processes of entrainment and deposition in fluvial systems closely. A nature of clast
movement which considers momentum transfer is perhaps not suitable to boulder mantled
surfaces, where movement is suggested to be iterative. Tribe and Church's (1999) model
successfully replicated the formation of stone lines and clusters, whose morphology could
be related to percentage ground cover transport direction relative to flow.
Several models have examined the development of periglacial sorted networks. Although
similar in appearance to the features seen in the Badia, the features are quite different.
Periglacial stripes form as a result of cryoturbation, powered by freeze thaw cycling in the
sub-arctic environment. The sorting is more of a product of vertical convective
displacement rather than a predominantly lateral lock of clasts. An example is the three
dimensional model proposed by Kressler et al. (2001 ), which uses ice crystal growth,
thawing, soil compression, desiccation and relaxation of slope morphology and vertical
sorting via illuviation. The model is successful in producing sorted circles in three
dimensions. Further examples of models to simulate regularity in surface forms have
been developed, many based on a cellular automata approach. They include studies of
banded vegetation patterns (Dunkerley, 1997), rainfall runoff modelling (Puigdefabregas
-245-

Chapter 6: Modelling
et al., 1998) and rill initiation and growth (Favis-Mortlock et al., 2000). Despite the
limitations of a modelling approach, these studies all provide alternative explanations or
reiterate field and laboratory studies of complex process action.
6.4 Theoretical background to selfaorganizing systems in geomorphology
lt is necessary to give a theoretical background to self-organizing systems and then
expand the considerations to the geomorphology and earth surface systems. Self
organization as a concept has evolved considerably. As a theory applied to
geomorphological situations there are several factors which limit its application. The most
pertinent of these are first, the lack of quantitative validation to the field, and second, a
dissatisfaction with the precise definitions of self-organization. Some to suggest research
into chaos, fractals and self-organization has passed its peak (Baas, in press), but its
development and application continues. Due to the evolving nature of its use,
inconsistencies exist in the definitions of what exactly constitutes a self-organizing system.
Several comprehensive reviews of self-organization applied to earth surface systems
(Phillips, 1999), the recognition of the emergent properties of landforms (Harrison, 2001)
and self-organized criticality (Bak et al., 1988), give greater historical and theoretical depth
than is necessary here. The use of self-organization within geomorphology has been
directly adopted from other scientific disciplines. lt is these disciplines that are used as
basis for description of the background and definition of self-organizing systems;
"[ ... ] a self organizing system is a system which tends to improve its performance
in the course of time by making its elements better organized for achieving a goal.
This includes the special case in which the goal is to achieve a high degree of
complexity (order) of relevant entities from a low degree of organization (disorder,
chaos)." (Kiir, 1991 page 156).
Self-organization refers to the spontaneous formation of organized structure or pattern
from initially random conditions, a process termed emergence (Harrison, 2001 ). The
emergence of structure has often been attributed to an equalization of entropy across the
landscape (Phillips, 1999). A self-organizing system will alter its structure depending on its
experiences and its environment (Farley and Clark, 1954). Several similarities are
apparent between many physical and biological systems, which have intelligence and
memory (Phillips, 1999). A system is a collection of interacting parts that function as a
whole. lt is distinguishable from its surroundings, with recognizable boundaries. A system
has properties that are emergent. They are not contained within any of the individual
parts. They exist at a higher level of description. Self-organizing systems are considered
adaptive and dynamic. Dynamic systems are composed of a large number of elements
-246-

Chapter 6: Modelling
and thus the system occupies a very large state space. The elements interact, commonly
termed synergetics (Haken, 1977). The size of the state space, the total number of
arrangements or combinations available to the system, is considered to increase in
dimension in accordance with the number of variables (Lucas, 2001 ). Self-organizing
systems evolve to occupy a smaller volume of their state space tending towards an
attractor, which is interpreted as a form of self-organization. The presence of an attractor
in a system is only identified under conditions whereby energy is dissipated, through for
example friction. Dissipative structures therefore only exist when there is a constant flux of
energy through a system. In the case of geomorphic systems, flux maybe periodic as
dictated by geomorphic events, but is still considered constant.
Self-organizing systems are not in equilibrium, but are dynamic. An attractor maybe
chaotic, under which condition the emergent behaviour is often too complex to
understand, or it may be confined to a small region of the state space. Under this
condition order and structure of a consistent nature will form from initially random
conditions. Formal dynamic systems are commonly used to understand real dynamic
systems, for example networks of chemical reactions and non-equilibrium
thermodynamics behaviour (Nicolis and Prigogine, 1989). The conclusion from much work
with self-organizing systems is that there is a tendency for the spontaneous formation of
complex physical patterns in nature (Kauffman, 1993). The process of self-organization is
commonly interpreted as the formation of order from chaos. The evolution to order is pre
constrained by the position of the systems attractors in state space and unless the
parameters of a system are changed, a system cannot deviate significantly from its own
attractor landscape. Evolution is constrained in a self-organizing system (lnkpen and
Petley, 2001) a suggestion which runs parallel to Brunsden's (2001) suggestion of
landscape resistance, dictated by the system structure, its history and the way in which a
system filters energy movement across the landscape.
lt has been long established in ecology that the nature of spatial pattern directly influences
the action of processes (Wat, 194 7, Huffaker, 1958), so the extension of this to earth
surface systems appears logical. Self-organizing earth surface systems exhibit unique
attributes. Self-organization involves interactions which are commonly manifested as
reversible, two way processes. In earth surface systems one way processes are of
importance. Gravity driven flux of energy and mass, for example the down-slope migration
of sediment due to toppling or weathering processes, further act to complicate the nature
of a systems dynamics and make their emergent forms recognizable. The features of
earth surface systems do not detract from the suggestion that they are undergoing self
organizing process.
-247-

Chapter 6: Modelling
Given the inherent diversity and complexity of natural systems, a series of characteristics
of self-organizing systems can be suggested, though still no definitive laws are available.
The system must be considered to be thermodynamicly open, in that it exchanges energy
with its environment. The system must exhibit dynamic behaviour such that it is
undergoing constant or iterative change. An example of this is the import of usable
energy, for example an increase in potential by heave processes instigated by the action
of hydrology and the export of entropy back to the system, although parallels between the
laws of thermodynamics and the behaviour of physical systems is not supported by all
(Shalizi, 2001 ).
A self-organizing system undergoes inherent local interactions whereby neighboring
objects and systems directly influence each other. Self-organizing systems exhibit non
linear dynamics as a result of the action of positive and negative feedback loops.
Feedback can exist between components and between the components and the
structures that emerge. A self-organized system must contain many parts as the
behaviour of the system is determined by the interactions, connections and feedback
loops between the systems parts. Emergence, arguably the most nebulous concept of
self-organizing systems (Crutchfield, 1994), is based on the suggestion that the whole
system is greater than the sum of the parts. The effects of self-organization are multi
scale. Small scale interactions can result in large scale emergent structures which then in
turn act to modify the nature of the small scale interactions. Prigogine ( 1984) suggests
that large scale emergence is a way for a system to dissipate micro-scale entropy.
Macroscopic emergent order maybe indicative of iterative small scale decreases in
entropy.
Even under the conditions self-organization may still not occur. The conditions that are
sufficient for self-organized behaviour and the necessity of these conditions still remains
unknown (Milne, 1996). Accordingly, the effects and magnitude of self-organization
remains equally vexing. Dissatisfaction with self-organization often stems from both the
weak definitions and the difficulty of quantifying what is in essence a qualitative outcome.
Various methods including entropy, dimensionality, computational mechanics, information
theory and language theory have all been suggested as methods of describing emergent
structure. No one satisfactory method has as yet prevailed.
Self-organization as a method of understanding complex systems has several benefits.
Simplicity is critical. The individual components of a system are simple. Complexity only
emerges when multiple components interact, but they do this under highly controlled and
-248-

Chapter 6: Modelling
definable conditions. Basing the behaviour of a system's components on physically based
principles is relatively easy and justifiable. Self-organizing systems are in essence
reliable. Even though their behaviour is complex, under the same conditions a system will
consistently generate a similar type of complex behaviour. As the emergent behaviour of
the system is the product of many individuals, the dynamics of a system do not heavily
depend upon one individual component. In chaotic systems, the converse applies. A small
perturbation can result in massive divergence in a systems behaviour. Finally, self
organizing systems are adaptive. A system may experience variations in external forcing
but adapt its character accordingly.
Phillips (1999) suggests that self-organizing systems are commonplace in geomorphology
and their use as a mechanism of understanding is by no means new (Haff and Werner,
1996). Some suggest that a landscape or landforms exhibit features that are greater than
the sum of its parts. A reductionist approach will, if this holds true, struggle to explain the
full complexity of landscape (Phillips, 1992). An example of emergent structure in
geomorphology is periglacial sorted nets. Their form, structure and morphology cannot be
discerned from a minute study of the individual parts, but rather from the interactions
between the parts (Hallet, 1987). Other examples include rill initiation (Favis-Mortlock et
at, 2000), patterned ground (Nicholson, 1976), cuspate beach forms (Werner and Fink,
1993) sand ripples and gravel bed river forms (Tribe and Church, 1999), particle sorting
due to vehicles (Perez, 1991 ). Emergent properties are in essence qualitative structures
arising from quantitative processes (Harrison, 2001 ). lt is the description of these
emergent properties in geomorphology that some suggest has the potential to explain
landscape at the scale of the landform, in such a way that a reductionist approach could
never achieve (Harrison, 2001 ). The local rules that determine a systems dynamics are
easily quantifiable but emergent structure is more subjective as it cannot be explicitly
described in physical terms.
Many of the features of self-organizing systems theory appear to have significant parallels
with the form and potential dynamics of the slopes of the Badia. Under the hypothesis that
the slopes of the northeastern Badia behave as a self-organizing system the following
points can be suggested.
1. The individual clasts are the components of a larger system. The movement of
each clast, under whatever mechanism, be it hydraulic or an iterative heave
process, is determined firstly by the components specific character and secondly
by the nature and character of its neighboring clasts.
-249-

Chapter 6: Modelling
2. Emergent forms are apparent and evidence of modification of the surface has
been described. The image analysis of the spatial character of the surfaces has
highlighted that the distribution of clasts is non-random. Evidence of clear spatial
structure has been witnessed and quantified. Pattern appears to vary with slope
and surface cover variables but behaviour appears complex. Results generated
from the image analysis and surface hydrology experiment do not appear sufficient
to explain the presence and magnitude of surface organization. The explanation of
this patterning appears to be at a higher level of description. Organization is also
apparent in the diverse spatial nature of surface cover. Evidence of modification of
the surface by process action and conversely the action of surface form modifying
process action has been illustrated above. This is potentially a manifestation of
multi-scale emergence. Evidence of homeostasis acting between form and
process is suggested (Higgitt and Allison, 1999a).
3. The surfaces appear dynamic. The present geomorphology of the Badia has
shown subtle but significant linkages between contemporary surface character,
contemporary process and slope form. A symbiotic link between the contemporary
form and process in the context of the historical condition of the slope is
suggested.
4. Surfaces appear adaptive. The ubiquitous clast cover in the northeastern Badia is
surprisingly continuous despite the massive range of surface ages. The suggestion
raised from this is that the surfaces of varying ages have undergone a variety of
external forcing regimes but the surface has maintained a surprisingly consistent
form, which is still maintained today. Within this ubiquitous clast cover there are
subtle variations which are seen to link systematically with slope process action.
There are very few areas in the northeastern Badia where the surfaces are
substantially different. Virtually all areas of the ground surface support a clastic
mantle of some form. The implication is again that surfaces adapt and adjust to
perturbations in their environment rather than undergo a catastrophic nature of
change. The nature of variation identified in this thesis supports this suggestion.
With these parallels, SOS presents an attractive model on which to base an
understanding of the slopes of the Badia. Process action in the Badia in virtually
impossible to understand at the temporal scales involved to witness significant degrees of
surface modification. The control over the simple rules that dictate the action and
interaction of the system components can potentially be based on the findings made from
the image analysis and surface hydrology experiments. Suitable tools are available, such
-250-

Chapter 6: Modelling
as cellular automata, which have the ability to examine the nature of interactions and
dynamics of such a system, under highly controlled modelling conditions.
6.5 Model design
Adopting a cellular automata modelling approach presents several advantages for the
study of the dynamics and modification of the surfaces of the northeast Jordan Badia.
Cellular automata are mathematical models of systems which are composed of many
simple, individually acting parts, and are hence considered synergetic (Wolfram, 1984 ). A
cellular automata is an array of discrete automata, or cells. Complex behaviour has been
found to arise from the interaction of simple cells and as a result a cellular automata is
considered to act as dynamic system (Bak, 1997). Cellular automata are considered
totalistic. The state of a component within the array is derived as a product of the states of
the neighboring components. Generic properties are commonly apparent as independent
from the precise details of the cellular automata construction. The similarities between the
behaviour of self-organizing systems and the fundamentals of cellular automata are
numerous. Their multiple component composition and structure results in complexity,
order and random forms, as is commonly witnessed in self-organizing systems. Cellular
automata are adaptive to their conditions, changing behaviour and their final configuration
in response to minor perturbations in interaction behaviour. Contrary to self-organization,
cellular automata are well understood. Since their introduction in the late 1940s by von
Nuemann (Tofolli, 1996), cellular automata have been widely applied (Wolfram, 1984).
The attraction of highly simplistic rules applied to a random starting condition applied to
many situations. A modelling approach using cellular automata allows precise controls
over both the initial conditions, the interaction rules and is also capable of generating
statistics with regards organization, optimization and pattern as the model evolves.
3.5.1 Construction of the cellular automata model
As part of this research cellular automata model was developed that was designed to
simulate the surfaces of the northeastern Badia. The modelling approach is a preliminary
attempt to simulate the processes in action on the Badia surfaces. The variation of the
rules which dictate the behaviour of the model can be altered in accordance with the
nature of surface variations observed in the field.
The model construction is based on a simplification of the northeastern Badia surfaces.
The surfaces are reduced to a two dimensional surface, the plane of which lies parallel to
-251 -

Chapter 6: Modelling
the ground surface. The model surface is comprised of a matrix of clasts and sediment.
The resulting binary image or matrix of square cells can have one of two states: clast or
sediment. The surface is represented as a lattice or array, comprised of square cells. The
matrix operates over a slope whereby objects can only move down-slope. Three clast
sizes are used in the model, all of which are square cohesive blocks of cells. These are
small, 1 cell width, medium, 2 cells wide and large clasts, 3 cells wide. Probability of
movement of an individual clast is proportional to both the specific properties of the clasts
and also those of its neighbours. The conditions form the basis of the rules which dictate
the movement of clasts across the surface.
Clast interactions are dictated by a series of conditions or rules, all of which are pre
definable. The state of the rules remains consistent throughout the model simulation. The
rule set was developed to be analogous to the processes dictating the potential iterative
movement of surface clasts in the northeastern Badia observed in this study. Movement is
restricted by friction between clasts (f(clast)). Friction acts horizontally across slope and
also up-slope between diagonal cells. Clast size influences the probability of that clast
moving (p(clast)), which again has a direct physical analogue. The sum of the
probabilities of movement minus the frictions acting between the clasts (p(move)),
dictates whether a clast will move (Table 2). The controls on model behaviour are
considered as surrogate values for many of the variations which naturally occur in the
field. In the model, eleven parameters of the surface and clast interactions can be
controlled and varied (Table 6.1 ).
-252-

Variable name
Matsize
Totcl
small rocks
Medium rocks
IT max
Sangle
p(small) }
p(medium)
p(large)
Diagonal friction (fd;a9)
Chapter 6: Modelling
Property
Width of the cellular automata array- the matrix is
square
Total number of clasts which defines cover
percentage when combined with Matsize
Defines clast size sorting. The number of large clasts
is calculated when combined with Totcl
Number of iteration steps
Angle of slope -defined as a probability of
Range (probability)
10- 1000
Matsize I 1
Matsize I 4
10 - infinity
movement between 0 and 1. A higher slope angle is 0- 1
described as a higher probability of movement
Probability of clast moving p(clast)
Friction between two diagonal cells, up
slope
Friction between a cell and two
0-1
0-1
0-1
0- 1
0- 1 Double diagonal friction (Dfddiag) diagonal up-slope cells
f( clast)
Lateral friction (f1a) Friction across slope between two cells 0-1
p(move) = p(clast)- f(clast)
Table 6.1 Model parameters and variables
The variables outlined in Table 6.1 influence the nature and speed of interactions between
clasts. The probabilities of clasts moving are determined by the condition of the
neighbouring cells. The outcome of an interaction between occupied cells, or clasts, is
totalistic, in that it is determined by the product of the frictions between clasts and the
probabilities of each individual clast moving. All feasible arrangements and types of
interaction are detailed in Table 6.2.
-253-

Table 6.2 Clast interaction outcomes
where :
1 = cell occupied by clast
0 =cell empty
A clast movement is always by 1 cell only
There is no up-slope interaction between cells
p(move) = p(clast) - f(clast)
Situation
...... c (1)
E (1) > 0 E (1) (1) '-
LL
c 0
:;:::; (.)
~ ro c 0 O'l C'tl
0
Before Condition
If p(clast) > f(clast) and S = 0, then clast
moves
If p(clast) < f(clast) and S = 1, then no
movement
If p(clast) < f(clast) and S = 0 or 1 , then
no movement
If p(clast) > f(clast) and S = 0, then clast
moves
Chapter 6: Modell ing
NW N NE
w E
SW s SE
After
- 254 -

c 0 :z (.)
~
0> c 0>
"'0 ·c []]
If p(clast) < f(clast) and S = 0 or 1, then
no movement
If p(clast) > f(clast) and S = 0, then clast
moves
If p(clast) < f(clast) and S = 0 or 1, then
no movement
If p(clast) > f(clast) and S = 0, then clast
moves
Chapter 6: Modelling
An example of the calculation of the probabilities of clast movement is given in Table 6.3.
-255-

Chapter 6: Modelling
Table 6.3 Example of run set-up conditions and outcomes
Parameter
Matsize
Totcl
small rocks
Medium rocks
IT max
Sangle
p(small)
p(medium)
p(large)
Diagonal friction (fd;a9)
Double diagonal friction (Dfddiag)
Lateral friction (fla)
} CIS
p(clast)
f(clast)
Value (Run X in coefficient of variation tests)
125
1547
773
516
4000
0.5
0.5
0.25
0.125
0.25
0.125
0.25
Situation Summary of situation Probability of Lock
= p(small) x Sangle p(move) = 0.25
= p(small) x flat x Sangle p(move) = 0.0625
= p(small) x fdiag x Sangle p(move) = 0.0.625
-256-

= p(small) x Dfddiag x Sang le
= p(small) x 2(flat) x Sangle
Chapter 6: Modelling
p(move) = 0.03125
p(move) = 0.03125
The rules defined above result in the following model assumptions which should be borne
in mind when considering the results and their implications for relating the model output to
the northeastern Badia.
e Clasts do not knock-on. Collisions are elastic and momentum is not transferred.
This is thought to be the most representative of the northeastern Badia.
Movements are iterative and small scale, momentum transfer resulting in
sequential movement of clasts is therefore limited.
• Clasts are not deflected. The nature of movement in the northeastern Badia is
suggested to iterative and small scale. Deflection is more likely to occur in a
system where the clasts have more significant velocities and momentum.
• Clasts cannot move around or rotate around other clasts. If an object is stationary,
then clasts in the matrix column above can only stack up and not roll around the
static clast.
• The underlying sediment surface is uniform in form and character. There is no
consideration of microtopography and the sediment surface is assumed to have a
uniform gradient.
o The initial distribution of clasts is randomly generated but a given cover
percentage can be defined by specifying the number of clasts of various sizes on
the surface.
-257-

Chapter 6: Modelling
3.5.2 Model output
Three outputs from the model were derived. First, images of each time iteration in the
model were exported and saved. These are in the form of a binary data file that can be
displayed as an image (.bmp) file. Various analyses can be undertaken on the image,
including box fractal dimension to calculate the image form variation between model
conditions. The second and third outputs from the model were measures of the model
behaviour, Lock and Org, form the main quantitative output from the model.
• Lock
Lock is the mean probability of all clasts in the matrix moving during the next
iteration. lt is calculated as the product of probability of the individual clasts
moving and the frictions between neighbouring clasts, as defined above. Lock
provides a measure of surface stability and describes the tendency of clasts to
move.
• Org
Org is the mean number of neighbouring cells which are occupied by other
clasts, calculated for all clasts in the array after every iterative loop of the
model. The mean is calculated from the cells directly above, below, left or right
of the clast in question. The value of Org is therefore larger for larger clast
sizes. Org provides a measure of the condition of neighbouring cells and is
therefore a measure of surface structure, or organization.
Finally time or iterations are recorded incrementally, such that temporal changes in
system dynamics can be assessed.
3.5.3 Model code and function
A flow diagram of model behaviour was developed prior to model construction (Table 6.4).
The model begins by constructing a random distribution of clast cells within the matrix, to
a size cover percentage and clast size distribution. The model then runs an iterative query
loop which equates the probabilities of each clast moving. The loop results in either a
down-slope movement or results in the clasts remaining fixed in position until the next
iteration query loop. The calculation of probabilities is based entirely on the run-setup
previously defined prior to the start of the model. The variables controlling all parameters
of the experiment are held in an instruction file (rundata.txt). Model output is in the form of
text files, which are batch processed using Visual Basic Macros embedded in the model,
-258-

Chapter 6: Modelling
and output into Microsoft Excel. The speed of the model is dictated by both the number of
clasts on the matrix, the size of the matrix and the processing speed of the computer.
Sang le
p(clast)
f(clast)
Matsize
Tot cl
NO
STOP
Input: Sangle, p(clast), f (clast), Matsize, Totcl, ClS, ITI'ax
Randomly select clast (cln)
Calculate p(clast) and f(clast)
Move clast down-slope 1 cell
Calculate STAB, PAT and PIC
Table 6.4 Flow diagram of model operation
Slope angle (fraction)
Probability of clast moving, relative to size
Friction on each clast, due to Orghood conditions
Matrix width and length
Total number of clasts (all sizes)
ClS
ITma;.;
Queried clast
Number of clasts in small and medium fraction•
Total number of
iterations
Present iteration
* number of large clast = Totcl - ClS
-259-

Chapter 6: Modelling
3.5.4 Model experimental set~up
The modelling procedure is based on a parametric study to understand the influence of
each of the modelled variables on the behaviour of the interactions between particles and
the resulting influence on the modelled surface character. The variables tested were
selected to compliment the findings from the surface characterization and surface
hydrology. Six variables have been selected to identify their role in controlling surface
dynamics and form. These are percentage clast cover, clast shape, clast size sorting,
slope angle, weighted means and finally a randomly generated set of model parameters.
The first five variables have been shown previously to be significantly linked to slope form
and process (Chapter 5). The nature of link is complex and varies considerably between
locations. The model aims to assess each of the factors in controlled conditions. The 119
model experiments undertaken are split into 6 sets (Table 6.5).
Run set Run numbers Variables under test
1-30 Percentage cover
2 31-63 Friction angle
3 64-72 Clast sorting
4 73-102 Slope angle
5 103- 114 Weighted means
6 115-119 Random probabilities
Table 6.5 Run set configurations
The variables under examination were incrementally increased in a series of model runs.
The variables not under examination are maintained at constant values. The constants
used for all experiments are detailed in Table 6.6. The values were selected after a series
of trial experiments with the model.
Variable
Matsize
Tote I
ITmax
Sang le
p(small)
p(medium)
p(large)
Dfddiag
Value
125
33% cover
4000
0.5
0.5
0.25
0.125
0.25
0.125
0.25
Table 6.6 Model variable constants
The behaviour of each experimental was quantitatively assessed using mathematical
function. This function described the rates of change during the course of the simulation
-260-

Chapter 6: Modelling
and assessed the final stable value of the system. The final state of the system was
assessed using both Lock and Org. A quantitative comparison between model dynamics
and final outcomes allowed the influence of each parameter to be directly compared.
Additionally, the box fractal dimension of the final surface configuration is generated using
the method used in the image analysis procedure, again allowing a quantitative
comparison of model outputs between different run configurations. The benefit of this is
that the results from the model can be directly compared to the results derived from the
image analysis on the surface of the northeastern Badia.
The results of the modelling are presented in seven sections. Firstly general qualitative
and quantitative observations of model behaviour are presented and then each of the six
individual model set-ups and their results presented. Throughout links are made with
geomorphological observations, similarities and parallels from the field.
6.6 General model observations
In all modelled conditions the rules imposed acted to modify the initially random
configuration of the surface. In some runs the changes were only slight, whereas in others
a distinct change in surface form was noted. Surfaces undergo a modification to a state
which is non-random. The rate and magnitude of this departure away from the initially
random conditions varied between run set-ups. Some models resulted in clusters of
clasts. Others produced linear features both, with against and at constant angles to the
contour of the slope. Evidence of queuing or stacking whereby a static clast holds up up
slope clasts was seen. Under high frictions, clasts were seen to stick or lock together
forming initially small clusters which later agglomerate into larger concentrations. Clusters
are frequently centred on a core stone often of a larger size (Plate 6.2).
-261 -

Chapter 6: Modelling
Plate 6.2 Examples of clast surface structures in the northeastern Badia (all images oriented downslope)
Relatively few of the run set-ups resulted in a totally locked or static arrangement after
4000 iterations, but rather maintained a stable asymptotic level of clast movements. Runs
with medium or large clasts tended to produce more clearly defined structure, a result of
the increased product of multiple frictions around the larger clast perimeters in addition to
the visual effect of greater spaces between the concentrations of clasts. Linear increases
in independent variables often resulted in complex and non-linear responses in either or
both Org and Lock. Although distinct polygon networks were not formed, areas devoid of
clasts and linear structures in the clast arrangement are clearly visible.
Four examples of model output are given in Figure 6.1. The model outputs are all at the
same scale. Run 40 shows an incidence of clustering of small clasts with distinct areas
showing a lower concentration of clasts. Run 115 shows an effectively random distribution
which is not dissimilar for the initial starting conditions. This run was taken from the series
of experiments with randomly generated probabilities of movements and frictions. Run 93
shows a surface comprised of the largest clast size, with clear evidence of queuing and
lineation, and Run 41 shows a clear dendritic structure with lineations of both clast
structures and corresponding linear areas devoid of clasts. In the majority of experiments
- 262 -

Chapter 6: Modelling
the degree of structure or pattern increases. Movement decreases, hence the surfaces
become more stable.
Run configurations Run 40 41 93 115 Slope total rocks 5156 5156 573 5156 small rocks 5156 5156 0 5156 medium rocks 0.5 0 0 0 115 40 slope 0.5 0.5 1 0.704378 p(s) 0.5 0 . 5 0 . 5 0.733637 p(m) 0 . 25 0.25 0.25 0.076259 93 41 p(l) 0 . 125 0.125 0 . 125 0.509067 Single diagonal 0 .909 1 0.25 0.756016 Double diagonal 0.455 0.5 0.125 0.378008 Friction 0 . 123 0 0.25 0.736194
Figure 6.1 Example model outputs: runs 40, 41,93 and 115
-263-

Chapter 6: Modelling
Both measures of Org and Lock change through the course experiment. In all experiments
there is a significant degree of variation in both measures of behaviour, indicating a non
static stable state. A typical example is given in Figure 6.2.
Run 1- Org Run 1- Lock 0.65 0.16
~ 0
0.6 .:L. CJ
..3
0.15
0.14
0.55
0.5
0 1000 2000 Iterations
3000
0.13
0.12 Lr-------.----r------.---....-4000 0 1000 2000
Iterations
3000 4000
Figure 6.2 Run 1 - Org and Lock, median values connected by a cubic spline
Figure 6.2 shows the nature of the behaviour of the surface through the period of the
model experiment. The initial condition is rapidly adjusted within the first 1000 iterations
after which an asymptotic value of both Org and Lock is reached. Minor perturbations are
apparent, suggesting that the surface is not static but has obtained an equilibrium level of
Lock and Org form. lt is tempting to fit an exponential decay or growth model to this type
of behaviour, as employed by Ahnert (1994), but this appears not to be appropriate. An
exponential decay or growth does not tend to an asymptotic value which is clearly
apparent here. Decay in the case of Lock, or growth in the case of Org is initially
exponential but the final state of the surface after 4000 iterations cannot adequately be
explained by an exponential curve. Additionally, to solve an exponential decay curve, time
or model iterations must be logged. Log time is conceptually tenuous as there is no
physical analogue or explanation for the logarithm of time. A curve of the form shown in
Equation 6.1 was therefore adopted.
y1 Eq. 6.1 y = y, exp( -kt) + y 2 (1- exp( -kt))
where: y = Org (Lock) at t y iy2
= Iteration
yl = Initial (Org, Lock)
y2 = Final (Org, Lock) y1
k = Rate of change
-264-

Ol
0
Chapter 6: Modelling
The model, referred to below as Expapp, approximates an exponential approach to an
asymptotic equilibrium value for both Org and Lock and a linear temporal scale can be
used to solve the equation. The model works as both a growth and decay curve
simultaneously. The model provides a measure of both the rate at which the surface
reaches an equilibrium level (k), the value of the final asymptotic value (y2) and an
approximation of the initial condition (y1 ). Figure 6.3 shows the Expapp model (solid line)
fitted to measures of Org and Lock for Run 1, in addition to a standard exponential decay
and growth curve (dashed lines).
Run 1- Org Run 1 -Lock 0.65 0.16
0.15 0.6
0.55
0.5 j 0.12 1;------.----r-----r---,-
0 1000 2000 3000 4000 0 1000 2000 3000
iterations iterations
Figure 6.3 Expapp model (solid line) and standard exponential model (dashed line) applied to Run 1
Root mean squared error (RMSE) indicates the success of the Expapp in fitting to the
derived values of Lock and Org. The smaller the RMSE the better the regression predicts
the model output data. For Org in Run 1 RMSE for the standard exponential growth is
0.017, compared to 0.0078 for the asymptotic Expapp model, and for the Lock measure,
the values of RMSE are 0.021 and 0.0027, respectively. The standard exponential curve
underestimates the rate of change during the initial period of the experiment and later
overestimates the value of the asymptotic final state of the system. The asymptotic model
is logically and statistically more appropriate and significant. Expapp is used in the
analysis below as a quantitative comparison between model outputs. The model is applied
to mean data from 10 repetitions of each experimental run described.
Each model generates a binary image files. Box fractal dimension analysis was
undertaken on each image for all 119 experiments. The initially random state generated a
mean box fractal dimension of 1.897 (a = 0.08), with 107 out of 119 experiments
generating a lower box fractal dimension, suggesting a tendency, albeit slight in many
-265-
4000

Chapter 6: Modelling
instances, to non-random distributions. Figure 6.4 shows the distribution of box fractal
dimensions generated, here represented as a kernel density estimate. The mean value for
all experiments (1.794) and the mean value for the fractal dimension of the initial starting
conditions (1.897) are indicated in the distribution. The bimodal distribution is explained as
a function of the nature of the run set ups used and should not be considered as a
characteristic of actual distribution of fractal dimensions for the entire model state space.
The tail on the distribution indicates that under some, albeit infrequent circumstances a
highly significant departure away from the random starting condition is apparent. The
conditions which instigate the largest departures away from CSR are explored further
below.
~ ·u; c
4
Q) 2 0
0 ------- ---~ 1.4
---1.6
I I
/
I I
I I
I
I
I
' I il i
/ I i
I ! I ;
I
1.794 1.897
"' I ' I
1.8
' '
L() ..-
c ::J 0::
Box fractal dimension
\ \ \ I
2
Figure 6.4 Kernel density estimate of box fractal dimensions for all runs, showing mean and initial condition and box fractal dimensions for the 4 example model outputs
-266-

Chapter 6: Modelling
6. 7 Quantitative model analysis
3. 7.1 Run set 1 -The influence of cover percentage
Ground surface cover percentage is commonly cited as a control on surface hydrology
(Poesen et al., 1994 ). The result presented in Chapter 5 demonstrates subtle links
between ground cover percentage and the action of hydrological processes. The linkage
is complex and appears intimately related to other variables of slope and surface
character. Linear regression analysis is limited as a tool to explain the role of surface form
on dictating process action. A series of experimental designs was developed to examine
the influence of a linear incremental increase in percentage ground cover on surface form
and behaviour. Table 6.7 gives the run specifications. The three clast sizes were tested
separately for simplicity. Each successive run in this set experienced an incremental
increase of 3.2% ground cover between 12.8% and 41.6%. Each incremental increase in
ground cover was performed on surfaces with clast population composed of entirely,
small, then medium and finally large clasts. Trial models identified that values around 33%
demonstrated the most interesting behaviour. Above the experimental range defined the
spaces between clasts was not great enough to permit sufficient movement to allow
structure formation. Below, the gaps were such that reduced interactions between clasts
meant that locking structures did not tend to form. As with all experimental run-sets, the
variables not under examination are held constant (Table 6.7).
-267-

Run set Percentage cover (small clasts only) Percentage cover (medium clasts only) Percentage cover (large clasts only)
Run number 1 to 10 11 to 20 21 to 30
For intermediate runs For intermediate runs For intermediate
runs
Matsize 125 125 125 125 125 125 125 125 125
Totcl 2000 (12.8 %) 2000 - 500 a (3.2 %) - 6500 (41.6 %) 500 (12.8 %)
500- 125a (3.2 %) -1625 (41.6%) 222 (12.8 %)
222 - 56 a (3.2 %) -722 (416 %)
6500 1625 722
Small rocks 2000 2000- (SOO)a- 6500 6500 0 0 0 0 0 0
Medium rocks 0 0 0 500 500- (125)a -1625 1625 0 0 0
IT max 4000 4000 4000 4000 4000 4000 4000 4000 4000
Sang le 0.5 0.5 0.5 0.5 0.5 0.5 0.5 0.5 0.5
p(small) 0.5 0.5 0.5 0.5 0.5 0.5 0.5 0.5 0.5
p(medium) 0.25 0.25 0.25 0.25 0.25 0.25 0.25 0.25 0.25
p(large) 0.125 0.125 0.125 0.125 0.125 0.125 0.125 0.125 0.125
fdiag 0.25 0.25 0.25 0.25 0.25 0.25 0.25 0.25 0.25
Dfddiag 0.125 0.125 0.125 0.125 0.125 0.125 0.125 0.125 0.125
F,., 0.25 0.25 0.25 0.25 0.25 0.25 0.25 0.25 0.25
Repetitions 10 per rule set 10 per rule set 10 per rule set
a Iterative increase between runs
Table 6.7 Set I -!Run configuration

i. Stability
The final state of surface stability is shown to be dependant on the ground surface cover
percentage. Additionally, under these conditions the clast size influences the level of the
final stable state of the surface. The response to a linear increase in cover percentage is a
relatively linear decrease in the final mean probability of movement (Lock) on the surfaces
for each clast size (Figure 6.5) .
x small + medium 0 large
0.15 - X
0.1 -
.::.:.- X
o ..!!:! X
0 (1J _J(.)
<f)
0 .05 0
'en X
N 0 0
>-:::::- 0 X 0
0 0
0 X
0
0
0 .01 - 0
10 20 30 40
Cover percentage %
Figure 6.5 T he variation of y2 - Lock, for runs 1 - 30, with cover percentage and clast size
The rate of change to reach an asymptotic equilibrium of probabi lity of k-Lock also varies
with cover percentage. Figure 6.6 shows that as cover percentage increases the speed
with which the surfaces stabilize increases accordingly. Additionally, smaller clasts appear
to stabilize more rapidly than larger clasts, probably as a result of their greater likelihood
of movement. The behaviour of the model appears to be logical , as the higher the
percentage cover then the less distance a clast has to move on average to come into
contact with other clasts and lock into a structure. Figure 6.6 also illustrates the increased
nature of variability of surfaces dominated by small clasts. Combined with the results in
Figure 6.5, several key differences between these surfaces can be made. Even though all
of the surfaces in the experiment use uniform clast sizes, the nature of the interactions is
quite different. Larger clasts have a greater edge length available for interactions to occur.
Total friction can be the product lateral, diagonal and double diagonal frictions
simultaneously. The result of this is a potentially much lower probability of clast movement
-269-

Chapter 6: Modelling
for larger clasts, as shown in Figure 6.5. As on smaller clasts, edge length is only one unit
grid space width, on a surface with only small clasts the total friction between two particles
can only ever be the product of either lateral or diagonal contact, apart from the exception
of double diagonal friction, which within this model is deliberately considered separately.
X Small 0 Large + Medium
0.06 X
X
0.04 -
+
0.02 + X
+ X ~Q) X X X
u- + + o ro ...J~ + I Ol + ~..Q X X
X + 0 + 0
0
+ 0
0
0 0
0
0
0.001 - 0
I I
10 20 30 40
Cover percentage %
Figure 6.6 Variation of k- Lock, with clast size and cover percentage
A physical analogy to this in the field can be suggested. The model suggests that
increased edge length on a surface with larger clasts may behave differently to that on a
surface with small clasts due to an increase in the number of interactions, and have a
resulting influence on the spatial character of the surface. On a small clast dominated
surface the friction forces on and between clasts is low due to short edge lengths. The
magnitude of the frictions between clasts in this fraction is closer to the magnitude of the
force of the clast movement mechanism. Small clast movement is controlled by frictions of
values closer to that of the forcing mechanism than those acting on and between larger
clasts. Smaller clast dominated surfaces may therefore be expected to behave more
sporadically and respond to events of a lower magnitude than larger clast dominated
surfaces. Surface pattern may form but accordingly may breakdown, whereas greater total
distances of movement maybe expected on surfaces with larger clasts. The implication of
this size control on structure is that pattern may be scale specific. The behaviour seen in
-270-

Chapter 6: Modelling
the model may explain the presence and absence of pattern in some areas, particularly
between basalt types.
i. Organization
Pattern measured by the mean number of occupied neighbourhood cells (Org), increases
with ground cover percentage for small and medium sized clasts (Figure 6. 7), but appears
to have little influence on large clasts dominated surfaces.
0 small 6 medium 0 large
2
0
ro 0 Q) .... ro 1.5 0
(;) ~
0
(.) 0
.8 0 "Cl Q) 0
.t:::l "Cl 0 .... ro
"Cl 0 c ro - 0 (/)
0 0 D 0 0 0.5 6 6
Ol 6 .... 6 0 6
N >-
0
10 20 30 40 Cover percentage(%)
Figure 6.7 Variation of Org with cover percentage, as influenced by clast size
The increase in Org with cover percentage appears highly linear; ,-2 values for linear least
squares regression between percentage cover and y2-0rg are 0.998, 0.983 and 0.994 for
small, medium and large clast dominated surfaces, respectively. The nature of surface
organization and its variation with the increase in cover percentage varies significantly
between clast sizes. Small clasts show an increase in the tendency to organize with
increased percentage cover, medium clast size dominated surfaces show a less
pronounced increase and large clast show no discernable variation with increased
percentage cover. Absolute values of Org appear to be strongly linked to clast size but the
relative change in Org with cover percentage is linear. The result has an important
implication for the surfaces of the northeastern Badia. The suggestion raised is that the
-271 -

Chapter 6: Modelling
larger the clast, the less likely the occurrence of structure. An increase in clast size
increases the complexity of the interactions between clasts. In the northeastern Badia
clasts are commonly mixed, which results in complex multiple interactions between
several clasts. The large clast surfaces and their increased complexity are perhaps more
appropriate as a model of the surfaces of the northeastern Badia. The limited variation in
patterning with cover percentage on the more complex surfaces tested here is reflected in
the northeastern Badia. No clear relationship has been found between cover percentage
and any of the spatial measures of surface form developed previously. In the case of the
small clasts dominated surfaces, which demonstrate a clear link between cover
percentage and degree of surface organization, a much more simplistic nature of surface
dynamics is apparent. The implication in the northeastern Badia is not dependent on clast
size but rather on the complexity of the interactions between clasts. For example, on a
surface with a tightly constrained unimodal distribution of clast sizes interactions may be
simple, as the similarity in edge lengths of all clasts limited the number of clasts that can
interact at one time. Clast interaction complexity is a function of clast size, clast size
distribution and clast form and texture. Very subtle variations in any of these factors may
have a profound influence of the spatial arrangement of the surface form.
Surface organization is also assessed using the box fractal dimension (Figure 6.8). A
distinctly non-linear response in fractal dimension to an increased cover percentage is
apparent. Increased cover percentage increases the dimensionality of the surface. Clast
size also increases the degree of self similarity which can logically be explained by the
formation of more complex structures at the scale of the 125 matrix by smaller clasts. The
non-linear variation in box fractal dimension is surprising and appears contrary to the Org
results above. Fractal dimension assesses the self-similarity of the resultant image. A
higher percentage cover results in more clasts on the surface, which is more complex. lt is
also influenced by the spatial arrangement of clasts, irrespective of percentage cover. lt
would appear that spatial organization increases with percentage cover, but in a non
linear manner. An examination of the resultant images for runs 21 - 30 (medium clasts)
(Figure 6.1 ). Expapp curves were fitted to the increase in box fractal dimension with
increased ground cover percentage. Optimum root mean squared error was found for a
final box dimension (y2) of 2, and an initial percentage cover equal to zero, therefore the
model results appear to generate a logical type of surface behaviour; 100% surface cover,
has a square form and a fractal dimension of 2, as generated by the model. Box fractal
dimension therefore undergoes an exponential increase to an asymptotic state.
-272-

Chapter 6: Modelling
0 Small t:. Medium [] Large
2
0 0 0 0 0
0 0
c 0 t:. 0 0 t:. t:. -~ 1.8
0 Q) t:. [] Cl E '6 Cl
ro Cl Cl
t) ro Cl ..... -X Cl ~ 1.6 -
Cl
Cl
Cl
1.4 I
10 20 30 40 Percentage cover(%)
Figure 6.8 Box fractal dimension -set 1
Analysis of an incremental increase in percentage cover has suggested several
interesting observations of surface behaviour. Increased percentage reduces the
probability of clast movement in addition to increasing the speed at which the surface
adjusts to an asymptotic equilibrium. Surfaces adapt to the local conditions and display a
clast distribution which tends to a non-random form. Patterning or structure appears to
increase with percentage cover under the conditions of simple clast interactions. lt
appears more likely however than on complex surfaces, where clast size, clast shape and
texture are all highly variable, may result in an equally weak relationship between surface
percentage cover and the occurrence of ground surface cover. The model output supports
the suggestion raised from the image analysis of the surfaces which failed to generate
statistically significant relationships between ground surface cover percentage and any
measure of surface organization.
-273-

Chapter 6: Modelling
) . ~ , .. "" ... . • • •
• :lo
l.~ . ;V' , "i • • •
=-,.~, ,. ,, • • Vi' !) 'lj.J ! . :. . , ·: ~:lo • • ~ ~ ..... .
& • ' , ....
Run number 21 26 22 27 23 28 24 29 25 30
Figure 6.9 Model output images runs 21 - 30
-274-

Chapter 6: Modelling
3.7.2 Run set 2 a Influence of angle of friction
The image analysis of the northeastern Badia surface has revealed a distinct down-slope
variation in particle texture and roundness. Modelling the influence of percentage cover
has demonstrated the importance of clast interactions as a control on surface character,
with an apparent control of size and edge length on the behaviour of the surfaces. Clast
shape and texture have been identified as highly variable down-slope. The implication of
this type of clast specific variation can now assessed in the model, by varying the
resultant of friction forces between interacting clasts. By changing the friction and the
angle in which its acts, a surrogate for clast texture and shape is simulated.
The model simulates inter-clastic frictions with two forces: one acting across the contour
(flat) and one acting at 45° to the contour (fdia9). By altering the ratio of the two frictions the
direction of the resultant averaged over the image, here termed the angle of friction, can
be altered. This is designed to simulate the influence of clast rounding and surface
texture, in addition to acting as a proxy for understanding the dynamics of variable clast
interactions. The run set is designed to examine whether an optimum angle of friction
exists under which surface structure is most likely to form and then assess the effect of
this on surface dynamics. The direction and magnitude of the angle of friction in terms of a
physical analogy to this in the northeastern Badia is difficult to judge. Friction and the
potential of movement between real clasts is a result of a complex interplay of surface
texture, contact length and size, clast inertia and the tendency of a clast to topple down
slope but it is suggested here that the influence of these interactions can be simplified to
flat and fdiag·
A model was constructed whereby the magnitude of the resultant of f1at and fdiag is always
equal to 1. By altering the ratio between the two values, the angle of the resultant, termed
the friction angle, is moved between 45° and 0° to the horizontal, in 5° increments with an
additional experiment at the midpoint, at 22.5°. The respective values for f1at and fdiag were
calculated as shown in Figure 6.1 0.
-275-

/
/ /
/
/ /
/
a
'?f / ·· ...
/ ···· .... / ·· ..
..•·
.·· / 0 : :
-- /L~~-- _Jj h
.··
b
..···
h
Chapter 6: Modelling
h = Csina
a= fih
:. a = /i(Csina)
b = Ccosa-h
:. b = C(cosa -sina)
ifC = 1 and 0 = 45°
b = cosa -sina
&
a= fi(sina)
C, resultant of a (fdiag) and b (f1at) is always = 1
the angle of the resultant, varies between 45° and horizontal (0°) at 5° intervals
Figure 6.10 Calculation of friction angle
The resulting values of f1at and fdiag are displayed with the other run set-up parameters
employed in this series of experiments parameters are shown in Table 6.8.
Run set Change in friction angle- cover percentage set at 33 % (small rocks only) --------- ~---
Run number 31 32 33 34 35 36 37 38 39 40 41
Friction angle 0 5 10 15 20 22.5 25 30 35 40 45 -------- -~- ·-----
Matsize 125 125 125 125 125 125 125 125 125 125 125
Totcl 5156 5156 5156 5156 5156 5156 5156 5156 5156 5156 5156
Small rocks 5156 5156 5156 5156 5156 5156 5156 5156 5156 5156 5156
Medium rocks 0 0 0 0 0 0 0 0 0 0 0
ITmax 4000 4000 4000 4000 4000 4000 4000 4000 4000 4000 4000
Sang le 0.5 0.5 0.5 0.5 0.5 0.5 0.5 0.5 0.5 0.5 0.5
p(small) 0.5 0.5 0.5 0.5 0.5 0.5 0.5 0.5 0.5 0.5 0.5
p(medium) 0.25 0.25 0.25 0.25 0.25 0.25 0.25 0.25 0.25 0.25 0.25
p(large) 0.125 0.125 0.125 0.125 0.125 0.125 0.125 0.125 0.125 0.125 0.125
fdlag 0 0.123 0.246 0.366 0.484 0.541 0.598 0.707 0.811 0.909
Dfddiag 0 0.062 0.123 0.183 0.242 0.271 0.299 0.354 0.406 0.455 0.5
f, •• 0.909 0.811 0.707 0.598 0.541 0.484 0.366 0.246 0.123 0
Repetitions 10 per rule set
0 Values of friction here rounded to 3 d.p., but figures to 8 d.p. were used in the model 0 Dfddiag is always held at Y, of fdiag
Table 6.8 Run configurations- Set 2
-276-

Chapter 6: Modelling
D. Stability
The influence of friction angle on surface movement is profound. Again three clast sizes
were tested separately, each displaying a different nature of surface behaviour (Figure
6.11 ).
0 small t:. medium [] large
0.1 - I
I I
I
0 I 0 I 0
I 0 I
0 I I
I 0 I
.;,:. I u I 0 I
_J 0 I '
N I
>. 0.05- 11 A 0 t:.
I
t:. I t:. t:. I
I t:. I
I
[] []I []
I t:. I 0
[] I [] []
I [] t:. I t:.
I [] I
0 - 0 [] ~ li1
I I I I
0 5 10 15 20 25 30 35 40 45
Friction angle (degrees)
Figure 6.11 Influence of angle of friction on y2-Lock
Interestingly peak values of y2-Lock increase with clast size, indicated by the dashed line
above. The small clast experiments generate a modal frequency distribution of y2-Lock,
centred on a mean value of 22.5°, with the lowest levels of y2-Lock at 0° and 45°. The
increase in y2-Lock with friction angle as dictated by clast size has several important
implications. As clast size increases the edge length available for contacts and friction
increases. The angle at which a clast can support another clast of equal or smaller size
through friction is dependent on clast size. The geometry of an emergent pattern or
polygon network is dependent on clast size, via the variable nature of friction contacts.
Despite altering the friction angle, the relative clast position in the matrix can only either
be at 45° or 0° to the horizontal due to the grid layout. When the resultant is at 22.5°,
neither f1at or fdiag is dominant and correspondingly y2-Lock is large. The difference in
behaviour between the three clasts sizes is also of interest. lt is noticeable that medium
-277-

Chapter 6: Modelling
and large clast sizes have a less dramatic response to a variable angle of friction. The
tendency for the mean value of y2-Lock to move towards a friction angle of 0° degrees
with increasing clast size is a reflection of the changing ratio of f1at to fdiag with increasing
clast size (Figure 6.12). An analogy to this in the field can be made. Edge length
increases geometrically with clast diameter. On a surface with larger clasts a greater
contact edge length is available for generating frictions and contacts between clasts. Total
friction between clasts increases as a result of both a greater length of clast contacts and
a greater number of clasts in contact at one time. In addition to the increasing magnitude
of friction the nature of the friction changes. With a greater edge length more clasts may
come into contact. Larger clasts may have more than one point of contact, whereas
smaller clasts may only be limited to one contact point. Edge lengths are of particular
importance when considering the relative Lock of different size fractions on a surface with
a mixed clast size distribution.
1 : 1 4:6 6: 10
Figure 6.12 Changing ratio of friction forces with increased clast size
The rate of change to a stable state under various friction angles is complex. Figure 6.13
shows that clast size dictates the rate of stabilization of the surface. Small clasts tend to
behave more erratically than medium and large clasts, reflecting the more muted
response due to increased interaction complexity for the larger clast sizes. For small
clasts, the rate of change to stabilization appears shows no significant decrease as the
friction angle moves from 0° to 45°, whereas for medium and large clasts there is a clearly
apparent decreases in the k-Lock, again a function of the changing nature of clast
interactions with clast size. For large clasts the number and magnitude of fdiag relative to f1at
increases. As the angle of friction approaches fdiag (45°) the probability of movement
decreases and hence the rate of change to a stable state slows. Geomorphologically this
suggests that large clast dominated surfaces maybe more resilient to modification and
may take more iterative cycles to adjust to a change in forcing conditions.
-278-

Chapter 6: Modelling
0 small A medium [J large
0.3 0
0.2 0 0
0
0.1 0
0 0 ..:..:: 0 0 (.) g
..:..:: A
A A [J A
[J [J [J [J
[J [J
0 [J
A [J
0.001 A [J [J
I I I I I I I I I
0 5 10 15 20 25 30 35 40 45 Friction angle (degrees)
Figure 6.13 K values- rates of change to a stable state under variable friction angles.
-279-

Chapter 6: Modelling
ii. Organization
Angle of friction has a profound effect on the nature of pattern formation on the
surfaces generated by the model (Figure 6.14).
___.. Medi um
--+00
Figure 6.14 Runs 31-40 Variable angle of friction, indicated by the arrow for small clasts
-280-

Chapter 6: Modelling
Figure 6.14 shows the change in nature of structure with a varying angle of friction, the
resultant indicated by the arrow for each image, for small clasts. The nature of pattern
varies dramatically from a clearly dendritic surface pattern at 45°, to an apparently
unordered structure between 20° and 25°, and then a clustered pattern arranged parallel
to the contour with friction angle at 0° to the horizontal. Pattern measures corroborate the
visual representation of spatial distribution of clasts seen above, as shown in Figure 6.15.
2> 0
' N >.
6 -
Cl
4
2 0
0
0
o Small t:.. Medium Cl Large
Cl Cl
Cl
Cl Cl
Cl Cl
0 0
0 0 0 0 0
5 10 15 20 25 30 Friction angle (degrees)
Figure 6.15 Run set 2- The influence of friction angle on y2-0rg
Cl
t:..
0
35
Cl
t:..
0
40
The three rocks sizes perform differently in the model. What is surprising is the maximum
value of y2-0rg for the 5 degree friction angles, for all three clast sizes, a distinction not
seen in the y2-Lock. The maxima, seen in Figure 6.15, can be understood by referring
back to the images in Figure 0.16. A friction angle of 5° appears to promote the greatest
degree of clast clustering, even more so than 0°. At 45° the surface, although visually
structured, is dominated by an almost uniform distribution of clasts across the matrix all
held in position by the dominant fdiag and Dfddiag. y2-0rg reflects an increase in
clustering, the fractal dimension of the images reflects the degree of self similarity (Figure
0.18).
-281 -
Cl
0
45

Chapter 6: Modelling
0 small 1::. medium [J large
0 0
1.9 -0 0 0 0 0
0
0
c 0 0
"Ui 1.85 -c (!)
E 1::. "0 0 1::.
ro 1::.
t5 1::. ro 1.8 .._ -X 0
(!) [J [J
[J
1.75 [J
[J [J
[J [J [J
1.7 I I I
0 5 10 15 20 25 30 35 40 45
Friction angle (degrees)
Figure 6. t 6 Box fractal dimension- Run set 2.
Figure 6.16 reflects the regularity of the structures seen in Figure 6.14, suggesting a
higher degree of self similarity as the angle of friction increases to 45°. Again, the smaller
clast dominated surface returns a higher box fractal dimension. All three clast sizes show
a steady increase in image self-similarity with increasing angle of friction. Comparing y2-
0rg and box fractal dimension raises some interesting suggestions. y2-0rg decreases
with friction angle reflecting a higher degree of clustering as the angle tends to 0°.
Clustering is not reflected in the box fractal dimension which rather reflects the degree of
linearity and self similarity in the image. These observations can be extrapolated to the
northeastern Badia. In the Badia structure is present, but on a visual basis, rarely
continuous down a slope profile. The occurrence of pattern is unpredictable. lt is often
difficult to relate the presence and occurrence of structure to either surface or slope
variables. Visually, pattern is either there or not. On a qualitative basis it is very difficult to
suggest varying degrees of structure. A polygonal net appears as a polygonal net and
there is qualitatively little transition between an ordered and random surface. Analysis of
the fractal dimension at points down the surveyed slope profiles indicates a gradual
change in the organization of the surface, which can be differentiated from other the
influence of other surface variables. The image analysis and model pick out and quantify
pattern and structure that the human eye is unable to see.
-282-

Chapter 6: Modelling
The model appears to replicate the conditions in the northeastern Badia. Run 31 shows a
very clear dendritic style of structure which is easily recognisable as an organized pattern.
Conversely Run 32, at least on a visual basis appears to show relatively little degree of
organization, despite the run set-up being only slightly different from that in Run 31. The
two statistics employed, Org and the box fractal dimension, indicate that there is a gradual
transition from a random to a non-random distribution leading to an organized surface
structure. The model suggests that subtle variations in the nature of interactions on the
surface can have implications on the type and visual appearance of the surface
structures. The implication is that what appears to be random in the field may well be at
some transition between order and randomness.
The results from the spatial analysis of structure appear to be incongruous with those with
regards surface stability. Measures of surface structure suggest that both clustered and
ordered structures are stable, explained as a result of the increased number of contact
points between clasts, which generates the lowest mean probabilities of clast Lock. The
transition from clustering to linear structure shown is not reflected in a corresponding
linear change in surface stability. As discussed, the most potentially unstable surfaces are
those which are neither clustered nor structured.
Additionally it is notable that even those areas with Org exhibit some degree of dynamism.
Surface structures are not static but dynamic. Structure, as an emergent property, is a
manifestation of clast interactions and is not necessarily indicative of a static locked
surface. If the controls on interactions change through time, for example increase clast
rounding due to attrition or weathering, then the emergent surface structures may too
reflect this. The model has shown that only a slight variation in the nature of clast
interactions is needed to alter the surfaces both qualitatively and quantitatively. Given the
apparent unstable nature of non clustered and non ordered surfaces, it is suggested that
with external forcing held constant a surface will tend towards some form of organization.
The development of Org reduces the entropy of the surfaces. A more mature surface
should display greater degree of order.
In the Badia this is reflected in a greater degree of structure at the base of slope where
process intensity is at its highest. Surfaces have experienced significant process action to
modify their form to a more stable state, as indicated by Org. Again there are issues of
homeostasis. When structure is present it may be self-perpetuating. As a locking structure
develops its spatial extent and area increases, allowing more contacts with other clasts.
This is potentially the reason that when a structure appears it is very clear, even though a
transition in the degree of organization is rarely visually apparent. A lack of structures in
-283-

Chapter 6: Modelling
the field can be suggested to be a reflection of either a location which does not experience
processes of sufficient magnitude to modify the surface, or secondly, an area that has
undergone some form of change in the controls on interactions. A surface under these
conditions maybe in transition between a chaotic or random state to a more ordered
surface organization.
Although the angle of friction does not have a direct physical analogy in the field, run set 2
has demonstrated the degree of sensitivity of the surfaces and the variability of emergent
forms that result from only subtle variation in interaction properties. Features such as clast
form may hold a significant control over the behaviour of the surface.
3.7.3 Run se~ 3- The influence of clast sorting
Clast size has been shown above to play a critical role in the behaviour of the surfaces.
The image analysis in the Badia has identified a systematic variation in the nature of
clasts sorting by within and between locations and can be linked to surface, slope and
hydrological variables with statistical significance. The following series of experiments
aims to explore the role of various levels of clast sorting on the behaviour and dynamics of
the surfaces. Again cover percentage is held at 33 %. Ratio of the clast size is kept at 1
2: 3, as detailed in Table 6.9.
Run number 64 65 66 67 68 69 70 71 72 ----- --- --- ------ -----
One clast size Mixed clast sizes
Small 0 0 3 2 1 2 3 ~ Q) nl N c:Pi Medium 0 0 2 3 3 2
Large 0 0 2 3 3 2
Table 6.9 Proportional ratio of small : medium : large clast sizes- Runs 64- 72
Every combination of small : medium : large in these ratios is tested in Runs 67 - 72.
Runs 64 - 66 are undertaken for comparison between surfaces with one clast size and
those with a mixture of clast sizes. Values of the coefficient of variation are calculated for
each run set up using the formula described in Chapter 4, and is employed here as the
measure of clast size distribution sorting.
-284-

Chapter 6: Modelling
Run set Change in coefficient of variation- cover percentage held at 33 %, combinations of 3 : 2 : 1 ratio
Run number 64 65 66 67 68 69 70 71 72
cvb 0 0 0 0.861 0.697 0.579 0.528 0.663 0.611
One clast size Mixed clast sizes
Matsize 125 125 125 125 125 125 125 125 125
Totcl 5156 1289 573 1547 1345 998 859 937 897
Small rocks 5156 0 0 773 448 166 143 312 224
Medium rocks 0 1289 0 516 673 499 286 156 224
IT max 4000 4000 4000 4000 4000 4000 4000 4000 4000
Sang le 0.5 0.5 0.5 0.5 0.5 0.5 0.5 0.5 0.5
p(small) 0.5 0.5 0.5 0.5 0.5 0.5 0.5 0.5 0.5
p(medium) 0.25 0.25 0.25 0.25 0.25 0.25 0.25 0.25 0.25
p(large) 0.125 0.125 0.125 0.125 0.125 0.125 0.125 0.125 0.125
fdiag 0.25 0.25 0.25 0.25 0.25 0.25 0.25 0.25 0.25
Dfddiag 0.125 0.125 0.125 0.125 0.125 0.125 0.125 0.125 0.125
F,., 0.25 0.25 0.25 0.25 0.25 0.25 0.25 0.25 0.25
Repetitions 1 0 per rule set
Table 6.10 Proportional ratios of small : medium : large clasts, and run-set configurations- Runs 64-72
ii. Lock
The small number of experiments undertaken to examine the role of particle sorting in
determining surface behaviour limits the statistical significance of the results generated,
but nonetheless some tentative observations can be made. The final stability of the
surfaces appears to be positively related to an increased level of clast sorting, though this
relationship is not statistically significant (~ = 0.53, (for 5% significance, ~ = 0.81)). A
greater degree of locking between the surface clasts is achieved on surfaces with a more
uniform distribution of clast sizes (Figure 6.17). There appears to be little or no
relationship between the degree of clast sorting and the rate at which a surface stabilizes
(Figure 6.17). Rates of change in surface character appear more complex.
-285-

N' c ..l<:
0.008
0 0
Chapter 6: Modelling
0
0.011 0
g 0.006 -
0.01 Q' 0
_I
0.004
0 0
..l<: (.)
0 _I
0.009
0
0
0
0
~----~~0----~,------~----~0.008 -~-----,,-----,------,, ----~, 0.7 0.8 0.9 0.5 0.6 0.7 0.8 0.9 0.5 0.6
Coefficient of variation Coefficient of variation
Figure 6.17 Variation of final stable state (y2-Lock) with coefficient of variation (left); Relationship between k-Lock and the coefficient of variation (right)
The Lock of clasts on a surface with a mixed clast size distribution is complicated by the
interaction of objects that behave according to different rules, or probabilities of Lock. The
relative importance of the individual size fractions in controlling in this instance the Lock of
the surfaces is now addressed. The model output on surface with a mixed clast size
distribution can be tailored to give details of the behaviour of each of the individual size
fractions on the surfaces. Figure 6.18 gives an example of this for Run 71.
0.1
0.05
..l<:~
u2 0 CO _~l;l 'Ol
No >-=
0.0005
I I ·I ··I ·~
0
I I I
\
...................................................... ~~~!1.!1'!1
Large
', Small -------------------------------I I
1000 2000 iterations
3000 4000
Figure 6.18 Expapp curves fitted to small, medium and large clast behaviour- Run 71
-286-

Chapter 6: Modelling
Both a surprising and important control on surface dynamics is apparent (Figure 6.18).
The fitted curves indicate the mean probability of each clast size moving through the
experiment, as represented by y2-Lock. At the start of the experiment (iterations = 0) the
clast Lock directly reflects the probability of Lock determined by clast size, with small
moving most freely, then medium and finally large. As the surface modifies under the
experimental conditions the behaviour of each fraction rapidly changes. After 333
iterations the small size fraction becomes the most static clast size. For a period of 268
iterations beginning at iteration 250 the largest clast fraction is the most mobile, despite
having the lowest probability of Lock. The final equilibrium state of the experiment shows
medium clasts being the most dynamic, followed by the large and finally the small clasts.
The development of surface patterning may therefore be expected to be more pronounced
on larger clast dominated surfaces. The smaller clast sizes may be to responsive to
process action to form patterning as they tend not to become tessellated into locking
structures. As a size group, small clasts maybe considered to be too stable to form self
organized.
The perhaps surprising nature of behaviour is explained as a result of the complexity of
interactions of different clast sizes and has implications that can be extrapolated to the
field. At the outset of the experiment clasts are randomly but uniformly dispersed across
the matrix. As the experiment commences clasts begin to come to rest against those
which are less mobile. In the example above the surface is dominated by large clasts. The
small clasts become lodged behind larger clasts which are less mobile. After 125
iterations the majority of small clasts are jammed behind medium and large clasts. Small
clasts can only move if the medium or large clast moves. A queuing effect occurs,
whereby the movement of the smaller mobile fraction is dominated and controlled by the
larger clast sizes. The medium and large clasts in effect act as core stones supporting
structures of smaller clasts sizes. This suggestion is supported by observations of the
clast structures within polygonal forms (Plate 6.1 ). The medium fraction remains more
mobile than the largest fraction, in this instance as it acts both as a core stone but retains
mobility due to its higher probability of clast movement.
Intuitively the most mobile clast should be those which are most probable to move. On
surfaces with a variety of clast sizes it is those clasts which dominate and support surface
structures that are the most mobile, often those of a larger size. This is of particular
importance in the northeastern Badia where hydraulic transport and hence preferential
clast size movement is unlikely. Even if the smaller clast fraction is more likely to be
mobilized, the dynamics of the whole surface may be dictated by the larger clasts fraction.
-287-

Chapter 6: Modelling
ii. Organization
Contrary to measures of stability, measures of surface structure and pattern appear to
correlate well with clast sorting variables. Figure 6.19 shows the relationship between Cvb,
box fractal dimension, and Org. The relationship between y2-0rg is statistically significant
(1% significance level when n = 6, ~ = 0.917).
Ol
0 I
N >.
y2 = 3.146 + 0.468xcoefficient of variation
r2 = 0.916, RMSE = 0.018 n = 3.55 6
; ;
; ;
; ;
3.5 ; ;
0 ; ;
; ;
; ;
;
;; 0
3.45 ; ;
; p;
; ;
; ;
;; 0 ;
6 3.4
I
0.5 0.6 0.7 0.8
Coefficient of variation
; ;
A) ;
I
0.9
Box fractal dimension = 1.694 + 0.081 xcoefficient of variation
r2 = 0.474 RMSE = 0.011 n = 6
c .Q (/) c Q)
1.77
-~ 1.76 "0
1§ (J
ro ~ 1.75 0
OJ
1.74
1.73
0
0
I
0.6 0.7 0.8 0.9
Figure 6.19 The relationship between coefficient of variation and y2-0rg, and box fractal dimension
-288-

Chapter 6: Modelling
The implication is that the sorting of the clast population influences the nature of resulting
surface structure. The strength of the relationship between Org and Cvb suggests that as
sorting increases and a more uniform clast distribution emerges, with the surface tending
to form clusters. The corresponding increase in fractal dimension tentatively suggests a
tendency towards greater self-similarity and linear order with increased clast size sorting.
These suggestions are supported by a visual assessment of model output (Figure 6.20).
Evidence of linearity in surface form is apparent where smaller clasts queue behind the
larger cores stones. All surfaces show areas that are devoid of clasts, lineations and
clusters. Fractal dimensions appear lower than those established earlier for surfaces with
variable percentage cover. This implies that under experimental conditions where the
surface supports a mixed clast size distribution, clusters rather than regular ordered
features tend to form. On a larger matrix the clustering and segregation of clasts into
structures may represent a higher order of structure, but this is beyond the scope of this
experiment.
Mixed clast size surfaces appear to behave in a complex manner. Interactions vary
throughout the course of the experiment and the relative dominance of each clast size in
controlling the surface dynamics alters. Order and structure emerges as the sorting of the
clast population increases. The implications of this in the northeastern Badia are two fold.
Firstly, all of the surfaces surveyed using the image analysis show a dispersed clast size
distribution, returning high values of Cvb. The response of the northeastern Badia surfaces
is likely to be equally complex and variable as that in the model. Again, visually similar
results when quantified represent a systematic variation in the spatial organization and
character of the surfaces which can be linked to minor perturbations in the controls on
clast interactions. Secondly, the model suggests a greater tendency to clustering, rather
than distinct self-similarity. Under these modelling conditions it is difficult to explore
whether clustering at this matrix size is a reflection of pattern of a higher order. In the field
examples patterning are linear, forming networks (Figure 6.20). An organized surface can
be either clustered or lineated. Structure does not necessarily have to look aesthetically
pleasing to be statistically organized.
-289-

Chapter 6: Modell ing
67 68
69 70
71 72
Figure 6.20 Final model output runs 67- 72
-290-

Chapter 6: Modelling
3.7.4 Run set 4- The influence of slope angle
Classification of the slopes in the northeastern Badia has shown a range of slope forms
and angles. Slope angles, although generally low, vary between locations. The
relationship between slope angle and surface character and the relationship between
slope angle and surface hydrology has been shown to be by no means straight forward. A
model is developed to explore the relationship between the dynamics and organization of
the surface as influenced by changing slope angle. A surrogate control on slope angle is
used in the model. Slope here is effectively a control on the rate of change, or speed with
which the model works. The complexity of clast interactions means that a change in slope
in not just a speed regulator on the model, but it is found to dictate the nature of surface
form variations and structure. The effect of altering the speed of the model is now
investigated. A series of experiments, Runs 73 - 102, is designed to examine the
influence of an incremental increase in slope angle on the three clast sizes (Table 6.11 ).
-291 -

Run set Percentage cover= 33% (small clasts on ly) Percentage cover = 33% (medium clasts only) Percentage cover = 33% (large clasts only)
Run number 73 to 82 83 to 92 93 to 102
For intermediate runs For intermediate runs For intermediate runs
Matsize 125 125 125 125 125 125 125 125 125
Totcl 5156 5156 5156 1289 1289 1289 573 573 573
Small rocks 5156 5156 5156 0 0 0 0 0 0
Medium rocks 0 0 0 1289 1289 1289 I 0 0 0
ITmax 4000 4000 4000 4000 4000 4000 4000 4000 4000
Sangle 1 1- (0.1)3- 0 0 1 1-(0.1)• -o 0 1 1- (0.1)3
- 0 0
p(small) 0.5 0.5 0.5 0.5 0.5 0.5 0.5 0.5 0.5
p(medium) 0.25 0.25 0.25 0.25 0 .25 0.25 0.25 0 .25 0.25
p(large) 0.125 0. 125 0.125 0.125 0.125 0.125 0.125 0.125 0.125
fdiag 0.25 0.25 0.25 I
0.25 0.25 0.25 0 .25 0.25 0.25
Dfddiag 0.1 25 0.125 0.125 0.125 0.125 0.125 0.125 0.125 0.125
Flat 0.25 0.25 0.25 I 0.25 0.25 0.25 0.25 0.25 0.25
Repetitions 10 per rule set 10 per rule set 1 0 per rule set
Table 6.11 Run configurations- Runs 73- 102.

i. Stability
Final levels of surface Lock appear to be dictated by the slope angle of the surface. lt has
already been demonstrated that surface stability is a function of clast size. Results
indicate that in this experiment the three clast sizes respond differently to changes in
slope angle . There is a highly significant relationship between stability and slope angle for
each clast size fraction ; small ,-2 = 0.994, medium ,-2 = 0.988, large ,-2 = 0.987 (1%
significance for 8 degrees of freedom = 0. 765) . In this experiment, slope angle controls
the fina l probability of clast movement. On these surfaces the clasts are still free to move
and are not significantly jammed or locked together. Slope angle has been shown to
control to fi nal rate of surface activity, but it can also be related to the speed with which
the surfaces stabilize, which has implications for the surfaces in the Badia. Figure 6.21
illustrates Expapp curves fitted to the y2-Lock output for Runs 73 - 82. lt is clear that as
slope angle increases the final stable state of the surface tends to be more mobile.
~ t)
0 __J
0.1
~ 0.05
0
1.0
0.9
0.8
- 0.7
0.6 0.5
0.4 ------------------- 0.3
------ ----------- --- - - - - - --- --- - - --- - ----- - --- 0.2
4 40 iterations
400
0.1
4000
Figure 6.21 Influence of slope angle on Lock - Runs 73 - 82. The value of slope va lue is labeled on each line
Figure 6.21 also suggests that the rate of change to a stable state is also increased by an
increased slope angle. Figure 6.22 reiterates this, showing a strong relationship between
k-Lock, the rate of change in the Expapp model and slope angle.
-293-

Chapter 6: Modelling
" Small + Medium 0 Large
0.08 .. X
0.06 X
)(
~ () 0 0.04 _J
I ~
.. +
X +
0.02 -+
• 0 .. 0 )(
)( 0 0
)( 0 0 + 0
~ 0 0
0 -I I
0 0.2 0.4 0.6 0.8 Slope angle
Figure 6.22 Relationship between slope angle and the rate of chan ge to stable state
Rates of change to a stable state increase more consistently with increased clast size.
This is a reflection of the increased dampening incurred by the greater complexity of
multiple interactions experienced on larger clast dominated surfaces. For all clast sizes
the rate of change to a stable state increase with slope angle. The implication of this to the
northeastern Badia concerns the condition of various portions of a slope profile. The lower
response time for adjustment on higher slope angles means that surface modification
could be expected to be greatest at these points . Low angled slopes may represent
immature surfaces. The degree to which the surface can be modified maybe limited by the
low slope angle and reduced activity of gravity driven processes. The situation is further
complicated in the field by up-slope angle, which has previously been shown to be an
important control on local slope form and process. A low slope angle at the base of a
concavity may be significantly modified not as a resu lt of its local slope angle, but rather
as a product of the up-slope cond itions. The model is not capable as assessing the
influence of whole slope profile form. Figure 6.21 and Figure 6.22 suggest that at lower
slope angles the modification of the surface is muted .
ii. Organization
There is a significant re lationship between the values of slope ang le and y2-0rg. The
nature of the link between slope and y2-0rg varies considerably between clast fractions.
For small clasts the relationship is negative, with clustering apparently reducing with
-294-

Yl (;)
Chapter 6: Modelling
increased slope, whereas on medium clast dominated surfaces clustering increases with
slope angle. Both relationships are statistically significant (,-2 = 0.632 for 5% confidence
limits). Clast size and the resulting variable nature of clast interactions act as a significant
control on surface dynamics. The relationship between slope angle and the behaviour of
the largest clast fraction is not statistically significant.
y2 = 1.429- 0.012 x slope r2 = 0.674 RMSE = 0.003 n = 10
1.43 0
0 ... ... ... ... o', ...
2.38
Yl (;) Cll 2.36-(3
y2 = 2.318 + 0.050 x slope r2 = 0.677, RMSE = 0.011 n = 10
Cll (3 1.425 ... ... ... E ro E
... ... ... 0
.!!:.-
Ol
... ... 0
0 ...... ...
~
'0 <1> E 2.34 -
0 1.42
...... 0 ... ... ...
Ol
... 0 I
N >-
N 2.32-... ' >-...
0 b-., ' 0
1.415 L:,-----..,----,---.-----..---0,.... 2.3 -...,...._ __ """'l"'", -----r-, ----;-------r,-----;-,
0 0.2 0.4 0.6 0.8 0 0.2 0.4 0.6 0.8 1
Slope
Figure 6.23 Relationship between slope angle and y2-0rg, small and medium clast sizes
Visually the differences between clast size behaviour are difficult to discern (Figure 6.24).
lt is clear that the absolute range in values of y2-0rg remains small but nonetheless
distinct differences exist in clast size behaviour.
-295-

Chapter 6: Modell ing
73 83 93
77 87 97
82 93 102
Figure 6.24 Output images Run set 4
Analysis of variations in fractal dimension show an insignificant relationship with in y2-0rg
with slope angle (small ~ = 0.024; medium ~ = 0.035; large ~ = 0.248, 5 % significance
when N = 10, ~ = 0.632) . Slope is therefore a poor predictor of surface fractal dimension.
Modification in the surface tends to form clusters, the distinction of which is dependant on
clast size. Self similarity and order as described by the box fractal dimension is not
influenced by slope angle. This reiterates the distinction between the nature of structure
described by y2-0rg, namely clustering , and that described by the fractal dimension,
namely self-similarity. Using box fractal dimension as a measure of surface pattern and
structure suggests that slope is not influential. lt is clear however that subtle differences
emerge in the degree of surface clustering with variations in slope angle. The rate and
nature of change with which the surfaces adopt a final asymptotic condition of stability is
linked to slope angle but the final condition itself is not linked to slope form . Applied to the
northeastern Badia the model results support the findings which suggest that slope as a
sole predictor of surface organization is not reliable.
-296 -

Chapter 6: Modelling
3.7.5 Run set 5- The influence of edge weighting
Dunkerley ( 1995) advocated the use of what he termed appropriate statistics to describe
and explain coarse clastic surfaces. He suggested the use of edge, area and volume
weighted mean intermediate axes was a more appropriate method of quantifying surfaces
as the weighted means represent more closely the controls on surface processes. In the
image analysis and within the context of the model, edge and area can be directly
measured from which volume can be extrapolated if clasts are assumed to be perfect
cubes. Weighting in the model is used as a surrogate for the propensity for a clast to
undergo movement. The behaviour of a surface whereby the probability of movement
(p(clast)) is proportional to edge-length, area or volume, is be compared. The following
series of experiments is designed to examine the influence of weighting the probability of
clast movement to edge length, surface area and a surrogate value for clast volume.
Results of these experiments help to suggest the relevance of weighted measures as a
means of understanding clastic surface dynamics, if an iterative mechanism of surface
modification is appropriate.
In the model run-sets previously undertaken thus far the ratio of probabilities for each of
the size fractions has been based on clast area. Four subsets of tests were undertaken.
The first, Runs 103- 105, examines surfaces with a mixed clast size distribution. Runs
106- 108, Runs 109- 111 and Runs 112- 114 consider small, medium and large clasts
respectively for comparison, each with an area, edge and volume weighting. Again
variables not under examination are maintained at a constant level. Run configurations
determined using the weighting system described in Table 6.12 are given in Table 6.13
and Table 6.14.
-297-

Chapter 6: Modelling
Area Edge Volume
Small 1 4
Relative Medium 4 8 8 Weightings Small
Large 9 12 27 D Total 14 24 36
Unit weighting (1/ Total) Individual 0.0714 0.0417 0.0278 Medium
m Small 0.0714 0.1667 0.0278 Clast Weightings
= Relative weightings x Medium 0.2857 0.3333 0.2222 Unit weighting
Large 0.6429 0.5 0.75 Large
Reciprocals -- ----~··
Small 0.9289 0.8333 0.9722
Final clast weightings Medium 0.7142 0.6667 0.7778
large 0.3571 0.5 0.25
Table 6.12 Calculation of edge, area and volume weighting
Run set Percentage cover = 33 %, clasts in ratio 3 Small clasts only (cover= 33 %)
(small) : 2 (medium) : 1 (large), weighted by area
Run number 103 104 105 106 107 108
Matsize 125 125 125 125 125 125
Totcl 1547 1547 1547 5156 5156 5156
Small rocks 773 773 773 5156 5156 5156
Medium rocks 516 516 516 0 0 0
ITmax 4000 4000 4000 4000 4000 4000
Sang le 0.5 0.5 0.5 0.5 0.5 0.5
p(small) 0.929 0.833 0.972 0.929 0.833 0.972
p(medium) 0.714 0.667 0.778 0.714 0.667 0.778
p(large) 0.357 0.5 0.25 0.357 0.5 0.25
fdlag 0.25 0.25 0.25 0.25 0.25 0.25
Dfddlag 0.125 0.125 0.125 0.125 0.125 0.125
Flat 0.25 0.25 0.25 0.25 0.25 0.25
Repetitions 10 per rule set
Table 6.13 Run configurations- Runs 103-108
-298-

Chapter 6: Modelling
Run set Medium clasts only (cover= 33 %) Large clasts only (cover= 33 %)
Run nreiumber 109 110 111 112 113 114
Matsize 125 125 125 125 125 125
Tote! 1289 1289 1289 573 573 573
Small rocks 0 0 0 0 0 0
Medium rocks 1289 1289 1289 0 0 0
ITmax 4000 4000 4000 4000 4000 4000
Sangle 0.5 0.5 0.5 0.5 0.5 0.5
p(small) 0.929 0.833 0.972 0.929 0.833 0.972
p(medium) 0.714 0.667 0.778 0.714 0.667 0.778
p(large) 0.357 0.5 0.25 0.25 0.25 0.25
fdiag 0.25 0.25 0.25 0.25 0.25 0.25
Dfddiag 0.125 0.125 0.125 0.125 0.125 0.125
Flat 0.25 0.25 0.25 0.25 0.25 0.25
Repetitions 10 per rule set
Table 6.14 Run configurations- Runs 109- 114
i. Stability
The image analysis in the northeastern Badia suggests that the consideration of the edge
lengths, areas and volume of clasts through process appropriate weighting provided a
valuable link between surface form, slope and hydrology. The change in relationship
between the type of edge weighting and the stability of the surfaces appears systematic.
Table 6.15 shows the final mean value of stability for each of the weighting regimes for
surfaces with a mixed clast size distribution.
Weighting y2-Lock k-Lock
Edge 0.0229 0.0199
Area 0.0195 0.0202
Volume 0.0161 0.0226
Table 6.15 Influence of weighted means on surface Lock
Weighting the probability of clast movement by a measure of a higher dimension, for
example area and volume, reduces the final stability of the surfaces. Three-dimensional
volumetric weighting leads to a lower value of y2-Lock than the one dimensional edge
length weighting. The surfaces under volumetric weighting are more stable. The difference
in results is explained as a function of the shift in ratio of the relative influence of the large
to small clasts controlling the surface dynamics. In volumetric weighting, the ratio of small
-299-

Chapter 6: Modelling
to medium to large clasts is 1 : 8 : 27, whereas under the edge weighting condition this
ratio is 1 : 2 : 3. As the dimension of the weighting factor increases, the proportional
influence of the largest clast fraction in the distribution is amplified geometrically. Under
volume weighting the probability of movement for a large clast is, in relative terms, low. As
these clasts tend to dominate the behaviour of mixed populations, as shown previously,
the rate of change in surface modification is low.
An assessment of which of the weighting strategies is more appropriate to the conditions
of the northeastern Badia is difficult to undertake in the absence of direct measurement of
clast movements in the field. The diversity of results generated by the different methods of
weighting in the model has some interesting implications. In the field it has been noted
that the dominant process in action may alternate between locations. In parallel is the
systematic variation of ground surface form, which as demonstrated has a profound
influence on surface behaviour. lt is plausible that the importance of different facets of the
surface character have a variable influence on surface form between different locations.
Take for example a storm on a slope profile. At the top of the slope clast area may play a
critical role in intercepting raindrop impact or concentrating overland flow. At the mid-point
of the slope, where flow depths and pending are such that the impact of raindrops is
negligible, edge length may be of greater importance in partitioning infiltration from
overland flow. At the base of the slope, where wetting depths are greatest and hence
shrink - swell processes may be at their greatest, the volume of the clast may play an
important role as its mass, which is directly proportional to volume, may determine the
tendency of the clast to topple or settle on the sediment surface. The model has shown
that variable weighting can alter surface movement. If behaviour is relative to different
aspects of the clast surface in the northeastern Badia, then it would not be unreasonable
to expect that surface dynamics vary accordingly, as suggested by the model.
-300-

Chapter 6: Modelling
ii. Organization
Surface structure is dictated by the shifting ratio of importance of small to large clasts as
the dimension of the weighting employed increases. Table 6.16 shows the relationship
between y2-0rg and the weighting type and also shows the variation in box fractal
dimension.
Weighting
Edge
Area
Volume
y2-0rg
3.5418
3.5778
3.6090
Box fractal dimension
1.7603
1.7629
1.7688
Table 6.16 Org and fractal dimension relative to weighting type
Variation in Org appears systematic, but is not pronounced. Increases in clustering,
suggested by an increased level of y2-0rg corresponds well with increasing values of the
box fractal dimension. The surfaces do not show a preferential tendency to either
clustering or self-similarity, but rather both appear to increase as the dimension of the
weighting increases. Variable levels of surface organization previously identified as a
result of the influence of weighting are to an extent reflected in the field. Only very subtle
variations in surface organization and structure are apparent from the spatial analysis of
the model output. Natural variability of the surfaces in the field may act to mask such a
subtle variation incurred by the effect of the changing importance of different attributes of
the clasts in controlling surface processes and form. The tendency the slopes of the
northeastern Badia to exhibit systematic variations in surface organization is commonly
shrouded in naturally occurring noise. Visually it is difficult to explicitly say which surfaces
are the most ordered (Figure 6.25). Without an entirely robust method of comparison
between two dimensional patterns or levels of organization, the distinction of this type of
phenomena in the field is virtually impossible. Examining various weighting parameters
has shown another potential control on surface form which can directly be extrapolated to
the geomorphology of the northeastern Badia surfaces. Specifically the variable role and
dominance of process action down the slope profile may well be influenced and
represented most appropriately by clast measures with variable weightings.
-301 -

Chapter 6: Modelling
Edge
Area
Volume
Mixed Small Medium Large
Figure 6.25 The influence of edge weighting and clast size on surface form. Final model output- Run set 5

Chapter 6: Modelling
3.7.6 Run sei 6- The on1fluence of ll"andomly generated model conditions
A final set of run configurations was undertaken to examine the response of the surface to
randomly generated conditions. The results so far have been based on systematically
chosen model conditions, with linear iterative incremental changes in model parameters,
which mirror variations noted in the field. Model output and behaviour can be related both
qualitatively and quantitatively to observations from the field, both in terms of form and
process.
This series of experiments aims to examine whether the behaviour previously seen also
occurs under random conditions. If so, then it could be suggested that the variations in
model response and potentially in the field, may be entirely due to the action of random
processes and hence be due to chance. Conversely, if random conditions fail to replicate
the behaviour observed then tentative suggestions can be made that the surfaces do not
behave under random conditions and that a certain degree organization and feedback
between surface form and process is responsible for contemporary form and process on
the northeastern Badia slopes. A series of experiments is developed within which the
probabilities of clast movement, slope and the interclastic frictions are determined by
random number generation between 0 and 1. Dfddiag is maintained at half the value of
fdiag to sustain logical totalistic behaviour of multiple clasts (Table 6.17). The five
experiments undertaken comprise a mixed clast size distribution with small to medium to
large clasts in the ratio 3 : 2 : 1, at a fixed ground cover percentage of 33 %.
Run set Cover percentage (33 %), 3 : 2 : 1 ratio of small, medium and large ---------- - - -- - ·--
Run number 115 116 117 118 119 ----- -- ·---- -· - -----
Matslze 125 125 125 125 125
Totcl 1547 1547 1547 1547 1547
Small rocks 773 773 773 773 773
Medium rocks 516 516 516 516 516
ITmax 4000 4000 4000 4000 4000
Sang le 0.7044 0.3769 0.4374 0.4275 0.0015
p(small) 0.7336 0.4192 0.2825 0.4451 0.0752
p(medium) 0.0763 0.1794 0.1281 0.1089 0.0484
p(large) 0.5091 0.1306 0.6128 0.2780 0.9861
fdiag 0.7560 0.4930 0.7345 0.8401 0.5767
Dfddiag 0.3780 0.2465 0.3673 0.4200 0.2883
F, •• 0.7362 0.0753 0.9597 0.9671 0.7995
Repetitions 10 per rule set
Table 6.17 Run set configurations- Run set 6
-303-

Chapter 6: Modelling
i. Stability
The random generation of run conditions produced a variety of surface behaviours. Where
unusual surface behaviour occurs, it appears that it can be directly related to a single low
probability of clast movement. The results of the experiments are show in Table 6.18.
Mean Mean Rate of RMSE Run f(move) p(move)
Y2-Lock change (k- (Expapp) Lock)
115 0.623 0.506 0.273 0.073 0.002
116 0.272 0.277 0.010 0.054 0.000
117 0.687 0.365 0.067 0.001 0.002
118 0.742 0.315 0.112 0.046 0.002
119 0.555 0.278 1.267 0.000 0.001
Table 6.181nfluence of randomly generated run configurations on surface Lock
Differences in the behaviour of the surfaces can be explained by examining the minimum
probabilities of movement and friction. In run 115, p(medium) = 0.076, in run 116 f1at = 0.075 and in run 119 Sangle = 0.0015, p(small) = 0.075 and p(medium) = 0.048. The
combined effect of low values of Sangle, p(small) and p(medium) in run 119 result in an
effectively static surface, with virtually no clast movement expect at the very start of the
experiment, as indicated by a very low value of k-Lock. Run 118, for example, has no
significantly low movement or friction values. The surface in Run 118 takes a longer
period of iterations to stabilize, and when it does so, it stabilizes with more freedom of
movement than the other run set-ups.
Surface movement is sensitive to individual variables. A single low value of either friction
or movement can cause a surface to jam very rapidly, even before a structured or ordered
state is reached. Under random conditions surfaces are not always able to modify
themselves spatially, and so organization is often limited. Surfaces appear to stabilize at
levels influenced by purely one contact rule or interaction. The combined influence of
multiple interactions appears to be of less importance when one interaction rule has a
magnitude which is significantly different to the rest. The implication for the northeastern
Badia is that if for some reason, be that external or internal to the slope system, one type
of interaction limits clast movement substantially more than other interactions, then the
surface may behave in a static manner, showing limited dynamics and modification.
-304-

Chapter 6: Modelling
i. Organization
Org statistics and the box fractal dimension show a variety of surface structure and levels
of organization emerging from this series of experiments (Table 6.19).
Run y2-0rg k-Org Box fractal dimension
115 1.2002 0.0947 1.9056
116 2.0627 0.0021 1.8537
117 1.2120 0.0739 1.8962
118 1.2202 0.1452 1.9007
119 1.2674 0.0003 1.8973
Table 6.19 y2-0rg and box fractal dimension - Run sets 115 - 119
y2-0rg varies between Runs 115 to 119. The most noticeable departure to clustering is
seen in Run 116. Run 119 experienced relative little modification shows no significant
departure away from a completely random spatial distribution. The rate of change to Org,
represented by k-Org reflects to role of single low probabilities of movement or high levels
of friction in the dictating the outcome of the model. Under a randomly generated
distribution the mean number of contacts for all clasts on the surface is 1.279. Departure
from this value indicates the degree of modification. Runs 115, 117 and 118 all show
values less than 1.279, whereas the static surface in Run 119 is closer to this figure. The
box fractal dimension again reiterates this suggestion. The most highly modified surface
seen in Run 116 demonstrates a higher degree of linearity returning a lower fractal
dimension. The remaining four runs show no discernable differences or departures from
the initial random condition, as is reflected in the model output images in Figure 6.26.
Under random conditions that model generates a variety of outputs which appear to be
commonly related to extraordinary values of either frictions and or probabilities of clast
movement. The model has demonstrated that under randomly generated conditions, order
and structure and a stable surface form can emerge. In the northeastern Badia it is
unlikely that random conditions exist. Feedbacks between clast size and shape should
logically effect the nature of interactions between clasts. Systematic variations in surface
character have been noted and related to slope and process action. lt would seem logical
and plausible to assume that the nature of interactions and feedbacks on the surface is
equally non-random.
- 305-

Chapter 6: Modelling
Figure 6.26 Model output images - Run set 6
- 306 -

Chapter 6: Modelling
6.8 Discussion
The model developed as part of this study generates a valuable series of results. The
model structure behaves in a manner which can be conceptually linked to the behaviour of
the surfaces of the northeastern Badia. Rather than a direct visual comparison between
the model output and the real world environment, the quantitative assessment of the
dynamics and behaviour of the model appear to closely mirror features observed in the
field. Temporal variations in the model output match spatial variations observed at various
positions down-slope in the field. The model succeeds in explaining links between clast
form and surface spatial configuration where the previous regression analysis, using a
linear model, only returns insignificant relationships. As such, the model is a good
predictor of where pattern or structure does and does not occur. In many instances an
incremental, or linear, variation in model parameters results in a distinctly non-linear or
chaotic response in surface behaviour and form.
The Expapp model, which suggests an exponential approach to an asymptotic stable
state, appears to be an appropriate method of describing the stabilization of the modelled
surfaces. The model suggests that even though the surfaces on the whole do not obtain a
static condition, they do maintain their form at a consistent level. The value of the stable
state is intimately linked with both the character of the whole surface and the character of
the individual surface clasts. Additionally, the rate at which the surface reaches a stable
state is controlled by the specific characteristics of the surface clasts.
The parametric analysis of the influence of clast variables has demonstrated that subtle
variations in clast interactions have a significant influence on the behaviour and final state
of the surface. The model is sensitive to minor perturbations in clast interaction
parameters. In several instances surprising results are generated. For example, on a
surface with a mixed clast size distribution, it is not the most mobile clasts which are the
most free to move but rather the larger clasts which act as core stones to lock together
and inhibit the movement of the other clasts on the surface.
Clast size, as a commonly quoted measure of surface form, is a vital control on the model
behaviour. lt is apparent that as the size of the clasts increases the complexity of the
interactions between clasts increases. In the model small, medium and large clasts often
all behave in a very different manner. The various clast sizes appear to behave and
-307-

Chapter 6: Modelling
respond to the initially random conditions in a variety of ways. An example of an
implication of the model results is the difference in dynamics of surfaces on different
basalt types, due to the control of clast form and size distribution. If the initial starting
condition of clast form is dictated by the jointing structures or mineralogy of the underlying
basalt, but the subsequent modification of the surfaces is as a result of similar processes
regimes, then all surfaces will tend not to evolve to a single characteristic form. The final
surface condition is linked directly to the initial conditions and the nature of clast
interactions which this dictates. The diversity of surface form and variations in surface
form observed may therefore be a function of different surface responses to a similar
pattern of climatic forcing, rather than a series of snapshots at various stages of a linear
path of surface evolution.
lt is difficult to relate the influence of local slope to surface form variations in the field. The
logical assumption would be to assume that an increased slope angle acts purely as an
accelerator to the surface processes but slope has been found to influence the various
clast sizes in a different manner in the model. Given the non-linear response of many of
the other parameters studied, the influence of slope has been found to be equally
complex. The distinction in surface behaviour with slope has several implications for a
whole slope understanding of surface behaviour. Slope may influence the rates and the
magnitude of various fractions of the clast size distribution in different ways. Changes
down-slope cannot therefore be directly related to slope angle alone.
The examination of edge weighting raises the suggestion that the role of dominant
processes may change with position down-slope or across the landscape. At the top of a
slope profile, where raindrop impact in the dominant control on sediment mobilization and
surface modification, it is the planimetric projection of the surface or clast area that is a
vital control on surface process and modification. At the slope mid-point where runoff
depths are increased, the transmission of water into and across the surface is more
closely dictated by clast edge lengths. At the slope bottom, where sediments are
saturated, it maybe clast volumes which hold a more significant control as they are
effectively suspended in the sediments and their position directly dictated by clast size.
Given the ages of the surfaces, it may be expected that they should be considered to be
tending towards mature landforms. The image analysis and the experiments on surface
hydrology have demonstrated that there is a close symbiosis between contemporary form
and process, suggesting that the surfaces are dynamic and responsive to contemporary
conditions. The model demonstrates a similar manner of behaviour. The surfaces obtain a
stable state under which they are directly controlled by the state of the interactions
- 308-

Chapter 6: Modelling
between the surface clasts. An interesting line of enquiry would be to explore the
response and relaxation of a system to a disturbance or alternation in the base conditions
of the model. The modelled surfaces, given their close link to the model parameters, are
dynamic. The surface also appears mature in that all have obtained a steady state of
behaviour after the completion of the model experiment. Relating this to the northeastern
Badia opens some interesting suggestions. Many of surfaces show a departure away from
complete spatial randomness in clast arrangement. The model has shown that pattern is
not necessarily indicative of a stable or mature surface but is more closely linked to the
specific conditions on that surface.
The model has been successful in creating a range of levels of surface organization. As
with the image analysis in the northeastern Badia, the model produces a gradual transition
in surface organization. Both contradict observation in the field that pattern is a discrete
entity which is either present or absent. Systematic variations in the severity of surface
organization are apparent with variable in model parameters. All of the surfaces generated
show some form of departure from complete spatial randomness. In the field, an observed
regularity in the distribution of surface clasts was associated with a spacing dictated by
the size of the clasts, relative to the centroid position, and was not therefore considered
an artifact of surface dynamics. The model suggests that even slight variations in the
levels of surface form variation may be directly to the dynamics of the surface.
The modelling procedure attempted to examine ideas of self-organization and assess how
relevant these considerations are to understanding the dynamics of the slopes of the
northeastern Badia. There are many apparent similarities between the behaviour and
output of the model developed and those of other self-organizing systems (Shultz, 1998).
Direct comparisons of model results between this study and others are of little value given
the diversity in modelling approaches and interpretations of the concepts of self
organization. Several key features are however apparent. First, the model generates
emergent structures (Harrison, 2001) such as dendritic networks, regular lineations and
clustering. The model is therefore reliable, as the results generated from different
randomly generated starting conditions are very similar, under similar modelled
parameters. The nature of the emergent properties cannot easily be discerned from the
individual character of the systems components. Second, the model displays homeostasis
between the action of process and the resulting form, and vice-versa. The modified
surface form alters the way in which the process acts to further modify the surface.
Finally, the model, based on an iterative mechanism of surface modification, appears to
be a sensible and successful method of described the development or the land surface
- 309-

Chapter 6: Modelling
forms in the Badia. The interaction between multiple clasts generates complex behaviour
from a few simple rules, all of which can be linked to geomorphological variations in the
northeastern Badia. The nature of change, the rate of change and the final resultant forms
generated by the model appears consistent with the geomorphological variations in the
northeastern Badia. What remains an unknown is the actual rates of change and
modification of the surfaces. As suggested, what is today considered a high magnitude
event may only be considered to be one of many iterative events in the evolution of the
northeast Badia surfaces. Conversely, the influence of contemporary small scale events is
not known. Only by monitoring the processes directly in the field over a long period can an
understanding of the rates of change in this landscape be understood. What is clear from
the model and from the field investigation is that the contemporary surfaces are dynamic
and reflect the current nature of surface processes.
6.9 Conclusions
Many characteristics of the forms and the nature of changes developed by the clast lock
model have close analogies to observations from the Badia. The modelling approach
appears to perform well and generates results with direct and logical parallels with the
natural surfaces of the northeastern Badia. Clear non-linear effects of linear changes in
modelled parameters occur. Consistent changes in measures of surface stability and
structure are apparent. The hypothesis of iterative surface modification as the main
mechanism of surface organization appears to be true, both in terms of the model output
and in terms of the potential nature of process action in the northeastern Badia. Despite
the rather crude spatial resolution of the model it provides an alternative method of
exploring the linkages between various surface slope and hydrology parameters. If
nothing else, it provides food for thought on mechanisms and dynamics of surface
modification processes.
Several key points have been raised from this modelling exercise. What often appears on
a visual basis to be distinctly organized may only be, on a quantitative basis, only slightly
different from a resulting image with little qualitative impression of order. Each of the run
setups has raised suggestions with regards the nature of dynamics on the surfaces and
identified critical controls on surface form variation. Of equal importance is the consistency
of the model in demonstrating where organization does not occur. Finally, levels of
structure and the rates with which the surface adjusts can all be linked to the nature of the
interactions between the surface clasts.
- 310-

Chapter 7: Cone! us ion
- 311 -

Chapter 7: Conclusion
Clhapter 7: Conclusion
7.1 Summary of thesis
The principal aim of this thesis has been to provide a geomorphological assessment of
coarse clastic slopes in arid environments, based on the characterization of form
explaining contemporary hydrological processes and modelling ground surface
modification.
The main objectives were to:
i. examine the variations in ground surface character on arid coarse clastic surfaces;
ii. examine the variation in slope hydrology and process action on arid coarse clastic
surfaces;
iii. explore linkages between ground surface character, slope profile form and surface
process action;
iv. use a detailed study of slope form and process as a basis for understanding the
temporal development of clast surface organization;
v. apply the results of a model of clast dynamics, to aid the understanding of surface
and landscape development.
- 312-

Chapter 7: Conclusion
7.2 Original contribution to knowledge
This study uses a scaled approach which enables links between surface form and
processes at the plot scale to be considered in the wider landscape (Chapter 3). Plots are
positioned using a systematic technique based on a semi-quantitative nested sampling
strategy. Results generated from the plots selected using this method show a consistent,
logical and systematic variation in surface character and process action.
Ground surface characterization using the newly developed image analysis technique
shows a much greater level of detail and variety in surface measures than previous
studies (Chapter 4 ). The aerial image analysis provides a flexible technique from which a
large spatial and statistically significant sample can be collected. Many of the new
measures of the in situ nature of the surface form commonly exhibit a more logical nature
of change than conventional measures of clastic surface form. The nature of variation
within and between basalt types has been shown to be complex and the character of the
ground surface varies downslope. In general clast texture becomes smoother, more
rounded and the size distribution more constricted towards the base of slope profiles. The
nature of downslope change is complex and is linked to slope form, location and
underlying geology. Individual basalt flows can be clearly delimited by their surface
character, each showing a distinct ground surface character.
Individual measures of surface form commonly show a different nature and magnitude of
change down slope profiles. The complexity of the change in surface character is a
reflection of relative intensity and dominance of one or more formative processes acting
on the surface. The processes include: those which modify individual clasts, for example
weathering; those which modify the spatial condition of the surface, or example iterative
clast movements; and processes which influence the whole profile surface form, for
example the influence of aeolian processes relative to slope hydrology. Many of the
variations in surface form can be directly linked to the logical variations in slope process
action, described in this study through an examination of slope hydrology (Chapter 5).
The concept of adequacy of surface characterization, suggested by Dunkerley (1995), is
validated by the results presented in this thesis. Both weighted intermediate axis means
and the actual characteristics of the surface to which these approximate, measured
directly by the image analysis, return more significant results than conventional measures
of clastic surface form (Chapter 4). The consideration of adequacy and appropriate
measures is of paramount importance where variations in surface form are as subtle as
those observed in this research.
- 313-

Chapter 7: Conclusion
A series of feedbacks exist between surface form and process (Chapter 5). Surface
character has been shown, in some cases, to exhibit convergence downslope to a more
constricted style of surface form, the clast size distribution becomes more constricted
about a mean down-slope. In other instances, surface form has been shown to be
divergent, for example, the degree and character of surface organization increasing down
slope. This highlights the variable nature of processes acting to modify the surface form. A
potential feedback mechanism is the presence of clast structures, which may have a
significant influence on slope behaviour.
Surface organization of clasts has been quantified using three methods of spatial analysis
(Chapter 4). The degree of surface organization can be linked directly to slope and
surface cover variables, and in many instances performs better as an indicator of down
slope change in surface form than other variables. No previous attempt to quantify the
spatial distribution of clasts on similar surfaces has been made. Marked systematic
variations in surface form will hold an equally significant control over slope process and
should be considered in any model of slope or catchment hydrology. Mean values of
average slope hydrology may hide a significant degree of variation in surface form and
process, as seen in the result of this research. The subtle, yet consistent, variation in
slope surface character across the landscape, suggests a mechanism of small-scale but
spatially extensive iterative surface modification. Additionally, systematic downslope
variations in surface character suggest a slope process control on surface form, yet
previous work has demonstrated that the mobilization of such massive clasts by overland
flow is not a feasible mechanism of clast movement.
The surface characterization has demonstrated that a direct link between surface form
and basalt age is not clear. Variation in the surface character on the slopes of a single
basalt is complex and appears to be intimately linked with slope form. Variation in ground
surface character appears consistent between basalt types. Given the diversity in slope
profile form identified within just one basalt type, it is tenuous to suggest an evolutionary
link between ground surface character, slope profile form and basalt age from the results
presented in this thesis.
The examination of the surface hydrology in the northeastern Badia describes the nature
of contemporary slope process activity (Chapter 5). The simulation of high-magnitude rain
storm events has been successful in elucidating variations in surface hydrology. A distinct
variation in surface hydrology has been noted and is convincingly explained by links with
slope, surface profile form and process. The hydrological characteristics examined appear
- 314-

Chapter 7: Conclusion
to adhere to the characteristics of surfaces in similar environments (Abrahams and
Parsons, 1992). Sediment mobilization, although limited in the experiments, is strongly
dictated by splash detachment. Evidence has been presented which suggests that the
clastic surface acts to mute the hydrological response of the slope. The muting of the
surface response is increasingly apparent towards the base of the slope profile. The top of
the slope profile commonly exhibits a flashier and responsive surface hydrology relative to
the increasingly muted response further down-slope. The variation in surface hydrology is
noted both in terms of response times and volumes of runoff generated.
The role of surface clasts in dictating surface hydrology and rainfall partitioning has been
demonstrated through the use of both ring infiltration experiments and plot-based rainfall
simulation (Chapter 5). The presence of fine loose sediments is incongruous with a
surface which experiences high volumes of high-velocity overland flow. Only limited
evidence of gully or rill development is apparent, again supporting the suggestion that the
surface clast cover strongly dictates and mutes the action of slope hydrology and overland
flow.
An examination of whole slope profiles has demonstrated the complexity of surface
hydrology (Chapter 5). The influence of the upslope area, slope angle and the specific
ground cover characteristics all control the form of the surface and the efficiency of
surface processes. Any attempt to understand catchment scale hydrology must take into
account this diversity in surface response. These findings have implications for other
studies of catchment scale slope hydrology on clastic surfaces beyond the northeastern
Badia. One such method of accounting for the variation in average slope hydrology has
been the detailed surface characterization. The characteristics of the in situ nature of the
surface derived by the image analysis are highly successful in predicting slope hydrology.
The success of the planimetric assessment of surface character as an indicator of surface
hydrology shows both the appropriate nature of the characterisation method developed.
A cellular automata model was developed to simulate the spatial modification of the
surface clast distribution, as influenced by a range of physically constrained modelled
parameters. Many of the features and the responses to variations in model parameters
closely mirror variations observed in the field. The model demonstrates complex
behaviour in response to linear variations in controlling parameters which are synonymous
with naturally occurring variations in surface character. Although spatially crude and
simplistic, the behaviour of the model is also logical, showing variations and behaviours
which can conceptually be linked to geomorphological processes in the field.
- 315-

Chapter 7: Conclusion
A main benefit of the model is instilling alternative ways of considering the interactions of
form and processes on clastic arid surfaces. Non-linearity in the field is also apparent in
the behaviour of the model. Subtle variations in individual model parameters appear to
hold a significant influence over the outcome of the model. Surfaces are sensitive and
responsive to slight variations in surface or clast form. The initial starting conditions of the
model are influential on the model behaviour and outcome. The surface cover percentage
returns a wide diversity of behaviours and generates a range of organizational and
structural characteristics (Chapter 6). In addition the clast size sorting, the angle of slope
and the nature of friction between clasts influenced the behaviour and outcome of the
model. The surfaces in the model show a quasi-stable state under which an asymptotic
level of clast movement and surface organization is apparent. Once they have reached
this state surface exhibit only a limited departure similar characteristic to the local scale
heterogeneity observed in the field.
The final stable state of the surface, the speed with which the surface obtains that state
and the final level of surface structure all appear to be independent. No one set or
individual type of parameter appears to dictate either dynamics or organization alone,
reflecting the complexity of the surfaces. In the example of different clast sizes, each of
the three clast sizes in the model appears to behave and respond differently. The
behaviour of clasts can in part be related to size or edge length, but again no one
overriding control is apparent. Slope is more than an accelerator of process action; the
differential response of surface clasts to forcing creates a different style of surface
dynamics on different slope angles. The behaviour of the model is not always intuitive.
This is not to say that the model output is illogical, or has no physical parallel. lt is more
that the controls on surface behaviour may not always be instinctive. For example, large
surface clasts are seen to be the most mobile fraction in a mixed clast size populated
surface. The displacement of the more easily movable small clasts is frequently dictated
by the larger clasts. Surface structures are commonly jammed around the large clasts,
which act as core stones.
The occurrence of surface structure and organization ranging from complete spatial
randomness to regularity, linearity and order has been quantitatively shown to be a
transition and not a dichotomy of forms. What appears as visually patterned or structured
is part of a gradual transition. In the field the observation that surfaces are either patterned
and structured or is been demonstrated using the image analysis and also in model the, to
be a snapshot of a gradual transition in surface forms. The visual perception is that
pattern emerges spontaneously, but quantitatively pattern has been shown to evolve. The
form of pattern and structure is complex. Pattern can be described in terms of linearity,
- 316-

Chapter 7: Conclusion
clustering, regularity and randomness. Examples of each of these features have been
observed in the field and the model output (Chapter 6).
The suggestion of an iterative mechanism of surface modification appears to be supported
by the model output (Chapter 6). The evidence from the model shows that when modelled
as an iteratively adjusting system, the surface form and behaviour is comparable to
features observed in the field. As such the iterative hypothesis of surface modification
draws many parallels between the real-world surfaces and the principles of a self
organizing system. The model has shown characteristics of self-organization, such as
emergence, convergence and divergence. A consideration of the concepts of self
organization has raised new and interesting ways of thinking about and understanding the
behaviour of surfaces.
The nature of spatial change in surface configuration can be used to infer the nature of
process action on the surfaces of the north eastern Badia. Rainfall simulation experiments
have highlighted the diversity in response to rainfall events across the desert surface
which mirrors the variations in surface character measured by the image analysis. The
experiments have illustrated the relative rates of runoff generation and hydrological
activity between locations, but the absolute rates of process activity and the mechanisms
that control the movement and organization of the surfaces remain unknown. Several
tentative suggestions can be made as to which are the most important mechanisms
behind the movements of surface clasts. All movement mechanisms discussed below are
focussed on the promotion of a vertical displacement of the clast which then resettles
preferentially downslope.
The most important control on surface processes appears to be the action of water, both
through infiltration and overland flow generation. A slope process, controlled by increasing
volumes of overland flow downslope, would account for and be coherent with the nature of
downslope change in surface character described in this thesis. Overland flow has been
assessed at the micro-scale examining only small volumes of runoff generated from a
small plot experiment. Volumes of overland flow over the whole slope profile remain
unknown given the role of enhanced infiltration around surface clasts, and the variable
nature of surface sediments. The surface clasts remain relatively massive when compared
to the transport capacity of overland flow and are unlikely to be transported through direct
entrainment. Smaller clast fractions may be preferentially sorted downslope by overland
flow accounting for some of the evidence presented above. Elsewhere I have undertaken
a series of flume experiments examining the influence of scour erosion on clasts in a
simulation of conditions on desert slopes such as those seen in the north eastern Badia
- 317-

Chapter 7: Conclusion
(Rosser, 1999). A surprising conclusion of this work was that scour-hole development and
erosion on the upslope margin of the surface clast commonly instigated the small scale
upslope movement of a clast as it toppled into the hole. Clast movement was greatly
inhibited when two or more clasts came into contact and locked, as demonstrated in the
cellular model.
The activity of hydrological processes, predominantly infiltration, may result in a
differential action of secondary moisture driven mechanisms. Evidence for secondary
processes is available in abundance, but again deficiencies of directly monitoring these
processes due to their rates and magnitude inhibits our understanding of them in the field.
During the winter months severe frosts occur, with notable ice crystal growth around water
pipes and standing water pools. The depth of penetration of frost or indeed water
infiltration into the desert surface is not known but evidence for the presence of water in
the soil horizon is apparent; gyspum and calcrete accretions are all evidence of the
presence and transfer of water through the desert soil. Carbonate collar accretions in
rocky desert soils have been studied as indicators of water movement through the soil and
indicators of previous process activity (McFadden et al., 1999). Their role in directly
promoting movement has not been studied. These indicators of water movement may
themselves instigate clast movement through for example crystal growth during both
calcium carbonate and gypsum accumulation. Of these carbonate appears the most likely
to influence the position of surface clasts; gypsum is only commonly found deep in the
weathering horizon and not near to the surface, whereas numerous carbonate accretions
are often found at the surface or directly beneath surface clasts. Accretions commonly
exhibit tapering dripstone spikes, which may promote an iterative vertical movement as
they grow. This phenomenon has never been studied.
Material property analysis of the slope sediments indicates a high percentage of clay and
previous studies have noted a common occurrence of zeolite (lbrahim, 1994). Both clay
and zeolite are known to swell when saturated with water producing expansive forces,
which again may force a vertical unsettling of the surface clasts (Attorn and Barakat,
2000). Saturation of sediments may also contribute to a movement of surface clasts
through lack of buoyancy of the sediments in the waterlogged sediments, with clasts
sinking into the sediments. This has a preferential size sorting, with clasts that are
supported entirely in the wetted depth of sediments. On steeper slope angles sediment
wetting may also facilitate soil creep and downslope movement of surface sediments.
Additionally thermal properties of the surface need to be considered. The surface clasts
are black but the underlying sediments are light brown and it is evident in the field that
-318-

Chapter 7: Conclusion
clasts act as perfect radiators of energy. As such the exposed surface is commonly hot,
whereas the underside is frequency cool, frequently sustaining a moist soil patch beneath
clasts. This area attracts fauna which may have subsequent impacts on the soil structure.
The light sediment surface is highly reflective and observation suggests the penetration of
solar energy does not appear to reach a significant depth into the soil profile. This
diversity of energy transfer across the surface reflects the differential depths and
distribution of wetting during the rainfall simulation experiments. With such a steep wetting
gradient and potentially equal temperature gradient, clast movement maybe encouraged
by spatial variation in surface cooling or drying.
Mechanisms of movement which have been observed on surfaces described as more
conventional desert pavements can be applied to the slopes of the north eastern Badia.
One such example is winnowing (Higgitt and Allison, 1998), whereby the surface
roughness of the desert develops a rough boundary layer enhancing aeolian
sedimentation. Surface clasts iteratively maintain their position at the top of the sediment
surface through successive shrink and swell wetting cycles. This was suggested by Higgitt
and Allison (1998) for the north eastern Badia, and evidence presented in this thesis
supports this; only infrequently are clasts found suspended in an exposed sediment
profile, suggesting clasts are either weathered out or maintained at the sediment surface.
The rates of this process are however slow. A series of erosion plots in the Badia have
been cleared of clasts for a period of 8 years. None of the plots show a significant degree
of alteration or reworking from their original state after clearance. Rates of change are
either incredibly slow, or formative events are very infrequent. This long term experiment
covers a period during which large runoff generating events were known to have occurred
(Dotteridge, 1998), suggesting slow rates of geomorphic processes.
A further aspect of this environment that is poorly understood is the role of aeolian
processes. Clear evidence has been presented in this thesis which demonstrates the
spatial variation of aeolian deposition. The role of sediment remobilisation and deposition
in clast burial or exposure still remains poorly understood, but evidence in the field of
more intense deposition at slope toes and the scarcity of sediments at the slope crests
may equally be explained by aeolian processes as by the slope controlled hydrological
processes. The environment is clearly not dominated by aeolian processes. The
laminated sediment playa deposits, the spatial variation in clast shape and the step like
microtopography all indicate the role of hydrological processes, all of which cannot be
attributed to aeolian action.
- 319-

Chapter 7: Conclusion
In addition to the natural geomorphological processes responsible for clast movement,
there is a potential role for faunal or anthropogenic induced movement. Herds of goats
and sheep frequently walk across the desert in search of fertile grazing land. Visual
evidence of clast disturbance through kicking or shuffling by animals and herders has
been seen. Animal disturbance may play a critical role, but attributing all of the spatial
variations noted in this thesis to this process is dangerous. Animal disturbance does not
account for the gradual nature of down slope changes observed in the field, nor the
changes in particle shape. The poor relationship between the degree of reorganization of
the surface and slope angles, which would directly influence any variation incurred
through animal disturbance, is not strong. Anthropogenic disturbance is also either
present or not, and would therefore also not show the gradual nature of change identified
in the field.
Finally, all of the potential mechanisms of clast movement, both natural and
anthropogenic, must be held in the context of the historical conditioning that the north
eastern Badia has experienced. As discussed the present environmental conditions may
not have been consistent through the development of today's surfaces and as a result nor
has the degree of anthropogenic activity been constant. The relative influence and indeed
the actual action of all of the processes discussed is not known, but must clearly change
through periods of wetter or warmer climate.
In summary, the research in this thesis has generated a series of original findings which
contributes to the understanding of coarse clastic surfaces in arid environments, the
geomorphology of the northeastern Badia, geomorphological techniques and finally, the
application of self-organization to the understanding of clast mantled surface dynamics.
There is a need to consider the results of plot based assessments of surface form and
process in context of larger scale variations across the landscape. The in situ nature of
the surface appears to be the most appropriate perspective from which to study the
relationship between surface form and process. Surface clasts have a profound and
variable influence on slope hydrology. The surfaces of the northeastern Badia are
dynamic and not relict. Subtle links exist between the variability in contemporary surface
form and surface process. The processes which act to modify the surfaces are
multifaceted, often non-linear and frequently complex. The surfaces exhibit many
characteristics of a self-organizing system. The spatial organization of surface clasts is
both a cause and effect of variation in slope process action. Finally, no clear evolutionary
link between basalt age, slope form and surface character is apparent.
7.3 Extension to previous studies
- 320-

Chapter 7: Conclusion
This study has significantly extended previous work. Advances have been made in
methodological approaches, the understanding of coarse clastic slope geomorphology,
the understanding of the specific geomorphology of the northeastern Badia and finally, to
the application of self-organization as a tool for understanding the dynamics of earth
surface systems. The direct comparison of the research presented in this thesis to other
studies should be made with caution. Clastic surfaces in arid environments are as diverse
in character and genesis as the number of studies which have examined their
geomorphology. As a result, many of the findings of previous work are frequently site
specific and strongly dictated by the local climate, geology and the evolutionary history of
the region in question. Nevertheless several overarching advances can be proposed.
The influence of surface clasts on surface process has been shown to be complex and
diverse (Abrahams and Parsons, 1992; Poesen et al., 1994 ). The influence of clasts can
have both a negative and positive influence on process action (Poesen and lngelmo
Sanchez, 1994). This study has shown a similar variety of influences on surface hydrology
in the northeastern Badia. Convergence and divergence in both form and behaviour has
been observed to operate in parallel downslope profiles. Multiple regression analysis and
the use of a cellular model have demonstrated the sensitivity of surface form and
behaviour to slight variations in the character of the clast population. Complex and non
linear behaviour can be related directly to variations in simple characteristics of the
surface.
An intimate link between surface form and process has been shown in the northeastern
Badia and this research has identified the potential of surface process to alter form, which
in turn influences the action of the formative process. Previous work has tentatively
suggested a qualitative assessment of the influence of the spatial character of surface
form on surface processes (Abrahams and Parsons, 1994; Jean et al., 2000). The
tendency for qualitative comparisons is possibly because of the lack of a rigorous direct
comparison between two-dimensional patterns (Parsons and Abrahams, 1994; Jean et al.,
1999; Tribe and Church, 1999). This study has presented the first attempt to quantitatively
demonstrate both the nature of variation and the influence on process of surface clast
structures and organization. Much previous work has examined the influence of variable
surface form on the action of processes on coarse clastic surfaces (Abrahams and
Parsons, 1992). The use of a single storm simulation, specifically formulated to elucidate
the differences in surface response as dictated by surface form variations has
demonstrated the level of control which surface character affords on surface hydrology.
- 321 -

Chapter 7: Conclusion
A direct link between slope angle and particle size is often noted (Bryan, 1925; Rahn
1966; Cooke and Reeves, 1972). The difficulty in drawing direct links between slope and
simple clast parameters, as discussed by Vincent and Sadah (1995), has been echoed in
the findings of this study. Slope is one of a range of factors that influence slope form and
process, all of which are interdependent.
Several studies have focussed on the evolution of clastic arid surfaces and have tried to
draw links between surface character and slope profile form and landscape evolution
(AIIison and Higgitt, 1998; Friend et al., 2000). The ergodic treatment of the results
generated in this study indicates a down-slope change in surface form and process action,
but extrapolation to an evolutionary link between slope profile form variation and surface
character appears tenuous. By implication if, as has been shown, surface form influences
slope process then surface form must influence slope evolution. The results from this
thesis show a more complex link between surface character, slope form and geology than
has been previously suggested (AIIison et al., 2001 ). Whilst the results do not
demonstrate an evolutionary change in surface and slope form, they highlight the degree
of surface variation within each basalt type, which should be considered within any further
study of slope form evolution.
This thesis has provided the first detailed examination of surface hydrology in the
northeastern Badia. Kirk ( 1997) and Warburton ( 1998) previously conducted work on
infiltration and soil surface crusting as a result of rainfall in the region. This research both
complements their findings and provides a greater understanding of the processes in
action on the undisturbed clast mantled slopes which dominate this region.
Allison et al. (2000) summarises a large body of work which has examined the form of the
clast mantled surfaces. This thesis has explored the variation of surface form within and
between basalts at a greater level of detail than previously undertaken. The findings of
this thesis largely complement the previous work published, showing marked systematic
variations in surface character with slope form and basalt type. A greater degree of
heterogeneity in surface character than that previously noted has been identified in this
thesis. The variations observed have been linked directly to local and whole slope
controls, in addition to the variable action of processes. The results presented question
the evolutionary model of slope form ground surface cover suggested by Allison and
Higgitt ( 1998). This study has demonstrated than a more detailed consideration of within
basalt variation as influenced by variable slope form and drainage evolution should be
considered within a model of surface form links with slope evolution.
- 322-

Chapter 7: Conclusion
Higgitt and Allison (1999) suggested that a homeostatic modification of the surface form
maybe in action in the northeastern Badia. The results of this study qualify this
suggestion. Slope hydrology is clearly dictated by the surface form. The results also raise
suggestions of the mechanisms and processes directly responsible for the modification of
the surfaces. An iterative mechanism of movement appears to be the most likely nature of
change to dominate surface form. The actually processes responsible for this type of
movement of surface clasts remains a challenging question in the absence of the direct
measurement of surface modification processes in the field.
Previous work has developed computer simulations of many geomorphological features
and situations based upon the principles of self-organizing systems (Phillips, 1999; Favis
Mortlock et al., 2000; Baas, in press). This study uses a cellular automata model to
simulate the effects of the interactions between surface clasts. The model demonstrates
that self-organizing systems appear to be a valuable tool for increasing the understanding
of complex geomorphological phenomena. The common criticism of such a modelling
approach is the lack of validation to field evidence (Harrison, 2001 ). The detailed
assessment of surface form variation provided by the image analysis is capable of
measuring the surfaces to a precision that can be considered of the same order of
magnitude as the variations made to the model parameters which hold a significant
influence over modelled surface behaviour. The two methods are therefore
complementary.
On its own, the value of the modelling approach would be much less valid (Haff, 1996).
Baas (in press) suggests that dissatisfaction with theories such as self-organizing arises
from their loose and inconsistent interpretation, the lack of a quantitative comparison of
model output and direct links to field evidence. This study has attempted to address these
concerns. The use of quantitative measures on both the planimetric projection of the
surface and the model output allows direct quantitative comparison. Although the model
output is not designed to the spatially representative of real surface form, the relative
variations between locations in the field is considered synonymous with variations
generated by the parametric model output.
Many of the relationships previously identified in the northeastern Badia between surface
and slope form were limited by their statistical significance, attributed to both the sample
size and the spatial extent of the surface area under consideration (AIIison et al., 2001 ).
The destructive method of surface characterization previously employed also inhibited the
application of the results to an examination of slope process action. The research
presented in this thesis has identified significant relationships between surface form and
process. Additionally, newly developed measures of surface form, specifically the spatial
-323-

Chapter 7: Conclusion
characteristics of the clast distribution have behaved favourably and often generated
significant relationships between form and process where conventional measures do not.
A range of techniques has previously been used to characterize coarse clastic surfaces
(Dunkerley, 1995). The image analysis technique developed in this thesis provides a
flexible approach that rapidly and precisely measures the in-situ character of clastic
surface form. Dunkerley (1995) suggested that the consideration of adequate measures of
a clast surface is necessary to provide an appropriate understanding of the formative
processes. By using both conventional measures of surfaces character in combination
with an in situ assessment of surface form this study has clearly demonstrated the
benefits and importance of appropriate measures of surface form. The sampling
methodology adopted has identified the significance of considering plot based results in
the context of the wider landscape. Without the method adopted the results generated
could not have been considered in terms of the whole slope profile or beyond.
Previous attempts have been made to model the modification of coarse clastic surfaces in
geomorphology have been made (Ahnert, 1994; Tribe and Church, 1999). Again, the
models developed are frequently site specific so direct comparisons between model
outputs are difficult. Despite this the modelling approach can produce both logical and
sensible results. In doing so it is the first attempt to understand the modification of coarse
clastic desert surfaces through an iterative mechanism of adjustment. The model is
successful in replicating surface order and structure, as has been observed in the field.
- 324-

Chapter 7: Conclusion
7.4 Recommendations for further research
lt is possible to make recommendations for future work based upon the findings of this
research.
A more detailed understanding of the links between contemporary surface form and
process has been established. The direct processes responsible for the modification of
the clasts and whole surface form have deliberately not been addressed in this study. The
sporadic and infrequent nature of formative events, which are suggested to be rain
storms, inhibits their study within the confines of this thesis. Monitoring of actual clast
movement mechanisms, be they instigated by hydraulic deformation of sediment,
carbonate accretion, heave processes or ice needle growth, or indeed the direct transport
or unsettling of clasts by overland flow, should be undertaken. Additionally, the relative
contribution of hydrological and aeolian processes on surface character and process
should be studied. Only when these influences are understood can the longer term
genesis of these surfaces be approached.
Contemporary surface hydrology has been employed in this study as a surrogate variable
for process action within this study. Although not the sole, indeed, direct process
responsible for surface modification, hydrology is intimately linked with the transfer of
water into the sediment surface. Surface hydrology has been shown to be highly sensitive
to variations in ground surface configuration. The results demonstrate that in addition to
form directly influencing process action, the influence of process action potentially holds
an additional influence on surface form. Direct studies of this type of feedback would be
highly beneficial. Surface hydrology potentially holds a significant influence over surface
modification. Cyclic heave, carbonate accretion, ice needle action and clay shrink and
swell are all intimately linked to slope hydrology. Surface hydrology is therefore a vital clue
to understanding surface form and process variations. Previously an evolutionary
linkbetween surface form and geology has been made (AIIison et al., 2000). The results
from this study provide a range of considerations on scale, surface form and process
variability and adequacy which provide a template for future studies into the evolution of
coarse clastic slopes in arid environments.
This study has been conducted principally in a relatively small area on the surfaces of one
basalt type. In order to gain a more comprehensive understanding of the evolutionary link
between slope form and ground surface configuration, suggested by Allison and Higgitt
(1998), similar studies should be undertaken on additional basalt surfaces. During the
research for this thesis several attempts were made to gain an understanding of the three-
-325-

Chapter 7: Conclusion
dimensional form of the surfaces, combining both the planimetric view of the surface with
an assessment of the vertical extent of surface clasts. A three-dimensional assessment of
surface form would combine the benefits of the planimetric projection with a consideration
of the attributes of the surface which a measure of surface roughness, which influences
flow depths and routing. Digital photogrammetry using stereo imagery to produce a three
dimensional representation of the surface form was attempted in this study. The error
incurred from the additional complexities of measurement in three dimensions drastically
reduces the feasible size of sample obtainable using this technique. A more sophisticated
method of image capture and analysis may yield more success. DGPS was employed to
conduct highly detailed and accurate (± 0.02 m) cross profile transects of the clast
surface, similar to the approach used by Dun ne et al. ( 1992) who assessed the downslope
increase in fractal dimension of surface roughness. This approach may provide additional
clues as to the dominant controls on surface form and process.
Previous work has demonstrated the importance of the underlying sediments on clast
mantled desert surfaces in controlling surface hydrology and desert pavement evolution
(Wells et al., 1995; Brown and Dunkerley, 1996; MacFadden et al., 1998). This study has
primarily focussed on the influence of clast form and surface configuration in controlling
surface hydrology and development. Data from the northeastern Badia suggest that the
downslope distribution of sediments is effectively homogeneous, but no study of soil
structure, material properties or the presence of vesicular horizons has been made. Even
though particle size variations and the mineral composition of the sediments is constant
downslope, the presence of surface sealing and crusting, the variable depth of sediments
and the variable degree of clast burial should all be taken into account, even though these
features are not reflected in the variations in material properties measured.
The model of surface modification and spatial organization can be developed further
which would be of direct benefit to the understanding of surface geomorphology. First,
currently the spatial arrangement of the starting conditions of the model is randomly
generated, and in therefore not a direct simulation of the naturally occurring surfaces.
Second, the particle size distribution and clast shape based on a cellular grid is a very
crude representation of reality. Ideally, a method which extracts both particle size
characteristics and clast arrangements directly from the images of the in-situ surface
would be undertaken. The stability and evolution of real surfaces could then be
undertaken. Ideally the model would also be temporally constrained, through for example
surface dating, such that the timescales and rate of change could be suggested. The
model is also currently incapable of simulating weathering of clasts which alter clast form.
If the spatial variations in clast form, for example clast rounding and texture are
- 326-

Chapter 7: Conclusion
synonymous with a temporal modification of surface form, then the alteration of clast form
during the iterations of the model would be beneficial.
Many of the methods developed in this study can be applied to other geomorphological
situations. The method of slope profile location combines a long established method of
profile location with a new computer based profile extraction procedure. The aerial image
capture procedure operates at a scale which is of particular relevance to the study of
landforms and generates detail in excess of that of conventional aerial photography over a
wider spatial extent than ground based photography. The automated image analysis
developed for particle characterization could also be applied to similar coarse clastic
surfaces, for example gravel-bed rivers or periglacial surfaces. The use of rain storm
simulation experiments as a way of forcing differences in surface process to become
apparent could again be applied to other landscape where variability in surface process is
only very subtle. Finally, the modelling approach has demonstrated an ability to generate
alternative ways of thinking about landforms, through concepts such as self-organization.
This thesis is part of ongoing research in arid zone geomorphology, the behaviour of earth
surface systems and the specific context of the northeastern Jordanian Badia. The results
raise questions which may help to define the future research direction in all of these
areas.
'Stones have been known to move'
Shakespeare, Macbeth, Ill, iv
-327-

References
-328-

Abed, A.M. and Yaghan, R. 2000. 'On the paleoclimate of Jordan during the last glacial
maximum', Palaeogeography, Palaeoclimatology, Palaeoecology, 160, 23 -33.
Aber, J.S., Aaviksoo, K., Karofeld, E. and Aber, W.A. 2002 'Patterns in Estonian bogs as
depicted in col or kite aerial photographs', Suo, 53, no.1, 1 - 15.
Abrahams, A.D., Howard, A.D. and Parsons, A.J. 1994. 'Rock-mantled slopes', in Abrahams,
A.D. and Parsons, A.J. (Eds) 'Geomorphology of Desert Environments', Chapman
and Hall, London, 173-212.
Abrahams, A .D. and Parsons, A.J. 1994. 'Hydraulics of overland flow on stone-covered desert
surfaces', Catena, 23, 111 - 140.
Abrahams, A.D. and Parsons, A.J. 1991. 'Relation between infiltration and stone cover on a
semi-arid hillslope, southern Arizona', Journal of Hydrology, 122, 49- 59.
Abrahams, A. D. and Parsons, A.J. 1991 b. 'Relation between sediment yield and gradient on
debris covered hillslopes, Walnut Gulch, Arizona', Bulletin of the Geological
Society of America, 103, 1109 - 1113.
Abrahams, A.D., Parsons, A.J., Cooke, R.U. and Reeve, R.W. 1984. 'Stone movement on
hillslopes in the Mojave Desert, California: a 16-year record', Earth Surface
Processes and Landforms, 9, 365- 370.
Abrahams, A.D. and Parsons, A.J. and Luk, S.H. 1988. 'Hydrologic and sediment response to
simulated rainfall on desert hill-slopes in southern Arizona', Catena, 15, 103 - 117.
Abrahams, A.D. Parsons, A.J. and Hirsh, P.J. 1985. 'Hillslope gradient-particle size relations:
evidence for the formation of debris slopes by hydraulic processes in the Mojave
Desert', Journal of Geology, 93, 347- 357.
Agnew, C. and Anderson, E. 1992. 'Water resources in the arid realm', Routledge, London.
Ahmad, A. and Chandler, J.H. 1999. 'Photogrammetric capabilities of the Kodak DC40,
DCS420 and DCS460 Digital Cameras', Photogrammetric Record, 16 (94), 601 -
615.
Ahnert, F. 1994. 'Modelling the development of non-periglacial sorted nets', Catena, 23, 43-
63.
AI-Farraj A. and Harvey A.M. 2000. 'Desert pavement characteristics on wadi terrace and
alluvial fan surfaces: Wadi AI-Bih, U.A.E. and Oman', Geomorphology ,35, no. 3-
4, 279- 297.
AI-Hamoud, A.S., Allison, R.J., Sunna, B.F. and White, K. 1995. 'Geology, geomorphology,
- 329-

hydrology, groundwater and physical resources of the desertified Badia
environment in Jordan', GeoJournal, 37, 51 - 67.
Allison, R.J. and Goudie, A.J. 1990. The form of rock slopes in tropical limestone and their
association with rockmass strength', Zietschrift fOr Geomorphologie, 39 - 129 -
148.
Allison, R.J., and Higgitt, D.L. 1998. 'Slope form and associations with ground surface boulder
cover in arid environments', Catena, 33, 47- 74.
Allison, R.J., Grove, J.R., Higgitt, D.L., Kirk, A.J., Rosser, N.J. and Warburton, J. 2000.
'Geomorphology of the eastern Badia basalt plateau, Jordan', The Geographical
Journal, 2, 353- 370.
Allison, R.J., Higgitt, D.L., Kirk, A.J., Warburton, J., AI-Hamoud, A.S., Sunna, B.F. and White,
K. 1998. 'Geology, geomorphology, hydrology, groundwater and physical
resources', in Dutton, R.W., Clark, J.l. and Battikhi, A.M. (Eds), 'Arid land
resources and their management', Kegan Paul International, London, 19-44.
Amman, G. 2000. Thiessen Polygon Extension for ArcGIS
http://arcscripts.esri.com/details.asp?dbid=10642- accessed 01.05.01.
Anderson, R.S. 1990. 'Eolian ripples as examples of self-organization in geomorphological
systems', Earth-Science Reviews, 29, no.1-4, 77- 96.
Baas, A.C.W. in press. 'Chaos, fractals, self-organization in coastal geomorphology: simulating
dune landscapes in vegetated environments', Geomorphology.
Bak, P. 1997. 'How nature works: the science of self-organized criticality', Oxford University
Press, Oxford, UK.
Bak, P., Tang, C. and Wiesenfeld, K. 1988. 'Self-organized criticality', Physical Review A, 38.
364- 374.
Baly, D. and Tushingham, A.D. 1971. 'Aitas of the biblical world', World Publishing Company,
New York.
Barberi, F., Capaldi, G., Gasperini, P., Marinelli, G., Santacroce, R. Scandone, R., Treuil, M,
and Varet, J. 1979. 'Recent basaltic volcanism of Jordan and its implications on
the recent geodynamic history of the Dead Sea shear zone', in' International
Symposium of the Geodynamic Evolution of the Afro-Arabian Rift System', Rome,
667- 682.
Barton, A.P. 1994. 'Water chemistry as a factor influencing the erositivity of simulated rain',
Unpublished M.Sc. Thesis, Cranfield University.
- 330-

Battany, M.C. and Grismer, M.E. 2000. 'Rainfall runoff and erosion in Napa Valley vineyards:
Effects of slope, cover and surface roughness', Hydrological Processes, 14, no.7,
1289- 1304.
Battany, M.C. and Grismer, M.E. 2000. 'Rainfall runoff and erosion in Napa Valley vineyards:
Effects of slope, cover and surface roughness', Hydrological Processes, 14, no.7,
1289- 1304.
Becher, H.H. 1994. 'Evaluating the resistance to penetration within the surface layer of soil
aggregates', Soil Technology, 7, no.2, 105- 111.
Beheiry, S.A. 1969. 'Geomorphology of central eastern Jordan', Bulletin Societe Geographie
d'Egypte, 42, 5- 22.
Bender, F. 1968. 'Geologie von Jordanien', Gebr. Borntraeger, Berlin.
Bentley, W. 1904. 'Studies of raindrops and raindrop phenomena', Monthly Weather Review,
32,450.
Benton, C. 'Kite Aerial Photography', http://arch.ced.berkeley.edu/kap/kaptoc.html, accessed
between 01.01.2000 and 01.09.02
Bergkamp G. 1998. 'A hierarchical view of the interactions of runoff and infiltration with
vegetation and microtopography in semiarid shrublands', Catena, 33, no.3, 4201 -
4220.
Berndtsson, R. and Larson, M. 1987. 'Spatial variability of infiltration in a semi-arid
environment (Tunisia)', Journal of Hydrology, 90, no. 1 - 2, 117 - 133.
Berry, B.J.L. and Marble, D.F. 1968. 'Spatial Analysis', Englewood Cliffs NJ, Prentice-Hall.
Setts, A.V.G. 1998. 'The Harra and the Harrad: Excavation and Surveys in Eastern Jordan',
Vol.1, Sheffield Academic Press,
Billi P. and Paris E. 1992. 'Bed sediment characterization in river engineering problems',
IAHS; Publication, 210.
Blackburn, W.H. 1975. 'Factors influencing infiltration and sediment production of rangelands
in Nevada', Water Resources Research, 11, 929- 937.
Bloschl, G. and Sivapalan, M. 1995. 'Scale issues in hydrological modelling - A review',
Hydrological Processes, Vol. 9, no. 3- 4, 251 - 290.
Boots, B.N. 1987. 'Voronoi (Thiessen) polygons', Concepts and techniques in modern
geography, 45, GeoBooks, Norwich, UK.
- 331 -

Bark H.R. and Rohdenburg H. 1981. 'Rainfall simulation in southeast Spain: analysis of
overland flow and infiltration' in 'Soil conservation: problems and prospects',
Morgan, R.P.C. (ed), Wiley, London, 293- 302.
Borselli L., Torri D., Poesen J. and Sanchis P.S. 2001. 'Effects of water quality on infiltration,
runoff and interrill erosion processes during simulated rainfall', Earth Surface
Processes and Landforms, 26, no.3, 329- 342.
Bowyer-Bower T .A.S. 1993. 'Effects of rainfall intensity and antecedent moisture on the
steady- state infiltration rate in a semi-arid region', Soil Use and Management, 9,
no.2, 69 - 76.
Bowyer-Bower, T.A.S. and Burt, T.P. 1989. 'Rainfall simulators for investigating soil response
to rainfall', Soil Technology, 2, 1 -16.
Box, J.E. 1981, 'The effects of surface slaty fragments on soil erosion by water', Soil Science
Society of America Proceedings, 45, 111 - 116.
Bozdag T., and Karpuz C. 1997. 'Development of a particle size distribution analysis system by
digital image processing', International Journal of Surface Mining, Reclamation
and Environment, 11, no.2, 59- 67.
Bradley, W.C., Fahnestock, R.K. and Rowenkamp, E.T. 1972. 'Coarse sediment transport by
flood flows on Knik River, Alaska', Bulletin of the Geology Society of America, 83,
1261- 1284
Brakensiek, D.L. and Rawls, W.J. 1994. 'Soil containing rock fragments: effects on infiltration',
Catena, 23, 99 - 110.
Brooks, C. 1998. 'Nearest Neighbour Analysis Extension for ESRI ArcView -
http://arcscripts.esri.com/details.asp?dbid=1 0642- accessed 01.09.01.
Brown, K.J. and Dunkerley, D.L. 1996. 'The influence of hillslope gradient, regolith texture,
stone size and stone position on the presence of a vesicular layer and related
aspects of hillslope hydrologic processes: a case study from the Austalian arid
zone', Catena, 26, 71 - 84.
Bruins, H.J. and Yaalon, D.H. 1979. 'Stratigraphy of the Neviot section in the desert loess of
the Negev', Acta Geologica Academiae Scientiarum Hungaricae, 22, 161 - 169.
Brunsden D. 2001. 'A critical assessment of the sensitivity concept in geomorphology', Catena,
42, no. 2-4, 99- 123.
Bryan, K. 1922. 'Erosion and sedimentation in the Papago Country, Arizona', US. Geological
Survey Bulletin, 730-B, 19 -90
- 332-

Bryan, K. 1940. 'The retreat of slopes', Annals of the Association of American Geographers,
30, 254 - 268.
Bull, L.J., Kirkby, M.J., Shannon, J. and Hooke, J.M. 2000. 'The variation in estimated
discharge in relation to the location of storm cells in S.E. Spain', Catena, 38 (3),
191 -209.
Bull, W.B. 1991. 'Geomorphic responses to climatic change', Oxford University Press, New
York.
Bullard J.E., Wiggs G.F.S. and Nash D.J. 2000. 'Experimental study of wind directional
variability in the vicinity of a model valley', Geomorphology, 35, 1 - 2, 127- 143.
Bunte, K. and Poesen, J. 1993. 'Effects of rock fragment covers on erosion and transport of
non-cohesive sediment by shallow overland flow', Water Resources Research,
29, no. 5, 1415- 1425.
Burdon, D.J. 1959. 'Handbook of the geology of Jordan, Government of the Hashemite
Kingdom of Jordan.
Butler, J.B., Lane, S.N. and Chandler, J.H. 2001. 'Application of two-dimensional fractal
analysis to the characterization of gravel-bed river surface structure',
Mathematical Geology, 33, 301 - 330.
Butzer, K.W. 1958. 'Quaternary stratigraphy and climate in the Near Easr, Ferd. Dummlers
Verlag, Bonn.
Carmi, 1., Noter, Y., and Schlesinger, R. 1971. 'Rehovot radio carbon measurements',
Department of Radio-Carbon, 13, 412 - 419.
Cerda A. 1998. 'The influence of geomorphological position and vegetation cover on the
erosional and hydrological processes on a Mediterranean hillslope', Hydrological
Processes, 12, no.4, 661 - 671.
Chandler, J.H. and Padfield, C.J., 1996. 'Automated Digital Photogrammetry on A Shoestring',
Photogrammetric Record, 15 (88), 545- 559.
Cheng C., DePinto J.V., Atkinson J.F., VanBenschoten J.E. and Bursik M.l. 2000. 'Image
based system for particle counting and sizing', Journal of Environmental
Engineering, 126, no.3, 258 - 266.
Childs, S.W. and Flint, A.L. 1990. 'Physical propeties of forest soils containing rock fragments',
in Gessel, S.P., Lacate, D. S., Weetman, G. F. and Powers, R. F. (Eds)
'Sustained production of forest soils', University of British Columbia, Faculty of
Forestry Publication, Vancouver, B.C., 95- 121.
-333-

Church, M.A., McLean, D.G. and Wolcott, J.F. 1987. 'River bed gravels: sampling and
analysis', in Thorne, C.R., Bathurst, J.C. and Hey, R.D. (Eds) 'Sediment transport
in gravel bed rivers, Wiley, New York, 43- 79.
Collinet J. and Valentin C. 1984. 'Evaluation of factors influencing water erosion in West Africa
using rainfall simulation', International Association of Hydrological Sciences;
IAHS-A/SH Publication 144.
Cooke, R.U. and R.W. Reeves, 1976. 'Arroyos and environmental change in the American
South-West', Oxford, Clarendon Press.
Cooke, R.U., Warren, A. and Goudie, A.S. 1993. 'Desert geomorpho/ogy', UCL Press, London.
Coutinho, M.A. and Tomas, P.P. 1995. 'Comparison of Fournier with Wischmeier Rainfall
Erosivity Indices', in Rickson, R. J. (Ed.) Conserving Soil Resources, European
Perspectives, Oxford University Press, London.
Cox, N.J. in prep. 'Kernel estimation as a basic tool for geomorphological data analysis'
Crofts, R.S. 197 4. 'A visual measure of single particle form for use in the field', Journal of
Sedimentary Petrology, 44 (3), 931 - 934.
Cructchfield, J.P. 1994. 'Is anything ever new?' in Cowan, G., Pines, D. and Melsner, D. (Eds)
'SF/ Studies in the sciences of complexity XIX'. Addison-Wesley, Massachusetts,
USA.
Dan, J. and Yaalon, D.H. 1966. Trends in the development with time in the Mediterannean
environments of Israel', Conference on Mediterranean Soils, Madrid,
Transactions, 139- 145.
Darboux, F. Gascuei-Odoux, C. and Davy, P. 2002. 'Effect of surface water storgae by soil
roughness on overland flow generation', Earth Surface Processes and Landforms,
27, no. 3, 223- 233.
De Vries, H. and Barendsen, G.W. 1954. 'Measurements of age by the carbon-14 technique',
Nature, 174,1138-1141.
Diggle, P. 1983. 'Statistical analysis of spatial point patterns', Academic Press, London.
Diplas, P., and Fripp, J.B. 1991. 'Properties of various sediment sampling procedures', Journal
of Hydraulic Engineering,- ASCE 118, no.?, 955- 970.
Dixon, J.C. 1994. 'Duricrusts', in Abrahams, A.D. and Parsons, A.J. (ed.) 'Geomorphology of
Desert Environments', Chapman, London, 82- 105.
Darn, R.l. 1994. The role of climatic change in alluvial fan development', in Abrahams, A.D.
- 334-

and Parsons, A.J. (Eds) 'Geomorphology of Desert Environments', Chapman and
Hall, London, 591 - 615.
Dohrenwend, J.C., Abrahams, A.D. and Turrin, B.O. 1994. 'Drainage development on basaltic
lava flows, Cima volcanic field, southeast California, and Lunar Crater volcanic
field, south- central Nevada', Geological Society of America Bulletin, 99, no.3, 405
-413.
Dotteridge, J., 1998. 'Water resource quality, sustainability and development, in Dutton, R.W.,
Clark, J.l. and Battikhi, A.M. (Eds), 'Arid land resources and their management',
Kegan Paul International, London, 67- 80.
Dubief, J. 1979. 'Review of the North African climate with particular reference on the
production of aeolian dust in the Sahel Zone and in the Sahara', in Morales, C.,
'Saharan dust', John Wiley, Chichester, UK, 27-48.
Duley, F.L. and Hays, O.E. 1932. 'The effect of the degree of slope on runoff and soil erosion',
Journal of Agriculture Research, 45, 349 - 360.
Dumas, J. 1965. 'Relation entre l'erodiite des sols et leurs caracteristique analytques', Cahier
ORSTOM Serie Pedologie, 3, 307-333.
Dunkerley, D.L. 1994. 'Short communication: Bulk sampling of coarse clastic sediments for
particle size analyses, Earth Surface Processes and Landforms, The Journal of
The British Geomorphological Research Group, 19, 255- 261.
Dunkerley, D.L. 1996. 'Short communication: Stone cover on desert hill-slopes: extent of bias
in diameters from grid samples and procedures for bias correction', Earth Surface
Processes and Landforms, 21, 573- 580.
Dunkerley, D.L. 1995. 'Surface stone cover on desert hillslope: parameterizing characteristics
in relation to infiltration and surface runoff, Earth Surface Processes and
Landforms, 20, 207 - 218.
Dunkerley, D.L., Domelow, P. and Tooth, D. 2001. 'Frictional retardation of laminar flow by
plant litter and surface stones on dryland surfaces: a laboratory study', Water
Resources Research, 37, no. 5, 1417- 1423.
Dunne, T., Whipple, K.X and Aubry, B.F. 1995. 'Microtopography of hill-slopes and the
initiation of channels by Horton overland flow', in 'Evolving Concepts in Fluvial
Geomorphology', Costa, J.E., (Ed) American Geophysical Union, Geophysical
Monograph, 27- 44.
Dutton, R.W. 1998. 'Population, environment and development', in Dutton, R.W., Clarke, J.l.
and Battikho, A. (Eds) 'Arid land resources and their management', Kegan Paul
-335-

International, London, 3- 20.
Ehlen, J. 2000. 'Fractal analysis of joint patterns in granite', International Journal of Rock
Mechanics and Mining Sciences, 37, no.6, 909- 922.
El Boushi, I.M. and Davis, S.N. 1969. 'Water-retention characteristics of coarse rock particles',
Journal of Hydrology, 8, 431 - 441 .
ESRI 2002. 'ArcGIS Online Manuaf - http://www.esriuk.com/pdf/whitepapers/arcgis_8.163.pdf,
accessed between 01.01.01 and 25.09.02
Esteves, M., Planchon, 0., Lapetite, J.M., Silvera, N. and Cadet, P. 2000. The 'EMIRE' large
rainfall simulator: Design and field testing', Earth Surface Processes and
Landforms, 25 (7), 681 - 690.
Evans, 1.8.1967. The properties of patterns of points, measured in space, filling and angular
relationships', Geographical Articles, No. 8, Department of Geography, University
of Cambridge, UK.
FAO 1962. 'A study of agroclimatology in semi-arid and arid zones of the Near East',
FAO/UNESCO/WMO, lnteragency Report on Agro-climatology, Rome, Italy.
Farley, B.G. and Clark, W.A. 1954. 'Simulation of self-organizing systems by digital computer',
I.R.E. Transactions on Information Theory, 4, 76- 84.
Favis-Mortlock, D., Boardman, J. Parsons, A.J. and Lascelles, B. 2000. 'Emergence and
erosion: a model for rill initiation and development', Hydrological Processes, 14,
2173-2205.
Fernlund, J.M.R. 1998. 'The effect of particle form on sieve analysis: a test by image analysis',
Engineering Geology, 50, no.1 - 2, 111 - 124.
FFA 2000. 'PC-Image analysis software- Manuaf, Foster Findlay Associates, Newcastle, UK.
Fisher, N.l. 1993. 'Statistical Analysis of Circular Data', Cambridge University Press,
Cambridge, UK.
Fisher, W.B., Atkinson, K., Beaumont, P., Cole, A., Gilchrist-Shorlaw, D. 1966. 'Soil survey of
Wadi Ziqlab, Jordan', Department of Geography, University of Durham.
Foster I.D.L., Fullen MA, Brandsma R.T. and Chapman A.S. 2000. 'Drip-screen rainfall
simulators for hydro- and pedo-geomorphological research: The Coventry
experience', Earth Surface Processes and Landforms, The Journal of the British
Geomorphological Research Group, 25, no.?, 691 - 707.
Fotheringham, A.S. 2000. 'Quantitative geography: perspectives on modern spatial analysis',
-336-

Sage, London.
Friend D.A., Liu T., Sharma P., Phillips F.M. and Campbell S.W. 2000. 'Evolution of desert
colluvia boulder slopes', Geomorphology, 36, no.1 - 2, 19 - 45.
Gale, S.J. and Hoare, P.G. 1992. 'Bulk sampling of coarse clastic sediments for particle size
analysis', Earth Surface Processes and Landforms, The Journal of the British
Geomorphological Research Group, 17 (5), 729- 724.
Ganor, E. and Mamane, Y. 1982. Transport of Saharan dust across the eastern
Mediterranean', Atmospheric Environment, 16, 581 - 587.
Garrard, A.N., Stanley-Price, N.P. and Copeland, L. 1975. 'A survey of prehistoric sites in the
Azraq Basin, Eastern Jordan', Paleorient, 3, 109- 126.
Gonzalez, R.C. and Woods, R.E. 1992. 'Digital image processing', Addison-Wesley Publishing
Company, Boston, MA.
Goodfriend, G.A. and Magartiz, M. 1988. 'Paleosols and the late Pliestocene rainfall
fluctuations in the Negev Desert', Nature, 346, 141- 146.
Goossens, D. 1994. 'Effects of rock fragments on eolian deposition of atmospheric dust',
Catena, 23, 167 - 189.
Goudie, A.S., Livingstone, 1., and Stokes, S. 1999. 'Aeo/ian environments, sediments and
landforms', Wiley, Chichester, UK.
Grant, W.J. and Struchtemeyer, R.A. 1959. 'Influence of the coarse fraction in two Maine
potato soils on infiltration, runoff and erosion', Soil Science Society America
Proceedings, 23, 391 - 394.
Greenbaum, N., Margalit, A., Shick, A., Sharon, D. and Baker, V.R. 1998. 'A high magnitude
storm and flood in a hyperarid catchment, Nahal Zin,Negev Desert, Israel',
Hydrological Processes, 12, 1 - 23.
Greenbaum, N., Schick, A.P. and Baker, V.R. 2000. The palaeoflood record of a hyperarid
catchment, Nahal Zin, Negev Desert, Israel', Earth Surface Processes and
Landforms, 25, no.9, 951 - 971.
Greig-Smith, P. 1964. 'Quantitative Plant Ecology, Second Edition', Butterworths, London.
Grove, J.R. 2000. 'Stratigraphic analysis of sedimentary deposits the Jordanian Badia, and
Syria', Unpublished Report - Department of Archaeology and Department of
Geography, University of Durham, UK.
Guba, I and Mustafa, H. 1988. 'Structural control of young basaltic fissure eruptions in the
- 337-

basalt plateau area of the north Arabian plate, north east Jordan', Journal of
Vulcanology and Geothermal Research, 35, 319 - 334.
Haft, B.W. 1996 'Limitations on predictive modelling in gemorphology', in Rhoads, B.L. and
Thornes, C.E. 'The scientific nature of geomorphology: Proceedings of the 21h
Binghamton Symposium in Geomorphology', John Wiley and Sons Ltd.,
Chichester, UK,
Haft, B.W. 2001. 'Desert pavement: an Environmental Canary?', Geology, 109, no. 5, 661 -
668.
Haken, H. 1977. 'Synergetics', Springer-Verlag, Germany.
Hall, M.J. 1970. 'A critique of methods of simulating rainfall', Water Resources Research, 6,
no. 4,1104-1114.
Hallet, B. 1987. 'On geometric patterns with a focus on stone sorted circles viewed as a free
convection phenomenon', in Nicolis, C. and Nicolis, G. (Eds) 'Irreversible
phenomenon and dynamical systems analysis in geosciences', 533-553.
Harrison, S. 2001. 'On reductionism and emergence in geomorphology', Transactions of the
Institute of British Geographers, 26, 3, 327- 339.
Hawkins, R.H. and Cundy, T.W. 1987. 'Steady state analysis of infiltration and overland flow
for spatially varied hillslopes', Water Resources Bulletin, 23, 215- 216.
Helming, K., Prasad, S.N. and Romkens, M.J.M. 1997. 'Drainage network characteristics on
eroding soil surfaces', 'Proceedings of the Conference on Management of
Landscapes Disturbed by Channel Incision', S.S.Y. Wang, E.J. Langendoen and
F.D. Shields, Jr., (Eds), Oxford, MS, May 20-22, 1997.
Helms, S.W. 1981. 'Jawa- Lost city of the Black Desert', Methuen and Co. Ltd., London.
Hey, R.D. and Thorne, C.R. 1986. 'Stable Channels with Mobile Gravel Beds', Journal of
Hydraulic Engineering, American Society of Civil Engineers, 112, 8, 671 - 689.
Higgitt, D.L. and Allison, R.J. 1998, 'Characteristics of basalt boulder surfaces', in Dutton,
R.W., Clark, J.l. and Battikho, A. 'Arid land resources and their management',
Kegan Paul International, London, 171- 182.
Higgitt, D.L. and Allison, R.J. 1999a. 'Characteristics of stone covers on the surface of basalt
flows in arid, northeast Jordan', Geomorphology, 28, 263- 280.
Higgitt, D.L. and Allison, R.J. 1999b. 'Ciast exposure on boulder-covered desert slopes', Earth
Surface Processes and Landforms, 24, 2, 111- 125.
- 338-

Hinkley, B.S. 1980. 'Factors affecting off-road vehicle induced erosion acceleration in the
Mojave Desert, California', Department of Applied Earth Sciences, Stanford, 78.
Holden, J. 2000. 'Runoff generation in upland blanket peat covered catchments', Unpublished
PhD Thesis, University of Durham, UK.
Horton, R.E. 1945. 'Erosional Development of Streams and Their Drainage Basins:
Hydrophysical Approach to Quantitative Morphology', Bulletin of the Geological
Society of America, 56, 275 - 370.
Huang, C. and Bradford, J.M. 1990. 'Depressional storage for Markow-Gaurssian surfaces',
Water Resources Research, 26 (9), 2235- 2242.
Huckriede, R. and Wiesemann, G. 1968. 'Der jungpleistozane Pluvial-See von EI-Jafr und
weitere Oaten zum Quarter Jordanians',
95.
Geologica et Plaeontologica, 2, 73 -
Huffaker, C.B. 1958. 'Experimental studies on predation: dispersion factors and predator
prey oscillations', Hilgardia, 27, 343- 383.
Huntings Technical Services 1965. 'Wadi Dhuleil investigation', Unveroffentlicht Bericht fOr die
jordanien Regierung, Archive of the Natural Resource Authority, London.
lbbeken H., Warnke D.A. and Diepenbroek M. 1998. 'Granulometric study of the Hanaupah
Fan, Death Valley, California', Earth Surface Processes and Landforms, 23, no. 6,
481 -492.
lbrahim, K.M. 1993. 'A new occurrence of zeolites in the volcanic tuft of northeast Jordan',
Report for the Geology Department, Royal Holloway and Bedford College,
University of London.
llani, S., Harlavan, Y., Tarawaneh, K., Rabba, 1., Weinberger, R. lbrahim, K. Petltz, S. and
Steinitz, G. 2001. ·New K-Ar ages of basalts from the Harrat Ash Shaam volcanic
field in Jordan: Implications for the span and duration of the upper-mantle
upwelling beneath the western Arabian plate', Geology, 29, 171 - 174.
lmeson A.C. and Verstraten J.M. 1987. 'Rills on badland slopes: a physico-chemically
controlled phenomenon', Catena Supplement, 12, 139- 150.
lnkpen, R.J., and Petley, D.N. 2001. 'Fitness spaces and their potential for visualizing change
in the physical landscape', Area, 33, 242- 251.
lssar, A.S. and Bruins, H.J. 1983. 'Special climatology conditions in the deserts of Sinai and
the Negev during the latest pleistocene', Palaeogeography, Palaeoclimatology,
Palaeoecology, 43, 63 - 72.
- 339-

Jean, J. S., Ai, K.F., Shih, K. and Hung, C.C. 2000. 'Stone cover and slope factors influencing
hillside surface runoff and infiltration: laboratory investigation', Hydrological
Processes, 14, 1829- 1849.
Johnson, C.W. and Gordon, W.H. 1988. 'Runoff and erosion from rainfall simulator plots on
sagebush rangeland', Transactions of the American Society of Agricultural
Engineers, 31, 421 - 427.
Jones, D.K.C., Cooke, R.U. and Warren, A. 1986. 'Geomorphological investigation, for
engineering purposes, of blowing sand and dust hazard', Quarterly Journal of
Engineering Geology, 19, 251 - 270.
Kaiser, K, Kempf, E.K., Leroi-Gourhan, A. and Schutt, H.1973. 'Quartarstratigraphische
Untersuchung aus dem Damaskus-Becken und seiner Umbebung', Zeitschrift tar
Geomorphologie, 17, 263- 353.
Kauffman, S.A. 1993. 'Origins of order: Self-organisation and selection in evolution', Oxford
University Press, New York, USA.
Kellerhals, R., and Bray, D.l. 1971. 'Sampling Procedures for Coarse Fluvial Sediments',
Journal of the Hydraulics Division, American Society of Civil Engineers, 97, HY8,
1165- 1180.
Kidron, G.J. and Pick, K. 2000. 'The limited role of localized convective storms in runoff
production in the western Negev Desert', Journal of Hydrology, 229, no. 3- 4, 281
-289.
Kidron, G.J. and Yair, A. 2001 'Runoff-induced sediment yield over dune slopes in the Negev
desert. 1: Quantity and variability', Earth Surface Processes and Landforms, 26,
no.5, 461 - 474.
King, L. 1969. 'Statistical Analysis in Geography', Prentice-Hall, New Jersey.
Kirk, A.J. 1997. 'Relationships between sediment, moisture and soil crust characteristics in arid
environments', Unpublished PhD Thesis, University of Durham, UK.
Kirk, A.J. 1998. 'A synthesis of climatic data with specific interest in the precipitation record', in
Dutton, R.W., Clark, J.l. and Battikhi, A.M. (Eds), 'Arid land resources and their
managemenr, Kegan Paul International, London, 47- 66.
Kirk by, A. and Kirk by, M.J. 197 4. 'Surface wash at the semi-arid break in slope', Zeitschrift tar
Geomorphology, Supplement Band 21, 151 - 176.
Kirkby, M.J., lmeson, A.C., Bergkamp, G. and Cammerat, L.H. 1996. 'Scaling up processes
and models from field plot to the water shed and regional areas', Journal of Soil
-340-

and Water Conservation, 51 (5), 391 - 396.
Klir, G. 1991. 'Facets of systems science', Plenum Press, Kluwer Academic Publishers, The
Netherlands.
Koon, J.L., Hendrick, J.G., and Hermanson, R.E. 1970. 'Some effects of soil surface cover
geometry on infiltration', Water Resources Research, 6 (1 ), 246- 253.
Kressler, M.A., Murray, A.B. and Werner, B.T. 2001. 'A model for sorted circles as self
organized patterns', Journal of Geophysical Research, 106, no. 87, 13287 -
13306.
Krown, L. 1966. 'Approach to forecasting seasonal rainfall in Israel', Journal of Applied
Meteorology, 5, 590- 594.
Lamb, H.H. 1972. 'Climate: Past, present and future', Methuen and Co. Ltd., London.
Lamb, H.H. 1968. 'The climatic background to the birth of civilization', Advancement of
Science, 25, 103- 120.
Lancaster, N., Greeley, R. and Rasmussen, K.R. 1991. 'Interaction between unvegetated
surfaces and the atmospheric boundary layer: a preliminary assessment', Acta
Mechanica Supplement, 2, 89- 102.
Lange J., Leibundgut, C.H., and Schick, A.P. 2000. 'The importance of single events in arid
zone rainfall-runoff modelling', Physics and Chemistry of the Earth (B), 25, No. 7-
8, 673- 677.
Larmuth, L. 1978. 'Temperatures beneath stones used as daytime retreats by desert animals',
Journal of Arid Environments, 1, 35-40.
Laws, J.O. 1941. 'Fall velocity of water droplets', Transactions of the American Geophysical
Union, 22, 709 - 721.
Laws, J.O. and Parsons, D.A. 1943. 'Relationship of raindrop size to intensity', Transactions of
the American Geophysical Union, 24, 452- 460.
Leica 1997 'System 300 Differential GPS Manual, Lieca Geosystems, UK.
Lucas, C. 2001. http://www.calresco.org/lucas/classify.htm- accessed 01_02
Macleod, N. in press. 'Geometric morphometries and geological shape-classification systems',
Earth-Science Reviews.
McFadden, L.D., McDonald, E.V., Wells, S.G., Anderson, K., Quade, J and Forman, S.L. 1998.
'The vesicular layer and carbonate collars of desert soils and pavements:
-341 -

formation, age and relation to climate change', Geomorphology, 24, 101 - 145.
McFadden, L.D., Wells, S.G. and Jercinovich, M.J. 1987. 'Influence of eolian and pedogenic
processes on the origin and evolution of desert pavements', Geology, 15, 504 -
508.
Meeuwig, R.O. 1970. 'Infiltration and soil erosion as influenced by vegetation and soil in
northern Utah', Journal of Range Management, 33, 185 - 188.
Melton, M .A. 1965. 'Debris-covered hillslopes of the southern Arizona desert- consideration of
their stability and sediment contribution', Journal of Geology, 73, 715 - 729.
Mercier, N. and Valladas, H. 1994. 'Thermoluminescence dates for the Paleolithic Levant', in
Bar-Yosef, 0. and Kra, R. S. (Eds) 'Late Quaternary chronologies and
palaeolclimates of the eastern Mediterranean', Tuscan, 13- 20.
Meyer, L.D. 1958. 'An investigation of methods for simulated rainfall on standard runoff plots
and a study of the drop size, velocity and kinetic energy of selected spray
nozzles', USDA, Soil and water conservation research division, Special Report,
No. 81.
Milne 2001. http://algodones.unm.edu/-bmilne/- accessed 01.02.02
Moeyersons, J., Vermeersch, P.M., Beeckman, H. and Peer, P.V. 1999. 'Holocene
environmental environmental changes in the Gebel Umm Hamad, Eastern Desert,
Egypt', Geomorphology, 26, 397- 312.
Moffat, D. T. 1988. 'A volcanotectonic analysis of the Cenozoic continental basalts of northern
Jordan; Implications for hydrocarbon prospecting in the black 8 area', ERI, Jordan
EJ, 88- 1.
Morman, F. 1959. 'Soils of east Jordan', FAO, Rome.
Naden, P. 1987. 'Modelling gravel-bed topography from sediment transport', Earth Surface
Processes and Landforms, 12, no.4, 353- 367.
Nash, D.J. 2000. 'Arid geomorphology', Progress in Physical Geography, 24, 3, 425-443.
Neev, E. and Emery, K. 1995. 'The destruction of Sodom, Gomorrah and Jericho', Oxford
University Press, UK.
Nicholson, F.H. 1976. 'Patterned ground formation and description as suggested by low artic
and subartic examples', Artic and Alpine Research, 8, No. 4, 329- 342.
Nickling, W.G. 1987. The initiation of grain movement by wind', 'Processus et mesure de
!'erosion', 25e UGI, Paris, 113 - 127.
-342-

Nicolis, G. and Prigogine, I. 1989. 'Exploring complexity', W.H. Freeman, New York, USA.
Nyssen J., Lavrysen E., Haile M., Deckers J., Poesen J. and Moeyersons J. 2002. 'Spatial
distribution of rock fragments in cultivated soils in Northern Ethiopia as affected by
lateral and vertical displacement processes', Geomorphology, 43, no.1- 2, 1- 16.
Oberlander, T.M., 1974. 'Land inheritance and the pediment problem in the Mojave Desert of
southern California', American Journal of Science, 274, 849- 875.
Okabe, A., Boots, B. and Sugihara, K. 1992. 'Spatial tessellations: concepts and applications
of Voronoi diagrams', Wiley, Chichester, UK.
Osborne, H.B. and Renard K.G. 1969. 'Analysis of two major runoff-producing southwest
thunderstorms', Journal of Hydrology, 8, 282- 302.
Parsons, A.J. and Lascelles, B. 2000. 'Rainfall simulation in geomorphology', Earth Surface
Processes and Landforms, 25 (7), 679 - 679.
Perez, F .L. 1991. 'Particle sorting due to off-road vehicle traffic in a high Andean Paramo',
Catena, 18, 239 - 254.
Perry, A. 1981. 'Mediterranean Climate- A synoptic reappraisal', Progress
Geography, 5, 107- 113.
in Physical
Phillip, J.R. 1957. 'The theory of infiltration 1. The infiltration equation and its solution', Soil
Science, 83, 345- 357.
Phillips, J.D. 1999. 'Earth surface systems: Chaos, complexity and order', Blackwell Publishers
Ltd., Oxford, UK.
Picavet, P.L. 1912. 'Suspension Pendulare Elliptique', Revue du Cerf-Volant, November issue.
Pielou, E.C. 1975. 'Ecological diversity', Wiley and Sons, New York.
Pitty, A.F. 1969. 'A scheme for hillslope analysis', Occasional Papers in Geography, No. 9,
University of Hull.
Poesen, J. 1987. 'Transport of rock fragments by rill flow- a field study', Gatena, 8, 35-54.
Poesen, J. and lngelmo-Sanchez, F. 1992. 'Runoff and sediment yield from topsails with
different porosity as affected by rock fragment cover and position', Galena, 19,
451 -474.
Poesen, J. and Lavee, H. 1994. 'Rock fragments in top soils: significance and processes',
Galena, 24, 1 - 28.
-343-

Poesen, J., lngelmo-Sanchez, F. and Mucher, H. 1990. 'The hydrological response of soil
surfaces to rainfall as affected by cover and position of rock fragments in the top
layer', Earth Surface Processes and Landforms, The Journal of the British
Geomorphological Research Group, 15, 653 - 671.
Prigogine, I. 2001.
01.02.02
http://www.mdpi.org/entropy/entropyweb/prigogine.htm - accessed
Puigdefabregas J., Gutierrez L., Sole A., Del Barrio G. and Boer M.M. 1998. 'Differential
responses of hillslope and channel elements to rainfall events in a semi-arid area',
Geomorpho/ogy, 23, 2- 4, 337- 351.
Quennell, A.M. 1951. 'The geology and mineral resources of Trans-Jordan', Colonial Geology
and Mineral Resources, 2, 85 - 115.
Quennell, A.M. 1984. 'The Western Arabia rift system', in Dixon, J. E. and Robertson, A. H. F.
'The geological evolution of the eastern Mediterranean', Geological Society
Special Publication, 17, 775- 788.
Quennell, A.M. 1956. 'Geological map of Jordan (East of the Rift Valley)- Scale 1: 250,000',
RJGC, Amman, Jordan.
Rahn, P.H. 1967. 'Sheetfloods, streamfloods and the formation of pediments', Annals of the
Association of American Geographers, 57, 593- 604.
Ripley, B.D. 1988. 'Statistical inference for spatial processes', Cambridge University Press,
Cambridge, UK.
Roberts, N. 1982. 'Lake levels as an indicator of Near Eastern palaeo-climates: a preliminary
appraisal', in Bintliff, J. L. and Van Zeist, W. (Eds), 'Palaeoclimates,
palaeoenvironments and human communities in the Eastern Mederranean region
in Later Prehistory', B.A.R. International Series 133, Oxford, 235- 167.
Robinson D.A. and Naghizadeh R. 1992. The impact of cultivation practice and wheelings on
runoff generation and soil erosion on the South Downs: some experimental
results using simulated rainfall', Soil Use and Management, 8, no.4, 151- 156.
Rodriguez-lturbe, I. and Rindalo, A. 1997. 'Fractal river basins. Change and self-organisation',
Cambridge University Press, Cambridge, UK.
Rohdenburg, H. and Walther, D. 1968. 'Rezente Struckturboden in Giessen', Eiszeitalter und
Gegenwart, 19, 272 - 282.
Rolshoven, M. 1976. 'Aktiuve Frostmusterung in Augsberg', Eiszeitalter und Gegenwart, 27,
-344-

189- 192.
Romkens M.J.M., Helming K. and Prasad S.N. 2002. 'Soil erosion under different rainfall
intensities, surface roughness, and soil water regimes', Catena, no. 2 - 3, 103 -
123.
Roux, J.S. and Roos, Z.N. 1986 'The relationship between the size of particles in surface wash
sediment and rainfall characteristics on a low angle slope in a semi-arid climate',
Zietschrift fOr Geomorpho/ogie, 30, 3, 357- 362.
Russo, D. and Jury, W.A. 1987. 'A theoretical study of the estimation of the correlation scale in
spatially variable fields 1. Stationary fields', Water Resources Research, 23, 1257
- 1268.
Saffarini, G.A., Nassir, S. and Abed, A.M. 1985. 'A contribution to the petrology and
geochemistry of the Quaternary-Neogene basalts of central Jordan', Dirasat, 12,
133- 144.
Salles, C., Poesen, J. and Borselli, L. 1999. 'Measurement of simulated drop size distribution
with an optical spectre pluviometer: Sample size considerations', Earth Surface
Processes and Landforms, 24, no.6, 545 - 556.
Schlichting, H. 1955. 'Boundary-layer theory', Pergamon, London.
Schumm, S.A. 1991. 'To interpret the Earth: Ten ways to go wrong', Cambridge University
Press, Cambridge.
Seginer, 1., Morin, J. and Schahori. 1962. 'Runoff and erosion studies in a mountainous Terra
Rosa region in Israel', Bulletin of the International Association of Scientific
Hydrology, 7 (4), 79- 92.
Selby, M.J. 1993. 'Hills/ope materials and processes', Oxford University Press, Oxford, UK.
Sena, G., Connell, S., Wells, S.G., and Andersen, K. 1994. 'Investigation into the surficial
processes active on fan pavement surfaces using titled carbonate collars,
Providence Mountains, Califormia', in McGill, S.F. and Ross, T.M. (Eds)
Geological Society of America, Cordilleran Section Guidebook, 210- 213.
Shalizi, C. 2001. http://www.santafe.edu/-shalizilnotebooks/self-organization.html - accessed -
01.02.02
Sharma M.L., Gander G.A. and Hunt C.G. 1980. 'Spatial variability of infiltration in a
watershed', Journal of Hydrology, 44, no.1- 2, 101- 122.
Shaw, S.H. 1947. 'Southern Palestine geological map on a scale of 1 250 000 with
-345-

explanatory notes', Government Printer, Government of Palestine, Jerusalem.
Shehadeh, N. 1985. 'The climate of Jordan in the past and present', in Hadidi, A. (Ed), 'Studies
in the history and archaeology of Jordan', Amman, Jordan, Department of
Antiquities, Heshamite Kingdom of Jordan, Amman, Jordan.
Shortis, M.R. and Beyer, H.A. 1996. 'Sensor technology for digital photogrammetry and
machine vision', in Atkinson, K.B. (Ed) 'Close Range Photogrammetry and
Machine Vision', Whittles Publishing, Caithness, 106 - 155.
Silverman, B.W.1986 'Density Estimation for Statistics and Data Analysis', Chapman and Hall,
New York.
Simanton, R.J., Rawitz, E.D. and Shirley, E.D. 1984. 'The effects of rock fragments on erosion
of semiarid soils', in Erosion and productivity of soils containing rock fragments',
Soil Science Society of America, Special Publication 13, 65- 72.
Slattery, M.C. 1994. 'Contemporary sediment dynamics and sediment delivery in a small
agricultural catchment, north Oxfordshire, U~. Unpublished Ph.D thesis,
University of Oxford.
Smith, R.E. and Hebbert, R.H.B. 1979. 'A Monte-Carlo analysis of the hydrological effects of
spatial variability of infiltration', Water Resources Research, 15, 419- 429.
Springer, M.E. 1958. 'Desert pavement and vesicular layer of some soils in the desert of the
Lahontan Basin, Nevada', Soil Science Society of America Proceedings, 22, 63 -
66.
Starky, J. and El Daly, 0. 2000. 'Desert travelers: from Herodotus to T.E. Lawrence', ASTENE,
UK.
Stolum, H.H. 1996. 'River meandering as a self-organization process', Science, 271, no. 5256,
1710- 1713.
Tansey, K. 1999. 'Monitoring and modelling surface moisture in north-east Jordan using ERS
SAR data', Unpublished PhD Thesis, Department of Geography, University of
Leicester, UK.
Tansey, K.; White, K.; Battikhi, A.M. and Millington, A. 1996. 'Relationships between surface
roughness and ERS-1 SAR backscatter on desert surfaces in eastern Jordan:
preliminary results', Proceedings of the 22nd annual conference of the Remote
Sensing Society: remote sensing, science and industry, University of Durham,
Remote Sensing Society.
Tarawneh, K., llani, S., Rabba, 1., Harlavan, Y., Peltz, S., lbraham, K., Weinberger, R.and
- 346-

Steinitz, G. 2000. 'Dating of the Harrat Ash Shaam Basalts, Northeast Jordan
(Phase 1)' Jordanian Natural Resources Agency, Geological Survey of Israel
Report GSII2/2000.
Thiede, J., 1978. 'A glacial Mediterranean', Nature, 276, 680-683.
Thornson, R.M. and Bender, G. 1985. 'Eolian deflation by katabatic ancient winds: a late
quaternary example from the north Alaska Range', Geological Society of America
Bulletin, 96, 702- 709.
Tingbao, X., Moore, I.D. and Gallant J.C. 1993. 'Fractals, fractal dimensions and landscapes
a review', Geomorphology, 8, no.4, 245- 262.
Toffoli, T. and Margolus, N. 1987. 'Cellular Automata Machines: A New Environment for
Modelling', Cambridge, MA: The M. I. T. Press.
Torri, D., Regues, D., Pellegrini, S. and Bazzoffi, P. 2000. 'Within-storm soil surface dynamics
and erosive effects of rainstorms', Catena, 31, 138- 150.
Touchan, R. and Hughes, M.K. 1999. 'Dendrochronology in Jordan', Journal of Arid
Environments, 42, 291 - 303.
Tribe, S. and Church, M. 1999. 'Simulations of cobble structure on a gravel streambed', Water
Resources Research, 35, no. 1, 311 - 318.
Valentin, C. 1994. 'Surface sealing as affected by various rock fragment covers in West Africa',
Catena, 23, 87- 97.
Valentin, C. and Casenave, A. 1992. 'Infiltration into sealed soils as influenced by gravel
cover', Soil Science Society of America Journal, 56, no. 6, 1667- 1673.
Valladas, H. 1992. 'Thermoluminescence dating of flint', Quaternary Science Reviews, 11, 1 -
5.
van Ash, T.W. 1980. 'Water erosion on slopes and landsliding in a Mediterranean landscape',
Utrechtse Geografishce Studies, 20, 238.
van den Boom, B. and Suwwan, 0. 1966. 'Report on geological and petrological studies of the
plateaubasalts in NE Jordan, Unveroffentlich Bericht der deutschen geologischen
Mission in Jordanien', Archiv Bundesanstalt fOr Bodenforschung, Hanonver.
van Dijk A.I.J.M., Bruijnzeel L.A. and Rosewell C.J. 2002. 'Rainfall intensity-kinetic energy
relationships: A critical literature appraisal', Journal of Hydrology, 261, no.1 - 4, 1 -
23.
Vincent, P. and Sadah, A. 1995. 'Downslope changes in the shape of pediment debris, Saudi
- 347-

Arabia', Sedimentary Geology, 95, no.3-4, 207- 219.
Vincent, P. and Sadah, A. 1996. The profile form of rock-cut pediments in western Saudi
Arabia', Journal of Arid Environments, 32, no.2, 121 - 139.
Vincent, P. and Sadah, A. 1995b 'Fabric analyses of some Saudi Arabian pediment gravels',
Journal of Arid Environments, 30, no.4, 371 - 384.
Vincent, P. and Sadah, A. 1996a 'Particle size spectra of some Saudi Arabian pedisediments',
Journal of Arid Environments, 33, no.1, 1 - 8.
Wainwright, J. Parsons, A.J. and Abrahams, A.D. 1999. 'Field and computer simulation
experiments on the formation of desert pavement', Earth Surface Processes and
Landforms, The Journal of the British Geomorphological Research Group, 24,
1025- 1037.
Wainwright, J., Abrahams, A.D. and Parsons, A.J. 2000. 'Plot-scale studies of vegetation,
erosion and overland flow interactions: Case studies from Arizona and New
Mexico', Hydrological Processes, 14, no. 16, 2921 - 2943.
Warburton, J 1998. 'A reconnaissance survey of surface water infiltration characteristics', in
Dutton, R.W., Clark, J.l. And Battikhi, A.M. (Eds). 'Arid land resources and their
managemenf, Kegan Paul International, London, 157- 170.
Washburn, A.L. 1979. 'Geocryology', Edward Arnold Ltd., London.
Watt, A.S. 1947. 'Pattern and process in the plant community', Journal of Ecology, 35, 1 -22.
Weider, M. Yair, A. and Arzi, A. 1985. 'Catenary soil relationships of arid hillslopes', Catena, 6,
41 -57.
Werner, B.T. and Fink, T.M. 1993. 'Beach cusps as self-organized patterns', Science, 260, 968
- 971.
Werner, B.T. and Hall et, B. 1993. 'Numerical simulation of self-organized stone stripes',
Nature, 361, 142- 145.
Wigley, T.M.L. and Farmer, G. 1982. Climate of the eastern Mediterranean and Near East', in
Bintliff, J.L. and Van Zeist, W. (Eds) 'Palaeoclimates, palaeoenvironments and
human communities in the Eastern Mediterranean region in later prehistory',
BAR International, Oxford, UK, 3- 39.
Wilcox, B.P., Wood, M.K. and Tromble, J.T. 1988. 'Factors influencing infiltrability of semi-arid
mountain slopes', Journal of Range Management, 41, 197-206.
Wilson, P. and Clark, R. 1991. 'Development of miniature sorted patterned ground following
- 348-

soil erosion in East Falkland, South Atlantic', Earth Surface Processes and
Landforms, 16, 369 - 376.
Wohl, E.E., Anthony, D.J., Madsen, S.W. and Thompson, D.M. 1996. 'A comparison of surface
sampling methods for coarse fluvial sediments', Water Resources Research, 32,
no.10, 3219-3226.
Wolcott, J. and Church, M. 1991. 'Strategies for sampling spatially heterogeneous
phenomena: the example of gravel rivers', Journal of Sedimentary Petrology, 61,
no. 4, 534- 543.
Wolfram, S. 1984. 'Cellular automata as models of complexity', Nature, 311 (4), 281 - 312.
Wolman, M.G. 1954. 'A method of sampling coarse river-bed material', Transactions of the
American Geophysical Union, 35, 951 - 956.
Wunsam S. and Bowman J.C. 2001. 'Economical digital photomicroscopy', Journal of
Paleolimnology, 25, no.3, 399-403.
Yaalon, D.H. and Ganor, E. 1979. 'East Mediterranean trajectories of dust carrying storms
from the Sahara to Sinai', in Morales, C. 'Saharan dust', John Wiley, Chichester,
UK,187-193.
Yaalon, D.H. and Ginzbourg, D. 1966. 'Sedimentary characteristics and climatic analysis of
easterly dust storms in the Negev (Israel)', Sedimentology, 6, 315- 332.
Yair, A. 1990. The role of topography and surface cover upon soil formation along
hillslopes in arid climates', Geomorphology, 3, no.3- 4, 287- 299.
Yair, A. and Lavee, H. 1981. 'An investigation into source areas of sediment and sediment
transport by overland flow along arid hillslopes', Proceedings of the Symposium
on Erosion and Sediment Transport Measurements, IAHS Publication, 133, 433-
446.
Yair, A. and Lavee, H. 1979. 'Runoff generative processes and runoff yield from arid talus
mantled slopes', Earth Surface Processes and Landforms, 1, 235- 247.
Young, A. 1961. 'Characteristic and limiting slope angles', Zeitschrift far Geomorphologie, 5,
126- 131.
Young, A. 1974. 'Slope profile survey', British Geomorphological Research Group, Technical
Bulletin, 11.
Young, R.A. and Burwell, R.E. 1972. 'Prediction of runoff and erosion from natural rainfall
using a rain simulator', Soil Science Society of America Proceedings, 36 (5), 827-
-349-

830.
Zmeskal , 0 ., Vesely, M., Nezadal, M. and Buchnicek, M. 2001. 'Fractal Analysis of Image
Structures' , in 'Digital lmaging in Biology and Medicine', Czech Academy of
Science Ceske Budejovice, 57 - 59.
- 350-