Investigation of the mechanical behaviour of fine/coarse soil ...
290
HAL Id: tel-03467834 https://pastel.archives-ouvertes.fr/tel-03467834 Submitted on 6 Dec 2021 HAL is a multi-disciplinary open access archive for the deposit and dissemination of sci- entific research documents, whether they are pub- lished or not. The documents may come from teaching and research institutions in France or abroad, or from public or private research centers. L’archive ouverte pluridisciplinaire HAL, est destinée au dépôt et à la diffusion de documents scientifiques de niveau recherche, publiés ou non, émanant des établissements d’enseignement et de recherche français ou étrangers, des laboratoires publics ou privés. Investigation of the mechanical behaviour of fine/coarse soil mixture Yu Su To cite this version: Yu Su. Investigation of the mechanical behaviour of fine/coarse soil mixture. Géotechnique. École des Ponts ParisTech, 2021. English. NNT: 2021ENPC0015. tel-03467834
-
Upload
khangminh22 -
Category
Documents
-
view
1 -
download
0
Transcript of Investigation of the mechanical behaviour of fine/coarse soil ...
HAL Id: tel-03467834https://pastel.archives-ouvertes.fr/tel-03467834
Submitted on 6 Dec 2021
HAL is a multi-disciplinary open accessarchive for the deposit and dissemination of sci-entific research documents, whether they are pub-lished or not. The documents may come fromteaching and research institutions in France orabroad, or from public or private research centers.
L’archive ouverte pluridisciplinaire HAL, estdestinée au dépôt et à la diffusion de documentsscientifiques de niveau recherche, publiés ou non,émanant des établissements d’enseignement et derecherche français ou étrangers, des laboratoirespublics ou privés.
Investigation of the mechanical behaviour of fine/coarsesoil mixture
Yu Su
To cite this version:Yu Su. Investigation of the mechanical behaviour of fine/coarse soil mixture. Géotechnique. Écoledes Ponts ParisTech, 2021. English. �NNT : 2021ENPC0015�. �tel-03467834�
Investigation of the mechanical behavior of
fine/coarse soil mixture
École doctorale N°531 - SIE (Sciences, Ingénierie, Environnement)
Specialty: Geotechnical Engineering
Laboratoire Navier/CERMES
Date : 02 September 2021
by
Yu SU
Composition du jury :
Prof. Antonio Gomes Correia Président
(University of Minho)
Prof. Cyrille Chazallon Rapporteur
(INSA de Strasbourg)
Prof. Pierre Breul Rapporteur
(Université Clermont Auvergne)
Dr. Pierre Hornych Examinateur
(Université Gustave Eiffel)
Dr. Nicolas Calon Examinateur
(Société Nationale des Chemins de fer Français)
Dr. Jean-Claude Dupla Examinateur
(Ecole des Ponts ParisTech)
Dr. Jean Canou Examinateur
(Ecole des Ponts ParisTech)
Prof. Yu-Jun Cui Directeur de thèse
(Ecole des Ponts ParisTech)


I
ACKNOWLEDGEMENTS
This dissertaiton is the result of four years work in Laboratoire Navier of Ecole des Ponts
ParisTech. This work was financed by the China Scholarship Council (CSC) and Ecole des
Ponts ParisTech (ENPC). I would like to take this opportunity to address my thanks to all
persons who give me support to the accomplishment of this dissertation.
First, I would like to address my deepest gratitude to my supervisor Prof. Yu-Jun Cui. His
guidance, patience and encouragement are crucial elements in the course of my PhD work. It is
my honor to have such a responsible and outstanding supervisor. What he taught me is not only
helpful to my PhD work, but also beneficial for my future career.
I wish to acknowledge my co-supervisors Dr. Jean-Claude Dupla and Dr. Jean Canou, who
accompany me to finish the whole PhD work. Thanks for their excellent guidance and
constructive suggestions to help me finish the experimental tests.
I am grateful to all other Jury members: Prof. Cyrille Chazallon, Prof. Pierre Breul, Prof.
Antonio Gomes Correia, Dr. Pierre Hornych and Dr. Nicolas Calon. Thanks to them for
examining this dissertation and giving constructive comments and suggestions.
I also wish to address my thanks to my friends and colleagues in Ecole des Ponts ParisTech,
especially those who came to France together and almost graduated in the same time: Zi, Hao,
Zhi-Xiong, Yang-Zi and so on. I am also grateful to the technical team: Emmanuel De Laure,
Marine Lemaire, Xavier Boulay, Baptiste Chabot and Loïc Lesueur. Without their help, it is
impossible for me to finish my experimental tests.
For the early 29 years of the whole life, one of the luckiest things happened on me is to meet Uncle
Yang, the founder of Guohua Memory Middle School and the company of Country Garden
Holdings. They have supported me economically and mentally for fourteen years. They taught
me how to be a better person and devote myself to the society.
Finally, I am so lucky to have my fiancée Jing Xiong and family standing with me forever. No
matter what difficulties I face and what decisions I make, they choose to trust me and support
me.
II
RESUME
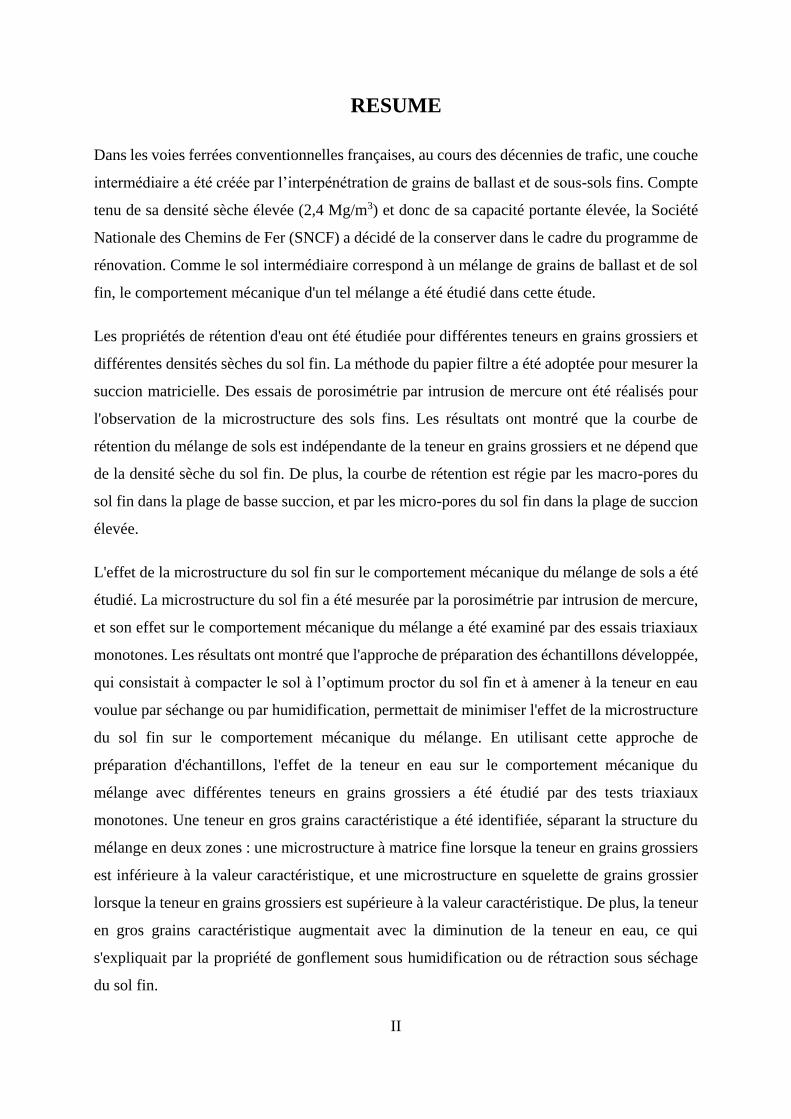
Dans les voies ferrées conventionnelles françaises, au cours des décennies de trafic, une couche
intermédiaire a été créée par l’interpénétration de grains de ballast et de sous-sols fins. Compte
tenu de sa densité sèche élevée (2,4 Mg/m3) et donc de sa capacité portante élevée, la Société
Nationale des Chemins de Fer (SNCF) a décidé de la conserver dans le cadre du programme de
rénovation. Comme le sol intermédiaire correspond à un mélange de grains de ballast et de sol
fin, le comportement mécanique d'un tel mélange a été étudié dans cette étude.
Les propriétés de rétention d'eau ont été étudiée pour différentes teneurs en grains grossiers et
différentes densités sèches du sol fin. La méthode du papier filtre a été adoptée pour mesurer la
succion matricielle. Des essais de porosimétrie par intrusion de mercure ont été réalisés pour
l'observation de la microstructure des sols fins. Les résultats ont montré que la courbe de
rétention du mélange de sols est indépendante de la teneur en grains grossiers et ne dépend que
de la densité sèche du sol fin. De plus, la courbe de rétention est régie par les macro-pores du
sol fin dans la plage de basse succion, et par les micro-pores du sol fin dans la plage de succion
élevée.
L'effet de la microstructure du sol fin sur le comportement mécanique du mélange de sols a été
étudié. La microstructure du sol fin a été mesurée par la porosimétrie par intrusion de mercure,
et son effet sur le comportement mécanique du mélange a été examiné par des essais triaxiaux
monotones. Les résultats ont montré que l'approche de préparation des échantillons développée,
qui consistait à compacter le sol à l’optimum proctor du sol fin et à amener à la teneur en eau
voulue par séchange ou par humidification, permettait de minimiser l'effet de la microstructure
du sol fin sur le comportement mécanique du mélange. En utilisant cette approche de
préparation d'échantillons, l'effet de la teneur en eau sur le comportement mécanique du
mélange avec différentes teneurs en grains grossiers a été étudié par des tests triaxiaux
monotones. Une teneur en gros grains caractéristique a été identifiée, séparant la structure du
mélange en deux zones : une microstructure à matrice fine lorsque la teneur en grains grossiers
est inférieure à la valeur caractéristique, et une microstructure en squelette de grains grossier
lorsque la teneur en grains grossiers est supérieure à la valeur caractéristique. De plus, la teneur
en gros grains caractéristique augmentait avec la diminution de la teneur en eau, ce qui
s'expliquait par la propriété de gonflement sous humidification ou de rétraction sous séchage
du sol fin.
III
L'effet de la teneur en eau sur la déformation permanente, le module réversible et le coefficient
d'amortissement du mélange de sols a été étudié par des essais triaxiaux cycliques. Une
procédure de chargement en plusieurs étapes à long terme a été adoptée pour étudier la
déformation permanente, et une procédure de chargement en plusieurs étapes à court terme a
été adoptée pour étudier le module réversible et le coefficient d'amortissement. Les résultats ont
montré qu'une augmentation de la teneur en eau entraînait une augmentation de la déformation
permanente et une diminution du module réversible en raison de la diminution de la succion
matricielle, et une augmentation du coefficient d'amortissement en raison de l'augmentation de
la viscosité du sol.
Une loi de comportement a été proposée pour la déformation permanente, permettant de tenir
compte des effets du nombre des cycles de chargement, de la contrainte déviatorique et de la
teneur en gros grains. De plus, l’effet de la succion matricielle était également pris en compte
en incorborant les propriétes de rétention d’eau. Une autre loi de comportement a été également
proposée pour le module réversible, permettant la description de la variation du module
réversible avec les variations de la contrainte déviatorique, de la succion matricielle et de la
teneur en gros grains.
Mots clés : mélange de sol fin / grossier; comportement mécanique; microstructure; teneur en
eau; teneur en grains grossiers; loi de comportement
IV
ABSTRACT
In the French conventional railway tracks, under the decades of traffic loadings, an interlayer
was created by the interpenetration of ballast grains and subgrade fine soil. Considering the high
bearing capacity related to its high dry density (2.4 Mg /m3), the French national railway
company (SNCF) decided to keep it as one part of the substructure during the renewal program.
As the interlayer soil corresponded to a mixture of ballast grains and fine soil, the mechanical
behaviour of such fine/coarse soil mixture was investigated in this study.
The water retention properties of soil mixture were investigated under varying coarse grain
contents and dry densities of fine soil. The filter paper method was adopted to measure the
matric suction. The mercury intrusion porosimetry tests were performed for the microstructure
observation of fine soil. Results showed that the soil-water retention curve of soil mixture was
independent of coarse grain content, and only dependent on the dry density of fine soil.
Moreover, the soil-water retention curve in low suction range was governed by macro-pores of
fine soil, while in high suction range by micro-pores of fine soil.
The effect of microstructure of fine soil on the mechanical behaviour of soil mixture was studied.
The microstructure of fine soil was measured by mercury intrusion porosimetry tests, and its
effect on the mechanical behaviour of mixture was examined by monotonic triaxial tests.
Results showed that the developed sample preparation approach, which is to compact the soil
at the optimum water content and then modify it to the desired value by either wetting or drying,
allowed the effect of microstructure of fine soil on the mechanical behaviour of mixture to be
minimized. Using this sample preparation approach, the effect of water content on the
mechanical behaviour of mixture with varying coarse grain contents was investigated by
monotonic triaxial tests. A characteristic coarse grain content was identified, separating the
fabric of mixture into two zones: a fine matrix macrostructure when the coarse grain content
was smaller than the characteristic value, and a coarse grian skeleton fabric when the coarse
grain content was larger than the characteristic value. Moreover, the characteristic coarse grain
content increased with the decrease of water content, which was explained by the shrinkage
property of fine soil.
The effect of water content on the permanent strain, the resilient modulus and the damping ratio
of soil mixture was investigated by cyclic triaxial tests. A long-term multi-stage loading
procedure was performed for studying permanent strain, and a shor-term multi-stage loading
V
procedure for studying resilient modulus and damping ratio. Results showed that increasing
water content led to an increase of permanent strain and a decrease of resilient modulus owing
to the decrease of matric suction, and an increase of damping ratio owing to the increase of soil
viscosity.
A constitutive model was proposed for the permanent strain, allowing the effects of the number
of loading cycles, deviator stress and coarse grain content to be accounted for. Furthermore, the
effect of matric suction was taken into account by incorporating soil-water retention curve.
Another constitutive model was developed for the resilient modulus, allowing the description
of the resilient modulus variation with changes in deviator stress, matric suction and coarse
grain content.
Keywords: fine/coarse soil mixture; mechanical behaviour; microstructure; water content;
coarse grain content; constitutive model
VI
PUBLICATIONS
1. Su, Y., Cui, Y. J., Dupla, J. C., Canou, J., & Qi, S. 2021. Developing a Sample Preparation
Approach to Study the Mechanical Behavior of Unsaturated Fine/Coarse Soil Mixture.
Geotechnical Testing Journal, 44(4), 912-928.
2. Su, Y., Cui, Y. J., Dupla, J. C., Canou, J., & Qi, S. 2020. A fatigue model for track-bed
materials with consideration of the effect of coarse grain content. Transportation Geotechnics,
23, 100353.
3. Su, Y., Cui, Y. J., Dupla, J. C., & Canou, J. 2020. Investigation of the effect of water content
on the mechanical behavior of track-bed materials under various coarse grain contents.
Construction and Building Materials, 263, 120206.
4. Su, Y., Cui, Y. J., Dupla, J. C., & Canou, J. 2021. Effect of water content on resilient modulus
and damping ratio of fine/coarse soil mixtures with varying coarse grain contents.
Transportation Geotechnics, 26, 100452.
5. Su, Y., Cui, Y. J., Dupla, J. C., & Canou, J. 2021. Soil-water retention behaviour of
fine/coarse soil mixture with varying coarse grain contents and fine soil dry densities. Canadian
Geotechnical Journal. (Accepted)
6. Su, Y., Cui, Y. J., Dupla, J. C., & Canou, J. Effect of water content on permanent deformation
of fine/coarse soil mixtures with varying coarse grain contents and subjected to multi-stage
cyclic loading. Under review in Acta Geotechnica.
7. Su, Y., Cui, Y. J., Dupla, J. C., & Canou, J. Modelling the suction- and deviator stress-
dependent resilient modulus of unsaturated fine/coarse soil mixture by considering soil-water
retention curve. Under review in Acta Geotechnica.
8. Su, Y., Cui, Y. J., Dupla, J. C., & Canou, J. A fatigue model for fine/coarse soil mixture with
consideration of the effects of coarse grain content and suction. Under review in Canadian
Geotechnical Journal.
VII
CONTENTS
RESUME .................................................................................................................................... II
ABSTRACT ............................................................................................................................. IV
PUBLICATIONS ..................................................................................................................... VI
GENERAL INTRODUCTION .................................................................................................. 1
General context ................................................................................................................... 1
Objectives ........................................................................................................................... 3
Outline ................................................................................................................................ 3
CHAPTER Ⅰ. LITERATURE REVIEW .................................................................................... 6
I.1 Introduction ................................................................................................................... 6
I.2 Comparison between intact interlayer soil and reconstituted soil mixture ................... 6
I.3 Water retention behavior of soil mixture .................................................................... 12
I.4 Mechanical behavior of soil mixture .......................................................................... 16
I.4.1 Static behavior ...................................................................................................... 16
I.4.2 Permanent deformation behavior ......................................................................... 22
I.4.3 Dynamic characteristics ....................................................................................... 30
I.5 Constitutive models for soil mixture ........................................................................... 34
I.5.1 Permanent deformation ........................................................................................ 34
I.5.2 Resilient modulus ................................................................................................. 38
I.6 Conclusions ................................................................................................................. 44
CHAPTER Ⅱ. WATER RETENTION BEHAVIOR OF SOIL MIXTURE ............................ 46
Soil-water retention behaviour of fine/coarse soil mixture with varying coarse grain contents
and fine soil dry densities ..................................................................................................... 47
Introduction .................................................................................................................. 47
Materials and methods .................................................................................................. 49
Results .......................................................................................................................... 56
Discussions ................................................................................................................... 61
VIII
Conclusions .................................................................................................................. 65
References .................................................................................................................... 66
CHAPTER Ⅲ. MECHANICAL BEHAVIOR OF SOIL MIXTURE UNDER MONOTONIC
LOADING ................................................................................................................................ 70
Developing a sample preparation approach to study the mechanical behaviour of unsaturated
fine/coarse soil mixture ........................................................................................................ 71
Introduction .................................................................................................................. 71
Materials and methods .................................................................................................. 73
Experimental results ..................................................................................................... 80
Interpretation and discussion ........................................................................................ 90
Conclusions .................................................................................................................. 94
References .................................................................................................................... 96
Investigation of the effect of water content on the mechanical behavior of track-bed materials
under various coarse grain contents ..................................................................................... 99
Introduction .................................................................................................................. 99
Materials and methods ................................................................................................ 101
Experimental results ................................................................................................... 108
Discussions ................................................................................................................. 122
Conclusions ................................................................................................................ 123
References .................................................................................................................. 124
CHAPTER Ⅳ. MECHANICAL BEHAVIOR OF SOIL MIXTURE UNDER CYCLIC
LOADING .............................................................................................................................. 126
Effect of water content on permanent deformation of fine/coarse soil mixtures with varying
coarse grain contents and subjected to multi-stage cyclic loading ..................................... 127
Introduction ................................................................................................................ 127
Materials and sample preparation ............................................................................... 129
Cyclic triaxial tests ..................................................................................................... 134
Results and discussions .............................................................................................. 137
IX
Conclusions ................................................................................................................ 146
References .................................................................................................................. 147
Effect of water content on resilient modulus and damping ratio of fine/coarse soil mixtures
with varying coarse grain contents ..................................................................................... 150
Introduction ................................................................................................................ 150
Materials and methods ................................................................................................ 153
Experimental results ................................................................................................... 158
Interpretation and discussion ...................................................................................... 169
Conclusions ................................................................................................................ 171
References .................................................................................................................. 172
CHAPTER Ⅴ. MODELING OF THE MECHANICAL BEHAVIOR OF SOIL MIXTURE
WITH CONSIDERATION OF SOIL-WATER RETENTION CURVE ............................... 175
A fatigue model for track-bed materials with consideration of the effect of coarse grain
content ................................................................................................................................ 177
Introduction ................................................................................................................ 177
Modelling of permanent strain ................................................................................... 179
Determination of model parameters ........................................................................... 185
Model validation ......................................................................................................... 189
Discussion of the proposed fatigue model ................................................................. 190
Conclusions ................................................................................................................ 192
References .................................................................................................................. 193
A fatigue model for fine/coarse soil mixture accounting for the effects of coarse grain content
and suction by incorporating soil-water retention curve .................................................... 195
Introduction ................................................................................................................ 195
Modelling background ............................................................................................... 197
Proposition of a new model ........................................................................................ 199
Validation of the proposed model .............................................................................. 201
Comparisons between the proposed model and three representative existing models213
X
Conclusions ................................................................................................................ 222
References .................................................................................................................. 224
Modelling the suction- and deviator stress-dependent resilient modulus of unsaturated
fine/coarse soil mixture by considering soil-water retention curve ................................... 226
Introduction ................................................................................................................ 226
Modelling background ............................................................................................... 230
Proposition of a new model ........................................................................................ 232
Validation of the proposed model .............................................................................. 240
Comparison between the prosed model and representative existing models ............. 251
Conclusions ................................................................................................................ 259
References .................................................................................................................. 260
CONCLUSIONS AND PERSPECTIVES ............................................................................. 263
Conclusions ................................................................................................................ 263
Perspectives ................................................................................................................ 266
REFERENCES ....................................................................................................................... 268
Chapter Ⅰ. Literature review
1
GENERAL INTRODUCTION
General context
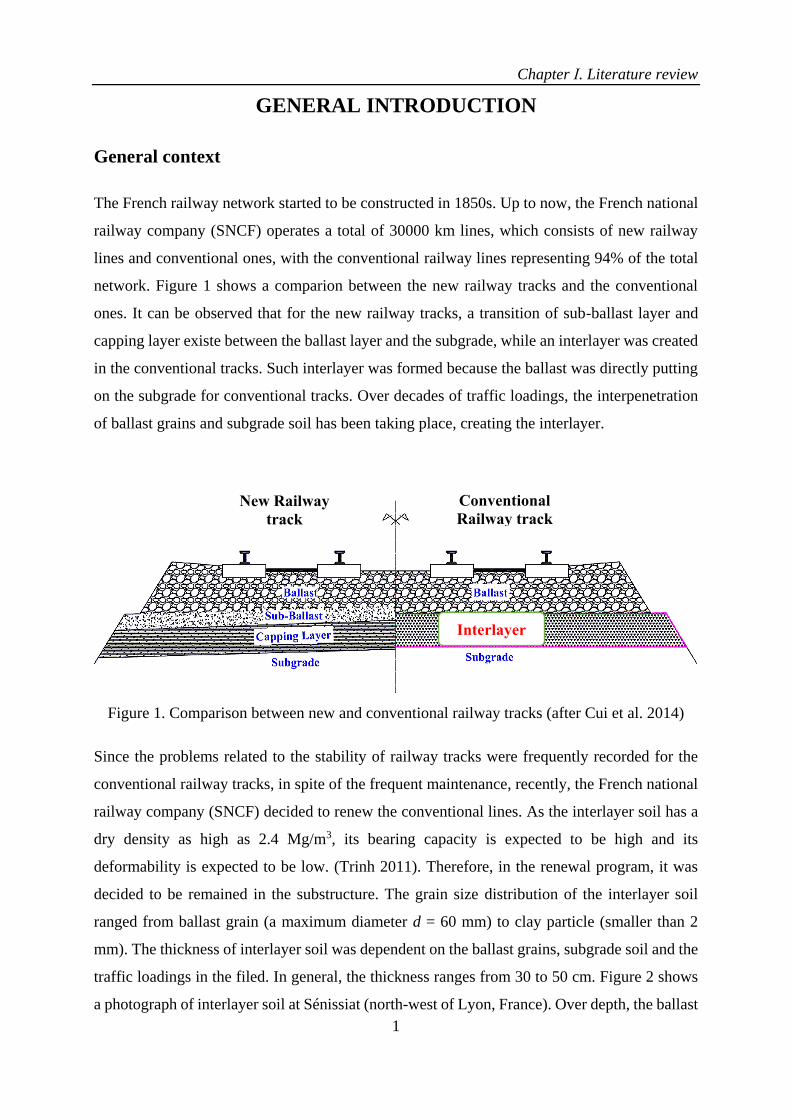
The French railway network started to be constructed in 1850s. Up to now, the French national
railway company (SNCF) operates a total of 30000 km lines, which consists of new railway
lines and conventional ones, with the conventional railway lines representing 94% of the total
network. Figure 1 shows a comparion between the new railway tracks and the conventional
ones. It can be observed that for the new railway tracks, a transition of sub-ballast layer and
capping layer existe between the ballast layer and the subgrade, while an interlayer was created
in the conventional tracks. Such interlayer was formed because the ballast was directly putting
on the subgrade for conventional tracks. Over decades of traffic loadings, the interpenetration
of ballast grains and subgrade soil has been taking place, creating the interlayer.
Figure 1. Comparison between new and conventional railway tracks (after Cui et al. 2014)
Since the problems related to the stability of railway tracks were frequently recorded for the
conventional railway tracks, in spite of the frequent maintenance, recently, the French national
railway company (SNCF) decided to renew the conventional lines. As the interlayer soil has a
dry density as high as 2.4 Mg/m3, its bearing capacity is expected to be high and its
deformability is expected to be low. (Trinh 2011). Therefore, in the renewal program, it was
decided to be remained in the substructure. The grain size distribution of the interlayer soil
ranged from ballast grain (a maximum diameter d = 60 mm) to clay particle (smaller than 2
mm). The thickness of interlayer soil was dependent on the ballast grains, subgrade soil and the
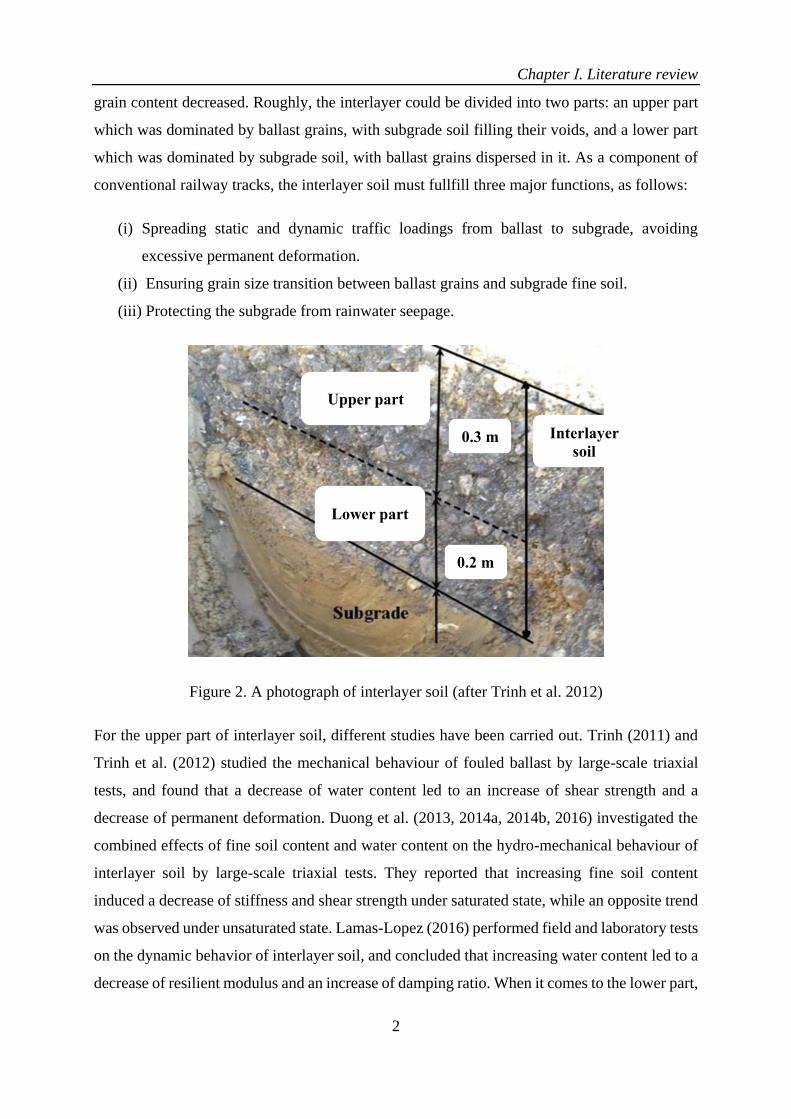
traffic loadings in the filed. In general, the thickness ranges from 30 to 50 cm. Figure 2 shows
a photograph of interlayer soil at Sénissiat (north-west of Lyon, France). Over depth, the ballast
Interlayer
New Railway
track
Conventional
Railway track
Chapter Ⅰ. Literature review
2
grain content decreased. Roughly, the interlayer could be divided into two parts: an upper part
which was dominated by ballast grains, with subgrade soil filling their voids, and a lower part
which was dominated by subgrade soil, with ballast grains dispersed in it. As a component of
conventional railway tracks, the interlayer soil must fullfill three major functions, as follows:
(i) Spreading static and dynamic traffic loadings from ballast to subgrade, avoiding
excessive permanent deformation.
(ii) Ensuring grain size transition between ballast grains and subgrade fine soil.
(iii) Protecting the subgrade from rainwater seepage.
Figure 2. A photograph of interlayer soil (after Trinh et al. 2012)
For the upper part of interlayer soil, different studies have been carried out. Trinh (2011) and
Trinh et al. (2012) studied the mechanical behaviour of fouled ballast by large-scale triaxial
tests, and found that a decrease of water content led to an increase of shear strength and a
decrease of permanent deformation. Duong et al. (2013, 2014a, 2014b, 2016) investigated the
combined effects of fine soil content and water content on the hydro-mechanical behaviour of
interlayer soil by large-scale triaxial tests. They reported that increasing fine soil content
induced a decrease of stiffness and shear strength under saturated state, while an opposite trend
was observed under unsaturated state. Lamas-Lopez (2016) performed field and laboratory tests
on the dynamic behavior of interlayer soil, and concluded that increasing water content led to a
decrease of resilient modulus and an increase of damping ratio. When it comes to the lower part,
Upper part
Lower part
0.3 m
0.2 m
Interlayer
soil
Chapter Ⅰ. Literature review
3
Wang et al. (2017, 2018a, 2018b) investigated the effect of coarse grain content fv on its static
and dynamic behaviors. They identified a characteristic coarse grain content fv-cha, which
separated the fabric of interlayer soil into two parts: a fine matrix macrostructure at fv < fv-cha,
and a coarse grain skeleton fabric at fv > fv-cha. Qi et al. (2020a, 2020b) studied the effect of grain
size distribution of coarse grains on the mechanical behavior of interlayer soil with both fabrics.
They found that a decrease of coefficient of uniformity Cu induced an increase of stiffness and
shear strength for the coarse grain skeleton fabric, while an opposite trend was observed for the
fine matrix macrostructure. However, the effect of water content on the mechanical behavior of
interlayer soil with both fabrics has not been investigated.
Objectives
In this study, the effects of water content and coarse grain content on the mechanical behaviour
of the reconstituted interlayer soil were investigated. The main objectives include:
(i) Studying the water retention behaviour of soil mixture with varying coarse grain
contents and fine soil dry densities.
(ii) Investigating the effect of microstructure of fine soil on the mechanical behaviour of
soil mixture.
(iii) Investigating the effect of water content on the mechanical behaviour of soil mixture
under monotonic loading, such as shear strength, cohesion, friction angle and so on.
(iv) Investigating the effect of water content on permanent deformation of soil mixture
under long-term multi-stage cyclic loading.
(v) Investigating the effect of water content on resilient modulus and damping ratio of soil
mixture under shor-term multi-stage cyclic loading.
(vi) Modelling the effects of water content and coarse grain content on the permanent
deformation and the resilient modulus of soil mixture by incorporating the soil-water
retention curve.
Outline
The dissertation is organized in five chapters.
The first chapter is devoted to the literature review. Firstly, a comparison was made between
the intact interlayer soil and the reconstituted soil mixture. A good agreement between these
two soils was obtained. Secondly, the water retention behavior of soil mixture was presented.
Chapter Ⅰ. Literature review
4
Thirdly, the mechanical behaviors of soil mixture were reported, in terms of static behavior and
dynamic behavior. Different factors affecting these mechanical behaviors were discussed.
Finally, the constitutive models describing variations of permanent deformation and resilient
modulus with changes in different factors were reviewed.
The second chapter is dedicated to the water retention behavior of soil mixture. The effects of
coarse grain content and dry density of fine soil on the soil-water retention curve (SWRC) of
mixture were investigated. The filter paper method was applied to measure the matric suction.
Mercury intrusion porosimetry tests were performed for the microstructure observation of fine
soil under varying dry densities. The SWRC of mixture was found to be only dependent on the
dry density of fine soil and independent of coarse grain content. These obtained results were
presented in a paper published in Canadian Geotechnical Journal.
The third chapter is devoted to the mechanical behaviour of fine/coarse soil mixture under
monotonic loading, which corresponded to two published papers. The first paper, published in
Geotechnical Testing Journal, developed a sample preparation approach for unsaturated soil
mixture, allowing the effect of microstructure of fine soil on the mechanical behaviour of
mixture to be minimized. The second paper, published in Construction and Building Materials,
addressed the effect of water content on mechanical behaviour of soil mixture with varying
coarse grain contents. A series of monotonic triaxial tests were conducted. The variations of
mechanical parameters with water content and coarse grain content were analysed.
The fourth chapter depicts the mechanical behaviour of soil mixture under cyclic loading, which
was presented in two papers. In the first paper submitted to Acta Geotechnica, the effects of
water content and coarse grain content on the permanent deformation of soil mixture were
investigated by cyclic triaxial tests. A long-term cyclic loading was performed for this purpose.
In the second paper published in Transportation Geotechnics, the effects of water content and
coarse grain content on dynamic properties of soil mixture were investigated, which included
resilient modulus and damping ratio. A shor-term cyclic loading was adopted.
The fifth chapter is devoted to the modeling of the mechanical bahavior of soil mixture
incorporating the soil-water retention curve, which were presented in three papers. The first
paper, published in Transportation Geotechnics, presents a fatigue model describing the
variation of permanent strain with the number of loading cycles, deviator stress and coarse grain
content. In the second paper submitted to Canadian Geotechnical Journal, a new fatigue model
Chapter Ⅰ. Literature review
5
incorporating matric suction was developed based on the previously developed fatigue model.
This model was validated using the experimental data from literature. Comparisons with
existing models showed the performance of the proposed model in describing the permanent
strain variation with changes in number of loading cycles, deviator stress, coarse grain content
and matric suction. In the third paper submitted to Acta Geotechnica, a constitutive model was
proposed for the resilient modulus of unsaturated soil mixtures, allowing the effects of matric
suction, deviator stress and coarse grain content to be accounted for. The proposed model was
validated by experimental results from literature. Comparisons with representative existing
models showed that the proposed model was capable to well describe the variations of resilient
modulus with changes in matric suction, deviator stress and coarse grain content.
The general conclusions were presented at the end, together with some perspectives for the
future study.
Chapter Ⅰ. Literature review
6
CHAPTER Ⅰ. LITERATURE REVIEW
I.1 Introduction
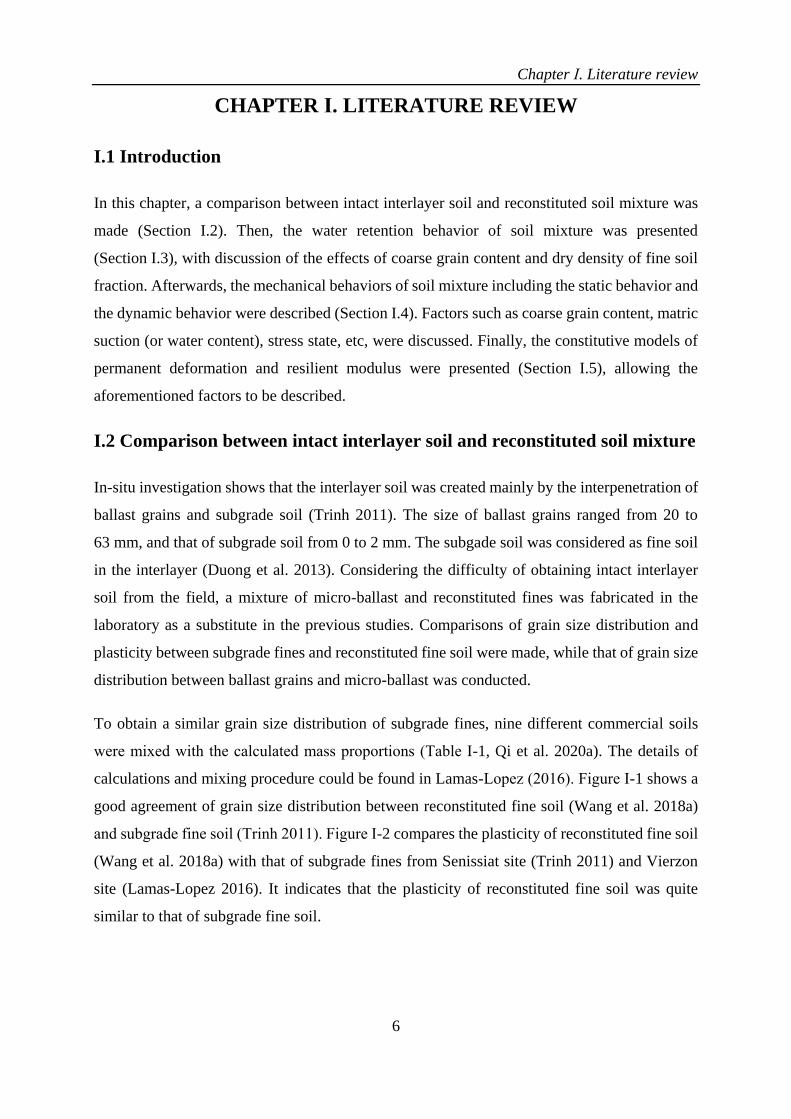
In this chapter, a comparison between intact interlayer soil and reconstituted soil mixture was
made (Section I.2). Then, the water retention behavior of soil mixture was presented
(Section I.3), with discussion of the effects of coarse grain content and dry density of fine soil
fraction. Afterwards, the mechanical behaviors of soil mixture including the static behavior and
the dynamic behavior were described (Section I.4). Factors such as coarse grain content, matric
suction (or water content), stress state, etc, were discussed. Finally, the constitutive models of
permanent deformation and resilient modulus were presented (Section I.5), allowing the
aforementioned factors to be described.
I.2 Comparison between intact interlayer soil and reconstituted soil mixture
In-situ investigation shows that the interlayer soil was created mainly by the interpenetration of
ballast grains and subgrade soil (Trinh 2011). The size of ballast grains ranged from 20 to
63 mm, and that of subgrade soil from 0 to 2 mm. The subgade soil was considered as fine soil
in the interlayer (Duong et al. 2013). Considering the difficulty of obtaining intact interlayer
soil from the field, a mixture of micro-ballast and reconstituted fines was fabricated in the
laboratory as a substitute in the previous studies. Comparisons of grain size distribution and
plasticity between subgrade fines and reconstituted fine soil were made, while that of grain size
distribution between ballast grains and micro-ballast was conducted.
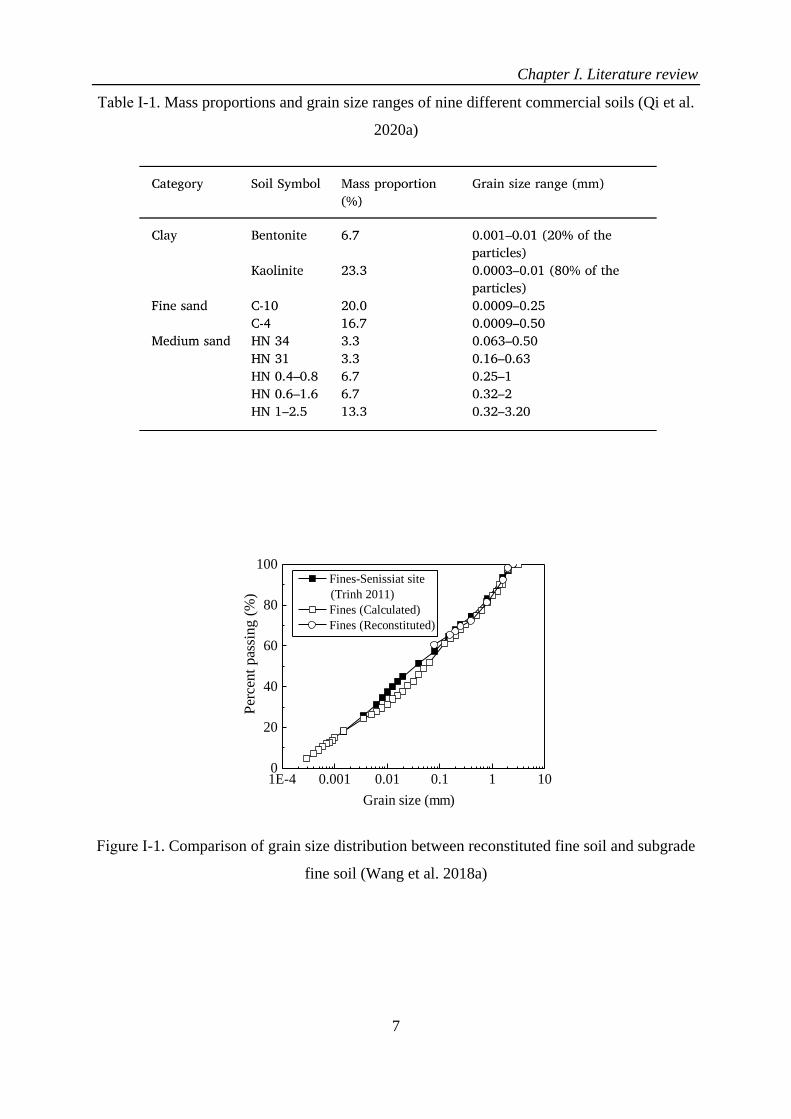
To obtain a similar grain size distribution of subgrade fines, nine different commercial soils
were mixed with the calculated mass proportions (Table Ⅰ-1, Qi et al. 2020a). The details of
calculations and mixing procedure could be found in Lamas-Lopez (2016). Figure Ⅰ-1 shows a
good agreement of grain size distribution between reconstituted fine soil (Wang et al. 2018a)
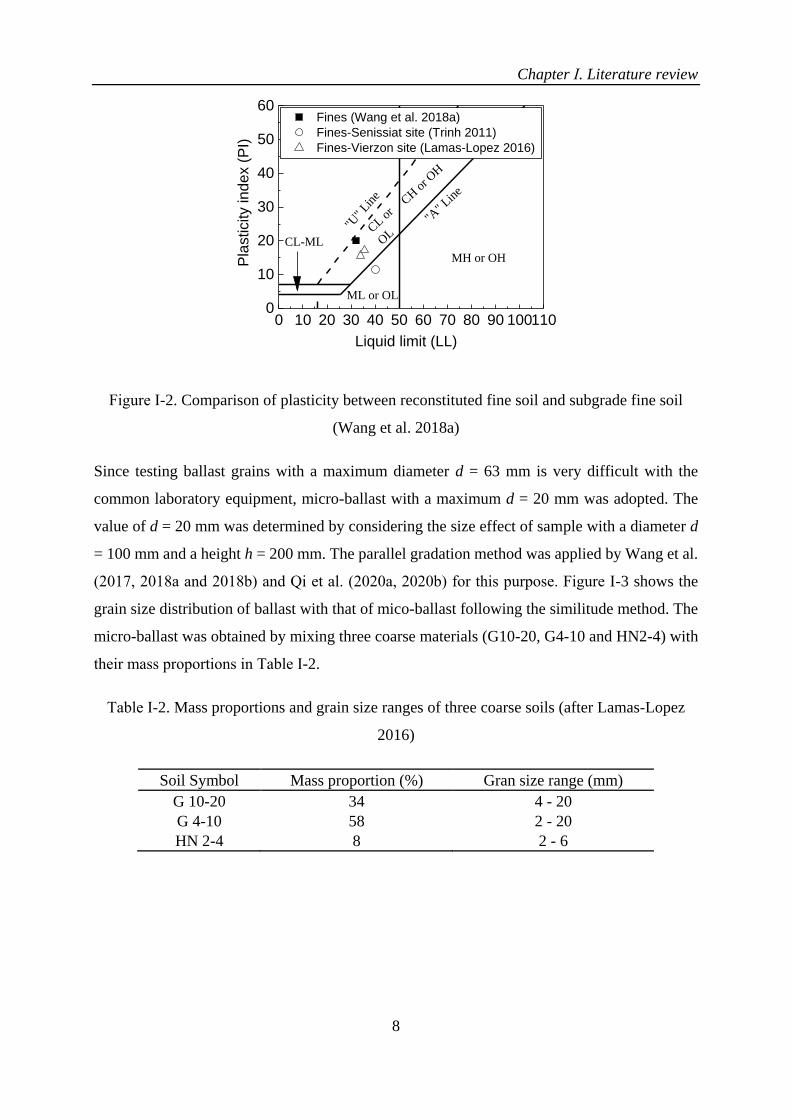
and subgrade fine soil (Trinh 2011). Figure Ⅰ-2 compares the plasticity of reconstituted fine soil
(Wang et al. 2018a) with that of subgrade fines from Senissiat site (Trinh 2011) and Vierzon
site (Lamas-Lopez 2016). It indicates that the plasticity of reconstituted fine soil was quite
similar to that of subgrade fine soil.
Chapter Ⅰ. Literature review
7
Table Ⅰ-1. Mass proportions and grain size ranges of nine different commercial soils (Qi et al.
2020a)
1E-4 0.001 0.01 0.1 1 100
20
40
60
80
100 Fines-Senissiat site
(Trinh 2011)
Fines (Calculated)
Fines (Reconstituted)
Per
cent
pas
sing (
%)
Grain size (mm)
Figure Ⅰ-1. Comparison of grain size distribution between reconstituted fine soil and subgrade
fine soil (Wang et al. 2018a)
Chapter Ⅰ. Literature review
8
0 10 20 30 40 50 60 70 80 90 1001100
10
20
30
40
50
60
OL
CL-ML
"U" Lin
e
"A" L
ine
CL o
r CH
or O
H
Pla
sticity in
de
x (
PI)
Liquid limit (LL)
ML or OL
MH or OH
Fines (Wang et al. 2018a)
Fines-Senissiat site (Trinh 2011)
Fines-Vierzon site (Lamas-Lopez 2016)
Figure Ⅰ-2. Comparison of plasticity between reconstituted fine soil and subgrade fine soil
(Wang et al. 2018a)
Since testing ballast grains with a maximum diameter d = 63 mm is very difficult with the
common laboratory equipment, micro-ballast with a maximum d = 20 mm was adopted. The
value of d = 20 mm was determined by considering the size effect of sample with a diameter d
= 100 mm and a height h = 200 mm. The parallel gradation method was applied by Wang et al.
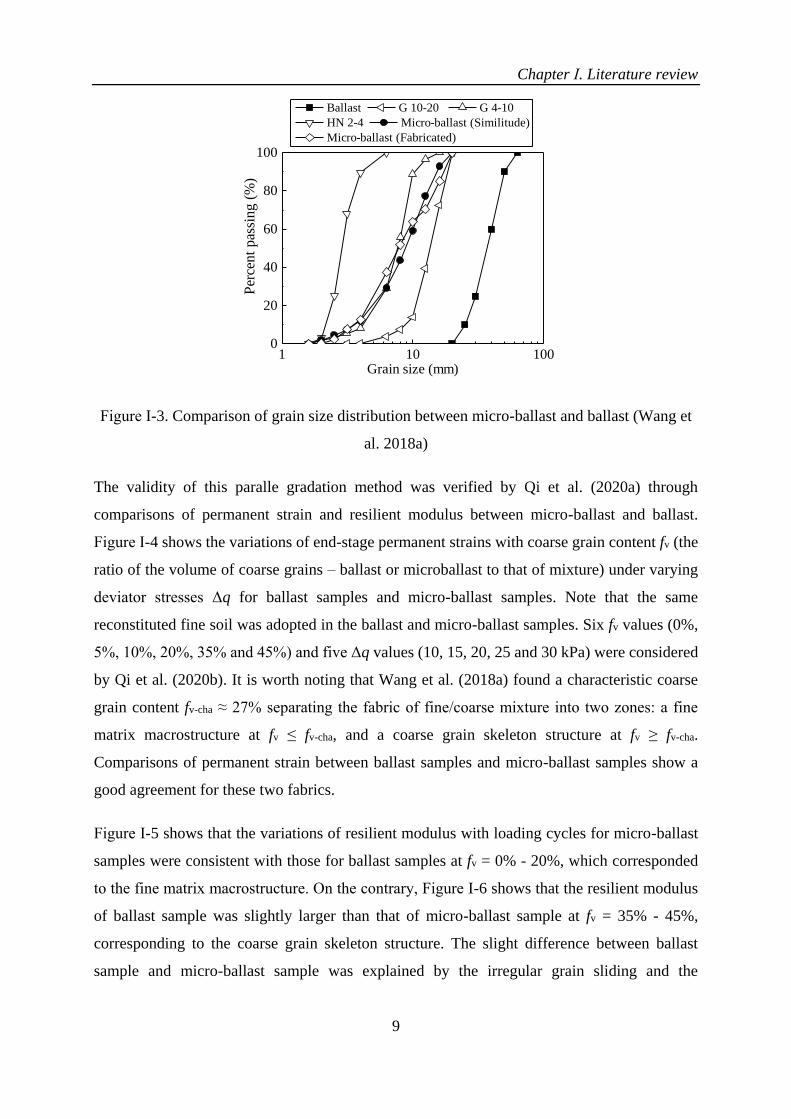
(2017, 2018a and 2018b) and Qi et al. (2020a, 2020b) for this purpose. Figure Ⅰ-3 shows the
grain size distribution of ballast with that of mico-ballast following the similitude method. The
micro-ballast was obtained by mixing three coarse materials (G10-20, G4-10 and HN2-4) with
their mass proportions in Table Ⅰ-2.
Table Ⅰ-2. Mass proportions and grain size ranges of three coarse soils (after Lamas-Lopez
2016)
Soil Symbol Mass proportion (%) Gran size range (mm)
G 10-20 34 4 - 20
G 4-10 58 2 - 20
HN 2-4 8 2 - 6
Chapter Ⅰ. Literature review
9
1 10 1000
20
40
60
80
100
Ballast G 10-20 G 4-10
HN 2-4 Micro-ballast (Similitude)
Micro-ballast (Fabricated)
Per
cent
pas
sing (
%)
Grain size (mm)
Figure Ⅰ-3. Comparison of grain size distribution between micro-ballast and ballast (Wang et
al. 2018a)
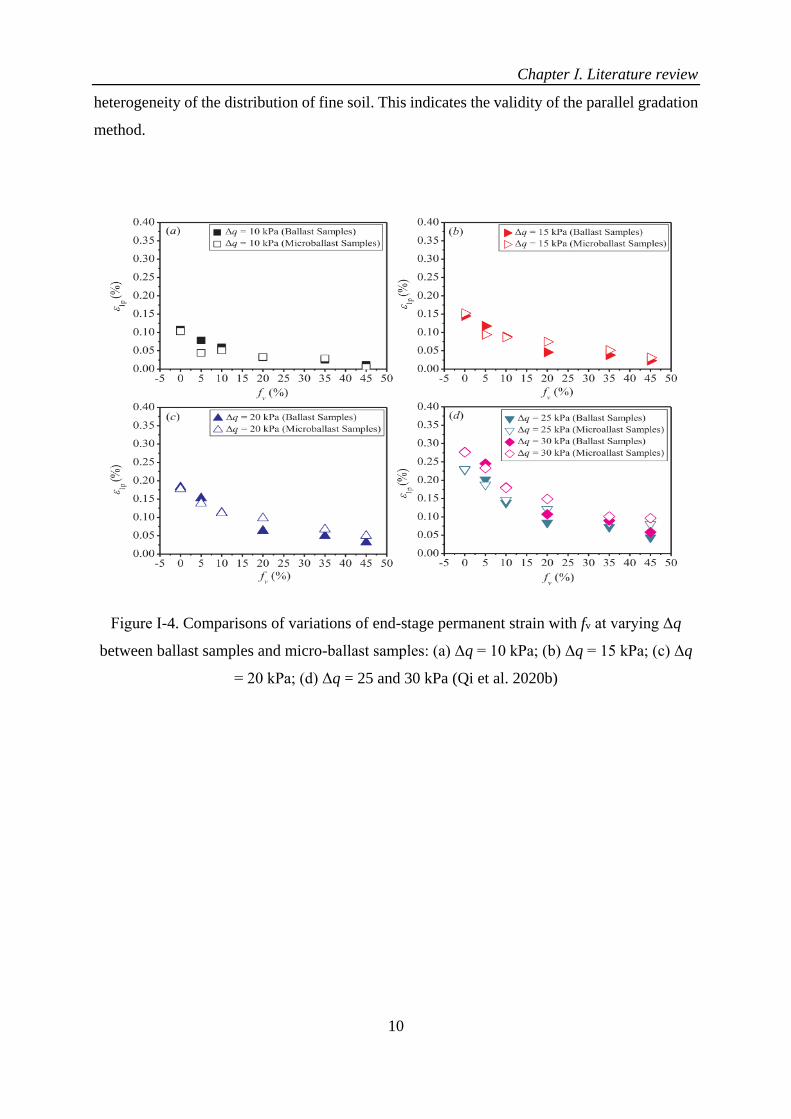
The validity of this paralle gradation method was verified by Qi et al. (2020a) through
comparisons of permanent strain and resilient modulus between micro-ballast and ballast.
Figure Ⅰ-4 shows the variations of end-stage permanent strains with coarse grain content fv (the
ratio of the volume of coarse grains – ballast or microballast to that of mixture) under varying
deviator stresses Δq for ballast samples and micro-ballast samples. Note that the same
reconstituted fine soil was adopted in the ballast and micro-ballast samples. Six fv values (0%,
5%, 10%, 20%, 35% and 45%) and five Δq values (10, 15, 20, 25 and 30 kPa) were considered
by Qi et al. (2020b). It is worth noting that Wang et al. (2018a) found a characteristic coarse
grain content fv-cha ≈ 27% separating the fabric of fine/coarse mixture into two zones: a fine
matrix macrostructure at fv ≤ fv-cha, and a coarse grain skeleton structure at fv ≥ fv-cha.
Comparisons of permanent strain between ballast samples and micro-ballast samples show a
good agreement for these two fabrics.
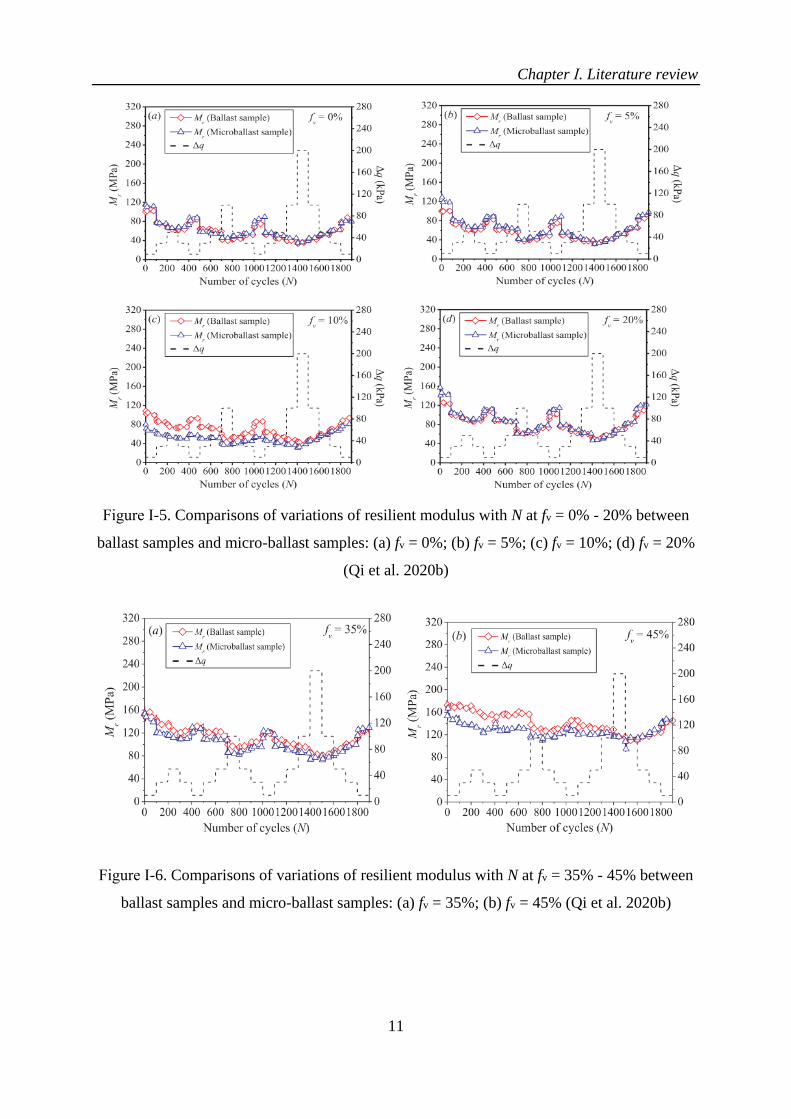
Figure Ⅰ-5 shows that the variations of resilient modulus with loading cycles for micro-ballast
samples were consistent with those for ballast samples at fv = 0% - 20%, which corresponded
to the fine matrix macrostructure. On the contrary, Figure Ⅰ-6 shows that the resilient modulus
of ballast sample was slightly larger than that of micro-ballast sample at fv = 35% - 45%,
corresponding to the coarse grain skeleton structure. The slight difference between ballast
sample and micro-ballast sample was explained by the irregular grain sliding and the
Chapter Ⅰ. Literature review
10
heterogeneity of the distribution of fine soil. This indicates the validity of the parallel gradation
method.
Figure Ⅰ-4. Comparisons of variations of end-stage permanent strain with fv at varying Δq
between ballast samples and micro-ballast samples: (a) Δq = 10 kPa; (b) Δq = 15 kPa; (c) Δq
= 20 kPa; (d) Δq = 25 and 30 kPa (Qi et al. 2020b)
Chapter Ⅰ. Literature review
11
Figure Ⅰ-5. Comparisons of variations of resilient modulus with N at fv = 0% - 20% between
ballast samples and micro-ballast samples: (a) fv = 0%; (b) fv = 5%; (c) fv = 10%; (d) fv = 20%
(Qi et al. 2020b)
Figure Ⅰ-6. Comparisons of variations of resilient modulus with N at fv = 35% - 45% between
ballast samples and micro-ballast samples: (a) fv = 35%; (b) fv = 45% (Qi et al. 2020b)
Chapter Ⅰ. Literature review
12
I.3 Water retention behavior of soil mixture
The water retention property plays an important role for the permanent deformation, stiffness
and shear strength of unsaturated soil mixture. The soil-water retention curve (SWRC) describes
the soil’s capacity to store and release water under vaying suctions, which was generally
expressed in terms of the suction as a function of the degree of saturation or the gravimetric
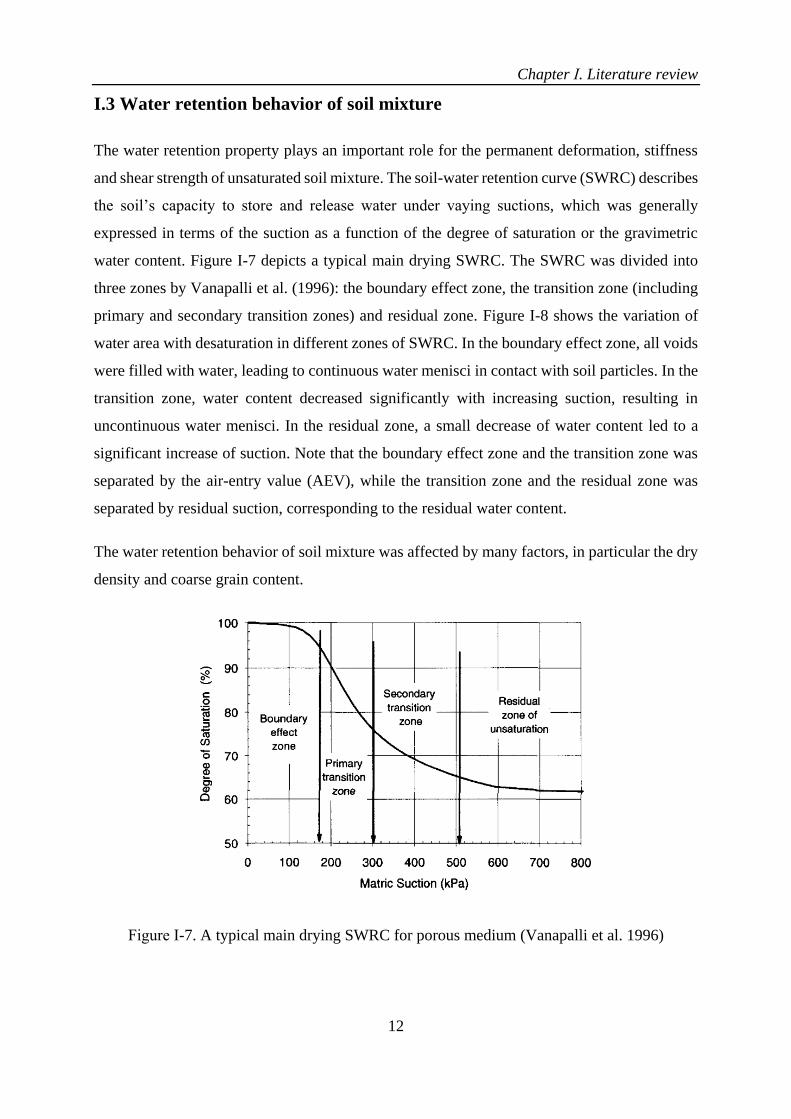
water content. Figure Ⅰ-7 depicts a typical main drying SWRC. The SWRC was divided into
three zones by Vanapalli et al. (1996): the boundary effect zone, the transition zone (including
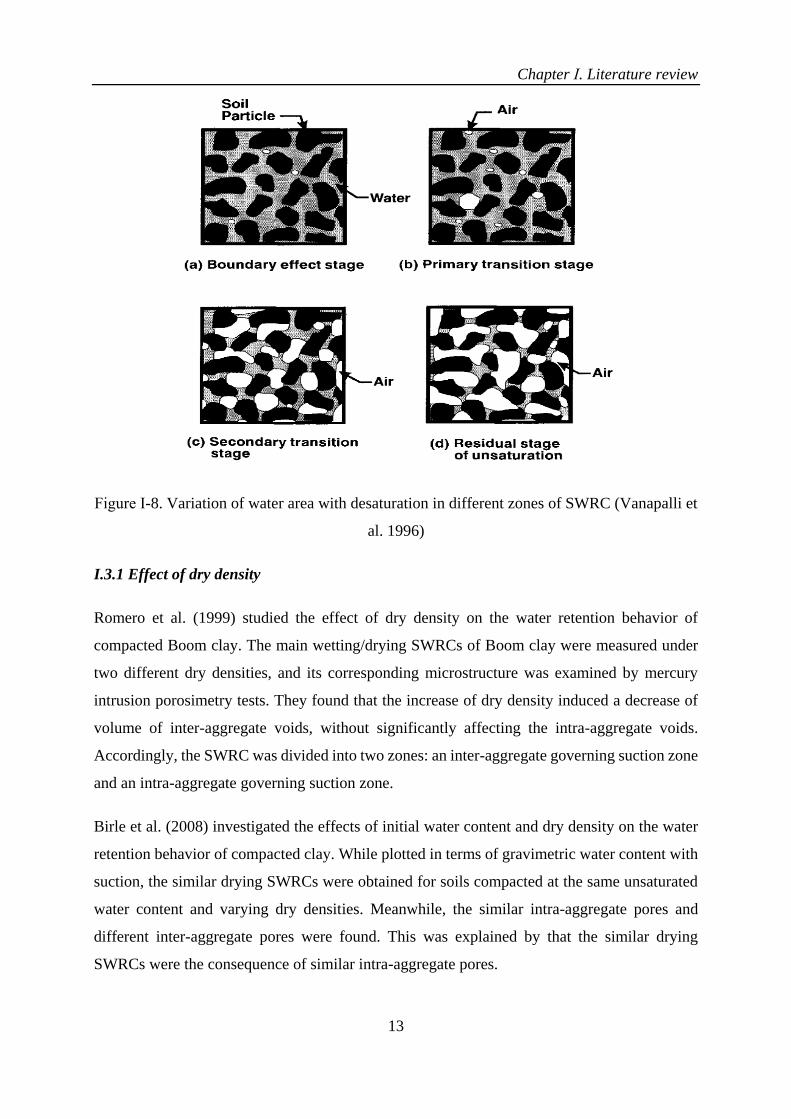
primary and secondary transition zones) and residual zone. Figure Ⅰ-8 shows the variation of
water area with desaturation in different zones of SWRC. In the boundary effect zone, all voids
were filled with water, leading to continuous water menisci in contact with soil particles. In the
transition zone, water content decreased significantly with increasing suction, resulting in
uncontinuous water menisci. In the residual zone, a small decrease of water content led to a
significant increase of suction. Note that the boundary effect zone and the transition zone was
separated by the air-entry value (AEV), while the transition zone and the residual zone was
separated by residual suction, corresponding to the residual water content.
The water retention behavior of soil mixture was affected by many factors, in particular the dry
density and coarse grain content.
Figure Ⅰ-7. A typical main drying SWRC for porous medium (Vanapalli et al. 1996)
Chapter Ⅰ. Literature review
13
Figure Ⅰ-8. Variation of water area with desaturation in different zones of SWRC (Vanapalli et
al. 1996)
I.3.1 Effect of dry density
Romero et al. (1999) studied the effect of dry density on the water retention behavior of
compacted Boom clay. The main wetting/drying SWRCs of Boom clay were measured under
two different dry densities, and its corresponding microstructure was examined by mercury
intrusion porosimetry tests. They found that the increase of dry density induced a decrease of
volume of inter-aggregate voids, without significantly affecting the intra-aggregate voids.
Accordingly, the SWRC was divided into two zones: an inter-aggregate governing suction zone
and an intra-aggregate governing suction zone.
Birle et al. (2008) investigated the effects of initial water content and dry density on the water
retention behavior of compacted clay. While plotted in terms of gravimetric water content with
suction, the similar drying SWRCs were obtained for soils compacted at the same unsaturated
water content and varying dry densities. Meanwhile, the similar intra-aggregate pores and
different inter-aggregate pores were found. This was explained by that the similar drying
SWRCs were the consequence of similar intra-aggregate pores.
Chapter Ⅰ. Literature review
14
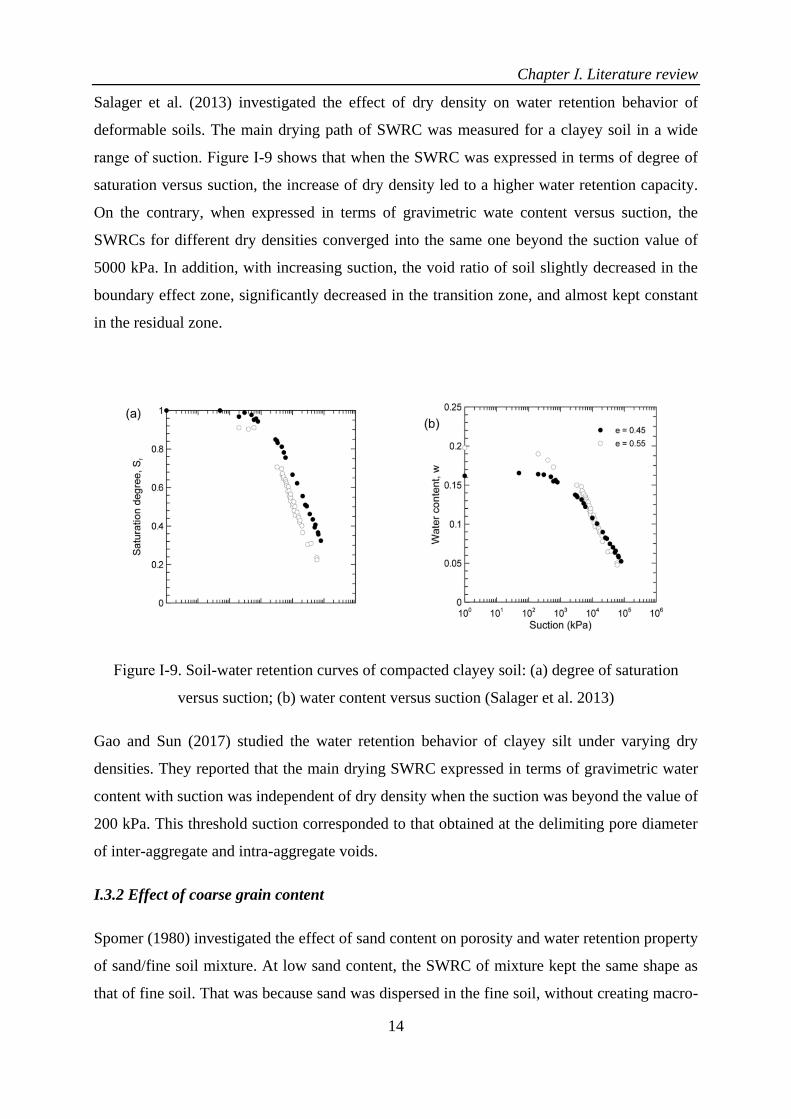
Salager et al. (2013) investigated the effect of dry density on water retention behavior of
deformable soils. The main drying path of SWRC was measured for a clayey soil in a wide
range of suction. Figure Ⅰ-9 shows that when the SWRC was expressed in terms of degree of
saturation versus suction, the increase of dry density led to a higher water retention capacity.
On the contrary, when expressed in terms of gravimetric wate content versus suction, the
SWRCs for different dry densities converged into the same one beyond the suction value of
5000 kPa. In addition, with increasing suction, the void ratio of soil slightly decreased in the
boundary effect zone, significantly decreased in the transition zone, and almost kept constant
in the residual zone.
Figure Ⅰ-9. Soil-water retention curves of compacted clayey soil: (a) degree of saturation
versus suction; (b) water content versus suction (Salager et al. 2013)
Gao and Sun (2017) studied the water retention behavior of clayey silt under varying dry
densities. They reported that the main drying SWRC expressed in terms of gravimetric water
content with suction was independent of dry density when the suction was beyond the value of
200 kPa. This threshold suction corresponded to that obtained at the delimiting pore diameter
of inter-aggregate and intra-aggregate voids.
I.3.2 Effect of coarse grain content
Spomer (1980) investigated the effect of sand content on porosity and water retention property
of sand/fine soil mixture. At low sand content, the SWRC of mixture kept the same shape as
that of fine soil. That was because sand was dispersed in the fine soil, without creating macro-
Chapter Ⅰ. Literature review
15
pores among sand. Conversely, at high sand content, the shape of SWRC of mixture resembled
that of sand.
Ravina and Magier (1984) studied the water retention behavior of mixture of clay soil and
coarse grains. They found that an increase of coarse grain content gave rise to an increase of
mixture’s resistance to compaction. During the compaction of mixture, some macro-pores
among coarse grains was conserved. As a result, the volume of macro-pores increased with
increasing coarse grain content.
Fies et al. (2002) investigated the water retention property of mixture at varying glass fragments.
The increase of glass content led to a decrease of water content in the mixture. The macro-pores
could retain water when suction was lower than 10 kPa. The formation of these macro-pores
was determined by two mechanisms: incomplete filling between glass and fine soil, and
shrinkage of fine soil during drying.
Baetens et al. (2009) studied the effect of rock fragments on the water retention property of
stony soil. They found that increasing rock fragments significantly affected the water retention
property of mixture when matric sution was lower than 30 kPa, which was attributed to the
effect of rock fragment on pore size distribution of mixture.
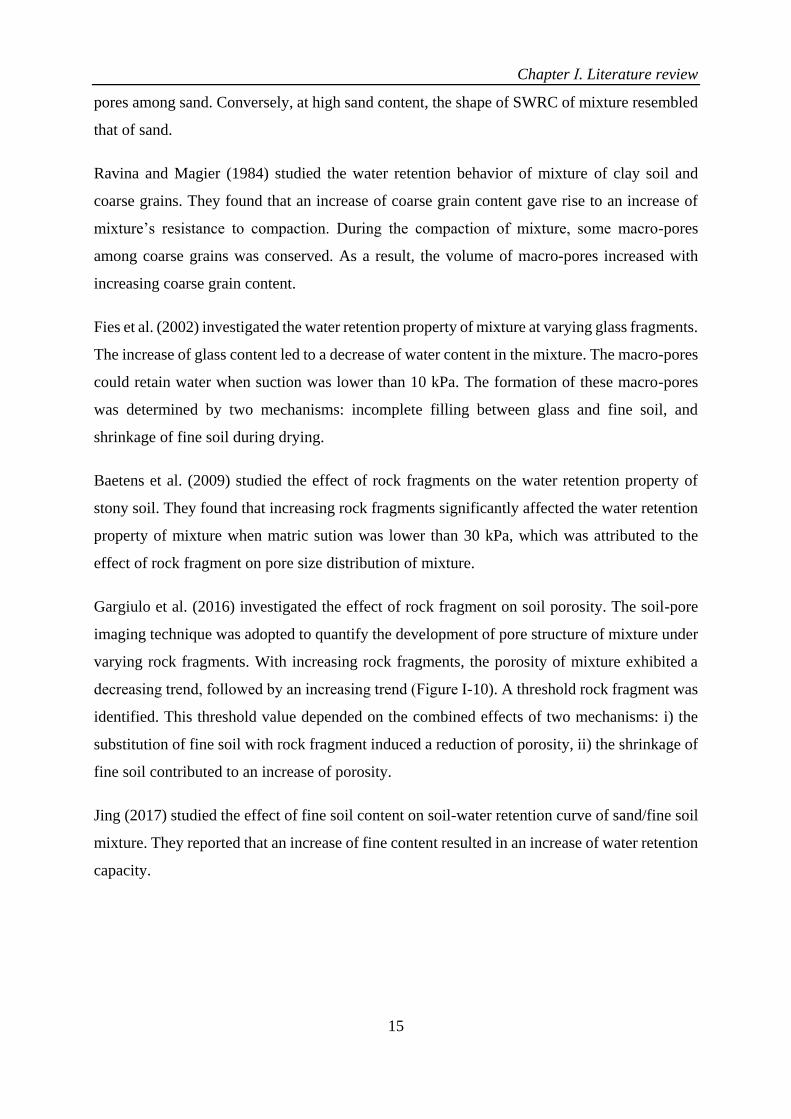
Gargiulo et al. (2016) investigated the effect of rock fragment on soil porosity. The soil-pore
imaging technique was adopted to quantify the development of pore structure of mixture under
varying rock fragments. With increasing rock fragments, the porosity of mixture exhibited a
decreasing trend, followed by an increasing trend (Figure Ⅰ-10). A threshold rock fragment was
identified. This threshold value depended on the combined effects of two mechanisms: i) the
substitution of fine soil with rock fragment induced a reduction of porosity, ii) the shrinkage of
fine soil contributed to an increase of porosity.
Jing (2017) studied the effect of fine soil content on soil-water retention curve of sand/fine soil
mixture. They reported that an increase of fine content resulted in an increase of water retention
capacity.
Chapter Ⅰ. Literature review
16
Figure Ⅰ-10. Variations of porosity of mixture with rock fragment content (Gargiulo et al.
2016)
I.4 Mechanical behavior of soil mixture
The mechanical behavior of soil mixture was presented in this section, including the static
behaviour and the dynamic behaviour.
I.4.1 Static behavior
The static behavior of soil mixture such as shear strength was affected by many factors, in
particular the coarse grain content and water content.
I.4.1.1 Effect of coarse grain content
Vallejo (2001) investigated the shear strength of binary granular mixture. Two glass beads at
different sizes (5 and 0.4 mm) were adopted as substitutes for coarse/fine grains. A coarse grain
supported structure was identified when the proportion of large glass beads was more than 70%;
a transition structure (including transitional coarse/fine grain supported structure) was found
when the proportion ranged from 40% to 70%; a fine grain supported structure was found when
the proportion was less than 40%. This was consistent with the findings of previous studies on
gravel/sand mixture shown in Table Ⅰ-3.
Chapter Ⅰ. Literature review
17
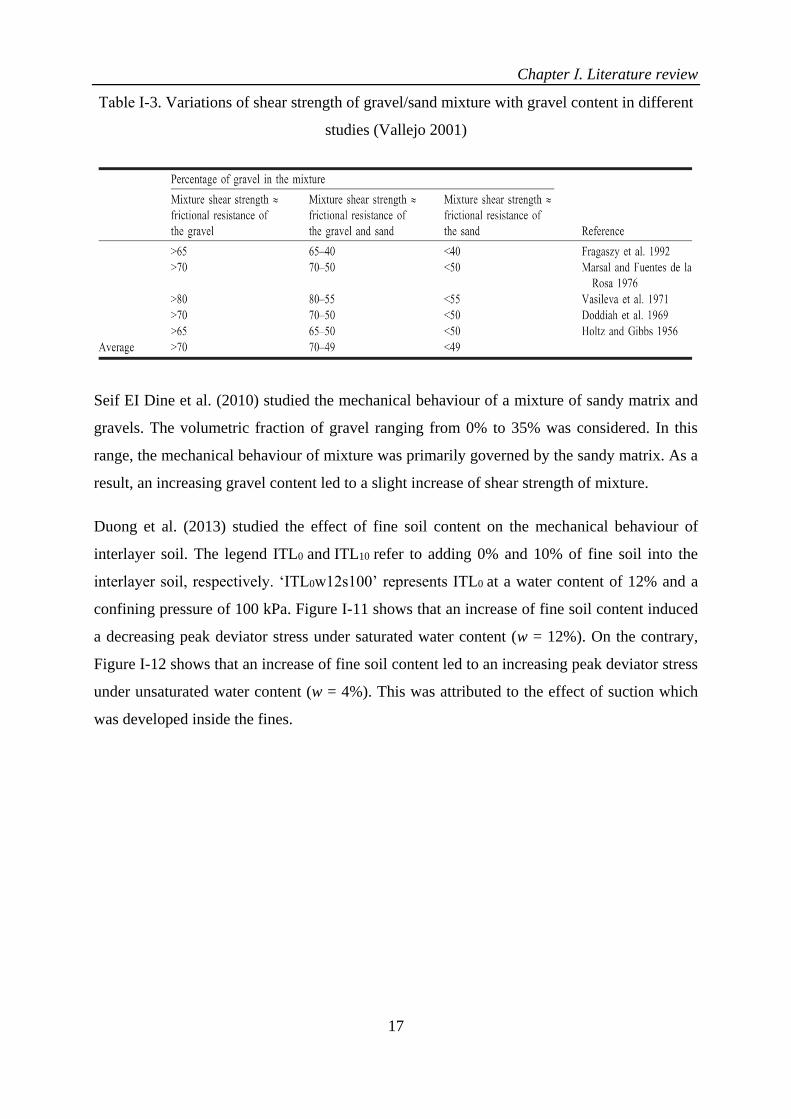
Table Ⅰ-3. Variations of shear strength of gravel/sand mixture with gravel content in different
studies (Vallejo 2001)
Seif EI Dine et al. (2010) studied the mechanical behaviour of a mixture of sandy matrix and
gravels. The volumetric fraction of gravel ranging from 0% to 35% was considered. In this
range, the mechanical behaviour of mixture was primarily governed by the sandy matrix. As a
result, an increasing gravel content led to a slight increase of shear strength of mixture.
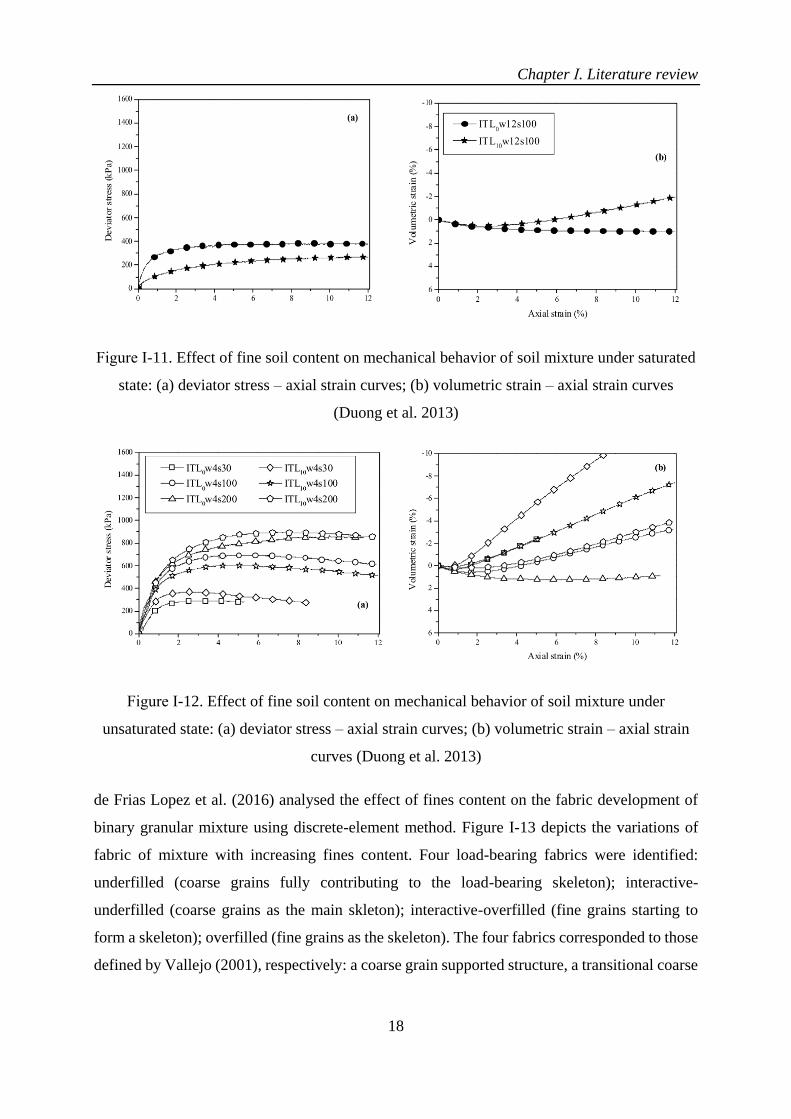
Duong et al. (2013) studied the effect of fine soil content on the mechanical behaviour of
interlayer soil. The legend ITL0 and ITL10 refer to adding 0% and 10% of fine soil into the
interlayer soil, respectively. ‘ITL0w12s100’ represents ITL0 at a water content of 12% and a
confining pressure of 100 kPa. Figure Ⅰ-11 shows that an increase of fine soil content induced
a decreasing peak deviator stress under saturated water content (w = 12%). On the contrary,
Figure Ⅰ-12 shows that an increase of fine soil content led to an increasing peak deviator stress
under unsaturated water content (w = 4%). This was attributed to the effect of suction which
was developed inside the fines.
Chapter Ⅰ. Literature review
18
Figure Ⅰ-11. Effect of fine soil content on mechanical behavior of soil mixture under saturated
state: (a) deviator stress – axial strain curves; (b) volumetric strain – axial strain curves
(Duong et al. 2013)
Figure Ⅰ-12. Effect of fine soil content on mechanical behavior of soil mixture under
unsaturated state: (a) deviator stress – axial strain curves; (b) volumetric strain – axial strain
curves (Duong et al. 2013)
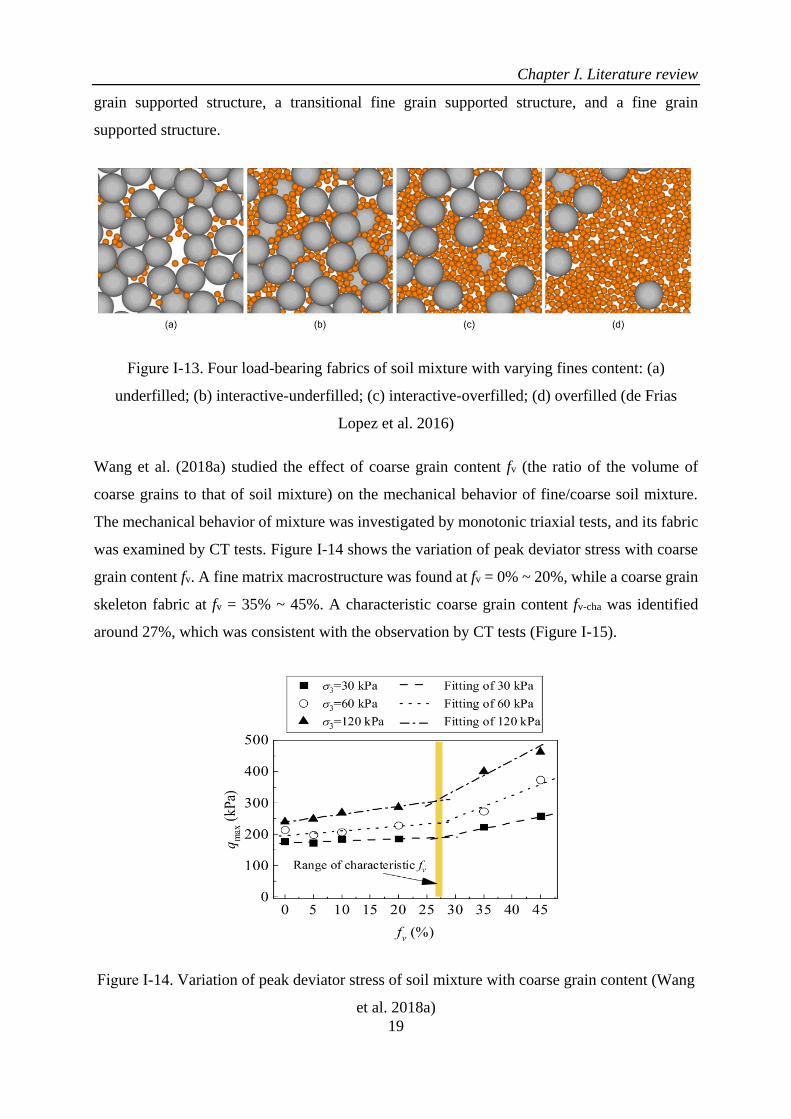
de Frias Lopez et al. (2016) analysed the effect of fines content on the fabric development of
binary granular mixture using discrete-element method. Figure Ⅰ-13 depicts the variations of
fabric of mixture with increasing fines content. Four load-bearing fabrics were identified:
underfilled (coarse grains fully contributing to the load-bearing skeleton); interactive-
underfilled (coarse grains as the main skleton); interactive-overfilled (fine grains starting to
form a skeleton); overfilled (fine grains as the skeleton). The four fabrics corresponded to those
defined by Vallejo (2001), respectively: a coarse grain supported structure, a transitional coarse
Chapter Ⅰ. Literature review
19
grain supported structure, a transitional fine grain supported structure, and a fine grain
supported structure.
Figure Ⅰ-13. Four load-bearing fabrics of soil mixture with varying fines content: (a)
underfilled; (b) interactive-underfilled; (c) interactive-overfilled; (d) overfilled (de Frias
Lopez et al. 2016)
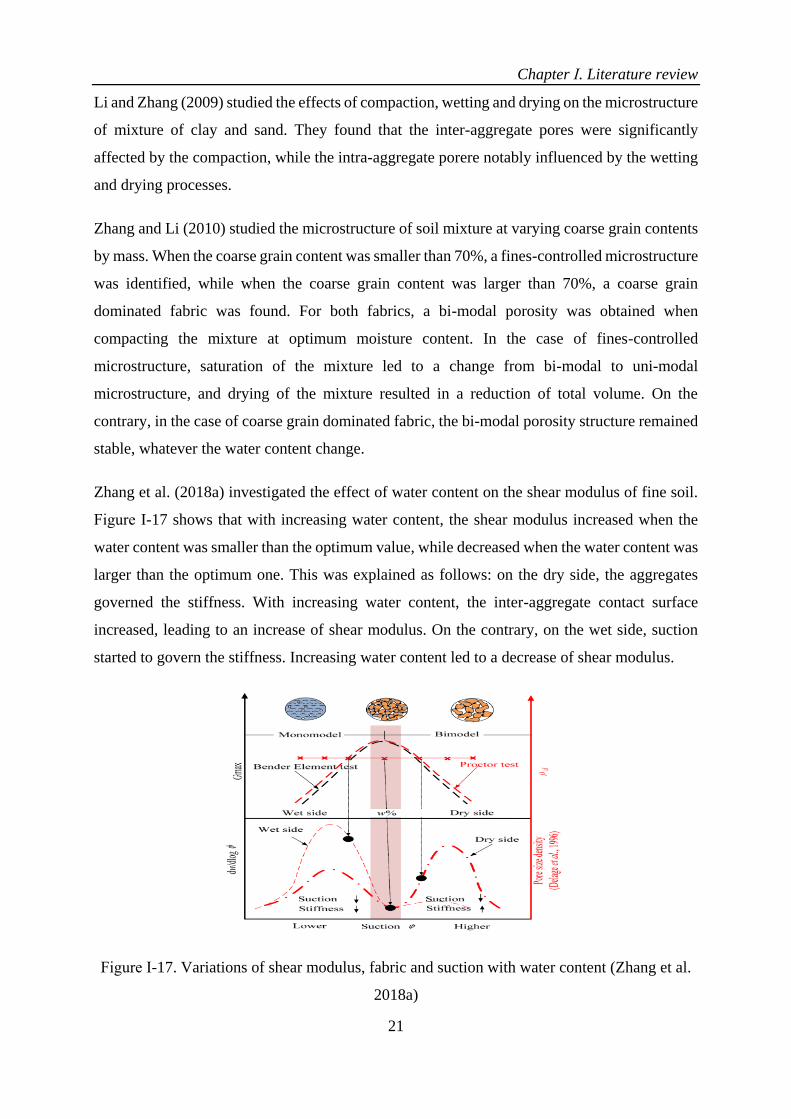
Wang et al. (2018a) studied the effect of coarse grain content fv (the ratio of the volume of
coarse grains to that of soil mixture) on the mechanical behavior of fine/coarse soil mixture.
The mechanical behavior of mixture was investigated by monotonic triaxial tests, and its fabric
was examined by CT tests. Figure Ⅰ-14 shows the variation of peak deviator stress with coarse
grain content fv. A fine matrix macrostructure was found at fv = 0% ~ 20%, while a coarse grain
skeleton fabric at fv = 35% ~ 45%. A characteristic coarse grain content fv-cha was identified
around 27%, which was consistent with the observation by CT tests (Figure Ⅰ-15).
Figure Ⅰ-14. Variation of peak deviator stress of soil mixture with coarse grain content (Wang
et al. 2018a)

Chapter Ⅰ. Literature review
20
Figure Ⅰ-15. 3D views of coarse grain distribution in compacted soil mixture (Wang et al.
2018a)
I.4.1.2 Effect of water content
Delage et al. (1996) investigated the effect of compaction water content on microstructure of
silt by scanning electron microscopy and mercury intrusion porosimetry tests. Figure Ⅰ-16
shows a bi-modal porosity microstructure of silt compacted on the dry side of optimum, while
a uni-modal porosity microstructure of silt on the wet side. This was attributed to a fine
aggregate structure of silt formed on the dry side, while a fine matrix structure on the wet side.
Figure Ⅰ-16. Pore size distributions of silt compacted at three different water contents: (a)
cumulative curves; (b) differential curves (Delage et al. 1996)
Chapter Ⅰ. Literature review
21
Li and Zhang (2009) studied the effects of compaction, wetting and drying on the microstructure
of mixture of clay and sand. They found that the inter-aggregate pores were significantly
affected by the compaction, while the intra-aggregate porere notably influenced by the wetting
and drying processes.
Zhang and Li (2010) studied the microstructure of soil mixture at varying coarse grain contents
by mass. When the coarse grain content was smaller than 70%, a fines-controlled microstructure
was identified, while when the coarse grain content was larger than 70%, a coarse grain
dominated fabric was found. For both fabrics, a bi-modal porosity was obtained when
compacting the mixture at optimum moisture content. In the case of fines-controlled
microstructure, saturation of the mixture led to a change from bi-modal to uni-modal
microstructure, and drying of the mixture resulted in a reduction of total volume. On the
contrary, in the case of coarse grain dominated fabric, the bi-modal porosity structure remained
stable, whatever the water content change.
Zhang et al. (2018a) investigated the effect of water content on the shear modulus of fine soil.
Figure Ⅰ-17 shows that with increasing water content, the shear modulus increased when the
water content was smaller than the optimum value, while decreased when the water content was
larger than the optimum one. This was explained as follows: on the dry side, the aggregates
governed the stiffness. With increasing water content, the inter-aggregate contact surface
increased, leading to an increase of shear modulus. On the contrary, on the wet side, suction
started to govern the stiffness. Increasing water content led to a decrease of shear modulus.
Figure Ⅰ-17. Variations of shear modulus, fabric and suction with water content (Zhang et al.
2018a)

Chapter Ⅰ. Literature review
22
Trinh et al. (2012) studied the effect of water content on the shear strength of fouled ballast.
They found that the lower the water content, the higher the shear strength.
Duong et al. (2013) investigated the effect of water content on the mechanical behavior of
interlayer soil. The legend ‘ITL10w4s30’ refers to the interlayer soil with addition of 10% of
fines at a water content of 4% and a confining pressure of 30 kPa. Figure Ⅰ-18 shows that a
decrease of water content gave rise to increases of shear strength and dilatancy angle. This was
attributed to the suction effect inside the fines.
Figure Ⅰ-18. Effect of water content on the mechanical behavior of interlayer soil: (a) deviator
stress – axial strain; (b) volumetric strain – axial strain (Duong et al. 2013)
I.4.2 Permanent deformation behavior
The permanent deformation of fine/coarse soil mixture was affected by many factors, such as
the loading cycles, stress level, stress history, coarse grain content, and water content (or
suction).
I.4.2.1 Effect of loading cycles
The number of loading cycles is one of the most important factor for the permanent strain of
soil mixture. The permanent strain can be determined by cyclic triaxial tests. AFNOR (2004)
recommends a test procedure to determine the evolution of permanent strain with loading cycles.
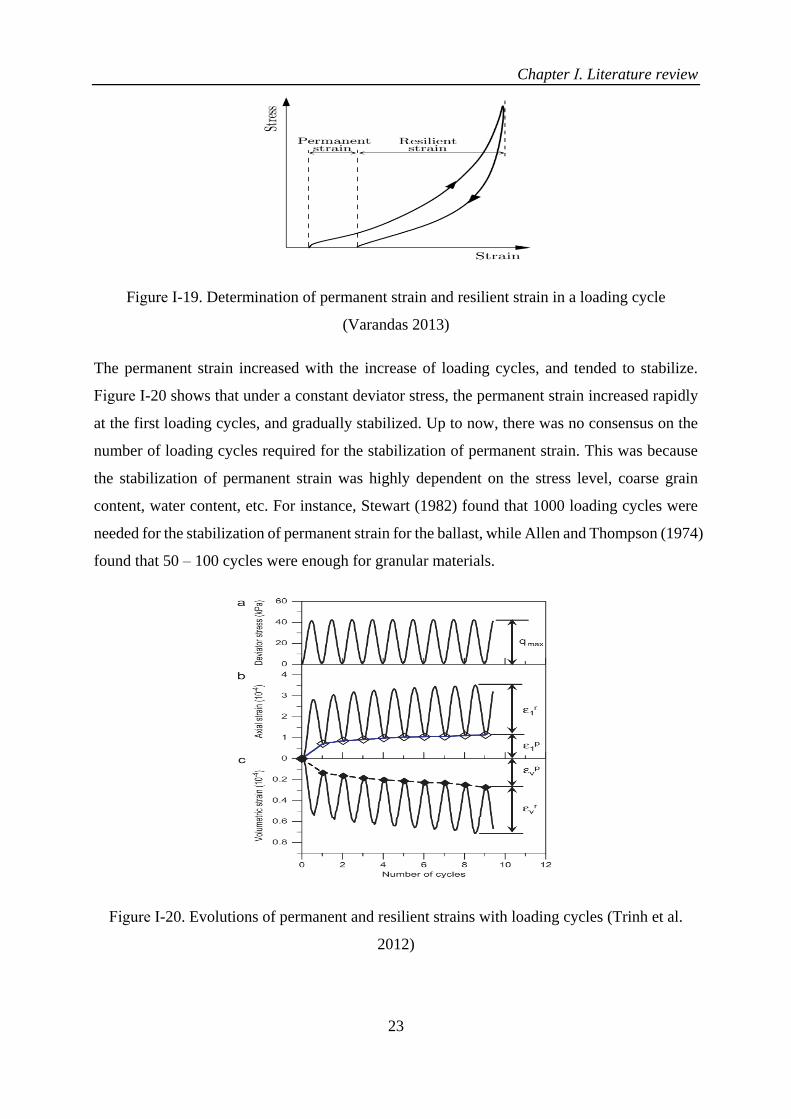
The loading cycles are performed under constant stress amplitudes. Figure Ⅰ-19 shows that
under a given loading cycle, the total strain can be separated into the resilient strain and the
permanent strain.
Chapter Ⅰ. Literature review
23
Figure Ⅰ-19. Determination of permanent strain and resilient strain in a loading cycle
(Varandas 2013)
The permanent strain increased with the increase of loading cycles, and tended to stabilize.
Figure Ⅰ-20 shows that under a constant deviator stress, the permanent strain increased rapidly
at the first loading cycles, and gradually stabilized. Up to now, there was no consensus on the
number of loading cycles required for the stabilization of permanent strain. This was because
the stabilization of permanent strain was highly dependent on the stress level, coarse grain
content, water content, etc. For instance, Stewart (1982) found that 1000 loading cycles were
needed for the stabilization of permanent strain for the ballast, while Allen and Thompson (1974)
found that 50 – 100 cycles were enough for granular materials.
Figure Ⅰ-20. Evolutions of permanent and resilient strains with loading cycles (Trinh et al.
2012)
Chapter Ⅰ. Literature review
24
I.4.2.2 Effect of stress level and stress history
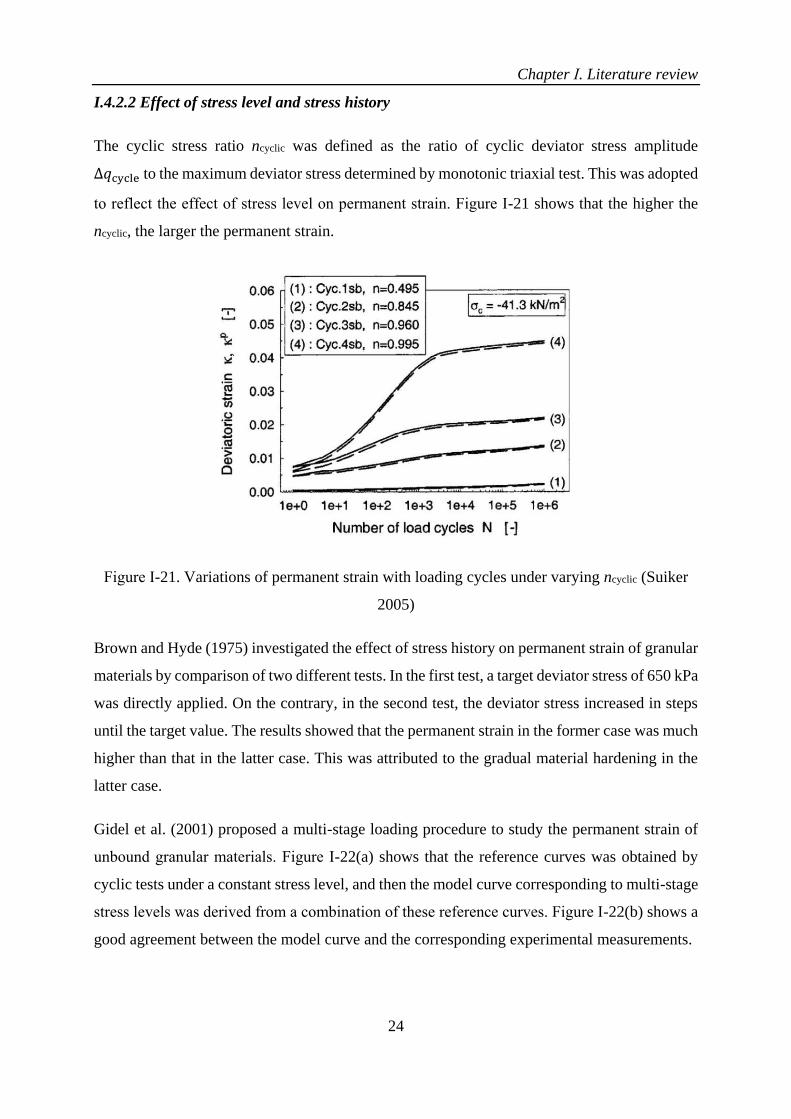
The cyclic stress ratio ncyclic was defined as the ratio of cyclic deviator stress amplitude
∆𝑞cycle to the maximum deviator stress determined by monotonic triaxial test. This was adopted
to reflect the effect of stress level on permanent strain. Figure Ⅰ-21 shows that the higher the
ncyclic, the larger the permanent strain.
Figure Ⅰ-21. Variations of permanent strain with loading cycles under varying ncyclic (Suiker
2005)
Brown and Hyde (1975) investigated the effect of stress history on permanent strain of granular
materials by comparison of two different tests. In the first test, a target deviator stress of 650 kPa
was directly applied. On the contrary, in the second test, the deviator stress increased in steps
until the target value. The results showed that the permanent strain in the former case was much
higher than that in the latter case. This was attributed to the gradual material hardening in the
latter case.
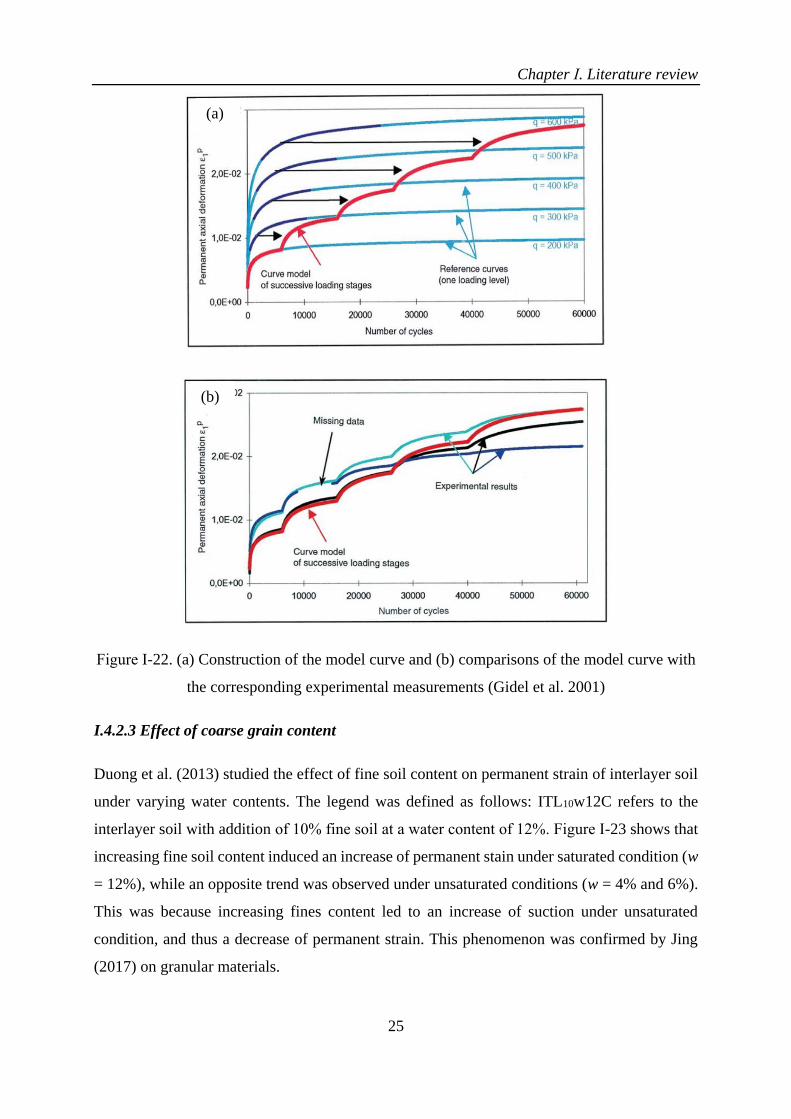
Gidel et al. (2001) proposed a multi-stage loading procedure to study the permanent strain of
unbound granular materials. Figure Ⅰ-22(a) shows that the reference curves was obtained by
cyclic tests under a constant stress level, and then the model curve corresponding to multi-stage
stress levels was derived from a combination of these reference curves. Figure Ⅰ-22(b) shows a
good agreement between the model curve and the corresponding experimental measurements.
Chapter Ⅰ. Literature review
25
Figure Ⅰ-22. (a) Construction of the model curve and (b) comparisons of the model curve with
the corresponding experimental measurements (Gidel et al. 2001)
I.4.2.3 Effect of coarse grain content
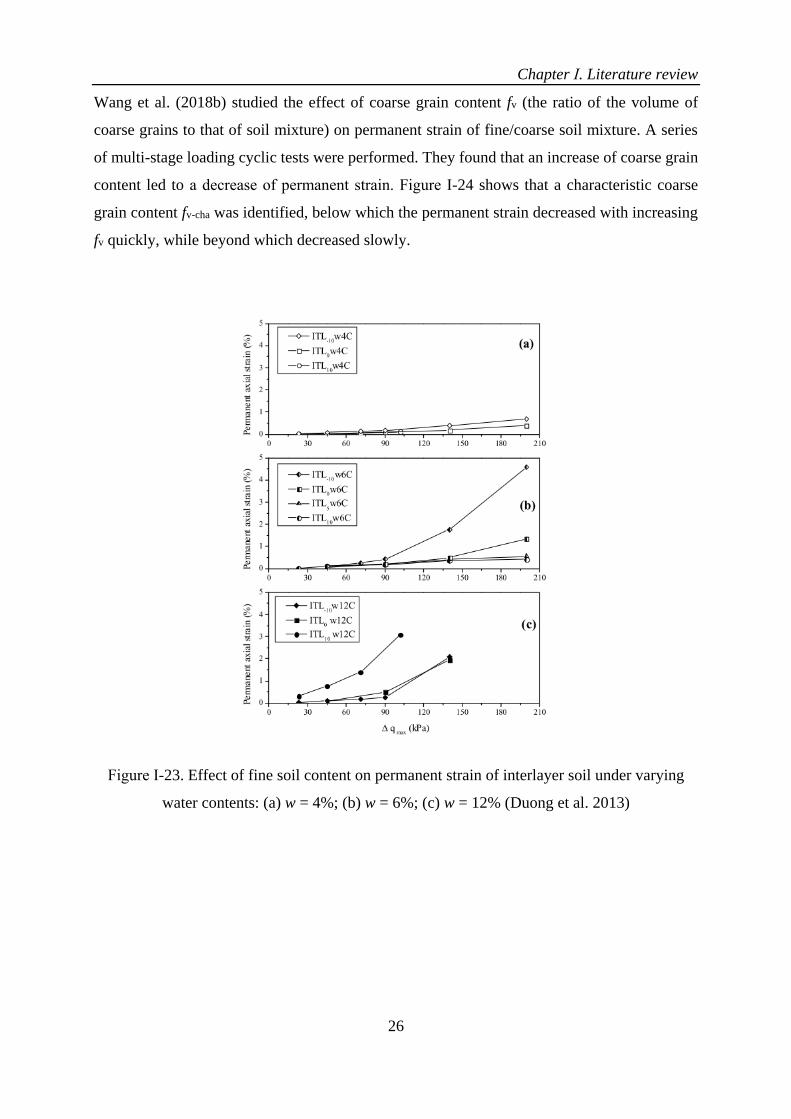
Duong et al. (2013) studied the effect of fine soil content on permanent strain of interlayer soil
under varying water contents. The legend was defined as follows: ITL10w12C refers to the
interlayer soil with addition of 10% fine soil at a water content of 12%. Figure Ⅰ-23 shows that
increasing fine soil content induced an increase of permanent stain under saturated condition (w
= 12%), while an opposite trend was observed under unsaturated conditions (w = 4% and 6%).
This was because increasing fines content led to an increase of suction under unsaturated
condition, and thus a decrease of permanent strain. This phenomenon was confirmed by Jing
(2017) on granular materials.
(a)
(b)
Chapter Ⅰ. Literature review
26
Wang et al. (2018b) studied the effect of coarse grain content fv (the ratio of the volume of
coarse grains to that of soil mixture) on permanent strain of fine/coarse soil mixture. A series
of multi-stage loading cyclic tests were performed. They found that an increase of coarse grain
content led to a decrease of permanent strain. Figure Ⅰ-24 shows that a characteristic coarse
grain content fv-cha was identified, below which the permanent strain decreased with increasing
fv quickly, while beyond which decreased slowly.
Figure Ⅰ-23. Effect of fine soil content on permanent strain of interlayer soil under varying
water contents: (a) w = 4%; (b) w = 6%; (c) w = 12% (Duong et al. 2013)
Chapter Ⅰ. Literature review
27
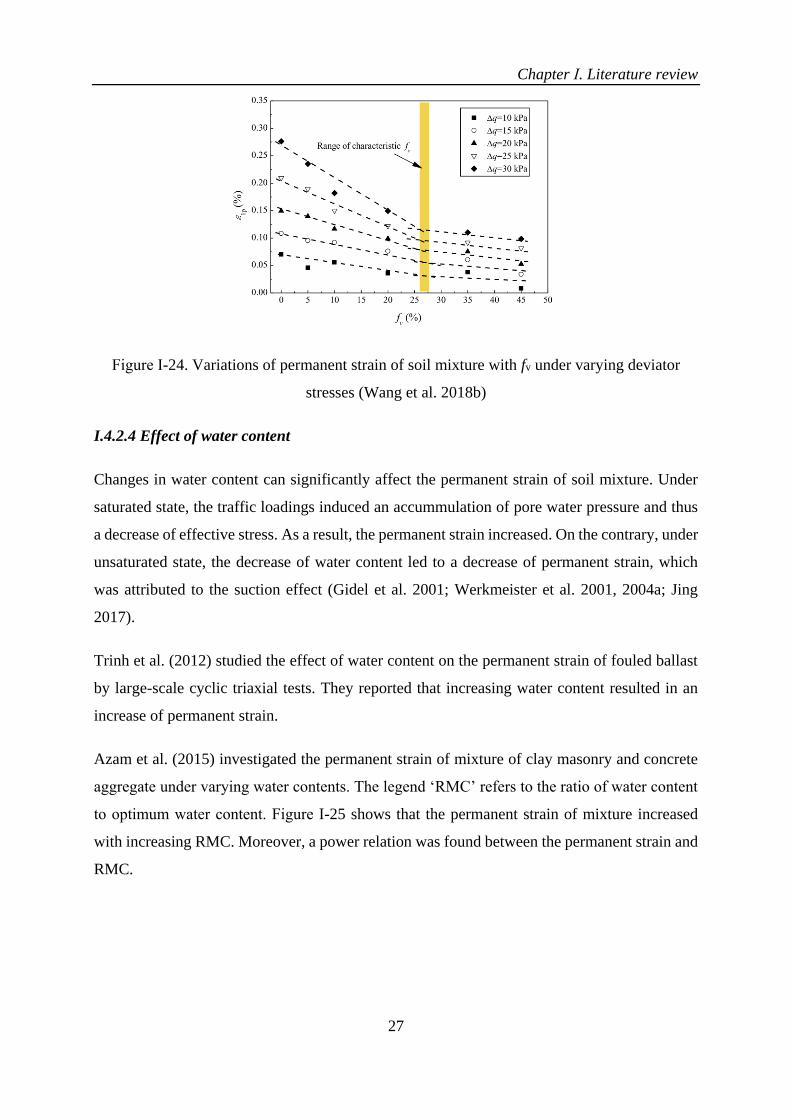
Figure Ⅰ-24. Variations of permanent strain of soil mixture with fv under varying deviator
stresses (Wang et al. 2018b)
I.4.2.4 Effect of water content
Changes in water content can significantly affect the permanent strain of soil mixture. Under
saturated state, the traffic loadings induced an accummulation of pore water pressure and thus
a decrease of effective stress. As a result, the permanent strain increased. On the contrary, under
unsaturated state, the decrease of water content led to a decrease of permanent strain, which
was attributed to the suction effect (Gidel et al. 2001; Werkmeister et al. 2001, 2004a; Jing
2017).
Trinh et al. (2012) studied the effect of water content on the permanent strain of fouled ballast
by large-scale cyclic triaxial tests. They reported that increasing water content resulted in an
increase of permanent strain.
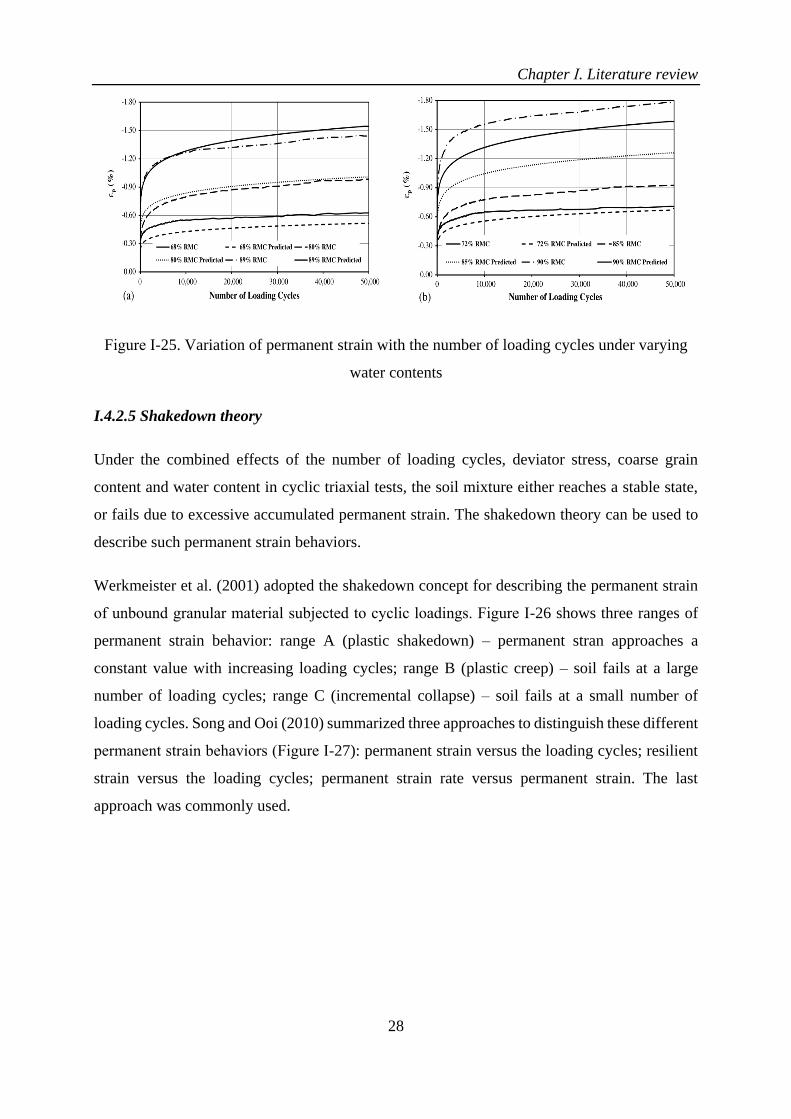
Azam et al. (2015) investigated the permanent strain of mixture of clay masonry and concrete
aggregate under varying water contents. The legend ‘RMC’ refers to the ratio of water content
to optimum water content. Figure Ⅰ-25 shows that the permanent strain of mixture increased
with increasing RMC. Moreover, a power relation was found between the permanent strain and
RMC.
Chapter Ⅰ. Literature review
28
Figure Ⅰ-25. Variation of permanent strain with the number of loading cycles under varying
water contents
I.4.2.5 Shakedown theory
Under the combined effects of the number of loading cycles, deviator stress, coarse grain
content and water content in cyclic triaxial tests, the soil mixture either reaches a stable state,
or fails due to excessive accumulated permanent strain. The shakedown theory can be used to
describe such permanent strain behaviors.
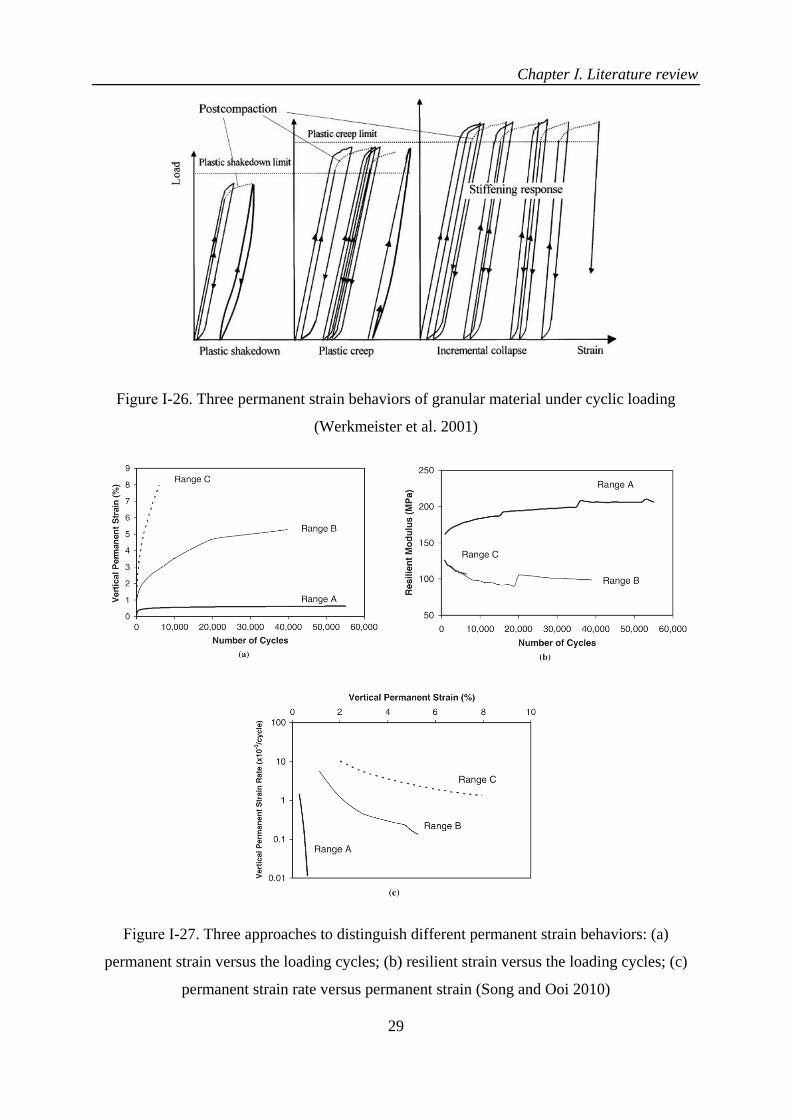
Werkmeister et al. (2001) adopted the shakedown concept for describing the permanent strain
of unbound granular material subjected to cyclic loadings. Figure Ⅰ-26 shows three ranges of
permanent strain behavior: range A (plastic shakedown) – permanent stran approaches a
constant value with increasing loading cycles; range B (plastic creep) – soil fails at a large
number of loading cycles; range C (incremental collapse) – soil fails at a small number of
loading cycles. Song and Ooi (2010) summarized three approaches to distinguish these different
permanent strain behaviors (Figure Ⅰ-27): permanent strain versus the loading cycles; resilient
strain versus the loading cycles; permanent strain rate versus permanent strain. The last
approach was commonly used.
Chapter Ⅰ. Literature review
29
Figure Ⅰ-26. Three permanent strain behaviors of granular material under cyclic loading
(Werkmeister et al. 2001)
Figure Ⅰ-27. Three approaches to distinguish different permanent strain behaviors: (a)
permanent strain versus the loading cycles; (b) resilient strain versus the loading cycles; (c)
permanent strain rate versus permanent strain (Song and Ooi 2010)
Chapter Ⅰ. Literature review
30
Yang and Huang (2007) investigated the effect of water content on the permanent strain
behavior of subgrade soil by cyclic tests. They found that the critical stress between range A
and B decreased with the increasing water content.
Tao et al. (2010) studied the permanent strain behavior of pavement base materials under cyclic
loading. Two responses of permanent strain were identified - stable and unstable. This was
found to be highly dependent on the loading levels and type of materials.
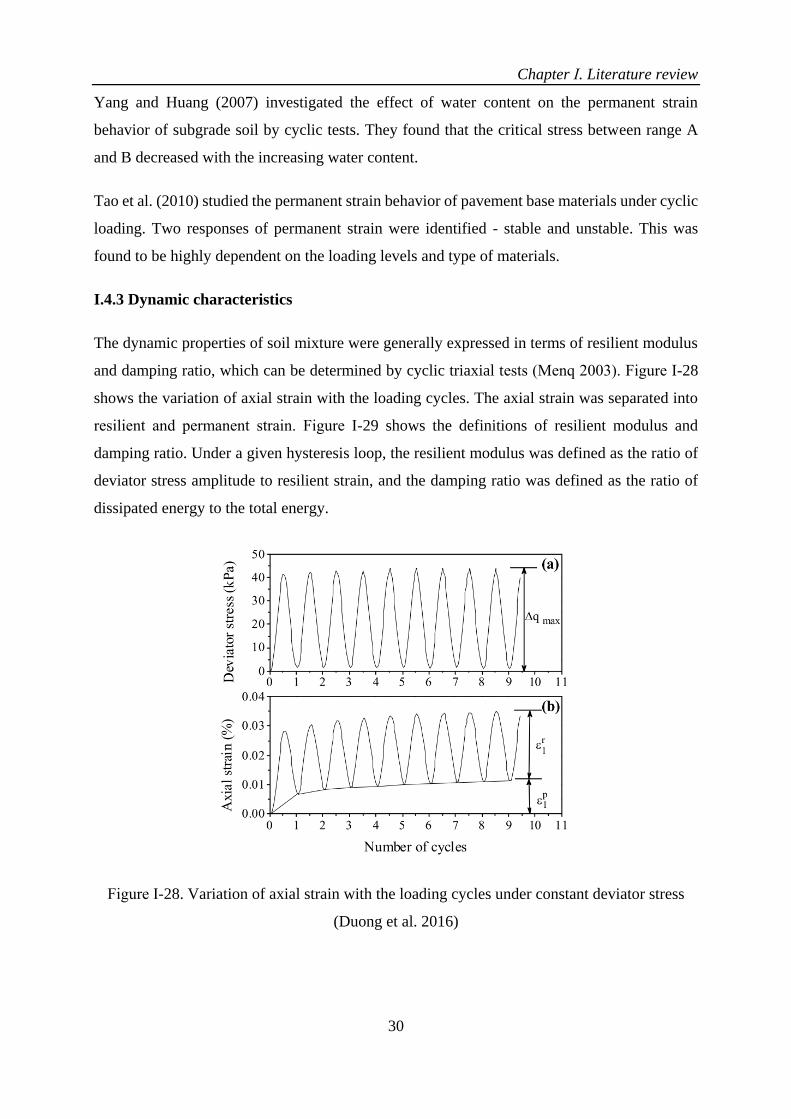
I.4.3 Dynamic characteristics
The dynamic properties of soil mixture were generally expressed in terms of resilient modulus
and damping ratio, which can be determined by cyclic triaxial tests (Menq 2003). Figure Ⅰ-28
shows the variation of axial strain with the loading cycles. The axial strain was separated into
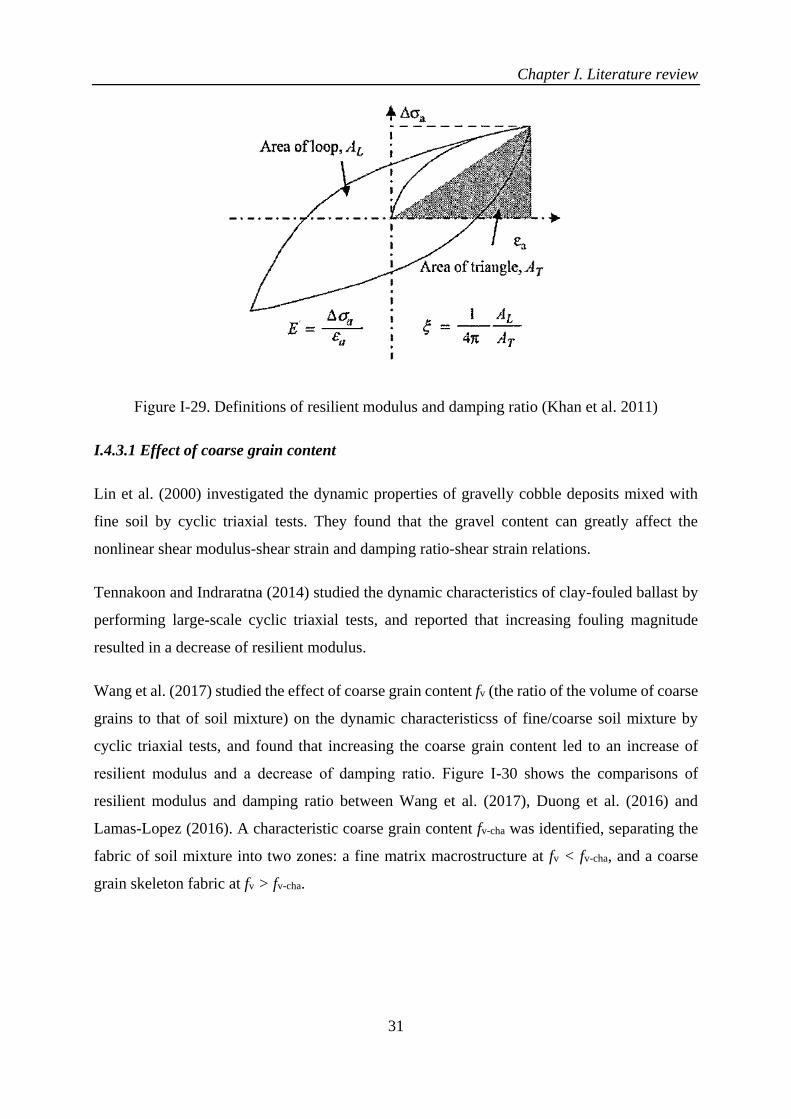
resilient and permanent strain. Figure Ⅰ-29 shows the definitions of resilient modulus and
damping ratio. Under a given hysteresis loop, the resilient modulus was defined as the ratio of
deviator stress amplitude to resilient strain, and the damping ratio was defined as the ratio of
dissipated energy to the total energy.
Figure Ⅰ-28. Variation of axial strain with the loading cycles under constant deviator stress
(Duong et al. 2016)
Chapter Ⅰ. Literature review
31
Figure Ⅰ-29. Definitions of resilient modulus and damping ratio (Khan et al. 2011)
I.4.3.1 Effect of coarse grain content
Lin et al. (2000) investigated the dynamic properties of gravelly cobble deposits mixed with
fine soil by cyclic triaxial tests. They found that the gravel content can greatly affect the
nonlinear shear modulus-shear strain and damping ratio-shear strain relations.
Tennakoon and Indraratna (2014) studied the dynamic characteristics of clay-fouled ballast by
performing large-scale cyclic triaxial tests, and reported that increasing fouling magnitude
resulted in a decrease of resilient modulus.
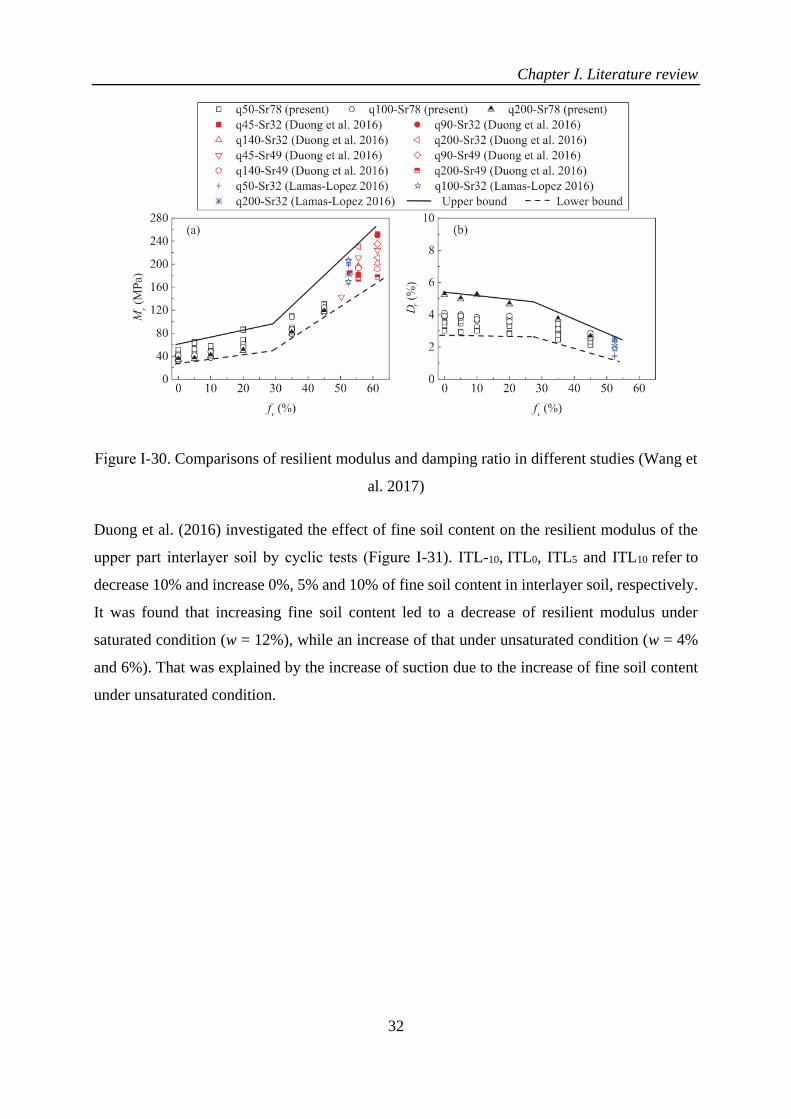
Wang et al. (2017) studied the effect of coarse grain content fv (the ratio of the volume of coarse
grains to that of soil mixture) on the dynamic characteristicss of fine/coarse soil mixture by
cyclic triaxial tests, and found that increasing the coarse grain content led to an increase of
resilient modulus and a decrease of damping ratio. Figure Ⅰ-30 shows the comparisons of
resilient modulus and damping ratio between Wang et al. (2017), Duong et al. (2016) and
Lamas-Lopez (2016). A characteristic coarse grain content fv-cha was identified, separating the
fabric of soil mixture into two zones: a fine matrix macrostructure at fv < fv-cha, and a coarse
grain skeleton fabric at fv > fv-cha.
Chapter Ⅰ. Literature review
32
Figure Ⅰ-30. Comparisons of resilient modulus and damping ratio in different studies (Wang et
al. 2017)
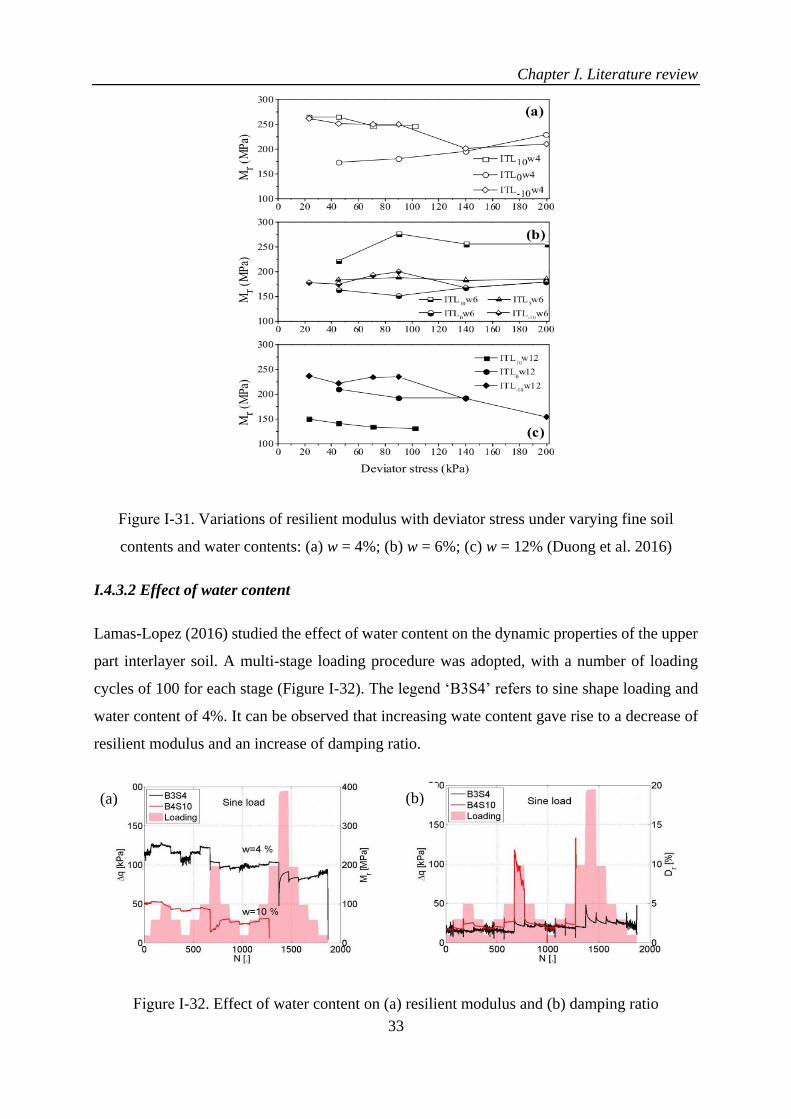
Duong et al. (2016) investigated the effect of fine soil content on the resilient modulus of the
upper part interlayer soil by cyclic tests (Figure Ⅰ-31). ITL-10, ITL0, ITL5 and ITL10 refer to
decrease 10% and increase 0%, 5% and 10% of fine soil content in interlayer soil, respectively.
It was found that increasing fine soil content led to a decrease of resilient modulus under
saturated condition (w = 12%), while an increase of that under unsaturated condition (w = 4%
and 6%). That was explained by the increase of suction due to the increase of fine soil content
under unsaturated condition.
Chapter Ⅰ. Literature review
33
Figure Ⅰ-31. Variations of resilient modulus with deviator stress under varying fine soil
contents and water contents: (a) w = 4%; (b) w = 6%; (c) w = 12% (Duong et al. 2016)
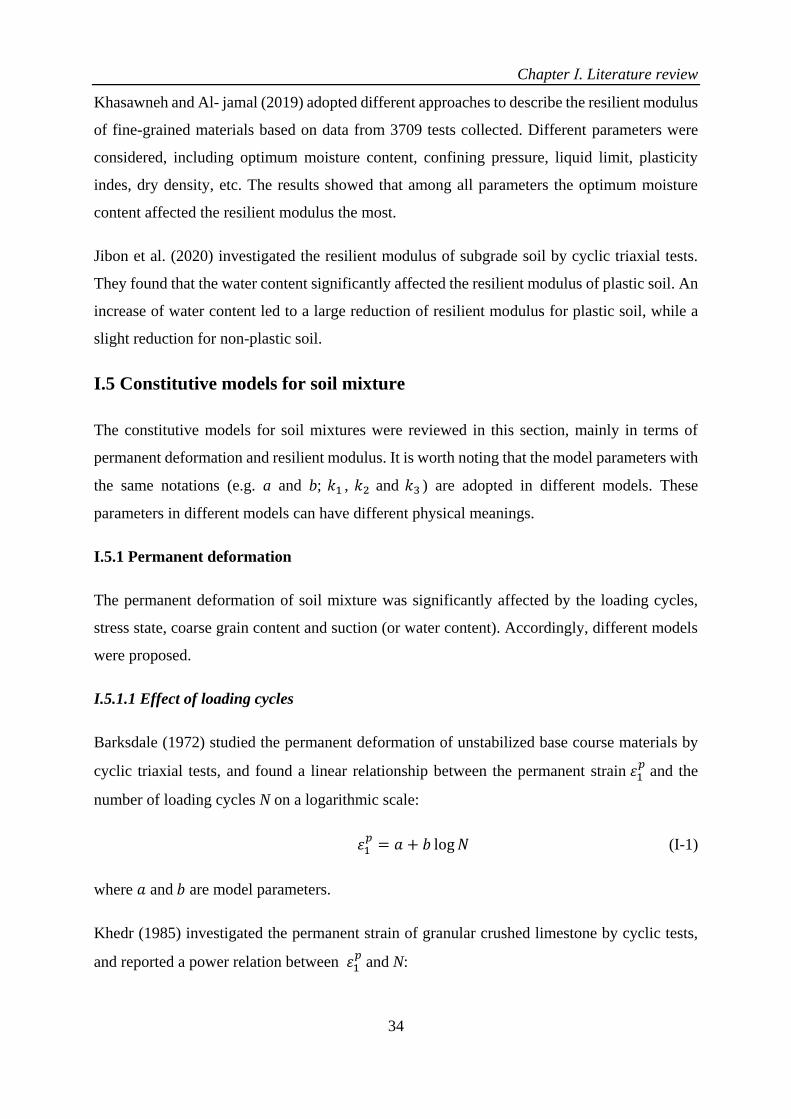
I.4.3.2 Effect of water content
Lamas-Lopez (2016) studied the effect of water content on the dynamic properties of the upper
part interlayer soil. A multi-stage loading procedure was adopted, with a number of loading
cycles of 100 for each stage (Figure Ⅰ-32). The legend ‘B3S4’ refers to sine shape loading and
water content of 4%. It can be observed that increasing wate content gave rise to a decrease of
resilient modulus and an increase of damping ratio.
Figure Ⅰ-32. Effect of water content on (a) resilient modulus and (b) damping ratio
(a) (b)
Chapter Ⅰ. Literature review
34
Khasawneh and Al- jamal (2019) adopted different approaches to describe the resilient modulus
of fine-grained materials based on data from 3709 tests collected. Different parameters were
considered, including optimum moisture content, confining pressure, liquid limit, plasticity
indes, dry density, etc. The results showed that among all parameters the optimum moisture
content affected the resilient modulus the most.
Jibon et al. (2020) investigated the resilient modulus of subgrade soil by cyclic triaxial tests.
They found that the water content significantly affected the resilient modulus of plastic soil. An
increase of water content led to a large reduction of resilient modulus for plastic soil, while a
slight reduction for non-plastic soil.
I.5 Constitutive models for soil mixture
The constitutive models for soil mixtures were reviewed in this section, mainly in terms of
permanent deformation and resilient modulus. It is worth noting that the model parameters with
the same notations (e.g. a and b; 𝑘1 , 𝑘2 and 𝑘3 ) are adopted in different models. These
parameters in different models can have different physical meanings.
I.5.1 Permanent deformation
The permanent deformation of soil mixture was significantly affected by the loading cycles,
stress state, coarse grain content and suction (or water content). Accordingly, different models
were proposed.
I.5.1.1 Effect of loading cycles
Barksdale (1972) studied the permanent deformation of unstabilized base course materials by
cyclic triaxial tests, and found a linear relationship between the permanent strain 휀1𝑝 and the
number of loading cycles N on a logarithmic scale:
휀1𝑝
= 𝑎 + 𝑏 log 𝑁 (Ⅰ-1)
where 𝑎 and 𝑏 are model parameters.
Khedr (1985) investigated the permanent strain of granular crushed limestone by cyclic tests,
and reported a power relation between 휀1𝑝
and N:
Chapter Ⅰ. Literature review
35
𝜀1
𝑝
𝑁= 𝑎𝑁−𝑏 (Ⅰ-2)
where 𝑎 and 𝑏 are model parameters.
Sweere (1990) proposed Eq. (Ⅰ-3) to describe the variation of 휀1𝑝 with N for unbound granular
materials:
휀1𝑝
= 𝑎𝑁𝑏 (Ⅰ-3)
where 𝑎 and 𝑏 are model parameters.
Hornych et al. (1993) proposed Eq. (Ⅰ-4) to describe the effect of N on 휀1𝑝
of unbound granular
materials, which has been adopted in French standard for cyclic triaxial tests (AFNOR 1995):
휀1𝑝
= 𝑓(𝑁) = 𝐴 ∙ [1 − (𝑁
100)−𝐵] (Ⅰ-4)
where 𝐴 and 𝐵 are model parameters; 𝐴 represents the maximum permanent strain when the
number of loading cycles approaches infinity; 𝐵 controls the evolution of permanent strain with
the increase of loading cycles.
Bonaquist and Witczak (1997) developed Eq. (Ⅰ-5) for granular materials, allowing the effect
of strain hardening to be accounted for:
휀1𝑝
= ∑1
𝑁ℎ 휀1 (Ⅰ-5)
where 휀1 is the permanent strain at the first loading cycle; h is the hardening parameter.
I.5.1.2 Effect of stress state
Lashine et al. (1971) found a linear relationship between the permanent strain and the ratio of
deviator stress 𝜎d to confining pressure 𝜎3:
휀1𝑝
= 𝑎𝜎d
𝜎3 (Ⅰ-6)
where 𝑎 is model parameter.
Barksdale (1972) proposed Eq. (Ⅰ-7) to describe the variation of 휀1𝑝
for base course materials,
with changes in the ratio of 𝜎d to 𝜎3, cohesion c and friction angle 𝜑:
Chapter Ⅰ. Literature review
36
휀1𝑝
=
𝜎d𝑎𝜎3
𝑛
1−[(𝑅f∙𝜎d)(1−sin 𝜑)
2(𝑐∙cos 𝜑+𝜎3 sin 𝜑)] (Ⅰ-7)
where 𝑎, 𝑛 and 𝑅f are model parameters.
Lekarp and Dawson (1998) proposed Eq. (Ⅰ-8) for describing 휀1𝑝
of unbound granular materials
under the combined effects of the ratio of deviator stress 𝜎d to mean stress p and the length of
stress path:
𝜀1
𝑝 (𝑁ref)
(𝐿/𝑝0)= 𝑎(
𝜎d
𝑝)max
𝑏 (Ⅰ-8)
where 휀1𝑝
(𝑁ref) is the accumulated permanent strain after a given number of loading cycles
𝑁ref; 𝐿 is the length of stress path, equal to (𝜎d2 + 𝑝2)1/2; 𝑝0 is the reference stress; 𝑎 and b are
model parameters.
Gidel et al. (2001) developed Eq. (Ⅰ-9) for unbound granular materials, allowing the effects of
N and stress state on 휀1𝑝
to be accounted for:
휀1𝑝
= 𝑓(𝑁) ∙ 𝑔(𝑝max, 𝜎d) (Ⅰ-9)
with
𝑓(𝑁) = 𝐴 ∙ [1 − (𝑁
100)−𝐵] (Ⅰ-10)
𝑔(𝑝max, 𝜎d) = 휀1𝑝1(
𝑙max
𝑝a)𝑛1
1
(𝑚1+𝑠1
𝑝max−
𝜎d𝑝max
) (Ⅰ-11)
where 𝑓(𝑁) is derived from Eq. (Ⅰ-4) (Hornych et al. 1993); 𝑙max = (𝜎d2 + 𝑝max
2 )1/2, 𝜎d and
𝑝max are maximum deviator stress and mean stress, respectively; 휀1𝑝1, 𝑛1, 𝑚1, 𝑠1, 𝐴 and B are
model parameters; 𝑝a is the atmospheric pressure.
Korkiala-Tanttu (2005) proposed Eq. (Ⅰ-12) for unbound materials, taking the effects of N and
deviator stress ratio R on 휀1𝑝
into account:
휀1𝑝
= 𝑐𝑁𝑏 𝑅
𝐴−𝑅 (Ⅰ-12)
Chapter Ⅰ. Literature review
37
where c and b are model parameters; 𝑅 is the deviator stress ratio, equal to 𝜎d/𝜎d−f, 𝜎d−f is the
deviator stress at failure; A is the theoretical maximum deviator stress ratio (A = Rmax = 1.0); A
= 1.02 – 1.05 was recommended to avoid numerical problems.
I.5.1.3 Effect of coarse grain content, water content and suction
Trinh et al. (2012) studied the effect of water content on 휀1𝑝
of interlayer soil by large-scale
cyclic triaxial tests, and developed Eq. (Ⅰ-13) allowing the description of 휀1𝑝
variation under the
combined effects of loading cycles N, deviator stress 𝜎d and water content:
휀1𝑝
= 𝑓(𝑁) ∙ 𝑡(𝑤, 𝜎d) (Ⅰ-13)
with
𝑓(𝑁) = 𝐴 ∙ [1 − (𝑁
100)−𝐵] (Ⅰ-14)
𝑡(𝑤, 𝜎d) = 휀1𝑝0 ∙ (𝑤 + 𝑎) ∙ (
𝜎d
𝑝a)
𝑏 (Ⅰ-15)
where 𝑓(𝑁) is derived from Eq. (Ⅰ-4) (Hornych et al. 1993); 휀1𝑝0 , 𝑎 and 𝑏 are model
parameters; 𝑝a is the atmospheric pressure.
Azam et al. (2015) investigated the effects of coarse grain content and suction on 휀1𝑝
of soil
mixture, and proposed Eq. (Ⅰ-16) to describe the variation of 휀1𝑝
with loading cycles N, coarse
grain content RCM (percent of coarse grain in mixture) and suction 𝜓:
휀1𝑝
= 𝑎𝑁𝑏 (𝜓+1
𝑝a)
𝑐(
DDR
1+wPI+RCM)𝑑 (Ⅰ-16)
where 𝑎, 𝑏, 𝑐 and 𝑑 are model parameters; wPI is the weighted plasticity index, equal to PI ×
(percent passing 200 sieve/100); PI is the plasticity index (%); 200 sieve refers to 0.075 mm;
DDR is the ratio of dry density to the maximum dry density corresponding to optimum moisture
content.
Chapter Ⅰ. Literature review
38
Jing et al. (2018) studied the effects of fine soil content and water content on 휀1𝑝
of sand, and
developed Eq. (Ⅰ-17) taking the effects of fines content fc (the ratio of the mass of fine soil to
that of mixture), deviator stress 𝜎d and water content on 휀1𝑝
into account:
휀1𝑝
= 𝑅[1 − (𝑁
100)
( 𝑘′
𝑤+𝑜′∗𝑓c)
] ∙g(𝑓c, 𝜎d, 𝑤) (Ⅰ-17)
with
g(𝑓c, 𝜎d, 𝑤)=[𝑎 ∙ (𝑤
𝑘)𝑜∙𝑓c
𝑢] ∙ [
𝑙max
𝑝a]
𝑛∙
1
𝑚+𝑠
𝑝max−
𝜎d𝑝max
(Ⅰ-18)
where R, 𝑘′, 𝑜′, 𝑎, 𝑘, 𝑜, 𝑢, 𝑛, 𝑚 and 𝑠 are model parameters; 𝑙max = (𝜎d2 + 𝑝max
2 )1/2, 𝜎d and
𝑝max are maximum deviator stress and mean stress, respectively.
Furthermore, the effects of fines content fc and water content on 휀1𝑝
in Eq. (Ⅰ-17) were
substituted by that of suction 𝜓 in Eq. (Ⅰ-19):
휀1𝑝
= 𝑇[1 − (𝑁
100)
𝑒∙ln (𝜓
𝜓a)+𝑓
] ∙ 𝑏 ∙ (𝜓
𝜓∗)𝑑
∙ (𝑙max
𝑝a)𝑛 ∙
1
𝑚+𝑠
𝑝max−
𝜎d𝑝max
(Ⅰ-19)
where 𝜓∗ is the suction value corresponding to the intersection point of wetting and drying
paths of SWRC; 𝜓a = 100 kPa; T, 𝑒, 𝑓, 𝑏, 𝑑, 𝑛, 𝑚 and 𝑠 are model parameters.
I.5.2 Resilient modulus
The resilient modulus is a fundamental parameter to describe the stiffness of soil mixture under
cyclic loading. The resilient modulus of soil mixture was highly dependent on stress state,
coarse grain content and suction (or water content). The constitutive models of resilient modulus
were developed by incorporating these factors.
I.5.2.1 Effect of stress state
Seed et al. (1967) studied the resilient modulus of subgrade soil, and described the resilient
modulus as a function of bulk stress:
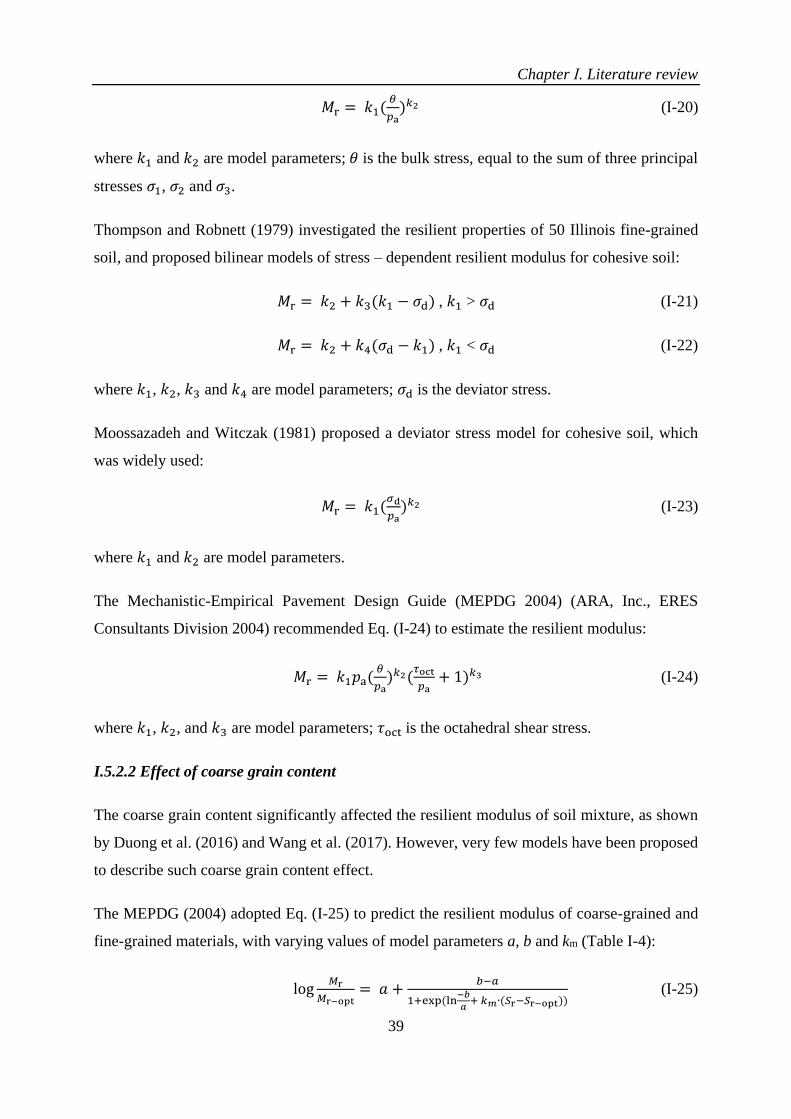
Chapter Ⅰ. Literature review
39
𝑀r = 𝑘1(𝜃
𝑝a)𝑘2 (Ⅰ-20)
where 𝑘1 and 𝑘2 are model parameters; 𝜃 is the bulk stress, equal to the sum of three principal
stresses 𝜎1, 𝜎2 and 𝜎3.
Thompson and Robnett (1979) investigated the resilient properties of 50 Illinois fine-grained
soil, and proposed bilinear models of stress – dependent resilient modulus for cohesive soil:
𝑀r = 𝑘2 + 𝑘3(𝑘1 − 𝜎d) , 𝑘1 > 𝜎d (Ⅰ-21)
𝑀r = 𝑘2 + 𝑘4(𝜎d − 𝑘1) , 𝑘1 < 𝜎d (Ⅰ-22)
where 𝑘1, 𝑘2, 𝑘3 and 𝑘4 are model parameters; 𝜎d is the deviator stress.
Moossazadeh and Witczak (1981) proposed a deviator stress model for cohesive soil, which
was widely used:
𝑀r = 𝑘1(𝜎d
𝑝a)𝑘2 (Ⅰ-23)
where 𝑘1 and 𝑘2 are model parameters.
The Mechanistic-Empirical Pavement Design Guide (MEPDG 2004) (ARA, Inc., ERES
Consultants Division 2004) recommended Eq. (Ⅰ-24) to estimate the resilient modulus:
𝑀r = 𝑘1𝑝a(𝜃
𝑝a)𝑘2(
𝜏oct
𝑝a+ 1)𝑘3 (Ⅰ-24)
where 𝑘1, 𝑘2, and 𝑘3 are model parameters; 𝜏oct is the octahedral shear stress.
I.5.2.2 Effect of coarse grain content
The coarse grain content significantly affected the resilient modulus of soil mixture, as shown
by Duong et al. (2016) and Wang et al. (2017). However, very few models have been proposed
to describe such coarse grain content effect.
The MEPDG (2004) adopted Eq. (Ⅰ-25) to predict the resilient modulus of coarse-grained and
fine-grained materials, with varying values of model parameters a, b and km (Table Ⅰ-4):
log𝑀r
𝑀r−opt= 𝑎 +
𝑏−𝑎
1+exp (ln−𝑏
𝑎+ 𝑘𝑚∙(𝑆r−𝑆r−opt))
(Ⅰ-25)

Chapter Ⅰ. Literature review
40
where 𝑀r/𝑀r−opt is the resilient modulus ratio; 𝑀r is the resilient modulus at a given degree of
saturation 𝑆r; 𝑀r−opt is the resilient modulus at a degree of saturation corresponding to the
optimum moisture content 𝑆r−opt; a, b and km are model parameters.
Table Ⅰ-4. Model parameters a, b and km for coarse-grained and fine-grained materials
(MEPDG 2004)
Parameter Coarse-grained materials Fine-grained materials
a -0.3123 -0.5934
b 0.3 0.4
km 6.8157 6.1324
I.5.2.3 Effect of suction
Empirical relationships between resilient modulus 𝑀r and matric suction 𝜓 were developed by
some investigators. Some of such models were summarized below.
Johnson et al. (1986) proposed an empirical model for sandy soil:
𝑀r = 1.35 × 106 × (101.36 − 𝜓)2.36(𝐽1)3.25(𝜌d)3.06 (Ⅰ-26)
where 𝐽1 is the first stress invariant; 𝜌d is the dry density.
Parreira and Gonçalves (2000) studied the effect of 𝜓 on 𝑀r for the lateritic soil from Brazil
under cyclic triaxial tests, and established a relationship between 𝑀r, deviator stress 𝜎d and 𝜓:
𝑀r = 14.10(𝜎d)0.782(𝜓)0.076 (Ⅰ-27)
Doucet and Doré (2004) proposed Eq. (Ⅰ-28) for crushed granular materials from Canada:
𝑀r = 1060𝜃 − 8700𝜓 + 5700 (Ⅰ-28)
Sawangsuriya et al. (2009) investigated the effect of 𝜓 on 𝑀r for four compacted subgrade soils,
and proposed Eqs. (Ⅰ-29) and (Ⅰ-30) by considering two reference 𝑀r values - 𝑀r−sat and 𝑀r−opt,
respectively:
𝑀r
𝑀r−sat= −5.61 + 4.54log (𝜓) (Ⅰ-29)
𝑀r
𝑀r−opt= −0.24 + 0.25log (𝜓) (Ⅰ-30)

Chapter Ⅰ. Literature review
41
where 𝑀r−sat and 𝑀r−opt are 𝑀r under saturated and optimum moisture content conditions,
respectively.
Ba et al. (2013) proposed Eq. (Ⅰ-31) to describe the variation of resilient modulus ratio
𝑀𝑟/𝑀r−opt with 𝜓 for four unbound granular materials:
𝑀r
𝑀r−opt= 0.385 + 0.267log (𝜓) (Ⅰ-31)
These empirical models were developed based on limited experimental results using regression
analysis, which were difficult to be generalized to other materials. The constitutive models
considering stress state above (e.g. Ⅰ-23 and Ⅰ-24) can be revised, by either incorporating the
suction into the stress state, or adding the suction as an independent term. Compared with
empirical models, these revised constitutive models were more generalizable.
Loach (1987) investigated the resilient response of three clays under varying deviator stresses
and suctions, and proprosed Eq. (Ⅰ-32):
𝑀r = 𝜎d
𝑘1(
𝑐𝜎c+𝜓
𝜎d)𝑘2 (Ⅰ-32)
where 𝑘1 and 𝑘2 are model parameters; c is the compressibility factor; 𝜎c is the confining stress.
Heath et al. (2004) proposed Eq. (Ⅰ-33) for granular base materials, allowing the combined
effects of 𝜓, stress state and pore air pressure to be accounted for:
𝑀r = 𝑘1𝑝a(𝜃
3−𝑢a+𝜒𝜓
𝑝a)𝑘2(
𝜎d
𝑝a)𝑘3 (Ⅰ-33)
where 𝑘1 , 𝑘2 and 𝑘3 are model parameters; 𝑢a is the pore air pressure; 𝜒 is the Bishop’s
effective stress parameter.
Yang et al. (2005) investigated the variation of resilient modulus with 𝜓 for compacted
subgrade soil, and incorporated 𝜓 into 𝜎d in Eq. (Ⅰ-34):
𝑀r = 𝑘1(𝜎d + 𝜒𝜓)𝑘2 (Ⅰ-34)
where 𝑘1 and 𝑘2 are model parameters.
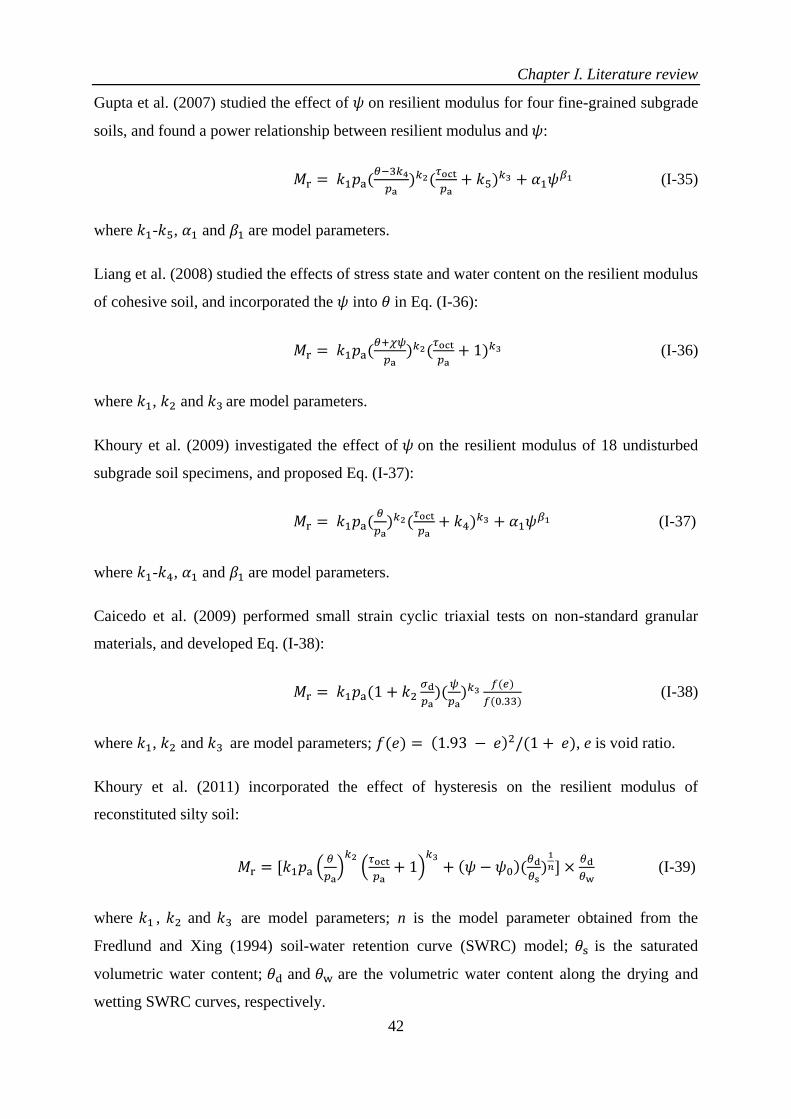
Chapter Ⅰ. Literature review
42
Gupta et al. (2007) studied the effect of 𝜓 on resilient modulus for four fine-grained subgrade
soils, and found a power relationship between resilient modulus and 𝜓:
𝑀r = 𝑘1𝑝a(𝜃−3𝑘4
𝑝a)𝑘2(
𝜏oct
𝑝a+ 𝑘5)𝑘3 + 𝛼1𝜓𝛽1 (Ⅰ-35)
where 𝑘1-𝑘5, 𝛼1 and 𝛽1 are model parameters.
Liang et al. (2008) studied the effects of stress state and water content on the resilient modulus
of cohesive soil, and incorporated the 𝜓 into 𝜃 in Eq. (Ⅰ-36):
𝑀r = 𝑘1𝑝a(𝜃+𝜒𝜓
𝑝a)𝑘2(
𝜏oct
𝑝a+ 1)𝑘3 (Ⅰ-36)
where 𝑘1, 𝑘2 and 𝑘3 are model parameters.
Khoury et al. (2009) investigated the effect of 𝜓 on the resilient modulus of 18 undisturbed
subgrade soil specimens, and proposed Eq. (Ⅰ-37):
𝑀r = 𝑘1𝑝a(𝜃
𝑝a)𝑘2(
𝜏oct
𝑝a+ 𝑘4)𝑘3 + 𝛼1𝜓𝛽1 (Ⅰ-37)
where 𝑘1-𝑘4, 𝛼1 and 𝛽1 are model parameters.
Caicedo et al. (2009) performed small strain cyclic triaxial tests on non-standard granular
materials, and developed Eq. (Ⅰ-38):
𝑀r = 𝑘1𝑝a(1 + 𝑘2𝜎d
𝑝a)(
𝜓
𝑝a)𝑘3
𝑓(𝑒)
𝑓(0.33) (Ⅰ-38)
where 𝑘1, 𝑘2 and 𝑘3 are model parameters; 𝑓(𝑒) = (1.93 − 𝑒)2/(1 + 𝑒), e is void ratio.
Khoury et al. (2011) incorporated the effect of hysteresis on the resilient modulus of
reconstituted silty soil:
𝑀r = [𝑘1𝑝a (𝜃
𝑝a)
𝑘2
(𝜏oct
𝑝a+ 1)
𝑘3
+ (𝜓 − 𝜓0)(𝜃d
𝜃s)
1
𝑛] ×𝜃d
𝜃w (Ⅰ-39)
where 𝑘1 , 𝑘2 and 𝑘3 are model parameters; n is the model parameter obtained from the
Fredlund and Xing (1994) soil-water retention curve (SWRC) model; 𝜃s is the saturated
volumetric water content; 𝜃d and 𝜃w are the volumetric water content along the drying and
wetting SWRC curves, respectively.

Chapter Ⅰ. Literature review
43
Cary and Zapata (2011) proposed Eq. (Ⅰ-40) for a granular soil and a clayey sand, by
incorporating the positive pore water pressure under saturated condition ∆𝑢w−sat and the matric
suction variation under unsaturated condition ∆𝜓:
𝑀r = 𝑘1𝑝a(𝜃net−3∆𝑢w−sat
𝑝a)𝑘2(
𝜏oct
𝑝a+ 1)𝑘3(
𝜓−∆𝜓
𝑝a+ 1)𝑘4 (Ⅰ-40)
where 𝑘1-𝑘4 are model parameters; 𝜃net is net bulk stress.
Oh et al. (2012) considered in-situ water content in Eq. (Ⅰ-41) for granular base and subgrade
soils:
𝑀r = 𝑘1𝑝a(𝜃+3𝑘4𝜓𝜃1
𝑝a)𝑘2(
𝜏oct
𝑝a+ 1)𝑘3 (Ⅰ-41)
where 𝑘1, 𝑘2, 𝑘3 and 𝑘4 are model parameters; 𝜃1 is the volumetric water content.
Ng et al. (2013) investigated the resilient modulus of subgrade soil under varying deviator
stresses and suctions by suction-controlled cyclic tests, and proposed Eq. (Ⅰ-42):
𝑀r = 𝑀0(𝑝
𝑝r)𝑘1(
𝜎d
𝑝r+ 1)𝑘2(
𝜓
𝑝+ 1)𝑘3 (Ⅰ-42)
where 𝑘1, 𝑘2 and 𝑘3 are model parameters; 𝑝 is the net mean stress; 𝑝r is the reference pressure;
𝑀0 is the 𝑀r value at reference stress state when 𝜓 = 0, 𝑝 = 𝑝r and 𝜎d = 𝑝r.
Han and Vanapalli (2015) proposed Eq. (Ⅰ-43) to predict the variation of resilient modulus with
suction for 11 different compacted subgrade soils. The soil-water retention curve was
incorporated.
𝑀r−𝑀r−sat
𝑀r−opt−𝑀r−sat=
𝜓
𝜓opt(
𝑆r
𝑆r−opt)𝜉 (Ⅰ-43)
where 𝑀r−sat is the resilient modulus under saturated condition; 𝑀r−opt and 𝜓opt are resilient
modulus and matric suction under optimum moisture content condition; 𝑆r is the degree of
saturation; 𝑆r−opt is the degree of saturation corresponding to the optimum moisture content; 𝜉
is model parameter.
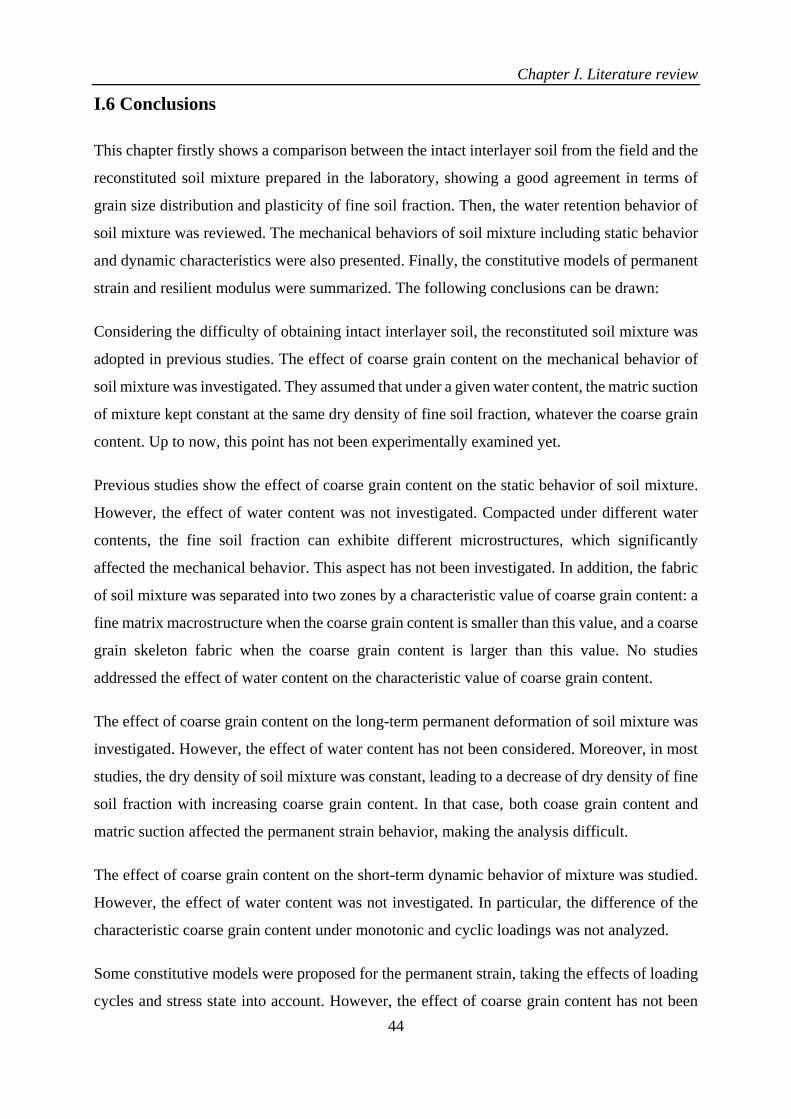
Chapter Ⅰ. Literature review
44
I.6 Conclusions
This chapter firstly shows a comparison between the intact interlayer soil from the field and the
reconstituted soil mixture prepared in the laboratory, showing a good agreement in terms of
grain size distribution and plasticity of fine soil fraction. Then, the water retention behavior of
soil mixture was reviewed. The mechanical behaviors of soil mixture including static behavior
and dynamic characteristics were also presented. Finally, the constitutive models of permanent
strain and resilient modulus were summarized. The following conclusions can be drawn:
Considering the difficulty of obtaining intact interlayer soil, the reconstituted soil mixture was
adopted in previous studies. The effect of coarse grain content on the mechanical behavior of
soil mixture was investigated. They assumed that under a given water content, the matric suction
of mixture kept constant at the same dry density of fine soil fraction, whatever the coarse grain
content. Up to now, this point has not been experimentally examined yet.
Previous studies show the effect of coarse grain content on the static behavior of soil mixture.
However, the effect of water content was not investigated. Compacted under different water
contents, the fine soil fraction can exhibite different microstructures, which significantly
affected the mechanical behavior. This aspect has not been investigated. In addition, the fabric
of soil mixture was separated into two zones by a characteristic value of coarse grain content: a
fine matrix macrostructure when the coarse grain content is smaller than this value, and a coarse
grain skeleton fabric when the coarse grain content is larger than this value. No studies
addressed the effect of water content on the characteristic value of coarse grain content.
The effect of coarse grain content on the long-term permanent deformation of soil mixture was
investigated. However, the effect of water content has not been considered. Moreover, in most
studies, the dry density of soil mixture was constant, leading to a decrease of dry density of fine
soil fraction with increasing coarse grain content. In that case, both coase grain content and
matric suction affected the permanent strain behavior, making the analysis difficult.
The effect of coarse grain content on the short-term dynamic behavior of mixture was studied.
However, the effect of water content was not investigated. In particular, the difference of the
characteristic coarse grain content under monotonic and cyclic loadings was not analyzed.
Some constitutive models were proposed for the permanent strain, taking the effects of loading
cycles and stress state into account. However, the effect of coarse grain content has not been

Chapter Ⅰ. Literature review
45
incorporated. Furthermore, no existing constitutive models have been developed to describe the
variation of permanent strain of soil mixture with changes in loading cycles, stress state, coarse
grain content and matric suction.
Some constitutive models were proposed for the resilient modulus, allowing the stress state and
matric suction to be taken into consideration. However, no existing constitutive models
described the coupled effects of stress state and matric suction. In addition, the effect of coarse
grain content on resilient modulus has not been incorporated.
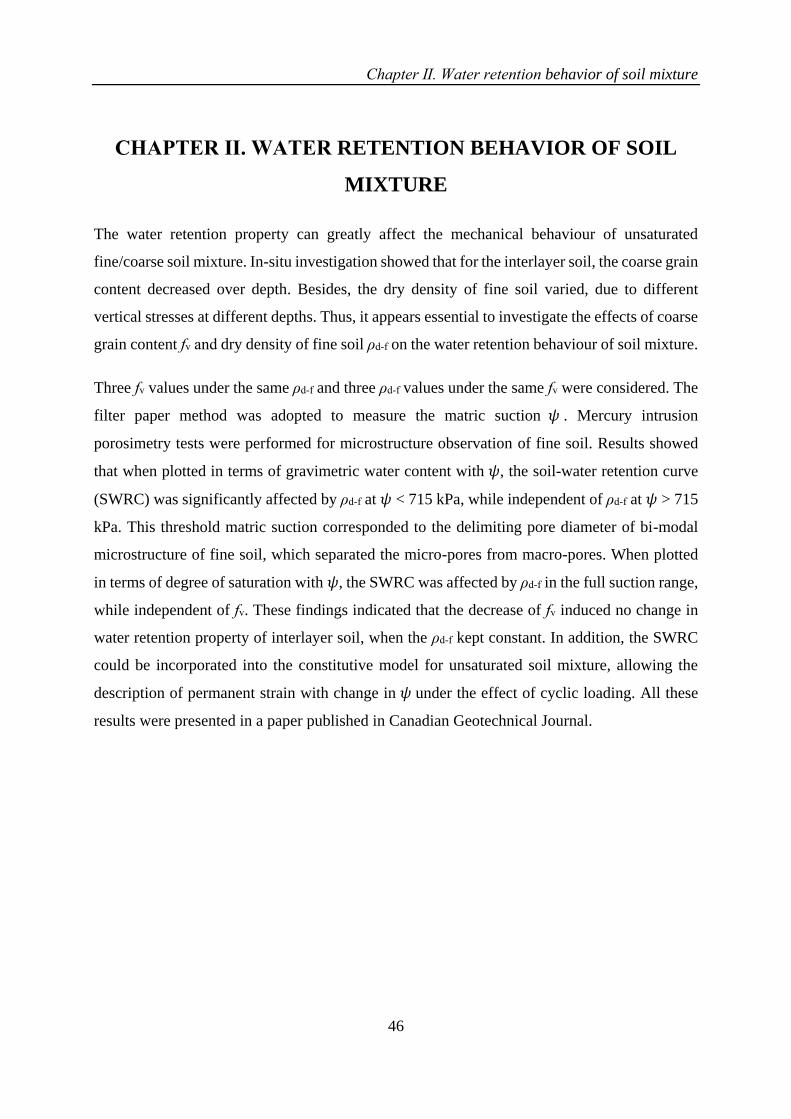
Chapter Ⅱ. Water retention behavior of soil mixture
46
CHAPTER Ⅱ. WATER RETENTION BEHAVIOR OF SOIL
MIXTURE
The water retention property can greatly affect the mechanical behaviour of unsaturated
fine/coarse soil mixture. In-situ investigation showed that for the interlayer soil, the coarse grain
content decreased over depth. Besides, the dry density of fine soil varied, due to different
vertical stresses at different depths. Thus, it appears essential to investigate the effects of coarse
grain content fv and dry density of fine soil ρd-f on the water retention behaviour of soil mixture.
Three fv values under the same ρd-f and three ρd-f values under the same fv were considered. The
filter paper method was adopted to measure the matric suction 𝜓 . Mercury intrusion
porosimetry tests were performed for microstructure observation of fine soil. Results showed
that when plotted in terms of gravimetric water content with 𝜓, the soil-water retention curve
(SWRC) was significantly affected by ρd-f at 𝜓 < 715 kPa, while independent of ρd-f at 𝜓 > 715
kPa. This threshold matric suction corresponded to the delimiting pore diameter of bi-modal
microstructure of fine soil, which separated the micro-pores from macro-pores. When plotted
in terms of degree of saturation with 𝜓, the SWRC was affected by ρd-f in the full suction range,
while independent of fv. These findings indicated that the decrease of fv induced no change in
water retention property of interlayer soil, when the ρd-f kept constant. In addition, the SWRC
could be incorporated into the constitutive model for unsaturated soil mixture, allowing the
description of permanent strain with change in 𝜓 under the effect of cyclic loading. All these
results were presented in a paper published in Canadian Geotechnical Journal.
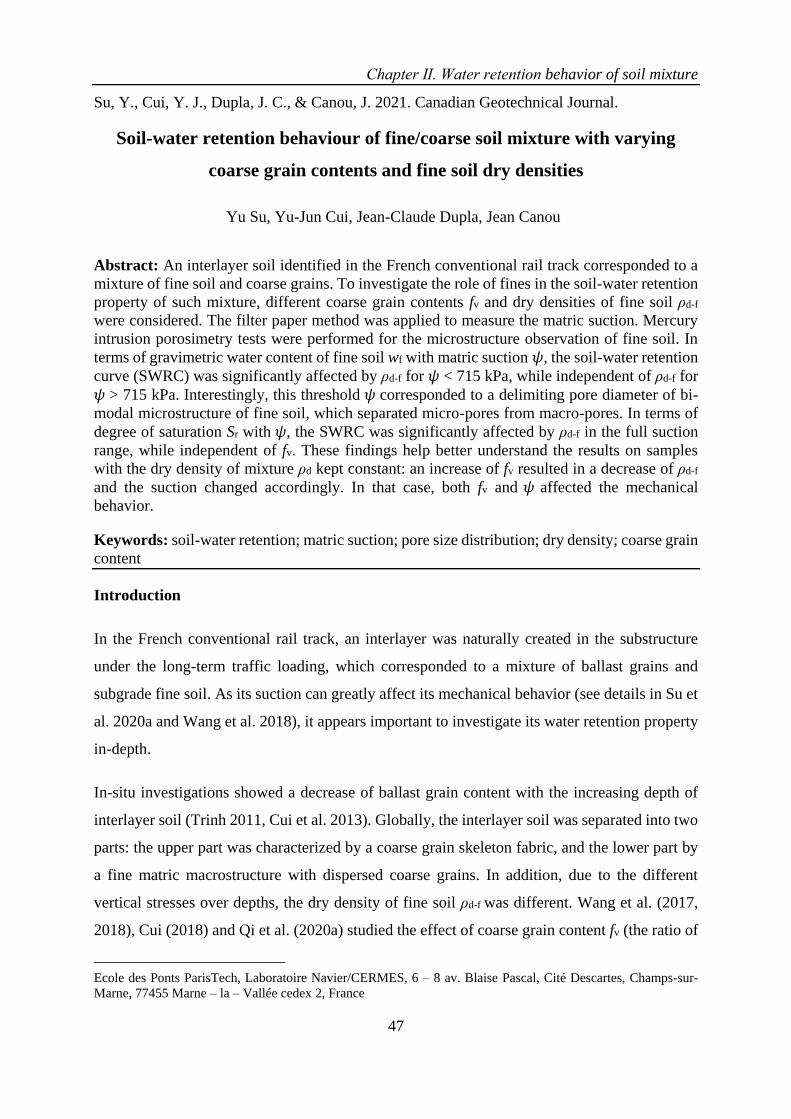
Chapter Ⅱ. Water retention behavior of soil mixture
47
Su, Y., Cui, Y. J., Dupla, J. C., & Canou, J. 2021. Canadian Geotechnical Journal.
Soil-water retention behaviour of fine/coarse soil mixture with varying
coarse grain contents and fine soil dry densities
Yu Su, Yu-Jun Cui, Jean-Claude Dupla, Jean Canou1
Abstract: An interlayer soil identified in the French conventional rail track corresponded to a
mixture of fine soil and coarse grains. To investigate the role of fines in the soil-water retention
property of such mixture, different coarse grain contents fv and dry densities of fine soil ρd-f
were considered. The filter paper method was applied to measure the matric suction. Mercury
intrusion porosimetry tests were performed for the microstructure observation of fine soil. In
terms of gravimetric water content of fine soil wf with matric suction 𝜓, the soil-water retention
curve (SWRC) was significantly affected by ρd-f for 𝜓 < 715 kPa, while independent of ρd-f for
𝜓 > 715 kPa. Interestingly, this threshold 𝜓 corresponded to a delimiting pore diameter of bi-
modal microstructure of fine soil, which separated micro-pores from macro-pores. In terms of
degree of saturation Sr with 𝜓, the SWRC was significantly affected by ρd-f in the full suction
range, while independent of fv. These findings help better understand the results on samples
with the dry density of mixture ρd kept constant: an increase of fv resulted in a decrease of ρd-f
and the suction changed accordingly. In that case, both fv and 𝜓 affected the mechanical
behavior.
Keywords: soil-water retention; matric suction; pore size distribution; dry density; coarse grain
content
Introduction
In the French conventional rail track, an interlayer was naturally created in the substructure
under the long-term traffic loading, which corresponded to a mixture of ballast grains and
subgrade fine soil. As its suction can greatly affect its mechanical behavior (see details in Su et
al. 2020a and Wang et al. 2018), it appears important to investigate its water retention property
in-depth.
In-situ investigations showed a decrease of ballast grain content with the increasing depth of
interlayer soil (Trinh 2011, Cui et al. 2013). Globally, the interlayer soil was separated into two
parts: the upper part was characterized by a coarse grain skeleton fabric, and the lower part by
a fine matric macrostructure with dispersed coarse grains. In addition, due to the different
vertical stresses over depths, the dry density of fine soil ρd-f was different. Wang et al. (2017,
2018), Cui (2018) and Qi et al. (2020a) studied the effect of coarse grain content fv (the ratio of
Ecole des Ponts ParisTech, Laboratoire Navier/CERMES, 6 – 8 av. Blaise Pascal, Cité Descartes, Champs-sur-
Marne, 77455 Marne – la – Vallée cedex 2, France
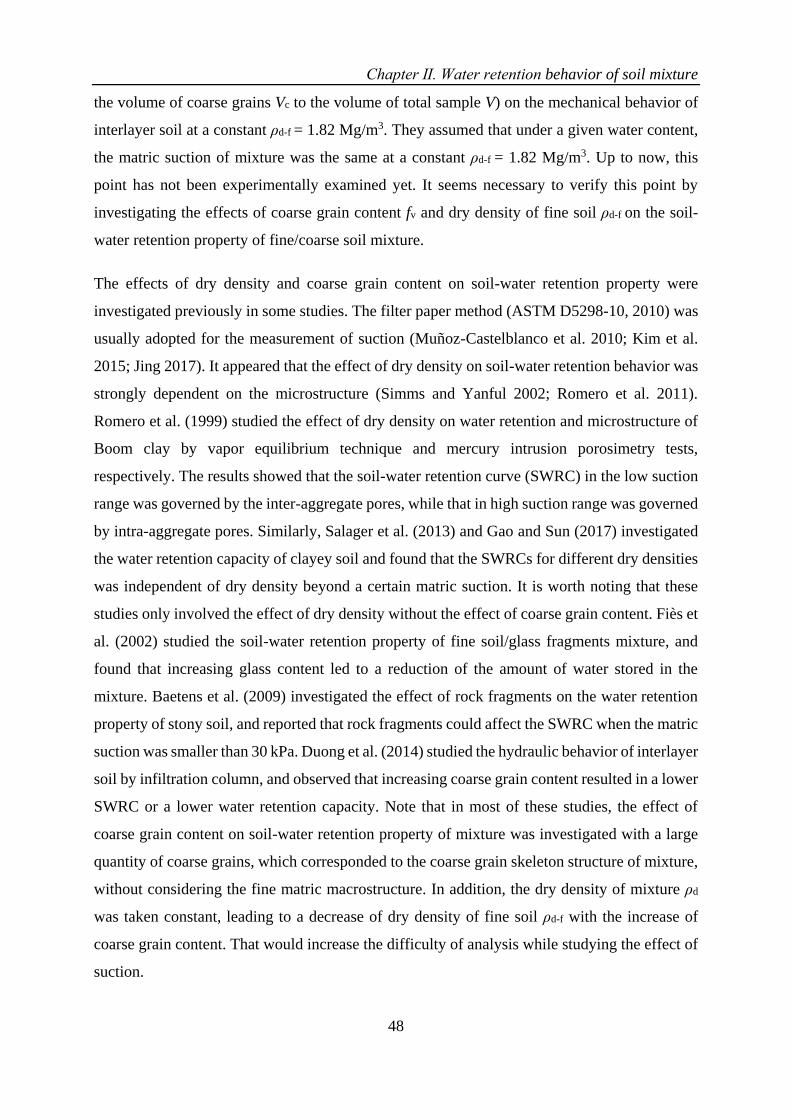
Chapter Ⅱ. Water retention behavior of soil mixture
48
the volume of coarse grains Vc to the volume of total sample V) on the mechanical behavior of
interlayer soil at a constant ρd-f = 1.82 Mg/m3. They assumed that under a given water content,
the matric suction of mixture was the same at a constant ρd-f = 1.82 Mg/m3. Up to now, this
point has not been experimentally examined yet. It seems necessary to verify this point by
investigating the effects of coarse grain content fv and dry density of fine soil ρd-f on the soil-
water retention property of fine/coarse soil mixture.
The effects of dry density and coarse grain content on soil-water retention property were
investigated previously in some studies. The filter paper method (ASTM D5298-10, 2010) was
usually adopted for the measurement of suction (Muñoz-Castelblanco et al. 2010; Kim et al.
2015; Jing 2017). It appeared that the effect of dry density on soil-water retention behavior was
strongly dependent on the microstructure (Simms and Yanful 2002; Romero et al. 2011).
Romero et al. (1999) studied the effect of dry density on water retention and microstructure of
Boom clay by vapor equilibrium technique and mercury intrusion porosimetry tests,
respectively. The results showed that the soil-water retention curve (SWRC) in the low suction
range was governed by the inter-aggregate pores, while that in high suction range was governed
by intra-aggregate pores. Similarly, Salager et al. (2013) and Gao and Sun (2017) investigated
the water retention capacity of clayey soil and found that the SWRCs for different dry densities
was independent of dry density beyond a certain matric suction. It is worth noting that these
studies only involved the effect of dry density without the effect of coarse grain content. Fiès et
al. (2002) studied the soil-water retention property of fine soil/glass fragments mixture, and
found that increasing glass content led to a reduction of the amount of water stored in the
mixture. Baetens et al. (2009) investigated the effect of rock fragments on the water retention
property of stony soil, and reported that rock fragments could affect the SWRC when the matric
suction was smaller than 30 kPa. Duong et al. (2014) studied the hydraulic behavior of interlayer
soil by infiltration column, and observed that increasing coarse grain content resulted in a lower
SWRC or a lower water retention capacity. Note that in most of these studies, the effect of
coarse grain content on soil-water retention property of mixture was investigated with a large
quantity of coarse grains, which corresponded to the coarse grain skeleton structure of mixture,
without considering the fine matric macrostructure. In addition, the dry density of mixture ρd
was taken constant, leading to a decrease of dry density of fine soil ρd-f with the increase of
coarse grain content. That would increase the difficulty of analysis while studying the effect of
suction.
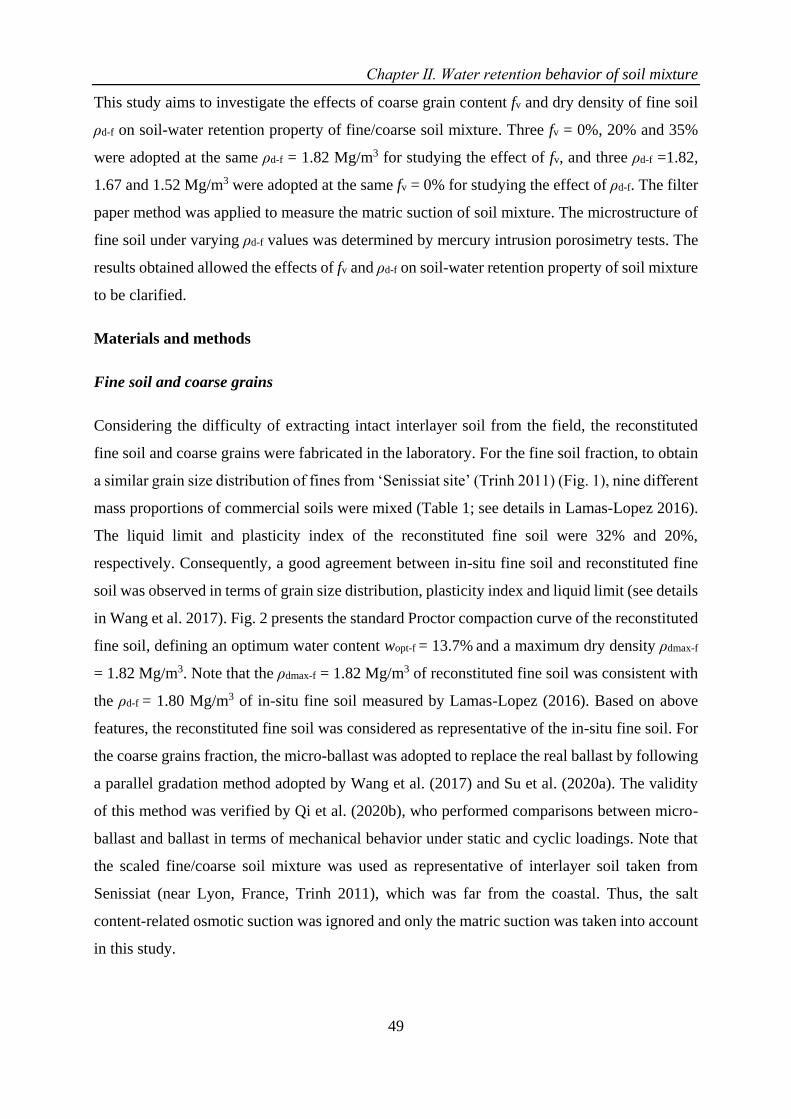
Chapter Ⅱ. Water retention behavior of soil mixture
49
This study aims to investigate the effects of coarse grain content fv and dry density of fine soil
ρd-f on soil-water retention property of fine/coarse soil mixture. Three fv = 0%, 20% and 35%
were adopted at the same ρd-f = 1.82 Mg/m3 for studying the effect of fv, and three ρd-f =1.82,
1.67 and 1.52 Mg/m3 were adopted at the same fv = 0% for studying the effect of ρd-f. The filter
paper method was applied to measure the matric suction of soil mixture. The microstructure of
fine soil under varying ρd-f values was determined by mercury intrusion porosimetry tests. The
results obtained allowed the effects of fv and ρd-f on soil-water retention property of soil mixture
to be clarified.
Materials and methods
Fine soil and coarse grains
Considering the difficulty of extracting intact interlayer soil from the field, the reconstituted
fine soil and coarse grains were fabricated in the laboratory. For the fine soil fraction, to obtain
a similar grain size distribution of fines from ‘Senissiat site’ (Trinh 2011) (Fig. 1), nine different
mass proportions of commercial soils were mixed (Table 1; see details in Lamas-Lopez 2016).
The liquid limit and plasticity index of the reconstituted fine soil were 32% and 20%,
respectively. Consequently, a good agreement between in-situ fine soil and reconstituted fine
soil was observed in terms of grain size distribution, plasticity index and liquid limit (see details
in Wang et al. 2017). Fig. 2 presents the standard Proctor compaction curve of the reconstituted
fine soil, defining an optimum water content wopt-f = 13.7% and a maximum dry density ρdmax-f
= 1.82 Mg/m3. Note that the ρdmax-f = 1.82 Mg/m3 of reconstituted fine soil was consistent with
the ρd-f = 1.80 Mg/m3 of in-situ fine soil measured by Lamas-Lopez (2016). Based on above
features, the reconstituted fine soil was considered as representative of the in-situ fine soil. For
the coarse grains fraction, the micro-ballast was adopted to replace the real ballast by following
a parallel gradation method adopted by Wang et al. (2017) and Su et al. (2020a). The validity
of this method was verified by Qi et al. (2020b), who performed comparisons between micro-
ballast and ballast in terms of mechanical behavior under static and cyclic loadings. Note that
the scaled fine/coarse soil mixture was used as representative of interlayer soil taken from
Senissiat (near Lyon, France, Trinh 2011), which was far from the coastal. Thus, the salt
content-related osmotic suction was ignored and only the matric suction was taken into account
in this study.
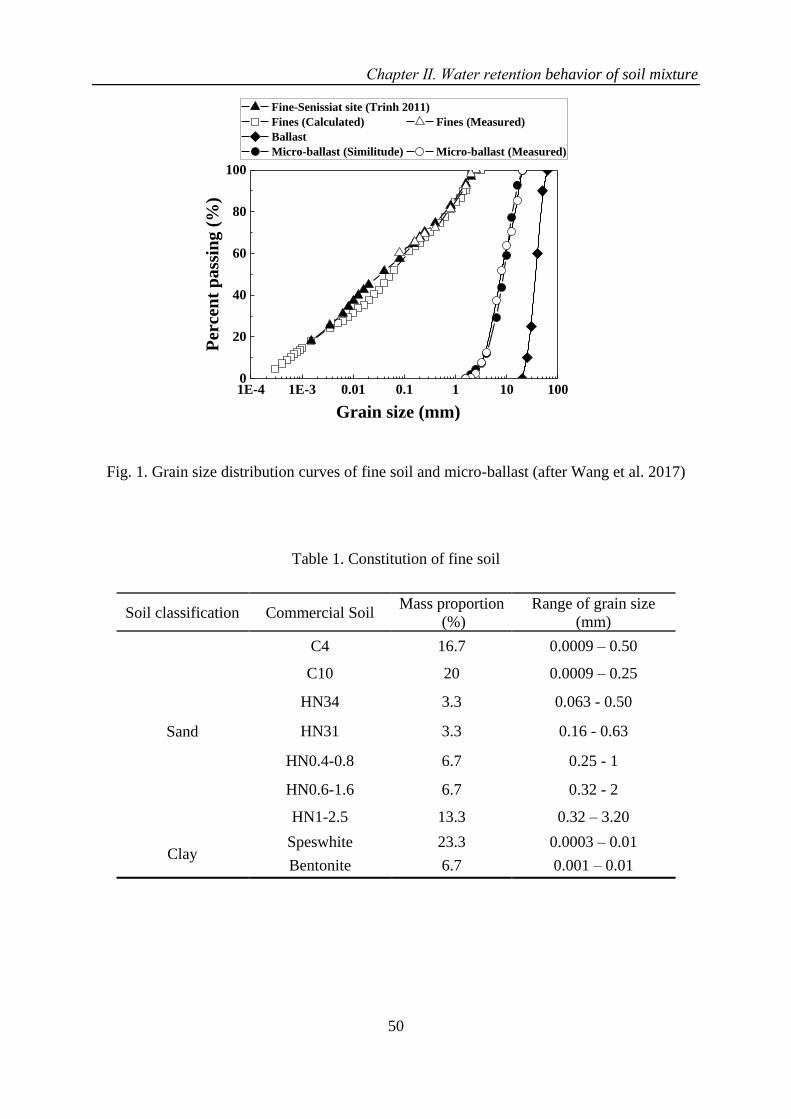
Chapter Ⅱ. Water retention behavior of soil mixture
50
1E-4 1E-3 0.01 0.1 1 10 1000
20
40
60
80
100
Fine-Senissiat site (Trinh 2011)
Fines (Calculated) Fines (Measured)
Ballast
Micro-ballast (Similitude) Micro-ballast (Measured)
Per
cen
t p
ass
ing (
%)
Grain size (mm)
Fig. 1. Grain size distribution curves of fine soil and micro-ballast (after Wang et al. 2017)
Table 1. Constitution of fine soil
Soil classification Commercial Soil Mass proportion
(%)
Range of grain size
(mm)
Sand
C4 16.7 0.0009 – 0.50
C10 20 0.0009 – 0.25
HN34 3.3 0.063 - 0.50
HN31 3.3 0.16 - 0.63
HN0.4-0.8 6.7 0.25 - 1
HN0.6-1.6 6.7 0.32 - 2
HN1-2.5 13.3 0.32 – 3.20
Clay Speswhite 23.3 0.0003 – 0.01
Bentonite 6.7 0.001 – 0.01

Chapter Ⅱ. Water retention behavior of soil mixture
51
4 6 8 10 12 14 16 18 20 22 24 26 28
1.48
1.52
1.56
1.60
1.64
1.68
1.72
1.76
1.80
1.84
Sr = 95%
Sr = 100%
Saturation line:
dmax-f
= 1.82 Mg/m3
d-f
= 1.67 Mg/m3
d-f
= 1.52 Mg/m3
wopt-f = 13.7%
d
-f
(Mg
/m3)
wf (%)
Standard Proctor curve of fine soil
As-compacted states of fine soil Saturated states of fine soil
Fig. 2. As-compacted and saturated states of fine soil with respect to its standard Proctor
compaction curve
Parameter fv, widely adopted in previous studies (Seif El Dine et al. 2010; Wang et al. 2017,
2018; Su et al. 2020a, 2020b), was considered in this study. Based on the definition of fv (Eq.(1)),
which only quantified the amount of dry coarse grains in the mixture, all voids and water were
assumed to be contained in the fine soil (Fig. 3), as in Wang et al. (2018) and Su et al. (2020a).
Based on this assumption, the degree of saturation Sr of mixture can be related to the fine soil
fraction. :
𝑓v =𝑉c
𝑉=
𝑉c
𝑉c+𝑉f=
𝑉c
𝑉c+𝑉s−f+𝑉w−f+𝑉a−f (1)
where Vf is the volume of fine soil; Vs-f, Vw-f and Va-f are the volume of fine grains, water and
air in the fine soil.
For the soil mixture at varying fv, ρd-f and water content wf of fine soil, the mass of coarse grains
ms-c, fine grains ms-f and water content of fine soil mw-f could be determined as follows:
𝑚s−c = 𝑉c ∙ 𝐺s−c ∙ 𝜌w = 𝑓v ∙ 𝑉 ∙ 𝐺s−c ∙ 𝜌w (2)
𝑚s−f = 𝜌d−f ∙ 𝑉f = 𝜌d−f ∙ 𝑉 ∙ (1 − 𝑓v) (3)
𝑚w−f = 𝑤f ∙ 𝑚s−f (4)

Chapter Ⅱ. Water retention behavior of soil mixture
52
where Gs-c is the specific gravity of coarse grains; ρw is the water unit mass.
For the soil mixture at a given ρd-f, the corresponding void ratio of fine soil ef could be deduced
using Eq. (5):
𝑒f =𝐺s−f∙𝜌w
𝜌d−f− 1 (5)
where Gs-f is the specific gravity of fine soil.
Then, the void ratio em of soil mixture can be determined:
𝑒m =𝑉v−f
𝑉c+𝑉s−f=
𝑉v−f
𝑉−𝑉v−f (6)
𝑉v−f = 𝑒f ∙ 𝑉s−f (7)
𝑉s−f = 𝑚s−f
𝐺s−f∙𝜌w (8)
where Vv-f is the volume of voids in fine soil; Vs-f is the volume of fine grains.
Combining Eqs. (1), (3) and (5)-(8), the void ratio em of soil mixture at varying fv and ρd-f was
obtained:
𝑒m = −1 + 1
1−(𝐺s−f∙𝜌w−𝜌d−f)∙(1−𝑓v)
𝐺s−f∙𝜌w
(9)
Fig. 4 shows the variations of ef and em with fv at a constant ρd-f = 1.82 Mg/m3. The ef and em
were obtained by substituting ρd-f = 1.82 Mg/m3 and Gs-f = 2.68 (Duong et al. 2016) into Eqs.
(5) and (9), respectively:
𝑒f = 0.47 (10)
𝑒m = −1 + 1
1−0.32∙(1−𝑓v) (11)
As mentioned before, all voids and water were assumed to be contained in the fine soil. Thus,
the Sr represented both degree of saturation of soil mixture and that of fine soil:
𝑆r =𝑉w−f
𝑉v−f (12)
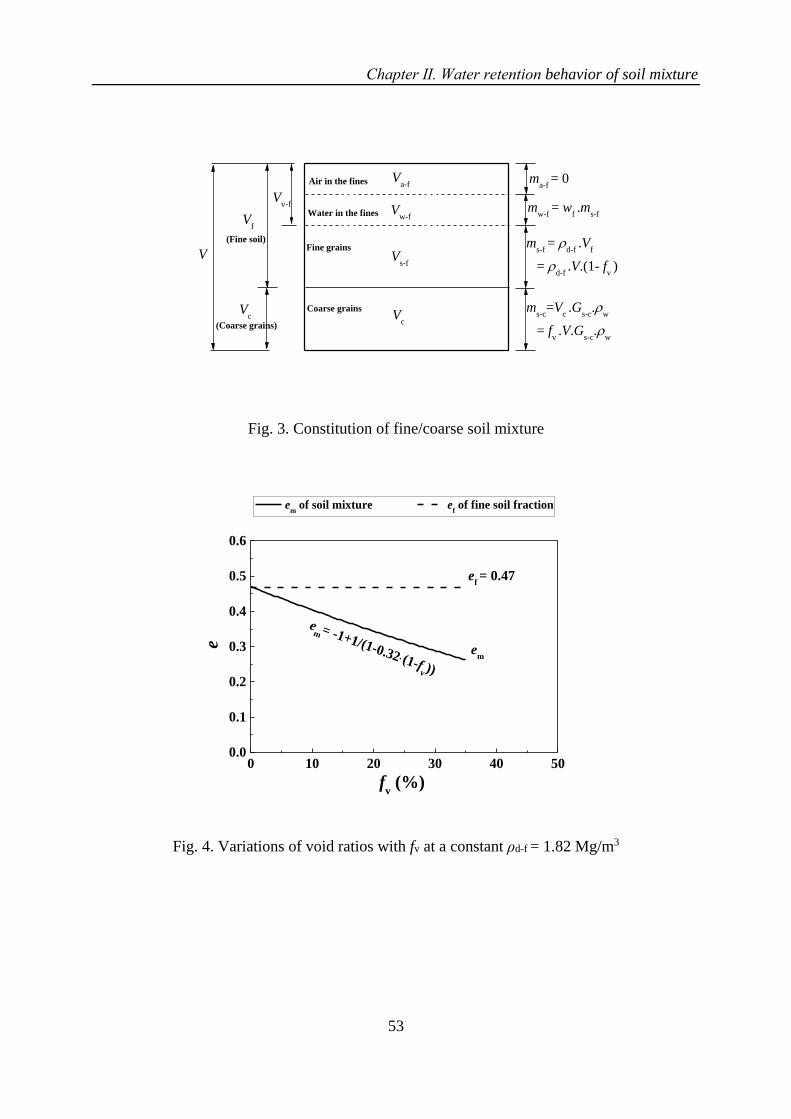
Chapter Ⅱ. Water retention behavior of soil mixture
53
ms-c
=Vc .G
s-c.
w
= fv .V.G
s-c.
w
ms-f
= d-f
.Vf
= d-f
.V.(1- fv )
mw-f
= wf .m
s-f
Coarse grains
Fine grains
Water in the fines
Vv-f
(Coarse grains)
Vc
(Fine soil)
Vf
V
Va-f
Vw-f
Vs-f
Vc
ma-f
= 0Air in the fines
Fig. 3. Constitution of fine/coarse soil mixture
0 10 20 30 40 500.0
0.1
0.2
0.3
0.4
0.5
0.6
ef = 0.47
em
em of soil mixture e
f of fine soil fraction
e
fv (%)
em = -1+1/(1-0.32(1-f
v ))
Fig. 4. Variations of void ratios with fv at a constant ρd-f = 1.82 Mg/m3
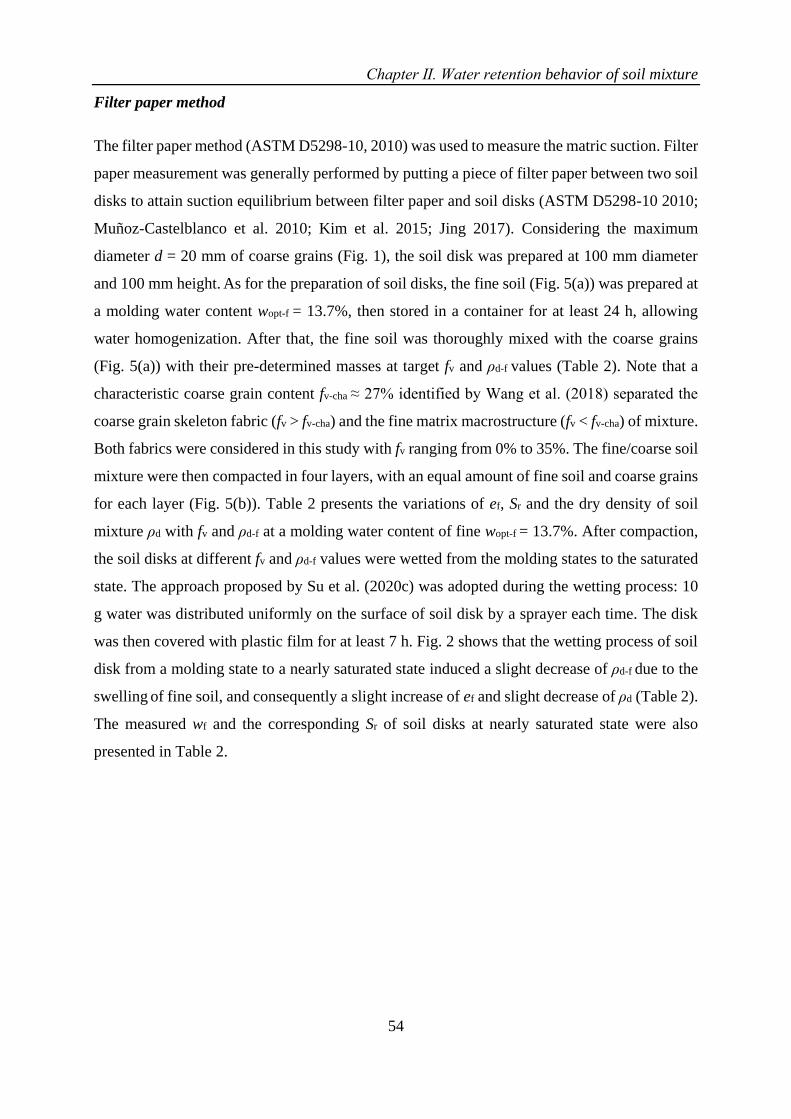
Chapter Ⅱ. Water retention behavior of soil mixture
54
Filter paper method
The filter paper method (ASTM D5298-10, 2010) was used to measure the matric suction. Filter
paper measurement was generally performed by putting a piece of filter paper between two soil
disks to attain suction equilibrium between filter paper and soil disks (ASTM D5298-10 2010;
Muñoz-Castelblanco et al. 2010; Kim et al. 2015; Jing 2017). Considering the maximum
diameter d = 20 mm of coarse grains (Fig. 1), the soil disk was prepared at 100 mm diameter
and 100 mm height. As for the preparation of soil disks, the fine soil (Fig. 5(a)) was prepared at
a molding water content wopt-f = 13.7%, then stored in a container for at least 24 h, allowing
water homogenization. After that, the fine soil was thoroughly mixed with the coarse grains
(Fig. 5(a)) with their pre-determined masses at target fv and ρd-f values (Table 2). Note that a
characteristic coarse grain content fv-cha ≈ 27% identified by Wang et al. (2018) separated the
coarse grain skeleton fabric (fv > fv-cha) and the fine matrix macrostructure (fv < fv-cha) of mixture.
Both fabrics were considered in this study with fv ranging from 0% to 35%. The fine/coarse soil
mixture were then compacted in four layers, with an equal amount of fine soil and coarse grains
for each layer (Fig. 5(b)). Table 2 presents the variations of ef, Sr and the dry density of soil
mixture ρd with fv and ρd-f at a molding water content of fine wopt-f = 13.7%. After compaction,
the soil disks at different fv and ρd-f values were wetted from the molding states to the saturated
state. The approach proposed by Su et al. (2020c) was adopted during the wetting process: 10
g water was distributed uniformly on the surface of soil disk by a sprayer each time. The disk
was then covered with plastic film for at least 7 h. Fig. 2 shows that the wetting process of soil
disk from a molding state to a nearly saturated state induced a slight decrease of ρd-f due to the
swelling of fine soil, and consequently a slight increase of ef and slight decrease of ρd (Table 2).
The measured wf and the corresponding Sr of soil disks at nearly saturated state were also
presented in Table 2.
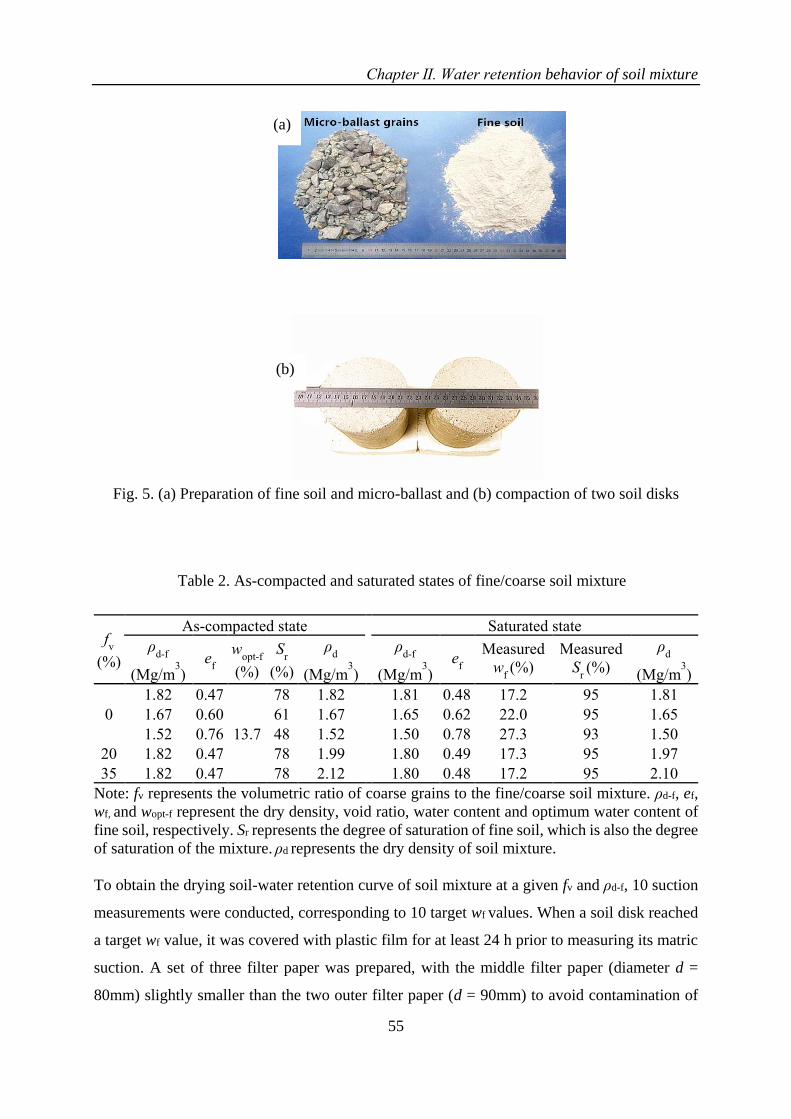
Chapter Ⅱ. Water retention behavior of soil mixture
55
Fig. 5. (a) Preparation of fine soil and micro-ballast and (b) compaction of two soil disks
Table 2. As-compacted and saturated states of fine/coarse soil mixture
fv
(%)
As-compacted state Saturated state
ρd-f
(Mg/m3)
ef
wopt-f
(%)
Sr
(%)
ρd
(Mg/m3)
ρ
d-f
(Mg/m3)
ef
Measured
wf (%)
Measured
Sr (%)
ρd
(Mg/m3)
0
1.82 0.47
13.7
78 1.82
1.81 0.48 17.2 95 1.81
1.67 0.60 61 1.67 1.65 0.62 22.0 95 1.65
1.52 0.76 48 1.52 1.50 0.78 27.3 93 1.50
20 1.82 0.47 78 1.99 1.80 0.49 17.3 95 1.97
35 1.82 0.47 78 2.12 1.80 0.48 17.2 95 2.10
Note: fv represents the volumetric ratio of coarse grains to the fine/coarse soil mixture. ρd-f, ef,
wf, and wopt-f represent the dry density, void ratio, water content and optimum water content of
fine soil, respectively. Sr represents the degree of saturation of fine soil, which is also the degree
of saturation of the mixture. ρd represents the dry density of soil mixture.
To obtain the drying soil-water retention curve of soil mixture at a given fv and ρd-f, 10 suction
measurements were conducted, corresponding to 10 target wf values. When a soil disk reached
a target wf value, it was covered with plastic film for at least 24 h prior to measuring its matric
suction. A set of three filter paper was prepared, with the middle filter paper (diameter d =
80mm) slightly smaller than the two outer filter paper (d = 90mm) to avoid contamination of
(a)
(b)
Chapter Ⅱ. Water retention behavior of soil mixture
56
the middle one. The set of three filter papers was then placed between two soil disks. The whole
set was covered with plastic film, and then sealed with wax. Note that an initial water content
of 4.61% of the filter paper was measured, corresponding to a suction of 93 MPa. In this case,
the filter paper followed a wetting process during the equilibration process between soil and
filter paper. After equilibration, the water content of soil disks and the middle filter paper were
measured, with a balance of 1/10000 g accuracy. The corresponding matric suction was then
determined for varying fv, ρd-f and wf values. It is worth noting that the volume of soil disks at
different wf values was also measured, by means of a caliper.
Mercury intrusion porosimetry test (MIP)
For the MIP tests, three soil disks were prepared at varying ρd-f = 1.82, 1.67 and 1.52 Mg/m3
with the same fv = 0%. The freeze-drying method was adopted: fine soil was cut into small
pieces of around 1.5 g each, and then immersed into nitrogen under vacuum; afterwards, the
frozen soil was transferred to the chamber of a freeze dryer for lyophilizing. This method
minimized the microstructure disturbance of fine soil, which was widely used in previous
studies (Cui et al. 2002; Delage et al. 2006; Wang et al. 2014).
Results
To determine the equilibration time of samples with the filter paper method, three samples were
prepared at the same fv = 0%, ρd-f = 1.82 Mg/m3 and wopt-f = 13.7%, with 5, 7 and 9 days waited,
respectively. Fig. 6 depicts the variations of matric suction and water content of filter paper
with time. It appears that with the increase of time from 0 to 5, 7 and 9 days, the water content
of filter paper increased from 4.61% to 30.59%, 32.02% and 32.11%, and the corresponding
matric suction decreased from 93 MPa to 879, 679 and 670 kPa, respectively. This indicated
that at least a time of 7 days was needed for the suction equilibration between soil and filter
paper. Thereby, a duration of 7 days was adopted for all tests.
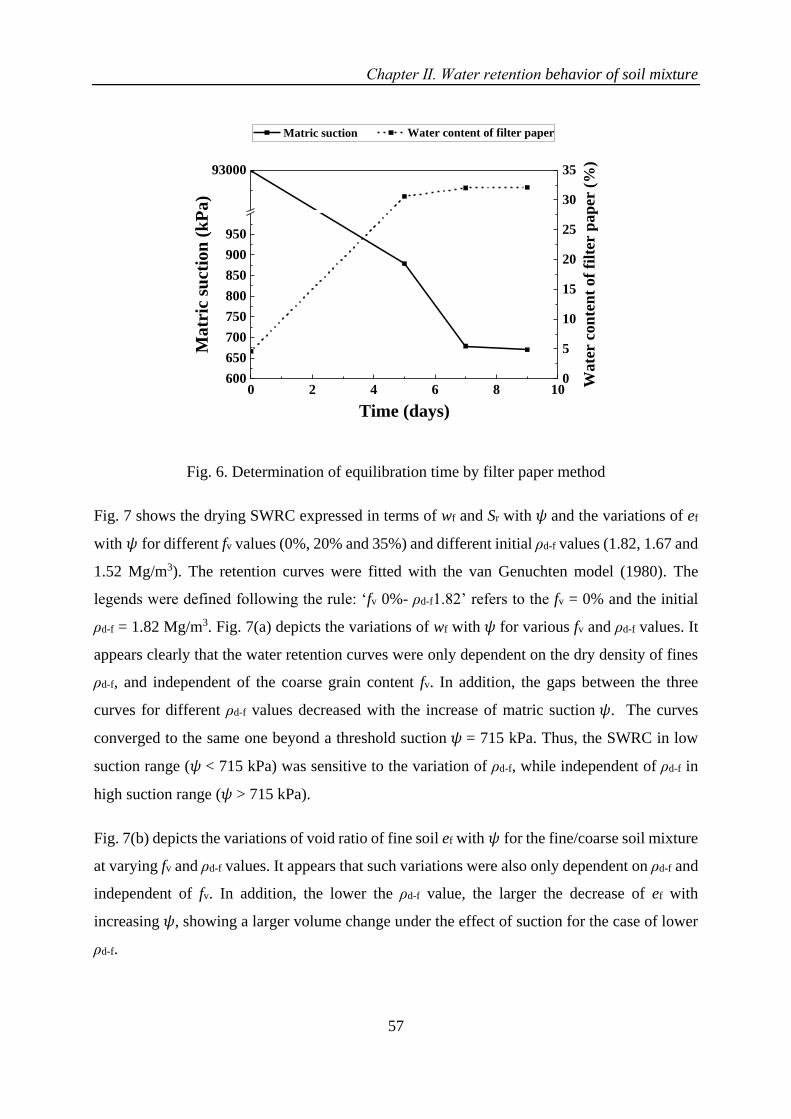
Chapter Ⅱ. Water retention behavior of soil mixture
57
0 2 4 6 8 10600
650
700
750
800
850
900
950
93000
Matric suction
Matr
ic s
uct
ion
(k
Pa
)
Time (days)
0
5
10
15
20
25
30
35
Wate
r co
nte
nt
of
filt
er p
ap
er (
%)
Water content of filter paper
Fig. 6. Determination of equilibration time by filter paper method
Fig. 7 shows the drying SWRC expressed in terms of wf and Sr with 𝜓 and the variations of ef
with 𝜓 for different fv values (0%, 20% and 35%) and different initial ρd-f values (1.82, 1.67 and
1.52 Mg/m3). The retention curves were fitted with the van Genuchten model (1980). The
legends were defined following the rule: ‘fv 0%- ρd-f1.82’ refers to the fv = 0% and the initial
ρd-f = 1.82 Mg/m3. Fig. 7(a) depicts the variations of wf with 𝜓 for various fv and ρd-f values. It
appears clearly that the water retention curves were only dependent on the dry density of fines
ρd-f, and independent of the coarse grain content fv. In addition, the gaps between the three
curves for different ρd-f values decreased with the increase of matric suction 𝜓. The curves
converged to the same one beyond a threshold suction 𝜓 = 715 kPa. Thus, the SWRC in low
suction range (𝜓 < 715 kPa) was sensitive to the variation of ρd-f, while independent of ρd-f in
high suction range (𝜓 > 715 kPa).
Fig. 7(b) depicts the variations of void ratio of fine soil ef with 𝜓 for the fine/coarse soil mixture
at varying fv and ρd-f values. It appears that such variations were also only dependent on ρd-f and
independent of fv. In addition, the lower the ρd-f value, the larger the decrease of ef with
increasing 𝜓, showing a larger volume change under the effect of suction for the case of lower
ρd-f.
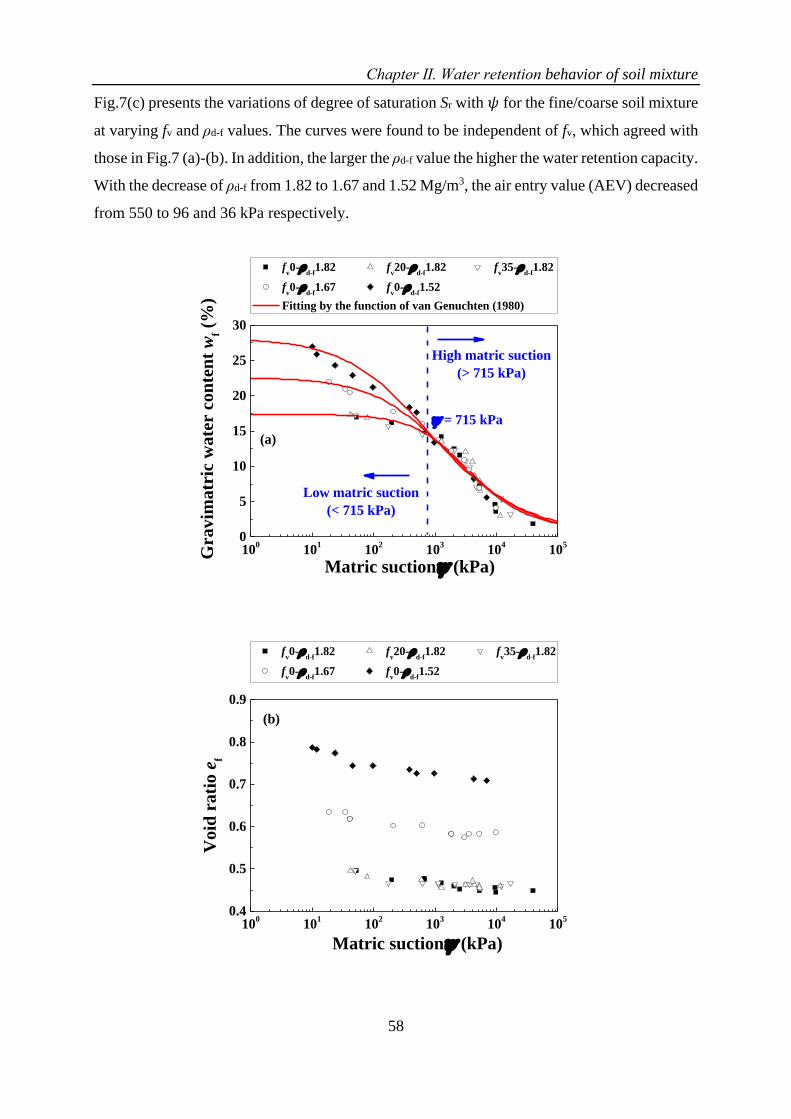
Chapter Ⅱ. Water retention behavior of soil mixture
58
Fig.7(c) presents the variations of degree of saturation Sr with 𝜓 for the fine/coarse soil mixture
at varying fv and ρd-f values. The curves were found to be independent of fv, which agreed with
those in Fig.7 (a)-(b). In addition, the larger the ρd-f value the higher the water retention capacity.
With the decrease of ρd-f from 1.82 to 1.67 and 1.52 Mg/m3, the air entry value (AEV) decreased
from 550 to 96 and 36 kPa respectively.
100
101
102
103
104
105
0
5
10
15
20
25
30
High matric suction
(> 715 kPa)
(a)
= 715 kPa
Low matric suction
(< 715 kPa)
Matric suction (kPa)
Gravim
atr
ic w
ate
r c
on
ten
t w
f (%
)
fv0-
d-f1.82 f
v20-
d-f1.82 f
v35-
d-f1.82
fv0-
d-f1.67 f
v0-
d-f1.52
Fitting by the function of van Genuchten (1980)
100
101
102
103
104
105
0.4
0.5
0.6
0.7
0.8
0.9
(b)
Matric suction (kPa)
fv0-
d-f1.82 f
v20-
d-f1.82 f
v35-
d-f1.82
fv0-
d-f1.67 f
v0-
d-f1.52
Vo
id r
ati
o e
f
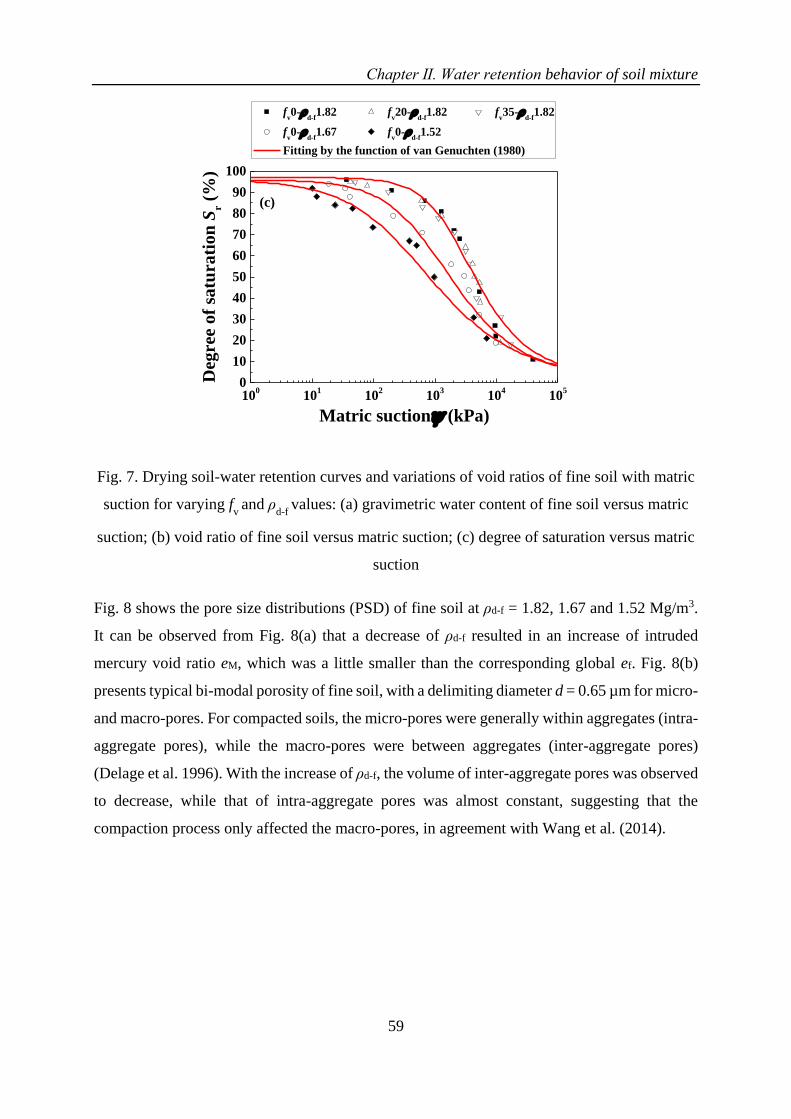
Chapter Ⅱ. Water retention behavior of soil mixture
59
100
101
102
103
104
105
0
10
20
30
40
50
60
70
80
90
100
(c)
fv0-
d-f1.82 f
v20-
d-f1.82 f
v35-
d-f1.82
fv0-
d-f1.67 f
v0-
d-f1.52
Fitting by the function of van Genuchten (1980)
Deg
ree o
f sa
tura
tio
n S
r (
%)
Matric suction (kPa)
Fig. 7. Drying soil-water retention curves and variations of void ratios of fine soil with matric
suction for varying fv and ρ
d-f values: (a) gravimetric water content of fine soil versus matric
suction; (b) void ratio of fine soil versus matric suction; (c) degree of saturation versus matric
suction
Fig. 8 shows the pore size distributions (PSD) of fine soil at ρd-f = 1.82, 1.67 and 1.52 Mg/m3.
It can be observed from Fig. 8(a) that a decrease of ρd-f resulted in an increase of intruded
mercury void ratio eM, which was a little smaller than the corresponding global ef. Fig. 8(b)
presents typical bi-modal porosity of fine soil, with a delimiting diameter d = 0.65 µm for micro-
and macro-pores. For compacted soils, the micro-pores were generally within aggregates (intra-
aggregate pores), while the macro-pores were between aggregates (inter-aggregate pores)
(Delage et al. 1996). With the increase of ρd-f, the volume of inter-aggregate pores was observed
to decrease, while that of intra-aggregate pores was almost constant, suggesting that the
compaction process only affected the macro-pores, in agreement with Wang et al. (2014).
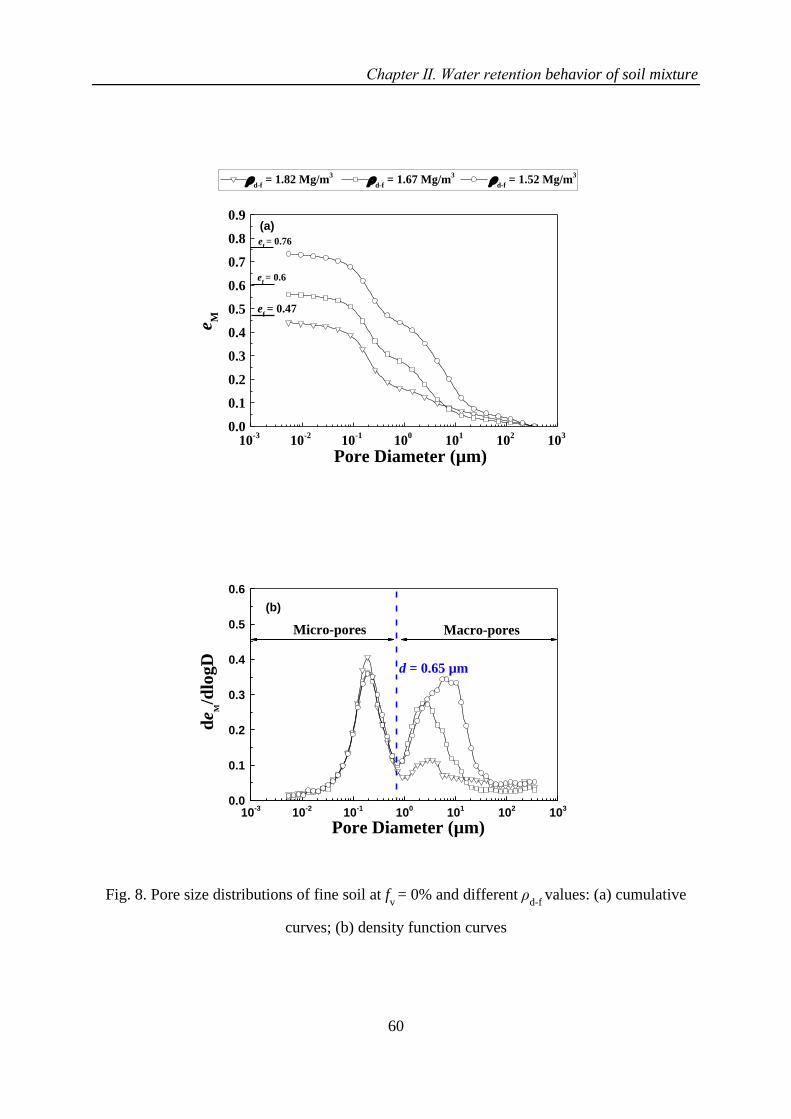
Chapter Ⅱ. Water retention behavior of soil mixture
60
10-3
10-2
10-1
100
101
102
103
0.0
0.1
0.2
0.3
0.4
0.5
0.6
0.7
0.8
0.9(a)
eM
Pore Diameter (µm)
d-f
= 1.82 Mg/m3
d-f = 1.67 Mg/m
3
d-f = 1.52 Mg/m
3
ef = 0.47
ef = 0.6
ef = 0.76
0.0
0.1
0.2
0.3
0.4
0.5
0.6
10-3
10-2
10-1
100
101
102
103
d = 0.65 µm
Macro-pores
de
M/d
log
D
Pore Diameter (µm)
(b)
Micro-pores
Fig. 8. Pore size distributions of fine soil at fv = 0% and different ρ
d-f values: (a) cumulative
curves; (b) density function curves
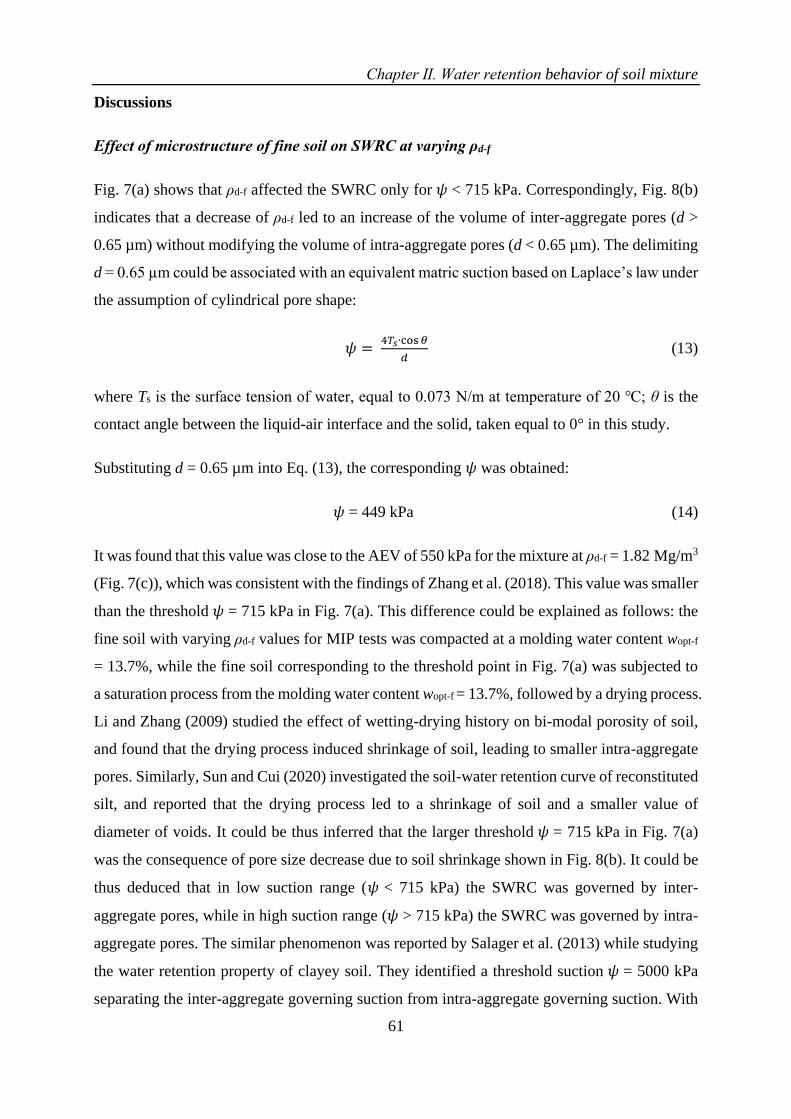
Chapter Ⅱ. Water retention behavior of soil mixture
61
Discussions
Effect of microstructure of fine soil on SWRC at varying ρd-f
Fig. 7(a) shows that ρd-f affected the SWRC only for 𝜓 < 715 kPa. Correspondingly, Fig. 8(b)
indicates that a decrease of ρd-f led to an increase of the volume of inter-aggregate pores (d >
0.65 µm) without modifying the volume of intra-aggregate pores (d < 0.65 µm). The delimiting
d = 0.65 µm could be associated with an equivalent matric suction based on Laplace’s law under
the assumption of cylindrical pore shape:
𝜓 = 4𝑇𝑠∙cos 𝜃
𝑑 (13)
where Ts is the surface tension of water, equal to 0.073 N/m at temperature of 20 ℃; θ is the
contact angle between the liquid-air interface and the solid, taken equal to 0° in this study.
Substituting d = 0.65 µm into Eq. (13), the corresponding 𝜓 was obtained:
𝜓 = 449 kPa (14)
It was found that this value was close to the AEV of 550 kPa for the mixture at ρd-f = 1.82 Mg/m3
(Fig. 7(c)), which was consistent with the findings of Zhang et al. (2018). This value was smaller
than the threshold 𝜓 = 715 kPa in Fig. 7(a). This difference could be explained as follows: the
fine soil with varying ρd-f values for MIP tests was compacted at a molding water content wopt-f
= 13.7%, while the fine soil corresponding to the threshold point in Fig. 7(a) was subjected to
a saturation process from the molding water content wopt-f = 13.7%, followed by a drying process.
Li and Zhang (2009) studied the effect of wetting-drying history on bi-modal porosity of soil,
and found that the drying process induced shrinkage of soil, leading to smaller intra-aggregate
pores. Similarly, Sun and Cui (2020) investigated the soil-water retention curve of reconstituted
silt, and reported that the drying process led to a shrinkage of soil and a smaller value of
diameter of voids. It could be thus inferred that the larger threshold 𝜓 = 715 kPa in Fig. 7(a)
was the consequence of pore size decrease due to soil shrinkage shown in Fig. 8(b). It could be
thus deduced that in low suction range (𝜓 < 715 kPa) the SWRC was governed by inter-
aggregate pores, while in high suction range (𝜓 > 715 kPa) the SWRC was governed by intra-
aggregate pores. The similar phenomenon was reported by Salager et al. (2013) while studying
the water retention property of clayey soil. They identified a threshold suction 𝜓 = 5000 kPa
separating the inter-aggregate governing suction from intra-aggregate governing suction. With
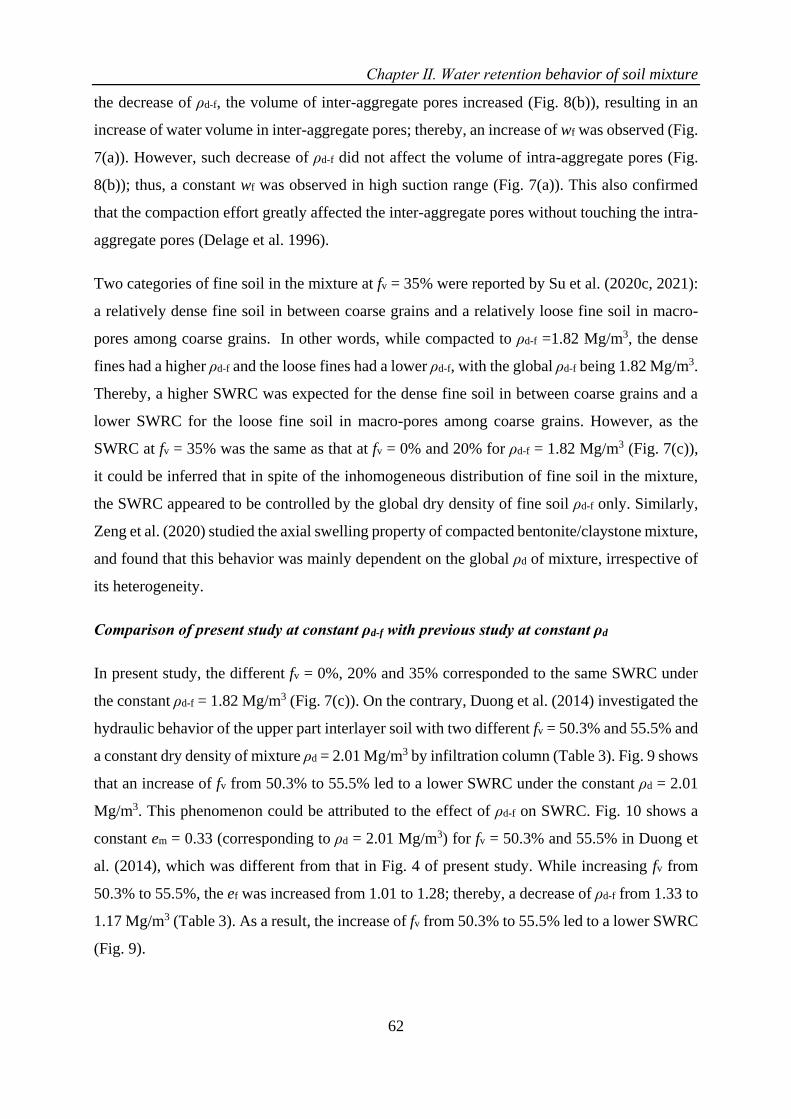
Chapter Ⅱ. Water retention behavior of soil mixture
62
the decrease of ρd-f, the volume of inter-aggregate pores increased (Fig. 8(b)), resulting in an
increase of water volume in inter-aggregate pores; thereby, an increase of wf was observed (Fig.
7(a)). However, such decrease of ρd-f did not affect the volume of intra-aggregate pores (Fig.
8(b)); thus, a constant wf was observed in high suction range (Fig. 7(a)). This also confirmed
that the compaction effort greatly affected the inter-aggregate pores without touching the intra-
aggregate pores (Delage et al. 1996).
Two categories of fine soil in the mixture at fv = 35% were reported by Su et al. (2020c, 2021):
a relatively dense fine soil in between coarse grains and a relatively loose fine soil in macro-
pores among coarse grains. In other words, while compacted to ρd-f =1.82 Mg/m3, the dense
fines had a higher ρd-f and the loose fines had a lower ρd-f, with the global ρd-f being 1.82 Mg/m3.
Thereby, a higher SWRC was expected for the dense fine soil in between coarse grains and a
lower SWRC for the loose fine soil in macro-pores among coarse grains. However, as the
SWRC at fv = 35% was the same as that at fv = 0% and 20% for ρd-f = 1.82 Mg/m3 (Fig. 7(c)),
it could be inferred that in spite of the inhomogeneous distribution of fine soil in the mixture,
the SWRC appeared to be controlled by the global dry density of fine soil ρd-f only. Similarly,
Zeng et al. (2020) studied the axial swelling property of compacted bentonite/claystone mixture,
and found that this behavior was mainly dependent on the global ρd of mixture, irrespective of
its heterogeneity.
Comparison of present study at constant ρd-f with previous study at constant ρd
In present study, the different fv = 0%, 20% and 35% corresponded to the same SWRC under
the constant ρd-f = 1.82 Mg/m3 (Fig. 7(c)). On the contrary, Duong et al. (2014) investigated the
hydraulic behavior of the upper part interlayer soil with two different fv = 50.3% and 55.5% and
a constant dry density of mixture ρd = 2.01 Mg/m3 by infiltration column (Table 3). Fig. 9 shows
that an increase of fv from 50.3% to 55.5% led to a lower SWRC under the constant ρd = 2.01
Mg/m3. This phenomenon could be attributed to the effect of ρd-f on SWRC. Fig. 10 shows a
constant em = 0.33 (corresponding to ρd = 2.01 Mg/m3) for fv = 50.3% and 55.5% in Duong et
al. (2014), which was different from that in Fig. 4 of present study. While increasing fv from
50.3% to 55.5%, the ef was increased from 1.01 to 1.28; thereby, a decrease of ρd-f from 1.33 to
1.17 Mg/m3 (Table 3). As a result, the increase of fv from 50.3% to 55.5% led to a lower SWRC
(Fig. 9).
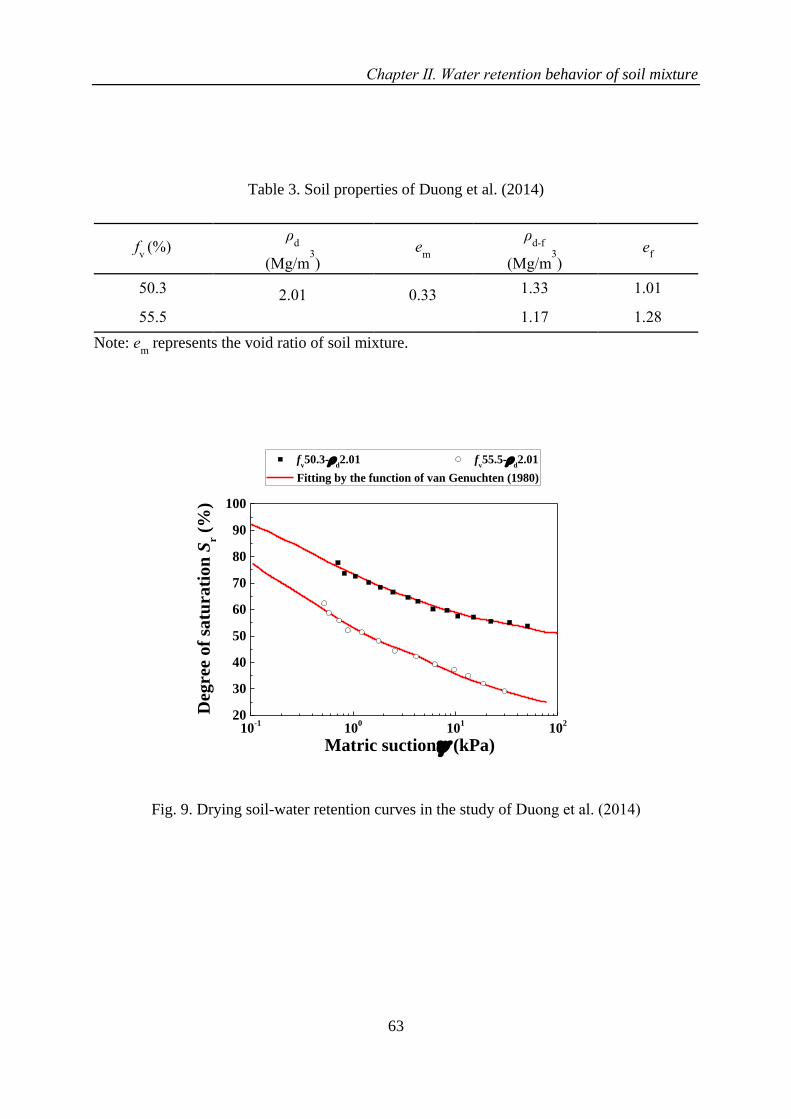
Chapter Ⅱ. Water retention behavior of soil mixture
63
Table 3. Soil properties of Duong et al. (2014)
fv
(%) ρ
d
(Mg/m3)
em
ρ
d-f
(Mg/m3)
ef
50.3 2.01 0.33 1.33 1.01
55.5 1.17 1.28
Note: em
represents the void ratio of soil mixture.
10-1
100
101
102
20
30
40
50
60
70
80
90
100
Deg
ree o
f sa
tura
tio
n S
r (
%)
Matric suction (kPa)
fv50.3-
d2.01 f
v55.5-
d2.01
Fitting by the function of van Genuchten (1980)
Fig. 9. Drying soil-water retention curves in the study of Duong et al. (2014)
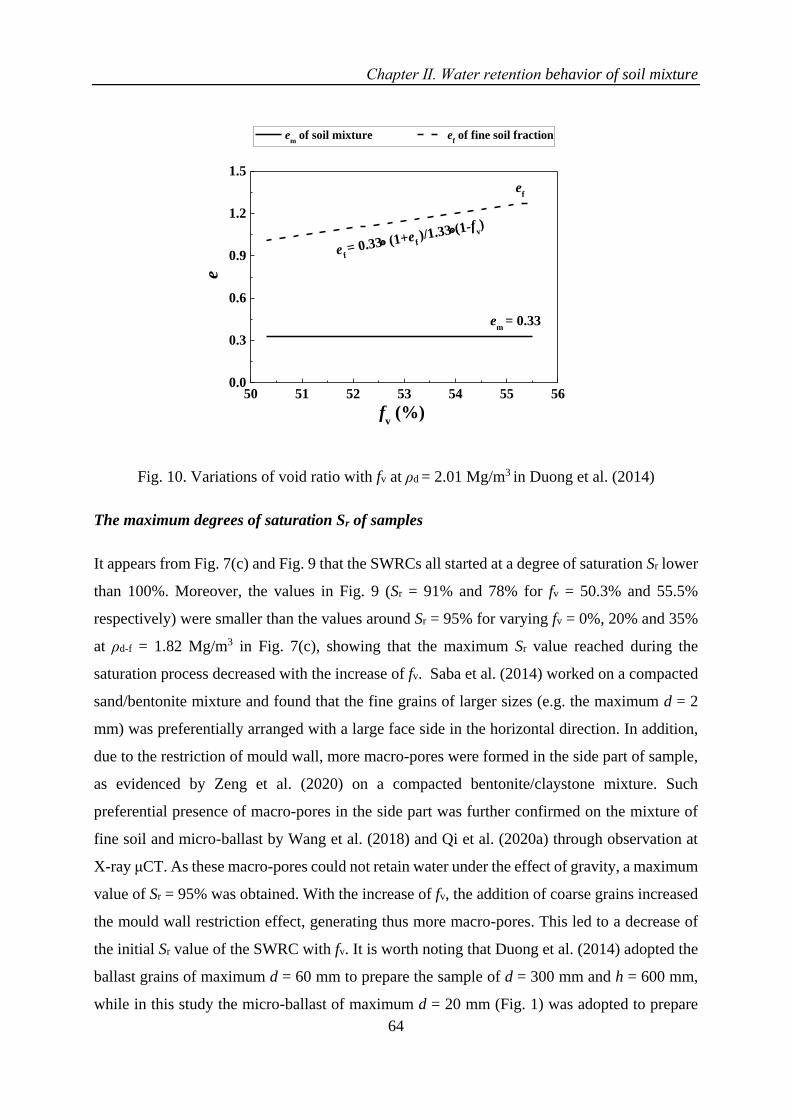
Chapter Ⅱ. Water retention behavior of soil mixture
64
50 51 52 53 54 55 560.0
0.3
0.6
0.9
1.2
1.5
e f = 0.33 (1+e f
)/1.33(1-fv)
ef
em
= 0.33
em of soil mixture e
f of fine soil fraction
e
fv (%)
Fig. 10. Variations of void ratio with fv at ρd = 2.01 Mg/m3 in Duong et al. (2014)
The maximum degrees of saturation Sr of samples
It appears from Fig. 7(c) and Fig. 9 that the SWRCs all started at a degree of saturation Sr lower
than 100%. Moreover, the values in Fig. 9 (Sr = 91% and 78% for fv = 50.3% and 55.5%
respectively) were smaller than the values around Sr = 95% for varying fv = 0%, 20% and 35%
at ρd-f = 1.82 Mg/m3 in Fig. 7(c), showing that the maximum Sr value reached during the
saturation process decreased with the increase of fv. Saba et al. (2014) worked on a compacted
sand/bentonite mixture and found that the fine grains of larger sizes (e.g. the maximum d = 2
mm) was preferentially arranged with a large face side in the horizontal direction. In addition,
due to the restriction of mould wall, more macro-pores were formed in the side part of sample,
as evidenced by Zeng et al. (2020) on a compacted bentonite/claystone mixture. Such
preferential presence of macro-pores in the side part was further confirmed on the mixture of
fine soil and micro-ballast by Wang et al. (2018) and Qi et al. (2020a) through observation at
X-ray μCT. As these macro-pores could not retain water under the effect of gravity, a maximum
value of Sr = 95% was obtained. With the increase of fv, the addition of coarse grains increased
the mould wall restriction effect, generating thus more macro-pores. This led to a decrease of
the initial Sr value of the SWRC with fv. It is worth noting that Duong et al. (2014) adopted the
ballast grains of maximum d = 60 mm to prepare the sample of d = 300 mm and h = 600 mm,
while in this study the micro-ballast of maximum d = 20 mm (Fig. 1) was adopted to prepare
Chapter Ⅱ. Water retention behavior of soil mixture
65
soil disk of d = 100 mm and h = 100 mm. Much larger mould wall restriction effect was thus
expected in the case of Duong et al. (2014) due to the larger dimensions of the grains and the
sample. Consequently, much lower maximum degrees of saturation (Sr = 91% and 78% for fv =
50.3% and 55.5%) were obtained in their case.
Conclusions
To investigate the role of fine soil on the soil-water retention property of fine/coarse soil mixture,
three fv = 0%, 20% and 35% at the same ρd-f = 1.82 Mg/m3 and three ρd-f = 1.82, 1.67 and
1.52 Mg/m3 at the same fv = 0% were considered. A filter paper method was applied to measure
the matric suction of soil mixture at different water contents. Mercury intrusion porosimetry
tests were performed for microstructure observation of fine soil at varying ρd-f. The results
obtained allowed the following conclusions to be drawn.
The drying SWRC of mixture was found to be only dependent on ρd-f and independent of fv. A
typical bi-modal microstructure of fine soil was identified for varying ρd-f values, defining a
micro-pore and a macro-pore populations. When expressed in terms of wf with 𝜓, the SWRC
was found to be significantly affected by ρd-f for the matric suction 𝜓 lower than 715 kPa. By
contrast, when 𝜓 was higher than 715 kPa, the SWRC kept the same, independent of ρd-f.
Interestingly, a delimiting pore diameter d = 0.65 µm was identified, separating micro-pores (or
intra-aggregate pores) from macro-pores (or inter-aggregate pores). This delimiting diameter
corresponded to a matric suction of 449 kPa, which was smaller than the threshold 𝜓 = 715 kPa
due to the effect of volume change experienced in the course of soil wetting/drying from the
remolded state (wopt-f = 13.7%). Thus, the SWRC in low suction range (𝜓 < 715 kPa) was
governed by macro-pores, while in high suction range (𝜓 > 715 kPa) by micro-pores. In
addition, the SWRC of mixture appeared to be controlled by the global fine soil dry density
ρd-f only. The effect of the possible heterogeneity of fine soil distribution inside the mixture
seemed to be negligible.
When expressed in terms of Sr with 𝜓, the SWRC appeared to be significantly affected by ρd-f,
while unaffected by fv. This helped better understand the observation of Duong et al. (2014) –
the water retention capacity was decreased by the increase of fv: in the study of Duong et al.
(2014), a constant ρd = 2.01 Mg/m3 was adopted instead of a constant ρd-f. In this case, an
increase of fv resulted in a decrease of ρd-f, thereby a decrease of water retention capacity.
Chapter Ⅱ. Water retention behavior of soil mixture
66
The initial Sr of the SWRC appeared to decrease with the increase of fv. At fv = 0%, due to the
effect of mould wall restriction, macro-pores were formed in the side part of sample. As these
macro-pores could not retain water under the effect of gravity, the maximum value of Sr = 95%
smaller than 100% was obtained in the saturation process. With the increase of fv, the addition
of coarse grains increased the mould wall restriction effect, generating more macro-pores and
thus lower maximum Sr. This phenomenon was expected to be more pronounced in the case of
larger grains and larger sample dimensions.
From a practical point of view, these findings suggest that when investigating the water-
retention property of interlayer soil, the scaled coarse grains at small size can be used as a
substitute for real ballast grains at large size. With the increasing depth of interlayer soil, the
decrease of fv induced no changes on water-retention capacity of interlayer soil, provided that
the ρd-f of fine soil kept constant. When the water retention property is determined, it can be
incorporated in the mechanical models to better describe the variation of permanent strain of
unsaturated interlayer soil under the effect of cyclic loadings. In addition, it is worth noting that
to some extent these findings can be helpful in evaluating the effects of ρd-f and fv on the water
retention property of mixtures with varying types of coarse and fine soil.
Acknowledgements
This work was supported by the China Scholarship Council (CSC) and Ecole des Ponts
ParisTech.
References
ASTM D5298-10. 2010. Standard test method for measurement of soil potential (suction) using
filter paper. West Conshohocken, PA: ASTM International.
Baetens, J. M., Verbist, K., Cornelis, W. M., Gabriels, D., and Soto, G. 2009. On the influence
of coarse fragments on soil water retention. Water resources research, 45(7).
Cui, Y.J., Loiseau, C. and Delage, P. 2002. Microstructure changes of a confined swelling soil
due to suction. In Unsaturated Soils: Proceedings of the Third International Conference
on Unsaturated Soils, UNSAT 2002, 10-13 March 2002, Recife, Brazil (Vol. 2, p. 593).
CRC Press.
Cui, Y.J., Duong, T.V., Tang, A.M., Dupla, J.C., Calon, N. and Robinet, A. 2013. Investigation
of the hydro-mechanical behaviour of fouled ballast. Journal of Zhejiang University
Science A, 14(4), pp.244-255.
Chapter Ⅱ. Water retention behavior of soil mixture
67
Cui, Y. J. 2018. Mechanical behaviour of coarse grains/fines mixture under monotonic and
cyclic loadings. Transportation Geotechnics, 17, 91-97.
Delage, P., Audiguier, M., Cui, Y.J. and Howat, M.D. 1996. Microstructure of a compacted
silt. Canadian Geotechnical Journal, 33(1), pp.150-158.
Delage, P., Marcial, D., Cui, Y.J. and Ruiz, X. 2006. Ageing effects in a compacted bentonite:
a microstructure approach. Géotechnique, 56(5), pp.291-304.
Duong, T. V., Cui, Y. J., Tang, A. M., Dupla, J. C., and Calon, N. 2014. Effect of fine particles
on the hydraulic behavior of interlayer soil in railway substructure. Canadian geotechnical
journal, 51(7), 735-746.
Duong, T. V., Cui, Y. J., Tang, A. M., Dupla, J. C., Canou, J., Calon, N., and Robinet, A. 2016.
Effects of water and fines contents on the resilient modulus of the interlayer soil of railway
substructure. Acta Geotechnica, 11(1), 51-59.
Fiès, J. C., Louvigny, N. D. E., and Chanzy, A. 2002. The role of stones in soil water retention.
European Journal of Soil Science, 53(1), 95-104.
Gao, Y., Sun, D. 2017. Soil-water retention behavior of compacted soil with different densities
over a wide suction range and its prediction. Computers and Geotechnics, 91(nov.):17-26.
Jing, P. 2017. Experimental study and modelling of the elastoplastic behaviour of unbound
granular materials under large number of cyclic loadings at various initial hydric states
(Doctoral dissertation, Université de Strasbourg).
Kim, H., Ganju, E., Tang, D., Prezzi, M., and Salgado, R. 2015. Matric suction measurements
of compacted subgrade soils. Road Materials and Pavement Design, 16(2), 358-378.
Li, X., and Zhang, L. M. 2009. Characterization of dual-structure pore-size distribution of soil.
Canadian geotechnical journal, 46(2), 129-141.
Lamas-lopez, F. 2016. Field and laboratory investigation on the dynamic behavior of
conventional railway track-bed materials in the context of traffic upgrade. PhD Thesis,
Ecole Nationale des Ponts et Chaussées, Université Paris-Est.
Muñoz-Castelblanco, J. A., Pereira, J. M., Delage, P., and Cui, Y. J. 2010. Suction
measurements on a natural unsaturated soil: A reappraisal of the filter paper method. In
Unsaturated Soils-Proc. Fifth Int. Conf. on Unsaturated Soils (Vol. 1, pp. 707-712). CRC
Press.
Qi, S., Cui, Y.J., Chen, R.P., Wang, H.L., Lamas-Lopez, F., Aimedieu, P., Dupla, J.C., Canou,
J. and Saussine, G. 2020a. Influence of grain size distribution of inclusions on the
mechanical behaviours of track-bed materials. Géotechnique, 70(3), pp.238-247.
Qi, S., Cui, Y.J., Dupla, J.C., Chen, R.P., Wang, H.L., Su, Y., Lamas-Lopez, F. and Canou, J.
2020b. Investigation of the parallel gradation method based on the response of track-bed
materials under cyclic loadings. Transportation Geotechnics, p.100360.
Chapter Ⅱ. Water retention behavior of soil mixture
68
Romero, E., Gens, A., and Lloret, A. 1999. Water permeability, water retention and
microstructure of unsaturated compacted Boom clay. Engineering Geology, 54(1-2), 117-
127.
Romero, E., DELLA VECCHIA, G. A. B. R. I. E. L. E., and Jommi, C. 2011. An insight into
the water retention properties of compacted clayey soils. Géotechnique, 61(4), 313-328.
Simms, P. H., and Yanful, E. K. 2002. Predicting soil—Water characteristic curves of
compacted plastic soils from measured pore-size distributions. Géotechnique, 52(4), 269-
278.
Seif El Dine, B., Dupla, J. C., Frank, R., Canou, J., and Kazan, Y. 2010. Mechanical
characterization of matrix coarse-grained soils with a large-sized triaxial device. Canadian
Geotechnical Journal, 47(4), 425-438.
Salager, S., Nuth, M., Ferrari, A., and Laloui, L. 2013. Investigation into water retention
behaviour of deformable soils. Canadian Geotechnical Journal, 50(2), 200-208.
Saba, S., Barnichon, J.D., Cui, Y.J., Tang, A.M., Delage, P. 2014. Microstructure and
anisotropic swelling behaviour of compacted bentonite/sand mixture. Journal of Rock
Mechanics and Geotechnical Engineering 6(2), 126-132.
Su, Y., Cui, Y. J., Dupla, J. C., and Canou, J. 2020a. Investigation of the effect of water content
on the mechanical behavior of track-bed materials under various coarse grain contents.
Construction and Building Materials, 263, 120206.
Su, Y., Cui, Y. J., Dupla, J. C., Canou, J., and Qi, S. 2020b. A fatigue model for track-bed
materials with consideration of the effect of coarse grain content. Transportation
Geotechnics, 100353.
Su, Y., Cui, Y.J., Dupla, J.C., Canou, J., Qi, S. 2020c. Developing a sample preparation
approach to study the mechanical behavior of unsaturated fine/coarse soil mixture.
Geotechnical Testing Journal. https://doi.org/10.1520/GTJ20190450
Su, Y., Cui, Y. J., Dupla, J. C., and Canou, J. 2021. Effect of water content on resilient modulus
and damping ratio of fine/coarse soil mixture with varying coarse grain contents.
Transportation Geotechnics, 100452.
Sun, W. J., and Cui, Y. J. 2020. Determining the soil-water retention curve using mercury
intrusion porosimetry test in consideration of soil volume change. Journal of Rock
Mechanics and Geotechnical Engineering, 12(5), 1070-1079.
Trinh, V. N. 2011. Comportement hydromécanique des matériaux constitutifs de plateformes
ferroviaires anciennes. PhD Thesis, Ecole Nationale des Ponts et Chaussées, Université
Paris-Est.
van Genuchten, M. T. 1980. A closed‐form equation for predicting the hydraulic conductivity
of unsaturated soils. Soil science society of America journal, 44(5), 892-898.
Wang, Q., Cui, Y. J., Tang, A. M., Xiang-Ling, L., and Wei-Min, Y. 2014. Time-and density-
dependent microstructure features of compacted bentonite. Soils and Foundations, 54(4),
657-666.
Chapter Ⅱ. Water retention behavior of soil mixture
69
Wang, H. L., Cui, Y. J., Lamas-Lopez, F., Dupla, J. C., Canou, J., Calon, N., ... and Chen, R. P.
2017. Effects of inclusion contents on resilient modulus and damping ratio of unsaturated
track-bed materials. Canadian Geotechnical Journal, 54(12), 1672-1681.
Wang, H.L., Cui, Y.J., Lamas-Lopez, F., Calon, N., Saussine, G., Dupla, J.C., Canou, J.,
Aimedieu, P. and Chen, R.P. 2018. Investigation on the mechanical behavior of track-bed
materials at various contents of coarse grains. Construction and Building Materials, 164,
pp.228-237.
Zhang, F., Cui, Y. J., and Ye, W. M. 2018. Distinguishing macro-and micro-pores for materials
with different pore populations. Géotechnique Letters, 8(2), 102-110.
Zeng, Z., Cui, Y. J., Conil, N., and Talandier, J. 2020. Experimental study on the aeolotropic
swelling behaviour of compacted bentonite/claystone mixture with axial/radial
technological voids. Engineering Geology, 278, 105846.

Chapter Ⅲ. Mechanical behavior of soil mixture under monotonic loading
70
CHAPTER Ⅲ. MECHANICAL BEHAVIOR OF SOIL
MIXTURE UNDER MONOTONIC LOADING
Field observation showed that with respect to rainfall and evaporation, water content varied in
the interlayer soil. For fine soil fraction, different compaction water contents led to different
microstructures of fine soil, and thus different mechanical behaviors. In addition, for a soil
compacted at a given water content, the further variation of water content could lead to
significant change of the mechanical behavior of mixture.
The effect of microstructure of fine soil on the mechanical behavior of mixture was studied.
The microstructure of fine soil was investigated by mercury intrusion porosimetry tests, and its
effect on the mechanical behavior of mixture was examined by monotonic triaxial tests. The
results showed that for the fine matrix macrostructure of mixture, a strong microstructure effect
of fine soil on the overall mechanical behavior of mixture was identified. On the contrary, for
the coarse grain skeleton fabric, a very limited microstructure effect was observed. These results
were presented in a paper published in Geotechnical Testing Journal.
The effect of water content on the mechanical behavior of mixture was investigated by
monotonic triaxial tests. Varying water contents of fine soil wf, coarse grain contents fv and
confining pressures were considered. The results showed that variations of maximum deviator
stress, elastic modulus, friction angle and dilatancy angle with fv followed a bi-linear mode,
defining a characteristic coarse grain content fv-cha at a given water content: fv-cha ≈ 25%, 29%
and 33% for wf = 17.6%, 10.6% and 7.0%, respectively. The increase of fv-cha with the decrease
of wf was attributed to the shrinkage property of fine soil. This part corresponded to a paper
published in Construction and Building Materials.
Chapter Ⅲ. Mechanical behavior of soil mixture under monotonic loading
71
Su, Y., Cui, Y. J., Dupla, J. C., Canou, J., & Qi, S. 2021. Geotechnical Testing Journal, 44(4).
Developing a sample preparation approach to study the mechanical
behaviour of unsaturated fine/coarse soil mixture
Yu Su1, Yu-Jun Cui1, Jean-Claude Dupla1, Jean Canou1, Shuai Qi1,2
Abstract:An interlayer soil was identified in the conventional French railway substructure,
corresponding to a mixture of fine soils and coarse grains. As the overall mechanical behaviour
of the interlayer soil can be conditioned by the microstructure of the fine soils, for the laboratory
testing, it is important to develop an appropriate protocol for the sample preparation by
compaction, which allows this microstructure effect to be minimised. In this study, two sample
preparation approaches were considered for a fine/coarse mixture, with two distinct volumetric
contents of coarse grains fv (volumetric ratio of coarse grain to total sample). The microstructure
of fine soils was investigated using mercury intrusion porosimetry, and its effect on the overall
mechanical behaviour was examined through monotonic triaxial tests. Results showed that
while compacted dry of optimum, the fine soils exhibited a bi-modal porosity microstructure.
By contrast, while compacted wet of optimum, the fine soils exhibited a uni-modal porosity
microstructure. When fv = 10%, the sample was characterised by a fine matrix macrostructure
with coarse grains floating in it. In that case, strong effect of the microstructure of fine soils on
the overall mechanical behaviour was identified. On the contrary, when fv = 35%, the sample
was characterised by a coarse grain skeleton. In that case, very limited microstructure effect of
fine soils on the overall mechanical behaviour was observed. Thus, while preparing samples of
unsaturated fine/coarse soil mixture by compaction to study the overall mechanical behaviour,
it is important to account for the fv value. At low fv, the compaction at different water contents
is to be avoided because of the significant effect of microstructure of fines. On the contrary, at
high fv, the samples at different water contents can be prepared by compacting the mixture at
the desired water contents.
Keywords: interlayer soils; volumetric contents of coarse grains; microstructure; compaction;
shear strength
Introduction
Most French conventional railway tracks were constructed by putting ballast directly on the
subgrade. Due to the penetration of ballast and subgrade under the effect of train circulation
over years, an interlayer of ballast/subgrade soil was created. Considering its high dry density
(2.4 Mg/m3) and high bearing capacity (Trinh 2011), the French railway company (SNCF)
decided to keep it as part of the substructure in the national track renewal program (Cui et al.
2014).
1Ecole des Ponts ParisTech, Laboratoire Navier/CERMES, 6 – 8 av. Blaise Pascal, Cité Descartes, Champs-sur-
Marne, 77455 Marne – la – Vallée cedex 2, France 2Zhejiang University, Dept. of Civil Engineering, 38 Zheda Road, Hangzhou 310027, China
Chapter Ⅲ. Mechanical behavior of soil mixture under monotonic loading
72
The coarse grains in the interlayer soil were not uniformly distributed, with a content decreasing
over depth. For the upper part, the effects of fine content and water content were studied by
monotonic and cyclic triaxial tests (Trinh et al. 2012; Cui et al. 2013, 2014; Duong et al. 2013,
2014, 2016; Lamas-Lopez et al. 2015, 2016). In order to extend the study to the whole interlayer,
Wang et al. (2017, 2018a, 2018b) and Qi et al. (2020) worked on compacted fine/coarse soil
mixture at different volumetric contents of coarse grains, fv (volumetric ratio of coarse grain to
total sample). Results revealed that there was a characteristic fv-cha value, below which the
mixture was characterised by a fine matrix with coarse grains floating in it, while beyond which
the mixture was characterised by a coarse grain skeleton.
It is worth noting that in the previous studies, the fine soil state was fixed at the optimum water
content and maximum dry density in order to fix the soil suction for all samples. This is
obviously not the case in field conditions where suction varies with variations of water content.
Thus, it is important to extend the study to the effect of water content. A challenging question
arises in that case for the preparation of samples: may the samples be prepared by directly
compacting the mixture at different desired water contents?
Previous studies revealed significant difference in microstructure of fine-grained soils
compacted at different remolding water contents and the strong effect of soil microstructure on
the overall hydro-mechanical behaviour of fine-grained soils. Through scanning electron
microscope (SEM) and mercury intrusion porosimetry (MIP), a bi-modal porosity
microstructure with well-developed aggregates was observed on the dry side of optimum, while
a uni-modal porosity microstructure characterised by a global fine matrix was identified on the
wet side of optimum (Diamond et al. 1970; Delage et al. 1996). The plastic limit wp (or PL) can
be considered as the critical water content separating the aggregate microstructure from matrix
microstructure (Ahmed et al. 1974). For the bi-modal porosity microstructure, changes in inter-
aggregate voids were dominant during compression, while changes in intra-aggregate pores
were dominant during saturation and drying (Li and Zhang 2009; Zhang and Li 2010; Zhang et
al. 2018a). Through changes of small shear modulus and suction with remolding water content,
Zhang et al. (2018b) found that when the water content was higher than the optimum one, the
total suction controlled the soil stiffness. By contrast, when the water content was lower than
the optimum one, it was the contact surface between aggregates that controlled the soil stiffness.
In this study, in order to address the question about the possible effect of the microstructure of
fine soils on the overall mechanical behaviour of the fine/coarse soil mixture, two different
Chapter Ⅲ. Mechanical behavior of soil mixture under monotonic loading
73
volumetric contents of coarse grains, fv, were considered: 10% and 35%, representing a fine
matrix macrostructure and a coarse grain skeleton microstructure, respectively, according to
Wang et al. (2017, 2018a, 2018b). The target water contents wf for the fine soil were w1 = 11%
(Sr = 62%) and w2 = 16% (Sr = 91%), representing the dry and wet sides of optimum water
content of fine soil (wopt-f = 13.7%), respectively. Two different approaches were adopted to
prepare the samples at the target water contents wf. The first approach was to compact at the
optimum water content of fines wopt-f = 13.7%. Then, the sample was dried or wetted to reach
the target water content wf. The second approach was to directly compact the sample at the
target water content wf. Mercury intrusion porosimetry was applied to study the microstructure
of fine soils and monotonic triaxial tests were performed to investigate the overall mechanical
behaviour. The results obtained allowed the effect of sample preparation on the overall
mechanical behaviour to be clarified for unsaturated fine/coarse soil mixtures.
Materials and methods
Sample preparation approaches
The materials used by Wang et al. (2018a) were adopted in this study: nine different commercial
soils were mixed to constitute the fine soils (Fig. 1) and micro-ballast (Fig. 2) was prepared
using three granular soils by following the similitude method (Wang et al. 2018a). The
reconstituted fine soil and micro-ballast can be observed in Fig. 3. The values of specific gravity
Gs of fine soil and micro-ballast were 2.68 and 2.67, respectively. The liquid limit and plasticity
index of the fine soils are 32% and 20%, respectively (Fig. 4). The standard proctor compaction
curve was determined following ASTM D698-12, Standard test methods for laboratory
compaction characteristics of soil using standard effort (12 400 ft-lbf/ft3 (600 kN-m/m3)), for
the reconstituted fine soils (Fig. 5), defining an optimum water content wopt-f = 13.7% and a
maximum dry density ρdmax-f = 1.82 Mg/m3.
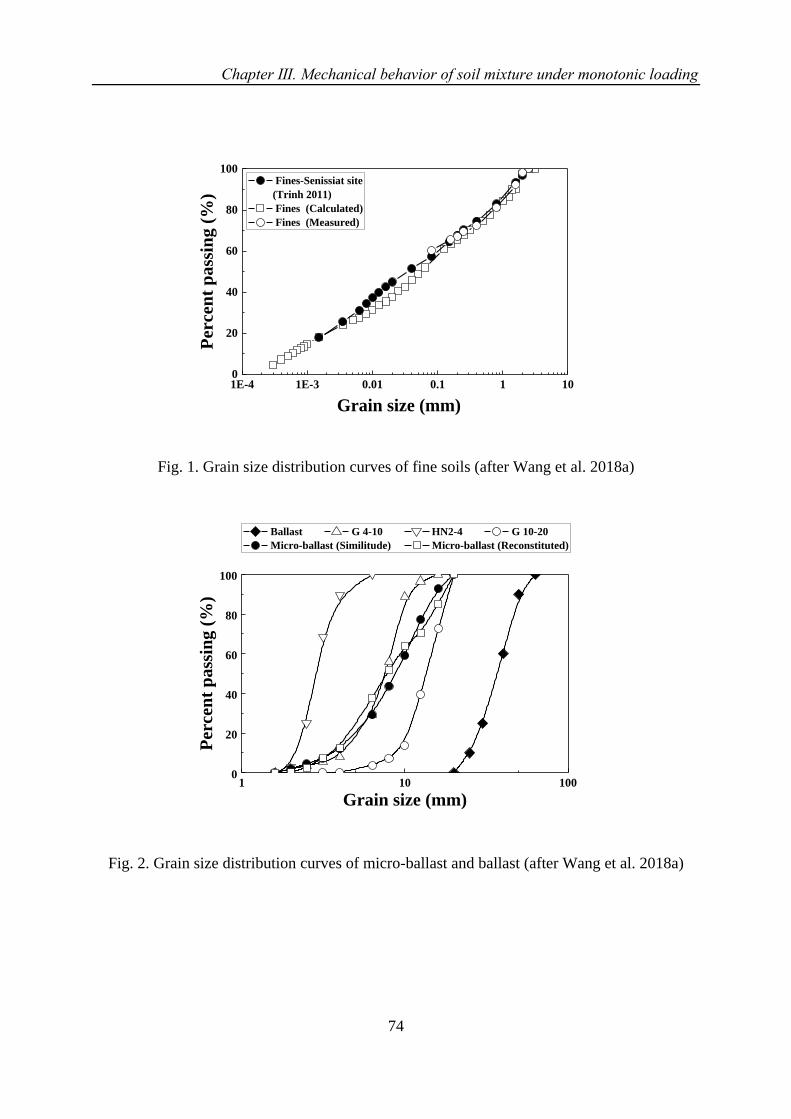
Chapter Ⅲ. Mechanical behavior of soil mixture under monotonic loading
74
1E-4 1E-3 0.01 0.1 1 100
20
40
60
80
100 Fines-Senissiat site
(Trinh 2011)
Fines (Calculated)
Fines (Measured)
Percen
t p
ass
ing
(%
)
Grain size (mm)
Fig. 1. Grain size distribution curves of fine soils (after Wang et al. 2018a)
1 10 1000
20
40
60
80
100
Ballast G 4-10 HN2-4 G 10-20
Micro-ballast (Similitude) Micro-ballast (Reconstituted)
Per
cen
t p
ass
ing
(%
)
Grain size (mm)
Fig. 2. Grain size distribution curves of micro-ballast and ballast (after Wang et al. 2018a)
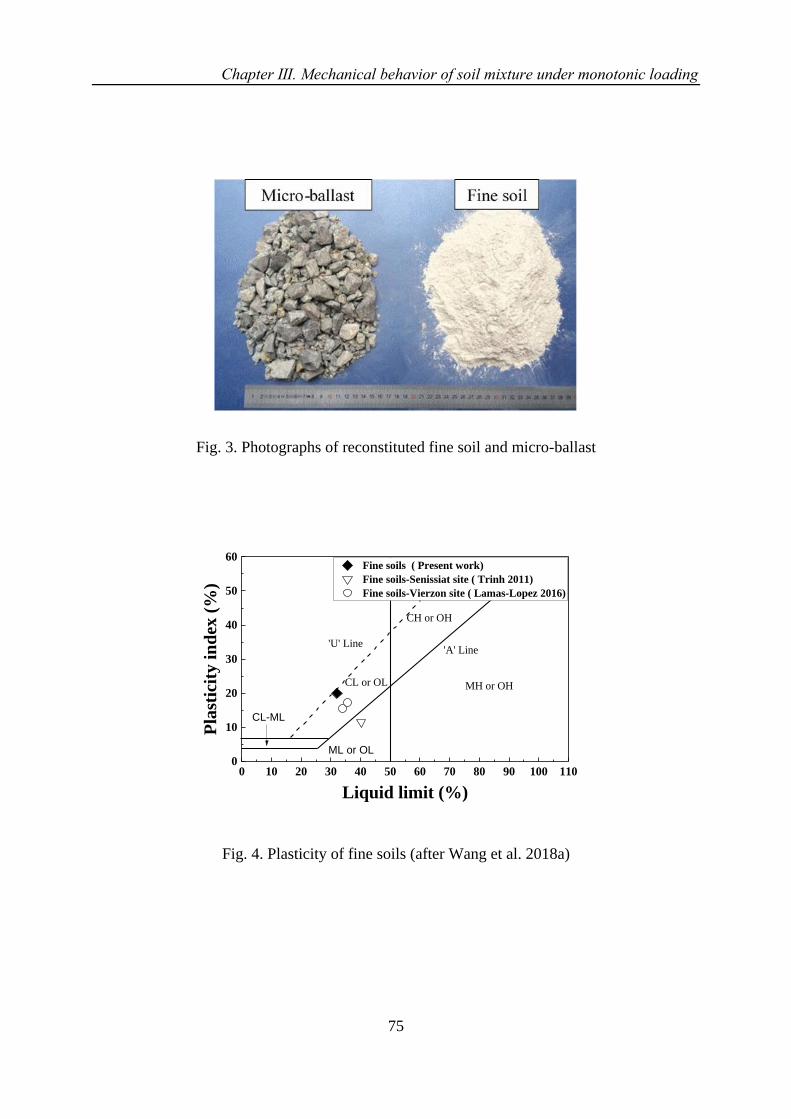
Chapter Ⅲ. Mechanical behavior of soil mixture under monotonic loading
75
Fig. 3. Photographs of reconstituted fine soil and micro-ballast
0 10 20 30 40 50 60 70 80 90 100 1100
10
20
30
40
50
60
'U' Line'A' Line
CH or OH
CL or OL MH or OH
ML or OL
Pla
stic
ity
in
dex
(%
)
Liquid limit (%)
CL-ML
Fine soils ( Present work)
Fine soils-Senissiat site ( Trinh 2011)
Fine soils-Vierzon site ( Lamas-Lopez 2016)
Fig. 4. Plasticity of fine soils (after Wang et al. 2018a)
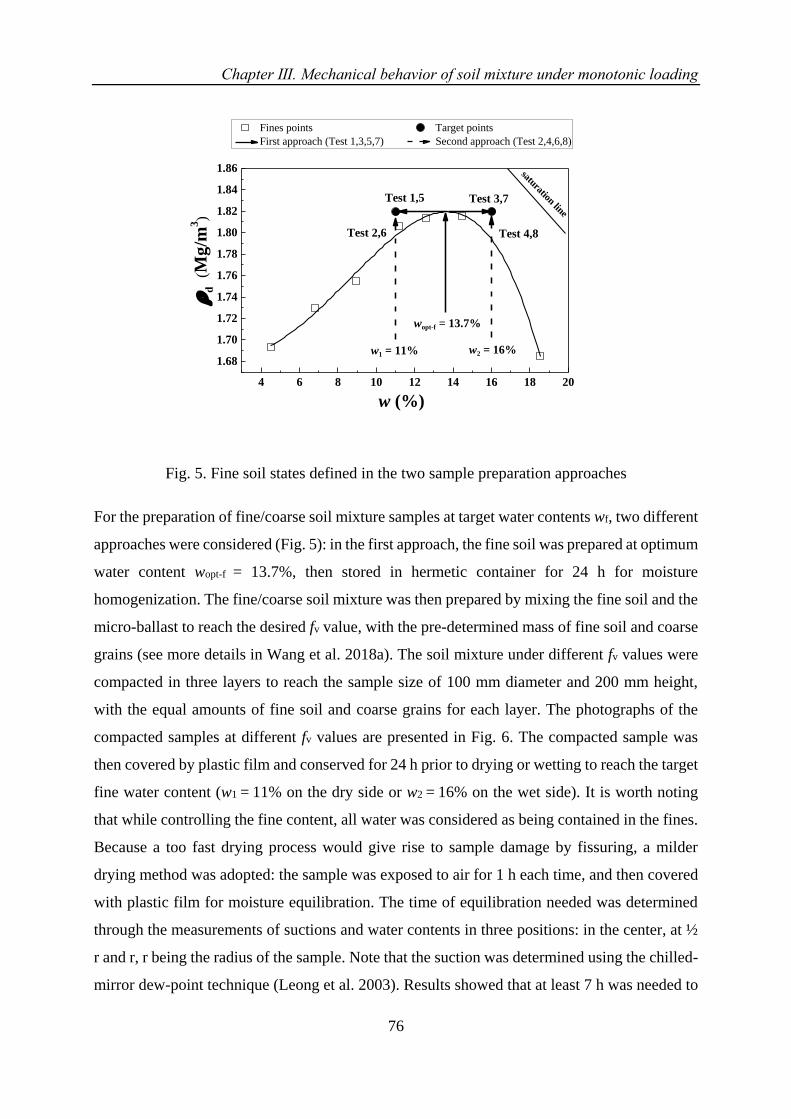
Chapter Ⅲ. Mechanical behavior of soil mixture under monotonic loading
76
4 6 8 10 12 14 16 18 20
1.68
1.70
1.72
1.74
1.76
1.78
1.80
1.82
1.84
1.86
wopt-f = 13.7%
w2 = 16%w1 = 11%
Test 4,8Test 2,6
Test 3,7Test 1,5
d
(Mg
/m3)
w (%)
Fines points Target points
First approach (Test 1,3,5,7) Second approach (Test 2,4,6,8)
saturation line
Fig. 5. Fine soil states defined in the two sample preparation approaches
For the preparation of fine/coarse soil mixture samples at target water contents wf, two different
approaches were considered (Fig. 5): in the first approach, the fine soil was prepared at optimum
water content wopt-f = 13.7%, then stored in hermetic container for 24 h for moisture
homogenization. The fine/coarse soil mixture was then prepared by mixing the fine soil and the
micro-ballast to reach the desired fv value, with the pre-determined mass of fine soil and coarse
grains (see more details in Wang et al. 2018a). The soil mixture under different fv values were
compacted in three layers to reach the sample size of 100 mm diameter and 200 mm height,
with the equal amounts of fine soil and coarse grains for each layer. The photographs of the
compacted samples at different fv values are presented in Fig. 6. The compacted sample was
then covered by plastic film and conserved for 24 h prior to drying or wetting to reach the target
fine water content (w1 = 11% on the dry side or w2 = 16% on the wet side). It is worth noting
that while controlling the fine content, all water was considered as being contained in the fines.
Because a too fast drying process would give rise to sample damage by fissuring, a milder
drying method was adopted: the sample was exposed to air for 1 h each time, and then covered
with plastic film for moisture equilibration. The time of equilibration needed was determined
through the measurements of suctions and water contents in three positions: in the center, at ½
r and r, r being the radius of the sample. Note that the suction was determined using the chilled-
mirror dew-point technique (Leong et al. 2003). Results showed that at least 7 h was needed to

Chapter Ⅲ. Mechanical behavior of soil mixture under monotonic loading
77
reach reasonable equilibrium in terms of suction and water content (Table 1). In the case of
wetting process, 10 g water was sprayed on the sample each time prior to covering it with plastic
film for equilibration. The same equilibration time of at least 7 h was adopted. In the second
approach, water was simply added into the fine soil to reach the target water content w1 = 11%
on the dry side or w2 = 16% on the wet side. Micro-ballast was then added to reach the desired
fv values. The mixture samples were prepared by compaction to reach the size of 100 mm
diameter and 200 mm height.
As shown in Table 2, the first approach was applied to Test 1, Test 3, Test 5, and Test 7, with
all tests duplicated. The second approach was applied to Test 2, Test 4, Test 6, and Test 8, with
only Test 2 duplicated.
Fig. 6. Photographs of samples compacted at wopt-f = 13.7% and under various coarse grain
contents
Table 1. Suction and water content measured at different equilibration times for fine soils
Position
Suction
(MPa)
Water
content (%)
Suction
(MPa)
Water
content
(%)
After 6h After 7h
center 0.33 12.7 0.32 12.9
1/2 r 0.24 13.5 0.35 12.8
r 0.46 13.7 0.33 13.1
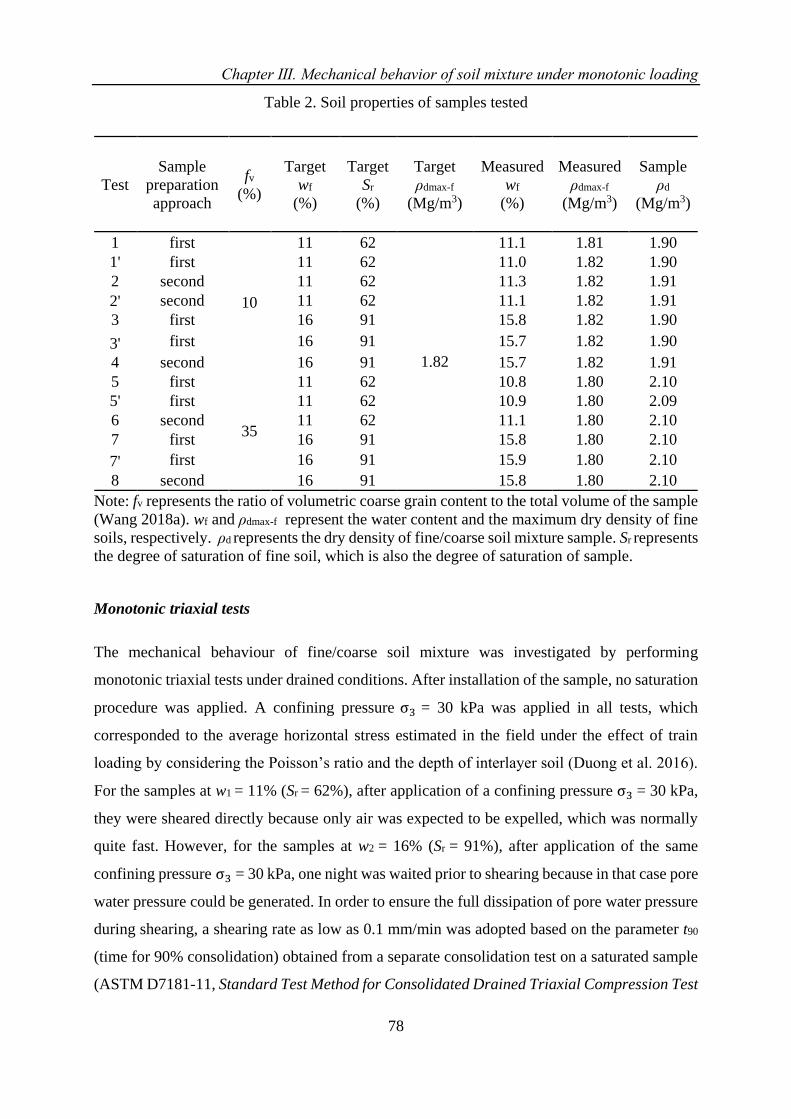
Chapter Ⅲ. Mechanical behavior of soil mixture under monotonic loading
78
Table 2. Soil properties of samples tested
Test
Sample
preparation
approach
fv
(%)
Target
wf
(%)
Target
Sr
(%)
Target
ρdmax-f
(Mg/m3)
Measured
wf
(%)
Measured
ρdmax-f
(Mg/m3)
Sample
ρd
(Mg/m3)
1 first
10
11 62
1.82
11.1 1.81 1.90
1' first 11 62 11.0 1.82 1.90
2 second 11 62 11.3 1.82 1.91
2' second 11 62 11.1 1.82 1.91
3 first 16 91 15.8 1.82 1.90
3' first 16 91 15.7 1.82 1.90
4 second 16 91 15.7 1.82 1.91
5 first
35
11 62 10.8 1.80 2.10
5' first 11 62 10.9 1.80 2.09
6 second 11 62 11.1 1.80 2.10
7 first 16 91 15.8 1.80 2.10
7' first 16 91 15.9 1.80 2.10
8 second 16 91 15.8 1.80 2.10
Note: fv represents the ratio of volumetric coarse grain content to the total volume of the sample
(Wang 2018a). wf and ρdmax-f represent the water content and the maximum dry density of fine
soils, respectively. ρd represents the dry density of fine/coarse soil mixture sample. Sr represents
the degree of saturation of fine soil, which is also the degree of saturation of sample.
Monotonic triaxial tests
The mechanical behaviour of fine/coarse soil mixture was investigated by performing
monotonic triaxial tests under drained conditions. After installation of the sample, no saturation
procedure was applied. A confining pressure σ3 = 30 kPa was applied in all tests, which
corresponded to the average horizontal stress estimated in the field under the effect of train
loading by considering the Poisson’s ratio and the depth of interlayer soil (Duong et al. 2016).
For the samples at w1 = 11% (Sr = 62%), after application of a confining pressure σ3 = 30 kPa,
they were sheared directly because only air was expected to be expelled, which was normally
quite fast. However, for the samples at w2 = 16% (Sr = 91%), after application of the same
confining pressure σ3 = 30 kPa, one night was waited prior to shearing because in that case pore
water pressure could be generated. In order to ensure the full dissipation of pore water pressure
during shearing, a shearing rate as low as 0.1 mm/min was adopted based on the parameter t90
(time for 90% consolidation) obtained from a separate consolidation test on a saturated sample
(ASTM D7181-11, Standard Test Method for Consolidated Drained Triaxial Compression Test
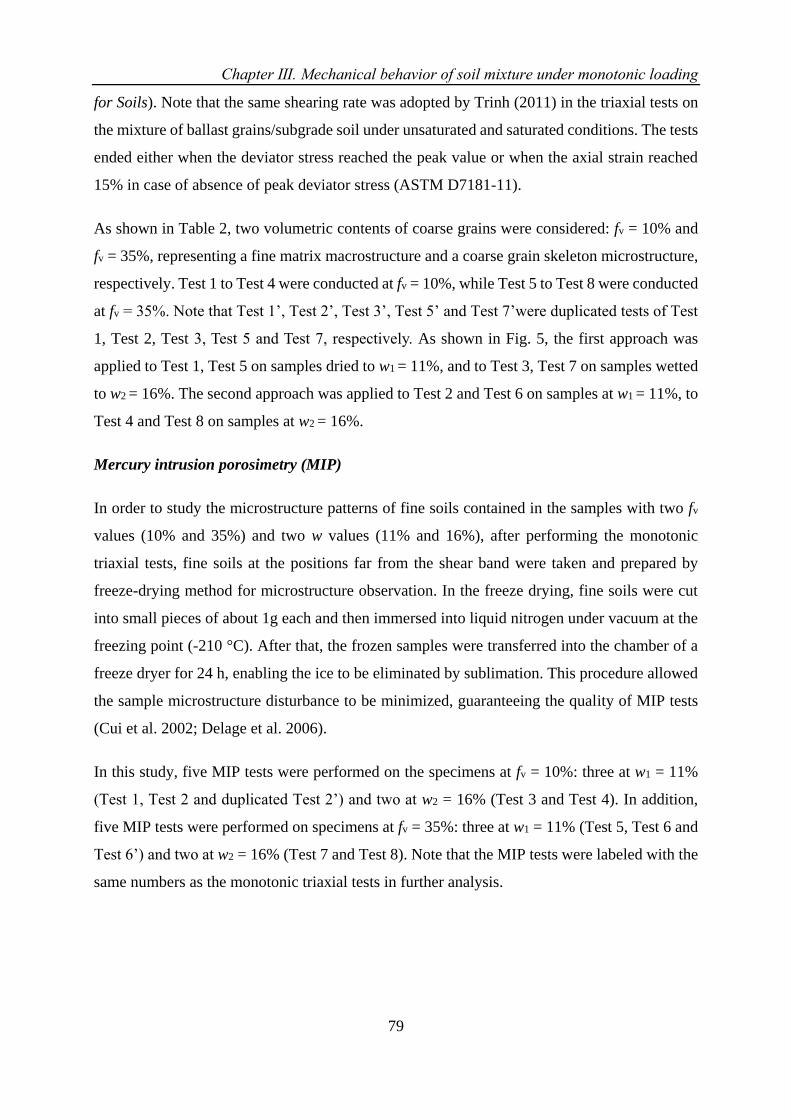
Chapter Ⅲ. Mechanical behavior of soil mixture under monotonic loading
79
for Soils). Note that the same shearing rate was adopted by Trinh (2011) in the triaxial tests on
the mixture of ballast grains/subgrade soil under unsaturated and saturated conditions. The tests
ended either when the deviator stress reached the peak value or when the axial strain reached
15% in case of absence of peak deviator stress (ASTM D7181-11).
As shown in Table 2, two volumetric contents of coarse grains were considered: fv = 10% and
fv = 35%, representing a fine matrix macrostructure and a coarse grain skeleton microstructure,
respectively. Test 1 to Test 4 were conducted at fv = 10%, while Test 5 to Test 8 were conducted
at fv = 35%. Note that Test 1’, Test 2’, Test 3’, Test 5’ and Test 7’were duplicated tests of Test
1, Test 2, Test 3, Test 5 and Test 7, respectively. As shown in Fig. 5, the first approach was
applied to Test 1, Test 5 on samples dried to w1 = 11%, and to Test 3, Test 7 on samples wetted
to w2 = 16%. The second approach was applied to Test 2 and Test 6 on samples at w1 = 11%, to
Test 4 and Test 8 on samples at w2 = 16%.
Mercury intrusion porosimetry (MIP)
In order to study the microstructure patterns of fine soils contained in the samples with two fv
values (10% and 35%) and two w values (11% and 16%), after performing the monotonic
triaxial tests, fine soils at the positions far from the shear band were taken and prepared by
freeze-drying method for microstructure observation. In the freeze drying, fine soils were cut
into small pieces of about 1g each and then immersed into liquid nitrogen under vacuum at the
freezing point (-210 °C). After that, the frozen samples were transferred into the chamber of a
freeze dryer for 24 h, enabling the ice to be eliminated by sublimation. This procedure allowed
the sample microstructure disturbance to be minimized, guaranteeing the quality of MIP tests
(Cui et al. 2002; Delage et al. 2006).
In this study, five MIP tests were performed on the specimens at fv = 10%: three at w1 = 11%
(Test 1, Test 2 and duplicated Test 2’) and two at w2 = 16% (Test 3 and Test 4). In addition,
five MIP tests were performed on specimens at fv = 35%: three at w1 = 11% (Test 5, Test 6 and
Test 6’) and two at w2 = 16% (Test 7 and Test 8). Note that the MIP tests were labeled with the
same numbers as the monotonic triaxial tests in further analysis.
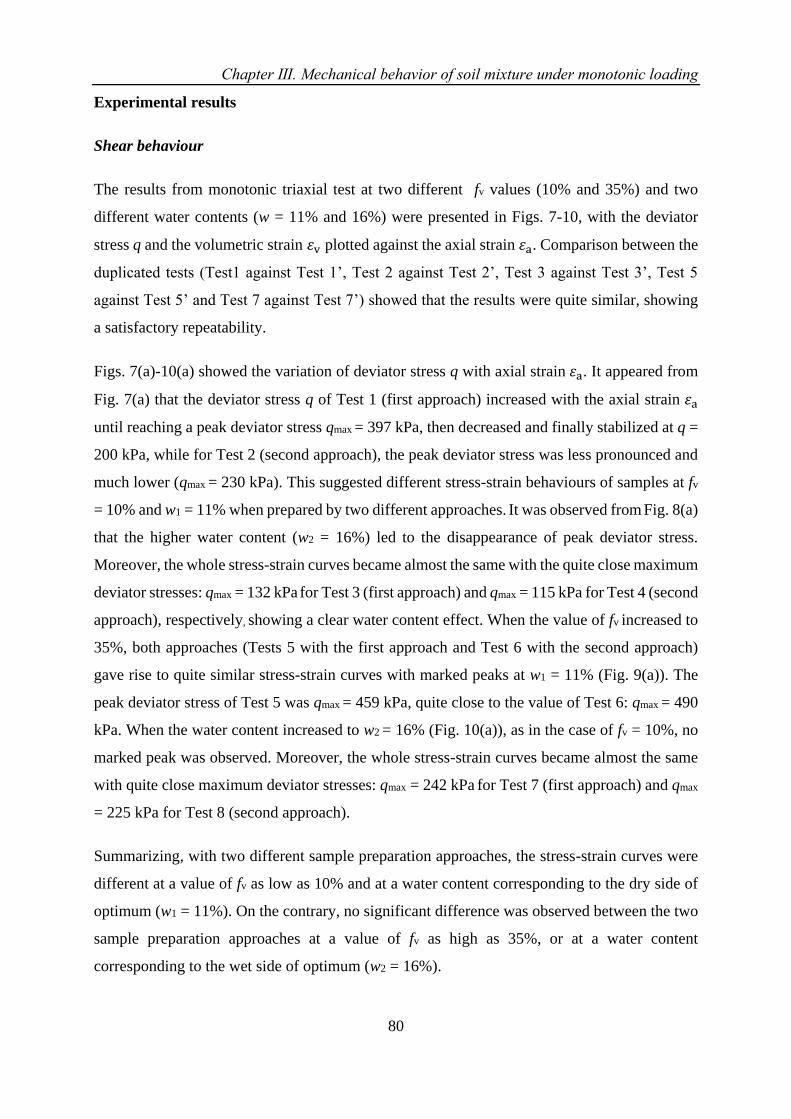
Chapter Ⅲ. Mechanical behavior of soil mixture under monotonic loading
80
Experimental results
Shear behaviour
The results from monotonic triaxial test at two different fv values (10% and 35%) and two
different water contents (w = 11% and 16%) were presented in Figs. 7-10, with the deviator
stress q and the volumetric strain 휀v plotted against the axial strain 휀a. Comparison between the
duplicated tests (Test1 against Test 1’, Test 2 against Test 2’, Test 3 against Test 3’, Test 5
against Test 5’ and Test 7 against Test 7’) showed that the results were quite similar, showing
a satisfactory repeatability.
Figs. 7(a)-10(a) showed the variation of deviator stress q with axial strain 휀a. It appeared from
Fig. 7(a) that the deviator stress q of Test 1 (first approach) increased with the axial strain 휀a
until reaching a peak deviator stress qmax = 397 kPa, then decreased and finally stabilized at q =
200 kPa, while for Test 2 (second approach), the peak deviator stress was less pronounced and
much lower (qmax = 230 kPa). This suggested different stress-strain behaviours of samples at fv
= 10% and w1 = 11% when prepared by two different approaches. It was observed from Fig. 8(a)
that the higher water content (w2 = 16%) led to the disappearance of peak deviator stress.
Moreover, the whole stress-strain curves became almost the same with the quite close maximum
deviator stresses: qmax = 132 kPa for Test 3 (first approach) and qmax = 115 kPa for Test 4 (second
approach), respectively, showing a clear water content effect. When the value of fv increased to
35%, both approaches (Tests 5 with the first approach and Test 6 with the second approach)
gave rise to quite similar stress-strain curves with marked peaks at w1 = 11% (Fig. 9(a)). The
peak deviator stress of Test 5 was qmax = 459 kPa, quite close to the value of Test 6: qmax = 490
kPa. When the water content increased to w2 = 16% (Fig. 10(a)), as in the case of fv = 10%, no
marked peak was observed. Moreover, the whole stress-strain curves became almost the same
with quite close maximum deviator stresses: qmax = 242 kPa for Test 7 (first approach) and qmax
= 225 kPa for Test 8 (second approach).
Summarizing, with two different sample preparation approaches, the stress-strain curves were
different at a value of fv as low as 10% and at a water content corresponding to the dry side of
optimum (w1 = 11%). On the contrary, no significant difference was observed between the two
sample preparation approaches at a value of fv as high as 35%, or at a water content
corresponding to the wet side of optimum (w2 = 16%).

Chapter Ⅲ. Mechanical behavior of soil mixture under monotonic loading
81
Figs. 7(b) -10(b) showed the variation of volumetric strain 휀v with axial strain 휀a. In Fig. 7(b)
for all samples, the volumetric strain 휀v started with a contractancy stage followed by a
dilatancy stage. The dilatancy appeared more pronounced for Test 1, as compared to that of
Test 2. At the higher water content (w2 = 16%) in Fig. 8(b), the first (Test 3) and the second
(Test 4) sample preparation approaches gave rise to quite similar pure contractancy curves,
evidencing a significant water content effect. In the case of fv = 35%, all curves were
characterised by a contractancy stage followed by a dilatancy stage (Figs. 9(b) and 10(b)), with
the dilantancy much larger than that at fv = 10%, in particular in the case of dry side of optimum
(Fig. 9(b)). Moreover, there was little difference between the curves of the first sample
preparation approach and those of the second sample preparation approach: for both dry side
(Fig. 9(b)) and wet side (Fig. 10(b)), the curves were almost the same.
Overall, as for the stress-strain curves, the volumetric strain-axial strain curves also showed
different behaviours at fv = 10% on the dry side of optimum (w1 = 11%), but quite similar
behaviours at fv = 35% or on the wet side of optimum (w2 = 16%).
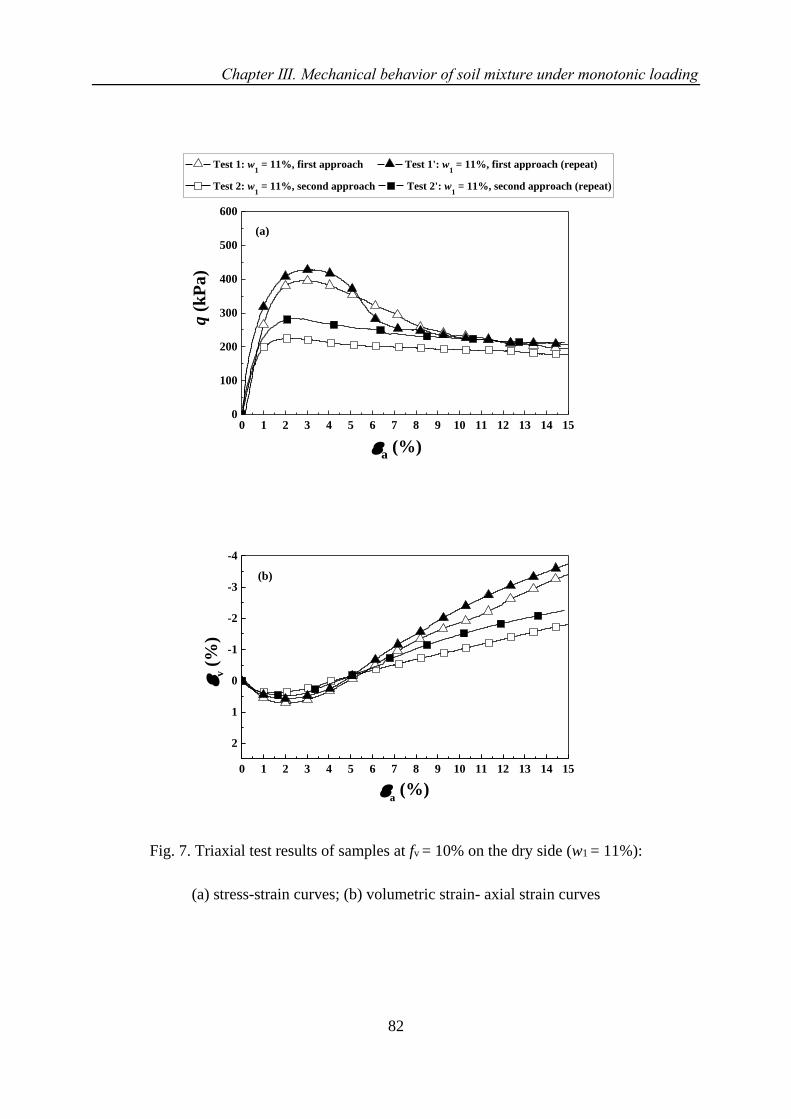
Chapter Ⅲ. Mechanical behavior of soil mixture under monotonic loading
82
0 1 2 3 4 5 6 7 8 9 10 11 12 13 14 150
100
200
300
400
500
600
(a)
a (%)
q (
kP
a)
Test 1: w1 = 11%, first approach Test 1': w
1 = 11%, first approach (repeat)
Test 2: w1 = 11%, second approach Test 2': w
1 = 11%, second approach (repeat)
0 1 2 3 4 5 6 7 8 9 10 11 12 13 14 15
2
1
0
-1
-2
-3
-4
(b)
a (%)
v (
%)
Fig. 7. Triaxial test results of samples at fv = 10% on the dry side (w1 = 11%):
(a) stress-strain curves; (b) volumetric strain- axial strain curves
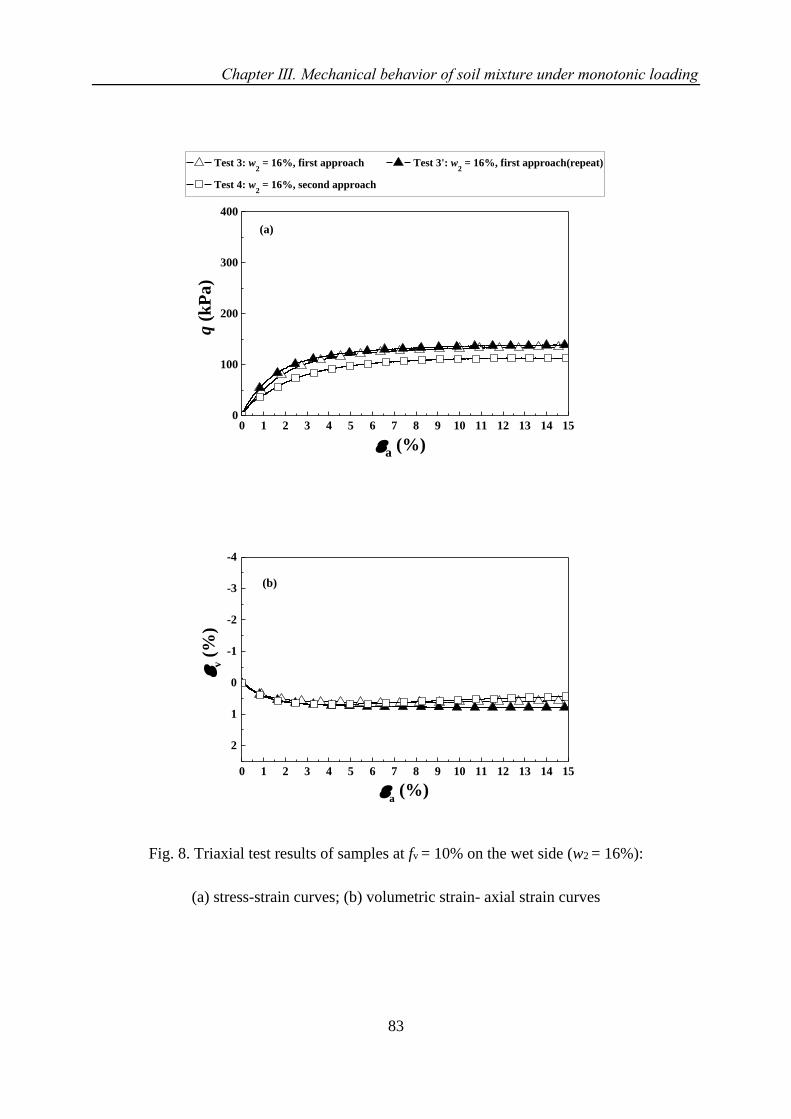
Chapter Ⅲ. Mechanical behavior of soil mixture under monotonic loading
83
0 1 2 3 4 5 6 7 8 9 10 11 12 13 14 150
100
200
300
400q
(k
Pa
)
a (%)
a (%)
a (%)
(a)
Test 3: w2 = 16%, first approach Test 3': w
2 = 16%, first approach(repeat)
Test 4: w2 = 16%, second approach
0 1 2 3 4 5 6 7 8 9 10 11 12 13 14 15
2
1
0
-1
-2
-3
-4
v (
%)
a (%)
(b)
Fig. 8. Triaxial test results of samples at fv = 10% on the wet side (w2 = 16%):
(a) stress-strain curves; (b) volumetric strain- axial strain curves
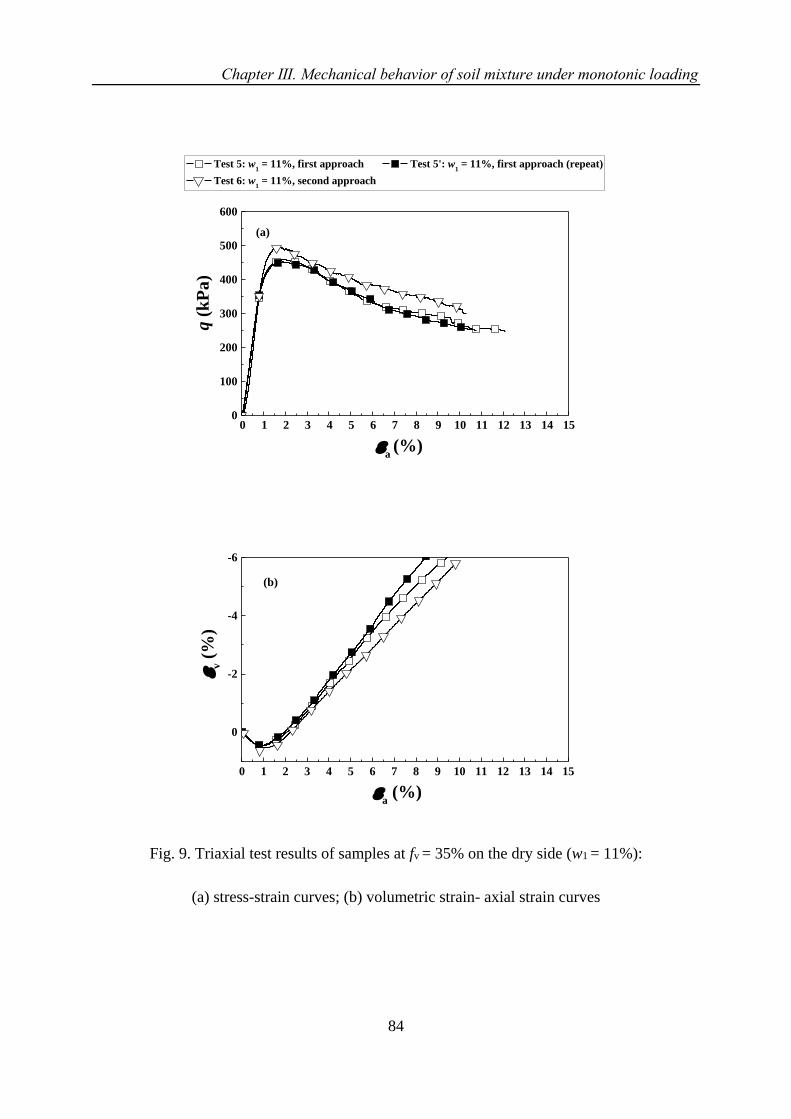
Chapter Ⅲ. Mechanical behavior of soil mixture under monotonic loading
84
0 1 2 3 4 5 6 7 8 9 10 11 12 13 14 150
100
200
300
400
500
600
a (%)
q (
kP
a)
(a)
Test 5: w1 = 11%, first approach Test 5': w
1 = 11%, first approach (repeat)
Test 6: w1 = 11%, second approach
0 1 2 3 4 5 6 7 8 9 10 11 12 13 14 15
0
-2
-4
-6
a (%)
v (
%)
(b)
Fig. 9. Triaxial test results of samples at fv = 35% on the dry side (w1 = 11%):
(a) stress-strain curves; (b) volumetric strain- axial strain curves
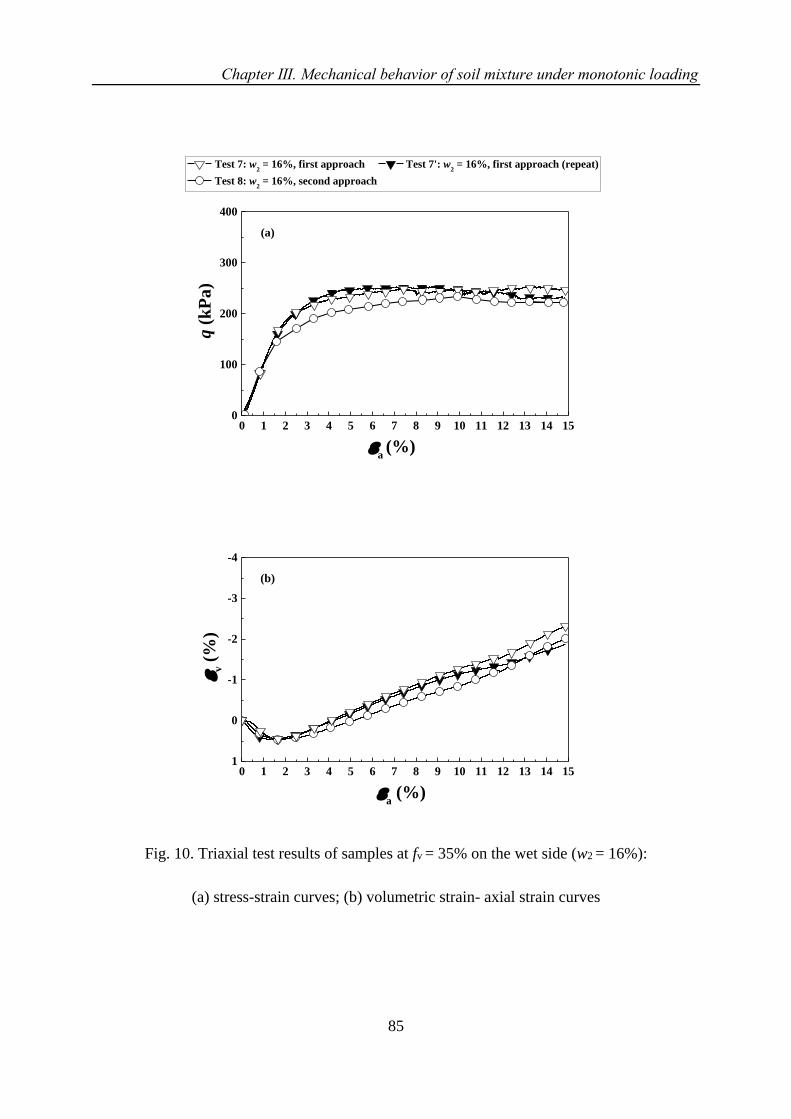
Chapter Ⅲ. Mechanical behavior of soil mixture under monotonic loading
85
0 1 2 3 4 5 6 7 8 9 10 11 12 13 14 150
100
200
300
400
a (%)
q (
kP
a)
(a)
Test 7: w2 = 16%, first approach Test 7': w
2 = 16%, first approach (repeat)
Test 8: w2 = 16%, second approach
0 1 2 3 4 5 6 7 8 9 10 11 12 13 14 151
0
-1
-2
-3
-4
a (%)
v (
%)
(b)
Fig. 10. Triaxial test results of samples at fv = 35% on the wet side (w2 = 16%):
(a) stress-strain curves; (b) volumetric strain- axial strain curves
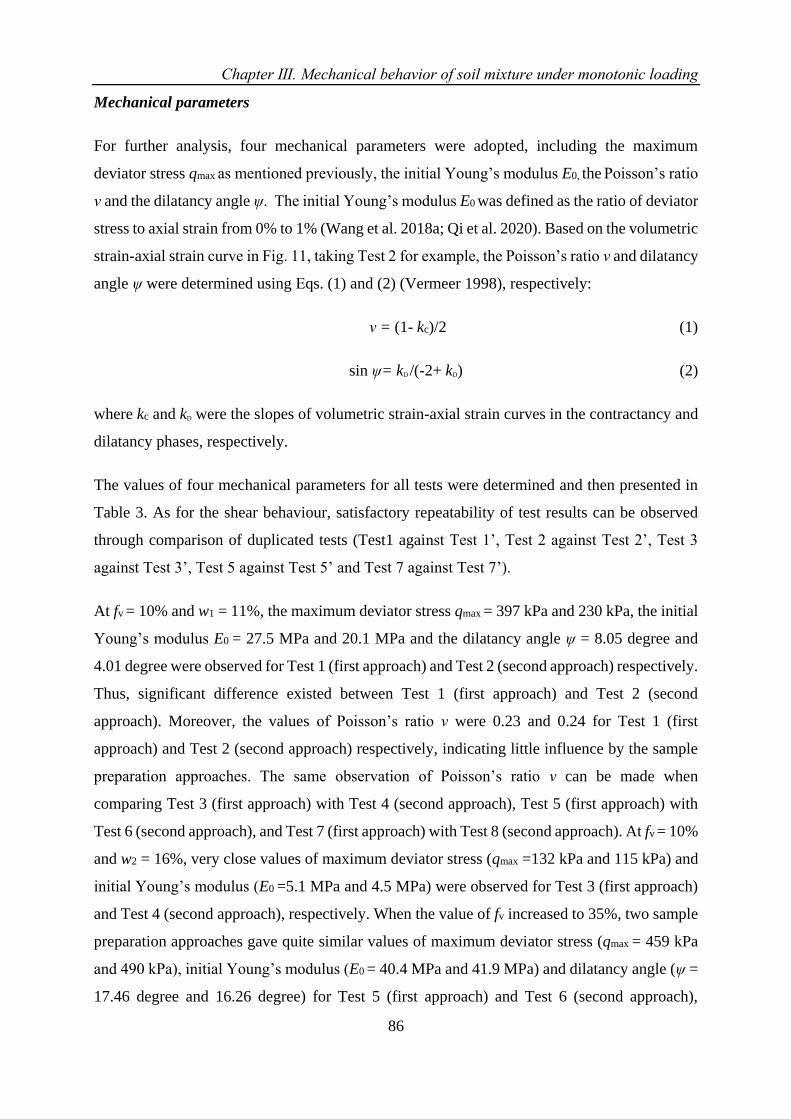
Chapter Ⅲ. Mechanical behavior of soil mixture under monotonic loading
86
Mechanical parameters
For further analysis, four mechanical parameters were adopted, including the maximum
deviator stress qmax as mentioned previously, the initial Young’s modulus E0, the Poisson’s ratio
ν and the dilatancy angle ψ. The initial Young’s modulus E0 was defined as the ratio of deviator
stress to axial strain from 0% to 1% (Wang et al. 2018a; Qi et al. 2020). Based on the volumetric
strain-axial strain curve in Fig. 11, taking Test 2 for example, the Poisson’s ratio ν and dilatancy
angle ψ were determined using Εqs. (1) and (2) (Vermeer 1998), respectively:
ν = (1- kc)/2 (1)
sin ψ= kD /(-2+ kD) (2)
where kc and kD were the slopes of volumetric strain-axial strain curves in the contractancy and
dilatancy phases, respectively.
The values of four mechanical parameters for all tests were determined and then presented in
Table 3. As for the shear behaviour, satisfactory repeatability of test results can be observed
through comparison of duplicated tests (Test1 against Test 1’, Test 2 against Test 2’, Test 3
against Test 3’, Test 5 against Test 5’ and Test 7 against Test 7’).
At fv = 10% and w1 = 11%, the maximum deviator stress qmax = 397 kPa and 230 kPa, the initial
Young’s modulus E0 = 27.5 MPa and 20.1 MPa and the dilatancy angle ψ = 8.05 degree and
4.01 degree were observed for Test 1 (first approach) and Test 2 (second approach) respectively.
Thus, significant difference existed between Test 1 (first approach) and Test 2 (second
approach). Moreover, the values of Poisson’s ratio ν were 0.23 and 0.24 for Test 1 (first
approach) and Test 2 (second approach) respectively, indicating little influence by the sample
preparation approaches. The same observation of Poisson’s ratio ν can be made when
comparing Test 3 (first approach) with Test 4 (second approach), Test 5 (first approach) with
Test 6 (second approach), and Test 7 (first approach) with Test 8 (second approach). At fv = 10%
and w2 = 16%, very close values of maximum deviator stress (qmax =132 kPa and 115 kPa) and
initial Young’s modulus (E0 =5.1 MPa and 4.5 MPa) were observed for Test 3 (first approach)
and Test 4 (second approach), respectively. When the value of fv increased to 35%, two sample
preparation approaches gave quite similar values of maximum deviator stress (qmax = 459 kPa
and 490 kPa), initial Young’s modulus (E0 = 40.4 MPa and 41.9 MPa) and dilatancy angle (ψ =
17.46 degree and 16.26 degree) for Test 5 (first approach) and Test 6 (second approach),

Chapter Ⅲ. Mechanical behavior of soil mixture under monotonic loading
87
respectively. The same observation can be made when comparing Test 7 (first approach) with
Test 8 (second approach).
Overall, two different approaches only led to different values of mechanical parameters at low
fv value (fv = 10%) and on the dry side of optimum (w1 = 11%), which was consistent with the
observation of stress-strain curves and volumetric strain-axial strain curves.
2
1
0
-1
-2
-3
-4
0 1 2 3 4 5 6 7 8 9 10 11 12 13 14 15
Test 2: w1 = 11%, second approach
Slope kD
Slope kC
Dilatancy
v (
%)
a (%)
Contractancy
Fig. 11. Determination of Poisson’s ratio and dilatancy angle
Table 3. Mechanical parameter from triaxial tests
Mechanic
al
parameter
fv = 10% (w1=11%) fv = 10%
(w2=16%)
fv = 35%
(w1=11%)
fv = 35%
(w2=16%) Test 1 Test 1’ Test 2 Test 2’ Test 3 Test 3’ Test 4 Test 5 Test 5’ Test 6 Test 7 Test 7’ Test 8
qmax (kPa) 397 427 230 284 132 135 115 459 451 490 242 230 225
E0 (MPa) 27.5 31.4 20.1 22.5 5.1 5.7 4.5 40.4 40.4 41.9 9.9 9.9 9.8
ν 0.23 0.23 0.24 0.24 0.34 0.33 0.33 0.23 0.23 0.22 0.34 0.32 0.32
ψ (degree) 8.05 8.63 4.01 5.74 / / / 17.46 18.06 16.26 5.34 5.22 4.76
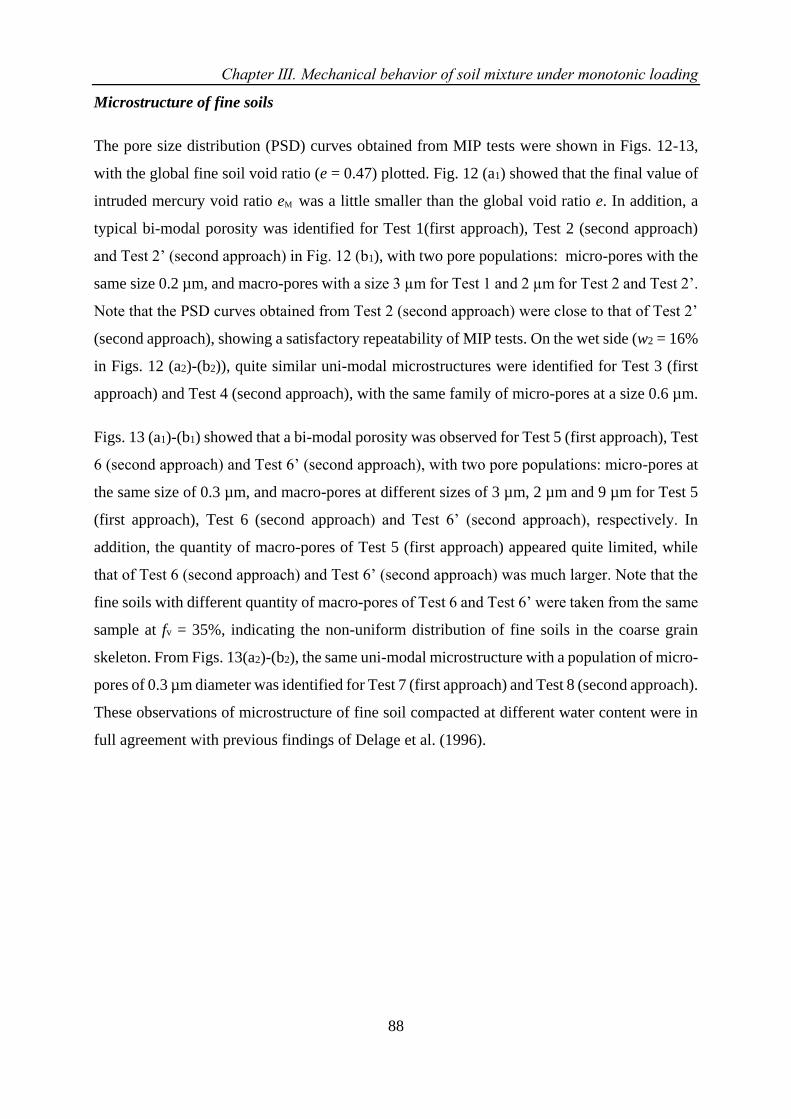
Chapter Ⅲ. Mechanical behavior of soil mixture under monotonic loading
88
Microstructure of fine soils
The pore size distribution (PSD) curves obtained from MIP tests were shown in Figs. 12-13,
with the global fine soil void ratio (e = 0.47) plotted. Fig. 12 (a1) showed that the final value of
intruded mercury void ratio eM was a little smaller than the global void ratio e. In addition, a
typical bi-modal porosity was identified for Test 1(first approach), Test 2 (second approach)
and Test 2’ (second approach) in Fig. 12 (b1), with two pore populations: micro-pores with the
same size 0.2 µm, and macro-pores with a size 3 µm for Test 1 and 2 µm for Test 2 and Test 2’.
Note that the PSD curves obtained from Test 2 (second approach) were close to that of Test 2’
(second approach), showing a satisfactory repeatability of MIP tests. On the wet side (w2 = 16%
in Figs. 12 (a2)-(b2)), quite similar uni-modal microstructures were identified for Test 3 (first
approach) and Test 4 (second approach), with the same family of micro-pores at a size 0.6 µm.
Figs. 13 (a1)-(b1) showed that a bi-modal porosity was observed for Test 5 (first approach), Test
6 (second approach) and Test 6’ (second approach), with two pore populations: micro-pores at
the same size of 0.3 µm, and macro-pores at different sizes of 3 µm, 2 µm and 9 µm for Test 5
(first approach), Test 6 (second approach) and Test 6’ (second approach), respectively. In
addition, the quantity of macro-pores of Test 5 (first approach) appeared quite limited, while
that of Test 6 (second approach) and Test 6’ (second approach) was much larger. Note that the
fine soils with different quantity of macro-pores of Test 6 and Test 6’ were taken from the same
sample at fv = 35%, indicating the non-uniform distribution of fine soils in the coarse grain
skeleton. From Figs. 13(a2)-(b2), the same uni-modal microstructure with a population of micro-
pores of 0.3 µm diameter was identified for Test 7 (first approach) and Test 8 (second approach).
These observations of microstructure of fine soil compacted at different water content were in
full agreement with previous findings of Delage et al. (1996).
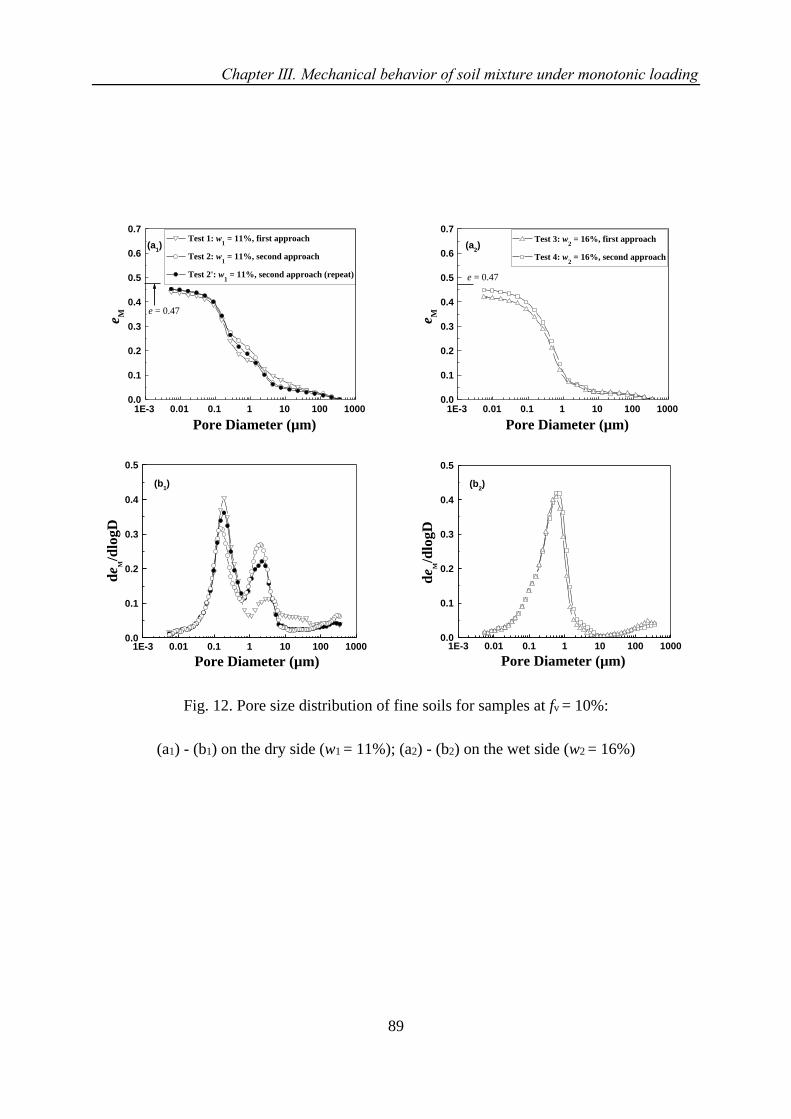
Chapter Ⅲ. Mechanical behavior of soil mixture under monotonic loading
89
1E-3 0.01 0.1 1 10 100 10000.0
0.1
0.2
0.3
0.4
0.5
0.6
0.7
(a1)
e M
Pore Diameter (µm)
Test 1: w1 = 11%, first approach
Test 2: w1 = 11%, second approach
Test 2': w1 = 11%, second approach (repeat)
e = 0.47
1E-3 0.01 0.1 1 10 100 10000.0
0.1
0.2
0.3
0.4
0.5
0.6
0.7
(a2)
e MPore Diameter (µm)
Test 3: w2 = 16%, first approach
Test 4: w2 = 16%, second approach
e = 0.47
0.0
0.1
0.2
0.3
0.4
0.5
1E-3 0.01 0.1 1 10 100 1000
de
M/d
logD
Pore Diameter (µm)
(b1)
0.0
0.1
0.2
0.3
0.4
0.5
1E-3 0.01 0.1 1 10 100 1000
de M
/dlo
gD
Pore Diameter (µm)
(b2)
Fig. 12. Pore size distribution of fine soils for samples at fv = 10%:
(a1) - (b1) on the dry side (w1 = 11%); (a2) - (b2) on the wet side (w2 = 16%)
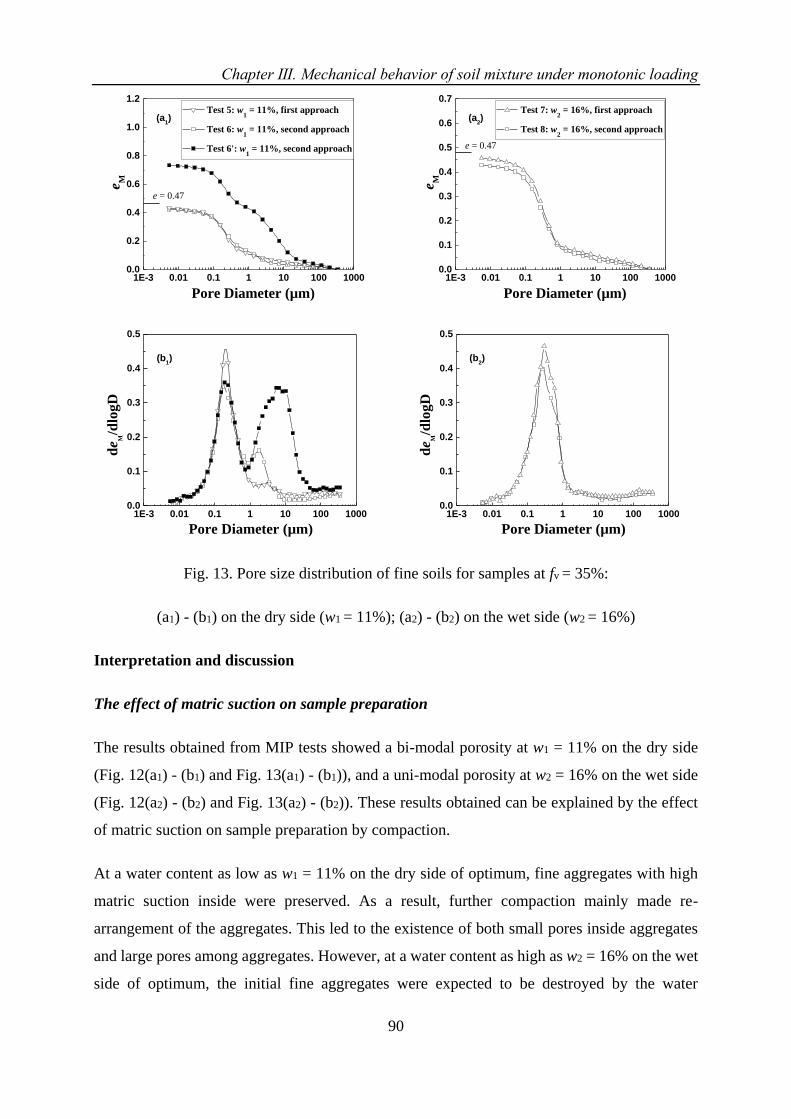
Chapter Ⅲ. Mechanical behavior of soil mixture under monotonic loading
90
1E-3 0.01 0.1 1 10 100 10000.0
0.2
0.4
0.6
0.8
1.0
1.2
(a1)
Pore Diameter (µm)
e M
Test 5: w1 = 11%, first approach
Test 6: w1 = 11%, second approach
Test 6': w1 = 11%, second approach
e = 0.47
1E-3 0.01 0.1 1 10 100 10000.0
0.1
0.2
0.3
0.4
0.5
0.6
0.7
(a2)
Pore Diameter (µm)
eM
Test 7: w2 = 16%, first approach
Test 8: w2 = 16%, second approach
e = 0.47
1E-3 0.01 0.1 1 10 100 10000.0
0.1
0.2
0.3
0.4
0.5
(b1)
Pore Diameter (µm)
de M
/dlo
gD
1E-3 0.01 0.1 1 10 100 10000.0
0.1
0.2
0.3
0.4
0.5
(b2)
Pore Diameter (µm)
de M
/dlo
gD
Fig. 13. Pore size distribution of fine soils for samples at fv = 35%:
(a1) - (b1) on the dry side (w1 = 11%); (a2) - (b2) on the wet side (w2 = 16%)
Interpretation and discussion
The effect of matric suction on sample preparation
The results obtained from MIP tests showed a bi-modal porosity at w1 = 11% on the dry side
(Fig. 12(a1) - (b1) and Fig. 13(a1) - (b1)), and a uni-modal porosity at w2 = 16% on the wet side
(Fig. 12(a2) - (b2) and Fig. 13(a2) - (b2)). These results obtained can be explained by the effect
of matric suction on sample preparation by compaction.
At a water content as low as w1 = 11% on the dry side of optimum, fine aggregates with high
matric suction inside were preserved. As a result, further compaction mainly made re-
arrangement of the aggregates. This led to the existence of both small pores inside aggregates
and large pores among aggregates. However, at a water content as high as w2 = 16% on the wet
side of optimum, the initial fine aggregates were expected to be destroyed by the water
Chapter Ⅲ. Mechanical behavior of soil mixture under monotonic loading
91
hydration or the decrease of matric suction. As a result, a fine matrix structure was expected to
be formed after compaction, leading to a uni-modal pore-size distribution.
At the optimum water content wopt-f = 13.7%, the matric suction inside the fine aggregates was
normally lower than that at w1 = 11%, but high enough to keep certain mechanical resistance of
the aggregates. In other words, the aggregates at wopt-f = 13.7% were expected to be more
deformable than those at w1 = 11%. As a result, under the effect of further compaction, fewer
large pores were produced in the case of wopt-f = 13.7%. When drying from wopt-f = 13.7% to
w1 = 11%, the matric suction was increased and some shrinkage was expected, enlarging the
large pores a little. By contrast, when wetting from wopt-f = 13.7% to w2 = 16%, the matric
suction was decreased and some swelling was expected, decreasing the large pores a little. Even
though some microstructure changes could occur during drying or wetting, it appeared that the
effects of drying or wetting were much less significant than those of the remolded water content
(see Figs. 12-13).
Shear strength of soil mixture and microstructure of fine soils
The results obtained from monotonic triaxial test indicated that the shear strength was different
between Test 1 and Test 2 at fv = 10% and w1 = 11%, with two different sample preparation
approaches. On the contrary, no marked difference of shear strength was observed between Test
3 and Test 4 at fv = 10% and w2 = 16%, even though the sample preparation approaches were
also different. Moreover, quite similar shear strength was identified for Test 5 and Test 6 and
for Test 7 and Test 8 at fv = 35%, whatever the water content values (dry side or wet side).
Wang et al. (2018a) showed that at fv = 10% (smaller than the characteristic value fv-cha ≈ 27%),
the fine/coarse soil mixture was characterized by a fine matrix macrostructure with coarse
grains floating in it. By contrast, at fv = 35% (larger than fv-cha ≈ 27%), the mixture was
characterized by a coarse grain skeleton microstructure. As a consequence, the shear strength
of Test 1 to Test 4 at fv = 10% was governed by the fine soils. In that case, the changes of
microstructure of fine soils with compaction water content greatly affected the overall
mechanical behaviours. On the dry side, bi-modal porosity existed in the samples (Test 1 and
Test 2 in Fig. 12(b1)), corresponding to the micro-pores within aggregates (intra-aggregate pores)
and the macro-pores between aggregates (inter-aggregate pores). In that case, the inter-
aggregate pores played an important role in the structure of fine soils and the assembly of
aggregates governed the soil stiffness. Since the quantity of inter-aggregate pores for Test 2 was
Chapter Ⅲ. Mechanical behavior of soil mixture under monotonic loading
92
much larger than that of Test 1 (Fig. 12 (b1)), less pronounced peak deviator stress was identified
for Test 2 (qmax = 230 kPa) as compared to Test 1 (qmax = 397 kPa) in Fig. 7. The similar
observation was made by Zhang et al. (2018b) on the stiffness of fine soils with different
remolding water contents: the inter-aggregate pores dominated the soil microstructure on the
dry side of Proctor optimum. With the increase of water content, the increase of inter-aggregate
contact surface gave rise to the increase of maximum shear modulus Gmax or soil stiffness.
Vanapalli et al. (1996a, 1996b) also found the effect of inter-aggregate contact surface on
unsaturated shear strength of compacted glacier till. The results showed that for a given matrix
suction, the specimens prepared at higher water content have larger shear strength. In addition,
it has been reported by several investigators that the unsaturated shear strength and soil-water
retention curves were dependent on soil microstructure which was in turn dependent on the
remolding water content (Delage et al. 1996; Vanapalli et al. 1996a, 1996b; Birle et al. 2008).
By contrast, on the wet side (w2 = 16%), all aggregates were destroyed and a uni-modal porosity
was usually observed (Test 3 and Test 4 in Fig. 12(b2)). Thus, quite similar global mechanical
behaviours were expected (Fig. 8).
When the value of fv became 35%, higher than fv-cha ≈ 27%, the soil microstructure was rather
characterised by a coarse grain skeleton. Thus, the mechanical responses in Test 5 to Test 8 at
fv = 35% were expected to be governed by the coarse grains skeleton (Figs. 9-10), whatever the
microstructure of fines – bi-modal for Test 5 and Test 6 at w1 = 11% (Figs. 13(a1) - (b1)) and
uni-modal for Test 7 and Test 8 at w2 = 16% (Figs. 13(a2) - (b2)). Indeed, the same shear
behaviours were observed from Test 5 and Test 6 at w1 = 11% shown in Fig. 9, and the same
shear behaviours were observed from Test 7 and Test 8 at w2 = 16% shown in Fig. 10.
Distribution of fine soils
Comparison of the PSD curves between Test 6 and Test 6’ at fv = 35% (Figs. 13(a1) - (b1))
showed that they were not the same, even though both were of bi-modal nature. For further
analysis, the PSD curve of Test 2 at fv = 10% was put together with those of Test 6 and Test 6’
at fv = 35% in Figs. 14(a) - (b). It appeared that the PSD curve of Test 6’ was characterised by
a larger value of intruded mercury void ratio (eM = 0.72) and a larger quantity of macro-pores,
as compared with that of Test 6. The quantity of macro-pores of Test 2 was between those of
Test 6 and Test 6’. This suggested two categories of fine soils in the coarse grains skeleton
structure (fv = 35%), namely dense fine soils in-between coarse grains (Test 6) and loose fine
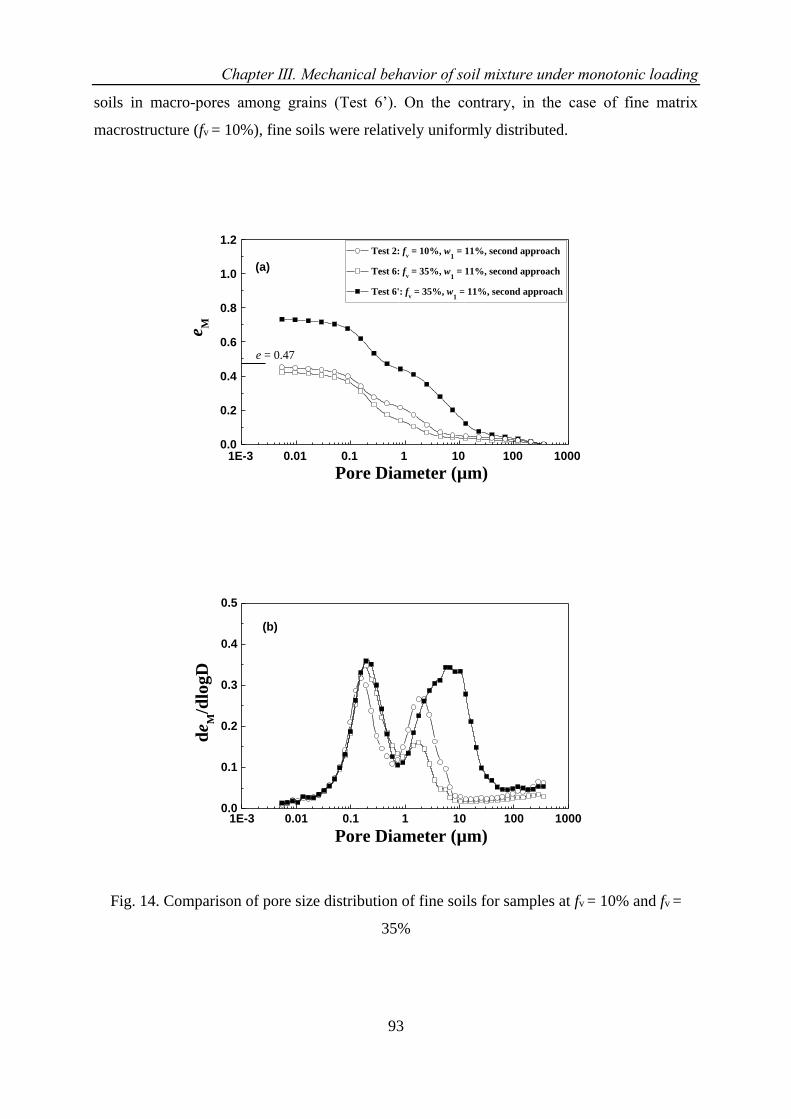
Chapter Ⅲ. Mechanical behavior of soil mixture under monotonic loading
93
soils in macro-pores among grains (Test 6’). On the contrary, in the case of fine matrix
macrostructure (fv = 10%), fine soils were relatively uniformly distributed.
1E-3 0.01 0.1 1 10 100 10000.0
0.2
0.4
0.6
0.8
1.0
1.2
(a)
e M
Pore Diameter (µm)
Test 2: fv = 10%, w
1 = 11%, second approach
Test 6: fv = 35%, w
1 = 11%, second approach
Test 6': fv = 35%, w
1 = 11%, second approach
e = 0.47
1E-3 0.01 0.1 1 10 100 10000.0
0.1
0.2
0.3
0.4
0.5
(b)
de
M/d
log
D
Pore Diameter (µm)
Fig. 14. Comparison of pore size distribution of fine soils for samples at fv = 10% and fv =
35%
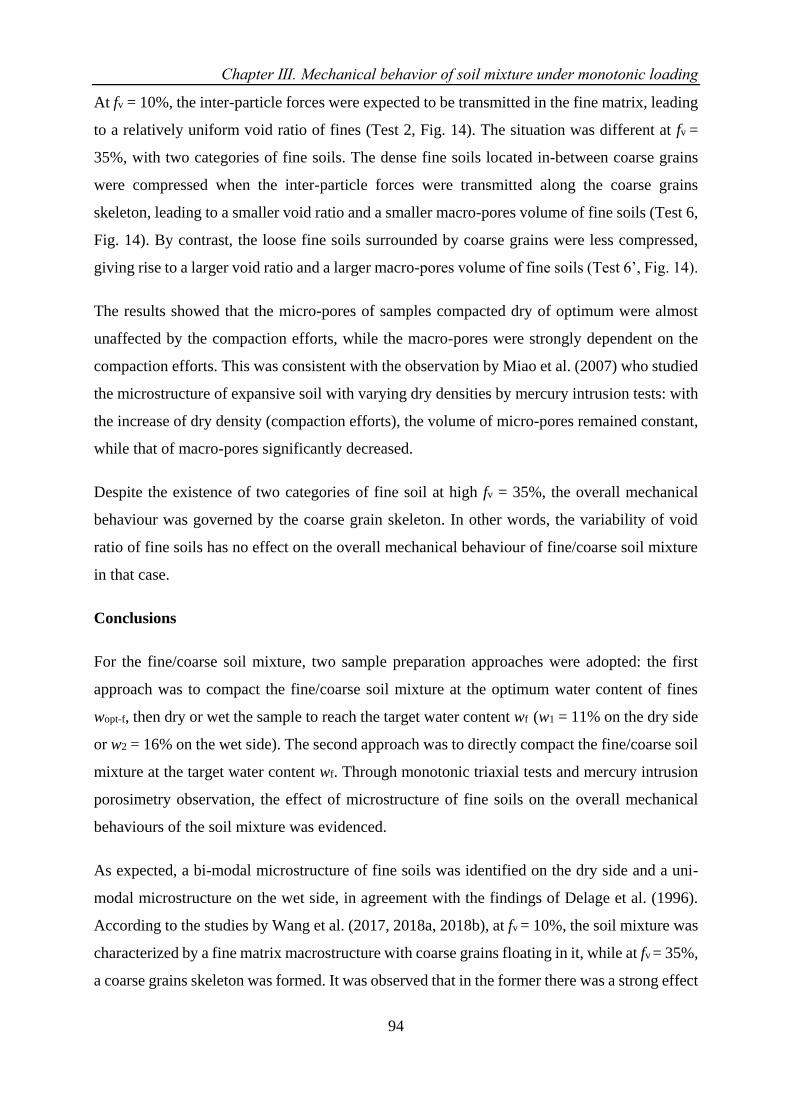
Chapter Ⅲ. Mechanical behavior of soil mixture under monotonic loading
94
At fv = 10%, the inter-particle forces were expected to be transmitted in the fine matrix, leading
to a relatively uniform void ratio of fines (Test 2, Fig. 14). The situation was different at fv =
35%, with two categories of fine soils. The dense fine soils located in-between coarse grains
were compressed when the inter-particle forces were transmitted along the coarse grains
skeleton, leading to a smaller void ratio and a smaller macro-pores volume of fine soils (Test 6,
Fig. 14). By contrast, the loose fine soils surrounded by coarse grains were less compressed,
giving rise to a larger void ratio and a larger macro-pores volume of fine soils (Test 6’, Fig. 14).
The results showed that the micro-pores of samples compacted dry of optimum were almost
unaffected by the compaction efforts, while the macro-pores were strongly dependent on the
compaction efforts. This was consistent with the observation by Miao et al. (2007) who studied
the microstructure of expansive soil with varying dry densities by mercury intrusion tests: with
the increase of dry density (compaction efforts), the volume of micro-pores remained constant,
while that of macro-pores significantly decreased.
Despite the existence of two categories of fine soil at high fv = 35%, the overall mechanical
behaviour was governed by the coarse grain skeleton. In other words, the variability of void
ratio of fine soils has no effect on the overall mechanical behaviour of fine/coarse soil mixture
in that case.
Conclusions
For the fine/coarse soil mixture, two sample preparation approaches were adopted: the first
approach was to compact the fine/coarse soil mixture at the optimum water content of fines
wopt-f, then dry or wet the sample to reach the target water content wf (w1 = 11% on the dry side
or w2 = 16% on the wet side). The second approach was to directly compact the fine/coarse soil
mixture at the target water content wf. Through monotonic triaxial tests and mercury intrusion
porosimetry observation, the effect of microstructure of fine soils on the overall mechanical
behaviours of the soil mixture was evidenced.
As expected, a bi-modal microstructure of fine soils was identified on the dry side and a uni-
modal microstructure on the wet side, in agreement with the findings of Delage et al. (1996).
According to the studies by Wang et al. (2017, 2018a, 2018b), at fv = 10%, the soil mixture was
characterized by a fine matrix macrostructure with coarse grains floating in it, while at fv = 35%,
a coarse grains skeleton was formed. It was observed that in the former there was a strong effect
Chapter Ⅲ. Mechanical behavior of soil mixture under monotonic loading
95
of microstructure of fine soils on the overall mechanical behaviour of the fine/coarse soil
mixture, while in the latter case the effect of microstructure of fine soils became quite limited.
Moreover, it was found that at fv = 35%, the microstructures of fine soil were not uniform, with
dense fines in-between coarse grains and loose fines surrounded by coarse grains.
Therefore, to minimize the effect of microstructure of fine soils on the overall mechanical
behaviour of soil mixture during sample preparation, at low fv with the macrostructure defined
by fine matrix, only the first sample preparation approach can be adopted for the dry side but
the two approaches can be adopted for the wet side. On the contrary, at high fv with the
microstructure defined by coarse grains skeleton, the two sample preparation approaches can
be adopted, whatever the remolded water content. However, this conclusion is valid only when
the mechanical behaviour is addressed. It is anticipated that the hydraulic behaviour must be
significantly different between dry and wet samples, whatever the fv values, because of the
different microstructures created while compacting at different water contents.
It is worth noting that to some extent the obtained results can be helpful in evaluating the effect
of the formation process on the global mechanical behavior for the interlayer soil or the fouled
ballast.
Acknowledgements
This work was supported by the China Scholarship Council (CSC) and Ecole des Ponts
ParisTech.
Chapter Ⅲ. Mechanical behavior of soil mixture under monotonic loading
96
References
Ahmed, S., C. W. Lovell, & S. Diamond. 1974. Pore sizes and strength of compacted
clay. Journal of the Geotechnical Engineering Division, ASCE, 100 (GT4): 407-425
ASTM International. 2011. Standard Test Method for Consolidated Drained Triaxial
Compression Test for Soils. ASTM D7181-11. West Conshohocken, PA: ASTM
International approved July 1, 2011. https://doi.org/10.1520/D7181-11
ASTM International. 2012. Standard Test Methods for Laboratory Compaction Characteristics
of Soil Using Standard Effort (12400 ft-lbf/ft3 (600 kN-m/m3)). ASTM D698-12. West
Conshohocken, PA: ASTM International approved June 10, 2000.
https://doi.org/10.1520/D0698-12
Birle, E., D. Heyer and N. Vogt. 2008. Influence of the initial water content and dry density on
the soil–water retention curve and the shrinkage behavior of a compacted clay. Acta
Geotechnica, 3(3), p.191. https://doi.org/10.1007/s11440-008-0059-y.
Cui, Y. J., C. Loiseau, and P. Delage. 2002. Microstructure Changes of a Confined Swelling
Soil Due to Suction Controlled Hydration. In Unsaturated Soils: Proceedings of the Third
International Conference on Unsaturated Soils, UNSAT 2002, 10–13 March 2002, Recife,
Brazil, Vol. 2, edited by J. F. T. Jucá, T. M. P. de Campos, and F. A. M. Marinho, 593–
598. Lisse, the Netherlands: A. A. Balkema.
Cui, Y.J., T.V. Duong, A.M. Tang, , J.C. Dupla, N. Calon, and A. Robinet. 2013. Investigation
of the hydro-mechanical behaviour of fouled ballast. Journal of Zhejiang University
Science A, 14(4), pp.244-255. https://doi.org/10.1631/jzus.A1200337.
Cui, Y.J., F. Lamas-Lopez, V.N. Trinh, N. Calon, S.C. D’aguiar, J.C. Dupla, A.M. Tang, J.
Canou, and A. Robinet. 2014. Investigation of interlayer soil behaviour by field
monitoring. Transportation Geotechnics, 1(3), pp.91-105.
https://doi.org/10.1016/j.trgeo.2014.04.002.
Diamond, S., 1970. Pore size distributions in clays. Clays and clay minerals, 18(1), pp.7-23.
https://doi.org/10.1346/CCMN.1970.0180103.
Delage, P., M. Audiguier, Y.J. Cui, and M.D. Howat. 1996. Microstructure of a compacted
silt. Canadian Geotechnical Journal, 33(1), pp.150-158. https://doi.org/10.1139/t96-030.
Delage, P., D. Marcial, Y.J. Cui, and X. Ruiz. 2006. Ageing effects in a compacted bentonite:
a microstructure approach. Géotechnique, 56(5), pp.291-304.
https://doi.org/10.1680/geot.2006.56.5.291.
Duong, T.V., A.M. Tang, Y.J. Cui, V.N. Trinh, J.C. Dupla, , N. Calon, J. Canou, and A.
Robinet. 2013. Effects of fines and water contents on the mechanical behavior of interlayer
soil in ancient railway sub-structure. Soils and foundations, 53(6), pp.868-878.
https://doi.org/10.1016/j.sandf.2013.10.006.
Chapter Ⅲ. Mechanical behavior of soil mixture under monotonic loading
97
Duong, T.V., Y.J. Cui, A.M. Tang, J.C. Dupla, J. Canou, N. Calon, and A. Robinet. 2014.
Investigating the mud pumping and interlayer creation phenomena in railway sub-
structure. Engineering geology, 171, pp.45-58.
https://doi.org/10.1016/j.enggeo.2013.12.016.
Duong, T.V., Y.J. Cui, A.M. Tang, J.C. Dupla, J. Canou, N. Calon, and A. Robinet. 2016.
Effects of water and fines contents on the resilient modulus of the interlayer soil of railway
substructure. Acta Geotechnica, 11(1), pp.51-59. https://doi.org/10.1007/s11440-014-
0341-0.
Lamas-Lopez, F., d’Aguiar, S. C., Robinet, A., Cui, Y. J., Calon, N., Canou, J., ... & Tang, A.
M. 2015. In-situ investigation of the behaviour of a French conventional railway platform.
Proc., Transportation Research Board TRB 2015.
Lamas-Lopez, F. 2016. Field and laboratory investigation on the dynamic behaviour of
conventional railway track-bed materials in the context of traffic upgrade (Doctoral
dissertation, Paris Est).
Leong, E.C., S. Tripathy, and H. Rahardjo. 2003. Total suction measurement of unsaturated
soils with a device using the chilled-mirror dew-point technique. Geotechnique, 53(2),
pp.173-182. https://doi.org/10.1680/geot.2003.53.2.173.
Li, X. and L.M. Zhang. 2009. Characterization of dual-structure pore-size distribution of
soil. Canadian geotechnical journal, 46(2), pp.129-141. https://doi.org/10.1139/T08-110.
Miao, L., S.L. Houston, Y. Cui, and J. Yuan. 2007. Relationship between soil structure and
mechanical behavior for an expansive unsaturated clay. Canadian Geotechnical
Journal, 44(2), pp.126-137. https://doi.org/10.1139/t06-108.
Qi, S., Y.J. Cui, R.P. Chen, H.L. Wang, , F. Lamas-Lopez, , P. Aimedieu, J.C. Dupla, J.
Canou, and G. Saussine. 2020. Influence of grain size distribution of inclusions on the
mechanical behaviours of track-bed materials. Géotechnique, pp.1-10.
https://doi.org/10.1680/jgeot.18.P.047.
Trinh, V. N. 2011. Comportement hydromécanique des matériaux constitutifs de plateformes
ferroviaires anciennes. PhD Thesis, Ecole Nationale des Ponts et Chaussées, Université
Paris-Est.
Trinh, V.N., A.M. Tang, Y.J. Cui, , J.C. Dupla, J. Canou, N. Calon, L. Lambert, , A. Robinet,
and O. Schoen. 2012. Mechanical characterisation of the fouled ballast in ancient railway
track substructure by large-scale triaxial tests. Soils and foundations, 52(3), pp.511-523.
https://doi.org/10.1016/j.sandf.2012.05.009.
Vanapalli, S.K., D.G. Fredlund, D.E. Pufahl, and A.W. Clifton, 1996a. Model for the prediction
of shear strength with respect to soil suction. Canadian Geotechnical Journal, 33(3),
pp.379-392. https://doi.org/10.1139/t96-060.
Vanapalli, S.K., D.G. Fredlund, D.E. Pufahl. 1996b. The relationship between the soil-water
characteristic curve and the unsaturated shear strength of a compacted glacial
till. Geotechnical Testing Journal, 19(3), pp.259-268. https://doi.org/10.1520/GTJ10351J.
Chapter Ⅲ. Mechanical behavior of soil mixture under monotonic loading
98
Vermeer, P. A. 1998. Non-associated Plasticity for Soils, Concrete and Rock. In Physics of Dry
Granular Media, edited by H. J.Herrmann, J. P. Hovi, and S. Luding, 163–196. Dordrecht,
the Netherlands: Springer. https://doi.org/10.1007/978-94-017-2653-5_10
Wang, H.L., Y.J. Cui, F. Lamas-Lopez, J.C. Dupla, J. Canou, N. Calon, G. Saussine, P.
Aimedieu, and R.P. Chen. 2017. Effects of inclusion contents on resilient modulus and
damping ratio of unsaturated track-bed materials. Canadian Geotechnical Journal, 54(12),
pp.1672-1681. https://doi.org/10.1139/cgj-2016-0673.
Wang, H.L., Y.J. Cui, F. Lamas-Lopez, N. Calon, G. Saussine, J.C. Dupla, J. Canou, P.
Aimedieu, and R.P. Chen. 2018a. Investigation on the mechanical behavior of track-bed
materials at various contents of coarse grains. Construction and Building Materials, 164,
pp.228-237. https://doi.org/10.1016/j.conbuildmat.2017.12.209.
Wang, H.L., Y.J. Cui, F. Lamas-Lopez, J.C. Dupla, J. Canou, N. Calon, G. Saussine, , P.
Aimedieu, and R.P. Chen. 2018b. Permanent deformation of track-bed materials at various
inclusion contents under large number of loading cycles. Journal of Geotechnical and
Geoenvironmental Engineering, 144(8), p.04018044.
https://doi.org/10.1061/(ASCE)GT.1943-5606.0001911.
Zhang, L.M. and X. Li. 2010. Microporosity structure of coarse granular soils. Journal of
Geotechnical and Geoenvironmental Engineering, 136(10), pp.1425-1436.
https://doi.org/10.1061/(ASCE)GT.1943-5606.0000348.
Zhang, F., Y.J. Cui, and W.M. Ye. 2018a. Distinguishing macro-and micro-pores for materials
with different pore populations. Géotechnique Letters, 8(2), pp.102-110.
https://doi.org/10.1680/jgele.17.00144.
Zhang, T.W., Y.J. Cui, F. Lamas-Lopez, N. Calon, and S. Costa D’Aguiar. 2018b. Compacted
soil behaviour through changes of density, suction, and stiffness of soils with remoulding
water content. Canadian Geotechnical Journal, 55(2), pp.182-190.
https://doi.org/10.1139/cgj-2016-0628.
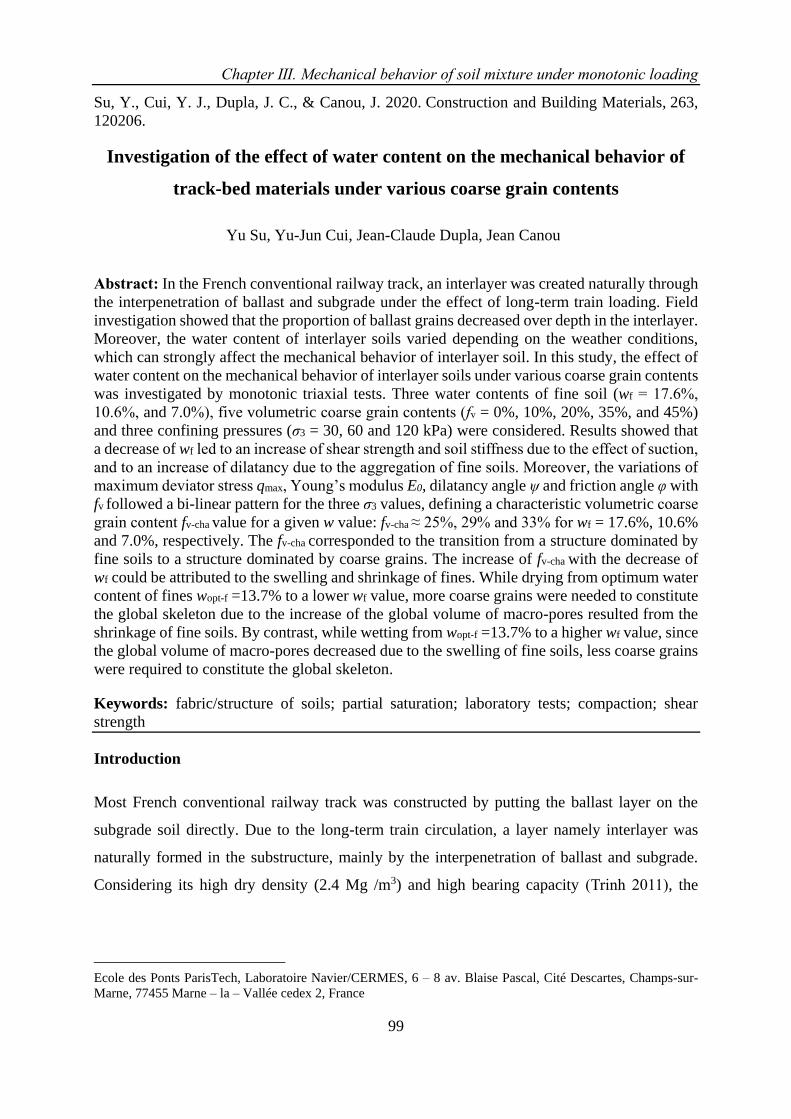
Chapter Ⅲ. Mechanical behavior of soil mixture under monotonic loading
99
Su, Y., Cui, Y. J., Dupla, J. C., & Canou, J. 2020. Construction and Building Materials, 263,
120206.
Investigation of the effect of water content on the mechanical behavior of
track-bed materials under various coarse grain contents
Yu Su, Yu-Jun Cui, Jean-Claude Dupla, Jean Canou1
Abstract: In the French conventional railway track, an interlayer was created naturally through
the interpenetration of ballast and subgrade under the effect of long-term train loading. Field
investigation showed that the proportion of ballast grains decreased over depth in the interlayer.
Moreover, the water content of interlayer soils varied depending on the weather conditions,
which can strongly affect the mechanical behavior of interlayer soil. In this study, the effect of
water content on the mechanical behavior of interlayer soils under various coarse grain contents
was investigated by monotonic triaxial tests. Three water contents of fine soil (wf = 17.6%,
10.6%, and 7.0%), five volumetric coarse grain contents (fv = 0%, 10%, 20%, 35%, and 45%)
and three confining pressures (σ3 = 30, 60 and 120 kPa) were considered. Results showed that
a decrease of wf led to an increase of shear strength and soil stiffness due to the effect of suction,
and to an increase of dilatancy due to the aggregation of fine soils. Moreover, the variations of
maximum deviator stress qmax, Young’s modulus E0, dilatancy angle ψ and friction angle φ with
fv followed a bi-linear pattern for the three σ3 values, defining a characteristic volumetric coarse
grain content fv-cha value for a given w value: fv-cha ≈ 25%, 29% and 33% for wf = 17.6%, 10.6%
and 7.0%, respectively. The fv-cha corresponded to the transition from a structure dominated by
fine soils to a structure dominated by coarse grains. The increase of fv-cha with the decrease of
wf could be attributed to the swelling and shrinkage of fines. While drying from optimum water
content of fines wopt-f =13.7% to a lower wf value, more coarse grains were needed to constitute
the global skeleton due to the increase of the global volume of macro-pores resulted from the
shrinkage of fine soils. By contrast, while wetting from wopt-f =13.7% to a higher wf value, since
the global volume of macro-pores decreased due to the swelling of fine soils, less coarse grains
were required to constitute the global skeleton.
Keywords: fabric/structure of soils; partial saturation; laboratory tests; compaction; shear
strength
Introduction
Most French conventional railway track was constructed by putting the ballast layer on the
subgrade soil directly. Due to the long-term train circulation, a layer namely interlayer was
naturally formed in the substructure, mainly by the interpenetration of ballast and subgrade.
Considering its high dry density (2.4 Mg /m3) and high bearing capacity (Trinh 2011), the
Ecole des Ponts ParisTech, Laboratoire Navier/CERMES, 6 – 8 av. Blaise Pascal, Cité Descartes, Champs-sur-
Marne, 77455 Marne – la – Vallée cedex 2, France
Chapter Ⅲ. Mechanical behavior of soil mixture under monotonic loading
100
French railway company (SNCF) has decided to keep it as part of the substructure in the
execution of the track renewal program (Cui et al. 2013).
Based on the field investigation, the content of ballast grains was found to decrease over depth
(Trinh 2011). Globally, the interlayer can be separated into two parts: the upper part dominated
by ballast grains and the lower part dominated by fine soils. For the upper part, the effects of
fine soil content and water content on the mechanical behavior were studied by Trinh et al.
(2012), Cui et al. (2013), Duong et al. (2013, 2014, 2016) and Lamas-Lopez et al. (2015, 2016)
by performing monotonic and cyclic triaxial tests. In order to extend the study to the whole
interlayer, Wang et al. (2017, 2018a, 2018b) and Qi et al. (2020) investigated the effect of coarse
grain content fv (volumetric ratio of coarse grains to total sample) on the mechanical behavior.
Results revealed existence of a characteristic volumetric coarse grain content fv-cha, below which
the soil was characterised by a fine matrix with coarse grains floating in it, while beyond which
the soil was characterised by a coarse grain skeleton. It is worth noting that in the previous
studies, the effect of fv on the mechanical behavior was investigated under constant water
content conditions. This is obviously not the field condition where the water content varies
depending on the weather conditions, resulting in changes in mechanical behavior. Therefore,
from a practical point of view, it appears essential to investigate the effect of water content on
the mechanical behavior of interlayer soil.
There are several studies addressing the effect of coarse grain content on the mechanical
behavior of soil. Seif El Dine et al. (2010) worked on sandy matrix with fv of gravels, showing
an increase of shear strength with the increase of fv. However, Vallejo (2001) showed an
opposite trend when the mass proportion of coarse particles was beyond 65% for a mixture of
rock and sand. It is worth noting that the fines involved in their studies were cohesionless soils
like sand and glass beads, which did not represent the natural fine soils in the interlayer. Wang
et al. (2017, 2018a, 2018b) studied the effect of fv on the static and dynamic responses of
interlayer soil, and identified a characteristic value fv-cha that could be used to differentiate two
distinct soil fabrics. Qi et al. (2020) investigated the effect of the coefficient of uniformity Cu
of coarse grains on the mechanical behavior of interlayer soils, and found that the decrease of
Cu led to an increase of fv-cha. A few studies were undertaken to investigate the water content
effect on the mechanical behavior of substructure soils in terms of shear strength, resilient
modulus, etc. Trinh et al. (2012) investigated the effect of water content on the mechanical
behavior of fouled ballast at different water contents and found that the lower the water content,
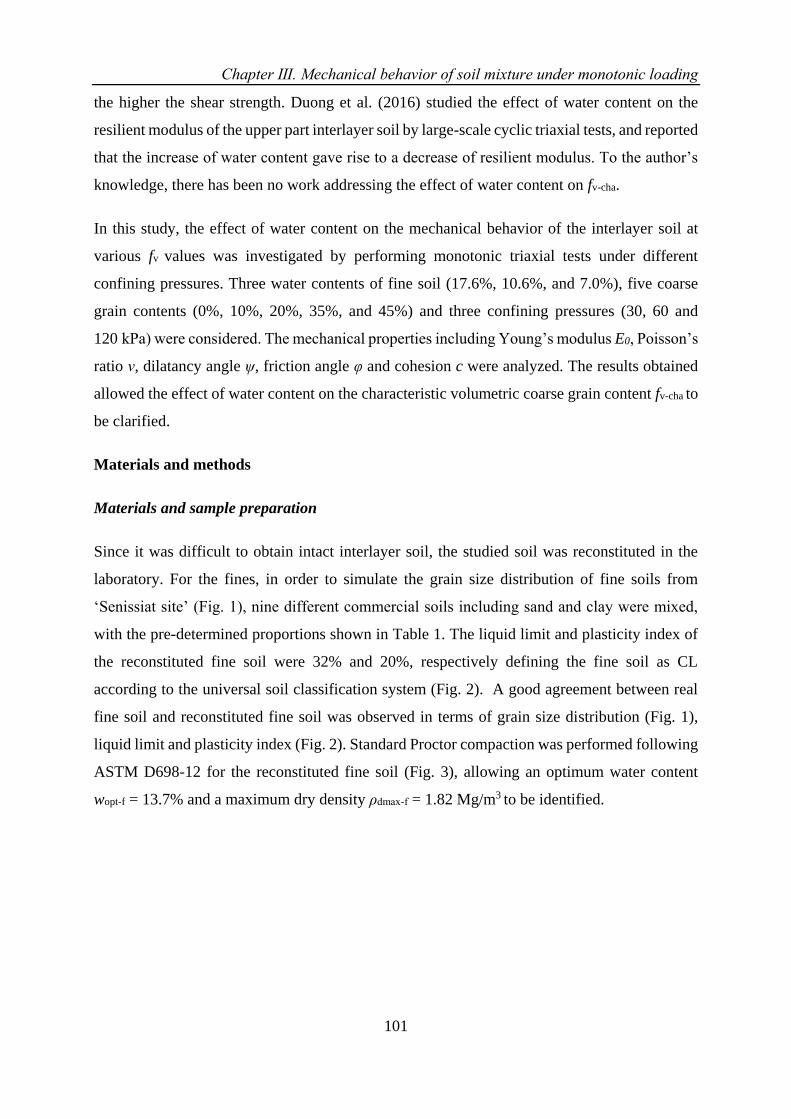
Chapter Ⅲ. Mechanical behavior of soil mixture under monotonic loading
101
the higher the shear strength. Duong et al. (2016) studied the effect of water content on the
resilient modulus of the upper part interlayer soil by large-scale cyclic triaxial tests, and reported
that the increase of water content gave rise to a decrease of resilient modulus. To the author’s
knowledge, there has been no work addressing the effect of water content on fv-cha.
In this study, the effect of water content on the mechanical behavior of the interlayer soil at
various fv values was investigated by performing monotonic triaxial tests under different
confining pressures. Three water contents of fine soil (17.6%, 10.6%, and 7.0%), five coarse
grain contents (0%, 10%, 20%, 35%, and 45%) and three confining pressures (30, 60 and
120 kPa) were considered. The mechanical properties including Young’s modulus E0, Poisson’s
ratio ν, dilatancy angle ψ, friction angle φ and cohesion c were analyzed. The results obtained
allowed the effect of water content on the characteristic volumetric coarse grain content fv-cha to
be clarified.
Materials and methods
Materials and sample preparation
Since it was difficult to obtain intact interlayer soil, the studied soil was reconstituted in the
laboratory. For the fines, in order to simulate the grain size distribution of fine soils from
‘Senissiat site’ (Fig. 1), nine different commercial soils including sand and clay were mixed,
with the pre-determined proportions shown in Table 1. The liquid limit and plasticity index of
the reconstituted fine soil were 32% and 20%, respectively defining the fine soil as CL
according to the universal soil classification system (Fig. 2). A good agreement between real
fine soil and reconstituted fine soil was observed in terms of grain size distribution (Fig. 1),
liquid limit and plasticity index (Fig. 2). Standard Proctor compaction was performed following
ASTM D698-12 for the reconstituted fine soil (Fig. 3), allowing an optimum water content
wopt-f = 13.7% and a maximum dry density ρdmax-f = 1.82 Mg/m3 to be identified.
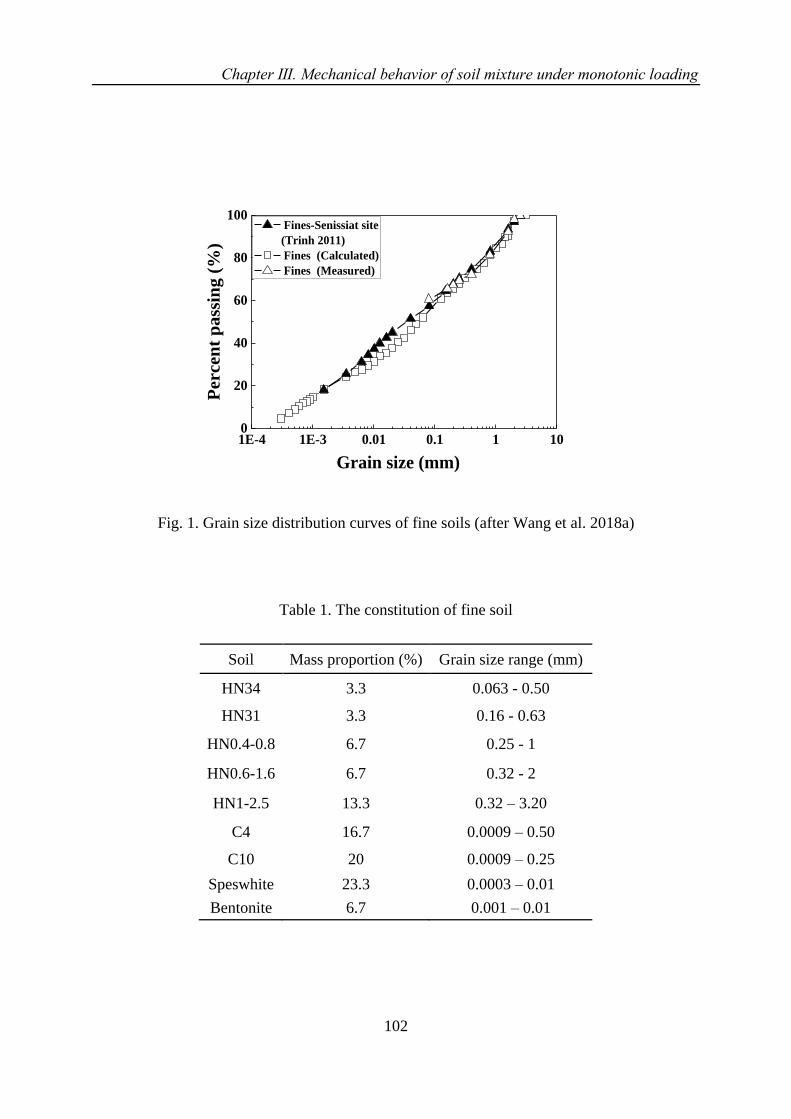
Chapter Ⅲ. Mechanical behavior of soil mixture under monotonic loading
102
1E-4 1E-3 0.01 0.1 1 100
20
40
60
80
100 Fines-Senissiat site
(Trinh 2011)
Fines (Calculated)
Fines (Measured)
Percen
t p
ass
ing (
%)
Grain size (mm)
Fig. 1. Grain size distribution curves of fine soils (after Wang et al. 2018a)
Table 1. The constitution of fine soil
Soil Mass proportion (%) Grain size range (mm)
HN34 3.3 0.063 - 0.50
HN31 3.3 0.16 - 0.63
HN0.4-0.8 6.7 0.25 - 1
HN0.6-1.6 6.7 0.32 - 2
HN1-2.5 13.3 0.32 – 3.20
C4 16.7 0.0009 – 0.50
C10 20 0.0009 – 0.25
Speswhite 23.3 0.0003 – 0.01
Bentonite 6.7 0.001 – 0.01
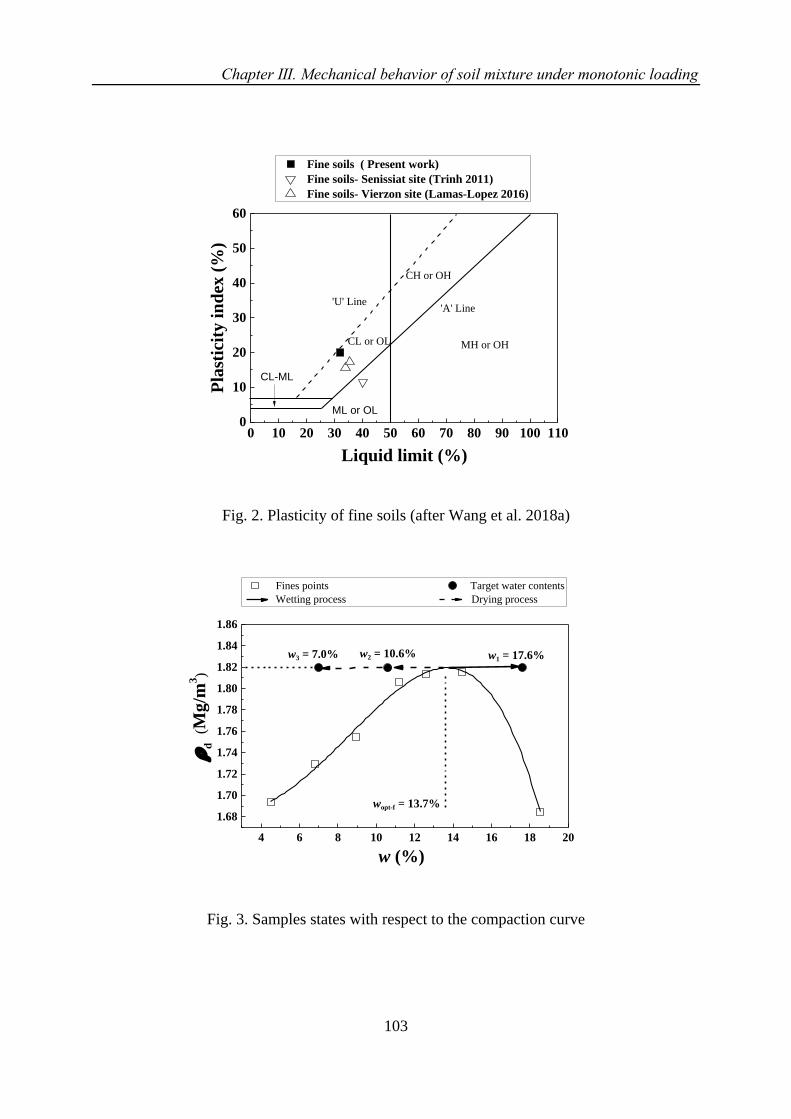
Chapter Ⅲ. Mechanical behavior of soil mixture under monotonic loading
103
0 10 20 30 40 50 60 70 80 90 100 1100
10
20
30
40
50
60
'U' Line'A' Line
CH or OH
CL or OL MH or OH
ML or OL
Pla
stic
ity i
nd
ex (
%)
Liquid limit (%)
CL-ML
Fine soils ( Present work)
Fine soils- Senissiat site (Trinh 2011)
Fine soils- Vierzon site (Lamas-Lopez 2016)
Fig. 2. Plasticity of fine soils (after Wang et al. 2018a)
4 6 8 10 12 14 16 18 20
1.68
1.70
1.72
1.74
1.76
1.78
1.80
1.82
1.84
1.86
w3 = 7.0%
wopt-f = 13.7%
w2 = 10.6%
d
(Mg
/m3)
w (%)
Fines points Target water contents
Wetting process Drying process
w1 = 17.6%
Fig. 3. Samples states with respect to the compaction curve
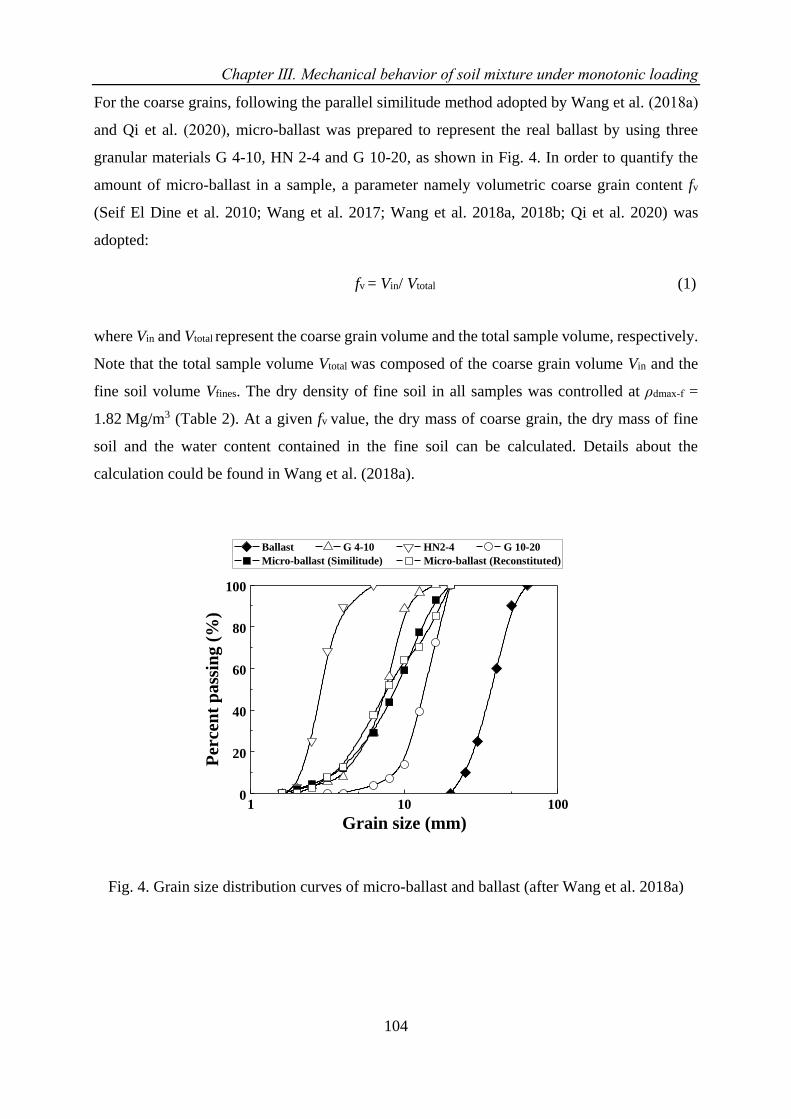
Chapter Ⅲ. Mechanical behavior of soil mixture under monotonic loading
104
For the coarse grains, following the parallel similitude method adopted by Wang et al. (2018a)
and Qi et al. (2020), micro-ballast was prepared to represent the real ballast by using three
granular materials G 4-10, HN 2-4 and G 10-20, as shown in Fig. 4. In order to quantify the
amount of micro-ballast in a sample, a parameter namely volumetric coarse grain content fv
(Seif El Dine et al. 2010; Wang et al. 2017; Wang et al. 2018a, 2018b; Qi et al. 2020) was
adopted:
fv = Vin/ Vtotal (1)
where Vin and Vtotal represent the coarse grain volume and the total sample volume, respectively.
Note that the total sample volume Vtotal was composed of the coarse grain volume Vin and the
fine soil volume Vfines. The dry density of fine soil in all samples was controlled at ρdmax-f =
1.82 Mg/m3 (Table 2). At a given fv value, the dry mass of coarse grain, the dry mass of fine
soil and the water content contained in the fine soil can be calculated. Details about the
calculation could be found in Wang et al. (2018a).
1 10 1000
20
40
60
80
100
Ballast G 4-10 HN2-4 G 10-20
Micro-ballast (Similitude) Micro-ballast (Reconstituted)
Per
cen
t p
ass
ing (
%)
Grain size (mm)
Fig. 4. Grain size distribution curves of micro-ballast and ballast (after Wang et al. 2018a)
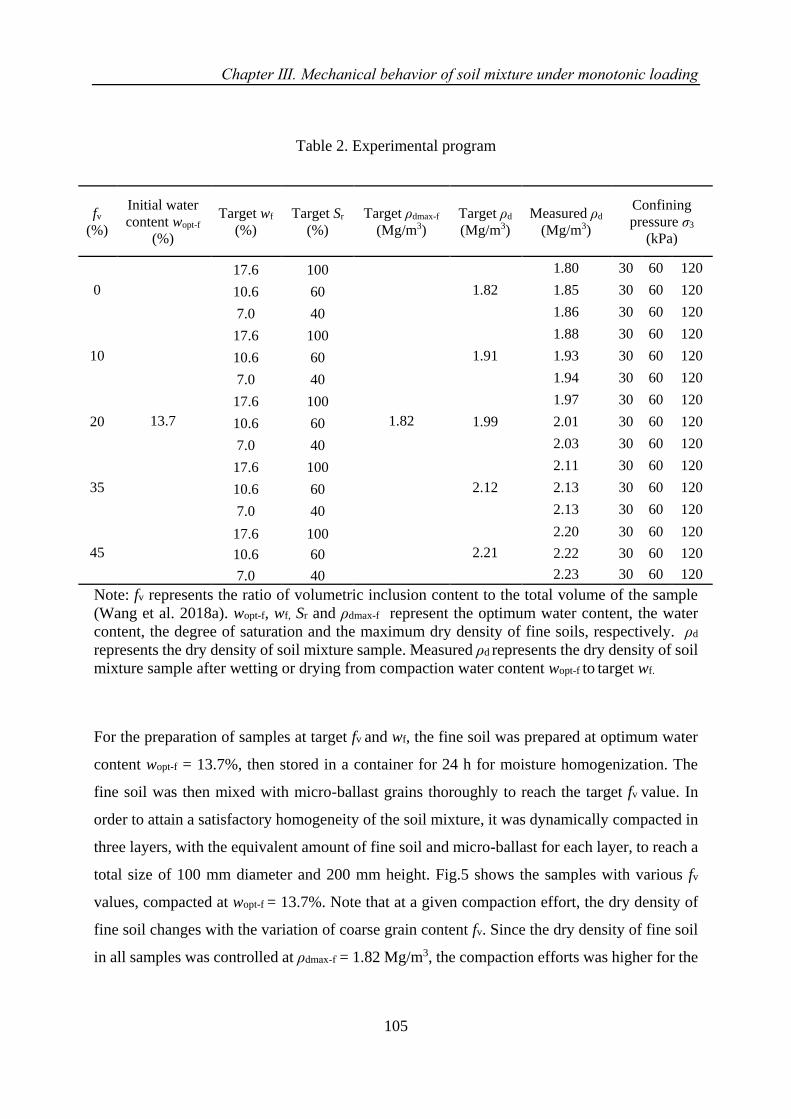
Chapter Ⅲ. Mechanical behavior of soil mixture under monotonic loading
105
Table 2. Experimental program
Note: fv represents the ratio of volumetric inclusion content to the total volume of the sample
(Wang et al. 2018a). wopt-f, wf, Sr and ρdmax-f represent the optimum water content, the water
content, the degree of saturation and the maximum dry density of fine soils, respectively. ρd
represents the dry density of soil mixture sample. Measured ρd represents the dry density of soil
mixture sample after wetting or drying from compaction water content wopt-f to target wf.
For the preparation of samples at target fv and wf, the fine soil was prepared at optimum water
content wopt-f = 13.7%, then stored in a container for 24 h for moisture homogenization. The
fine soil was then mixed with micro-ballast grains thoroughly to reach the target fv value. In
order to attain a satisfactory homogeneity of the soil mixture, it was dynamically compacted in
three layers, with the equivalent amount of fine soil and micro-ballast for each layer, to reach a
total size of 100 mm diameter and 200 mm height. Fig.5 shows the samples with various fv
values, compacted at wopt-f = 13.7%. Note that at a given compaction effort, the dry density of
fine soil changes with the variation of coarse grain content fv. Since the dry density of fine soil
in all samples was controlled at ρdmax-f = 1.82 Mg/m3, the compaction efforts was higher for the
fv
(%)
Initial water
content wopt-f
(%)
Target wf
(%)
Target Sr
(%)
Target ρdmax-f
(Mg/m3)
Target ρd
(Mg/m3)
Measured ρd
(Mg/m3)
Confining
pressure σ3
(kPa)
0
13.7
17.6 100
1.82
1.82
1.80 30 60 120
10.6 60 1.85 30 60 120
7.0 40 1.86 30 60 120
10
17.6 100
1.91
1.88 30 60 120
10.6 60 1.93 30 60 120
7.0 40 1.94 30 60 120
20
17.6 100
1.99
1.97 30 60 120
10.6 60 2.01 30 60 120
7.0 40 2.03 30 60 120
35
17.6 100
2.12
2.11 30 60 120
10.6 60 2.13 30 60 120
7.0 40 2.13 30 60 120
45
17.6 100
2.21
2.20 30 60 120
10.6 60 2.22 30 60 120
7.0 40 2.23 30 60 120

Chapter Ⅲ. Mechanical behavior of soil mixture under monotonic loading
106
samples at higher fv values. As a result, higher ρd values were obtained for the samples with
higher fv values, as shown in Table 2.
Fig. 5. Photographs of the samples with various coarse grain contents and compacted at wopt-f
= 13.7%
After reaching the target fv value, either a wetting or a drying process was adopted to obtain the
target wf: w1 = 17.6% on the wet side of optimum; w2 = 10.6% and w3 = 7.0% on the dry side of
optimum. In the case of drying process, considering that a too fast drying would lead to sample
damage by fissuring, a milder drying method was performed: the sample was exposed to the air
in the laboratory for 1 h each time, and then wrapped with plastic film for equilibration. The
time of equilibration needed was determined by measurement of suction and water content in
three positions: in the center, ½ r and r, with r being radius of the sample. The results obtained
showed that 7 h was required for reaching reasonable equilibration in terms of suction and water
content (Table 3). In the case of wetting process, 10 g water was sprayed on the sample each
time prior to covering it with plastic film for equilibration. The same equilibration time of at
least 7 h was adopted.
Table 3. Suction and water content measured at different equilibration times for fine soils
Position
Suction
(MPa)
Water
content (%)
Suction
(MPa)
Water
content
(%)
After 6h After 7h
center 0.33 12.7 0.32 12.9
1/2 r 0.24 13.5 0.35 12.8
r 0.46 13.7 0.33 13.1
fv = 0% fv = 10% fv = 20% fv = 35% fv = 45%
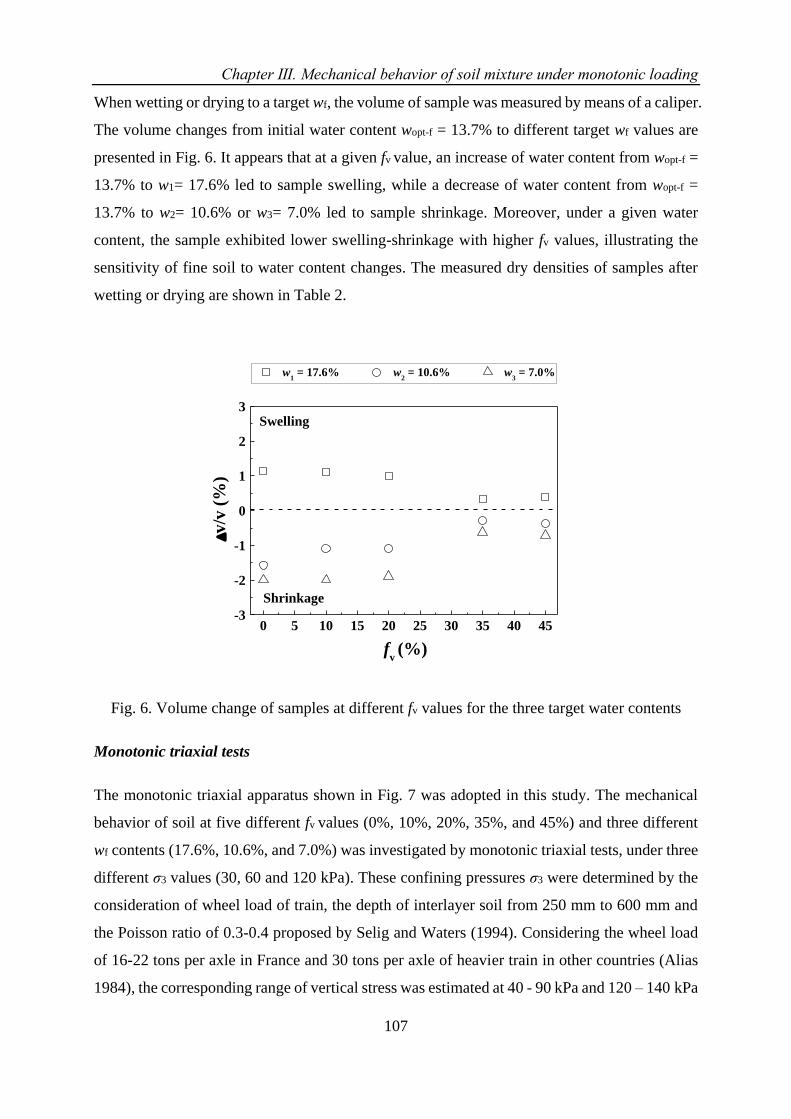
Chapter Ⅲ. Mechanical behavior of soil mixture under monotonic loading
107
When wetting or drying to a target wf, the volume of sample was measured by means of a caliper.
The volume changes from initial water content wopt-f = 13.7% to different target wf values are
presented in Fig. 6. It appears that at a given fv value, an increase of water content from wopt-f =
13.7% to w1= 17.6% led to sample swelling, while a decrease of water content from wopt-f =
13.7% to w2= 10.6% or w3= 7.0% led to sample shrinkage. Moreover, under a given water
content, the sample exhibited lower swelling-shrinkage with higher fv values, illustrating the
sensitivity of fine soil to water content changes. The measured dry densities of samples after
wetting or drying are shown in Table 2.
0 5 10 15 20 25 30 35 40 45-3
-2
-1
0
1
2
3
fv (%)
Shrinkage
w1 = 17.6% w
2 = 10.6% w
3 = 7.0%
v/v
(%
)
Swelling
Fig. 6. Volume change of samples at different fv values for the three target water contents
Monotonic triaxial tests
The monotonic triaxial apparatus shown in Fig. 7 was adopted in this study. The mechanical
behavior of soil at five different fv values (0%, 10%, 20%, 35%, and 45%) and three different
wf contents (17.6%, 10.6%, and 7.0%) was investigated by monotonic triaxial tests, under three
different σ3 values (30, 60 and 120 kPa). These confining pressures σ3 were determined by the
consideration of wheel load of train, the depth of interlayer soil from 250 mm to 600 mm and
the Poisson ratio of 0.3-0.4 proposed by Selig and Waters (1994). Considering the wheel load
of 16-22 tons per axle in France and 30 tons per axle of heavier train in other countries (Alias
1984), the corresponding range of vertical stress was estimated at 40 - 90 kPa and 120 – 140 kPa
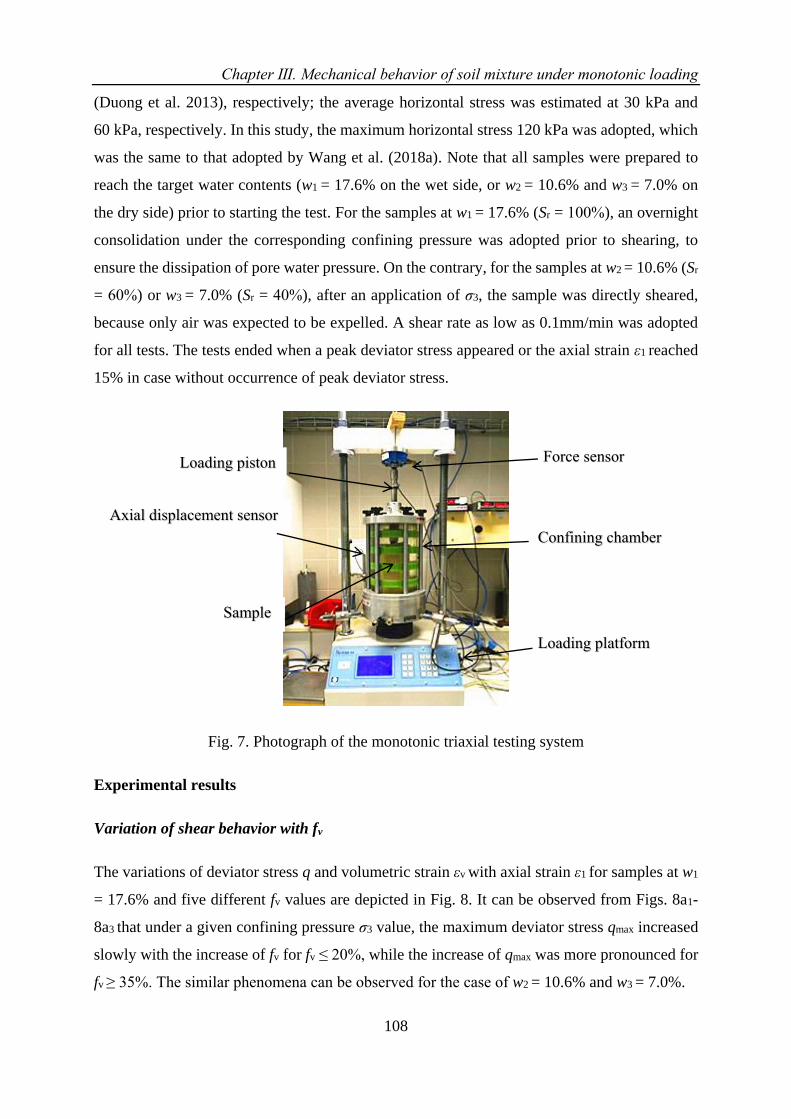
Chapter Ⅲ. Mechanical behavior of soil mixture under monotonic loading
108
(Duong et al. 2013), respectively; the average horizontal stress was estimated at 30 kPa and
60 kPa, respectively. In this study, the maximum horizontal stress 120 kPa was adopted, which
was the same to that adopted by Wang et al. (2018a). Note that all samples were prepared to
reach the target water contents (w1 = 17.6% on the wet side, or w2 = 10.6% and w3 = 7.0% on
the dry side) prior to starting the test. For the samples at w1 = 17.6% (Sr = 100%), an overnight
consolidation under the corresponding confining pressure was adopted prior to shearing, to
ensure the dissipation of pore water pressure. On the contrary, for the samples at w2 = 10.6% (Sr
= 60%) or w3 = 7.0% (Sr = 40%), after an application of σ3, the sample was directly sheared,
because only air was expected to be expelled. A shear rate as low as 0.1mm/min was adopted
for all tests. The tests ended when a peak deviator stress appeared or the axial strain ε1 reached
15% in case without occurrence of peak deviator stress.
Fig. 7. Photograph of the monotonic triaxial testing system
Experimental results
Variation of shear behavior with fv
The variations of deviator stress q and volumetric strain εv with axial strain ε1 for samples at w1
= 17.6% and five different fv values are depicted in Fig. 8. It can be observed from Figs. 8a1-
8a3 that under a given confining pressure σ3 value, the maximum deviator stress qmax increased
slowly with the increase of fv for fv ≤ 20%, while the increase of qmax was more pronounced for
fv ≥ 35%. The similar phenomena can be observed for the case of w2 = 10.6% and w3 = 7.0%.
Force sensor
Confining chamber
Sample
Axial displacement sensor
Loading piston
Loading platform
Chapter Ⅲ. Mechanical behavior of soil mixture under monotonic loading
109
In Fig. 8b1, pure contractancy behaviour was observed for samples at fv ≤ 20%, while for
samples at fv ≥ 35%, a behavior of contractancy followed by dilatancy was identified. Moreover,
the larger the fv value, the more pronounced the dilatancy behaviour. This dilatancy was
however reduced by the increase of confining pressure: when σ3 was increased from 60 kPa (Fig.
8b2) to 120 kPa (Fig. 8b3), the contractancy increased and the dilatancy decreased.
Variation of maximum deviator stress qmax with wf
Fig. 9 depicts the variations of qmax against fv at different σ3 values for three different water
contents. In the case of w1 = 17.6% (Fig. 9a), it appears that under a given σ3 value, the variation
of qmax followed a bi-linear pattern with two different slopes, which defined a characteristic
volumetric coarse grain content fv-cha. Moreover, similar fv-cha values (around 25%) could be
identified for the three different σ3 values. Physically, the fv-cha value distinguished two different
soil fabrics: when fv ≤ fv-cha, the soil fabric was governed by fine soil dominated structure, while
when fv ≥ fv-cha it was governed by coarse grain dominated structure, in agreement with the
observations by Wang et al. (2018a) and Qi et al. (2020).
The same phenomena were observed for the two other water contents: w2 = 10.6% (Fig. 9b) and
w3 = 7.0% (Fig. 9c). For each water content, qmax varies in a bi-linear fashion with with fv,
defining a fv-cha value which is independent of the σ3 value. The values of fv-cha were 29% and
33% for w2 = 10.6% and w3 = 7.0%, respectively. Comparison of the fv-cha values at different
water contents showed that fv-cha increased with the decrease of water content.
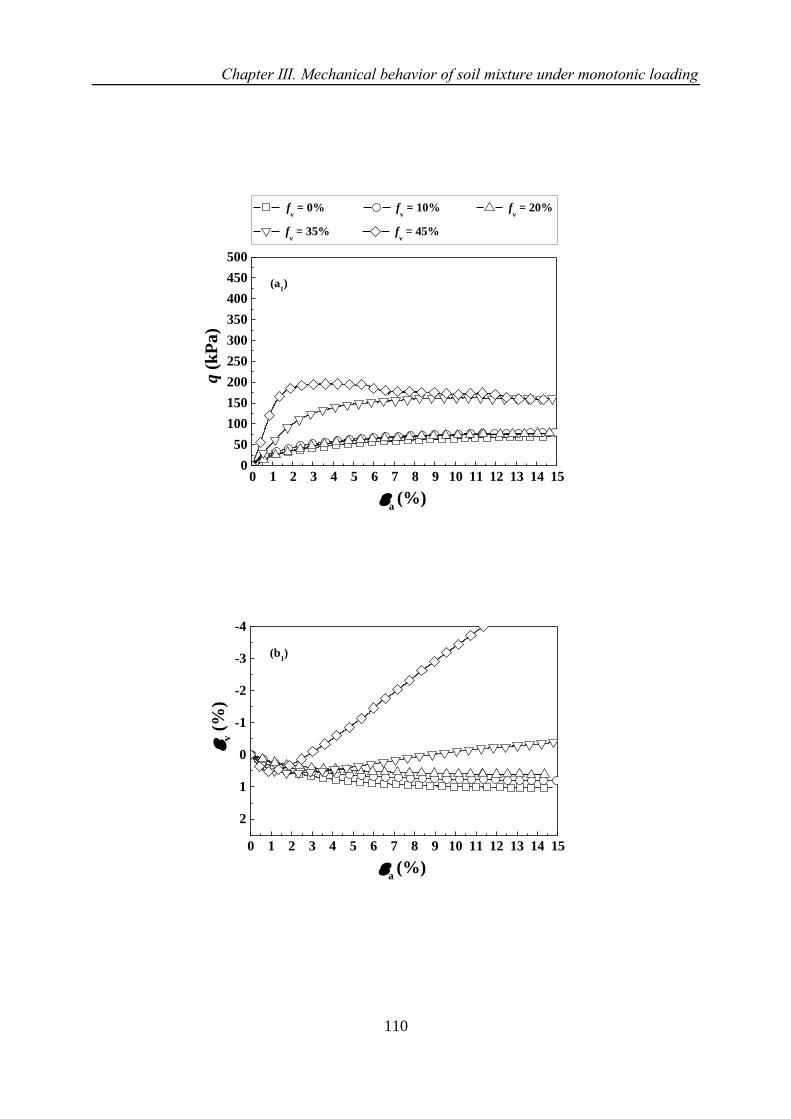
Chapter Ⅲ. Mechanical behavior of soil mixture under monotonic loading
110
0 1 2 3 4 5 6 7 8 9 10 11 12 13 14 150
50
100
150
200
250
300
350
400
450
500
q (
kP
a)
a (%)
fv = 0% f
v = 10% f
v = 20%
fv = 35% f
v = 45%
(a1)
0 1 2 3 4 5 6 7 8 9 10 11 12 13 14 15
2
1
0
-1
-2
-3
-4
a (%)
v (
%)
(b1)
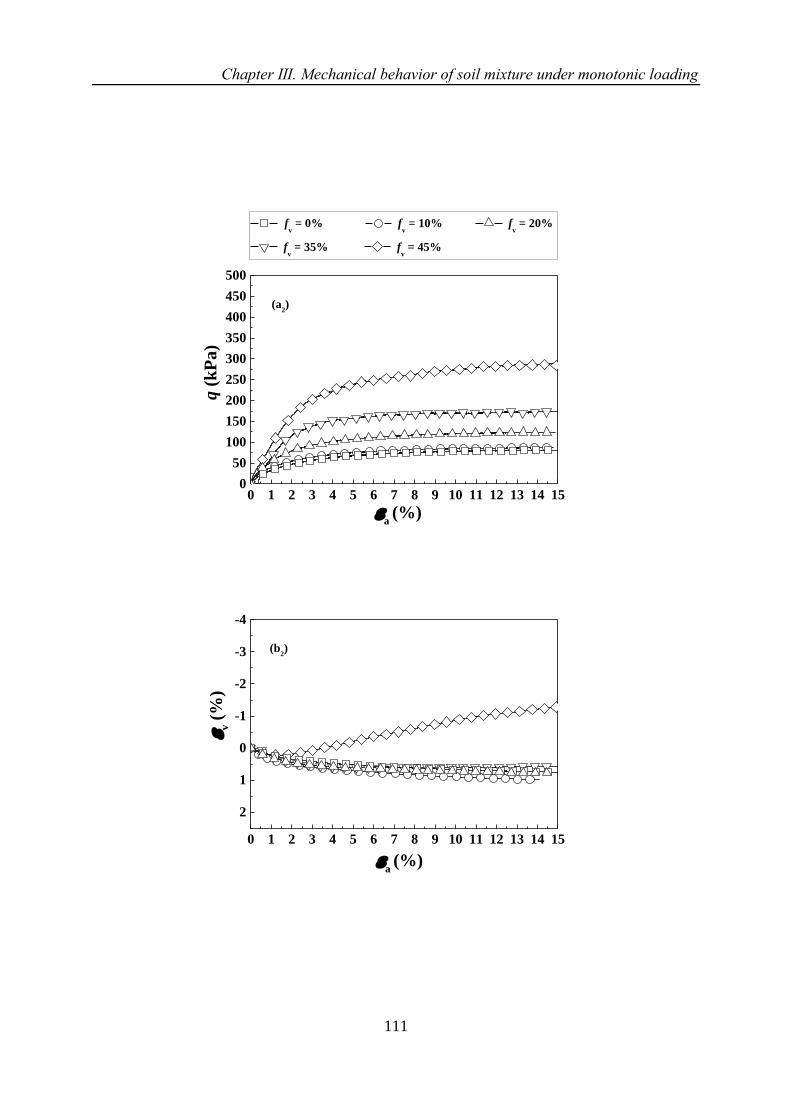
Chapter Ⅲ. Mechanical behavior of soil mixture under monotonic loading
111
0 1 2 3 4 5 6 7 8 9 10 11 12 13 14 150
50
100
150
200
250
300
350
400
450
500
q (
kP
a)
a (%)
(a2)
fv = 0% f
v = 10% f
v = 20%
fv = 35% f
v = 45%
0 1 2 3 4 5 6 7 8 9 10 11 12 13 14 15
2
1
0
-1
-2
-3
-4
v (
%)
a (%)
(b2)
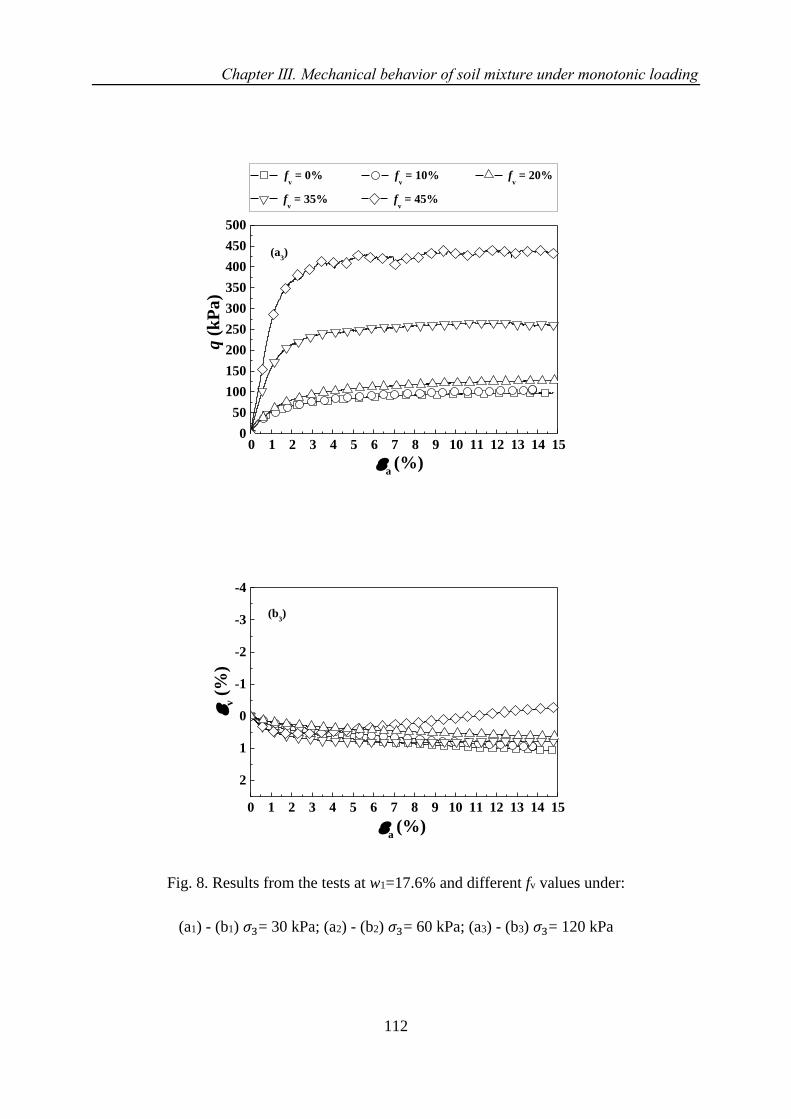
Chapter Ⅲ. Mechanical behavior of soil mixture under monotonic loading
112
0 1 2 3 4 5 6 7 8 9 10 11 12 13 14 150
50
100
150
200
250
300
350
400
450
500
a (%)
q (
kP
a)
fv = 0% f
v = 10% f
v = 20%
fv = 35% f
v = 45%
(a3)
0 1 2 3 4 5 6 7 8 9 10 11 12 13 14 15
2
1
0
-1
-2
-3
-4
a (%)
v (
%)
(b3)
Fig. 8. Results from the tests at w1=17.6% and different fv values under:
(a1) - (b1) 𝜎3= 30 kPa; (a2) - (b2) 𝜎3= 60 kPa; (a3) - (b3) 𝜎3= 120 kPa
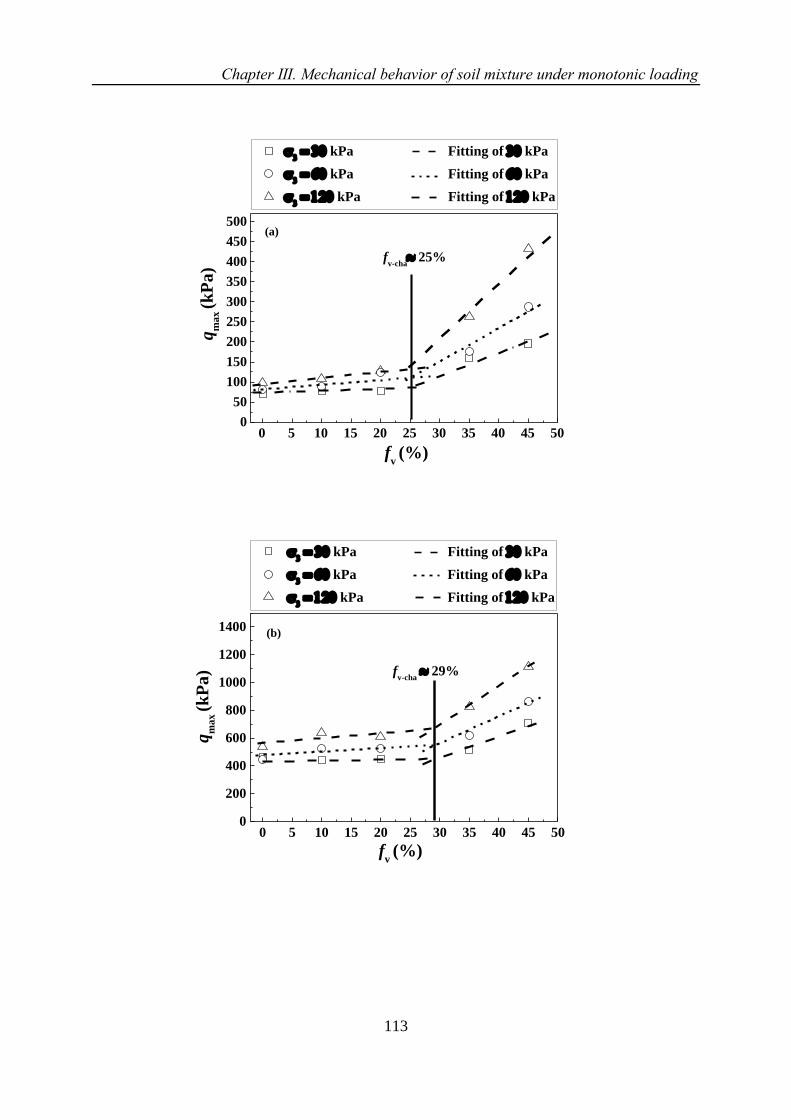
Chapter Ⅲ. Mechanical behavior of soil mixture under monotonic loading
113
0 5 10 15 20 25 30 35 40 45 500
50
100
150
200
250
300
350
400
450
500
= kPa Fitting of kPa
= kPa Fitting of kPa
= kPa Fitting of kPa
qm
ax
(kP
a)
fv (%)
fv-cha
25%
(a)
0 5 10 15 20 25 30 35 40 45 500
200
400
600
800
1000
1200
1400
= kPa Fitting of kPa
= kPa Fitting of kPa
= kPa Fitting of kPa
(b)
fv (%)
qm
ax
(kP
a) f
v-cha 29%
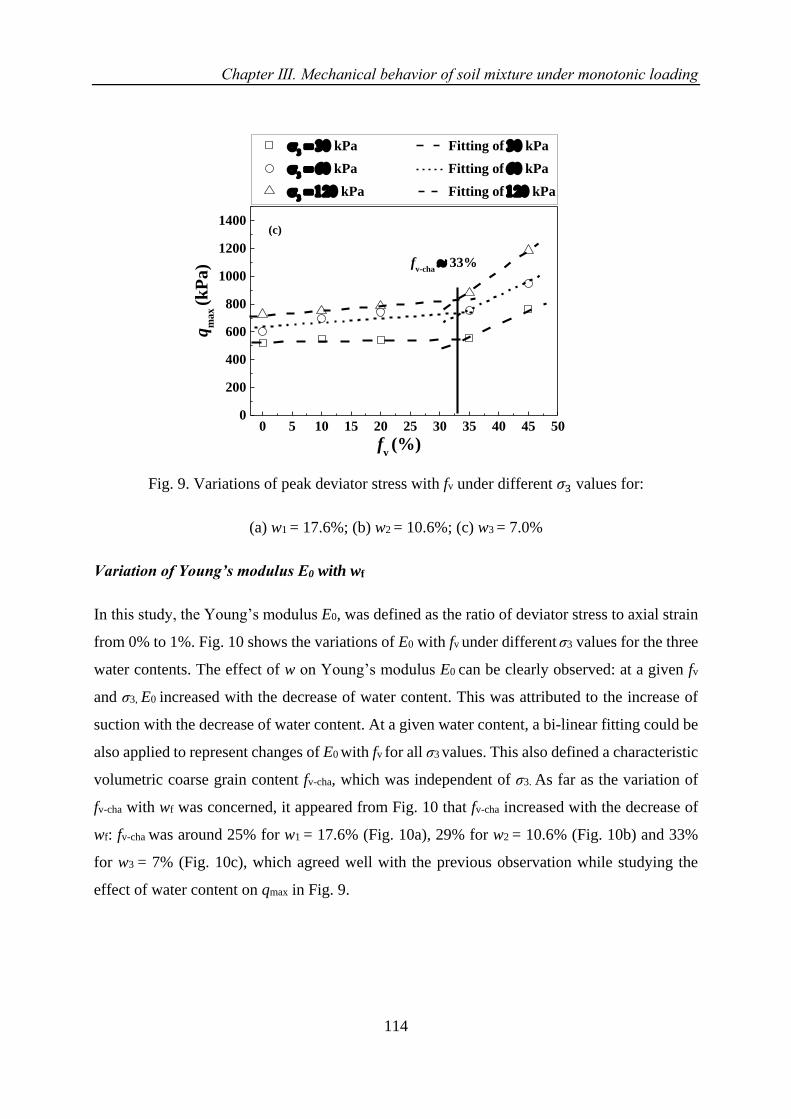
Chapter Ⅲ. Mechanical behavior of soil mixture under monotonic loading
114
0 5 10 15 20 25 30 35 40 45 500
200
400
600
800
1000
1200
1400
= kPa Fitting of kPa
= kPa Fitting of kPa
= kPa Fitting of kPa
(c)
qm
ax
(kP
a)
fv (%)
fv-cha
33%
Fig. 9. Variations of peak deviator stress with fv under different 𝜎3 values for:
(a) w1 = 17.6%; (b) w2 = 10.6%; (c) w3 = 7.0%
Variation of Young’s modulus E0 with wf
In this study, the Young’s modulus E0, was defined as the ratio of deviator stress to axial strain
from 0% to 1%. Fig. 10 shows the variations of E0 with fv under different σ3 values for the three
water contents. The effect of w on Young’s modulus E0 can be clearly observed: at a given fv
and σ3, E0 increased with the decrease of water content. This was attributed to the increase of
suction with the decrease of water content. At a given water content, a bi-linear fitting could be
also applied to represent changes of E0 with fv for all σ3 values. This also defined a characteristic
volumetric coarse grain content fv-cha, which was independent of σ3. As far as the variation of
fv-cha with wf was concerned, it appeared from Fig. 10 that fv-cha increased with the decrease of
wf: fv-cha was around 25% for w1 = 17.6% (Fig. 10a), 29% for w2 = 10.6% (Fig. 10b) and 33%
for w3 = 7% (Fig. 10c), which agreed well with the previous observation while studying the
effect of water content on qmax in Fig. 9.
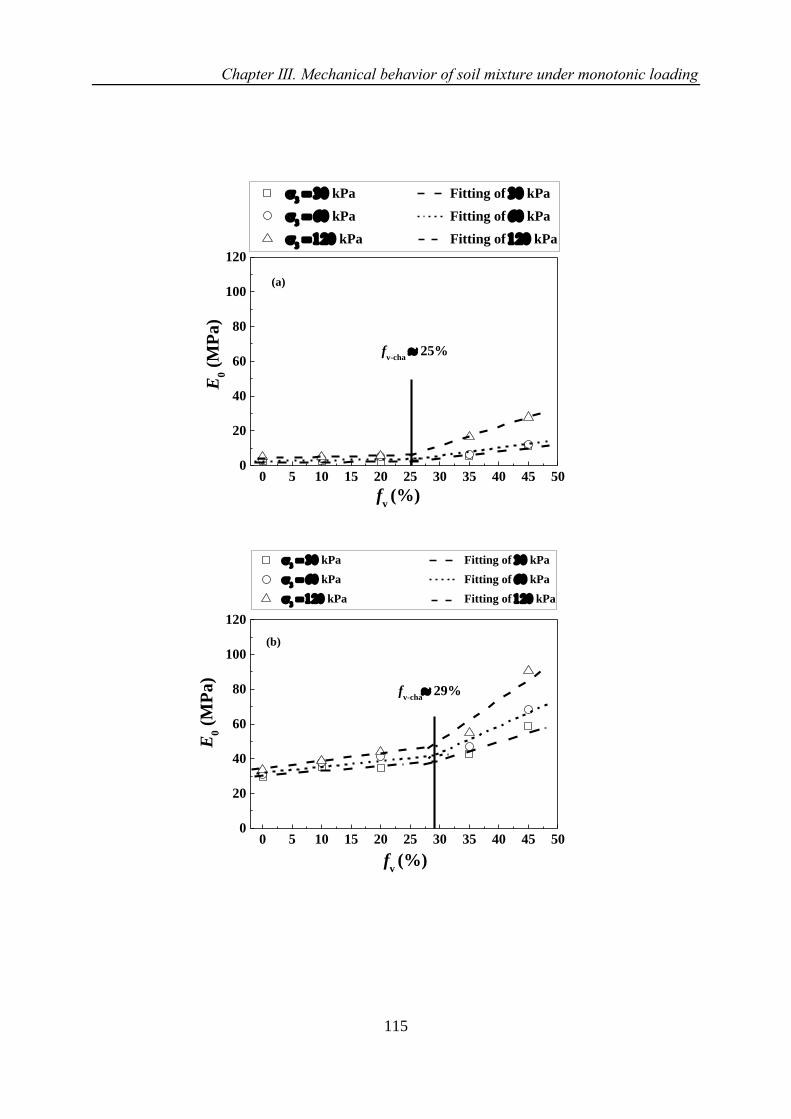
Chapter Ⅲ. Mechanical behavior of soil mixture under monotonic loading
115
0 5 10 15 20 25 30 35 40 45 500
20
40
60
80
100
120
(a)
= kPa Fitting of kPa
= kPa Fitting of kPa
= kPa Fitting of kPa
fv-cha
25%
fv (%)
E0 (
MP
a)
0 5 10 15 20 25 30 35 40 45 500
20
40
60
80
100
120
(b)
fv-cha
29%
E0 (
MP
a)
fv (%)
= kPa Fitting of kPa
= kPa Fitting of kPa
= kPa Fitting of kPa
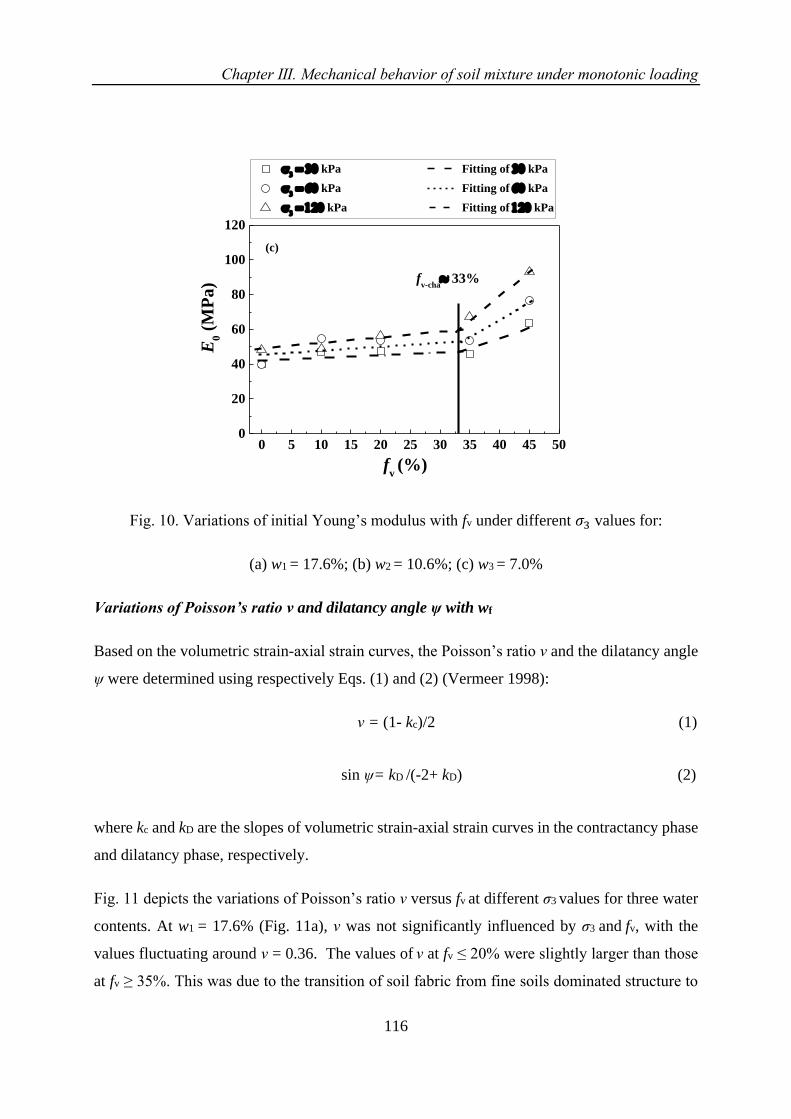
Chapter Ⅲ. Mechanical behavior of soil mixture under monotonic loading
116
0 5 10 15 20 25 30 35 40 45 500
20
40
60
80
100
120
(c)
fv-cha
33%
E0 (
MP
a)
fv (%)
= kPa Fitting of kPa
= kPa Fitting of kPa
= kPa Fitting of kPa
Fig. 10. Variations of initial Young’s modulus with fv under different 𝜎3 values for:
(a) w1 = 17.6%; (b) w2 = 10.6%; (c) w3 = 7.0%
Variations of Poisson’s ratio ν and dilatancy angle ψ with wf
Based on the volumetric strain-axial strain curves, the Poisson’s ratio ν and the dilatancy angle
ψ were determined using respectively Eqs. (1) and (2) (Vermeer 1998):
ν = (1- kc)/2 (1)
sin ψ= kD /(-2+ kD) (2)
where kc and kD are the slopes of volumetric strain-axial strain curves in the contractancy phase
and dilatancy phase, respectively.
Fig. 11 depicts the variations of Poisson’s ratio ν versus fv at different σ3 values for three water
contents. At w1 = 17.6% (Fig. 11a), ν was not significantly influenced by σ3 and fv, with the
values fluctuating around ν = 0.36. The values of ν at fv ≤ 20% were slightly larger than those
at fv ≥ 35%. This was due to the transition of soil fabric from fine soils dominated structure to

Chapter Ⅲ. Mechanical behavior of soil mixture under monotonic loading
117
coarse grains dominated structure, which resulted in the increase of soil stiffness and the
decrease of horizontal strain. Moreover, the difference of ν between fv ≤ 20% and fv ≥ 35%
decreased with the decrease of water content. The average value of ν was 0.21 at w2 = 10.6%
(Fig. 11b) and 0.19 at w3 = 7.0% (Fig. 11c). At w3 = 7.0%, the ν remained almost unchanged
with the increase of fv. Overall, it appeares that the average value of ν decreased with the
decreasing water content, suggesting that the lateral strain was reduced by the increase of
suction or decrease of water content.
0 5 10 15 20 25 30 35 40 45 500.0
0.1
0.2
0.3
0.4
0.5
(a)
=
fv (%)
= kPa
= kPa
= kPa
0 5 10 15 20 25 30 35 40 45 500.0
0.1
0.2
0.3
0.4
0.5
(b)
=
fv (%)
= kPa
= kPa
= kPa
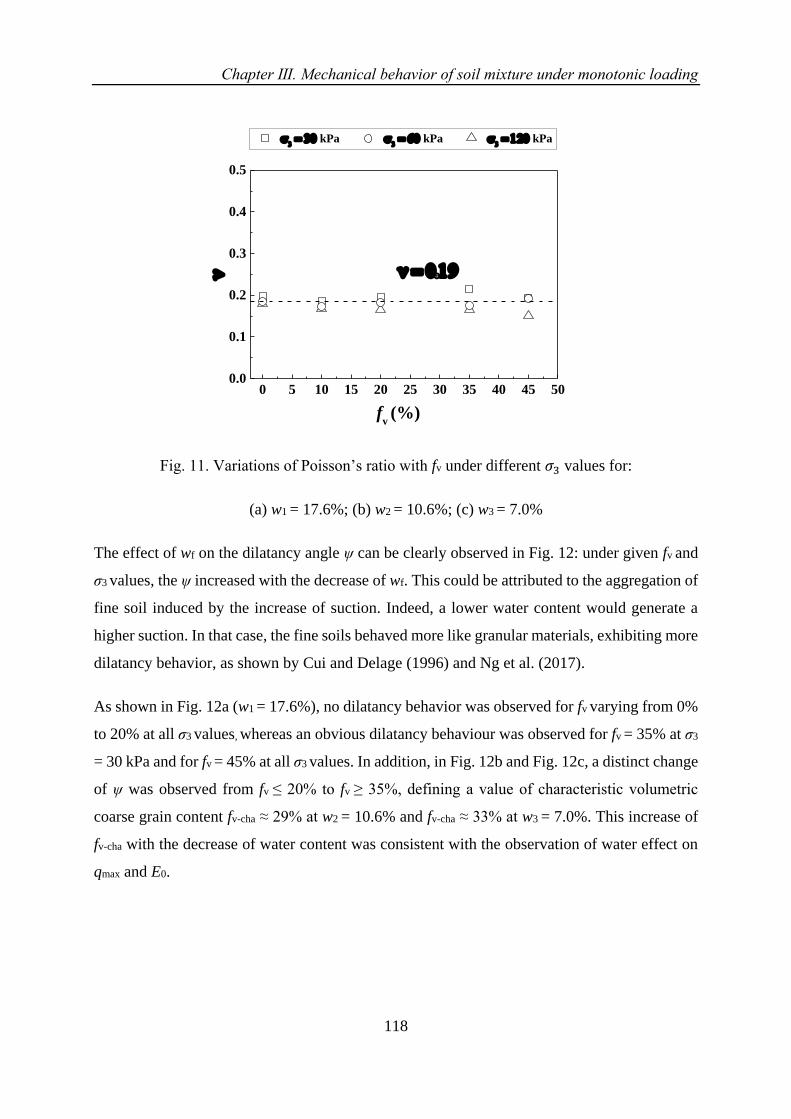
Chapter Ⅲ. Mechanical behavior of soil mixture under monotonic loading
118
0 5 10 15 20 25 30 35 40 45 500.0
0.1
0.2
0.3
0.4
0.5
=
fv (%)
= kPa
= kPa
= kPa
Fig. 11. Variations of Poisson’s ratio with fv under different 𝜎3 values for:
(a) w1 = 17.6%; (b) w2 = 10.6%; (c) w3 = 7.0%
The effect of wf on the dilatancy angle ψ can be clearly observed in Fig. 12: under given fv and
σ3 values, the ψ increased with the decrease of wf. This could be attributed to the aggregation of
fine soil induced by the increase of suction. Indeed, a lower water content would generate a
higher suction. In that case, the fine soils behaved more like granular materials, exhibiting more
dilatancy behavior, as shown by Cui and Delage (1996) and Ng et al. (2017).
As shown in Fig. 12a (w1 = 17.6%), no dilatancy behavior was observed for fv varying from 0%
to 20% at all σ3 values, whereas an obvious dilatancy behaviour was observed for fv = 35% at σ3
= 30 kPa and for fv = 45% at all σ3 values. In addition, in Fig. 12b and Fig. 12c, a distinct change
of ψ was observed from fv ≤ 20% to fv ≥ 35%, defining a value of characteristic volumetric
coarse grain content fv-cha ≈ 29% at w2 = 10.6% and fv-cha ≈ 33% at w3 = 7.0%. This increase of
fv-cha with the decrease of water content was consistent with the observation of water effect on
qmax and E0.
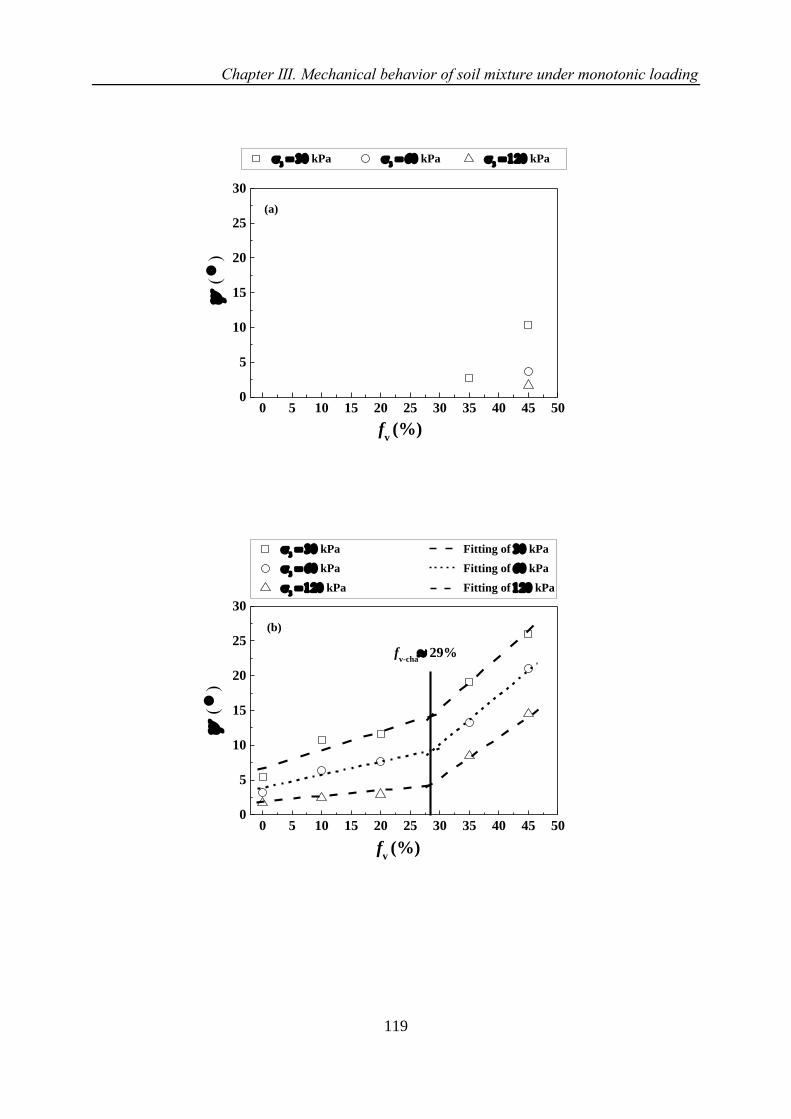
Chapter Ⅲ. Mechanical behavior of soil mixture under monotonic loading
119
0 5 10 15 20 25 30 35 40 45 500
5
10
15
20
25
30
(a)
fv (%)
= kPa
= kPa
= kPa
(
)
0 5 10 15 20 25 30 35 40 45 500
5
10
15
20
25
30
(b)
fv-cha
29%
fv (%)
= kPa Fitting of kPa
= kPa Fitting of kPa
= kPa Fitting of kPa
(
)
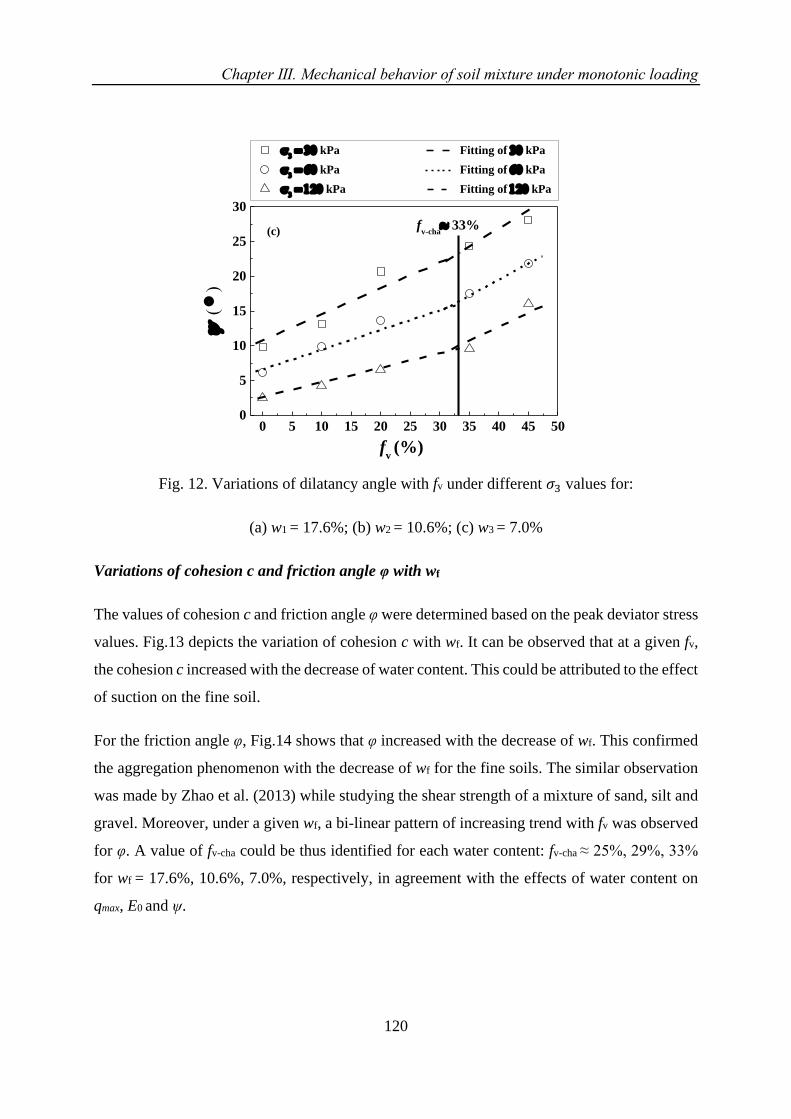
Chapter Ⅲ. Mechanical behavior of soil mixture under monotonic loading
120
0 5 10 15 20 25 30 35 40 45 500
5
10
15
20
25
30
(c)f
v-cha 33%
fv (%)
= kPa Fitting of kPa
= kPa Fitting of kPa
= kPa Fitting of kPa
(
)
Fig. 12. Variations of dilatancy angle with fv under different 𝜎3 values for:
(a) w1 = 17.6%; (b) w2 = 10.6%; (c) w3 = 7.0%
Variations of cohesion c and friction angle φ with wf
The values of cohesion c and friction angle φ were determined based on the peak deviator stress
values. Fig.13 depicts the variation of cohesion c with wf. It can be observed that at a given fv,
the cohesion c increased with the decrease of water content. This could be attributed to the effect
of suction on the fine soil.
For the friction angle φ, Fig.14 shows that φ increased with the decrease of wf. This confirmed
the aggregation phenomenon with the decrease of wf for the fine soils. The similar observation
was made by Zhao et al. (2013) while studying the shear strength of a mixture of sand, silt and
gravel. Moreover, under a given wf, a bi-linear pattern of increasing trend with fv was observed
for φ. A value of fv-cha could be thus identified for each water content: fv-cha ≈ 25%, 29%, 33%
for wf = 17.6%, 10.6%, 7.0%, respectively, in agreement with the effects of water content on
qmax, E0 and ψ.
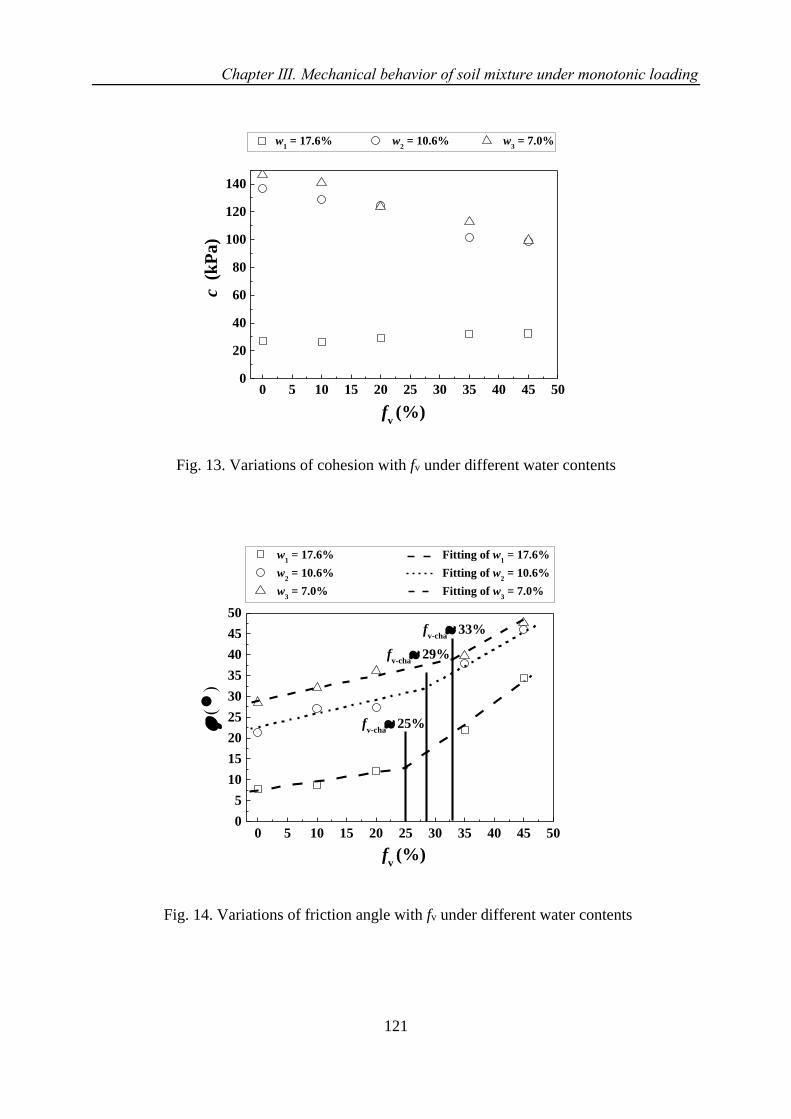
Chapter Ⅲ. Mechanical behavior of soil mixture under monotonic loading
121
0 5 10 15 20 25 30 35 40 45 500
20
40
60
80
100
120
140
fv (%)
w1 = 17.6% w
2 = 10.6% w
3 = 7.0%
c (
kP
a)
Fig. 13. Variations of cohesion with fv under different water contents
0 5 10 15 20 25 30 35 40 45 500
5
10
15
20
25
30
35
40
45
50
fv (%)
fv-cha
33%
fv-cha
29%
fv-cha
25%
w1 = 17.6% Fitting of w
1 = 17.6%
w2 = 10.6% Fitting of w
2 = 10.6%
w3 = 7.0% Fitting of w
3 = 7.0%
(
)
Fig. 14. Variations of friction angle with fv under different water contents
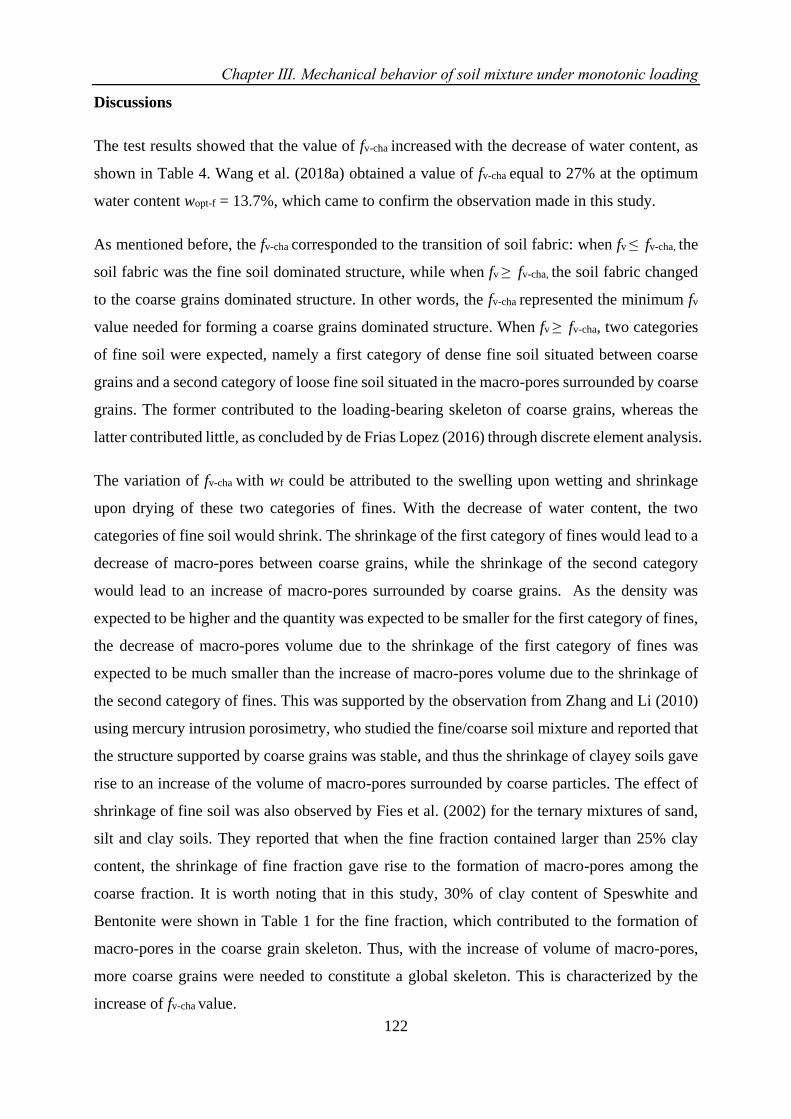
Chapter Ⅲ. Mechanical behavior of soil mixture under monotonic loading
122
Discussions
The test results showed that the value of fv-cha increased with the decrease of water content, as
shown in Table 4. Wang et al. (2018a) obtained a value of fv-cha equal to 27% at the optimum
water content wopt-f = 13.7%, which came to confirm the observation made in this study.
As mentioned before, the fv-cha corresponded to the transition of soil fabric: when fv ≤ fv-cha, the
soil fabric was the fine soil dominated structure, while when fv ≥ fv-cha, the soil fabric changed
to the coarse grains dominated structure. In other words, the fv-cha represented the minimum fv
value needed for forming a coarse grains dominated structure. When fv ≥ fv-cha, two categories
of fine soil were expected, namely a first category of dense fine soil situated between coarse
grains and a second category of loose fine soil situated in the macro-pores surrounded by coarse
grains. The former contributed to the loading-bearing skeleton of coarse grains, whereas the
latter contributed little, as concluded by de Frias Lopez (2016) through discrete element analysis.
The variation of fv-cha with wf could be attributed to the swelling upon wetting and shrinkage
upon drying of these two categories of fines. With the decrease of water content, the two
categories of fine soil would shrink. The shrinkage of the first category of fines would lead to a
decrease of macro-pores between coarse grains, while the shrinkage of the second category
would lead to an increase of macro-pores surrounded by coarse grains. As the density was
expected to be higher and the quantity was expected to be smaller for the first category of fines,
the decrease of macro-pores volume due to the shrinkage of the first category of fines was
expected to be much smaller than the increase of macro-pores volume due to the shrinkage of
the second category of fines. This was supported by the observation from Zhang and Li (2010)
using mercury intrusion porosimetry, who studied the fine/coarse soil mixture and reported that
the structure supported by coarse grains was stable, and thus the shrinkage of clayey soils gave
rise to an increase of the volume of macro-pores surrounded by coarse particles. The effect of
shrinkage of fine soil was also observed by Fies et al. (2002) for the ternary mixtures of sand,
silt and clay soils. They reported that when the fine fraction contained larger than 25% clay
content, the shrinkage of fine fraction gave rise to the formation of macro-pores among the
coarse fraction. It is worth noting that in this study, 30% of clay content of Speswhite and
Bentonite were shown in Table 1 for the fine fraction, which contributed to the formation of
macro-pores in the coarse grain skeleton. Thus, with the increase of volume of macro-pores,
more coarse grains were needed to constitute a global skeleton. This is characterized by the
increase of fv-cha value.
Chapter Ⅲ. Mechanical behavior of soil mixture under monotonic loading
123
Conclusions
The effect of wf on the mechanical behavior of interlayer soil at various fv was investigated by
monotonic triaxial tests. Three water contents (wf = 17.6%, 10.6%, and 7.0%), five volumetric
coarse grain contents (fv = 0%, 10%, 20%, 35% and 45%) and three confining pressures (σ3 =
30, 60 and 120 kPa) were considered. The obtained results allowed the following conclusions
to be drawn.
The decrease of water content led to an increase of the peak deviator stress qmax and the Young’s
modulus E0. This could be explained by the effect of suction with the decrease of water content.
The Poisson’s ratio ν was found to decrease with the decrease of water content, because the
horizontal deformation was reduced by the increase of suction. The dilatancy angle ψ and the
friction angle φ were found to increase with the decrease of water content. This was attributed
to the aggregation of fine soil induced by the increase of suction, enhancing the dilatancy
behavior and the friction of soil. A larger cohesion c was observed at lower wf, also due to the
effect of suction in fine soil.
The variation of qmax, E0, ψ, and φ with fv followed a bi-linear pattern, defining a same
characteristic fv-cha value for a given wf value: fv-cha ≈ 25%, 29% and 33% for wf = 17.6%, 10.6%
and 7.0%, respectively. The value of fv-cha ≈ 27% at wopt = 13.7% reported by Wang et al. (2018a)
came to support this observation. This was attributed to the swelling upon wetting and shrinkage
upon drying of two categories of fine soil: a first category of dense fine soil situated between
coarse grains and a second category of loose fine soil situated in the macro-pores surrounded
by coarse grains. With the decrease of water content, the two categories of fine soils would
shrink. Moreover, the shrinkage of the first category of fines would lead to a decrease of macro-
pores between coarse grains, while the shrinkage of the second category would lead to an
increase of macro-pores surrounded by coarse grains. As the decrease of macro-pores volume
due to the shrinkage of the first category of fines was expected to be much smaller than the
increase of macro-pores volume due to the shrinkage of the second category of fines, the global
macro-pores volume was increasing with the decrease of water content. In that case, more
coarse grains were needed to constitute a global skeleton, leading to an increase of fv-cha.
Chapter Ⅲ. Mechanical behavior of soil mixture under monotonic loading
124
Acknowledgements
This work was supported by the China Scholarship Council (CSC) and Ecole des Ponts
ParisTech.
References
Alias La voie ferr´ee. 1984. Techniques de construction et d’entretien. 2nd Ed., Eyrolles.
ASTM D698-12. 2012. Standard test methods for laboratory compaction characteristics of soil
using standard effort. ASTM International, West Conshohocken, Pa.
Cui, Y. J., & Delage, P. 1996. Yeilding and plastic behaviour of an unsaturated compacted silt.
Géotechnique, 46(2), 291-311.
Cui, Y.J., Duong, T.V., Tang, A.M., Dupla, J.C., Calon, N. and Robinet, A., 2013. Investigation
of the hydro-mechanical behaviour of fouled ballast. Journal of Zhejiang University
Science A, 14(4), pp.244-255.
Duong, T.V., Tang, A.M., Cui, Y.J., Trinh, V.N., Dupla, J.C., Calon, N., Canou, J. and Robinet,
A., 2013. Effects of fines and water contents on the mechanical behavior of interlayer soil
in ancient railway sub-structure. Soils and foundations, 53(6), pp.868-878.
Duong, T.V., Cui, Y.J., Tang, A.M., Dupla, J.C., Canou, J., Calon, N. and Robinet, A., 2014.
Investigating the mud pumping and interlayer creation phenomena in railway sub-
structure. Engineering geology, 171, pp.45-58.
Duong, T.V., Cui, Y.J., Tang, A.M., Dupla, J.C., Canou, J., Calon, N. and Robinet, A., 2016.
Effects of water and fines contents on the resilient modulus of the interlayer soil of railway
substructure. Acta Geotechnica, 11(1), pp.51-59.
de Frias Lopez, R., Silfwerbrand, J., Jelagin, D., & Birgisson, B. 2016. Force transmission and
soil fabric of binary granular mixtures. Géotechnique, 66(7), 578-583.
Fiès, J. C., Louvigny, N. D. E., & Chanzy, A. 2002. The role of stones in soil water retention.
European Journal of Soil Science, 53(1), 95-104.
Lamas-Lopez, F., d’Aguiar, S.C., Robinet, A., Cui, Y.J., Calon, N., Canou, J., Dupla, J.C. and
Tang, A.M., 2015. In-situ investigation of the behaviour of a French conventional railway
platform. In Proceedings of the transportation research board 94th annual meeting.
Washington, DC (pp. 15-1076).
Lamas-lopez, F. 2016. Field and laboratory investigation on the dynamic behavior of
conventional railway track-bed materials in the context of traffic upgrade. PhD Thesis,
Ecole Nationale des Ponts et Chaussées, Université Paris-Est.
Ng, C. W. W., Baghbanrezvan, S., Sadeghi, H., Zhou, C., & Jafarzadeh, F. 2017. Effect of
specimen preparation techniques on dynamic properties of unsaturated fine-grained soil at
high suctions. Canadian Geotechnical Journal, 54(9), 1310-1319.
Chapter Ⅲ. Mechanical behavior of soil mixture under monotonic loading
125
Qi, S., Cui, Y. J., Chen, R. P., Wang, H. L., Lamas-Lopez, F., Aimedieu, P., ... & Saussine, G.
2020. Influence of grain size distribution of inclusions on the mechanical behaviours of
track-bed materials. Géotechnique, 70(3), 238-247.
Selig, E. T., & Waters, J. M. 1994. Track geotechnology and substructure management. Thomas
Telford.
Seif El Dine, B., Dupla, J. C., Frank, R., Canou, J., & Kazan, Y. 2010. Mechanical
characterization of matrix coarse-grained soils with a large-sized triaxial device. Canadian
Geotechnical Journal, 47(4), 425-438.
Trinh, V. N. 2011. Comportement hydromécanique des matériaux constitutifs de plateformes
ferroviaires anciennes. PhD Thesis, Ecole Nationale des Ponts et Chaussées, Université
Paris-Est.
Trinh, V.N., Tang, A.M., Cui, Y.J., Dupla, J.C., Canou, J., Calon, N., Lambert, L., Robinet, A.
and Schoen, O., 2012. Mechanical characterisation of the fouled ballast in ancient railway
track substructure by large-scale triaxial tests. Soils and foundations, 52(3), pp.511-523.
Vermeer, P. A. 1998. Non-associated Plasticity for Soils, Concrete and Rock. In Physics of Dry
Granular Media, edited by H. J.Herrmann, J. P. Hovi, and S. Luding, 163–196. Dordrecht,
the Netherlands: Springer. https://doi.org/10.1007/978-94-017-2653-5_10
Vallejo, L. E. 2001. Interpretation of the limits in shear strength in binary granular mixtures.
Canadian Geotechnical Journal, 38(5), 1097-1104.
Wang, H.L., Cui, Y.J., Lamas-Lopez, F., Dupla, J.C., Canou, J., Calon, N., Saussine, G.,
Aimedieu, P. and Chen, R.P., 2017. Effects of inclusion contents on resilient modulus and
damping ratio of unsaturated track-bed materials. Canadian Geotechnical Journal, 54(12),
pp.1672-1681.
Wang, H.L., Cui, Y.J., Lamas-Lopez, F., Calon, N., Saussine, G., Dupla, J.C., Canou, J.,
Aimedieu, P. and Chen, R.P., 2018a. Investigation on the mechanical behavior of track-
bed materials at various contents of coarse grains. Construction and Building
Materials, 164, pp.228-237.
Wang, H.L., Cui, Y.J., Lamas-Lopez, F., Dupla, J.C., Canou, J., Calon, N., Saussine, G.,
Aimedieu, P. and Chen, R.P., 2018b. Permanent deformation of track-bed materials at
various inclusion contents under large number of loading cycles. Journal of Geotechnical
and Geoenvironmental Engineering, 144(8), p.04018044.
Zhang, L.M. and Li, X., 2010. Microporosity structure of coarse granular soils. Journal of
Geotechnical and Geoenvironmental Engineering, 136(10), pp.1425-1436.
Zhao, H. F., Zhang, L. M., & Fredlund, D. G. 2013. Bimodal shear-strength behavior of
unsaturated coarse-grained soils. Journal of geotechnical and geoenvironmental
engineering, 139(12), 2070-2081.
Chapter Ⅳ. Mechanical behavior of soil mixture under cyclic loading
126
CHAPTER Ⅳ. MECHANICAL BEHAVIOR OF SOIL
MIXTURE UNDER CYCLIC LOADING
In-situ investigation showed that the interlayer soil was subjected to varying traffic loadings.
With respect to rainfall and evaporation, the variation of water content induced changes of
dynamic properties of interlayer soil, which can significantly affect the stability of rail tracks.
The effect of water content on the permanent strain of mixture with varying coarse grain
contents fv was studied. A multi-stage loading procedure was adopted, with various deviator
stresses of 10, 15, 20, 25, 30 kPa applied. A large number of loading cycles N = 90000 was
adopted for each stage. Comparison with previous studies showed that when the dry density of
fine soil ρd-f kept constant, an increase of fv led to a decrease of permanent strain, due to the
reinforcement effect of coarse grains. On the contrary, when the dry density of mixture ρd kept
constant, the ρd-f decreased with increasing fv, and the suction decreased accordingly. When the
negative effect of decreasing suction prevailed on the positive effect of increasing fv, the
permanent strain increased with increasing fv. This part corresponded to a paper submitted to
Acta Geotechnica.
The effect of water content on resilient modulus and damping ratio of mixture with varying
coarse grain contents fv were also investigated. A multi-stage loading procedure was adopted,
with various deviator stresses of 10, 30, 50, 100, 200 kPa applied. A small number of loading
cycles N = 100 was adopted for each stage. Results showed that an increase of water content
led to a decrease of resilient modulus owing to the decrease of suction while an increase of
damping ratio owing to the increase of soil viscosity. Through the variations of resilient
modulus and damping ratio with coarse grain content, a characteristic coarse grain content fv-cha
was identified at a given water content: fv-cha ≈ 25.5% and 32.0% at a water content of 17.6%
and 10.6%, respectively. The increase of fv-cha with decreasing water content was explained by
the shrinkage property of fine soil. Comparison of the fv-cha values under cyclic loading and
monotonic loading showed that cyclic loading led to a slightly larger value than monotonic
loading, evidencing the effect of cyclic loading on soil fabric. These results were presented in
a paper published in Transportation Geotechnics.
Chapter Ⅳ. Mechanical behavior of soil mixture under cyclic loading
127
Su, Y., Cui, Y. J., Dupla, J. C., & Canou, J. 2021. Submitted to Acta Geotechnica.
Effect of water content on permanent deformation of fine/coarse soil
mixtures with varying coarse grain contents and subjected to multi-stage
cyclic loading
Yu Su, Yu-Jun Cui, Jean-Claude Dupla, Jean Canou5
Abstract: An interlayer soil in ancient rail tracks was identified as a mixture of ballast grains
and subgrade fines. As the permanent strain 휀1𝑝 of such mixture was affected by water content,
cyclic triaxial tests were performed, under varying water contents of fines wf and coarse grain
contents fv. Comparison between present and previous studies showed the significant effect of
sample preparation method on 휀1𝑝
. In present study, a constant fine dry density ρd-f was
maintained, leading to an unchanged suction of mixture whatever the fv value. In this case, only
the reinforcement effect of fv on 휀1𝑝 was identified. By contrast, in previous studies, the global
dry density of mixture ρd was kept constant, resulting in a decrease of ρd-f with increasing fv and
consequently a decrease of suction. In this case, when the negative effect of decreasing suction
prevailed on the positive reinforcement effect of increasing fv, the 휀1𝑝 increased.
Keywords: interlayer soil; cyclic triaxial test; permanent deformation; water content; coarse
grain content; fabric/ structure of soils
Introduction
An interlayer was created in most conventional French rail tracks, mainly due to the
interpenetration of ballast grains and subgrade fine soils. This interlayer was maintained in the
railway substructure in the French program of rail track renewal considering its high dry density
(2.4 Mg/m3, Trinh 2011), Cui et al. (2013) and, hence, bearing capacity. As an important
component of rail track, the interlayer soil diffused static and dynamic stresses into the
substructure, avoiding excessive deformation. In this case, the deformation behavior of
interlayer soil appeared to be significant, especially for the long-term stability of rail track. Field
observation showed that the ballast grain content decreased over depth in the interlayer soil
(Trinh 2011). However, the interlayer could be approximately divided into two parts: the upper
part dominated by ballast grains and the lower part dominated by subgrade fine soil. With the
unstable groundwater and climate change (rainfall and evaporation), the water content of
interlayer soil can change over time, significantly affecting its permanent deformation behavior.
Ecole des Ponts ParisTech, Laboratoire Navier/CERMES, 6 – 8 av. Blaise Pascal, Cité Descartes, Champs-sur-
Marne, 77455 Marne – la – Vallée cedex 2, France
Chapter Ⅳ. Mechanical behavior of soil mixture under cyclic loading
128
Thus, in order to ensure the good serviceability of the tracks, it is essential to understand the
effect of water content on the permanent deformation of interlayer soil.
The effect of coarse grain content on permanent deformation of soil have been investigated by
several investigators. Song and Ooi (2010) studied the deformation behaviour of aggregates
with varying fine soil contents, and found that increasing fine content gave rise to an increase
of permanent deformation of soil mixtures. Wang et al. (2018a) investigated the effect of coarse
grain content fv (ratio of coarse grain volume to total volume) on permanent strain of interlayer
soil by cyclic triaxial tests. They identified a characteristic coarse grain content fv-cha in a narrow
range from 25.8% to 27.8%: a large decrease of permanent strain with fv was observed at fv ≤
fv-cha, but a slight decrease of that at fv ≥ fv-cha. It is worth noting that these tests were performed
under a constant water content of fine soils fraction wopt-f = 13.7%, and the effect of water
content was not specifically addressed . Some studies evidenced the effect of water content on
permanent deformation of substructures: at saturation, an excess pore water pressure
accumulated under traffic loadings led to a decrease of effective stress and an increase of
permanent deformation. When the water content decreased, the permanent deformation
appeared to decrease, which was attributed to the contribution of suction (Gidel et al. 2001;
Werkmeister et al. 2001; Nie et al. 2020; Trinh et al. 2012; Jing 2017; Wan et al. 2020). Gu et
al. (2020) studied the permanent deformation of unbound granular materials by suction-
controlled cyclic triaxial tests, and reported that an increase of suction led to a decrease of
accumulated permanent strain exponentially under varying deviator stress amplitudes. Duong
et al. (2013) investigated the effect of water content on permanent deformation of the upper
interlayer soil with varying fine soil contents, and found that the effects of water content and
fine content on permanent deformation were strongly related. At saturated state, an increase of
fine content gave rise to an increase of permanent deformation, while at unsaturated state, an
opposite trend was observed, due to the contribution of suction developed in the fines. Jing
(2017) studied the deformation behaviour of granular material with varying water contents and
fine contents, and also reported that increasing fine content led to an increase of permanent
deformation under saturated condition and a decrease of that under unsaturated condition. Note
that in most studies, the dry density of fine/coarse soil mixtures remained constant during the
sample preparation; thereby a variation of dry density of fine soil fraction was induced with
varying fine contents (or coarse grain contents). In that case, both suction and coarse grain
content varied, rendering the test results difficult to be analysed.
Chapter Ⅳ. Mechanical behavior of soil mixture under cyclic loading
129
This study aims at investigating the effect of water content on the permanent deformation of
fine/coarse soil mixtures under various coarse grain contents. A series of cyclic triaxial tests
were performed for this purpose. Emphasis was put on keeping the fine dry density ρd-f constant
in all samples, allowing a constant suction of soil mixtures whatever the fv value. A multi-step
loading procedure at various deviator stress amplitudes of 10, 15, 20, 25 and 30 kPa was applied,
with a number of loading cycles at 90000 for each stress amplitude. Two target water contents
of fine soil (17.6% and 10.6%) and five coarse grain contents (0%, 10%, 20%, 35% and 45%)
were considered.
Materials and sample preparation
Considering the difficulty of obtaining intact interlayer soil from the field, the reconstituted
soils consisting of fine soil and coarse grains were fabricated in the laboratory. For re-
constituting the fine soil, nine different commercial soils (Table 1) are mixed with the pre-
determined proportions, to obtain a similar grain size distribution curve of fines from ‘Senissiat
site’ (Fig. 1). Note that in this study fines refer to the soil finer than ballast in the field, which
correspond to a mixture encompassing grains of clay to sand sizes. The liquid limit and
plasticity index of reconstituted fine soil were 32% and 20%, respectively, classifying the soil
as CL based on the universal soil classification system. Fig. 2 presents the standard proctor
compaction curve of fine soil, defining an optimum water content wopt-f = 13.7% and a maximum
dry density ρdmax-f = 1.82 Mg/m3.
For the coarse grains, based on a parallel gradation method applied by Wang et al. (2018b) , Qi
et al. (2020a) and Su et al. (2020a, 2020b, 2021a), which was verified later by Qi et al. (2020b),
micro-ballast was adopted to replace the real ballast in Fig.1. A parameter of coarse grain
content fv (Wang et al. 2018b), defined as the ratio of the volume of coarse grains Vc to the total
volume of fine/coarse mixture V (Eq. (1)), was adopted in this study. All voids and water were
assumed to be contained in the fine soil (Fig. 3). Thus, under a given fv, the dry density of fine
soil ρd-f and the water content of fine soil wf, the masses of coarse grain ms-c, fine grain ms-c and
the water content of fine soil mw-f were calculated by Eqs. (2) – (4), respectively.
𝑓v =𝑉c
𝑉=
𝑉c
𝑉c+𝑉f=
𝑉c
𝑉c+𝑉s−f+𝑉w−f+𝑉a−f (1)
where Vf is the volume of fine soil; Vs-f, Vw-f and Va-f are the volume of fine grains, water and
air in the fine soil, respectively.
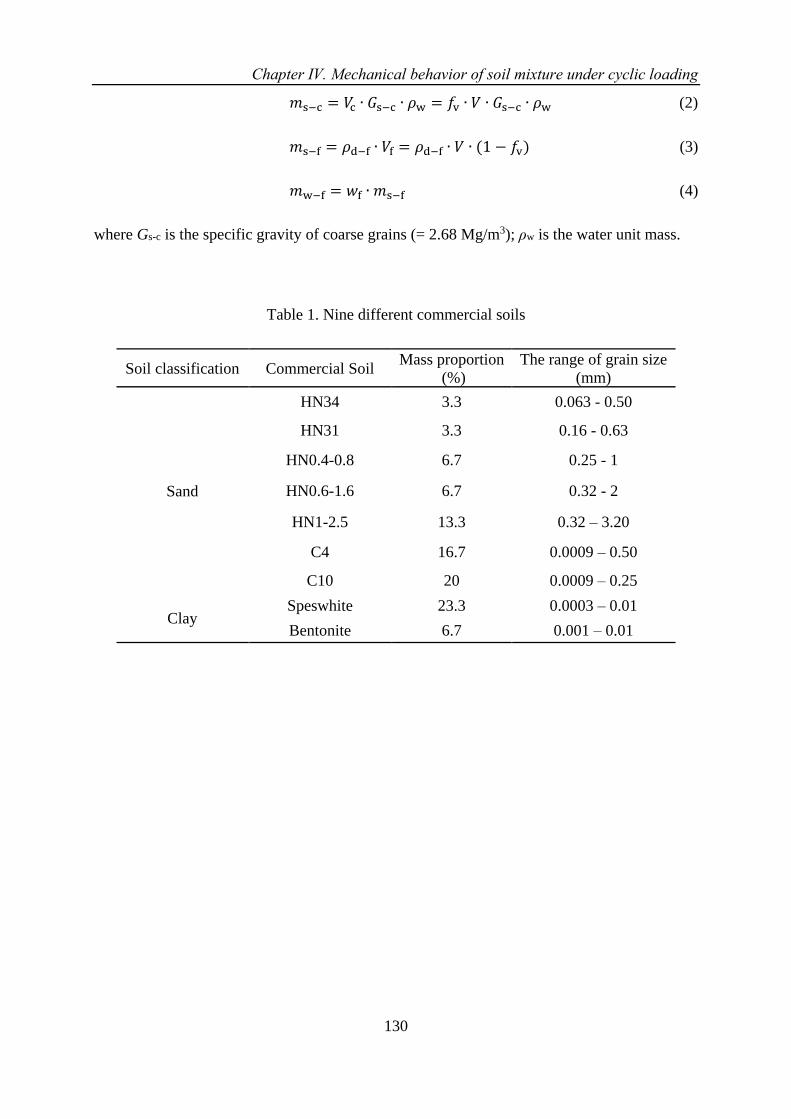
Chapter Ⅳ. Mechanical behavior of soil mixture under cyclic loading
130
𝑚s−c = 𝑉c ∙ 𝐺s−c ∙ 𝜌w = 𝑓v ∙ 𝑉 ∙ 𝐺s−c ∙ 𝜌w (2)
𝑚s−f = 𝜌d−f ∙ 𝑉f = 𝜌d−f ∙ 𝑉 ∙ (1 − 𝑓v) (3)
𝑚w−f = 𝑤f ∙ 𝑚s−f (4)
where Gs-c is the specific gravity of coarse grains (= 2.68 Mg/m3); ρw is the water unit mass.
Table 1. Nine different commercial soils
Soil classification Commercial Soil Mass proportion
(%)
The range of grain size
(mm)
Sand
HN34 3.3 0.063 - 0.50
HN31 3.3 0.16 - 0.63
HN0.4-0.8 6.7 0.25 - 1
HN0.6-1.6 6.7 0.32 - 2
HN1-2.5 13.3 0.32 – 3.20
C4 16.7 0.0009 – 0.50
C10 20 0.0009 – 0.25
Clay Speswhite 23.3 0.0003 – 0.01
Bentonite 6.7 0.001 – 0.01
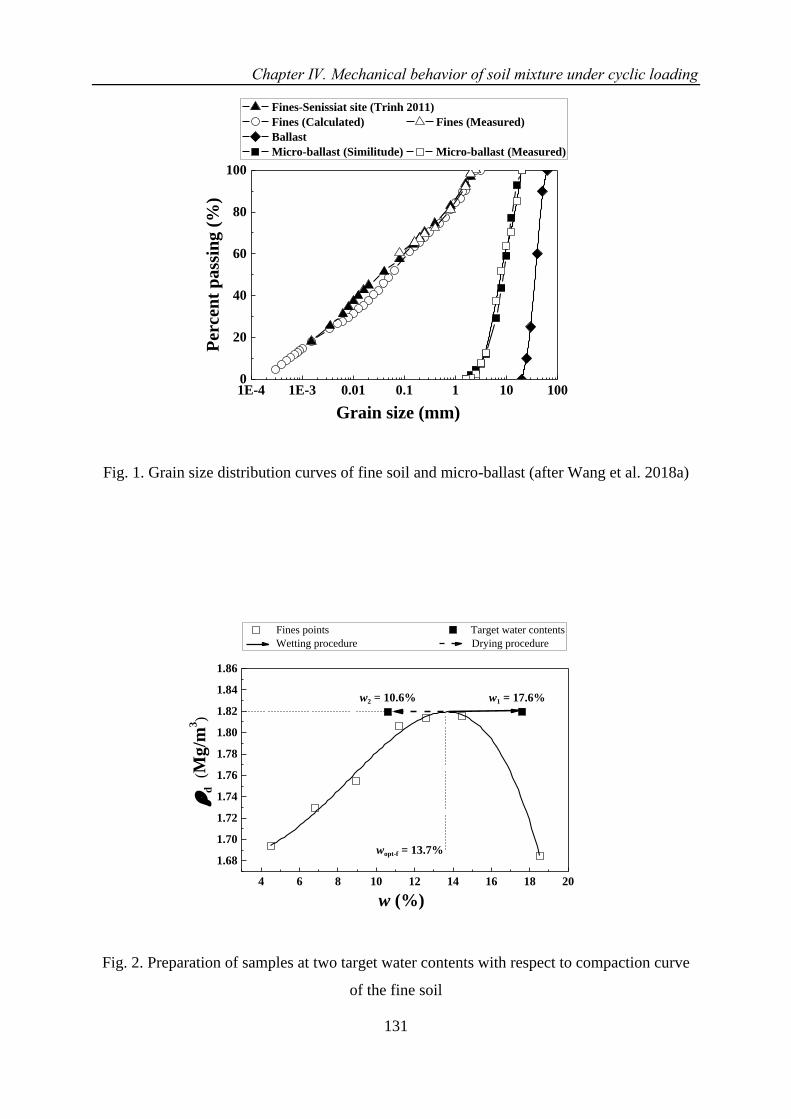
Chapter Ⅳ. Mechanical behavior of soil mixture under cyclic loading
131
1E-4 1E-3 0.01 0.1 1 10 1000
20
40
60
80
100
Fines-Senissiat site (Trinh 2011)
Fines (Calculated) Fines (Measured)
Ballast
Micro-ballast (Similitude) Micro-ballast (Measured)
Per
cen
t p
ass
ing
(%
)
Grain size (mm)
Fig. 1. Grain size distribution curves of fine soil and micro-ballast (after Wang et al. 2018a)
4 6 8 10 12 14 16 18 20
1.68
1.70
1.72
1.74
1.76
1.78
1.80
1.82
1.84
1.86
wopt-f = 13.7%
w2 = 10.6%
d
(Mg
/m3)
w (%)
Fines points Target water contents
Wetting procedure Drying procedure
w1 = 17.6%
Fig. 2. Preparation of samples at two target water contents with respect to compaction curve
of the fine soil
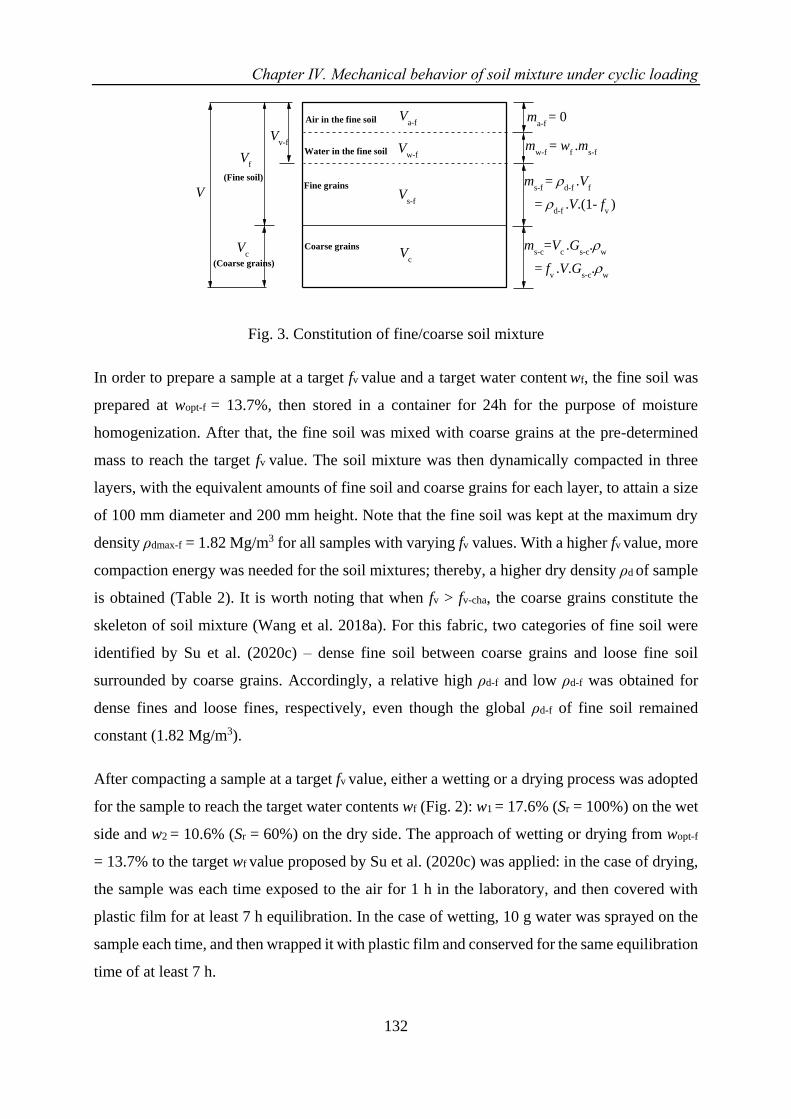
Chapter Ⅳ. Mechanical behavior of soil mixture under cyclic loading
132
ms-c
=Vc .G
s-c.
w
= fv .V.G
s-c.
w
ms-f
= d-f
.Vf
= d-f
.V.(1- fv )
mw-f
= wf .m
s-f
Coarse grains
Fine grains
Water in the fine soil
Vv-f
(Coarse grains)
Vc
(Fine soil)
Vf
V
Va-f
Vw-f
Vs-f
Vc
ma-f
= 0Air in the fine soil
Fig. 3. Constitution of fine/coarse soil mixture
In order to prepare a sample at a target fv value and a target water content wf, the fine soil was
prepared at wopt-f = 13.7%, then stored in a container for 24h for the purpose of moisture
homogenization. After that, the fine soil was mixed with coarse grains at the pre-determined
mass to reach the target fv value. The soil mixture was then dynamically compacted in three
layers, with the equivalent amounts of fine soil and coarse grains for each layer, to attain a size
of 100 mm diameter and 200 mm height. Note that the fine soil was kept at the maximum dry
density ρdmax-f = 1.82 Mg/m3 for all samples with varying fv values. With a higher fv value, more
compaction energy was needed for the soil mixtures; thereby, a higher dry density ρd of sample
is obtained (Table 2). It is worth noting that when fv > fv-cha, the coarse grains constitute the
skeleton of soil mixture (Wang et al. 2018a). For this fabric, two categories of fine soil were
identified by Su et al. (2020c) – dense fine soil between coarse grains and loose fine soil
surrounded by coarse grains. Accordingly, a relative high ρd-f and low ρd-f was obtained for
dense fines and loose fines, respectively, even though the global ρd-f of fine soil remained
constant (1.82 Mg/m3).
After compacting a sample at a target fv value, either a wetting or a drying process was adopted
for the sample to reach the target water contents wf (Fig. 2): w1 = 17.6% (Sr = 100%) on the wet
side and w2 = 10.6% (Sr = 60%) on the dry side. The approach of wetting or drying from wopt-f
= 13.7% to the target wf value proposed by Su et al. (2020c) was applied: in the case of drying,
the sample was each time exposed to the air for 1 h in the laboratory, and then covered with
plastic film for at least 7 h equilibration. In the case of wetting, 10 g water was sprayed on the
sample each time, and then wrapped it with plastic film and conserved for the same equilibration
time of at least 7 h.
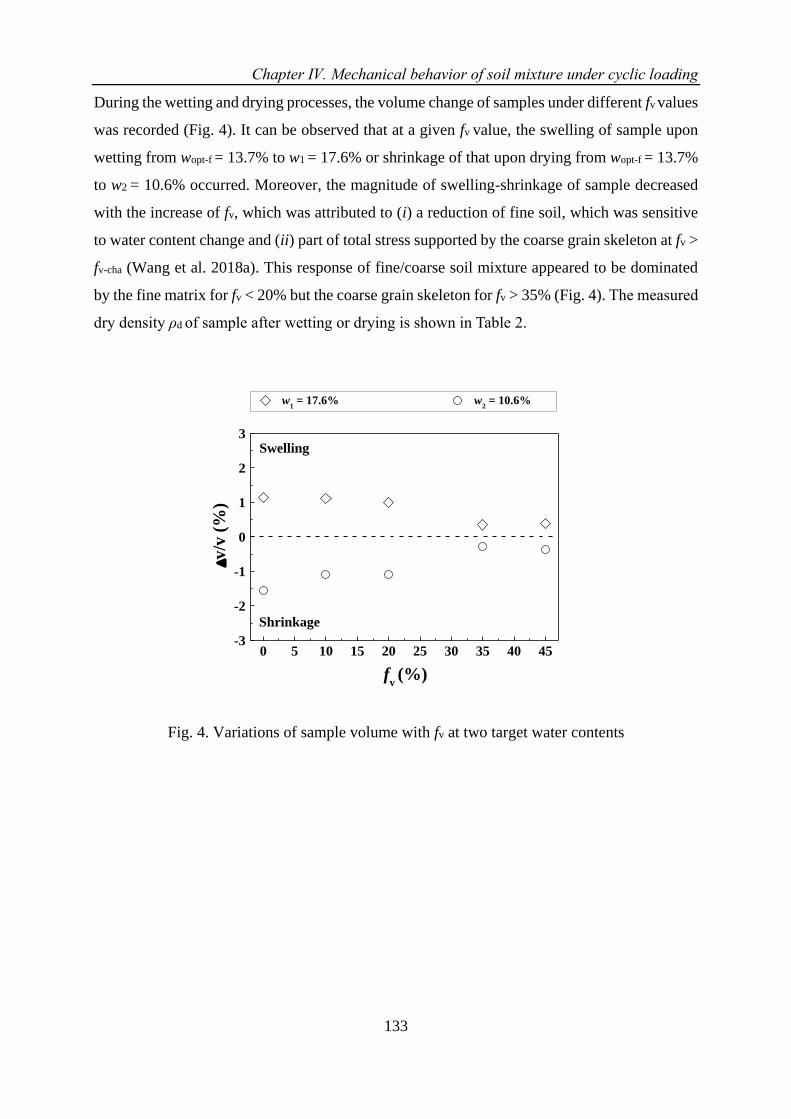
Chapter Ⅳ. Mechanical behavior of soil mixture under cyclic loading
133
During the wetting and drying processes, the volume change of samples under different fv values
was recorded (Fig. 4). It can be observed that at a given fv value, the swelling of sample upon
wetting from wopt-f = 13.7% to w1 = 17.6% or shrinkage of that upon drying from wopt-f = 13.7%
to w2 = 10.6% occurred. Moreover, the magnitude of swelling-shrinkage of sample decreased
with the increase of fv, which was attributed to (i) a reduction of fine soil, which was sensitive
to water content change and (ii) part of total stress supported by the coarse grain skeleton at fv >
fv-cha (Wang et al. 2018a). This response of fine/coarse soil mixture appeared to be dominated
by the fine matrix for fv < 20% but the coarse grain skeleton for fv > 35% (Fig. 4). The measured
dry density ρd of sample after wetting or drying is shown in Table 2.
0 5 10 15 20 25 30 35 40 45-3
-2
-1
0
1
2
3
fv (%)
Shrinkage
w1 = 17.6% w
2 = 10.6%
v/v
(%
)
Swelling
Fig. 4. Variations of sample volume with fv at two target water contents
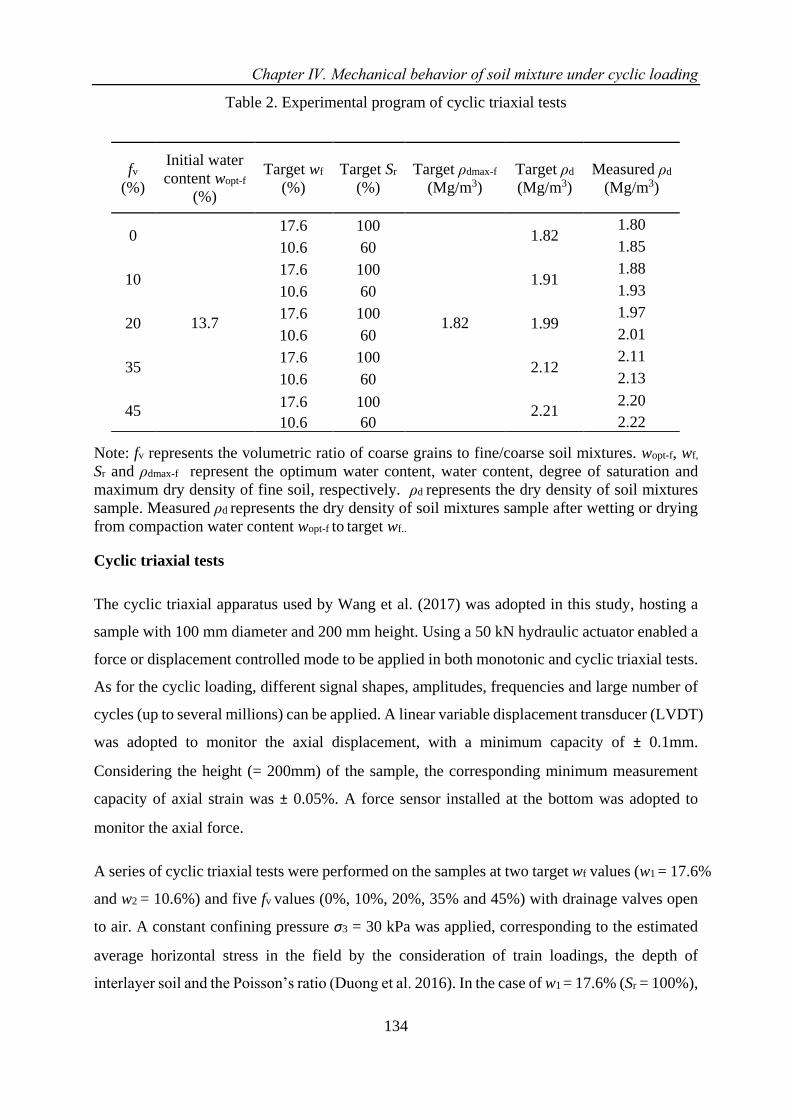
Chapter Ⅳ. Mechanical behavior of soil mixture under cyclic loading
134
Table 2. Experimental program of cyclic triaxial tests
Note: fv represents the volumetric ratio of coarse grains to fine/coarse soil mixtures. wopt-f, wf,
Sr and ρdmax-f represent the optimum water content, water content, degree of saturation and
maximum dry density of fine soil, respectively. ρd represents the dry density of soil mixtures
sample. Measured ρd represents the dry density of soil mixtures sample after wetting or drying
from compaction water content wopt-f to target wf..
Cyclic triaxial tests
The cyclic triaxial apparatus used by Wang et al. (2017) was adopted in this study, hosting a
sample with 100 mm diameter and 200 mm height. Using a 50 kN hydraulic actuator enabled a
force or displacement controlled mode to be applied in both monotonic and cyclic triaxial tests.
As for the cyclic loading, different signal shapes, amplitudes, frequencies and large number of
cycles (up to several millions) can be applied. A linear variable displacement transducer (LVDT)
was adopted to monitor the axial displacement, with a minimum capacity of ± 0.1mm.
Considering the height (= 200mm) of the sample, the corresponding minimum measurement
capacity of axial strain was ± 0.05%. A force sensor installed at the bottom was adopted to
monitor the axial force.
A series of cyclic triaxial tests were performed on the samples at two target wf values (w1 = 17.6%
and w2 = 10.6%) and five fv values (0%, 10%, 20%, 35% and 45%) with drainage valves open
to air. A constant confining pressure σ3 = 30 kPa was applied, corresponding to the estimated
average horizontal stress in the field by the consideration of train loadings, the depth of
interlayer soil and the Poisson’s ratio (Duong et al. 2016). In the case of w1 = 17.6% (Sr = 100%),
fv
(%)
Initial water
content wopt-f
(%)
Target wf
(%)
Target Sr
(%)
Target ρdmax-f
(Mg/m3)
Target ρd
(Mg/m3)
Measured ρd
(Mg/m3)
0
13.7
17.6 100
1.82
1.82 1.80
10.6 60 1.85
10 17.6 100
1.91 1.88
10.6 60 1.93
20 17.6 100
1.99 1.97
10.6 60 2.01
35 17.6 100
2.12 2.11
10.6 60 2.13
45 17.6 100
2.21 2.20
10.6 60 2.22
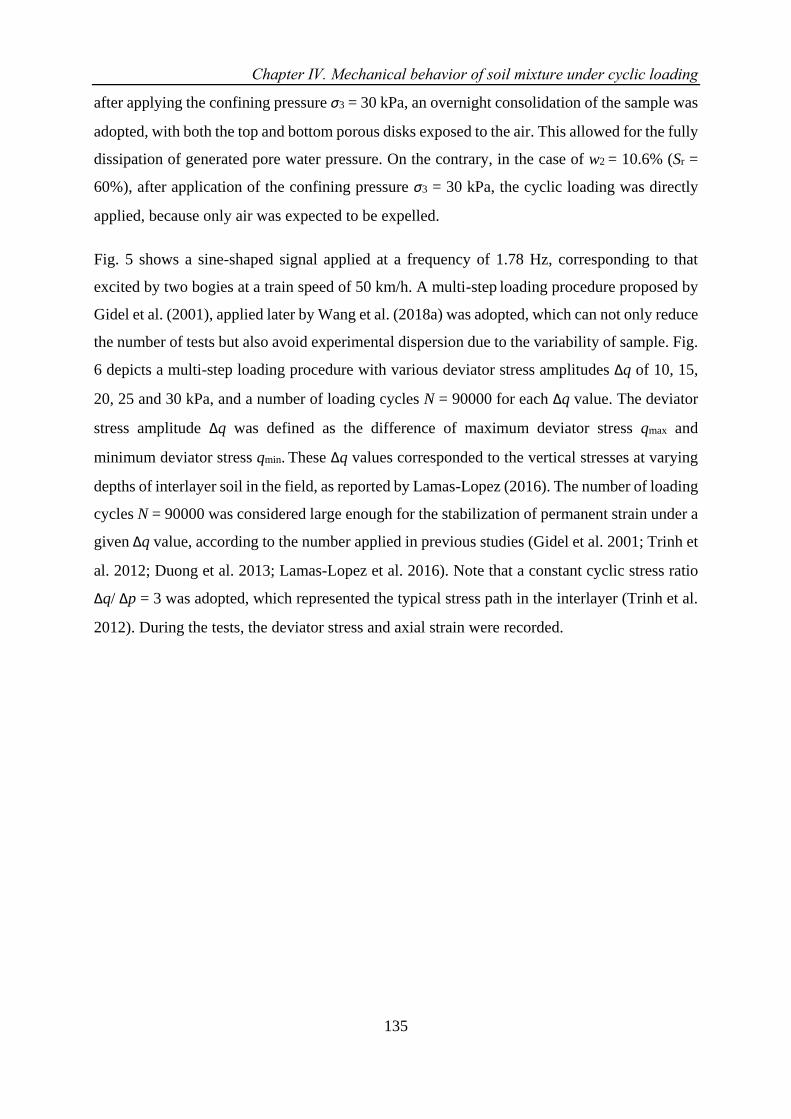
Chapter Ⅳ. Mechanical behavior of soil mixture under cyclic loading
135
after applying the confining pressure σ3 = 30 kPa, an overnight consolidation of the sample was
adopted, with both the top and bottom porous disks exposed to the air. This allowed for the fully
dissipation of generated pore water pressure. On the contrary, in the case of w2 = 10.6% (Sr =
60%), after application of the confining pressure σ3 = 30 kPa, the cyclic loading was directly
applied, because only air was expected to be expelled.
Fig. 5 shows a sine-shaped signal applied at a frequency of 1.78 Hz, corresponding to that
excited by two bogies at a train speed of 50 km/h. A multi-step loading procedure proposed by
Gidel et al. (2001), applied later by Wang et al. (2018a) was adopted, which can not only reduce
the number of tests but also avoid experimental dispersion due to the variability of sample. Fig.
6 depicts a multi-step loading procedure with various deviator stress amplitudes Δq of 10, 15,
20, 25 and 30 kPa, and a number of loading cycles N = 90000 for each Δq value. The deviator
stress amplitude Δq was defined as the difference of maximum deviator stress qmax and
minimum deviator stress qmin. These Δq values corresponded to the vertical stresses at varying
depths of interlayer soil in the field, as reported by Lamas-Lopez (2016). The number of loading
cycles N = 90000 was considered large enough for the stabilization of permanent strain under a
given Δq value, according to the number applied in previous studies (Gidel et al. 2001; Trinh et
al. 2012; Duong et al. 2013; Lamas-Lopez et al. 2016). Note that a constant cyclic stress ratio
Δq/ Δp = 3 was adopted, which represented the typical stress path in the interlayer (Trinh et al.
2012). During the tests, the deviator stress and axial strain were recorded.

Chapter Ⅳ. Mechanical behavior of soil mixture under cyclic loading
136
0.0 0.2 0.4 0.6 0.8 1.0 1.20
5
10
15
20
25
30
35
40
t (s)
q (
kP
a)
q = 10 kPa q = 15 kPa q = 20 kPa
q = 25 kPa q = 30 kPa
Fig. 5. Typical sine-shaped signals applied in cyclic triaxial tests
0 90000 180000 270000 360000 4500000
5
10
15
20
25
30
35
40
q = 30 kPa
q = 25 kPa
q = 20 kPa
q =10 kPa
Cycle (N)
q (
kP
a)
q = 15 kPa
Fig. 6. Multi-step loading procedure with various stress amplitudes Δq
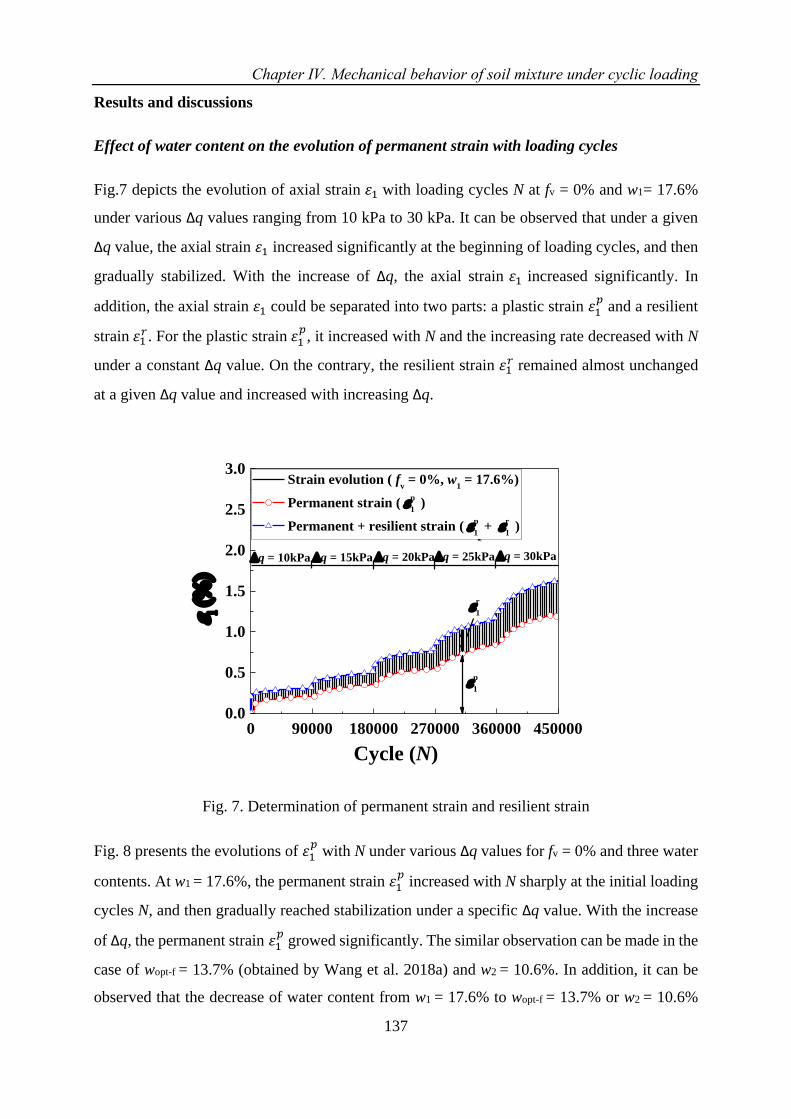
Chapter Ⅳ. Mechanical behavior of soil mixture under cyclic loading
137
Results and discussions
Effect of water content on the evolution of permanent strain with loading cycles
Fig.7 depicts the evolution of axial strain 휀1 with loading cycles N at fv = 0% and w1= 17.6%
under various Δq values ranging from 10 kPa to 30 kPa. It can be observed that under a given
Δq value, the axial strain 휀1 increased significantly at the beginning of loading cycles, and then
gradually stabilized. With the increase of Δq, the axial strain 휀1 increased significantly. In
addition, the axial strain 휀1 could be separated into two parts: a plastic strain 휀1𝑝 and a resilient
strain 휀1𝑟. For the plastic strain 휀1
𝑝, it increased with N and the increasing rate decreased with N
under a constant Δq value. On the contrary, the resilient strain 휀1𝑟 remained almost unchanged
at a given Δq value and increased with increasing Δq.
0 90000 180000 270000 360000 4500000.0
0.5
1.0
1.5
2.0
2.5
3.0
q = 30kPaq = 25kPaq = 20kPaq = 15kPa
r
1
p
1
p
1
p
1
q = 10kPa
Strain evolution ( fv = 0%, w
1 = 17.6%)
Permanent strain ( p
1 )
Permanent + resilient strain ( p
1 +
r
1 )
(
)
Cycle (N)
p
1
Fig. 7. Determination of permanent strain and resilient strain
Fig. 8 presents the evolutions of 휀1𝑝 with N under various Δq values for fv = 0% and three water
contents. At w1 = 17.6%, the permanent strain 휀1𝑝 increased with N sharply at the initial loading
cycles N, and then gradually reached stabilization under a specific Δq value. With the increase
of Δq, the permanent strain 휀1𝑝
growed significantly. The similar observation can be made in the
case of wopt-f = 13.7% (obtained by Wang et al. 2018a) and w2 = 10.6%. In addition, it can be
observed that the decrease of water content from w1 = 17.6% to wopt-f = 13.7% or w2 = 10.6%
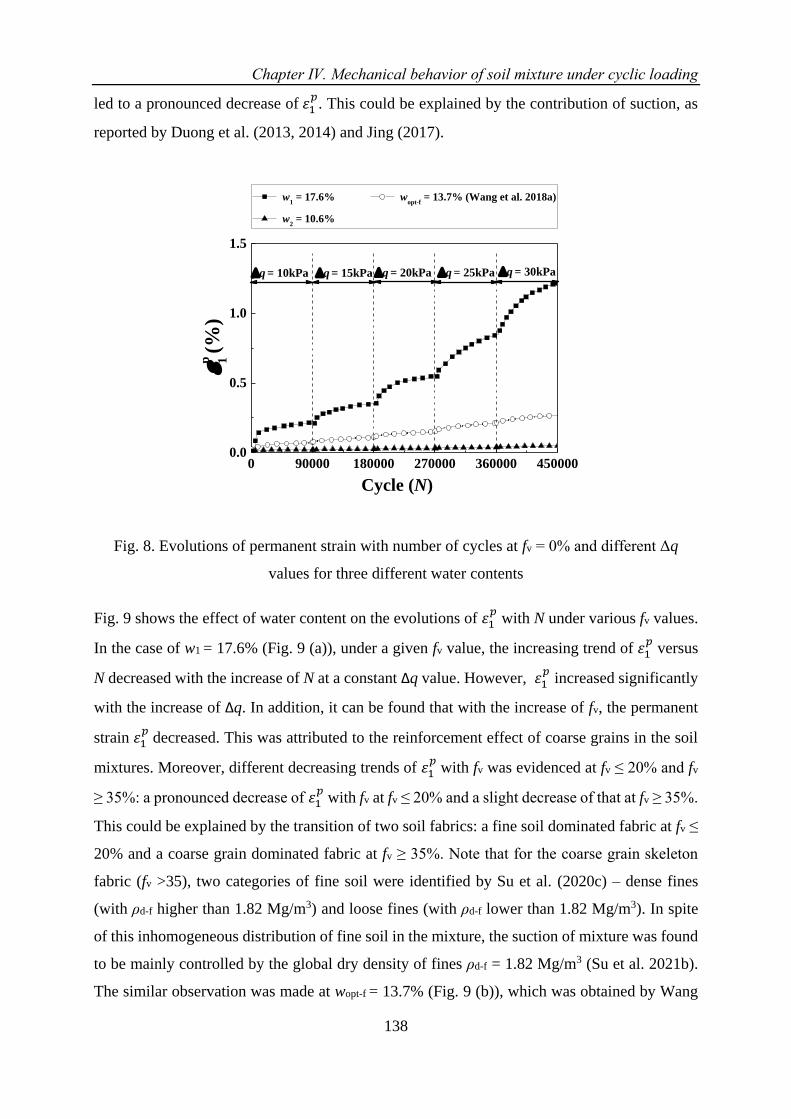
Chapter Ⅳ. Mechanical behavior of soil mixture under cyclic loading
138
led to a pronounced decrease of 휀1𝑝. This could be explained by the contribution of suction, as
reported by Duong et al. (2013, 2014) and Jing (2017).
0 90000 180000 270000 360000 4500000.0
0.5
1.0
1.5
q = 30kPaq
= 25kPaq
= 20kPaq
= 15kPaq
= 10kPa
p 1 (%
) w
1 = 17.6% w
opt-f = 13.7% (Wang et al. 2018a)
w2 = 10.6%
Cycle (N)
Fig. 8. Evolutions of permanent strain with number of cycles at fv = 0% and different Δq
values for three different water contents
Fig. 9 shows the effect of water content on the evolutions of 휀1𝑝 with N under various fv values.
In the case of w1 = 17.6% (Fig. 9 (a)), under a given fv value, the increasing trend of 휀1𝑝 versus
N decreased with the increase of N at a constant Δq value. However, 휀1𝑝 increased significantly
with the increase of Δq. In addition, it can be found that with the increase of fv, the permanent
strain 휀1𝑝
decreased. This was attributed to the reinforcement effect of coarse grains in the soil
mixtures. Moreover, different decreasing trends of 휀1𝑝
with fv was evidenced at fv ≤ 20% and fv
≥ 35%: a pronounced decrease of 휀1𝑝
with fv at fv ≤ 20% and a slight decrease of that at fv ≥ 35%.
This could be explained by the transition of two soil fabrics: a fine soil dominated fabric at fv ≤
20% and a coarse grain dominated fabric at fv ≥ 35%. Note that for the coarse grain skeleton
fabric (fv >35), two categories of fine soil were identified by Su et al. (2020c) – dense fines
(with ρd-f higher than 1.82 Mg/m3) and loose fines (with ρd-f lower than 1.82 Mg/m3). In spite
of this inhomogeneous distribution of fine soil in the mixture, the suction of mixture was found
to be mainly controlled by the global dry density of fines ρd-f = 1.82 Mg/m3 (Su et al. 2021b).
The similar observation was made at wopt-f = 13.7% (Fig. 9 (b)), which was obtained by Wang
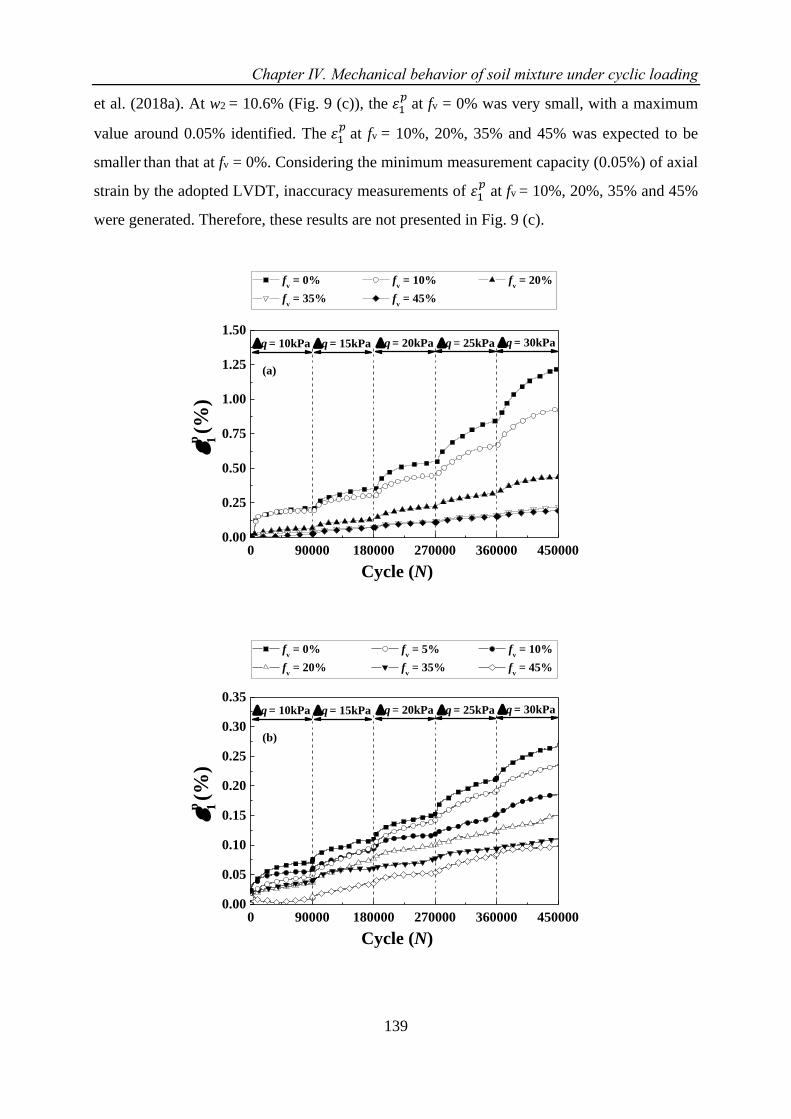
Chapter Ⅳ. Mechanical behavior of soil mixture under cyclic loading
139
et al. (2018a). At w2 = 10.6% (Fig. 9 (c)), the 휀1𝑝
at fv = 0% was very small, with a maximum
value around 0.05% identified. The 휀1𝑝
at fv = 10%, 20%, 35% and 45% was expected to be
smaller than that at fv = 0%. Considering the minimum measurement capacity (0.05%) of axial
strain by the adopted LVDT, inaccuracy measurements of 휀1𝑝 at fv = 10%, 20%, 35% and 45%
were generated. Therefore, these results are not presented in Fig. 9 (c).
0 90000 180000 270000 360000 4500000.00
0.25
0.50
0.75
1.00
1.25
1.50q
= 30kPaq
= 25kPaq
= 20kPaq
= 15kPaq
= 10kPa
p 1 (%
)
p
1 fv = 0% f
v = 10% f
v = 20%
fv = 35% f
v = 45%
Cycle (N)
(a)
0 90000 180000 270000 360000 4500000.00
0.05
0.10
0.15
0.20
0.25
0.30
0.35q
= 30kPaq
= 25kPaq
= 20kPaq
= 15kPaq
= 10kPa
p 1 (%
)
p
1 fv = 0% f
v = 5% f
v = 10%
fv = 20% f
v = 35% f
v = 45%
Cycle (N)
(b)
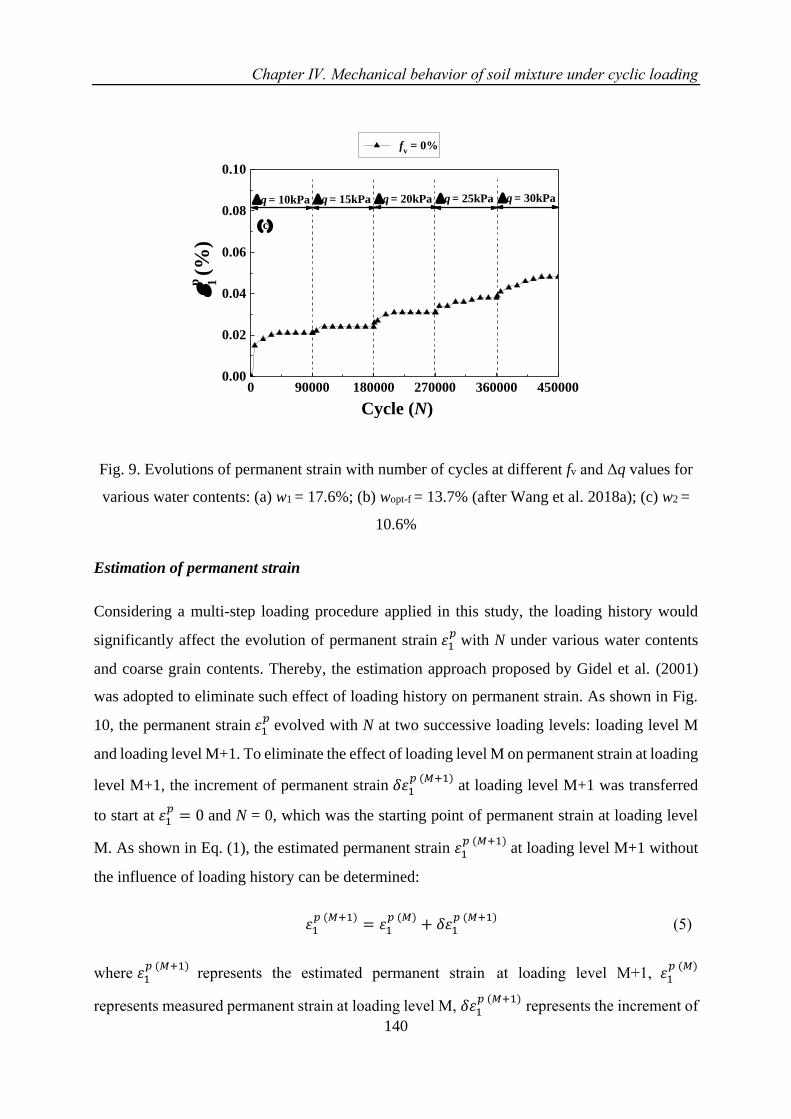
Chapter Ⅳ. Mechanical behavior of soil mixture under cyclic loading
140
0 90000 180000 270000 360000 4500000.00
0.02
0.04
0.06
0.08
0.10
(c)
q = 30kPaq
= 25kPaq
= 20kPaq
= 15kPaq
= 10kPa
p 1 (%
)
Cycle (N)
fv = 0%
Fig. 9. Evolutions of permanent strain with number of cycles at different fv and Δq values for
various water contents: (a) w1 = 17.6%; (b) wopt-f = 13.7% (after Wang et al. 2018a); (c) w2 =
10.6%
Estimation of permanent strain
Considering a multi-step loading procedure applied in this study, the loading history would
significantly affect the evolution of permanent strain 휀1𝑝
with N under various water contents
and coarse grain contents. Thereby, the estimation approach proposed by Gidel et al. (2001)
was adopted to eliminate such effect of loading history on permanent strain. As shown in Fig.
10, the permanent strain 휀1𝑝
evolved with N at two successive loading levels: loading level M
and loading level M+1. To eliminate the effect of loading level M on permanent strain at loading
level M+1, the increment of permanent strain 𝛿휀1𝑝 (𝑀+1)
at loading level M+1 was transferred
to start at 휀1𝑝
= 0 and N = 0, which was the starting point of permanent strain at loading level
M. As shown in Eq. (1), the estimated permanent strain 휀1𝑝 (𝑀+1)
at loading level M+1 without
the influence of loading history can be determined:
휀1𝑝 (𝑀+1)
= 휀1𝑝 (𝑀)
+ 𝛿휀1𝑝 (𝑀+1)
(5)
where 휀1𝑝 (𝑀+1)
represents the estimated permanent strain at loading level M11, 휀1𝑝 (𝑀)
represents measured permanent strain at loading level M, 𝛿휀1𝑝 (𝑀+1)
represents the increment of
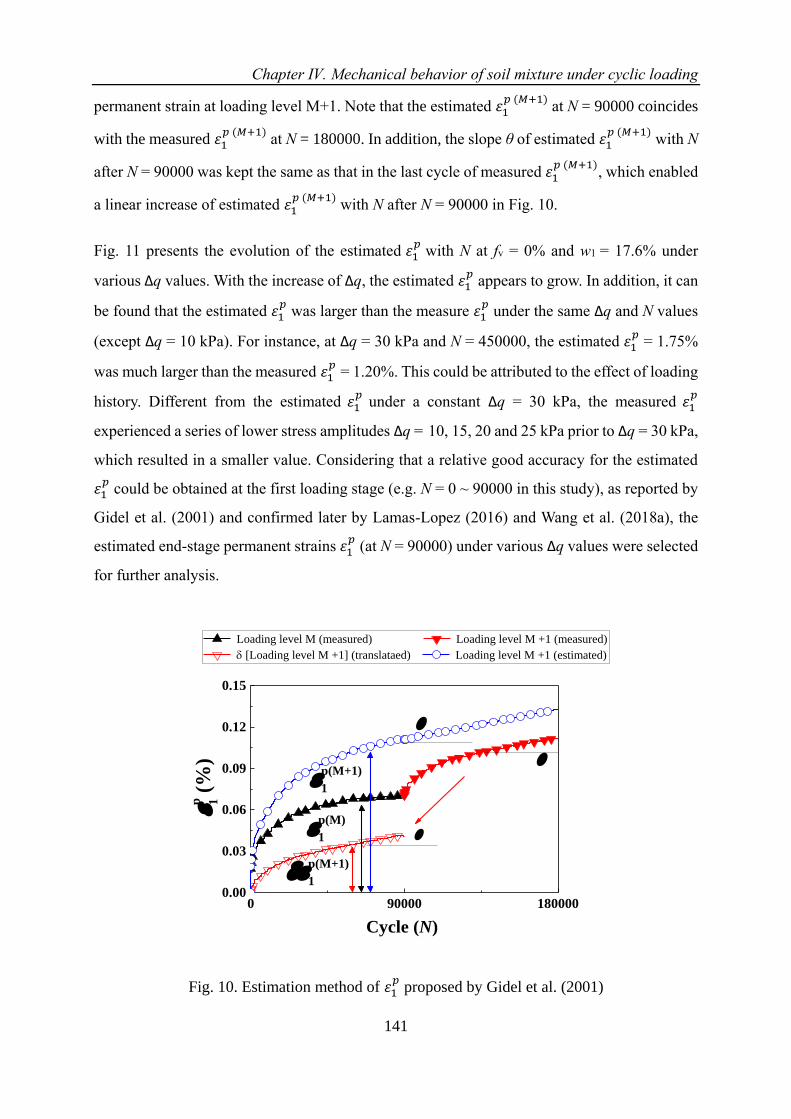
Chapter Ⅳ. Mechanical behavior of soil mixture under cyclic loading
141
permanent strain at loading level M11. Note that the estimated 휀1𝑝 (𝑀+1)
at N = 90000 coincides
with the measured 휀1𝑝 (𝑀+1)
at N = 180000. In addition, the slope θ of estimated 휀1𝑝 (𝑀+1)
with N
after N = 90000 was kept the same as that in the last cycle of measured 휀1 𝑝 (𝑀+1)
, which enabled
a linear increase of estimated 휀1𝑝 (𝑀+1)
with N after N = 90000 in Fig. 10.
Fig. 11 presents the evolution of the estimated 휀1𝑝 with N at fv = 0% and w1 = 17.6% under
various Δq values. With the increase of Δq, the estimated 휀1𝑝 appears to grow. In addition, it can
be found that the estimated 휀1𝑝 was larger than the measure 휀1
𝑝 under the same Δq and N values
(except Δq = 10 kPa). For instance, at Δq = 30 kPa and N = 450000, the estimated 휀1𝑝 = 1.75%
was much larger than the measured 휀1𝑝 = 1.20%. This could be attributed to the effect of loading
history. Different from the estimated 휀1𝑝 under a constant Δq = 30 kPa, the measured 휀1
𝑝
experienced a series of lower stress amplitudes Δq = 10, 15, 20 and 25 kPa prior to Δq = 30 kPa,
which resulted in a smaller value. Considering that a relative good accuracy for the estimated
휀1𝑝 could be obtained at the first loading stage (e.g. N = 0 ~ 90000 in this study), as reported by
Gidel et al. (2001) and confirmed later by Lamas-Lopez (2016) and Wang et al. (2018a), the
estimated end-stage permanent strains 휀1𝑝 (at N = 90000) under various Δq values were selected
for further analysis.
0 90000 1800000.00
0.03
0.06
0.09
0.12
0.15
p(M+1)
1
p(M+1)
1
p(M)
1
Cycle (N)
p 1 (
%)
Loading level M (measured) Loading level M +1 (measured)
[Loading level M +1] (translataed) Loading level M +1 (estimated)
Fig. 10. Estimation method of 휀1𝑝 proposed by Gidel et al. (2001)
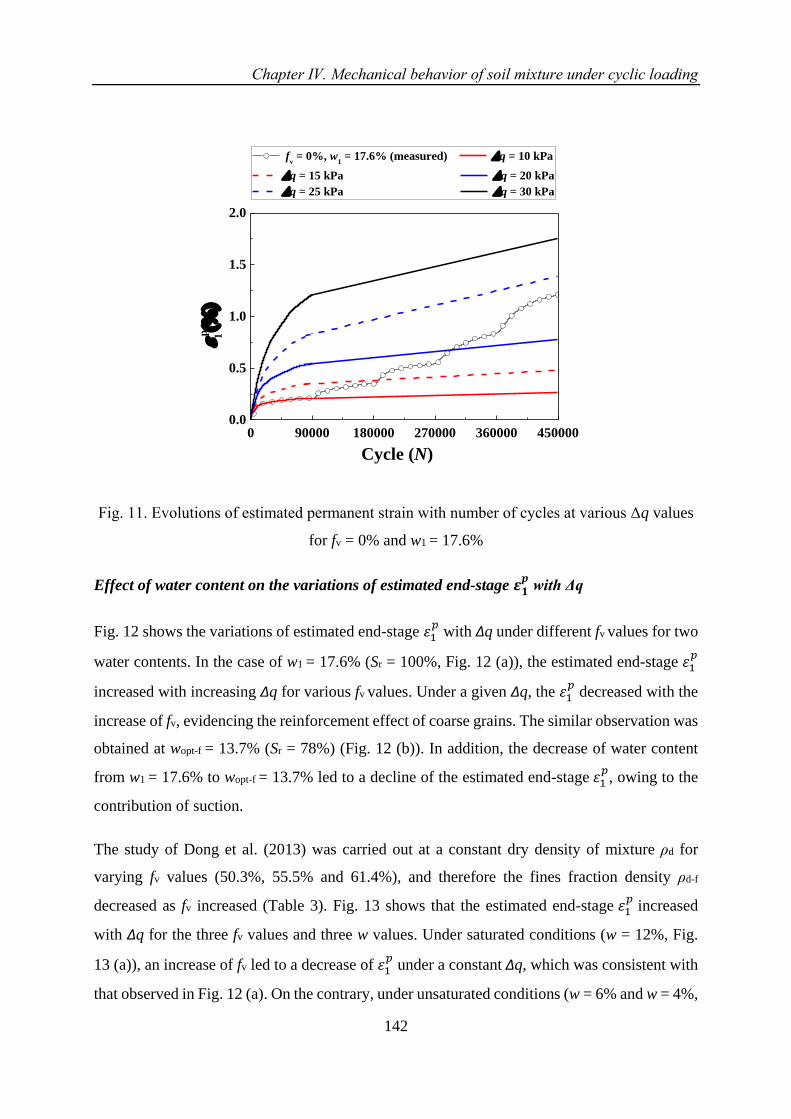
Chapter Ⅳ. Mechanical behavior of soil mixture under cyclic loading
142
0 90000 180000 270000 360000 4500000.0
0.5
1.0
1.5
2.0
fv = 0%, w
1 = 17.6% (measured) q = 10 kPa
q = 15 kPa q = 20 kPa
q = 25 kPa q = 30 kPa
p 1(
)
Cycle (N)
Fig. 11. Evolutions of estimated permanent strain with number of cycles at various Δq values
for fv = 0% and w1 = 17.6%
Effect of water content on the variations of estimated end-stage 𝜺𝟏𝒑 with Δq
Fig. 12 shows the variations of estimated end-stage 휀1𝑝 with Δq under different fv values for two
water contents. In the case of w1 = 17.6% (Sr = 100%, Fig. 12 (a)), the estimated end-stage 휀1𝑝
increased with increasing Δq for various fv values. Under a given Δq, the 휀1𝑝 decreased with the
increase of fv, evidencing the reinforcement effect of coarse grains. The similar observation was
obtained at wopt-f = 13.7% (Sr = 78%) (Fig. 12 (b)). In addition, the decrease of water content
from w1 = 17.6% to wopt-f = 13.7% led to a decline of the estimated end-stage 휀1𝑝, owing to the
contribution of suction.
The study of Dong et al. (2013) was carried out at a constant dry density of mixture ρd for
varying fv values (50.3%, 55.5% and 61.4%), and therefore the fines fraction density ρd-f
decreased as fv increased (Table 3). Fig. 13 shows that the estimated end-stage 휀1𝑝 increased
with Δq for the three fv values and three w values. Under saturated conditions (w = 12%, Fig.
13 (a)), an increase of fv led to a decrease of 휀1𝑝 under a constant Δq, which was consistent with
that observed in Fig. 12 (a). On the contrary, under unsaturated conditions (w = 6% and w = 4%,
Chapter Ⅳ. Mechanical behavior of soil mixture under cyclic loading
143
Figs. 12 (b) - (c)), an increase of fv resulted in an increase of the estimated end-stage 휀1𝑝 under
a constant Δq, which was contradictory with the observation in Fig. 12 (b). This could be
explained by the fact that the permanent strain behavior of soil mixtures was affected by both
the reinforcement effect of coarse grains and the effect of suction in fines. Under saturated
conditions, without the effect of suction, the reinforcement effect of fv played a dominant role
in the permanent strain behavior of mixtures. In this case, an increase of fv induced a decrease
of 휀1𝑝
(Fig. 12 (a) and Fig. 13 (a)). By contrast, under unsaturated conditions, both the
reinforcement effect of coarse grains and the effect of suction in fines affected the permanent
strain behavior. Note that the suction of fines fraction was strongly related to its ρd-f under a
constant water content, as evidenced by Romero et al. (1999) and Gao and Sun (2017). In the
present study, the fine soil was controlled at ρdmax-f = 1.82 Mg/m3 (Table 2), leading to an
unchanged suction (= 739 kPa in Wang et al. 2018a) at wopt-f = 13.7% under varying fv values.
This was supported by the findings of Su et al. (2021b) on the same fine/coarse soil mixture,
who reported that the soil-water retention curve was only affected by the dry density of fine soil
ρd-f, while independent of coarse grain content fv. In this case, the reinforcement effect of fv on
the permanent strain behavior was clearly identified: an increase of fv led to a smaller 휀1𝑝 (Fig.
12 (b)). Conversely, in the study of Duong et al. (2013), the ρd-f of fine soil declines from 1.33
Mg/m3 to 1.17 and 0.94 Mg/m3 with the increasing fv values from 50.3% to 55.5% and 61.4%
(Table 3), which would result in a decrease of suction within the fine fraction. In this case, the
negative effect of decreasing suction prevailed on the positive reinforcement effect of increasing
fv. As a result, the 휀1𝑝 increased with increasing fv. (Fig. 13 (b) – (c)).
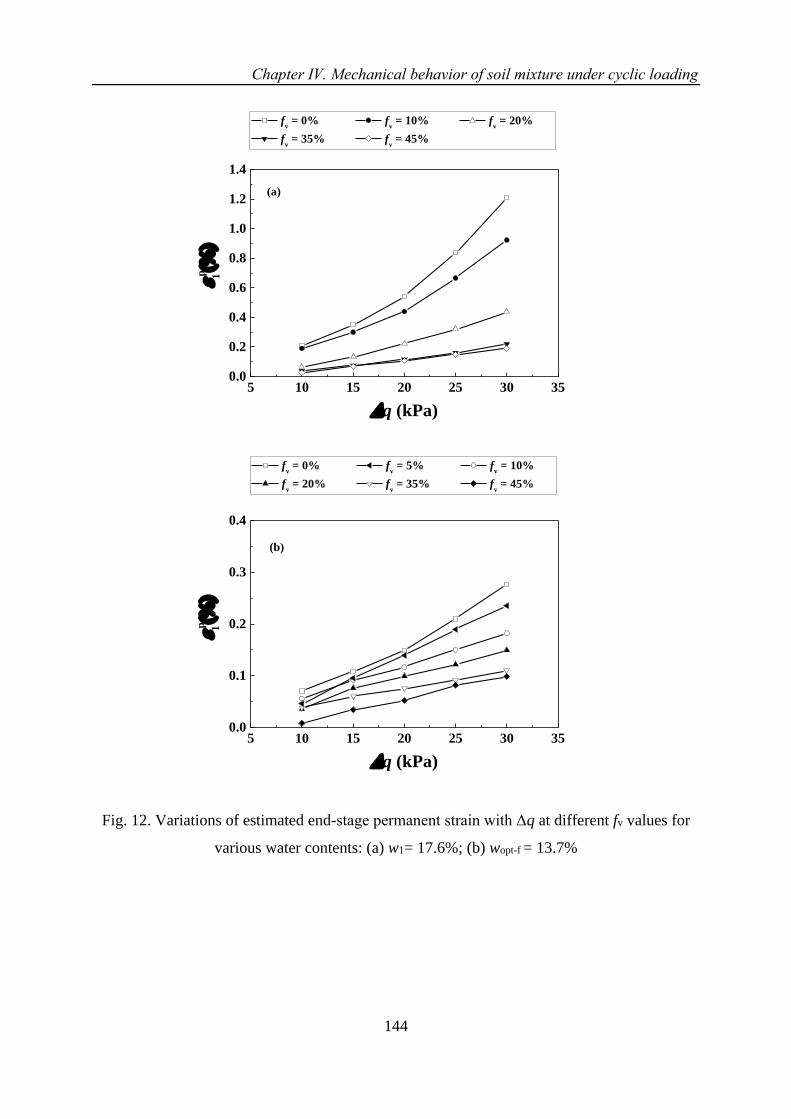
Chapter Ⅳ. Mechanical behavior of soil mixture under cyclic loading
144
5 10 15 20 25 30 350.0
0.2
0.4
0.6
0.8
1.0
1.2
1.4
(a)
q (kPa)
p 1(
)
fv = 0% f
v = 10% f
v = 20%
fv = 35% f
v = 45%
5 10 15 20 25 30 350.0
0.1
0.2
0.3
0.4
(b)
q (kPa)
p 1(
)
fv = 0% f
v = 5% f
v = 10%
fv = 20% f
v = 35% f
v = 45%
Fig. 12. Variations of estimated end-stage permanent strain with Δq at different fv values for
various water contents: (a) w1= 17.6%; (b) wopt-f = 13.7%
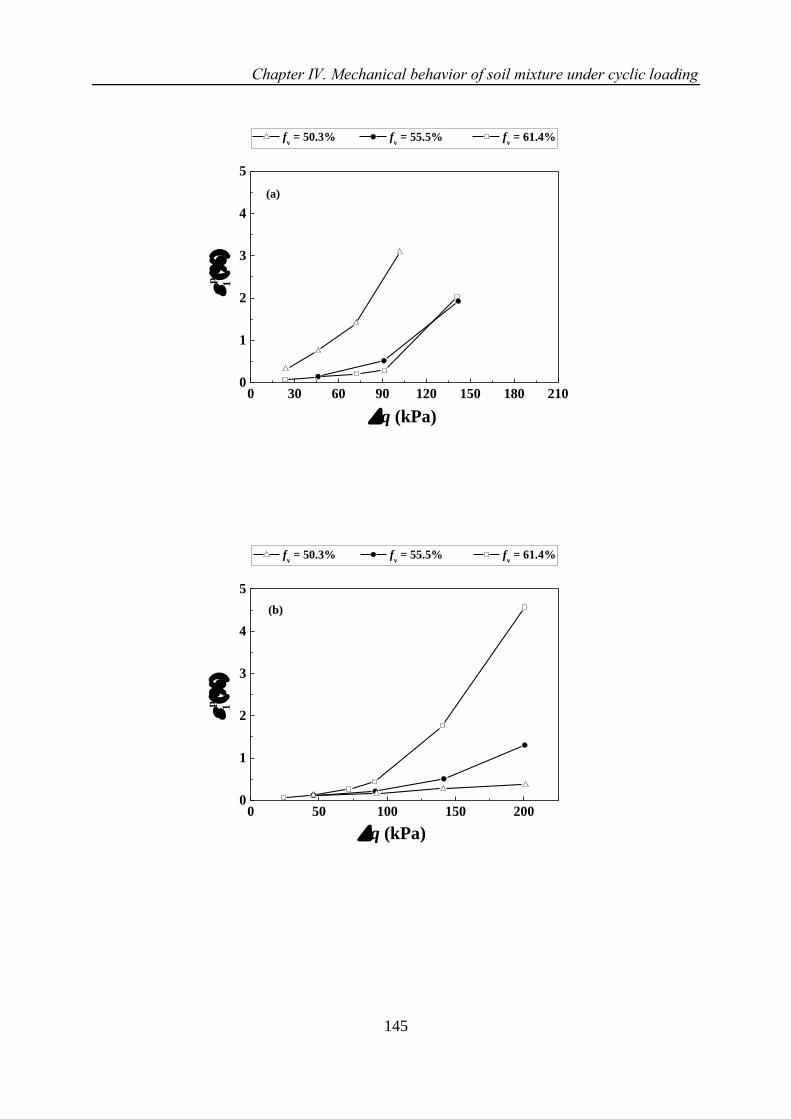
Chapter Ⅳ. Mechanical behavior of soil mixture under cyclic loading
145
0 30 60 90 120 150 180 2100
1
2
3
4
5
q (kPa)
p 1(
)
fv = 50.3% f
v = 55.5% f
v = 61.4%
(a)
0 50 100 150 2000
1
2
3
4
5
q (kPa)
p 1(
)
fv = 50.3% f
v = 55.5% f
v = 61.4%
(b)
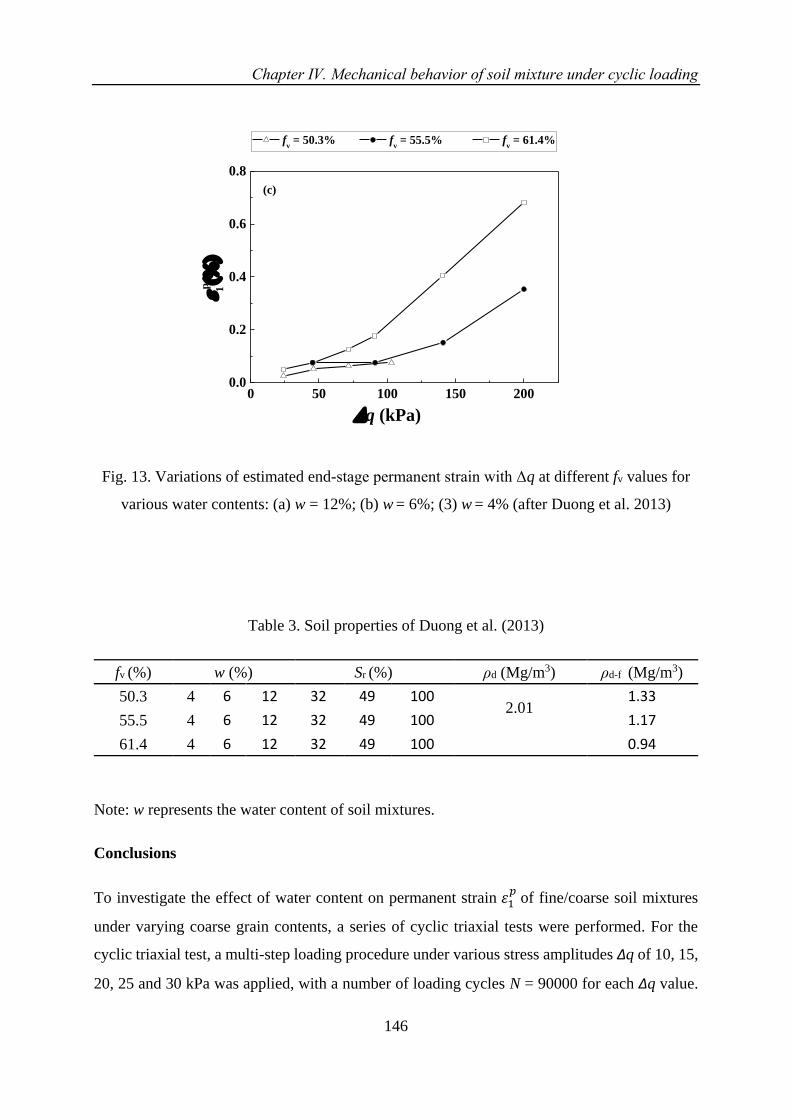
Chapter Ⅳ. Mechanical behavior of soil mixture under cyclic loading
146
0 50 100 150 2000.0
0.2
0.4
0.6
0.8
q (kPa)
p 1(
)
(c)
fv = 50.3% f
v = 55.5% f
v = 61.4%
Fig. 13. Variations of estimated end-stage permanent strain with Δq at different fv values for
various water contents: (a) w = 12%; (b) w = 6%; (3) w = 4% (after Duong et al. 2013)
Table 3. Soil properties of Duong et al. (2013)
fv (%) w (%) Sr (%) ρd (Mg/m3) ρd-f (Mg/m3)
50.3 4 6 12 32 49 100 2.01
1.33
55.5 4 6 12 32 49 100 1.17
61.4 4 6 12 32 49 100 0.94
Note: w represents the water content of soil mixtures.
Conclusions
To investigate the effect of water content on permanent strain 휀1𝑝
of fine/coarse soil mixtures
under varying coarse grain contents, a series of cyclic triaxial tests were performed. For the
cyclic triaxial test, a multi-step loading procedure under various stress amplitudes Δq of 10, 15,
20, 25 and 30 kPa was applied, with a number of loading cycles N = 90000 for each Δq value.
Chapter Ⅳ. Mechanical behavior of soil mixture under cyclic loading
147
Two target fines water contents wf (w1 = 17.6% and w2 = 10.6%) and five coarse grain contents
fv (0%, 10%, 20%, 35% and 45%) were considered. The estimation approach of 휀1𝑝
proposed by
Gidel et al. (2001) was adopted to eliminate the effect of loading history on 휀1𝑝. Through the
comparison of the present study and the study of Duong et al. (2013), the effects of water content
and coarse grain content on the permanent strain behavior of fine/coarse soil mixtures were
clarified. The following conclusions to be drawn:
A decrease of water content led to a decrease of permanent strain 휀1𝑝, due to the contribution of
suction. An increase of fv gave rise to a decrease of 휀1𝑝, owing to the reinforcement effect of fv.
The comparison of present study and the study of Duong et al. (2013) indicated a significant
effect of sample preparation approach on the permanent strain behavior of soil mixtures. In the
present study, a constant ρd-f of fine soil fraction was maintained, leading to an unchanged
suction of soil mixtures with varying fv values. In this case, the reinforcement effect of fv on the
permanent strain behavior was clearly identified: an increase of fv led to a decrease of 휀1𝑝
.
Conversely, in the study of Duong et al. (2013), with a global dry density kept constant, an
increase of fv led to a decrease of the dry density of fines ρd-f and consequently a decrease of
suction. In that case, when the negative effect of decreasing suction prevailed on the positive
reinforcement effect of increasing fv, the 휀1𝑝 increased with the increase of fv.
Acknowledgements
This work was supported by the China Scholarship Council (CSC) and Ecole des Ponts
ParisTech.
References
Cui, Y.J., Duong, T.V., Tang, A.M., Dupla, J.C., Calon, N. and Robinet, A., 2013. Investigation
of the hydro-mechanical behaviour of fouled ballast. Journal of Zhejiang University
Science A, 14(4), pp.244-255.
Duong, T.V., Tang, A.M., Cui, Y.J., Trinh, V.N., Dupla, J.C., Calon, N., Canou, J. and Robinet,
A., 2013. Effects of fines and water contents on the mechanical behavior of interlayer soil
in ancient railway sub-structure. Soils and foundations, 53(6), pp.868-878.
Duong, T. V., Cui, Y. J., Tang, A. M., Dupla, J. C., & Calon, N. 2014. Effect of fine particles
on the hydraulic behavior of interlayer soil in railway substructure. Canadian geotechnical
journal, 51(7), 735-746.
Chapter Ⅳ. Mechanical behavior of soil mixture under cyclic loading
148
Duong, T.V., Cui, Y.J., Tang, A.M., Dupla, J.C., Canou, J., Calon, N. and Robinet, A., 2016.
Effects of water and fines contents on the resilient modulus of the interlayer soil of railway
substructure. Acta Geotechnica, 11(1), pp.51-59.
Gidel, G., Hornych, P., Breysse, D., & Denis, A. 2001. A new approach for investigating the
permanent deformation behaviour of unbound granular material using the repeated loading
triaxial apparatus. Bulletin des laboratoires des Ponts et Chaussées, (233).
Gao, Y., Sun, DA. 2017. Soil-water retention behavior of compacted soil with different
densities over a wide suction range and its prediction. Computers and Geotechnics, 91, 17-
26.
Gu, C., Zhan, Y., Wang, J., Cai, Y., Cao, Z., & Zhang, Q. (2020). Resilient and permanent
deformation of unsaturated unbound granular materials under cyclic loading by the large-
scale triaxial tests. Acta Geotechnica, 15(12), 3343-3356.
Jing, P. 2017. Experimental study and modelling of the elastoplastic behaviour of unbound
granular materials under large number of cyclic loadings at various initial hydric states
(Doctoral dissertation).
Jing, P., Nowamooz, H., & Chazallon, C. 2018. Permanent deformation behaviour of a granular
material used in low-traffic pavements. Road Materials and Pavement Design, 19(2), 289-
314.
Lamas-lopez, F. 2016. Field and laboratory investigation on the dynamic behavior of
conventional railway track-bed materials in the context of traffic upgrade. PhD Thesis,
Ecole Nationale des Ponts et Chaussées, Université Paris-Est.
Nie, R., Li, Y., Leng, W., Mei, H., Dong, J., & Chen, X. (2020). Deformation characteristics of
fine-grained soil under cyclic loading with intermittence. Acta Geotechnica, 1-14.
Qi, S., Cui, Y.J., Chen, R.P., Wang, H.L., Lamas-Lopez, F., Aimedieu, P., Dupla, J.C., Canou,
J. and Saussine, G., 2020a. Influence of grain size distribution of inclusions on the
mechanical behaviours of track-bed materials. Géotechnique, 70(3), pp.238-247.
Qi, S., Cui, Y.J., Dupla, J.C., Chen, R.P., Wang, H.L., Su, Y., Lamas-Lopez, F. and Canou, J.,
2020b. Investigation of the parallel gradation method based on the response of track-bed
materials under cyclic loadings. Transportation Geotechnics, p.100360.
Romero, E., Gens, A., & Lloret, A. 1999. Water permeability, water retention and
microstructure of unsaturated compacted Boom clay. Engineering Geology, 54(1-2), 117-
127.
Song, Y., & Ooi, P. S. 2010. Interpretation of shakedown limit from multistage permanent
deformation tests. Transportation research record, 2167(1), 72-82.
Su, Y., Cui, Y. J., Dupla, J. C., & Canou, J. 2020a. Investigation of the effect of water content
on the mechanical behavior of track-bed materials under various coarse grain contents.
Construction and Building Materials, 263, 120206.
Chapter Ⅳ. Mechanical behavior of soil mixture under cyclic loading
149
Su, Y., Cui, Y. J., Dupla, J. C., Canou, J., & Qi, S. 2020b. A fatigue model for track-bed
materials with consideration of the effect of coarse grain content. Transportation
Geotechnics, 23, 100353.
Su, Y., Cui, Y. J., Dupla, J. C., Canou, J., & Qi, S. 2020c. Developing a Sample Preparation
Approach to Study the Mechanical Behavior of Unsaturated Fine/Coarse Soil Mixture.
Geotechnical Testing Journal, 44(4).
Su, Y., Cui, Y. J., Dupla, J. C., & Canou, J. 2021a. Effect of water content on resilient modulus
and damping ratio of fine/coarse soil mixtures with varying coarse grain contents.
Transportation Geotechnics, 26, 100452.
Su, Y., Cui, Y. J., Dupla, J. C., & Canou, J. 2021b. Soil-water retention behaviour of fine/coarse
soil mixture with varying coarse grain contents and fine soil dry densities. Canadian
Geotechnical Journal, (ja).
Trinh, V. N. 2011. Comportement hydromécanique des matériaux constitutifs de plateformes
ferroviaires anciennes. PhD Thesis, Ecole Nationale des Ponts et Chaussées, Université
Paris-Est.
Trinh, V.N., Tang, A.M., Cui, Y.J., Dupla, J.C., Canou, J., Calon, N., Lambert, L., Robinet, A.
and Schoen, O., 2012. Mechanical characterisation of the fouled ballast in ancient railway
track substructure by large-scale triaxial tests. Soils and foundations, 52(3), pp.511-523.
Werkmeister, S., Dawson, A. R., & Wellner, F. 2001. Permanent deformation behavior of
granular materials and the shakedown concept. Transportation Research Record, 1757(1),
75-81.
Wan, Z., Bian, X., Li, S., Chen, Y., & Cui, Y. 2020. Remediation of mud pumping in ballastless
high-speed railway using polyurethane chemical injection. Construction and Building
Materials, 259, 120401.
Wang, H. L., Cui, Y. J., Lamas-Lopez, F., Dupla, J. C., Canou, J., Calon, N., ... & Chen, R. P.
2017. Effects of inclusion contents on resilient modulus and damping ratio of unsaturated
track-bed materials. Canadian Geotechnical Journal, 54(12), 1672-1681.
Wang, H.L., Cui, Y.J., Lamas-Lopez, F., Dupla, J.C., Canou, J., Calon, N., Saussine, G.,
Aimedieu, P. and Chen, R.P., 2018a. Permanent deformation of track-bed materials at
various inclusion contents under large number of loading cycles. Journal of Geotechnical
and Geoenvironmental Engineering, 144(8), p.04018044.
Wang, H.L., Cui, Y.J., Lamas-Lopez, F., Calon, N., Saussine, G., Dupla, J.C., Canou, J.,
Aimedieu, P. and Chen, R.P., 2018b. Investigation on the mechanical behavior of track-
bed materials at various contents of coarse grains. Construction and Building
Materials, 164, pp.228-237.
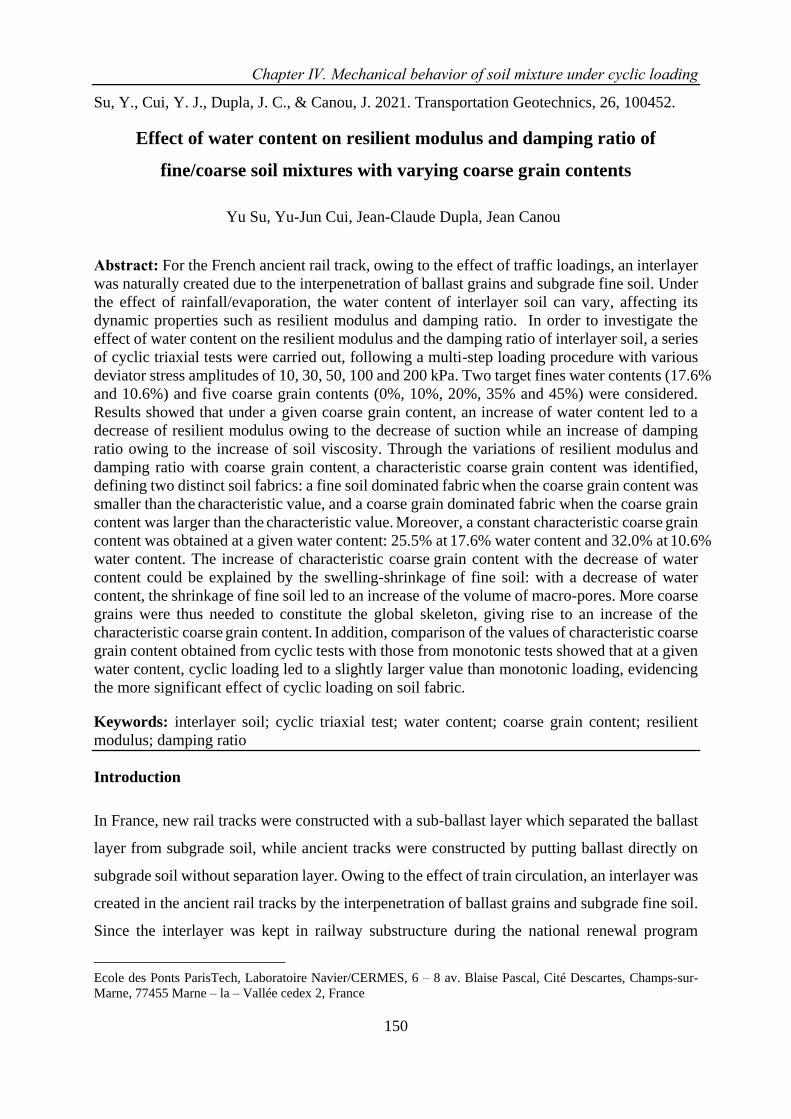
Chapter Ⅳ. Mechanical behavior of soil mixture under cyclic loading
150
Su, Y., Cui, Y. J., Dupla, J. C., & Canou, J. 2021. Transportation Geotechnics, 26, 100452.
Effect of water content on resilient modulus and damping ratio of
fine/coarse soil mixtures with varying coarse grain contents
Yu Su, Yu-Jun Cui, Jean-Claude Dupla, Jean Canou6
Abstract: For the French ancient rail track, owing to the effect of traffic loadings, an interlayer
was naturally created due to the interpenetration of ballast grains and subgrade fine soil. Under
the effect of rainfall/evaporation, the water content of interlayer soil can vary, affecting its
dynamic properties such as resilient modulus and damping ratio. In order to investigate the
effect of water content on the resilient modulus and the damping ratio of interlayer soil, a series
of cyclic triaxial tests were carried out, following a multi-step loading procedure with various
deviator stress amplitudes of 10, 30, 50, 100 and 200 kPa. Two target fines water contents (17.6%
and 10.6%) and five coarse grain contents (0%, 10%, 20%, 35% and 45%) were considered.
Results showed that under a given coarse grain content, an increase of water content led to a
decrease of resilient modulus owing to the decrease of suction while an increase of damping
ratio owing to the increase of soil viscosity. Through the variations of resilient modulus and
damping ratio with coarse grain content, a characteristic coarse grain content was identified,
defining two distinct soil fabrics: a fine soil dominated fabric when the coarse grain content was
smaller than the characteristic value, and a coarse grain dominated fabric when the coarse grain
content was larger than the characteristic value. Moreover, a constant characteristic coarse grain
content was obtained at a given water content: 25.5% at 17.6% water content and 32.0% at 10.6%
water content. The increase of characteristic coarse grain content with the decrease of water
content could be explained by the swelling-shrinkage of fine soil: with a decrease of water
content, the shrinkage of fine soil led to an increase of the volume of macro-pores. More coarse
grains were thus needed to constitute the global skeleton, giving rise to an increase of the
characteristic coarse grain content. In addition, comparison of the values of characteristic coarse
grain content obtained from cyclic tests with those from monotonic tests showed that at a given
water content, cyclic loading led to a slightly larger value than monotonic loading, evidencing
the more significant effect of cyclic loading on soil fabric.
Keywords: interlayer soil; cyclic triaxial test; water content; coarse grain content; resilient
modulus; damping ratio
Introduction
In France, new rail tracks were constructed with a sub-ballast layer which separated the ballast
layer from subgrade soil, while ancient tracks were constructed by putting ballast directly on
subgrade soil without separation layer. Owing to the effect of train circulation, an interlayer was
created in the ancient rail tracks by the interpenetration of ballast grains and subgrade fine soil.
Since the interlayer was kept in railway substructure during the national renewal program
Ecole des Ponts ParisTech, Laboratoire Navier/CERMES, 6 – 8 av. Blaise Pascal, Cité Descartes, Champs-sur-
Marne, 77455 Marne – la – Vallée cedex 2, France
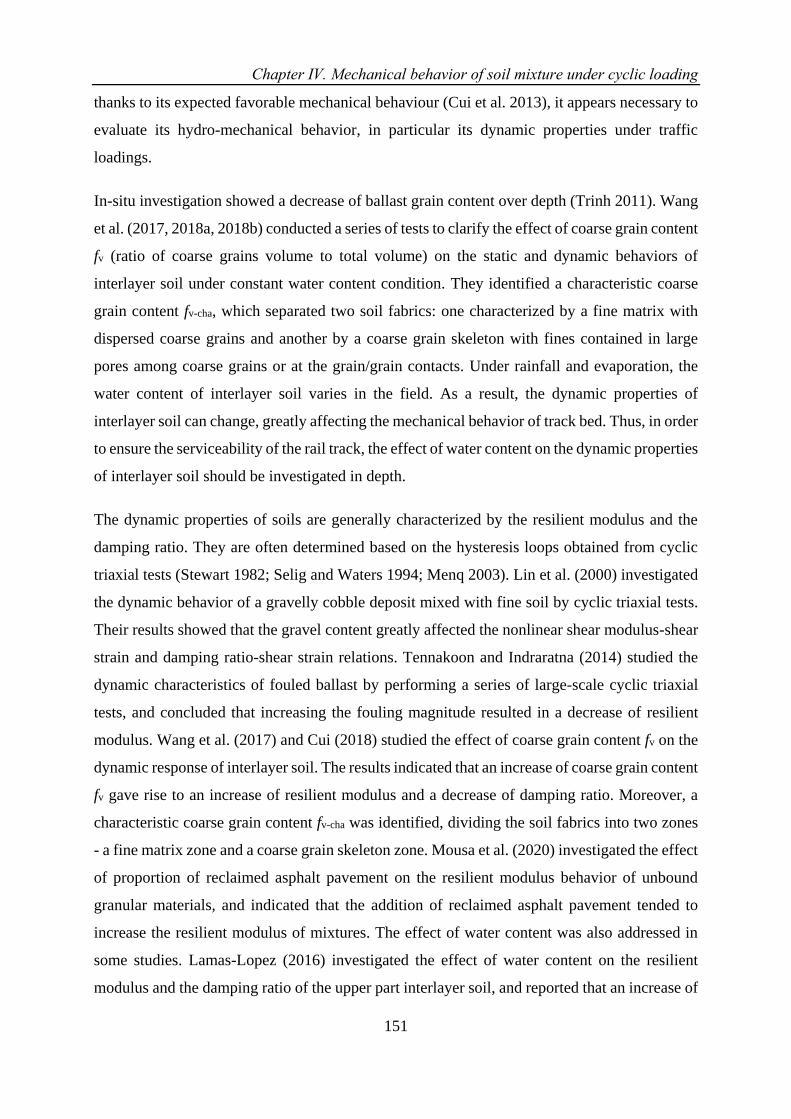
Chapter Ⅳ. Mechanical behavior of soil mixture under cyclic loading
151
thanks to its expected favorable mechanical behaviour (Cui et al. 2013), it appears necessary to
evaluate its hydro-mechanical behavior, in particular its dynamic properties under traffic
loadings.
In-situ investigation showed a decrease of ballast grain content over depth (Trinh 2011). Wang
et al. (2017, 2018a, 2018b) conducted a series of tests to clarify the effect of coarse grain content
fv (ratio of coarse grains volume to total volume) on the static and dynamic behaviors of
interlayer soil under constant water content condition. They identified a characteristic coarse
grain content fv-cha, which separated two soil fabrics: one characterized by a fine matrix with
dispersed coarse grains and another by a coarse grain skeleton with fines contained in large
pores among coarse grains or at the grain/grain contacts. Under rainfall and evaporation, the
water content of interlayer soil varies in the field. As a result, the dynamic properties of
interlayer soil can change, greatly affecting the mechanical behavior of track bed. Thus, in order
to ensure the serviceability of the rail track, the effect of water content on the dynamic properties
of interlayer soil should be investigated in depth.
The dynamic properties of soils are generally characterized by the resilient modulus and the
damping ratio. They are often determined based on the hysteresis loops obtained from cyclic
triaxial tests (Stewart 1982; Selig and Waters 1994; Menq 2003). Lin et al. (2000) investigated
the dynamic behavior of a gravelly cobble deposit mixed with fine soil by cyclic triaxial tests.
Their results showed that the gravel content greatly affected the nonlinear shear modulus-shear
strain and damping ratio-shear strain relations. Tennakoon and Indraratna (2014) studied the
dynamic characteristics of fouled ballast by performing a series of large-scale cyclic triaxial
tests, and concluded that increasing the fouling magnitude resulted in a decrease of resilient
modulus. Wang et al. (2017) and Cui (2018) studied the effect of coarse grain content fv on the
dynamic response of interlayer soil. The results indicated that an increase of coarse grain content
fv gave rise to an increase of resilient modulus and a decrease of damping ratio. Moreover, a
characteristic coarse grain content fv-cha was identified, dividing the soil fabrics into two zones
- a fine matrix zone and a coarse grain skeleton zone. Mousa et al. (2020) investigated the effect
of proportion of reclaimed asphalt pavement on the resilient modulus behavior of unbound
granular materials, and indicated that the addition of reclaimed asphalt pavement tended to
increase the resilient modulus of mixtures. The effect of water content was also addressed in
some studies. Lamas-Lopez (2016) investigated the effect of water content on the resilient
modulus and the damping ratio of the upper part interlayer soil, and reported that an increase of
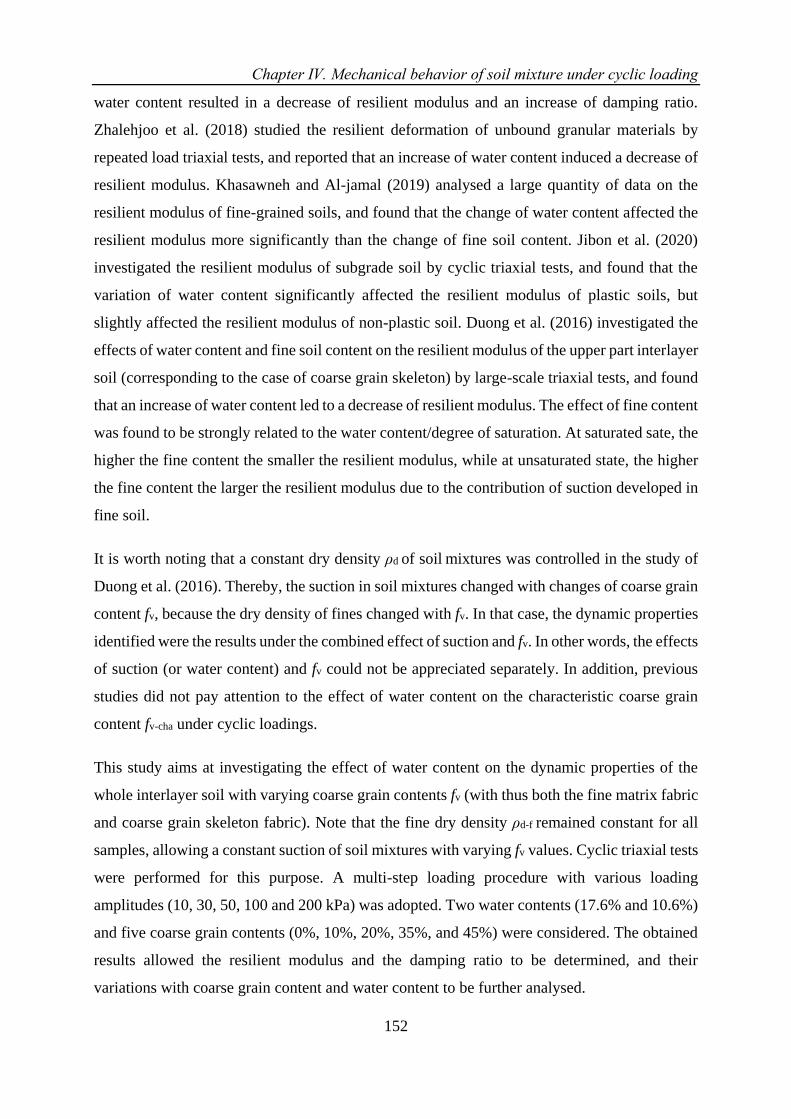
Chapter Ⅳ. Mechanical behavior of soil mixture under cyclic loading
152
water content resulted in a decrease of resilient modulus and an increase of damping ratio.
Zhalehjoo et al. (2018) studied the resilient deformation of unbound granular materials by
repeated load triaxial tests, and reported that an increase of water content induced a decrease of
resilient modulus. Khasawneh and Al-jamal (2019) analysed a large quantity of data on the
resilient modulus of fine-grained soils, and found that the change of water content affected the
resilient modulus more significantly than the change of fine soil content. Jibon et al. (2020)
investigated the resilient modulus of subgrade soil by cyclic triaxial tests, and found that the
variation of water content significantly affected the resilient modulus of plastic soils, but
slightly affected the resilient modulus of non-plastic soil. Duong et al. (2016) investigated the
effects of water content and fine soil content on the resilient modulus of the upper part interlayer
soil (corresponding to the case of coarse grain skeleton) by large-scale triaxial tests, and found
that an increase of water content led to a decrease of resilient modulus. The effect of fine content
was found to be strongly related to the water content/degree of saturation. At saturated sate, the
higher the fine content the smaller the resilient modulus, while at unsaturated state, the higher
the fine content the larger the resilient modulus due to the contribution of suction developed in
fine soil.
It is worth noting that a constant dry density ρd of soil mixtures was controlled in the study of
Duong et al. (2016). Thereby, the suction in soil mixtures changed with changes of coarse grain
content fv, because the dry density of fines changed with fv. In that case, the dynamic properties
identified were the results under the combined effect of suction and fv. In other words, the effects
of suction (or water content) and fv could not be appreciated separately. In addition, previous
studies did not pay attention to the effect of water content on the characteristic coarse grain
content fv-cha under cyclic loadings.
This study aims at investigating the effect of water content on the dynamic properties of the
whole interlayer soil with varying coarse grain contents fv (with thus both the fine matrix fabric
and coarse grain skeleton fabric). Note that the fine dry density ρd-f remained constant for all
samples, allowing a constant suction of soil mixtures with varying fv values. Cyclic triaxial tests
were performed for this purpose. A multi-step loading procedure with various loading
amplitudes (10, 30, 50, 100 and 200 kPa) was adopted. Two water contents (17.6% and 10.6%)
and five coarse grain contents (0%, 10%, 20%, 35%, and 45%) were considered. The obtained
results allowed the resilient modulus and the damping ratio to be determined, and their
variations with coarse grain content and water content to be further analysed.
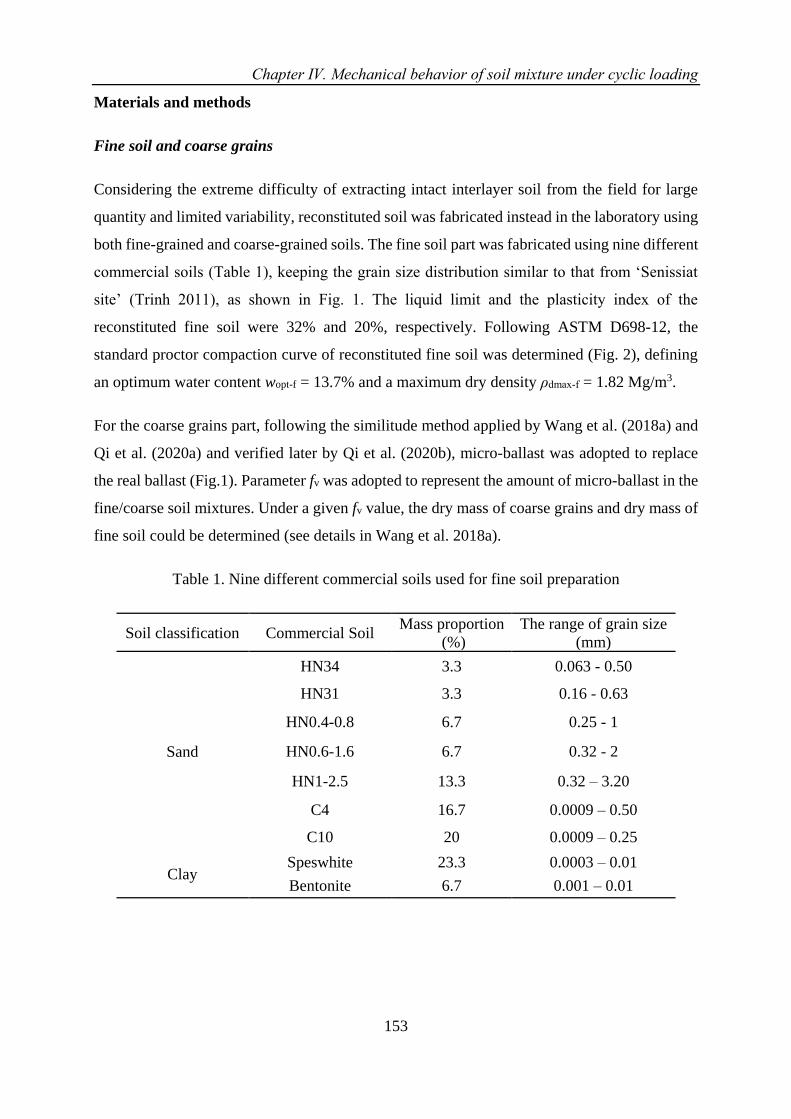
Chapter Ⅳ. Mechanical behavior of soil mixture under cyclic loading
153
Materials and methods
Fine soil and coarse grains
Considering the extreme difficulty of extracting intact interlayer soil from the field for large
quantity and limited variability, reconstituted soil was fabricated instead in the laboratory using
both fine-grained and coarse-grained soils. The fine soil part was fabricated using nine different
commercial soils (Table 1), keeping the grain size distribution similar to that from ‘Senissiat
site’ (Trinh 2011), as shown in Fig. 1. The liquid limit and the plasticity index of the
reconstituted fine soil were 32% and 20%, respectively. Following ASTM D698-12, the
standard proctor compaction curve of reconstituted fine soil was determined (Fig. 2), defining
an optimum water content wopt-f = 13.7% and a maximum dry density ρdmax-f = 1.82 Mg/m3.
For the coarse grains part, following the similitude method applied by Wang et al. (2018a) and
Qi et al. (2020a) and verified later by Qi et al. (2020b), micro-ballast was adopted to replace
the real ballast (Fig.1). Parameter fv was adopted to represent the amount of micro-ballast in the
fine/coarse soil mixtures. Under a given fv value, the dry mass of coarse grains and dry mass of
fine soil could be determined (see details in Wang et al. 2018a).
Table 1. Nine different commercial soils used for fine soil preparation
Soil classification Commercial Soil Mass proportion
(%)
The range of grain size
(mm)
Sand
HN34 3.3 0.063 - 0.50
HN31 3.3 0.16 - 0.63
HN0.4-0.8 6.7 0.25 - 1
HN0.6-1.6 6.7 0.32 - 2
HN1-2.5 13.3 0.32 – 3.20
C4 16.7 0.0009 – 0.50
C10 20 0.0009 – 0.25
Clay Speswhite 23.3 0.0003 – 0.01
Bentonite 6.7 0.001 – 0.01
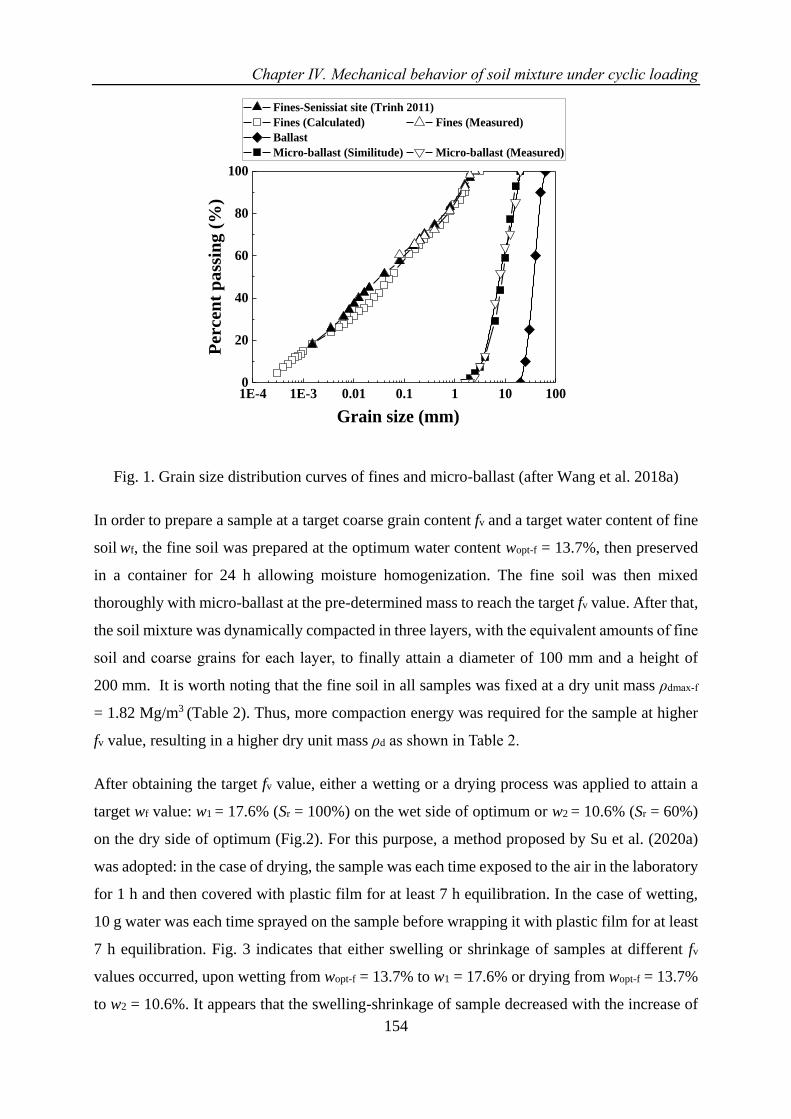
Chapter Ⅳ. Mechanical behavior of soil mixture under cyclic loading
154
1E-4 1E-3 0.01 0.1 1 10 1000
20
40
60
80
100
Fines-Senissiat site (Trinh 2011)
Fines (Calculated) Fines (Measured)
Ballast
Micro-ballast (Similitude) Micro-ballast (Measured)
Percen
t p
ass
ing
(%
)
Grain size (mm)
Fig. 1. Grain size distribution curves of fines and micro-ballast (after Wang et al. 2018a)
In order to prepare a sample at a target coarse grain content fv and a target water content of fine
soil wf, the fine soil was prepared at the optimum water content wopt-f = 13.7%, then preserved
in a container for 24 h allowing moisture homogenization. The fine soil was then mixed
thoroughly with micro-ballast at the pre-determined mass to reach the target fv value. After that,
the soil mixture was dynamically compacted in three layers, with the equivalent amounts of fine
soil and coarse grains for each layer, to finally attain a diameter of 100 mm and a height of
200 mm. It is worth noting that the fine soil in all samples was fixed at a dry unit mass ρdmax-f
= 1.82 Mg/m3 (Table 2). Thus, more compaction energy was required for the sample at higher
fv value, resulting in a higher dry unit mass ρd as shown in Table 2.
After obtaining the target fv value, either a wetting or a drying process was applied to attain a
target wf value: w1 = 17.6% (Sr = 100%) on the wet side of optimum or w2 = 10.6% (Sr = 60%)
on the dry side of optimum (Fig.2). For this purpose, a method proposed by Su et al. (2020a)
was adopted: in the case of drying, the sample was each time exposed to the air in the laboratory
for 1 h and then covered with plastic film for at least 7 h equilibration. In the case of wetting,
10 g water was each time sprayed on the sample before wrapping it with plastic film for at least
7 h equilibration. Fig. 3 indicates that either swelling or shrinkage of samples at different fv
values occurred, upon wetting from wopt-f = 13.7% to w1 = 17.6% or drying from wopt-f = 13.7%
to w2 = 10.6%. It appears that the swelling-shrinkage of sample decreased with the increase of
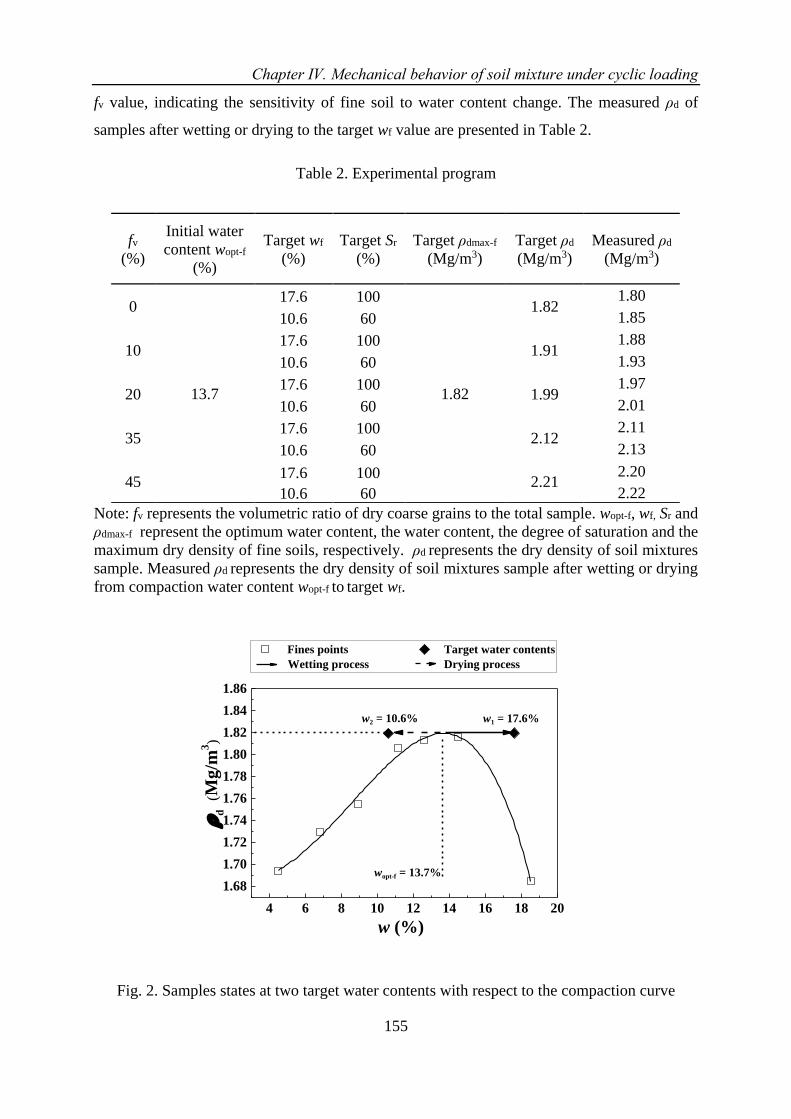
Chapter Ⅳ. Mechanical behavior of soil mixture under cyclic loading
155
fv value, indicating the sensitivity of fine soil to water content change. The measured ρd of
samples after wetting or drying to the target wf value are presented in Table 2.
Table 2. Experimental program
Note: fv represents the volumetric ratio of dry coarse grains to the total sample. wopt-f, wf, Sr and
ρdmax-f represent the optimum water content, the water content, the degree of saturation and the
maximum dry density of fine soils, respectively. ρd represents the dry density of soil mixtures
sample. Measured ρd represents the dry density of soil mixtures sample after wetting or drying
from compaction water content wopt-f to target wf.
4 6 8 10 12 14 16 18 20
1.68
1.70
1.72
1.74
1.76
1.78
1.80
1.82
1.84
1.86
wopt-f = 13.7%
w2 = 10.6%
d
(Mg
/m3)
w (%)
Fines points Target water contents
Wetting process Drying process
w1 = 17.6%
Fig. 2. Samples states at two target water contents with respect to the compaction curve
fv
(%)
Initial water
content wopt-f
(%)
Target wf
(%)
Target Sr
(%)
Target ρdmax-f
(Mg/m3)
Target ρd
(Mg/m3)
Measured ρd
(Mg/m3)
0
13.7
17.6 100
1.82
1.82 1.80
10.6 60 1.85
10 17.6 100
1.91 1.88
10.6 60 1.93
20 17.6 100
1.99 1.97
10.6 60 2.01
35 17.6 100
2.12 2.11
10.6 60 2.13
45 17.6 100
2.21 2.20
10.6 60 2.22
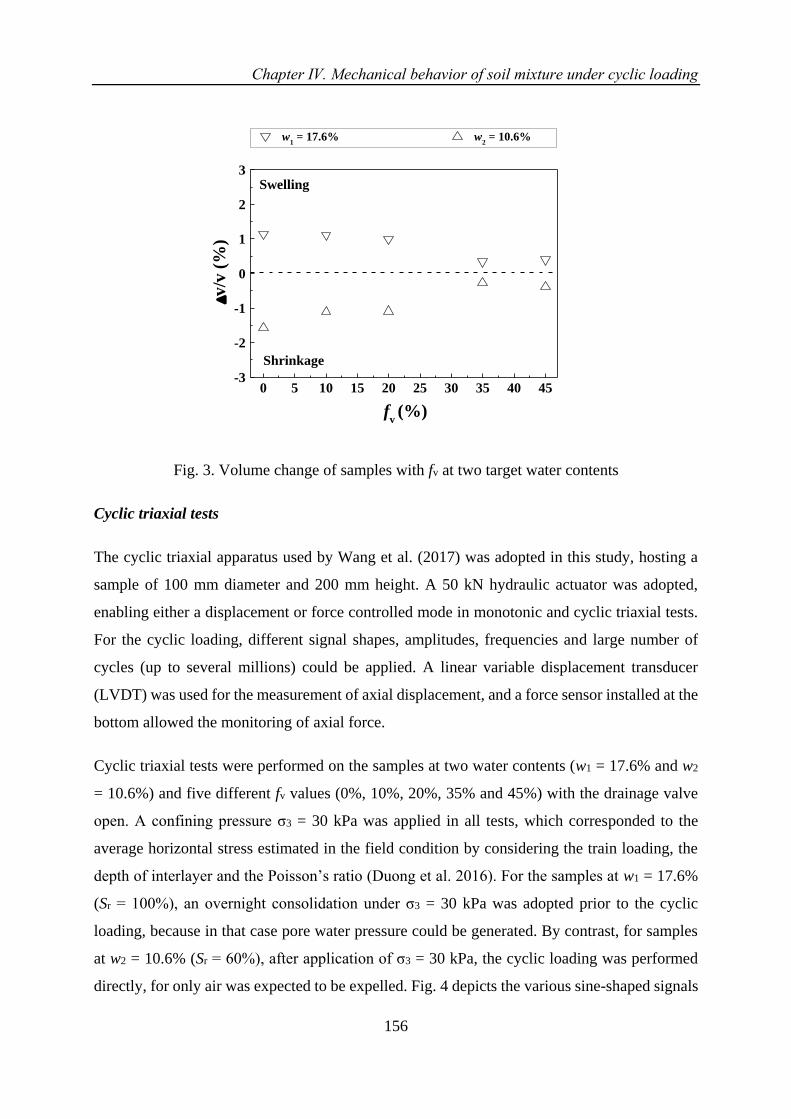
Chapter Ⅳ. Mechanical behavior of soil mixture under cyclic loading
156
0 5 10 15 20 25 30 35 40 45-3
-2
-1
0
1
2
3
fv (%)
Shrinkage
w1 = 17.6% w
2 = 10.6%
v
/v (
%)
Swelling
Fig. 3. Volume change of samples with fv at two target water contents
Cyclic triaxial tests
The cyclic triaxial apparatus used by Wang et al. (2017) was adopted in this study, hosting a
sample of 100 mm diameter and 200 mm height. A 50 kN hydraulic actuator was adopted,
enabling either a displacement or force controlled mode in monotonic and cyclic triaxial tests.
For the cyclic loading, different signal shapes, amplitudes, frequencies and large number of
cycles (up to several millions) could be applied. A linear variable displacement transducer
(LVDT) was used for the measurement of axial displacement, and a force sensor installed at the
bottom allowed the monitoring of axial force.
Cyclic triaxial tests were performed on the samples at two water contents (w1 = 17.6% and w2
= 10.6%) and five different fv values (0%, 10%, 20%, 35% and 45%) with the drainage valve
open. A confining pressure σ3 = 30 kPa was applied in all tests, which corresponded to the
average horizontal stress estimated in the field condition by considering the train loading, the
depth of interlayer and the Poisson’s ratio (Duong et al. 2016). For the samples at w1 = 17.6%
(Sr = 100%), an overnight consolidation under σ3 = 30 kPa was adopted prior to the cyclic
loading, because in that case pore water pressure could be generated. By contrast, for samples
at w2 = 10.6% (Sr = 60%), after application of σ3 = 30 kPa, the cyclic loading was performed
directly, for only air was expected to be expelled. Fig. 4 depicts the various sine-shaped signals
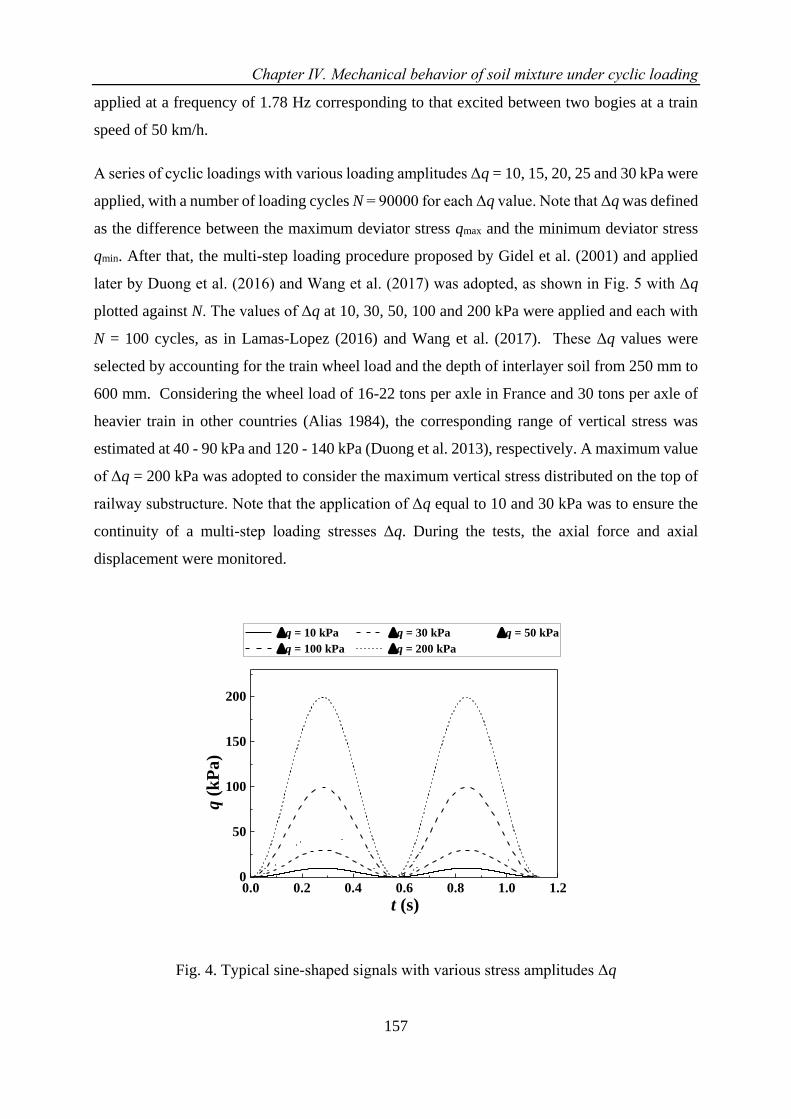
Chapter Ⅳ. Mechanical behavior of soil mixture under cyclic loading
157
applied at a frequency of 1.78 Hz corresponding to that excited between two bogies at a train
speed of 50 km/h.
A series of cyclic loadings with various loading amplitudes Δq = 10, 15, 20, 25 and 30 kPa were
applied, with a number of loading cycles N = 90000 for each Δq value. Note that Δq was defined
as the difference between the maximum deviator stress qmax and the minimum deviator stress
qmin. After that, the multi-step loading procedure proposed by Gidel et al. (2001) and applied
later by Duong et al. (2016) and Wang et al. (2017) was adopted, as shown in Fig. 5 with Δq
plotted against N. The values of Δq at 10, 30, 50, 100 and 200 kPa were applied and each with
N = 100 cycles, as in Lamas-Lopez (2016) and Wang et al. (2017). These Δq values were
selected by accounting for the train wheel load and the depth of interlayer soil from 250 mm to
600 mm. Considering the wheel load of 16-22 tons per axle in France and 30 tons per axle of
heavier train in other countries (Alias 1984), the corresponding range of vertical stress was
estimated at 40 - 90 kPa and 120 - 140 kPa (Duong et al. 2013), respectively. A maximum value
of Δq = 200 kPa was adopted to consider the maximum vertical stress distributed on the top of
railway substructure. Note that the application of Δq equal to 10 and 30 kPa was to ensure the
continuity of a multi-step loading stresses Δq. During the tests, the axial force and axial
displacement were monitored.
0.0 0.2 0.4 0.6 0.8 1.0 1.20
50
100
150
200
t (s)
q (
kP
a)
q = 10 kPa q = 30 kPa q = 50 kPa
q = 100 kPa q = 200 kPa
Fig. 4. Typical sine-shaped signals with various stress amplitudes Δq

Chapter Ⅳ. Mechanical behavior of soil mixture under cyclic loading
158
0 300 600 900 1200 1500 18000
50
100
150
200
250
q = 200 kPa
q = 100 kPa
q = 50 kPa
q (
kP
a)
Cycle (N)
Fig. 5. Multi-step loading procedure applied in cyclic triaxial tests
Experimental results
Fig. 6 depicts typical hysteresis loops for various deviator stress amplitudes Δq at fv = 0% and
two target water contents. It can be observed that at a given water content, the size of hysteresis
loop increased with the increase of Δq. When Δq ≤ 30 kPa, the hysteresis loops were small
because of the large number of loading cycles applied under this stress level to approach an in-
situ soil state, prior to starting the multi-step loading procedure shown in Fig. 5. By contrast,
when Δq increased to a larger value, especially at 100 kPa for w1 =17.6% and 200 kPa for w2 =
10.6%, a larger unclosed hysteresis loop occurred, with the axial strain consisting of two parts:
permanent strain 휀1𝑝 and elastic strain 휀1
𝑟. Note that at w1 =17.6%, the used LVDT reached its
measurement capacity around 70 mm by the end of loading under Δq = 100 kPa. Thus, the tests
at w1 =17.6% ended at N = 1400 (Fig. 5). In addition, a decrease of water content from w1 =17.6%
to w2 = 10.6% led to a decrease of the size of hysteresis loops, indicating that both permanent
strain 휀1𝑝 and elastic strain 휀1
𝑟 decreased with the decrease of water content.
To further clarify the effect of water content, the variations of 휀1𝑝 and 휀1
𝑟 with loading cycles N
at fv = 0% are plotted in Fig. 7 for the two target water contents. At a given water content, the
permanent strain 휀1𝑝 and elastic strain 휀1
𝑟 increased slowly with Δq until Δq = 100 -200 kPa.
Then, a sharp increase was observed for both strains. As shown in Fig. 7, the decrease of water
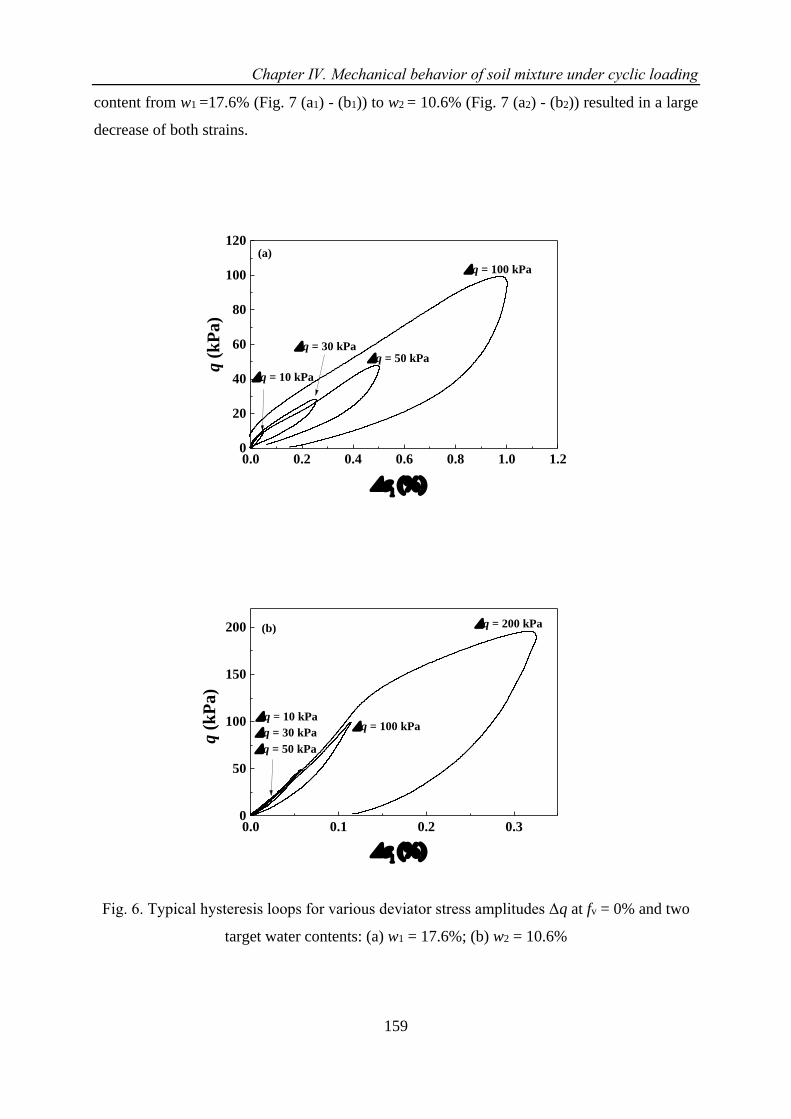
Chapter Ⅳ. Mechanical behavior of soil mixture under cyclic loading
159
content from w1 =17.6% (Fig. 7 (a1) - (b1)) to w2 = 10.6% (Fig. 7 (a2) - (b2)) resulted in a large
decrease of both strains.
0.0 0.2 0.4 0.6 0.8 1.0 1.20
20
40
60
80
100
120
q = 100 kPa
q = 50 kPaq = 30 kPa
(a)
q (
kP
a)
()
q = 10 kPa
0.0 0.1 0.2 0.30
50
100
150
200 q = 200 kPa
q = 100 kPa
q = 50 kPa
q = 30 kPa
q = 10 kPa
(b)
q (
kP
a)
()
Fig. 6. Typical hysteresis loops for various deviator stress amplitudes Δq at fv = 0% and two
target water contents: (a) w1 = 17.6%; (b) w2 = 10.6%
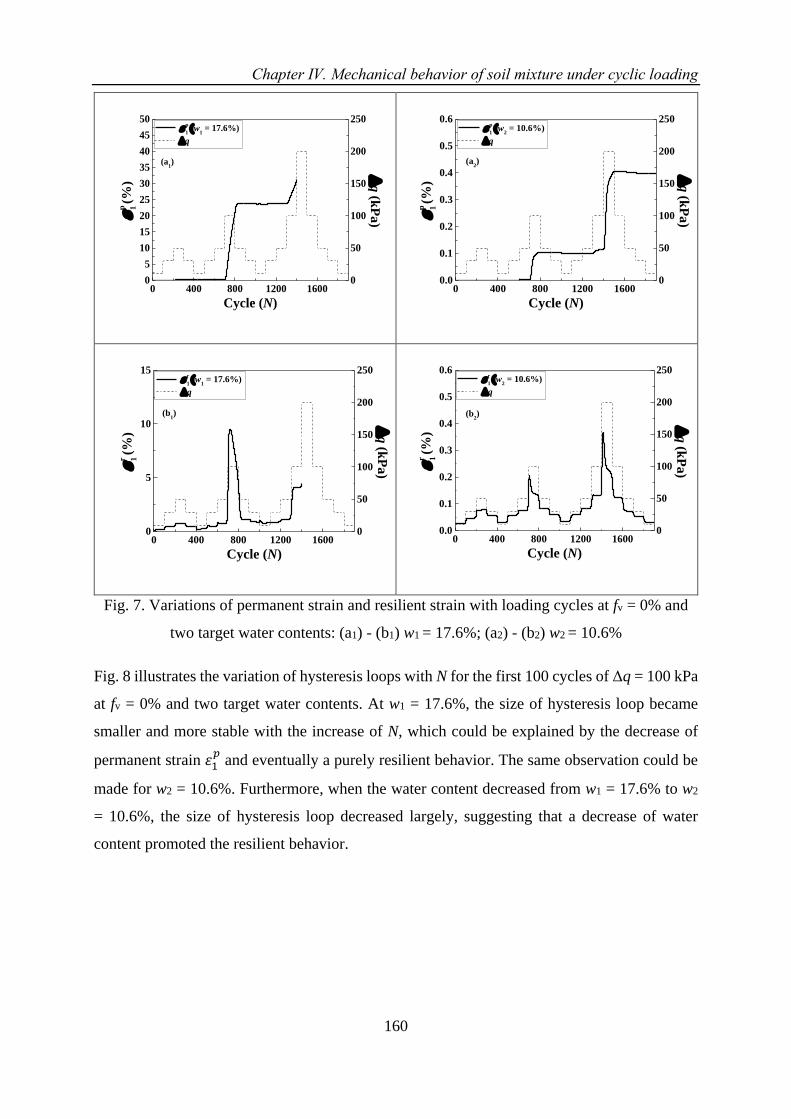
Chapter Ⅳ. Mechanical behavior of soil mixture under cyclic loading
160
0 400 800 1200 16000
5
10
15
20
25
30
35
40
45
50
p
1 (w
1 = 17.6%)
p 1 (%
)
Cycle (N)
0
50
100
150
200
250
q
(kP
a)
q
(a1)
0 400 800 1200 16000.0
0.1
0.2
0.3
0.4
0.5
0.6
(a2)
p
1 (w
2 = 10.6%)
p 1 (%
)
Cycle (N)
0
50
100
150
200
250
q (k
Pa
)
q
0 400 800 1200 16000
5
10
15
(b1)
r
1 (w
1 = 17.6%)
r 1 (%
)
Cycle (N)
0
50
100
150
200
250
q
(kP
a)
q
0 400 800 1200 16000.0
0.1
0.2
0.3
0.4
0.5
0.6
(b2)
r
1 (w
2 = 10.6%)
r 1 (%
)
Cycle (N)
0
50
100
150
200
250
q
(kP
a)
q
Fig. 7. Variations of permanent strain and resilient strain with loading cycles at fv = 0% and
two target water contents: (a1) - (b1) w1 = 17.6%; (a2) - (b2) w2 = 10.6%
Fig. 8 illustrates the variation of hysteresis loops with N for the first 100 cycles of Δq = 100 kPa
at fv = 0% and two target water contents. At w1 = 17.6%, the size of hysteresis loop became
smaller and more stable with the increase of N, which could be explained by the decrease of
permanent strain 휀1𝑝 and eventually a purely resilient behavior. The same observation could be
made for w2 = 10.6%. Furthermore, when the water content decreased from w1 = 17.6% to w2
= 10.6%, the size of hysteresis loop decreased largely, suggesting that a decrease of water
content promoted the resilient behavior.
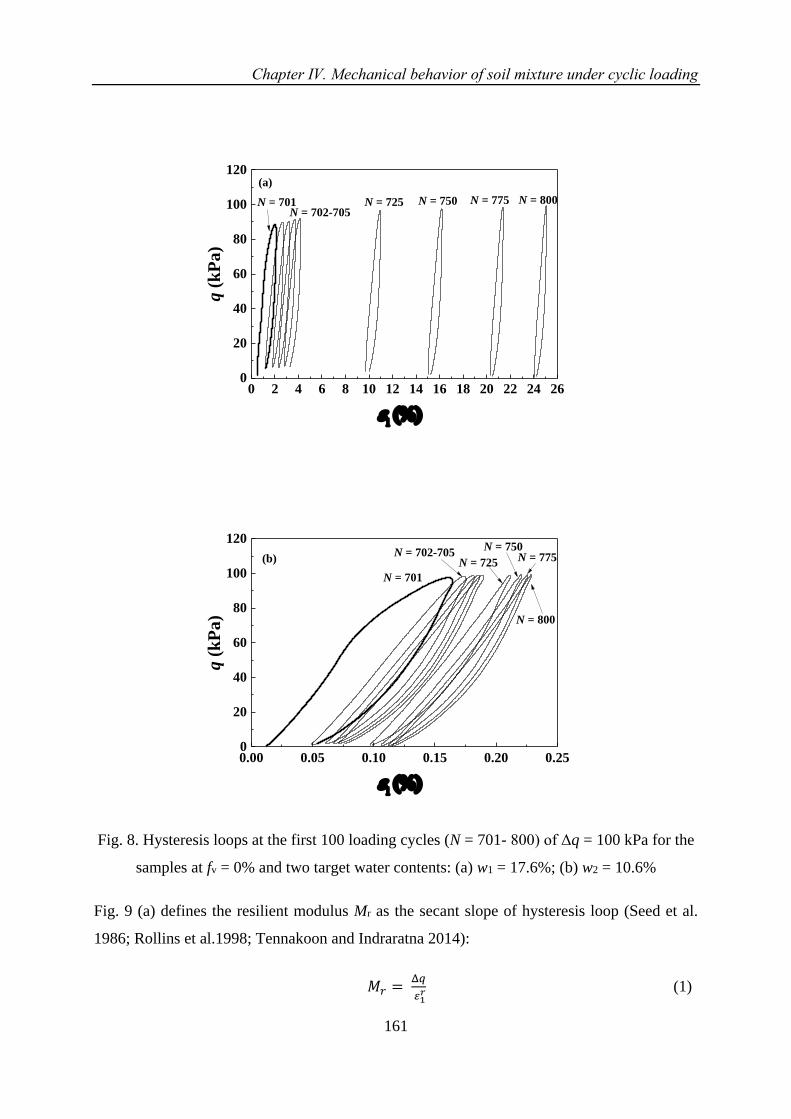
Chapter Ⅳ. Mechanical behavior of soil mixture under cyclic loading
161
0 2 4 6 8 10 12 14 16 18 20 22 24 260
20
40
60
80
100
120(a)
N = 800N = 775N = 750N = 725N = 702-705
q (
kP
a)
()
N = 701
0.00 0.05 0.10 0.15 0.20 0.250
20
40
60
80
100
120
(b)
N = 800
N = 775N = 750
N = 725N = 702-705
q (
kP
a)
()
N = 701
Fig. 8. Hysteresis loops at the first 100 loading cycles (N = 701- 800) of Δq = 100 kPa for the
samples at fv = 0% and two target water contents: (a) w1 = 17.6%; (b) w2 = 10.6%
Fig. 9 (a) defines the resilient modulus Mr as the secant slope of hysteresis loop (Seed et al.
1986; Rollins et al.1998; Tennakoon and Indraratna 2014):
𝑀𝑟 = Δ𝑞
𝜀1𝑟 (1)
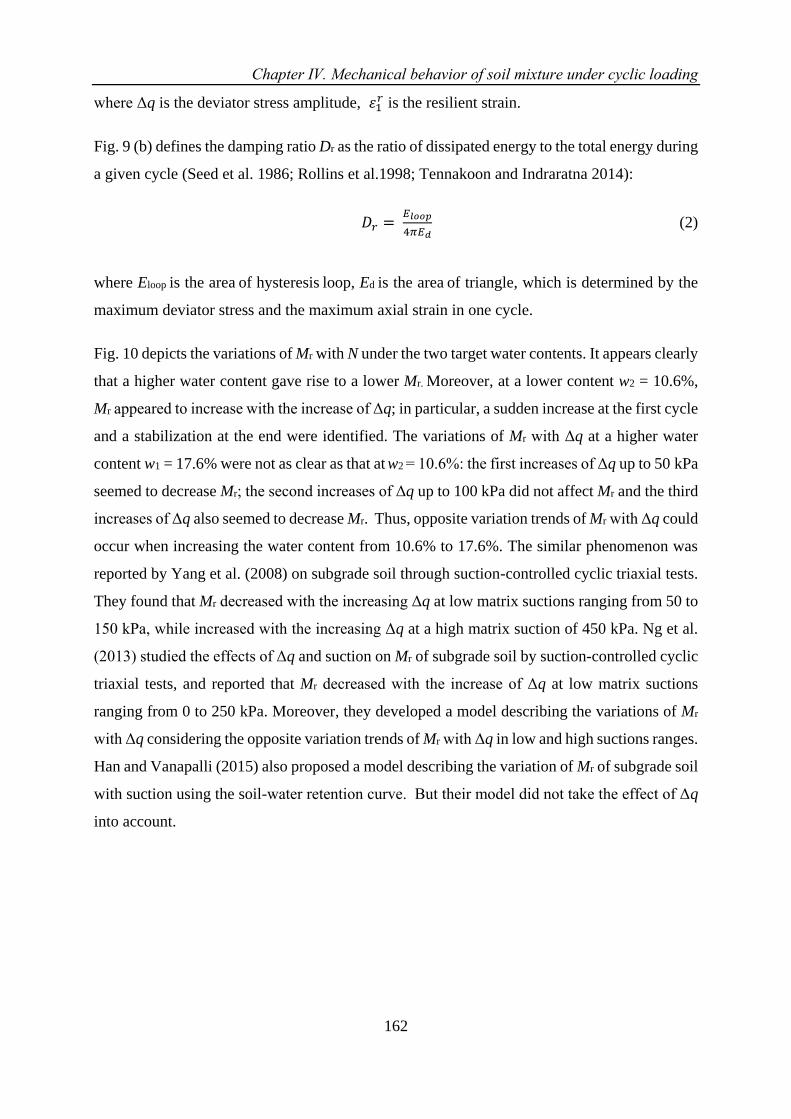
Chapter Ⅳ. Mechanical behavior of soil mixture under cyclic loading
162
where Δq is the deviator stress amplitude, 휀1𝑟 is the resilient strain.
Fig. 9 (b) defines the damping ratio Dr as the ratio of dissipated energy to the total energy during
a given cycle (Seed et al. 1986; Rollins et al.1998; Tennakoon and Indraratna 2014):
𝐷𝑟 = 𝐸𝑙𝑜𝑜𝑝
4𝜋𝐸𝑑 (2)
where Eloop is the area of hysteresis loop, Ed is the area of triangle, which is determined by the
maximum deviator stress and the maximum axial strain in one cycle.
Fig. 10 depicts the variations of Mr with N under the two target water contents. It appears clearly
that a higher water content gave rise to a lower Mr. Moreover, at a lower content w2 = 10.6%,
Mr appeared to increase with the increase of Δq; in particular, a sudden increase at the first cycle
and a stabilization at the end were identified. The variations of Mr with Δq at a higher water
content w1 = 17.6% were not as clear as that at w2 = 10.6%: the first increases of Δq up to 50 kPa
seemed to decrease Mr; the second increases of Δq up to 100 kPa did not affect Mr and the third
increases of Δq also seemed to decrease Mr. Thus, opposite variation trends of Mr with Δq could
occur when increasing the water content from 10.6% to 17.6%. The similar phenomenon was
reported by Yang et al. (2008) on subgrade soil through suction-controlled cyclic triaxial tests.
They found that Mr decreased with the increasing Δq at low matrix suctions ranging from 50 to
150 kPa, while increased with the increasing Δq at a high matrix suction of 450 kPa. Ng et al.
(2013) studied the effects of Δq and suction on Mr of subgrade soil by suction-controlled cyclic
triaxial tests, and reported that Mr decreased with the increase of Δq at low matrix suctions
ranging from 0 to 250 kPa. Moreover, they developed a model describing the variations of Mr
with Δq considering the opposite variation trends of Mr with Δq in low and high suctions ranges.
Han and Vanapalli (2015) also proposed a model describing the variation of Mr of subgrade soil
with suction using the soil-water retention curve. But their model did not take the effect of Δq
into account.
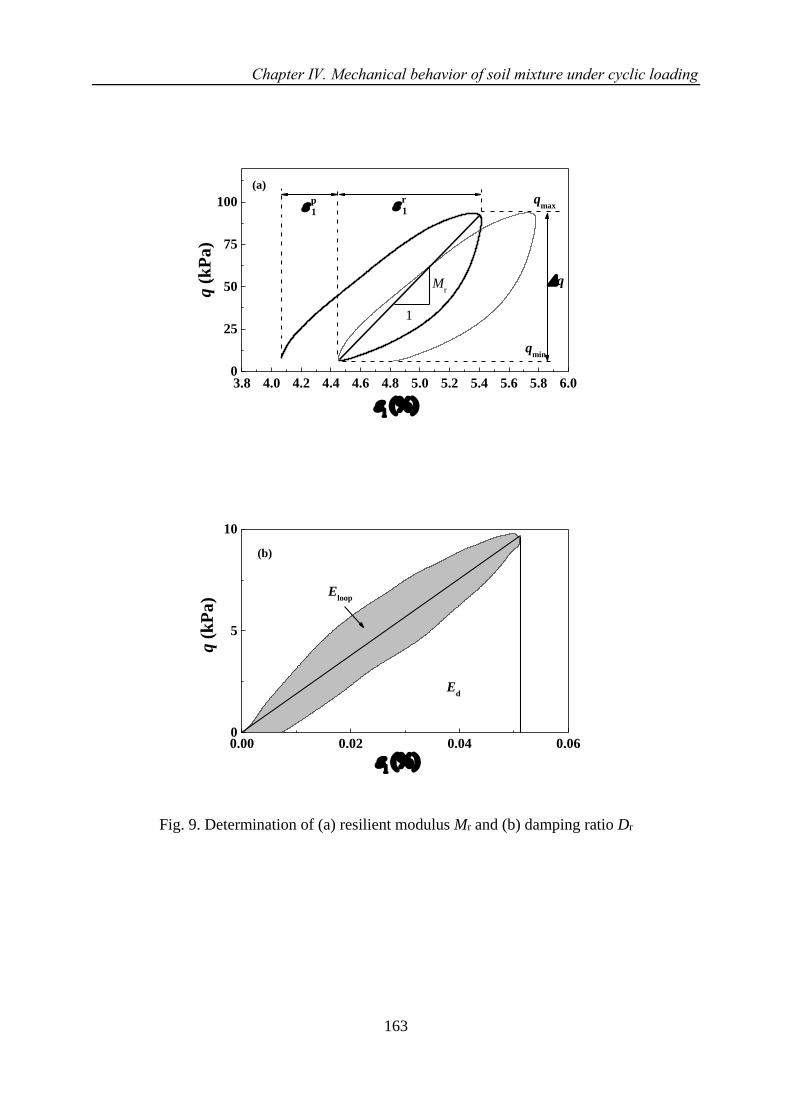
Chapter Ⅳ. Mechanical behavior of soil mixture under cyclic loading
163
3.8 4.0 4.2 4.4 4.6 4.8 5.0 5.2 5.4 5.6 5.8 6.00
25
50
75
100
(a)
r
1
Mr
q
qmin
qmax
q
()
q (
kP
a)
p
1
1
0.00 0.02 0.04 0.060
5
10
(b)
Ed
q (
kP
a)
()
Eloop
Fig. 9. Determination of (a) resilient modulus Mr and (b) damping ratio Dr
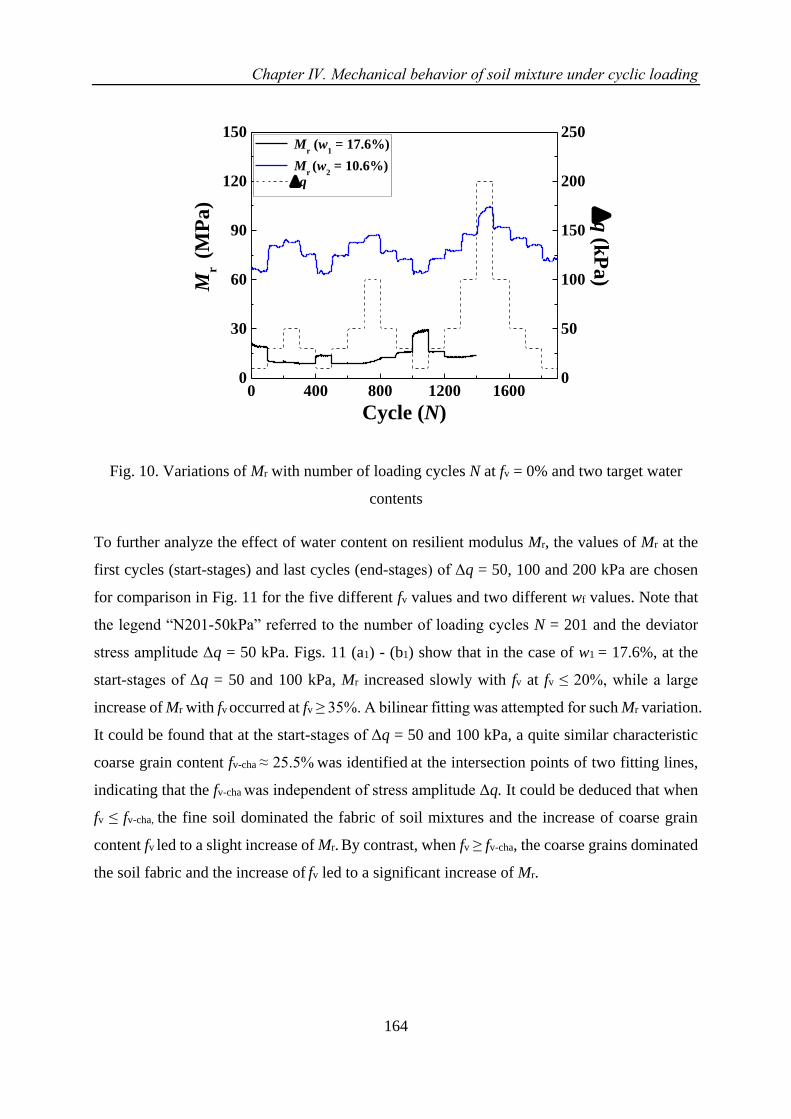
Chapter Ⅳ. Mechanical behavior of soil mixture under cyclic loading
164
0 400 800 1200 16000
30
60
90
120
150 M
r (w
1 = 17.6%)
Mr (w
2 = 10.6%)
Mr (
MP
a)
Cycle (N)
0
50
100
150
200
250
q
(kP
a) q
Fig. 10. Variations of Mr with number of loading cycles N at fv = 0% and two target water
contents
To further analyze the effect of water content on resilient modulus Mr, the values of Mr at the
first cycles (start-stages) and last cycles (end-stages) of Δq = 50, 100 and 200 kPa are chosen
for comparison in Fig. 11 for the five different fv values and two different wf values. Note that
the legend “N201-50kPa” referred to the number of loading cycles N = 201 and the deviator
stress amplitude Δq = 50 kPa. Figs. 11 (a1) - (b1) show that in the case of w1 = 17.6%, at the
start-stages of Δq = 50 and 100 kPa, Mr increased slowly with fv at fv ≤ 20%, while a large
increase of Mr with fv occurred at fv ≥ 35%. A bilinear fitting was attempted for such Mr variation.
It could be found that at the start-stages of Δq = 50 and 100 kPa, a quite similar characteristic
coarse grain content fv-cha ≈ 25.5% was identified at the intersection points of two fitting lines,
indicating that the fv-cha was independent of stress amplitude Δq. It could be deduced that when
fv ≤ fv-cha, the fine soil dominated the fabric of soil mixtures and the increase of coarse grain
content fv led to a slight increase of Mr. By contrast, when fv ≥ fv-cha, the coarse grains dominated
the soil fabric and the increase of fv led to a significant increase of Mr.
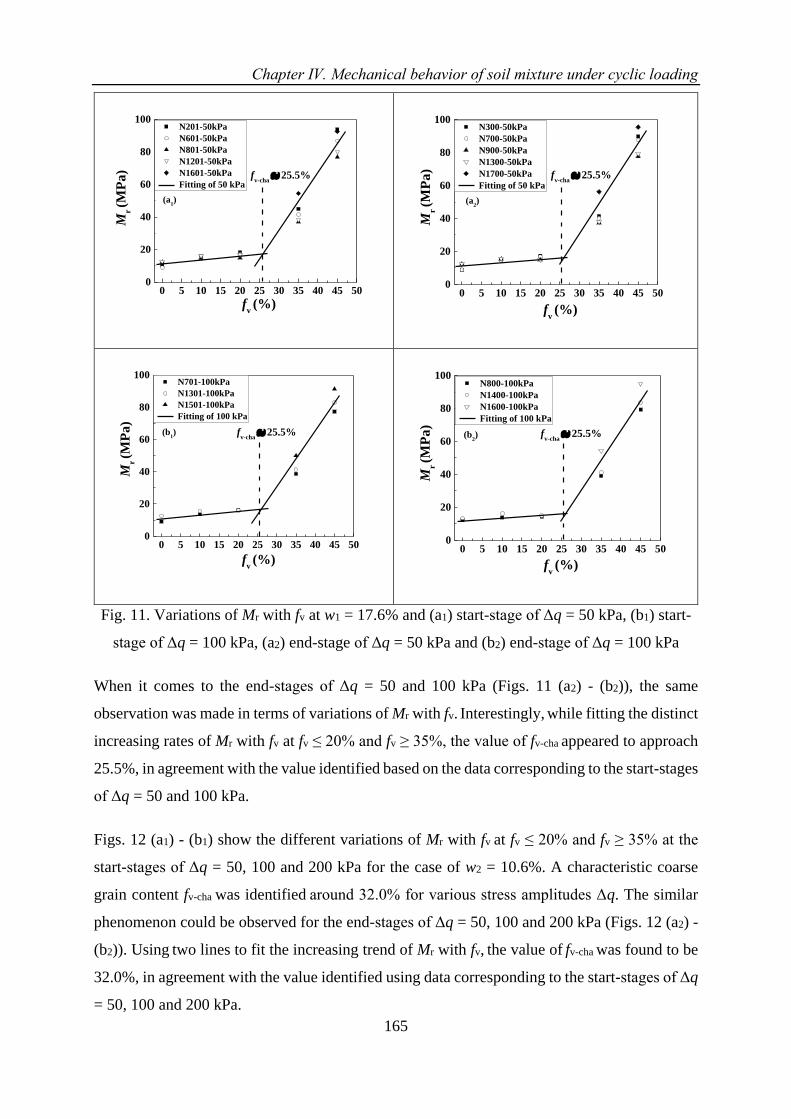
Chapter Ⅳ. Mechanical behavior of soil mixture under cyclic loading
165
0 5 10 15 20 25 30 35 40 45 500
20
40
60
80
100
(a1)
N201-50kPa
N601-50kPa
N801-50kPa
N1201-50kPa
N1601-50kPa
Fitting of 50 kPa
Mr (M
Pa)
fv (%)
fv-cha
25.5%
0 5 10 15 20 25 30 35 40 45 500
20
40
60
80
100
(a2)
fv-cha
25.5%
Mr (M
Pa)
fv (%)
N300-50kPa
N700-50kPa
N900-50kPa
N1300-50kPa
N1700-50kPa
Fitting of 50 kPa
0 5 10 15 20 25 30 35 40 45 500
20
40
60
80
100
(b1) f
v-cha 25.5%
Mr (M
Pa)
fv (%)
N701-100kPa
N1301-100kPa
N1501-100kPa
Fitting of 100 kPa
0 5 10 15 20 25 30 35 40 45 500
20
40
60
80
100
(b2) f
v-cha 25.5%
Mr (M
Pa)
fv (%)
N800-100kPa
N1400-100kPa
N1600-100kPa
Fitting of 100 kPa
Fig. 11. Variations of Mr with fv at w1 = 17.6% and (a1) start-stage of Δq = 50 kPa, (b1) start-
stage of Δq = 100 kPa, (a2) end-stage of Δq = 50 kPa and (b2) end-stage of Δq = 100 kPa
When it comes to the end-stages of Δq = 50 and 100 kPa (Figs. 11 (a2) - (b2)), the same
observation was made in terms of variations of Mr with fv. Interestingly, while fitting the distinct
increasing rates of Mr with fv at fv ≤ 20% and fv ≥ 35%, the value of fv-cha appeared to approach
25.5%, in agreement with the value identified based on the data corresponding to the start-stages
of Δq = 50 and 100 kPa.
Figs. 12 (a1) - (b1) show the different variations of Mr with fv at fv ≤ 20% and fv ≥ 35% at the
start-stages of Δq = 50, 100 and 200 kPa for the case of w2 = 10.6%. A characteristic coarse
grain content fv-cha was identified around 32.0% for various stress amplitudes Δq. The similar
phenomenon could be observed for the end-stages of Δq = 50, 100 and 200 kPa (Figs. 12 (a2) -
(b2)). Using two lines to fit the increasing trend of Mr with fv, the value of fv-cha was found to be
32.0%, in agreement with the value identified using data corresponding to the start-stages of Δq
= 50, 100 and 200 kPa.
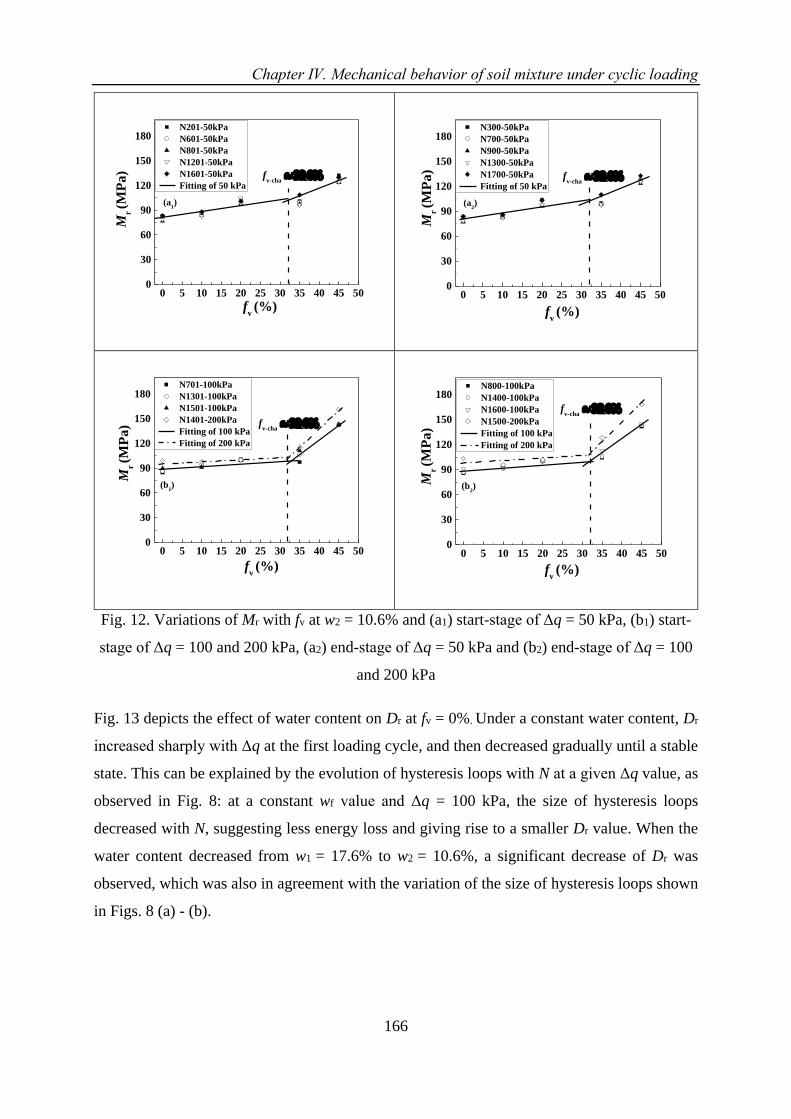
Chapter Ⅳ. Mechanical behavior of soil mixture under cyclic loading
166
0 5 10 15 20 25 30 35 40 45 500
30
60
90
120
150
180
(a1)
N201-50kPa
N601-50kPa
N801-50kPa
N1201-50kPa
N1601-50kPa
Fitting of 50 kPa
Mr (M
Pa)
fv (%)
fv-cha
0 5 10 15 20 25 30 35 40 45 500
30
60
90
120
150
180
(a2)
fv-cha
Mr (M
Pa)
fv (%)
N300-50kPa
N700-50kPa
N900-50kPa
N1300-50kPa
N1700-50kPa
Fitting of 50 kPa
0 5 10 15 20 25 30 35 40 45 500
30
60
90
120
150
180
(b1)
fv-cha
Mr (M
Pa)
fv (%)
N701-100kPa
N1301-100kPa
N1501-100kPa
N1401-200kPa
Fitting of 100 kPa
Fitting of 200 kPa
0 5 10 15 20 25 30 35 40 45 500
30
60
90
120
150
180
(b2)
fv-cha
Mr (M
Pa
)
fv (%)
N800-100kPa
N1400-100kPa
N1600-100kPa
N1500-200kPa
Fitting of 100 kPa
Fitting of 200 kPa
Fig. 12. Variations of Mr with fv at w2 = 10.6% and (a1) start-stage of Δq = 50 kPa, (b1) start-
stage of Δq = 100 and 200 kPa, (a2) end-stage of Δq = 50 kPa and (b2) end-stage of Δq = 100
and 200 kPa
Fig. 13 depicts the effect of water content on Dr at fv = 0%. Under a constant water content, Dr
increased sharply with Δq at the first loading cycle, and then decreased gradually until a stable
state. This can be explained by the evolution of hysteresis loops with N at a given Δq value, as
observed in Fig. 8: at a constant wf value and Δq = 100 kPa, the size of hysteresis loops
decreased with N, suggesting less energy loss and giving rise to a smaller Dr value. When the
water content decreased from w1 = 17.6% to w2 = 10.6%, a significant decrease of Dr was
observed, which was also in agreement with the variation of the size of hysteresis loops shown
in Figs. 8 (a) - (b).
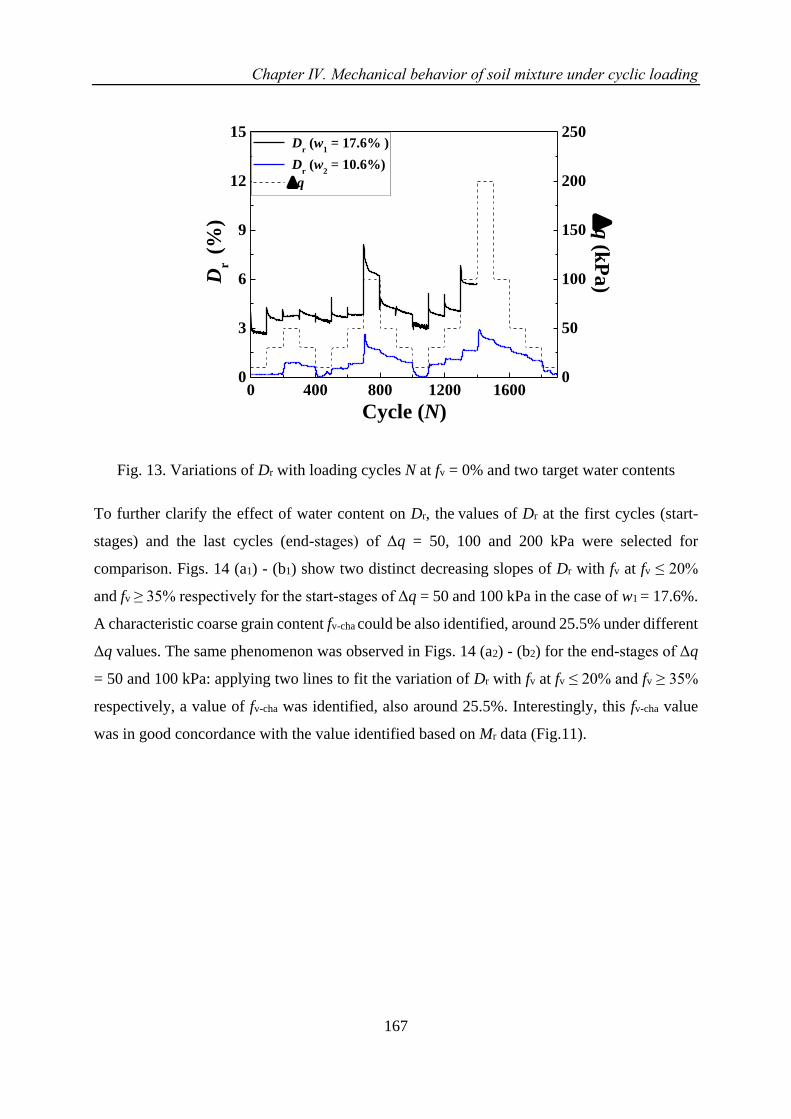
Chapter Ⅳ. Mechanical behavior of soil mixture under cyclic loading
167
0 400 800 1200 16000
3
6
9
12
15 D
r (w
1 = 17.6% )
Dr (w
2 = 10.6%)
Dr (
%)
Cycle (N)
0
50
100
150
200
250
q
(kP
a) q
Fig. 13. Variations of Dr with loading cycles N at fv = 0% and two target water contents
To further clarify the effect of water content on Dr, the values of Dr at the first cycles (start-
stages) and the last cycles (end-stages) of Δq = 50, 100 and 200 kPa were selected for
comparison. Figs. 14 (a1) - (b1) show two distinct decreasing slopes of Dr with fv at fv ≤ 20%
and fv ≥ 35% respectively for the start-stages of Δq = 50 and 100 kPa in the case of w1 = 17.6%.
A characteristic coarse grain content fv-cha could be also identified, around 25.5% under different
Δq values. The same phenomenon was observed in Figs. 14 (a2) - (b2) for the end-stages of Δq
= 50 and 100 kPa: applying two lines to fit the variation of Dr with fv at fv ≤ 20% and fv ≥ 35%
respectively, a value of fv-cha was identified, also around 25.5%. Interestingly, this fv-cha value
was in good concordance with the value identified based on Mr data (Fig.11).
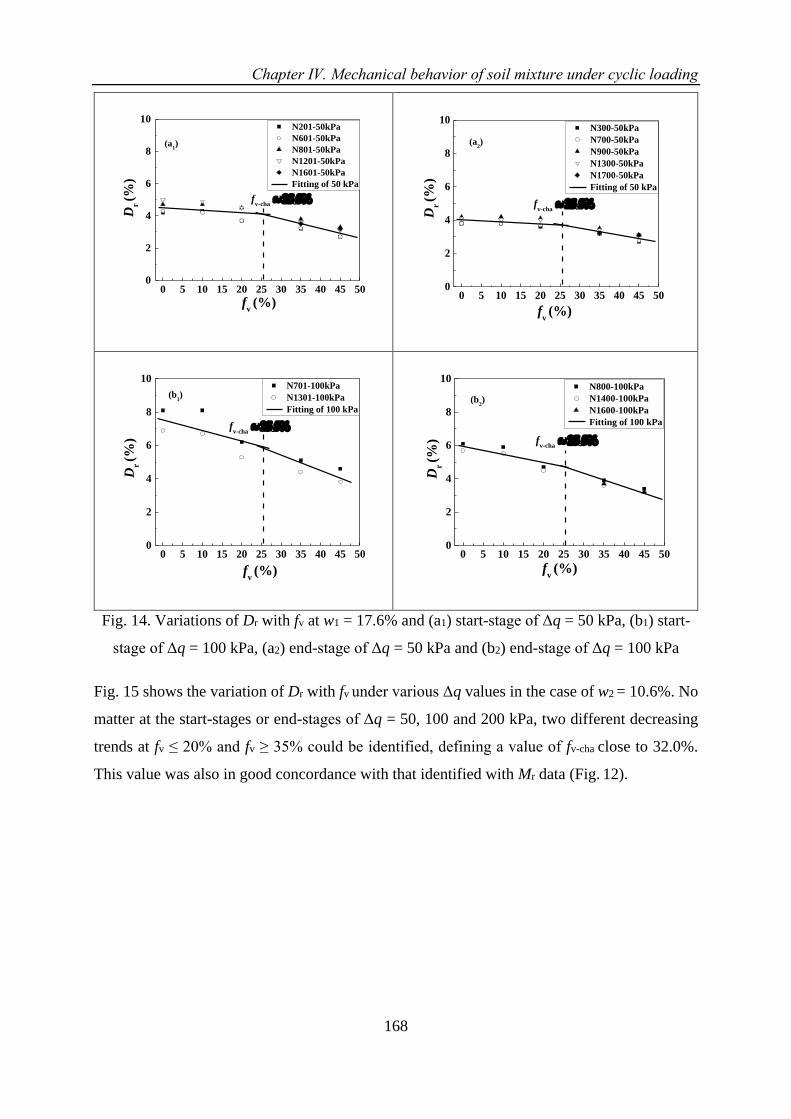
Chapter Ⅳ. Mechanical behavior of soil mixture under cyclic loading
168
0 5 10 15 20 25 30 35 40 45 500
2
4
6
8
10
(a1)
fv-cha
fv (%)
N201-50kPa
N601-50kPa
N801-50kPa
N1201-50kPa
N1601-50kPa
Fitting of 50 kPa
Dr (%
)
0 5 10 15 20 25 30 35 40 45 500
2
4
6
8
10
(a2)
fv-cha
Dr (%
)
fv (%)
N300-50kPa
N700-50kPa
N900-50kPa
N1300-50kPa
N1700-50kPa
Fitting of 50 kPa
0 5 10 15 20 25 30 35 40 45 500
2
4
6
8
10
(b1)
fv-cha
Dr (%
)
fv (%)
N701-100kPa
N1301-100kPa
Fitting of 100 kPa
0 5 10 15 20 25 30 35 40 45 500
2
4
6
8
10
(b2)
fv-cha
D
r (%
)
fv (%)
N800-100kPa
N1400-100kPa
N1600-100kPa
Fitting of 100 kPa
Fig. 14. Variations of Dr with fv at w1 = 17.6% and (a1) start-stage of Δq = 50 kPa, (b1) start-
stage of Δq = 100 kPa, (a2) end-stage of Δq = 50 kPa and (b2) end-stage of Δq = 100 kPa
Fig. 15 shows the variation of Dr with fv under various Δq values in the case of w2 = 10.6%. No
matter at the start-stages or end-stages of Δq = 50, 100 and 200 kPa, two different decreasing
trends at fv ≤ 20% and fv ≥ 35% could be identified, defining a value of fv-cha close to 32.0%.
This value was also in good concordance with that identified with Mr data (Fig. 12).
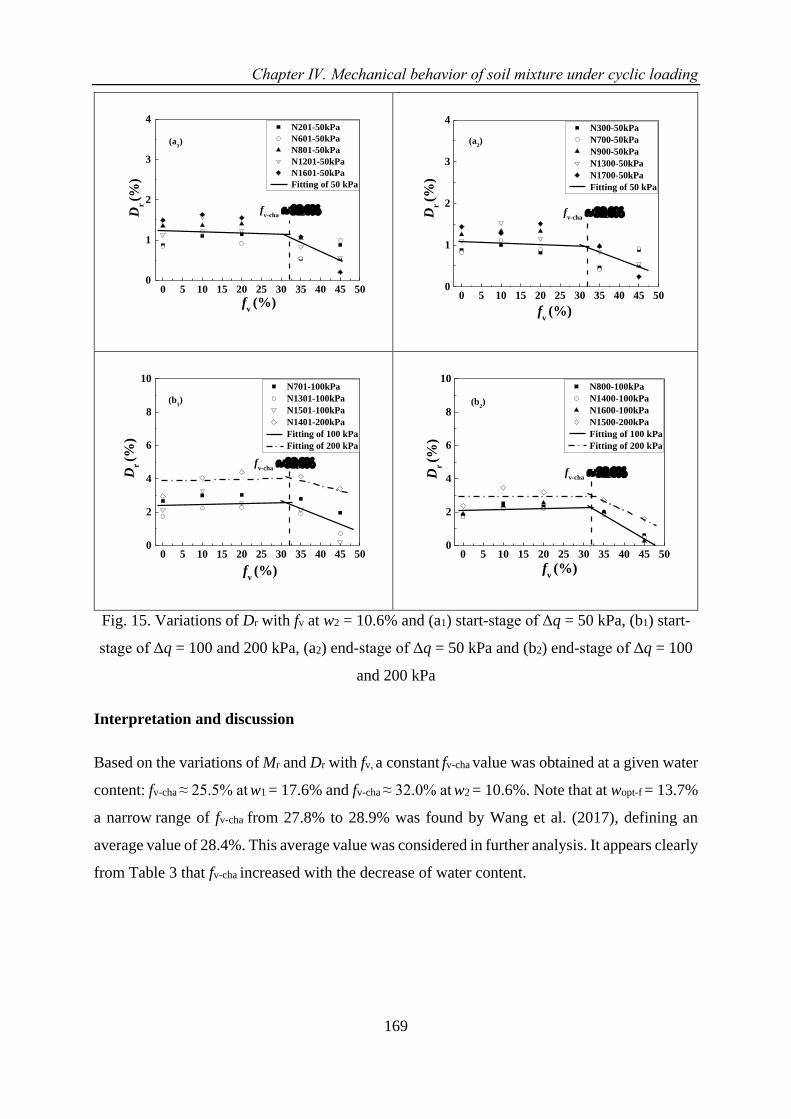
Chapter Ⅳ. Mechanical behavior of soil mixture under cyclic loading
169
0 5 10 15 20 25 30 35 40 45 500
1
2
3
4
(a1)
fv-cha
fv (%)
N201-50kPa
N601-50kPa
N801-50kPa
N1201-50kPa
N1601-50kPa
Fitting of 50 kPa
Dr (%
)
0 5 10 15 20 25 30 35 40 45 500
1
2
3
4
(a2)
fv-cha
Dr (%
)
fv (%)
N300-50kPa
N700-50kPa
N900-50kPa
N1300-50kPa
N1700-50kPa
Fitting of 50 kPa
0 5 10 15 20 25 30 35 40 45 500
2
4
6
8
10
(b1)
fv-cha
Dr (%
)
fv (%)
N701-100kPa
N1301-100kPa
N1501-100kPa
N1401-200kPa
Fitting of 100 kPa
Fitting of 200 kPa
0 5 10 15 20 25 30 35 40 45 500
2
4
6
8
10
(b2)
fv-cha
Dr (%
)
fv (%)
N800-100kPa
N1400-100kPa
N1600-100kPa
N1500-200kPa
Fitting of 100 kPa
Fitting of 200 kPa
Fig. 15. Variations of Dr with fv at w2 = 10.6% and (a1) start-stage of Δq = 50 kPa, (b1) start-
stage of Δq = 100 and 200 kPa, (a2) end-stage of Δq = 50 kPa and (b2) end-stage of Δq = 100
and 200 kPa
Interpretation and discussion
Based on the variations of Mr and Dr with fv, a constant fv-cha value was obtained at a given water
content: fv-cha ≈ 25.5% at w1 = 17.6% and fv-cha ≈ 32.0% at w2 = 10.6%. Note that at wopt-f = 13.7%
a narrow range of fv-cha from 27.8% to 28.9% was found by Wang et al. (2017), defining an
average value of 28.4%. This average value was considered in further analysis. It appears clearly
from Table 3 that fv-cha increased with the decrease of water content.
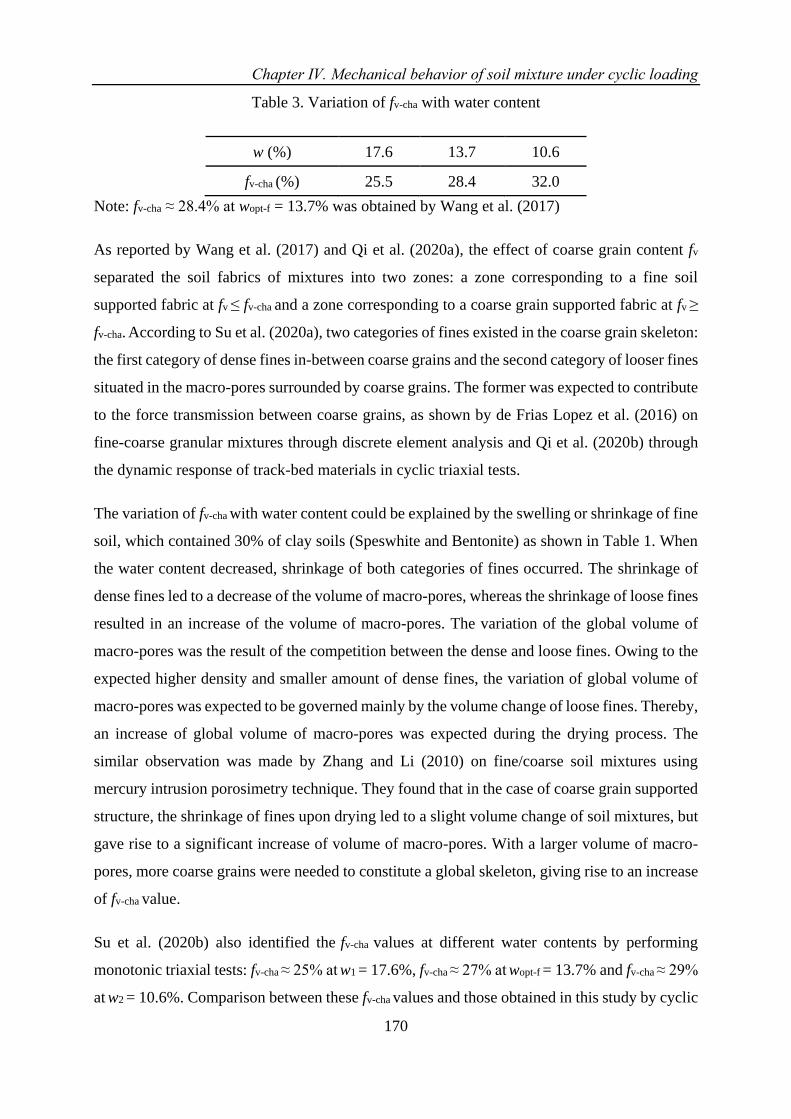
Chapter Ⅳ. Mechanical behavior of soil mixture under cyclic loading
170
Table 3. Variation of fv-cha with water content
w (%) 17.6 13.7 10.6
fv-cha (%) 25.5 28.4 32.0
Note: fv-cha ≈ 28.4% at wopt-f = 13.7% was obtained by Wang et al. (2017)
As reported by Wang et al. (2017) and Qi et al. (2020a), the effect of coarse grain content fv
separated the soil fabrics of mixtures into two zones: a zone corresponding to a fine soil
supported fabric at fv ≤ fv-cha and a zone corresponding to a coarse grain supported fabric at fv ≥
fv-cha. According to Su et al. (2020a), two categories of fines existed in the coarse grain skeleton:
the first category of dense fines in-between coarse grains and the second category of looser fines
situated in the macro-pores surrounded by coarse grains. The former was expected to contribute
to the force transmission between coarse grains, as shown by de Frias Lopez et al. (2016) on
fine-coarse granular mixtures through discrete element analysis and Qi et al. (2020b) through
the dynamic response of track-bed materials in cyclic triaxial tests.
The variation of fv-cha with water content could be explained by the swelling or shrinkage of fine
soil, which contained 30% of clay soils (Speswhite and Bentonite) as shown in Table 1. When
the water content decreased, shrinkage of both categories of fines occurred. The shrinkage of
dense fines led to a decrease of the volume of macro-pores, whereas the shrinkage of loose fines
resulted in an increase of the volume of macro-pores. The variation of the global volume of
macro-pores was the result of the competition between the dense and loose fines. Owing to the
expected higher density and smaller amount of dense fines, the variation of global volume of
macro-pores was expected to be governed mainly by the volume change of loose fines. Thereby,
an increase of global volume of macro-pores was expected during the drying process. The
similar observation was made by Zhang and Li (2010) on fine/coarse soil mixtures using
mercury intrusion porosimetry technique. They found that in the case of coarse grain supported
structure, the shrinkage of fines upon drying led to a slight volume change of soil mixtures, but
gave rise to a significant increase of volume of macro-pores. With a larger volume of macro-
pores, more coarse grains were needed to constitute a global skeleton, giving rise to an increase
of fv-cha value.
Su et al. (2020b) also identified the fv-cha values at different water contents by performing
monotonic triaxial tests: fv-cha ≈ 25% at w1 = 17.6%, fv-cha ≈ 27% at wopt-f = 13.7% and fv-cha ≈ 29%
at w2 = 10.6%. Comparison between these fv-cha values and those obtained in this study by cyclic
Chapter Ⅳ. Mechanical behavior of soil mixture under cyclic loading
171
triaxial tests showed that for a given water content, a slightly larger fv-cha value was obtained
under cyclic loading. This could be explained by the more efficient effect of cyclic loading on
the rearrangement of coarse grains. The similar phenomenon was observed by Duong et al.
(2016) on upper part of interlayer soil, who reported that the cyclic loading resulted in a
progressive stabilization of particles arrangement. Werkmeister et al. (2004) investigated the
volume change behavior of unbound granular materials by cyclic triaxial tests, and found that
the cyclic loading induced a denser soil structure and an increase of coarse grain contacts. It
could be thus inferred that a relatively larger reduction of macro-pore volume is expected under
cyclic loading, increasing the fraction of coarse grains required for constituting a grain skeleton
fabric and leading to a larger fv-cha value.
Conclusions
To investigate the effect of water content on the dynamic properties of interlayer soil, a series
of cyclic triaxial tests were performed, following a multi-step loading procedure with various
Δq values. Two target fine water contents wf (w1 = 17.6% and w2 = 10.6%) and five coarse grain
contents fv (0%, 10%, 20%, 35% and 45%) were considered, aiming at investigating the
variations of the resilient modulus Mr and the damping ratio Dr with wf and fv. In particular, the
values of Mr and Dr at the start-stages and end-stages of Δq = 50, 100 and 200 kPa were selected
for comparison. The following conclusions were drawn:
Under a given fv value, the increase of water content led to a decrease of Mr due to the
contribution of suction while an increase of Dr owing to the increase of soil viscosity. Through
the variations of Mr and Dr with fv, a characteristic coarse grain content fv-cha was identified,
defining two distinct soil fabrics: a fine matrix fabric at fv ≤ fv-cha and a coarse grain skeleton
fabric at fv ≥ fv-cha. Moreover, a constant fv-cha value was obtained at a given water content: fv-cha
≈ 25.5% at w1 = 17.6% and fv-cha ≈ 32.0% at w2 = 10.6%. Wang et al. (2017) identified a value
fv-cha ≈ 28.4% at wopt-f = 13.7% under equivalent conditions. The increase of fv-cha with the
decrease of water content could be explained by the swelling-shrinkage of fine soil. With the
decrease of water content, the shrinkage of fine soil led to an increase of global volume of
macro-pores. In that case, more coarse grains were required to constitute the global skeleton,
giving rise to an increase of fv-cha.
Comparison of fv-cha values obtained from monotonic and cyclic triaxial tests suggested that
under a given water content, the value of fv-cha obtained under cyclic loading was slightly larger
Chapter Ⅳ. Mechanical behavior of soil mixture under cyclic loading
172
than that under monotonic loading, evidencing the more efficient effect of cyclic loading on the
rearrangement of coarse grains.
Ackknowledgements
This work was supported by the China Scholarship Council (CSC) and Ecole des Ponts
ParisTech.
References
Alias La voie ferr´ee. 1984. Techniques de construction et d’entretien. 2nd Ed., Eyrolles.
ASTM D698-12. 2012. Standard test methods for laboratory compaction characteristics of soil
using standard effort. ASTM International, West Conshohocken, Pa.
Cui, Y.J., Duong, T.V., Tang, A.M., Dupla, J.C., Calon, N. and Robinet, A., 2013. Investigation
of the hydro-mechanical behaviour of fouled ballast. Journal of Zhejiang University
Science A, 14(4), pp.244-255.
Cui, Y. J. 2018. Mechanical behaviour of coarse grains/fines mixture under monotonic and
cyclic loadings. Transportation Geotechnics, 17, 91-97.
Duong, T.V., Cui, Y.J., Tang, A.M., Dupla, J.C., Canou, J., Calon, N. and Robinet, A., 2016.
Effects of water and fines contents on the resilient modulus of the interlayer soil of railway
substructure. Acta Geotechnica, 11(1), pp.51-59.
de Frias Lopez, R., Silfwerbrand, J., Jelagin, D., & Birgisson, B. 2016. Force transmission and
soil fabric of binary granular mixtures. Géotechnique, 66(7), 578-583.
Gidel, G., Hornych, P., Breysse, D., & Denis, A. 2001. A new approach for investigating the
permanent deformation behaviour of unbound granular material using the repeated loading
triaxial apparatus. Bulletin des laboratoires des Ponts et Chaussées, (233).
Han, Z., & Vanapalli, S. K. 2015. Model for predicting resilient modulus of unsaturated
subgrade soil using soil-water characteristic curve. Canadian Geotechnical Journal, 52(10),
1605-1619.
Jibon, M., Mishra, D., & Kassem, E. 2020. Laboratory characterization of fine-grained soils for
Pavement ME Design implementation in Idaho. Transportation Geotechnics, 25, 100395.
Khasawneh, M. A., & Al-jamal, N. F. 2019. Modeling resilient modulus of fine-grained
materials using different statistical techniques. Transportation Geotechnics, 21, 100263.
Lin, S. Y., Lin, P. S., Luo, H. S., & Juang, C. H. 2000. Shear modulus and damping ratio
characteristics of gravelly deposits. Canadian Geotechnical Journal, 37(3), 638-651.
Lamas-lopez, F. 2016. Field and laboratory investigation on the dynamic behavior of
conventional railway track-bed materials in the context of traffic upgrade. PhD Thesis,
Ecole Nationale des Ponts et Chaussées, Université Paris-Est.
Chapter Ⅳ. Mechanical behavior of soil mixture under cyclic loading
173
Menq, F. Y. 2003. Dynamic properties of sandy and gravelly soils. Ph.D. thesis, The University
of Texas at Austin.
Mousa, E., El-Badawy, S., & Azam, A. 2020. Evaluation of Reclaimed Asphalt Pavement as
Base/Subbase Material in Egypt. Transportation Geotechnics, 100414.
Ng, C. W. W., Zhou, C., Yuan, Q., & Xu, J. 2013. Resilient modulus of unsaturated subgrade
soil: experimental and theoretical investigations. Canadian Geotechnical Journal, 50(2),
223-232.
Qi, S., Cui, Y.J., Chen, R.P., Wang, H.L., Lamas-Lopez, F., Aimedieu, P., Dupla, J.C., Canou,
J. and Saussine, G., 2020a. Influence of grain size distribution of inclusions on the
mechanical behaviours of track-bed materials. Géotechnique, pp.1-10.
Qi, S., Cui, Y. J., Dupla, J. C., Chen, R. P., Wang, H. L., Su, Y., ... & Canou, J. 2020b.
Investigation of the parallel gradation method based on the response of track-bed materials
under cyclic loadings. Transportation Geotechnics, 100360.
Rollins, K. M., Evans, M. D., Diehl, N. B., & III, W. D. D. 1998. Shear modulus and damping
relationships for gravels. Journal of Geotechnical and Geoenvironmental Engineering,
124(5), 396-405.
Stewart, H. E. 1982. The prediction of track performance under dynamic traffic loading. Ph.D.
thesis, University of Massachusetts.
Seed, H. B., Wong, R. T., Idriss, I. M., & Tokimatsu, K. 1986. Moduli and damping factors for
dynamic analyses of cohesionless soils. Journal of geotechnical engineering, 112(11),
1016-1032.
Selig, E. T., & Waters, J. M. 1994. Track geotechnology and substructure management. Thomas
Telford, London, U.K.
Seif El Dine, B., Dupla, J. C., Frank, R., Canou, J., & Kazan, Y. 2010. Mechanical
characterization of matrix coarse-grained soils with a large-sized triaxial device. Canadian
Geotechnical Journal, 47(4), 425-438.
Su, Y., Cui, Y.J., Dupla, J.C., Canou, J., Qi, S., 2020a. Developing a sample preparation
approach to study the mechanical behavior of unsaturated fine/coarse soil
mixture. Geotechnical Testing Journal. (In press)
Su, Y., Cui, Y. J., Dupla, J. C., & Canou, J. 2020b. Investigation of the effect of water content
on the mechanical behavior of track-bed materials under various coarse grain contents.
Construction and Building Materials, 263, 120206.
Tennakoon, N., & Indraratna, B. 2014. Behaviour of clay-fouled ballast under cyclic loading.
Géotechnique, 64(6), 502-506.
Trinh, V. N. 2011. Comportement hydromécanique des matériaux constitutifs de plateformes
ferroviaires anciennes. PhD Thesis, Ecole Nationale des Ponts et Chaussées, Université
Paris-Est.
Chapter Ⅳ. Mechanical behavior of soil mixture under cyclic loading
174
Werkmeister, S., Dawson, A.R. and Wellner, F., 2004. Pavement design model for unbound
granular materials. Journal of Transportation Engineering, 130(5), pp.665-674.
Wang, H.L., Cui, Y.J., Lamas-Lopez, F., Dupla, J.C., Canou, J., Calon, N., Saussine, G.,
Aimedieu, P. and Chen, R.P., 2017. Effects of inclusion contents on resilient modulus and
damping ratio of unsaturated track-bed materials. Canadian Geotechnical Journal, 54(12),
pp.1672-1681.
Wang, H.L., Cui, Y.J., Lamas-Lopez, F., Calon, N., Saussine, G., Dupla, J.C., Canou, J.,
Aimedieu, P. and Chen, R.P., 2018a. Investigation on the mechanical behavior of track-
bed materials at various contents of coarse grains. Construction and Building
Materials, 164, pp.228-237.
Wang, H.L., Cui, Y.J., Lamas-Lopez, F., Dupla, J.C., Canou, J., Calon, N., Saussine, G.,
Aimedieu, P. and Chen, R.P., 2018b. Permanent deformation of track-bed materials at
various inclusion contents under large number of loading cycles. Journal of Geotechnical
and Geoenvironmental Engineering, 144(8), p.04018044.
Yang, S. R., Lin, H. D., Kung, J. H., & Huang, W. H. 2008. Suction-controlled laboratory test
on resilient modulus of unsaturated compacted subgrade soils. Journal of Geotechnical and
Geoenvironmental Engineering, 134(9), 1375-1384.
Zhang, L.M. and Li, X., 2010. Microporosity structure of coarse granular soils. Journal of
Geotechnical and Geoenvironmental Engineering, 136(10), pp.1425-1436.
Zhalehjoo, N., Tolooiyan, A., Mackay, R., & Bodin, D. 2018. The effect of instrumentation on
the determination of the resilient modulus of unbound granular materials using advanced
repeated load triaxial testing. Transportation Geotechnics, 14, 190-201.
Chapter Ⅴ. Modeling of the mechanical behavior of soil mixture with consideration of soil-water retention curve
175
CHAPTER Ⅴ. MODELING OF THE MECHANICAL
BEHAVIOR OF SOIL MIXTURE WITH CONSIDERATION OF
SOIL-WATER RETENTION CURVE
In the three previous chapters, the water retention behavior and mechanical behavior under
monotonic and cyclic loadings were investigated. Factors such as water content (or matric
suction), coarse grain content, stress state and loading cycles were considered. The constitutive
models were developed for the mechanical behavior of mixture with consideration of soil-water
retention curve, allowing the aforementioned factors to be accounted for.
Modelling of the permanent strain of mixture was performed, with consideration of the effects
of coarse grain content, deviator stress and loading cycles. Experimental data from previous
studies were adopted to verify the proposed model. The results showed that the proposed fatigue
model can well describe the variation of permanent strain with changes in coarse grain content,
deviator stress and loading cycles, in the case of plastic shakedown. This part corresponded to
a paper published in Transportation Geotechnics.
The aforementioned model was extended to the effect of matric suction by incorporating the
soil-water retention curve. Different studies from literature were adopted to verify the proposed
model. The model parameters were determined by fitting the variation of permanent strain with
matric suction, coarse grain content, deviator stress and loading cycles under saturated
conditions, and then adopted to predict the results under unsaturated condition. The results
indicated a good agreement between the predictions and the measurements, showing the
performance of the proposed model in describing the variation of permanent strain with these
factors. Comparisons with representative existing models showed that the proposed model can
provide better predictions. These results were presented in a paper submitted to Canadian
Geotechnical Journal.
A constitutive model incorporating the soil-water retention curve was proposed for the resilient
modulus of mixture, allowing the effects of matric suction, deviator stress and coarse grain
content to be accounted for. The model was validated using experimental results from literature.
Comparisons with the representative existing models showed that the proposed model is capable

Chapter Ⅴ. Modeling of the mechanical behavior of soil mixture with consideration of soil-water retention curve
176
of describing the suction-dependent effect of deviator stress on resilient modulus in the full
suction range, while existing models can only give satisfactory simulations in the low suction
range. These results were presented in a paper submitted to Acta Geotechnica.
Chapter Ⅴ. Modeling of the mechanical behavior of soil mixture with consideration of soil-water retention curve
177
Su, Y., Cui, Y. J., Dupla, J. C., Canou, J., & Qi, S. 2020. Transportation Geotechnics, 23,
100353.
A fatigue model for track-bed materials with consideration of the effect of
coarse grain content
Yu Su1, Yu-Jun Cui1, Jean-Claude Dupla1, Jean Canou1, Shuai Qi1,2
Abstract: Previous studies showed that the permanent strain of interlayer soil in the French
conventional railway substructure is highly dependent on the volumetric coarse grain content fv
(volumetric ratio of coarse grain to total sample). This study developed a fatigue model allowing
the effects of coarse grain content fv, stress state and number of loading cycles N on permanent
strain to be accounted for. Data from the multi-stage loading cyclic tests of interlayer soil
conducted at six different fv values (0%, 5%, 10%, 20%, 35% and 45%) and five different
maximum deviator stress ∆qmax values (10 kPa, 15 kPa, 20 kPa, 25 kPa and 30 kPa) were
reviewed and used for this purpose. The model parameters were determined by fitting the results
from the tests at fv = 0%, 5% and 35%. In order to validate the proposed fatigue model, the
determined model parameters were then used to simulate the tests at fv = 10%, 20% and 45%.
The results obtained showed that the proposed model can well describe the permanent strain
after a certain number of loading cycles, in the case of plastic shakedown.
Keywords: coarse grain content; permanent strain; fatigue model; cyclic triaxial tests; soil
fabric
Introduction
Under the effect of long-term train circulation in the French conventional railway track, a new
layer named interlayer was created, mainly by interpenetration of ballast and subgrade.
Considering the high bearing capacity of the interlayer material corresponding to a mixture of
ballast grains and fine soils, which was characterized by its high dry density of 2.4 Mg/m3 (Trinh
2011), the French railway company (SNCF) decided to keep it as part of substructure in the
national track renewal program. Field investigation showed that the proportion of ballast grains
decreased over depth. Roughly, the interlayer could be divided into upper part which is
dominated by ballast grains and lower part which is dominated by fine soils (Trinh et al. 2012).
For the upper part, the effects of fine content and water content on permanent strain were studied
by Trinh et al. (2012), Cui et al. (2013), Duong et al. (2013, 2014, 2016) and Lamas-Lopez et
al. (2014, 2016) by performing monotonic and cyclic triaxial tests. The results showed that the
higher the water content, the larger the permanent strain. At saturated state, the higher the fine
1Ecole des Ponts ParisTech, Laboratoire Navier/CERMES, 6 – 8 av. Blaise Pascal, Cité Descartes, Champs-sur-
Marne, 77455 Marne – la – Vallée cedex 2, France 2Zhejiang University, Dept. of Civil Engineering, 38 Zheda Road, Hangzhou 310027, China
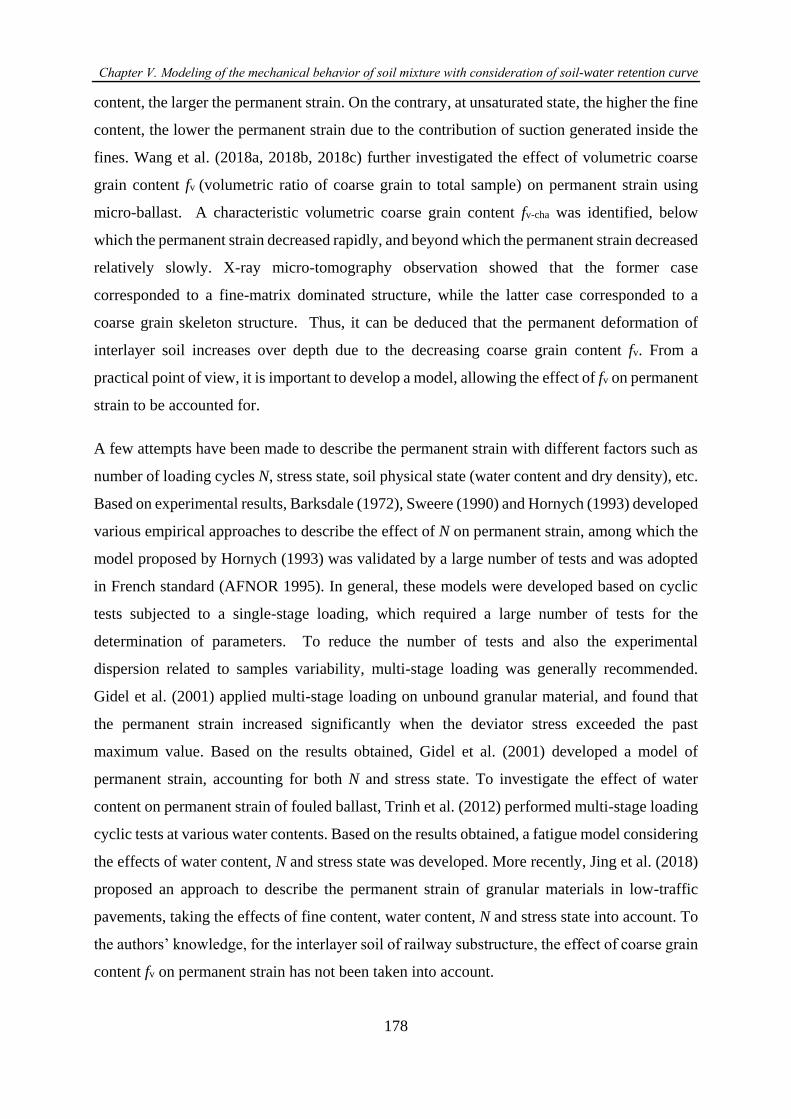
Chapter Ⅴ. Modeling of the mechanical behavior of soil mixture with consideration of soil-water retention curve
178
content, the larger the permanent strain. On the contrary, at unsaturated state, the higher the fine
content, the lower the permanent strain due to the contribution of suction generated inside the
fines. Wang et al. (2018a, 2018b, 2018c) further investigated the effect of volumetric coarse
grain content fv (volumetric ratio of coarse grain to total sample) on permanent strain using
micro-ballast. A characteristic volumetric coarse grain content fv-cha was identified, below
which the permanent strain decreased rapidly, and beyond which the permanent strain decreased
relatively slowly. X-ray micro-tomography observation showed that the former case
corresponded to a fine-matrix dominated structure, while the latter case corresponded to a
coarse grain skeleton structure. Thus, it can be deduced that the permanent deformation of
interlayer soil increases over depth due to the decreasing coarse grain content fv. From a
practical point of view, it is important to develop a model, allowing the effect of fv on permanent
strain to be accounted for.
A few attempts have been made to describe the permanent strain with different factors such as
number of loading cycles N, stress state, soil physical state (water content and dry density), etc.
Based on experimental results, Barksdale (1972), Sweere (1990) and Hornych (1993) developed
various empirical approaches to describe the effect of N on permanent strain, among which the
model proposed by Hornych (1993) was validated by a large number of tests and was adopted
in French standard (AFNOR 1995). In general, these models were developed based on cyclic
tests subjected to a single-stage loading, which required a large number of tests for the
determination of parameters. To reduce the number of tests and also the experimental
dispersion related to samples variability, multi-stage loading was generally recommended.
Gidel et al. (2001) applied multi-stage loading on unbound granular material, and found that
the permanent strain increased significantly when the deviator stress exceeded the past
maximum value. Based on the results obtained, Gidel et al. (2001) developed a model of
permanent strain, accounting for both N and stress state. To investigate the effect of water
content on permanent strain of fouled ballast, Trinh et al. (2012) performed multi-stage loading
cyclic tests at various water contents. Based on the results obtained, a fatigue model considering
the effects of water content, N and stress state was developed. More recently, Jing et al. (2018)
proposed an approach to describe the permanent strain of granular materials in low-traffic
pavements, taking the effects of fine content, water content, N and stress state into account. To
the authors’ knowledge, for the interlayer soil of railway substructure, the effect of coarse grain
content fv on permanent strain has not been taken into account.
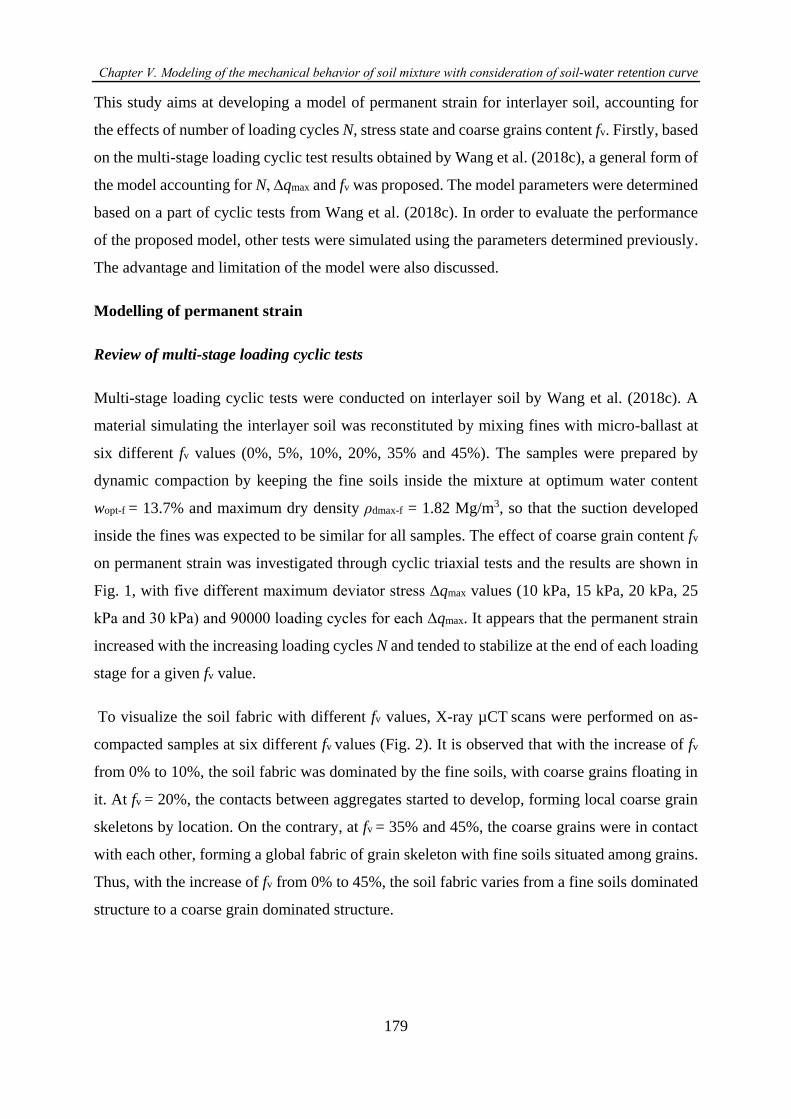
Chapter Ⅴ. Modeling of the mechanical behavior of soil mixture with consideration of soil-water retention curve
179
This study aims at developing a model of permanent strain for interlayer soil, accounting for
the effects of number of loading cycles N, stress state and coarse grains content fv. Firstly, based
on the multi-stage loading cyclic test results obtained by Wang et al. (2018c), a general form of
the model accounting for N, ∆qmax and fv was proposed. The model parameters were determined
based on a part of cyclic tests from Wang et al. (2018c). In order to evaluate the performance
of the proposed model, other tests were simulated using the parameters determined previously.
The advantage and limitation of the model were also discussed.
Modelling of permanent strain
Review of multi-stage loading cyclic tests
Multi-stage loading cyclic tests were conducted on interlayer soil by Wang et al. (2018c). A
material simulating the interlayer soil was reconstituted by mixing fines with micro-ballast at
six different fv values (0%, 5%, 10%, 20%, 35% and 45%). The samples were prepared by
dynamic compaction by keeping the fine soils inside the mixture at optimum water content
wopt-f = 13.7% and maximum dry density ρdmax-f = 1.82 Mg/m3, so that the suction developed
inside the fines was expected to be similar for all samples. The effect of coarse grain content fv
on permanent strain was investigated through cyclic triaxial tests and the results are shown in
Fig. 1, with five different maximum deviator stress ∆qmax values (10 kPa, 15 kPa, 20 kPa, 25
kPa and 30 kPa) and 90000 loading cycles for each ∆qmax. It appears that the permanent strain
increased with the increasing loading cycles N and tended to stabilize at the end of each loading
stage for a given fv value.
To visualize the soil fabric with different fv values, X-ray µCT scans were performed on as-
compacted samples at six different fv values (Fig. 2). It is observed that with the increase of fv
from 0% to 10%, the soil fabric was dominated by the fine soils, with coarse grains floating in
it. At fv = 20%, the contacts between aggregates started to develop, forming local coarse grain
skeletons by location. On the contrary, at fv = 35% and 45%, the coarse grains were in contact
with each other, forming a global fabric of grain skeleton with fine soils situated among grains.
Thus, with the increase of fv from 0% to 45%, the soil fabric varies from a fine soils dominated
structure to a coarse grain dominated structure.
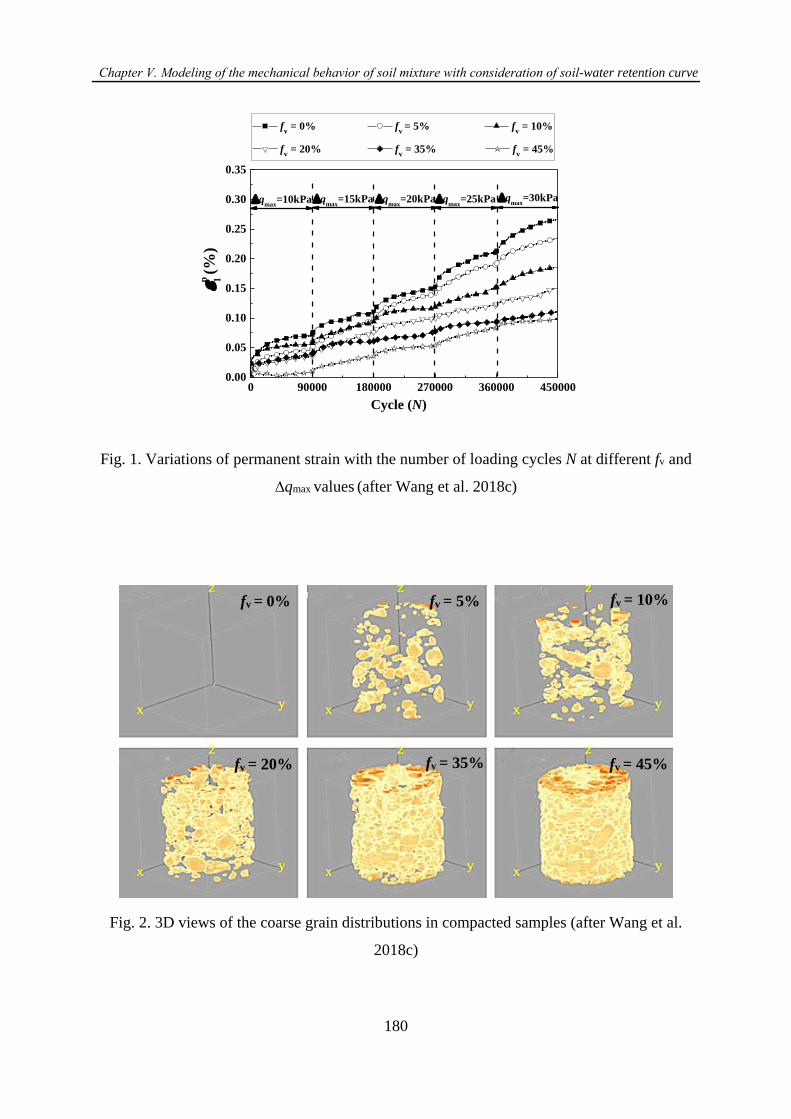
Chapter Ⅴ. Modeling of the mechanical behavior of soil mixture with consideration of soil-water retention curve
180
0 90000 180000 270000 360000 4500000.00
0.05
0.10
0.15
0.20
0.25
0.30
0.35
qmax
=30kPaqmax
=25kPaqmax
=20kPaqmax
=15kPaqmax
=10kPap 1
(%)
fv = 0% f
v = 5% f
v = 10%
fv = 20% f
v = 35% f
v = 45%
Cycle (N)
Fig. 1. Variations of permanent strain with the number of loading cycles N at different fv and
∆qmax values (after Wang et al. 2018c)
Fig. 2. 3D views of the coarse grain distributions in compacted samples (after Wang et al.
2018c)
fv = 0% fv = 5% fv = 10%
fv = 20% fv = 35% fv = 45%
Chapter Ⅴ. Modeling of the mechanical behavior of soil mixture with consideration of soil-water retention curve
181
Table 1. Fatigue models accounting for the effect of different factors on permanent strain
reported in literatures
Reference Variable Fatigue model
Hornych (1993) 1) N
휀1
𝑝= 𝑓(𝑁) = 𝐴 ∙ [1 − (
𝑁
100)−𝐵] )
Gidel et al.
(2001)
1) N
2) ∆qmax
휀1𝑝
= 𝑔(∆𝑝𝑚𝑎𝑥, ∆𝑞𝑚𝑎𝑥) ∙ ℎ(𝑁)
= 𝑔(∆𝑝𝑚𝑎𝑥, ∆𝑞𝑚𝑎𝑥) ∙ 𝑎 ∙ [1 − (𝑁
100)
−𝐵
]
𝑔(∆𝑝𝑚𝑎𝑥 , ∆𝑞𝑚𝑎𝑥) = 휀1𝑝0(
𝑙𝑚𝑎𝑥
𝑝𝑎)𝑛
1
(𝑚 +𝑠
∆𝑝𝑚𝑎𝑥−
∆𝑞𝑚𝑎𝑥
∆𝑝𝑚𝑎𝑥)
Trinh et al.
(2012)
1) N
2) ∆qmax
3) w
휀1𝑝
= 𝑡(𝑤, ∆𝑞𝑚𝑎𝑥) ∙ ℎ(𝑁)
= 𝑡(𝑤, ∆𝑞𝑚𝑎𝑥) ∙ 𝑎 ∙ [1 − (𝑁
100)−𝐵]
𝑡(𝑤, ∆𝑞𝑚𝑎𝑥) = 휀1𝑝0 ∙ (𝑤 + 𝑎1) ∙ (
∆𝑞𝑚𝑎𝑥
𝑝𝑎)𝛼
Development of a fatigue model
Table 1 shows three widely applied fatigue models, with N by Hornych (1993), with N and
∆𝑞𝑚𝑎𝑥 by Gidel et al. (2001), with N and ∆𝑞𝑚𝑎𝑥 and w by Trinh et al. (2012), allowing the
assessment of permanent strain produced under the effect of different variables. As this study
focuses on the modelling of the effect of fv on permanent strain based on the cyclic test results
obtained by Wang et al. (2018c) under constant water content condition, the effect of water
content was not taken into account. Data from cyclic tests with different fv values and w values
are needed to generalize the study to water content effect. Most likely, the coupled effects of fv
w should be considered in that case. Table 1 shows that the effects of N and other variables are
separated to different terms (Gidel et al. 2001; Trinh et al. 2012). Similarly, in this study, the
proposed function k (𝑓𝑣, ∆𝑞𝑚𝑎𝑥) is a term related to the effects of fv and ∆qmax, while ℎ (𝑁) is a
term related to N. The general form of this model is established as follows:
휀1𝑝(𝑓𝑣, ∆𝑞𝑚𝑎𝑥, 𝑁) = 𝑘(𝑓𝑣, ∆𝑞𝑚𝑎𝑥) ∙ ℎ(𝑁) (1)
where ε1𝑝 is the permanent strain, ∆qmax is the deviator stress level.
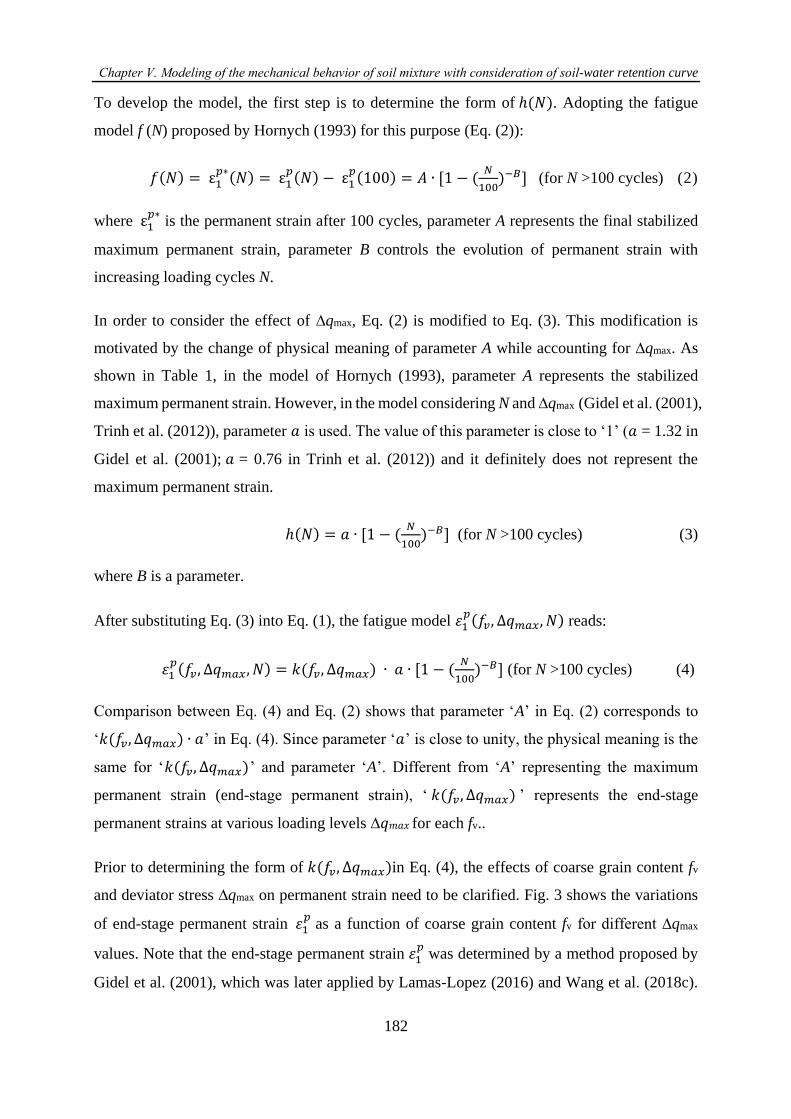
Chapter Ⅴ. Modeling of the mechanical behavior of soil mixture with consideration of soil-water retention curve
182
To develop the model, the first step is to determine the form of ℎ(𝑁). Adopting the fatigue
model f (N) proposed by Hornych (1993) for this purpose (Eq. (2)):
𝑓(𝑁) = ε1𝑝∗(𝑁) = ε1
𝑝(𝑁) − ε1𝑝(100) = 𝐴 ∙ [1 − (
𝑁
100)−𝐵] (for N >100 cycles) (2)
where ε1𝑝∗
is the permanent strain after 100 cycles, parameter A represents the final stabilized
maximum permanent strain, parameter B controls the evolution of permanent strain with
increasing loading cycles N.
In order to consider the effect of ∆qmax, Eq. (2) is modified to Eq. (3). This modification is
motivated by the change of physical meaning of parameter A while accounting for ∆qmax. As
shown in Table 1, in the model of Hornych (1993), parameter A represents the stabilized
maximum permanent strain. However, in the model considering N and ∆qmax (Gidel et al. (2001),
Trinh et al. (2012)), parameter 𝑎 is used. The value of this parameter is close to ‘1’ (𝑎 = 1.32 in
Gidel et al. (2001); 𝑎 = 0.76 in Trinh et al. (2012)) and it definitely does not represent the
maximum permanent strain.
ℎ(𝑁) = 𝑎 ∙ [1 − (𝑁
100)−𝐵] (for N >100 cycles) (3)
where B is a parameter.
After substituting Eq. (3) into Eq. (1), the fatigue model 휀1𝑝(𝑓𝑣, ∆𝑞𝑚𝑎𝑥, 𝑁) reads:
휀1𝑝(𝑓𝑣, ∆𝑞𝑚𝑎𝑥, 𝑁) = 𝑘(𝑓𝑣, ∆𝑞𝑚𝑎𝑥) ∙ 𝑎 ∙ [1 − (
𝑁
100)−𝐵] (for N >100 cycles) (4)
Comparison between Eq. (4) and Eq. (2) shows that parameter ‘A’ in Eq. (2) corresponds to
‘𝑘(𝑓𝑣, ∆𝑞𝑚𝑎𝑥) ∙ 𝑎’ in Eq. (4). Since parameter ‘𝑎’ is close to unity, the physical meaning is the
same for ‘𝑘(𝑓𝑣, ∆𝑞𝑚𝑎𝑥)’ and parameter ‘A’. Different from ‘A’ representing the maximum
permanent strain (end-stage permanent strain), ‘ 𝑘(𝑓𝑣, ∆𝑞𝑚𝑎𝑥) ’ represents the end-stage
permanent strains at various loading levels ∆𝑞𝑚𝑎𝑥 for each fv..
Prior to determining the form of 𝑘(𝑓𝑣, ∆𝑞𝑚𝑎𝑥)in Eq. (4), the effects of coarse grain content fv
and deviator stress ∆qmax on permanent strain need to be clarified. Fig. 3 shows the variations
of end-stage permanent strain 휀1𝑝 as a function of coarse grain content fv for different ∆qmax
values. Note that the end-stage permanent strain 휀1𝑝 was determined by a method proposed by
Gidel et al. (2001), which was later applied by Lamas-Lopez (2016) and Wang et al. (2018c).
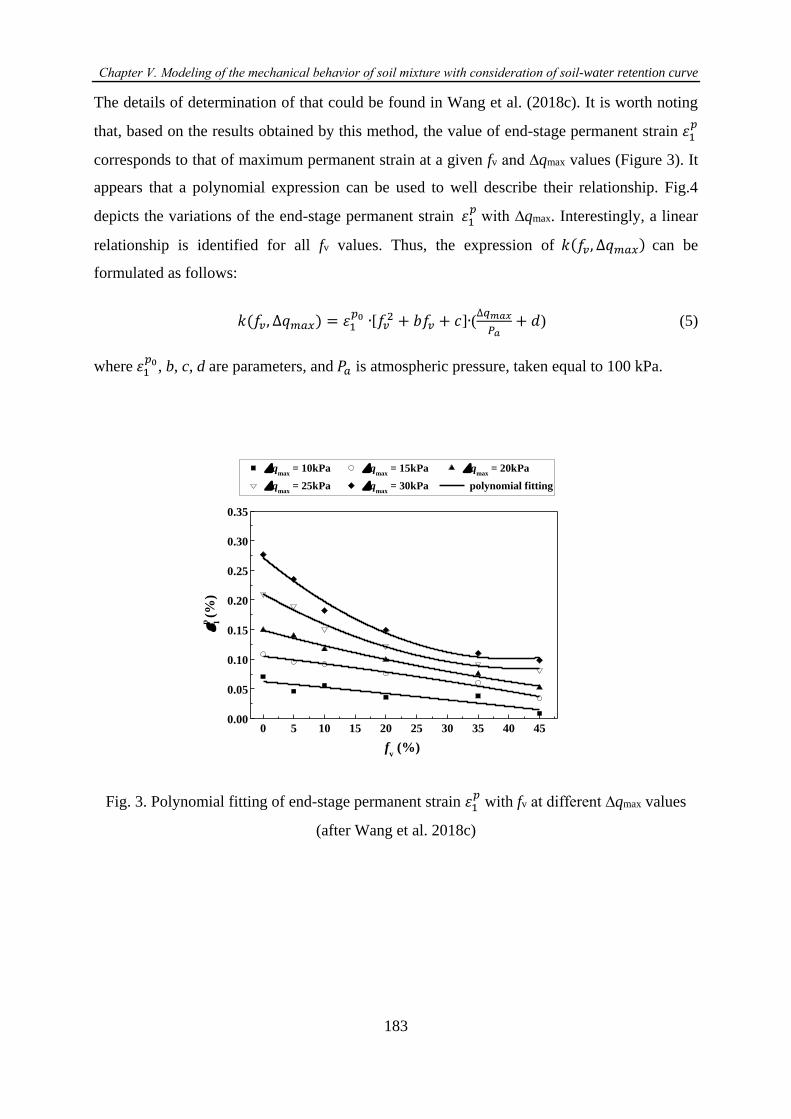
Chapter Ⅴ. Modeling of the mechanical behavior of soil mixture with consideration of soil-water retention curve
183
The details of determination of that could be found in Wang et al. (2018c). It is worth noting
that, based on the results obtained by this method, the value of end-stage permanent strain 휀1𝑝
corresponds to that of maximum permanent strain at a given fv and ∆qmax values (Figure 3). It
appears that a polynomial expression can be used to well describe their relationship. Fig.4
depicts the variations of the end-stage permanent strain 휀1𝑝 with ∆qmax. Interestingly, a linear
relationship is identified for all fv values. Thus, the expression of 𝑘(𝑓𝑣, ∆𝑞𝑚𝑎𝑥) can be
formulated as follows:
𝑘(𝑓𝑣, ∆𝑞𝑚𝑎𝑥) = 휀1𝑝0 ∙[𝑓𝑣
2 + 𝑏𝑓𝑣 + 𝑐]∙(∆𝑞𝑚𝑎𝑥
𝑃𝑎+ 𝑑) (5)
where 휀1𝑝0, b, c, d are parameters, and 𝑃𝑎 is atmospheric pressure, taken equal to 100 kPa.
0 5 10 15 20 25 30 35 40 450.00
0.05
0.10
0.15
0.20
0.25
0.30
0.35
p 1 (%
)
fv (%)
qmax
= 10kPa qmax
= 15kPa qmax
= 20kPa
qmax
= 25kPa qmax
= 30kPa polynomial fitting
Fig. 3. Polynomial fitting of end-stage permanent strain 휀1𝑝 with fv at different ∆qmax values
(after Wang et al. 2018c)
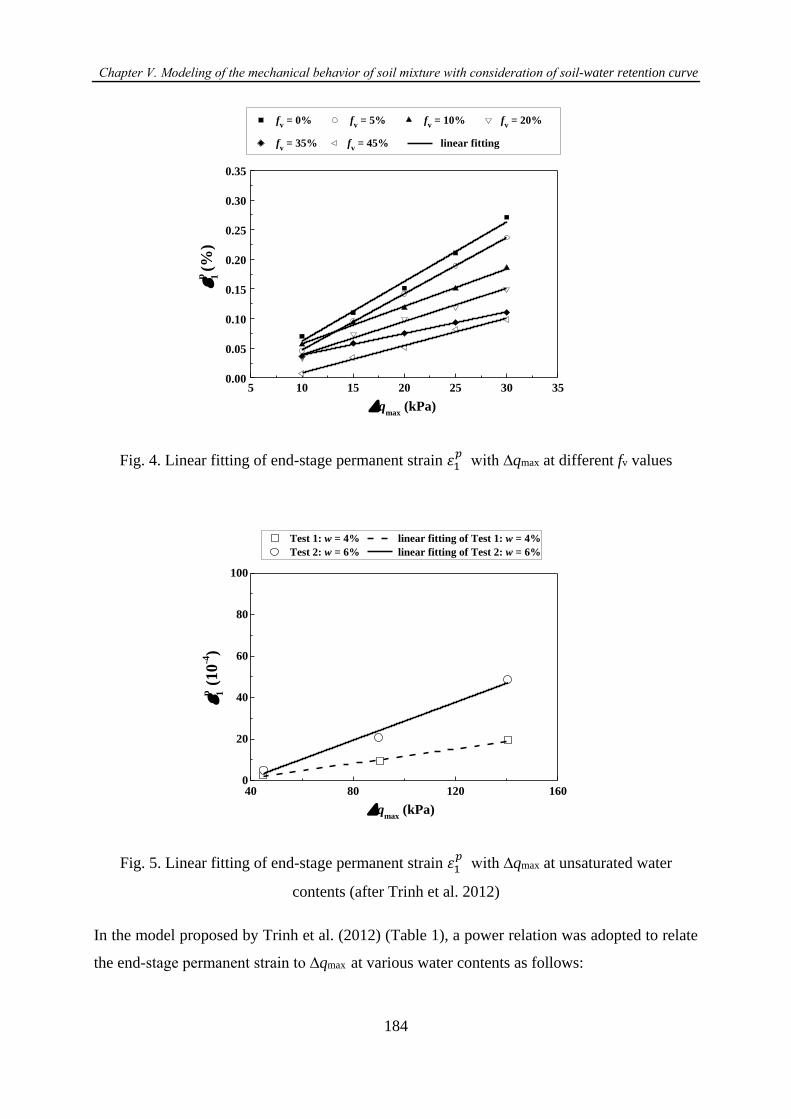
Chapter Ⅴ. Modeling of the mechanical behavior of soil mixture with consideration of soil-water retention curve
184
5 10 15 20 25 30 350.00
0.05
0.10
0.15
0.20
0.25
0.30
0.35
qmax
(kPa)
p 1 (%
)
fv = 0% f
v = 5% f
v = 10% f
v = 20%
fv = 35% f
v = 45% linear fitting
Fig. 4. Linear fitting of end-stage permanent strain 휀1𝑝 with ∆qmax at different fv values
40 80 120 1600
20
40
60
80
100
qmax
(kPa)
p 1
(1
0-4
)
Test 1: w = 4% linear fitting of Test 1: w = 4%
Test 2: w = 6% linear fitting of Test 2: w = 6%
Fig. 5. Linear fitting of end-stage permanent strain 휀1𝑝 with ∆qmax at unsaturated water
contents (after Trinh et al. 2012)
In the model proposed by Trinh et al. (2012) (Table 1), a power relation was adopted to relate
the end-stage permanent strain to ∆qmax at various water contents as follows:
Chapter Ⅴ. Modeling of the mechanical behavior of soil mixture with consideration of soil-water retention curve
185
𝑡( 𝑤, ∆𝑞𝑚𝑎𝑥 )= 휀1𝑝0 ∙( 𝑤 + 𝑎1)∙ (
∆𝑞𝑚𝑎𝑥
𝑃𝑎)𝛼 (6)
where 휀1𝑝0, 𝑎1 and α are parameters, and 𝑃𝑎 = 100 kPa.
A power relationship was obtained by Trinh et al. (2012) between the end-stage permanent
strain 휀1𝑝and ∆qmax for three different water contents w = 4%, 6% and 12% (corresponding to Sr
= 32%, 48% and 100%, respectively). In the case of constant water content considered in this
study (wopt-f = 13.7%), a linear relationship is obtained with α = 1. Further examination reveals
that the linear relationship is also valid when the soil is unsaturated (w = 4% and 6%) in the
case of Trinh et al. (2012), as shown in Fig. 5.
After substituting Eq. (5) into Eq. (4), the fatigue model 휀1𝑝(𝑓𝑣, ∆𝑞𝑚𝑎𝑥, 𝑁) accounting for the
effect of coarse grain content fv, maximum deviator stress ∆qmax and the number of loading
cycles N is obtained:
휀1𝑝(𝑓𝑣, ∆𝑞𝑚𝑎𝑥, 𝑁) = 휀1
𝑝0 ∙[𝑓𝑣2 + 𝑏𝑓𝑣 + 𝑐]∙(
∆𝑞𝑚𝑎𝑥
𝑃𝑎+ 𝑑) ∙ 𝑎 ∙ [1 − (
𝑁
100)−𝐵]
(for N >100 cycles) (7)
where 휀1𝑝0, b, c, d, 𝑎 and 𝐵 are parameters, and 𝑃𝑎=100 kPa.
Determination of model parameters
Wang et al. (2018c) investigated the effect of coarse grain content fv on permanent strain with
six different fv values (0%, 5%, 10%, 20%, 35% and 45%). The measured data from the tests at
fv = 0%, 5%, 35% are used to determine the model parameters, with the following two steps:
The first step is to determine four parameters 휀1𝑝0 , b, c and d by fitting Eq. (5) to the end-stage
permanent strains 휀1𝑝 at fv = 0%, 5%, 35%, as shown in Fig. 6. The values obtained are 휀1
𝑝0=
2.40, b = -1.03, c = 0.45, d = -0.05.
The second step is to determine parameters 𝑎 and B by fitting Eq. (7) to the measured data at fv
= 0%, 5%, 35%. The parameters obtained are 𝑎 = 1.20, B = 0.22.
Fig. 7 presents a comparison between the fitting curves and the measured data at fv = 0%, 5%,
35%. It appears that the proposed fatigue model can well fit the experimental data. Moreover,
better fitting can be obtained when the permanent strain stabilizes at the ends of loading stages.
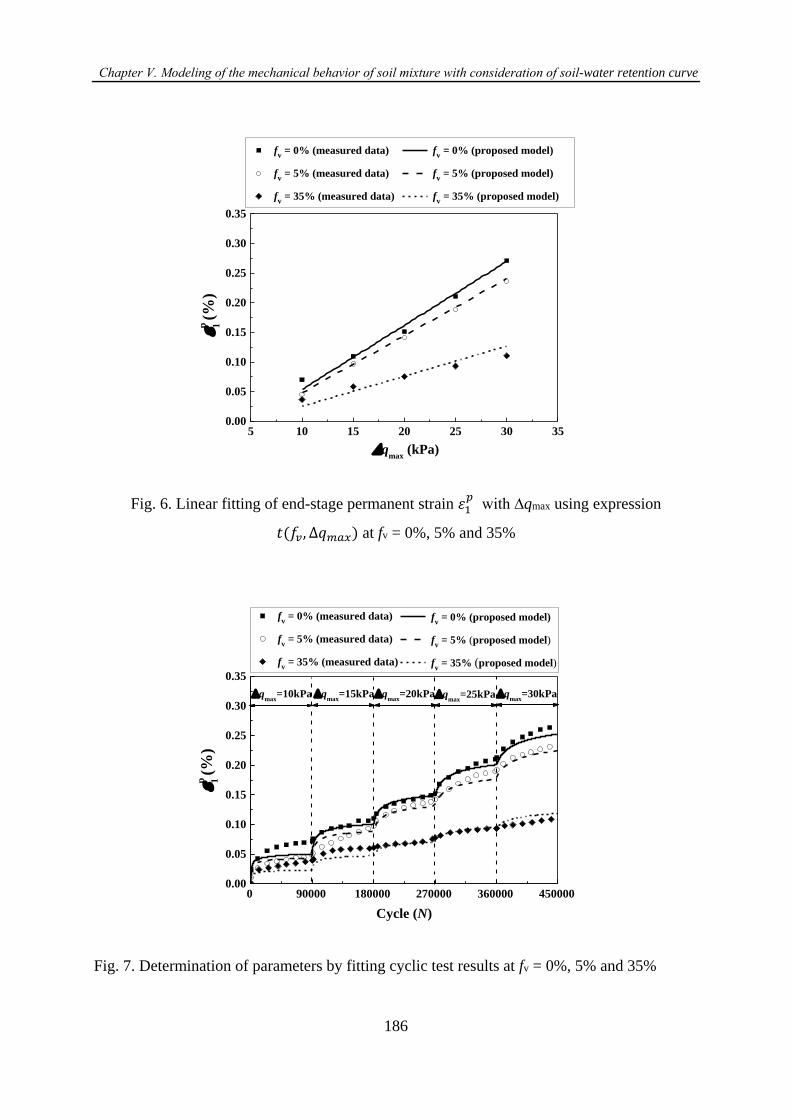
Chapter Ⅴ. Modeling of the mechanical behavior of soil mixture with consideration of soil-water retention curve
186
5 10 15 20 25 30 350.00
0.05
0.10
0.15
0.20
0.25
0.30
0.35p 1
(%)
qmax
(kPa)
fv = 0% (measured data) f
v = 0% (proposed model)
fv = 5% (measured data) f
v = 5% (proposed model)
fv = 35% (measured data) f
v = 35% (proposed model)
Fig. 6. Linear fitting of end-stage permanent strain 휀1𝑝 with ∆qmax using expression
𝑡(𝑓𝑣, ∆𝑞𝑚𝑎𝑥) at fv = 0%, 5% and 35%
fv = 0% (measured data)
fv = 5% (measured data)
fv = 35% (measured data)
0.00
0.05
0.10
0.15
0.20
0.25
0.30
0.35
0 90000 180000 270000 360000 450000
p 1 (%
)
Cycle (N)
fv = 0% (proposed model)
fv = 5% (proposed model)
fv = 35% (proposed model)
qmax
=30kPaqmax
=25kPaqmax
=20kPaqmax
=15kPaqmax
=10kPa
Fig. 7. Determination of parameters by fitting cyclic test results at fv = 0%, 5% and 35%
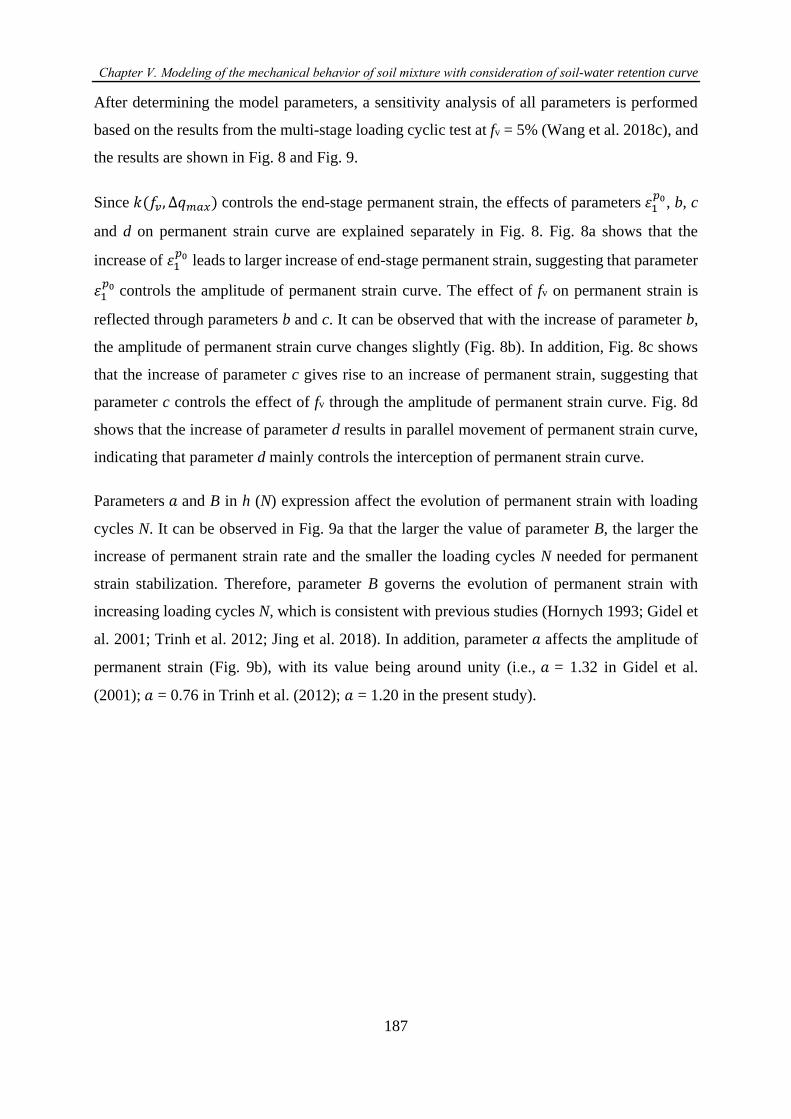
Chapter Ⅴ. Modeling of the mechanical behavior of soil mixture with consideration of soil-water retention curve
187
After determining the model parameters, a sensitivity analysis of all parameters is performed
based on the results from the multi-stage loading cyclic test at fv = 5% (Wang et al. 2018c), and
the results are shown in Fig. 8 and Fig. 9.
Since 𝑘(𝑓𝑣, ∆𝑞𝑚𝑎𝑥) controls the end-stage permanent strain, the effects of parameters 휀1𝑝0, b, c
and d on permanent strain curve are explained separately in Fig. 8. Fig. 8a shows that the
increase of 휀1𝑝0 leads to larger increase of end-stage permanent strain, suggesting that parameter
휀1𝑝0 controls the amplitude of permanent strain curve. The effect of fv on permanent strain is
reflected through parameters b and c. It can be observed that with the increase of parameter b,
the amplitude of permanent strain curve changes slightly (Fig. 8b). In addition, Fig. 8c shows
that the increase of parameter c gives rise to an increase of permanent strain, suggesting that
parameter c controls the effect of fv through the amplitude of permanent strain curve. Fig. 8d
shows that the increase of parameter d results in parallel movement of permanent strain curve,
indicating that parameter d mainly controls the interception of permanent strain curve.
Parameters 𝑎 and B in h (N) expression affect the evolution of permanent strain with loading
cycles N. It can be observed in Fig. 9a that the larger the value of parameter B, the larger the
increase of permanent strain rate and the smaller the loading cycles N needed for permanent
strain stabilization. Therefore, parameter B governs the evolution of permanent strain with
increasing loading cycles N, which is consistent with previous studies (Hornych 1993; Gidel et
al. 2001; Trinh et al. 2012; Jing et al. 2018). In addition, parameter 𝑎 affects the amplitude of
permanent strain (Fig. 9b), with its value being around unity (i.e., 𝑎 = 1.32 in Gidel et al.
(2001); 𝑎 = 0.76 in Trinh et al. (2012); 𝑎 = 1.20 in the present study).
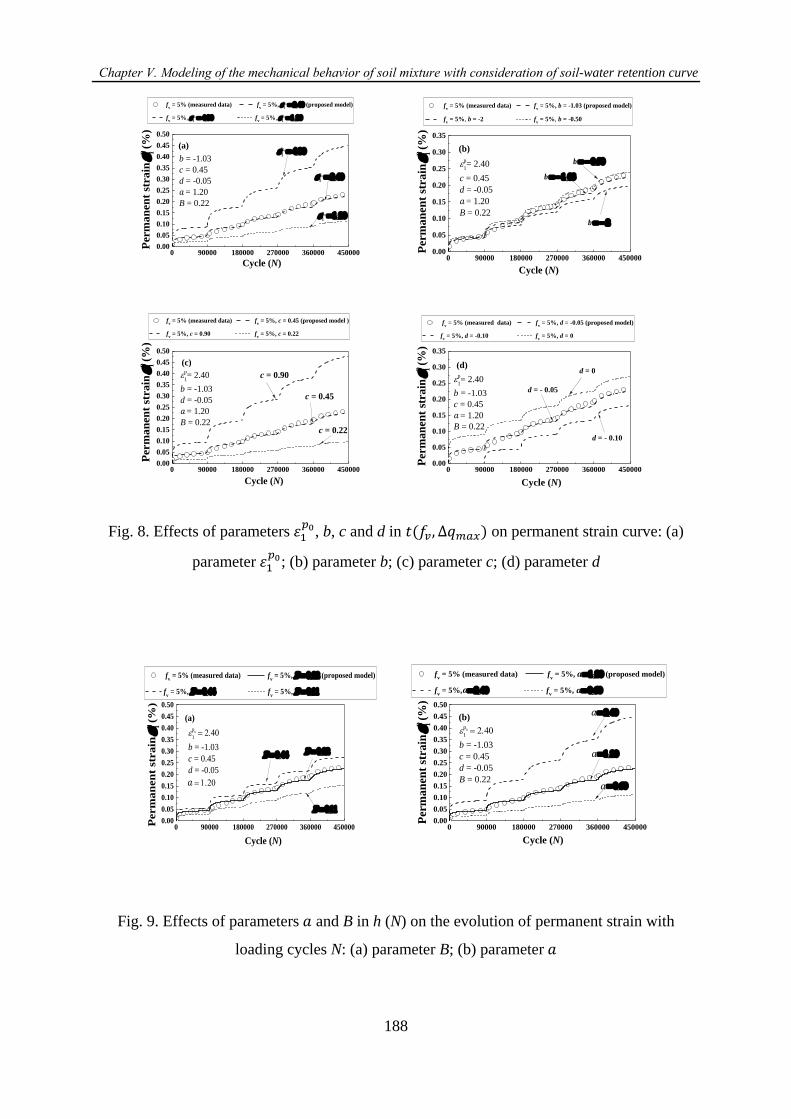
Chapter Ⅴ. Modeling of the mechanical behavior of soil mixture with consideration of soil-water retention curve
188
0 90000 180000 270000 360000 4500000.00
0.05
0.10
0.15
0.20
0.25
0.30
0.35
0.40
0.45
0.50
b = -1.03
c = 0.45
d = -0.05
𝑎 = 1.20
B = 0.22
Perm
an
en
t st
ra
in
p 1 (%
)
Cycle (N)
fv = 5% (measured data) f
v = 5%,
p0
1 = (proposed model)
fv = 5%,
p0
1 = f
v = 5%,
p0
1 =
(a)
p0
1 =
p
0
1 =
p
0
1 =
0 90000 180000 270000 360000 450000
0.00
0.05
0.10
0.15
0.20
0.25
0.30
0.35
(b)
p
1= 2.40
c = 0.45
d = -0.05
𝑎 = 1.20
B = 0.22b = −
b = −
Cycle (N)
Perm
an
en
t st
rain
p 1
(%
)
b = −
fv = 5% (measured data) f
v = 5%, b = -1.03 (proposed model)
fv = 5%, b = -2 f
v = 5%, b = -0.50
0 90000 180000 270000 360000 4500000.00
0.05
0.10
0.15
0.20
0.25
0.30
0.35
0.40
0.45
0.50
(c)
p
1= 2.40
b = -1.03
d = -0.05
𝑎 = 1.20
B = 0.22c = 0.22
c = 0.45
Cycle (N)
Perm
an
en
t st
ra
in
p 1 (%
)
fv = 5% (measured data) f
v = 5%, c = 0.45 (proposed model )
fv = 5%, c = 0.90 f
v = 5%, c = 0.22
c = 0.90
0 90000 180000 270000 360000 4500000.00
0.05
0.10
0.15
0.20
0.25
0.30
0.35
(d)
p
1= 2.40
b = -1.03
c = 0.45
𝑎 = 1.20
B = 0.22
d = - 0.10
Cycle (N)
Per
ma
nen
t st
rain
p 1
(%)
d = 0
fv = 5% (measured data) f
v = 5%, d = -0.05 (proposed model)
fv = 5%, d = -0.10 f
v = 5%, d = 0
d = - 0.05
Fig. 8. Effects of parameters 휀1𝑝0, b, c and d in 𝑡(𝑓𝑣, ∆𝑞𝑚𝑎𝑥) on permanent strain curve: (a)
parameter 휀1𝑝0; (b) parameter b; (c) parameter c; (d) parameter d
0 90000 180000 270000 360000 4500000.00
0.05
0.10
0.15
0.20
0.25
0.30
0.35
0.40
0.45
0.50
=
=
Cycle (N)
Perm
an
en
t st
ra
in
p 1 (%
)
fv = 5% (measured data) f
v = 5%, = (proposed model)
fv = 5%, = f
v = 5%, =
(a)
p
0
1 =
b = -1.03
c = 0.45
d = -0.05
=
=
𝑎 1
0 90000 180000 270000 360000 4500000.00
0.05
0.10
0.15
0.20
0.25
0.30
0.35
0.40
0.45
0.50
𝑎 1
𝑎 1
𝒂 1
𝑎 1 =
=
Cycle (N)
Per
ma
nen
t st
rain
p 1
(%
)
fv = 5% (measured data) f
v = 5%, = (proposed model)
fv = 5%, = f
v = 5%, =
(b)
p
0
1 =
b = -1.03
c = 0.45
d = -0.05
B = 0.22
=
𝒂 1
𝒂 1
𝒂 1
Fig. 9. Effects of parameters 𝑎 and B in h (N) on the evolution of permanent strain with
loading cycles N: (a) parameter B; (b) parameter 𝑎
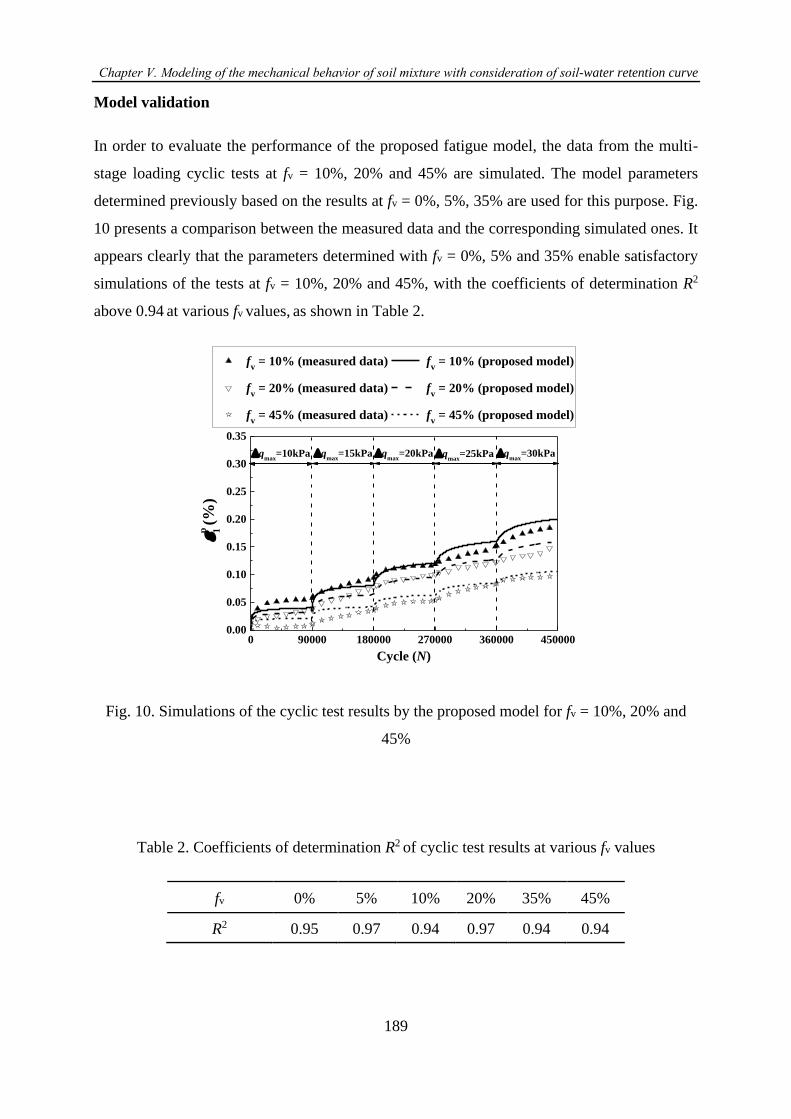
Chapter Ⅴ. Modeling of the mechanical behavior of soil mixture with consideration of soil-water retention curve
189
Model validation
In order to evaluate the performance of the proposed fatigue model, the data from the multi-
stage loading cyclic tests at fv = 10%, 20% and 45% are simulated. The model parameters
determined previously based on the results at fv = 0%, 5%, 35% are used for this purpose. Fig.
10 presents a comparison between the measured data and the corresponding simulated ones. It
appears clearly that the parameters determined with fv = 0%, 5% and 35% enable satisfactory
simulations of the tests at fv = 10%, 20% and 45%, with the coefficients of determination R2
above 0.94 at various fv values, as shown in Table 2.
0 90000 180000 270000 360000 4500000.00
0.05
0.10
0.15
0.20
0.25
0.30
0.35
p 1 (%
)
Cycle (N)
fv = 10% (measured data) f
v = 10% (proposed model)
fv = 20% (measured data) f
v = 20% (proposed model)
fv = 45% (measured data) f
v = 45% (proposed model)
qmax
=30kPaqmax
=25kPaqmax
=20kPaqmax
=15kPaqmax
=10kPa
Fig. 10. Simulations of the cyclic test results by the proposed model for fv = 10%, 20% and
45%
Table 2. Coefficients of determination R2 of cyclic test results at various fv values
fv 0% 5% 10% 20% 35% 45%
R2 0.95 0.97 0.94 0.97 0.94 0.94
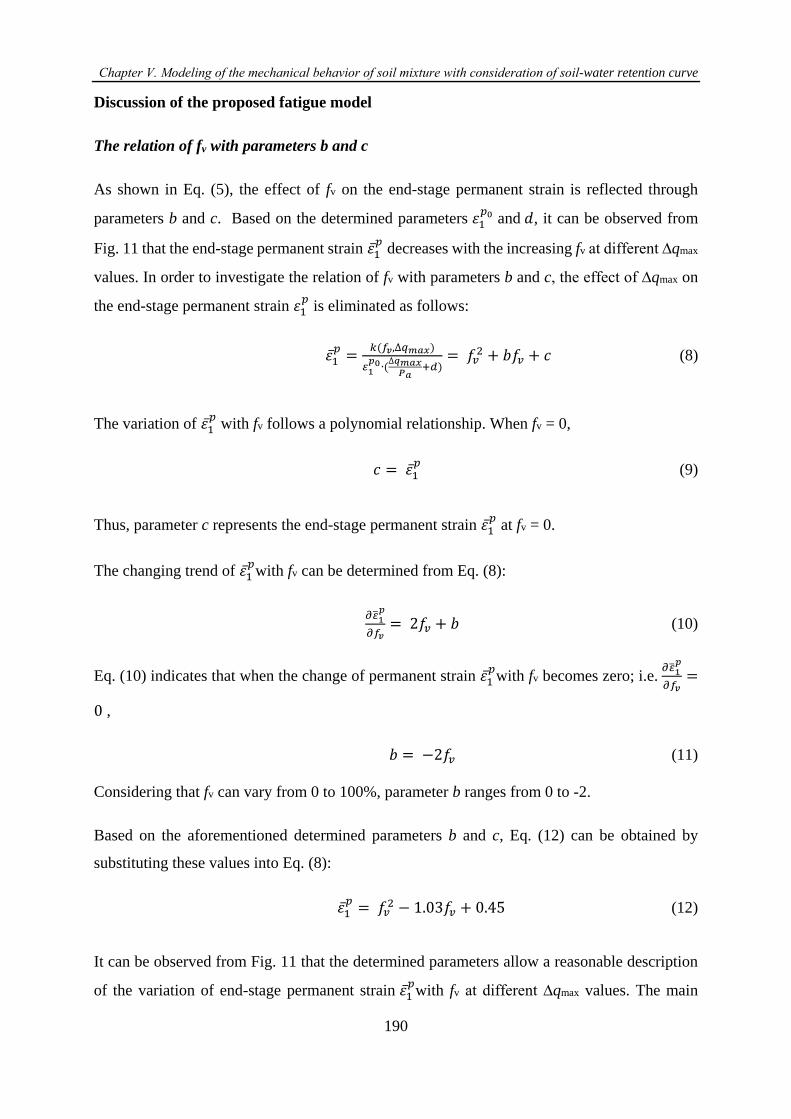
Chapter Ⅴ. Modeling of the mechanical behavior of soil mixture with consideration of soil-water retention curve
190
Discussion of the proposed fatigue model
The relation of fv with parameters b and c
As shown in Eq. (5), the effect of fv on the end-stage permanent strain is reflected through
parameters b and c. Based on the determined parameters 휀1𝑝0 and 𝑑, it can be observed from
Fig. 11 that the end-stage permanent strain 휀1𝑝 decreases with the increasing fv at different ∆qmax
values. In order to investigate the relation of fv with parameters b and c, the effect of ∆qmax on
the end-stage permanent strain 휀1𝑝 is eliminated as follows:
휀1𝑝
=𝑘(𝑓𝑣,∆𝑞𝑚𝑎𝑥)
𝜀1𝑝0 ∙(
∆𝑞𝑚𝑎𝑥𝑃𝑎
+𝑑)= 𝑓𝑣
2 + 𝑏𝑓𝑣 + 𝑐 (8)
The variation of 휀1𝑝 with fv follows a polynomial relationship. When fv = 0,
𝑐 = 휀1𝑝 (9)
Thus, parameter c represents the end-stage permanent strain 휀1𝑝 at fv = 0.
The changing trend of 휀1𝑝with fv can be determined from Eq. (8):
𝜕��1
𝑝
𝜕𝑓𝑣= 2𝑓𝑣 + 𝑏 (10)
Eq. (10) indicates that when the change of permanent strain 휀1𝑝with fv becomes zero; i.e.
𝜕��1𝑝
𝜕𝑓𝑣=
0 ,
𝑏 = −2𝑓𝑣 (11)
Considering that fv can vary from 0 to 100%, parameter b ranges from 0 to -2.
Based on the aforementioned determined parameters b and c, Eq. (12) can be obtained by
substituting these values into Eq. (8):
휀1𝑝
= 𝑓𝑣2 − 1.03𝑓𝑣 + 0.45 (12)
It can be observed from Fig. 11 that the determined parameters allow a reasonable description
of the variation of end-stage permanent strain 휀1𝑝with fv at different ∆qmax values. The main
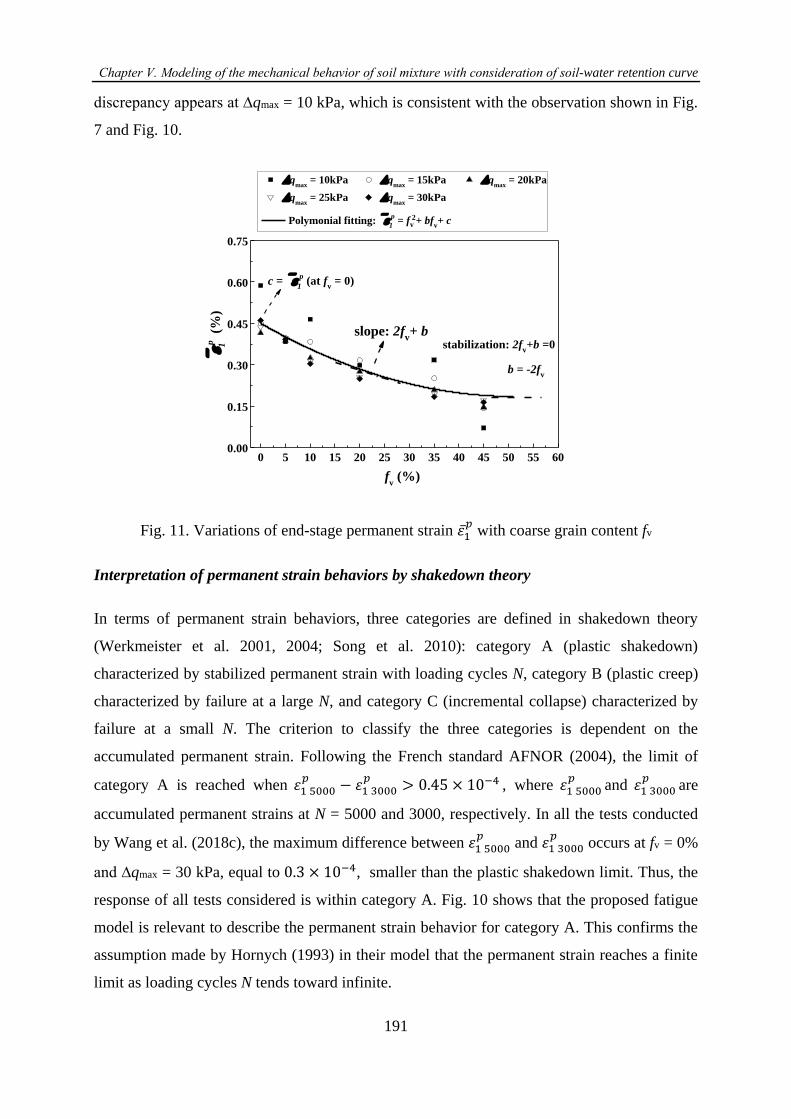
Chapter Ⅴ. Modeling of the mechanical behavior of soil mixture with consideration of soil-water retention curve
191
discrepancy appears at ∆qmax = 10 kPa, which is consistent with the observation shown in Fig.
7 and Fig. 10.
0 5 10 15 20 25 30 35 40 45 50 55 600.00
0.15
0.30
0.45
0.60
0.75
p 1
(%
)
fv (%)
qmax
= 10kPa qmax
= 15kPa qmax
= 20kPa
qmax
= 25kPa qmax
= 30kPa
Polymonial fitting: p
1 = f 2
v + bfv+ c
b = -2fv
stabilization: 2fv+b =0
slope: 2fv+ b
c = p
1 (at f
v = 0)
Fig. 11. Variations of end-stage permanent strain 휀1𝑝 with coarse grain content fv
Interpretation of permanent strain behaviors by shakedown theory
In terms of permanent strain behaviors, three categories are defined in shakedown theory
(Werkmeister et al. 2001, 2004; Song et al. 2010): category A (plastic shakedown)
characterized by stabilized permanent strain with loading cycles N, category B (plastic creep)
characterized by failure at a large N, and category C (incremental collapse) characterized by
failure at a small N. The criterion to classify the three categories is dependent on the
accumulated permanent strain. Following the French standard AFNOR (2004), the limit of
category A is reached when 휀1 5000𝑝
− 휀1 3000𝑝
> 0.45 × 10⁻⁴ , where 휀1 5000𝑝
and 휀1 3000𝑝
are
accumulated permanent strains at N = 5000 and 3000, respectively. In all the tests conducted
by Wang et al. (2018c), the maximum difference between 휀1 5000𝑝
and 휀1 3000𝑝
occurs at fv = 0%
and ∆qmax = 30 kPa, equal to 0.3 × 10⁻⁴, smaller than the plastic shakedown limit. Thus, the
response of all tests considered is within category A. Fig. 10 shows that the proposed fatigue
model is relevant to describe the permanent strain behavior for category A. This confirms the
assumption made by Hornych (1993) in their model that the permanent strain reaches a finite
limit as loading cycles N tends toward infinite.
Chapter Ⅴ. Modeling of the mechanical behavior of soil mixture with consideration of soil-water retention curve
192
Conclusions
In order to model the effect of fv on permanent strain of interlayer soil, a fatigue model
휀1𝑝(𝑓𝑣, ∆𝑞𝑚𝑎𝑥, 𝑁) was developed based on the results from multi-stage loading cyclic tests
conducted by Wang et al. (2018c), at six different fv values (0%, 5%, 10%, 20%, 35% and 45%)
and five different ∆qmax values (10 kPa, 15 kPa, 20 kPa, 25 kPa and 30 kPa), with 90000 loading
cycles for each ∆qmax. The proposed fatigue model accounts for the effects of coarse grain
content fv, maximum deviator stress ∆qmax and loading cycles N on permanent strain. The model
parameters were determined by fitting the cyclic tests at fv = 0%, 5% and 35%, and then used
to simulate the tests at fv = 10%, 20% and 45%. A good agreement was obtained between the
measurements and simulations, showing the performance of the proposed fatigue model for
predicting permanent strain.
It is worth noting that the proposed model is valid when the permanent strain stabilizes at a
certain number of cycles N. In other words, it can only describe the permanent strain of category
A (plastic shakedown). Moreover, the fatigue model 휀1𝑝(𝑓𝑣, ∆𝑞𝑚𝑎𝑥, 𝑁) has not taken the effect
of water content into account. Further experimental data are needed to take this effect into
consideration.
Acknowledgements
This work was supported by the China Scholarship Council (CSC) and Ecole des Ponts
ParisTech.
Chapter Ⅴ. Modeling of the mechanical behavior of soil mixture with consideration of soil-water retention curve
193
References
AFNOR, 1995. NF P98-235-1—Test relating to pavements. Unbound granular materials. Part
1: Repeated Loading Triaxial Test.
AFNOR, 2004, NF EN 13286-7—Unbound and Hydraulically Bound Mixtures. Part 7:
Cyclic Load Triaxial Test for Unbound Mixtures.
Barksdale, R. D. 1972. Laboratory evaluation of rutting in base course materials. In Presented
at the Third International Conference on the Structural Design of Asphalt Pavements,
Grosvenor House, Park Lane, London, England, Sept. 11-15, 1972. (Vol. 1, No.
Proceeding).
Cui, Y. J., Duong, T. V., Tang, A. M., Dupla, J. C., Calon, N., & Robinet, A. 2013. Investigation
of the hydro-mechanical behaviour of fouled ballast. Journal of Zhejiang University
Science A, 14(4), 244-255.
Duong, T. V., Tang, A. M., Cui, Y. J., Trinh, V. N., Dupla, J. C., Calon, N., ... & Robinet, A.
2013. Effects of fines and water contents on the mechanical behavior of interlayer soil in
ancient railway sub-structure. Soils and foundations, 53(6), 868-878.
Duong, T. V., Cui, Y. J., Tang, A. M., Dupla, J. C., Canou, J., Calon, N., & Robinet, A. 2014.
Investigating the mud pumping and interlayer creation phenomena in railway sub-structure.
Engineering Geology, 171, 45-58.
Duong, T. V., Cui, Y. J., Tang, A. M., Dupla, J. C., Canou, J., Calon, N., & Robinet, A. 2016.
Effects of water and fines contents on the resilient modulus of the interlayer soil of railway
substructure. Acta Geotechnica, 11(1), 51-59.
Gidel, G., Hornych, P., Breysse, D., & Denis, A. 2001. A new approach for investigating the
permanent deformation behaviour of unbound granular material using the repeated loading
triaxial apparatus. Bulletin des laboratoires des Ponts et Chaussées, (233).
Hornych, P. 1993. Étude des déformations permanentes sous chargements répétés de trois
graves non traitées. Bulletin de liaison des Laboratoires des Ponts et Chaussées, (184).
Jing, P., Nowamooz, H., & Chazallon, C. 2018. Permanent deformation behaviour of a granular
material used in low-traffic pavements. Road Materials and Pavement Design, 19(2), 289-
314.
Lamas-Lopez, F., d’Aguiar, S. C., Robinet, A., Cui, Y. J., Calon, N., Canou, J., ... & Tang, A.
M. 2015. In-situ investigation of the behaviour of a French conventional railway platform.
Proc., Transportation Research Board TRB 2015.
Lamas-Lopez, F. 2016. Field and laboratory investigation on the dynamic behaviour of
conventional railway track-bed materials in the context of traffic upgrade (Doctoral
dissertation, Paris Est).
Sweere, G.T.H., 1990. Unbound Granular Bases for Roads. PhD Thesis. Delft, Netherlands.
Chapter Ⅴ. Modeling of the mechanical behavior of soil mixture with consideration of soil-water retention curve
194
Song, Y., & Ooi, P. S. 2010. Interpretation of shakedown limit from multistage permanent
deformation tests. Transportation research record, 2167(1), 72-82.
Trinh, V. N. 2011. Comportement hydromécanique des matériaux constitutifs de plateformes
ferroviaires anciennes. PhD Thesis, Ecole Nationale des Ponts et Chaussées, Université
Paris-Est.
Trinh, V. N., Tang, A. M., Cui, Y. J., Dupla, J. C., Canou, J., Calon, N., ... & Schoen, O. 2012.
Mechanical characterisation of the fouled ballast in ancient railway track substructure by
large-scale triaxial tests. Soils and foundations, 52(3), 511-523.
Werkmeister, S., Dawson, A. R., & Wellner, F. 2001. Permanent deformation behavior of
granular materials and the shakedown concept. Transportation Research Record, 1757(1),
75-81.
Werkmeister, S., Dawson, A. R., & Wellner, F. 2004. Pavement design model for unbound
granular materials. Journal of Transportation Engineering, 130(5), 665-674.
Wang, H. L., Chen, R. P., Qi, S., Cheng, W., & Cui, Y. J. 2018. Long-term performance of pile-
supported ballastless track-bed at various water levels. Journal of Geotechnical and
Geoenvironmental Engineering, 144(6), 04018035.
Wang, H. L., Cui, Y. J., Lamas-Lopez, F., Calon, N., Saussine, G., Dupla, J. C., ... & Chen, R.
P. 2018. Investigation on the mechanical behavior of track-bed materials at various contents
of coarse grains. Construction and Building Materials, 164, 228-237.
Wang, H. L., Cui, Y. J., Lamas-Lopez, F., Dupla, J. C., Canou, J., Calon, N., ... & Chen, R. P.
2018. Permanent deformation of track-bed materials at various inclusion contents under
large number of loading cycles. Journal of Geotechnical and Geoenvironmental
Engineering, 144(8), 04018044.
Chapter Ⅴ. Modeling of the mechanical behavior of soil mixture with consideration of soil-water retention curve
195
Su, Y., Cui, Y. J., Dupla, J. C., Canou, J., & Duan, S. Q. 2021. Submitted to Canadian
Geotechnical Journal.
A fatigue model for fine/coarse soil mixture accounting for the effects of
coarse grain content and suction by incorporating soil-water retention
curve
Yu Su1, Yu-Jun Cui1, Jean-Claude Dupla1, Jean Canou1, Shu-Qian Duan1,2
Abstract: Experimental observations showed that the permanent strain 휀1𝑝 of fine/coarse soil
mixture was significantly affected by the number of loading cycles N, deviator stress σd, coarse
grain content fv and matric suction 𝜓. In this study, a fatigue model incorporating soil-water
retention curve was developed, allowing the combined effects of N, σd, fv and 𝜓 on 휀1𝑝 to be
accounted for. Several studies were selected from literature to verify the proposed model. The
model parameters were determined by fitting the variations of 휀1𝑝 with N, σd, fv and 𝜓 under
saturated condition, and then adopted to predict the results under unsaturated condition. A good
agreement was obtained between the model predictions and the experimental results, showing
the performance of the proposed model in describing the variations of 휀1𝑝 with N, σd, fv and 𝜓
in the case of plastic shakedown. Comparisons with three representative existing models
showed that the proposed model incorporating 𝜓 provides better predictions of 휀1𝑝
than the
existing models considering the water content, for both the case of constant dry density of fine
soil fraction ρd-f and the case of constant dry density of mixture ρd. This was explained as follows:
for the latter case, keeping the ρd constant, an increasing fv induced a decreasing ρd-f and hence
a decrease of 𝜓. For both cases, the effect of ρd-f on 휀1𝑝 was rather reflected by 𝜓 than by water
content.
Keywords: fine/coarse soil mixture; fatigue model; permanent strain; coarse grain content;
matric suction; soil-water retention curve
Introduction
An interlayer soil was identified in the French conventional rail tracks, corresponding to a
mixture of fine soil and coarse grains. Wang et al. (2018) studied the effect of coarse grain
content fv (the ratio of the volume of coarse grain to that of mixture) on permanent strain of
such mixture by cyclic tests under a constant optimum moisture content of fine soil fraction
wopt-f, and found that an increase of fv led to a decrease of permanent strain. Su et al. (2021a)
also reported that an increasing fv induced a decrease of permanent strain under both unsaturated
and saturated conditions. On the contrary, Duong et al. (2013) found that an increase of fv
induced a decrease of permanent strain under saturated condition, while an opposite trend was
1Ecole des Ponts ParisTech, Laboratoire Navier/CERMES, 6 – 8 av. Blaise Pascal, Cité Descartes, Champs-sur-
Marne, 77455 Marne – la – Vallée cedex 2, France 2Zhengzhou University, School of Civil Engineering, Zhengzhou, Henan 450001, China
Chapter Ⅴ. Modeling of the mechanical behavior of soil mixture with consideration of soil-water retention curve
196
found under unsaturated condition. This is because that Duong et al. (2013) controlled the global
dry density of mixture ρd with varying fv, inducing a varying dry density of fine soil fraction ρd-
f and thus a varying suction 𝜓, while Wang et al. (2018) and Su et al. (2021a) kept a constant
ρd-f with varying fv, which resulted in a constant 𝜓 at a given water content. In a general case,
both fv and 𝜓 affected the permanent strain of fine/coarse soil mixture. From a practical point
of view, it appears essential to develop a model of permanent strain for such mixtures,
accounting for the combined effects of fv and 𝜓.
Numerous studies reported that the permanent strain of soil mixture was mainly affected by the
number of loading cycles N, stress state, coarse grain content fv and suction 𝜓 (or water content)
(Li and Selig 1996; Puppala et al. 2005; Song and Ooi 2010; Gabr and Cameron 2013; Chen et
al. 2019; Su et al. 2020a; Qi et al. 2020). Based on the experimental results, various empirical
models were proposed to describe the variations of permanent strain with changes in either the
loading cyles N (Barksdale 1972; Sweere 1990; Hornych et al. 1993), or the stress state (Shenton
1974; Lekarp and Dawson 1998). Gidel et al. (2001) studied the effects of N and stress level on
the permanent strain of unbound granular material by multi-stage loading cyclic tests, and found
that when the applied deviator stress σd exceeded the past maximum value, the permanent strain
increased notably. Based on the experimental results, they developed a model of permanent
strain under the combined effects of N and stress states. Wang et al. (2018) studied the effect of
fv on the permanent strain of fine/coarse soil mixture by multi-stage loading cyclic tests. They
identified a characteristic coarse grain content fv-cha, below which the permanent strain
decreased quickly with increasing fv, while beyond which the permanent strain decreased slowly.
Su et al. (2020b) proposed a model describing such fv effect. Trinh et al. (2012) studied the
effect of water content on permanent strain of interlayer soil by large-scale cyclic triaxial tests
and found that an increase of water content induced an increasing permanent strain. Based on
the experimental results, they proposed a model allowing the effects of N, σd, and w to be
accounted for. Azam et al. (2015) investigated the effects of water content and suction on the
permanent strain of a mixture of clay masonry and concrete aggregate, and proposed different
models for describing the variations of permanent strain with water content and suction,
respectively. Jing et al. (2018) studied the effects of water content and fine soil content on the
permanent strain of granular materials, and found that an increase of fine soil content led to an
increasing permanent strain under saturated condition, but a decreasing permanent strain under
unsaturated condition due to the contribution of suction. They proposed a model by substituting
the effects of fine soil content and water content on permanent strain with that of suction.
Chapter Ⅴ. Modeling of the mechanical behavior of soil mixture with consideration of soil-water retention curve
197
However, the use of suction cannot fully reflect the effect of fine soil content (or coarse grain
content) on permanent strain, in particular under saturated condition where suction is
theoretically null when the osmotic suction is ignored. This indicated that both the effect of
coarse grain content and that of matric suction should be accounted for. To date, no model has
been proposed for describing the variations of permanent strain of soil mixture with changes in
the number of loading cycles N, deviator stress σd, coarse grain content fv and matric suction 𝜓.
In this study, based on the model proposed by Su et al. (2020b), a new fatigue model
incorporating soil-water retention curve (SWRC) was developed. This model was validated
using experimental data from literature, which included the authors’ own data. A comparison
between the proposed model and some representative existing models was made, allowing the
performance of proposed model to be revealed in describing the variations of 휀1𝑝 with N, σd, fv
and 𝜓.
Modelling background
Some investigators proposed empirical models for the description of 휀1𝑝 variation with change
in the number of loading cycles N. For instance, Hornych et al. (1993) studied the effect of N
on 휀1𝑝 for unbound granular materials, and proposed Eq. (1) for describing the variation of 휀1
𝑝
with N:
휀1𝑝
= 𝑓(𝑁) = 𝐴 ∙ [1 − (𝑁
100)−𝐵] (1)
where A and B are model parameters. Eq. (1) has been commonly used to describe the effect of
N on 휀1𝑝. This equation was also adopted in French standard (AFNOR 1995).
Gidel et al. (2001) studied the effects of N and stress state on 휀1𝑝 for unbound granular materials,
and extended Eq. (1) to the effect of stress state:
휀1𝑝
= 𝑔(𝑝max, 𝜎d) ∙ 𝑎1 ∙ [1 − (𝑁
100)
−𝐵] (2)
with
𝑔(𝑝max, 𝜎d) = 휀1𝑝1(
𝑙max
𝑝a)𝑛1
1
(𝑚1+𝑠1
𝑝max−
𝜎d𝑝max
) (3)
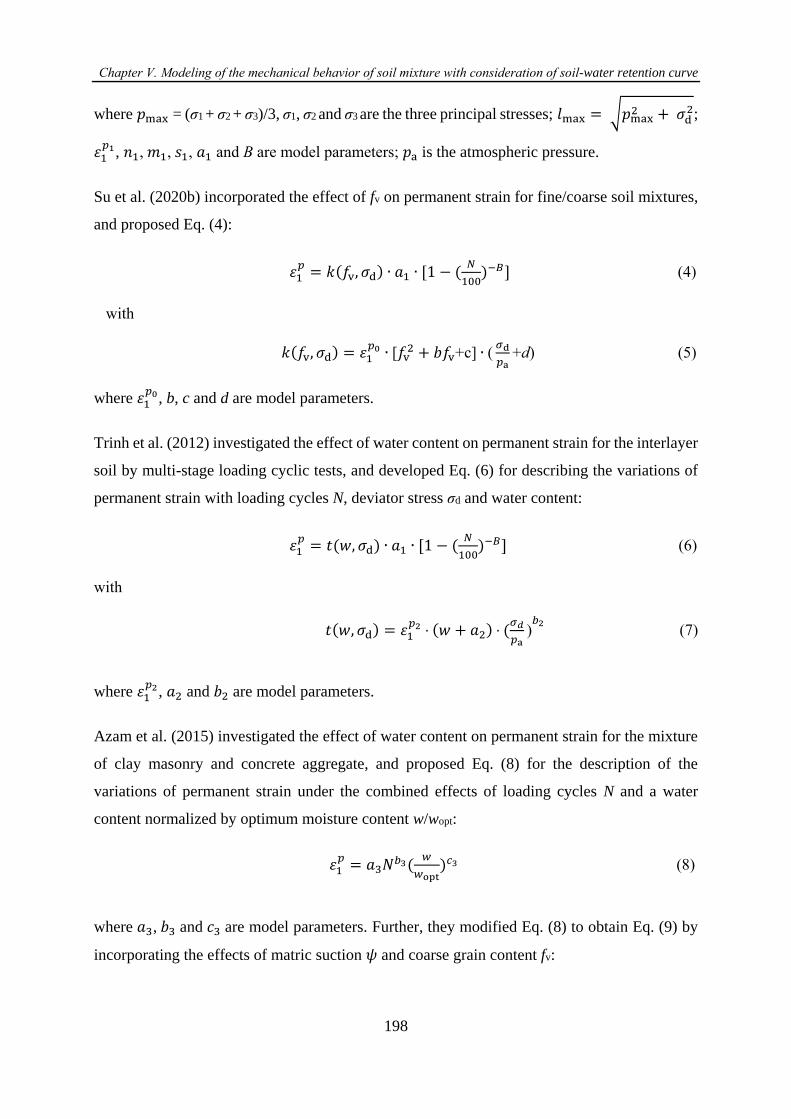
Chapter Ⅴ. Modeling of the mechanical behavior of soil mixture with consideration of soil-water retention curve
198
where 𝑝max = (σ1 + σ2 + σ3)/3, σ1, σ2 and σ3 are the three principal stresses; 𝑙max = √𝑝max2 + 𝜎d
2;
휀1𝑝1, 𝑛1, 𝑚1, 𝑠1, 𝑎1 and B are model parameters; 𝑝a is the atmospheric pressure.
Su et al. (2020b) incorporated the effect of fv on permanent strain for fine/coarse soil mixtures,
and proposed Eq. (4):
휀1𝑝
= 𝑘(𝑓v, 𝜎d) ∙ 𝑎1 ∙ [1 − (𝑁
100)−𝐵] (4)
with
𝑘(𝑓v, 𝜎d) = 휀1𝑝0 ∙ [𝑓v
2 + 𝑏𝑓v1c] ∙ (𝜎d
𝑝a1d) (5)
where 휀1𝑝0, b, c and d are model parameters.
Trinh et al. (2012) investigated the effect of water content on permanent strain for the interlayer
soil by multi-stage loading cyclic tests, and developed Eq. (6) for describing the variations of
permanent strain with loading cycles N, deviator stress σd and water content:
휀1𝑝
= 𝑡(𝑤, 𝜎d) ∙ 𝑎1 ∙ [1 − (𝑁
100)−𝐵] (6)
with
𝑡(𝑤, 𝜎d) = 휀1𝑝2 ∙ (𝑤 + 𝑎2) ∙ (
𝜎𝑑
𝑝a)
𝑏2 (7)
where 휀1𝑝2, 𝑎2 and 𝑏2 are model parameters.
Azam et al. (2015) investigated the effect of water content on permanent strain for the mixture
of clay masonry and concrete aggregate, and proposed Eq. (8) for the description of the
variations of permanent strain under the combined effects of loading cycles N and a water
content normalized by optimum moisture content w/wopt:
휀1𝑝
= 𝑎3𝑁𝑏3(𝑤
𝑤opt)𝑐3 (8)
where 𝑎3, 𝑏3 and 𝑐3 are model parameters. Further, they modified Eq. (8) to obtain Eq. (9) by
incorporating the effects of matric suction 𝜓 and coarse grain content fv:
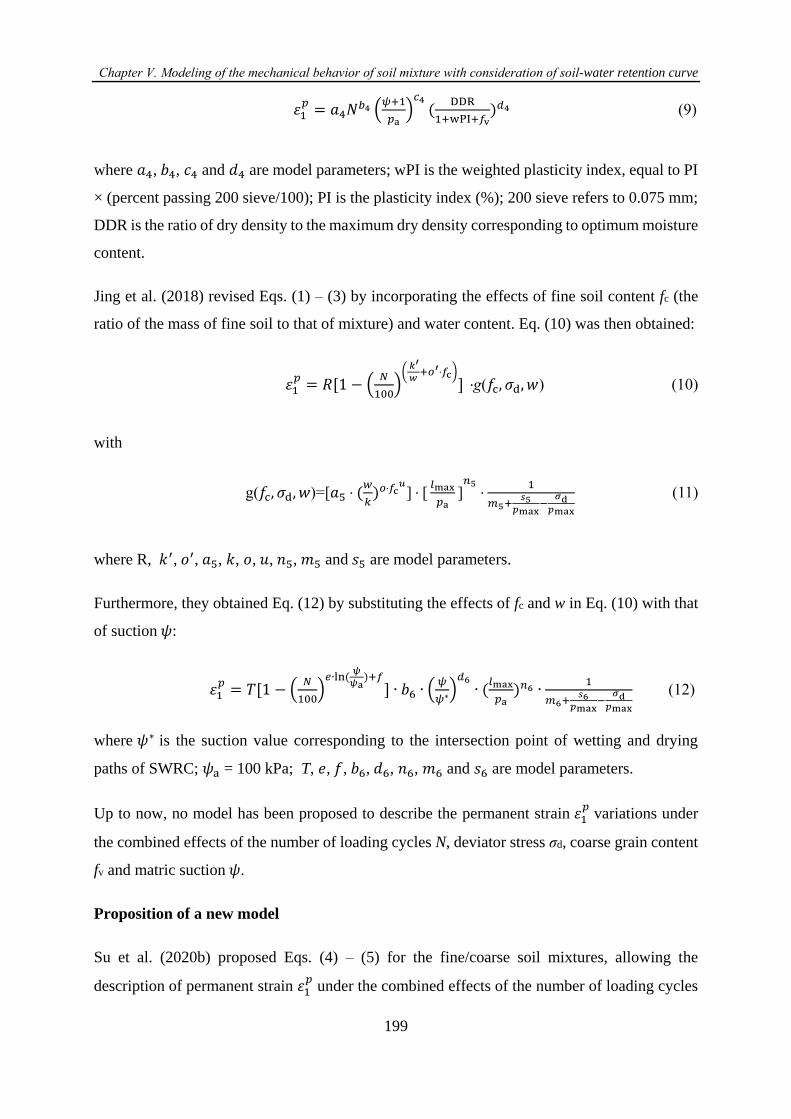
Chapter Ⅴ. Modeling of the mechanical behavior of soil mixture with consideration of soil-water retention curve
199
휀1𝑝
= 𝑎4𝑁𝑏4 (𝜓+1
𝑝a)
𝑐4
(DDR
1+wPI+𝑓v)𝑑4 (9)
where 𝑎4, 𝑏4, 𝑐4 and 𝑑4 are model parameters; wPI is the weighted plasticity index, equal to PI
× (percent passing 200 sieve/100); PI is the plasticity index (%); 200 sieve refers to 0.075 mm;
DDR is the ratio of dry density to the maximum dry density corresponding to optimum moisture
content.
Jing et al. (2018) revised Eqs. (1) – (3) by incorporating the effects of fine soil content fc (the
ratio of the mass of fine soil to that of mixture) and water content. Eq. (10) was then obtained:
휀1𝑝
= 𝑅[1 − (𝑁
100)
( 𝑘′
𝑤+𝑜′∙𝑓c)
] ∙g(𝑓c, 𝜎d, 𝑤) (10)
with
g(𝑓c, 𝜎d, 𝑤)=[𝑎5 ∙ (𝑤
𝑘)𝑜∙𝑓c
𝑢] ∙ [
𝑙max
𝑝a]
𝑛5∙
1
𝑚5+𝑠5
𝑝max−
𝜎d𝑝max
(11)
where R, 𝑘′, 𝑜′, 𝑎5, 𝑘, 𝑜, 𝑢, 𝑛5, 𝑚5 and 𝑠5 are model parameters.
Furthermore, they obtained Eq. (12) by substituting the effects of fc and w in Eq. (10) with that
of suction 𝜓:
휀1𝑝
= 𝑇[1 − (𝑁
100)
𝑒∙ln (𝜓
𝜓a)+𝑓
] ∙ 𝑏6 ∙ (𝜓
𝜓∗)𝑑6
∙ (𝑙max
𝑝a)𝑛6 ∙
1
𝑚6+𝑠6
𝑝max−
𝜎d𝑝max
(12)
where 𝜓∗ is the suction value corresponding to the intersection point of wetting and drying
paths of SWRC; 𝜓a = 100 kPa; T, 𝑒, 𝑓, 𝑏6, 𝑑6, 𝑛6, 𝑚6 and 𝑠6 are model parameters.
Up to now, no model has been proposed to describe the permanent strain 휀1𝑝 variations under
the combined effects of the number of loading cycles N, deviator stress σd, coarse grain content
fv and matric suction 𝜓.
Proposition of a new model
Su et al. (2020b) proposed Eqs. (4) – (5) for the fine/coarse soil mixtures, allowing the
description of permanent strain 휀1𝑝 under the combined effects of the number of loading cycles
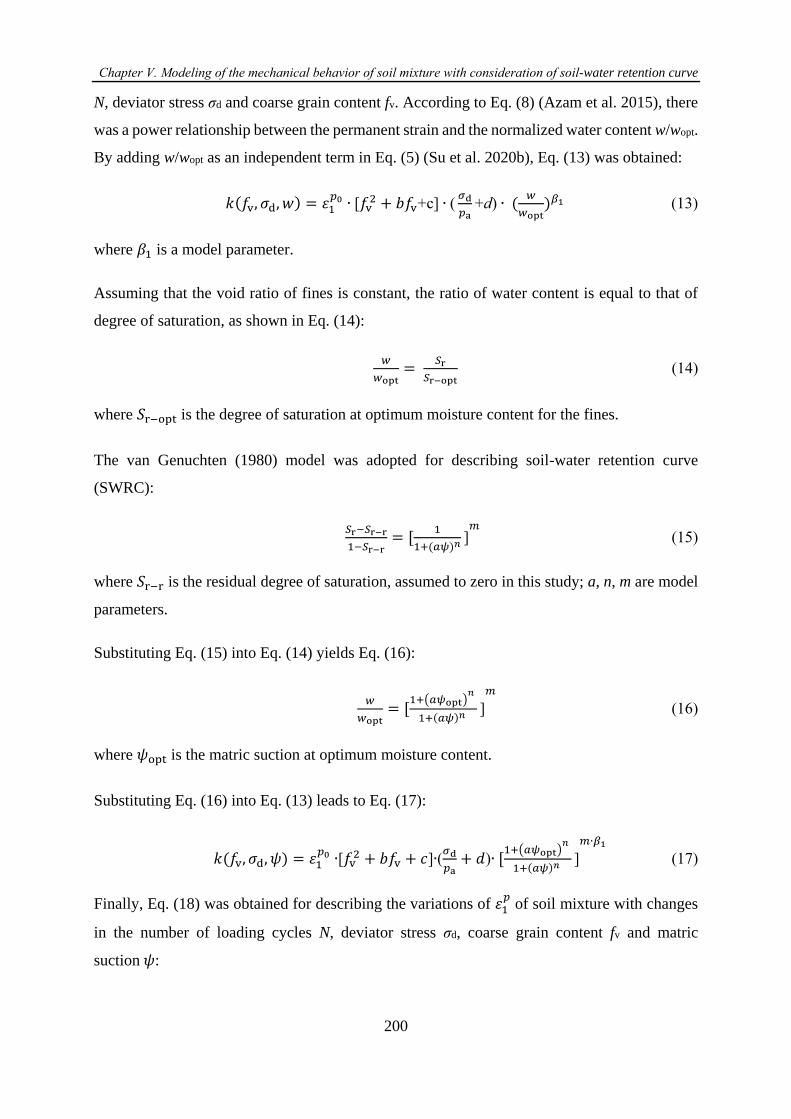
Chapter Ⅴ. Modeling of the mechanical behavior of soil mixture with consideration of soil-water retention curve
200
N, deviator stress σd and coarse grain content fv. According to Eq. (8) (Azam et al. 2015), there
was a power relationship between the permanent strain and the normalized water content w/wopt.
By adding w/wopt as an independent term in Eq. (5) (Su et al. 2020b), Eq. (13) was obtained:
𝑘(𝑓v, 𝜎d, 𝑤) = 휀1𝑝0 ∙ [𝑓v
2 + 𝑏𝑓v1c] ∙ (𝜎d
𝑝a1d) ∙ (
𝑤
𝑤opt)𝛽1 (13)
where 𝛽1 is a model parameter.
Assuming that the void ratio of fines is constant, the ratio of water content is equal to that of
degree of saturation, as shown in Eq. (14):
𝑤
𝑤opt=
𝑆r
𝑆r−opt (14)
where 𝑆r−opt is the degree of saturation at optimum moisture content for the fines.
The van Genuchten (1980) model was adopted for describing soil-water retention curve
(SWRC):
𝑆r−𝑆r−r
1−𝑆r−r= [
1
1+(𝑎𝜓)𝑛 ]𝑚
(15)
where 𝑆r−r is the residual degree of saturation, assumed to zero in this study; a, n, m are model
parameters.
Substituting Eq. (15) into Eq. (14) yields Eq. (16):
𝑤
𝑤opt= [
1+(𝑎𝜓opt)𝑛
1+(𝑎𝜓)𝑛 ]
𝑚
(16)
where 𝜓opt is the matric suction at optimum moisture content.
Substituting Eq. (16) into Eq. (13) leads to Eq. (17):
𝑘(𝑓v, 𝜎d, 𝜓) = 휀1𝑝0 ∙[𝑓v
2 + 𝑏𝑓v + 𝑐]∙(𝜎d
𝑝a+ 𝑑)∙ [
1+(𝑎𝜓opt)𝑛
1+(𝑎𝜓)𝑛 ]
𝑚∙𝛽1
(17)
Finally, Eq. (18) was obtained for describing the variations of 휀1𝑝 of soil mixture with changes
in the number of loading cycles N, deviator stress σd, coarse grain content fv and matric
suction 𝜓:
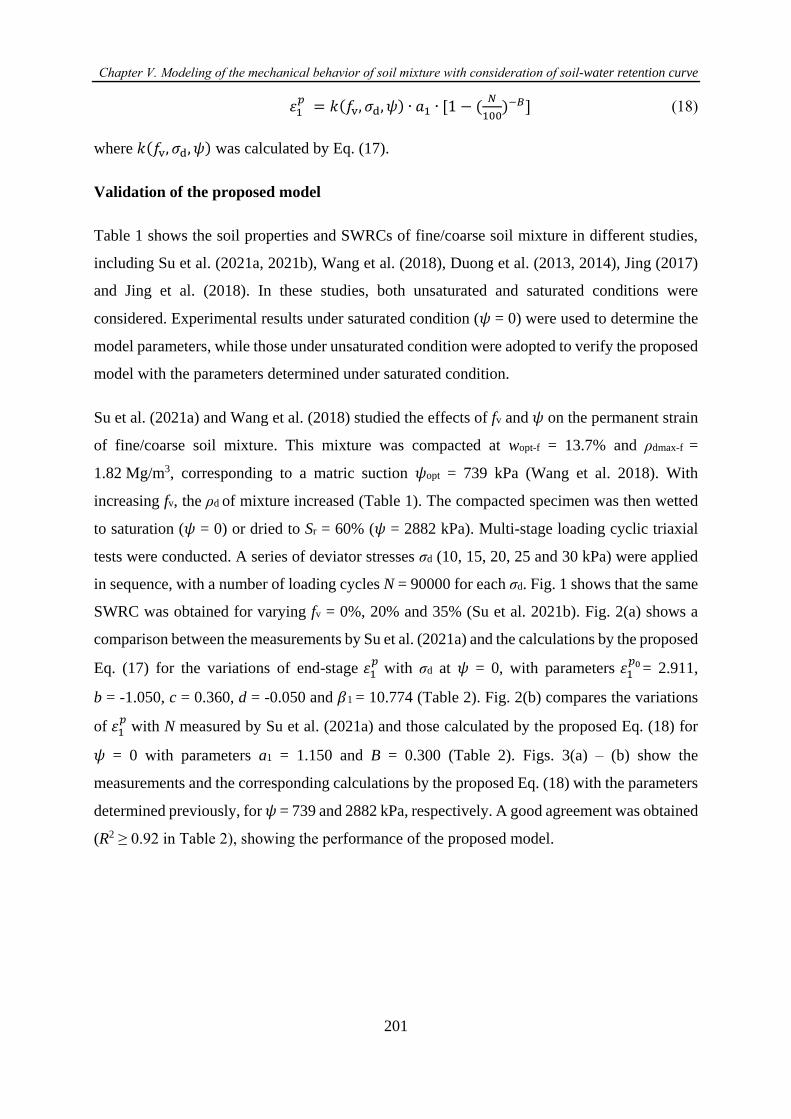
Chapter Ⅴ. Modeling of the mechanical behavior of soil mixture with consideration of soil-water retention curve
201
휀1𝑝
= 𝑘(𝑓v, 𝜎d, 𝜓) ∙ 𝑎1 ∙ [1 − (𝑁
100)−𝐵] (18)
where 𝑘(𝑓v, 𝜎d, 𝜓) was calculated by Eq. (17).
Validation of the proposed model
Table 1 shows the soil properties and SWRCs of fine/coarse soil mixture in different studies,
including Su et al. (2021a, 2021b), Wang et al. (2018), Duong et al. (2013, 2014), Jing (2017)
and Jing et al. (2018). In these studies, both unsaturated and saturated conditions were
considered. Experimental results under saturated condition (𝜓 = 0) were used to determine the
model parameters, while those under unsaturated condition were adopted to verify the proposed
model with the parameters determined under saturated condition.
Su et al. (2021a) and Wang et al. (2018) studied the effects of fv and 𝜓 on the permanent strain
of fine/coarse soil mixture. This mixture was compacted at wopt-f = 13.7% and ρdmax-f =
1.82 Mg/m3, corresponding to a matric suction 𝜓opt = 739 kPa (Wang et al. 2018). With
increasing fv, the ρd of mixture increased (Table 1). The compacted specimen was then wetted
to saturation (𝜓 = 0) or dried to Sr = 60% (𝜓 = 2882 kPa). Multi-stage loading cyclic triaxial
tests were conducted. A series of deviator stresses σd (10, 15, 20, 25 and 30 kPa) were applied
in sequence, with a number of loading cycles N = 90000 for each σd. Fig. 1 shows that the same
SWRC was obtained for varying fv = 0%, 20% and 35% (Su et al. 2021b). Fig. 2(a) shows a
comparison between the measurements by Su et al. (2021a) and the calculations by the proposed
Eq. (17) for the variations of end-stage 휀1𝑝
with σd at 𝜓 = 0, with parameters 휀1𝑝0 = 2.911,
b = -1.050, c = 0.360, d = -0.050 and 𝛽1 = 10.774 (Table 2). Fig. 2(b) compares the variations
of 휀1𝑝 with N measured by Su et al. (2021a) and those calculated by the proposed Eq. (18) for
𝜓 = 0 with parameters a1 = 1.150 and B = 0.300 (Table 2). Figs. 3(a) – (b) show the
measurements and the corresponding calculations by the proposed Eq. (18) with the parameters
determined previously, for 𝜓 = 739 and 2882 kPa, respectively. A good agreement was obtained
(R2 ≥ 0.92 in Table 2), showing the performance of the proposed model.
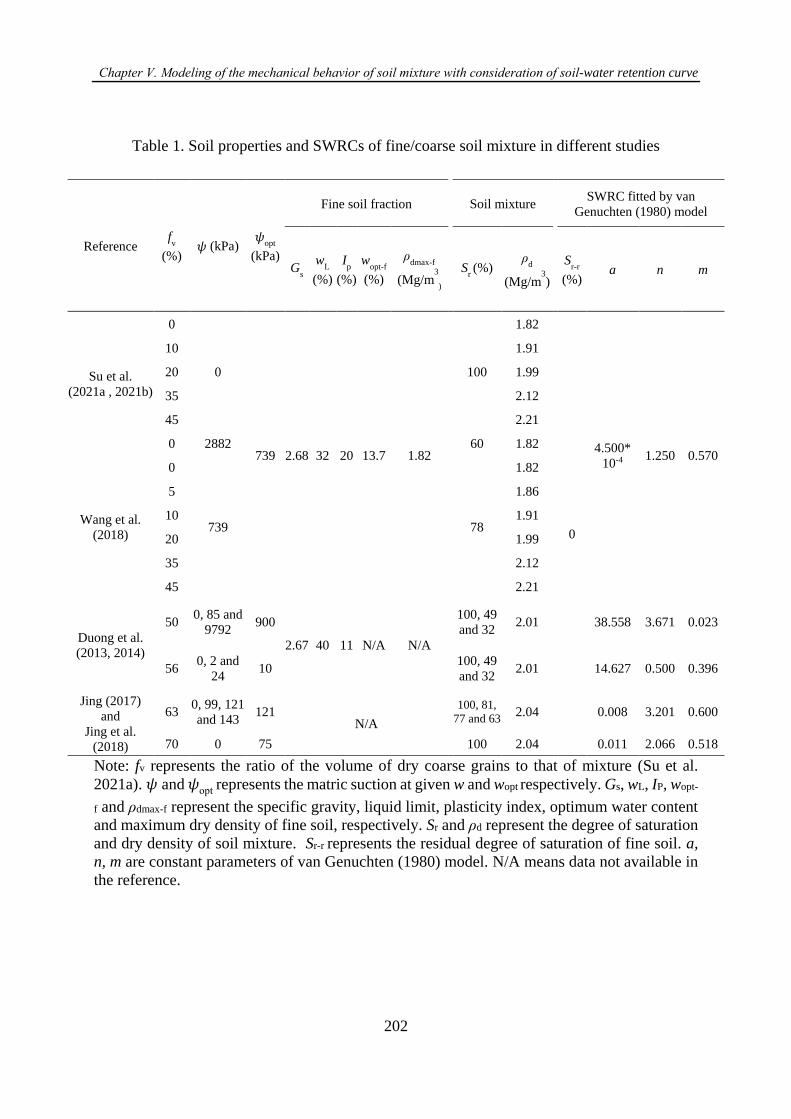
Chapter Ⅴ. Modeling of the mechanical behavior of soil mixture with consideration of soil-water retention curve
202
Table 1. Soil properties and SWRCs of fine/coarse soil mixture in different studies
Reference fv
(%) 𝜓 (kPa)
𝜓opt
(kPa)
Fine soil fraction Soil mixture SWRC fitted by van
Genuchten (1980) model
Gs
wL
(%)
Ip
(%)
wopt-f
(%)
ρdmax-f
(Mg/m3
)
Sr (%)
ρd
(Mg/m3)
S
r-r
(%) a n m
Su et al.
(2021a , 2021b)
0
0
739 2.68 32 20 13.7 1.82
100
1.82
0
4.500*
10-4 1.250 0.570
10 1.91
20 1.99
35 2.12
45 2.21
0 2882 60 1.82
Wang et al.
(2018)
0
739
78
1.82
5 1.86
10 1.91
20 1.99
35 2.12
45 2.21
Duong et al.
(2013, 2014)
50 0, 85 and
9792 900
2.67 40 11 N/A N/A
100, 49
and 32 2.01 38.558 3.671 0.023
56 0, 2 and
24 10 100, 49
and 32 2.01 14.627 0.500 0.396
Jing (2017)
and
Jing et al.
(2018)
63 0, 99, 121
and 143 121
N/A
100, 81,
77 and 63 2.04 0.008 3.201 0.600
70 0 75 100 2.04 0.011 2.066 0.518
Note: fv represents the ratio of the volume of dry coarse grains to that of mixture (Su et al.
2021a). 𝜓 and 𝜓opt represents the matric suction at given w and wopt respectively. Gs, wL, IP, wopt-
f and ρdmax-f represent the specific gravity, liquid limit, plasticity index, optimum water content
and maximum dry density of fine soil, respectively. Sr and ρd represent the degree of saturation
and dry density of soil mixture. Sr-r represents the residual degree of saturation of fine soil. a,
n, m are constant parameters of van Genuchten (1980) model. N/A means data not available in
the reference.
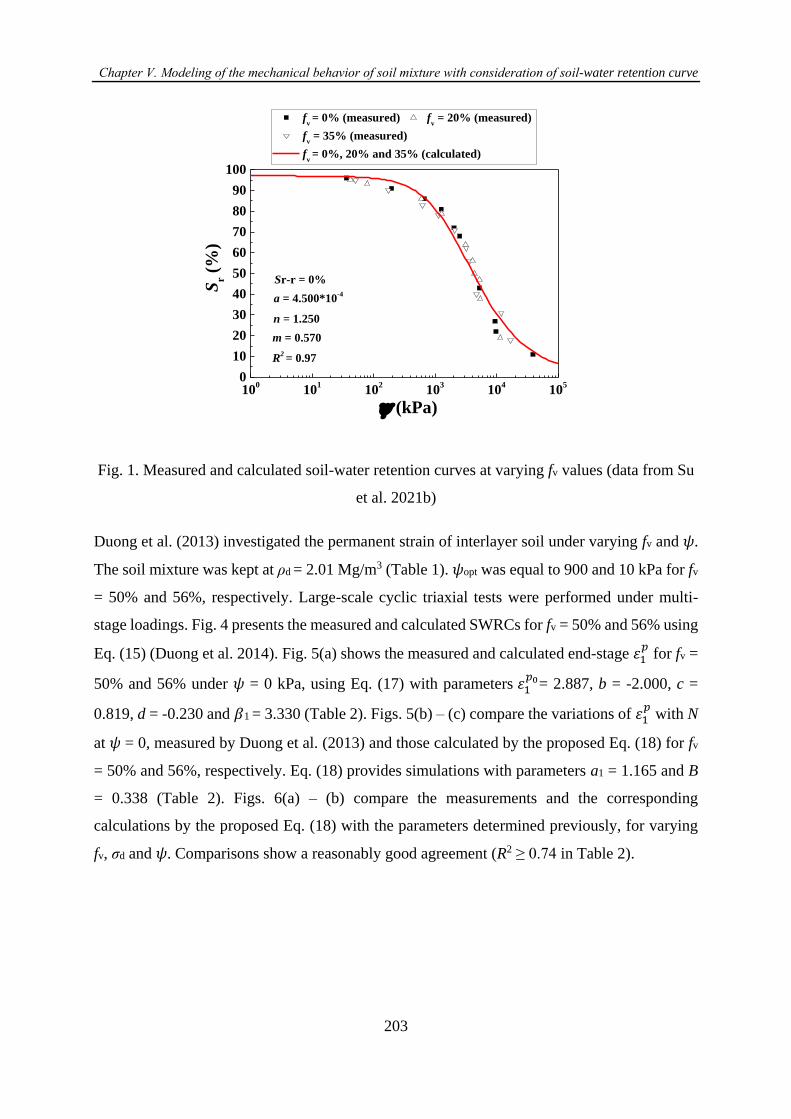
Chapter Ⅴ. Modeling of the mechanical behavior of soil mixture with consideration of soil-water retention curve
203
100
101
102
103
104
105
0
10
20
30
40
50
60
70
80
90
100
Sr-r = 0%
fv = 0% (measured) f
v = 20% (measured)
fv = 35% (measured)
fv = 0%, 20% and 35% (calculated)
Sr (
%)
(kPa)
R2 = 0.97
m = 0.570
n = 1.250
a = 4.500*10-4
Fig. 1. Measured and calculated soil-water retention curves at varying fv values (data from Su
et al. 2021b)
Duong et al. (2013) investigated the permanent strain of interlayer soil under varying fv and 𝜓.
The soil mixture was kept at ρd = 2.01 Mg/m3 (Table 1). 𝜓opt was equal to 900 and 10 kPa for fv
= 50% and 56%, respectively. Large-scale cyclic triaxial tests were performed under multi-
stage loadings. Fig. 4 presents the measured and calculated SWRCs for fv = 50% and 56% using
Eq. (15) (Duong et al. 2014). Fig. 5(a) shows the measured and calculated end-stage 휀1𝑝 for fv =
50% and 56% under 𝜓 = 0 kPa, using Eq. (17) with parameters 휀1𝑝0= 2.887, b = -2.000, c =
0.819, d = -0.230 and 𝛽1 = 3.330 (Table 2). Figs. 5(b) – (c) compare the variations of 휀1𝑝 with N
at 𝜓 = 0, measured by Duong et al. (2013) and those calculated by the proposed Eq. (18) for fv
= 50% and 56%, respectively. Eq. (18) provides simulations with parameters a1 = 1.165 and B
= 0.338 (Table 2). Figs. 6(a) – (b) compare the measurements and the corresponding
calculations by the proposed Eq. (18) with the parameters determined previously, for varying
fv, σd and 𝜓. Comparisons show a reasonably good agreement (R2 ≥ 0.74 in Table 2).
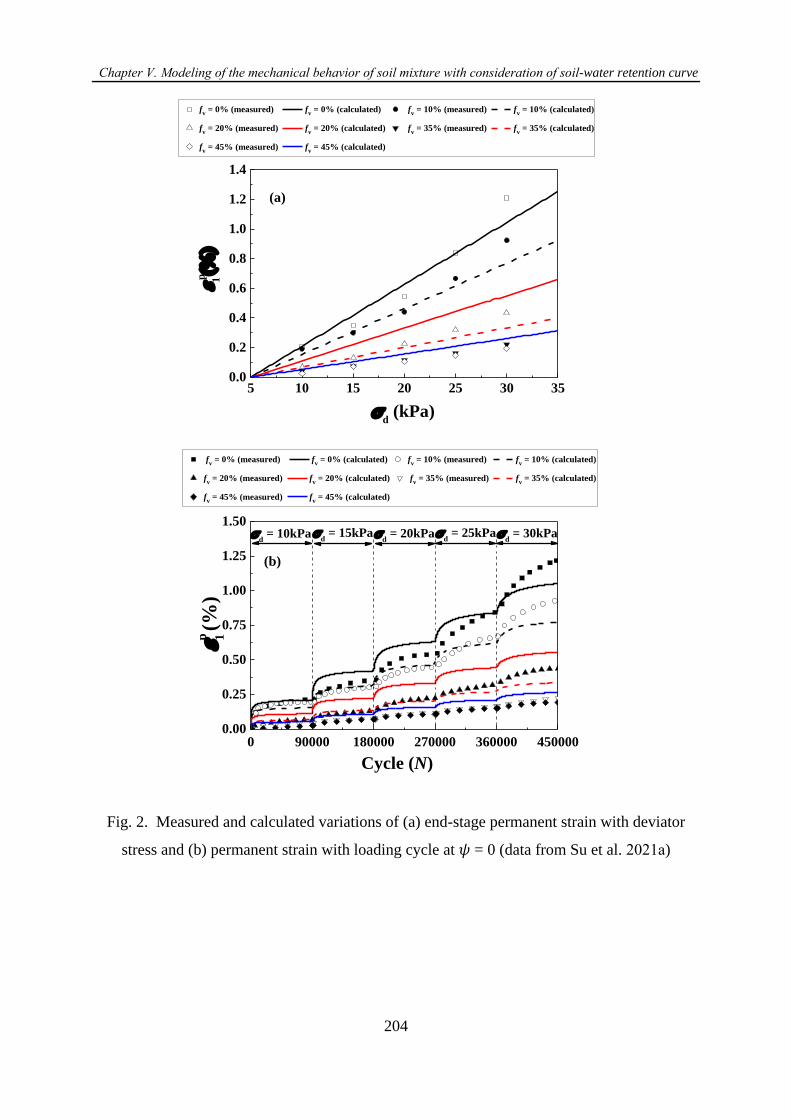
Chapter Ⅴ. Modeling of the mechanical behavior of soil mixture with consideration of soil-water retention curve
204
5 10 15 20 25 30 350.0
0.2
0.4
0.6
0.8
1.0
1.2
1.4
(a)
d (kPa)
p 1(
)
fv = 0% (measured) f
v = 0% (calculated) f
v = 10% (measured) f
v = 10% (calculated)
fv = 20% (measured) f
v = 20% (calculated) f
v = 35% (measured) f
v = 35% (calculated)
fv = 45% (measured) f
v = 45% (calculated)
0 90000 180000 270000 360000 4500000.00
0.25
0.50
0.75
1.00
1.25
1.50
(b)
p 1 (%
)
p
1
d = 30kPa
d = 25kPa
d = 20kPa
d = 15kPa
d = 10kPa
fv = 0% (measured) f
v = 0% (calculated) f
v = 10% (measured) f
v = 10% (calculated)
fv = 20% (measured) f
v = 20% (calculated) f
v = 35% (measured) f
v = 35% (calculated)
fv = 45% (measured) f
v = 45% (calculated)
Cycle (N)
Fig. 2. Measured and calculated variations of (a) end-stage permanent strain with deviator
stress and (b) permanent strain with loading cycle at 𝜓 = 0 (data from Su et al. 2021a)
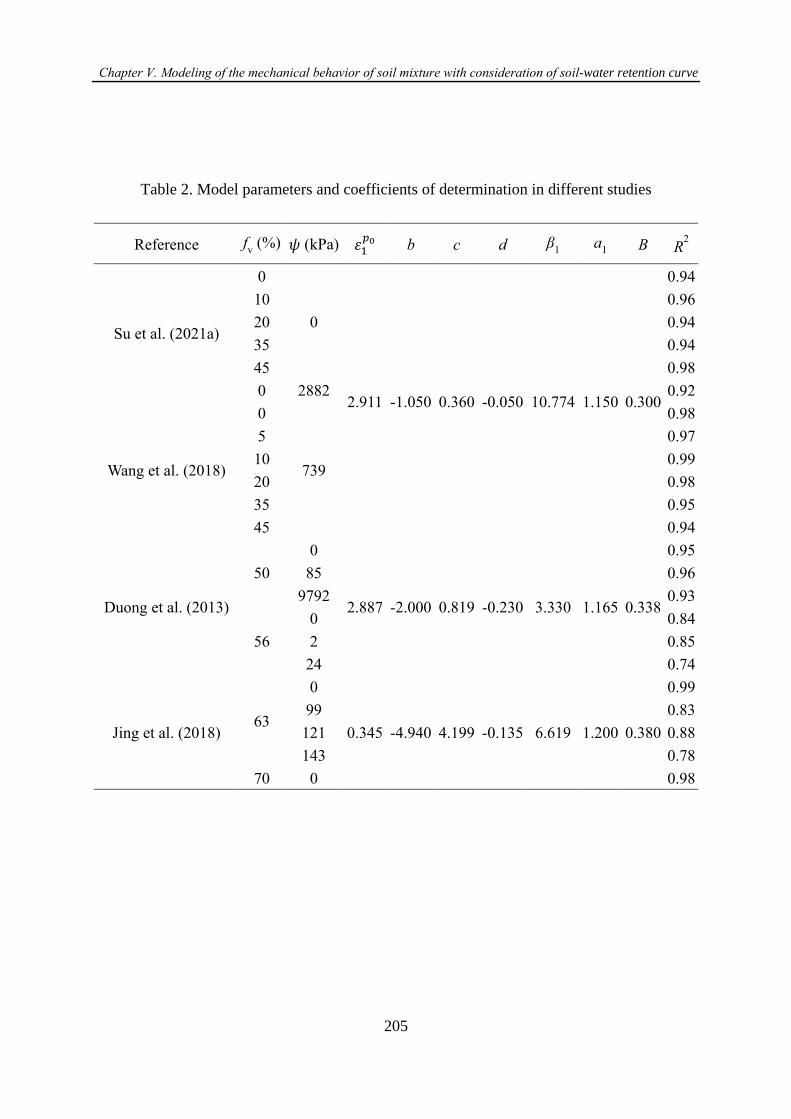
Chapter Ⅴ. Modeling of the mechanical behavior of soil mixture with consideration of soil-water retention curve
205
Table 2. Model parameters and coefficients of determination in different studies
Reference fv (%) 𝜓 (kPa) 휀1
𝑝0 b c d β1 a
1 B R2
Su et al. (2021a)
0
0
2.911 -1.050 0.360 -0.050 10.774 1.150 0.300
0.94 10 0.96 20 0.94 35 0.94 45 0.98 0 2882 0.92
Wang et al. (2018)
0
739
0.98 5 0.97 10 0.99 20 0.98 35 0.95 45 0.94
Duong et al. (2013)
50 0
2.887 -2.000 0.819 -0.230 3.330 1.165 0.338
0.95 85 0.96
9792 0.93
56 0 0.84 2 0.85 24 0.74
Jing et al. (2018) 63
0
0.345 -4.940 4.199 -0.135 6.619 1.200 0.380
0.99 99 0.83 121 0.88 143 0.78
70 0 0.98
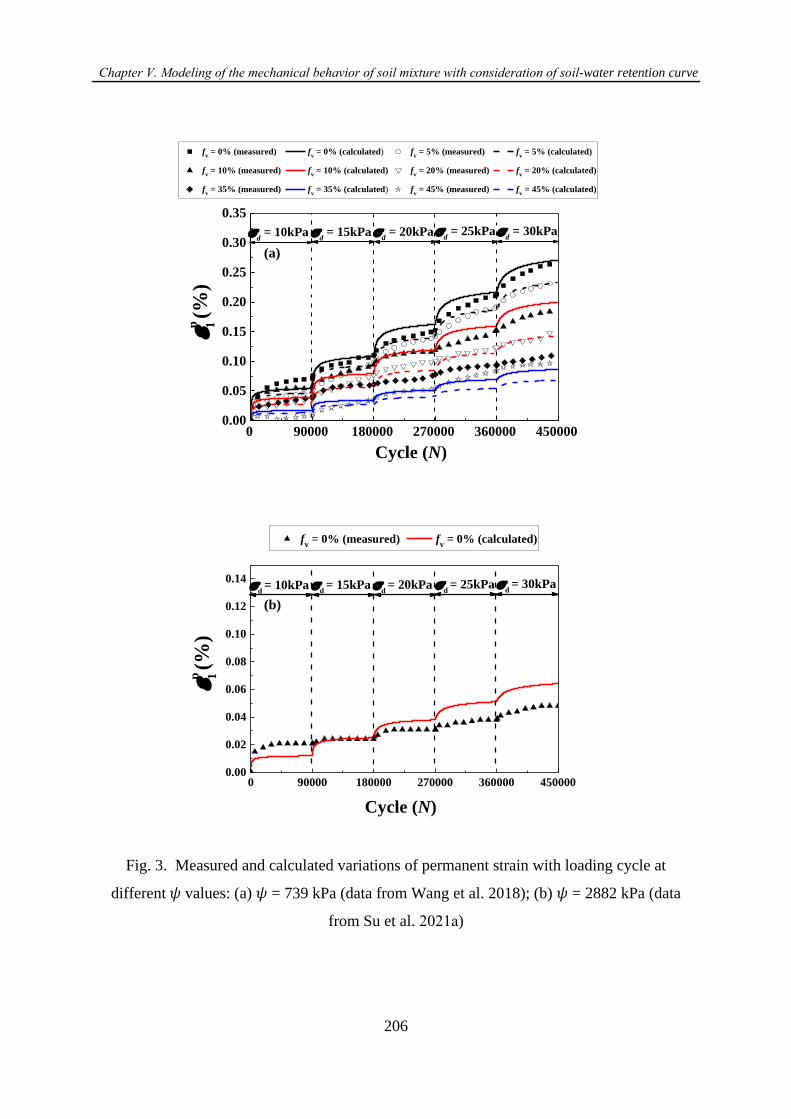
Chapter Ⅴ. Modeling of the mechanical behavior of soil mixture with consideration of soil-water retention curve
206
fv = 0% (measured) f
v = 0% (calculated) f
v = 5% (measured) f
v = 5% (calculated)
fv = 10% (measured) f
v = 10% (calculated) f
v = 20% (measured) f
v = 20% (calculated)
fv = 35% (measured) f
v = 35% (calculated) f
v = 45% (measured) f
v = 45% (calculated)
0.00
0.05
0.10
0.15
0.20
0.25
0.30
0.35
0 90000 180000 270000 360000 450000
(a)
p 1 (%
)
Cycle (N)
d = 30kPa
d = 25kPa
d = 20kPa
d = 15kPa
d = 10kPa
0 90000 180000 270000 360000 4500000.00
0.02
0.04
0.06
0.08
0.10
0.12
0.14
(b)
p 1 (%
)
Cycle (N)
d = 30kPa
d = 25kPa
d = 20kPa
d = 15kPa
d = 10kPa
fv = 0% (measured) f
v = 0% (calculated)
Fig. 3. Measured and calculated variations of permanent strain with loading cycle at
different 𝜓 values: (a) 𝜓 = 739 kPa (data from Wang et al. 2018); (b) 𝜓 = 2882 kPa (data
from Su et al. 2021a)
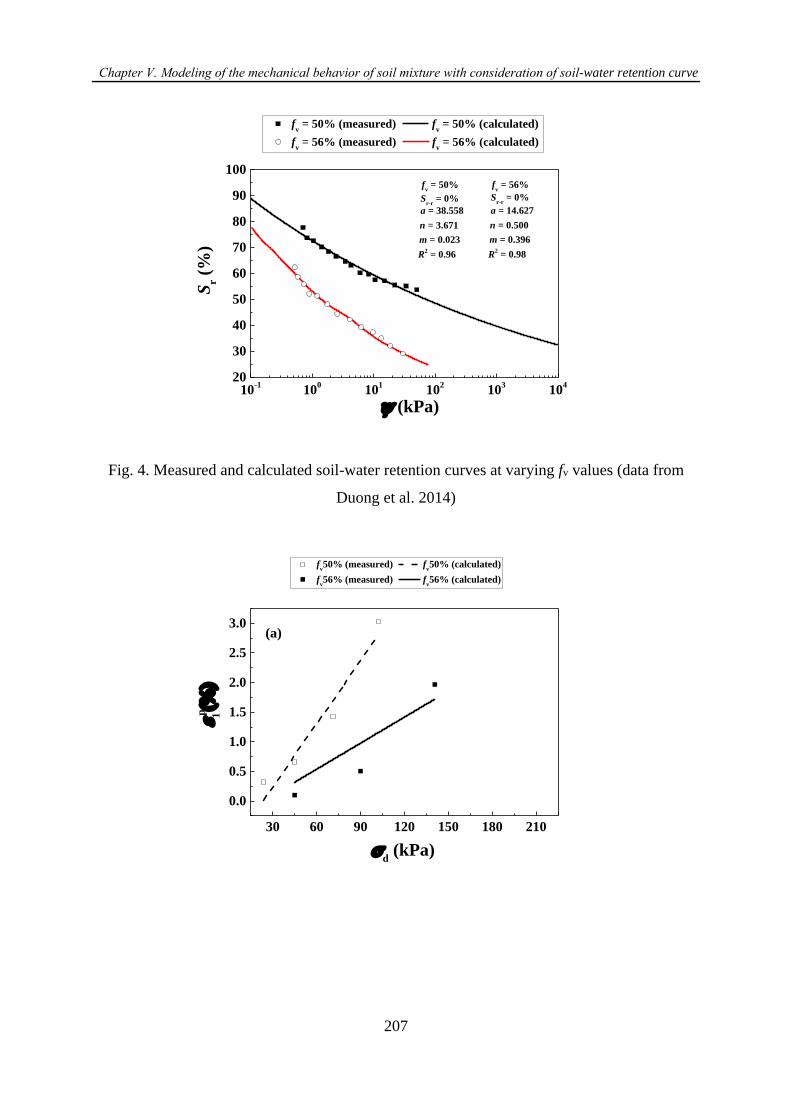
Chapter Ⅴ. Modeling of the mechanical behavior of soil mixture with consideration of soil-water retention curve
207
10-1
100
101
102
103
104
20
30
40
50
60
70
80
90
100
Sr-r
= 0%Sr-r
= 0% S
r (%
)
(kPa)
fv = 50% (measured) f
v = 50% (calculated)
fv = 56% (measured) f
v = 56% (calculated)
R2 = 0.98
m = 0.396
n = 0.500
a = 14.627
fv = 56%
R2 = 0.96
m = 0.023
n = 3.671
a = 38.558
fv = 50%
Fig. 4. Measured and calculated soil-water retention curves at varying fv values (data from
Duong et al. 2014)
30 60 90 120 150 180 210
0.0
0.5
1.0
1.5
2.0
2.5
3.0(a)
d (kPa)
p 1(
)
fv50% (measured) f
v50% (calculated)
fv56% (measured) f
v56% (calculated)
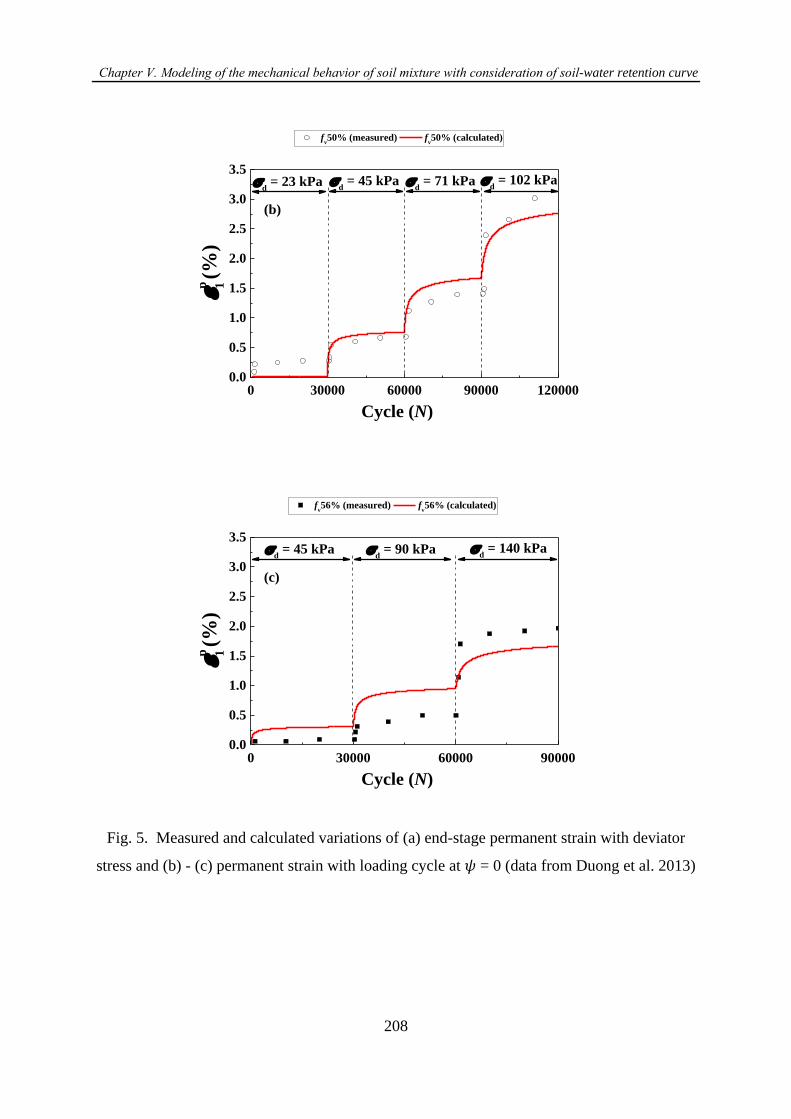
Chapter Ⅴ. Modeling of the mechanical behavior of soil mixture with consideration of soil-water retention curve
208
0 30000 60000 90000 1200000.0
0.5
1.0
1.5
2.0
2.5
3.0
3.5
(b)
d = 23 kPa
d = 102 kPa
p 1 (%
)
fv50% (measured) f
v50% (calculated)
Cycle (N)
d = 45 kPa
d = 71 kPa
0 30000 60000 900000.0
0.5
1.0
1.5
2.0
2.5
3.0
3.5
(c)
d = 140 kPa
d = 90 kPa
d = 45 kPa
p 1 (%
)
fv56% (measured) f
v56% (calculated)
Cycle (N)
Fig. 5. Measured and calculated variations of (a) end-stage permanent strain with deviator
stress and (b) - (c) permanent strain with loading cycle at 𝜓 = 0 (data from Duong et al. 2013)
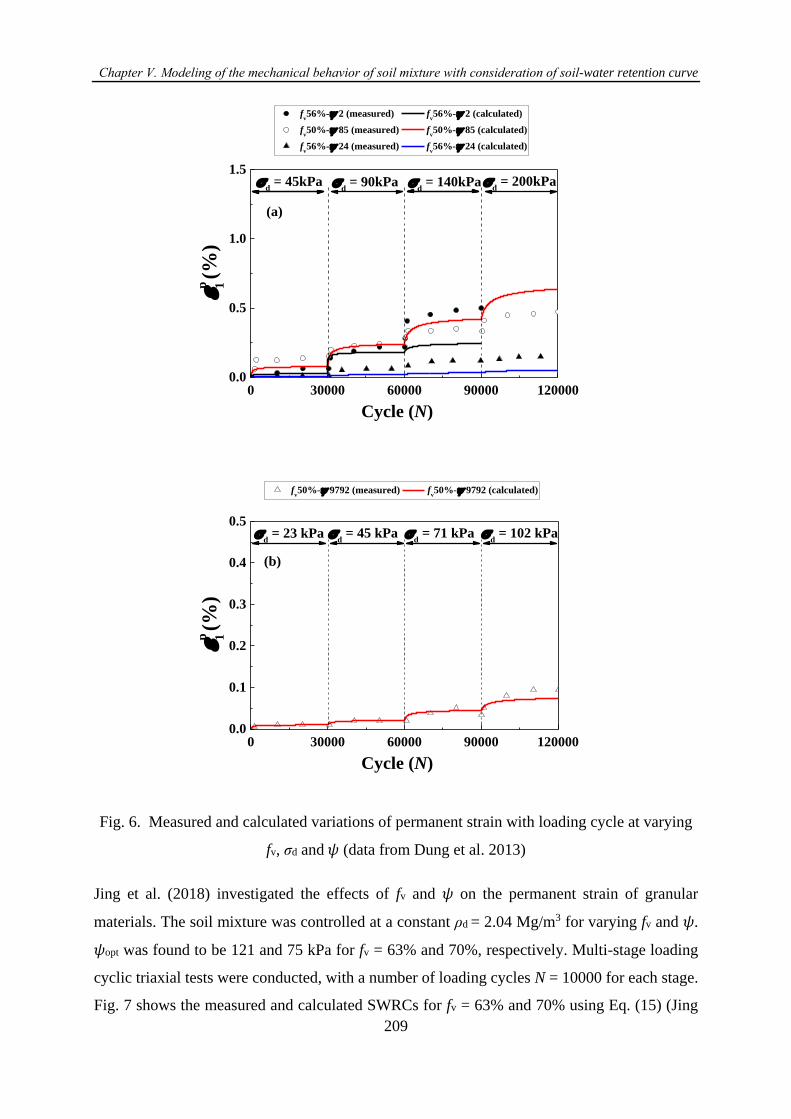
Chapter Ⅴ. Modeling of the mechanical behavior of soil mixture with consideration of soil-water retention curve
209
0 30000 60000 90000 1200000.0
0.5
1.0
1.5
(a)
d = 200kPa
d = 140kPa
d = 90kPa
p 1 (%
)
p
1
d = 45kPa
fv56%- 2 (measured) f
v56%- 2 (calculated)
fv50%- 85 (measured) f
v50%- 85 (calculated)
fv56%- 24 (measured) f
v56%- 24 (calculated)
Cycle (N)
0 30000 60000 90000 1200000.0
0.1
0.2
0.3
0.4
0.5
(b)
d = 102 kPa
d = 71 kPa
d = 45 kPa
d = 23 kPa
p 1 (%
)
fv50%- 9792 (measured) f
v50%- 9792 (calculated)
Cycle (N)
Fig. 6. Measured and calculated variations of permanent strain with loading cycle at varying
fv, σd and 𝜓 (data from Dung et al. 2013)
Jing et al. (2018) investigated the effects of fv and 𝜓 on the permanent strain of granular
materials. The soil mixture was controlled at a constant ρd = 2.04 Mg/m3 for varying fv and 𝜓.
𝜓opt was found to be 121 and 75 kPa for fv = 63% and 70%, respectively. Multi-stage loading
cyclic triaxial tests were conducted, with a number of loading cycles N = 10000 for each stage.
Fig. 7 shows the measured and calculated SWRCs for fv = 63% and 70% using Eq. (15) (Jing

Chapter Ⅴ. Modeling of the mechanical behavior of soil mixture with consideration of soil-water retention curve
210
2017). Fig. 8(a) compares the end-stage 휀1𝑝 at 𝜓 = 0, measured by Jing et al. (2018) and those
calculated by the proposed Eq. (17) for fv = 63% and 70%, respectively. Figs. 8(b) – (c) show
the comparisons of the variations of 휀1𝑝 with N under 𝜓 = 0 between the measurements by Jing
et al. (2018) and calculations using the proposed Eq. (18) for fv = 63% and 70%, respectively.
The parameters in Eq. (18) were determined and presented in Table 2. Fig. 9 shows the
predictions by Eq. (18) with the parameters determined previously, for fv = 63% and varying 𝜓.
A small difference between measurements and calculations was observed for the first three
loading stages (σd = 40, 70 and 100), while a large difference for the fourth loading stage (σd =
140 kPa) appeared, especially in the case of 𝜓 = 99 kPa.
Based on the shakedown theory (Werkmeister et al. 2001, 2004), Jing (2017) found that the
permanent strain behavior for 𝜓 = 99 kPa at σd = 140 kPa was classified as category B (plastic
creep – failure at a large N). This implies that the proposed Eq. (18) can only well describe the
permanent strain of category A (plastic shakedown – stabilization of permanent strain with
increasing N), which was consistent with the model proposed by Trinh et al. (2012), Jing et al.
(2018) and Su et al. (2020b). This explained the difference at the end of loading stages for fv =
0% and 10% at 𝜓 = 0 and σd = 30 kPa (Fig. 2(b)) and fv = 50% at 𝜓 = 0 kPa and σd = 102 kPa
(Fig. 5(b)).
101
102
103
20
30
40
50
60
70
80
90
100
Sr (
%)
(kPa)
fv = 63% (measured) f
v = 63% (calculated)
fv = 70% (measured) f
v = 70% (calculated)
fv = 70%
Sr-r
= 0%
R2 = 0.99
m = 0.518
n = 2.066
a = 0.011
fv = 63%
Sr-r
= 0%
R2 = 0.98
m = 0.600
n = 3.201
a = 0.008
Fig. 7. Measured and calculated soil-water retention curves at varying fv values (data from
Jing 2017)
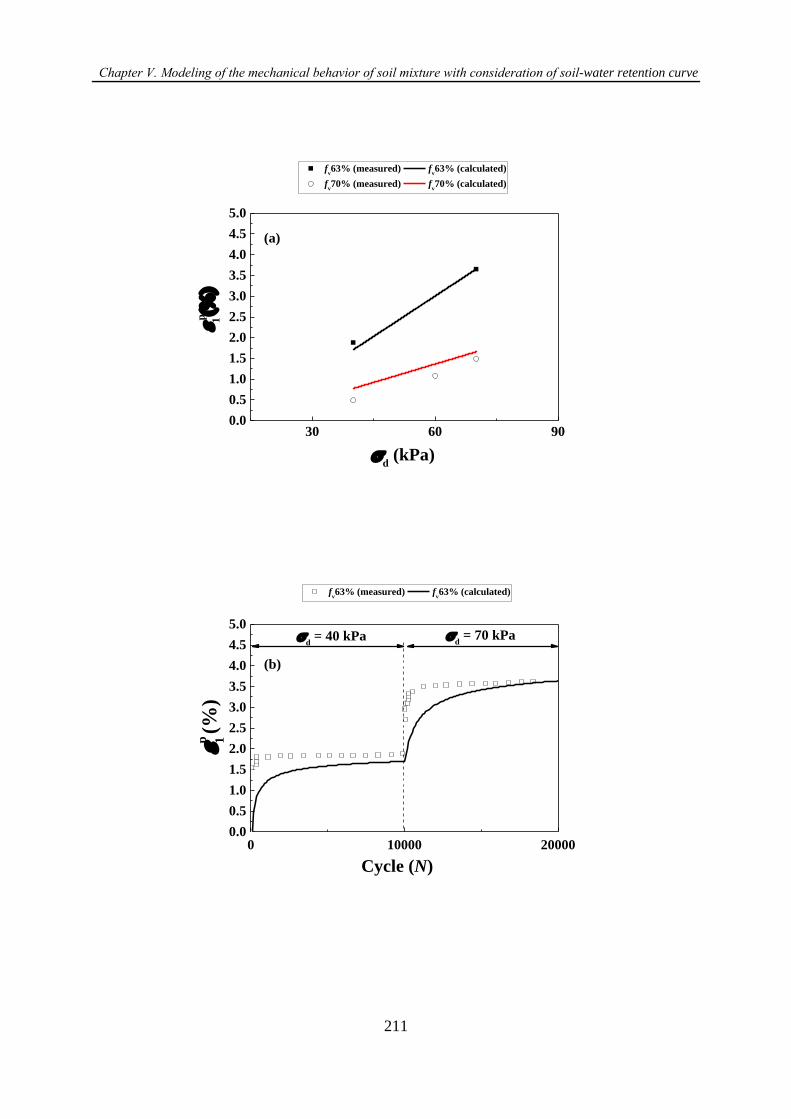
Chapter Ⅴ. Modeling of the mechanical behavior of soil mixture with consideration of soil-water retention curve
211
30 60 900.0
0.5
1.0
1.5
2.0
2.5
3.0
3.5
4.0
4.5
5.0
(a)
d (kPa)
p 1(
)
fv63% (measured) f
v63% (calculated)
fv70% (measured) f
v70% (calculated)
0 10000 200000.0
0.5
1.0
1.5
2.0
2.5
3.0
3.5
4.0
4.5
5.0
(b)
d = 70 kPa
d = 40 kPa
p 1 (%
)
fv63% (measured) f
v63% (calculated)
Cycle (N)
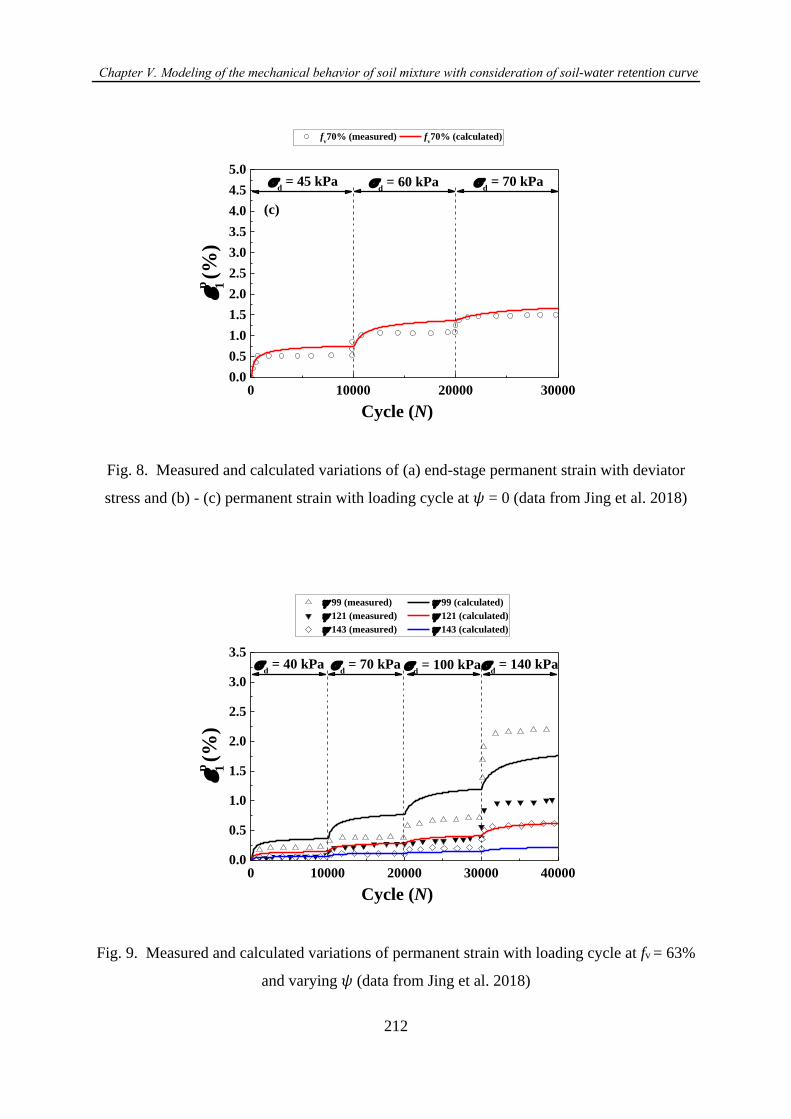
Chapter Ⅴ. Modeling of the mechanical behavior of soil mixture with consideration of soil-water retention curve
212
0 10000 20000 300000.0
0.5
1.0
1.5
2.0
2.5
3.0
3.5
4.0
4.5
5.0
(c)
d = 70 kPa
d = 60 kPa
d = 45 kPa
p 1 (%
)
fv70% (measured) f
v70% (calculated)
Cycle (N)
Fig. 8. Measured and calculated variations of (a) end-stage permanent strain with deviator
stress and (b) - (c) permanent strain with loading cycle at 𝜓 = 0 (data from Jing et al. 2018)
0 10000 20000 30000 400000.0
0.5
1.0
1.5
2.0
2.5
3.0
3.5
d = 100 kPa
d = 140 kPa
d = 70 kPa
d = 40 kPa
p 1 (%
)
99 (measured) 99 (calculated)
121 (measured) 121 (calculated)
143 (measured) 143 (calculated)
Cycle (N)
Fig. 9. Measured and calculated variations of permanent strain with loading cycle at fv = 63%
and varying 𝜓 (data from Jing et al. 2018)
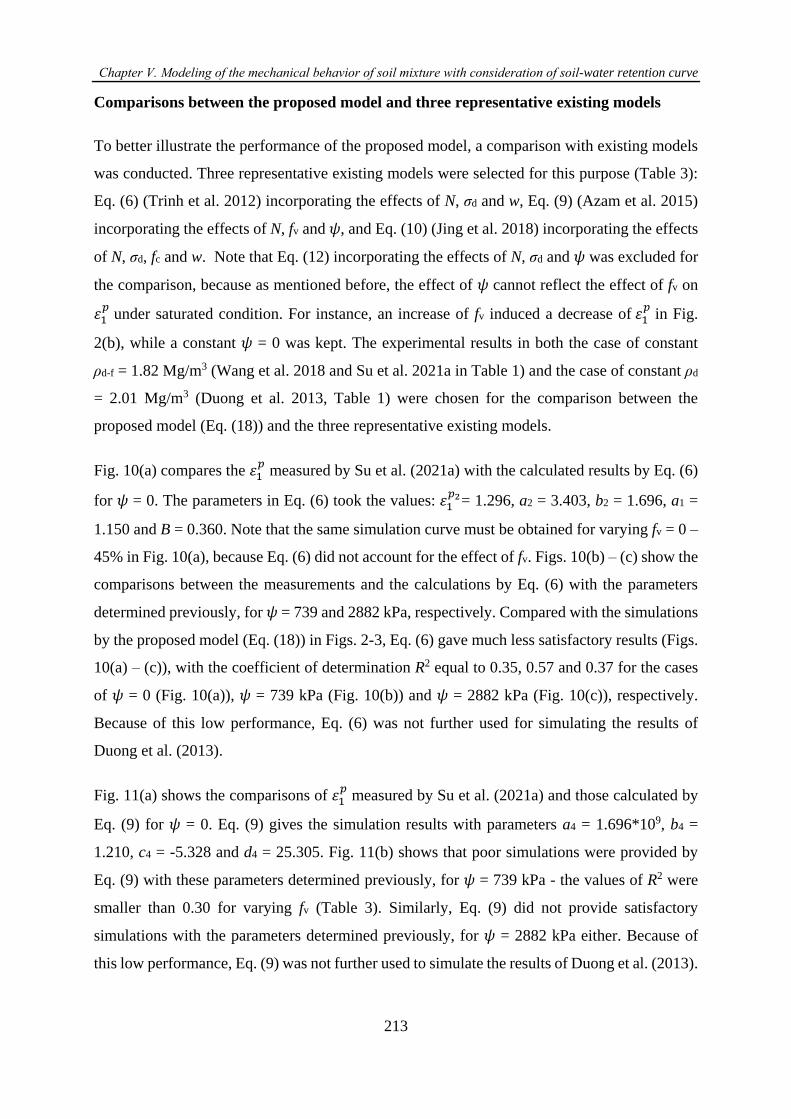
Chapter Ⅴ. Modeling of the mechanical behavior of soil mixture with consideration of soil-water retention curve
213
Comparisons between the proposed model and three representative existing models
To better illustrate the performance of the proposed model, a comparison with existing models
was conducted. Three representative existing models were selected for this purpose (Table 3):
Eq. (6) (Trinh et al. 2012) incorporating the effects of N, σd and w, Eq. (9) (Azam et al. 2015)
incorporating the effects of N, fv and 𝜓, and Eq. (10) (Jing et al. 2018) incorporating the effects
of N, σd, fc and w. Note that Eq. (12) incorporating the effects of N, σd and 𝜓 was excluded for
the comparison, because as mentioned before, the effect of 𝜓 cannot reflect the effect of fv on
휀1𝑝 under saturated condition. For instance, an increase of fv induced a decrease of 휀1
𝑝 in Fig.
2(b), while a constant 𝜓 = 0 was kept. The experimental results in both the case of constant
ρd-f = 1.82 Mg/m3 (Wang et al. 2018 and Su et al. 2021a in Table 1) and the case of constant ρd
= 2.01 Mg/m3 (Duong et al. 2013, Table 1) were chosen for the comparison between the
proposed model (Eq. (18)) and the three representative existing models.
Fig. 10(a) compares the 휀1𝑝 measured by Su et al. (2021a) with the calculated results by Eq. (6)
for 𝜓 = 0. The parameters in Eq. (6) took the values: 휀1𝑝2= 1.296, a2 = 3.403, b2 = 1.696, a1 =
1.150 and B = 0.360. Note that the same simulation curve must be obtained for varying fv = 0 –
45% in Fig. 10(a), because Eq. (6) did not account for the effect of fv. Figs. 10(b) – (c) show the
comparisons between the measurements and the calculations by Eq. (6) with the parameters
determined previously, for 𝜓 = 739 and 2882 kPa, respectively. Compared with the simulations
by the proposed model (Eq. (18)) in Figs. 2-3, Eq. (6) gave much less satisfactory results (Figs.
10(a) – (c)), with the coefficient of determination R2 equal to 0.35, 0.57 and 0.37 for the cases
of 𝜓 = 0 (Fig. 10(a)), 𝜓 = 739 kPa (Fig. 10(b)) and 𝜓 = 2882 kPa (Fig. 10(c)), respectively.
Because of this low performance, Eq. (6) was not further used for simulating the results of
Duong et al. (2013).
Fig. 11(a) shows the comparisons of 휀1𝑝 measured by Su et al. (2021a) and those calculated by
Eq. (9) for 𝜓 = 0. Eq. (9) gives the simulation results with parameters a4 = 1.696*109, b4 =
1.210, c4 = -5.328 and d4 = 25.305. Fig. 11(b) shows that poor simulations were provided by
Eq. (9) with these parameters determined previously, for 𝜓 = 739 kPa - the values of R2 were
smaller than 0.30 for varying fv (Table 3). Similarly, Eq. (9) did not provide satisfactory
simulations with the parameters determined previously, for 𝜓 = 2882 kPa either. Because of
this low performance, Eq. (9) was not further used to simulate the results of Duong et al. (2013).
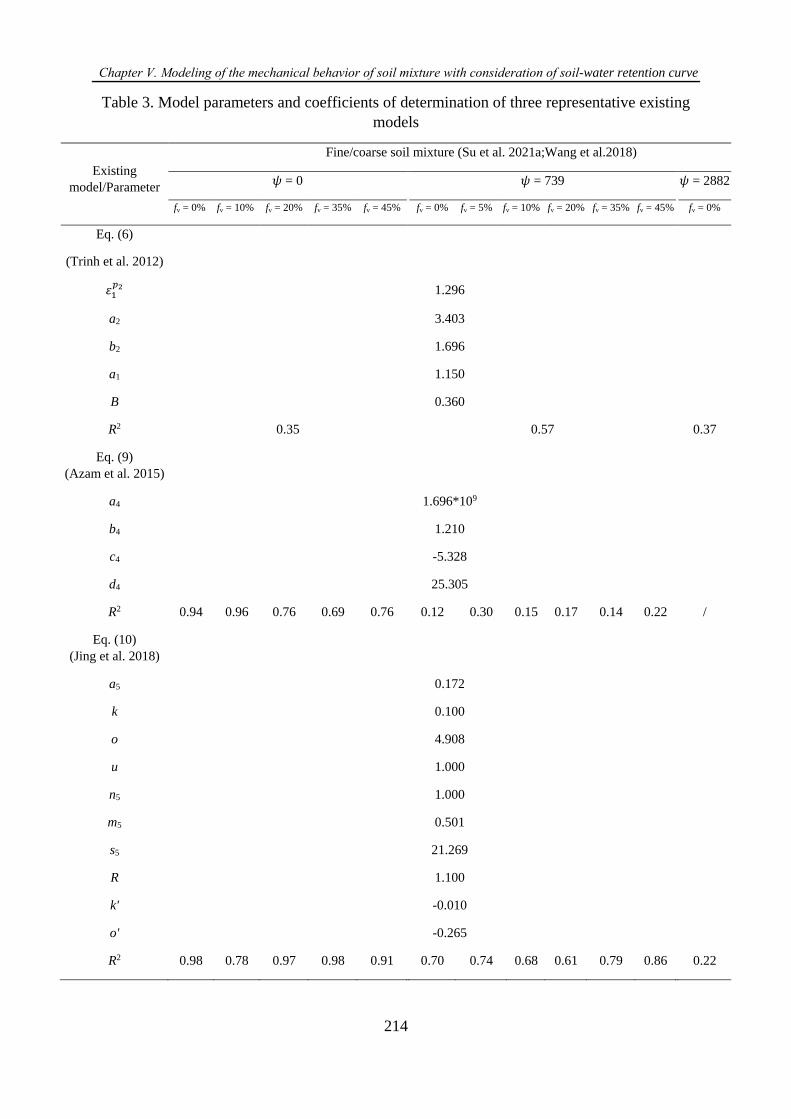
Chapter Ⅴ. Modeling of the mechanical behavior of soil mixture with consideration of soil-water retention curve
214
Table 3. Model parameters and coefficients of determination of three representative existing
models
Existing
model/Parameter
Fine/coarse soil mixture (Su et al. 2021a;Wang et al.2018)
𝜓 = 0 𝜓 = 739 𝜓 = 2882
fv = 0% fv = 10% fv = 20% fv = 35% fv = 45% fv = 0% fv = 5% fv = 10% fv = 20% fv = 35% fv = 45% fv = 0%
Eq. (6)
(Trinh et al. 2012)
휀1𝑝2 1.296
a2 3.403
b2 1.696
a1 1.150
B 0.360
R2 0.35 0.57 0.37
Eq. (9)
(Azam et al. 2015)
a4 1.696*109
b4 1.210
c4 -5.328
d4 25.305
R2 0.94 0.96 0.76 0.69 0.76 0.12 0.30 0.15 0.17 0.14 0.22 /
Eq. (10)
(Jing et al. 2018)
a5 0.172
k 0.100
o 4.908
u 1.000
n5 1.000
m5 0.501
s5 21.269
R 1.100
k' -0.010
o' -0.265
R2 0.98 0.78 0.97 0.98 0.91 0.70 0.74 0.68 0.61 0.79 0.86 0.22
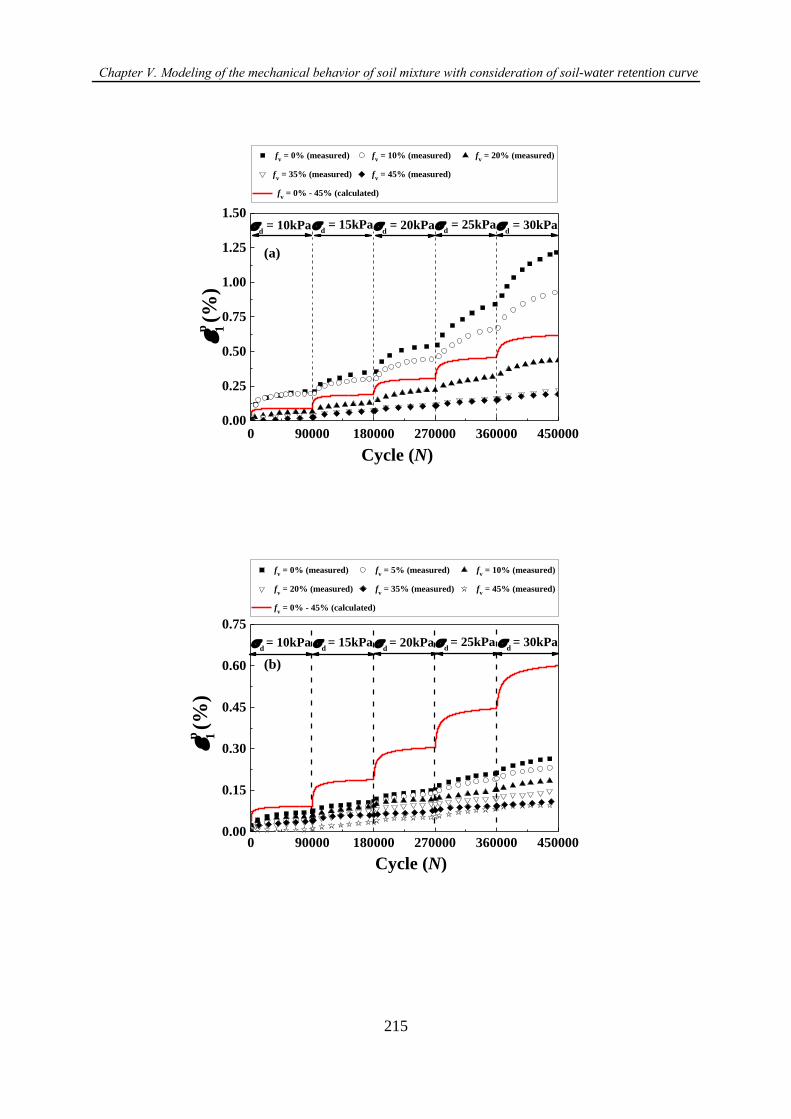
Chapter Ⅴ. Modeling of the mechanical behavior of soil mixture with consideration of soil-water retention curve
215
0 90000 180000 270000 360000 4500000.00
0.25
0.50
0.75
1.00
1.25
1.50
(a)
p 1 (%
)
p
1
d = 30kPa
d = 25kPa
d = 20kPa
d = 15kPa
d = 10kPa
fv = 0% (measured) f
v = 10% (measured) f
v = 20% (measured)
fv = 35% (measured) f
v = 45% (measured)
fv = 0% - 45% (calculated)
Cycle (N)
fv = 0% (measured) f
v = 5% (measured) f
v = 10% (measured)
fv = 20% (measured) f
v = 35% (measured) f
v = 45% (measured)
fv = 0% - 45% (calculated)
0 90000 180000 270000 360000 4500000.00
0.15
0.30
0.45
0.60
0.75
(b)
d = 30kPa
d = 25kPa
d = 20kPa
d = 15kPa
d = 10kPa
p 1 (%
)
Cycle (N)
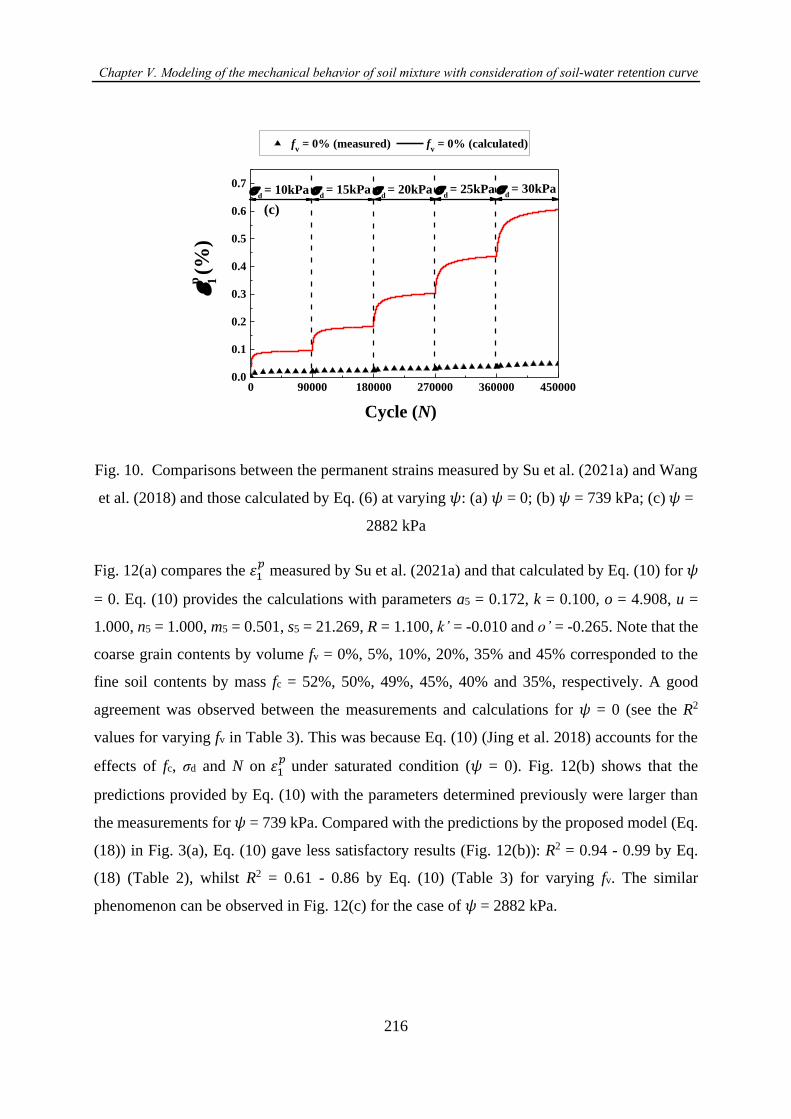
Chapter Ⅴ. Modeling of the mechanical behavior of soil mixture with consideration of soil-water retention curve
216
0 90000 180000 270000 360000 4500000.0
0.1
0.2
0.3
0.4
0.5
0.6
0.7
(c)p 1
(%)
Cycle (N)
d = 30kPa
d = 25kPa
d = 20kPa
d = 15kPa
d = 10kPa
fv = 0% (measured) f
v = 0% (calculated)
Fig. 10. Comparisons between the permanent strains measured by Su et al. (2021a) and Wang
et al. (2018) and those calculated by Eq. (6) at varying 𝜓: (a) 𝜓 = 0; (b) 𝜓 = 739 kPa; (c) 𝜓 =
2882 kPa
Fig. 12(a) compares the 휀1𝑝 measured by Su et al. (2021a) and that calculated by Eq. (10) for 𝜓
= 0. Eq. (10) provides the calculations with parameters a5 = 0.172, k = 0.100, o = 4.908, u =
1.000, n5 = 1.000, m5 = 0.501, s5 = 21.269, R = 1.100, k’ = -0.010 and o’ = -0.265. Note that the
coarse grain contents by volume fv = 0%, 5%, 10%, 20%, 35% and 45% corresponded to the
fine soil contents by mass fc = 52%, 50%, 49%, 45%, 40% and 35%, respectively. A good
agreement was observed between the measurements and calculations for 𝜓 = 0 (see the R2
values for varying fv in Table 3). This was because Eq. (10) (Jing et al. 2018) accounts for the
effects of fc, σd and N on 휀1𝑝
under saturated condition (𝜓 = 0). Fig. 12(b) shows that the
predictions provided by Eq. (10) with the parameters determined previously were larger than
the measurements for 𝜓 = 739 kPa. Compared with the predictions by the proposed model (Eq.
(18)) in Fig. 3(a), Eq. (10) gave less satisfactory results (Fig. 12(b)): R2 = 0.94 - 0.99 by Eq.
(18) (Table 2), whilst R2 = 0.61 - 0.86 by Eq. (10) (Table 3) for varying fv. The similar
phenomenon can be observed in Fig. 12(c) for the case of 𝜓 = 2882 kPa.
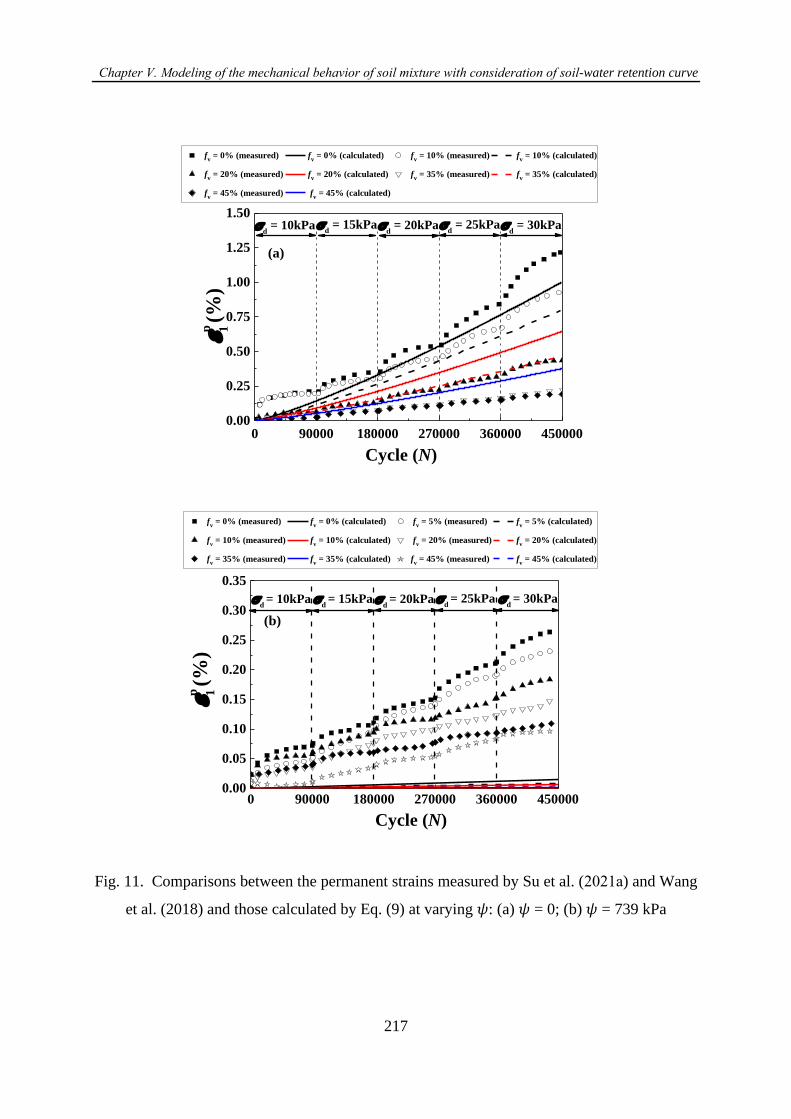
Chapter Ⅴ. Modeling of the mechanical behavior of soil mixture with consideration of soil-water retention curve
217
0 90000 180000 270000 360000 4500000.00
0.25
0.50
0.75
1.00
1.25
1.50
(a)
p 1 (%
)
p
1
d = 30kPa
d = 25kPa
d = 20kPa
d = 15kPa
d = 10kPa
fv = 0% (measured) f
v = 0% (calculated) f
v = 10% (measured) f
v = 10% (calculated)
fv = 20% (measured) f
v = 20% (calculated) f
v = 35% (measured) f
v = 35% (calculated)
fv = 45% (measured) f
v = 45% (calculated)
Cycle (N)
fv = 0% (measured) f
v = 0% (calculated) f
v = 5% (measured) f
v = 5% (calculated)
fv = 10% (measured) f
v = 10% (calculated) f
v = 20% (measured) f
v = 20% (calculated)
fv = 35% (measured) f
v = 35% (calculated) f
v = 45% (measured) f
v = 45% (calculated)
0 90000 180000 270000 360000 4500000.00
0.05
0.10
0.15
0.20
0.25
0.30
0.35
(b)
d = 30kPa
d = 25kPa
d = 20kPa
d = 15kPa
d = 10kPa
p 1 (%
)
Cycle (N)
Fig. 11. Comparisons between the permanent strains measured by Su et al. (2021a) and Wang
et al. (2018) and those calculated by Eq. (9) at varying 𝜓: (a) 𝜓 = 0; (b) 𝜓 = 739 kPa
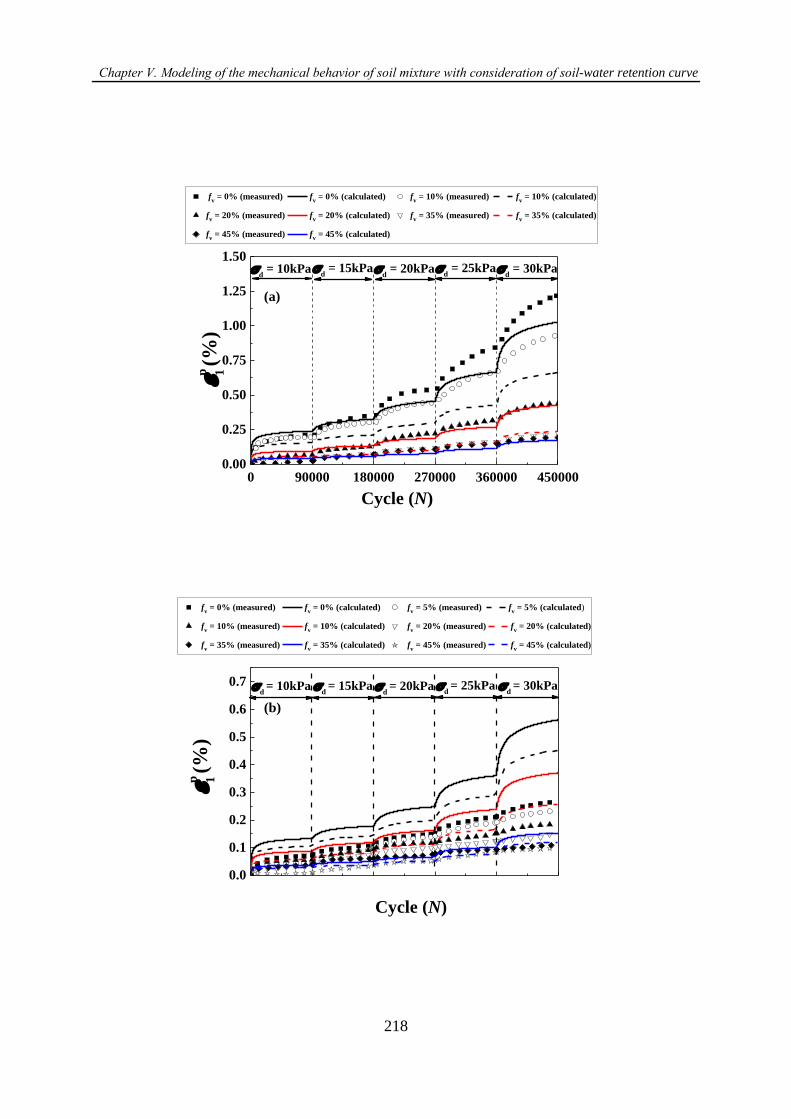
Chapter Ⅴ. Modeling of the mechanical behavior of soil mixture with consideration of soil-water retention curve
218
0 90000 180000 270000 360000 4500000.00
0.25
0.50
0.75
1.00
1.25
1.50
(a)
p 1 (%
)
p
1
d = 30kPa
d = 25kPa
d = 20kPa
d = 15kPa
d = 10kPa
fv = 0% (measured) f
v = 0% (calculated) f
v = 10% (measured) f
v = 10% (calculated)
fv = 20% (measured) f
v = 20% (calculated) f
v = 35% (measured) f
v = 35% (calculated)
fv = 45% (measured) f
v = 45% (calculated)
Cycle (N)
fv = 0% (measured) f
v = 0% (calculated) f
v = 5% (measured) f
v = 5% (calculated)
fv = 10% (measured) f
v = 10% (calculated) f
v = 20% (measured) f
v = 20% (calculated)
fv = 35% (measured) f
v = 35% (calculated) f
v = 45% (measured) f
v = 45% (calculated)
0.0
0.1
0.2
0.3
0.4
0.5
0.6
0.7
(b)
d = 30kPa
d = 25kPa
d = 20kPa
d = 15kPa
d = 10kPa
p 1 (%
)
Cycle (N)
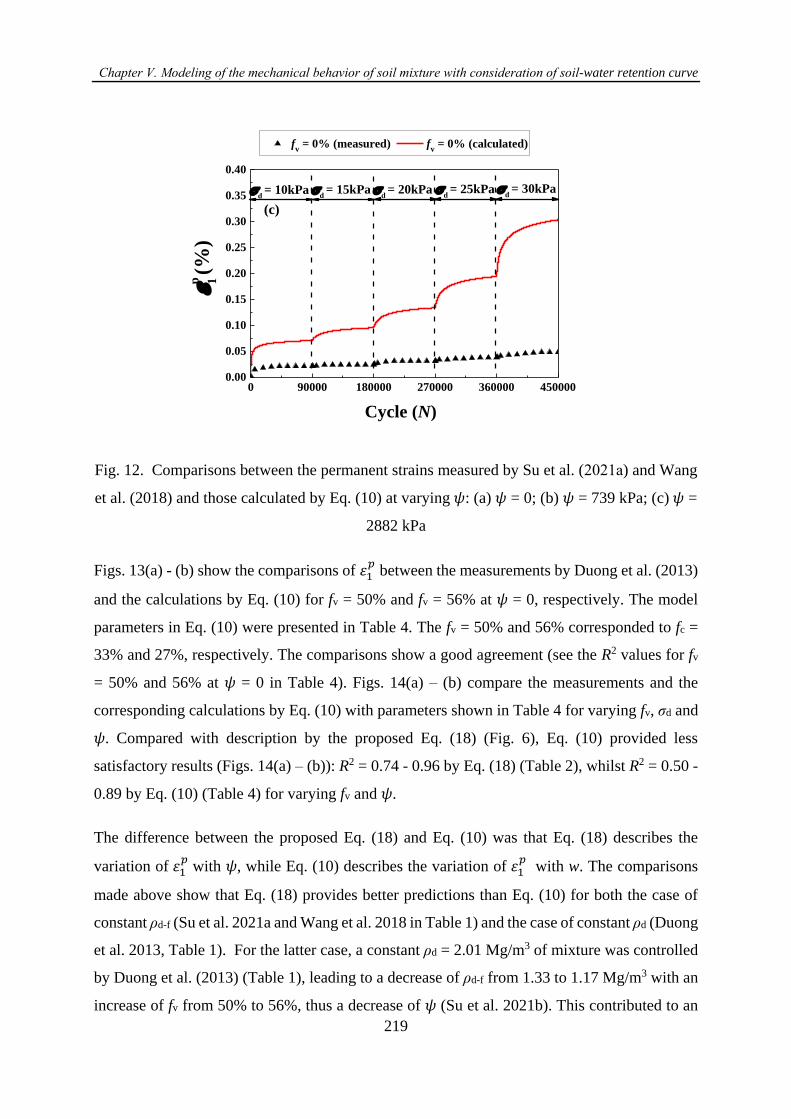
Chapter Ⅴ. Modeling of the mechanical behavior of soil mixture with consideration of soil-water retention curve
219
0 90000 180000 270000 360000 4500000.00
0.05
0.10
0.15
0.20
0.25
0.30
0.35
0.40
(c)p 1
(%)
Cycle (N)
d = 30kPa
d = 25kPa
d = 20kPa
d = 15kPa
d = 10kPa
fv = 0% (measured) f
v = 0% (calculated)
Fig. 12. Comparisons between the permanent strains measured by Su et al. (2021a) and Wang
et al. (2018) and those calculated by Eq. (10) at varying 𝜓: (a) 𝜓 = 0; (b) 𝜓 = 739 kPa; (c) 𝜓 =
2882 kPa
Figs. 13(a) - (b) show the comparisons of 휀1𝑝 between the measurements by Duong et al. (2013)
and the calculations by Eq. (10) for fv = 50% and fv = 56% at 𝜓 = 0, respectively. The model
parameters in Eq. (10) were presented in Table 4. The fv = 50% and 56% corresponded to fc =
33% and 27%, respectively. The comparisons show a good agreement (see the R2 values for fv
= 50% and 56% at 𝜓 = 0 in Table 4). Figs. 14(a) – (b) compare the measurements and the
corresponding calculations by Eq. (10) with parameters shown in Table 4 for varying fv, σd and
𝜓. Compared with description by the proposed Eq. (18) (Fig. 6), Eq. (10) provided less
satisfactory results (Figs. 14(a) – (b)): R2 = 0.74 - 0.96 by Eq. (18) (Table 2), whilst R2 = 0.50 -
0.89 by Eq. (10) (Table 4) for varying fv and 𝜓.
The difference between the proposed Eq. (18) and Eq. (10) was that Eq. (18) describes the
variation of 휀1𝑝 with 𝜓, while Eq. (10) describes the variation of 휀1
𝑝 with w. The comparisons
made above show that Eq. (18) provides better predictions than Eq. (10) for both the case of
constant ρd-f (Su et al. 2021a and Wang et al. 2018 in Table 1) and the case of constant ρd (Duong
et al. 2013, Table 1). For the latter case, a constant ρd = 2.01 Mg/m3 of mixture was controlled
by Duong et al. (2013) (Table 1), leading to a decrease of ρd-f from 1.33 to 1.17 Mg/m3 with an
increase of fv from 50% to 56%, thus a decrease of 𝜓 (Su et al. 2021b). This contributed to an

Chapter Ⅴ. Modeling of the mechanical behavior of soil mixture with consideration of soil-water retention curve
220
increase of 휀1𝑝 under unsaturated condition. For both the cases, the effect of ρd-f on 휀1
𝑝 was rather
reflected by 𝜓 than by w. Thus, a better performance was obtained with the proposed Eq. (18)
as compared to Eq. (10).
0 30000 60000 90000 1200000.0
0.5
1.0
1.5
2.0
2.5
3.0
3.5
(a)
d = 23 kPa
d = 102 kPa
p 1 (%
)
fv50% (measured) f
v50% (calculated)
Cycle (N)
d = 45 kPa
d = 71 kPa
0 30000 60000 900000.0
0.5
1.0
1.5
2.0
2.5
3.0
3.5
(b)
d = 140 kPa
d = 90 kPa
d = 45 kPa
p 1 (%
)
fv56% (measured) f
v56% (calculated)
Cycle (N)
Fig. 13. Comparisons between the permanent strains measured by Duong et al. (2013) and
those calculated by Eq. (10) at 𝜓 = 0
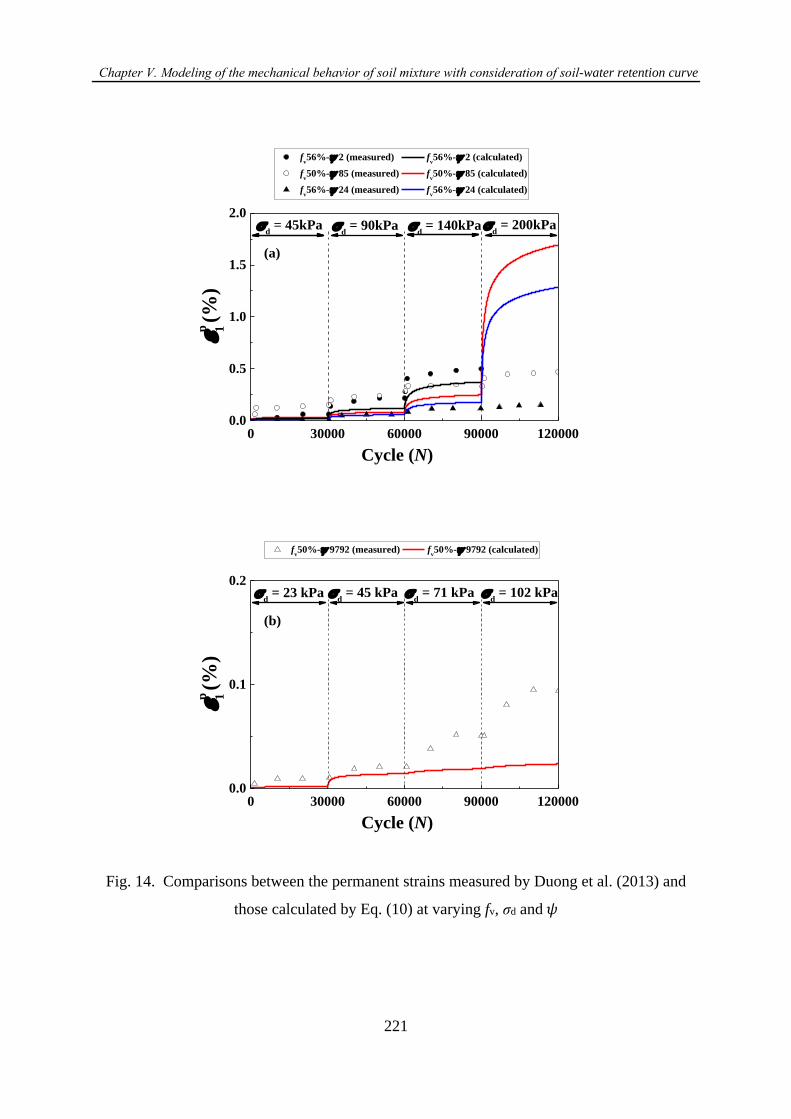
Chapter Ⅴ. Modeling of the mechanical behavior of soil mixture with consideration of soil-water retention curve
221
0 30000 60000 90000 1200000.0
0.5
1.0
1.5
2.0
(a)
d = 200kPa
d = 140kPa
d = 90kPa
p 1 (%
)
p
1
d = 45kPa
fv56%- 2 (measured) f
v56%- 2 (calculated)
fv50%- 85 (measured) f
v50%- 85 (calculated)
fv56%- 24 (measured) f
v56%- 24 (calculated)
Cycle (N)
0 30000 60000 90000 1200000.0
0.1
0.2
(b)
d = 102 kPa
d = 71 kPa
d = 45 kPa
d = 23 kPa
p 1 (%
)
fv50%- 9792 (measured) f
v50%- 9792 (calculated)
Cycle (N)
Fig. 14. Comparisons between the permanent strains measured by Duong et al. (2013) and
those calculated by Eq. (10) at varying fv, σd and 𝜓
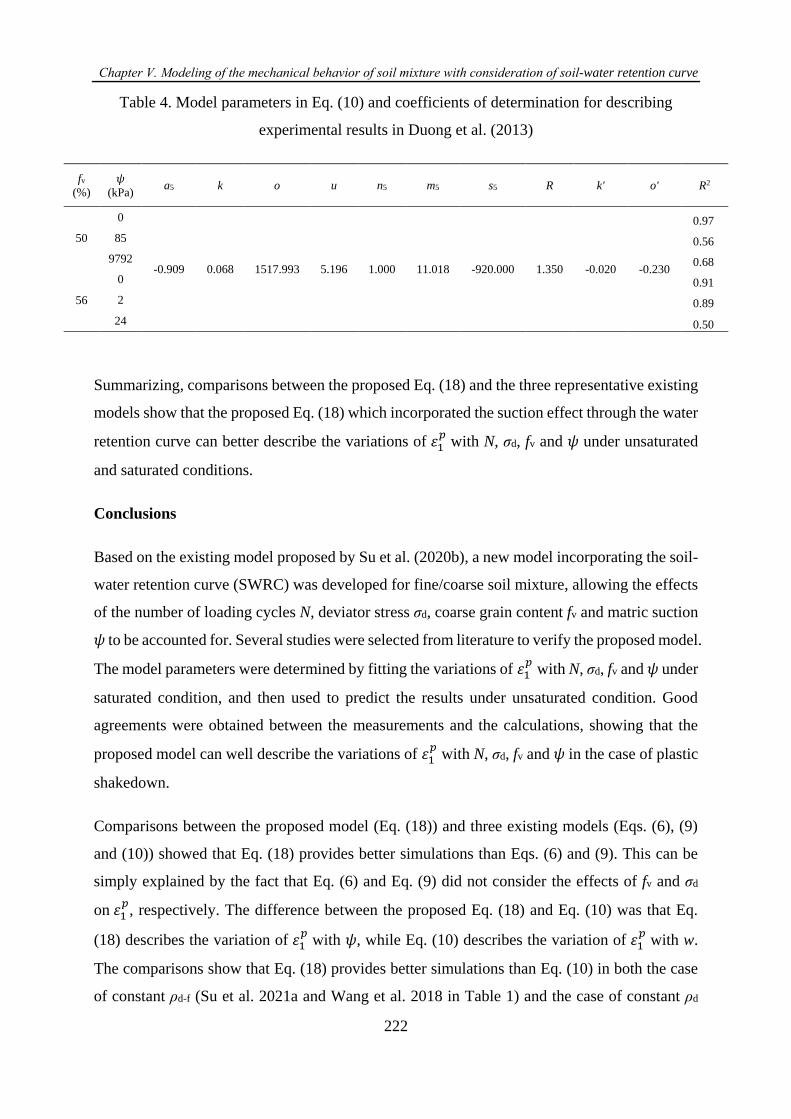
Chapter Ⅴ. Modeling of the mechanical behavior of soil mixture with consideration of soil-water retention curve
222
Table 4. Model parameters in Eq. (10) and coefficients of determination for describing
experimental results in Duong et al. (2013)
fv
(%)
𝜓
(kPa) a5 k o u n5 m5 s5 R k' o' R2
50
0
-0.909 0.068 1517.993 5.196 1.000 11.018 -920.000 1.350 -0.020 -0.230
0.97
85 0.56
9792 0.68
56
0 0.91
2 0.89
24 0.50
Summarizing, comparisons between the proposed Eq. (18) and the three representative existing
models show that the proposed Eq. (18) which incorporated the suction effect through the water
retention curve can better describe the variations of 휀1𝑝 with N, σd, fv and 𝜓 under unsaturated
and saturated conditions.
Conclusions
Based on the existing model proposed by Su et al. (2020b), a new model incorporating the soil-
water retention curve (SWRC) was developed for fine/coarse soil mixture, allowing the effects
of the number of loading cycles N, deviator stress σd, coarse grain content fv and matric suction
𝜓 to be accounted for. Several studies were selected from literature to verify the proposed model.
The model parameters were determined by fitting the variations of 휀1𝑝 with N, σd, fv and 𝜓 under
saturated condition, and then used to predict the results under unsaturated condition. Good
agreements were obtained between the measurements and the calculations, showing that the
proposed model can well describe the variations of 휀1𝑝 with N, σd, fv and 𝜓 in the case of plastic
shakedown.
Comparisons between the proposed model (Eq. (18)) and three existing models (Eqs. (6), (9)
and (10)) showed that Eq. (18) provides better simulations than Eqs. (6) and (9). This can be
simply explained by the fact that Eq. (6) and Eq. (9) did not consider the effects of fv and σd
on 휀1𝑝, respectively. The difference between the proposed Eq. (18) and Eq. (10) was that Eq.
(18) describes the variation of 휀1𝑝 with 𝜓, while Eq. (10) describes the variation of 휀1
𝑝 with w.
The comparisons show that Eq. (18) provides better simulations than Eq. (10) in both the case
of constant ρd-f (Su et al. 2021a and Wang et al. 2018 in Table 1) and the case of constant ρd
Chapter Ⅴ. Modeling of the mechanical behavior of soil mixture with consideration of soil-water retention curve
223
(Duong et al. 2013, Table 1). For the latter case, a constant ρd = 2.01 Mg/m3 of mixture was
controlled by Duong et al. (2013) (Table 1), leading to a decrease of ρd-f from 1.33 to 1.17
Mg/m3 with an increase of fv from 50% to 56%, thus a decrease of 𝜓 (Su et al. 2021b). For both
cases, the effect of ρd-f on 휀1𝑝 was rather reflected by 𝜓 than by w. Thus, a better performance
could be obtained with the proposed Eq. (18) as compared to Eq. (10).
Acknowledgements
This work was supported by the China Scholarship Council (CSC) and Ecole des Ponts
ParisTech.

Chapter Ⅴ. Modeling of the mechanical behavior of soil mixture with consideration of soil-water retention curve
224
References
AFNOR, 1995. NF P98-235-1—Test relating to pavements. Unbound granular materials. Part
1: Repeated Loading Triaxial Test.
Azam, A. M., Cameron, D. A., & Rahman, M. M. 2015. Permanent strain of unsaturated
unbound granular materials from construction and demolition waste. Journal of Materials
in Civil Engineering, 27(3), 04014125.
Barksdale, R. D. 1972. Laboratory evaluation of rutting in base course materials. In Presented
at the Third International Conference on the Structural Design of Asphalt Pavements,
Grosvenor House, Park Lane, London, England, Sept. 11-15, 1972. (Vol. 1, No.
Proceeding).
Chen, W. B., Feng, W. Q., Yin, J. H., Borana, L., & Chen, R. P. 2019. Characterization of
permanent axial strain of granular materials subjected to cyclic loading based on
shakedown theory. Construction and Building Materials, 198, 751-761.
Duong, T. V., Tang, A. M., Cui, Y. J., Trinh, V. N., Dupla, J. C., Calon, N., ... & Robinet, A.
2013. Effects of fines and water contents on the mechanical behavior of interlayer soil in
ancient railway sub-structure. Soils and foundations, 53(6), 868-878.
Duong, T. V., Cui, Y. J., Tang, A. M., Dupla, J. C., & Calon, N. 2014. Effect of fine particles
on the hydraulic behavior of interlayer soil in railway substructure. Canadian geotechnical
journal, 51(7), 735-746..
Gidel, G., Hornych, P., Breysse, D., & Denis, A. 2001. A new approach for investigating the
permanent deformation behaviour of unbound granular material using the repeated loading
triaxial apparatus. Bulletin des laboratoires des Ponts et Chaussées, (233).
Gabr, A. R., & Cameron, D. A. 2013. Permanent strain modeling of recycled concrete aggregate
for unbound pavement construction. Journal of materials in civil engineering, 25(10), 1394-
1402.
Hornych, P. 1993. Étude des déformations permanentes sous chargements répétés de trois
graves non traitées. Bulletin de liaison des Laboratoires des Ponts et Chaussées, (184).
Jing, P. 2017. Experimental study and modelling of the elastoplastic behaviour of unbound
granular materials under large number of cyclic loadings at various initial hydric states
(Doctoral dissertation, Université de Strasbourg).
Jing, P., Nowamooz, H., & Chazallon, C. 2018. Permanent deformation behaviour of a granular
material used in low-traffic pavements. Road Materials and Pavement Design, 19(2), 289-
314.
Li, D., & Selig, E. T. 1996. Cumulative plastic deformation for fine-grained subgrade soils.
Journal of geotechnical engineering, 122(12), 1006-1013.
Lekarp, F., & Dawson, A. 1998. Modelling permanent deformation behaviour of unbound
granular materials. Construction and building materials, 12(1), 9-18.
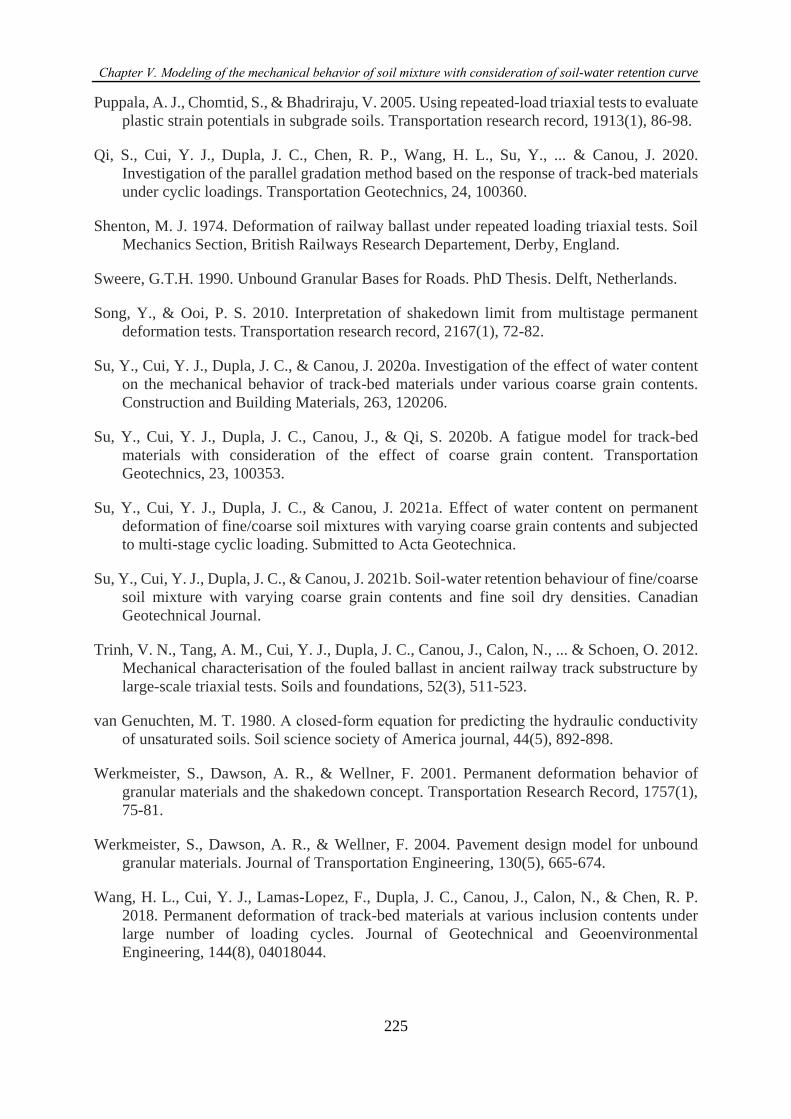
Chapter Ⅴ. Modeling of the mechanical behavior of soil mixture with consideration of soil-water retention curve
225
Puppala, A. J., Chomtid, S., & Bhadriraju, V. 2005. Using repeated-load triaxial tests to evaluate
plastic strain potentials in subgrade soils. Transportation research record, 1913(1), 86-98.
Qi, S., Cui, Y. J., Dupla, J. C., Chen, R. P., Wang, H. L., Su, Y., ... & Canou, J. 2020.
Investigation of the parallel gradation method based on the response of track-bed materials
under cyclic loadings. Transportation Geotechnics, 24, 100360.
Shenton, M. J. 1974. Deformation of railway ballast under repeated loading triaxial tests. Soil
Mechanics Section, British Railways Research Departement, Derby, England.
Sweere, G.T.H. 1990. Unbound Granular Bases for Roads. PhD Thesis. Delft, Netherlands.
Song, Y., & Ooi, P. S. 2010. Interpretation of shakedown limit from multistage permanent
deformation tests. Transportation research record, 2167(1), 72-82.
Su, Y., Cui, Y. J., Dupla, J. C., & Canou, J. 2020a. Investigation of the effect of water content
on the mechanical behavior of track-bed materials under various coarse grain contents.
Construction and Building Materials, 263, 120206.
Su, Y., Cui, Y. J., Dupla, J. C., Canou, J., & Qi, S. 2020b. A fatigue model for track-bed
materials with consideration of the effect of coarse grain content. Transportation
Geotechnics, 23, 100353.
Su, Y., Cui, Y. J., Dupla, J. C., & Canou, J. 2021a. Effect of water content on permanent
deformation of fine/coarse soil mixtures with varying coarse grain contents and subjected
to multi-stage cyclic loading. Submitted to Acta Geotechnica.
Su, Y., Cui, Y. J., Dupla, J. C., & Canou, J. 2021b. Soil-water retention behaviour of fine/coarse
soil mixture with varying coarse grain contents and fine soil dry densities. Canadian
Geotechnical Journal.
Trinh, V. N., Tang, A. M., Cui, Y. J., Dupla, J. C., Canou, J., Calon, N., ... & Schoen, O. 2012.
Mechanical characterisation of the fouled ballast in ancient railway track substructure by
large-scale triaxial tests. Soils and foundations, 52(3), 511-523.
van Genuchten, M. T. 1980. A closed‐form equation for predicting the hydraulic conductivity
of unsaturated soils. Soil science society of America journal, 44(5), 892-898.
Werkmeister, S., Dawson, A. R., & Wellner, F. 2001. Permanent deformation behavior of
granular materials and the shakedown concept. Transportation Research Record, 1757(1),
75-81.
Werkmeister, S., Dawson, A. R., & Wellner, F. 2004. Pavement design model for unbound
granular materials. Journal of Transportation Engineering, 130(5), 665-674.
Wang, H. L., Cui, Y. J., Lamas-Lopez, F., Dupla, J. C., Canou, J., Calon, N., & Chen, R. P.
2018. Permanent deformation of track-bed materials at various inclusion contents under
large number of loading cycles. Journal of Geotechnical and Geoenvironmental
Engineering, 144(8), 04018044.
Chapter Ⅴ. Modeling of the mechanical behavior of soil mixture with consideration of soil-water retention curve
226
Su, Y., Cui, Y. J., Dupla, J. C., & Canou, J. 2021. Submitted to Acta Geotechnica.
Modelling the suction- and deviator stress-dependent resilient modulus of
unsaturated fine/coarse soil mixture by considering soil-water retention
curve
Yu Su, Yu-Jun Cui, Jean-Claude Dupla, Jean Canou1
Abstract: Experimental observations have shown that the resilient modulus Mr of fine/coarse
soil mixture can be significantly affected by the coarse grain content fv, deviator stress σd and
matric suction 𝜓. In this study, a constitutive model incorporating the soil-water retention curve
(SWRC) was proposed to describe the effects of 𝜓 and 𝜎d on Mr. This model was then extended
to the effect of fv. The proposed model implied the resilient modulus at saturation condition (Mr-
sat), the resilient modulus at optimum moisture content (OMC) condition (Mr-opt), the suction at
OMC (𝜓opt) and the parameters related to SWRC. The model was validated using experimental
data from five studies reported in literature. Comparisons with three representative existing
models showed that the proposed model was capable to well describe the suction-dependent
effect of deviator stress in the full range of suction, while the existing models gave satisfactory
simulation results only in the low suction range. Indeed, experimental studies revealed that there
was a threshold matric suction 𝜓th, and with increasing 𝜎d, the Mr decreased when 𝜓 < 𝜓th,
but increased when 𝜓 > 𝜓th. When 𝜓 < 𝜓th, all models gave good simulations. On the contrary,
when 𝜓 > 𝜓th, only the proposed model gave good simulations, in particular when 𝜓th > 𝜓opt.
This showed the performance of the proposed model in describing the variation of resilient
modulus of unsaturated fine/coarse soil mixtures with changes in coarse grain content, deviator
stress and matric suction.
Keywords: resilient modulus; constitutive model; matric suction; deviator stress; coarse grain
content; soil-water retention curve
Introduction
An interlayer soil was naturally created in the French conventional rail tracks, corresponding to
a mixture of ballast grains and subgrade fine soil. The in-situ investigation showed a decrease
of ballast grain content over the depth of interlayer soil (Trinh 2011). The resilient modulus Mr,
defined as the ratio of cyclic deviator stress to resilient strain, was adopted to characterize the
stiffness of interlayer soil (Nie et al. 2020). Wang et al. (2017, 2018a, 2018b) and Qi et al.
(2020a) studied the effects of coarse grain content fv (the ratio of the volume of micro-ballast
grains to that of mixture) and deviator stress σd on Mr of interlayer soil by cyclic triaxial tests
under constant matric suction 𝜓. Figs. 1(a)-(b) show the grain size distribution curves of fine
Ecole des Ponts ParisTech, Laboratoire Navier/CERMES, 6 – 8 av. Blaise Pascal, Cité Descartes, Champs-sur-
Marne, 77455 Marne – la – Vallée cedex 2, France
Chapter Ⅴ. Modeling of the mechanical behavior of soil mixture with consideration of soil-water retention curve
227
soil and micro-ballast, among which the micro-ballast was fabricated by a mixture of three
coarse grains G 4-10, HN 2-4 and G 10-20 (see more details in Wang et al. 2017). The effect of
𝜓 on the Mr of interlayer soil was further investigated by Su et al. (2021a) through multi-stage
deviator stresses cyclic tests. Those experimental results indicated that the Mr of such
fine/coarse soil mixture was significantly affected by coarse grain content fv, matric suction 𝜓
and deviator stress σd. From a practical point of view, it appears important to develop a
constitutive model of Mr for the fine/coarse soil mixture, taking the combined effects of fv, 𝜓
and σd into consideration.
The effects of fv, 𝜓 and σd on Mr were addressed in numerous experimental studies and different
models were proposed for that. Wang et al. (2017) and Cui et al. (2018) studied the effect of fv
on the Mr of fine/coarse soil mixture, and defined a characteristic coarse grain content fv-cha
separating two fabric kinds for the mixtures: a fine matrix macrostructure at fv ≤ fv-cha, and a
coarse grain skeleton fabric at fv ≥ fv-cha. They found that Mr increased slowly with increasing fv
at fv ≤ fv-cha, while quickly at fv ≥ fv-cha. No constitutive model has been developed for describing
this phenomenon.
The effects of 𝜓 and σd on Mr were generally investigated by multi-stage loadings cyclic triaxial
tests (Gupta et al. 2007; Nowamooz et al. 2011). Gu et al. (2020) performed a series of large-
scale cyclic triaxial tests on unbound granular materials, and found that the increase in both 𝜓
and σd led to an increase of Mr. Ng et al. (2013) studied the effects of 𝜓 and σd on the Mr of
unsaturated subgrade soil by suction-controlled cyclic triaxial tests. The results showed that in
a narrow range of 𝜓 from 0 to 250 kPa, an increase of 𝜓 induced an increase of Mr, and an
increase of σd led to a reduction of Mr at a constant 𝜓. Yang et al. (2008) performed suction-
controlled tests on residual mudstone soil with various deviator stresses σd. They reported that
with increasing σd, the Mr decreased at low matric suctions (𝜓 = 50 and 150 kPa), while
increased at a high matric suction (𝜓 = 450 kPa). Similarly, Su et al. (2021a) studied the effect
of w on the Mr of fine/coarse soil mixture through multi-stage loadings cyclic triaxial tests. They
found that an increase of w led to a decrease of Mr of soil mixture, due to the effect of 𝜓.
Moreover, in the case of low 𝜓 (smaller than or equal to 𝜓opt at optimum moisture content
OMC), the increase of σd resulted in a decrease of Mr, while in the case of high 𝜓 (larger than
𝜓opt), an opposite trend was observed. Han and Vanapalli (2015) investigated the effect of 𝜓 on
the Mr of unsaturated subgrade soil, and proposed a constitutive model incorporating the soil-
water retention curve (SWRC). Oh et al. (2009) and Han and Vanapalli (2016a, 2016b) also

Chapter Ⅴ. Modeling of the mechanical behavior of soil mixture with consideration of soil-water retention curve
228
consider SWRC while modeling the effect of 𝜓 on Mr. To date, there are no models for the
description of Mr variation with changes in 𝜓 and σd for unsaturated fine/coarse soil mixtures.
In this study, a constitutive model of Mr was proposed for unsaturated fine/coarse soil mixtures,
accounting for the effects of 𝜓, σd, and fv. Experimental data collected from literature including
the authors’ own data were used to validate the model. Comparisons between the proposed
model and three representative existing models showed that the proposed model is capable to
well describe the variations of Mr with changes in σd and fv in the full range of 𝜓.
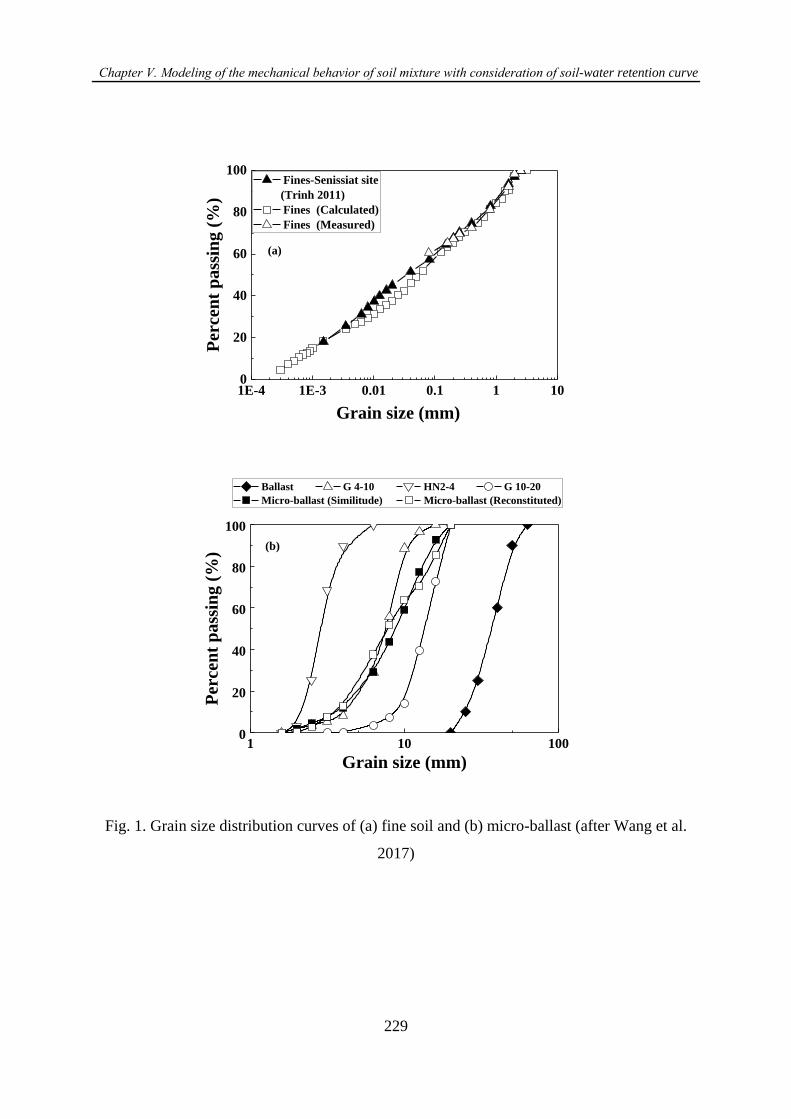
Chapter Ⅴ. Modeling of the mechanical behavior of soil mixture with consideration of soil-water retention curve
229
1E-4 1E-3 0.01 0.1 1 100
20
40
60
80
100 Fines-Senissiat site
(Trinh 2011)
Fines (Calculated)
Fines (Measured)P
erce
nt
pa
ssin
g (
%)
Grain size (mm)
(a)
1 10 1000
20
40
60
80
100
Ballast G 4-10 HN2-4 G 10-20
Micro-ballast (Similitude) Micro-ballast (Reconstituted)
Per
cen
t p
ass
ing
(%
)
Grain size (mm)
(b)
Fig. 1. Grain size distribution curves of (a) fine soil and (b) micro-ballast (after Wang et al.
2017)
Chapter Ⅴ. Modeling of the mechanical behavior of soil mixture with consideration of soil-water retention curve
230
Modelling background
Some investigators proposed empirical models to simulate the Mr - 𝜓 relationship. For instance,
Sawangsuriya et al. (2009) studied the effect of 𝜓 on Mr with four compacted subgrade soils,
and proposed Eqs. (1) - (2) by considering two reference Mr values at saturation condition and
OMC condition- Mr-sat and Mr-opt, respectively:
𝑀r/𝑀r−sat = −5.61 + 4.54log (𝜓) (1)
𝑀r/𝑀r−opt = −0.24 + 0.25log (𝜓) (2)
Ba et al. (2013) proposed Eq. (3) to estimate the variations of Mr of four compacted granular
materials with respect to 𝜓 using a resilient modulus ratio of Mr to the Mr-opt:
𝑀r/𝑀r−opt = 0.385 + 0.267log (𝜓) (3)
These empirical models were simple and their parameters could be easily determined by
regression analysis. However, since they were generally derived from limited experimental data,
it appears difficult to be generalized to other materials.
The Mechanistic-Empirical Pavement Design Guide (MEPDG) (ARA, Inc., ERES Consultants
Division. 2004) recommended the commonly used Eq. (4) to describe the variation of Mr with
stress:
𝑀r = 𝑘1𝑝a (𝜃b
𝑝a)
𝑘2
(𝜏oct
𝑝a+ 1)𝑘3 (4)
where 𝜃b is the bulk stress, equal to the sum of the three principal stresses σ1, σ2 and σ3; 𝜏oct is
the octahedral shear stress, equal to √2/3(𝜎1 − 𝜎3) in triaxial condition; 𝑝a is the atmospheric
pressure; k1 , k2 and k3 are model parameters.
Liang et al. (2008) studied the effects of stress state and matric suction on the Mr of cohesive
soil. They proposed Eq. (5) by incorporating 𝜓 into the bulk stress of Eq. (4) using the Bishop’s
effective stress parameter 𝜒:
𝑀r = 𝑘4𝑝a (𝜃b+𝜒𝜓
𝑝a)
𝑘5
(𝜏oct
𝑝a+ 1)𝑘6 (5)
where k4, k5 and k6 are model parameters.
Chapter Ⅴ. Modeling of the mechanical behavior of soil mixture with consideration of soil-water retention curve
231
Similarly, Heath et al. (2004) investigated the Mr of unsaturated granular materials, and
developed Eq. (6) by modifying Eq. (4) using the Bishop’s effective stress parameter 𝜒:
𝑀r = 𝑘7𝑝a (𝜃b3
−𝑢a+𝜒𝜓
𝑝a)
𝑘8
(𝜎d
𝑝a)𝑘9 (6)
where k7, k8 and k9 are model parameters; 𝑢a is the pore air pressure.
Gupta et al. (2007) and Khoury et al. (2013) modified Eq. (4) by adding 𝜓 as an independent
term, such as 𝐴𝜓𝐵 in Eqs. (7) and (8) for subgrade soils:
𝑀r = 𝑘10𝑝a (𝜃b−3𝑘11
𝑝a)
𝑘12
(𝜏oct
𝑝a+ 𝑘13)𝑘14 + 𝐴1𝜓𝐵1 (7)
𝑀r = 𝑘15𝑝a (𝜃b
𝑝a)
𝑘16
(𝜏oct
𝑝a+ 𝑘17)𝑘18 + 𝐴2𝜓𝐵2 (8)
where k10–k18, A1, B1, A2 and B2 are model parameters.
The MEPDG (ARA, Inc., ERES Consultants Division. 2004) adopted Eq. (9) to predict the
variation of Mr with respect to the seasonal variation of water content in the field condition:
log (𝑀r
𝑀r−opt) = 𝑎 +
𝑏−𝑎
1+exp[ln−𝑏
𝑎+𝑘m∙(𝑆r−𝑆r−opt)]
(9)
where Sr is the degree of saturation; Mr-opt and Sr-opt are the resilient modulus and the degree of
saturation at OMC, respectively; a and b are the minimum and maximum values of log (Mr/Mr-
opt), respectively; km is a regression parameter. For fine-grained soil, a = -0.5934, b = 0.4 and
km = 6.1324; for coarse-grained soil, a = -0.3123, b = 0.3 and km = 6.8157.
Han and Vanapalli (2015) proposed Eq. (10) for compacted subgrade fine soils, incorporating
SWRC:
𝑀r−𝑀r−sat
𝑀r−opt−𝑀r−sat=
𝜓
𝜓opt(
𝑆r
𝑆r−opt)𝜉 (10)
where 𝜉 is the model parameter.
Summarizing, Table 1 presents a summary of model parameters for Eqs. (1) - (10).
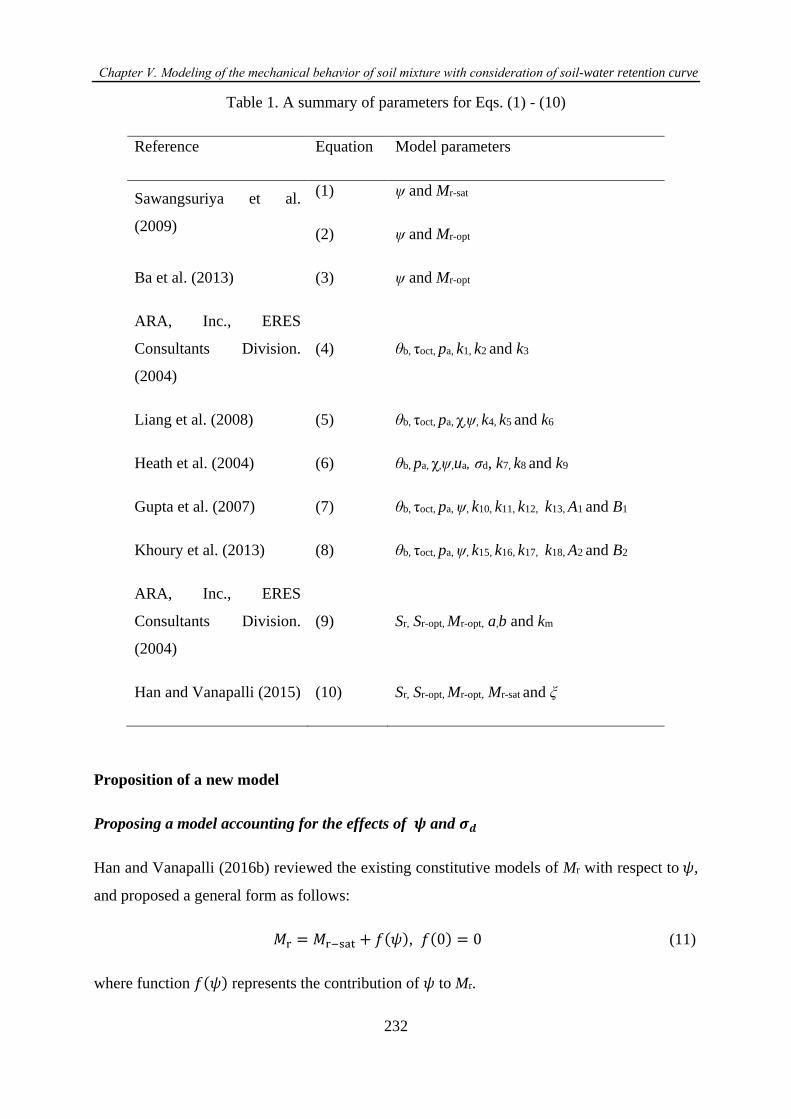
Chapter Ⅴ. Modeling of the mechanical behavior of soil mixture with consideration of soil-water retention curve
232
Table 1. A summary of parameters for Eqs. (1) - (10)
Reference Equation Model parameters
Sawangsuriya et al.
(2009)
(1) ψ and Mr-sat
(2) ψ and Mr-opt
Ba et al. (2013) (3) ψ and Mr-opt
ARA, Inc., ERES
Consultants Division.
(2004)
(4) θb, τoct, pa, k1, k2 and k3
Liang et al. (2008) (5) θb, τoct, pa, χ,ψ, k4, k5 and k6
Heath et al. (2004) (6) θb, pa, χ,ψ,ua, σd, k7, k8 and k9
Gupta et al. (2007) (7) θb, τoct, pa, ψ, k10, k11, k12, k13, A1 and B1
Khoury et al. (2013) (8) θb, τoct, pa, ψ, k15, k16, k17, k18, A2 and B2
ARA, Inc., ERES
Consultants Division.
(2004)
(9) Sr, Sr-opt, Mr-opt, a,b and km
Han and Vanapalli (2015) (10) Sr, Sr-opt, Mr-opt, Mr-sat and ξ
Proposition of a new model
Proposing a model accounting for the effects of 𝝍 and 𝝈𝒅
Han and Vanapalli (2016b) reviewed the existing constitutive models of Mr with respect to 𝜓,
and proposed a general form as follows:
𝑀r = 𝑀r−sat + 𝑓(𝜓), 𝑓(0) = 0 (11)
where function 𝑓(𝜓) represents the contribution of 𝜓 to Mr.
Chapter Ⅴ. Modeling of the mechanical behavior of soil mixture with consideration of soil-water retention curve
233
Referring to the existing models (e.g. Eq. (5) in Liang et al. 2008 and Eq. (6) in Heath et al.
2004), a factor 𝜒𝜓 was adopted to reflect the effect of 𝜓 on the Mr of unsaturated soils. As stated
by Han and Vanapalli (2016a), using factor 𝜒𝜓 induced a change of the role of suction 𝜓 from
a pore-scale stress to a macroscopic stress which contributed to the constitutive stress and hence
the Mr of unsaturated soils. In this study, factor 𝜒𝜓 was modified by considering (i) a power
relationship of Mr - 𝜓 in Eqs. (7) - (8) (Gupta et al. 2007 and Khoury et al. 2013) and (ii) a
parameter 𝜒 equal to the effective degree of saturation 𝑆re, which was defined as the ratio of
(𝑆r − 𝑆r−r) to (1 − 𝑆r−r), where Sr-r is the residual degree of saturation (Alonso et al. 2010; Lu
et al. 2010). Therefore, a new factor 𝜓𝐵𝑆re was generated and Eq. (12) was obtained:
𝑀r = 𝑀r−sat + 𝐴 ∙ 𝜓𝐵 ∙ 𝑆re (12)
where A and B are model parameters.
Substituting Mr-opt and the corresponding 𝜓opt and 𝑆r−opte
(the effective degree of saturation at
OMC) into Eq. (12) yields Eq. (13):
𝑀r−opt = 𝑀r−sat + 𝐴 ∙ 𝜓opt𝐵 ∙ 𝑆r−opt
e (13)
Dividing Eq. (12) by Eq. (13) leads to the normalized Eq. (14) where parameter A vanishes:
𝑀r−𝑀r−sat
𝑀r−opt−𝑀r−sat= (
𝜓
𝜓opt)𝐵 ∙
𝑆re
𝑆r−opte (14)
Eq. (15) (Moossazadeh and Witczak 1981) was commonly used to characterize the effect of σd
on Mr. Based on Eq. (15), Eq. (16) was proposed for relating σd to parameter B in Eq. (14):
𝑀r = 𝑘19(𝜎d
𝑝a)𝑘20 (15)
𝐵 = 𝑙1 ∙ (𝜎d
𝑝a)𝑙2 (16)
where k19, k20, l1 and l2 are model parameters.
The van Genuchten (1980) model was adopted for describing the SWRC:
𝑆re =
𝑆r−𝑆r−r
1−𝑆r−r= [
1
1+(𝑎𝜓)𝑛 ]𝑚
(17)

Chapter Ⅴ. Modeling of the mechanical behavior of soil mixture with consideration of soil-water retention curve
234
where Sr-r is the residual degree of saturation, assumed to be 0 in this study; a, n and m are model
parameters.
Substituting Eqs. (16) and (17) into Eq. (14), Eq. (18) was obtained, which allowed prediction
of the variation of Mr under the combined effects of 𝜓 and σd:
𝑀r−𝑀r−sat
𝑀r−opt−𝑀r−sat= (
𝜓
𝜓opt)
𝑙1∙(𝜎d𝑝a
)𝑙2∙ [
1+(𝑎𝜓opt)𝑛
1+(𝑎𝜓)𝑛 ]𝑚 (18)
Table 2 shows the properties of soils 1 - 5 tested by Wang et al. (2017) and Su et al. (2021a),
with fv varying from 0% to 45%. Fig. 2 shows that the same SWRC was obtained for fv = 0%,
20% and 35% (Su et al. 2021b). This indicated that an increase of fv led to a constant 𝜓 under a
given Sr when keeping the dry density of fine soil constant (ρdmax-f = 1.82 Mg/m3 in Table 2), as
expected by Wang et al. (2017, 2018a, 2018b) and Qi et al. (2020a). Fig. 3 shows the
comparisons between the measurements by Wang et al. (2017) and Su et al. (2021a) and the
calculations by Eq. (18) for the variations of Mr with 𝜓 under different deviator stresses 𝜎d and
five fv values. It can be observed from Fig. 3(a) that Mr increased with the increase of 𝜓 under
a constant 𝜎d, and a reasonably good agreement was obtained between the measurements and
the calculations. Further examination showed that a threshold matric suction 𝜓 th could be
identified, corresponding to the intersection of the curves of different deviators stresses (𝜎d =
50, 100 and 200 kPa). When 𝜓 < 𝜓th, the Mr decreased with increasing 𝜎d, while an opposite
trend was observed when 𝜓 > 𝜓th. In addition, the increase of 𝜎d led to a decrease of model
parameter l1, keeping parameter l2 constant (equal to 1.000). The similar phenomenon was
observed in Figs. 3(b) - (e) for fv = 10% - 45%. It seems that the higher the 𝜓th, the higher the
coefficient of determination R2 for soils 1-5. Overall, a good agreement was obtained between
measurements and calculations, with the R2 ≥ 0.90. Figs. 3(a) - (e) indicate that an increase of
fv from 0% to 45% resulted in an increase of Mr-sat from 11 to 85 MPa.
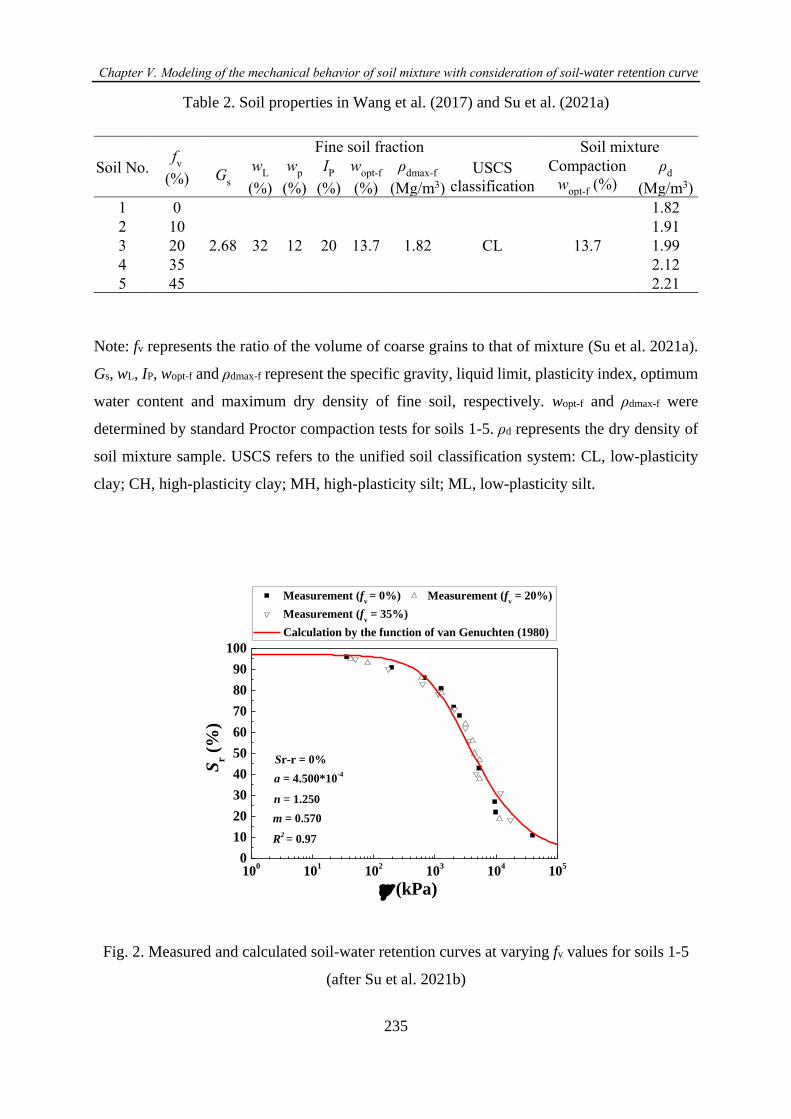
Chapter Ⅴ. Modeling of the mechanical behavior of soil mixture with consideration of soil-water retention curve
235
Table 2. Soil properties in Wang et al. (2017) and Su et al. (2021a)
Soil No. fv
(%)
Fine soil fraction Soil mixture
Gs
wL
(%)
wp
(%)
IP
(%)
wopt-f
(%)
ρdmax-f
(Mg/m3)
USCS
classification Compaction
wopt-f
(%)
ρd
(Mg/m3)
1 0
2.68 32 12 20 13.7 1.82 CL 13.7
1.82
2 10 1.91
3 20 1.99
4 35 2.12
5 45 2.21
Note: fv represents the ratio of the volume of coarse grains to that of mixture (Su et al. 2021a).
Gs, wL, IP, wopt-f and ρdmax-f represent the specific gravity, liquid limit, plasticity index, optimum
water content and maximum dry density of fine soil, respectively. wopt-f and ρdmax-f were
determined by standard Proctor compaction tests for soils 1-5. ρd represents the dry density of
soil mixture sample. USCS refers to the unified soil classification system: CL, low-plasticity
clay; CH, high-plasticity clay; MH, high-plasticity silt; ML, low-plasticity silt.
100
101
102
103
104
105
0
10
20
30
40
50
60
70
80
90
100
Sr-r = 0%
Measurement (fv = 0%) Measurement (f
v = 20%)
Measurement (fv = 35%)
Calculation by the function of van Genuchten (1980)
Sr (
%)
(kPa)
R2 = 0.97
m = 0.570
n = 1.250
a = 4.500*10-4
Fig. 2. Measured and calculated soil-water retention curves at varying fv values for soils 1-5
(after Su et al. 2021b)
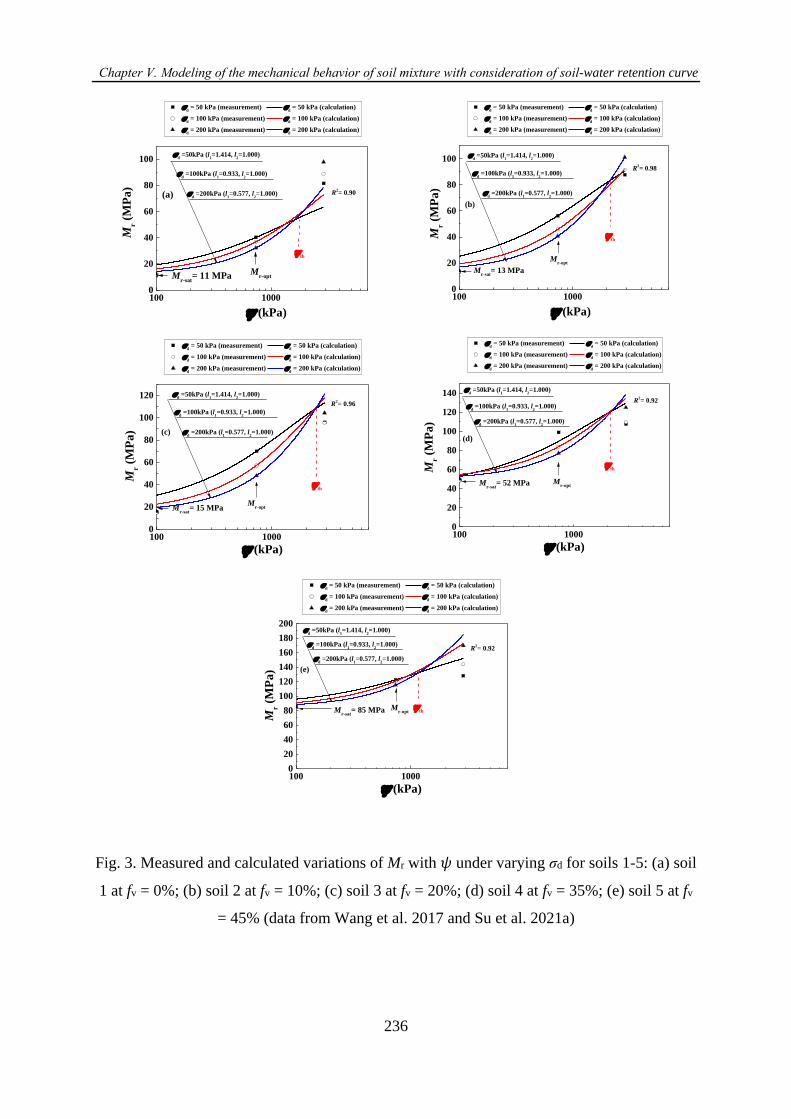
Chapter Ⅴ. Modeling of the mechanical behavior of soil mixture with consideration of soil-water retention curve
236
100 10000
20
40
60
80
100
th
Mr
(MP
a)
(kPa)
(a)
d = 50 kPa (measurement)
d = 50 kPa (calculation)
d = 100 kPa (measurement)
d = 100 kPa (calculation)
d = 200 kPa (measurement)
d = 200 kPa (calculation)
Mr-sat
= 11 MPa
d =100kPa (l
1=0.933, l
2=1.000)
d =50kPa (l
1=1.414, l
2=1.000)
d =200kPa (l
1=0.577, l
2=1.000) R
2= 0.90
Mr-opt
100 10000
20
40
60
80
100
(b)
d = 50 kPa (measurement)
d = 50 kPa (calculation)
d = 100 kPa (measurement)
d = 100 kPa (calculation)
d = 200 kPa (measurement)
d = 200 kPa (calculation)
Mr (
MP
a)
(kPa)
Mr-sat
= 13 MPa
R2= 0.98
Mr-opt
d =100kPa (l
1=0.933, l
2=1.000)
d =50kPa (l
1=1.414, l
2=1.000)
d =200kPa (l
1=0.577, l
2=1.000)
th
100 10000
20
40
60
80
100
120
(c)
d = 50 kPa (measurement)
d = 50 kPa (calculation)
d = 100 kPa (measurement)
d = 100 kPa (calculation)
d = 200 kPa (measurement)
d = 200 kPa (calculation)
(kPa)
Mr
(MP
a)
Mr-sat
= 15 MPa
R2= 0.96
Mr-opt
d =100kPa (l
1=0.933, l
2=1.000)
d =50kPa (l
1=1.414, l
2=1.000)
d =200kPa (l
1=0.577, l
2=1.000)
th
100 10000
20
40
60
80
100
120
140
(d)
d = 50 kPa (measurement)
d = 50 kPa (calculation)
d = 100 kPa (measurement)
d = 100 kPa (calculation)
d = 200 kPa (measurement)
d = 200 kPa (calculation)
Mr
(MP
a)
(kPa)
Mr-sat
= 52 MPa
R2= 0.92
Mr-opt
th
d =100kPa (l
1=0.933, l
2=1.000)
d =50kPa (l
1=1.414, l
2=1.000)
d =200kPa (l
1=0.577, l
2=1.000)
100 10000
20
40
60
80
100
120
140
160
180
200
(e)
d = 50 kPa (measurement)
d = 50 kPa (calculation)
d = 100 kPa (measurement)
d = 100 kPa (calculation)
d = 200 kPa (measurement)
d = 200 kPa (calculation)
(kPa)
Mr (
MP
a)
R2= 0.92
Mr-sat
= 85 MPa Mr-opt
th
d =100kPa (l
1=0.933, l
2=1.000)
d =50kPa (l
1=1.414, l
2=1.000)
d =200kPa (l
1=0.577, l
2=1.000)
Fig. 3. Measured and calculated variations of Mr with 𝜓 under varying σd for soils 1-5: (a) soil
1 at fv = 0%; (b) soil 2 at fv = 10%; (c) soil 3 at fv = 20%; (d) soil 4 at fv = 35%; (e) soil 5 at fv
= 45% (data from Wang et al. 2017 and Su et al. 2021a)

Chapter Ⅴ. Modeling of the mechanical behavior of soil mixture with consideration of soil-water retention curve
237
The Mr - 𝜎d relationship depended on the combined effects of the soil hardening in the loading
process and the rebounding in the unloading process. When 𝜓 < 𝜓th, a matrix structure of fine
soil was expected due to the effect of water hydration (Su et al. 2021c). On the contrary, the
high 𝜓 induced an aggregated fine soil microstructure (Cui and Delage 1996; Ng et al. 2017).
Upon loading, an increase of 𝜎d contributed to the compression of fine matrix and the
rearrangement of fine aggregates (Werkmeister et al. 2004). Thus, an increase of Mr is expected
for both fabrics due to the hardening phenomenon. Conversely, in the unloading process, owing
to the rebounding effect, the resilient strain increased, which resulted in a decrease of Mr. For
the fine matrix fabric (𝜓 < 𝜓th), due to its larger deformability, the effect of rebounding on Mr
appeared to be more significant than the effect of hardening, leading to a decrease of Mr with
increasing 𝜎d. By contrast, for the aggregated fabric (𝜓 > 𝜓th), owing to its lower deformability,
the rebounding effect was not as significant as the hardening effect. In this case, the Mr increased
with increasing 𝜎d. This indicated that 𝜓th could be considered as the threshold value between
the fine matrix fabric (at 𝜓 < 𝜓th) and the fine aggregate fabric (at 𝜓 > 𝜓th). It appeared that 𝜓th
was slightly affected by the coarse grain content fv. At fv = 0% - 20%, a fine matrix
macrostructure was obtained for soils 1 - 3, while at fv = 35% - 45% the coarse grains were
dominant for soils 4 - 5. With increasing fv, the transition of these two fabrics contributed to a
slight decrease of 𝜓th, for that less fine soil was needed to be transferred from the fine matrix
fabric to the fine aggregate fabric.
Fig. 4 shows the variations of Mr with fv under varying 𝜓 and a constant 𝜎d = 200 kPa for soils
1-5. Fig. 5 shows a linear variation of parameter l1 with log (𝜎d/pa), leading to Eq. (19):
𝑙1 = 𝛼1 log (𝜎d
𝑝a) + 𝛽1 (19)
where 𝛼1 and 𝛽1 are model parameters. Eq. (19) allows the determination of the two parameters
(𝛼1 = -1.390, 𝛽1 = 0.967) with a regression coefficient R2 = 0.99.
Substituting Eq. (19) into Eq. (18) yields Eq. (20):
𝑀r−𝑀r−sat
𝑀r−opt−𝑀r−sat= (
𝜓
𝜓opt)
[𝛼1 log(𝜎d𝑝a
)+𝛽1]∙(𝜎d𝑝a
)∙ [
1+(𝑎𝜓opt)𝑛
1+(𝑎𝜓)𝑛 ]𝑚 (20)
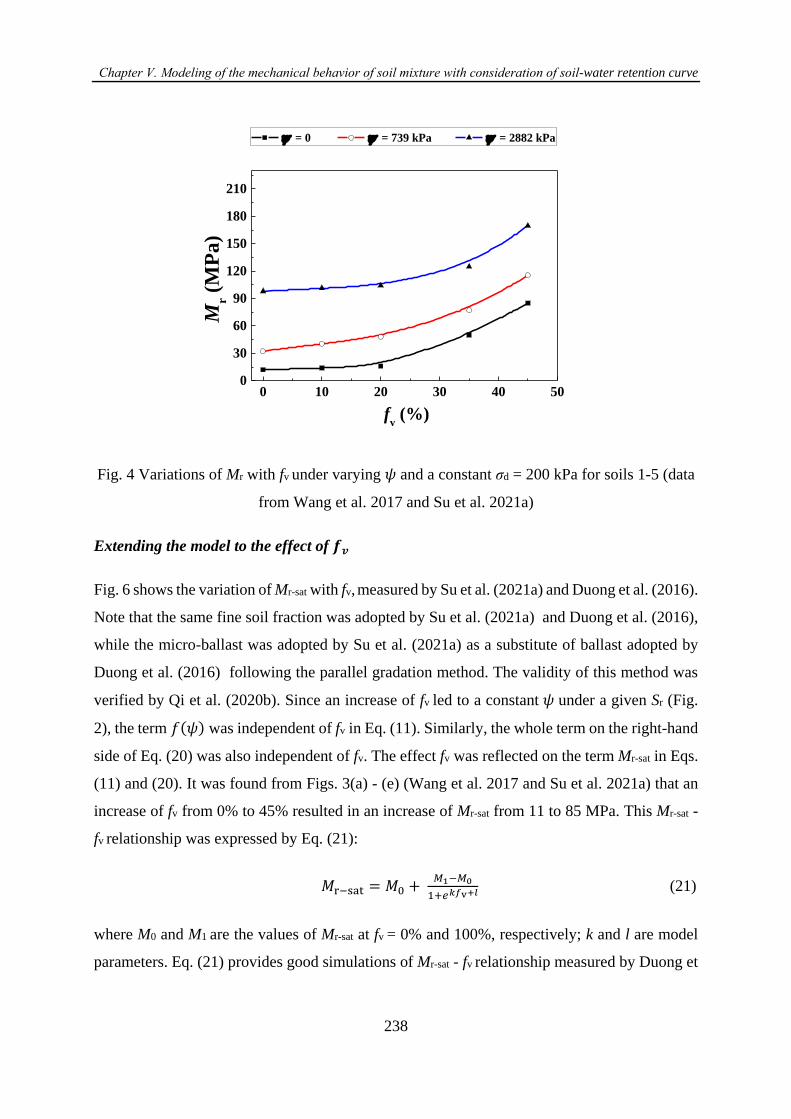
Chapter Ⅴ. Modeling of the mechanical behavior of soil mixture with consideration of soil-water retention curve
238
0 10 20 30 40 500
30
60
90
120
150
180
210
Mr (
MP
a)
= 0 = 739 kPa = 2882 kPa
fv (%)
Fig. 4 Variations of Mr with fv under varying 𝜓 and a constant σd = 200 kPa for soils 1-5 (data
from Wang et al. 2017 and Su et al. 2021a)
Extending the model to the effect of 𝒇𝒗
Fig. 6 shows the variation of Mr-sat with fv, measured by Su et al. (2021a) and Duong et al. (2016).
Note that the same fine soil fraction was adopted by Su et al. (2021a) and Duong et al. (2016),
while the micro-ballast was adopted by Su et al. (2021a) as a substitute of ballast adopted by
Duong et al. (2016) following the parallel gradation method. The validity of this method was
verified by Qi et al. (2020b). Since an increase of fv led to a constant 𝜓 under a given Sr (Fig.
2), the term 𝑓(𝜓) was independent of fv in Eq. (11). Similarly, the whole term on the right-hand
side of Eq. (20) was also independent of fv. The effect fv was reflected on the term Mr-sat in Eqs.
(11) and (20). It was found from Figs. 3(a) - (e) (Wang et al. 2017 and Su et al. 2021a) that an
increase of fv from 0% to 45% resulted in an increase of Mr-sat from 11 to 85 MPa. This Mr-sat -
fv relationship was expressed by Eq. (21):
𝑀r−sat = 𝑀0 + 𝑀1−𝑀0
1+𝑒𝑘𝑓v+𝑙 (21)
where M0 and M1 are the values of Mr-sat at fv = 0% and 100%, respectively; k and l are model
parameters. Eq. (21) provides good simulations of Mr-sat - fv relationship measured by Duong et
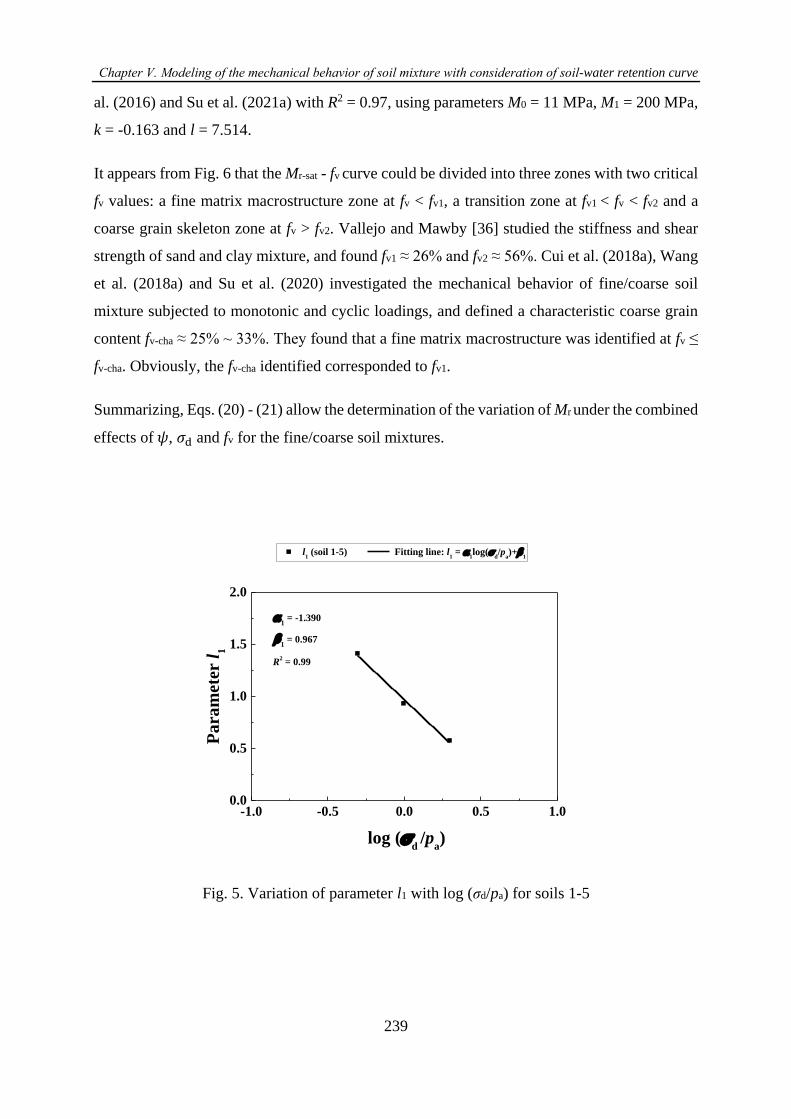
Chapter Ⅴ. Modeling of the mechanical behavior of soil mixture with consideration of soil-water retention curve
239
al. (2016) and Su et al. (2021a) with R2 = 0.97, using parameters M0 = 11 MPa, M1 = 200 MPa,
k = -0.163 and l = 7.514.
It appears from Fig. 6 that the Mr-sat - fv curve could be divided into three zones with two critical
fv values: a fine matrix macrostructure zone at fv < fv1, a transition zone at fv1 < fv < fv2 and a
coarse grain skeleton zone at fv > fv2. Vallejo and Mawby [36] studied the stiffness and shear
strength of sand and clay mixture, and found fv1 ≈ 26% and fv2 ≈ 56%. Cui et al. (2018a), Wang
et al. (2018a) and Su et al. (2020) investigated the mechanical behavior of fine/coarse soil
mixture subjected to monotonic and cyclic loadings, and defined a characteristic coarse grain
content fv-cha ≈ 25% ~ 33%. They found that a fine matrix macrostructure was identified at fv ≤
fv-cha. Obviously, the fv-cha identified corresponded to fv1.
Summarizing, Eqs. (20) - (21) allow the determination of the variation of Mr under the combined
effects of 𝜓, 𝜎d and fv for the fine/coarse soil mixtures.
-1.0 -0.5 0.0 0.5 1.00.0
0.5
1.0
1.5
2.0
l1 (soil 1-5) Fitting line: l
1 =
1log(
d/p
a)+
1
Para
met
er l
1
log (d /p
a)
1 = -1.390
1 = 0.967
R2 = 0.99
Fig. 5. Variation of parameter l1 with log (σd/pa) for soils 1-5
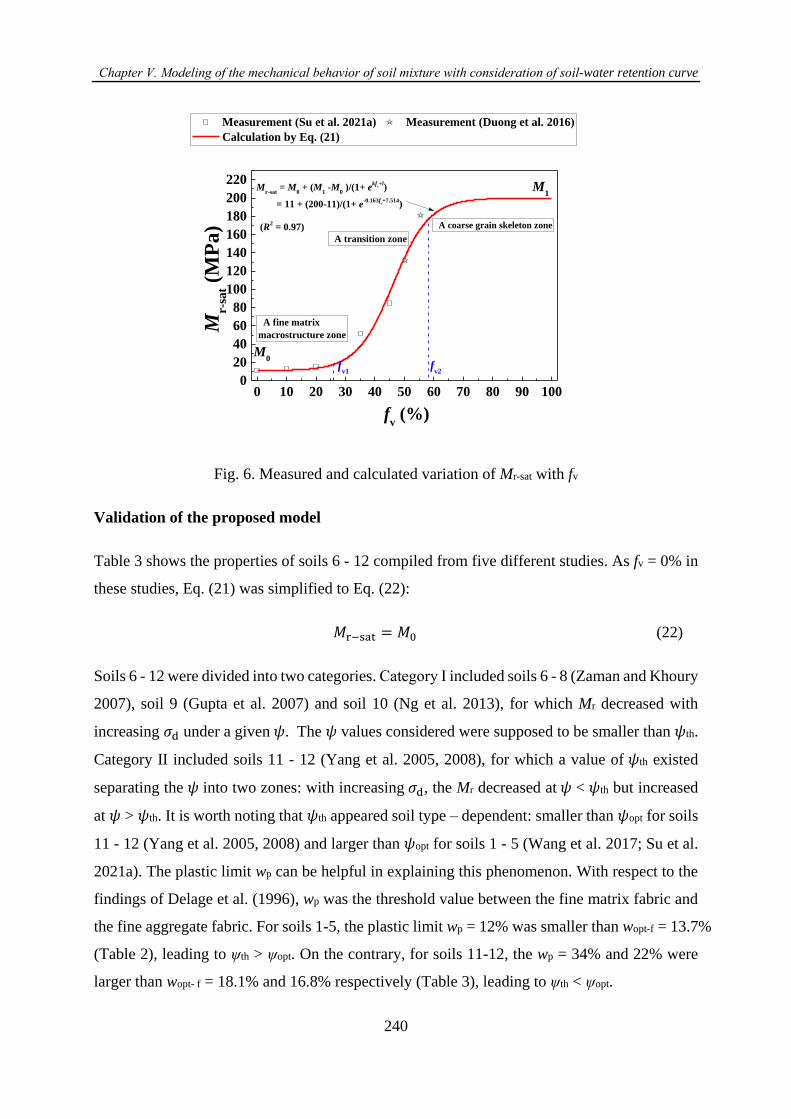
Chapter Ⅴ. Modeling of the mechanical behavior of soil mixture with consideration of soil-water retention curve
240
0 10 20 30 40 50 60 70 80 90 1000
20
40
60
80
100
120
140
160
180
200
220
A coarse grain skeleton zone
A transition zone
M1
M0
fv2
fv1
Mr-s
at (M
Pa)
Measurement (Su et al. 2021a) Measurement (Duong et al. 2016)
Calculation by Eq. (21)
fv (%)
A fine matrix
macrostructure zone
Mr-sat
= M0 + (M
1 -M
0 )/(1+ e
kfv+l
)
= 11 + (200-11)/(1+ e-0.163f
v+7.514
)
(R2 = 0.97)
Fig. 6. Measured and calculated variation of Mr-sat with fv
Validation of the proposed model
Table 3 shows the properties of soils 6 - 12 compiled from five different studies. As fv = 0% in
these studies, Eq. (21) was simplified to Eq. (22):
𝑀r−sat = 𝑀0 (22)
Soils 6 - 12 were divided into two categories. Category Ⅰ included soils 6 - 8 (Zaman and Khoury
2007), soil 9 (Gupta et al. 2007) and soil 10 (Ng et al. 2013), for which Mr decreased with
increasing 𝜎d under a given 𝜓. The 𝜓 values considered were supposed to be smaller than 𝜓th.
Category Ⅱ included soils 11 - 12 (Yang et al. 2005, 2008), for which a value of 𝜓th existed
separating the 𝜓 into two zones: with increasing 𝜎d, the Mr decreased at 𝜓 < 𝜓th but increased
at 𝜓 > 𝜓th. It is worth noting that 𝜓th appeared soil type – dependent: smaller than 𝜓opt for soils
11 - 12 (Yang et al. 2005, 2008) and larger than 𝜓opt for soils 1 - 5 (Wang et al. 2017; Su et al.
2021a). The plastic limit wp can be helpful in explaining this phenomenon. With respect to the
findings of Delage et al. (1996), wp was the threshold value between the fine matrix fabric and
the fine aggregate fabric. For soils 1-5, the plastic limit wp = 12% was smaller than wopt-f = 13.7%
(Table 2), leading to ψth > ψopt. On the contrary, for soils 11-12, the wp = 34% and 22% were
larger than wopt- f = 18.1% and 16.8% respectively (Table 3), leading to ψth < ψopt.
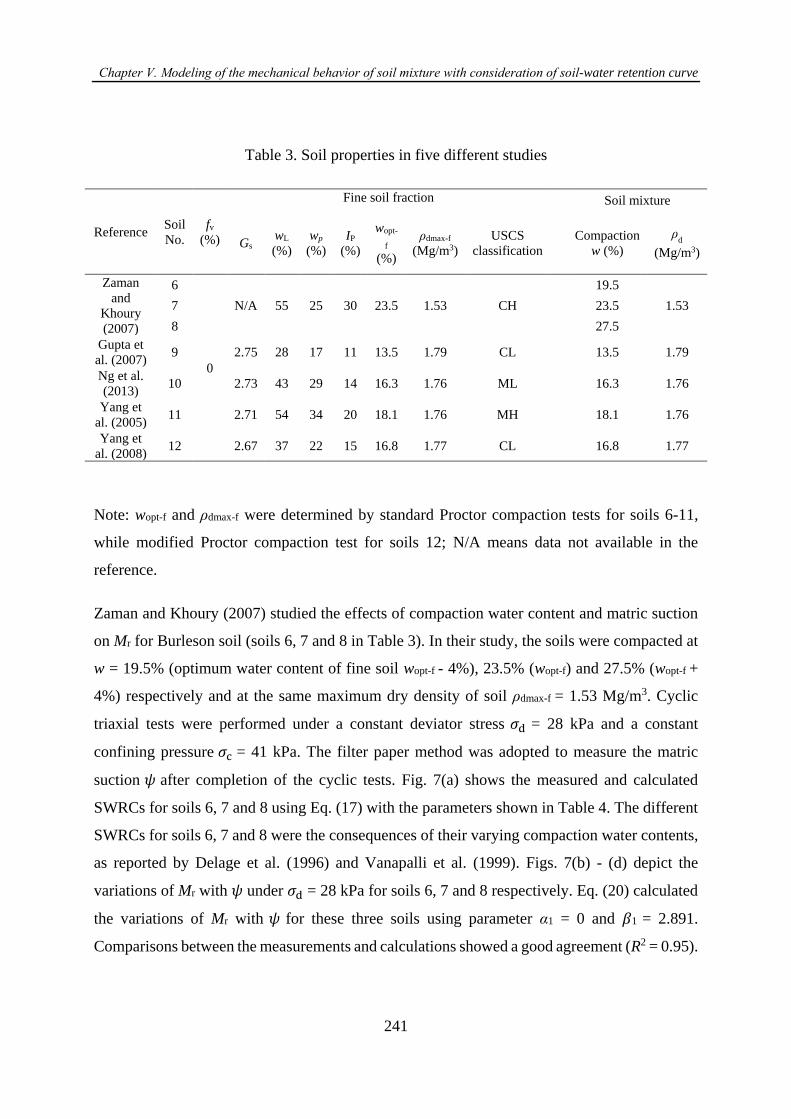
Chapter Ⅴ. Modeling of the mechanical behavior of soil mixture with consideration of soil-water retention curve
241
Table 3. Soil properties in five different studies
Reference Soil
No.
fv
(%)
Fine soil fraction Soil mixture
Gs wL
(%)
wp
(%)
IP
(%)
wopt-
f
(%)
ρdmax-f
(Mg/m3)
USCS
classification
Compaction
w (%)
ρd
(Mg/m3)
Zaman
and
Khoury
(2007)
6
0
N/A 55 25 30 23.5 1.53 CH
19.5
1.53 7 23.5
8 27.5
Gupta et
al. (2007) 9 2.75 28 17 11 13.5 1.79 CL 13.5 1.79
Ng et al.
(2013) 10 2.73 43 29 14 16.3 1.76 ML 16.3 1.76
Yang et
al. (2005) 11 2.71 54 34 20 18.1 1.76 MH 18.1 1.76
Yang et
al. (2008) 12 2.67 37 22 15 16.8 1.77 CL 16.8 1.77
Note: wopt-f and ρdmax-f were determined by standard Proctor compaction tests for soils 6-11,
while modified Proctor compaction test for soils 12; N/A means data not available in the
reference.
Zaman and Khoury (2007) studied the effects of compaction water content and matric suction
on Mr for Burleson soil (soils 6, 7 and 8 in Table 3). In their study, the soils were compacted at
w = 19.5% (optimum water content of fine soil wopt-f - 4%), 23.5% (wopt-f) and 27.5% (wopt-f +
4%) respectively and at the same maximum dry density of soil ρdmax-f = 1.53 Mg/m3. Cyclic
triaxial tests were performed under a constant deviator stress 𝜎d = 28 kPa and a constant
confining pressure 𝜎c = 41 kPa. The filter paper method was adopted to measure the matric
suction 𝜓 after completion of the cyclic tests. Fig. 7(a) shows the measured and calculated
SWRCs for soils 6, 7 and 8 using Eq. (17) with the parameters shown in Table 4. The different
SWRCs for soils 6, 7 and 8 were the consequences of their varying compaction water contents,
as reported by Delage et al. (1996) and Vanapalli et al. (1999). Figs. 7(b) - (d) depict the
variations of Mr with 𝜓 under 𝜎d = 28 kPa for soils 6, 7 and 8 respectively. Eq. (20) calculated
the variations of Mr with 𝜓 for these three soils using parameter α1 = 0 and 𝛽1 = 2.891.
Comparisons between the measurements and calculations showed a good agreement (R2 = 0.95).
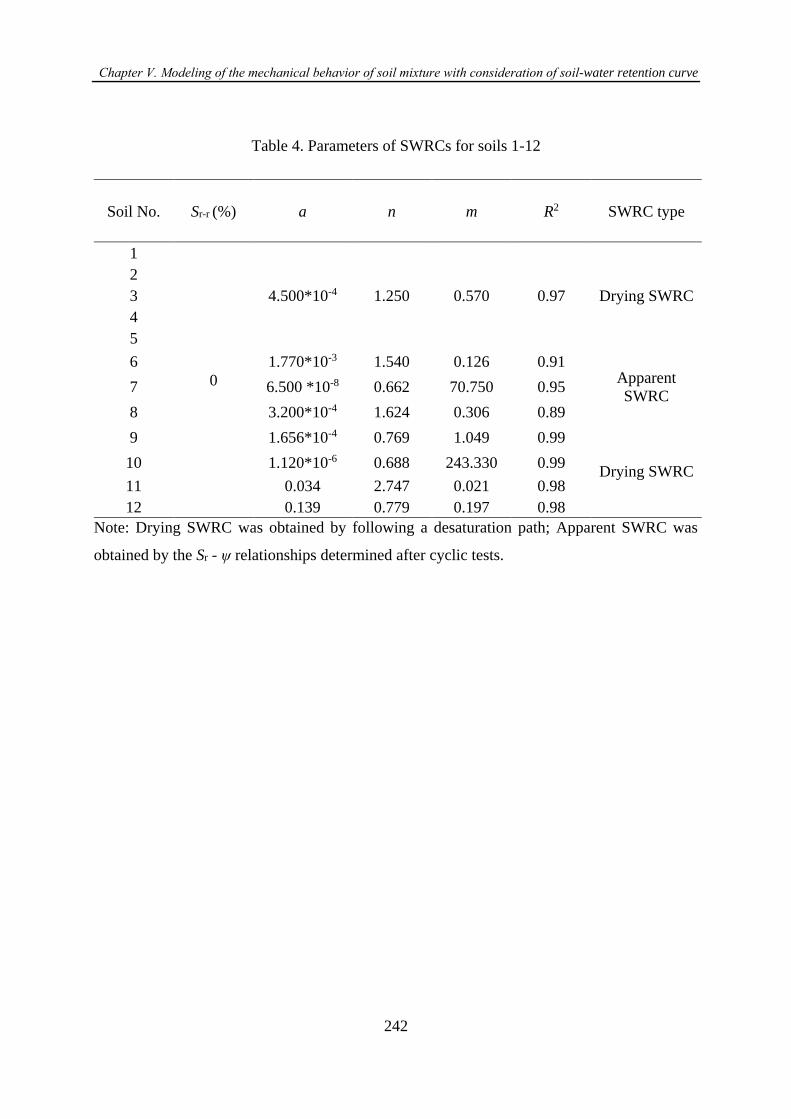
Chapter Ⅴ. Modeling of the mechanical behavior of soil mixture with consideration of soil-water retention curve
242
Table 4. Parameters of SWRCs for soils 1-12
Soil No. Sr-r (%) a n m R2 SWRC type
1
0
4.500*10-4 1.250 0.570 0.97 Drying SWRC
2
3
4
5
6 1.770*10-3 1.540 0.126 0.91 Apparent
SWRC 7 6.500 *10-8 0.662 70.750 0.95
8 3.200*10-4 1.624 0.306 0.89
9 1.656*10-4 0.769 1.049 0.99
Drying SWRC 10 1.120*10-6 0.688 243.330 0.99
11 0.034 2.747 0.021 0.98
12 0.139 0.779 0.197 0.98
Note: Drying SWRC was obtained by following a desaturation path; Apparent SWRC was
obtained by the Sr - ψ relationships determined after cyclic tests.
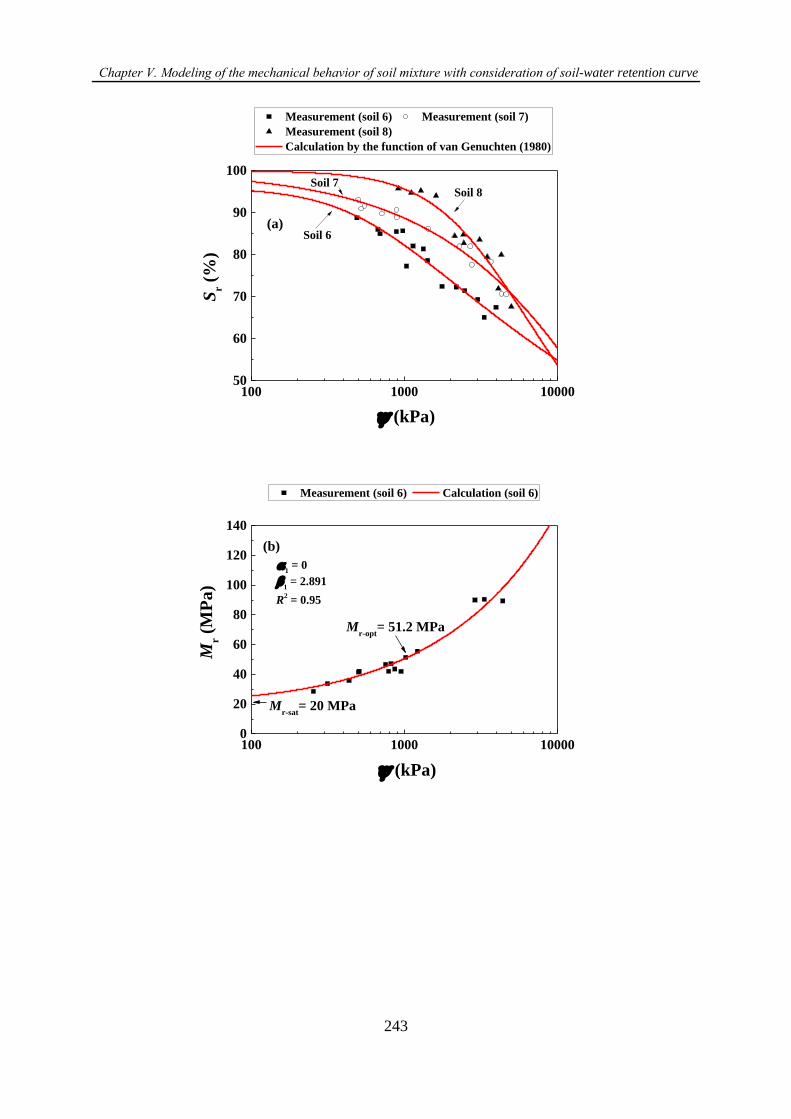
Chapter Ⅴ. Modeling of the mechanical behavior of soil mixture with consideration of soil-water retention curve
243
100 1000 1000050
60
70
80
90
100
(a)
Soil 8Soil 7
Soil 6
Measurement (soil 6) Measurement (soil 7)
Measurement (soil 8)
Calculation by the function of van Genuchten (1980)
(kPa)
Sr (
%)
100 1000 100000
20
40
60
80
100
120
140
(b)
Mr-opt
= 51.2 MPa
Measurement (soil 6) Calculation (soil 6)
(kPa)
Mr
(MP
a)
Mr-sat
= 20 MPa
1 = 2.891
1 = 0
R2 = 0.95
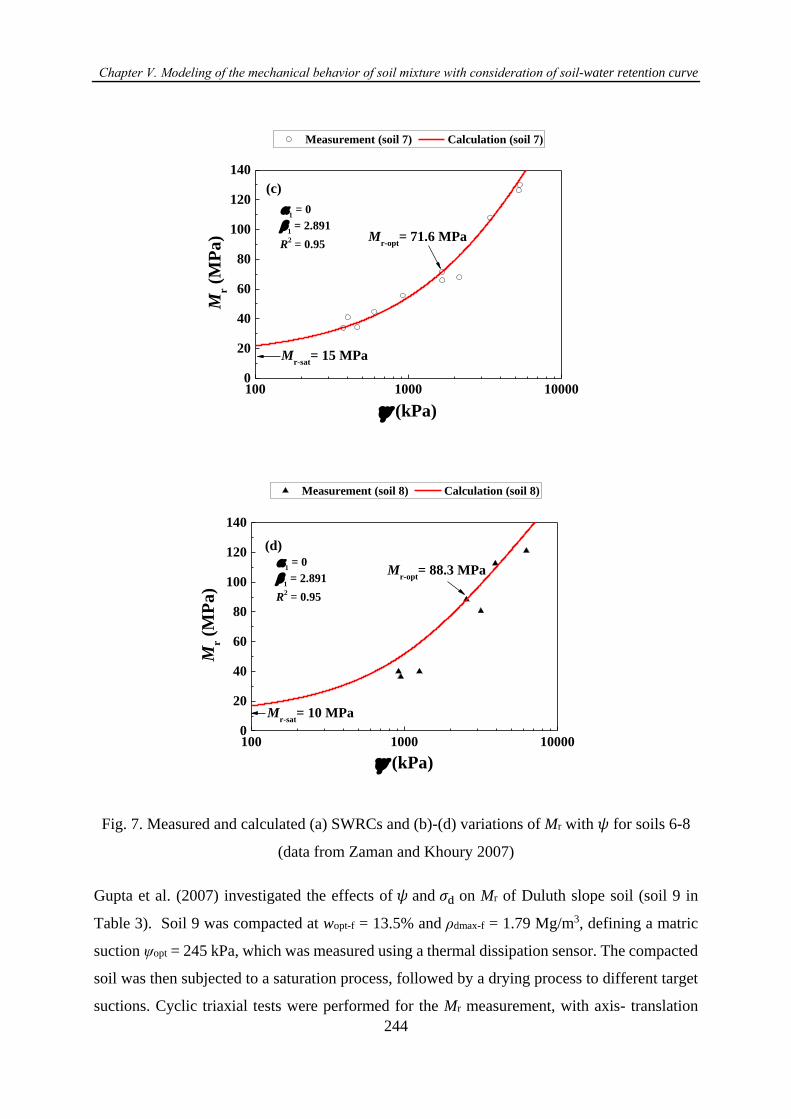
Chapter Ⅴ. Modeling of the mechanical behavior of soil mixture with consideration of soil-water retention curve
244
100 1000 100000
20
40
60
80
100
120
140
(c)
Mr-opt
= 71.6 MPa
Mr-sat
= 15 MPa
Measurement (soil 7) Calculation (soil 7)
Mr
(MP
a)
(kPa)
1 = 2.891
1 = 0
R2 = 0.95
100 1000 100000
20
40
60
80
100
120
140
(d)
Mr-opt
= 88.3 MPa
Measurement (soil 8) Calculation (soil 8)
Mr
(MP
a)
(kPa)
Mr-sat
= 10 MPa
1 = 2.891
1 = 0
R2 = 0.95
Fig. 7. Measured and calculated (a) SWRCs and (b)-(d) variations of Mr with 𝜓 for soils 6-8
(data from Zaman and Khoury 2007)
Gupta et al. (2007) investigated the effects of 𝜓 and 𝜎d on Mr of Duluth slope soil (soil 9 in
Table 3). Soil 9 was compacted at wopt-f = 13.5% and ρdmax-f = 1.79 Mg/m3, defining a matric
suction ψopt = 245 kPa, which was measured using a thermal dissipation sensor. The compacted
soil was then subjected to a saturation process, followed by a drying process to different target
suctions. Cyclic triaxial tests were performed for the Mr measurement, with axis- translation
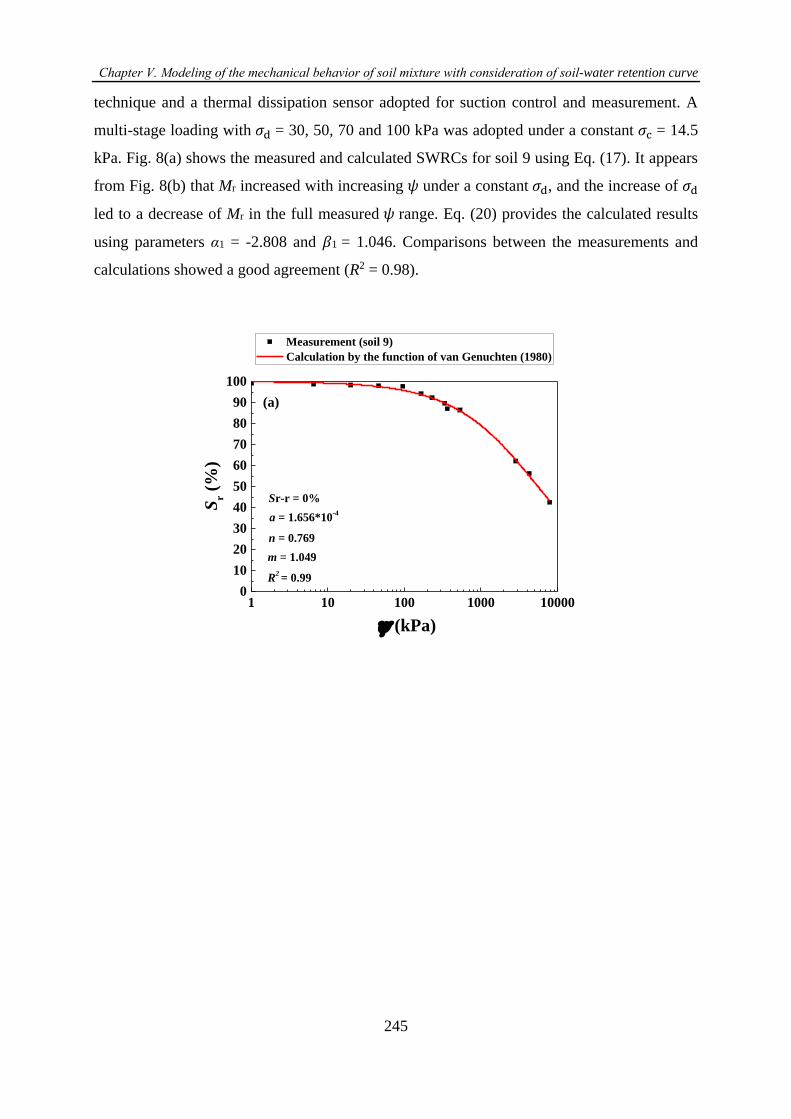
Chapter Ⅴ. Modeling of the mechanical behavior of soil mixture with consideration of soil-water retention curve
245
technique and a thermal dissipation sensor adopted for suction control and measurement. A
multi-stage loading with 𝜎d = 30, 50, 70 and 100 kPa was adopted under a constant 𝜎c = 14.5
kPa. Fig. 8(a) shows the measured and calculated SWRCs for soil 9 using Eq. (17). It appears
from Fig. 8(b) that Mr increased with increasing 𝜓 under a constant 𝜎d, and the increase of 𝜎d
led to a decrease of Mr in the full measured 𝜓 range. Eq. (20) provides the calculated results
using parameters α1 = -2.808 and 𝛽1 = 1.046. Comparisons between the measurements and
calculations showed a good agreement (R2 = 0.98).
1 10 100 1000 100000
10
20
30
40
50
60
70
80
90
100
(a)
Measurement (soil 9)
Calculation by the function of van Genuchten (1980)
Sr (
%)
(kPa)
Sr-r = 0%
R2 = 0.99
m = 1.049
n = 0.769
a = 1.656*10-4
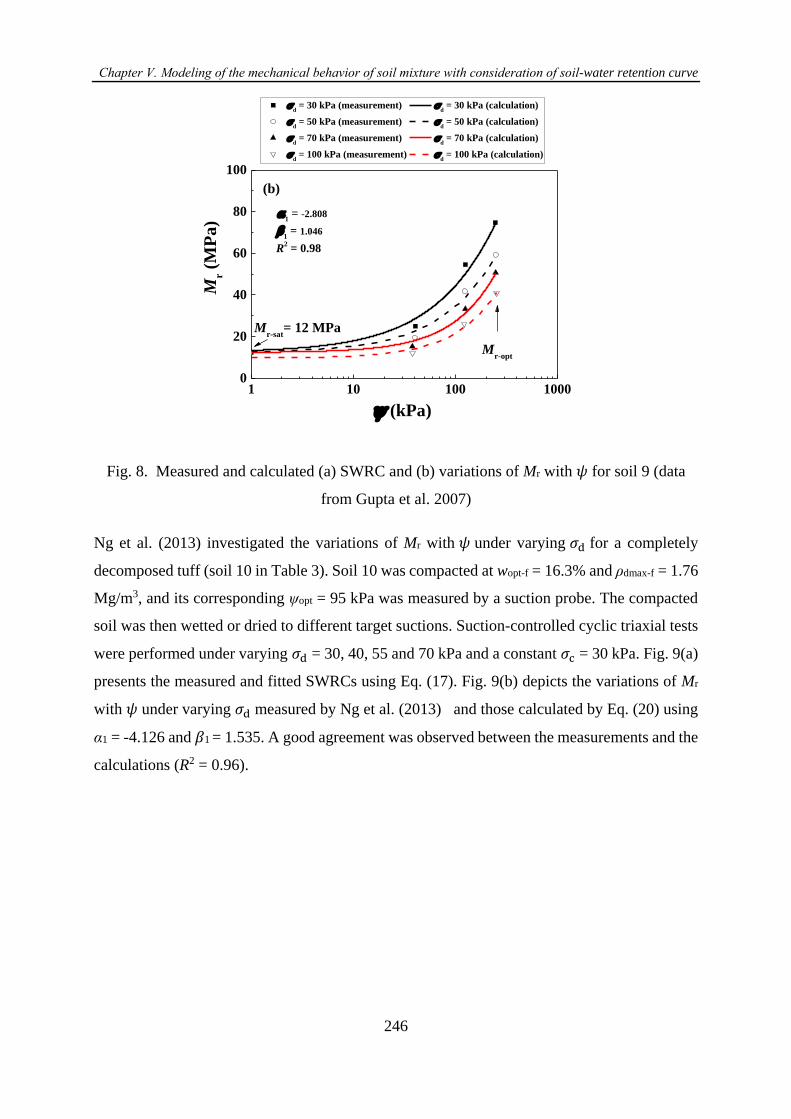
Chapter Ⅴ. Modeling of the mechanical behavior of soil mixture with consideration of soil-water retention curve
246
1 10 100 10000
20
40
60
80
100
(b)
Mr-opt
d = 30 kPa (measurement)
d = 30 kPa (calculation)
d = 50 kPa (measurement)
d = 50 kPa (calculation)
d = 70 kPa (measurement)
d = 70 kPa (calculation)
d = 100 kPa (measurement)
d = 100 kPa (calculation)
Mr
(MP
a)
(kPa)
Mr-sat
= 12 MPa
1 = 1.046
1 = -2.808
R2 = 0.98
Fig. 8. Measured and calculated (a) SWRC and (b) variations of Mr with 𝜓 for soil 9 (data
from Gupta et al. 2007)
Ng et al. (2013) investigated the variations of Mr with 𝜓 under varying 𝜎d for a completely
decomposed tuff (soil 10 in Table 3). Soil 10 was compacted at wopt-f = 16.3% and ρdmax-f = 1.76
Mg/m3, and its corresponding ψopt = 95 kPa was measured by a suction probe. The compacted
soil was then wetted or dried to different target suctions. Suction-controlled cyclic triaxial tests
were performed under varying 𝜎d = 30, 40, 55 and 70 kPa and a constant 𝜎c = 30 kPa. Fig. 9(a)
presents the measured and fitted SWRCs using Eq. (17). Fig. 9(b) depicts the variations of Mr
with 𝜓 under varying 𝜎d measured by Ng et al. (2013) and those calculated by Eq. (20) using
α1 = -4.126 and 𝛽1 = 1.535. A good agreement was observed between the measurements and the
calculations (R2 = 0.96).
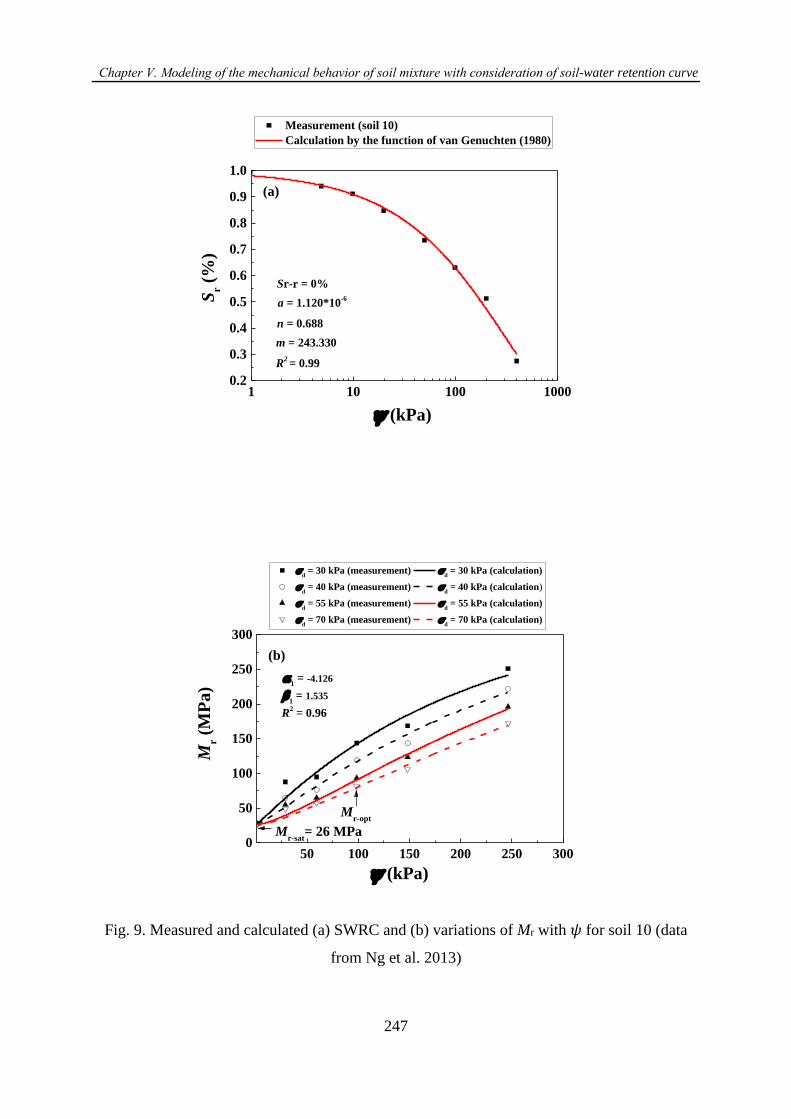
Chapter Ⅴ. Modeling of the mechanical behavior of soil mixture with consideration of soil-water retention curve
247
1 10 100 10000.2
0.3
0.4
0.5
0.6
0.7
0.8
0.9
1.0
(a)
Sr (
%)
(kPa)
Measurement (soil 10)
Calculation by the function of van Genuchten (1980)
Sr-r = 0%
R2 = 0.99
m = 243.330
n = 0.688
a = 1.120*10-6
50 100 150 200 250 3000
50
100
150
200
250
300
(b)
Mr-opt
d = 30 kPa (measurement)
d = 30 kPa (calculation)
d = 40 kPa (measurement)
d = 40 kPa (calculation)
d = 55 kPa (measurement)
d = 55 kPa (calculation)
d = 70 kPa (measurement)
d = 70 kPa (calculation)
Mr-sat
= 26 MPa
1 = 1.535
1 = -4.126
R2 = 0.96
(kPa)
Mr
(MP
a)
Fig. 9. Measured and calculated (a) SWRC and (b) variations of Mr with 𝜓 for soil 10 (data
from Ng et al. 2013)
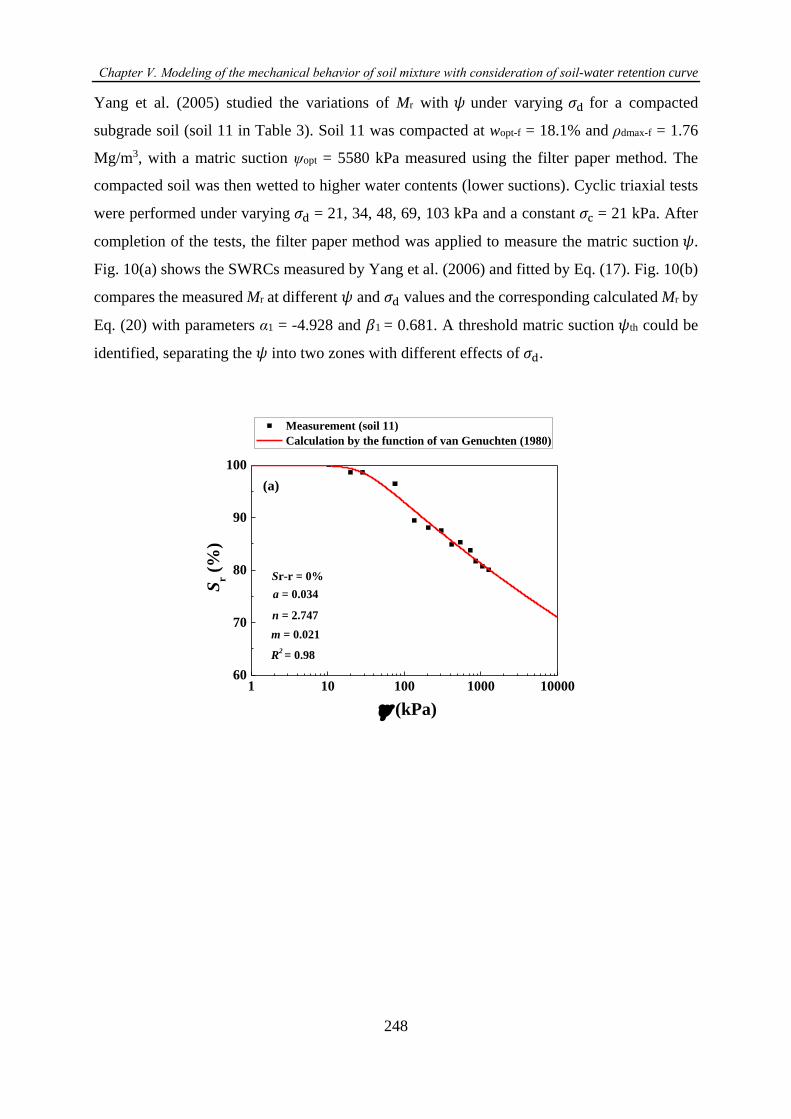
Chapter Ⅴ. Modeling of the mechanical behavior of soil mixture with consideration of soil-water retention curve
248
Yang et al. (2005) studied the variations of Mr with 𝜓 under varying 𝜎d for a compacted
subgrade soil (soil 11 in Table 3). Soil 11 was compacted at wopt-f = 18.1% and ρdmax-f = 1.76
Mg/m3, with a matric suction ψopt = 5580 kPa measured using the filter paper method. The
compacted soil was then wetted to higher water contents (lower suctions). Cyclic triaxial tests
were performed under varying 𝜎d = 21, 34, 48, 69, 103 kPa and a constant 𝜎c = 21 kPa. After
completion of the tests, the filter paper method was applied to measure the matric suction 𝜓.
Fig. 10(a) shows the SWRCs measured by Yang et al. (2006) and fitted by Eq. (17). Fig. 10(b)
compares the measured Mr at different 𝜓 and 𝜎d values and the corresponding calculated Mr by
Eq. (20) with parameters α1 = -4.928 and 𝛽1 = 0.681. A threshold matric suction 𝜓th could be
identified, separating the 𝜓 into two zones with different effects of 𝜎d.
1 10 100 1000 1000060
70
80
90
100
(a)
Sr-r = 0%
Measurement (soil 11)
Calculation by the function of van Genuchten (1980)
Sr (
%)
(kPa)
R2 = 0.98
m = 0.021
n = 2.747
a = 0.034

Chapter Ⅴ. Modeling of the mechanical behavior of soil mixture with consideration of soil-water retention curve
249
10 100 1000 100000
50
100
150
200
250
300
350
400
(b)
Mr-opt
d = 21 kPa (measurement)
d = 21 kPa (calculation)
d = 34 kPa (measurement)
d = 34 kPa (calculation)
d = 48 kPa (measurement)
d = 48 kPa (calculation)
d = 69 kPa (measurement)
d = 69 kPa (calculation)
d = 103 kPa (measurement)
d = 103 kPa (calculation)
Mr
(MP
a)
(kPa)
Mr-sat= 77 MPa
54 MPa
50 MPa
45 MPa
42 MP
th
1 = 0.681
= -4.928
R2 = 0.98
Fig. 10. Measured and calculated (a) SWRC (data from Yang et al. 2006) and (b) variations of
Mr with 𝜓 for soil 11 (data from Yang et al. 2005)
Yang et al. (2008) investigated the variations of Mr with 𝜓 under varying 𝜎d for a compacted
mudstone soil (soil 12 in Table 3). Soil 12 was compacted at wopt-f = 16.8% and ρdmax-f = 1.77
Mg/m3, defining a matric suction ψopt = 500 kPa which was measured by the filter paper method.
It was then wetted to higher water contents (19.1%, 20.2% and 23.2%) to reach various suctions
(450, 150 and 50 kPa respectively). Cyclic triaxial tests were performed with suction controlled
by the axis-translation technique. Four deviator stresses 𝜎d = 34, 48, 69 and 103 kPa were
applied in sequence under a constant 𝜎c = 21 kPa. Fig. 11(a) shows the measured and fitted
SWRCs by Eq. (17). Fig. 11(b) depicts the variations of Mr with 𝜓 under varying 𝜎d measured
by Yang et al. (2008) and those calculated by Eq. (20) with parameters α1 = -3.943 and 𝛽1 =
1.606. A 𝜓th was identified from Fig. 11(b), separating the 𝜓 into two zones with different
effects of 𝜎d, which was consistent with the observation in Fig. 10(b).
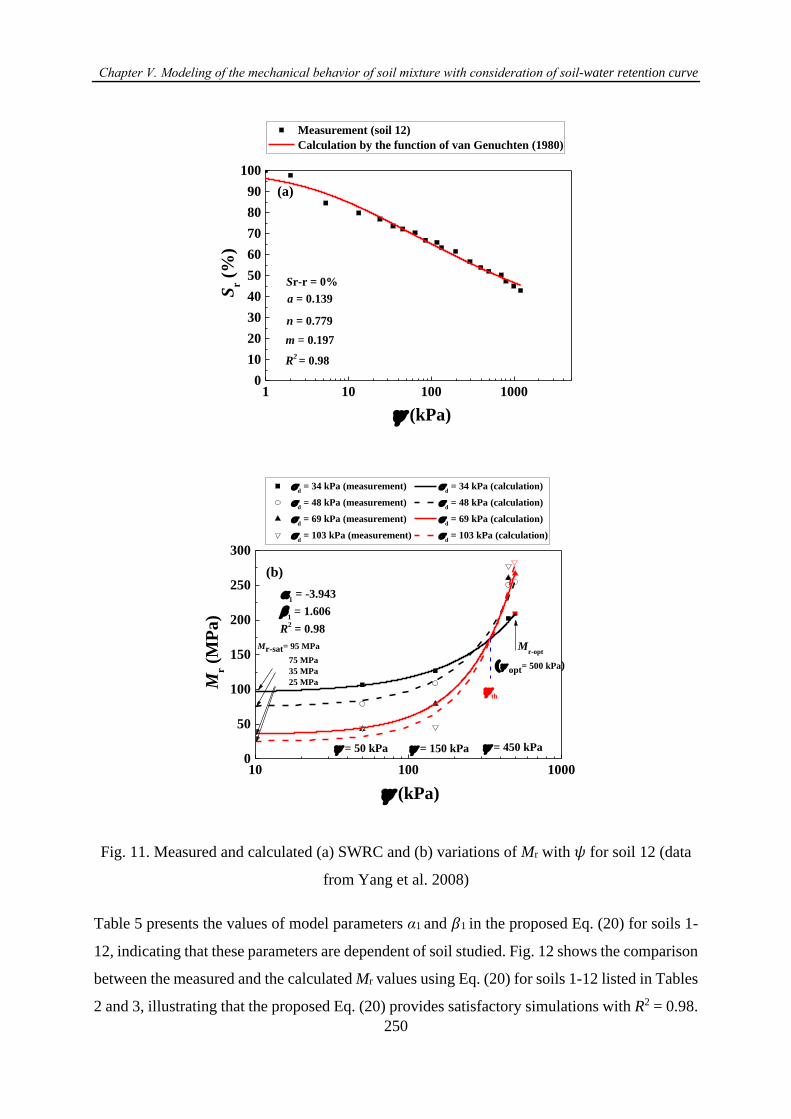
Chapter Ⅴ. Modeling of the mechanical behavior of soil mixture with consideration of soil-water retention curve
250
1 10 100 10000
10
20
30
40
50
60
70
80
90
100
(a)
Sr-r = 0%
Measurement (soil 12)
Calculation by the function of van Genuchten (1980)
Sr (
%)
(kPa)
R2 = 0.98
m = 0.197
n = 0.779
a = 0.139
10 100 10000
50
100
150
200
250
300
(b)
Mr-opt
( opt= 500 kPa)
= 450 kPa = 150 kPa = 50 kPa
d = 34 kPa (measurement)
d = 34 kPa (calculation)
d = 48 kPa (measurement)
d = 48 kPa (calculation)
d = 69 kPa (measurement)
d = 69 kPa (calculation)
d = 103 kPa (measurement)
d = 103 kPa (calculation)
Mr
(MP
a)
(kPa)
Mr-sat= 95 MPa
75 MPa
35 MPa
25 MPa
th
1 = 1.606
1 = -3.943
R2 = 0.98
Fig. 11. Measured and calculated (a) SWRC and (b) variations of Mr with 𝜓 for soil 12 (data
from Yang et al. 2008)
Table 5 presents the values of model parameters α1 and 𝛽1 in the proposed Eq. (20) for soils 1-
12, indicating that these parameters are dependent of soil studied. Fig. 12 shows the comparison
between the measured and the calculated Mr values using Eq. (20) for soils 1-12 listed in Tables
2 and 3, illustrating that the proposed Eq. (20) provides satisfactory simulations with R2 = 0.98.
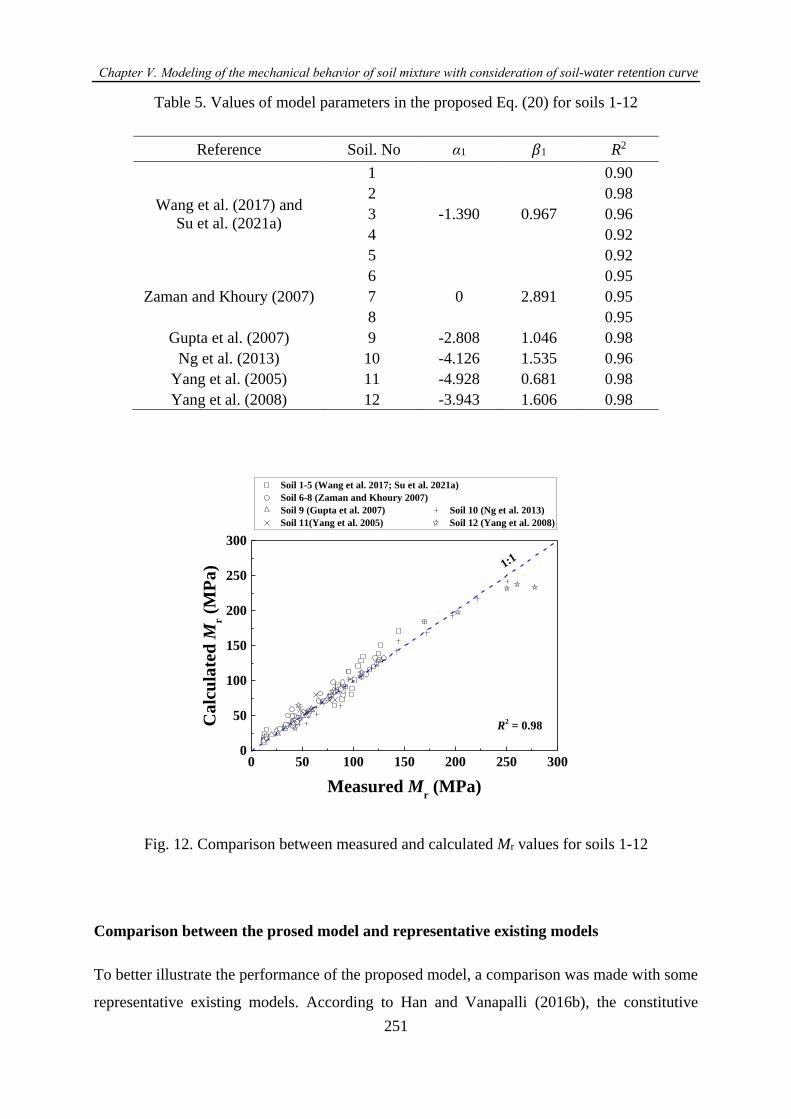
Chapter Ⅴ. Modeling of the mechanical behavior of soil mixture with consideration of soil-water retention curve
251
Table 5. Values of model parameters in the proposed Eq. (20) for soils 1-12
Reference Soil. No α1 𝛽1 R2
Wang et al. (2017) and
Su et al. (2021a)
1
-1.390 0.967
0.90
2 0.98
3 0.96
4 0.92
5 0.92
Zaman and Khoury (2007)
6
0 2.891
0.95
7 0.95
8 0.95
Gupta et al. (2007) 9 -2.808 1.046 0.98
Ng et al. (2013) 10 -4.126 1.535 0.96
Yang et al. (2005) 11 -4.928 0.681 0.98
Yang et al. (2008) 12 -3.943 1.606 0.98
0 50 100 150 200 250 3000
50
100
150
200
250
300
R2 = 0.98
Soil 1-5 (Wang et al. 2017; Su et al. 2021a)
Soil 6-8 (Zaman and Khoury 2007)
Soil 9 (Gupta et al. 2007) Soil 10 (Ng et al. 2013)
Soil 11(Yang et al. 2005) Soil 12 (Yang et al. 2008)
Ca
lcu
late
d M
r (
MP
a)
Measured Mr (MPa)
1:1
Fig. 12. Comparison between measured and calculated Mr values for soils 1-12
Comparison between the prosed model and representative existing models
To better illustrate the performance of the proposed model, a comparison was made with some
representative existing models. According to Han and Vanapalli (2016b), the constitutive
Chapter Ⅴ. Modeling of the mechanical behavior of soil mixture with consideration of soil-water retention curve
252
models of Mr could be categorized into three groups: group A - empirical models (e.g. Eqs. (1)
- (4) and (9)); group B - models incorporating 𝜓 into deviator or mean stresses (e.g. Eqs. (5) -
(6)); group C- models considering 𝜓 as an independent term (e.g. Eqs. (7) - (8) and (10)). Three
representative models were selected from these three groups: Eq. (9) (ARA, Inc., ERES
Consultants Division. 2004), Eq. (5) (Liang et al. 2008) and Eq. (10) (Han and Vanapalli 2005)
for groups A, B and C, respectively. Note that Eqs. (9) - (10) incorporated SWRC using Eq.
(17). Three studies were adopted for the comparison among (Table 6): soil 10 (Ng et al. 2013)
of category Ⅰ (𝜓 < 𝜓th), soil 12 (Yang et al. 2008) of category Ⅱ (𝜓 > 𝜓th and 𝜓th < 𝜓opt) and
soil 5 (Wang et al. 2017; Su et al. 2021a) of category Ⅱ (𝜓 > 𝜓th and 𝜓th > 𝜓opt).
Fig. 13(a) shows the Mr measured by Ng et al. (2013) and that calculated by Eq. (9) using
parameters a = -0.593, b = 0.400 and km = 6.132. A reasonably good agreement was obtained
between the measurements and the calculations (R2 = 0.94). The similar phenomenon was
observed in Figs. 13(b) - (c): Eqs. (5) and (10) provided satisfactory simulations with parameters
presented in Table 6 (R2 = 0.97 and 0.92, respectively). This indicates that in the case of category
Ⅰ (𝜓 < 𝜓th), all the three representative existing models as well as the proposed Eq. (20) can be
used to describe the Mr variations.
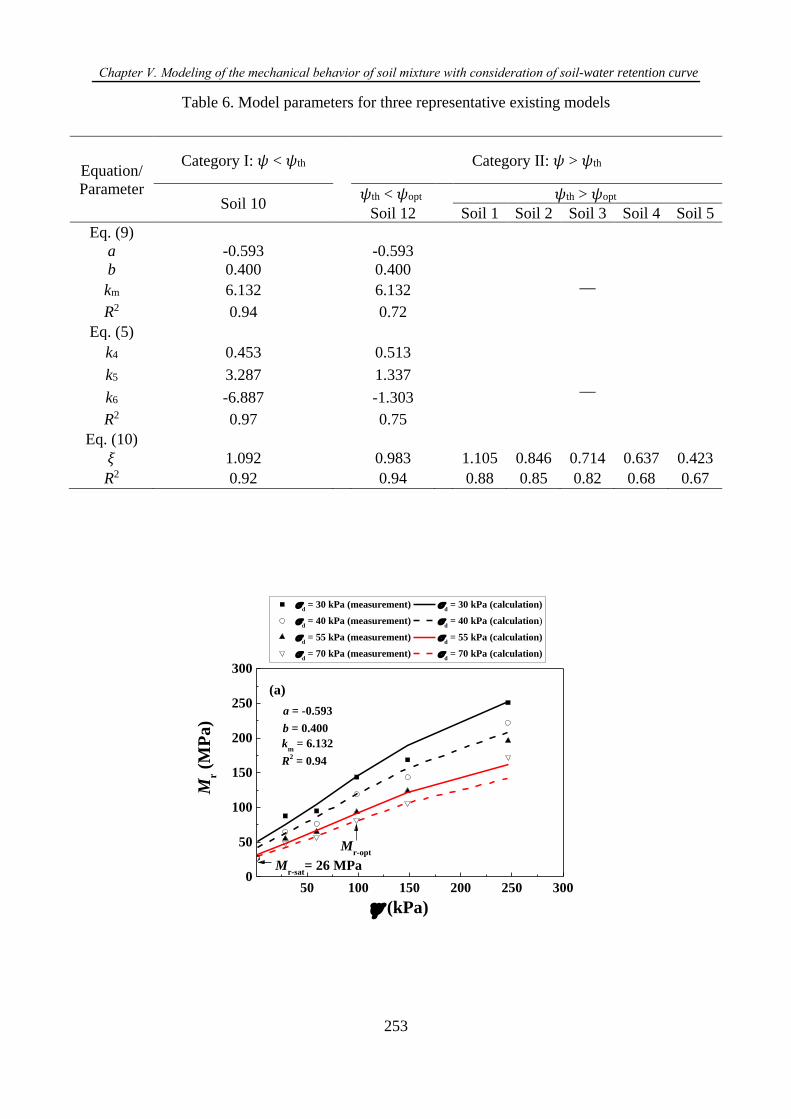
Chapter Ⅴ. Modeling of the mechanical behavior of soil mixture with consideration of soil-water retention curve
253
Table 6. Model parameters for three representative existing models
Equation/
Parameter
Category Ⅰ: 𝜓 < 𝜓th Category Ⅱ: 𝜓 > 𝜓th
Soil 10 𝜓th < 𝜓opt 𝜓th > 𝜓opt
Soil 12 Soil 1 Soil 2 Soil 3 Soil 4 Soil 5
Eq. (9)
a -0.593 -0.593
__ b 0.400 0.400
km 6.132 6.132
R2 0.94 0.72
Eq. (5)
k4 0.453 0.513
__ k5 3.287 1.337
k6 -6.887 -1.303
R2 0.97 0.75
Eq. (10)
𝜉 1.092 0.983 1.105 0.846 0.714 0.637 0.423
R2 0.92 0.94 0.88 0.85 0.82 0.68 0.67
50 100 150 200 250 3000
50
100
150
200
250
300
(a)
km = 6.132
Mr-opt
d = 30 kPa (measurement)
d = 30 kPa (calculation)
d = 40 kPa (measurement)
d = 40 kPa (calculation)
d = 55 kPa (measurement)
d = 55 kPa (calculation)
d = 70 kPa (measurement)
d = 70 kPa (calculation)
Mr-sat
= 26 MPa
b = 0.400
a = -0.593
R2 = 0.94
(kPa)
Mr
(MP
a)
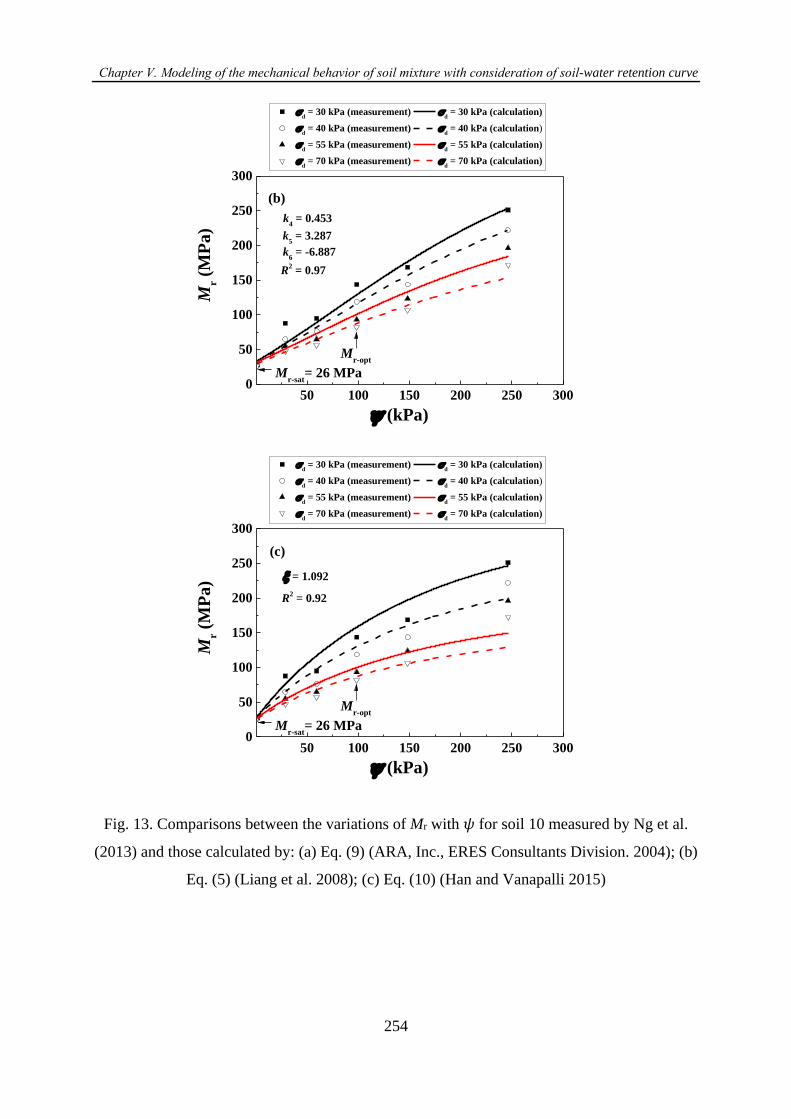
Chapter Ⅴ. Modeling of the mechanical behavior of soil mixture with consideration of soil-water retention curve
254
50 100 150 200 250 3000
50
100
150
200
250
300
(b)
k6 = -6.887
Mr-opt
d = 30 kPa (measurement)
d = 30 kPa (calculation)
d = 40 kPa (measurement)
d = 40 kPa (calculation)
d = 55 kPa (measurement)
d = 55 kPa (calculation)
d = 70 kPa (measurement)
d = 70 kPa (calculation)
Mr-sat
= 26 MPa
k5 = 3.287
k4 = 0.453
R2 = 0.97
(kPa)
Mr
(MP
a)
50 100 150 200 250 3000
50
100
150
200
250
300
(c)
Mr-opt
d = 30 kPa (measurement)
d = 30 kPa (calculation)
d = 40 kPa (measurement)
d = 40 kPa (calculation)
d = 55 kPa (measurement)
d = 55 kPa (calculation)
d = 70 kPa (measurement)
d = 70 kPa (calculation)
Mr-sat
= 26 MPa
= 1.092
R2 = 0.92
(kPa)
Mr
(MP
a)
Fig. 13. Comparisons between the variations of Mr with 𝜓 for soil 10 measured by Ng et al.
(2013) and those calculated by: (a) Eq. (9) (ARA, Inc., ERES Consultants Division. 2004); (b)
Eq. (5) (Liang et al. 2008); (c) Eq. (10) (Han and Vanapalli 2015)
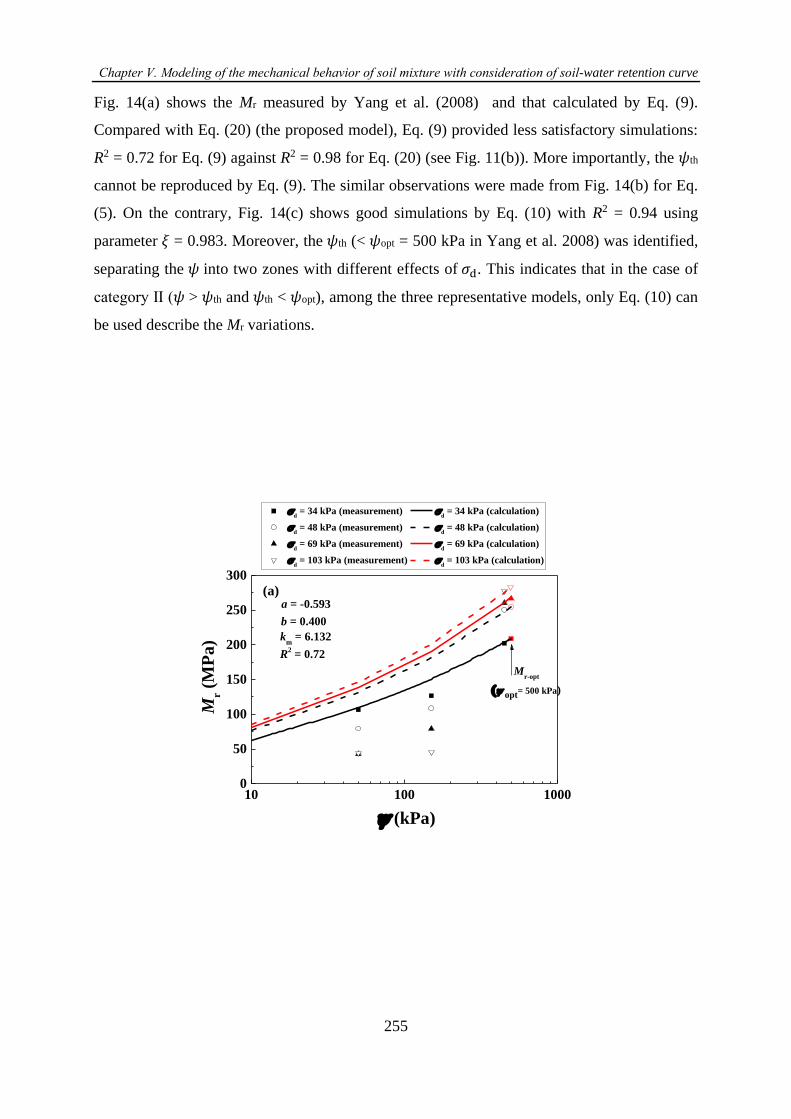
Chapter Ⅴ. Modeling of the mechanical behavior of soil mixture with consideration of soil-water retention curve
255
Fig. 14(a) shows the Mr measured by Yang et al. (2008) and that calculated by Eq. (9).
Compared with Eq. (20) (the proposed model), Eq. (9) provided less satisfactory simulations:
R2 = 0.72 for Eq. (9) against R2 = 0.98 for Eq. (20) (see Fig. 11(b)). More importantly, the 𝜓th
cannot be reproduced by Eq. (9). The similar observations were made from Fig. 14(b) for Eq.
(5). On the contrary, Fig. 14(c) shows good simulations by Eq. (10) with R2 = 0.94 using
parameter 𝜉 = 0.983. Moreover, the 𝜓th (< 𝜓opt = 500 kPa in Yang et al. 2008) was identified,
separating the 𝜓 into two zones with different effects of 𝜎d. This indicates that in the case of
category Ⅱ (𝜓 > 𝜓th and 𝜓th < 𝜓opt), among the three representative models, only Eq. (10) can
be used describe the Mr variations.
10 100 10000
50
100
150
200
250
300
(a)
Mr-opt
( opt= 500 kPa)
d = 34 kPa (measurement)
d = 34 kPa (calculation)
d = 48 kPa (measurement)
d = 48 kPa (calculation)
d = 69 kPa (measurement)
d = 69 kPa (calculation)
d = 103 kPa (measurement)
d = 103 kPa (calculation)
Mr
(MP
a)
(kPa)
km = 6.132
b = 0.400
a = -0.593
R2 = 0.72
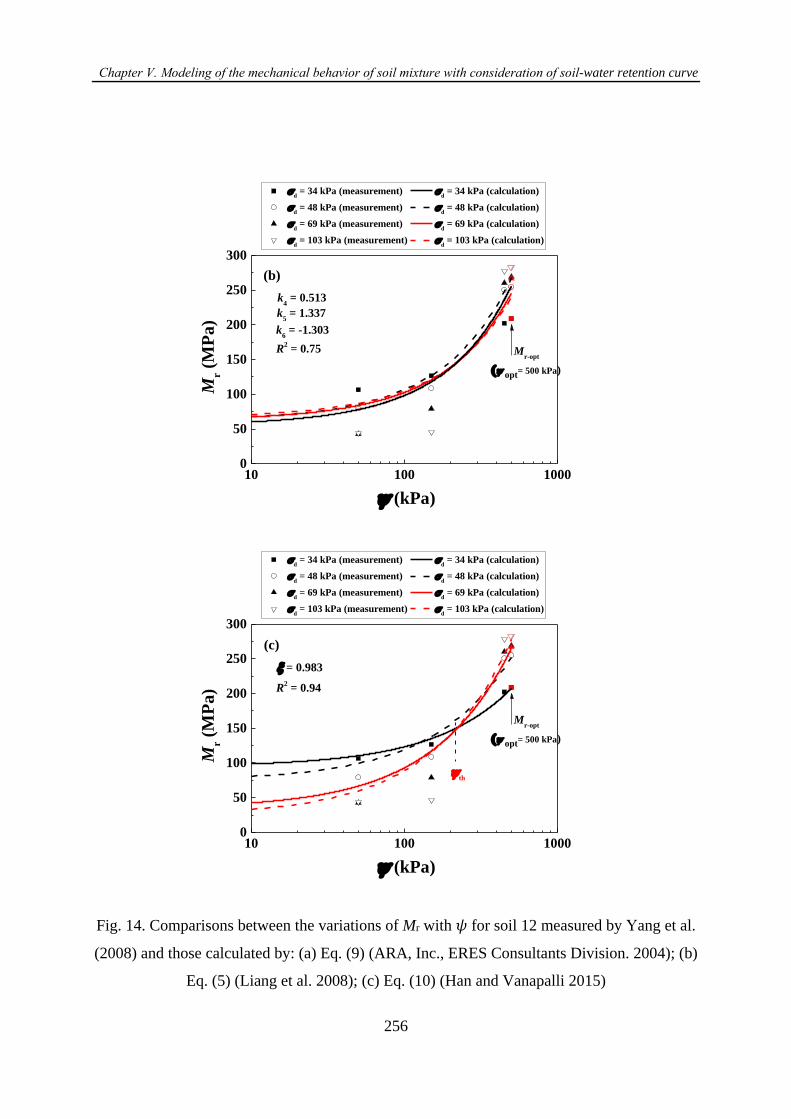
Chapter Ⅴ. Modeling of the mechanical behavior of soil mixture with consideration of soil-water retention curve
256
10 100 10000
50
100
150
200
250
300
(b)
(a)
k6 = -1.303
k5 = 1.337
Mr-opt
( opt= 500 kPa)
d = 34 kPa (measurement)
d = 34 kPa (calculation)
d = 48 kPa (measurement)
d = 48 kPa (calculation)
d = 69 kPa (measurement)
d = 69 kPa (calculation)
d = 103 kPa (measurement)
d = 103 kPa (calculation)
Mr
(MP
a)
(kPa)
k4 = 0.513
R2 = 0.75
10 100 10000
50
100
150
200
250
300
(c)
Mr-opt
( opt= 500 kPa)
d = 34 kPa (measurement)
d = 34 kPa (calculation)
d = 48 kPa (measurement)
d = 48 kPa (calculation)
d = 69 kPa (measurement)
d = 69 kPa (calculation)
d = 103 kPa (measurement)
d = 103 kPa (calculation)
Mr
(MP
a)
(kPa)
th
= 0.983
R2 = 0.94
Fig. 14. Comparisons between the variations of Mr with 𝜓 for soil 12 measured by Υang et al.
(2008) and those calculated by: (a) Eq. (9) (ARA, Inc., ERES Consultants Division. 2004); (b)
Eq. (5) (Liang et al. 2008); (c) Eq. (10) (Han and Vanapalli 2015)
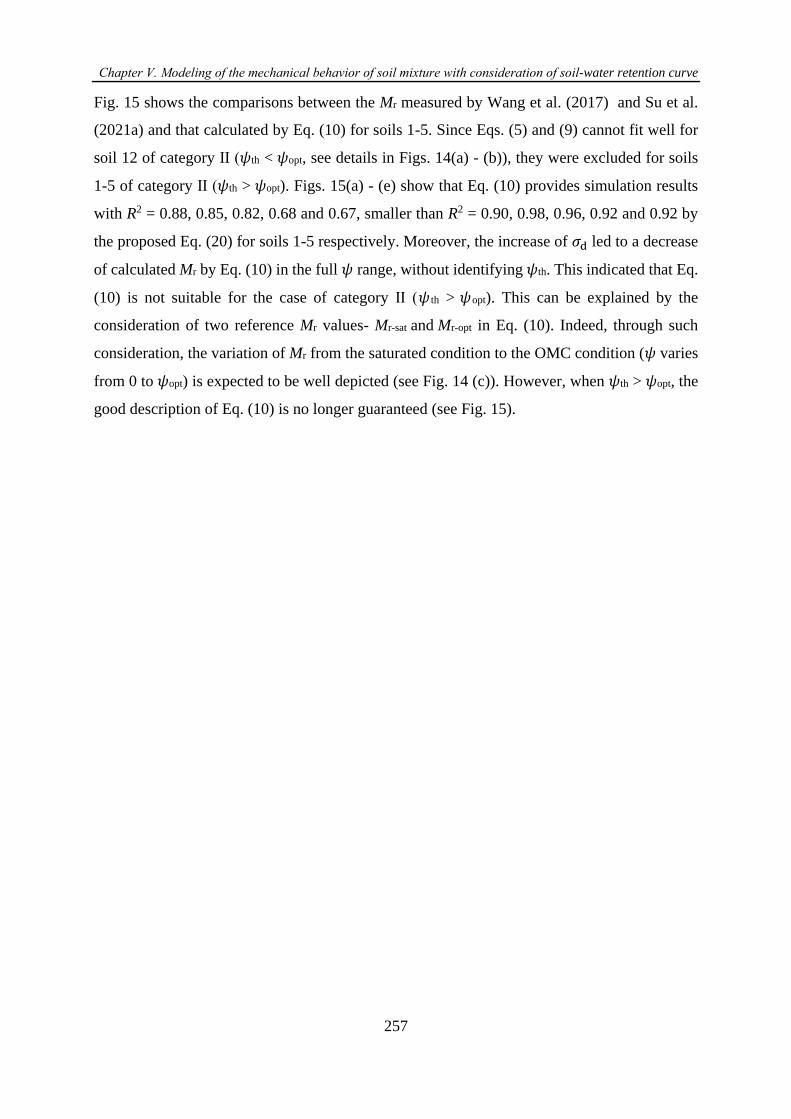
Chapter Ⅴ. Modeling of the mechanical behavior of soil mixture with consideration of soil-water retention curve
257
Fig. 15 shows the comparisons between the Mr measured by Wang et al. (2017) and Su et al.
(2021a) and that calculated by Eq. (10) for soils 1-5. Since Eqs. (5) and (9) cannot fit well for
soil 12 of category Ⅱ (𝜓th < 𝜓opt, see details in Figs. 14(a) - (b)), they were excluded for soils
1-5 of category Ⅱ (𝜓th > 𝜓opt). Figs. 15(a) - (e) show that Eq. (10) provides simulation results
with R2 = 0.88, 0.85, 0.82, 0.68 and 0.67, smaller than R2 = 0.90, 0.98, 0.96, 0.92 and 0.92 by
the proposed Eq. (20) for soils 1-5 respectively. Moreover, the increase of 𝜎d led to a decrease
of calculated Mr by Eq. (10) in the full 𝜓 range, without identifying 𝜓th. This indicated that Eq.
(10) is not suitable for the case of category Ⅱ (𝜓 th > 𝜓opt). This can be explained by the
consideration of two reference Mr values- Mr-sat and Mr-opt in Eq. (10). Indeed, through such
consideration, the variation of Mr from the saturated condition to the OMC condition (𝜓 varies
from 0 to 𝜓opt) is expected to be well depicted (see Fig. 14 (c)). However, when 𝜓th > 𝜓opt, the
good description of Eq. (10) is no longer guaranteed (see Fig. 15).
Chapter Ⅴ. Modeling of the mechanical behavior of soil mixture with consideration of soil-water retention curve
258
100 10000
20
40
60
80
100
Mr
(MP
a)
(kPa)
(a)
d = 50 kPa (measurement)
d = 50 kPa (calculation)
d = 100 kPa (measurement)
d = 100 kPa (calculation)
d = 200 kPa (measurement)
d = 200 kPa (calculation)
Mr-sat
= 11 MPa Mr-opt
= 1.105
R2= 0.88
100 10000
20
40
60
80
100 (b)
d = 50 kPa (measurement)
d = 50 kPa (calculation)
d = 100 kPa (measurement)
d = 100 kPa (calculation)
d = 200 kPa (measurement)
d = 200 kPa (calculation)
Mr
(MP
a)
(kPa)
Mr-sat
= 13 MPa
Mr-opt
= 0.846
R2= 0.85
100 10000
20
40
60
80
100
120(c)
d = 50 kPa (measurement)
d = 50 kPa (calculation)
d = 100 kPa (measurement)
d = 100 kPa (calculation
d = 200 kPa (measurement)
d = 200 kPa (calculation)
(kPa)
Mr (
MP
a)
Mr-sat
= 15 MPaM
r-opt
= 0.714
R2= 0.82
100 10000
20
40
60
80
100
120
140(d)
d = 50 kPa (measurement)
d = 50 kPa (calculation)
d = 100 kPa (measurement)
d = 100 kPa (calculation)
d = 200 kPa (measurement)
d = 200 kPa (calculation)
Mr (
MP
a)
(kPa)
Mr-sat
= 52 MPa Mr-opt
= 0.637
R2= 0.68
100 10000
20
40
60
80
100
120
140
160
180
200
(e) = 0.423
d = 50 kPa (measurement)
d = 50 kPa (calculation)
d = 100 kPa (measurement)
d = 100 kPa (calculation)
d = 200 kPa (measurement)
d = 200 kPa (calculation)
(kPa)
Mr
(MP
a)
R2= 0.67
Mr-sat
= 85 MPa
Mr-opt
Fig. 15. Comparisons between the variations of Mr with 𝜓 for soils 1 - 5 measured by Wang et
al. (2017) and Su et al. (2021a) and those calculated by Eq. (10) (Han and Vanapalli 2015):
(a) soil 1 at fv = 0%; (b) soil 2 at fv = 10%; (c) soil 3 at fv = 20%; (d) soil 4 at fv = 35%; (e) soil
5 at fv = 45%
Chapter Ⅴ. Modeling of the mechanical behavior of soil mixture with consideration of soil-water retention curve
259
The comparison of different models indicates that the variation of Mr can be well described by
Eqs. (9), (5) and (10) from group A, B and C for category Ⅰ (𝜓 < 𝜓th). For category Ⅱ (𝜓th <
𝜓opt), only Eq. (10) among the three representative models can give satisfactory description,
while for category Ⅱ (𝜓th > 𝜓opt), even Eq. (10) fails. This leads to the conclusion that only the
proposed Eq. (20) which incorporates the combined effects of 𝜎d and 𝜓 on the Mr in the full
range of suction can provide good description for both 𝜓th < 𝜓opt and 𝜓th > 𝜓opt.
It is worth noting that as the existing models incorporating SWRC, such as Eq. (10) (Han and
Vanapalli 2015), the hysteresis effect has not been accounted for. Further studies are needed to
extend the proposed model to the hysteresis effect.
Conclusions
A constitutive model was proposed to describe the variation of resilient modulus Mr with matric
suction 𝜓 and deviator stress 𝜎d. This model was then extended to the effect of coarse grain
content fv based on the experimental data from Wang et al. (2017) and Su et al. (2021a) to
describe the variation of Mr for unsaturated fine/coarse soil mixtures. The model incorporates
soil-water retention curve (SWRC). The key parameters are the resilient modulus at saturated
sate Mr-sat, the resilient modulus at optimum state Mr-opt, the matric suction at optimum state 𝜓opt,
soil parameters α1 and 𝛽1, as well as the parameters related to SWRC. The proposed model was
validated using five different studies. A comparative study was also conducted between the
proposed model and three representative existing models from literature. The following
conclusions can be drawn:
The effect of 𝜎d on Mr was found to be highly dependent on 𝜓, with a threshold matric suction
𝜓th separating 𝜓 into two zones: with an increasing 𝜎d, the Mr decreased at 𝜓 < 𝜓th, while
increased at 𝜓 > 𝜓th. Using the threshold matric suction 𝜓th, previous studies from literature
could be divided into two categories: category Ⅰ (𝜓 < 𝜓 th) and category Ⅱ (𝜓 > 𝜓 th). For
category Ⅰ ( 𝜓 < 𝜓 th), the variation of Mr could be satisfactorily described by the three
representative models. For category Ⅱ (𝜓 > 𝜓th), only Eq. (10) among the three representative
models provided satisfactory simulations in the case of 𝜓th > 𝜓opt. However, in the case of 𝜓th
< 𝜓opt, Eq. (10) failed also. Unlike the three representative models, the proposed model Eq.
(20) could gave good results in the full 𝜓 range. In addition, the effect of fv was well
incorporated using Eq. (21). Thus, the proposed model constitutes a helpful tool for describing
Chapter Ⅴ. Modeling of the mechanical behavior of soil mixture with consideration of soil-water retention curve
260
the variation of resilient modulus of unsaturated fine/coarse soil mixtures under the combined
effects of deviator stress and suction
Acknowledgements
This work was supported by the China Scholarship Council (CSC) and Ecole des Ponts
ParisTech.
References
ARA, Inc., ERES Consultants Division. 2004. Guide for mechanistic - empirical design of new
and rehabilitated pavement structures. Final report, NCHRP Project 1-37A. Transportation
Research Board, Washington, D.C.
Alonso, E. E., Pereira, J. M., Vaunat, J., & Olivella, S. 2010. A microstructurally based effective
stress for unsaturated soils. Géotechnique, 60(12), 913-925.
Ba, M., Nokkaew, K., Fall, M., & Tinjum, J. M. 2013. Effect of matric suction on resilient
modulus of compacted aggregate base courses. Geotechnical and Geological Engineering,
31(5), 1497-1510.
Cui, Y. J., & Delage, P. 1996. Yielding and plastic behaviour of an unsaturated compacted silt.
Géotechnique, 46(2), 291-311.
Cui, Y. J. 2018. Mechanical behaviour of coarse grains/fines mixture under monotonic and
cyclic loadings. Transportation Geotechnics, 17, 91-97.
Delage, P., Audiguier, M., Cui, Y.J. and Howat, M.D., 1996. Microstructure of a compacted
silt. Canadian Geotechnical Journal, 33(1), pp.150-158.
Duong, T. V., Cui, Y. J., Tang, A. M., Dupla, J. C., Canou, J., Calon, N., & Robinet, A. 2016.
Effects of water and fines contents on the resilient modulus of the interlayer soil of railway
substructure. Acta Geotechnica, 11(1), 51-59.
Gupta, S., Ranaivoson, A., Edil, T., Benson, C., & Sawangsuriya, A. 2007. Pavement design
using unsaturated soil technology.
Heath, A. C., Pestana, J. M., Harvey, J. T., & Bejerano, M. O. 2004. Normalizing behavior of
unsaturated granular pavement materials. Journal of Geotechnical and Geoenvironmental
Engineering, 130(9), 896-904.
Han, Z., & Vanapalli, S. K. 2015. Model for predicting resilient modulus of unsaturated
subgrade soil using soil-water characteristic curve. Canadian Geotechnical Journal, 52(10),
1605-1619.
Han, Z., & Vanapalli, S. K. 2016a. Stiffness and shear strength of unsaturated soils in relation
to soil-water characteristic curve. Géotechnique, 66(8), 627-647.
Chapter Ⅴ. Modeling of the mechanical behavior of soil mixture with consideration of soil-water retention curve
261
Han, Z., & Vanapalli, S. K. 2016b. State-of-the-Art: Prediction of resilient modulus of
unsaturated subgrade soils. International Journal of Geomechanics, 16(4), 04015104.
Khoury, N., Brooks, R., Boeni, S. Y., & Yada, D. 2013. Variation of resilient modulus, strength,
and modulus of elasticity of stabilized soils with postcompaction moisture contents. Journal
of Materials in Civil Engineering, 25(2), 160-166.
Liang, R. Y., Rabab’ah, S., & Khasawneh, M. 2008. Predicting moisture-dependent resilient
modulus of cohesive soils using soil suction concept. Journal of Transportation Engineering,
134(1), 34-40.
Lu, N., Godt, J. W., & Wu, D. T. 2010. A closed‐form equation for effective stress in
unsaturated soil. Water Resources Research, 46(5).
Moossazadeh, J., & Witczak, M. W. 1981. Prediction of subgrade moduli for soil that exhibits
nonlinear behavior. Transportation Research Record, (810).
Nowamooz, H., Chazallon, C., Arsenie, M. I., Hornych, P., & Masrouri, F. 2011. Unsaturated
resilient behavior of a natural compacted sand. Computers and Geotechnics, 38(4), 491-
503.
Ng, C. W. W., Zhou, C., Yuan, Q., & Xu, J. 2013. Resilient modulus of unsaturated subgrade
soil: experimental and theoretical investigations. Canadian Geotechnical Journal, 50(2),
223-232.
Ng, C. W. W., Baghbanrezvan, S., Sadeghi, H., Zhou, C., & Jafarzadeh, F. 2017. Effect of
specimen preparation techniques on dynamic properties of unsaturated fine-grained soil at
high suctions. Canadian Geotechnical Journal, 54(9), 1310-1319.
Oh, W. T., Vanapalli, S. K., & Puppala, A. J. 2009. Semi-empirical model for the prediction of
modulus of elasticity for unsaturated soils. Canadian Geotechnical Journal, 46(8), 903-914.
Qi, S., Cui, Y.J., Chen, R.P., Wang, H.L., Lamas-Lopez, F., Aimedieu, P., Dupla, J.C., Canou,
J. and Saussine, G., 2020. Influence of grain size distribution of inclusions on the
mechanical behaviours of track-bed materials. Géotechnique, 70(3), pp.238-247.
Sawangsuriya, A., Edil, T. B., & Benson, C. H. 2009. Effect of suction on resilient modulus of
compacted fine-grained subgrade soils. Transportation research record, 2101(1), 82-87.
Su, Y., Cui, Y. J., Dupla, J. C., & Canou, J. 2020. Investigation of the effect of water content
on the mechanical behavior of track-bed materials under various coarse grain contents.
Construction and Building Materials, 263, 120206.
Su, Y., Cui, Y. J., Dupla, J. C., & Canou, J. 2021a. Effect of water content on resilient modulus
and damping ratio of fine/coarse soil mixture with varying coarse grain contents.
Transportation Geotechnics, 100452.
Su, Y., Cui, Y.J., Dupla, J.C., Canou, J., Qi, S., 2021b. Developing a sample preparation
approach to study the mechanical behavior of unsaturated fine/coarse soil mixture.
Geotechnical Testing Journal. https://doi.org/10.1520/GTJ20190450.
Chapter Ⅴ. Modeling of the mechanical behavior of soil mixture with consideration of soil-water retention curve
262
Trinh, V. N. 2011. Comportement hydromécanique des matériaux constitutifs de plateformes
ferroviaires anciennes. PhD Thesis, Ecole Nationale des Ponts et Chaussées, Université
Paris-Est.
Van Genuchten, M. T. 1980. A closed‐form equation for predicting the hydraulic conductivity
of unsaturated soils. Soil science society of America journal, 44(5), 892-898.
Vanapalli, S. K., Fredlund, D. G., & Pufahl, D. E. 1999. The influence of soil structure and
stress history on the soil–water characteristics of a compacted till. Geotechnique, 49(2),
143-159.
Vallejo, L. E., & Mawby, R. 2000. Porosity influence on the shear strength of granular material–
clay mixtures. Engineering Geology, 58(2), 125-136.
Werkmeister, S., Dawson, A. R., & Wellner, F. 2004. Pavement design model for unbound
granular materials. Journal of Transportation Engineering, 130(5), 665-674.
Wang, H. L., Cui, Y. J., Lamas-Lopez, F., Dupla, J. C., Canou, J., Calon, N., & Chen, R. P.
2017. Effects of inclusion contents on resilient modulus and damping ratio of unsaturated
track-bed materials. Canadian Geotechnical Journal, 54(12), 1672-1681.
Wang, H.L., Cui, Y.J., Lamas-Lopez, F., Calon, N., Saussine, G., Dupla, J.C., Canou, J.,
Aimedieu, P. and Chen, R.P., 2018a. Investigation on the mechanical behavior of track-
bed materials at various contents of coarse grains. Construction and Building
Materials, 164, pp.228-237.
Wang, H.L., Cui, Y.J., Lamas-Lopez, F., Dupla, J.C., Canou, J., Calon, N., Saussine, G.,
Aimedieu, P. and Chen, R.P., 2018b. Permanent deformation of track-bed materials at
various inclusion contents under large number of loading cycles. Journal of Geotechnical
and Geoenvironmental Engineering, 144(8), p.04018044.
Yang, S. R., Huang, W. H., & Tai, Y. T. 2005. Variation of resilient modulus with soil suction
for compacted subgrade soils. Transportation Research Record, 1913(1), 99-106.
Yang, S. R., Kung, J. H., Huang, W. H., & Lin, H. D. 2006. Resilient modulus of unsaturated
cohesive subgrade soils. Yantu Gongcheng Xuebao(Chinese Journal of Geotechnical
Engineering), 28(2), 225-229.
Yang, S. R., Lin, H. D., Kung, J. H., & Huang, W. H. 2008. Suction-controlled laboratory test
on resilient modulus of unsaturated compacted subgrade soils. Journal of Geotechnical and
Geoenvironmental Engineering, 134(9), 1375-1384.
Zaman, M., & Khoury, N. 2007. Effect of soil suction and moisture on resilient modulus of
subgrade soils in Oklahoma (No. ORA 125-6662).
Conclusions and perspectives
263
CONCLUSIONS AND PERSPECTIVES
Conclusions
In the French conventional railway tracks, an interlayer was created by the interpenetration of
ballast grains and subgrade fine soil. Considering the difficulty of obtaining intact interlayer
soil from the field, the reconstituted soil mixture was adopted as a substitute in the laboratory.
The water retention behavior of soil mixture was investigated under varying coarse grain
contents and fine soil dry densities. Then, a sample preparation approach was developed,
allowing the effect of microstructure of fine soil on the mechanical behavior of mixture to be
minimized. Using this sample preparation approach, the mechanical behavior of mixture under
monotonic and cyclic loadings was investigated. Factors such as water content, coarse grain
content, stress state, loading cycles, etc, were considered. Finally, constitutive models were
proposed for the permanent strain and resilient modulus of fine/coarse soil mixture, allowing
the aforementioned factors to be accounted for.
Water retention behavior of soil mixture
The water retention behavior of soil mixture was investigated under varying coarse grain
contents fv and dry densities of fine soil ρd-f. The filter paper method was adopted to measure
the matric suction 𝜓 , and mercury intrusion porosimetry tests were performed for
microstructure observation of fine soil.
Results showed that the drying soil-water retention curve (SWRC) of mixture was only
dependent on ρd-f and independent of fv. When expressed in terms of gravimetric water content
of fine soil versus matric suction, SWRC was significantly affected by ρd-f at 𝜓 < 715 kPa, while
independent of ρd-f at 𝜓 > 715 kPa. This threshold matric suction corresponded to the delimiting
pore diameter of microstructure, which separated micro-pores from macro-pores. This
suggested that the SWRC in low 𝜓 range (𝜓 < 715) was governed by macro-pores, while in
high 𝜓 range (𝜓 > 715) governed by micro-pores. When expressed in terms of the degree of
saturation versus matric suction, the SWRC was affected by ρd-f in the full 𝜓 range, while
independent of fv. This help understand the observation of Duong et al. (2014) – the water
retention capacity of mixture decreased with the increase of fv: the dry density of mixture kept
constant, resulted in a decrease of ρd-f with increasing fv and thus a decrease of water retention
capacity.
Conclusions and perspectives
264
Mechanical behavior of soil mixture under monotonic loading
The effect of microstructure of fine soil on the mechanical behavior of soil mixture was
investigated. Two sample preparation approaches were compared: the first approach was to
compact the mixture at optimum moisture content, then dry or wet to the target water content;
the second approach was to directly compact the mixture at the target water content. Two coarse
grain contents fv (10% and 35%) and two target water contents (11% on the dry side of optimum
and 16% on the wet side) were considered. The microstructure of fine soil was investigated
using mercury intrusion porosimetry tests, and its effect on the overall mechanical behavior was
examined by monotonic triaxial tests.
Results showed that in the case of the fine matrix macrostructure (fv = 10%), a strong
microstructure effect of fine soil on the overall mechanical behavior of mixture was identified.
On the contrary, in the case of the coarse grain skeleton fabric (fv = 35%), a very limited
microstructure effect was observed. These findings can be helpful to minimize the effect of
microstructure of fine soil on the overall mechanical behavior of mixture during sample
preparation. In the case of fine matrix macrostructure, only the first sample preparation
approach can be adopted for the mixture on the dry side of optimum, but both approaches can
be adopted on the wet side. In the case of coarse grain skeleton, two approaches can be adopted,
whatever the remolded water content.
The effect of water content on the mechanical behavior of mixture under varying coarse grain
contents was investigated. Three water contents of fine soil wf (17.6%, 10.6% and 7.0%) and
five coarse grain contents fv (0%, 10%, 20%, 35% and 45%) were considered. Results showed
that variations of maximum deviator stress, elastic modulus, dilatancy angle and friction angle
with fv followed a bi-linear mode, defining a characteristic coarse grain content fv-cha for a given
wf: fv-cha ≈ 25%, 29% and 33% for wf = 17.6%, 10.6% and 7.0%, respectively. The fv-cha
corresponded to a transition from a fine matrix macrostructure to a coarse grain skeleton fabric.
The fv-cha increased with the decrease of wf, which was explained by the shrinkage property of
fine soil.
Mechanical behavior of soil mixture under cyclic loading
The effect of water content on permanent strain of soil mixture was investigated by cyclic
triaxial tests. The dry density of fine soil ρd-f kept constant for mixture with varying fv. A multi-
Conclusions and perspectives
265
stage loading procedure was applied, with a large number of loading cycles N = 90000 for each
stage. Results showed that the decrease of water content led to a decrease of permanent strain
owing to the increase of suction, and the increase of fv led to a decrease of permanent strain
owing to the reinforcement effect of coarse grains. These findings help understand the results
of Duong et al. (2013): the dry density of mixture ρd kept constant, resulting in a decrease of
ρd-f with increasing fv and thus a decrease of 𝜓 . In this case, when the negative effect of
decreasing 𝜓 prevailed on the positive reinforcement effect of increasing fv, the permanent
strain increased with the increase of fv.
The effect of water content on the resilient modulus and damping ratio of mixture with varying
fv was investigated by cyclic triaxial tests. A multi-stage loading procedure was applied, with a
small number of loading cycles N = 100 for each stage. Results showed that increasing water
content induced a decrease of resilient modulus owing to the decrease of suction, while an
increase of damping ratio owing to the increase of soil viscosity. Through the variations of
resilient modulus and damping ratio with fv, the same fv-cha was identified at a given water
content. It was found that the fv-cha increased with the decrease of water content, which was
explained by the shrinkage property of fine soil. Comparisons of the values of fv-cha under cyclic
and monotonic loadings showed that cyclic loading led to a slightly larger value than monotonic
loading, evidencing the effect of cyclic loading on the soil fabric.
Constitutive models for soil mixture
A fatigue model of permanent strain of mixture was proposed, allowing the effects of coarse
grain content fv, deviator stress σd and loading cycles N to be accounted for. Results showed
that the proposed model can well describe the permanent strain variations under the combined
effects of aforementioned factors, in the case of plastic shakedown. This fatigue model was
extended to the effect of 𝜓 by incorporating soil-water retention curve. Different studies from
literature were adopted to verify the proposed model. The model parameters were determined
using experimental results under saturated condition, and then adopted to predict the results
under unsaturated condition. A good agreement was obtained between the predictions and the
measurements, showing the performance of the proposed model in describing the permanent
strain variations under the combined effects of N, σd, fv and 𝜓. Comparisons with existing
models showed that the proposed model incorporating 𝜓 provided better predictions of
permanent strain than existing models considering w, for both the case of constant ρd-f and the
Conclusions and perspectives
266
case of constant ρd. This was explained by that the effect of ρd-f on permanent strain was better
reflected by 𝜓 than by w.
A constitutive model incorporating soil-water retention curve was proposed for the resilient
modulus of mixture, allowing the effects of 𝜓, σd and fv to be accounted for. The model was
validated using experimental results from literature. These experimental results revealed that a
threshold matric suction existed. With increasing σd, resilient modulus decreased when 𝜓 was
smaller than the threshold value, but increased when 𝜓 was larger than the threshold value.
Comparisons with existing models showed that the proposed model can well describe this
suction-dependent effect of σd on resilient modulus in the full 𝜓 range, while existing model
only gave satisfactory results in the low 𝜓 range (smaller than the threshold value).
From a practical point of view, the experimental results obtained can be used in assessment of
railway tracks mechanical degradation. Such mechanical degradation occurs when water
content changes in the interlayer soil, because the mechanical behaviour of interlayer soil
significantly varied with water content change. The models developed allowed the description
of permanent deformation and resilient modulus, with changes in water content and coarse grain
content. They constituted useful tools for evaluating the sensitivities of these mechanical
behaviors with respect to changes in water content and coarse grain content. Once the sensitivity
was identified, the corresponding measures can be applied to maintain or improve the
mechanical performance of railway tracks. For instance, setting drainage systems in the railway
tracks help alleviate the negative effect of water content on its mechanical behaviors.
Perspectives
This study allows better understanding the mechanical behavior of fine/coarse soil mixture and
its corresponding constitutive models. In light of the findings, the following issues can be
addressed in future studies:
The fatigue models for permanent strain of soil mixture could be implemented in a finite
element code for numerically analysing the long-term behaviour of railway tracks under the
combined effects of loading cycles, deviator stress, coarse grain content and matric suction.
The wetting-drying cycles can significantly affecte the microstructure of fine soil, and thus the
mechanical behaviour of soil mixture. Thus, it is proposed to extend the study to the effect of
wetting-drying cycles.
Conclusions and perspectives
267
Basically, the effect of coarse grain content fv on the hydraulic conductivity of mixture depended
on two mechanisms: (i) the hydraulic conductivity decreases with the decrease of void ratio due
to the increase of fv; (ii) the hydraulic conductivity increases with the increase of the volume of
macro-pores among coarse grains due to to the increase of fv. This aspect deserves in-depth
study because the track mechanical behaviour is fully coupled with the hydraulic behaviour
through the variations of sucion or water content.
To better describe the mechanical behaviour in terms of shear strength and dilatancy, it is
proposed to develop an elastoplastic model for the soil mixture under monotonic and cyclic
loadings, allowing the consideration of the effects of suction and coarse grain content.
References
268
REFERENCES
AFNOR, 1995. NF P98-235-1—Test relating to pavements. Unbound granular materials. Part
1: Repeated Loading Triaxial Test.
AFNOR, 2004, NF EN 13286-7—Unbound and Hydraulically Bound Mixtures. Part 7:
Cyclic Load Triaxial Test for Unbound Mixtures.
ASTM D5298-10. 2010. Standard test method for measurement of soil potential (suction) using
filter paper. West Conshohocken, PA: ASTM International.
ASTM International. 2011. Standard Test Method for Consolidated Drained Triaxial
Compression Test for Soils. ASTM D7181-11. West Conshohocken, PA: ASTM
International approved July 1, 2011. https://doi.org/10.1520/D7181-11
ASTM International. 2012. Standard Test Methods for Laboratory Compaction Characteristics
of Soil Using Standard Effort (12400 ft-lbf/ft3 (600 kN-m/m3)). ASTM D698-12. West
Conshohocken, PA: ASTM International approved June 10, 2000.
https://doi.org/10.1520/D0698-12
Ahmed, S., C. W. Lovell, & S. Diamond. 1974. Pore sizes and strength of compacted
clay. Journal of the Geotechnical Engineering Division, ASCE, 100 (GT4): 407-425.
Alias La voie ferr ee. 1984. Techniques de construction et d’entretien. 2nd Ed., Eyrolles.
ARA, Inc., ERES Consultants Division. 2004. Guide for mechanistic - empirical design of new
and rehabilitated pavement structures. Final report, NCHRP Project 1-37A. Transportation
Research Board, Washington, D.C.
Alonso, E. E., Pereira, J. M., Vaunat, J., & Olivella, S. 2010. A microstructurally based effective
stress for unsaturated soils. Géotechnique, 60(12), 913-925.
Azam, A. M., Cameron, D. A., & Rahman, M. M. 2015. Permanent strain of unsaturated
unbound granular materials from construction and demolition waste. Journal of Materials
in Civil Engineering, 27(3), 04014125.
Ba, M., Nokkaew, K., Fall, M., & Tinjum, J. M. 2013. Effect of matric suction on resilient
modulus of compacted aggregate base courses. Geotechnical and Geological Engineering,
31(5), 1497-1510.
Baetens, J. M., Verbist, K., Cornelis, W. M., Gabriels, D., and Soto, G. 2009. On the influence
of coarse fragments on soil water retention. Water resources research, 45(7).
Barksdale, R. D. 1972. Laboratory evaluation of rutting in base course materials. In Presented
at the Third International Conference on the Structural Design of Asphalt Pavements,
Grosvenor House, Park Lane, London, England, Sept. 11-15, 1972. (Vol. 1, No.
Proceeding).
References
269
Birle, E., D. Heyer and N. Vogt. 2008. Influence of the initial water content and dry density on
the soil–water retention curve and the shrinkage behavior of a compacted clay. Acta
Geotechnica, 3(3), p.191. https://doi.org/10.1007/s11440-008-0059-y.
Bonaquist, R. F., & Witczak, M. W. 1997. A comprehensive constitutive model for granular
materials in flexible pavement structures. In Eighth International Conference on Asphalt
PavementsFederal Highway Administration (No. Volume I).
Brown, S. F., & Hyde, A. F. L. 1975. Significance of cyclic confining stress in repeated-load
triaxial testing of granular material. Transportation research record, (537).
Caliendo, C. 2012. Local calibration and implementation of the mechanistic-empirical
pavement design guide for flexible pavement design. Journal of Transportation
Engineering, 138(3), 348-360.
Cary, C. E., & Zapata, C. E. 2011. Resilient modulus for unsaturated unbound materials. Road
Materials and Pavement Design, 12(3), 615-638.
Chen, W. B., Feng, W. Q., Yin, J. H., Borana, L., & Chen, R. P. 2019. Characterization of
permanent axial strain of granular materials subjected to cyclic loading based on
shakedown theory. Construction and Building Materials, 198, 751-761.
Cui, Y. J., & Delage, P. 1996. Yeilding and plastic behaviour of an unsaturated compacted silt.
Géotechnique, 46(2), 291-311.
Cui, Y. J., C. Loiseau, and P. Delage. 2002. Microstructure Changes of a Confined Swelling
Soil Due to Suction Controlled Hydration. In Unsaturated Soils: Proceedings of the Third
International Conference on Unsaturated Soils, UNSAT 2002, 10–13 March 2002, Recife,
Brazil, Vol. 2, edited by J. F. T. Jucá, T. M. P. de Campos, and F. A. M. Marinho, 593–
598. Lisse, the Netherlands: A. A. Balkema.
Cui, Y. J., Duong, T. V., Tang, A. M., Dupla, J. C., Calon, N., & Robinet, A. 2013. Investigation
of the hydro-mechanical behaviour of fouled ballast. Journal of Zhejiang University
Science A, 14(4), 244-255.
Cui, Y.J., F. Lamas-Lopez, V.N. Trinh, N. Calon, S.C. D’aguiar, J.C. Dupla, A.M. Tang, J.
Canou, and A. Robinet. 2014. Investigation of interlayer soil behaviour by field
monitoring. Transportation Geotechnics, 1(3), pp.91-105.
https://doi.org/10.1016/j.trgeo.2014.04.002.
Cui, Y. J. 2018. Mechanical behaviour of coarse grains/fines mixture under monotonic and
cyclic loadings. Transportation Geotechnics, 17, 91-97.
de Frias Lopez, R., Silfwerbrand, J., Jelagin, D., & Birgisson, B. 2016. Force transmission and
soil fabric of binary granular mixtures. Géotechnique, 66(7), 578-583.
Delage, P., Audiguier, M., Cui, Y.J. and Howat, M.D. 1996. Microstructure of a compacted
silt. Canadian Geotechnical Journal, 33(1), pp.150-158.
Delage, P., D. Marcial, Y.J. Cui, and X. Ruiz. 2006. Ageing effects in a compacted bentonite:
a microstructure approach. Géotechnique, 56(5), pp.291-304.
https://doi.org/10.1680/geot.2006.56.5.291.
References
270
Diamond, S., 1970. Pore size distributions in clays. Clays and clay minerals, 18(1), pp.7-23.
https://doi.org/10.1346/CCMN.1970.0180103.
Doucet, F., & Doré, G. 2004. Module réversible et coefficient de poisson réversible des
matériaux granulaires C-LTPP. In Proceedings of the 57th Canadian Geotechnical and 5th
Joint IAH-CNC and CGS groundwater specialty conferences CD-Rom, Québec.
Duong, T. V., Tang, A. M., Cui, Y. J., Trinh, V. N., Dupla, J. C., Calon, N., ... & Robinet, A.
2013. Effects of fines and water contents on the mechanical behavior of interlayer soil in
ancient railway sub-structure. Soils and foundations, 53(6), 868-878.
Duong, T. V., Cui, Y. J., Tang, A. M., Dupla, J. C., & Calon, N. 2014a. Effect of fine particles
on the hydraulic behavior of interlayer soil in railway substructure. Canadian geotechnical
journal, 51(7), 735-746.
Duong, T. V., Cui, Y. J., Tang, A. M., Dupla, J. C., Canou, J., Calon, N., & Robinet, A. 2014b.
Investigating the mud pumping and interlayer creation phenomena in railway sub-structure.
Engineering Geology, 171, 45-58.
Duong, T. V., Cui, Y. J., Tang, A. M., Dupla, J. C., Canou, J., Calon, N., & Robinet, A. 2016.
Effects of water and fines contents on the resilient modulus of the interlayer soil of railway
substructure. Acta Geotechnica, 11(1), 51-59.
Fiès, J. C., Louvigny, N. D. E., & Chanzy, A. 2002. The role of stones in soil water retention.
European Journal of Soil Science, 53(1), 95-104.
Gabr, A. R., & Cameron, D. A. 2013. Permanent strain modeling of recycled concrete aggregate
for unbound pavement construction. Journal of materials in civil engineering, 25(10), 1394-
1402.
Gao, Y., Sun, D. 2017. Soil-water retention behavior of compacted soil with different densities
over a wide suction range and its prediction. Computers and Geotechnics, 91(nov.):17-26.
Gargiulo, L., Mele, G., & Terribile, F. 2016. Effect of rock fragments on soil porosity: a
laboratory experiment with two physically degraded soils. European Journal of Soil
Science, 67(5), 597-604.
Gidel, G., Hornych, P., Breysse, D., & Denis, A. 2001. A new approach for investigating the
permanent deformation behaviour of unbound granular material using the repeated loading
triaxial apparatus. Bulletin des laboratoires des Ponts et Chaussées, (233).
Gupta, S., Ranaivoson, A., Edil, T., Benson, C., & Sawangsuriya, A. 2007. Pavement design
using unsaturated soil technology.
Han, Z., & Vanapalli, S. K. 2015. Model for predicting resilient modulus of unsaturated
subgrade soil using soil-water characteristic curve. Canadian Geotechnical Journal, 52(10),
1605-1619.
Han, Z., & Vanapalli, S. K. 2016a. Stiffness and shear strength of unsaturated soils in relation
to soil-water characteristic curve. Géotechnique, 66(8), 627-647.
References
271
Han, Z., & Vanapalli, S. K. 2016b. State-of-the-Art: Prediction of resilient modulus of
unsaturated subgrade soils. International Journal of Geomechanics, 16(4), 04015104.
Han, Z., & Vanapalli, S. K. 2016c. Relationship between resilient modulus and suction for
compacted subgrade soils. Engineering geology, 211, 85-97.
Heath, A. C., Pestana, J. M., Harvey, J. T., & Bejerano, M. O. 2004. Normalizing behavior of
unsaturated granular pavement materials. Journal of Geotechnical and Geoenvironmental
Engineering, 130(9), 896-904.
Hornych, P. 1993. Étude des déformations permanentes sous chargements répétés de trois
graves non traitées. Bulletin de liaison des Laboratoires des Ponts et Chaussées, (184).
Jibon, M., Mishra, D., & Kassem, E. 2020. Laboratory characterization of fine-grained soils for
Pavement ME Design implementation in Idaho. Transportation Geotechnics, 25, 100395.
Jing, P. 2017. Experimental study and modelling of the elastoplastic behaviour of unbound
granular materials under large number of cyclic loadings at various initial hydric states
(Doctoral dissertation, Université de Strasbourg).
Jing, P., Nowamooz, H., & Chazallon, C. 2018. Permanent deformation behaviour of a granular
material used in low-traffic pavements. Road Materials and Pavement Design, 19(2), 289-
314.
Johnson, T. C. 1986. Frost action predictive techniques for roads and airfields: A
comprehensive survey of research findings.
Khan, Z., El Naggar, M. H., & Cascante, G. 2011. Frequency dependent dynamic properties
from resonant column and cyclic triaxial tests. Journal of the Franklin Institute, 348(7),
1363-1376.
Khasawneh, M. A., & Al-jamal, N. F. 2019. Modeling resilient modulus of fine-grained
materials using different statistical techniques. Transportation Geotechnics, 21, 100263.
Khedr, S. 1985. Deformation characteristics of granular base course in flexible pavements.
Transportation Research Record, 1043, 131-138.
Khoury, N., Brooks, R., & Khoury, C. 2009. Environmental influences on the engineering
behavior of unsaturated undisturbed subgrade soils: Effect of soil suctions on resilient
modulus. International Journal of Geotechnical Engineering, 3(2), 303-311.
Khoury, C. N., Khoury, N. N., & Miller, G. A. 2011. Effect of cyclic suction history (hydraulic
hysteresis) on resilient modulus of unsaturated fine-grained soil. Transportation Research
Record, 2232(1), 68-75.
Khoury, N., Brooks, R., Boeni, S. Y., & Yada, D. 2013. Variation of resilient modulus, strength,
and modulus of elasticity of stabilized soils with postcompaction moisture contents. Journal
of Materials in Civil Engineering, 25(2), 160-166.
Kim, H., Ganju, E., Tang, D., Prezzi, M., and Salgado, R. 2015. Matric suction measurements
of compacted subgrade soils. Road Materials and Pavement Design, 16(2), 358-378.
References
272
Korkiala-Tanttu, L. 2005. A new material model for permanent deformations in pavements. In
Proceedings of the international conferences on the bearing capacity of roads, railways and
airfields.
Lamas-Lopez, F., d’Aguiar, S. C., Robinet, A., Cui, Y. J., Calon, N., Canou, J., ... & Tang, A.
M. 2015. In-situ investigation of the behaviour of a French conventional railway platform.
Proc., Transportation Research Board TRB 2015.
Lamas-Lopez, F. 2016. Field and laboratory investigation on the dynamic behavior of
conventional railway track-bed materials in the context of traffic upgrade. PhD Thesis,
Ecole Nationale des Ponts et Chaussées, Université Paris-Est.
Lashine, A. K., Brown, S. F., & Pell, P. S. 1971. Dynamic properties of soils. Department of
Civil Engineering, University of Nottingham (England).
Lekarp, F., & Dawson, A. 1998. Modelling permanent deformation behaviour of unbound
granular materials. Construction and building materials, 12(1), 9-18.
Leong, E.C., S. Tripathy, and H. Rahardjo. 2003. Total suction measurement of unsaturated
soils with a device using the chilled-mirror dew-point technique. Geotechnique, 53(2),
pp.173-182. https://doi.org/10.1680/geot.2003.53.2.173.
Li, D., & Selig, E. T. 1996. Cumulative plastic deformation for fine-grained subgrade soils.
Journal of geotechnical engineering, 122(12), 1006-1013.
Li, X. and L.M. Zhang. 2009. Characterization of dual-structure pore-size distribution of
soil. Canadian geotechnical journal, 46(2), pp.129-141. https://doi.org/10.1139/T08-110.
Liang, R. Y., Rabab’ah, S., & Khasawneh, M. 2008. Predicting moisture-dependent resilient
modulus of cohesive soils using soil suction concept. Journal of Transportation Engineering,
134(1), 34-40.
Lin, S. Y., Lin, P. S., Luo, H. S., & Juang, C. H. 2000. Shear modulus and damping ratio
characteristics of gravelly deposits. Canadian Geotechnical Journal, 37(3), 638-651.
Loach, S. C. 1987. Repeated loading of fine grained soils for pavement design (Doctoral
dissertation, University of Nottingham).
Lu, N., Godt, J. W., & Wu, D. T. 2010. A closed‐form equation for effective stress in
unsaturated soil. Water Resources Research, 46(5).
Menq, F. Y. 2003. Dynamic properties of sandy and gravelly soils. Ph.D. thesis, The University
of Texas at Austin.
Miao, L., S.L. Houston, Y. Cui, and J. Yuan. 2007. Relationship between soil structure and
mechanical behavior for an expansive unsaturated clay. Canadian Geotechnical
Journal, 44(2), pp.126-137. https://doi.org/10.1139/t06-108.
Moossazadeh, J., & Witczak, M. W. 1981. Prediction of subgrade moduli for soil that exhibits
nonlinear behavior. Transportation Research Record, (810).
References
273
Mousa, E., El-Badawy, S., & Azam, A. 2020. Evaluation of Reclaimed Asphalt Pavement as
Base/Subbase Material in Egypt. Transportation Geotechnics, 100414.
Muñoz-Castelblanco, J. A., Pereira, J. M., Delage, P., and Cui, Y. J. 2010. Suction
measurements on a natural unsaturated soil: A reappraisal of the filter paper method. In
Unsaturated Soils-Proc. Fifth Int. Conf. on Unsaturated Soils (Vol. 1, pp. 707-712). CRC
Press.
Ng, C. W. W., Zhou, C., Yuan, Q., & Xu, J. 2013. Resilient modulus of unsaturated subgrade
soil: experimental and theoretical investigations. Canadian Geotechnical Journal, 50(2),
223-232.
Ng, C. W. W., Baghbanrezvan, S., Sadeghi, H., Zhou, C., & Jafarzadeh, F. 2017. Effect of
specimen preparation techniques on dynamic properties of unsaturated fine-grained soil at
high suctions. Canadian Geotechnical Journal, 54(9), 1310-1319.
Nowamooz, H., Chazallon, C., Arsenie, M. I., Hornych, P., & Masrouri, F. 2011. Unsaturated
resilient behavior of a natural compacted sand. Computers and Geotechnics, 38(4), 491-
503.
Oh, W. T., Vanapalli, S. K., & Puppala, A. J. 2009. Semi-empirical model for the prediction of
modulus of elasticity for unsaturated soils. Canadian Geotechnical Journal, 46(8), 903-914.
Oh, J. H., Fernando, E. G., Holzschuher, C., & Horhota, D. 2012. Comparison of resilient
modulus values for Florida flexible mechanistic-empirical pavement design. International
Journal of Pavement Engineering, 13(5), 472-484.
Parreira, A. B., & Gonçalves, R. F. 2000. The influence of moisture content and soil suction on
the resilient modulus of a lateritic subgrade soil. In ISRM International Symposium.
International Society for Rock Mechanics and Rock Engineering.
Puppala, A. J., Chomtid, S., & Bhadriraju, V. 2005. Using repeated-load triaxial tests to evaluate
plastic strain potentials in subgrade soils. Transportation research record, 1913(1), 86-98.
Qi, S., Cui, Y. J., Chen, R. P., Wang, H. L., Lamas-Lopez, F., Aimedieu, P., ... & Saussine, G.
2020a. Influence of grain size distribution of inclusions on the mechanical behaviours of
track-bed materials. Géotechnique, 70(3), 238-247.
Qi, S., Cui, Y. J., Dupla, J. C., Chen, R. P., Wang, H. L., Su, Y., ... & Canou, J. 2020b.
Investigation of the parallel gradation method based on the response of track-bed materials
under cyclic loadings. Transportation Geotechnics, 100360.
Ravina, I., & Magier, J. 1984. Hydraulic conductivity and water retention of clay soils
containing coarse fragments. Soil Science Society of America Journal, 48(4), 736-740.
Robinet. 2014. Investigating the mud pumping and interlayer creation phenomena in railway
sub-structure. Engineering geology, 171, pp.45-58.
https://doi.org/10.1016/j.enggeo.2013.12.016.
Rollins, K. M., Evans, M. D., Diehl, N. B., & III, W. D. D. 1998. Shear modulus and damping
relationships for gravels. Journal of Geotechnical and Geoenvironmental Engineering,
124(5), 396-405.

References
274
Romero, E., Gens, A., & Lloret, A. 1999. Water permeability, water retention and
microstructure of unsaturated compacted Boom clay. Engineering Geology, 54(1-2), 117-
127.
Romero, E., DELLA VECCHIA, G. A. B. R. I. E. L. E., and Jommi, C. 2011. An insight into
the water retention properties of compacted clayey soils. Géotechnique, 61(4), 313-328.
Saba, S., Barnichon, J.D., Cui, Y.J., Tang, A.M., Delage, P. 2014. Microstructure and
anisotropic swelling behaviour of compacted bentonite/sand mixture. Journal of Rock
Mechanics and Geotechnical Engineering 6(2), 126-132.
Salager, S., Nuth, M., Ferrari, A., and Laloui, L. 2013. Investigation into water retention
behaviour of deformable soils. Canadian Geotechnical Journal, 50(2), 200-208.
Sawangsuriya, A., Edil, T. B., & Benson, C. H. 2009. Effect of suction on resilient modulus of
compacted fine-grained subgrade soils. Transportation research record, 2101(1), 82-87.
Seed, H. B., Chan, C. K., & Lee, C. E. 1962. Resilience characteristics of subgrade soils and
their relation to fatigue failures in asphalt pavements. In International Conference on the
Structural Design of Asphalt Pavements. SupplementUniversity of Michigan, Ann Arbor.
Seed, H. B., Wong, R. T., Idriss, I. M., & Tokimatsu, K. 1986. Moduli and damping factors for
dynamic analyses of cohesionless soils. Journal of geotechnical engineering, 112(11),
1016-1032.
Seif El Dine, B., Dupla, J. C., Frank, R., Canou, J., & Kazan, Y. 2010. Mechanical
characterization of matrix coarse-grained soils with a large-sized triaxial device. Canadian
Geotechnical Journal, 47(4), 425-438.
Selig, E. T., & Waters, J. M. 1994. Track geotechnology and substructure management. Thomas
Telford.
Shenton, M. J. 1974. Deformation of railway ballast under repeated loading triaxial tests. Soil
Mechanics Section, British Railways Research Departement, Derby, England.
Simms, P. H., and Yanful, E. K. 2002. Predicting soil—Water characteristic curves of
compacted plastic soils from measured pore-size distributions. Géotechnique, 52(4), 269-
278.
Song, Y., & Ooi, P. S. 2010. Interpretation of shakedown limit from multistage permanent
deformation tests. Transportation research record, 2167(1), 72-82.
Spomer, L. A. 1980. Prediction and Control of Porosity and Water Retention in Sand‐Soil
Mixtures for Drained Turf Sites 1. Agronomy Journal, 72(2), 361-362.
Stewart, H. E. 1982. The prediction of track performance under dynamic traffic loading. Ph.D.
thesis, University of Massachusetts.
Su, Y., Cui, Y. J., Dupla, J. C., & Canou, J. 2020a. Investigation of the effect of water content
on the mechanical behavior of track-bed materials under various coarse grain contents.
Construction and Building Materials, 263, 120206.
References
275
Su, Y., Cui, Y. J., Dupla, J. C., Canou, J., & Qi, S. 2020b. A fatigue model for track-bed
materials with consideration of the effect of coarse grain content. Transportation
Geotechnics, 23, 100353.
Su, Y., Cui, Y. J., Dupla, J. C., Canou, J., & Qi, S. 2020c. Developing a Sample Preparation
Approach to Study the Mechanical Behavior of Unsaturated Fine/Coarse Soil Mixture.
Geotechnical Testing Journal, 44(4).
Su, Y., Cui, Y. J., Dupla, J. C., & Canou, J. 2021a. Effect of water content on resilient modulus
and damping ratio of fine/coarse soil mixtures with varying coarse grain contents.
Transportation Geotechnics, 26, 100452.
Su, Y., Cui, Y. J., Dupla, J. C., & Canou, J. 2021b. Effect of water content on permanent
deformation of fine/coarse soil mixtures with varying coarse grain contents and subjected
to multi-stage cyclic loading. Submitted to Acta Geotechnica.
Su, Y., Cui, Y. J., Dupla, J. C., & Canou, J. 2021c. Soil-water retention behaviour of fine/coarse
soil mixture with varying coarse grain contents and fine soil dry densities. Canadian
Geotechnical Journal.
Suiker, A.S.J., 2005. Static and cyclic triaxial testing of coarse-grained and fine-grained
granular materials. Delft.
Sun, W. J., and Cui, Y. J. 2020. Determining the soil-water retention curve using mercury
intrusion porosimetry test in consideration of soil volume change. Journal of Rock
Mechanics and Geotechnical Engineering, 12(5), 1070-1079.
Sweere, G.T.H. 1990. Unbound Granular Bases for Roads. PhD Thesis. Delft, Netherlands.
Tao, M., Mohammad, L. N., Nazzal, M. D., Zhang, Z., & Wu, Z. 2010. Application of
shakedown theory in characterizing traditional and recycled pavement base materials.
Journal of Transportation Engineering, 136(3), 214-222.
Tennakoon, N., & Indraratna, B. 2014. Behaviour of clay-fouled ballast under cyclic loading.
Géotechnique, 64(6), 502-506.
Thompson, M. R., & Robnett, Q. L. 1979. Resilient properties of subgrade soils. Transportation
Engineering Journal of ASCE, 105(1), 71-89.
Trinh, V. N. 2011. Comportement hydromécanique des matériaux constitutifs de plateformes
ferroviaires anciennes. PhD Thesis, Ecole Nationale des Ponts et Chaussées, Université
Paris-Est.
Trinh, V. N., Tang, A. M., Cui, Y. J., Dupla, J. C., Canou, J., Calon, N., ... & Schoen, O. 2012.
Mechanical characterisation of the fouled ballast in ancient railway track substructure by
large-scale triaxial tests. Soils and foundations, 52(3), 511-523.
Vallejo, L. E., & Mawby, R. 2000. Porosity influence on the shear strength of granular material–
clay mixtures. Engineering Geology, 58(2), 125-136.
Vallejo, L. E. 2001. Interpretation of the limits in shear strength in binary granular mixtures.
Canadian Geotechnical Journal, 38(5), 1097-1104.
References
276
van Genuchten, M. T. 1980. A closed‐form equation for predicting the hydraulic conductivity
of unsaturated soils. Soil science society of America journal, 44(5), 892-898.
Vanapalli, S.K., D.G. Fredlund, D.E. Pufahl, and A.W. Clifton, 1996a. Model for the prediction
of shear strength with respect to soil suction. Canadian Geotechnical Journal, 33(3),
pp.379-392. https://doi.org/10.1139/t96-060.
Vanapalli, S.K., D.G. Fredlund, D.E. Pufahl. 1996b. The relationship between the soil-water
characteristic curve and the unsaturated shear strength of a compacted glacial
till. Geotechnical Testing Journal, 19(3), pp.259-268. https://doi.org/10.1520/GTJ10351J.
Vanapalli, S. K., Fredlund, D. G., & Pufahl, D. E. 1999. The influence of soil structure and
stress history on the soil–water characteristics of a compacted till. Geotechnique, 49(2),
143-159.
Varandas, J.N., 2013. Long-Term Behaviour of Railway Transitions Under Dynamic Loading.
Vermeer, P. A. 1998. Non-associated Plasticity for Soils, Concrete and Rock. In Physics of Dry
Granular Media, edited by H. J.Herrmann, J. P. Hovi, and S. Luding, 163–196. Dordrecht,
the Netherlands: Springer. https://doi.org/10.1007/978-94-017-2653-5_10
Wan, Z., Bian, X., Li, S., Chen, Y., & Cui, Y. 2020. Remediation of mud pumping in ballastless
high-speed railway using polyurethane chemical injection. Construction and Building
Materials, 259, 120401.
Wang, H. L., Cui, Y. J., Lamas-Lopez, F., Dupla, J. C., Canou, J., Calon, N., ... and Chen, R. P.
2017. Effects of inclusion contents on resilient modulus and damping ratio of unsaturated
track-bed materials. Canadian Geotechnical Journal, 54(12), 1672-1681.
Wang, H. L., Cui, Y. J., Lamas-Lopez, F., Calon, N., Saussine, G., Dupla, J. C., ... & Chen, R.
P. 2018a. Investigation on the mechanical behavior of track-bed materials at various
contents of coarse grains. Construction and Building Materials, 164, 228-237.
Wang, H.L., Cui, Y.J., Lamas-Lopez, F., Dupla, J.C., Canou, J., Calon, N., Saussine, G.,
Aimedieu, P. and Chen, R.P., 2018b. Permanent deformation of track-bed materials at
various inclusion contents under large number of loading cycles. Journal of Geotechnical
and Geoenvironmental Engineering, 144(8), p.04018044.
Wang, H. L., Chen, R. P., Qi, S., Cheng, W., & Cui, Y. J. 2018c. Long-term performance of
pile-supported ballastless track-bed at various water levels. Journal of Geotechnical and
Geoenvironmental Engineering, 144(6), 04018035.
Wang, Q., Cui, Y. J., Tang, A. M., Xiang-Ling, L., and Wei-Min, Y. 2014. Time-and density-
dependent microstructure features of compacted bentonite. Soils and Foundations, 54(4),
657-666.
Werkmeister, S., Dawson, A. R., & Wellner, F. 2001. Permanent deformation behavior of
granular materials and the shakedown concept. Transportation Research Record, 1757(1),
75-81.
References
277
Werkmeister, S. 2004a. Permanent deformation behaviour of unbound granular materials in
pavement constructions. Thesis dissertation, Fakultät Bauingenieurweser der Technischen
Universität Dresden.
Werkmeister, S., Dawson, A. R., & Wellner, F. 2004b. Pavement design model for unbound
granular materials. Journal of Transportation Engineering, 130(5), 665-674.
Yang, S. R., Huang, W. H., & Tai, Y. T. 2005. Variation of resilient modulus with soil suction
for compacted subgrade soils. Transportation Research Record, 1913(1), 99-106.
Yang, S. R., Kung, J. H., Huang, W. H., & Lin, H. D. 2006. Resilient modulus of unsaturated
cohesive subgrade soils. Yantu Gongcheng Xuebao(Chinese Journal of Geotechnical
Engineering), 28(2), 225-229.
Yang, S. R., & Huang, W. H. 2007. Permanent deformation and critical stress of cohesive soil
under repeated loading. Transportation research record, 2016(1), 23-30.
Yang, S. R., Lin, H. D., Kung, J. H., & Huang, W. H. 2008. Suction-controlled laboratory test
on resilient modulus of unsaturated compacted subgrade soils. Journal of Geotechnical and
Geoenvironmental Engineering, 134(9), 1375-1384.
Zaman, M., & Khoury, N. 2007. Effect of soil suction and moisture on resilient modulus of
subgrade soils in Oklahoma (No. ORA 125-6662).
Zeng, Z., Cui, Y. J., Conil, N., and Talandier, J. 2020. Experimental study on the aeolotropic
swelling behaviour of compacted bentonite/claystone mixture with axial/radial
technological voids. Engineering Geology, 278, 105846.
Zhalehjoo, N., Tolooiyan, A., Mackay, R., & Bodin, D. 2018. The effect of instrumentation on
the determination of the resilient modulus of unbound granular materials using advanced
repeated load triaxial testing. Transportation Geotechnics, 14, 190-201.
Zhang, L.M. and Li, X., 2010. Microporosity structure of coarse granular soils. Journal of
Geotechnical and Geoenvironmental Engineering, 136(10), pp.1425-1436.
Zhang, T.W., Y.J. Cui, F. Lamas-Lopez, N. Calon, and S. Costa D’Aguiar. 2018a. Compacted
soil behaviour through changes of density, suction, and stiffness of soils with remoulding
water content. Canadian Geotechnical Journal, 55(2), pp.182-190.
https://doi.org/10.1139/cgj-2016-0628.
Zhang, F., Cui, Y. J., and Ye, W. M. 2018b. Distinguishing macro-and micro-pores for materials
with different pore populations. Géotechnique Letters, 8(2), 102-110.
Zhao, H. F., Zhang, L. M., & Fredlund, D. G. 2013. Bimodal shear-strength behavior of
unsaturated coarse-grained soils. Journal of geotechnical and geoenvironmental
engineering, 139(12), 2070-2081.