Procedure for Classification of Coarse Aggregates Based on ...
130
l. Report No. FHWAITX-94/1244-9 I 2. Government Accession No. 4. Title and Subtitle PROCEDURE FOR CLASSIFICATION OF COARSE AGGREGATES BASED ON PROPERTIES AFFECTING PERFORMANCE 7. Author(s) Srikrishna Peapully, Dan G. Zollinger and B. Frank McCullough 9. Performing Organization Name and Address Texas Transportation Institute The Texas A&M University System College Station, Texas 77843-3135 12. Sponsoring Agency Name and Address Texas Department of Transportation Research and Technology Transfer Office P. 0. Box 5080 Austin, Texas 78763-5080 15. Supplementary Notes Technical Report Documentation Page J. Recipient's Catalog No. S. Report Date November 1994 6. .t'errorming Orgamzation Code 8. Performing Organization Report No. esearch Report 1244-9 . Work Umt No. {TRAIS) 11. Contract or Grant No. Study no. 0-1244 13. Type ot Keport ana t'enod covered Interim: September 1992 - August 1994 14. Sponsoring Agency Code Research performed in cooperation with the Texas Department of Transportation and the U.S. Department of Transportation, Federal Highway Administration. Research Study Title: Evaluation of the Performance of Texas Pavement Made with Different Coarse Aggregates. 16. Abstract Coarse aggregate is the major constituent of both Portland cement concrete and asphalt concrete and is therefore widely used for construction purposes. A classification system for coarse aggregates would provide a systematic means for the identification of aggregates which could be used in the selection of aggregates for different construction activities. The objectives of this research were as follows: (I) to characterize the aggregates based on their properties, (2) to develop a framework for an Aggregate Classification System (ACS), (3) to provide the basis for the implementation of ACS, and (4) to recommend test procedures and equipment needed to carry out tests on aggregates as required by the ACS. The classification system is developed in two stages: (1) comprehensive aggregate classification system incorporating all significant aggregate properties affecting pavement performance, and (2) simplified version of the comprehensive aggregate classification system. The ACS is recommended for implementation at three levels: (I) identification of aggregates, (2) simplified aggregate evaluation, and (3) detailed aggregate evaluation to supplement (1) and (2) as needed. This report also discusses the basic tests recommended for aggregate evaluation and lists the required equipment for these tests. Aggregate properties and their respective performance indicators are tabulated. Various areas of further research are identified and recommendations are made for the implementation of the proposed classification system. 17 Key Words Coarse Aggregates, Pavements, Aggregate Classification System, Evaluation of Aggregates, Properties of Aggregates, Testing, Equipment 18. u1stribution :statement No Restrictions. This document is available to the public through NTIS: National Technical Information Service 5285 Port Royal Road Springfield, Virginia 22161 19. Security Class it( ot this report) Unclassified I LU. Secunty c1ass1t.(ot lus page) Unclassified 1 21. No. ot Pages 129 122. Pnce
-
Upload
khangminh22 -
Category
Documents
-
view
1 -
download
0
Transcript of Procedure for Classification of Coarse Aggregates Based on ...

l. Report No.
FHW AITX-94/1244-9 I 2. Government Accession No.
4. Title and Subtitle
PROCEDURE FOR CLASSIFICATION OF COARSE AGGREGATES BASED ON PROPERTIES AFFECTING PERFORMANCE 7. Author(s)
Srikrishna Peapully, Dan G. Zollinger and B. Frank McCullough 9. Performing Organization Name and Address
Texas Transportation Institute The Texas A&M University System College Station, Texas 77843-3135 12. Sponsoring Agency Name and Address
Texas Department of Transportation Research and Technology Transfer Office P. 0. Box 5080 Austin, Texas 78763-5080
15. Supplementary Notes
Technical Report Documentation Page
J. Recipient's Catalog No.
S. Report Date
November 1994 6. .t'errorming Orgamzation Code
8. Performing Organization Report No.
esearch Report 1244-9 . Work Umt No. {TRAIS)
11. Contract or Grant No.
Study no. 0-1244 13. Type ot Keport ana t'enod covered
Interim: September 1992 -August 1994
14. Sponsoring Agency Code
Research performed in cooperation with the Texas Department of Transportation and the U.S. Department of Transportation, Federal Highway Administration. Research Study Title: Evaluation of the Performance of Texas Pavement Made with Different Coarse Aggregates. 16. Abstract
Coarse aggregate is the major constituent of both Portland cement concrete and asphalt concrete and is therefore widely used for construction purposes. A classification system for coarse aggregates would provide a systematic means for the identification of aggregates which could be used in the selection of aggregates for different construction activities.
The objectives of this research were as follows: (I) to characterize the aggregates based on their properties, (2) to develop a framework for an Aggregate Classification System (ACS), (3) to provide the basis for the implementation of ACS, and ( 4) to recommend test procedures and equipment needed to carry out tests on aggregates as required by the ACS.
The classification system is developed in two stages: (1) comprehensive aggregate classification system incorporating all significant aggregate properties affecting pavement performance, and (2) simplified version of the comprehensive aggregate classification system. The ACS is recommended for implementation at three levels: (I) identification of aggregates, (2) simplified aggregate evaluation, and (3) detailed aggregate evaluation to supplement (1) and (2) as needed.
This report also discusses the basic tests recommended for aggregate evaluation and lists the required equipment for these tests. Aggregate properties and their respective performance indicators are tabulated. Various areas of further research are identified and recommendations are made for the implementation of the proposed classification system. 17 Key Words
Coarse Aggregates, Pavements, Aggregate Classification System, Evaluation of Aggregates, Properties of Aggregates, Testing, Equipment
18. u1stribution :statement
No Restrictions. This document is available to the public through NTIS: National Technical Information Service 5285 Port Royal Road Springfield, Virginia 22161
19. Security Class it( ot this report)
Unclassified I LU. Secunty c1ass1t.(ot lus page)
Unclassified 1
21. No. ot Pages
129 122. Pnce


PROCEDURE FOR CLASSIFICATION OF COARSE AGGREGATES BASED ON PROPERTIES AFFECTING
PERFORMANCE
by
Srikrishna Peapully Graduate Research Assistant
Texas Transportation Institute
Dan G. Zollinger Assistant Research Engineer
Texas Transportation Institute
and
B. Frank McCullough Director, Center for Transportation Research
University of Texas at Austin
Research Report 1244-9 Research Study Number 0-1244
Research Study Title: Evaluation of the Performance of Texas Pavements Made with Different Coarse Aggregates
Sponsored by the Texas Department of Transportation
In Cooperation with U.S. Department of Transportation Federal Highway Administration
November 1994
TEXAS TRANSPORTATION INSTITUTE The Texas A&M University System College Station, Texas 77843-3135


IMPLEMENTATION STATEMENT
The classification system discussed in this report will assist in evaluating the
performance of coarse aggregates prior to their use in the field. Performance assessment of
aggregates will provide information regarding the necessity of blending of aggregates for
arriving at equal performance with different aggregates. Using different aggregates can lead
to better material selection and, thus, better performance of pavements and other structures in
which coarse aggregates are used. Implementation of the proposed aggregate classification
system can result in direct cost benefits to the Texas Department of Transportation.
v


DISCLAIMER
The contents of the report reflect the views of the authors, who are responsible for the
facts and accuracy of the information presented herein. The contents do not necessarily
reflect the official views or policies of the Federal Highway Administration or the Texas
Department of Transportation. This report does not constitute a standard, specification, or
regulation.
Vll

ACKNOWLEDGMENT
Research findings presented in this report are a result of joint efforts between the Texas
Transportation Institute, Texas A&M University, and the Center for Transportation Research,
University of Texas at Austin. The Authors would like to thank the staff of the Texas
Department of Transportation for their support throughout this study as well as the U.S.
Department of Transportation, Federal Highway Administration.
Vlll

TABLE OF CONTENTS
Page
LIST OF FIGURES . . . . . . . . . . . . . . . . . . . . . . . . . . . . . . . . . . . . . . . . . . . . . . . . XI
LIST OF TABLES ................................................ xiii
SUMMARY ..................................................... xv
CHAPTER 1: INTRODUCTION ...................................... I
I. I Background . . . . . . . . . . . . . . . . . . . . . . . . . . . . . . . . . . . . . . . . . . . . . . I
I .2 Purpose and Scope . . . . . . . . . . . . . . . . . . . . . . . . . . . . . . . . . . . . . . . . . . 3
1.3 Importance of Classification Systems . . . . . . . . . . . . . . . . . . . . . . . . . . . . . 4
1.4 Requirements of a Classification System ........................... 4
CHAPTER 2: OVERVIEW OF EXISTING CLASSIFICATION SYSTEMS ........ 7
2.1 Soil Classification Systems . . . . . . . . . . . . . . . . . . . . . . . . . . . . . . . . . . . . 7
2.2 Rock Classification Systems . . . . . . . . . . . . . . . . . . . . . . . . . . . . . . . . . . 11
2.3 Previous Efforts in Developing an Aggregate
Classification System . . . . . . . . . . . . . . . . . . . . . . . . . . . . . . . . . . . . . . . I 7
2.4 Classification of Synthetic Coarse Aggregates ...................... 25
2.5 Comments on Existing Aggregate Classification Systems ............... 27
CHAPTER 3: PROPERTIES OF MINERAL AGGREGATES . . . . . . . . . . . . . . . . . 3 I
3.1 Characterization of Natural Aggregates ........................... 31
3.2 Significance and Effects of Aggregate Properties
on Performance . . . . . . . . . . . . . . . . . . . . . . . . . . . . . . . . . . . . . . . . . . . 39
CHAPTER 4: DEVELOPMENT OF AGGREGATE CLASSIFICATION
SYSTEM ........................................... 43
4.1 Format of the Proposed Classification System ...................... 43
4.2 Basic Classification Groups . . . . . . . . . . . . . . . . . . . . . . . . . . . . . . . . . . . 44
4.3 Classification of Aggregates Based on Visual Examination .............. 46
4.4 Classification of Aggregates Based on Laboratory
Investigation ............................................. 47
4.5 Simplified Format of the Aggregate Classification System .............. 56
IX

TABLE OF CONTENTS (Continued)
CHAPTER 5: BASIS OF AGGREGATE CLASSIFICATION
SYSTEM IMPLEMENTATION ........................... 61
5.1 Field Investigations . . . . . . . . . . . . . . . . . . . . . . . . . . . . . . . . . . . . . . . . 61
5.2 Laboratory Studies ......................................... 71
5.3 Guidelines for Implementation of Classification System ................ 73
5.4 Relation of Aggregate Properties to Performance .................... 75
CHAPTER 6: TESTS AND EQUIPMENT FOR AGGREGATE
EVALUATION ....................................... 81
6.1 Aggregate Type Classification ................................. 81
6.2 Shape Classification . . . . . . . . . . . . . . . . . . . . . . . . . . . . . . . . . . . . . . . . 82
6.3 Textural Characteristic . . . . . . . . . . . . . . . . . . . . . . . . . . . . . . . . . . . . . . 86
6.4 Oxide Content ............................................ 86
6.5 Abrasion Resistance . . . . . . . . . . . . . . . . . . . . . . . . . . . . . . . . . . . . . . . . 88
6.6 Other Tests on Aggregates ................................... 90
CHAPTER 7: CONCLUSIONS AND RECOMMENDATIONS ................ 93
7.1 Conclusions ............................................. 93
7 .2 Recommendations for Implementation and Further
Research . . . . . . . . . . . . . . . . . . . . . . . . . . . . . . . . . . . . . . . . . . . . . . . . 94
REFERENCES . . . . . . . . . . . . . . . . . . . . . . . . . . . . . . . . . . . . . . . . . . . . . . . . . . . 95
APPENDIX A . . . . . . . . . . . . . . . . . . . . . . . . . . . . . . . . . . . . . . . . . . . . . . . . . . . . 99
APPENDIX B ................................................... 109
x
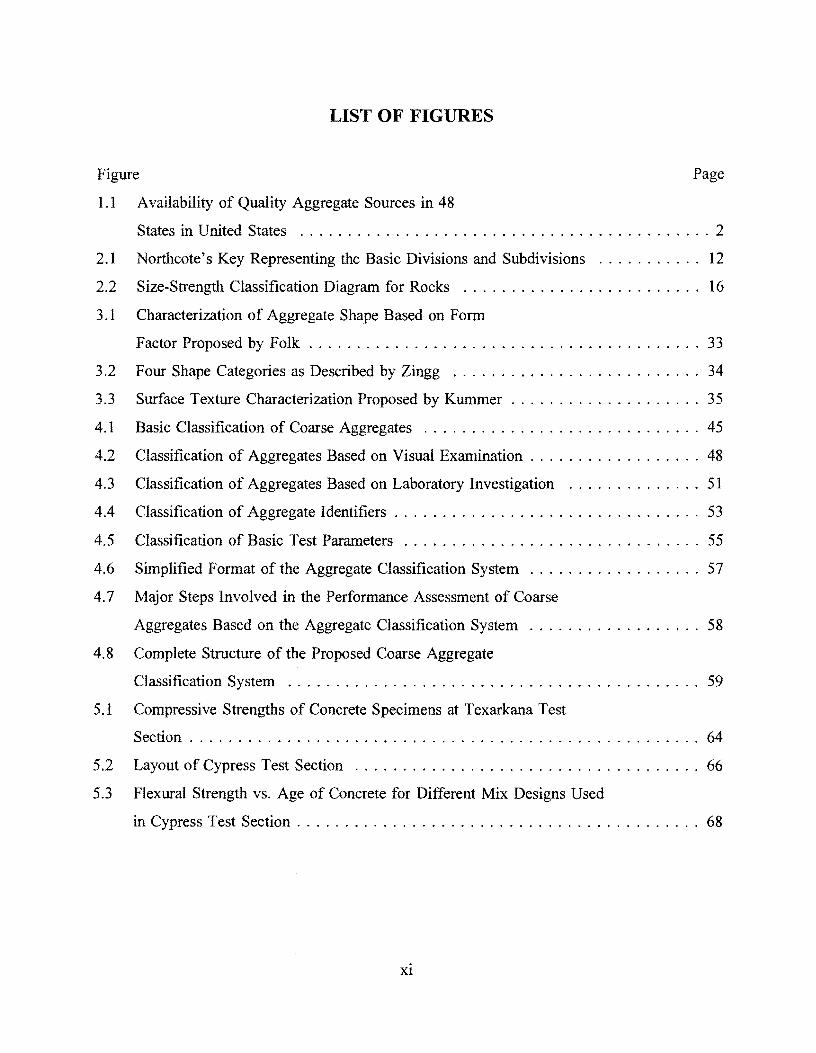
LIST OF FIGURES
Figure Page
1.1 Availability of Quality Aggregate Sources in 48
States in United States ........................................... 2
2.1 Northcote's Key Representing the Basic Divisions and Subdivisions ........... 12
2.2 Size-Strength Classification Diagram for Rocks . . . . . . . . . . . . . . . . . . . . . . . . . 16
3.1 Characterization of Aggregate Shape Based on Form
Factor Proposed by Folk ......................................... 33
3.2 Four Shape Categories as Described by Zingg .......................... 34
3.3 Surface Texture Characterization Proposed by Kummer .................... 35
4.1 Basic Classification of Coarse Aggregates . . . . . . . . . . . . . . . . . . . . . . . . . . . . . 45
4.2 Classification of Aggregates Based on Visual Examination .................. 48
4.3 Classification of Aggregates Based on Laboratory Investigation . . . . . . . . . . . . . . 51
4.4 Classification of Aggregate Identifiers . . . . . . . . . . . . . . . . . . . . . . . . . . . . . . . . 53
4.5 Classification of Basic Test Parameters . . . . . . . . . . . . . . . . . . . . . . . . . . . . . . . 55
4.6 Simplified Format of the Aggregate Classification System .................. 57
4. 7 Major Steps Involved in the Performance Assessment of Coarse
Aggregates Based on the Aggregate Classification System .................. 58
4.8 Complete Structure of the Proposed Coarse Aggregate
Classification System . . . . . . . . . . . . . . . . . . . . . . . . . . . . . . . . . . . . . . . . . . . 59
5.1 Compressive Strengths of Concrete Specimens at Texarkana Test
Section ..................................................... 64
5.2 Layout of Cypress Test Section .................................... 66
5.3 Flexural Strength vs. Age of Concrete for Different Mix Designs Used
in Cypress Test Section .......................................... 68
XI
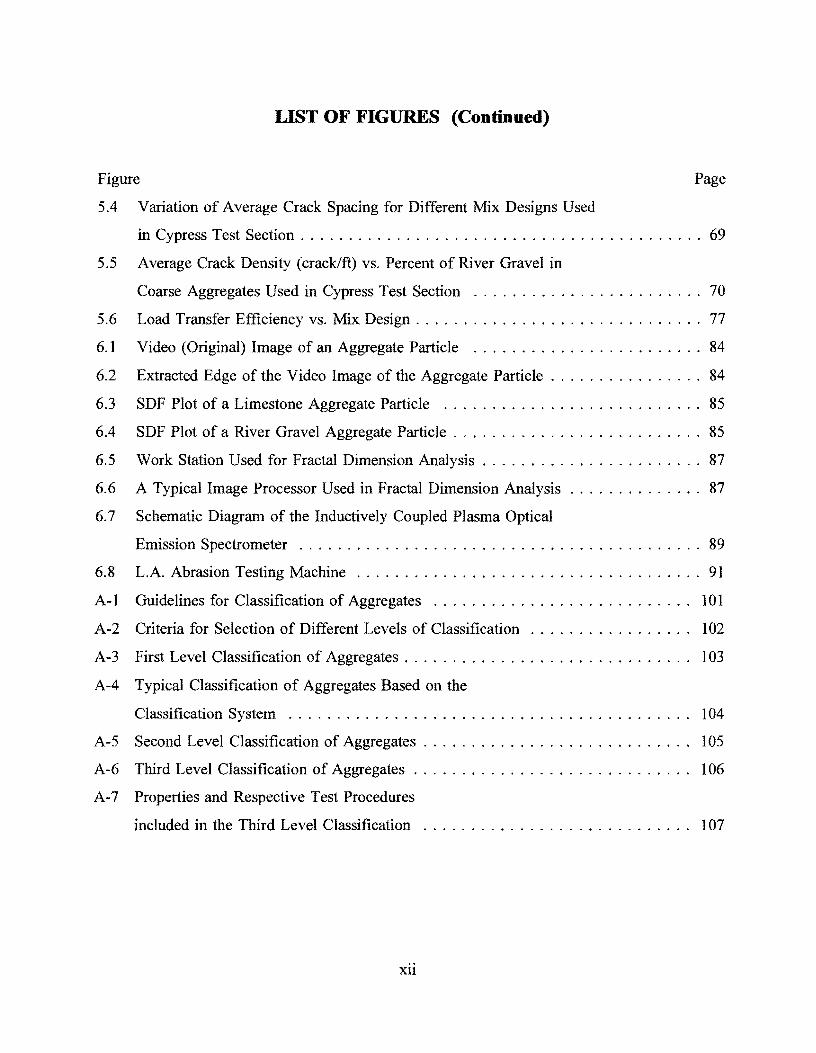
LIST OF FIGURES (Continued)
Figure Page
5.4 Variation of Average Crack Spacing for Different Mix Designs Used
in Cypress Test Section .......................................... 69
5.5 Average Crack Density (crack/ft) vs. Percent of River Gravel in
Coarse Aggregates Used in Cypress Test Section ........................ 70
5.6 Load Transfer Efficiency vs. Mix Design . . . . . . . . . . . . . . . . . . . . . . . . . . . . . . 77
6.1 Video (Original) Image of an Aggregate Particle . . . . . . . . . . . . . . . . . . . . . . . . 84
6.2 Extracted Edge of the Video Image of the Aggregate Particle . . . . . . . . . . . . . . . . 84
6.3 SDF Plot of a Limestone Aggregate Particle . . . . . . . . . . . . . . . . . . . . . . . . . . . 85
6.4 SDF Plot of a River Gravel Aggregate Particle . . . . . . . . . . . . . . . . . . . . . . . . . . 85
6.5 Work Station Used for Fractal Dimension Analysis ....................... 87
6.6 A Typical Image Processor Used in Fractal Dimension Analysis . . . . . . . . . . . . . . 87
6. 7 Schematic Diagram of the Inductively Coupled Plasma Optical
Emission Spectrometer .......................................... 89
6.8 L.A. Abrasion Testing Machine .................................... 91
A-1 Guidelines for Classification of Aggregates . . . . . . . . . . . . . . . . . . . . . . . . . . . I 01
A-2 Criteria for Selection of Different Levels of Classification . . . . . . . . . . . . . . . . . 102
A-3 First Level Classification of Aggregates . . . . . . . . . . . . . . . . . . . . . . . . . . . . . . 103
A-4 Typical Classification of Aggregates Based on the
Classification System . . . . . . . . . . . . . . . . . . . . . . . . . . . . . . . . . . . . . . . . . . I 04
A-5 Second Level Classification of Aggregates . . . . . . . . . . . . . . . . . . . . . . . . . . . . 105
A-6 Third Level Classification of Aggregates . . . . . . . . . . . . . . . . . . . . . . . . . . . . . 106
A-7 Properties and Respective Test Procedures
included in the Third Level Classification . . . . . . . . . . . . . . . . . . . . . . . . . . . . 107
Xll
Table
2.1
2.2
2.3
2.4
2.5
2.6
2.7
2.8
2.9
3.1
4.1
4.2
4.3
5.1
5.2
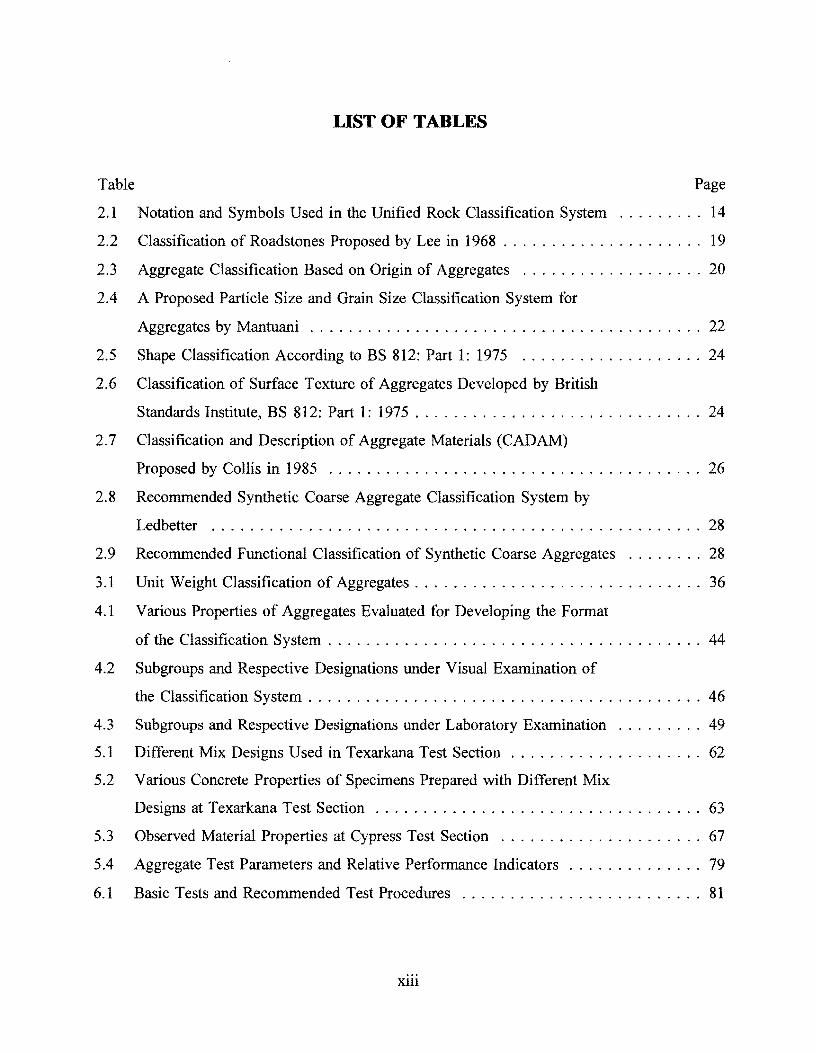
LIST OF TABLES
Page
Notation and Symbols Used in the Unified Rock Classification System . . . . . . . . . 14
Classification of Roadstones Proposed by Lee in 1968 . . . . . . . . . . . . . . . . . . . . . 19
Aggregate Classification Based on Origin of Aggregates . . . . . . . . . . . . . . . . . . . 20
A Proposed Particle Size and Grain Size Classification System for
Aggregates by Mantuani . . . . . . . . . . . . . . . . . . . . . . . . . . . . . . . . . . . . . . . . . 22
Shape Classification According to BS 812: Part 1: 1975 ................... 24
Classification of Surface Texture of Aggregates Developed by British
Standards Institute, BS 812: Part 1: 1975 .............................. 24
Classification and Description of Aggregate Materials (CADAM)
Proposed by Collis in 1985 . . . . . . . . . . . . . . . . . . . . . . . . . . . . . . . . . . . . . . . 26
Recommended Synthetic Coarse Aggregate Classification System by
Ledbetter . . . . . . . . . . . . . . . . . . . . . . . . . . . . . . . . . . . . . . . . . . . . . . . . . . . 28
Recommended Functional Classification of Synthetic Coarse Aggregates . . . . . . . . 28
Unit Weight Classification of Aggregates .............................. 36
Various Properties of Aggregates Evaluated for Developing the Format
of the Classification System ....................................... 44
Subgroups and Respective Designations under Visual Examination of
the Classification System . . . . . . . . . . . . . . . . . . . . . . . . . . . . . . . . . . . . . . . . . 46
Subgroups and Respective Designations under Laboratory Examination ......... 49
Different Mix Designs Used in Texarkana Test Section .................... 62
Various Concrete Properties of Specimens Prepared with Different Mix
Designs at Texarkana Test Section .................................. 63
Observed Material Properties at Cypress Test Section ..................... 67 5.3
5.4
6.1
Aggregate Test Parameters and Relative Performance Indicators .............. 79
Basic Tests and Recommended Test Procedures ......................... 81
xm

LIST OF TABLES (Continued)
Table Page
6.2 Other Aggregate Properties and the Respective Test Procedures .............. 91
B-1 Identification of Aggregates of Igneous Origin (39) . . . . . . . . . . . . . . . . . . . . . . 111
B-2 Identification of Aggregates of Sedimentary Origin (39) . . . . . . . . . . . . . . . . . . 111
B-3 Identification of Aggregates of Metamorphic Origin (39) . . . . . . . . . . . . . . . . . . 112
B-4 Format for Tabulation of Classification Results . . . . . . . . . . . . . . . . . . . . . . . . . 113
xiv
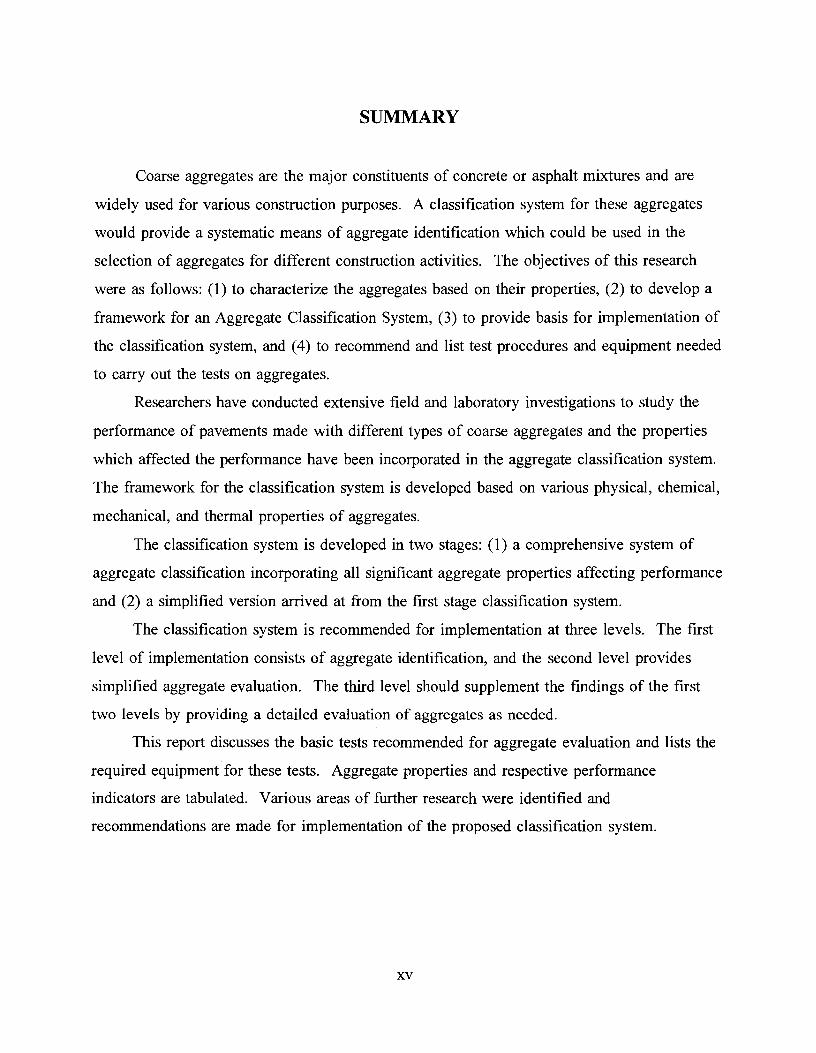
SUMMARY
Coarse aggregates are the major constituents of concrete or asphalt mixtures and are
widely used for various construction purposes. A classification system for these aggregates
would provide a systematic means of aggregate identification which could be used in the
selection of aggregates for different construction activities. The objectives of this research
were as follows: (1) to characterize the aggregates based on their properties, (2) to develop a
framework for an Aggregate Classification System, (3) to provide basis for implementation of
the classification system, and ( 4) to recommend and list test procedures and equipment needed
to carry out the tests on aggregates.
Researchers have conducted extensive field and laboratory investigations to study the
performance of pavements made with different types of coarse aggregates and the properties
which affected the performance have been incorporated in the aggregate classification system.
The framework for the classification system is developed based on various physical, chemical,
mechanical, and thermal properties of aggregates.
The classification system is developed in two stages: (1) a comprehensive system of
aggregate classification incorporating all significant aggregate properties affecting performance
and (2) a simplified version arrived at from the first stage classification system.
The classification system is recommended for implementation at three levels. The first
level of implementation consists of aggregate identification, and the second level provides
simplified aggregate evaluation. The third level should supplement the findings of the first
two levels by providing a detailed evaluation of aggregates as needed.
This report discusses the basic tests recommended for aggregate evaluation and lists the
required equipment for these tests. Aggregate properties and respective performance
indicators are tabulated. Various areas of further research were identified and
recommendations are made for implementation of the proposed classification system.
xv

CHAPTER 1: INTRODUCTION
1.1 BACKGROUND
American Society for Testing and Materials (ASTM) specification D-8 defines
aggregate as "a granular material of mineral composition such as sand, shale, slag, gravel, or
crushed stone, used with a cementing medium to form mortars or concrete, or alone as in base
courses, rail road ballasts etc" (1). Aggregates consist of coarse and fine portions and as per
ASTM C 125, " the portion of an aggregate retained on the 4. 75-mm (No.4) sieve" is defined
as coarse aggregate (2). Coarse aggregates are the major components of asphalt and portland
cement concrete, which are the most common materials used in the construction of pavements
and other structural systems. The characteristics of these coarse aggregates influence the
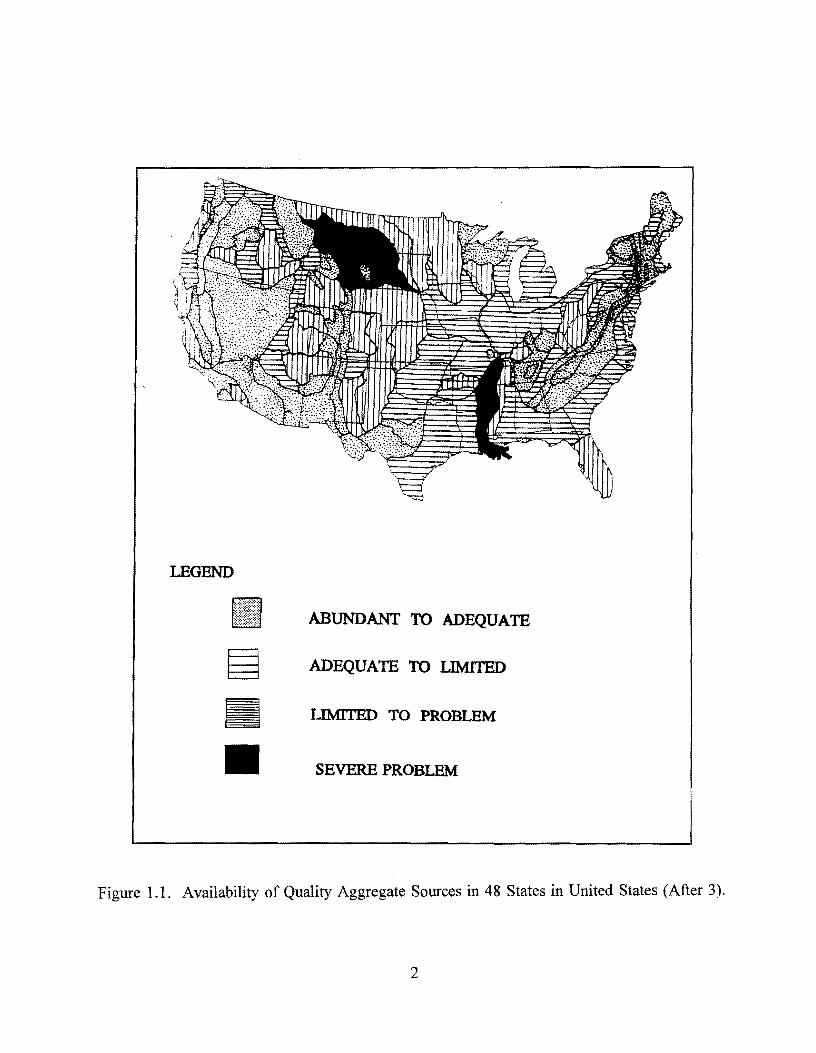
performance of the structures in which they are used. Witczak et al. (3) carried out
investigations on the potential availability of aggregates in 48 states in the United States of
America and rated the availability of aggregates under four different levels: (a) abundant to
adequate, (b) adequate to limited, ( c) limited to problem, and ( d) severe problem. These four
rating levels of the availability of quality aggregates are represented in Figure 1.1. From
Figure I. I, it can be inferred that not all states have abundant quality aggregate sources.
Different types of coarse aggregates that are being used in the construction of concrete and
asphalt pavements fall under one of the four aggregate rating levels and these coarse
aggregates have been found to influence the performance of various structures in different
ways. The concrete properties such as modulus of elasticity, drying shrinkage, and various
thermal properties depend on the type of coarse aggregate used (4). In spite of its
significance, coarse aggregate type is not directly considered as a design variable in the
concrete pavement design. Similarly, inappropriate selection of aggregates has been found to
affect the rutting potential of asphalt concrete (5). Past research has concluded that coarse
aggregate type significantly affects the performance of highway pavements (PCC and Asphalt)
and various other structures (4). The characteristics of coarse aggregates affecting the
performance of pavement structures differ for each aggregate type and depend upon various
physical, chemical, mechanical and thermal properties exhibited by each aggregate type. A
1
LEGEND
(·:l/.i.fi:f;,flf ABUNDANT TO ADEQUATE
~ ADEQUATE TO LIMITED
Iii LIMITED TO PROBLEM
SEVERE PROBLEM
Figure I. I. Availability of Quality Aggregate Sources in 48 States in United States (After 3).
2
substantial amount of research has been done in the past correlating various properties of
aggregates with the performance of structures in which they are used. Researchers have been
investigating the performance standards of aggregates in various ways ( 4, 6).
Natural aggregates consist of minerals and rocks and a system of classification for these
aggregates would be of great assistance for engineers in identifying a suitable type of
aggregate for use under given conditions. It also helps in predicting the behavior of different
types of aggregates used in the construction of highways and other structures containing
notable quantities of aggregates. This would result in minimizing aggregate related failures in
these structures. In view of the benefits an aggregate classification system could provide, an
effort has been made to develop a comprehensive system of aggregate classification, presented
in Chapter IV. A simplified form of this classification system is also discussed in the same
chapter. This simplified format is recommended for implementation.
1.2 PURPOSE AND SCOPE
The main objective of this research study was to evaluate the influence of various types
of coarse aggregates on the performance characteristics of asphalt and concrete pavements.
The aim of this part of the project was to identify the important characteristics of aggregates
in terms of their physical, chemical, mechanical and thermal properties and to develop a
framework for an aggregate classification system (ACS) which will provide a pattern for
considering the behavior and performance of pavements or other concrete structures made
with different coarse aggregates. In other words, the objectives of this part of the research are
as follows:
• Identify and characterize the coarse aggregates based on their properties,
• Develop a framework for an aggregate classification system,
• Point out the performance related implications regarding the selection of various
types of aggregates,
• Develop guidelines for the implementation of the aggregate classification system,
and
• Recommend and list the test procedures and equipment needed to carry out these
tests on aggregates.
3
1.3 IMPORTANCE OF CLASSIFICATION SYSTEMS
The reason for any classification system is to group individual units in an organized
manner so as to understand the properties of those objects. It provides the user with a
systematic means of identifying and predicting the properties and characteristics of the objects
which are classified. A classification system for any group of complex objects or units
provides an effective means of communication among experts to share their knowledge of the
object with one another. Often, it reduces the burden of detailed descriptions and analyses
(7). A well-devised system of classification will reflect known information regarding the
subject.
Naturally occurring objects which are subjected to seasonal variations and other
environmental factors are very complex in nature and difficult to characterize under a
systematic classification scheme. But such objects, if classified systematically, would greatly
augment the knowledge of practitioners and could provide impetus for further research in
related areas. For example, soil, which is a natural body consisting of various constituents in
different proportions and has a complicated physical and chemical makeup, has been
characterized by uniform classification systems. This has greatly helped in the study of soil
materials (7). Currently, more than one system of soil classification is available and each has
addressed the needs of soil investigators and researchers in the fields of soil sciences, civil
engineering, agriculture, etc. (8). Similarly, rocks, which are also natural bodies, have been
classified and rock classification has been useful in assessing geotechnical rock characteristics.
Rock classification systems have been used in geotechnical investigations carried out for
design and construction of various civil engineering projects. Thus, soil and rock
classification systems greatly exemplify the importance of material characterization. A
detailed overview of different soil and rock classification systems proposed and published is
given in Chapter II of this report.
1.4 REQUIREMENTS OF A CLASSIFICATION SYSTEM
The foremost requirement of any classification system is that it should be simple and
should be based only on distinct characteristics of the objects being classified. It should be
based on a logical sequence which can be easily remembered and serve an "all in one"
4

reference substituting the use of other references, charts and tables (7). A good classification
scheme is one which can be used by both experts and novices with equal ease. In any
classification system, there should be meaningful grouping and the number of classes should
be held to a minimum such that they address the required engineering characteristics. Various
criteria used to distinguish the objects under consideration should be consistent throughout the
classification. Any classification scheme consists of "categories" which are usually referred to
as "taxons" and these should be mutually exclusive (9).
Other major requirements for a good classification system include the use of appropriate
symbols where ever necessary, should consist of easily understood terminology. The
classification system so formulated should be practical in its usage in the field and the users
should be able to apply it over a wide range of phenomena. Laboratory tests, if needed to
distinguish various attributes, should be simple and economical. Finally, the classification
system should be easy to apply for both field and laboratory purposes (10, 11).
5


CHAPTER 2: OVERVIEW OF EXISTING CLASSIFICATION
SYSTEMS
2.1 SOIL CLASSIFICATION SYSTEMS
There are three soil classification systems which are currently widely used in the
geotechnical and transportation areas of Civil Engineering. They are as follows:
1. AASHTO Classification System,
2. Unified (ASTM) Soil Classification System, and
3. FAA Soil Classification System.
There are other soil classification systems which are currently being used world over
but the above mentioned ones are used most often in this part of the world. An overview of
each of these classification systems will help in understanding the characteristics the soil and
its behavior.
AASHTO Classification System
American Association of State Highway and Transportation Officials, commonly known
as AASHTO, developed a system of soil classification which is recognized world over. This
system essentially evaluates and classifies engineering properties of soils based on the field
performance of highways. This system was originally put forth by the Public Roads
Administration in 1931 and was revised by the Highway Research Board in 1945. It became
a standard "AASHO M145" in 1945 and subsequently as "AASHTO Ml45" (9).
In this classification system, soils which were in the same range of load carrying
capacity were classified into seven basic groups and were designated from A-1 to A-7. Soils
classified under group A-1 were designated as the best soils for subgrades under highways and
group A-7 soils constituted the poorest. In order to arrive at specific group evaluations, a
group index was developed wherein the index ranged from 0 for the best to 20 for the
poorest. In 1966, this was further revised and a relation was developed. This relation is
reproduced below for the purposes of clarity and better understanding (10):
Group Index (GI) (F-35)[0.2+0.005(LL-40)]+0.0l(F-15)(PI-10)
7

where,
F= % passing No.200 sieve,
LL Liquid Limit,
PI Plasticity Index.
The critical values for the percent passing the No.200 sieve, liquid limit and the
plasticity index were arrived at by various highway organizations after a careful evaluation of
various subgrade, subbase and base course materials. The AASHTO classification chart lists
the significant constituent materials in each soil group and also rates the subgrade from
"Excellent" to "Poor" (9). AASHTO classification system does not have a provision of
identifying organic soils (7).
Unified (ASTM) Classification System
The unified soil classification system is based on the classification system originally
developed by Dr. Arthur Casagrande of Harvard University for the U.S Army Corps of
Engineers. This was later revised and it is now a standard of ASTM D 2487. Currently, this
system finds its application in the evaluation of suitable soils for the construction of roads,
airfields, foundations and embankments (9).
In this system, soils are classified based on their performance as engineering
construction materials. The texture and plasticity are critical in identifying soils in accordance
with this system. Soils, as per this system, were broadly classified into coarse grained, fine
grained and organic soils. This is done based on the percent of soil passing or retained in a
No.200 sieve. Soils which contained 50% particles retained in a No.200 sieve were
classified as coarse grained soils and soils which contained more than 50% of the particles
passing the No.200 sieve were classified as fine grained. Organic soils were identified by
their dark color and odor. Soils were further classified into gravels, sands, silts and clays.
Gravels and sands are classified based on their percent passing or retained in No.4 sieve. The
coarse grained soils, whose percent retained in a No.4 sieve is more than 50 percent, were
classified as Gravels and those whose percent passing a No.4 sieve is more than 50 percent as
Sands (9).
8

Fine grained soils were classified into silts and clays based on their liquid limit and
plasticity index. The fine grained soils were classified as silts and clays depending on their
liquid limit and the plasticity index. The differentiating characteristic was the A-line, which
is an arbitrarily drawn line on the plasticity chart. The plasticity chart is a plot between the
liquid limit and the plasticity index and all those fine grained soils whose liquid limit and
plasticity index fall below the A-line on the plasticity charts were classified as silts and those
which fall above as clays. One of the notable features of this system is that it has given
designations for each of the divisions and subdivisions which are called "Group Symbols".
For example, well graded gravels are given a group symbol "GW" and poorly graded gravels
"GP". Organic soils like peat, muck were identified by "PT" (9).
FAA Soil Classification System
The Federal Aviation Administration (FAA) currently adopts the ASTM classification
system. But prior to the adoption of the ASTM system, the FAA followed its own system of
soil classification which was based on the mechanical (gradation) analysis and the plasticity
characteristics which included the liquid limit and the plasticity index.
Mechanical analysis was used as a basis to separate the soils into granular and fine
grained. The soils were divided into 13 groups and were designated from E-1 to E-13. They
were arranged based on their liquid limit and the plasticity index. Soil group E-1 had the
least values for the liquid limit and the plasticity index, whereas the soil group 13 had the
highest values for the same. The soils with less than 35 percent silt and clay combined were
classified as granular soils. The sand, silt and clay fractions were determined only for those
soils passing a No. I 0 sieve because these were considered critical with respect to variations in
moisture levels and climatic effects (10).
With this system of classification, soils under the E-1 group included well graded,
coarse, and granular soils which are stable even under poor drainage conditions. Similarly,
the soils classified under groups E-2 to E-4 contained less coarser soils, i.e., more than 45
percent of which are retained in a No. I 0 sieve. The stability of these soils under poor
drainage conditions is less than that of the soils grouped under E-1. Soils under groups E-5
to E-12 are essentially fine grained soils with increasing values of liquid limit and plasticity
9

indices. Group E-13 soils are characterized as organic soils having low stability, low density
and high moisture content (10).
The subgrade soil classification is based on the performance of soils as subgrades under
flexible and rigid pavements under varying conditions of frost and drainage. Thus, soils
classified under group E-1 were expected to provide adequate support except under extreme
frost heave conditions. The performance of soil as a road subgrade decreases as we move
from E-1 to E-12 in the table. Organic soils were reported unsuitable for subgrades (10).
Other Soil Classification Systems
There are various other classification systems developed by countries like Russia,
Canada and England. The AASHTO, ASTM and the FAA soil classification systems were
developed to be applied to subgrade soils under pavements, based on the USDA classification
system developed by U.S Department of Agriculture in 1938. The USDA system was a
genetic system of soil classification where the soils were divided into three categories,
namely, order, suborder and great soil group. It consisted of 36 great soil groups and
essentially conveyed information regarding the soil profile, soil environment and other
pedogenetic factors (12). Butler et al. (13) observed that the class boundaries were not
defined and the differentiating criteria were based on environmental factors rather than soil
characteristics. The Canadian system of soil classification consists of two classes, namely,
orders and great groups. This system is a hierarchial one based on "The generalization of
properties of real bodies of soil" (12). The classes in this system are defined based on the
measurable soil properties which indicated soil genesis and other environmental factors.
"Soil Classification for England and Wales" was developed in 1973 and is based on the
profile characteristics and does not take into account the factors relating to climate and site
(12). Since this classification system was intended to be used for general surveys of
cultivated and uncultivated land, it consisted of classes characterized by properties measured
in the field and inferred from field measurements. This classification system is divided into
three principal categories, namely, major groups, groups, and subgroups. The fourth group
consists of "soil series" distinguished by profile characteristics (12).
10

Most Russian soil classification systems are developed based on the genetic properties
of the soil. Although all the Russian soil classification systems followed the same basic
genetic approach, they can be subgrouped into five categories depending on whether the
system was classified based on "the conditions of pedogenesis, the factors governing the
pedogenesis, the character of the pedogenetic processes, single process or an evolutionary
stage of these processes" (12). The soil classification system developed by Gerasimov and
Glazovskaya in 1960 mostly emphasizes the soil dynamics and the pedogenetic functions of
the environment. It has a simple structure consisting of three classes, namely, Subtypes,
Species and Subspecies (13).
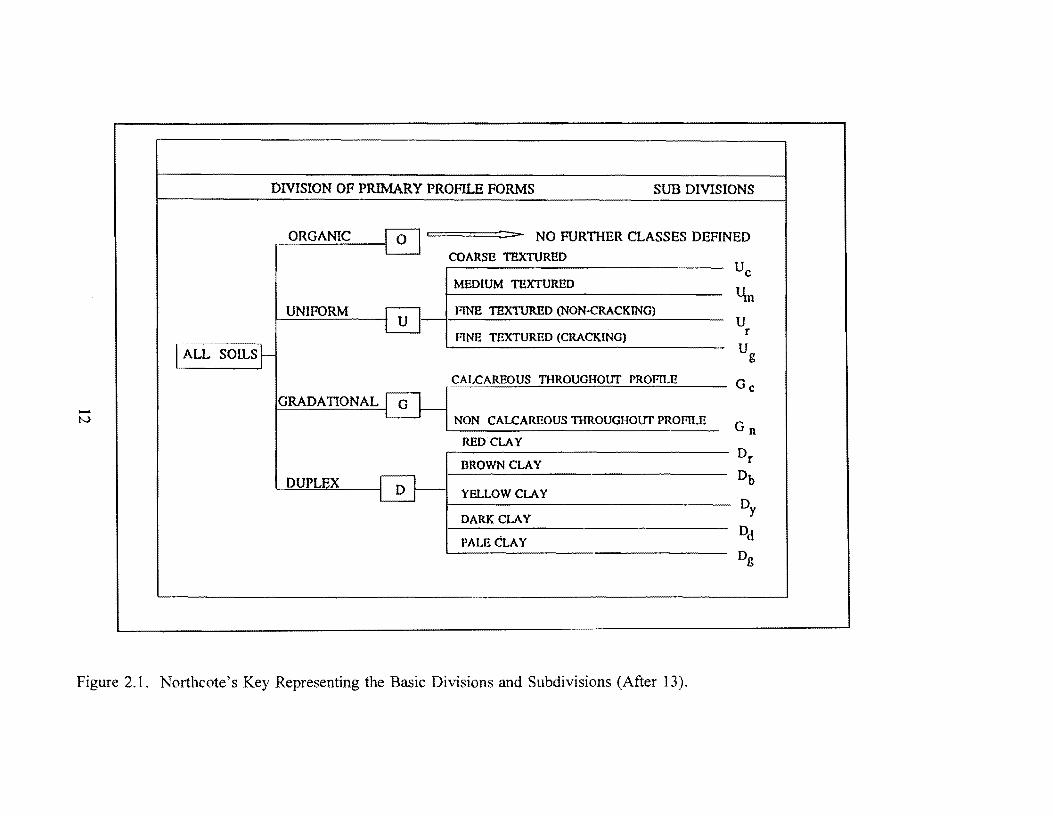
Northcote et al. (14) developed a factual classification system for Australian soils in
1962. This system is a deviation from the conventional soil classification systems which are
based on the genetics of the soil. Northcote used a "key" for differentiating soil into various
divisions. Soil characteristics such as texture, color and consistence are used for defining soil
into different groups, each of which is represented by a key. "Key" is essentially a symbol
which aids in grouping of soil into divisions and subdivisions. For example, the first division
is based on texture and consists of uniform, gradational and abrupt texture profiles which are
represented by keys U, G, and D respectively. Three "divisions" are further classified into 11
"subdivisions". These are subsequently grouped into "Sections", "Classes" and "Principal
profile forms" (14). Figure 2.1 shows the basic divisions of this soil classification system and
their respective keys.
Other prominent soil classification systems include the FitzPatrick's System developed
in 1971, the Kubiena system for the soils of Europe in 1953, "Soil map of the world"
developed by Dudal in 1974, the Polar soil classification system by Tedrow in 1977 and "An
attempt at a general soil classification" by Ivanova in 1956 (13).
2.2 ROCK CLASSIFICATION SYSTEMS
One of the first rock c1assification systems was proposed by Terzaghi in 1946 for
tunneling with steel supports (15). Since then, many rock mass classifications have been
developed which are being used as design aids in the field of Geology, Civil Engineering,
Mining and Petroleum Engineering. The prominent engineering rock mass classifications
11
DIVISION OF PRIMARY PROFILE FORMS SUB DIVISIONS
ORGANIC ~· :::-:::- NO FURTHER CLASSES DEFINED COARSE TEXTURED
Uc MEDIUM TEXTURED
l\n UNIFORM FINE THXTURED (NON-CRACKING)
u FINE TEXTURED (CRACKING) r
ALL SOILS ug CALCAREOUS THROUGHOUT PROFILE Ge
GRADATIONAL -N NON CALCAREOUSTIIROUGHOUTPROFILE Gn
RED CLAY
BROWN CLAY Dr
DUPLEX Db YELLOW CLAY
DARK CLAY Dy
PALE CLAY Dd
Dg
Figure 2.1. Northcote' s Key Representing the Basic Divisions and Subdivisions (After 13).

currently in use include the NATM classification system developed by Pacher in 1964, the
RQD system by Deere in 1967, the RMR system by Bieniawski in 1973, the Q-system by
Barton in 1974 and the Unified Rock Classification System by Williamson in 1959 (15).
Unified Rock Classification System (URCS)
The Unified Rock Classification System, developed by Williamson in 1959 is a simple
and concise classification system which assists in the preliminary assessment of rock condition
by simple field tests. This classification system is based on the following four fundamental
physical properties of rocks (8):
• Weathering,
• Strength,
• Discontinuity, and
• Density .
By evaluating these four basic elements, this classification system provides a reliable
estimate of the performance of the rock. The notations, consisting of abbreviated symbols,
are clearly indicated in Table 2.1 (8). The equipment required for carrying out field tests are
also simple and mostly require a hand lens, 1 lb ball peen hammer, and spring loaded scales
(10 lb range). The degree of weathering indicated by this system essentially refers to
chemical weathering and is classified into five different types based on the level of oxidation
of the rock. The strength of the rock is estimated by using a ball peen hammer and is
classified based on the reaction of the rock when struck with a hammer. Planar and linear
elements are classified by evaluating the "continuity", "shape" and "relief' of the rock. The
fourth element, unit weight, is classified into five categories using the spring-loaded scales.
The condition of the rock is represented by letters A through E. Thus, the rock designated by
AAAA indicates the good condition of the rock, i.e., the rock that requires least design
evaluation, and the rock designated by EEEE indicates the poor quality of the rock (8).
13
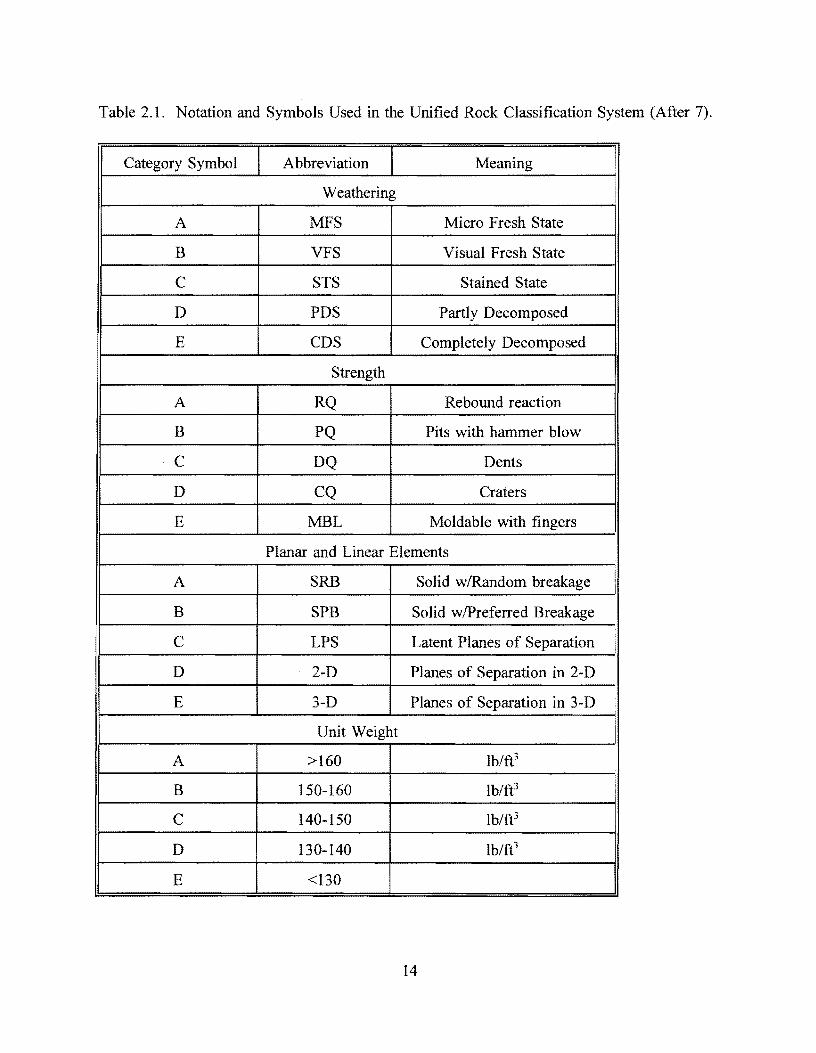
Table 2.1. Notation and Symbols Used in the Unified Rock Classification System (After 7).
Category Symbol Abbreviation Meaning
Weathering
A MFS Micro Fresh State
B VFS Visual Fresh State
c STS Stained State
D PDS Partly Decomposed
I E CDS Completely Decomposed
Strength
A RQ Rebound reaction
B PQ Pits with hammer blow
c DQ Dents
D CQ Craters
E MBL Moldable with fingers
Planar and Linear Elements I
A SRB Solid w/Random breakage I
B SPB Solid w/Preferred Breakage
c LPS Latent Planes of Separation
D 2-D Planes of Separation in 2-D i
E 3-D Planes of Separation in 3-D
Unit Weight
A >160 lb/ft3
B 150-160 lb/ft3
c 140-150 lb/ft3
D 130-140 lb/ft3
E <130
14

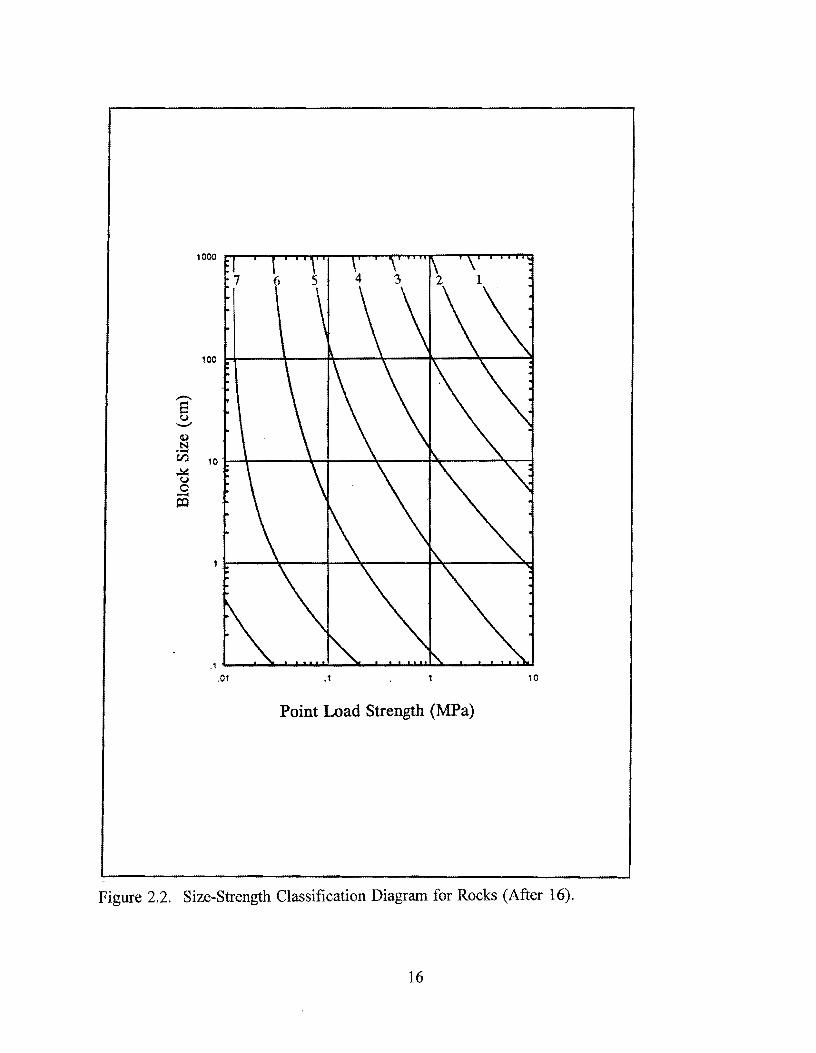
Size-Strength Classification System for Rocks
A size-strength classification system, developed by Franklin and Louis (16) during
1970-75, is based on the block size and the intact strength of rock mass. This rock
classification system has found a variety of applications in Civil Engineering and Mining in
the planning and design of underground excavations and ground control systems.
This classification is based on the concept that the rock mass is comprised of discrete
intact blocks whose behavior is essentially dependent on a combination of its size and
strength. Rock size is measured by observing an exposed rock face and the strength is
assessed by using simple hammer and scratch tests. Figure 2.2 shows a plot of the size
strength classification (16).
The values are plotted on a logarithmic scale in the classification chart. A single point
on the classification chart explains the uniformity of rock in its size and strength. A variable
rock unit results in a "unit plotting zone" which consists of scattered values of the size and
strength of the rock. Usually, a weak rock mass plots toward the lower left of the diagram
and stronger rock masses plot toward the upper right. This size-strength classification
assesses the condition of the rock mass as a function of its size and strength and expresses it
as rock quality index.
ISRM Classification System
The International Society for Rock Mechanics developed a rock classification system in
1981. This classification system gives a generic description of rock masses by characterizing
various zones that constitute a rock mass. The characteristics which this system recommends
for consideration to describe a rock mass are as follows (16):
• Geological description of the rock, explained by its name,
• Layer thickness and discontinuity spacing of the rocks, and
• Uniaxial compressive strength and the angle of friction of the fracture of the rock.
Though this classification is not exhaustive, its importance lies in the fact that it
presents intervals and their corresponding descriptions for all the parameters considered in this
system. In other words, this system characterizes the rock mass into five intervals based on
the respective values of uniaxial compressive strength, discontinuity spacing, and the angle of
15
100
-s (,>
'-" <I) N ·-l'Zl 10 ~ (,> 0
--< i:Q
Point Load Strength (MPa)
Figure 2.2. Size-Strength Classification Diagram for Rocks (After 16).
16

friction of the fractures (16). Strength of the intact rock, which has been an important
classification criterion in many rock classification systems, has been classified differently by
different authors.
There are various other systems of rock classification which are being widely
used in engineering projects relating to tunnels, slopes, foundations, and mines.
These include the Rock Mass Rating (RMR) classification system proposed by Bieniawski in
1973, the Q-system of rock classification developed by Barton in 1974 in Norway, and the
New Austrian Tunneling Method (NATM) developed by Ladislaus in 1965. The RMR
classification system proposed by Bieniawski was modified by various persons which
contributed to its application in countries like South Africa, Sri Lanka, and India (16).
2.3 PREVIOUS EFFORTS IN DEVELOPING AN AGGREGATE CLASSIFICATION
SYSTEM
Aggregates, which are naturally occurring rock materials, have been classified in
different ways in the past (17). Some of the approaches for classification of aggregates were
based on characteristics such as age, color, grain size, mineralogy, mode of formation, and
compressive strength. However, the most common approach is based on the geological
classification, which is dependent on the mode of formation of the parent rock.
Geological Classification of Aggregates
Aggregates are broadly classified into three main categories, namely, igneous,
sedimentary, and metamorphic rocks. These rock materials are further subdivided on the basis
of their texture, mineralogy and chemical composition. The British Standards Institute ( 17)
developed a "Group Classification" of aggregate materials which was later modified as
"Petrological Group Classification" because this system grouped all aggregates into their
petrological classes such as Basalt, Schist, and Limestone. One of the shortcomings of this
system was that it is not designed to predict the suitability of any aggregate for a particular
purpose and thus does not convey information regarding the mechanical or physical properties
of the aggregate. This standard was withdrawn by the British Standards Institute in 1984.
17
Weinert et al. (18) has proposed a classification system for aggregate materials used in
road construction in southern Africa in 1980 . This classification system categorizes
aggregates into nine groups depending on whether the rock material contains quartz or not.
The nine rock groups which are identified by this system are acid crystalline, basic crystalline,
high-silica, arenaceous, argillaceous, carbonate, diamictites, metalliferous rocks and
pedogenetic materials. Though the quartz content was a major criterion in grouping of
aggregate materials, some rock groups like diamictites and pedogenic materials were
exclusively based on the mode of formation. This lead to lack of consistency in the
identification and classification of aggregate materials. It is described in this classification
system that the mode of weathering, the durability and the suitability of aggregate material for
road construction purposes are inf erred from the presence or absence of quartz. Knight et al.
( 17) proposed a classification system for roadstones which was based on the petrological
characteristics of rocks. Lees et al. ( 17) in 1968 proposed a similar classification system with
the exception that this classification system consisted of symbols for each group identified.
This classification is shown in Table 2.2 (17).
The Asphalt Institute suggested a general system of classification for mineral aggregates
(19). This system of classification stresses the importance of the knowledge of origin of rock
from which the mineral aggregates are produced. This system classifies aggregates based on
the parent rock of the aggregate material into igneous, sedimentary and metamorphic rocks.
These are further subdivided into constituent classes depending on the texture and mineralogy
of the rocks. Table 2.3 gives the complete structure of this classification system in which the
"Type" and "Family" essentially represent the texture and mineralogy of the aggregates (15).
Grain Size and Particle Size Classification of Aggregates
The next common approach for classification of aggregates is in accordance with two
basic parameters, the particle size and the grain size characterizing the aggregate texture.
Fookes et al. (17) proposed a classification system for near-shore carbonate sediment rocks in
1975. This system was based on the grain size and "post depositional induration" of rocks.
Clarke et al. (17) expanded the system developed by Fookes in 1977 to accommodate non
carbonate sedimentary rocks. Sherman et al. ( 17) in 1980 proposed a classification of
18

Table 2.2. Classification of Roadstones Proposed by Lee in 1968 (After 17).
ROCKS
Igneous Sedimentary Metamorphic
le Coarse Sc Coarse Mc Coarse Granite Conglomerate Gneiss Syenite Breccia Diorite Gravel Gab bro Scree
Im Medium Sm Medium Mm Medium Micro granite Sandstone Quartzite Microsyenite Sand Microdiorite
Dolerite
If Fine Sf Fine Mf Fine Rh yo lite Shale Schist Trachyte Mudstone Slate Andesite Clay Hornfele
Basalt Sea Calcareous
Limestone Dolomite
ARTIFICIAL MATERIALS Slag
Calcined Bauxite Calcined Flint Crushed Brick
Pulverized Fuel Ash Symopal
19

Table 2.3. Aggregate Classification Based on Origin of Aggregates (After 19).
Class Tvne Farnilv
Limestone Calcareous
Dolomite Sedimentary
Shale Siliceous
Sandstone
Chert
Corn!lomerate
Breccia
Granite
Svenite
Intrusive Diorite (Coarse Grained) Gab bro
Periodotite
Pvroxenite
Homblendite
Igneous Obsidian
Pumice
Tuff Extrusive Rvholite (Fine-Grained)
Trachvte
Andesite
Basalt
Diabase
Gneiss
Schist Foliated
Amnhibolite
Slate Metamorphic Quartzite
Nonfoliated Marble
Sernentinite
20

aggregates based on their particle size. The size limits specified in this system conform to the
standard values in British Standards, BS 1377: 1975. American Society of Testing and
Materials (ASTM) standard C-136 specifies size limits for aggregates. Thus, the particle size
distribution of aggregates can be determined by carrying out a sieve analysis which essentially
separates aggregates when passed through a series of sieves.
Mantuani et al.(15) proposed a "Size Classification of Aggregate particles and Rock
Grains" which is similar to that developed by Sherman. Some of the assumptions made by
Mantuani are listed below (15):
• Same particle size classification is proposed for unconsolidated rocks like gravels
and sands, and consolidated ones crushed to similar sizes,
• On account of limited precision in sieving operations of aggregates, a level of
tolerance is specified for particle size distributions,
• Among the consolidated rocks, the crystalline rocks like metamorphic, crystalline
sedimentary, and elastic granular sedimentary rocks to be distinguished, and
• Grain size classification is based on the particle size range of the aggregates.
This classification system suggested a uniform range for particle sizes, clast sizes, and
grain sizes. The unconsolidated rocks have been classified into Gravel, Sand, Silt, and Clay
based on the particle size in millimeters (15). In other words, the particles greater than 4.76
mm were classified as coarse aggregates and the particles less than 4.76 mm were classified as
fine aggregates which includes sand, silt and clay.
Based on the grain size, the aggregates are classified into four classes, namely
Macrogranular, Mesogranular, Microgranular, and Cryptogranular. Each of these are
classified further into coarse, medium and fine particles (15). Table 2.4 represents the
proposed classification system. One of the important assumptions that the particle size range
can be adopted for grain size classification is indicated clearly in Table 2.4 (15). Based on
the particle size range, the grain size of aggregates has been classified further into coarse,
medium and fine textures.
21
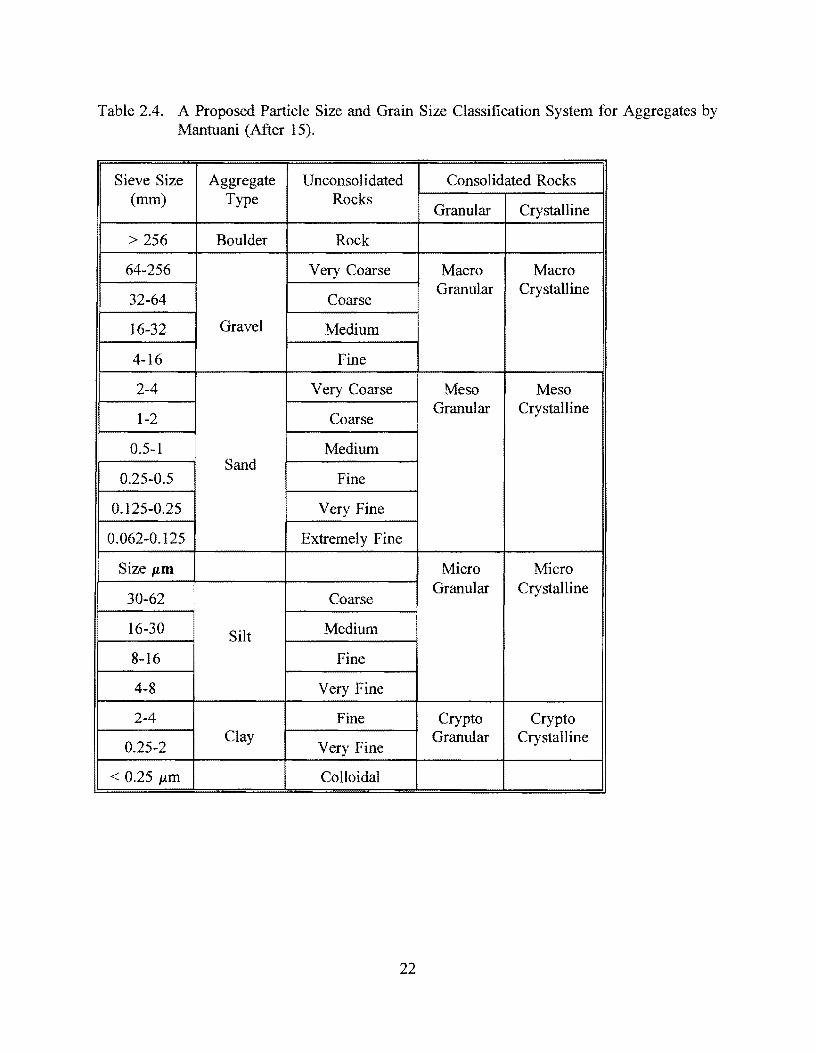
Table 2.4. A Proposed Particle Size and Grain Size Classification System for Aggregates by Mantuani (After 15).
Sieve Size Aggregate Unconsolidated Consolidated Rocks (mm) Type Rocks
Granular Crystalline
> 256 Boulder Rock
64-256 Very Coarse Macro Macro
32-64 Coarse Granular Crystalline
16-32 Gravel Medium
4-16 Fine
2-4 Very Coarse Meso Meso
1-2 Coarse Granular Crystalline
0.5-1 Medium Sand
0.25-0.5 Fine
0.125-0.25 Very Fine
0.062-0.125 Extremely Fine
Size µm Micro Micro
30-62 Coarse Granular Crystalline
16-30 Silt Medium
8-16 Fine
4-8 Very Fine
2-4 Fine Crypto Crypto
0.25-2 Clay
Very Fine Granular Crystalline
< 0.25 µm Colloidal
22
Shape and Texture Classification of Aggregates
Shape and Texture are often described as "Geometric or External" characteristics of an
aggregate. These properties have been found to affect the performance of aggregates in the
structures in which they are used. Shape has been described under two independent criteria,
namely, roundness or angularity and sphericity (15). Surface texture is also called surface
roughness of the aggregate and depends on the texture, structure and degree of weathering of
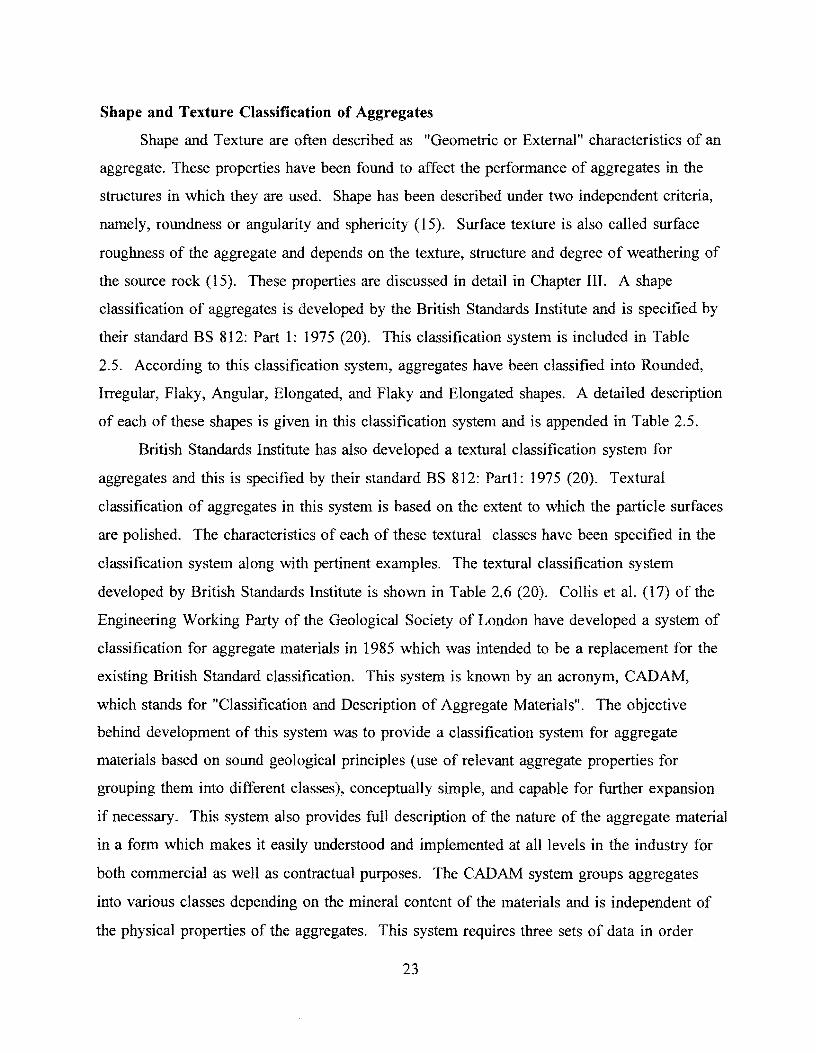
the source rock (15). These properties are discussed in detail in Chapter III. A shape
classification of aggregates is developed by the British Standards Institute and is specified by
their standard BS 812: Part 1: 1975 (20). This classification system is included in Table
2.5. According to this classification system, aggregates have been classified into Rounded,
Irregular, Flaky, Angular, Elongated, and Flaky and Elongated shapes. A detailed description
of each of these shapes is given in this classification system and is appended in Table 2.5.
British Standards Institute has also developed a textural classification system for
aggregates and this is specified by their standard BS 812: Partl: 1975 (20). Textural
classification of aggregates in this system is based on the extent to which the particle surfaces
are polished. The characteristics of each of these textural classes have been specified in the
classification system along with pertinent examples. The textural classification system
developed by British Standards Institute is shown in Table 2.6 (20). Collis et al. (17) of the
Engineering Working Party of the Geological Society of London have developed a system of
classification for aggregate materials in 1985 which was intended to be a replacement for the
existing British Standard classification. This system is known by an acronym, CADAM,
which stands for "Classification and Description of Aggregate Materials". The objective
behind development of this system was to provide a classification system for aggregate
materials based on sound geological principles (use of relevant aggregate properties for
grouping them into different classes), conceptually simple, and capable for further expansion
if necessary. This system also provides full description of the nature of the aggregate material
in a form which makes it easily understood and implemented at all levels in the industry for
both commercial as well as contractual purposes. The CADAM system groups aggregates
into various classes depending on the mineral content of the materials and is independent of
the physical properties of the aggregates. This system requires three sets of data in order
23
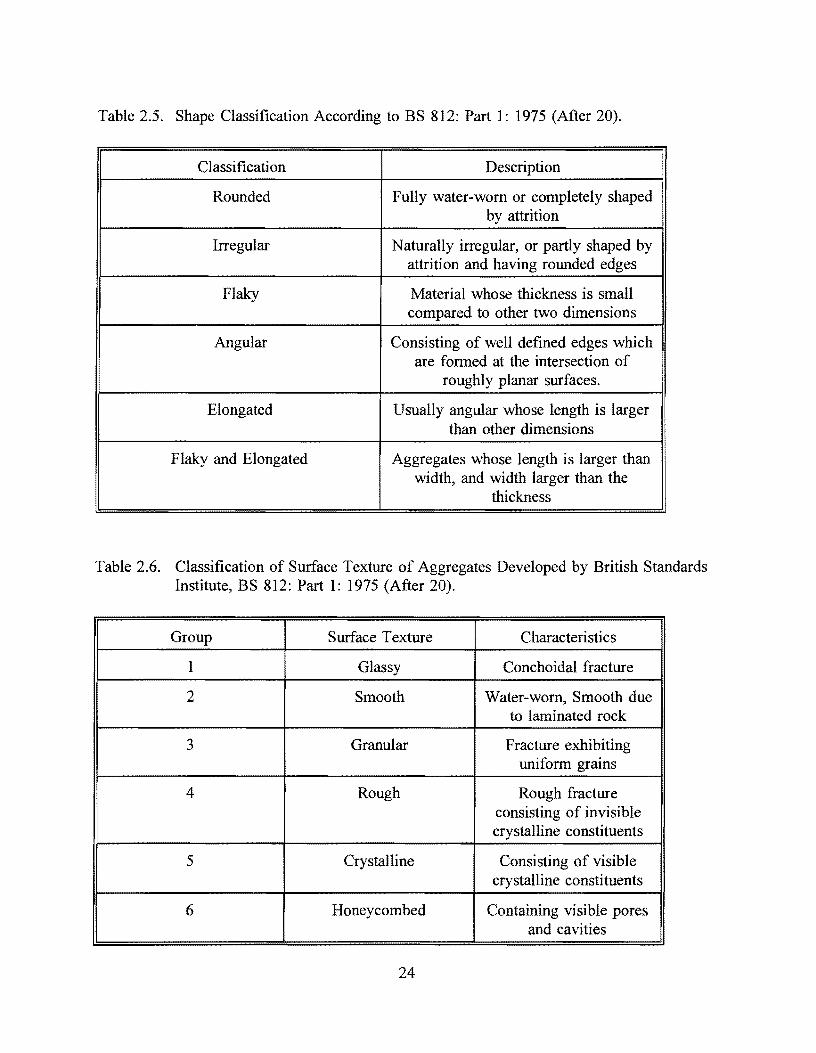
Table 2.5. Shape Classification According to BS 812: Part 1: 1975 (After 20).
Classification Description
Rounded Fully water-worn or completely shaped by attrition
Irregular Naturally irregular, or partly shaped by attrition and having rounded edges
Flaky Material whose thickness is small compared to other two dimensions
Angular Consisting of well defined edges which are formed at the intersection of
roughly planar surfaces.
Elongated Usually angular whose length is larger than other dimensions
Flaky and Elongated Aggregates whose length is larger than width, and width larger than the
thickness
Table 2.6. Classification of Surface Texture of Aggregates Developed by British Standards Institute, BS 812: Part 1: 1975 (After 20).
Group Surface Texture Characteristics
1 Glassy Conchoidal fracture
2 Smooth Water-worn, Smooth due to laminated rock
3 Granular Fracture exhibiting uniform grains
4 Rough Rough fracture consisting of invisible crystalline constituents
5 Crystalline Consisting of visible crystalline constituents
6 Honeycombed Containing visible pores and cavities
24

to classify aggregates listed below (17):
• The "Form" of the aggregate indicating the nature of the material,
• The "Class" of the aggregate indicating the dominant minerals present in them,
and
• Age, Grain size, Color and Foliation of the aggregate material.
The authors of the CAD AM system have devised a standard data sheet for entering and
analyzing the data pertaining to the aggregates. This standard form essentially serves as a
data compilation sheet and aids in the description and classification of the aggregate material.
The CADAM standard data form is shown in Table 2.7. Thus, based on the "Form", this
system classifies aggregates into crushed rock, gravel, sand, land-won or marine-dredged
aggregates. "Class" categorizes aggregates into either carbonate, quartz, silicate or other
miscellaneous groups. The third data set provides geological assessment of aggregates. It
includes information related to the aggregate age, grain size, color and foliation. Apart from
the data represented in Table 2. 7, this system also requires the location and sampling details
of the aggregates in order to assess the extent to which the sample represents the aggregate
source.
For a complete engineering assessment regarding the suitability of the aggregates for
construction purposes, this system recommends the provision of data related to the physical,
chemical and mechanical properties of the aggregates. Depending on the intended usage of
the aggregates, this system recommends evaluation of specific properties such as shape,
texture, porosity, particle size, hardness, water absorption and extent of contamination of the
aggregate material. Similarly, provision of petrological data is added as supplementary
information in this system. This data is recommended to be provided only when a possible
alkali-silica reactivity is suspected or to identify any potential problems related to aggregates.
2.4 CLASSIFICATION OF SYNTHETIC COARSE AGGREGATES
Synthetic aggregates, which are artificially produced lightweight aggregates, have found
their application in construction. These are generally produced by a process of expansion or
agglomeration of clay , shale, slate or pulverized ash (21 ).
25

Table 2.7. Classification and Description of Aggregate Mateirals (CADAM) Proposed by Collis in 1985 (After 19).
AGGREGATE L Natural Natural Land-Won FORM
Crushed Crushed Marine Crushed Gravel Sand Rock Mixed Mixed
CLASS Carbonate L Quartz I Silicate Class Misc. L Class Class
Igneous S'tary M'morp hie
Petrological Name
Geological Age/Color/Gr
am Size/Fissility
Comment (if any)

Ledbetter et al. (22) conducted research on synthetic aggregates for highway use at the Texas
Transportation Institute, Texas A&M University, during 1966-69 and have developed a
"Synthetic Coarse Aggregate Classification System".
This classification system divides the synthetic coarse aggregates into two classes,
namely, Bloated and Non-Bloated. Each of these classes are subdivided into groups A, B, C
based on the following recommended tests on the synthetic coarse aggregates (22):
• Dry Loose Unit Weight,
• 100 Minute Saturation,
• Aggregate Freeze-Thaw Loss,
• Pressure Slaking Value, and
• Los Angeles Abrasion Loss.
Based on the classification of synthetic coarse aggregates, Ledbetter et al.(22) suggested
a functional grouping for these aggregates. These functional groups indicate the synthetic
aggregates suitable for surface treatments, base materials, Asphaltic Concrete surfaces,
Portland Cement Concrete structures, etc. Table 2.8 explains the classification of synthetic
coarse aggregates. The functional grouping of synthetic coarse aggregates developed by the
same authors is shown in Table 2.9 (22). The documented report on the synthetic coarse
aggregate classification system also recommends test procedures for evaluating these
aggregates.
2.5 COMMENTS ON EXISTING AGGREGATE CLASSIFICATION SYSTEMS
Overview of existing aggregate classification systems suggests that mineral aggregates
predominantly have been classified based on various characteristics such as geological origin,
particle and grain size, shape, and surface texture. Apart from the CADAM system of
classification of aggregates, all other systems of classification were based on a single
characteristic of aggregates and hence do not give a complete description of the aggregate
material. Particle size and shape can be quantified according to the ASTM standards which
serve as equivalents to the British Standards Institute's shape and textural classification
systems. Although CAD AM system provides a supplementary list of mechanical and
27
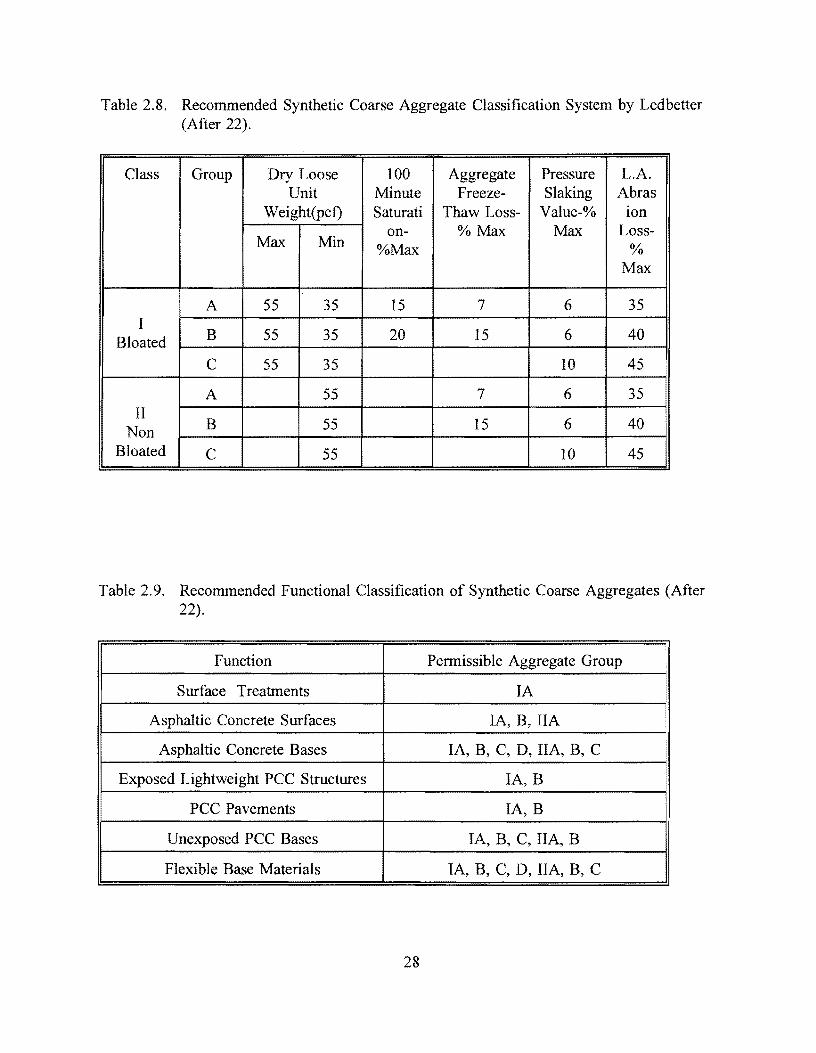
Table 2.8. Recommended Synthetic Coarse Aggregate Classification System by Ledbetter (After 22).
Class Group Dry Loose 100 Aggregate Pressure L.A. Unit Minute Freeze- Slaking A bras
Weight(pcf) Saturati Thaw Loss- Value-% ion on- %Max Max Loss-
Max Min %Max % Max
A 55 35 15 7 6 35 I
B 55 35 Bloated 20 15 6 40
c 55 35 10 45
A 55 7 6 35 II
Non B 55 15 6 40
Bloated c 55 10 45
Table 2.9. Recommended Functional Classification of Synthetic Coarse Aggregates (After 22).
Function Permissible Aggregate Group
Surface Treatments IA
Asphaltic Concrete Surfaces IA, B, IIA
Asphaltic Concrete Bases IA,B,C,D,IIA,B,C
Exposed Lightweight PCC Structures IA, B
PCC Pavements IA, B
Unexposed PCC Bases IA, B, C, IIA, B
Flexible Base Materials IA,B,C,D,IIA,B,C
28

chemical properties for aggregate evaluation, these are not integrated in the main classification
system in the sense that they do not provide preliminary information on the mechanical and
chemical aspects of the aggregate material. Also, this system of classification does not
provide information on the thermal properties such as the thermal coefficient of expansion of
aggregates. Keeping in view the need to integrate various physical, chemical, mechanical and
thermal characteristics of aggregates into a common system of classification which will assist
in the complete classification and description of aggregates for engineering use, a framework
for a coarse aggregate classification has been developed as a part of this research and is
explained in detail in the subsequent chapters. For the purpose of implementation, a
simplified version of the classification system has been developed and is included in Chapter
IV. Chapter III explains the properties of mineral aggregates and their significance with
respect to aggregate performance in the structures in which they are used.
29

CHAPTER 3: PROPERTIES OF MINERAL AGGREGATES
Natural aggregates are formed from various types of parent rocks and consist of
different types of minerals exhibiting various properties. All properties of aggregates affect
the quality and performance of structures in which they are used. However, there are
perceptible differences in their effect which depends on the intended purpose, type of
construction, and environment in which they are used. Thus, natural aggregates can be
described based on different types of properties exhibited by them.
3.1 CHARACTERIZATION OF NATURAL AGGREGATES
Aggregates can be broadly characterized based on four different classes of properties
which include physical, chemical, mechanical and thermal properties. These properties
represent the physical condition, chemical composition, mechanical strength, and thermal
stability of the aggregates, respectively. Physical properties are inherent physical
characteristics of the material such as maximum size, shape, texture, porosity, and specific
gravity. Chemical properties of aggregates essentially constitute the composition of
aggregates and represent the level of reactivity of the aggregates. They provide chemical
identification of aggregate particles and indicate their response to various chemical processes.
Similarly, mechanical properties of aggregates are a measure of material response to external
forces such as impact and compressive loads, dynamic stresses and evaluate the resistance of
aggregates (23). Lastly, thermal properties of aggregates describe the thermal expansion,
conductivity and volume stability of aggregates. The subsequent sections of this chapter
explain various characterization procedures that have been followed and the significance of
aggregate properties on performance.
Physical Properties
Characterization of aggregates based on their physical properties can be done by
following standard test procedures established for the same. Maximum particle size of the
aggregates is the size of the sieve opening through which 100% of the aggregate material
31

passes and is determined by performing a sieve analysis. Sieves are metallic plates consisting
of uniformly spaced openings ( 6). Characterization of particle size is important in that the
coarse aggregates which are deficient in any size fraction are usually undesirable. The
maximum size of the aggregate can be characterized by performing the mechanical sieve
analysis on a sample of aggregates. Excessively larger size of aggregate fractions, if present
in the gradation, will cause segregation during stockpiling and handling. On the other hand,
higher percentages of finer portions of aggregate would present problems in obtaining desired
workability ( 6). Thus, separation of aggregates into various sizes and determination of
optimum percentages of coarse and fine portions of aggregate is essential in achieving the
required gradation.
Shape and surface texture are attributes of coarse aggregates that describe their
geometry and they have been found to influence the performance of portland cement, asphalt
concrete, bases, and subbases under pavements and various other structures in which they find
their application ( 4, 5). Hence, characterization of aggregate shape and surface texture holds
significance in determining the available surface area of aggregates, interfacial bond between
aggregate surface and a binder, if present. Particle shape and texture have been characterized
in various ways in the past and play major roles in the mix design, and workability of
Portland Cement Concrete or Asphalt Concrete and thus affect their performance. ASTM D
3398 describes a procedure for characterization of aggregate shape and surface texture
wherein a numerical index is determined for aggregate shape and texture based on the
weighted average void content of specified aggregate sizes at a certain level of compaction.
The original percent of voids is initially determined and the final void percentage is
determined after subjecting the sample to two compactive efforts. The particle index is
expressed as a function of original percentage of voids and the change in the percent of voids
measured after compaction (24 ).
Folk et al. (6) characterized aggregates based on a form and a shape factor, respectively.
Both form and shape factors are a measure of axial proportions of the three axes of an
aggregate particle. Characterization of shape by form factor is shown in Figure 3.1.
Sphericity is represented by \fl in the figure. This figure illustrates various particle shapes
within the triangle and categorizes aggregates into compact, platy, bladed and elongated
32

-L-I/L·S~
Figure 3.1. Characterization of Aggregate Shape Based on Form Factor Proposed by Folk (After 6).
shapes. The method for shape classification adopted by the British Standards Institute is
discussed in Chapter IL Zingg et al. ( 6) defined aggregate shape based on the ratio of the
intermediate to the long axis and the ratio of the short to the intermediate axis of an aggregate
particle.
The four shape categories described by Zingg are shown in Figure 3.2. Burke et al. (6)
adopted the technique of projection of silhouettes of aggregate particles on a grid and
calculated the maximum sphericity of projected silhouettes. A similar method was adopted by
Heigold et al. (6) who measured the intercepts of silhouettes of aggregate particles and
compared it with the reference data containing geometrical standards using a computer.
Krumbein et al. (25) used roughness of aggregate in terms of average deviation of actual
surface from the surface mean as basis for characterizing the particle shape of aggregates.
Fractal characterization of aggregate shape and surface texture is a novel technique that has
been used in the recent past. Li et al. (26) carried quantitative analysis of aggregate shape
based on fractal technique and have characterized shape and texture of aggregates. Fractal
Dimension is the defining characteristic of fractals and essentially describes the level of
33

c z 9
1.0 l
213
-gl
II .
Spheroid 0
Bladed, Flat, and Elongated
1213
:SHORT/ INTERMEOIATE
. ~- ~
EQUANT, Neither Flat Nor Elongated
Roller
l}.O
Figure 3.2. Four Shape Categories as Described by Zingg (After 6).
roughness of a surface. The major steps involved in fractal characterization will be discussed
at greater length in Chapter VI.
The technique of numerical evaluation of roughness profile of aggregate surface is used
by Wright et al. (6). This technique consists of determination of roughness value by either
measuring the average height and depth from a mean surface line or by using root mean
square average to identify peak to valley heights on a surface profile. The roughness value is
used as a measure of surface texture of aggregates. Tons et al. ( 6) presented an approach
where the aggregate texture is related to its bulk packing behavior. Kummer et al. (27)
described the aggregate depth of texture as smooth, fine and coarse and the sharpness of
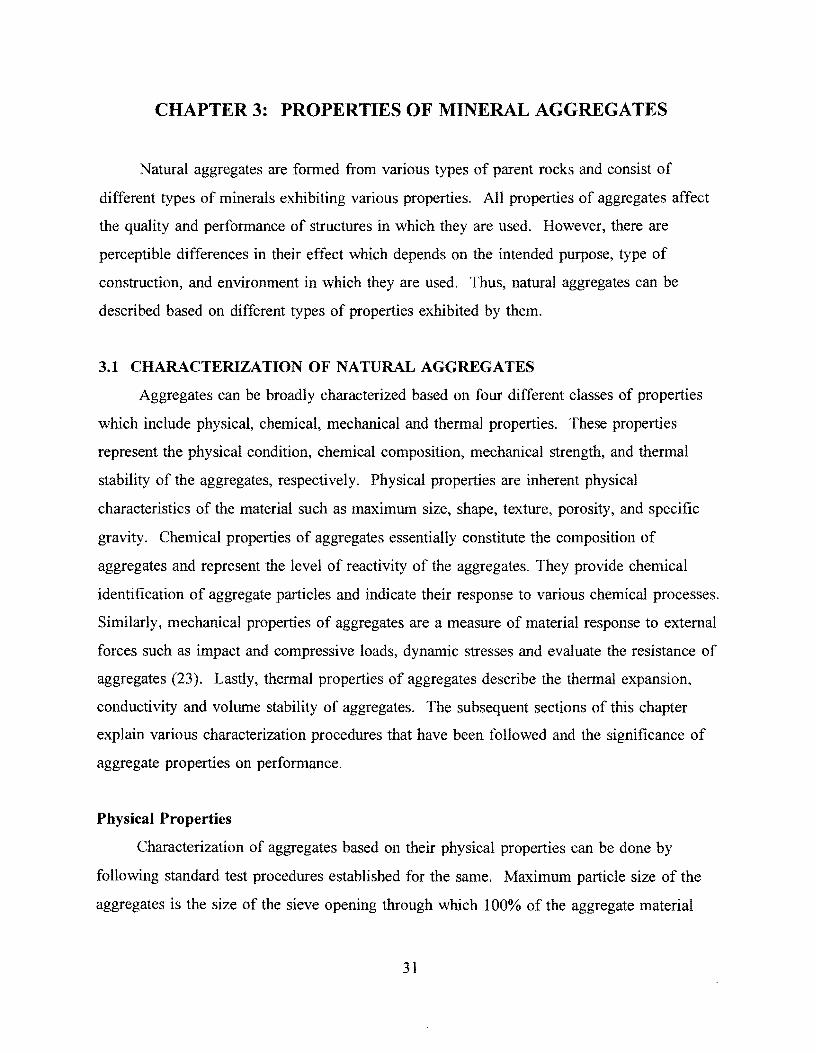
texture into smooth, rounded and, gritty textures as shown in Figure 3.3.
Other important physical properties of aggregates, which can be readily characterized
based on the available standard ASTM specifications, are the specific gravity, unit weight and
absorption. Unit weight can be determined according to ASTM C-29 and the specific gravity
and absorption of aggregates can be arrived at by following the ASTM standard C-127 or
34
SMOOTH 1111111!11
FINE TEXTURED Ull ! 11 i I! ROUNDED
FINE TEXTURED rr r1111111
GRI1TY
COARSE TEXTURED rrmrrrn ROUNDED
COARSE TEXTURED -GRfITY
Figure 3.3. Surface Texture Characterization Proposed by Kummer (After 27).
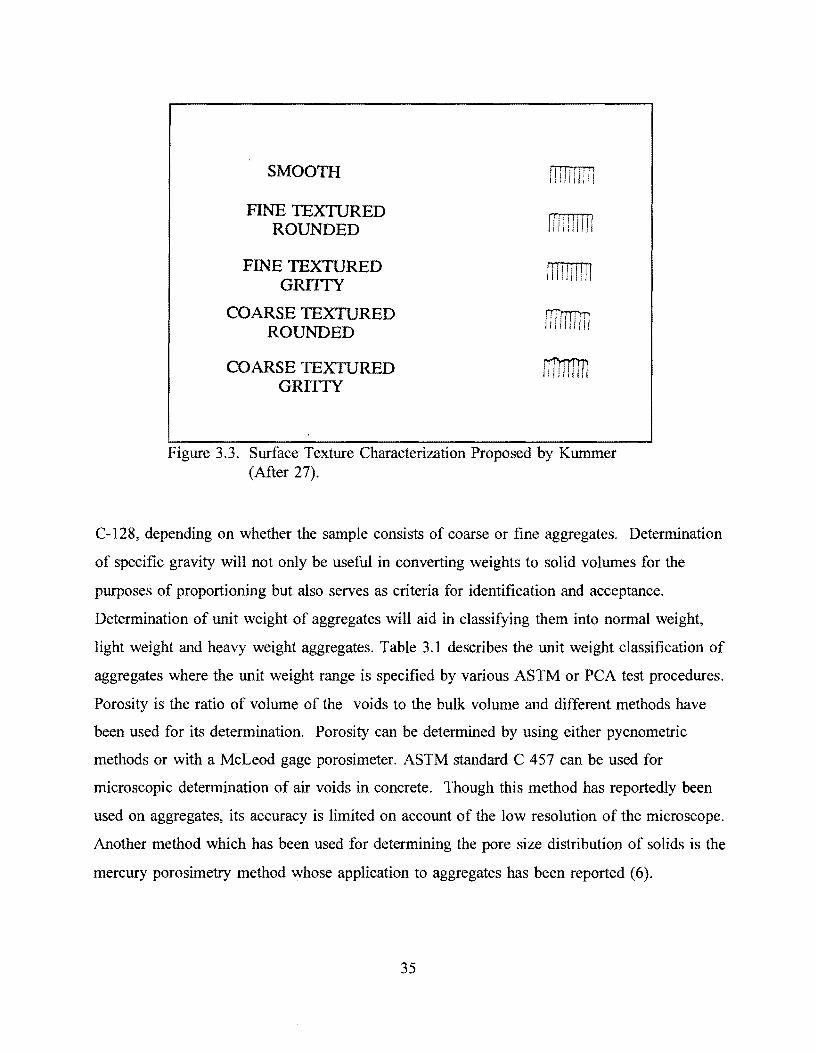
C-128, depending on whether the sample consists of coarse or fine aggregates. Determination
of specific gravity will not only be useful in converting weights to solid volumes for the
purposes of proportioning but also serves as criteria for identification and acceptance.
Determination of unit weight of aggregates will aid in classifying them into normal weight,
light weight and heavy weight aggregates. Table 3.1 describes the unit weight classification of
aggregates where the unit weight range is specified by various ASTM or PCA test procedures.
Porosity is the ratio of volume of the voids to the bulk volume and different methods have
been used for its determination. Porosity can be determined by using either pycnometric
methods or with a McLeod gage porosimeter. ASTM standard C 457 can be used for
microscopic determination of air voids in concrete. Though this method has reportedly been
used on aggregates, its accuracy is limited on account of the low resolution of the microscope.
Another method which has been used for determining the pore size distribution of solids is the
mercury porosimetry method whose application to aggregates has been reported (6).
35
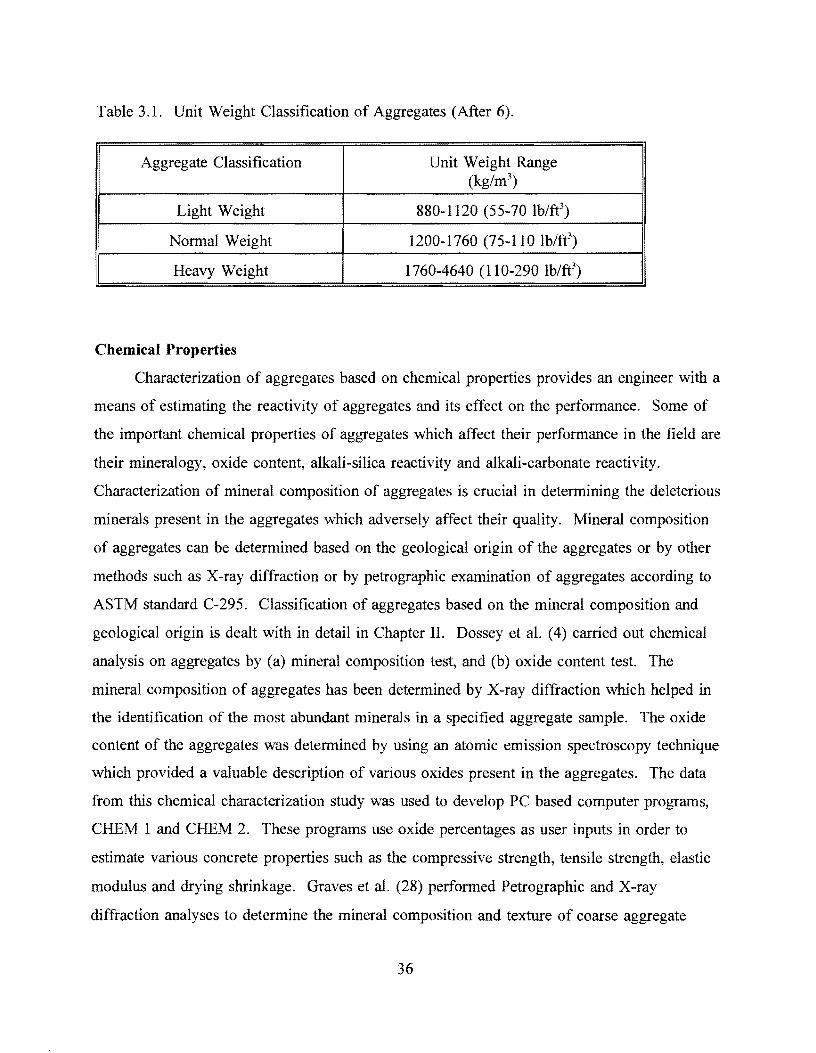
Table 3.1. Unit Weight Classification of Aggregates (After 6).
Aggregate Classification Unit Weight Range (kg/m3
)
Light Weight 880-1120 (55-70 lb/ft3)
Normal Weight 1200-1760 (75-110 lb/ft3)
Heavy Weight 1760-4640 (110-290 lb/ft3)
Chemical Properties
Characterization of aggregates based on chemical properties provides an engineer with a
means of estimating the reactivity of aggregates and its effect on the performance. Some of
the important chemical properties of aggregates which affect their performance in the field are
their mineralogy, oxide content, alkali-silica reactivity and alkali-carbonate reactivity.
Characterization of mineral composition of aggregates is crucial in determining the deleterious
minerals present in the aggregates which adversely affect their quality. Mineral composition
of aggregates can be determined based on the geological origin of the aggregates or by other
methods such as X-ray diffraction or by petrographic examination of aggregates according to
ASTM standard C-295. Classification of aggregates based on the mineral composition and
geological origin is dealt with in detail in Chapter II. Dossey et al. ( 4) carried out chemical
analysis on aggregates by (a) mineral composition test, and (b) oxide content test. The
mineral composition of aggregates has been determined by X-ray diffraction which helped in
the identification of the most abundant minerals in a specified aggregate sample. The oxide
content of the aggregates was determined by using an atomic emission spectroscopy technique
which provided a valuable description of various oxides present in the aggregates. The data
from this chemical characterization study was used to develop PC based computer programs,
CHEM 1 and CHEM 2. These programs use oxide percentages as user inputs in order to
estimate various concrete properties such as the compressive strength, tensile strength, elastic
modulus and drying shrinkage. Graves et al. (28) performed Petrographic and X-ray
diffraction analyses to determine the mineral composition and texture of coarse aggregate
36

samples. Microscopic petrographic examination was carried out on aggregates to determine
the shape, texture, fossil fragments, pore spaces, and detectable minerals. X-ray diffraction
analysis was used to confirm the minerals detected by petrographic examination (28).
Other chemical properties, such as the alkali-silica reactivity and alkali-carbonate
reactivity, can be determined by the ASTM test procedures. ASTM C-289 is a quick
chemical method for determination of alkali-silica reactivity and ASTM C-227 is a mortar bar
method for identifying the potential silica reactivity. Similarly, ASTM C-586 can be followed
to determine the potential carbonate reactivity.
Petrographic examination of aggregates provides a comprehensive means of aggregate
evaluation which includes the determination of mineral composition, chemical activity such as
the solubility, oxidation, hydration, alkali-silica reactivity, alkali-carbonate reactivity, and
identification of any deleterious substances (6).
Mechanical Properties
Abrasion resistance, strength, soundness, elastic modulus, polish value, and toughness
constitute some of the important mechanical properties of aggregates. Characterization of
aggregates based on mechanical properties helps in assessing the resistance of aggregates to
mechanical forces and localized impacts and thus assists in the evaluation and selection of
aggregates for various purposes.
Abrasion resistance can be determined by using standard test procedures ASTM C-131
and ASTM C-535 for small size and large size aggregates, respectively. All aggregates larger
than 1-1/2 inches can be evaluated for abrasion loss by ASTM C-535. ASTM C-88, a test for
soundness of aggregates by use of sodium or magnesium sulphate, is widely used for
evaluating the overall quality of aggregates. Soundness testing aids in characterizing the
resistance of aggregates to disintegration by saturated solutions of sodium or magnesium
sulphate. Another similar test that is carried out to evaluate the skid resistance of aggregates
used in wearing surfaces in highway pavements is the accelerated polish value test. This test
can be carried out as per ASTM D 3319 and E 303 and Texas Department of Transportation
follows a modified version (Tex-438-A) of these ASTM tests.
37

Elastic properties of aggregates such as the modulus of elasticity and Poisson's ratio can
be characterized by testing concrete mixtures containing different types of aggregates. There
are no ASTM specified test procedures for characterization of elastic properties of aggregates
directly. Similarly, no standard test procedure is available for characterization of strength of
aggregates directly. Though there are test methods available for evaluating the strength of
rock specimens, they do not, however, provide information on the mechanical bond strength
of aggregates, which is a crucial factor for mechanical characterization of aggregates. Graves
et al. (28) studied the interfacial bonding properties of different aggregates using a polarized
light microscope (PLM) and scanning electron microscope on the concrete specimens obtained
from different parts of the state of Florida. The micrographs obtained from these tests
showed the textural characteristics of the aggregates and this information was used to interpret
the mechanical bonding properties and thus the bond strength of the aggregates. Evaluation
of fracture toughness parameters is made by using the RILEM test procedure to provide
information on the fracture energy of concrete which could be used to estimate the bond
strength of aggregates (29).
Thermal Properties
Thermal coefficient of expansion of aggregates is one of the important thermal
characteristics of aggregates which was found to influence their performance in the structures
in which they are used. Other important properties which need special mention are the
thermal conductivity and specific heat of aggregates. Several methods have been developed to
evaluate the thermal coefficient of coarse aggregate and they are based on the linear
expansion of the aggregates over a certain temperature range. One such method was proposed
by Willis and DeReus ( 6). The Corps of Engineers developed another method for evaluating
the linear expansion of coarse aggregates which a SR-4 strain gage is attached to a coarse
aggregate specimen and readings are noted over a temperature range (30). Another method
adopted by Bureau of Reclamation consists of 25.4 to 76.2 mm deep specimens which are
coated with wax and are held in fulcrum-type extensometer frames. Electromagnetic strain
gages are used for recording the measurements while the specimen is immersed in a solution
of ethylene glycol (6). Thermal conductivity can be determined directly by ASTM test C 177
38
for steady state thermal transmission properties by means of a guarded hot plate. Specific
heat of aggregates can be determined by a procedure developed by the Corps of Engineers
which is also known as the method of mixtures. It is a calorimetric method which measures
the net heat required to raise the temperature of a specimen whose weight is known (6).
3.2 SIGNIFICANCE AND EFFECTS OF AGGREGATE PROPERTIES ON
PERFORMANCE
Natural aggregates exhibit different physical, chemical, mechanical and thermal
properties and each of these are important in affecting the quality and performance of
structures in which they are used. Physical properties such as particle shape and surface
texture affect the workability, strength and the bond between the aggregate particles and the
binder. Various studies on particle shape have indicated that the equidimensional particles
produce high density and higher strength of concrete, whereas flat and elongated particles
pack poorly with the binder and decrease workability. Crushed aggregate particles such as
limestone are angular and rough textured and hence provide a good bond with the binder.
Rounded and smooth textured aggregates, such as siliceous river gravels, are easy to work
with and provide good lubrication with less binder. Smooth particles, on account of less
bonding area, affect the bond between the aggregate surface and the binder. Also, past
research studies have shown that the shape of the aggregate affects the strength of concrete.
A concrete specimen, in a compressive strength test, is most likely to crack and subsequently
fail around smooth aggregate particles. However, the concrete specimens made with angular
aggregates have resulted in cracks through them. These results show that the failure at the
binder-aggregate interface in the concrete specimen made with smooth aggregate is due to the
low bond between the binder and aggregate (6, 15, 21).
Button et al. ( S) investigated the influence of aggregate characteristics on rutting of
asphalt concrete and concluded that an increase in percent crushed coarse aggregate increases
the stability of asphalt concrete and improves the resistance to creep of the mixture. Kaplan
et al. (6) studied the effects of texture on the strength of Portland Cement Concrete and
concluded that texture greatly influences the compressive strength of concrete. Some of the
factors which cause rough textured aggregates resulting in higher strength are the mechanical
39

interlock, available surface area for bonding and shape of the aggregate. Porosity of
aggregates is an important aggregate property which influences the surface texture and thus
the interfacial bond, abrasion resistance, and other elastic properties such as modulus of
elasticity and Poisson's ratio. It influences the absorption characteristics of aggregates and
pore spaces alter the volume of solids in the bulk volume of aggregates.
Mineral composition, oxide content and alkali-aggregate reactivity constitute prip.cipal
chemical properties which affect the performance. Natural aggregates consist of different
types of rocks and minerals, some of which significantly affect the quality of concrete.
Mineral composition identifies the most abundant minerals present in the aggregates in
question. A clear understanding of the mineralogy may prevent incompatibilities with the
binder. Deleterious mineral constituents present in an aggregate, if undetected, may cause a
serious deterioration of the quality of the aggregates, affecting the performance of the
structure in which they are used. Aggregates containing minerals such as quartzites and other
siliceous minerals may exhibit higher values of thermal expansion than limestone aggregates.
Aggregates derived from sedimentary and metamorphic rocks such as shales, slates,
phyllites and schists often consist of objectionable fabric, a fan-like form caused by the coarse
micaceous grains, which cause splitting and low bonding in these aggregates. Aggregates
containing chert and clay minerals which consist of sodium, potassium, calcium or magnesium
as "exchangeable cations" have been found to be susceptible to D-cracking in pavements and
other slabs on grade. On the other hand, aggregates of igneous origin, such as granites and
diorite, have not been associated with similar kinds of distress (31 ). Oxide based chemical
models have been developed by Dossey et al. ( 4) for predicting the material properties of the
hardened concrete. These studies have shown that various oxides present in aggregates can be
successfully used for preliminary assessment of aggregates prior to greater in-depth laboratory
testing.
The chemical characteristic of aggregates which has been investigated extensively is
alkali-aggregate reactivity. Alkali reactive aggregates cause expansion which results in
various types of distresses in concrete structural elements in which they are used. Among the
distresses that are caused by such aggregates include pattern or wavy cracking, popouts in
concrete pavements, and dislocation of structures. Alkali reactions cause changes in the
40

original composition of the aggregates, alter the texture and initiate microcracks. Though
petrographic examination of aggregates for reactive minerals and prediction of their effect on
the performance is very complex, it helps in the identification of reactive constituents of
aggregates ( 15).
The predominant reactive groups that occur in aggregates are the silica group and the
carbonate group, each of which influence the reactivity of aggregates in a different manner
( 15). Some of the minerals and rocks which have caused alkali-silica reactivity are opal,
chalcedony, chert, flint, siltstones, and argillites. Similarly, some of the alkali reactive
carbonate rocks which have been identified are dolomite, calcitic dolostones, and quartz
bearing argillaceous rocks. Determination of calcite-to-dolomite ratio is one of the significant
parameters for identifying carbonate aggregates. Both silicate and carbonate aggregates have
caused extensive damage in the form of severe cracking, expansion, and loss of strength
which lead to deterioration and failure of existing structures (6).
The mechanical properties which play a significant role in the evaluation and selection
of aggregates are the hardness, abrasion resistance, polish value, soundness and strength. The
Texas Department of Transportation's Aggregate Quality Management Program (AQMP)
requires evaluation of three mechanical properties on all aggregate samples submitted by the
aggregate producers. These are the "Abrasion of Coarse Aggregate by Use of the Los
Angeles Machine", "Soundness of Aggregate by use of Sodium Sulfate or Magnesium
Sulfate", and "Accelerated Polish Test for Coarse Aggregate" which provide information
regarding the percent loss due to abrasion, resistance to disintegration, and extent to which
aggregate polishes under moving traffic respectively (32). The significance of these properties
is that they provide adequate information by which poor quality aggregates can be eliminated
in the aggregate selection process.
Dumas et al. (32) have carried out extensive investigation on the effects of aggregate
blends on the properties of portland cement concrete and have concluded that blending of
aggregates is a viable option for meeting the performance specifications of aggregates to be
used in pavements. One of the other mechanical properties which is critical in evaluating the
quality of aggregates is their bond strength. Past studies on bond strength have stressed more
on the chemical aspects of the bond than the mechanical aspects of it. Another notable aspect
41

of bond strength is the surface area provided by each aggregate for bonding. Thus, the
surface area and surface roughness of aggregates can impact the bond strength of the concrete
and characterization of mechanical bond strength could improve the performance evaluation of
aggregates used in various structures (33).
Thermal characteristics of aggregates, such as the coefficient of thermal expansion,
thermal conductivity and specific heat of aggregates, influence various temperature related
distresses such as cracking and curling in pavements and other massive structures. Thermal
coefficient of expansion of aggregates is the most significant thermal property which affects
the durability of concrete, especially under severe exposure and extreme temperature changes.
Walker et al.(6) showed that the concretes containing aggregates with higher thermal
coefficients of expansion are less resistant to temperature changes than the aggregates with
lower coefficients of expansion. Typical range of values of thermal coefficient of expansion
of limestone and siliceous river gravel are 1-3 X 10⁻⁶ in/in/°C and 6.0-13.0 X 10⁻⁶ in/in/°C,
respectively (6).
Thermal conductivity of normal weight aggregates is largely influenced by their mineral
composition, whereas it is influenced by the moisture content in light weight aggregates.
Concrete made with limestone aggregates have a typical thermal conductivity of 10
Btu.in./h.ft2 and for moist concrete made with sandstone it is 20 Btu.in./h/ft2• The specific
heat of aggregates influence the specific heat of concrete and its determination is important in
the control of concrete placement temperatures and thermal volume change of mass concrete
(6).
The format of the coarse aggregate classification system is outlined and its stage wise
development is explained in detail in Chapter IV. The list of properties which are included in
the format of the proposed classification system are based on the understanding obtained as a
result of the thorough evaluation of the significance and affect of aggregate properties on
performance.
42

CHAPTER 4: DEVELOPMENT OF AGGREGATE CLASSIFICATION
SYSTEM
4.1 FORMAT OF THE PROPOSED CLASSIFICATION SYSTEM
The format of this classification system is developed based on some significant
properties of coarse aggregates which affect performance. The ultimate goal of this work is
to develop a classification system which can be used as a tool to understand the behavior of
coarse aggregates commonly used in construction of concrete or asphalt pavements and other
concrete structures. Hence, several properties of aggregates which have affected the
performance of pavements and other structures have been investigated for developing a list of
properties to be incorporated in the classification system. All the properties which were
studied for this purpose are included in Table 4.1.
The main objective of the evaluation of aggregates was to identify important
characteristics which affect the performance of structures in which they are used. The idea
behind the development of this classification system was to keep it simple, i.e., which consists
of material properties which can be easily evaluated in the laboratory and also to convey more
information regarding the aggregate being evaluated. To be consistent with this idea, a
careful investigation of the above listed properties of aggregates was carried out and standard
test procedures were evaluated for determining the type of equipment required, duration of the
test, and the level of pertinent information provided by each test. This evaluation revealed
that some of the tests needed extensive laboratory equipment, expertise, and longer duration to
obtain required results. As there are no standard tests for determination of hardness, elastic
modulus and thermal diffusivity of aggregates, they were excluded from the format of the
classification system. However, alternative evaluation methods for these properties are
suggested in the later part of this report. In order to facilitate a quick evaluation of coarse
aggregates in the field, visual examination of aggregates is proposed in the classification
system.
43
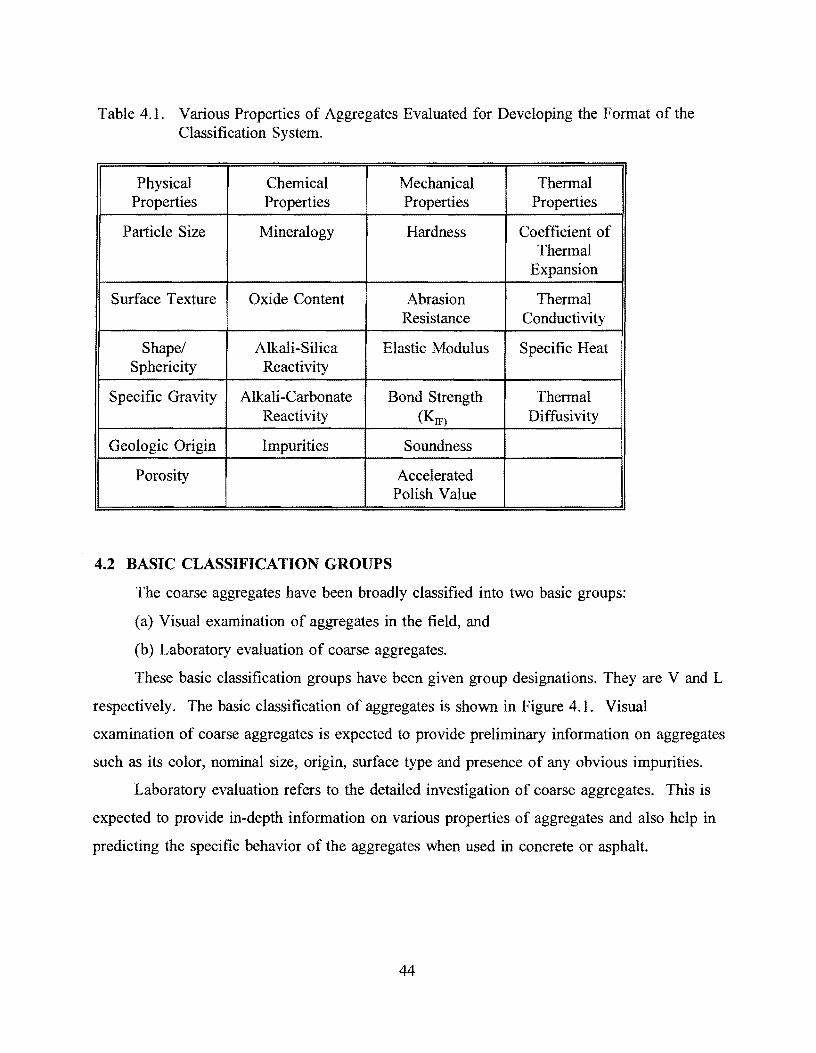
Table 4.1. Various Properties of Aggregates Evaluated for Developing the Format of the Classification System.
Physical Chemical Mechanical Thermal Properties Properties Properties Properties
Particle Size Mineralogy Hardness Coefficient of Thermal
Expansion
Surface Texture Oxide Content Abrasion Thermal Resistance Conductivity
Shape/ Alkali-Silica Elastic Modulus Specific Heat Sphericity Reactivity
Specific Gravity Alkali-Carbonate Bond Strength Thermal Reactivity (KIF) Diffusivity
Geologic Origin Impurities I Soundness
Porosity Accelerated Polish Value
4.2 BASIC CLASSIFICATION GROUPS
The coarse aggregates have been broadly classified into two basic groups:
(a) Visual examination of aggregates in the field, and
(b) Laboratory evaluation of coarse aggregates.
These basic classification groups have been given group designations. They are V and L
respectively. The basic classification of aggregates is shown in Figure 4. l. Visual
examination of coarse aggregates is expected to provide preliminary information on aggregates
such as its color, nominal size, origin, surface type and presence of any obvious impurities.
Laboratory evaluation refers to the detailed investigation of coarse aggregates. This is
expected to provide in-depth information on various properties of aggregates and also help in
predicting the specific behavior of the aggregates when used in concrete or asphalt.
44

AGGREGATE CLASSIFICATION SYSTEM
I AGGREGATES
I
VISUAL EXAMINATION LABORATORY INVESTIGATION
Figure 4.1. Basic Classification of Coarse Aggregates.

4.3 CLASSIFICATION OF AGGREGATES BASED ON VISUAL EXAMINATION
Visual examination of aggregates is an indispensable first step in evaluating concrete
aggregates and helps in the preliminary assessment of quality and thus the suitability of
aggregates for different construction purposes. Information pertaining to the geological
features of aggregates can be obtained by a careful examination of their color, texture and
mineral content (34). Knowledge of the physical geology and origin of rock type of
aggregates is helpful in identifying some deleterious minerals present in the aggregates. The
presence of fractures and cracks present in the aggregates can be determined by the visual
examination of aggregates. Also, the nominal size of the aggregate can be estimated by a
visual examination of a sample of aggregates from a stock pile.
Visual examination of aggregates is further classified into three subgroups. Each
subgroup has been given a designation. The subgroups and their group designations are
shown in Table 4.2.
Surface Type Classification (V-1)
This classification is expected to group the aggregate based on whether the surface of
aggregate is crushed or uncrushed. The identification of cracks and fractures in natural
aggregates is important in assessing their suitability for use in concrete (33). This information
is also expected to be obtained by the surface type classification of aggregates. Figure 4.2
represents the visual examination and its subgroup classification.
Table 4.2. Subgroups and Respective Designations under Visual Examination of the Classification System.
Classification Subgroup Subgroup Designation
Classification by Nominal Maximum Size V-1
Aggregate Type Classification V-2
Surface Type Classification V-3
46
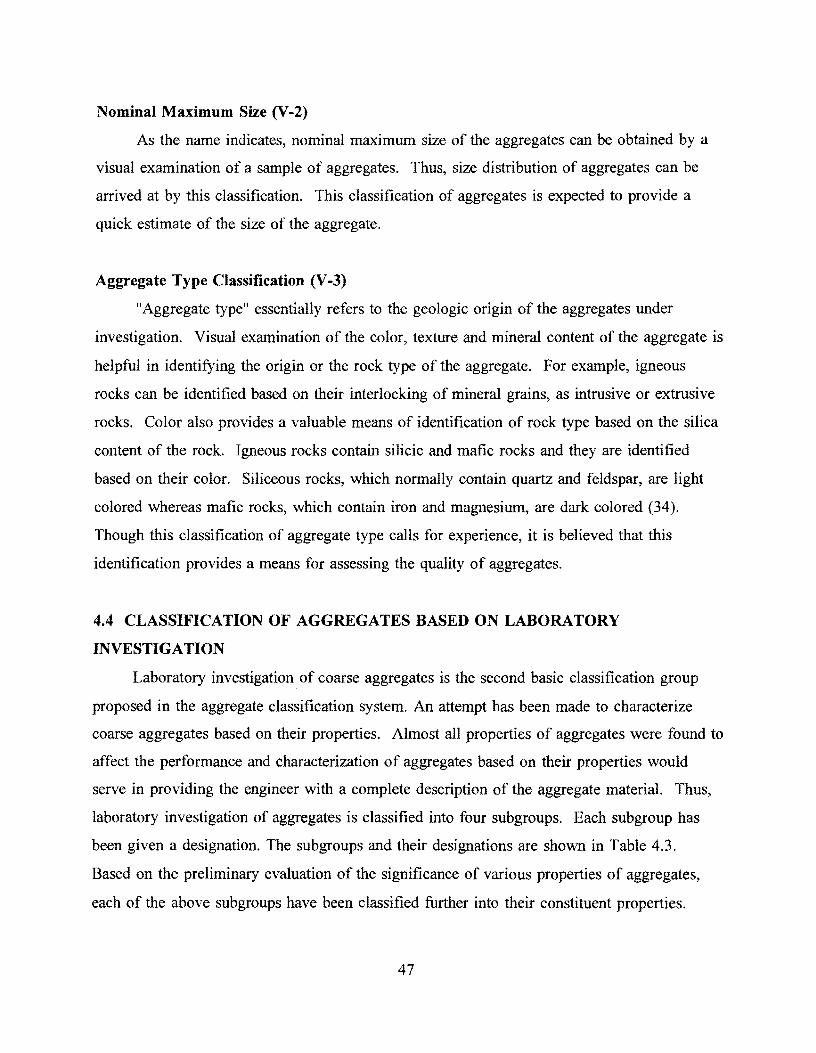
Nominal Maximum Size (V-2)
As the name indicates, nominal maximum size of the aggregates can be obtained by a
visual examination of a sample of aggregates. Thus, size distribution of aggregates can be
arrived at by this classification. This classification of aggregates is expected to provide a
quick estimate of the size of the aggregate.
Aggregate Type Classification (V-3)
"Aggregate type" essentially refers to the geologic origin of the aggregates under
investigation. Visual examination of the color, texture and mineral content of the aggregate is
helpful in identifying the origin or the rock type of the aggregate. For example, igneous
rocks can be identified based on their interlocking of mineral grains, as intrusive or extrusive
rocks. Color also provides a valuable means of identification of rock type based on the silica
content of the rock. Igneous rocks contain silicic and mafic rocks and they are identified
based on their color. Siliceous rocks, which normally contain quartz and feldspar, are light
colored whereas mafic rocks, which contain iron and magnesium, are dark colored (34).
Though this classification of aggregate type calls for experience, it is believed that this
identification provides a means for assessing the quality of aggregates.
4.4 CLASSIFICATION OF AGGREGATES BASED ON LABORATORY
INVESTIGATION
Laboratory investigation of coarse aggregates is the second basic classification group
proposed in the aggregate classification system. An attempt has been made to characterize
coarse aggregates based on their properties. Almost all properties of aggregates were found to
affect the performance and characterization of aggregates based on their properties would
serve in providing the engineer with a complete description of the aggregate material. Thus,
laboratory investigation of aggregates is classified into four subgroups. Each subgroup has
been given a designation. The subgroups and their designations are shown in Table 4.3.
Based on the preliminary evaluation of the significance of various properties of aggregates,
each of the above subgroups have been classified further into their constituent properties.
47
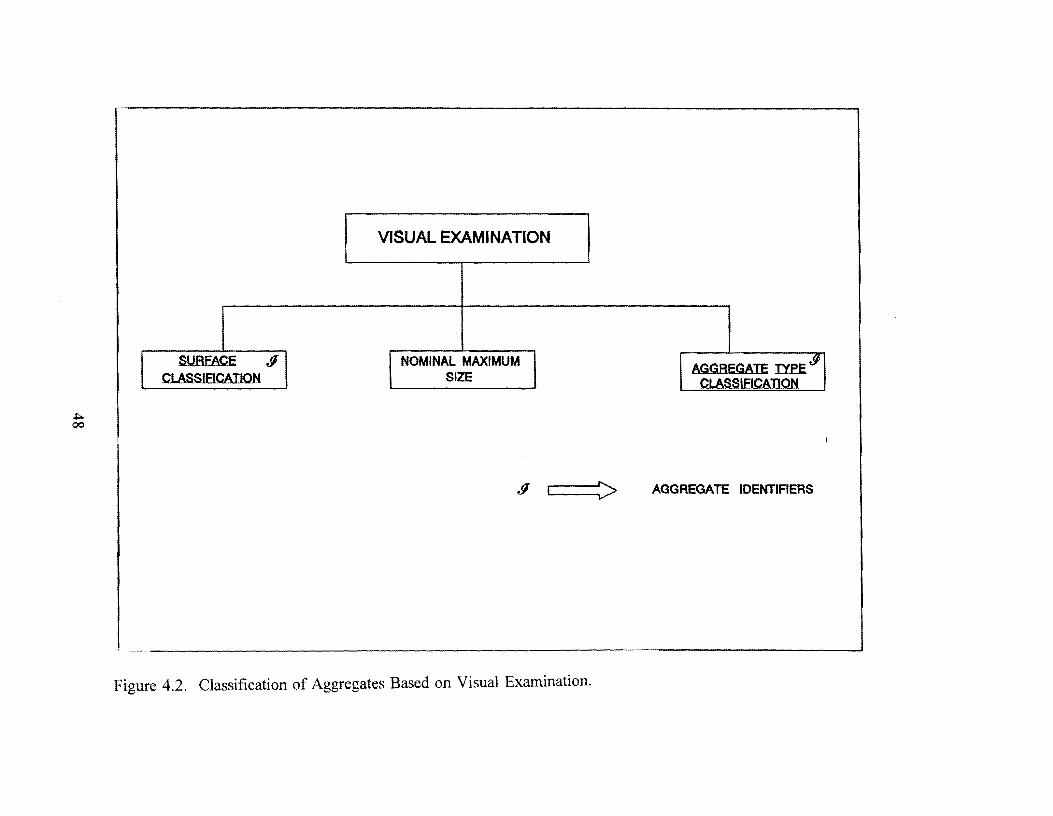
VISUAL EXAMINATION
SURFACE II NOMINAL MAXIMUM AGGREGATE D'.eE
91
CLASSIEICAIION SIZE QLASSIEICAJJQN
AGGREGATE IDENTIFIERS
Figure 4.2. Classification of Aggregates Based on Visual Examination.

Table 4.3. Subgroups and Respective Designations under Laboratory Examination.
Subgroup Designation
Physical Properties LP
Chemical Properties LC
Mechanical Properties LM
Thermal Properties LT
Physical Properties
Physical properties of coarse aggregates are proposed to be evaluated by classifying
them based on the:
• Size Distribution,
• Textural Characteristic,
• Shape Classification,
• Specific Gravity, and
• Porosity .
These subgroups have been designated from LP-1 to LP-5. These properties are
expected to provide comprehensive evaluation of the physical aspects of coarse aggregates.
Chemical Properties
Chemical properties of coarse aggregates are classified further based on the:
• Mineral Composition,
• Oxide Content,
• Alkali-Silica Reactivity, and
• Alkali-Carbonate Reactivity.
Evaluation of these properties would help in assessing the chemical composition,
mineralogy and presence of any deleterious chemical compounds in coarse aggregates and is
thus expected to provide a good understanding of the chemical behavior of the aggregates.
These subgroups have been designated from LC-1 to LC-4.
49

Mechanical Properties
Mechanical properties of coarse aggregates can be further classified based on the:
• Abrasion Resistance,
• Accelerated Polish Value,
• Fracture Toughness (stress intensity factor, K1p), and
• Sulfate Soundness.
Evaluation of mechanical properties of aggregates is crucial for assessing the key
characteristics like strength, soundness, skid resistance, impact resistance and bond strength of
the aggregates. These properties have been designated from LM-1 to LM-4.
Thermal Properties
Coarse aggregates can be further classified based on their thermal properties, namely:
• Thermal Coefficient of Expansion,
• Specific Heat, and
• Thermal Conductivity.
These are expected to provide an understanding of the effects of the thermal properties
of aggregates on the performance of concrete. These subgroups have been designated from
L T-1 to L T-3. Figure 4.3 shows the classification of coarse aggregates based on their
laboratory evaluation. Some of the properties have been represented by a superscript and are
the properties into which the classification system narrows down ultimately.
Keeping in view the complexity of the suggested classification of aggregates, which is
not only exhaustive but also time consuming, the properties listed in the classification system
are divided into three major categories:
• Aggregate Identifiers,
• Basic Test Parameters, and
• Inferred Parameters.
The rationale behind this division can be explained by the following points:
1. To keep the classification system simple,
2. To suggest tests which are less time consuming but more informative, and
3. To differentiate between the properties which help in aggregate identification and
the properties which provide information for predicting their behavior.
50

LABORATORY INVESTIGATION
PHYSICAL CHEMICAL MECHANICAL THERMAL PROPERTIES PROPERTIES PROPERTIES PROPERTIES
SIZE MINERAL ABRASION
DISTRIBUTION COMPOSITION RESISTANCE
THERMAL COEFFICIENT
TEXTURAL [ilJ OXIDE CONTENT PJ] ACCELERATED
CHARACTERISTIC POLISH VALUE
Vi SPECIFIC
HEAT
SHAeE .<J ALKALI • SILICA KIF CLASSIEICAIION REACTIVITY
THERMAL CONDUCTIVITY
SPECIFIC ALKALI • CARBONATE SOUNDNESS GRAVITY REACTIVITY
NOIE: .<J > AGGREGATE IDENTIFIERS
POROSITY PJ] > BASIC TEST PARAMETERS
> INFERRED PARAMETERS
Figure 4.3. Classification of Aggregates Based on Laboratory Examination.

Aggregate Identifiers
Aggregate identifiers can be defined "as those aggregate parameters which
identify the aggregate". These are the parameters which provide the ultimate classification of
the coarse aggr_egates based on this classification system. Hence, these are referred to as
"Designators". The properties which are classified under this category are:
• Shape Classification,
• Aggregate Type Classification, and
• Surface Type Classification.
Classification of aggregate identifiers is shown in Figure 4.4. The above mentioned
properties correspond to the subgroup designations LP-3, V-3, and V-2, respectively.
Based on shape, aggregates are further classified into standard shapes of aggregates,
namely, Cubic, Disc, Bladed and Rod. Shape classification identifiers are designated C, D, B,
R respectively.
Aggregate type classification helps in identifying the geologic origin of the aggregates.
It is further classified into Igneous, Sedimentary and Metamorphic rock types. These are
designated by I, S and M respectively.
Surface type classification essentially helps in identifying the aggregate based on
whether the aggregate is crushed or uncrushed. These identifiers are designated as C and U,
respectively. A typical classification of aggregate based on this classification system is
"DSC", where D corresponds to the Disc shape of the aggregate, S refers to the sedimentary
origin of the aggregate and C suggests that the aggregate in question is crushed. This
classification is represented more explicitly in the attached appendix.
Basic Test Parameters
Basic test parameters can be defined as the "aggregate parameters which provide
detailed information with regard to the properties of the aggregate which may be correlated to
the performance of the aggregate under a given set of conditions" These are referred to as
"Modifiers". The properties which have been classified under this category are as follows:
• Textural Characteristic,
• Oxide Content, and
• Abrasion Resistance.
52
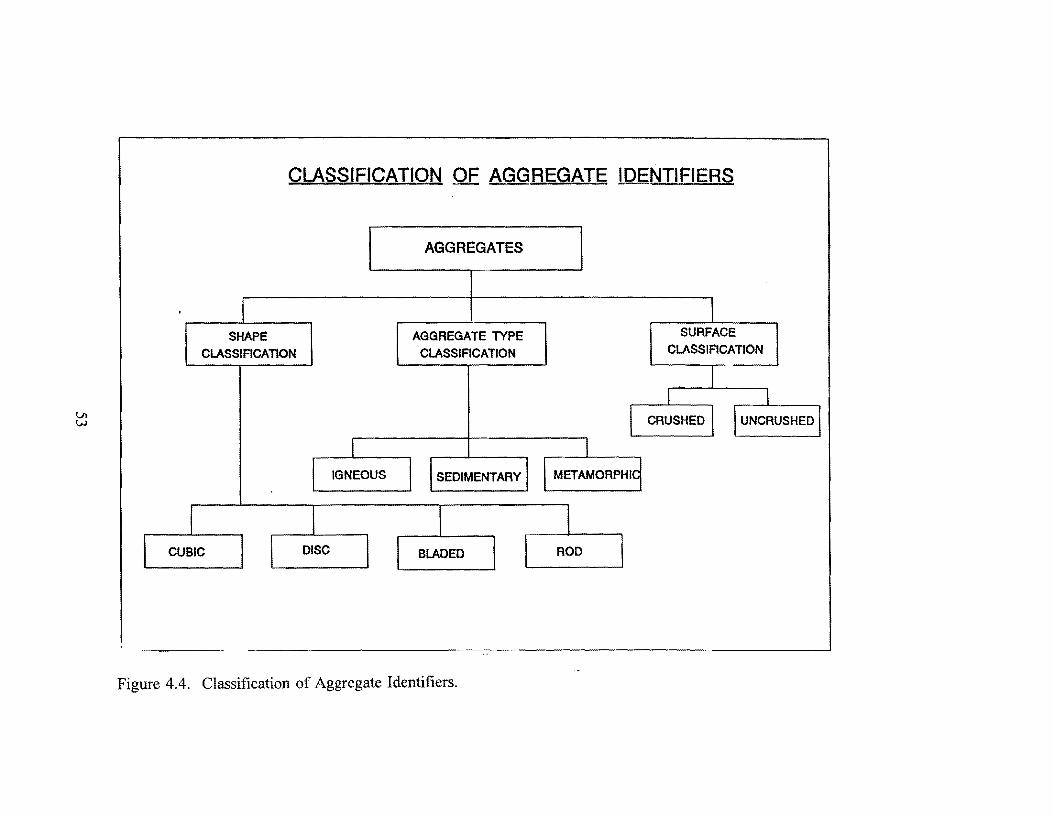
CLASSIFICATION OF AGGREGATE IDENTIFIERS
SHAPE CLASSIFICATION
CUBIC
IGNEOUS
DISC
AGGREGATES
AGGREGATE lYPE CLASSIFICATION
SEDIMENTARY
BLADED
Figure 4.4. Classification of Aggregate Identifiers.
METAMORPHI
ROD
SURFACE CLASSIFICATION
CRUSHED UNCRUSHED

The classification of basic test parameters is shown in Figure 4.5. These properties
correspond to the subgroups designated by LP-2, LC-2, and LM-1. Fractal Dimension
analysis can be carried out on aggregates and their textural characteristics can be classified as
smooth, medium or rough. Chemical analysis of aggregate samples can be performed by
using the technique of atomic emission spectroscopy, from which the percents of various
oxides can be quantitatively determined. Since the concrete properties are more influenced by
the mineralogy of the aggregate, by using stoichiometric analysis, the original mineral
composition can be back calculated from the determined oxide contents present in the
aggregates. CHEM 2 a computer model, has been developed by Dossey et al. (35) at the
Center for Transportation Research at the University of Texas at Austin, which does the back
calculation of mineral composition. The abrasion resistance of coarse aggregates can be
determined by using the L.A abrasion machine and the results can be used to classify the
abrasion resistance of aggregates as high, medium and low. Test procedures and equipment
required for performing these basic tests are dealt within Chapter VI.
Inferred Parameters
These are the properties which were not classified under either of the above two
categories. They can be defined as the "properties which are a part of the aggregate
classification system, but are inferred from the designated basic tests." This category consists
of all the tests on aggregates which are very exhaustive to run and are time consuming. For
example, alkali-silica reactivity (ASR) and alkali-carbonate reactivity (ACR) are significant
chemical characteristics, but these tests require extensive setup time and need more time to be
carried out. It is anticipated that these characteristics may be inferred from the basic test on
oxide content, which is not only simple, but also provides information regarding the presence
of silica and carbonates in the aggregates. If this test determines that excess quantities of silica
or carbonates are present, based on need, either standard tests on ASR and ACR can be
carried out on the aggregates.
54
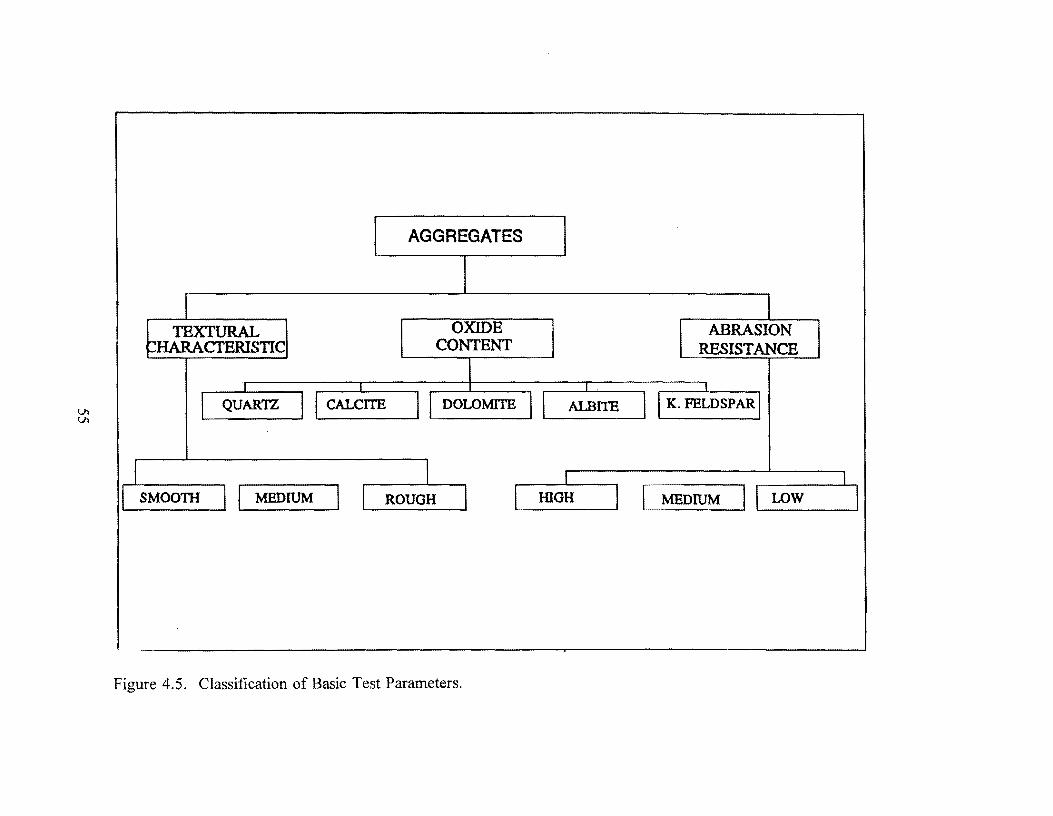
Vi Vi
AGGREGATES
TEXTURAL OXIDE '.:HARACTERISTIC CONTENT
I ., I I I
I QUARTZ I I CALCITE I I DOLOMITE I I Al.BITE
I I I SMOOTii I I MEDIUM I I ROUGH I IDOH I
Figure 4.5. Classification of Basic Test Parameters.
ABRASION RESISTANCE
I
I I K. FELDSPAR I
I
I MEDIUM I I LOW I
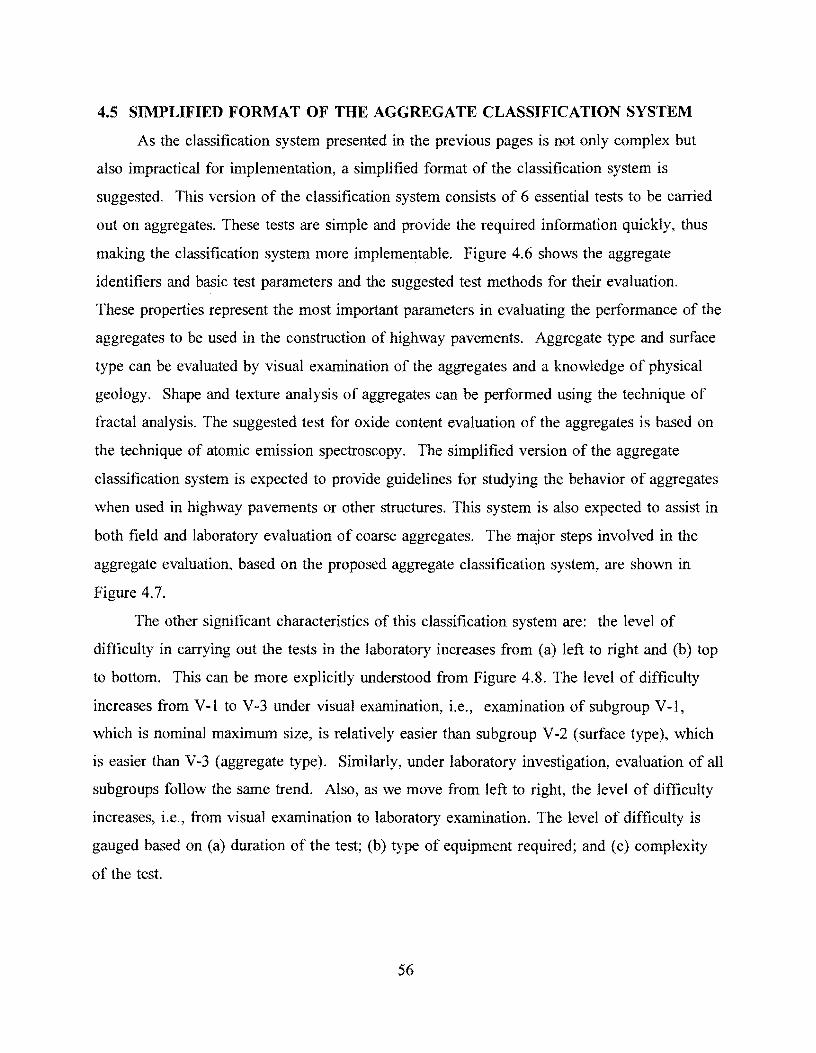
4.5 SIMPLIFIED FORMAT OF THE AGGREGATE CLASSIFICATION SYSTEM
As the classification system presented in the previous pages is not only complex but
also impractical for implementation, a simplified format of the classification system is
suggested. This version of the classification system consists of 6 essential tests to be carried
out on aggregates. These tests are simple and provide the required information quickly, thus
making the classification system more implementable. Figure 4.6 shows the aggregate
identifiers and basic test parameters and the suggested test methods for their evaluation.
These properties represent the most important parameters in evaluating the performance of the
aggregates to be used in the construction of highway pavements. Aggregate type and surface
type can be evaluated by visual examination of the aggregates and a knowledge of physical
geology. Shape and texture analysis of aggregates can be performed using the technique of
fractal analysis. The suggested test for oxide content evaluation of the aggregates is based on
the technique of atomic emission spectroscopy. The simplified version of the aggregate
classification system is expected to provide guidelines for studying the behavior of aggregates
when used in highway pavements or other structures. This system is also expected to assist in
both field and laboratory evaluation of coarse aggregates. The major steps involved in the
aggregate evaluation, based on the proposed aggregate classification system, are shown in
Figure 4.7.
The other significant characteristics of this classification system are: the level of
difficulty in carrying out the tests in the laboratory increases from (a) left to right and (b) top
to bottom. This can be more explicitly understood from Figure 4.8. The level of difficulty
increases from V-1 to V-3 under visual examination, i.e., examination of subgroup V-1,
which is nominal maximum size, is relatively easier than subgroup V-2 (surface type), which
is easier than V-3 (aggregate type). Similarly, under laboratory investigation, evaluation of all
subgroups follow the same trend. Also, as we move from left to right, the level of difficulty
increases, i.e., from visual examination to laboratory examination. The level of difficulty is
gauged based on (a) duration of the test; (b) type of equipment required; and (c) complexity
of the test.
56
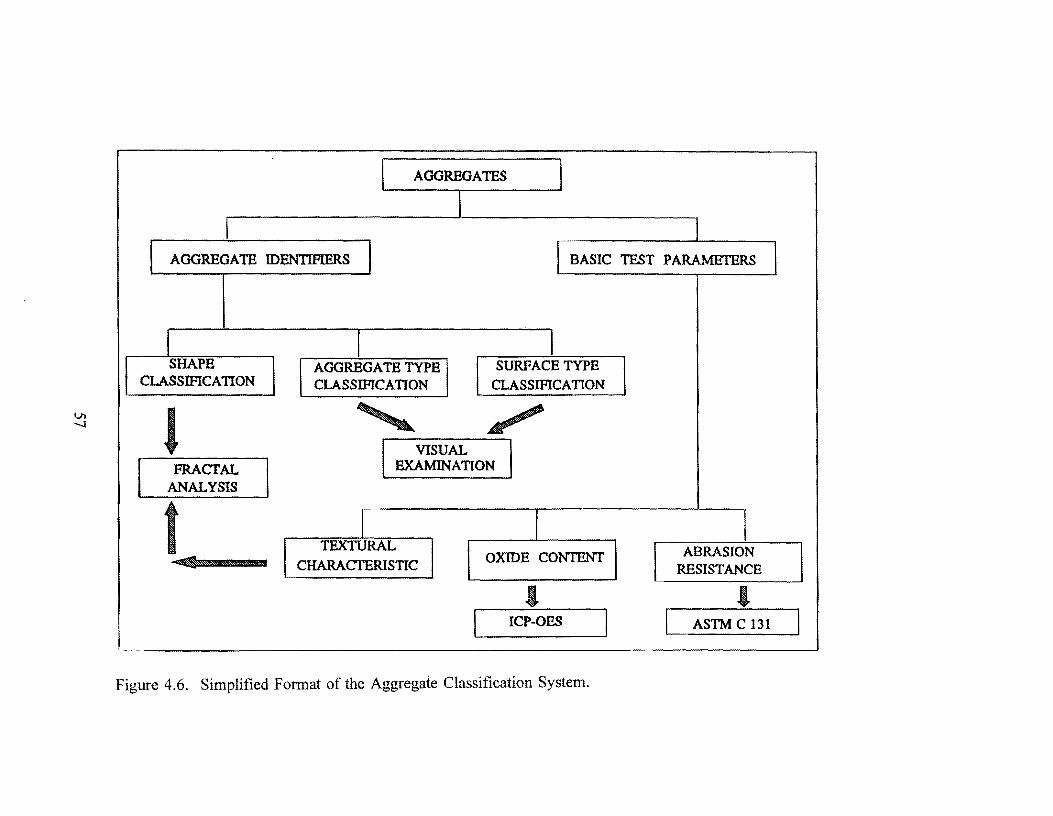
AGGREGATES
I AGGREG A TE IDENTIFIERS I I BASIC TEST PARAMETERS I
SHAPE CLASSIFICA TI
l ON
FRACTAL ANALYS IS I
I I AGGREGATE TYPE SURFACE TYPE CLASSIFICATION CLASSIFICATION
' / I VISUAL I EXAMINATION
I I TEXTURAL
CHARACTERISTIC OXIDE CONTENT
ICP-OES
Figure 4.6. Simplified Format of the Aggregate Classification System.
I ABRASION
RESISTANCE
ASTM C 131
Vo 00
AGGREGATE SAMPLE
J AGGREGATE IDENTIFICATION
SHAPE CLASSIFICATION
SURFACE TYPE
l
AGGREGATE TYPE
EVALUATION OF AGGREGATES
OXIDE CONTENT
J
ABRASION RESISTANCE
YES
• PERFORM
SPECIAL TESTS
I NO
PERFORMANCE ASSESSMENT
ANALYSIS OF RESULTS RECOMMENDATIONS
/ Figure 4.7. Major Steps Involved in the Performance Assessment of Coarse Aggregates Based on the Aggregate
Classification System.

AGGREGATE CLASSIFICATION SYSTEM
AGGREGATES
VISUAL EXAMINATION LABORATORY INVESTIGATION (L)
SURFACE § CLASSIFICATION
NOMINAL MAXIMUM SIZE
AGGREGATE I'leE § CLASSIFICATION
PHYSICAL PROPERTIES
(LP)
SIZE DISTRIBUTION
TEXTURAL fl CHARACTERISTIC
cLAl~AIION §
SPECIFIC GRAVllY
POROSllY
CHEMICAL PROPERTIES
(LC)
MINERAL COMPOSITION
OXIDE CONTENT 1J
ALKALI - SILICA REACTIVllY
ALKALI ·CARBONATE REACTIVITY
MECHANICAL PROPERTIES
(I.M)
ABRASION 1J RESISTANCE
ACCELERATED POLISH VALUE
KIF
SOUNDNESS
THERMAL PROPERTIES
(LT)
THERMAL COEFFICIENT
SPECIFIC HEAT
THERMAL CONDUCTIVllY
AGGREGATE IDENTIRERS
BASIC TEST PARAMETERS
INFERRED PARAMETERS
Figure 4.8. Complete Structure of the Proposed Coarse Aggregate Classification System.


CHAPTER 5: BASIS OF AGGREGATE CLASSIFICATION
SYSTEM IMPLEMENTATION
Various field and laboratory studies which have been carried to evaluate the influence
of aggregate type on the performance have been discussed in this chapter. Based on the
results of these studies, an effort has been made to develop guidelines for the implementation
of the proposed aggregate classification system which are presented in the later part of this
chapter.
5.1 FIELD INVESTIGATIONS
As a part of this research project, various field studies have been conducted in the form
of concrete pavement test sections at different locations in the state of Texas. These test
sections were primarily aimed at studying the factors that affect the performance of
pavements. The first field investigation was carried out on FM 559, Texarkana, Texas, where
a jointed plain concrete pavement section of 13 inches thickness was constructed in the month
of October, 1991. Among other factors, the effects of aggregate type and gradation on the
behavior of jointed concrete pavement were investigated and the results documented. The
five different mix designs which were used in that field study are presented in Table 5.1.
The aggregate types in the above table are represented by "SRG" and "LS" for siliceous
river gravel and limestone aggregate, respectively. The aggregate type, percent, and size for
each mix design are shown in Table 5.1. Mix design 1 was the control mix and did not
contain any intermediate (medium size particles) aggregate. In all other mixes, buckshot was
added as an intermediate aggregate to the aggregate gradation. The main purpose of addition
of intermediate aggregate is to fill the "gaps", which are essentially the voids between coarse
aggregates in the mix. These aggregates, on account of their medium size, can occupy these
spaces between coarse aggregates and thus decrease the volume of voids in the concrete. The
effect of addition of intermediate aggregate was studied by evaluating the cored specimens
from the pavement sections of different mix designs. The elongation and spacing of air
pockets were measured by linear traversing and the level of honey combing was identified for
61

Table 5. l. Different Mix Designs Used in Texarkana Test Section (36).
Mix Design No. Coarse Aggregate
Type Size
1 (Control Mix) SRG(100%) 1-1/2"
2 LS (50%) 1-1/2" SRG (50%) 314"
3 SRG (100%) 1-1/2"
4 SRG (100%) 314"
5 LS(100%) 1-1/2"
each cored specimen. The cored specimens containing intermediate aggregate showed lower
percentages of air pockets indicating the low severity of honey combing. Also, it was
reported that placement of concrete was relatively easier with the mix containing intermediate
aggregate, which can probably be attributed to the improved workability caused by the
intermediate aggregate. Mix design 2 was used to examine the effect of aggregate blending
on the properties of concrete. Siliceous river gravel of different sizes were used in mixes 3
(aggregate size: 1 1/2") and 4 (aggregate size: 3/4") and limestone aggregate was used in mix
5. Thus, these mix designs were developed to evaluate the effect of aggregate size, type, and
blending on the crack development in the pavement. Both conventional and early-aged saw
cutting techniques were used for studying the crack development at longitudinal and
transverse joints. The depth used for early-aged sawcut was 1 inch, whereas the conventional
technique used a depth of D/4 or about 3 inches. Crack surveys were done to observe the
pattern of crack formation at the desired locations (i.e., sawcut locations) and at any other
locations. The surveys showed that the sections with river gravel coarse aggregates showed
higher likelihood of crack formation at the sawcut locations than the sections with limestone
aggregates (36).
Concrete properties such as compressive strength, flexural strength, and fracture
toughness were tested for beam specimens that were prepared in the field. These tests were
62

conducted to investigate the effect of different coarse aggregate characteristics on the behavior
of concrete. The average flexural strength and compressive strength for all the mixes at the
age of seven days and the fracture parameters for mixes 3, 4, and 5 at 1-day concrete age are
tabulated in Table 5.2 (36). From Table 5.2, it can be observed that the mix with 100 %
crushed limestone (mix 5) showed higher flexural and compressive strength than mixes 3, 4,
and 5. On the other hand, mix design 2, which consisted of 50% river gravel and 50%
limestone, exhibited higher compressive strength but lower flexural strength than mix 5.
Although mixes 3 and 4 had same the intermediate and fine aggregate, mix 3 showed higher
compressive strength and flexural strength than mix 4. This can probably be attributed to the
larger size of coarse aggregate used in mix 3. However, the compressive strength of mix 4,
which contained smaller size river gravel (3/4") than mix 1 (1-1/2"), was higher than that of
mix 1. The higher compressive strength of mix 4 may have been a result of improved
gradation by the addition of intermediate aggregate. The coefficient of variation for flexural
strength was found to be in the range of 3.8 to 6 % and for compressive strength, it was in
the range of 0.6-5.9 %. The variation of compressive strength of different mixes with age is
shown in Figure 5.1.
Table 5.2. Various Concrete Properties of Specimens Prepared with Different Mix Designs at Texarkana Test Section (36).
Mix Design No. Average Flexural Average Fracture Strength@ 7 Compressive Toughness
Days (psi) Strength@ 7 Parameter Days (psi) (psiv'in)
1 662 4235 -2 805 5945 -3 693 5155 717
4 662 4380 687
5 841 5685 827
63

O'\ +,-..
-·0 c.. -..c ..... a> c Q) '-+J en Q)
> '(;)
"' Q) '-c.. E 0 u
6000 ····-······--·-·····~·····--· ........................................................................................................................................................... . ......
0 I! + ...... 0 • 5000----•--................ -................. - ................. -....... * ..... ._ .......................................................................................... >< ........... .
0 x
0 * ~ 4000----............ x ............. - .......................................... _ .................................................................................................................... ..
• I!
3000-----···--··· ......... -......................................... _ .............................................................................................................................. .
2000-1-~~~~,~~~--.,.--~~---",.--~~~~.~~~~.~~~--l
o 5 10 15 20 25 Age (day)
• Mix 1 + Mix 2
o Mix 3 (rerun) x Mix 4
* Mix3
.A. Mix5
30
Figure 5.1. Compressive Strengths of Concrete Specimens at Texarkana Test Section.

Fracture toughness was measured by determining fracture parameters based on a
nonlinear fracture model for concrete (size effect law), which suggests that fracture occurs in
concrete in a nonlinear fashion. Three point bending tests were carried out on beam
specimens of 1-day age and two fracture parameters, Ku - critical stress intensity factor and Cr
-effective critical crack increase, were determined. As shown in Table 5.2, the critical stress
intensity factor for mix 5 was the highest and was lowest for mix 4. The mix containing
crushed limestone showed a higher Ku value than specimens made with different sizes of river
gravel aggregate (36). Thus, it can be reasonably concluded from these results that the
aggregate type, size and gradation affect the concrete material properties such as compressive
strength, flexural strength and fracture toughness.
The variations in concrete material properties caused by different aggregate types can be
attributed to the chemical composition of the aggregate, its shape and texture, and the bond of
the aggregate. Characterization of these properties could provide additional information to
observe the variation in these properties caused by different aggregates and would provide for
a better understanding of the crack propagation in concrete pavements.
While the Texarkana test section was constructed in cool weather (November 1991;
average temperature: 70°F), the next field study was conducted in summer (August 1992;
average temperature 95°F) in Cypress, Texas, on Highway 290. The layout of this test
section is shown Figure 5.2. The primary aim of this field study was to examine the factors
that affect the cracking behavior of Continuously Reinforced Concrete (CRC) pavement and to
develop some guidelines for concrete pavement construction under hot weather conditions.
Four different mix designs were used in Part I-A and Part II of this test section, shown in
Figure 5.2. Specimens were prepared from these different mixes and were tested for
compressive strength and flexural strength. The four mix designs and their corresponding
values of concrete properties at 28-day age are summarized in Table 5.3. It can be seen from
Table 5.3 that the flexural strength of concrete made with 100% river gravel shows higher
flexural strength than one made with 100% limestone. However, the compressive strength is
highest for the concrete specimen made with 100% limestone.
65
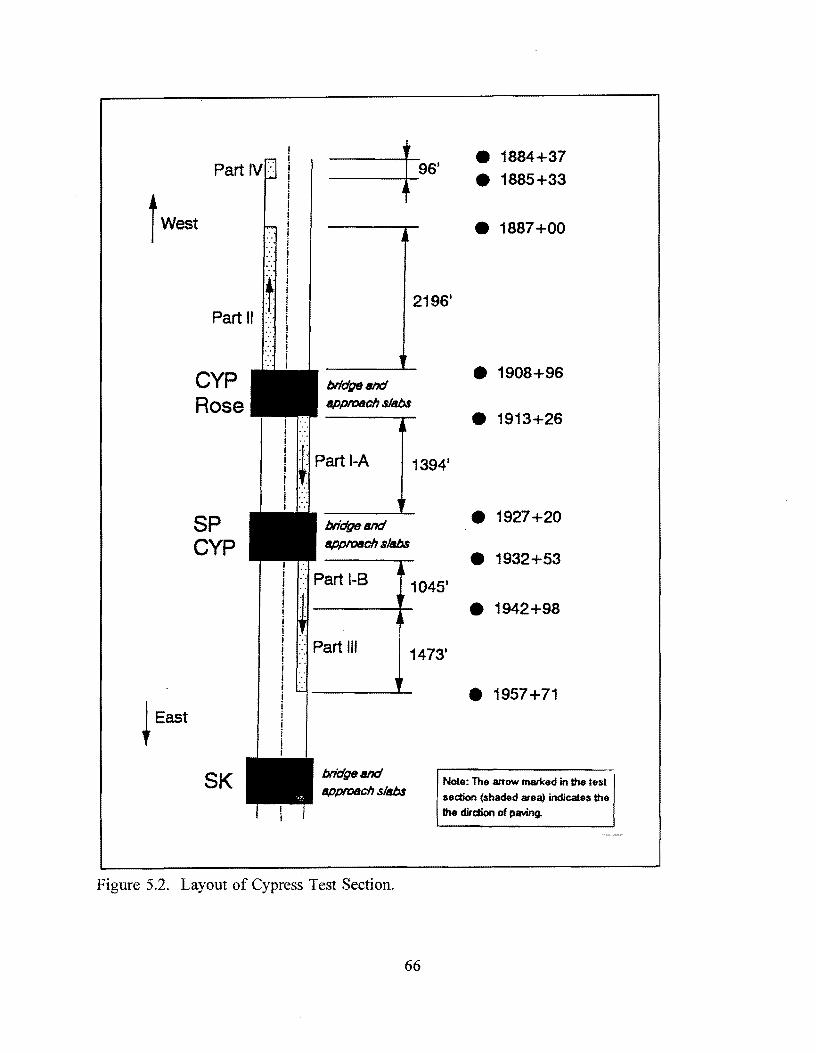
==+96' • 1884+37 Part IV::: • 1885+33
t West • 1887+00 .. .. .. ..
t . 2196' Part II ..
..
..
CYP • 1908+96 brldgesnd
Rose approach .slabs 1913+26 .. l • .. .. .. .. f Part I-A 1394'
.. .. .. .. ..
SP brldgesnd • 1927+20
CYP approach .slsb.f 1932+53 • I
i <· Part 1-8 i 1045' ! I .. • 1942+98 j i
.. i .. i ::: Part Ill i 14731 i j j
..
i • 1957+71 i i East I i i i i i
SK brldgesnd Note: The arrow maticed in the lest
approach slabs section (shaded area) im:licales the
the dirction of paving.
Figure 5.2. Layout of Cypress Test Section.
66

Table 5.3. Observed Material Properties at Cypress Test Section.
Mix Aggregate Type Flexural Strength Compressive Strength Design @ 28 days (psi) @ 28 days (psi)
1 100% LS 799 6790
2 67% LS, 33% 818 5625 SRO
3 33% LS, 67% 769 5395 SRO
4 100% SRO 843 6005
Concrete specimens made with aggregate blends showed different results than the ones
made with single aggregate. This can be better explained with the aid of Figure 5.3, where
the variation of flexural strength of concrete made with different proportions of river gravel
and limestone aggregates with age is illustrated. This figure indicates that mix 3, which
contained a higher percentage of river gravel, showed higher initial strength but a low final
strength, whereas mix 2, containing about 33% river gravel, showed a consistent increase in
strength with age. This suggests the importance of further research on aggregate blends on
the performance of concrete pavements.
An extensive crack survey was carried out to investigate the influence of aggregate type
on crack initiation and subsequent growth in the pavement. The study revealed that the
section which had concrete made with a higher percentage of river gravel had less uniformly
distributed cracks and the average crack spacing was found to be smaller than the pavement
section where a relatively higher percentage of limestone was used. This is illustrated in
Figure 5.4. Also, the siliceous river gravel sections had higher average crack width than
corresponding limestone sections. The crack development pattern of the siliceous gravel
sections could probably be attributed to their higher thermal coefficient than the limestone
coarse aggregate (35). Figure 5.5 shows the variation of average crack density with percent
of river gravel coarse aggregate in concrete used in two parts of the test section. The
regression fits of the average crack density values show the linear variation with the increase
67

900
800 -
700
600 -!".:::-(/) Q .__..
500 ..c ...... CJ) c Q)
400 '-......
(fJ
°' 00
3 7 14 28 Age (days)
111111 Mix1 l22Q] Mix 2 l22ZJ Mix 3 ESSj Mix 4
Figure 5.3. Flexural Strength vs. Age of Concrete for Different Mix Designs Used in Cypress Test Section.
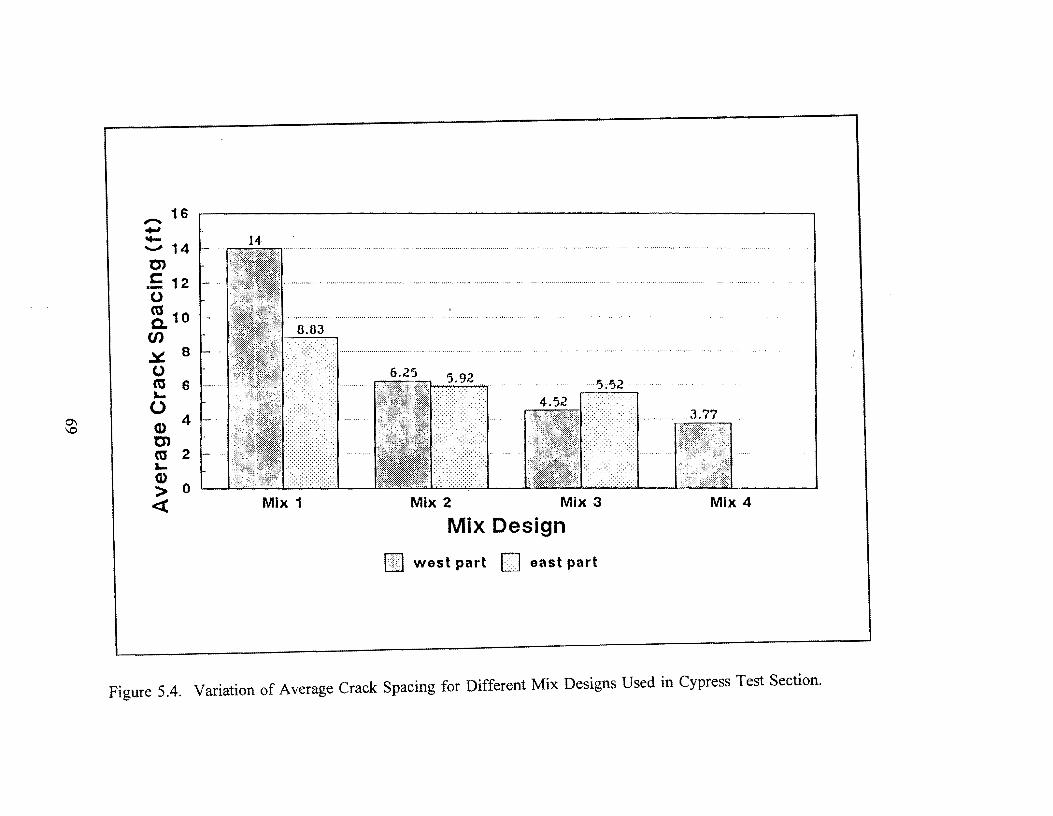
,..... 16 .... .._ 14 - 14 O')
.5 12 - ..
0 ('\J 10 Q. en :t:. 8
0 ('\J 6 ~
0 0\ (l) 4
"° O') C'G 2 -~ (l)
> 0 <C Mix 2 Mix 3 Mix 4
Mix Design
@ill] west part Q east part
Figure 5.4. Variation of Average Crack Spacing for Different Mix Designs Used in Cypress Test Section.

........ 0.25 ~ ...., CJ)
c Q)
0
0.2
~ 0.15 0 ro L. () 0.1
Cl) Cl ca o.o s L. Cl)
>
.. . . ... . ~·· ... ... .. . . .. ...
... ... ... ... ...
... ... £:, ...
... ·····
.... ~ ·~ ~·. ~ ... ····
.:·· ... .... r., ... •• ...
... ... .... ... ... ... ...
... ...
<C 0 ~-~-.~~.-~-.~~r--r-r-~--.~~-r-----r~~~~-1 0 20 40 60 80 100
Percentage of SAG In Coarse Aggregates (%)
Figure 5.5. Average Crack Density (crack/ft) vs. Percent of River Gravel in Coarse Aggregates Used in Cypress Test Section.

in the percent of river gravel coarse aggregate. This can be explained by the fact that the
higher river gravel content causes higher thermal expansion, resulting in the development of
cracks under high temperatures, such as 90°F, prevalent at the time of construction of the
Cypress test section. This figure explains the importance of characterization of aggregate type
for developing effective crack control guidelines.
5.2 LABORATORY STUDIES
A part of this research study, conducted at the Center of Transportation Research,
University of Texas at Austin, concentrated on the laboratory evaluation of the effects of
aggregate blends on the properties of Portland Cement Concrete. Specimens made with
blended aggregate and single aggregate were tested for compressive strength, modulus of
elasticity, splitting tensile strength, and linear shrinkage. The comparison of results showed a
linear relationship between concretes made with single and blended aggregates (32). This
study suggested that the properties of concrete made with blends of aggregates would vary
depending on the aggregate type and proportion.
Dossey et al. (35) have performed extensive chemical composition studies on aggregates
which include determination of principal mineral composition by X-ray diffraction and oxide
residue analysis. Oxide based models were developed with the results obtained from this
project. A computer program, CHEM 1, was developed which required the percent by weight
of four oxides, namely, CaO, MgO, Al20 3, and Fe20 3 as inputs to predict the tensile strength,
compressive strength, modulus of elasticity and drying shrinkage of concrete. The idea
behind this model was to provide the user with a rough prediction of material properties of
concrete made with a particular type of aggregate. The ultimate purpose was to use these
concrete material properties to determine design parameters such as the bar size, and steel
percent using another computer program, CRCP, so as to obtain the desired level of
performance.
As the oxide contents in aggregates are proportional to various minerals, these models
were further modified so as to develop models that are directly based on mineral composition.
Stoichiometric analysis was used to back-calculate the mineral composition from the
determined oxide contents. A modified version of the CHEM 1 program has been developed
which requires percent by weight of minerals, namely, Quartz, Calcite, Dolomite, Albite and
71

Potassium Feldspar. Regression models that were developed for various concrete material
properties are listed below (35).
fc (psi) =
fi (psi) =
e8·943 * (Calcite)"0
·086 * (Quartz)"0
·072 * (Dolomite)"0
.oi1 * (FS)"0
·033
1298-8.87 * (Calcite) - 8.089 * (Quartz)-7.45 * (Dolomite)-49.8 *(PF)+ 16.6 *
(Albite)
E(psi, millions) e1.m * (Calcite)"0·0087 * (Quartz)0
·021 * (Dolomite)0·
088 * (FSyo.1ot
The CHEM 2 program also predicts the thermal coefficient of expansion and the
regression model for thermal coefficient was (35):
ac = eJ.098 * (Quartz)°-486 * (Calcite)"0·106 * (Dolomite)0,415 * (PF)"2
·37 * (Albite)J.635
These models were used in computer program CHEM 2 to predict the material properties of
concrete. The oxide content test is a quick test and the results obtained from this test can be
conveniently used to predict the performance of aggregates prior to their use in the field (35).
Another important characteristic of coarse aggregates which needs to be evaluated
before their selection is the chemical reactivity. Presence of deleterious minerals in
aggregates can cause alkali-aggregate reactivity in concrete. Extensive studies have been
carried out to study the causes of alkali-silica reactivity and alkali-carbonate reactivity. It has
been determined that the existing test procedures (ASTM C-289 and ASTM C-227) for
detecting deleterious aggregates have often been ambiguous in the sense that slow reactive
aggregates such as quartzites, gneisses, and schists, which have been found to be innocuous in
the laboratory tests, have caused failures due to alkali-silica reactivity in field structures (37).
Various research studies conducted under the Strategic Highway Research Program
(SHRP) reflected that the existing test procedures are not only time consuming but also very
permissive in identification of "deleterious" or "innocuous" aggregates. For example,
aggregates such as quartz, quarried granite, quarried granite, chert, quartzite were classified as
"slow reacting" when tested as per ASTM C-289 but these aggregates were found to be
associated with alkali-silica reactivity when used in concrete structures. Conversely,
aggregates which have been found to be susceptible to deleterious reactivity did not indicate
development of alkali-silica reactivity. This can be attributed to the low alkali cement that
72

may have been used which impedes its development. Similar results were reported when
these tests were reported as per ASTM C-227. Thus, these studies stressed the need for
development of a quick and a reliable test method for identifying deleteriously reactive
aggregates (37).
A rapid immersion test, originally developed in South Africa, was found to be a suitable
test procedure to identify aggregates based on the measured expansion of mortar bars after 14
days of testing. This test procedure essentially consists of mortar bar preparation as per
ASTM C 227, immersion of these bars in water at 80 °C for 1 day and then in IN NaOH
solution for 14 days, and measurement of comparator readings (37). The other form of alkali
aggregate reactivity is the alkali-carbonate reactivity, but this is reported to be less frequent
than the alkali-silica reactivity. The reaction mechanism is similar to that of alkali-silica
reactivity. The aggregates which are rich in minerals such as dolomite, calcite and illite are
susceptible for causing this carbonate reactivity. This can be determined as per ASTM C-586
test procedure (38).
Thus, these test procedures evaluate the deleterious nature of the aggregates based on
which recommendations can be given for the use of low alkali cement which inhibits the
development of alkali-silica reactivity or alkali-carbonate reactivity in the field.
5.3 GUIDELINES FOR IMPLEMENTATION OF CLASSIFICATION SYSTEM
The guidelines for implementation have been drawn based on the laboratory and field
studies conducted as a part of this research study and other studies conducted to determine the
reactive aggregates.
As explained in Chapter IV, different types of physical, chemical, mechanical and
thermal properties that make up the classification system are divided into three categories,
namely, Aggregate identifiers, Basic test parameters, and Inferred parameters. These were
categorized in view of the difficulty in implementing an exhaustive aggregate classification
system. It is recommended that the proposed classification system be implemented at three
levels based on the type of information required on the aggregate and required level of
accuracy. Before implementing the classification system, based on the location of the project,
functional importance and type of structure, the potential problems associated with the
73
aggregates should be determined. Based on this assessment which assists in arriving at a
specific level of accuracy of information required, the implementation of the classification
system should be carried out accordingly.
The first level of implementation consists of evaluation of aggregate properties and
physical geology as identified and grouped under "Aggregate Identifiers". This includes a
qualitative appraisal of aggregates with respect to their Shape, Aggregate Type and the
Surface Type. These properties will serve to identify the aggregate and would provide
information regarding the parent rock of the aggregate being evaluated. The information
obtained from this evaluation could be used to understand other properties of aggregates and
the performance level can be specified. Evaluation of these properties is expected to provide
a precise identification of the aggregates. This would be the first level at which the aggregate
classification system could be implemented, which essentially consists of visual examination
of the aggregates from a stock pile. Knowledge of physical geology for aggregates can be
supplemented by use of reference 44.
The next level of suggested implementation of the aggregate classification system would
involve a more detailed investigation of the aggregates. It entails laboratory evaluation of
aggregates so as to predict their performance. The tests which need to be carried out for this
evaluation include the oxide content, abrasion resistance and the texture of the aggregates.
The oxide content test is expected to provide a thorough chemical analysis of the aggregates.
Various oxides present in the aggregates can be determined from this test and the dominant
minerals present in the aggregates can be back calculated using stoichiometric analysis. This
information would assist in predicting the thermal expansion of the aggregates. The abrasion
resistance would provide information pertaining to the hardness or toughness of the aggregates
and the textural characteristic would furnish the roughness of the aggregate. The surface
texture can be used as a basis to interpret the skid resistance of the aggregates. Though this
level of implementation is more time consuming than the first level, the suggested tests are
quick and provide necessary information and would greatly assist in the performance
assessment of the aggregates.
The first two levels of aggregate classification system not only render a comprehensive
identification and evaluation of the aggregates but also provide the highway engineers with a
tool for effective selection of suitable aggregates for various projects. A third level of
74
implementation of the classification system is suggested only if aggregate evaluation of
greater detail and accuracy is warranted. This level would essentially involve evaluation of
only those properties which require a detailed investigation. For example, if the basic tests
which are included in the second level of implementation suggest presence of some
deleterious minerals which would promote Alkali-Silica reactivity in the aggregate being
investigated, a more detailed evaluation of Alkali-Silica reactivity can be done based on the
suggested test procedure in the basic structure of the classification. These tests would be
specific, more time consuming, involve higher costs and would need more complex
equipment.
The first two levels of implementation of these recommendations should be carried out
in a phased manner and effort should be made to study the aggregate properties in the first
two levels carefully and develop patterns by which more complex aggregate properties can be
inferred from these properties. Though the third level is not easily implementable, it does
assist in either confirming or negating the results obtained from the first two levels.
5.4 RELATION OF AGGREGATE PROPERTIES TO PERFORMANCE
This section is intended to summarize the aggregate test parameters as they relate to the
performance. The test parameters included in the classification system relate to the
performance in the sense that the information provided by these tests would help the engineers
using this system in arriving at definite conclusions regarding the performance of aggregates
in the field. Trial field implementation would help in correlating the performance of different
aggregate types to the overall performance of the pavements or other structural systems.
The Texarkana test section provided some interesting results relating to the contribution
of aggregates to the performance of pavement and these results are used for an explicit
explanation of the relation of aggregate tests to performance. FWD testing was conducted on
various joints and cracks to evaluate the load transfer efficiency across joints and cracks in
sections made with different coarse aggregates. The results showed that the concrete made
with river gravel aggregates caused higher L TE values and effective stiffness, indicating high
load transfer across those joints. This information directly relates the aggregate properties to
performance. The better load transfer of river gravel concrete joints can be understood by
75

studying the fracture behavior of concrete made with different aggregate types. The fracture
toughness of river gravel concrete was higher than that of limestone concrete which indicates
that river gravel is hard (36). Figure 5.6 shows the variation of load transfer efficiency versus
type of mix design. The examination of fracture toughness specimens of concrete made with
river gravel aggregate showed that the fracture surface progresses around a river gravel
aggregate. Better aggregate interlock was provided by the river gravel aggregate, which
improves the joint performance under moving loads. However, river gravel sections resulted
in higher average crack density than that of limestone sections. Thus, identification of
aggregate type is crucial in understanding its field performance. The oxide content test,
which is one of the recommended basic aggregate tests, would provide information regarding
the different oxide contents present in aggregates which can be used for back calculating the
most abundant mineral present in the aggregate. Knowledge of mineral composition of the
aggregate assists in identifying the aggregate type (such as siliceous or dolomitic) which could
be used to infer other aggregate parameters such as thermal coefficient of expansion, strength,
and fracture toughness which are characteristic of the minerals present in the aggregates (35).
Identification of aggregate with a high thermal coefficient suggests more closely spaced cracks
and higher average crack density. The joint spacing and sawcut timing could be varied
accordingly so as to expect controlled crack formation at designated sawcut locations.
Shape and surface texture of aggregates indicate the permanent deformation
characteristics of an asphalt pavement and porosity of aggregates determine the available pore
spaces and their water retention capacity. Thermal characteristics, such as thermal coefficient
and thermal conductivity, cause volume changes (causing water in the voids and pore spaces
to expand) in the aggregate which causes microcracking and popouts. Chemical properties,
such as alkali-silica reactivity and alkali-carbonate reactivity, are related to the distresses such
as map and longitudinal cracking in pavements and other bridge columns and indicate the
surface deterioration of pavements (37). Mechanical properties such as abrasion resistance,
polish value, fracture toughness, and soundness indicate the resistance to degradation under
loads and extent of polish of the wearing surface.
76

-.J -.J I
100 i--~~~~~~~~~~~~~~~~~~~~~~~
80
60
........ 0 'Cf!.
._. 40 w I-_,
20
0 Mix 1 [e] Mix 1 [n] Mix 2 [e] Mix 2 [n] Mix 3 [e] Mix 4 [e] Mix 5 [e]
Mix Design ~ downstream II.I upstream [e] early-aged sawcut [n] conventional sawcut
Figure 5.6. Load Transfer Efficiency vs. Mix Design.

Different aggregate parameters are indicative of different performance characteristics.
Aggregate properties and respective performance indicators are summarized in Table 5.4.
From the table, it can be seen that evaluation of material properties of aggregates provide an
indication of their performance. Also, it can be seen that some aggregate characteristics can
be inferred from other aggregate parameters. For example, physical properties, such as shape
and texture, provide information not only on the geometry of the aggregate but also on its
physical stability. Similarly, chemical properties, such as such as oxide content, provide
information regarding the mineral composition, chemical reactivity and thermal coefficient of
expansion. The Texas Department of Transportation used the Los Angeles abrasion test as a
primary test to evaluate the wear of aggregates and soundness of aggregates is inferred from
this test (31 ).
As explained in the previous section, three basic test parameters, namely, textural
characteristic, oxide content, and abrasion resistance are included in the second level
implementation of the classification system and serve as performance indicators with respect
to the physical stability, chemical as well as thermal characteristics, and mechanical wear of
aggregates.
78

Table 5.4. Aggregate Test Parameters and Relative Performance Indicators (15).
Property Type
Physical Properties
Chemical Properties
Mechanical Properties
Thermal Properties
Aggregate Characteristic
Particle Size Shape Surface Texture Porosity Specific Gravity
Mineralogy Oxide Content Alkali-Silica reactivity Alkali-Carbonate Reactivity
Abrasion Resistance Accelerated Polish Value Fracture Toughness (kIF) Soundness
Coefficient of Thermal Expansion Specific Heat Thermal Conductivity
79
Performance Indicator
Uniform distribution of surface loads; Aggregate interlock; Rutting in HMA pavements; Durability of pavements
Expansion characteristics of structures; Reactivity with the binder; Distress in pavements and bridge columns; Surface deterioration of structures
Resistance to degradation due to vehicle loads; Skid resistance; Extent of polish of wearing surface;
Thermal distresses such as curling, warping and microcracking

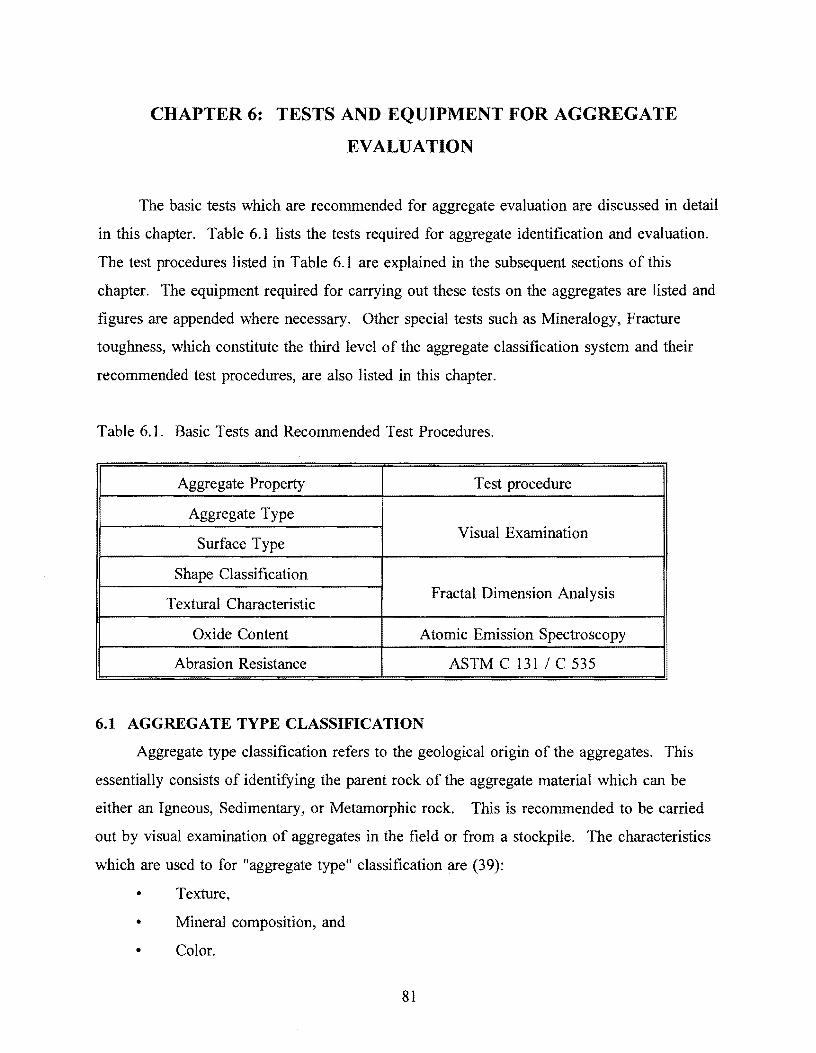
CHAPTER 6: TESTS AND EQUIPMENT FOR AGGREGATE
EVALUATION
The basic tests which are recommended for aggregate evaluation are discussed in detail
in this chapter. Table 6.1 lists the tests required for aggregate identification and evaluation.
The test procedures listed in Table 6.1 are explained in the subsequent sections of this
chapter. The equipment required for carrying out these tests on the aggregates are listed and
figures are appended where necessary. Other special tests such as Mineralogy, Fracture
toughness, which constitute the third level of the aggregate classification system and their
recommended test procedures, are also listed in this chapter.
Table 6.1. Basic Tests and Recommended Test Procedures.
Aggregate Property Test procedure
Aggregate Type
Surface Type Visual Examination
Shape Classification
Textural Characteristic Fractal Dimension Analysis
Oxide Content Atomic Emission Spectroscopy
Abrasion Resistance ASTM C 131 IC 535
6.l AGGREGATE TYPE CLASSIFICATION
Aggregate type classification refers to the geological origin of the aggregates. This
essentially consists of identifying the parent rock of the aggregate material which can be
either an Igneous, Sedimentary, or Metamorphic rock. This is recommended to be carried
out by visual examination of aggregates in the field or from a stockpile. The characteristics
which are used to for "aggregate type" classification are (39):
• Texture,
• Mineral composition, and
• Color.
81

Different rocks are characteristic of their texture and visual identification of rocks is
largely dependent on identification of texture based on the grain size. Typically, igneous
rocks exhibit granular, medium, fine, glassy, and fragmented textures. Granular texture can
be identified by naked eye and the grain size varies from 0.5 mm to about 5 mm. Minerals in
the medium textured rocks can be seen but they can only be identified with the aid of a hand
held lens. Fine textured rocks can only be identified by using a microscope. Fragmented
texture can be identified by the presence of fragments of igneous material ranging from large
blocks to fine dust.
Sedimentary rocks can be identified based on their elastic or non elastic texture. Clastic
textured rocks consist of particles which are broken, transported, and deposited whereas non
elastic rocks are predominantly single mineral and consist of a "network of interlocking
grains" (39).
Metamorphic rocks can be generally identified based on the three major types of
textures exhibited by them, namely, slaty, schistose, and gneissose types. Table 6.4 lists the
principal minerals that comprise metamorphic rock, different textures, colors and major rocks.
Rocks exhibiting these textures consist of different sub textures which vary from very fine
grained to coarse grained depending on the alignment of grains. The major types of
metamorphic rocks are identified based on their texture such as schist, gneiss, and slate.
The principal minerals, textures, and colors characteristic of different minerals for
different rock types are listed in the appendix. These tables can be used as a helpful tools for
aggregate identification both in the field and in the laboratory.
6.2 SHAPE CLASSIFICATION
Shape and texture of coarse aggregates can be evaluated by using the concept of fractals
and the technique of video imaging. This technique can provide an objective measure of the
shape and surface texture of the aggregates. Fractal characterization of surface texture is
explained in the later part of this chapter. The three major steps involved in the shape
computation are:
• Edge extraction,
• Computation of the Slope Density Function, and
82

• Calculation of Fractal Dimension by box counting.
Edge detection is the first step in the fractal characterization of aggregate shape. It
involves video framing of aggregate particles which are placed on a contrasting background
(for example, dark background is used for framing light colored aggregates). The video
images of these aggregate particles are then digitized into pixels. Each pixel is assigned with
a brightness value from a grey scale which varies from 0 for a pitch dark level to 255 for the
brightest level. On account of the contrasting background, there will be a rapid change in the
grey level at the boundary of the aggregate particle. A Sobel Gradient Operator, which
consists of horizontal and vertical masks, is used to find the gradient of the pixel and to
enhance the boundary of an aggregate. A mask is a 3X3 pixel operator which enhances an
edge by multiplying with a corresponding weight contained in it. An extraction algorithm is
used to extract the edge of an aggregate particle from its image. This algorithm, starting with
an edge element, searches for boundary pixels in eight directions, namely, N, NE, E, SE, S,
SW, W, and NW. The original image of an aggregate particle and its extracted edge are
shown in Figures 6.1 and 6.2 (26).
The next step in shape characterization is the computation of the slope density function
(SDF). The slope density function is based on a tangent-boundary curve ('l'-s) where 'l' is an
angle between a fixed line and a tangent to a point on the boundary and "s" is length of the
arc that the boundary traversed. Li et al. (26) observed that "the SDF is the histogram or
frequency of the angles collected over the boundary of a given shape". The jagged nature of
the SDF curve can be used to explain the angularity of an aggregate particle. Figures 6.3 and
6.4 show the Slope Density Function of a limestone and a river gravel aggregate, respectively
(26). These SDF curves show that the SDF of a limestone aggregate shows larger peaks than
that of river gravel aggregate, which is representative of the long, straight edges and more
angular nature of the limestone aggregate. Thus, SDF curves can effectively describe the
shapes of different aggregate particles .
The fractal dimension of the shape of an aggregate particle can be determined by using
box dimension. This procedure consists of overlay of the SDF curve of the aggregate with a
set of boxes and determination of the number of boxes which contain the line segment. This
procedure is repeated by changing the size of the box and the resulting values are plotted on a
83
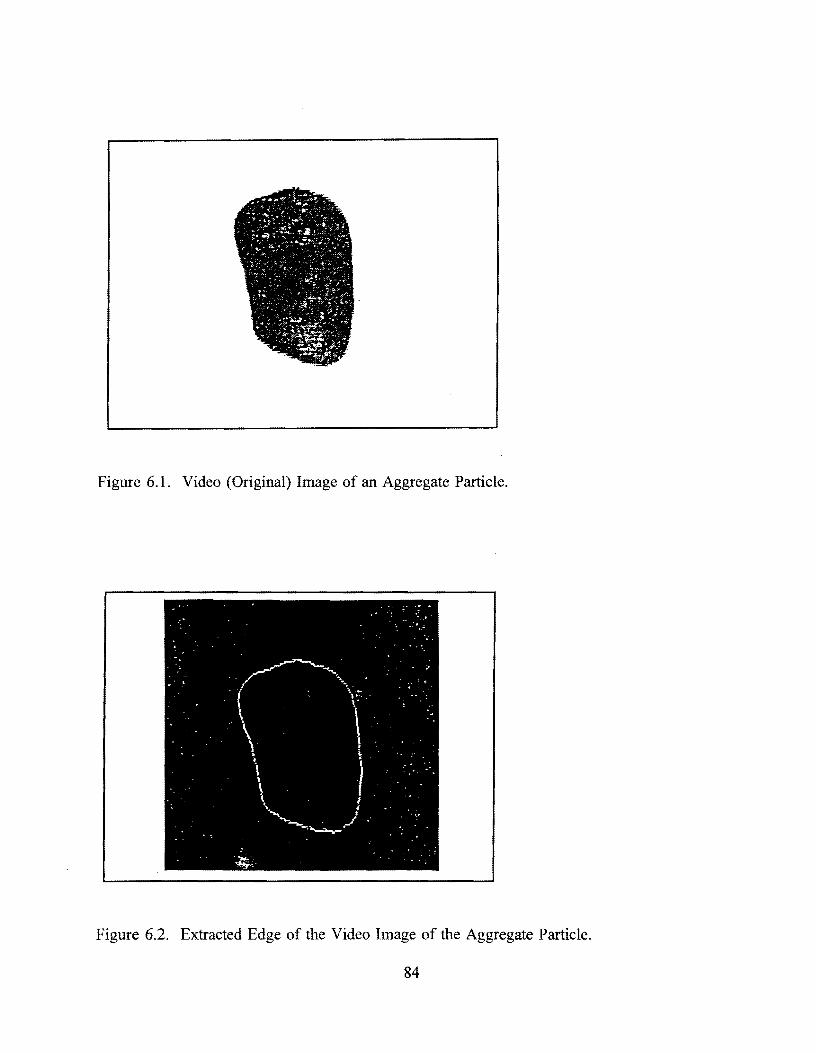
Figure 6.1. Video (Original) Image of an Aggregate Particle.
Figure 6.2. Extracted Edge of the Video Image of the Aggregate Particle.
84

140 120 100
N 80 60 40 20 0
0 50 100 150 200 250 300 350 .p
Figure 6.3. SDF Plot of a Limestone Aggregate Particle.
140 120 100
N 80 60 40 20 0
0 50 100 150 200 250 300 350 .p
Figure 6.4. SDF Plot of a River Gravel Aggregate Particle.
85

log-log scale which gives the box counting plot. The absolute value of the box count plot
slope gives the fractal dimension number of the shape of the aggregate particle. The fractal
dimension for a near smooth surface would be one, whereas for rough surfaces, it varies from
one to two (26).
6.3 TEXTURAL CHARACTERISTIC
The technique of fractal characterization can be extended to determine the surface
texture of an aggregate particle. This essentially consists of determination of the rate of
variation of grey levels of the adjacent pixels on the image of the aggregate particle. The
variation in grey levels of the image is proportional to the roughness of the aggregate particle.
In other words, the rougher the surface of the particle, the higher the variation in grey levels
of the image. The fractal dimension number of texture increases with increase in the variation
of grey levels or roughness. A cardboard surface, a cork particle, and a carpet material can
be used for the purposes of calibration of smooth, intermediate and rough textures
respectively. These calibrated values are used as standards in characterizing aggregates into
different textures.
The equipment required for fractal characterization of aggregate shape and surface
texture are:
• A personal computer with printer,
• A color image processing board,
• A image processing software, and
• A high resolution color video camera.
The workstation and image processor which are used in the video imaging laboratory at
the Texas Transportation Institute, Texas A&M University, are shown in Figures 6.5 and 6.6.
6.4 OXIDE CONTENT
Chemical analysis can be performed on aggregates to determine their oxide content and
the results obtained can be used to predict the aggregate performance. This test can be carried
out using the technique of Inductively Coupled Plasma Optical Emission Spectrometry (ICP
OES). It is an analysis technique used for determining the elements in solution samples using
86

Figure 6.5. Work Station Used for Fractal Dimension Analysis.
Figure 6.6. A Typical Image Processor Used in Fractal Dimension Analysis.
87

the spectra emitted by free atoms or ions. The atoms or ions are generated within a source
such as an "Inductively Coupled Plasma". Typically, "plasma" can be defined as a "hot gas"
where atoms or molecules are ionized. An inert gas such as Argon, when surrounded by a
"time-varying" magnetic field, is inductively coupled. The resulting plasma will have a
temperature of about I 0,000 K, with the help of which it dissociates, and atomizes the
elements present in the injected sample. Depending on the concentration of different elements
in the sample, a light of corresponding frequency is emitted. Since the concentration of the
element is proportional to the emitted light intensity, the measuring electronics in the
spectrometer compute the correlation between them and quantifies the results ( 40).
A schematic of the ICP spectrometer is shown in Figure 6. 7. It shows the required
equipment and various system electronics required for carrying out this test ( 41 ). Basic
components of the Inductively Coupled Plasma Optical Emission Spectroscopy instrument are:
• Spectrometer containing a grating, fine slit, an imaging system,
• Detector,
• ICP source,
• Nebulizer, Spray chamber, design torch for sample introduction,
• Mini Computer for data storage and analysis, and
• Argon gas, sulfuric acid, nitric acid, hydrochloric acid, and deionized water
constitute the required reagents and glassware such as pipets, volumetric flasks are
required for sample dilution.
6.5 ABRASION RESISTANCE
Abrasion resistance of aggregates can be measured according to ASTM standard test
procedure ASTM C 135 or ASTM C-535, depending on the size of coarse aggregates. The
Los Angeles abrasion machine is used to "measure the degradation of mineral aggregates of
standard gradings". The aggregates are placed along with a specified number of steel spheres
in a rotating steel drum where they are subjected to abrasion, attrition, and impact. The
rotating action of the steel drum carries the aggregates and steel spheres around and causes an
abrading action. The drum is rotated at a speed of 30-33 revolutions per minute for 500
revolutions and the aggregate portion is removed from the rotating drum and sieved to
88

Movable primary slit
Radio frequency 1---~::::::::: generator
Gos flow regulation
Concave diffraction grading
ICP source
Conditioning
SYSTEM ELECTRONICS
ELECTRONICS
Measuring electronics
Dedicated mini
computer
Instrument -----·
1--" control
Sample introduction
electronics
Figure 6. 7. Schematic Diagram of the Inductively Coupled Plasma Optical Emission Spectrometer ( 41 ).
89
measure the percent abrasion loss of the aggregates. This is the difference between the
original sample weight and the final sample weight expressed as a percentage of the original
sample weight. This test can be used to estimate the mechanical strength and toughness of
the aggregates and serves a good indicator of the relative quality of the aggregates with same
mineral composition ( 42). The L.A. abrasion testing machine is shown in Figure 6.8 ( 43).
The equipment required for the abrasion test are: (a) L.A. abrasion testing machine, (b) sieves,
(c) balance, and (d) steel charges approximately 46.8 mm (1 27/32) in diameter and each
weighing 390-445 grams.
6.6 OTHER TESTS ON AGGREGATES
All the properties of aggregates, other than the basic test parameters which are included
in the aggregate classification system and their respective recommended test procedures, are
listed in Table 6.2. These tests, if needed, can be performed as per the recommended test
procedures. The standards listed should be referred to obtain the detailed procedures of these
tests on aggregates.
As shown in the above table, most of the aggregate properties can be evaluated as per
the available ASTM standard test procedures. However, some of properties cannot be
quantified using ASTM procedures because of non-availability of relevant test procedures or
because of some shortcomings of the existing test procedures. There are no ASTM standard
procedures available for quantifying the fracture toughness, mineralogy, and oxide content of
the aggregates. The recommended test procedure for fracture toughness could not only be
used for evaluating the bond strength of the aggregates but also for carrying out stress
analysis on the pavement structure subsequently, if needed, to evaluate the performance of the
pavement. The oxide content test determines the percent of oxides present in aggregates
which can be used not only to back calculate the mineral composition of the aggregate
material but also assists in inferring the thermal characteristics of the material.
The shape and texture of aggregates can be determined according to ASTM D 3398 test
procedure. However, this test procedure is based on the percent void content in the aggregate
sample at two compactive efforts, which is used to arrive at a particle index. The calculated
particle index is used to arrive at an overall measure of shape and texture of aggregate
90

Direction of Rotation
Rotating Drum
Catch Pan for Sped men
Figure 6.8. L.A. Abrasion Testing Machine (After 43).
Table 6.2. Other Aggregate Properties and Their Respective Test Procedures.
I
Aggregate Property Test Procedure
Particle Size ASTM C 136
Specific Gravity ASTM C 127
Mineralogy X-Ray Diffraction
Alkali-Silica Reactivity ASTM C 289 ASTM C 227
Alkali-Carbonate ASTM C 586 I
Reactivity
Accelerated Polish Value TeX-438-A
Soundness ASTM C 88
KIF RILEM TC-89
Thermal Coefficient of CRD-C-125 Expansion
Specific Heat CRD-C-124
91
particles. One of the shortcomings of this procedure is that it requires repetition of the test
for each size fraction whose overall percentage in the gradation exceeds 10 percent. This test
method provides an approximate measure of particle shape and texture and does not
effectively characterize the aggregate geometry. Hence, fractal dimension analysis, which has
been proved as a good characterization technique, has been recommended as the test
procedure for evaluation of shape and texture.
Polish value test can be performed as per ASTM test standards D 3319 and E-303.
However, these ASTM test procedures do not outline the method for determination of polish
value of blended aggregates. The test procedure which is adopted by the Texas Department
of Transportation is recommended to be carried out for determination of polish value of
aggregates. This test procedure, unlike the ASTM test procedures, provides detailed
guidelines for assessment of polish value of blended aggregates.
The standard test procedures are recommended for evaluation of all aggregate properties
listed in this classification system. Apart from the basic tests, which are explained earlier in
this chapter, all other tests are advised to be carried out as per the recommended test
procedures, depending on the level of information and accuracy required.
92

CHAPTER 7: CONCLUSIONS AND RECOMMENDATIONS
7.1 CONCLUSIONS
Based on the framework developed for the coarse aggregate classification system, the
following conclusions are made:
1. The proposed aggregate classification system is expected to serve as an effective tool in
aggregate identification and subsequent prediction of the behavior of different aggregate
types.
2. Suitable coarse aggregate type can be selected based on the evaluation of aggregates,
which actually minimizes the chances of aggregate related failures of pavements and
other structures.
3. The suggested basic tests are expected to provide adequate information for appropriate
material selection. This will reduce maintenance and rehabilitation costs for the
implementing agency of this classification system.
4. The recommended tests for aggregate identification and performance evaluation are
simple, quick, and informative.
5. Performance evaluation of aggregates based on this classification system can be utilized
to develop better pavement design models where aggregate type can be incorporated as
a design parameter.
6. Based on the preliminary assessment of aggregates, suitable blending of aggregates can
be used as an alternative to enhance the performance of structures.
7. The aggregate classification system should be implemented at three levels. The first
two levels of implementation are expected to provide comprehensive identification and
performance evaluation of aggregates and require some knowledge of physical geology.
The third level consists of complex tests, but it can be used as a tool to confirm the
results obtained from the first two levels.
8. Successful implementation of the proposed classification system is expected to provide a
cost effective alternative to the petrographic examination of aggregates which is tedious,
time consuming and requires the special skills of a petrographer.
9. TxDOT should consider further investigation of second and third level implementation.
93

7.2 RECOMMENDATIONS FOR IMPLEMENTATION AND FURTHER RESEARCH
I. The proposed aggregate classification system should be implemented at three levels.
2. The first level of implementation, which largely consists of visual examination of
aggregates, should be used for aggregate identification and their preliminary assessment
based on the identification of aggregates.
3. The second level of implementation should consist of quantitative determination of
aggregate quality by laboratory investigation of suggested basic test parameters. The
results obtained should be used in performance assessment of aggregates and subsequent
material selection processes.
4. The third level of implementation essentially consists of special tests on aggregates and
in view of the complexity of the tests, it is recommended that this level should only be
implemented when it is deemed absolutely necessary.
5. The first two levels of suggested implementation should be carried out in a phased
manner and the results obtained should be carefully evaluated and methods for
improvements suggested.
6. More research needs to be carried out to validate the proposed classification system.
Trial field implementation should be carried out to check the accuracy of the results.
7. Another area which most definitely needs more research is the evaluation of test
methods for better aggregate characterization, which will provide patterns by which
complex properties can be inferred by more simpler tests on aggregates.
8. More extensive research should be performed to investigate the feasibility of inferring
the Alkali-Silica reactivity and the Alkali-Carbonate reactivity from the oxide content
tests.
9. The feasibility of characterizing of surface characteristics of aggregates by gas
chromatography should be explored. The mechanical aspect of bond strength of
aggregates could be studied if this technique proves successful.
10. Successful implementation of the aggregate classification system could be used for
developing a functional classification system for coarse aggregates.
94

REFERENCES
1. Concrete and Aggregates, ASTM D 8-91, Standard Terminology Relating to Materials
for Roads and Pavements, Section 4, Vol. 04.02, ASTM, Philadelphia, PA, 1991.
2. Concrete and Aggregates, ASTM C 125-88, Standard Terminology Relating to Concrete
and Concrete Aggregates, Section 4, Vol. 04.02, ASTM, Philadelphia, PA, 1991.
3. M. W. Witczak, C. W. Lovell, Jr., and E. J. Yoder. A Generalized Investigation of The
Potential Availability of Aggregate by Regional Geomorphic Units Within the
Conterminous 48 States. Presented at the 50th Annual Meeting of the Highway
Research Board, Washington, DC, 1971.
4. T. Dossey, H. Castedo, and B. F. McCullough. Prediction of Concrete Properties Using
Coarse Aggregate Chemical Composition Data. In Transportation Research Record
1284, TRB, National Research Council, Washington, DC, 1990, pp. 1-7.
5. J. W. Button, D. Perdomo, and R. L. Lytton. Influence of Aggregate on Rutting in
Asphalt Concrete Pavements. In Transportation Research Record 1259, TRB, National
Research Council, Washington, DC, 1989, pp. 141-152.
6. Significance of Tests and Properties of Concrete and Concrete Making Materials,
ASTM STP l 69B, ASTM, Philadelphia, PA, 1978.
7. T. K. Liu. A Review of Engineering Soil Classification Systems. Presented at the 45th
Annual Meeting of the Transportation Research Board, Washington, DC, 1965.
8. D. A. Williamson, and C. R. Kulm. The Unified Rock Classification System. Rock
Classification Systems for Engineering Purposes, ASTM STP 984, ASTM, Philadelphia,
PA, 1988.
9. PCA Soil Primer, Portland Cement Association, Skokie, IL.
10. Airport Pavement Design and Evaluation, Advisory Circular, AC l 50/5320-6C,
Department of Transportation, Federal Aviation Administration, Washington, DC.
11. H. J. Pincus, Opening Remarks. Rock Classification System for Engineering Purposes,
ASTM STP 984, ASTM, Philadelphia, PA, 1988.
95
12. Edited by C. W. Fin.kl, Jr. Soil Classification, Benchmark Papers in Soil Science V.l,
Hutchinson Ross Publishing Company, Stroudsburg, PA.
13. B. E. Butler. Soil Classification for Soil Survey, Clarendon Press, Oxford, 1980.
14. K. H. Northcote. The Factual Classification of Soils and Its Use in Soil Research, Soil
Classification, Benchmark Papers in Soil Science V. l, Hutchinson Ross Publishing
Company, Stroudsburg, PA, 1982.
15. L. D. Mantuani. Handbook of Concrete Aggregates, National Research Council of
Canada, Published by Noyes Publications, NJ, 1983.
16. Z. T. Bieniawski. Engineering Rock Mass Classifications, A complete manual for
Engineers and Geologists in Mining, Civil and Petroleum Engineering, John-Wiley &
Sons, NY, 1989.
17. Edited by L. Collis and R. A. Fox. Aggregates: Sand, Gravel, & Crushed Rock
Aggregates for Construction Purposes, Engineering Geology Special Publication No. 1,
Published by The Geological Society, Piccadilly, London, WI V OJU, 1985.
18. H. H. Weinert. The Natural Road Construction Materials of Southern Africa, Cape
Town, S. Africa, 1980.
19. The Asphalt Handbook, Manual Series No. 4 (MS-4), Asphalt Institute Building,
College Park, MD, 1989.
20. A. M. Neville, and J. J. Brooks. Concrete Technology, Longman Group UK Limited,
Essex, CM20 2JE, England, 1987.
21. Federation Internationale de la Precontrainte (FIP). FIP Manual of Lightweight
Aggregate Concrete, Halsted Press, a division of John Wiley and Sons Inc., NY, 1983.
22. W. B. Ledbetter et al. A Recommended Synthetic Coarse Aggregate Classification
System, Final Report, Synthetic Aggregate Research, Research Report 81-15, Texas
Transportation Institute, Texas A&M University, College Station, TX, 1971.
23. Edited by D. C. Pike. Standards for Aggregates, Ellis Horwood Series in Applied
Geology, West Sussex, England, 1990.
96

24. Road and Paving Materials: Pavement Management Technologies. ASTM D-3398-91,
Index of Aggregate Particle Shape and Texture, Annual Book of ASTM Standards,
Section 4, Vol. 04.03, ASTM, Philadelphia, PA, 1990.
25. W. C. Krumbein. Measurement and Geological Significance of Shape and Roundness
of Sedimentary Particles. Journal of Sedimentary Petrology, Vol. 13, No. 2, 1941, pp.
79-81.
26. L. Li, P. Chan, D. G. Zollinger, and R. L. Lytton. Quantitative Analysis of Aggregate
Shape Based on Fractals. Journal of the American Concrete Institute, Vol. 90, No. 4,
1993, pp. 357-365.
27. H. W. Kummer, and W. E. Meyer. NCHRP Repol1 37: Tentative Skid Resistance
Requirements For Main Rural Highways. HRB, National Research Council,
Washington, DC, 1967.
28. R. E. Graves. Physical, Mineralogical and Inteifacial Bonding Propel1ies of Carbonate
and Silicate Mineral Aggregates Used in Ponland Cement Concrete in Florida, Ph.D.
Dissertation, University of Florida, Gainesville, FL, 1991, pp. 22-41.
29. D. G. Zollinger, T. Tang, and R. H. Yoo. Fracture Toughness of Concrete at Early
Ages. Journal of American Concrete Institute, Vol. 90, No. 5, 1993, pp. 463-471.
30. E. J. Callan. The Relation of Thermal Expansion of Aggregates to the Durability of
Concrete, Bulletin No. 34, Waterways Experiment Station, U.S. Army Corps of
Engineers, Vicksburg, MS, February 1950.
31. Living With Marginal Aggregates, ASTM STP 597, ASTM, Philadelphia, PA, 1975.
32. A. Dumas. Effects of Aggregate Blends on the Propenies of Po11land Cement Concrete
Pavements, Master's Thesis, The University of Texas at Austin, TX, May 1994, pp.
10-25.
33. S. Mindess. Interfaces in Concrete. Materials Science of Concrete, The American
Ceramic Society, Vol. 1, 1989, pp. 163-180.
34. A. E. Kehew. General Geology for Engineers, Published by Prentice Hall, Inc., A
Division of Simon & Schuster, NJ, 1988.
97
35. T. Dossey, J. V. Salinas, and B. F. McCullough. A Methodology for The
Improvement of Oxide Residue Models for Estimation of Aggregate Performance
Using Stoichiometric Analysis, Presented at the 73rd Annual Meeting of the
Transportation Research Board, Washington, DC, January 1994.
36. T. Tang, D. G. Zollinger, and B. F. McCullough. Concrete Pavement Field Tests in
Texarkana and La Porte, Texas, and Analysis. Research Report 1244-7, Texas
Department of Transportation, Austin, May 1994.
37. D. Stark, B. Morgan, P. Okamoto, and S. Diamond. Eliminating or Minimizing Alkali
Silica Reactivity. SHRP-87-202, Final Report, Construction Technology Laboratories,
Skokie, IL, February 1993.
38. P. E. G. Bellew. Alkali-Aggregate Reactions, Proceedings of the 7th International
Conference, 1986, Ottawa, Canada, Published by Noyes Publications, NJ, 1987.
39. J. Pitts. A Manual of Geology for Civil Engineers, Published by Halsted Press, A
Division of John Wiley & Sons, NY, 1984.
40. A. Varma. Handbook of Inductively Coupled Plasma Atomic Emission Spectroscopy,
Published by CRC Press, Inc., N.W. Boca Raton, FL, 1991.
41. V. A. Passel, and R. N. Kniseley. Inductively Coupled Plasma Optical Emission
Spectroscopy. Journal of Analytical Chemistry, Vol. 46, 1974, p. 11 lOA.
42. Concrete and Aggregates, ASTM C 131-89, Standard Terminology Relating to
Concrete and Concrete Aggregates, Vol. 04.02, Section 4, ASTM, Philadelphia, PA,
1991.
43. Asphalt Institute. Principles of Construction of Hot-Mix Asphalt Pavements, Manual
Series No. 22, Asphalt Institute Building, College Park, MD, January 1984.
44. "Rock and Mineral Identification for Engineers", U.S. Department of Transportation,
Federal Highway Administration, November 1991.
98

APPENDIX A
99

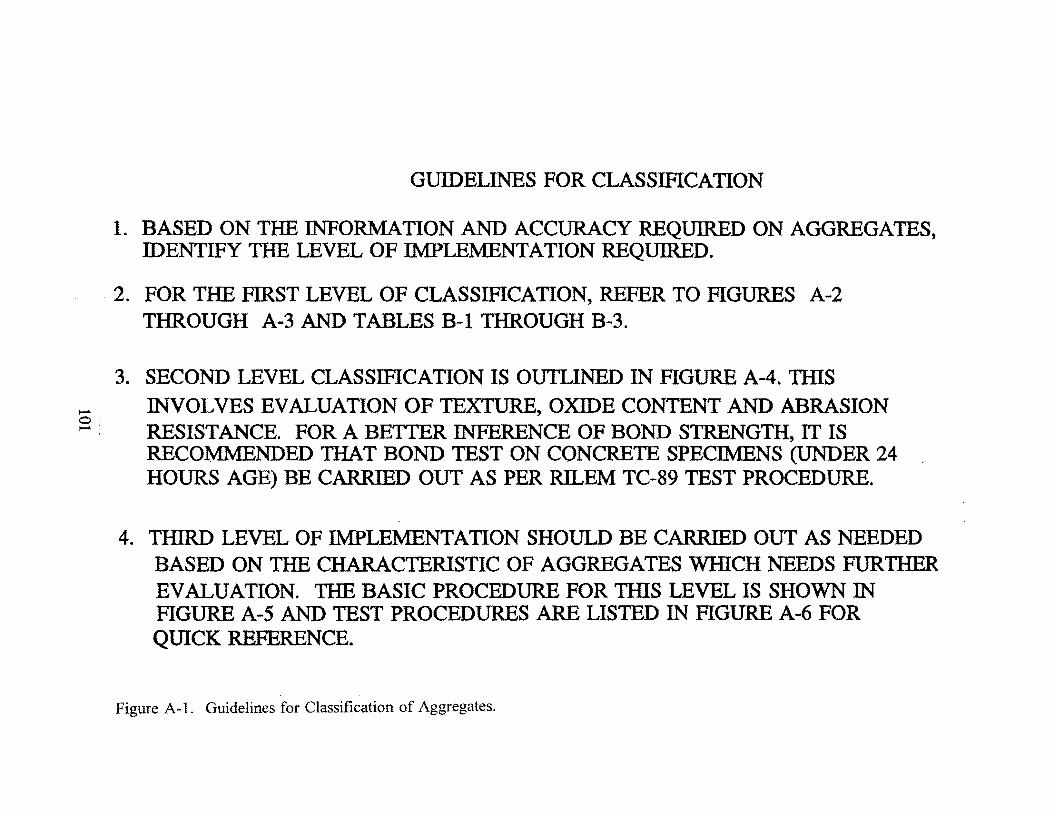
-s·
GUIDELINES FOR CLASSIFICATION
1. BASED ON THE INFORMATION AND ACCURACY REQUIRED ON AGGREGATES, IDENTIFY THE LEVEL OF IMPLEMENTATION REQUIRED.
2. FOR THE FIRST LEVEL OF CLASSIFICATION, REFER TO FIGURES A-2 THROUGH A-3 AND TABLES B-1 THROUGH B-3.
3. SECOND LEVEL CLASSIFICATION IS OUTLINED IN FIGURE A-4. THIS INVOLVES EVALUATION OF TEXTURE, OXIDE CONTENT AND ABRASION RESISTANCE. FOR A BETTER INFERENCE OF BOND STRENGTH, IT IS RECOMMENDED THAT BOND TEST ON CONCRETE SPECIMENS (UNDER 24 HOURS AGE) BE CARRIED OUT AS PER RILEM TC-89 TEST PROCEDURE.
4. THIRD LEVEL OF IMPLEMENTATION SHOULD BE CARRIED OUT AS NEEDED BASED ON THE CHARACTERISTIC OF AGGREGATES WHICH NEEDS FURTHER EVALUATION. THE BASIC PROCEDURE FOR THIS LEVEL IS SHOWN IN FIGURE A-5 AND TEST PROCEDURES ARE LISTED IN FIGURE A-6 FOR QUICK REFERENCE.
Figure A-1. Guidelines for Classification of Aggregates.

-0 N.
I AGGREGATE
IDENTIFICATION
PlRST LEVEL I IMPLEMENTATION
CONSTRUCTION ACTIVITY
MATERIAL SELECTION
IDENTIFICATION OF POTENTIAL PROBLEMS ASSOCIATED WITH AGGREGATES
LEVEL OF ACCURACY AND INFORMATION REQUIRED ON AGGREGATES
AGGREGATE EVALUATION
SECOND LEVEL IMPLEMENTATION
I
I DETAILED
INVESTIGATION
I TiilRD LEVEL I _IMPLEMENTATION
Figure A-2. Criteria for Selection of Different Levels of Classification.
I

AGGREGATE IDENTIFICATION
I I
VISUAL SHAPE CLASSIFICATION EXAMINATION
n n TEXTURE
I FRACTAL ANALYSIS I COLOR
I - n O· I I I I w• PRINCIPAL
CUBIC I I L BLADED I I 1
MINERAL DISC ROD
NOTE: COLOR , TEXTURE AND MINERALS CAN BE IDENTIFIED BASED ON THE CHARTS PROVIDED ( TABLES B-1 - B -3 IN APPENDIX B)
SHAPE CAN BE QUNATIFIED AS PER ASTM SPECIFICATION D-3398 ALSO
Figure A-3. First Level Classification of Aggregates.

I SHAPE
CLASSIFICATION
I I I I c I D B
AGGREGATE IDENTIFIERS ,(DESIGNATORS)
AGGREGATES
AGGREGATE TYPE CLASSIFICATION
I I
~ I 0 M
I SURFACE
CLASSIFICATION
I
u
A TYPICAL CLASSIFICATION OFAN AGGREGATE BASED ON THIS CLASSIFICATION SYSTEM
WOULD BE "DSC"
Figure A-4. Typical Classification of Aggregates Based on the Classification System.
I c
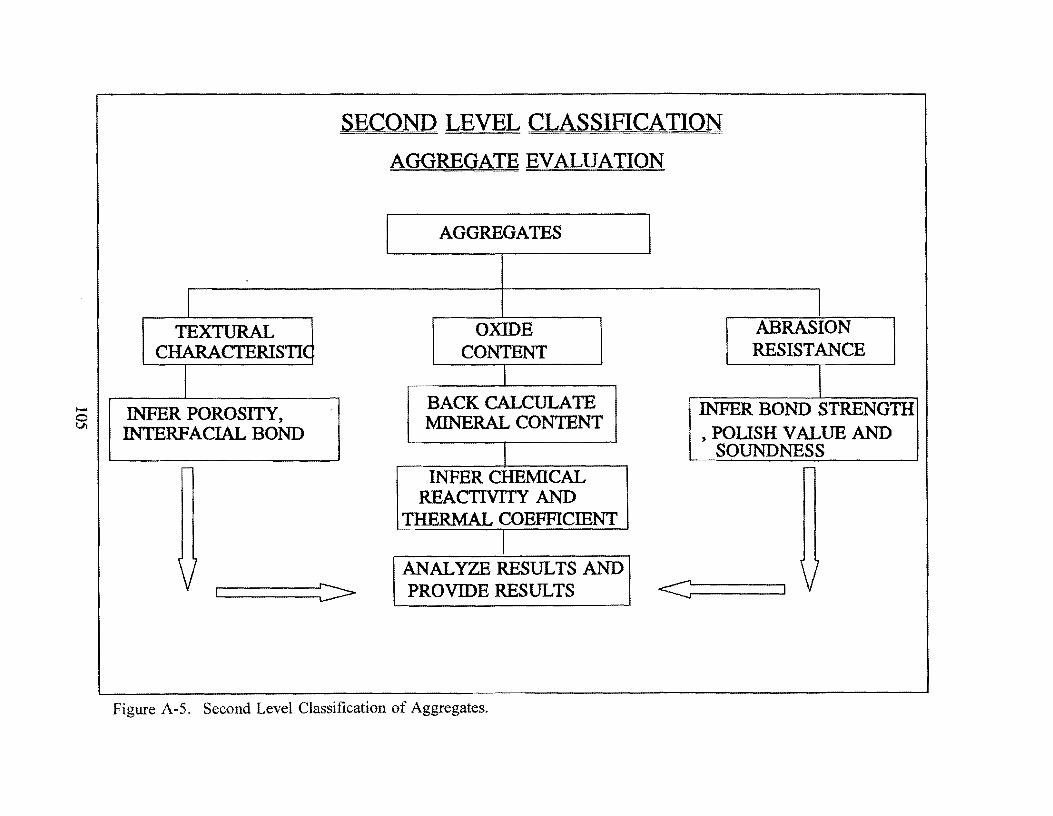
I TEXTURAL
CHARACTERISTIC
I INFER POROSITY, INTERFACIAL BOND
-
1 7
SECOND LEVEL CLASSIFICATION
AGGREGATE EVALUATION
AGGREGATES
I OXIDE ABRASION
CONTENT RESISTANCE
I BACK CALCULATE INFER BOND STRENGTH MINERAL CONTENT
, POUSH VALUE AND SOUNDNESS
INFER CHEMICAL ~
REACTIVITY AND THERMAL COEFFICIENT
ANALYZE RESULTS AND ' 1
PROVIDE RESULTS I <:-----
Figure A-5. Second Level Classification of Aggregates.
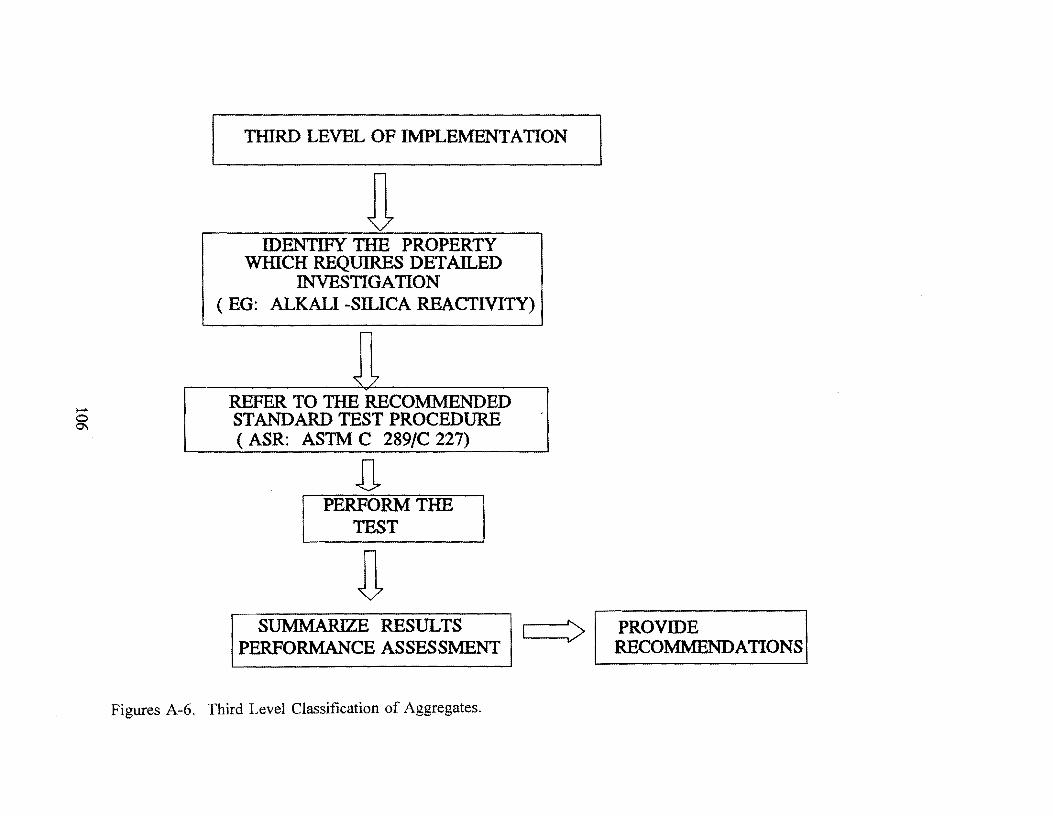
THIRD LEVEL OF IMPLEMENTATION
IDENTIFY THE PROPERTY WlilCH REQUIRES DETAILED
INVESTIGATION ( EG: ALKALI -SILICA REACTIVITY)
REFER TO THE RECOMMENDED STANDARD TEST PROCEDURE ( ASR: ASTM C 289/C 227)
PERFORM THE TEST
SUMMARIZE RESULTS c==> I PROVIDE I PERFORMANCE ASSESS1\1ENT RECOMMENDATIONS
Figures A-6. Third Level Classification of Aggregates.

THIRD LEVEL PROPERTIES AND RESPECTIVE TEST PROCEDURES
PROPERTY TEST PROCEDURE
MINERO LOGY X-RAY DIFFRACTION
ACCELERATED POLISH VALUE TEX-438-A
SOUNDNESS ASTMC88
ALKALI-SILICA REACTIVITY ASTM C 289/ ASTM C 227 ....... 0 -...J ALKALI-CARBONATE REACTIVITY ASTMC586
~ RILEMTC 89
THERMAL COEFFICIENT OF EXPANSION CRD C 125
SPECIFIC HEAT CRD C 124
PARTICLE SIZE ASTM C 136
SPECIFIC GRAVITY ASTM C 127
Figure A-7. Properties and Respective Test Procedures Included in the Third Level Classification.


APPENDIXB
109

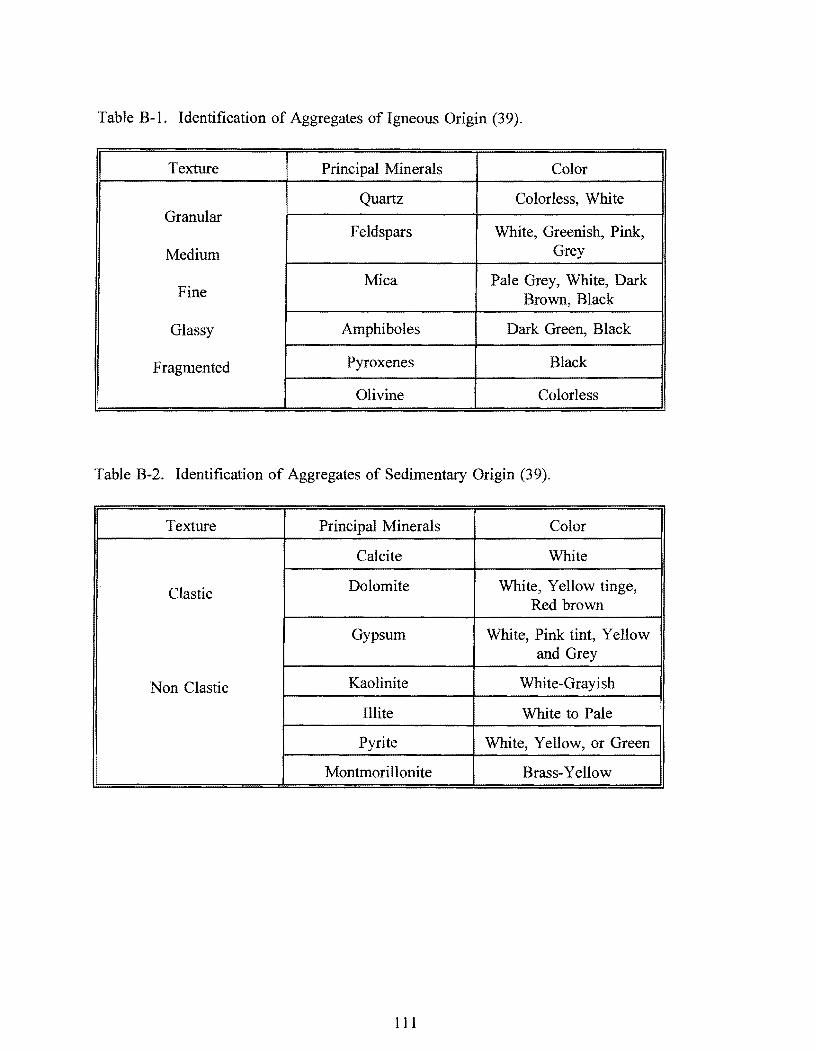
Table B-1. Identification of Aggregates of Igneous Origin (39).
Texture Principal Minerals Color
Quartz Colorless, White Granular
Feldspars White, Greenish, Pink,
Medium Grey
Mica Pale Grey, White, Dark Fine Brown, Black
Glassy Amphiboles Dark Green, Black
Fragmented Pyroxenes Black
Olivine Colorless
Table B-2. Identification of Aggregates of Sedimentary Origin (39).
Texture Principal Minerals Color
Calcite White
elastic Dolomite White, Yell ow tinge, Red brown
Gypsum White, Pink tint, Yellow and Grey
Non Clastic Kaolinite White-Grayish
Illite White to Pale i
Pyrite White, Yellow, or Green
Montmorillonite Brass-Yellow
111
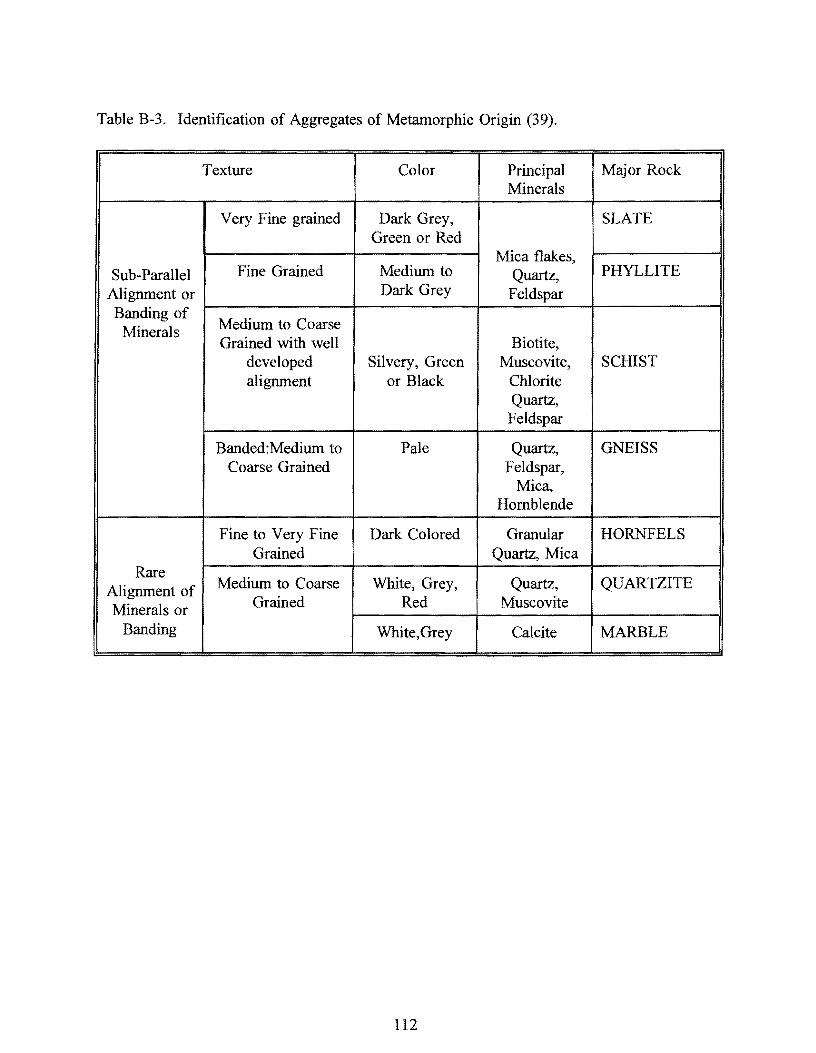
Table B-3. Identification of Aggregates of Metamorphic Origin (39).
Texture Color Principal Major Rock Minerals
Very Fine grained Dark Grey, SLATE Green or Red
Mica flakes, Sub-Parallel Fine Grained Medium to Quartz, PHYLLITE
Alignment or Dark Grey Feldspar Banding of
Medium to Coarse Minerals Grained with well Biotite,
developed Silvery, Green Muscovite, SCHIST alignment or Black Chlorite
Quartz, Feldspar
Banded:Medium to Pale Quartz, GNEISS Coarse Grained Feldspar,
Mica, Hornblende
Fine to Very Fine Dark Colored Granular HORNFELS Grained Quartz, Mica
Rare Medium to Coarse White, Grey, Quartz, QUARTZITE Alignment of
Minerals or Grained Red Muscovite
Banding White, Grey Calcite MARBLE
112

Table B-4. Format for Tabulation of Classification Results.
Aggregate Surface Shape FIRST LEVEL Type Type
CLASSIFICATION
Comments on First Level Classification
Texture Oxide Abrasion SECOND LEVEL Content Resistance
CLASSIFICATION
Comments on Second Level Classification
Property Test Desired THIRD LEVEL Procedure Characteristic
CLASSIFICATION
Comments on Third Level Classification
CONCLUSIONS AND RECOMMENDATIONS
113