High-resolution sequence stratigraphy of clastic shelves I: Units and bounding surfaces
25
Review article High-resolution sequence stratigraphy of clastic shelves I: Units and bounding surfaces Massimo Zecchin a, * , Octavian Catuneanu b a OGS (Istituto Nazionale di Oceanografia e di Geofisica Sperimentale), Borgo Grotta Gigante 42/c, 34010 Sgonico (TS), Italy b Department of Earth and Atmospheric Sciences, University of Alberta, 1-26 Earth Sciences Building, Edmonton, Alberta T6G 2E3, Canada article info Article history: Received 24 April 2012 Received in revised form 30 August 2012 Accepted 31 August 2012 Available online 13 September 2012 Keywords: High-resolution sequence stratigraphy Clastic shelves Stratigraphic units Stratigraphic surfaces abstract The high-resolution sequence stratigraphy tackles scales of observation that typically fall below the resolution of seismic exploration methods, commonly referred to as of 4th-order or lower rank. Outcrop- and core-based studies are aimed at recognizing features at these scales, and represent the basis for high- resolution sequence stratigraphy. Such studies adopt the most practical ways to subdivide the strati- graphic record, and take into account stratigraphic surfaces with physical attributes that may only be detectable at outcrop scale. The resolution offered by exposed strata typically allows the identification of a wider array of surfaces as compared to those recognizable at the seismic scale, which permits an accurate and more detailed description of cyclic successions in the rock record. These surfaces can be classified as ‘sequence stratigraphic’, if they serve as systems tract boundaries, or as facies contacts, if they develop within systems tracts. Both sequence stratigraphic surfaces and facies contacts are important in high-resolution studies; however, the workflow of sequence stratigraphic analysis requires the identification of sequence stratigraphic surfaces first, followed by the placement of facies contacts within the framework of systems tracts and bounding sequence stratigraphic surfaces. Several types of stratigraphic units may be defined, from architectural units bounded by the two nearest non-cryptic stratigraphic surfaces to systems tracts and sequences. The need for other types of stratigraphic units in high-resolution studies, such as parasequences and small-scale cycles, may be replaced by the usage of high-frequency sequences. The sequence boundaries that may be employed in high-resolution sequence stratigraphy are represented by the same types of surfaces that are used traditionally in larger scale studies, but at a correspondingly lower hierarchical level. Ó 2012 Elsevier Ltd. All rights reserved. 1. Introduction Sequence stratigraphic methodology and terminology devel- oped gradually since the inception of sequence stratigraphy (Payton, 1977; Wilgus et al., 1988), largely without formal guide- lines from the international stratigraphic commissions, and this resulted in the co-existence of several schools of thought that advocate different approaches to the application of the method. At the same time, the nature of the controls that govern sedimentary cyclicity in the rock record, such as eustasy vs. tectonics, climate and sediment supply, was also the subject of much debate (e.g., Miall, 1997). The lack of formal guidance in the development of sequence stratigraphy, coupled with the great variability exhibited by sedi- mentary successions, resulted in the proliferation of unnecessarily complex and sometimes conflicting terminology, leading to redundancies and ultimately to confusion. Catuneanu et al. (2009) initiated an international effort to identify a common platform in sequence stratigraphy, and highlighted the model-independent and the model-dependent aspects of the method. The former deal with all the objective features of sequences, such as the observation of stratal stacking patterns and changes thereof, whereas the latter referred to the nomenclature of surfaces and systems tracts, and to the selection of the sequence boundary. The adoption of a standard workflow based on model- independent principles free of any model-oriented personal prefer- ence has been endorsed recently by the International Subcommission on Stratigraphic Classification as the recommended approach to describe the cyclicity in sedimentary successions (Catuneanu et al., 2011). The adopted terminology should also follow a unified scheme derived from large consensus, and should be applicable to a wide range of scales, from seismic to high-resolution outcrop and core studies. However, while a standard workflow can be defined as a unified platform, the actual approach that is most applicable to * Corresponding author. Tel.: þ39 (0)40 2140313; fax: þ39 (0)40 327307. E-mail addresses: [email protected], [email protected] (M. Zecchin). Contents lists available at SciVerse ScienceDirect Marine and Petroleum Geology journal homepage: www.elsevier.com/locate/marpetgeo 0264-8172/$ e see front matter Ó 2012 Elsevier Ltd. All rights reserved. http://dx.doi.org/10.1016/j.marpetgeo.2012.08.015 Marine and Petroleum Geology 39 (2013) 1e25
Transcript of High-resolution sequence stratigraphy of clastic shelves I: Units and bounding surfaces
at SciVerse ScienceDirect
Marine and Petroleum Geology 39 (2013) 1e25
Contents lists available
Marine and Petroleum Geology
journal homepage: www.elsevier .com/locate/marpetgeo
Review article
High-resolution sequence stratigraphy of clastic shelves I: Units and boundingsurfaces
Massimo Zecchin a,*, Octavian Catuneanu b
aOGS (Istituto Nazionale di Oceanografia e di Geofisica Sperimentale), Borgo Grotta Gigante 42/c, 34010 Sgonico (TS), ItalybDepartment of Earth and Atmospheric Sciences, University of Alberta, 1-26 Earth Sciences Building, Edmonton, Alberta T6G 2E3, Canada
a r t i c l e i n f o
Article history:Received 24 April 2012Received in revised form30 August 2012Accepted 31 August 2012Available online 13 September 2012
Keywords:High-resolution sequence stratigraphyClastic shelvesStratigraphic unitsStratigraphic surfaces
* Corresponding author. Tel.: þ39 (0)40 2140313; fE-mail addresses: [email protected], zecchin
0264-8172/$ e see front matter � 2012 Elsevier Ltd.http://dx.doi.org/10.1016/j.marpetgeo.2012.08.015
a b s t r a c t
The high-resolution sequence stratigraphy tackles scales of observation that typically fall below theresolution of seismic exploration methods, commonly referred to as of 4th-order or lower rank. Outcrop-and core-based studies are aimed at recognizing features at these scales, and represent the basis for high-resolution sequence stratigraphy. Such studies adopt the most practical ways to subdivide the strati-graphic record, and take into account stratigraphic surfaces with physical attributes that may only bedetectable at outcrop scale. The resolution offered by exposed strata typically allows the identification ofa wider array of surfaces as compared to those recognizable at the seismic scale, which permits anaccurate and more detailed description of cyclic successions in the rock record. These surfaces can beclassified as ‘sequence stratigraphic’, if they serve as systems tract boundaries, or as facies contacts, ifthey develop within systems tracts. Both sequence stratigraphic surfaces and facies contacts areimportant in high-resolution studies; however, the workflow of sequence stratigraphic analysis requiresthe identification of sequence stratigraphic surfaces first, followed by the placement of facies contactswithin the framework of systems tracts and bounding sequence stratigraphic surfaces.
Several types of stratigraphic units may be defined, from architectural units bounded by the twonearest non-cryptic stratigraphic surfaces to systems tracts and sequences. The need for other types ofstratigraphic units in high-resolution studies, such as parasequences and small-scale cycles, may bereplaced by the usage of high-frequency sequences. The sequence boundaries that may be employed inhigh-resolution sequence stratigraphy are represented by the same types of surfaces that are usedtraditionally in larger scale studies, but at a correspondingly lower hierarchical level.
� 2012 Elsevier Ltd. All rights reserved.
1. Introduction
Sequence stratigraphic methodology and terminology devel-oped gradually since the inception of sequence stratigraphy(Payton, 1977; Wilgus et al., 1988), largely without formal guide-lines from the international stratigraphic commissions, and thisresulted in the co-existence of several schools of thought thatadvocate different approaches to the application of the method. Atthe same time, the nature of the controls that govern sedimentarycyclicity in the rock record, such as eustasy vs. tectonics, climateand sediment supply, was also the subject of much debate (e.g.,Miall, 1997).
The lack of formal guidance in the development of sequencestratigraphy, coupled with the great variability exhibited by sedi-mentary successions, resulted in the proliferation of unnecessarily
ax: þ39 (0)40 [email protected] (M. Zecchin).
All rights reserved.
complex and sometimes conflicting terminology, leading toredundancies and ultimately to confusion. Catuneanu et al. (2009)initiated an international effort to identify a common platform insequence stratigraphy, and highlighted the model-independentand the model-dependent aspects of the method. The formerdeal with all the objective features of sequences, such as theobservation of stratal stacking patterns and changes thereof,whereas the latter referred to the nomenclature of surfaces andsystems tracts, and to the selection of the sequence boundary.
The adoption of a standard workflow based on model-independent principles free of any model-oriented personal prefer-encehasbeenendorsed recentlyby the International Subcommissionon Stratigraphic Classification as the recommended approach todescribe the cyclicity in sedimentary successions (Catuneanu et al.,2011). The adopted terminology should also follow a unifiedscheme derived from large consensus, and should be applicable toa wide range of scales, from seismic to high-resolution outcrop andcore studies. However, while a standard workflow can be defined asa unified platform, the actual approach that is most applicable to
M. Zecchin, O. Catuneanu / Marine and Petroleum Geology 39 (2013) 1e252
a particular case study depends on a number of variables,including the types of data available for analysis, as well as thedepositional and tectonic settings (Catuneanu et al., 2009, 2010,2011).
High-resolution sequence stratigraphic analysis is a very effec-tive tool for outcrop research as well as for studies based on closelyspaced well-logs and cores. Recent developments in the acquisitionof seismic data have improved the resolution of seismic imaging toa level that rivals the resolution of outcrop studies, especially in thecase of Chirp or Boomer data (e.g., Liu et al., 2004; Ridente andTrincardi, 2005; Zecchin et al., 2009a, 2011a). However, thedegree of detail concerning the physical attributes of surfaces andsediment packages offered by outcrops and cores is irreplaceableand essential for the full understanding of sedimentary processesand the definition of process-based high-resolution sequencestratigraphic frameworks. Additional insights, such as those affor-ded by chemostratigraphy, may further improve the degree ofstratigraphic detail.
Traditional sequence stratigraphy was developed for thepurpose of petroleum exploration at scales above the seismicresolution, commonly referred to as of third order (Payton, 1977).For this reason, all the elements of a sequence stratigraphicframework, from depositional systems to systems tracts andsequences, were defined originally relative to this scale of obser-vation. Subsequent developments in sequence stratigraphy fol-lowed two trends: 1. the methodology was applied to datasetsother than seismic, including well logs, core and outcrop; and 2. themethodology was applied to increasingly smaller (sub-seismic)scales of observation to resolve, for example, issues of reservoircharacterization and fluid flow at stages of petroleum productiondevelopment. These trends resulted in a significant increase in thelevel of stratigraphic detail that can be resolved, defining what isknown today as high-resolution sequence stratigraphy.
The high-resolution sequence stratigraphy tackles scales ofobservation that typically fall below the resolution of seismic data,within the realm of 4th-order or lower rank stratigraphic frame-works. Outcrop and core data provide unique opportunities to
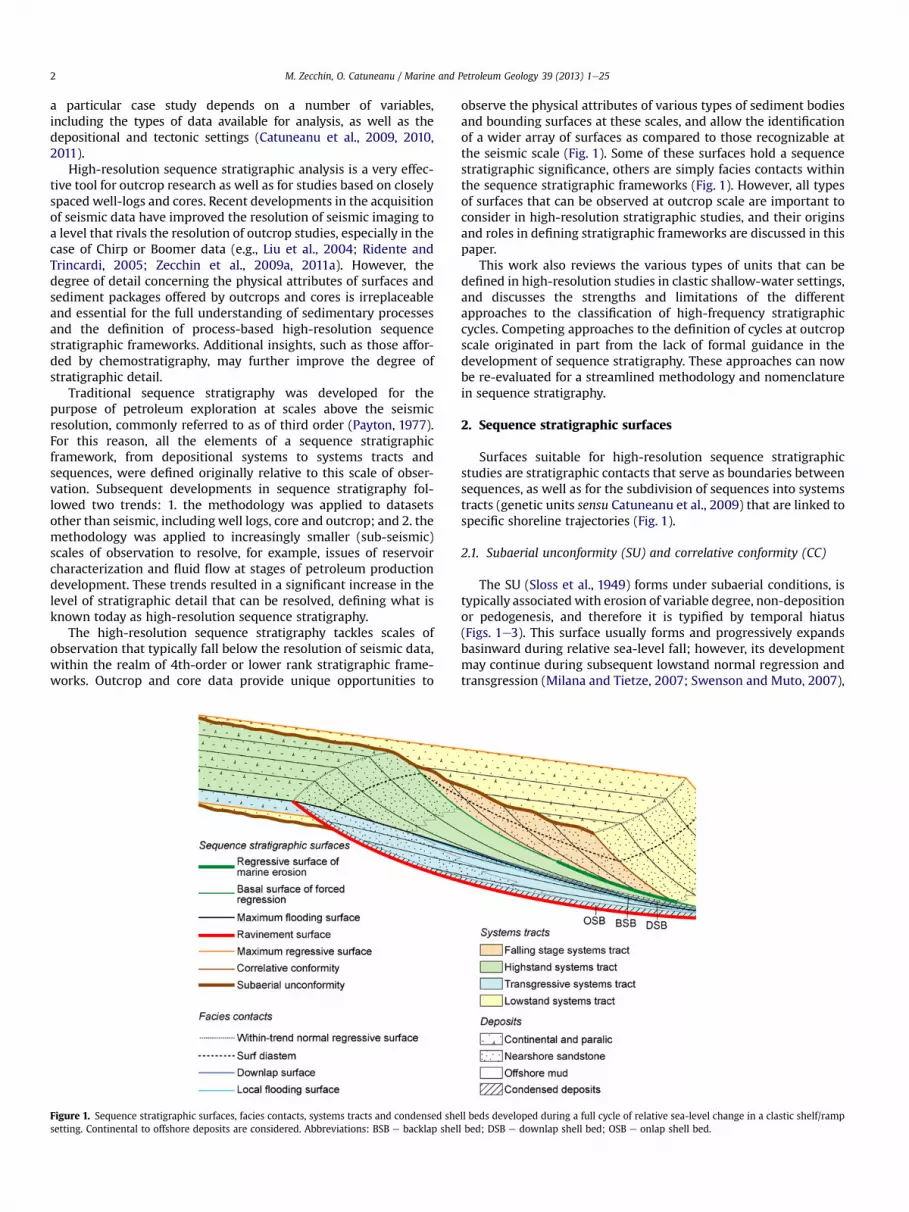
Figure 1. Sequence stratigraphic surfaces, facies contacts, systems tracts and condensed shesetting. Continental to offshore deposits are considered. Abbreviations: BSB e backlap shel
observe the physical attributes of various types of sediment bodiesand bounding surfaces at these scales, and allow the identificationof a wider array of surfaces as compared to those recognizable atthe seismic scale (Fig. 1). Some of these surfaces hold a sequencestratigraphic significance, others are simply facies contacts withinthe sequence stratigraphic frameworks (Fig. 1). However, all typesof surfaces that can be observed at outcrop scale are important toconsider in high-resolution stratigraphic studies, and their originsand roles in defining stratigraphic frameworks are discussed in thispaper.
This work also reviews the various types of units that can bedefined in high-resolution studies in clastic shallow-water settings,and discusses the strengths and limitations of the differentapproaches to the classification of high-frequency stratigraphiccycles. Competing approaches to the definition of cycles at outcropscale originated in part from the lack of formal guidance in thedevelopment of sequence stratigraphy. These approaches can nowbe re-evaluated for a streamlined methodology and nomenclaturein sequence stratigraphy.
2. Sequence stratigraphic surfaces
Surfaces suitable for high-resolution sequence stratigraphicstudies are stratigraphic contacts that serve as boundaries betweensequences, as well as for the subdivision of sequences into systemstracts (genetic units sensu Catuneanu et al., 2009) that are linked tospecific shoreline trajectories (Fig. 1).
2.1. Subaerial unconformity (SU) and correlative conformity (CC)
The SU (Sloss et al., 1949) forms under subaerial conditions, istypically associatedwith erosion of variable degree, non-depositionor pedogenesis, and therefore it is typified by temporal hiatus(Figs. 1e3). This surface usually forms and progressively expandsbasinward during relative sea-level fall; however, its developmentmay continue during subsequent lowstand normal regression andtransgression (Milana and Tietze, 2007; Swenson and Muto, 2007),
ll beds developed during a full cycle of relative sea-level change in a clastic shelf/rampl bed; DSB e downlap shell bed; OSB e onlap shell bed.
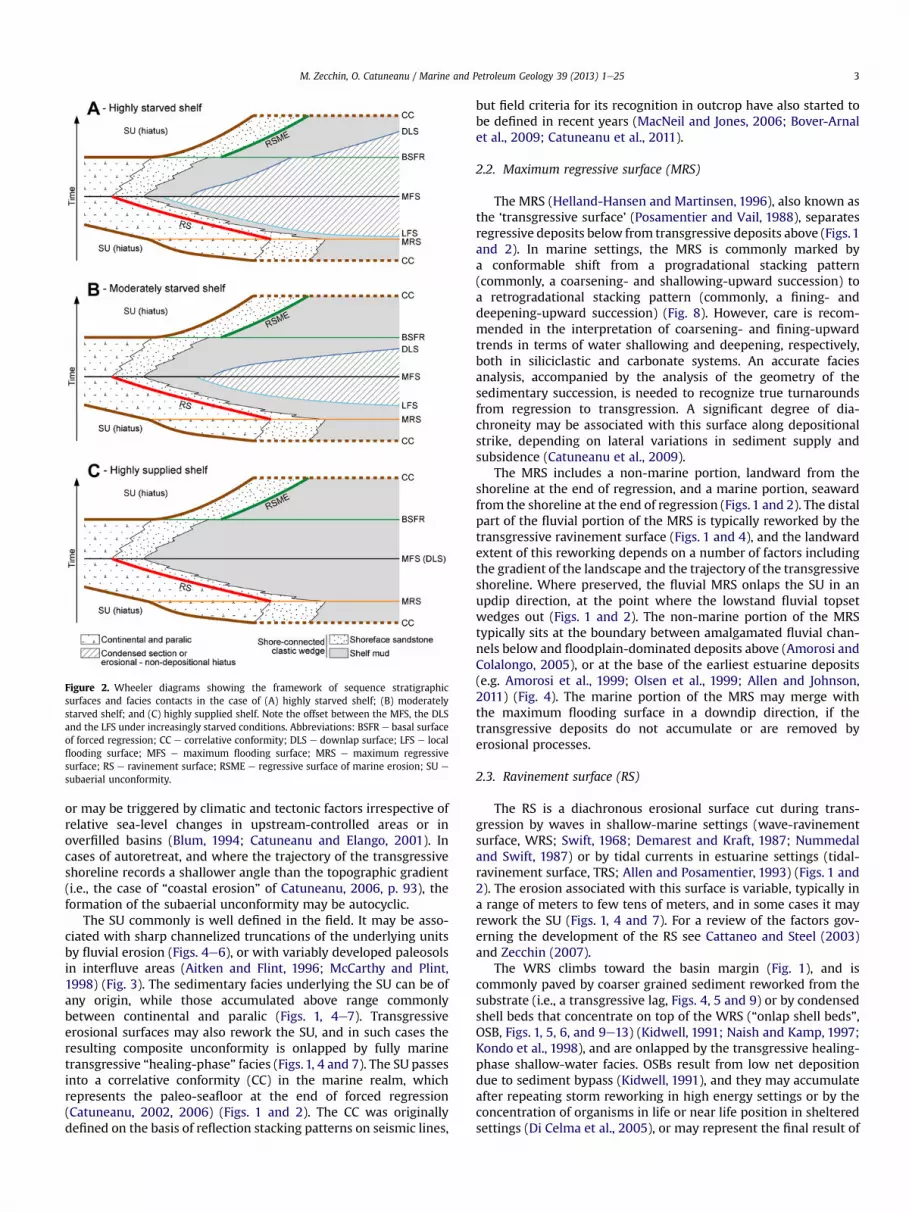
Figure 2. Wheeler diagrams showing the framework of sequence stratigraphicsurfaces and facies contacts in the case of (A) highly starved shelf; (B) moderatelystarved shelf; and (C) highly supplied shelf. Note the offset between the MFS, the DLSand the LFS under increasingly starved conditions. Abbreviations: BSFR e basal surfaceof forced regression; CC e correlative conformity; DLS e downlap surface; LFS e localflooding surface; MFS e maximum flooding surface; MRS e maximum regressivesurface; RS e ravinement surface; RSME e regressive surface of marine erosion; SU e
subaerial unconformity.
M. Zecchin, O. Catuneanu / Marine and Petroleum Geology 39 (2013) 1e25 3
or may be triggered by climatic and tectonic factors irrespective ofrelative sea-level changes in upstream-controlled areas or inoverfilled basins (Blum, 1994; Catuneanu and Elango, 2001). Incases of autoretreat, and where the trajectory of the transgressiveshoreline records a shallower angle than the topographic gradient(i.e., the case of “coastal erosion” of Catuneanu, 2006, p. 93), theformation of the subaerial unconformity may be autocyclic.
The SU commonly is well defined in the field. It may be asso-ciated with sharp channelized truncations of the underlying unitsby fluvial erosion (Figs. 4e6), or with variably developed paleosolsin interfluve areas (Aitken and Flint, 1996; McCarthy and Plint,1998) (Fig. 3). The sedimentary facies underlying the SU can be ofany origin, while those accumulated above range commonlybetween continental and paralic (Figs. 1, 4e7). Transgressiveerosional surfaces may also rework the SU, and in such cases theresulting composite unconformity is onlapped by fully marinetransgressive “healing-phase” facies (Figs. 1, 4 and 7). The SU passesinto a correlative conformity (CC) in the marine realm, whichrepresents the paleo-seafloor at the end of forced regression(Catuneanu, 2002, 2006) (Figs. 1 and 2). The CC was originallydefined on the basis of reflection stacking patterns on seismic lines,
but field criteria for its recognition in outcrop have also started tobe defined in recent years (MacNeil and Jones, 2006; Bover-Arnalet al., 2009; Catuneanu et al., 2011).
2.2. Maximum regressive surface (MRS)
The MRS (Helland-Hansen and Martinsen, 1996), also known asthe ‘transgressive surface’ (Posamentier and Vail, 1988), separatesregressive deposits below from transgressive deposits above (Figs.1and 2). In marine settings, the MRS is commonly marked bya conformable shift from a progradational stacking pattern(commonly, a coarsening- and shallowing-upward succession) toa retrogradational stacking pattern (commonly, a fining- anddeepening-upward succession) (Fig. 8). However, care is recom-mended in the interpretation of coarsening- and fining-upwardtrends in terms of water shallowing and deepening, respectively,both in siliciclastic and carbonate systems. An accurate faciesanalysis, accompanied by the analysis of the geometry of thesedimentary succession, is needed to recognize true turnaroundsfrom regression to transgression. A significant degree of dia-chroneity may be associated with this surface along depositionalstrike, depending on lateral variations in sediment supply andsubsidence (Catuneanu et al., 2009).
The MRS includes a non-marine portion, landward from theshoreline at the end of regression, and a marine portion, seawardfrom the shoreline at the end of regression (Figs. 1 and 2). The distalpart of the fluvial portion of the MRS is typically reworked by thetransgressive ravinement surface (Figs. 1 and 4), and the landwardextent of this reworking depends on a number of factors includingthe gradient of the landscape and the trajectory of the transgressiveshoreline. Where preserved, the fluvial MRS onlaps the SU in anupdip direction, at the point where the lowstand fluvial topsetwedges out (Figs. 1 and 2). The non-marine portion of the MRStypically sits at the boundary between amalgamated fluvial chan-nels below and floodplain-dominated deposits above (Amorosi andColalongo, 2005), or at the base of the earliest estuarine deposits(e.g. Amorosi et al., 1999; Olsen et al., 1999; Allen and Johnson,2011) (Fig. 4). The marine portion of the MRS may merge withthe maximum flooding surface in a downdip direction, if thetransgressive deposits do not accumulate or are removed byerosional processes.
2.3. Ravinement surface (RS)
The RS is a diachronous erosional surface cut during trans-gression by waves in shallow-marine settings (wave-ravinementsurface, WRS; Swift, 1968; Demarest and Kraft, 1987; Nummedaland Swift, 1987) or by tidal currents in estuarine settings (tidal-ravinement surface, TRS; Allen and Posamentier, 1993) (Figs. 1 and2). The erosion associated with this surface is variable, typically ina range of meters to few tens of meters, and in some cases it mayrework the SU (Figs. 1, 4 and 7). For a review of the factors gov-erning the development of the RS see Cattaneo and Steel (2003)and Zecchin (2007).
The WRS climbs toward the basin margin (Fig. 1), and iscommonly paved by coarser grained sediment reworked from thesubstrate (i.e., a transgressive lag, Figs. 4, 5 and 9) or by condensedshell beds that concentrate on top of the WRS (“onlap shell beds”,OSB, Figs. 1, 5, 6, and 9e13) (Kidwell, 1991; Naish and Kamp, 1997;Kondo et al., 1998), and are onlapped by the transgressive healing-phase shallow-water facies. OSBs result from low net depositiondue to sediment bypass (Kidwell, 1991), and they may accumulateafter repeating storm reworking in high energy settings or by theconcentration of organisms in life or near life position in shelteredsettings (Di Celma et al., 2005), or may represent the final result of

Figure 3. Subaerial unconformity (SU) marked by a calcrete interval, separating upper beachface sandstones from fluvio-lacustrine deposits. Middle Pleistocene Cutro terrace,southern Italy (modified from Zecchin et al., 2011b).
M. Zecchin, O. Catuneanu / Marine and Petroleum Geology 39 (2013) 1e254
concentration by infaunal organisms (Carnevale et al., 2011). TheWRS is also frequently marked by substrate-related ichnofossilsbelonging to the Glossifungites ichnofacies, including Thalassinoides,Skolithos, Diplocraterion and Arenicolites (Pemberton et al., 1992)(Figs. 9, 11 and 12), or to the Trypanites ichnofacies where a lithifiedsubstrate is exhumed (Pemberton et al., 1992; Cantalamessa et al.,2007). Gastrochaenolites, Entobia or other borings belonging tothe Trypanites ichnofacies can also affect the clasts composingtransgressive lags (Siggerud et al., 2000).
Although the RS is commonly a relatively flat surface, theevidence from post-glacial transgressed shelves shows locally high-relief, stepped or irregular RSs (Goff et al., 2005; Zecchin et al.,2011a). Due to its very good appearance in the field (Fig. 9), theRS is one of the most suitable surfaces to subdivide shallow-marinesuccessions into cycles (Zecchin, 2007).
2.4. Maximum flooding surface (MFS)
The maximum flooding surface (MFS, Posamentier et al., 1988;Van Wagoner et al., 1988) corresponds to the seafloor at the timeof maximum shoreline transgression, and marks a change betweentransgressive and normal regressive shoreline trajectories(Helland-Hansen and Martinsen, 1996; Catuneanu, 2006) (Figs. 1and 2). While on seismic lines the MFS is generally equated to thedownlap surface marking the base of the highstand progradingclinoforms, high-resolution outcrop and core studies indicate thatthe MFS and the downlap surface may be separated by a condensedsection and, therefore, they may not necessarily coincide (seeSection 3.2) (Figs. 1, 5, 11A,B and 12). The MFS, therefore, maycorrespond to a cryptic ‘conceptual’ horizon within condenseddeposits accumulated around the time of maximum transgression,without necessarily having a clear physical expression (Carter et al.,1998) (Figs. 11e14). In the case of starved shelves, the MFS may berepresented by omission surfaces; in the case of condensedsections, the MFS is commonly taken at the point of highest Bio-turbation Index, interpreted to indicate the change from trans-gression to highstand normal regression (Figs. 11 and 14).
The MFS may be associated to a significant degree of dia-chroneity along depositional strike, whereas it approximatesa timeline along dip (Catuneanu et al., 2009) (Fig. 2).
2.5. Basal surface of forced regression (BSFR)
The BSFR (Hunt and Tucker, 1992) coincides with the seafloor atthe onsetof forced regressionandmarks the base of allmarine forcedregressive deposits (Catuneanu, 2002, 2006) (Figs. 1 and 2). Thissurface was originally defined on the basis of seismic data(Catuneanu, 2006), but there is increasingevidence that the BSFRhasa lithological expression in outcrop and core as well (MacEachernet al., 1999; MacNeil and Jones, 2006; Bover-Arnal et al., 2009). Assediment supply to themarine environment increases with the startof relative sea-level fall, both in terms of volume and sedimentcaliber, an increase in the dip angle of clinoforms may occur at theonset of forced regression in a prograding wedge, producinga downlap surface at the top of the youngest highstand marinesediment (Fig. 15). If the base of the forced regressive wedge liesbelow wave base and/or the gradient of the forced regressive clino-forms is high (i.e., steeper than the wave equilibrium profile), thena regressive surface of marine erosion (see below) may not form; inthis case, the downlap surface that separates highstand from forcedregressive sediments is preservedas theBSFR, as it is not reworkedbywaves during forced regression. A field example illustrating thissituation is provided by Pomar and Tropeano (2001) (Fig. 15).
2.6. Regressive surface of marine erosion (RSME)
The RSME (Plint, 1988; Plint and Nummedal, 2000) is a dia-chronous surface produced by wave erosion in the lower shorefaceduring relative sea-level fall, and it marks the base of forced-regressive shorefaces (Figs. 1, 2, 7 and 16). This surface iscommonly recognizable by a sharp contact between fine-grainedshelf sediments below and sandy to gravelly shoreface sedimentsabove (Fig. 16); however, this contact may be cryptic where theamount of scouring is less and the caliber of the sediment below and

Figure 4. Hierarchical organization of cycles, with three high-frequency sequences composing a larger transgressive, deepening-upward trend, in the continental to marinePliocene succession of the Crotone Basin, southern Italy (modified from Zecchin et al., 2006). Individual RSs, marked by coarse-grained lags, rework MRSs and SUs locally. MRSs arecryptic and inferred to lie at the transition between amalgamated fluvial channel and floodplain deposits. Abbreviations: MRS e maximum regressive surface; RS e ravinementsurface; SU e subaerial unconformity.
M. Zecchin, O. Catuneanu / Marine and Petroleum Geology 39 (2013) 1e25 5
above is similar (e.g. Zecchin et al., 2009b, 2011b) (Fig. 7). Thissurface may also not form during forced regression, particularly infront of river-dominated deltas where seafloor gradients are steeperthan the wave equilibrium profile (Catuneanu, 2006). The RSMEmay be associated with lags (Pattison, 1995), gutter casts (Plint andNummedal, 2000) and Glossifungites ichnofacies (Pemberton et al.,1992). For a review of the factors governing the development ofthe RSME see Plint and Nummedal (2000) and Zecchin (2007).
2.7. The significance of sequence stratigraphic surfaces forcorrelation
2.7.1. The choice of a datumBecause of the sparse occurrence of outcrops, the choice of an
appropriate datum to correlate exposed stratigraphic sections and
cores may be difficult, and therefore the correct recognition ofsurfaces of sequence stratigraphic significance is essential. Thearbitrary choice of lithologic boundaries or inclined clinoformsurfaces as datum invariably leads to highly distorted architecturesof sedimentary bodies on cross sections (see examples inBhattacharya, 2011).
In principle, surfaces that are relatively flat at syn-depositionaltime, such as MFSs lying within fine-grained marine successions,make better datums, but they are often difficult to pick preciselywithin condensed sections (Fig. 14). Wave scouring during trans-gressionmay result in relatively flat and regularWRSs, as comparedto other surfaces, which can form extensive and well recognizablewave-cut platforms. However, they may exhibit a variable seawardinclination which needs to be accounted for in the construction ofcross sections. Similarly, the portion of the MRS that develops in

Figure 5. Example of transgressiveeregressive unit from the lower Pliocene Zinga Sandstone, Crotone Basin, southern Italy (modified from Zecchin et al., 2004). The lower part ofthe transgressive interval consists of packed shell concentrations (OSB) mixed at the base with material reworked from the substrate (transgressive lag) and overlying a trans-gressive erosional surface (RS). The transition between transgressive and regressive deposits consists of condensed shell beds (BSB) accumulated under conditions of sedimentstarvation (see text for details). The regressive succession is dominated by shorefaceeshelf deposits separated from the overlying fluvial strata by a subaerial unconformity. The MFSis cryptic and inferred to lie between the LFS and the DLS. Abbreviations: BSB e backlap shell bed; DLS e downlap surface; LFS e local flooding surface; MFS e maximum floodingsurface; OSB e onlap shell bed; RS e ravinement surface; SU e subaerial unconformity.
M. Zecchin, O. Catuneanu / Marine and Petroleum Geology 39 (2013) 1e256
shallow-water systemsmay also dip basinward, as representing theclinoform surface at the end of regression (Fig. 1). WRSs were usedas datum in several cases, for example in the study of shorefacetongues (e.g., Hampson, 2000) or of marine terrace deposits(Zecchin et al., 2009b, 2011b) (Fig. 7).
Figure 6. Sections illustrating the middle Pleistocene Cutro terrace deposits, southern Italy (by a rhodolith-bearing OSB, whereas the larger part of the succession is represented by regreshoreface from the upper shoreface sandstones and conglomerates. Minor discontinuity surcross-stratification; E � erosional discontinuity; OSB e onlap shell bed; ND e non-depositi
2.7.2. Correlation based on sparse datasetsThe correlation of sparse outcrop sections or cores and the
consequent 3D reconstruction of facies and stratigraphic architec-ture of sedimentary units can be made following a careful faciesanalysis and the recognition of surfaces of sequence stratigraphic
modified from Zecchin et al., 2011b). The terrace is marked at the base by an RS overlainssive shoreface to continental deposits. The erosional surf diastem separates the middlefaces define smaller-scale units that can be referred to as bedsets. Abbreviations: cs e
onal discontinuity; RS e ravinement surface; SU e subaerial unconformity.
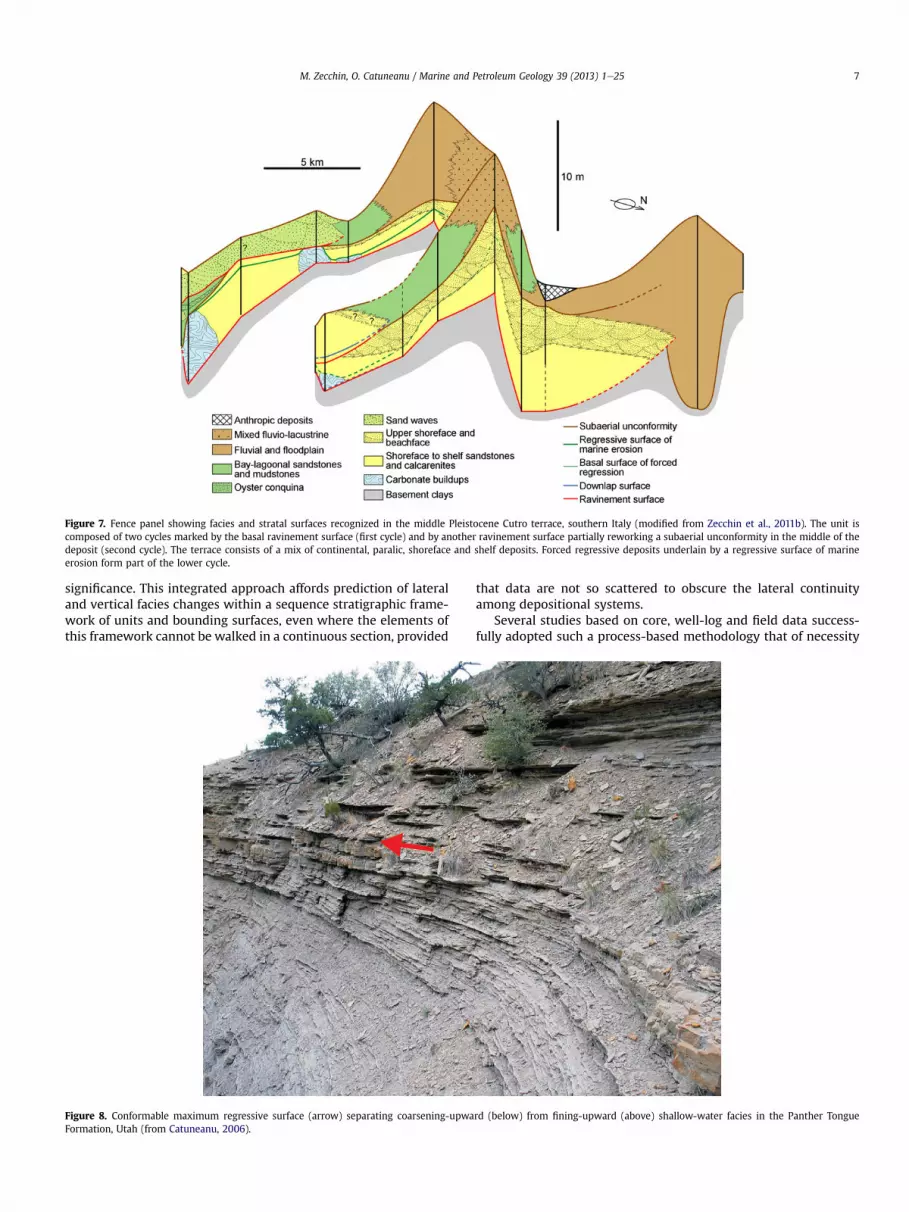
Figure 7. Fence panel showing facies and stratal surfaces recognized in the middle Pleistocene Cutro terrace, southern Italy (modified from Zecchin et al., 2011b). The unit iscomposed of two cycles marked by the basal ravinement surface (first cycle) and by another ravinement surface partially reworking a subaerial unconformity in the middle of thedeposit (second cycle). The terrace consists of a mix of continental, paralic, shoreface and shelf deposits. Forced regressive deposits underlain by a regressive surface of marineerosion form part of the lower cycle.
M. Zecchin, O. Catuneanu / Marine and Petroleum Geology 39 (2013) 1e25 7
significance. This integrated approach affords prediction of lateraland vertical facies changes within a sequence stratigraphic frame-work of units and bounding surfaces, even where the elements ofthis framework cannot be walked in a continuous section, provided
Figure 8. Conformable maximum regressive surface (arrow) separating coarsening-upwaFormation, Utah (from Catuneanu, 2006).
that data are not so scattered to obscure the lateral continuityamong depositional systems.
Several studies based on core, well-log and field data success-fully adopted such a process-based methodology that of necessity
rd (below) from fining-upward (above) shallow-water facies in the Panther Tongue

Figure 9. Prominent ravinement surface (RS) marked by large burrows, from the lower Pliocene Zinga Sandstone, Crotone Basin, southern Italy (modified from Zecchin et al., 2003).The surface is paved by material reworked from the substrate (transgressive lag) and by a thick accumulation of large oyster shells concentrated as an “onlap shell bed”.
M. Zecchin, O. Catuneanu / Marine and Petroleum Geology 39 (2013) 1e258
involves a certain degree of interpretation of the nature of surfacesand their large-scale architecture. An example based onwell-logs isprovided by Plint (2000) in the Cenomanian Dunvegan Formation(Alberta). Amorosi et al. (1999, 2005) adopted a sequence strati-graphic approach to correlate sparse cores in the Late Quaternarysuccession of the Po Plain (Italy), making a 3D reconstruction offacies architecture. A 3D facies and stratal architecture, based onsparse measured sections, was provided by Zecchin et al. (2011b) inthe Late Pleistocene Cutro terrace deposits (southern Italy) (Fig. 7).The degree of interpretation is minimized where continuousexposures are available, such as in the case of the Cretaceoussuccession of Book Cliffs (Utah) or the Eocene section of Spitsber-gen (Norway), where all elements of a sequence stratigraphicframework, including key bounding surfaces and stratal termina-tions can be observed in near seismic-scale outcrops (e.g., Pattison,1995; Hampson, 2000; Plink-Björklund and Steel, 2005).
3. Facies contacts in high-resolution stratigraphic analyses
Facies contacts are typically diachronous surfaces that developwithin (rather than at the boundary between) systems tracts, buthave good physical expression in outcrop or cores, bound sedimentbodies with distinct lithologies, and have the potential to refine theinternal architecture of systems tracts.
Figure 10. Types of shell beds within the down-dip sequence stratigraphic framework of asupply, and accumulate commonly during transgressions or highstands when the shelf is lcoquinas. Condensed shell beds are typically described at the base and at the top of transgresof highstand normal regressive deposits (downlap and toplap shell beds, respectively).
3.1. Flooding surface (FS)
The term FS was originally defined as the parasequenceboundary, and interpreted to correspond to ‘a surface across whichthere is evidence of an abrupt increase of water depth’ (VanWagoner et al., 1988). More recently, it has been recognized thatlithological discontinuities that are typically interpreted as FSs donot necessarily form as a result of abrupt increases in water depth,which would involve allogenic controls, but may also form inresponse to autocyclic processes such as delta lobe switching andabandonment (Fig. 17A). The term FS is also equivocal to someextent, as, under specific circumstances, a number of different typesof stratigraphic contacts (some sequence stratigraphic surfaces,some not) may satisfy the definition of a flooding surface(Catuneanu, 2002, 2006) (Fig. 17). For this reason, on a case-by-casebasis, the term FS can be effectively replaced with more specificterminology that indicates particular sequence stratigraphicsurfaces (e.g., MRS, MFS, RS, Fig. 17B) or facies contacts withintransgressive systems tracts. For the latter situation, specific termssuch as “local FS” (LFS; Abbott and Carter, 1994) or “within-trendFS” (WTFS; Catuneanu, 2006) have been proposed.
The LFS (Figs. 1, 2, 5 and 11e13) is produced distally on the shelfdue to marked sediment starvation and variable degree of erosionduring transgression. Where the transgressive sediments aremissing entirely, the LFS becomes an MFS, which also reworks the
clastic shelf (modified from Zecchin, 2007). Shell beds indicate stages of low sedimentargely submerged, providing favorable conditions for the growth and concentration ofsive deposits (onlap and backlap shell beds, respectively), and at the base and at the top

Figure 11. Different scenarios of surfaces and shell beds forming during transgressionto early highstand normal regression. (A) The OSB paves the RS during early trans-gression, whereas sediment starvation during late transgression may lead to theformation of the LFS at the base of the condensed BSB which may contain faunas in lifeor near life position. The progradation of the shore-connected prograding sedimentwedge progressively stops the development of the BSB, which thickens in a distaldirection. The BSB and the shore-connected prograding sediment wedge are separatedby the DLS. A DSB may lie at the base of the regressive sediment body. Note the offsetbetween the cryptic MFS, corresponding to the seafloor at the time of maximumshoreline retreat, and both the LFS and the DLS. (B) In this case, the accumulation ofshore-detached muds during late transgression and early highstand stops the devel-opment of the BSB distally and promotes the development of a mud-rich condensedsection that may contain the MFS. The base of the shore-detached mud may be mis-interpreted as a DLS. The MFS and the DLS coincide where erosion, non-deposition orhigh sediment supply prevent the development of the condensed section (cases C andD), or where the transgressive deposits do not accumulate (case E). Abbreviations: BSBe backlap shell bed; DLS e downlap surface; DLS* e apparent downlap surface; DSB e
downlap shell bed; LFS e local flooding surface; MFS e maximum flooding surface;OSB e onlap shell bed; RS e ravinement surface.
Figure 12. Development of stratigraphic surfaces and condensed shell beds duringtransgression and highstand normal regression. (A) RS, OSB, LFS and BSB form duringshoreline transgression. At the end of transgression, the BSB still continues to accu-mulate, although its development is locally interrupted by an expanding shore-detached mud wedge accumulated from suspension (see Fig. 11B). The seafloor atthis time of maximum shoreline retreat represents the MFS (modified from Abbott,2000). (B) The BSB continues its development until its blanketing by the shore-detached mud and by the prograding shore-connected sediment wedge. (C) Thesuperposition of the shore-connected sediment wedge on the shore-detached mudmay obscure the recognition of the distal part of the DLS in the field, which becomesa cryptic contact within the lower part of the fine-grained succession. On the shelf, theMFS is a cryptic surface that may lie in part within the BSB and in part within theshore-detached mud. Abbreviations: BSB e backlap shell bed; DLS e downlap surface;DLS* e apparent downlap surface; LFS e local flooding surface; MFS e maximumflooding surface; OSB e onlap shell bed; RS e ravinement surface.
M. Zecchin, O. Catuneanu / Marine and Petroleum Geology 39 (2013) 1e25 9
underlying MRS (Fig. 11E). The LFS may be characterized by intenseburrowing (Glossifungites ichnofacies), and generally marks thebase of condensed skeletal accumulations which typically consist ofepifauna-dominated community concentrations occasionallyswept by major storm waves and shelf currents (the “backlap shellbeds”, BSB, of Kidwell, 1991, Figs. 1, 5 and 10e13). The BSBs preservefaunas in life or near life position, due to the low environmentalenergy, which lived in deeper water relative to those forming OSBs(Kidwell, 1991; Naish and Kamp, 1997; Kondo et al., 1998; Di Celmaet al., 2005). Backlap refers to the termination of beds at the distaledge of a retrogradational body, as a result of sediment starvationand condensation, where stratal surfaces converge asymptotically
(Kidwell, 1991) (Fig. 10). Condensed sections may be marked by anincrease in the abundance of microfossils, marine hardgrounds,authigenic minerals and organic matter (Loutit et al., 1988).
The LFS corresponds to the ‘offshore marine erosion diastem’ ofNummedal and Swift (1987), and is characterized by a variabledegree of diachroneity (Carter et al., 1998) (Fig. 2). In some cases,

Figure 13. Example of shell beds and stratigraphic surfaces in the late Pleistocene Capo Colonna terrace, southern Italy. (A) Transgressive interval composed in its lower part ofa mollusc-rich assemblage (OSB) overlying an RS, and in its upper part of a bryozoan-bearing accumulation (BSB) placed between a sharp LFS and a lateral equivalent of the DLS (seethe vertical thick line for location in the inset dip section of the terrace). The highstand deposits are here represented by coralline algal patch reefs that pass laterally into bothcalcarenites and mixed bioclasticesiliciclastic sandstones (modified from Zecchin and Caffau, 2011). (B) and (C) show respectively the OSB and the BSB visible in (A) (modified fromZecchin et al., 2009b). Abbreviations: BSB e backlap shell bed; DLS e downlap surface; LFS e local flooding surface; OSB e onlap shell bed; RS e ravinement surface.
M. Zecchin, O. Catuneanu / Marine and Petroleum Geology 39 (2013) 1e2510
the LFS is absent and the base of BSBs is gradual because of rela-tively high sediment supply and/or reduced wave energy (Kidwell,1991; Di Celma et al., 2005). Where the transgressive marinedeposits are poorly represented, BSBs (accumulated on the shelf)and OSBs (accumulated within the shoreface) may be superposedor amalgamated as a result of backstepping (Naish and Kamp,1997;Kondo et al., 1998; Di Celma et al., 2002) (Fig. 10).
3.2. Downlap surface (DLS)
The DLS typically develops as a distinct surface on starvedshelves, where it sits at the sharp contact between the riverbornesediment of prograding clastic wedges and the underlying hemi-pelagic condensed sections that accumulate below the stormwavebase (Figs. 1, 2, 5, 10e12, 17 and 18). As such, the succession over-lying the DLS includes clinoforms and grades upward intoprogressively more proximal facies that indicate acceleratingsedimentation (Kidwell, 1991; Kondo et al., 1998) (Fig. 18). The DLS
may be overlain by less condensed shell beds that concentrate dueto sediment starvation at the basinward termination of the pro-grading wedge (the “downlap shell beds”, DSB, of Kidwell, 1991,Figs. 1, 10 and 11AeC). DSBs tend to be more common in sand-richbasins than in mud-rich basins (Kondo et al., 1998).
The DLS does not necessarily correspond to the seafloor at thetime ofmaximum shoreline transgression, which is theMFS (Fig. 2),although theywere commonly considered as equivalent (Baum andVail, 1988). In fact, the MFS is generally cryptic in the field and maylie anywhere between the LFS and the DLS, within the condensedsection (Figs. 11e13), depending on local sediment supply andlocation in the shorefaceeshelf system (see Abbott and Carter,1994; Carter et al., 1998). In particular, the DLS and the MFSdiverge in a downdip direction on starved shelves characterized bythe formation of condensed sections (Figs. 2A,B and 11A,B). Whereerosion prevails and condensed deposits do not accumulate, theDLS will merge with both the MFS and the LFS (Fig. 11C), and sucha composite surface may be associated with significant hiatus. If the
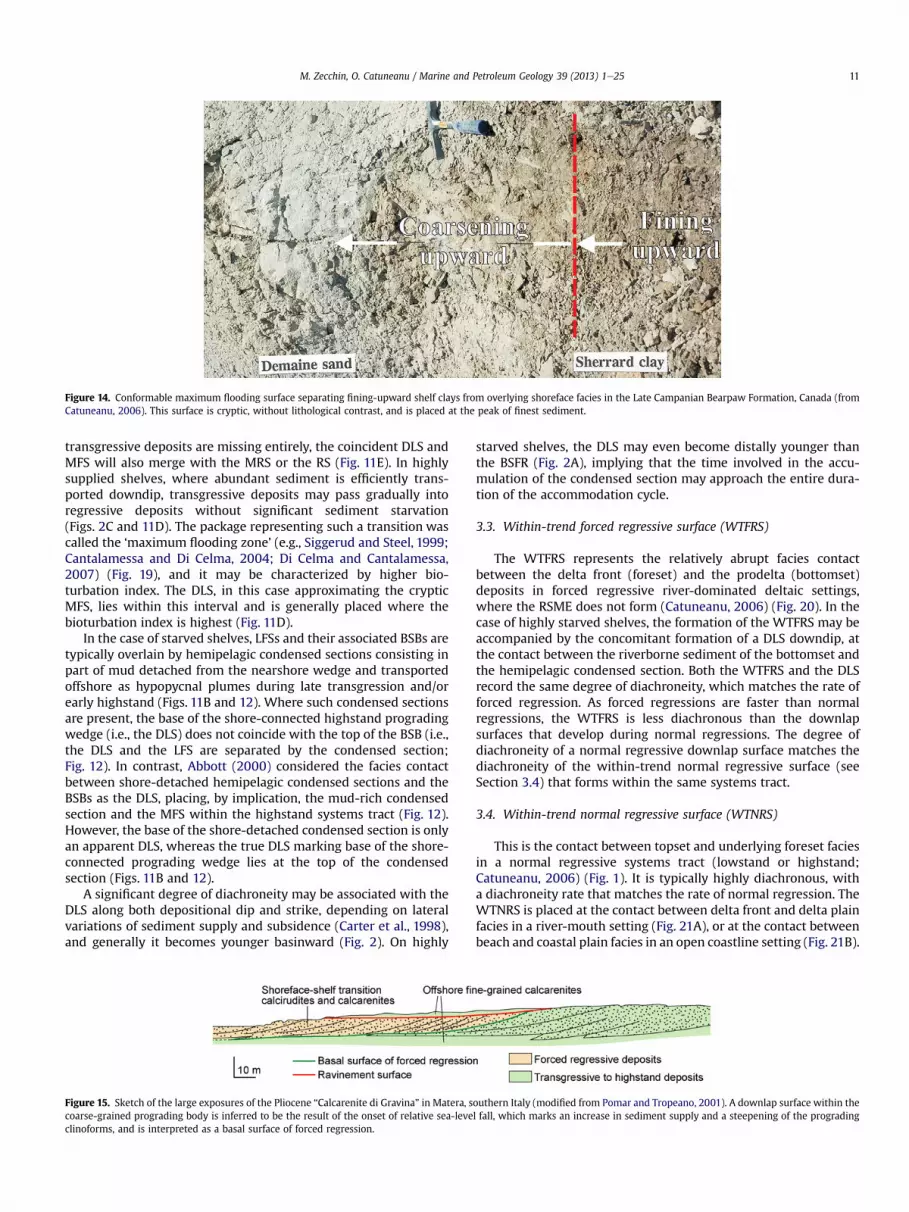
Figure 14. Conformable maximum flooding surface separating fining-upward shelf clays from overlying shoreface facies in the Late Campanian Bearpaw Formation, Canada (fromCatuneanu, 2006). This surface is cryptic, without lithological contrast, and is placed at the peak of finest sediment.
M. Zecchin, O. Catuneanu / Marine and Petroleum Geology 39 (2013) 1e25 11
transgressive deposits are missing entirely, the coincident DLS andMFS will also merge with the MRS or the RS (Fig. 11E). In highlysupplied shelves, where abundant sediment is efficiently trans-ported downdip, transgressive deposits may pass gradually intoregressive deposits without significant sediment starvation(Figs. 2C and 11D). The package representing such a transition wascalled the ‘maximum flooding zone’ (e.g., Siggerud and Steel, 1999;Cantalamessa and Di Celma, 2004; Di Celma and Cantalamessa,2007) (Fig. 19), and it may be characterized by higher bio-turbation index. The DLS, in this case approximating the crypticMFS, lies within this interval and is generally placed where thebioturbation index is highest (Fig. 11D).
In the case of starved shelves, LFSs and their associated BSBs aretypically overlain by hemipelagic condensed sections consisting inpart of mud detached from the nearshore wedge and transportedoffshore as hypopycnal plumes during late transgression and/orearly highstand (Figs. 11B and 12). Where such condensed sectionsare present, the base of the shore-connected highstand progradingwedge (i.e., the DLS) does not coincide with the top of the BSB (i.e.,the DLS and the LFS are separated by the condensed section;Fig. 12). In contrast, Abbott (2000) considered the facies contactbetween shore-detached hemipelagic condensed sections and theBSBs as the DLS, placing, by implication, the mud-rich condensedsection and the MFS within the highstand systems tract (Fig. 12).However, the base of the shore-detached condensed section is onlyan apparent DLS, whereas the true DLS marking base of the shore-connected prograding wedge lies at the top of the condensedsection (Figs. 11B and 12).
A significant degree of diachroneity may be associated with theDLS along both depositional dip and strike, depending on lateralvariations of sediment supply and subsidence (Carter et al., 1998),and generally it becomes younger basinward (Fig. 2). On highly
Figure 15. Sketch of the large exposures of the Pliocene “Calcarenite di Gravina” in Matera, scoarse-grained prograding body is inferred to be the result of the onset of relative sea-leveclinoforms, and is interpreted as a basal surface of forced regression.
starved shelves, the DLS may even become distally younger thanthe BSFR (Fig. 2A), implying that the time involved in the accu-mulation of the condensed section may approach the entire dura-tion of the accommodation cycle.
3.3. Within-trend forced regressive surface (WTFRS)
The WTFRS represents the relatively abrupt facies contactbetween the delta front (foreset) and the prodelta (bottomset)deposits in forced regressive river-dominated deltaic settings,where the RSME does not form (Catuneanu, 2006) (Fig. 20). In thecase of highly starved shelves, the formation of the WTFRS may beaccompanied by the concomitant formation of a DLS downdip, atthe contact between the riverborne sediment of the bottomset andthe hemipelagic condensed section. Both the WTFRS and the DLSrecord the same degree of diachroneity, which matches the rate offorced regression. As forced regressions are faster than normalregressions, the WTFRS is less diachronous than the downlapsurfaces that develop during normal regressions. The degree ofdiachroneity of a normal regressive downlap surface matches thediachroneity of the within-trend normal regressive surface (seeSection 3.4) that forms within the same systems tract.
3.4. Within-trend normal regressive surface (WTNRS)
This is the contact between topset and underlying foreset faciesin a normal regressive systems tract (lowstand or highstand;Catuneanu, 2006) (Fig. 1). It is typically highly diachronous, witha diachroneity rate that matches the rate of normal regression. TheWTNRS is placed at the contact between delta front and delta plainfacies in a river-mouth setting (Fig. 21A), or at the contact betweenbeach and coastal plain facies in an open coastline setting (Fig. 21B).
outhern Italy (modified from Pomar and Tropeano, 2001). A downlap surface within thel fall, which marks an increase in sediment supply and a steepening of the prograding

Figure 16. Regressive surface of marine erosion (RSME) abruptly separating inner shelf sands and muds (B) fromwave-dominated shoreface sands (A) in the Blackhawk Formation,Utah (modified from Catuneanu, 2006). The exposed section below the RSME is about 2 m thick.
Figure 17. (A) The variable significance of the flooding surface defined as a lithologicdiscontinuity (modified from Catuneanu, 2002). Depending on the location alongdepositional dip, the FS may coincide with an MFS, an MRS or a WTFC that isunrelated to any surface of sequence stratigraphic significance. (B) The samesuccession can be interpreted using sequence stratigraphic surfaces (MFS, MRS andRS) and facies contacts (DLS), which merge basinward becoming a compositesurface. Note that the MFS may be a cryptic surface lying between the MRS/RS andthe DLS. Abbreviations: DLS e downlap surface; FS e flooding surface; MFS e
maximum flooding surface; MRS e maximum regressive surface; RS e ravinementsurface; WTFC e within-trend facies contact.
M. Zecchin, O. Catuneanu / Marine and Petroleum Geology 39 (2013) 1e2512
3.5. Surf diastem (SD)
The SD is a facies contact generated by the seaward migration oflongshore troughs and rip channels during coastal progradation,and separates lower shoreface to shorefaceeshelf transitiondeposits below from trough cross-bedded upper shoreface depositsabove (Zhang et al., 1997; Swift et al., 2003; Clifton, 2006) (Figs. 1, 6and 22).
The SD should not be confused with the RSME, as the formerdevelops independently of relative sea-level changes, during bothforced and normal regressions (Clifton, 2006) (Fig. 1). Where uppershoreface deposits erosionally overlie shelf sediments duringa forced-regressive phase, without the interposition of lowershoreface deposits, then the SD coincides with the RSME.
3.6. Turbidite shelf entrenchment surface (tSES)
The turbidite shelf entrenchment surface (tSES) is a zone ofsediment bypass across the shelf, consisting of a channelizedfeature carved during transgression by sediment-laden turbiditecurrents (Di Celma et al., 2010). The development of tSESs is asso-ciated to headward erosion of shore-connected shelf channels. ThetSES separates shelf sediments below from turbidites above, and islocally marked by the Glossifungites Ichnofacies (Di Celma et al.,2010).
3.7. Bedset boundaries
A bedset is a meter-scale unit defined as “a relatively conform-able succession of genetically related beds bounded by surfaces oferosion, non-deposition, or their correlative conformities” (VanWagoner et al., 1990). Within shoreface to shelf cycles, bedsetsdefine individual clinoforms that can be recognized along deposi-tional dip if exposures are large enough (Hampson et al., 2008;Enge et al., 2010) (Fig. 23). Hampson et al. (2008) and Sømme

Figure 18. Example of downlap surface (arrows) separating prodelta sediments (below) from river-dominated delta front sands prograding to the left (above) in the FerronSandstone, Utah (from Catuneanu, 2006). Coal-bearing delta plain facies overlie the delta front, and are part of the topset of this highstand delta. The outcrop is about 30 m high.
M. Zecchin, O. Catuneanu / Marine and Petroleum Geology 39 (2013) 1e25 13
et al. (2008) highlighted a relationship between bedsets and indi-vidual beach ridges, with bedset boundaries generated as a result ofminor reorganization of the shoreline in response to variations insediment supply, climate and autocyclic processes. Bedsets may begrouped to form packages characterized by distinctive stackingpatterns, corresponding to beach ridge sets, which in turn maycompose larger units (Hampson et al., 2008).
Bedset boundaries are represented by non-depositional orerosional discontinuities, which are most distinctive within lowershoreface to shelf deposits and usually become cryptic in bothlandward and seaward directions (Hampson, 2000; Sømme et al.,2008) (Figs. 6, 23 and 24). Non-depositional discontinuities are
Figure 19. Dip section of an early Pleistocene shelf to continental succession in the Periadriasurface is cryptic in this case, and is replaced by a deeper water interval characterized by fi
contacts showing an abrupt decrease in thickness and amalgam-ation of storm-generated event beds, and an increase of bio-turbation (Hampson, 2000) (Figs. 6 and 24). In contrast, erosionaldiscontinuities may be marked by gutter casts and Glossifungitesichnofacies, and record an abrupt increase in bed amalgamationand grain size (Hampson, 2000) (Fig. 6). The formation of non-depositional discontinuities is inferred to be related to an abruptdecrease of sediment supply and/or wave energy, whereas thecontrary is expected for erosional discontinuities (Hampson, 2000;Sømme et al., 2008). High-frequency, very low-amplitude relativesea-level changes were also considered in the generation of thesesurfaces (Hampson et al., 2008).
tic Basin, central Italy (modified from Cantalamessa and Di Celma, 2004). The downlapner grain size and higher bioturbation level, referred to as a ‘maximum flooding zone’.

Figure 20. Within-trend forced regressive surface (arrow) at the contact between delta front (foreset) and prodelta (bottomset) facies in a forced regressive river-mouth setting(Panther Tongue, Utah; from Catuneanu, 2006).
M. Zecchin, O. Catuneanu / Marine and Petroleum Geology 39 (2013) 1e2514
The features of non-depositional and erosional discontinuitiesresemble those of FSs and RSMEs, respectively. However, bedsetboundaries tend to have a more limited lateral extent, and theirorigin is not tied to shoreline shifts (Fig. 23). To avoid nomencla-tural confusion between bedset boundaries and high-frequency FSsor RSMEs, it is suggested the use of the former if their origin is notlinked to transgressions and regressions.
Therefore, the use of bedsets is recommended for small (typi-cally meter-scale) subdivisions of the stratigraphic record that formindependently of shoreline shifts, as a result of minor variations insediment supply and/or wave height, and which are recognizableonly for relatively short distances along depositional dip and strike.
4. Stratigraphic units
4.1. Systems tracts
Systems tracts are stratigraphic units bounded by sequencestratigraphic surfaces, forming the subdivisions of sequences(Brown and Fisher, 1977; Catuneanu et al., 2009) (Fig. 1). In shelfsettings, systems tracts are directly associated with particular typesof shoreline trajectory, including transgression, normal regression(lowstand or highstand) and forced regression (Catuneanu et al.,2009, 2011) (Fig. 25). The shoreline trajectory was defined as the‘cross-sectional shoreline migration path along depositional dip’(Helland-Hansen and Gjelberg, 1994), and is typically controlled bythe interplay of relative sea-level change and sediment supply.Assuming 0� e seaward, 90� e upward, 180� e landward, and �90�
e downward, transgressions are typified by trajectories between90� and 180�, most commonly close to 180�; normal regressionsassume trajectories between 0� and 90�, most commonly close to0�; and forced regressions are normally characterized by shorelinetrajectories between 0� and �30� (Helland-Hansen and Martinsen,1996) (Figs. 23 and 25).
4.1.1. Transgressive systems tractsTransgressive systems tracts (TST) are bounded at the base by
theMRS or the RS and at the top by theMFS (Figs. 1 and 2). They arecharacterized by a retrogradational architecture resulting fromrates of accommodation creation that outpace those of sedimentsupply at the shoreline, typically accompanied by a deepening-upward trend in shallow-marine settings (Posamentier and Allen,1999; Catuneanu, 2002, 2006). The nomenclature of the TST isnon-controversial, and common among all sequence stratigraphic
approaches. The revised Exxon depositional sequence model refersto the TST as a retrogradational succession set (Neal and Abreu,2009; Abreu et al., 2010). Transgressive systems tracts mayinclude various continental, back-barrier, shoreface/shelf, anddeep-marine deposits (Posamentier and Allen, 1999; Catuneanu,2006), as well as OSBs, BSBs or other condensed deposits (Figs. 1,11 and 12). As the MFS typically lies within condensed sections(Figs. 11 and 12), such condensed deposits are commonly parttransgressive and part highstand normal regressive (Fig. 1).
In shallow-water shelf settings, the relative thickness of trans-gressive deposits with respect to that of the entire sequence mayvary considerably due to several factors, which include: accom-modation to supply ratio, amplitude and shape of the relative sea-level curve, position in the shorefaceeshelf system, local physiog-raphy, shoreline trajectory, climate, and ratio between siliciclasticinput and carbonate production (Zecchin, 2007). Locally thickertransgressive deposits may be related to the migration of trans-gressive shelf ridges or shoals (Snedden and Dalrymple, 1999;Suter, 2006). A review of transgressive deposits and their classifi-cation was provided by Cattaneo and Steel (2003).
4.1.2. Normal regressive systems tracts: lowstand and highstandNormal regressive systems tracts may be positioned between
transgressive (below) and forced regressive (above) strata (i.e., thehighstand systems tract: HST), or between forced regressive(below) and transgressive (above) strata (i.e., the lowstand systemstract: LST) (Fig. 1). In other cases, normal regressive deposits mayalternate either with transgressive strata, in which case they aredesignated as HST, or with forced regressive strata, in which casethey are designated as LST (Fig. 26). The nomenclature of thelowstand and highstand systems tracts was subject to debateamong the various sequence-stratigraphic schools (see Catuneanu,2006; Catuneanu et al., 2009, 2011; for a full discussion). Therevised Exxon depositional sequence model refers to the LST asa progradational to aggradational succession set, and to the HST, asdefined in this paper, as an aggradational to progradationalsuccession set (Neal and Abreu, 2009; Abreu et al., 2010). Normalregressive systems tracts may be bounded by various sequencestratigraphic surfaces depending on their position relative to othersystems tracts within a sequence. Lowstand systems tracts arebounded by the SU and its CC at the base, and by the MRS or the RSat the top (Figs. 1 and 2). Highstand systems tracts are bounded bythe MFS at the base, and by the SU and the BSFR or the RSME at thetop (Figs. 1 and 2).

Figure 21. (A) Within-trend normal regressive surface (arrow) at the contact between delta front (foreset) and delta plain (topset) facies in a normal regressive river-mouth setting(Ferron Sandstone, Utah; from Catuneanu, 2006). (B) Within-trend normal regressive surface (arrow) at the contact between beach (foreset) and alluvial plain (topset) facies ina normal regressive open shoreline setting (Bearpaw to Horseshoe Canyon transition, Alberta; from Catuneanu, 2006).
M. Zecchin, O. Catuneanu / Marine and Petroleum Geology 39 (2013) 1e25 15
Normal regressions are driven by sediment supply, where therates of sediment influx outpace those of accommodation creationat the shoreline. In shallow-water areas adjacent to the shoreline,normal regressions are accompanied by shallowing-upwardbathymetric trends; however, the relationship between normalregression and water shallowing may be offset in the deeperportions of the basin, where subsidence and sedimentation ratesmay differ significantly from those recorded in the shoreline area(Catuneanu, 2006). The stratal architecture of normal regressivedeposits is typically characterized by both progradation andaggradation, allowing the accumulation of sedimentary bodiesfeatured by clinoforms with aggrading topsets (Posamentier andAllen, 1999; Catuneanu, 2002, 2006) (Figs. 1 and 25). However, ifnormal regressive deposits include part of the condensed section
(Figs. 1 and 2), their architecture is not fully progradational, ascondensed sections are not part of the shore-connected clasticwedge (Figs. 11 and 12). In the case of late highstand normalregressions, where the stacking pattern of shore-connectedwedges is dominantly progradational with little or no aggrada-tion, toplap shell beds may concentrate along the top of the HST,even though the mixing of shells with the highstand sedimentmay reduce the appearance of condensation (Kidwell, 1991;Kondo et al., 1998) (Fig. 10). The concentration of shells at thetop and at the base of highstand normal regressive deposits (i.e.,toplap and downlap shell beds, respectively; Fig. 10) is favored byenvironmental conditions related to the submergence of the shelf,a situation that usually does not characterize lowstand normalregressions.

Figure 22. Surf diastem (white line) separating lower shoreface from upper shoreface deposits in the middle Pleistocene Cutro terrace, southern Italy (modified from Zecchin et al.,2011b).
M. Zecchin, O. Catuneanu / Marine and Petroleum Geology 39 (2013) 1e2516
Normal regressive systems tracts commonly include conti-nental, deltaic, shoreface/shelf, shelf margin, and deeper marinesediments (Posamentier and Allen, 1999; Catuneanu, 2006) (Fig. 1).In shoreface to shelf settings, progradation is marked by a transitionfrom prevailing horizontal burrow traces of the Cruziana ichnofa-cies (e.g. Cruziana, Thalassinoides, Chondrites and Planolites ichno-genera), indicating relatively low energy levels, to mostly verticaltraces of the Skolithos ichnofacies (e.g. Skolithos, Ophiomorpha andDiplocraterion ichnogenera) typifying higher energy, middle toupper shoreface deposits (Pemberton et al., 1992; MacEachern andBann, 2008) (Fig. 6). As in the case of the TST, the relative thicknessof normal regressive systems tracts with respect to that of theentire sequence is variable, depending on the interplay among thefactors cited above (Zecchin, 2007).
4.1.3. Falling-stage systems tractThe falling-stage systems tract (FSST) consists of forced
regressive deposits, and is bounded by the BSFR or the RSME at thebase, and by the SU and its CC at the top (Figs. 1 and 2). The top ofthe FSST may also be truncated by younger RSs (Fig. 7). The FSSTforms during relative sea-level fall when the shoreline is forced toregress irrespective of sediment supply (Catuneanu, 2002, 2006)(Fig. 25). With the exception of river-dominated deltas, forcedregressive conditions typically result in the accumulation ofsharp-based shorefaces on top of RSMEs (Fig. 16), and by anincrease of sediment supply to the deep-marine settings (Plint,
Figure 23. Main surfaces and minor discontinuities defining bedsets in the Kenilworth pdominated deltaic system (modified from Hampson, 2000; Helland-Hansen and Hampsonshoreline trajectories within the prograding body.
1988; Hunt and Tucker, 1992; Helland-Hansen and Gjelberg,1994; Plint and Nummedal, 2000). The shelf portion of the FSSTcommonly displays a foreshortening of the prograding clinoformsdue to the progressive decrease in accommodation with time,resulting in thinner deposits in a seaward direction (Posamentierand Allen, 1999) (Fig. 7). Forced regressive deposits are charac-terized by offlap, without topset development, due to the pre-vailing conditions of negative accommodation (Hunt and Tucker,1992; Helland-Hansen and Gjelberg, 1994) (Fig. 1). The develop-ment of condensed shell beds is not favored under conditions ofhigh sediment supply that typically characterize forced regres-sions (Naish and Kamp, 1997). The FSST was subject to nomen-clatural debate among the various sequence-stratigraphic schools(see Catuneanu, 2006; Catuneanu et al., 2009, 2011; for a fulldiscussion). The revised Exxon depositional sequence modelrefers to the FSST as a degradational succession set (Neal andAbreu, 2009; Abreu et al., 2010).
4.1.4. The stacking pattern of systems tracts and exceptions tocommon assumptions
It is generally assumed that systems tracts are stacked ina predictable manner in response of cycles of relative sea-levelchange and sediment supply, that is a repetition of lowstandnormal regressive, transgressive, highstand normal regressive andforced regressive deposits (Posamentier and Allen, 1999;Catuneanu, 2006; Catuneanu et al., 2009) (Fig. 1).
arasequence 4 of the Blackhawk Formation (USA), which is interpreted as a wave-, 2009). Note the changing direction between ascending and descending regressive
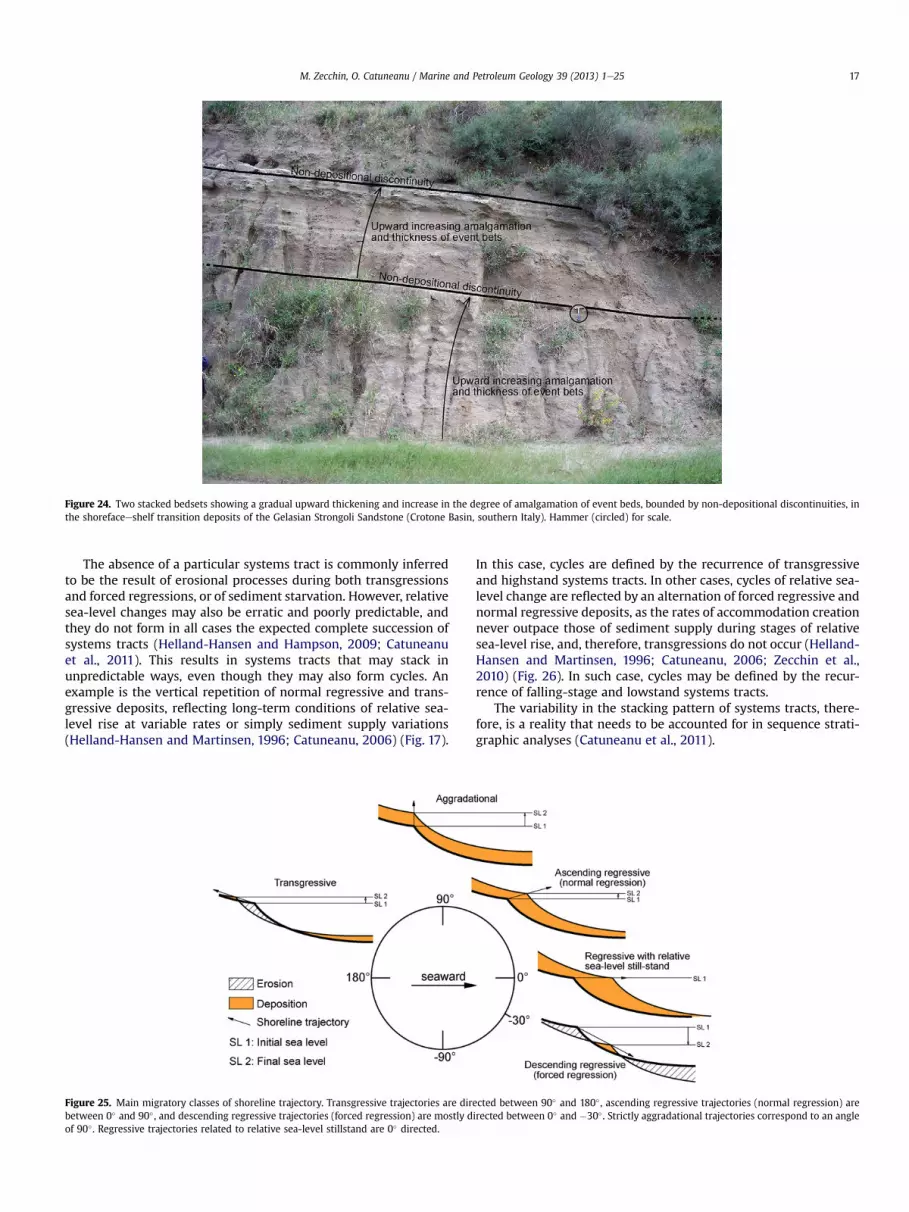
Figure 24. Two stacked bedsets showing a gradual upward thickening and increase in the degree of amalgamation of event beds, bounded by non-depositional discontinuities, inthe shorefaceeshelf transition deposits of the Gelasian Strongoli Sandstone (Crotone Basin, southern Italy). Hammer (circled) for scale.
M. Zecchin, O. Catuneanu / Marine and Petroleum Geology 39 (2013) 1e25 17
The absence of a particular systems tract is commonly inferredto be the result of erosional processes during both transgressionsand forced regressions, or of sediment starvation. However, relativesea-level changes may also be erratic and poorly predictable, andthey do not form in all cases the expected complete succession ofsystems tracts (Helland-Hansen and Hampson, 2009; Catuneanuet al., 2011). This results in systems tracts that may stack inunpredictable ways, even though they may also form cycles. Anexample is the vertical repetition of normal regressive and trans-gressive deposits, reflecting long-term conditions of relative sea-level rise at variable rates or simply sediment supply variations(Helland-Hansen and Martinsen, 1996; Catuneanu, 2006) (Fig. 17).
Figure 25. Main migratory classes of shoreline trajectory. Transgressive trajectories are dirbetween 0� and 90� , and descending regressive trajectories (forced regression) are mostly dof 90� . Regressive trajectories related to relative sea-level stillstand are 0� directed.
In this case, cycles are defined by the recurrence of transgressiveand highstand systems tracts. In other cases, cycles of relative sea-level change are reflected by an alternation of forced regressive andnormal regressive deposits, as the rates of accommodation creationnever outpace those of sediment supply during stages of relativesea-level rise, and, therefore, transgressions do not occur (Helland-Hansen and Martinsen, 1996; Catuneanu, 2006; Zecchin et al.,2010) (Fig. 26). In such case, cycles may be defined by the recur-rence of falling-stage and lowstand systems tracts.
The variability in the stacking pattern of systems tracts, there-fore, is a reality that needs to be accounted for in sequence strati-graphic analyses (Catuneanu et al., 2011).
ected between 90� and 180� , ascending regressive trajectories (normal regression) areirected between 0� and �30� . Strictly aggradational trajectories correspond to an angle

Figure 26. Alternation between prograding wedges with descending (orange arrows) and ascending (yellow arrows) shoreline trajectories in the late Pleistocene Le Castellashallow-marine succession, southern Italy (modified from Zecchin et al., 2010). Arrows indicate the trajectory of the rollover point, which reflects alternating forced and lowstandnormal regressions.
M. Zecchin, O. Catuneanu / Marine and Petroleum Geology 39 (2013) 1e2518
4.2. Architectural units
Architectural units are sediment bodies bounded by the twonearest non-cryptic stratigraphic contacts in a sedimentarysuccession, whether sequence stratigraphic surfaces or faciescontacts (Sections 2 and 3). Architectural units are typically smallerthan systems tracts. They commonly form the depositional buildingblocks of systems tracts, although some may also cross systemstract boundaries. For example, a condensed section bounded at thebase by the LFS and at the top by the DLS is an architectural unitwhich may form in part during shoreline transgression and in partduring highstand normal regression (Figs. 1, 11A,B and 12). Mostother architectural units, however, are part of, and form entirelyduring the deposition of a systems tract. For example, the shallow-water facies that prograde and aggrade during a highstand normalregression form an architectural unit that is bounded at the top bythe SU and the BSFR or the RSME, and at the base by the DLS (Fig. 1).
The shoreline-detached architectural units (e.g., condensedsections) are typically independent of shoreline trajectories, andmay include cryptic systems tract boundaries within (e.g., the MFS,Figs. 1, 11A,B and 12). Such architectural units are commonlybounded both at the top and at the base by facies contacts (e.g., theLFS and the DLS). The shoreline-attached architectural units arelinked to shoreline trajectories, and therefore to specific systemstracts; they typically do not cross systems tracts boundaries, andmay be bounded by a combination of sequence stratigraphicsurfaces and facies contacts (Fig. 1). Architectural units are partic-ularly useful in outcrop and core studies, and help define and refinethe internal architecture of systems tracts. The identification ofarchitectural units in the field relies on the integration of bothfacies analysis and sequence stratigraphic methodologies.
4.3. Trajectory analysis
Trajectory analysis represents an alternative way of studying thestratal architecture of sedimentary successions. Transgressive,normal regressive and forced regressive deposits correspond tomigratory classes of transgressive, ascending regressive anddescending regressive trajectories, respectively (Løseth andHelland-Hansen, 2001; Helland-Hansen and Hampson, 2009)(Fig. 25). Therefore, the identification of systems tracts can bemadeby means of both qualitative analysis of stratal stacking patterns
and quantitative trajectory analysis (e.g., Bullimore and Helland-Hansen, 2009; Hampson et al., 2009).
Trajectory analysis is effective in the recognition of bothcyclical and non-cyclical styles of stacking of systems tracts, as itdoes not assume a predictable pattern in the occurrence ofsystems tracts but it rather considers trajectory classes thatpotentially may be stacked in any order (Bullimore and Helland-Hansen, 2009; Helland-Hansen and Hampson, 2009). The deter-mination of the long-term shoreline trajectory is also useful toevaluate the degree of preservation of individual cycles, as well astheir overall stacking pattern (Zecchin, 2007; Helland-Hansen andHampson, 2009).
Another trajectory concept is the shelf-edge trajectory, definedas the ‘pathway taken by the shelf edge during the development ofa series of accreting clinoforms’ (Johannessen and Steel, 2005). Theshelf-edge trajectory is normally fixed or basinward directed (rarelylandward directed), and is a long-term response to changes ofrelative sea level and sediment supply an order of magnitude largerthan those controlling shoreline trajectories (Helland-Hansen andHampson, 2009).
5. The classification of stratigraphic cycles
The description and classification of stratigraphic cyclicity atoutcrop scale can be applied following various approaches, assummarized below (Fig. 27).
5.1. Allostratigraphic units and unconformity-boundedstratigraphic units
Allostratigraphic units are defined on the basis of their bound-ing discontinuity surfaces (North American Commission onStratigraphic Nomenclature (NACSN), 1983, 2005), whereas theunconformity-bounded stratigraphic units (UBSU) are based onwell recognizable and mappable unconformities (InternationalSubcommission on Stratigraphic Classification (ISSC), 1987;Salvador, 1994) (Fig. 27). The definition of allostratigraphic unitsand UBSUs does not consider the genetic relationships amongstrata nor the origin of bounding surfaces in response to relativesea-level changes. Despite this, allostratigraphy was successfullyapplied in various contexts (e.g., Bhattacharya and Walker, 1991;Martinsen et al., 1993; Varban and Plint, 2008), and its merit

Figure 27. Summary of stratigraphic units commonly used to describe successions inoutcrop and core, and their bounding surfaces. Any type of sequence (i.e., depositional,genetic, TeR) qualifies as a generic ‘stratigraphic sequence’ defined by the recurrenceof sequence stratigraphic surfaces through geologic time (Catuneanu et al., 2009,2011). Abbreviations: BSFR e basal surface of forced regression; CC e correlativeconformity; FS e flooding surface; MFS e maximum flooding surface; MRS e
maximum regressive surface; RS e ravinement surface; SU e subaerial unconformity.
M. Zecchin, O. Catuneanu / Marine and Petroleum Geology 39 (2013) 1e25 19
consists in the independence from models, resulting in long-livedallostratigraphic units. These characteristics allowed the inclusionof allostratigraphy within a formal scheme (NACSN, 1983, 2005),and the same consideration can bemade for the UBSUs (ISSC,1987).
Allostratigraphic units are hierarchically organized into allo-formations, which may form allogroups and may consist ofallomembers (Fig. 28). The choice of discontinuity surfacesas boundaries of allostratigraphic units may be in partinterpretation-driven, as in the case of flooding surfacesbounding deltaic lobes designated as alloformations or allo-members (e.g. Bhattacharya, 1993) (Fig. 28). UBSUs have beentermed “synthems” by the ISSC (the fundamental unit), whichmay be composed of subsynthems and may form super-synthems. However, this term has not gained popularity withinthe stratigraphic community. More informal designations such as“sequence” or “stratal unit” are widely used instead (Mitchum,1977; Zecchin et al., 2004; Longhitano et al., 2010).
While allostratigraphic units and UBSUs remain practical toolsfor mapping and correlation, improving upon the lithostratigraphic
Figure 28. The allomembers and smaller scale deltaic units (parasequences) of the upperboundaries consist of interpreted ‘major’ flooding surfaces, in contrast with the ‘minor’significance are indicated.
methodology, they are limited by the lack of process-based insightregarding the origin of the strata under analysis. As such, theconcept of systems tract does not have an equivalent in allos-tratigraphy or the UBSU methodology, as the definition of systemstracts is unique to sequence stratigraphy and require a full genetic(i.e., sequence stratigraphic) interpretation.
5.2. Parasequences
A parasequence was defined as ‘a relatively conformablesuccession of genetically related beds or bedsets bounded bymarine flooding surfaces and their correlative surfaces... Para-sequences are progradational and therefore the beds within par-asequences shoal upward’ (Van Wagoner et al., 1988, 1990)(Fig. 29). Parasequences may be stacked to form progradational,aggradational and retrogradational parasequence sets, whichtypify systems tracts composing a depositional sequence (VanWagoner et al., 1990). Both autocyclic and allocyclic processesmay be involved in the formation of parasequences (Catuneanuet al., 2009).
Although the parasequence concept has beenwidely used, someauthors highlighted its significant limitations and the confusiongenerated by its use and abuse, suggesting its abandonment(Walker, 1992; Posamentier and Allen, 1999; Catuneanu, 2006;Zecchin, 2010). Limitations of the parasequence concept includethe equivocal meaning of their bounding (“flooding”) surfaces(Section 3.1; Fig. 17); its architecture that considers onlyshallowing-upward trends without significant transgressivedeposits (Fig. 29); its mappability only in coastal to shallow-waterareas (in contrast with the concepts of sequence and systems tract);and its potential equivalence with high-frequency sequences of thesame hierarchical rank (Arnott, 1995; Posamentier and Allen, 1999;Catuneanu, 2006; Zecchin, 2010) (Fig. 29). Further confusion wasgenerated by the usage of the term parasequence only for cyclesdeveloped during relative sea-level rise, as well as for cycles thatmay be classified as small-scale or high-frequency sequencescomposed of systems tracts (Zecchin, 2010) (Fig. 29). Furthermore,even though the parasequence concept was introduced specificallyfor coastal to shallow-water settings, some authors expanded theusage of this term to alluvial and deep-water settings as well, todefine anymeter-scale cycles irrespective of origin (e.g., Spence andTucker, 2007; Tucker and Garland, 2010). Following the original
Cretaceous Dunvegan Alloformation (modified from Bhattacharya, 1993). Allomemberflooding surfaces bounding parasequences. Other surfaces of sequence stratigraphic

Figure 29. Cross-section showing meter-scale to decameter-scale units composing the Kenilworth Member of the Blackhawk Formation, USA (modified from Pattison, 1995). Thesuccession was originally described in terms of parasequences bounded by flooding surfaces, here considered as MRSs merged with MFSs. Note that the uppermost two cyclescontain RSMEs indicating forced regression, and therefore they should be classified as high-frequency sequences. Abbreviations: MFS e maximum flooding surface; MRS e
maximum regressive surface; RS e ravinement surface; RSME e regressive surface of marine erosion; SU e subaerial unconformity.
M. Zecchin, O. Catuneanu / Marine and Petroleum Geology 39 (2013) 1e2520
definition of the parasequence concept, it has been recognized thatthe architecture of cycles that develop at parasequence scale is farmore complex than originally envisaged, including any relativecontributions from transgressive or regressive deposits, andinvolving a variety of types of stratigraphic contacts as boundingsurfaces (e.g. Swift et al., 1991; Kidwell, 1997; Naish and Kamp,1997; Saul et al., 1999; Di Celma et al., 2005; Zecchin, 2005, 2007;Di Celma and Cantalamessa, 2007) (Figs. 17 and 30).
Some authors, recognizing the problems inherent in theapplication of the parasequence concept, proposed its redefini-tion. For example, from the study of peritidal carbonate cycles,Spence and Tucker (2007) proposed to extend the term para-sequence to all meter-scale cycles regardless if they are boundedor not by flooding surfaces and independent of their architecture.Apart from the ambiguity caused by the fact that some para-sequences defined in this way match also the criteria for thedefinition of high-frequency sequences, a parasequence conceptso different from the original meaning would rather justifya different terminology to avoid confusion. As concluded in theISSC report on sequence stratigraphy (Catuneanu et al., 2011),“following the principle that a sequence stratigraphic unit isdefined by specific bounding surfaces, most practitioners favorrestricting the concept of parasequence to a unit bounded bymarine flooding surfaces, in agreement with the original defini-tion of Van Wagoner et al. (1988, 1990)” (Fig. 27).
Figure 30. The variable symmetry found in transgressiveeregressive cycles, following Zecgressive deposits, whereas TeR cycles show a symmetric architecture. Abbreviations: DLSsurface; RS e ravinement surface; R e regressive; T e transgressive.
Referring to the classic shallowing-upward trend of a para-sequence, Hampson et al. (2008) proposed an additional geomor-phic criterion, that is the recognition of a set of progradationalclinoforms, to distinguish parasequences from minor and discon-tinuous stratigraphic subdivisions such as bedsets. Detailed infor-mation on the internal architecture of parasequences has beenprovided recently by Hampson (2000), Charvin et al. (2010), Engeet al. (2010) and Hampson et al. (2011), based on the study ofUpper Cretaceous successions in central Utah.
5.3. Sequences
Sequence stratigraphic models have been summarized ina number of syntheses (e.g., Posamentier and Allen, 1999;Catuneanu, 2002, 2006; Catuneanu et al., 2009, 2011). Catuneanu(2006) stressed the importance of being flexible and adopting theapproach that is most suitable to the data available. Depending onapproach, different types of sequence have been defined, eachbounded by different surfaces or combinations of surfaces(Catuneanu et al., 2011) (Fig. 27). The nomenclature of systemstracts may also vary with the model, although a standard termi-nology has now been adopted by the ISSC (Section 4.1).
The hierarchical classification of sequences based on the relativestratigraphic significance of their bounding surfaces, as opposed toa system that starts from parasequences as the basic building
chin (2007). R cycles and T cycles are dominated respectively by regressive and trans-e downlap surface; MFS e maximum flooding surface; MRS e maximum regressive

M. Zecchin, O. Catuneanu / Marine and Petroleum Geology 39 (2013) 1e25 21
blocks of sequences, was preferred by some authors due to thereasons discussed by Catuneanu (2006) and Zecchin (2007, 2010). Asimilar approach was already adopted by Mutti et al. (1994), whorecognized in the south-central Pyrenees a hierarchy consisting ofelementary (meters to tens of meters) depositional sequencesgrouped into small-scale composite depositional sequences, whichin turn compose large-scale composite depositional sequences.Another hierarchical approach was proposed by Neal and Abreu(2009) using the method of the ‘accommodation succession’,which was defined as ‘a regional sedimentary package resultingfrom changes in rates of shelfal accommodation creation anddepositional fill in response to changes in base level’. The basicmotif of the accommodation succession consists of lowstand pro-gradation to aggradation, transgressive retrogradation, and high-stand aggradation to progradation, degradation and/or basinwardshift, which define depositional sequences and larger scalesequence sets and composite sequences (Neal and Abreu, 2009).
The designation of depositional sequences assumes that theobserved cyclicity is the product of changes in relative sea level,with stages of rise and fall. In contrast, the genetic stratigraphicsequences of Galloway (1989) and the transgressiveeregressivesequences of Johnson and Murphy (1984) may correspond tocycles developed during continuous relative sea-level rise anddriven by sediment supply variations or changes in the rate ofaccommodation creation (Catuneanu et al., 2009).
As noted above, the relationship between stratigraphic cyclicityand relative sea-level changes is not evident in all cases, sincerelative sea-level changes may be irregular, and sediment supplyvariations may also contribute to the formation of the observedcyclicity. This aspect was updated by Catuneanu et al. (2009, 2011)introducing the ‘stratigraphic sequence’ concept (Fig. 27), whichunifies all types of sequences and considers sediment supplychanges, together with accommodation, as possible drivingmechanisms on sequence development. According to the reviseddefinition, a sequence corresponds to a cycle of change in accom-modation or sediment supply defined by the recurrence of thesame types of sequence stratigraphic surface through geologic time(Catuneanu et al., 2009, 2010, 2011) (Fig. 27).
5.4. Generic units
Practitioners operating with sparse field or core data that mayprevent or make difficult the recognition of controlling mecha-nisms, commonly refer to generic, descriptive cycle concepts, assuggested by Schlager (1991), Walker (1992) and Zecchin (2007,2010). Such generic cycles are independent of temporal scales,genetic mechanisms (allocyclic or autocyclic) and stratal stackingpatterns; their definition and internal subdivision can be made bymeans of mapping surfaces with physical expression in outcrop orcore. In shallow-marine shelf settings, all surfaces described inSections 2 and 3 may be useful to define generic cycles and theirinternal components, although the mappability (and hence theusefulness) of each surface may vary with the case study.
Historically, the term ‘cyclothem’ was used to define genericcycles in the upper Paleozoic successions of North America (Weller,1930; Wanless and Shepard, 1936); more recently, this term wasalso adopted to describe Plio-Pleistocene shelf cycles (Abbott andCarter, 1994). Zecchin (2005, 2007) proposed the concept of‘small-scale cycle’ to describe cyclicity in shoreface to shelfsuccessions at outcrop (meters to tens of meters) scale (Fig. 27).Small-scale cycles may be bounded by any recurring stratigraphicsurface in a succession (usually RSs or MRSs, Fig. 27), and typicallythe most prominent surfaces are selected as cycle boundaries. Therole of condensed shell beds is considered critical to recognizeinternal surfaces, according to the conceptual framework
developed for high-resolution stratigraphic analysis by Kidwell(1991), Abbott and Carter (1994), Naish and Kamp (1997), Carteret al. (1998) and Kondo et al. (1998). The small-scale cycleconcept is more comprehensive than the concept of parasequence,as it is not limited to shallowing-upward trends and to the occur-rence of flooding surfaces (Fig. 30).
Zecchin (2007) proposed a classification of small-scale cyclesbased on the relative development of retrograding and progradingunits: R cycles (dominated by regressive deposits), T cycles (domi-nated by transgressive deposits) and TeR cycles (showingtransgressive and regressive deposits of similar thickness)(Fig. 30). Following this descriptive classification, the para-sequence architecture represents only one case among the possiblearchitectures that can be found in the field (Fig. 30). The relativethickness of transgressive and regressive deposits within a regionalcontext may provide very useful information on depositionalconditions and forcing mechanisms (e.g., Catuneanu et al., 1997,2000; Zecchin, 2007).
6. Discussion
6.1. High-frequency sequences
The different approaches to the classification of high-frequency cycles are to some extent the result of conceptualdevelopments without formal guidance from the internationalstratigraphic commissions. The concepts of parasequence, small-scale cycle and high-frequency sequence may all be applied tosimilar scales of observation, often interchangeably. This gener-ates methodological confusion, and adds redundancy to thenomenclature of cycles at sub-seismic scale. The need to employparasequences and small-scale cycles in high-resolution studiesmay be replaced by the usage of high-frequency sequences. Thisaspect is discussed in more detail in Part II of this work(Catuneanu and Zecchin, 2012).
The concept of parasequence has divided the stratigraphiccommunity, with arguments being made both to retain and toabandon this type of unit (Walker, 1992; Catuneanu, 2006; Spenceand Tucker, 2007; Zecchin, 2010). The application of the sequenceconcept to the classification of high-frequency cycles related totransgressions and regressions in shallow-water settings makes theuse of the parasequence concept unnecessary. Since floodingsurfaces are always linked to episodes of transgression, every timea flooding surface occurs in the rock record, a maximum floodingsurface can be defined as well at the same scale of observation(Fig. 17). The opposite is not true, as not every transgression leadingto the formation of a maximum flooding surface is prone togenerate an abrupt lithological contact that can define a floodingsurface (Fig. 30). Therefore, maximum flooding surfaces (i.e.,genetic stratigraphic sequence boundaries) are more reliable forcorrelation than flooding surfaces (i.e., parasequence boundaries).Beyond the issue of mappability in coastal to shallow-watersettings, maximum flooding surfaces are much easier to extendinto the coeval fluvial and deep-water settings (Posamentier andAllen, 1999; Catuneanu, 2006), making the high-frequencysequence a superior type of unit for regional correlation.
An example illustrating the practicality of using the strati-graphic sequence in field studies, rather than the parasequence, isthe classification of glacio-eustatic cycles that form under Green-house and Icehouse climate regimes. Small-scale cycles developedduring Greenhouse periods were commonly referred to as para-sequences (e.g. Van Wagoner et al., 1990; Pattison, 1995) (Fig. 29),whereas those characterizing Icehouse periods were consideredhigh-frequency depositional sequences (e.g. Kidwell, 1997; Naishand Kamp, 1997), despite the same driving mechanism being
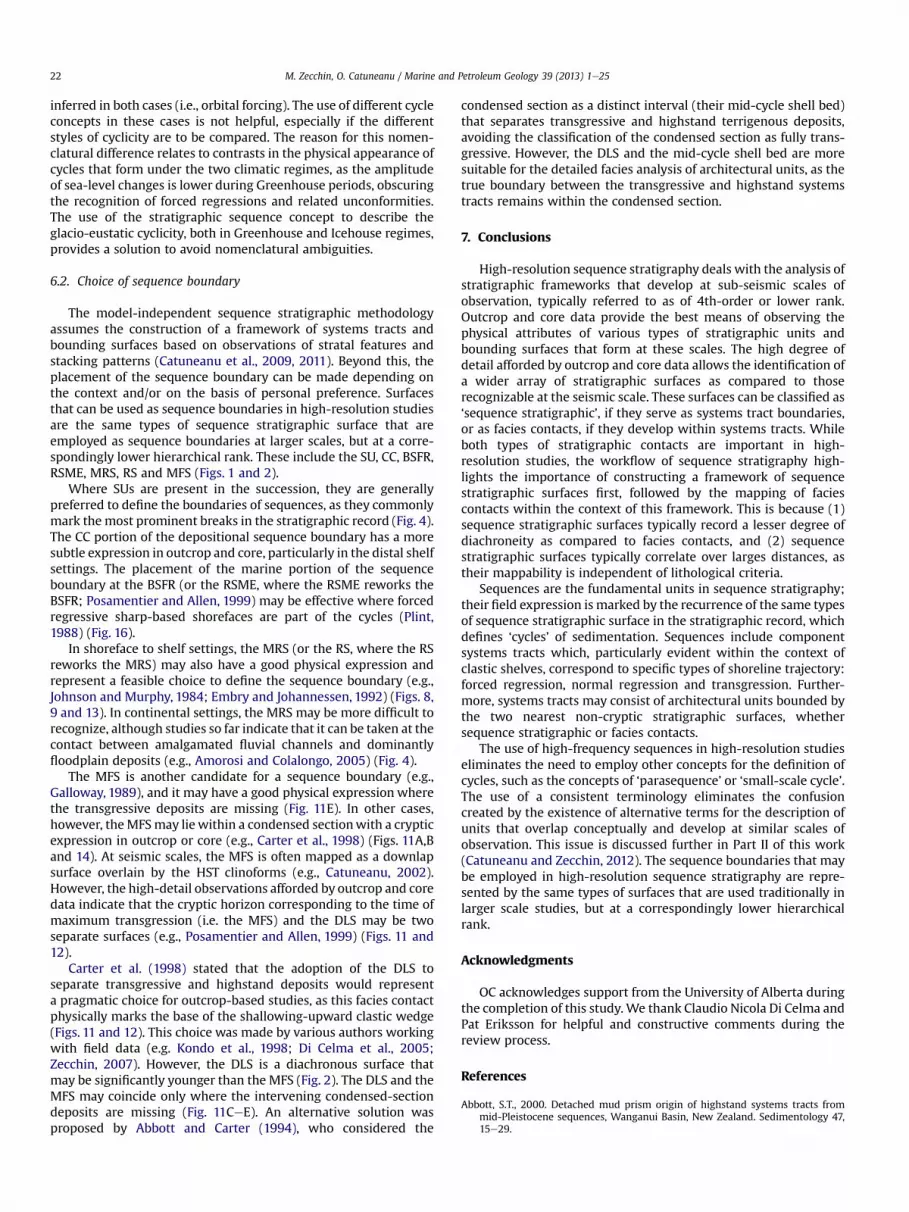
M. Zecchin, O. Catuneanu / Marine and Petroleum Geology 39 (2013) 1e2522
inferred in both cases (i.e., orbital forcing). The use of different cycleconcepts in these cases is not helpful, especially if the differentstyles of cyclicity are to be compared. The reason for this nomen-clatural difference relates to contrasts in the physical appearance ofcycles that form under the two climatic regimes, as the amplitudeof sea-level changes is lower during Greenhouse periods, obscuringthe recognition of forced regressions and related unconformities.The use of the stratigraphic sequence concept to describe theglacio-eustatic cyclicity, both in Greenhouse and Icehouse regimes,provides a solution to avoid nomenclatural ambiguities.
6.2. Choice of sequence boundary
The model-independent sequence stratigraphic methodologyassumes the construction of a framework of systems tracts andbounding surfaces based on observations of stratal features andstacking patterns (Catuneanu et al., 2009, 2011). Beyond this, theplacement of the sequence boundary can be made depending onthe context and/or on the basis of personal preference. Surfacesthat can be used as sequence boundaries in high-resolution studiesare the same types of sequence stratigraphic surface that areemployed as sequence boundaries at larger scales, but at a corre-spondingly lower hierarchical rank. These include the SU, CC, BSFR,RSME, MRS, RS and MFS (Figs. 1 and 2).
Where SUs are present in the succession, they are generallypreferred to define the boundaries of sequences, as they commonlymark themost prominent breaks in the stratigraphic record (Fig. 4).The CC portion of the depositional sequence boundary has a moresubtle expression in outcrop and core, particularly in the distal shelfsettings. The placement of the marine portion of the sequenceboundary at the BSFR (or the RSME, where the RSME reworks theBSFR; Posamentier and Allen, 1999) may be effective where forcedregressive sharp-based shorefaces are part of the cycles (Plint,1988) (Fig. 16).
In shoreface to shelf settings, the MRS (or the RS, where the RSreworks the MRS) may also have a good physical expression andrepresent a feasible choice to define the sequence boundary (e.g.,Johnson and Murphy, 1984; Embry and Johannessen, 1992) (Figs. 8,9 and 13). In continental settings, the MRS may be more difficult torecognize, although studies so far indicate that it can be taken at thecontact between amalgamated fluvial channels and dominantlyfloodplain deposits (e.g., Amorosi and Colalongo, 2005) (Fig. 4).
The MFS is another candidate for a sequence boundary (e.g.,Galloway, 1989), and it may have a good physical expression wherethe transgressive deposits are missing (Fig. 11E). In other cases,however, theMFSmay lie within a condensed sectionwith a crypticexpression in outcrop or core (e.g., Carter et al., 1998) (Figs. 11A,Band 14). At seismic scales, the MFS is often mapped as a downlapsurface overlain by the HST clinoforms (e.g., Catuneanu, 2002).However, the high-detail observations afforded by outcrop and coredata indicate that the cryptic horizon corresponding to the time ofmaximum transgression (i.e. the MFS) and the DLS may be twoseparate surfaces (e.g., Posamentier and Allen, 1999) (Figs. 11 and12).
Carter et al. (1998) stated that the adoption of the DLS toseparate transgressive and highstand deposits would representa pragmatic choice for outcrop-based studies, as this facies contactphysically marks the base of the shallowing-upward clastic wedge(Figs. 11 and 12). This choice was made by various authors workingwith field data (e.g. Kondo et al., 1998; Di Celma et al., 2005;Zecchin, 2007). However, the DLS is a diachronous surface thatmay be significantly younger than the MFS (Fig. 2). The DLS and theMFS may coincide only where the intervening condensed-sectiondeposits are missing (Fig. 11CeE). An alternative solution wasproposed by Abbott and Carter (1994), who considered the
condensed section as a distinct interval (their mid-cycle shell bed)that separates transgressive and highstand terrigenous deposits,avoiding the classification of the condensed section as fully trans-gressive. However, the DLS and the mid-cycle shell bed are moresuitable for the detailed facies analysis of architectural units, as thetrue boundary between the transgressive and highstand systemstracts remains within the condensed section.
7. Conclusions
High-resolution sequence stratigraphy deals with the analysis ofstratigraphic frameworks that develop at sub-seismic scales ofobservation, typically referred to as of 4th-order or lower rank.Outcrop and core data provide the best means of observing thephysical attributes of various types of stratigraphic units andbounding surfaces that form at these scales. The high degree ofdetail afforded by outcrop and core data allows the identification ofa wider array of stratigraphic surfaces as compared to thoserecognizable at the seismic scale. These surfaces can be classified as‘sequence stratigraphic’, if they serve as systems tract boundaries,or as facies contacts, if they develop within systems tracts. Whileboth types of stratigraphic contacts are important in high-resolution studies, the workflow of sequence stratigraphy high-lights the importance of constructing a framework of sequencestratigraphic surfaces first, followed by the mapping of faciescontacts within the context of this framework. This is because (1)sequence stratigraphic surfaces typically record a lesser degree ofdiachroneity as compared to facies contacts, and (2) sequencestratigraphic surfaces typically correlate over larges distances, astheir mappability is independent of lithological criteria.
Sequences are the fundamental units in sequence stratigraphy;their field expression is marked by the recurrence of the same typesof sequence stratigraphic surface in the stratigraphic record, whichdefines ‘cycles’ of sedimentation. Sequences include componentsystems tracts which, particularly evident within the context ofclastic shelves, correspond to specific types of shoreline trajectory:forced regression, normal regression and transgression. Further-more, systems tracts may consist of architectural units bounded bythe two nearest non-cryptic stratigraphic surfaces, whethersequence stratigraphic or facies contacts.
The use of high-frequency sequences in high-resolution studieseliminates the need to employ other concepts for the definition ofcycles, such as the concepts of ‘parasequence’ or ‘small-scale cycle’.The use of a consistent terminology eliminates the confusioncreated by the existence of alternative terms for the description ofunits that overlap conceptually and develop at similar scales ofobservation. This issue is discussed further in Part II of this work(Catuneanu and Zecchin, 2012). The sequence boundaries that maybe employed in high-resolution sequence stratigraphy are repre-sented by the same types of surfaces that are used traditionally inlarger scale studies, but at a correspondingly lower hierarchicalrank.
Acknowledgments
OC acknowledges support from the University of Alberta duringthe completion of this study.We thank Claudio Nicola Di Celma andPat Eriksson for helpful and constructive comments during thereview process.
References
Abbott, S.T., 2000. Detached mud prism origin of highstand systems tracts frommid-Pleistocene sequences, Wanganui Basin, New Zealand. Sedimentology 47,15e29.

M. Zecchin, O. Catuneanu / Marine and Petroleum Geology 39 (2013) 1e25 23
Abbott, S.T., Carter, R.M., 1994. The sequence architecture of mid-Pleistocene (c.1.1.-0.4 Ma) cyclothems from New Zealand: facies development during a period oforbital control on sea-level cyclicity. In: De Boer, P.L., Smith, D.G. (Eds.), OrbitalForcing and Cyclic Sequences. International Association of SedimentologistsSpecial Publication, vol. 19, pp. 367e394.
Abreu, V., Neal, J.E., Bohacs, K.M., Kalbas, J.L., 2010. Sequence stratigraphy of silici-clastic systems e the ExxonMobil methodology. SEPM Concepts in Sedimen-tology and Paleontology 9, 226.
Aitken, J.F., Flint, S.S., 1996. Variable expressions of interfluvial sequence boundariesin the Breathitt Group (Pennsylvanian), eastern Kentucky, USA. In: Howell, J.A.,Aitken, J.F. (Eds.), High Resolution Sequence Stratigraphy: Innovations andApplications. Geological Society Special Publication, vol. 104, pp. 193e206.
Allen, J.L., Johnson, C.L., 2011. Architecture and formation of transgressiveeregressive cycles in marginal marine strata of the John Henry Member,Straight Cliffs formation, upper Cretaceous of Southern Utah, USA. Sedi-mentology 58, 1486e1513.
Allen, G.P., Posamentier, H.W., 1993. Sequence stratigraphy and facies model of anincised valley fill: the Gironde estuary, France. Journal of Sedimentary Petrology63, 378e391.
Amorosi, A., Centineo, M.C., Colalongo, M.L., Fiorini, F., 2005. Millennial-scaledepositional cycles from the Holocene of the Po Plain, Italy. Marine Geology222e223, 7e18.
Amorosi, A., Colalongo, M.L., 2005. The linkage between alluvial and coeval near-shore marine successions: evidence from the Late Quaternary record of the PoRiver Plain, Italy. In: Blum, M.D., Marriott, S.B., Leclair, S.F. (Eds.), Fluvial Sedi-mentology VII. International Association of Sedimentologists Special Publica-tion, vol. 35, pp. 257e275.
Amorosi, A., Colalongo, M.L., Pasini, G., Preti, D., 1999. Sedimentary response to LateQuaternary sea-level changes in the Romagna coastal plain (northern Italy).Sedimentology 46, 99e121.
Arnott, R.W.C., 1995. The parasequence definition e are transgressive depositsinadequately addressed? Journal of Sedimentary Research B65, 1e6.
Baum, G.R., Vail, P.R., 1988. Sequence stratigraphic concepts applied to Paleogeneoutcrops, Gulf and Atlantic Basins. In: Wilgus, C.K., Hastings, B.S.,Kendall, C.G.St.C., Posamentier, H.W., Ross, C.A., Van Wagoner, J.C. (Eds.), SeaLevel Changes: an Integrated Approach. SEPM Special Publication, vol. 42,pp. 39e45.
Bhattacharya, J.P., 1993. The expression and interpretation of marine floodingsurfaces and erosional surfaces in core; examples from the Upper CretaceousDunvegan Formation in the Alberta foreland basin. In: Summerhayes, C.P.,Posamentier, H.W. (Eds.), Sequence Stratigraphy and Facies Associations.International Association of Sedimentologists Special Publication, vol. 18,pp. 125e160.
Bhattacharya, J.P., 2011. Practical problems in the application of the sequencestratigraphic method and key surfaces: integrating observations from ancientfluvial-deltaic wedges with Quaternary and modelling studies. Sedimentology58, 120e169.
Bhattacharya, J.P., Walker, R.G., 1991. Allostratigraphic subdivision of the UpperCretaceous Dunvegan, Shaftesbury, and Kaskapau Formations in the subsur-face of northwestern Alberta. Bulletin of Canadian Petroleum Geologists 39,145e164.
Blum, M.D., 1994. Genesis and architecture of incised valley fill sequences: a LateQuaternary example from the Colorado River, Gulf Coastal Plain of Texas. In:Weimer, P., Posamentier, H.W. (Eds.), Siliciclastic Sequence Stratigraphy: RecentDevelopments and Applications. AAPG Memoir, vol. 58, pp. 259e283.
Bover-Arnal, T., Salas, R., Moreno-Bedmar, J.A., Bitzer, K., 2009. Sequence stratig-raphy and architecture of a late EarlyeMiddle Aptian carbonate platformsuccession from the western Maestrat Basin (Iberian Chain, Spain). SedimentaryGeology 219, 280e301.
Brown Jr., L.F., Fisher, W.L., 1977. Seismic stratigraphic interpretation of depositionalsystems: examples from Brazilian rift and pull apart basins. In: Payton, C.E.(Ed.), Seismic Stratigraphy e Applications to Hydrocarbon Exploration. AAPGMemoir, vol. 26, pp. 213e248.
Bullimore, S.A., Helland-Hansen, W., 2009. Trajectory analysis of the lower BrentGroup (Jurassic), Northern North Sea: contrasting depositional patterns duringthe advance of a major deltaic system. Basin Research 21, 559e572.
Cantalamessa, G., Di Celma, C., 2004. Sequence response to syndepositionalregional uplift: insights from high-resolution sequence stratigraphy of lateEarly Pleistocene strata, Periadriatic Basin, central Italy. Sedimentary Geology164, 283e309.
Cantalamessa, G., Di Celma, C., Ragaini, L., Valleri, G., Landini, W., 2007. Sedimen-tology and high-resolution sequence stratigraphy of the late middle to lateMiocene Angostura Formation (western Borbón Basin, northwestern Ecuador).Journal of the Geological Society, London 164, 653e665.
Carnevale, G., Landini, W., Ragaini, L., Di Celma, C., Cantalamessa, G., 2011. Tapho-nomic and paleoecological analyses (mollusks and fishes) of the Súa MemberCondensed Shellbed, upper Onzole Formation (early Pliocene, Ecuador). Palaios26, 160e172.
Carter, R.M., Fulthorpe, C.S., Naish, T.R., 1998. Sequence concepts at seismic andoutcrop scale: the distinction between physical and conceptual stratigraphicsurfaces. Sedimentary Geology 122, 165e179.
Cattaneo, A., Steel, R.J., 2003. Transgressive deposits: a review of their variability.Earth-Science Reviews 62, 187e228.
Catuneanu, O., 2002. Sequence stratigraphy of clastic systems: concepts, merits, andpitfalls. Journal of African Earth Sciences 35, 1e43.
Catuneanu, O., 2006. Principles of Sequence Stratigraphy. Elsevier, Amsterdam,pp. 386.
Catuneanu, O., Beaumont, C., Waschbusch, P., 1997. Interplay of static loads andsubduction dynamics in foreland basins: reciprocal stratigraphies and the“missing” peripheral bulge. Geology 25, 1087e1090.
Catuneanu, O., Sweet, A.R., Miall, A.D., 2000. Reciprocal stratigraphy of the Cam-panianePaleocene Western Interior of North America. Sedimentary Geology134, 235e255.
Catuneanu, O., Abreu, V., Bhattacharya, J.P., Blum, M.D., Dalrymple, R.W.,Eriksson, P.G., Fielding, C.R., Fisher, W.L., Galloway, W.E., Gibling, M.R.,Giles, K.A., Holbrook, J.M., Jordan, R., Kendall, C.G.St.C., Macurda, B.,Martinsen, O.J., Miall, A.D., Neal, J.E., Nummedal, D., Pomar, L.,Posamentier, H.W., Pratt, B.R., Sarg, J.F., Shanley, K.W., Steel, R.J., Strasser, A.,Tucker, M.E., Winker, C., 2009. Towards the standardization of sequence stra-tigraphy. Earth-Science Reviews 92, 1e33.
Catuneanu, O., Bhattacharya, J.P., Blum, M.D., Dalrymple, R.W., Eriksson, P.G.,Fielding, C.R., Fisher, W.L., Galloway, W.E., Gianolla, P., Gibling, M.R.,Giles, K.A., Holbrook, J.M., Jordan, R., Kendall, C.G.St.C., Macurda, B.,Martinsen, O.J., Miall, A.D., Nummedal, D., Posamentier, H.W., Pratt, B.R.,Shanley, K.W., Steel, R.J., Strasser, A., Tucker, M.E., 2010. Sequence stratig-raphy: common ground after three decades of development. First Break 28,21e34.
Catuneanu, O., Elango, H.N., 2001. Tectonic control on fluvial styles: the BalfourFormation of the Karoo Basin, South Africa. Sedimentary Geology 140, 291e313.
Catuneanu, O., Galloway, W.E., Kendall, C.G.St.C., Miall, A.D., Posamentier, H.W.,Strasser, A., Tucker, M.E., 2011. Sequence stratigraphy: methodology andnomenclature. Newsletters on Stratigraphy 44 (3), 173e245.
Catuneanu, O., Zecchin, M., 2012. High-resolution sequence stratigraphy of clasticshelves II: controls on sequence development. Marine and Petroleum Geology39, 26e38.
Charvin, K., Hampson, G.J., Gallagher, K.L., Labourdette, R., 2010. Intra-parasequencearchitecture of an interpreted asymmetrical wave-dominated delta. Sedimen-tology 57, 760e785.
Clifton, H.E., 2006. A reexamination of facies models for clastic shorelines. In:Posamentier, H.W., Walker, R.G. (Eds.), Facies Models Revisited. SEPM SpecialPublication, vol. 84, pp. 293e337.
Demarest, J.M., Kraft, J.C., 1987. Stratigraphic record of Quaternary sea levels:implications for more ancient strata. In: Nummedal, D., Pilkey, O.H.,Howard, J.D. (Eds.), Sea-level Fluctuation and Coastal Evolution. SEPM SpecialPublication, vol. 41, pp. 223e239.
Di Celma, C., Cantalamessa, G., 2007. Sedimentology and high-frequency sequencestratigraphy of a forearc extensional basin: the Miocene Caleta HerraduraFormation, Mejillones Peninsula, northern Chile. Sedimentary Geology 198,29e52.
Di Celma, C., Cantalamessa, G., Landini, W., Ragaini, L., 2010. Stratigraphic evolutionfrom shoreface to shelf-indenting channel depositional systems during trans-gression: insights from the lower Pliocene Súa Member of the basal UpperOnzole Formation, Borbón Basin, northwest Ecuador. Sedimentary Geology 223,162e179.
Di Celma, C., Ragaini, L., Cantalamessa, G., Curzio, P., 2002. Shell concentrations astools in characterizing sedimentary dynamics at sequence-bounding uncon-formities: examples from the lower unit of the Canoa Formation (Late Pliocene,Ecuador). Geobios 35 (Suppl. 1), 72e85.
Di Celma, C., Ragaini, L., Cantalamessa, G., Landini, W., 2005. Basin physiographyand tectonic influence on the sequence architecture and stacking pattern:Pleistocene succession of the Canoa Basin (central Ecuador). Geological Societyof America Bulletin 117, 1226e1241.
Embry, A.F., Johannessen, E.P., 1992. TeR sequence stratigraphy, facies analysis andreservoir distribution in the uppermost TriassiceLower Jurassic succession,western Sverdrup Basin, Arctic Canada. In: Vorren, T.O., Bergsager, E., Dahl-Stamnes, O.A., Holter, E., Johansen, B., Lie, E., Lund, T.B. (Eds.), Arctic Geologyand Petroleum Potential. Norwegian Petroleum Society (NPF) Special Publica-tion, vol. 2, pp. 121e146.
Enge, H.D., Howell, J.A., Buckley, S.J., 2010. Quantifying clinothem geometry ina forced-regressive river-dominated delta, Panther Tongue Member, Utah, USA.Sedimentology 57, 1750e1770.
Galloway, W.E., 1989. Genetic stratigraphic sequences in basin analysis I: architec-ture and genesis of flooding-surface bounded depositional units. AAPG Bulletin73, 125e142.
Goff, J.A., Austin Jr., J.A., Gulick, S., Nordfjord, S., Christensen, B., Sommerfield, C.,Olson, H., Alexander, C., 2005. Recent and modern marine erosion on the NewJersey outer shelf. Marine Geology 216, 275e296.
Hampson, G.J., 2000. Discontinuity surfaces, clinoforms, and facies architecture ina wave-dominated, shorefaceeshelf parasequence. Journal of SedimentaryResearch 70, 325e340.
Hampson, G.J., Gani, M.R., Sharman, K.E., Irfan, N., Bracken, B., 2011. Along-strikeand down-dip variations in shallow-marine sequence stratigraphic architec-ture: Upper Cretaceous Star Point Sandstone, Wasatch Plateau, Central Utah,U.S.A. Journal of Sedimentary Research 81, 159e184.
Hampson, G.J., Rodriguez, A.B., Storms, J.E.A., Johnson, H.D., Meyer, C.T., 2008.Geomorphology and high-resolution stratigraphy of progradational wave-dominated shoreline deposits: impact on reservoir-scale facies architecture.In: Hampson, G.J., Steel, R.J., Burgess, P.M., Dalrymple, R.W. (Eds.), RecentAdvances in Models of Siliciclastic Shallow-Marine Stratigraphy. SEPM SpecialPublication, vol. 90, pp. 117e142.

M. Zecchin, O. Catuneanu / Marine and Petroleum Geology 39 (2013) 1e2524
Hampson, G.J., Sixsmith, P.J., Kieft, R.L., Jackson, C.A.L., Johnson, H.D., 2009. Quan-titative analysis of net-transgressive shoreline trajectories and stratigraphicarchitectures: mid-to-late Jurassic of the North Sea rift basin. Basin Research 21,528e558.
Helland-Hansen, W., Gjelberg, J., 1994. Conceptual basis and variability in sequencestratigraphy: a different perspective. Sedimentary Geology 92, 31e52.
Helland-Hansen, W., Hampson, G.J., 2009. Trajectory analysis: concepts and appli-cations. Basin Research 21, 454e483.
Helland-Hansen, W., Martinsen, O.J., 1996. Shoreline trajectories and sequences:description of variable depositional-dip scenarios. Journal of SedimentaryResearch 66, 670e688.
Hunt, D., Tucker, M.E., 1992. Stranded parasequences and the forced regressivewedge systems tract: deposition during base-level fall. Sedimentary Geology81, 1e9.
International Subcommission on Stratigraphic Classification, 1987. Unconfor-mity-bounded stratigraphic units. Geological Society of America Bulletin 98,232e237.
Johannessen, E.P., Steel, R.J., 2005. Shelf-margin clinoforms and prediction ofdeepwater sands. Basin Research 17, 521e550.
Johnson, J.G., Murphy, M.A., 1984. Time-rock model for Siluro-Devonian conti-nental shelf, western United States. Geological Society of America Bulletin 95,1349e1359.
Kidwell, S.M., 1991. Condensed deposits in siliciclastic sequences: expected andobserved features. In: Einsele, G., Ricken, W., Seilacher, A. (Eds.), Cycles andEvents in Stratigraphy. Springer-Verlag, Berlin, pp. 682e695.
Kidwell, S.M., 1997. Anatomy of extremely thin marine sequences landward ofa passive-margin hinge zone: Neogene Calvert Cliffs succession, Maryland,U.S.A. Journal of Sedimentary Research 67, 322e340.
Kondo, Y., Abbott, S.T., Kitamura, A., Kamp, P.J.J., Naish, T.R., Kamataki, T., Saul, G.S.,1998. The relationship between shellbed type and sequence architecture:examples from Japan and New Zealand. Sedimentary Geology 122, 109e127.
Liu, J.P., Milliman, J.D., Gao, S., Cheng, P., 2004. Holocene development of the YellowRiver’s subaqueous delta, North Yellow Sea. Marine Geology 209, 45e67.
Longhitano, S.G., Sabato, L., Tropeano, M., Gallicchio, S., 2010. A mixed bioclasticesiliciclastic flood-tidal delta in a micro tidal setting: depositional architecturesand hierarchical internal organization (Pliocene, southern Apennine, Italy).Journal of Sedimentary Research 80, 36e53.
Løseth, T.M., Helland-Hansen, W., 2001. Predicting the pinchout distance ofshoreline tongues. Terra Nova 13, 241e248.
Loutit, T.S., Hardenbol, J., Vail, P.R., 1988. Condensed sections: the key to agedetermination and correlation of continental margin sequences. In:Wilgus, C.K., Hastings, B.S., Kendall, C.G.St.C., Posamentier, H.W., Ross, C.A., VanWagoner, J.C. (Eds.), Sea-level Changes: an Integrated Approach. SEPM SpecialPublication, vol. 42, pp. 183e213.
MacEachern, J.A., Bann, K.L., 2008. The role of ichnology in refining shallow marinefacies models. In: Hampson, G.J., Steel, R.J., Burgess, P.M., Dalrymple, R.W. (Eds.),Recent Advances in Models of Siliciclastic Shallow-Marine Stratigraphy. SEPMSpecial Publication, vol. 90, pp. 73e116.
MacEachern, J.A., Zaitlin, B.A., Pemberton, S.G., 1999. A sharp-based sandstone ofthe Viking Formation, Joffre Field, Alberta, Canada: criteria for recognition oftransgressively incised shoreface complexes. Journal of Sedimentary Research69, 876e892.
MacNeil, A.J., Jones, B., 2006. Sequence stratigraphy of a Late Devonian ramp-situated reef system in the Western Canada Sedimentary Basin: dynamicresponses to sea-level change and regressive reef development. Sedimentology53, 321e359.
Martinsen, O.J., Martinsen, R.S., Steidtmann, J.R., 1993. Mesaverde Group (UpperCretaceous), Southeastern Wyoming: allostratigraphy versus sequence stratig-raphy in a tectonically active area. AAPG Bulletin 77, 1351e1373.
McCarthy, P.J., Plint, A.G., 1998. Recognition of interfluve sequence boundaries:integrating paleopedology and sequence stratigraphy. Geology 26, 387e390.
Miall, A.D., 1997. The Geology of Stratigraphic Sequences. Springer-Verlag, Berlin,pp. 433.
Milana, J.P., Tietze, K.-W., 2007. Limitations of sequence stratigraphic correlationbetween marine and continental deposits: a 3D experimental study ofunconformity-bounded units. Sedimentology 54, 293e316.
Mitchum Jr., R.M., 1977. Seismic stratigraphy and global changes of sea level. Part 11:glossary of terms used in seismic stratigraphy. In: Payton, C.E. (Ed.), SeismicStratigraphy e Applications to Hydrocarbon Exploration. AAPG Memoir, vol. 26,pp. 205e212.
Mutti, E., Davoli, G., Mora, S., Sgavetti, M., 1994. The eastern sector of the south-central folded Pyrenean foreland: criteria for stratigraphic analysis and excur-sion notes. In: Second High-Resolution Sequence Stratigraphy Conference, 20e26 June 1994, Tremp (Catalonia, Spain). Excursion Guidebook, pp. 83.
Naish, T.R., Kamp, P.J.J., 1997. Sequence stratigraphy of sixth-order (41 k.y.) Plio-ceneePleistocene cyclothems, Wanganui basin, New Zealand: a case for theregressive systems tract. Geological Society of America Bulletin 109, 978e999.
Neal, J., Abreu, V., 2009. Sequence stratigraphy hierarchy and the accommodationsuccession method. Geology 37, 779e782.
North American Commission on Stratigraphic Nomenclature, 1983. North Americanstratigraphic code. AAPG Bulletin 67, 841e875.
North American Commission on Stratigraphic Nomenclature, 2005. North Americanstratigraphic Code. AAPG Bulletin 89, 1547e1591.
Nummedal, D., Swift, D.J.P., 1987. Transgressive stratigraphy at sequence-boundingunconformities: some principles derived from Holocene and Cretaceous
examples. In: Nummedal, D., Pilkey, O.H., Howard, J.D. (Eds.), Sea-level Fluc-tuation and Coastal Evolution. SEPM Special Publication, vol. 41, pp. 241e260.
Olsen, T.R., Mellere, D., Olsen, T.,1999. Facies architecture and geometry of landward-stepping shoreface tongues: the Upper Cretaceous Cliff House Sandstone (Man-cos Canyon, south-west Colorado). Sedimentology 46, 603e625.
Pattison, S.A.J., 1995. Sequence stratigraphic significance of sharp-based lowstandshoreface deposits, Kenilworth Member, Book Cliffs, Utah. AAPG Bulletin 79,444e462.
Payton, C.E. (Ed.), 1977. Seismic Stratigraphy: Applications to Hydrocarbon Explo-ration. AAPG Memoir, vol. 26, p. 516.
Pemberton, S.G., MacEachern, J.A., Frey, R.W., 1992. Trace fossil facies models:environmental and allostratigraphic significance. In: Walker, R.G., James, N.P.(Eds.), Facies Models: Response to Sea Level Change. Geological Association ofCanada, Toronto, pp. 47e72.
Plink-Björklund, P., Steel, R., 2005. Deltas on falling-stage and lowstand shelfmargins, the Eocene Central Basin of Spitsbergen: importance of sedimentsupply. In: Giosan, L., Bhattacharya, J.P. (Eds.), River Deltas: Concepts, Models,and Examples. SEPM Special Publication, vol. 83, pp. 179e206.
Plint, A.G., 1988. Sharp-based shoreface sequences and offshore bars in the CardiumFormation of Alberta; their relationship to relative changes in sea level. In:Wilgus, C.K., Hastings, B.S., Kendall, C.G.St.C., Posamentier, H.W., Ross, C.A., VanWagoner, J.C. (Eds.), Sea Level Changes: an Integrated Approach. SEPM SpecialPublication, vol. 42, pp. 357e370.
Plint, A.G., 2000. Sequence stratigraphy and paleogeography of a Cenomaniandeltaic complex: the Dunvegan and lower Kaskapau formations in subsurfaceand outcrop, Alberta and British Columbia, Canada. Bulletin of CanadianPetroleum Geology 47, 43e79.
Plint, A.G., Nummedal, D., 2000. The falling stage systems tract: recognition andimportance in sequence stratigraphic analysis. In: Hunt, D., Gawthorpe, R.L.(Eds.), Sedimentary Responses to Forced Regressions. Geological Society SpecialPublication, vol. 172, pp. 1e17.
Pomar, L., Tropeano, M., 2001. The Calcarenite di Gravina Formation in Matera(southern Italy): new insights for coarse-grained, large-scale, cross-beddedbodies encased in offshore deposits. AAPG Bulletin 85, 661e689.
Posamentier, H.W., Allen, G.P., 1999. Siliciclastic sequence stratigraphy e conceptsand applications. SEPM Concepts in Sedimentology and Paleontology 7, 210.
Posamentier, H.W., Vail, P.R., 1988. Eustatic controls on clastic deposition, II:sequence and systems tract models. In: Wilgus, C.K., Hastings, B.S.,Kendall, C.G.St.C., Posamentier, H.W., Ross, C.A., Van Wagoner, J.C. (Eds.), SeaLevel Changes: an Integrated Approach. SEPM Special Publication, vol. 42,pp. 125e154.
Posamentier, H.W., Jervey, M.T., Vail, P.R., 1988. Eustatic controls on clastic depo-sition, I: conceptual framework. In: Wilgus, C.K., Hastings, B.S.,Kendall, C.G.St.C., Posamentier, H.W., Ross, C.A., Van Wagoner, J.C. (Eds.), SeaLevel Changes: an Integrated Approach. SEPM Special Publication, vol. 42,pp. 110e124.
Ridente, D., Trincardi, F., 2005. Pleistocene “muddy” forced-regression deposits onthe Adriatic shelf: a comparison with prodelta deposits of the late Holocenehighstand mud wedge. Marine Geology 222e223, 213e233.
Salvador, A., 1994. International Stratigraphic Guide. In: A Guide to StratigraphicClassification, Terminology and Procedure. IUGS, pp. 214.
Saul, G., Naish, T.R., Abbott, S.T., Carter, R.M., 1999. Sedimentary cyclicity in themarine PlioceneePleistocene of the Wanganui basin (New Zealand): sequencestratigraphic motifs characteristic of the past 2.5 m.y. Geological Society ofAmerica Bulletin 111, 524e537.
Schlager, W., 1991. Depositional bias and environmental change e important factorsin sequence stratigraphy. Sedimentary Geology 70, 109e130.
Siggerud, E.I.H., Steel, R.J., 1999. Architecture and trace-fossil characteristics ofa 10,000e20,000 year, fluvial-to-marine sequence, SE Ebro Basin, Spain. Journalof Sedimentary Research 69, 365e383.
Siggerud, E.I.H., Steel, R.J., Pollard, J.E., 2000. Bored pebbles and ravinement surfaceclusters in a transgressive systems tract, Sant Llorenç del Munt fan-deltacomplex, SE Ebro Basin, Spain. Sedimentary Geology 138, 161e177.
Sloss, L.L., Krumbein, W.C., Dapples, E.C., 1949. Integrated facies analysis. In:Longwell, C.R. (Ed.), Sedimentary Facies in Geologic History. Geological Societyof America Memoirs, vol. 39, pp. 91e124.
Sømme, T.O., Howell, J.A., Hampson, G.J., Storms, J.E.A., 2008. Genesis, architecture,and numerical modeling of intra-parasequence discontinuity surfaces in wave-dominated deltaic deposits: Upper Cretaceous Sunnyside Member, BlackhawkFormation, Book Cliffs, Utah, U.S.A. In: Hampson, G.J., Steel, R.J., Burgess, P.M.,Dalrymple, R.W. (Eds.), Recent Advances in Models of Siliciclastic Shallow-Marine Stratigraphy. SEPM Special Publication, vol. 90, pp. 421e441.
Snedden, J.W., Dalrymple, R.W., 1999. Modern shelf sand bodies: from historicalperspective to a unified theory for sand body genesis and evolution. In: Berg-man, K.M., Snedden, J.W. (Eds.), Isolated Shallow Marine Sandbodies: SequenceStratigraphic Analysis and Sedimentologic Interpretation. SEPM Special Publi-cation, vol. 64, pp. 13e28.
Spence, G.H., Tucker, M.A., 2007. A proposed integrated multi-signature model forperitidal cycles in carbonates. Journal of Sedimentary Research 77, 797e808.
Suter, J.R., 2006. Facies models revisited: clastic shelves. In: Posamentier, H.W.,Walker, R.G. (Eds.), Facies Models Revisited. SEPM Special Publication, vol. 84,pp. 339e397.
Swenson, J.B., Muto, T., 2007. Response of coastal plain rivers to falling relativesea-level: allogenic controls on the aggradational phase. Sedimentology 54,207e221.
M. Zecchin, O. Catuneanu / Marine and Petroleum Geology 39 (2013) 1e25 25
Swift, D.J.P., 1968. Coastal erosion and transgressive stratigraphy. Journal of Geology76, 444e456.
Swift, D.J.P., Parsons, B.S., Foyle, A., Oertel, G.F., 2003. Between beds and sequences:stratigraphic organization at intermediate scales in the Quaternary of the Vir-ginia coast, USA. Sedimentology 50, 81e111.
Swift, D.J.P., Phillips, S., Thorne, J.A., 1991. Sedimentation on continental margins: V.Parasequences. In: Swift, D.J.P., Oertel, G.F., Tillman, R.W., Thorne, J.A. (Eds.),Shelf Sand and Sandstone Bodies-Geometry, Facies and Sequence Stratigraphy.International Association of Sedimentologists Special Publication, vol. 14,pp. 153e187.
Tucker, M.E., Garland, J., 2010. High-frequency cycles and their sequence strati-graphic context: orbital forcing and tectonic controls on Devonian cyclicity,Belgium. Geologica Belgica 13 (3), 213e240.
Van Wagoner, J.C., Posamentier, H.W., Mitchum, R.M., Vail, P.R., Sarg, J.F., Loutit, T.S.,Hardenbol, J., 1988. An overview of the fundamentals of sequence stratigraphyand key definitions. In: Wilgus, C.K., Hastings, B.S., Kendall, C.G.St.C.,Posamentier, H.W., Ross, C.A., Van Wagoner, J.C. (Eds.), Sea Level Changes: anIntegrated Approach. SEPM Special Publication, vol. 42, pp. 39e45.
Van Wagoner, J.C., Mitchum, R.M., Campion, K.M., Rahmanian, V.D., 1990. Silici-clastic sequence stratigraphy in well logs, cores, and outcrops. AAPGMethods inExploration vol. 7, 55.
Varban, B.L., Plint, A.G., 2008. Palaeoenvironments, palaeogeography, and phys-iography of a large, shallow, muddy ramp: Late CenomanianeTuronianKaskapau Formation, Western Canada foreland basin. Sedimentology 55,201e233.
Walker, R.G., 1992. Facies, facies models and modern stratigraphic concepts. In:Walker, R.G., James, N.P. (Eds.), Facies Models: Response to Sea Level Change.Geological Association of Canada, Toronto, pp. 1e14.
Wanless, H.R., Shepard, E.P., 1936. Sea Level and climatic changes related to LatePaleozoic cycles. Geological Society of America Bulletin 47, 1177e1206.
Weller, J.M., 1930. Cyclic sedimentation of the Pennsylvanian Period and itssignificance. Journal of Geology 38, 97e135.
Wilgus, C.K., Hastings, B.S., Kendall, C.G.St.C., Posamentier, H.W., Ross, C.A., VanWagoner, J.C. (Eds.), 1988. Sea-level Changes: an Integrated Approach. SEPMSpecial Publication, vol. 42, p. 407.
Zecchin, M., 2005. Relationships between fault-controlled subsidence and pres-ervation of shallow-marine small-scale cycles: example from the lowerPliocene of the Crotone Basin (southern Italy). Journal of SedimentaryResearch 75, 300e312.
Zecchin, M., 2007. The architectural variability of small-scale cycles in shelf andramp clastic systems: the controlling factors. Earth-Science Reviews 84, 21e55.
Zecchin, M., 2010. Towards the standardization of sequence stratigraphy: is theparasequence concept to be redefined or abandoned? Earth-Science Reviews102, 117e119.
Zecchin, M., Brancolini, G., Tosi, L., Rizzetto, F., Caffau, M., Baradello, L., 2009a.Anatomy of the Holocene succession of the southern Venice Lagoon revealed byvery high resolution seismic data. Continental Shelf Research 29, 1343e1359.
Zecchin, M., Caffau, M., Civile, D., Roda, C., 2010. Anatomy of a late Pleistoceneclinoformal sedimentary body (Le Castella, Calabria, southern Italy): a case ofprograding spit system? Sedimentary Geology 223, 291e309.
Zecchin, M., Caffau, M., 2011. Key features of mixed carbonateesiliciclastic shallow-marine systems: the case of the Capo Colonna terrace (southern Italy). ItalianJournal of Geosciences 130, 370e379.
Zecchin, M., Ceramicola, S., Gordini, E., Deponte, M., Critelli, S., 2011a. Cliff overstepmodel and variability in the geometry of transgressive erosional surfaces inhigh-gradient shelves: the case of the Ionian Calabrian margin (southern Italy).Marine Geology 281, 43e58.
Zecchin, M., Civile, D., Caffau, M., Roda, C., 2009b. Facies and cycle architecture ofa Pleistocene marine terrace (Crotone, southern Italy): a sedimentary responseto late Quaternary, high-frequency glacio-eustatic changes. SedimentaryGeology 216, 138e157.
Zecchin, M., Civile, D., Caffau, M., Sturiale, G., Roda, C., 2011b. Sequence stratigraphyin the context of rapid regional uplift and high-amplitude glacio-eustaticchanges: the Pleistocene Cutro Terrace (Calabria, southern Italy). Sedimen-tology 58, 442e477.
Zecchin, M., Massari, F., Mellere, D., Prosser, G., 2003. Architectural styles of pro-grading wedges in a tectonically active setting, Crotone Basin, Southern Italy.Journal of the Geological Society, London 160, 863e880.
Zecchin, M., Massari, F., Mellere, D., Prosser, G., 2004. Anatomy and evolution ofa Mediterranean-type fault bounded basin: the lower Pliocene of the northernCrotone Basin (Southern Italy). Basin Research 16, 117e143.
Zecchin, M., Mellere, D., Roda, C., 2006. Sequence stratigraphy and architecturalvariability in growth fault-bounded basin fills: a review of Plio-Pleistocenestratal units of the Crotone Basin (southern Italy). Journal of the GeologicalSociety, London 163, 471e486.
Zhang, Y., Swift, D.J.P., Niedoroda, A.W., Reid, C.W., Thorne, J.A., 1997. Simulation ofsedimentary facies on the northern California shelf: implications for ananalytical theory of facies differentiation. Geology 27, 635e638.