Reports of elapsed time: Bounding and rounding processes in estimation
18
Journal of Experimental Psychology: Learning, Memory, and Cognition 1990, Vol. 16, No. 2, 196-213 Copyright 1990 by the American Psychological Association, Inc. logical Association, Inc. 0278-7393/9O/SOO.75 Reports of Elapsed Time: Bounding and Rounding Processes in Estimation Janellen Huttenlocher, Larry V. Hedges, and Norman M. Bradburn University of Chicago The present article concerns the way temporal information is represented in memory and the processes used in estimating when events occurred. In particular, we examine the sources of bias in reports of the time that has elapsed since a target event occurred. We find that reported times are less than actual times. Evidence is presented that this forward bias is not a result of misrepresentation of elapsed time in memory, but rather reflects two factors that arise in constructing reports from inexact information in memory. One factor is subjects' imposition of an upper boundary on reports, reflecting their notion of what would constitute reasonable answers to the question asked. This boundary truncates the distribution of reports, producing forward bias. The other factor is subjects' use of rounded (prototypic) values; these values, although stated in days, actually represent larger temporal categories (e.g., 14, 21, 30, 60 days ago). The distance between rounded values increases as the temporal categories become larger. Because of decreasing precision in memory and this increase in the distance between rounded values, a broader range of values is rounded down than up, thus producing forward bias. The present article is concerned with the way temporal information is represented in autobiographical (episodic) memory and with the processes used in estimating when events occurred. It seems clear that the order of events and the intervals between them are preserved in memory, at least to some extent. Yet a systematic bias is found in people's temporal reports; there is a tendency to report events as occurring more recently than they actually occurred (Hutten- locher, Hedges, & Prohaska, 1988; Loftus & Marburger, 1983; Neter & Waksberg, 1964; Sudman & Bradburn, 1973). At first glance, these findings suggest a lack of correspondence between time as subjectively experienced and time as objec- tively reckoned by the calendar. When the mental represen- tation of a dimension fails to correspond to objectively meas- ured distances along that dimension, it is appropriate to construct a psychological distance model (Shepard, 1974). However, reports from memory depend both on what has been encoded and on an estimation process that produces reports from what has been encoded. Thus a bias in reporting need not reflect a bias in the memory representation. Indeed, Huttenlocher et al. (1988) proposed that the metric properties of objectively measured time are preserved in memory, al- though inexactly. They argued that bias arises in the construc- tion of temporal reports—specifically, that bias arises in hi- erarchically organized ordered domains when an exact report The study reported in this article was supported in part by a grant from the Spencer Foundation to Janellen Huttenlocher and in part by National Science Foundation Grant SES 8520979 to Norman Bradburn and colleagues. In addition to overall coauthorship, Larry V. Hedges developed the formal presentation which makes up the Appendix. The authors thank Ray Adams for his help in data analysis and statistical modeling, and Lawrence Barsalou and Vincent Pro- haska for their comments on the article. Correspondence concerning this article should be addressed to Janellen Huttenlocher, University of Chicago, 5835 Kimbark Ave- nue. Chicago, Illinois 60637. must be made, but memory (although unbiased) is less exact than that required. Below, we examine the possible sources of bias in reporting. First, we examine the possibility of bias in memory itself, considering how alternative forms of temporal representation might give rise to distortion of objective time. Next, we examine how bias might arise in the reporting (estimation) process even if memory, while inexact, is unbiased. Hutten- locher et al. (1988) examined one source of bias in estimation (bounding effects); in the present article we consider an exten- sion of the same principle. Also in the present article, we examine a second source of bias in estimation (rounding effects) that arises in reports of elapsed time. Finally, we present data showing forward bias in reporting in a situation different from that studied in Huttenlocher et al. (1988), and we show that the proposed estimation processes fully account for the observed bias. Representation of Temporal Information It seems clear that the representation of temporal infor- mation in memory involves the conventional temporal units (days, weeks, months, and years) used to measure time. How- ever, there is more than one possible form in which the information might be represented. Two alternative forms of representation have been discussed in the existing literature— calendar representations and event sequence representations. Both make use of the conventional temporal units, but in different ways. Perhaps the most obvious hypothesis is that temporal memory is based on the calendar; that is, the dates of events are encoded in memory. In fact, researchers who examine the accuracy with which dates can be retrieved simply assume such a representation. However, an alternative hypothesis has recurred in the literature. In a recent discus- sion, Barsalou (1988) suggested that "extended event lines" are the "primary organizers" of autobiographical memory, 196
-
Upload
northwestern -
Category
Documents
-
view
0 -
download
0
Transcript of Reports of elapsed time: Bounding and rounding processes in estimation
Journal of Experimental Psychology:Learning, Memory, and Cognition1990, Vol. 16, No. 2, 196-213
Copyright 1990 by the American Psychological Association, Inc.logical Association, Inc.0278-7393/9O/SOO.75
Reports of Elapsed Time: Bounding andRounding Processes in Estimation
Janellen Huttenlocher, Larry V. Hedges, and Norman M. BradburnUniversity of Chicago
The present article concerns the way temporal information is represented in memory and theprocesses used in estimating when events occurred. In particular, we examine the sources of biasin reports of the time that has elapsed since a target event occurred. We find that reported timesare less than actual times. Evidence is presented that this forward bias is not a result ofmisrepresentation of elapsed time in memory, but rather reflects two factors that arise inconstructing reports from inexact information in memory. One factor is subjects' imposition ofan upper boundary on reports, reflecting their notion of what would constitute reasonableanswers to the question asked. This boundary truncates the distribution of reports, producingforward bias. The other factor is subjects' use of rounded (prototypic) values; these values,although stated in days, actually represent larger temporal categories (e.g., 14, 21, 30, 60 daysago). The distance between rounded values increases as the temporal categories become larger.Because of decreasing precision in memory and this increase in the distance between roundedvalues, a broader range of values is rounded down than up, thus producing forward bias.
The present article is concerned with the way temporalinformation is represented in autobiographical (episodic)memory and with the processes used in estimating whenevents occurred. It seems clear that the order of events andthe intervals between them are preserved in memory, at leastto some extent. Yet a systematic bias is found in people'stemporal reports; there is a tendency to report events asoccurring more recently than they actually occurred (Hutten-locher, Hedges, & Prohaska, 1988; Loftus & Marburger, 1983;Neter & Waksberg, 1964; Sudman & Bradburn, 1973). Atfirst glance, these findings suggest a lack of correspondencebetween time as subjectively experienced and time as objec-tively reckoned by the calendar. When the mental represen-tation of a dimension fails to correspond to objectively meas-ured distances along that dimension, it is appropriate toconstruct a psychological distance model (Shepard, 1974).However, reports from memory depend both on what hasbeen encoded and on an estimation process that producesreports from what has been encoded. Thus a bias in reportingneed not reflect a bias in the memory representation. Indeed,Huttenlocher et al. (1988) proposed that the metric propertiesof objectively measured time are preserved in memory, al-though inexactly. They argued that bias arises in the construc-tion of temporal reports—specifically, that bias arises in hi-erarchically organized ordered domains when an exact report
The study reported in this article was supported in part by a grantfrom the Spencer Foundation to Janellen Huttenlocher and in partby National Science Foundation Grant SES 8520979 to NormanBradburn and colleagues. In addition to overall coauthorship, LarryV. Hedges developed the formal presentation which makes up theAppendix. The authors thank Ray Adams for his help in data analysisand statistical modeling, and Lawrence Barsalou and Vincent Pro-haska for their comments on the article.
Correspondence concerning this article should be addressed toJanellen Huttenlocher, University of Chicago, 5835 Kimbark Ave-nue. Chicago, Illinois 60637.
must be made, but memory (although unbiased) is less exactthan that required.
Below, we examine the possible sources of bias in reporting.First, we examine the possibility of bias in memory itself,considering how alternative forms of temporal representationmight give rise to distortion of objective time. Next, weexamine how bias might arise in the reporting (estimation)process even if memory, while inexact, is unbiased. Hutten-locher et al. (1988) examined one source of bias in estimation(bounding effects); in the present article we consider an exten-sion of the same principle. Also in the present article, weexamine a second source of bias in estimation (roundingeffects) that arises in reports of elapsed time. Finally, wepresent data showing forward bias in reporting in a situationdifferent from that studied in Huttenlocher et al. (1988), andwe show that the proposed estimation processes fully accountfor the observed bias.
Representation of Temporal Information
It seems clear that the representation of temporal infor-mation in memory involves the conventional temporal units(days, weeks, months, and years) used to measure time. How-ever, there is more than one possible form in which theinformation might be represented. Two alternative forms ofrepresentation have been discussed in the existing literature—calendar representations and event sequence representations.Both make use of the conventional temporal units, but indifferent ways. Perhaps the most obvious hypothesis is thattemporal memory is based on the calendar; that is, the datesof events are encoded in memory. In fact, researchers whoexamine the accuracy with which dates can be retrievedsimply assume such a representation. However, an alternativehypothesis has recurred in the literature. In a recent discus-sion, Barsalou (1988) suggested that "extended event lines"are the "primary organizers" of autobiographical memory,
196
REPORTS OF ELAPSED TIME 197
and similar views have been expressed by Kolodner (1978),Linton (1986), and Neisser (1986), among others. However,there has not yet been a systematic examination of the criticaldifferences between calendar and event sequence representa-tions, notably, of whether distortions of objective time mightbe expected with one but not the other form of representation.
Within each of these possible forms of representing tem-poral information, we also differentiate between single- andmultilevel representation. In a single-level representation, theinformation specified in temporal units of varying fineness ofgrain (day, month, year) is integrated so as to form a timeline. In such a representation, the preservation of values atone level of detail (e.g., the day) implies preservation at allhigher levels (e.g., the month); if information involving finelygrained units is sufficiently inexact, that involving morecoarsely grained units also is lost. In contrast, in a multilevelrepresentation, the temporal information specified in tem-poral units of varying fineness of grain is preserved separatelyin memory. Strict separation among levels implies that inex-actness of information at one level does not affect inexactnessat other levels. We differentiate among these ways of repre-senting temporal information, as indicated below.
Forms of Representation
A calendar representation consists of an outside frameworkindependent of events, constructed out of the conventionalunits for measuring time. In our Western calendar, time ismeasured continuously in relation to an established zero point(at the time of Christ) by numbering the years. Smallerdivisions of time—within the year—involve the use of cyclicunits (days, weeks, months). These units are independent(nonredundant) so that the units at one level contain the fullset of distinguishable units at a lower level. The cyclic unitscan preserve order and interval across time periods up to (butnot longer than) the length of the cycle specified. Thus theuse of cyclic units alone (the day or month in which an eventoccurred) cannot preserve the continuity of events in autobio-graphical memory. In a calendar representation, it is essentialto specify the year. A calendar representation provides aframework, extending into the future, into which incomingevents can be entered. The time of each event is conceptual-ized independently of other events. A calendar might form asingle-level representation. That is, events might form a timeline in which each event is related to a date (e.g., Wednesday,the 5th of July, 1989), as in an appointment book. Alterna-tively, calendar units might form a multilevel representation.That is, because the calendar units at different levels of detailare defined independently, the time of an event might bespecified by separate values at each; for example, the fact thatan event occurred on a Wednesday and in July and in 1989might constitute three separate pieces of information. Theseseparate pieces of information might be retrieved and com-bined to produce an estimate of when an event occurred.
An event sequence representation consists of an ordered setof events separated by particular intervals of time (a day, aweek, etc.). This form of representation does not involve atemporal framework independent of events; events are en-coded in relation to preceding events. This temporal structure
is continually being constructed by relating incoming eventsto earlier events. Thus the times of events are not concep-tualized independently of one another. Further, there is noestablished zero point in an event sequence; yet a natural (buteverchanging) zero point would be at the present, the pointwhere new events are added. An event sequence might forma single-level representation. That is, events might form atime line that specifies the times between adjacent events (plusthe durations of the events themselves). Events might begrouped into larger aggregate units, but the aggregates wouldsimply be made up of component events with no independenttemporal meaning. The intervals between events might bedescribed in terms of days, weeks, and so on, but these wouldsimply be different units for measuring the intervals. Alter-natively, however, event sequences might form a multilevelrepresentation in which each incoming event is encoded inrelation to more than one earlier event (e.g., John's weddingis coded as a week after Sue's birthday, and as a month afterChristmas). These relations to earlier events might be sepa-rately represented in memory. In this case, several sources oftemporal information about a target event might be retrievedand combined in estimating when that event occurred.
Loss of Temporal Information Over Time
If temporal memory is exact, it constitutes a simple metricrepresentation in which objective time is preserved withoutdistortion. This is true regardless of whether the representationinvolves the calendar or an event sequence or of whether it issingle- or multilevel. However, temporal memory becomesincreasingly inexact over time (Baddeley, Lewis, & Nimmo-Smith, 1978). Examination of the pattern of loss over timecan provide evidence concerning the underlying form of therepresentation.
First, consider calendar representation, in which each eventis coded by date, independent of other events, so that memoryfor the time of a target event is unaffected by the loss ofinformation about other events. In a calendar representation,there is no obvious reason to expect systematic overall distor-tion to arise in the memory representation itself (leading toforward bias in reporting). In fact, in a single-level calendarrepresentation in which preservation of information at onelevel (e.g., days, months) implies preservation at all otherlevels, there is no reason to expect any distortion at all in thememory representation. That is, even when temporal infor-mation is inexact, the mean value of reports for a particularevent should lie at its true value.
In multilevel calendar representation, as in single-levelcalendar representation, objective time should be preservedoverall in memory. However, when memory is inexact, cer-tain forms of bias in reporting will arise because informationloss occurs independently at different levels (we will call thislocal bias). On the one hand, a larger unit may be forgottenwhile values at a level of greater detail are retained; forexample, people might forget the week an event occurred butremember the day; this would lead to a multimodal distribu-tion of reports around points separated by 7 days. Indeed,Friedman and Wilkins (1985) found that the larger timeperiod in which an event occurred may be forgotten while

198 J. HUTTENLOCHER, L. HEDGES, AND N. BRADBURN
values at a level of greater detail are retained. Alternatively, alarger unit may be retained when values at a level of greaterdetail are inexact, constraining the range of possible valuesreported. Indeed, Huttenlocher et al. (1988) found that largerunits (academic quarters, which are intervals bounded atparticular dates) constrained the assignment of particulardates to school-related events. Thus both Friedman and Wil-kins and Huttenlocher et al. show that there is multilevelcoding of certain calendar values in memory. However, be-cause the multilevel coding involved only cyclic units, thefindings do not indicate whether the continuity of events inautobiographical memory is preserved in a calendar represen-tation or an event sequence.
Second, consider event sequence representation. In contrastto calendar representation, it is clearly possible that systematicdistortion of objective time might arise in event sequencerepresentation. As time elapses, some events will be forgotten.If the representation of the time an event occurred is basedon the sums of the intervals between events plus their dura-tions, such loss would result in forward misplacement of thoseevents retained in memory. Thus the forward bias observedin temporal reports might reflect a misrepresentation in mem-ory. Both single- and multilevel representation based on eventsequences could give rise to distortion over time for this samereason. Although multiple entries might affect the overallpattern of loss from memory, it is not completely clear how.
Below we consider the processes involved in answeringquestions about when events occurred. The nature of theseprocesses depends on whether representation involves thecalendar or event sequences. Representation based on thecalendar consists of an entry of the date for each event,independent of other events. Hence, a date can be "lookedup" (although for multilevel calendar representation, valuesat different levels are looked up separately and combined toproduce a report). Representation based on an event se-quence, in contrast, consists of an ordered set of events(including interval information). This form of representationdoes not directly yield answers to temporal questions (regard-less of the form of the question). Answers must be constructedat the time of retrieval by examining the relevant portion ofthe event sequence (typically between the present and a targetevent) and by measuring that interval (number of days, weeks,etc. separating them). Note that if there is misrepresentationin temporal memory itself, bias will appear regardless of thequestion a person is asked. In contrast, if bias is due toprocesses that arise in producing reports, it should vary withthe question. Below we show the patterns of bias to beexpected for particular questions.
Answering Temporal Questions
We examine two sorts of variation in temporal questions.The first variation is whether questions ask for the date of anevent or for how long ago an event occurred. The difficultyof the question interacts with the form of the representation.Date questions should be easiest with calendar representationand most difficult with event sequence representation,whereas elapsed time questions should be intermediate indifficulty for both calendar and event sequence.
Consider first questions about the dates of events. Forcalendar representation, as noted above, answers can belooked up. However, for event sequence representation, an-swers must be calculated. Two steps are involved. The firststep is to measure the interval between the present and thetarget event (the size of units used [days, weeks, months] maydepend on the length of the sequence and/or on the precisionof the representation). The second step is to use this intervalinformation, together with the present date, to calculate thedate of the target event, as requested in the question. Considernext questions about elapsed time. The answers cannot belooked up, regardless of the form of representation (eventsequence or calendar). This is so because elapsed time is notstored information, but continually changes; hence, the inter-val between the present and a target event must be calculated.One step is involved for each type of representation. Forcalendar representation, the target date is looked up, and theelapsed time is calculated; that is, it is the interval betweenthe target date and the present date. For event sequencerepresentation, the interval must be measured (as notedabove); the interval information is in the proper form toanswer an elapsed time question. Elapsed time questions mayspecify particular units (days, weeks, months ago). When thesetemporal units are more precise than the information inmemory, bias in reporting may arise as indicated below underRounding.
The second variation in temporal questions concerns whatinformation is supplied (which determines how memory isaccessed) and what information is requested (which deter-mines what must be retrieved, inferred, or estimated). It ispossible either to supply a time and ask for an event, or tosupply an event and ask for a time. There are differencesbetween the ways these two types of questions are formulated,and these no doubt reflect the asymmetry between the repre-sentation of events and the times of their occurrence. That is,although a particular event is often associated with a time, aparticular time is not often associated with an event. Ques-tions that supply an event and ask for a time generally specifya particular event (e.g., "When was John's marriage?"); theymay or may not request an exact time ("How many days agowas John's marriage?"). We will call these event questions. Incontrast, questions that supply a time do not generally specifyan exact time or a particular event; questions like "Whathappened on July 9(13 days ago)?" tend to occur only incases where it can be assumed the subject knows a great dealabout an event and its date (e.g., a particular crime in a courtof law). More generally, such questions specify a period oftime and request instances of a particular type (e.g., "SinceJuly 1 [in the last 6 weeks], when did you go to the doctor?").These questions are frequently used in survey research andhave been called reference period questions. Reference periodquestions set an upper bound on reports (e.g., only reportsafter July 1 are wanted); this necessarily leads to forward biasin reporting when memory is inexact, as indicated belowunder Bounding.
Estimation Processes
We consider two estimation processes that may give rise tobias in answering the event questions in the present article.

REPORTS OF ELAPSED TIME 199
The first is that subjects may impose an upper bound on theirreports. Huttenlocher et al. (1988) showed that when memoryis inexact, bias necessarily arises for reference period questionsin which the investigator sets an upper bound on reports(events since January 1, since Christmas, etc.). Parallel biasmay arise if subjects themselves impose an upper bound ontheir reports. The other source of bias in estimation is the useof rounded values in reporting. This source of bias arises onlyin reports of elapsed time. These two estimation processes aredescribed in the following two sections.
Bounding: Largest Values
Earlier studies involving reference period questions showedforward bias in reporting (e.g., Neter & Waksberg, 1964;Sudman & Bradburn, 1973). Huttenlocher et al. (1988)pointed out that when memory is inexact, forward bias willnecessarily arise in answering such questions. To see thereason, consider an event which actually occurred near thestart of the reference period and for which inexactness inmemory may project a value prior to the start point. If anevent is projected to have occurred prior to the start point,subjects will not report it, because the question concernsevents remembered as occurring within the reference period.Thus, if the distribution of remembered times for that eventhas a mean at the true time, the truncation due to failure toreport will move the mean of the resulting distribution for-ward from the true time. Because the reference period endsat the present, events cannot be projected forward out of theperiod (into the future) but can only pile up near the endpoint; in any case, memory is most exact near the present sobackward displacement would be small compared with for-ward displacement earlier in the period (See Huttenlocher etal., 1988, for a detailed account of this process.)
Even if an upper bound is not imposed by the investigator,subjects may impose such a bound on their reports. If subjectsbound their reports, it leads to truncation of the distributionof reports, just as when bounds are imposed in the question,and to forward bias in reporting. There are a variety of reasonswhy subjects might bound their reports. One factor is thenature of the target event about which they are asked; if theevent is a relatively trivial one, they would expect to be askedabout it only over some limited time period. A second factoris the way the question is phrased; a question about elapseddays would be expected only across a limited time period. Itwould be assumed that questions about earlier events wouldhave been phrased in terms of weeks, months, or years.
Rounding: Prototypic Values
Answers to questions about elapsed time may be framed interms of units of various sizes (days, weeks, or months). Infact, there are conventional forms of framing answers usingunits at one level (e.g., number of days) that correspond tolarger temporal categories (e.g., months). For example, if aperson says "30 days ago" or "60 days ago," the answer maynot be meant to reflect precision to the nearest day; rather,"30 days" may be a value reported in days but used to standfor "a month." A set of reports of elapsed time framed interms of days may include both days (raw values) and esti-
mates in larger units stated in terms of days (i.e., roundedvalues).
The rounded values we have described are particular valueswithin a category which "stand for" or represent larger cate-gories. There has been discussion in the literature on catego-rization of the use of a particular instance, a "prototype," tostand for a category (cf. Oden, 1987; Posner & Keele, 1968;Smith & Medin, 1981). As in the present case, the use ofprototypes is posited to occur when memory is inexact. Theevidence that people generate prototypes comes from studiesin which subjects acquire categories from a set of instancesand consists of a greater tendency to "recognize" prototypicalinstances (i.e., subjects believe they have seen prototypicalinstances previously even if they have not) than other in-stances and of better categorization of prototypes than otherinstances. A proposed alternative to the view that subjectsgenerate a prototype which stands for a category is thatsubjects store the individual instances and that the observeddifferences in response to "prototypic" instances reflect thegreater similarity of these instances to the entire set of in-stances (cf. Medin & Schaffer, 1978). In the present case, theparticular rounded values used in answering questions areprototypes. That is, they are cultural conventions acquired asvalues for describing larger categories. Further, the use ofthese prototypic values has interesting behavioral conse-quences—namely, the forward bias in reporting describedbelow.
Rounded (prototypic) values, we posit, are used when thetemporal information in memory in inexact. Inexactness oftemporal information increases over time (Baddeley et al.,1978). Thus, over time, two changes should be found in theuse of rounded (prototypic) values. First, there should be anincrease in the proportion of prototypic values relative to rawvalues over time. Second, the size of the temporal units usedin rounding (e.g., weeks vs. months) should become largerover time. There are two likely sources of the rounded orprototypic values used in reporting. First, there are valuesbased on intervals of calendar time, namely, weeks (multiplesof 7) or months (multiples of 30). Second, there are valuesbased on the decimal system used generally in numericalestimation—roundings by 5s, 10s, and so forth.
If the size of the reporting interval (the distance betweenadjacent rounded values) increases with the amount of elapsedtime and if reports are framed in terms of days, the distancebetween prototypic values in days used in reporting also willincrease over time. In this case, forward bias in reporting willarise even if people's reports are generated from an underlyingdistribution with inexactness distributed symmetricallyaround the true elapsed time. To see the reason, consider theprototypic values 7, 10, 14, 21, 30, and 60 days. We makethe argument about bias for a hypothetical case in whichsubjects choose the prototypic values nearest to their recollec-tion. That is, the reporting interval for each prototypic valueis bounded by the midpoints between adjacent rounded val-ues. Assignment of the rounded response 14 begins at remem-bered values of 12 (midway between 10 and 14) and ends atremembered values of 17.5 (midway between 14 and 21).Note that the distance between 12 and 14 is smaller than thatbetween Hand 17.5. Because the range of remembered valuesto which a particular rounded value is assigned is smaller in
200 J. HUTTENLOCHER, L. HEDGES, AND N. BRADBURN
a forward than in a backward direction, a smaller range ofvalues is rounded up (e.g., to 14) than rounded down, andthis produces a net forward bias in reporting. By the sameargument, forward bias due to rounding in terms of thedecimal system also might appear with increases in elapsedtime if people first round by 5s, then by 10s, and so on.
Modeling of Bounding and Rounding Processes
Our purpose in the present study is to evaluate whetherbias in temporal reports reflects the misrepresentation oftemporal information in memory or reflects estimation proc-esses based on inexact but unbiased temporal information.Our approach to this problem, as in Huttenlocher et al. (1988)is to posit a model that holds that events are represented withno bias (but with uncertainty that increases over time) andthat the bias arises in producing estimates. We examinewhether the model can account for the observed distributionof temporal reports. The temporal reports we will be con-cerned with are answers to event questions. We model tem-poral reports in which subjects are asked how many days haveelapsed since a target event. The reason for the focus onelapsed time, to anticipate our findings, is that people gener-ally were unwilling to report the date of our target event,whereas they would report the number of days which hadelapsed since that event.
The model we propose can be described in terms of threeprocesses: a retrieval/measurement process, a bounding proc-ess, and a response process. The retrieval/measurement proc-ess corresponds to extracting an uncertain value from mem-ory. The bounding process constrains values to lie in abounded range consistent with the question that was asked.The response process involves translating that uncertain valueinto a specific value. We posit that, for reports of elapseddays, one of two related response processes may be used,commensurate with the uncertainty of the retrieved value.The first response process generates a response that directlyreflects the inexact value obtained from memory (we callthese raw responses). The second response process roundsthat value either to a conventional calendar prototype (i.e., 7,10,14,21,30, or 60) or to a conventional arithmetic prototype(i.e., a multiple of 5 or 10). Because uncertainty increases overtime, the effects of the bounding and rounding processes willbe more pronounced as the actual elapsed time increases.
The Study
Our purpose was to examine the sources of bias in answer-ing questions as to when an event occurred. Two types ofevent questions were used: One type requested the date of atarget event, and the other type requested the number of dayswhich had elapsed since that target event. Our purpose invarying the type of question was to investigate the form oftemporal representation in memory. Recall that date ques-tions should be easiest with calendar representation and mostdifficult with event sequence representation, compared withelapsed time questions, which should be intermediate in dif-ficulty with both forms of representation. Thus if date ques-tions are either much easier or much more difficult than
elapsed time questions, it would provide evidence concerningthe form of representation. As noted above, date questionswere very difficult, and we concluded that our target eventwas represented within an event sequence.
As we have indicated, event sequence representations (incontrast to calendar representations) might become distortedover time, leading to forward bias in reporting. Alternatively,objective time might be preserved in event sequences, andforward bias might arise because of bounding and/or round-ing in estimation. The imposition of an upper bound can bedetected in a set of data by the absence of reported valuesabove a given value despite the presence of true values abovethat level. The use of rounding (prototypic values) can bedetected in a set of data by a lack of correspondence betweenreported and true values in which certain values are overusedrelative to their true numbers. The conclusion that the over-used values are prototypes representative of larger temporalunits will be strengthened if the overused values reflect therounding conventions either of the calendar system and/orthe decimal system.
Our goal in designing the present study was to find a targetevent that would meet the following criteria. First, the eventshould be one which all subjects experience in essentially thesame way, thus avoiding variations in salience that couldpotentially affect estimation. Second, the event should be onewhich is distributed over time, so that particular characteris-tics of any unique date can be avoided. Third, the eventshould be one which is unlikely to be embedded in a largerevent cluster that could potentially complicate its temporalencoding and that might be represented differently acrosspeople. Fourth, the event should be one for which it is possibleto obtain a large number of reports so that the estimationmodel can be assessed.
We were able to implement a design that met all theserequirements. The target event was one to which a largerandom sample of people was exposed and which occurred atarbitrary times. Our target event was an interview of approx-imately 2 hr conducted in subjects' homes as part of theGeneral Social Survey (GSS). This survey is conducted eachyear by a survey organization associated with the Universityof Chicago (NORC, originally an acronym for National Opin-ion Research Center). In such surveys, a follow-up telephonecall (a "validation call") is made to some percentage of sub-jects to verify what occurred during the interviews. These callsare made at varying intervals after the interview—in theordinary course of events, within approximately 30 days(although this was deliberately altered in our third study). Theassignment of people to delay conditions is unsystematic. Wedesigned the temporal questions used in these validation calls.
Method
Three studies were carried out over a period of 3 years. The datamodeled in the article (reports of elapsed days) are combined overthe three studies (see Results). We describe the methods and goals ofeach of the studies separately. The study in the first year was designedto examine two issues. The first was people's ability to answerquestions about elapsed time versus dates. The other was to obtainpreliminary data to determine whether rounding occurred for ques-

REPORTS OF ELAPSED TIME 201
tions about elapsed days. There were 112 subjects in this study; 65were asked for the date of the interview, and 47 were asked how maydays ago the interview occurred. Only 15 subjects out of the 65 askedabout the date were willing to answer or even to give an educatedguess; in contrast 35 subjects out of the 47 asked about elapsed daysgave an answer. The answers to the elapsed time questions showedoveruse of particular values consistent with the rounding hypothesis.This first study showed that, at least for the event under study,representation involves an event sequence, not a calendar represen-tation. It also showed that more systematic examination of the effectsof rounding would be worthwhile.
The study in the second year included only questions about elapseddays. We presented a stronger probe to elicit an answer to the questionabout elapsed days when subjects responded to the initial questionby saying they did not know the answer. In this second-year studythere were 149 subjects, of whom 134 answered the elapsed daysquestion. There was considerable overuse of prototypic values. How-ever, in order to test our model systematically, more data were needed.Especially, we wanted to obtain data over a somewhat longer timeperiod to enable further exploration of use of prototypes.
The study in the third year extended the period over which vali-dation calls were made from the usual 30 day period to more than60 days. This was done to allow us to examine prototype usage overa longer time period. There were 629 subjects, 595 of whom reporteddays ago. We also added a general temporal question, prior to theelapsed days question, which simply asked when the interview hadtaken place. No probe was presented for this question. This questionwas included for two reasons. First, we wanted to determine if subjectstend spontaneously to answer in terms of elapsed time rather thandate, and second, we wanted to determine if the size of the temporalcategory subjects used in reporting (weeks, months) would increasewith actual elapsed time.
The data used to evaluate our model includes all the responses tothe elapsed days questions over the three studies for which the truetime of the home interview was available. The information about therelation between true and reported times is the critical data in fittingthe model. True times serve as the basis for the examination of bias.
Procedure
In all 3 years, the validation call began with an introduction asfollows:
I am calling from NORC at the University of Chicago. Recently,you were kind enough to allow one of our interviewers (name ofinterviewer) to interview you in connection with a study we areconducting. We always recheck some of the interviews by askinga few questions to make sure that the information we've collectedis accurate, and we also ask a few follow-up questions.
In all three studies, three different temporal questions were asked.The one analyzed in this article was "How many days ago did theinterview take place?" (This question preceded the other two ques-tions that concerned the day of the week and the hour of the day ofthe interview.) If subjects said they did not know how many days agothe interview took place, they were asked to "Please make your bestguess about the number of days." In the third year, an extra questionwas included after the introduction and before the specific questionabout elapsed days. Subjects were simply asked "When did theinterview take place?"
Subjects
The total number of subjects for whom reported days ago (andactual days ago) is available is 764 across the three studies. These
subjects were drawn from a larger sample group who had beeninterviewed earlier in their homes. The home interview is the GSSconducted each year by NORC, associated with the University ofChicago. The sampling frame for the GSS is based on the 1980census. The sample for the GSS is a probability sample of residentsaged 18 and older in households in the continental United States.Subjects for the validation call were a random sample of peopleinterviewed, stratified by interviewer and length of time since theoriginal interview. This smaller sample was contacted by telephone.Of the total group included here, 629, contacted in the third year,were asked the general first question.
Results
Spontaneous Choice of Temporal Categories
First, let us consider the distribution of answers to thegeneral question as to when the event occurred. The answersare shown in Table 1. Of the 629 persons presented with thisquestion, 104 said they could not remember and gave noanswer. Of the remainder, 72% of the responses were givenin terms of elapsed time. The next largest category, 10% ofresponses, simply stated the day of the week on which theinterview was remembered to have occurred. Only 4% ofsubjects produced an exact date (e.g., February 4).
Let us consider the answers stated in terms of elapsed time.There are differences in the reporting units used, and theseare related to the actual elapsed time since the home interview.Reports in weeks and in months are the predominant modesof responding. The proportion of reports in terms of weeksdecreases over time, while the proportion of reports in termsof months increases. Reports in months are rare until 5 weekshave elapsed, after which they rise rapidly relative to reportsin weeks. We will return to these data below because theyhave implications for the use of particular prototypic valuesin reports of the number of elapsed days since the homeinterview. For example, the elapsed time since an interviewthat actually occurred 43 days ago may be remembered bysome subjects in terms of weeks (6 weeks) and by othersubjects in terms of months (a month and a half)- One mightexpect differences between the subjects in the use of 42 versus45 days ago when they report the elapsed time in days.
Reports of Elapsed Days
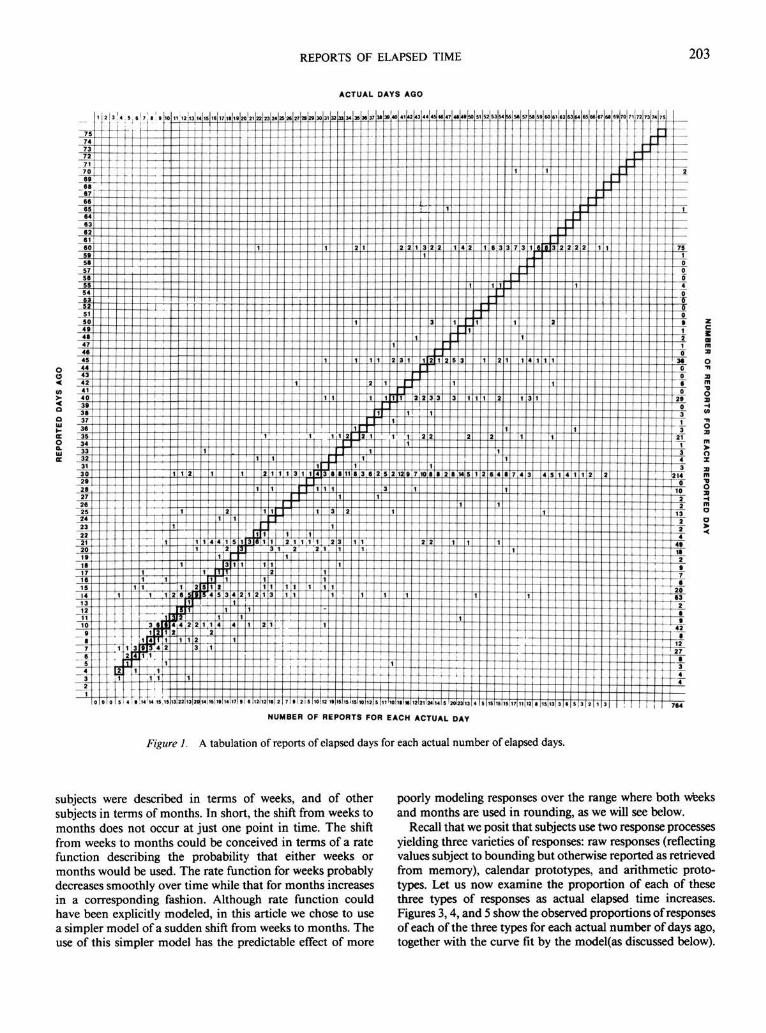
Now we turn to the reports of number of elapsed days.Figure 1 shows reported elapsed days against actual elapseddays for all subjects. Reports below the diagonal line indicatevalues that are smaller than actual elapsed time (forward bias),and reports above the diagonal line indicate values that arelarger than actual elapsed time (backward bias). Several fea-tures of the figure should be noted. First, more reports liebelow than above the line, indicating forward bias, except forthe upper right-hand portion of the graph where we approachthe maximum actual elapsed time. In that portion of thegraph the full range of actual days which would have beenassociated with various reports cannot be examined becausethere are few actual times that might potentially have beenmoved forward.

202 J. HUTTENLOCHER, L. HEDGES, AND N. BRADBURN
Table 1Type of Response to "When Did Interview Occur?" by Weeks Since Interview (N = 629)
Weekssince
interview
1No.Prop.
2No.Prop.
No.Prop.
No.Prop.
No.Prop.
No.Prop.
7
No.Prop.
Q
No.Prop.
Q
No.Prop.
10No.Prop.
Total
Daysago
1.04
1.02
1.02
1.02
4
'Ago" type only
Weeksago
8.30
31.45
30.47
14.43
19.28
14.19
13.12
10.12
6.09
145
Monthsago
2.03
2.06
33.48
34.46
55.47
50.59
46.63
11.79
233
"Calendar"
Cal.day
5.08
4.07
4.06
5.03
2.03
20
Cal.week
1.02
2.03
3
type only
Cal.month
1.02
1.03
3.05
1.02
9.08
4.05
5.07
1.08
25
"Ago" +"Cal."
1.04
2.03
2.03
2.02
7
Day ofweekonly
10.37
10.15
8.13
7.22
1.02
4.06
6.06
3.04
1.02
50
Day ofweek +Other
6.23
14.20
10.16
1.03
2.03
1.02
2.03
36
ReferenceTo
landmark
1.03
1.02
1.01
1.08
4
Noresponse
1.04
9.13
7.11
7.22
6.09
20.27
26.23
12.14
15.21
1.08
104
Totalinterviews
27
70
65
33
69
75
117
86
73
14
629
Note. No. = number; Prop. = proportion.
One feature of the data is the virtual absence of reportsgreater than 60 days. There are only 3 values greater than 60.Indeed, there are 37 cases where the true number of elapseddays is greater than 60 days; none of these were reported asoccurring more than 60 days ago. Thus it appears that thereis an aspect of the reporting process (i.e., an imposed upperbound) which constrains reports to fall at the prototypic valueof 60 days or less.
A second feature of the data is the uneven distribution ofreports over the range of possible days. This uneven distri-bution constitutes evidence of use of prototypic values inreporting. Our choice of calendar prototypes was determinedby recognized cultural usage; we chose 7, 10, 14, 21, 30, and60 days as calendar prototypes. We distinguish these proto-types from multiples of 5 while recognizing that some of them(10, 30, 60) are numerically multiple of 5. We do so because30 and 60 days are well recognized synonyms for 1 or 2months, and 10 days is a frequent synonym for a week and ahalf. It should be noted that the prototypes may reflect someintrusion of the decimal system into the calendar system inthat the modal month actually is 31 days, and a week-and-a-half is 10.5 days. These particular numbers are much morefrequently used in connection with elapsed time than areother multiples of 5.
Our selection of prototypes is validated by the observeddistribution of reports. Although these six values chosen asprototypes constitute less than 10% of the values falling inthe total range of reports, they make up 70% of the reports.Five of these values are the five most frequent responses (theonly values with over 40 reports). The remaining prototype(7 days) is of obvious importance in the calendar, even thoughthe frequency of reporting at 7 days is somewhat lower thanthe other prototypes; the lower frequency of reports at 7 daysis to be expected because memory for recent dates is moreaccurate, and consequently people make less frequent use ofprototypes in the recent past.
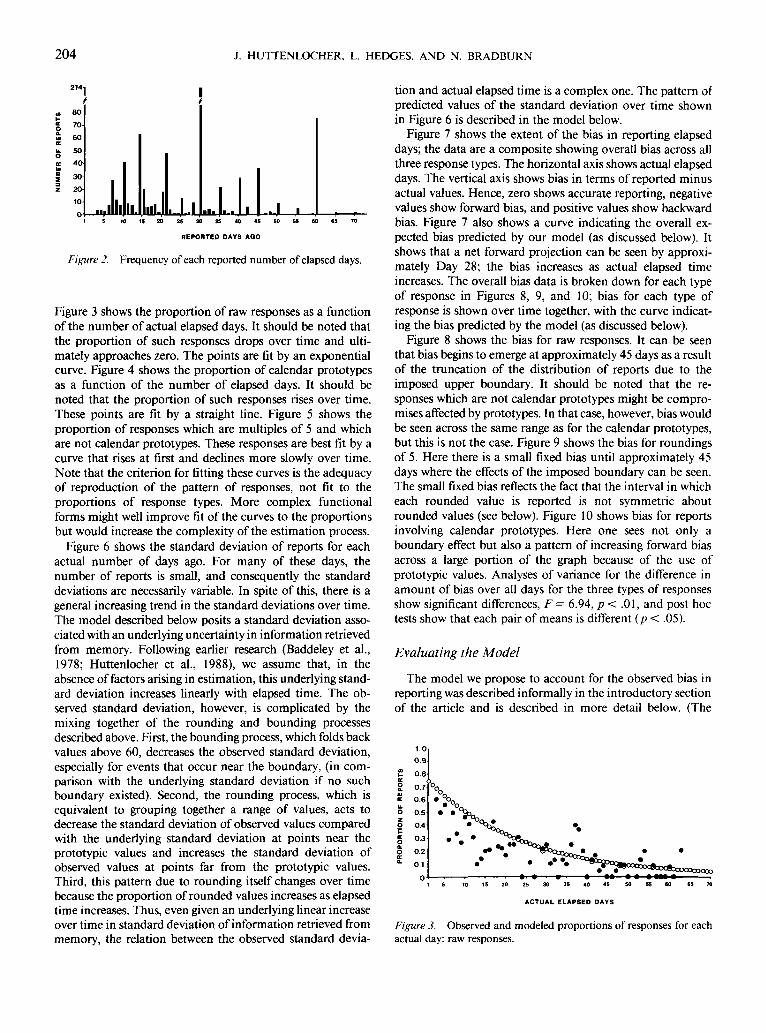
The unevenness of the distribution of reports is seen inFigure 1 by examining the prominence of horizontal lines atcertain values. A bar graph of reported elapsed days is shownin Figure 2. The great frequency of responses involving cal-endar prototypes can be noted. Roundings by fives are over-used to some extent. Rounding to 45 is overused relative toother roundings by 5s, as might be expected if it is used tostand for a month and a half. It also can be noted that 28 and42 are to some extent overused. These values are roundingsto 4 and 6 weeks, respectively. As we saw above in examiningthe data on the general time question, when the actual elapsedtime was in the range of 4-6 weeks, the reports of some
REPORTS OF ELAPSED TIME 203
ACTUAL DAYS AGO
Oo
a
o
75MM727170
666766
64636261
59565756555463525150494647464544434241403936ilJ6
34333231
2«2627262524232221
1916
15141.11211109676
32
i
1 2 3 4
—
I
r
s
I—
1.9 1
1-
1 1i
1
3 I £
1B1TT•JJT4 iT
-
i
-4-14 1S1
0 11
1
2
5 3
12 1
1
1
Mrn
22 13
3 1
1
it
il
2
3
20
15
1
4
1T
1
7
12
&
17
1
11
2
T
5
T4
3Ti
3
1
1
1
5
1
1
4
1
20
i
i ;
2
T
i
22
1
1
T\
2 24
1
Ti
1i
2
2
1
1
1
1
T~
1
6 j 2
25 2 .
1
27
1
2 1
il
" i"i
I
;
1
2 ,
29
11
1
5
30 3
1
1
1
1
1
0
1
T1
T
--12
32
1
1
3
1
1
33
1
J
L
s
34
2
35
1
1
1
1
*
5
36 37 3
1 '
1
, 1
I
I
0 2~[s"
39
t
1
3
,—
1
11
40
1
2
1
1
1
0
41 42
3 1
1
M
1
• *
43 4
1
1
1
2 2
i
2
J—
4
3
2
J
1
"
1
2
1
J
4
4
1
2
S
1
5 3
I
J
1
1
50 5
)
11
I 1
3 4
1
1
53
1
•
; •
b 1
54 55
1
! 1
!
I
i
It 5
M
1
1
57
1
1
1
7 1 1
5
1
60
1
1
b 1
61 62 6.
1
1 3 •
64 6.
1
5 3
66 6
-
1
6 1 6 9 It 7
—
•
72 73U
1
1
75
2
00040
60t1210
360060
2t0313
1341
010
22
13224
2
63| 2
•42
—rf27A
44_
764
NUMBER OF REPORTS FOR EACH ACTUAL DAY
Figure J. A tabulation of reports of elapsed days for each actual number of elapsed days.
zc
subjects were described in terms of weeks, and of othersubjects in terms of months. In short, the shift from weeks tomonths does not occur at just one point in time. The shiftfrom weeks to months could be conceived in terms of a ratefunction describing the probability that either weeks ormonths would be used. The rate function for weeks probablydecreases smoothly over time while that for months increasesin a corresponding fashion. Although rate function couldhave been explicitly modeled, in this article we chose to usea simpler model of a sudden shift from weeks to months. Theuse of this simpler model has the predictable effect of more
poorly modeling responses over the range where both weeksand months are used in rounding, as we will see below.
Recall that we posit that subjects use two response processesyielding three varieties of responses: raw responses (reflectingvalues subject to bounding but otherwise reported as retrievedfrom memory), calendar prototypes, and arithmetic proto-types. Let us now examine the proportion of each of thesethree types of responses as actual elapsed time increases.Figures 3,4, and 5 show the observed proportions of responsesof each of the three types for each actual number of days ago,together with the curve fit by the model(as discussed below).
204 J. HUTTENLOCHER, L. HEDGES, AND N. BRADBURN
80
70
60
50
40
30
20
10- •.llhllL ill. _L10 15 20 25 30 35 40 45 55 60 65 70
REPORTED DAYS AGO
Figure 2. Frequency of each reported number of elapsed days.
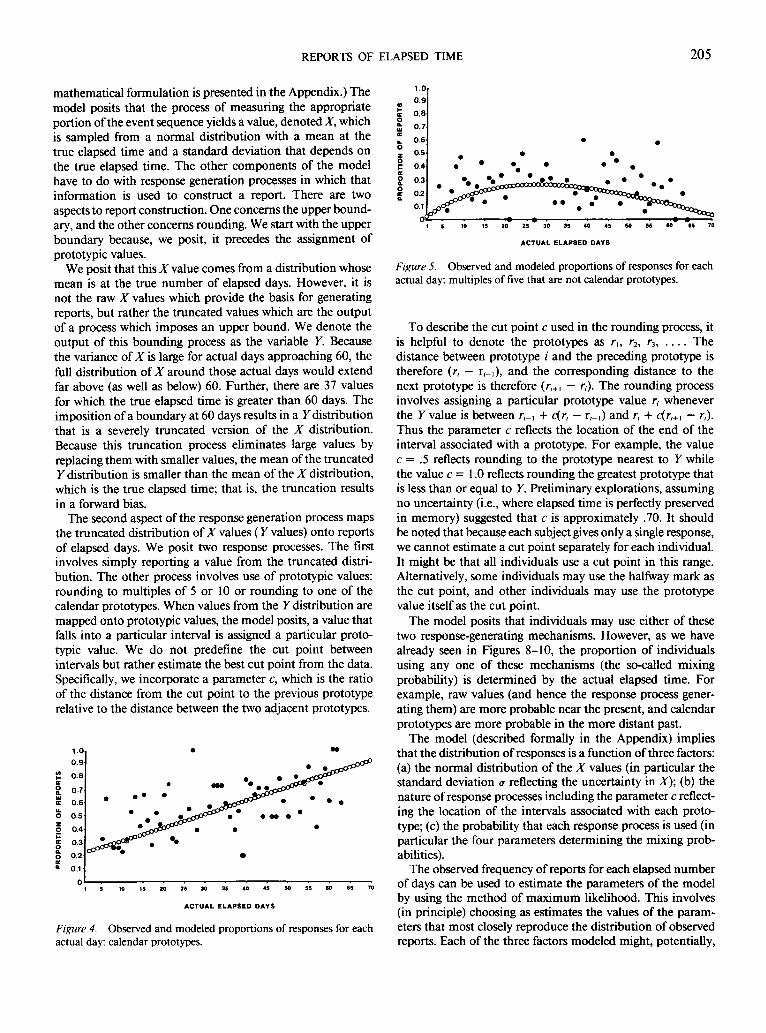
Figure 3 shows the proportion of raw responses as a functionof the number of actual elapsed days. It should be noted thatthe proportion of such responses drops over time and ulti-mately approaches zero. The points are fit by an exponentialcurve. Figure 4 shows the proportion of calendar prototypesas a function of the number of elapsed days. It should benoted that the proportion of such responses rises over time.These points are fit by a straight line. Figure 5 shows theproportion of responses which are multiples of 5 and whichare not calendar prototypes. These responses are best fit by acurve that rises at first and declines more slowly over time.Note that the criterion for fitting these curves is the adequacyof reproduction of the pattern of responses, not fit to theproportions of response types. More complex functionalforms might well improve fit of the curves to the proportionsbut would increase the complexity of the estimation process.
Figure 6 shows the standard deviation of reports for eachactual number of days ago. For many of these days, thenumber of reports is small, and consequently the standarddeviations are necessarily variable. In spite of this, there is ageneral increasing trend in the standard deviations over time.The model described below posits a standard deviation asso-ciated with an underlying uncertainty in information retrievedfrom memory. Following earlier research (Baddeley et al.,1978; Huttenlocher et al., 1988), we assume that, in theabsence of factors arising in estimation, this underlying stand-ard deviation increases linearly with elapsed time. The ob-served standard deviation, however, is complicated by themixing together of the rounding and bounding processesdescribed above. First, the bounding process, which folds backvalues above 60, decreases the observed standard deviation,especially for events that occur near the boundary, (in com-parison with the underlying standard deviation if no suchboundary existed). Second, the rounding process, which isequivalent to grouping together a range of values, acts todecrease the standard deviation of observed values comparedwith the underlying standard deviation at points near theprototypic values and increases the standard deviation ofobserved values at points far from the prototypic values.Third, this pattern due to rounding itself changes over timebecause the proportion of rounded values increases as elapsedtime increases. Thus, even given an underlying linear increaseover time in standard deviation of information retrieved frommemory, the relation between the observed standard devia-
tion and actual elapsed time is a complex one. The pattern ofpredicted values of the standard deviation over time shownin Figure 6 is described in the model below.
Figure 7 shows the extent of the bias in reporting elapseddays; the data are a composite showing overall bias across allthree response types. The horizontal axis shows actual elapseddays. The vertical axis shows bias in terms of reported minusactual values. Hence, zero shows accurate reporting, negativevalues show forward bias, and positive values show backwardbias. Figure 7 also shows a curve indicating the overall ex-pected bias predicted by our model (as discussed below). Itshows that a net forward projection can be seen by approxi-mately Day 28; the bias increases as actual elapsed timeincreases. The overall bias data is broken down for each typeof response in Figures 8, 9, and 10; bias for each type ofresponse is shown over time together, with the curve indicat-ing the bias predicted by the model (as discussed below).
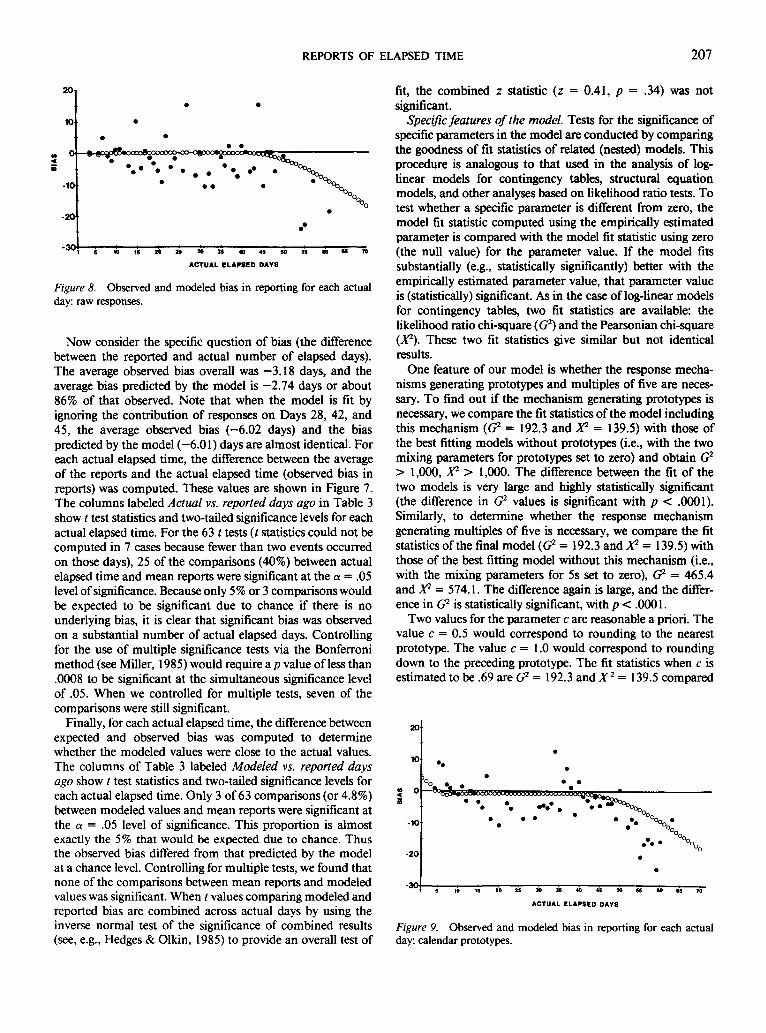
Figure 8 shows the bias for raw responses. It can be seenthat bias begins to emerge at approximately 45 days as a resultof the truncation of the distribution of reports due to theimposed upper boundary. It should be noted that the re-sponses which are not calendar prototypes might be compro-mises affected by prototypes. In that case, however, bias wouldbe seen across the same range as for the calendar prototypes,but this is not the case. Figure 9 shows the bias for roundingsof 5. Here there is a small fixed bias until approximately 45days where the effects of the imposed boundary can be seen.The small fixed bias reflects the fact that the interval in whicheach rounded value is reported is not symmetric aboutrounded values (see below). Figure 10 shows bias for reportsinvolving calendar prototypes. Here one sees not only aboundary effect but also a pattern of increasing forward biasacross a large portion of the graph because of the use ofprototypic values. Analyses of variance for the difference inamount of bias over all days for the three types of responsesshow significant differences, F — 6.94, p < .01, and post hoctests show that each pair of means is different (p < .05).
Evaluating the Model
The model we propose to account for the observed bias inreporting was described informally in the introductory sectionof the article and is described in more detail below. (The
ITS
:PO
F
cc
o
HO
I.
IOP
OR
1
a
1 0
0 .9
0.8
0.7
0.6
0.5
0.4
0.3
02
0.1
ACTUAL ELAPSED DAYS
Figure 3. Observed and modeled proportions of responses for eachactual day: raw responses.
REPORTS OF ELAPSED TIME 205
mathematical formulation is presented in the Appendix.) Themodel posits that the process of measuring the appropriateportion of the event sequence yields a value, denoted X, whichis sampled from a normal distribution with a mean at thetrue elapsed time and a standard deviation that depends onthe true elapsed time. The other components of the modelhave to do with response generation processes in which thatinformation is used to construct a report. There are twoaspects to report construction. One concerns the upper bound-ary, and the other concerns rounding. We start with the upperboundary because, we posit, it precedes the assignment ofprototypic values.
We posit that this X value comes from a distribution whosemean is at the true number of elapsed days. However, it isnot the raw X values which provide the basis for generatingreports, but rather the truncated values which are the outputof a process which imposes an upper bound. We denote theoutput of this bounding process as the variable Y. Becausethe variance of X is large for actual days approaching 60, thefull distribution of X around those actual days would extendfar above (as well as below) 60. Further, there are 37 valuesfor which the true elapsed time is greater than 60 days. Theimposition of a boundary at 60 days results in a Y distributionthat is a severely truncated version of the X distribution.Because this truncation process eliminates large values byreplacing them with smaller values, the mean of the truncatedY distribution is smaller than the mean of the X distribution,which is the true elapsed time; that is, the truncation resultsin a forward bias.
The second aspect of the response generation process mapsthe truncated distribution of X values (Y values) onto reportsof elapsed days. We posit two response processes. The firstinvolves simply reporting a value from the truncated distri-bution. The other process involves use of prototypic values:rounding to multiples of 5 or 10 or rounding to one of thecalendar prototypes. When values from the Y distribution aremapped onto prototypic values, the model posits, a value thatfalls into a particular interval is assigned a particular proto-typic value. We do not predefine the cut point betweenintervals but rather estimate the best cut point from the data.Specifically, we incorporate a parameter c, which is the ratioof the distance from the cut point to the previous prototyperelative to the distance between the two adjacent prototypes.
1.0
0.9
™ 0.8
I 0.7UJ
oc 0.6
O 0.5
O 0.4
g 0.30 0.2DC1 0.1
ACTUAL ELAPSED DAYS
Figure 4. Observed and modeled proportions of responses for eachactual day: calendar prototypes.
Figure 5. Observed and modeled proportions of responses for eachactual day: multiples of five that are not calendar prototypes.
To describe the cut point c used in the rounding process, itis helpful to denote the prototypes as r,, r2, r3, Thedistance between prototype / and the preceding prototype istherefore (r, — r,_,), and the corresponding distance to thenext prototype is therefore (r,+i — rt). The rounding processinvolves assigning a particular prototype value r, wheneverthe Y value is between r,_i + c(n — r;_i) and r, + c(r,+i — rt).Thus the parameter c reflects the location of the end of theinterval associated with a prototype. For example, the valuec = .5 reflects rounding to the prototype nearest to Y whilethe value c = 1.0 reflects rounding the greatest prototype thatis less than or equal to Y. Preliminary explorations, assumingno uncertainty (i.e., where elapsed time is perfectly preservedin memory) suggested that c is approximately .70. It shouldbe noted that because each subject gives only a single response,we cannot estimate a cut point separately for each individual.It might be that all individuals use a cut point in this range.Alternatively, some individuals may use the halfway mark asthe cut point, and other individuals may use the prototypevalue itself as the cut point.
The model posits that individuals may use either of thesetwo response-generating mechanisms. However, as we havealready seen in Figures 8-10, the proportion of individualsusing any one of these mechanisms (the so-called mixingprobability) is determined by the actual elapsed time. Forexample, raw values (and hence the response process gener-ating them) are more probable near the present, and calendarprototypes are more probable in the more distant past.
The model (described formally in the Appendix) impliesthat the distribution of responses is a function of three factors:(a) the normal distribution of the X values (in particular thestandard deviation a reflecting the uncertainty in X); (b) thenature of response processes including the parameter c reflect-ing the location of the intervals associated with each proto-type; (c) the probability that each response process is used (inparticular the four parameters determining the mixing prob-abilities).
The observed frequency of reports for each elapsed numberof days can be used to estimate the parameters of the modelby using the method of maximum likelihood. This involves(in principle) choosing as estimates the values of the param-eters that most closely reproduce the distribution of observedreports. Each of the three factors modeled might, potentially,

206 J. HUTTENLOCHER, L. HEDGES, AND N. BRADBURN
1 5 10 15 20 25 30 35 *0 45 50 55 60 65 70
Figure 6. Observed and modeled standard deviations of responsesfor each actual elapsed number of days.
involve a large number of parameters, but empirical regular-ities in the data (or earlier data) allowed us to greatly reducethe number of parameters used in the model. First, we as-sumed that the underlying standard deviation of observedreports increases linearly with elapsed time, consistent withearlier findings on reports of dates (Huttenlocher et ah, 1988).Thus, instead of estimating a independently for each day,resulting in 70 parameters, we estimated the coefficients of alinear relation between a and elapsed time by using just 2parameters, namely, the slope and the intercept of the linearrelation. Second, the mixing proportions might be differentfor each actual day, resulting in 2 x 70 = 140 parameters.However, the proportion of prototypical reports increasedlinearly, and raw responses decreased exponentially withelapsed time. (The proportion of multiples of 5 is determinedby the proportions of raw responses and prototypes.) Hence,we estimated the coefficients of an exponential (for raw re-sponses) and a linear relation (for prototypical responses)between elapsed time and the probability of each type ofresponse; this resulted in a total of four parameters (two forthe exponential and two for the linear relationship) for themixing proportions. Third, the cutting point c might bedifferent for each prototypic value, resulting in 15 parameters(one for each of the six prototypes plus 9 for each of thenonprototype multiples of 5). However, the c values estimatedindependently for each prototype and multiple of 5 were quitesimilar in value. Hence, we constrained the c values for all 15distinct prototypic values to be the same and obtained oneparameter.
Our empirical modeling strategy is not an attempt to opti-mally account for every feature of the data so as to achievethe best fit possible, with the attendant price of increasingcomplexity. Instead, we examine a relatively simple modelwhose general features are derived from theoretical as opposedto empirical considerations. We explore the degree to whichthis model is consistent with the data we have collected, andwe explore the discrepancies between the predictions of themodel and the data.
The observed data were used to estimate simultaneouslythe seven parameters of the model via the method of maxi-mum likelihood. The first concern in evaluating the model iswhether it accurately reproduces the distribution of the ob-served data (the number of reports of each number of elapsed
days, for each actual number of elapsed days). If it reproducesthe entire distribution of responses, it must, of course, accountfor bias and other specific features of the data distribution.The degree to which the model reproduces the distribution ofobserved data is assessed by means of two fit statistics: thelikelihood ratio chi-square statistic (G2) and the Pearsonianchi-square square statistic (X1). These two statistics are anal-ogous to those used in the log-linear analysis of contingencytables and give similar but not identical results (see the Ap-pendix). After estimating the values of the seven model pa-rameters by using the method of maximum likelihood, wefound that the values of the fit statistics were G2 = 192.3 andX2 = 139.5. Both of these values are statistically significant atthe p < .02 level, indicating that the distribution of responsespredicted by the model departed from that observed in thedata.
To examine where the model fails to fit, examine Table 2,which provides the actual (observed) number of each elapsednumber of days, the number of responses predicted (expected)by the model, and the contribution of that response to thePearsonian chi-square statistic. It is clear from Table 2 thatthe three largest contributions to the misfit are the larger thanexpected number of responses on Days 28, 42, and 45. Recallthat we expected that these values might misfit because of ourchoice of an unrealistically simple transition from the use ofweeks to months at a single point. This misfitting seems tosuggest that the use of weeks persists to the point of 4 and 6weeks (28 and 42 days) and perhaps that a "month and halfserves as a kind of prototype so that some people use 6 weeksand 45 days to indicate this prototype. The values of the fitstatistics computed for all responses except 28, 42, or 45 dayswere G2 = 27.6 and X2 = ll.l. These values are not statisticallysignificant. Comparing these values with their null samplingdistributions (i.e., the distribution of the fit statistics omittingresponses of 28, 42, and 45 days but assuming perfect fitelsewhere), we see that values of X1 as large as X2 = 13 Jwould occur due to chance between 15% and 20% of thetime, and values as large as G2 = 27.6 would occur over 80%of the time. Hence, except for underpredicting responses of28, 42, and 45 days, the model adequately reproduces theobserved distribution of responses.
2Or
Figure 7. Observed and modeled bias in reporting for each actualnumber of elapsed days.
REPORTS OF ELAPSED TIME 207
20
10
-10
-20
-30 5 W 1 5 » » » 3 J 4 0 4 S 5
ACTUAL ELAPSED DAYS
Figure 8. Observed and modeled bias in reporting for each actualday: raw responses.
Now consider the specific question of bias (the differencebetween the reported and actual number of elapsed days).The average observed bias overall was —3.18 days, and theaverage bias predicted by the model is -2.74 days or about86% of that observed. Note that when the model is fit byignoring the contribution of responses on Days 28, 42, and45, the average observed bias (-6.02 days) and the biaspredicted by the model (-6.01) days are almost identical. Foreach actual elapsed time, the difference between the averageof the reports and the actual elapsed time (observed bias inreports) was computed. These values are shown in Figure 7.The columns labeled Actual vs. reported days ago in Table 3show / test statistics and two-tailed significance levels for eachactual elapsed time. For the 63 t tests (t statistics could not becomputed in 7 cases because fewer than two events occurredon those days), 25 of the comparisons (40%) between actualelapsed time and mean reports were significant at the a = .05level of significance. Because only 5% or 3 comparisons wouldbe expected to be significant due to chance if there is nounderlying bias, it is clear that significant bias was observedon a substantial number of actual elapsed days. Controllingfor the use of multiple significance tests via the Bonferronimethod (see Miller, 1985) would require a p value of less than.0008 to be significant at the simultaneous significance levelof .05. When we controlled for multiple tests, seven of thecomparisons were still significant.
Finally, for each actual elapsed time, the difference betweenexpected and observed bias was computed to determinewhether the modeled values were close to the actual values.The columns of Table 3 labeled Modeled vs. reported daysago show t test statistics and two-tailed significance levels foreach actual elapsed time. Only 3 of 63 comparisons (or 4.8%)between modeled values and mean reports were significant atthe a = .05 level of significance. This proportion is almostexactly the 5% that would be expected due to chance. Thusthe observed bias differed from that predicted by the modelat a chance level. Controlling for multiple tests, we found thatnone of the comparisons between mean reports and modeledvalues was significant. When / values comparing modeled andreported bias are combined across actual days by using theinverse normal test of the significance of combined results(see, e.g., Hedges & Olkin, 1985) to provide an overall test of
fit, the combined z statistic (z = 0.41, p = .34) was notsignificant.
Specific features of the model. Tests for the significance ofspecific parameters in the model are conducted by comparingthe goodness of fit statistics of related (nested) models. Thisprocedure is analogous to that used in the analysis of log-linear models for contingency tables, structural equationmodels, and other analyses based on likelihood ratio tests. Totest whether a specific parameter is different from zero, themodel fit statistic computed using the empirically estimatedparameter is compared with the model fit statistic using zero(the null value) for the parameter value. If the model fitssubstantially (e.g., statistically significantly) better with theempirically estimated parameter value, that parameter valueis (statistically) significant. As in the case of log-linear modelsfor contingency tables, two fit statistics are available: thelikelihood ratio chi-square (G2) and the Pearsonian chi-square(X2). These two fit statistics give similar but not identicalresults.
One feature of our model is whether the response mecha-nisms generating prototypes and multiples of five are neces-sary. To find out if the mechanism generating prototypes isnecessary, we compare the fit statistics of the model includingthis mechanism (G2 = 192.3 and X2 = 139.5) with those ofthe best fitting models without prototypes (i.e., with the twomixing parameters for prototypes set to zero) and obtain G2
> 1,000, X2 > 1,000. The difference between the fit of thetwo models is very large and highly statistically significant(the difference in G2 values is significant with p < .0001).Similarly, to determine whether the response mechanismgenerating multiples of five is necessary, we compare the fitstatistics of the final model (G2 = 192.3 and X2 = 139.5) withthose of the best fitting model without this mechanism (i.e.,with the mixing parameters for 5s set to zero), G2 = 465.4and X2 = 574.1. The difference again is large, and the differ-ence in G2 is statistically significant, with p < .0001.
Two values for the parameter c are reasonable a priori. Thevalue c = 0.5 would correspond to rounding to the nearestprototype. The value c = 1.0 would correspond to roundingdown to the preceding prototype. The fit statistics when c isestimated to be .69 are G2 = 192.3 and^T2 = 139.5 compared
20
10
-10
-20
-30-
—°95o3W53»!5SBBBBB8SBB8B!JBBSSOi
I S 10 IS 20 2S M 3S 40 45 50 S5 SO U TO
ACTUAL ELAPSED DAYS
Figure 9. Observed and modeled bias in reporting for each actualday: calendar prototypes.

208 J. HUTTENLOCHER, L. HEDGES, AND N. BRADBURN
20
10
-20
-301 5 10 15 20 25 30 35 40 45
ACTUAL ELAPSED DAYS
55 60 65 70
Figure 10. Observed and modeled bias in reporting for each actualday: multiples of five that are not calendar prototypes.
with G2 = 518.7 and X2 > 1,000 when c = 1.0, and G2 =234.9 and X2 = 189.6 when c = .5. Hence, the estimatedvalue of c = .69 is significantly different (p < .001) than eitherc = .5 or c = 1.0.
We also tested certain other features of the model parame-terization. For example, we tested whether the proportion ofmultiples of five fit a linear curve as well as they fit anexponential curve (they did not) and whether the standarddeviations might increase nonlinearly with true time of oc-currence (they do not).
Discussion
We have obtained reports from people as to when a targetevent (a home interview) occurred. People tended to reportthis target event in terms of the amount of time that hadelapsed since it occurred, not in terms of calendar date. Theevidence is striking. First, in the initial study, half the subjectswere asked about elapsed time, and the other half were askedabout the date of the target event. Whereas 75% of subjectsasked about elapsed time produced an answer, only 23% ofthe subjects asked about the date produced an answer. Second,in the final study we included a question that could beanswered in terms of either elapsed time or date and by usingunits at any level of detail (weeks, months). Of the peoplewho answered, 72% used elapsed time in their reports; only4% gave an exact date.
The major focus of the studies was the relation betweenactual and reported numbers of elapsed days since a targetevent. Forward bias was found in people's reports. We pro-posed a model in which bias is not the result of misrepresen-tation of elapsed time in memory. The model posits thatmemory is unbiased, but increasingly inexact over time, withbias arising in the process of generating responses to thequestions asked. The model posits two factors that contributeto bias in estimating elapsed days: the imposition of an upperboundary and the use of prototypic values. We found thatthese two factors, arising in the reporting process, fully ac-count for the observed bias in reporting.
Consider first the imposed upper boundary on reports. Thedata clearly showed that 60 days was an upper boundary.Huttenlocher et al. (1988) showed that for questions in whichreporting period boundaries were stated, forward bias could
be explained by inexactness in memory for dates; this resultedin truncation of the distribution of reports near the boundary.The present study shows that subjects may impose boundariesnot explicitly stated in the question. In our model, this bound-
Table 2Comparison of Observed and Expected Number of Reportsof Each Elapsed Time
Report
123456789
101112131415161718192021222324252627282930313233343536373839404142434445464748495051525354555657585960
Number
Observed
0.0000.0004.0004.0003.0008.000
27.00012.0008.000
42.0009.0008.0002.000
63.00020.0006.0007.0009.0002.000
18.00049.000
4.0002.0002.000
13.0002.0002.000
10.0000.000
214.0003.0004.0003.0001.000
21.0003.0001.0003.0000.000
29.0000.0006.0000.0000.000
36.0000.0001.0002.0001.0009.0000.0000.0000.0000.0004.0000.0000.0000.0001.000
75.000
Expected
0.0100.1841.1382.881
11.2415.877
25.0277.7657.875
43.1927.6577.4617.181
42.26223.620
5.8885.4004.9184.451
18.64346.255
3.2672.9762.740
15.7492.4112.3042.2282.176
214.3702.1232.1092.0972.081
17.9062.028
1
1(
1'
1
.991
.948
.9007.629.799.748.697.647
3.366.547.497.446.395
J.289.288.233.178.122.521.010
0.9550.8990.845
79.888
x2
0.0100.1847.2020.4356.0410.7670.1562.3090.0020.0330.2360.0393.738
10.1760.5550.0020.4743.3881.3500.0220.1630.1650.3200.2000.4800.0700.040
27.1132.1760.0010.3621.6950.3890.5610.5350.4660.4930.5681.9007.3341.799
10.3451.6971.647
23.5561.5470.1650.2120.1121.9581.2881.2331.1781.1224.9091.0100.9550.8990.0280.299

REPORTS OF ELAPSED TIME 209
Table 3Observed and Expected Bias for Each Actual Elapsed Time
Day
456789
101112131415161718192021222324252627282930313233343536373839404142434445464748495051525354555657585960616263646568
Actual v<>. reporteddays ago
/
1.1912.4491.0751.8640.322
-1.6060.5241.2851.6120.615
-1.4530.795
-0.168-1.435
0.000-2.786-0.727-2.166
0.759-1.061-2.756
0.000-2.862-0.777-0.556-1.247-2.418-0.620-3.485-4.598-5.797
0.392-1.351-1.333-1.212-4.172-1.541-1.880-2.496-2.640-2.568-3.396-2.924-2.194-4.773-4.696-3.115-2.280-1.976-2.296-3.977-5.504-3.089-3.740-5.824-1.163-2.998-5.347-1.200-3.637-2.491-1.500-1.156
P
0.3000.0920.3140.0860.7520.1300.6080.2240.1220.5500.1620.4400.8680.1680.5000.014*0.4880.0820.4640.3120.014*0.5000.028*0.4600.6780.2800.038*0.5480.002*0.000**0.000**0.7000.2100.2100.2920.002*0.1580.0780.024*0.022*0.018*0.002*0.012*0.1160.000**0.000**0.008*0.1060.1200.038*0.002*0.000**0.008*0.004*0.000**0.2840.010*0.000**0.3540.014*0.0680.2720.368
Modeled vs. reporteddays ago
t
0.7631.1260.9001.9650.671
-1.1110.8721.5252.0470.862
-0.7731.2760.303
-0.6820.747
-2.128-0.255-1.721
1.039-0.625-2.076
0.220-2.288-0.371-0.259-0.822-1.230-0.141-1.882-2.574-1.287
1.552-0.333
1.2880.251
-1.765-0.152
0.463-0.453-0.504-0.321-0.557-0.758-0.725-1.726-2.294-1.240-1.380-0.691-0.324-1.713-2.949-0.920-1.391-2.933
2.334-0.346-2.069
0.002-1.629-0.378-0.087-2.800
P
0.4880.3420.3940.0720.5140.2860.3980.1540.0540.4060.4500.2240.7660.5040.4680.0500.8060.1460.3220.5440.0560.8620.0620.7200.8380.4580.2500.8900.0760.022*0.2200.1440.7460.2240.8140.1080.8820.6500.6560.6240.7520.5840.4610.5220.1000.0640.2380.2620.5280.7500.1080.010*0.3720.1940.014*0.0520.7340.0600.9980.1640.7240.9380.108
Note. Negative t values indicate that reported days is the smaller of thetwo values under comparison. A * following a p value indicates that it isstatistically significant at the .05 level of significance with no controls formultiple testing. A ** following a p value indicates that it is also statisticallysignificant at the .05 level when the Bonferroni method is used to controlfor the effects of repeated significance tests.
ary is imposed on the unbiased but inexact informationretrieved from memory, which leads to forward bias.
Consider next the use of rounded values in reporting. Thedata show striking overuse of certain culturally establishedprototypic values, namely 7, 10, 14, 21, 30, and 60 days. Weposited that the temporal information retrieved from memoryis assigned one of three sorts of values: raw values, valuesrounded by 5, or calendar prototypes. Raw responses fall offwith time as memory becomes less exact, and calendar pro-totypes increase with time for the same reason. Calendarprototypes increase in distance over time, changing fromrounding in weeks (expressed in multiples of 7) to roundingsin months (expressed in multiples of 30). Thus, the use ofprototypic values reflects what subjects remember aboutelapsed time. The distance between prototypic values in-creases over time, so for each prototypic value the range oflarger values rounded down is broader than the range ofsmaller values rounded up, and this leads to forward bias.The increase in distance between calendar prototypes (reflect-ing the units used) surely will vary for different people andfor events which differ in salience. We did not model suchrate variation in the increase in unit size over time.
By incorporating just two sources of forward bias (an im-posed boundary and a particular set of prototypic values) intoa quantitative model, we were able to account remarkablywell for observed bias in reporting. That is, for each actualnumber of elapsed days, the predicted number of reports wasvery close to the actual number of reports. Only 3 days outof 60 were poorly fit (28, 42, and 45 days), and these showthe effects of variation in the ways of assigning prototypicvalues. The overuse of 28 reflects rounding in terms of weeksor an alternative representation of a month. The overuse of45, relative to other roundings to 5s, reflects the value for amonth and a half for subjects using months as the unit, andsimilarly the overuse of 42 may reflect the continued use ofweeks or 6 weeks for a month and a half.
Issues Concerning Mental Representation
Our findings are relevant to two issues concerning mentalrepresentation raised in the introduction. First, the findingsprovide evidence about the way temporal information ispreserved in autobiographical memory. Second, the findingsprovide evidence concerning the role of temporal prototypesin which particular values are used to stand for larger cate-gories.
Temporal representation in autobiographical memory. Wehave noted that although it is obvious that autobiographicalmemory preserves (to some extent) the order and metriccontinuity of events in time, there has not yet been a system-atic evaluation of the form in which this information isrepresented. We distinguished between calendar representa-tion, in which the time of events is preserved in terms of anoutside temporal framework, and event sequence representa-tion, in which the time of events is preserved in relation toone another. We noted that the relative difficulty of questionsabout date versus questions about elapsed time might provideevidence about the form of representation. Date questionsshould be harder than elapsed time questions with eventsequence representation, but the opposite should be the case
210 J. HUTTENLOCHER, L. HEDGES, AND N. BRADBURN
with calendar representation. Our subjects were more easilyable to report the number of days that had elapsed since atarget event than to report its date. This strongly suggests thatthe target event is represented within an event sequence. Sotoo does the fact that subjects most frequently answered ageneral question as to when an event occurred in terms ofelapsed time, not date.
Event sequence representation, we suggested, might lead todistortion of objective time in memory through loss frommemory of events which form part of the sequence. In fact,the general pattern of reports obtained—showing increasingbias over time—is surely consistent with a pattern of increas-ing misrepresentation of temporal information over time.However, we found no evidence of such misrepresentation inmemory. The forward bias observed could be explained fullyon the basis of two factors arising in the process of producingan estimate. Subjects imposed an upper bound on their re-ports, and there was extensive overuse of certain values.Neither of these aspects of the data reflects misrepresentationin memory. Thus here, as in Huttenlocher et al.'s (1988)study, we conclude that objective time is preserved in memoryand that there is no need for a psychological scaling of time.
So compelling is the argument that temporal representationbased on event sequences should lead to a progressive shrink-age of psychological time relative to objective time that itsuggests that the representation of temporal information inautobiographical memory is not based solely on event se-quence representation. The view that temporal informationis preserved via some combination of these two modes ofrepresentation is not a novel one. It is clear that for certainpersonal and public events (e.g., birthdays, presidential inau-gurations), the full date is remembered. Further, it is clearthat partial information about calendar values frequently isavailable (e.g., day of the week an event occurred). On theother hand, it also is clear that for certain events not only arethe dates not directly available, but they cannot even be easilyinferred. One possible interpretation is that the underlyingform of temporal representation in autobiographical memoryinvolves an event sequence and that the dates of events, likenontemporal information, are simply associated with partic-ular events. The alternative is that not only are some datesremembered but that they form a part of an event sequencein such a way as to anchor the event sequence in relation tothe calendar, thus preserving objective time overall. In thiscase, there might be local distortions of time. That is, whilethe entire period between dated events would be "stretched"to match objective time, particular events might be part of anevent sequence and only indirectly linked to the calendar.This could give rise to local distortions in the temporalrepresentation itself. Because such distortion would reflect theloss of events from memory, it should become greater as thetime period from the present increases.
Temporal categories and prototypes. The particular valuesin terms of which subjects report elapsed time are stated atone level of detail (days) but are used to stand for largertemporal categories (weeks, months). As noted above, the useof particular values (category instances) to represent or "standfor" larger categories has been discussed in the existing liter-ature on categorization. Posner and Keele (1968) posited that
in acquiring a category (e.g., of visual forms), people maygenerate an "abstract idea" (a prototype) to represent thatcategory. One sort of evidence of prototypes is a greatertendency to "recognize" prototypical instances than otherinstances (i.e., subjects believe they have seen such instancespreviously even if they have not). It has proven difficult todistinguish a model that explains these recognition data bypositing prototypes from a model which posits that peoplesimply remember instances and that their responses reflectthe fact that so-called prototypic instances are the instancesthat are most similar, overall, to the set of stored instances(Medin & Schaffer, 1978; Nosofsky, 1986).
The prototypes in the present study are not hypothesizedabstractions posited to explain bias in recognition data. Ratherthey are responses involving particular values which are over-represented in the data. These responses represent learnedways of expressing category information (a week, a month)by using particular values (7 days, 30 days). Thus the existenceof the prototypes is not a matter of debate. We have showncertain consequences of using these prototypic values (numberof days) to stand for larger units (weeks, months) in estima-tion. First, the overrepresentation of these values in people'sreports results in local bias in the regions around each proto-typic value. Second, in cases where prototypes are unevenlydistributed over a dimension, as in the temporal case, anoverall bias in reporting results.
Rather than being an aspect of temporal representationitself, the prototypes in the present case are forms of reportingused when memory is inexact. That is, the overuse of theseprototypic values does not reflect a pile up in autobiographicalmemory of particular elapsed times. Elapsed times sinceparticular events are not stored information, but rather areestimated when the situation requires. The time that haselapsed since a remembered event when such estimates aremade surely does not systematically fall at the prototypes.The estimation of elapsed time may involve either measuringthe interval by using a scale (a temporal ruler) made up ofconventional units (e.g., days, weeks) or "adding up" intervalsbetween adjacent events. These elapsed times are then con-verted to prototypic values when the level of precision of theinterval is less than that required in the question (we requirean answer in days). Alternatively, however, it is possible thatpeople compare the entire interval with stored category infor-mation. That is, people could have acquired categories suchas "a month ago," also known as "30 days ago," from expe-riences in which various intervals are labeled—for example,"Harry's birthday was a month ago."1
Conclusions
In conclusion, it should be noted that the two sources ofbias in estimation modeled in the present study reflect generalprinciples having to do with the estimation of quantity. Thatis, both the imposition of bounds on what constitutes areasonable answer and the use of rounded values may besources of bias in producing reports of quantity from inexact
' This possibility was pointed out to us by Douglas Medin.

REPORTS OF ELAPSED TIME 211
information in memory in cases other than reports of elapsedtime.
The imposition of an upper boundary on reports reflectssubjects' beliefs about a largest reasonable estimate. In thepresent case, the imposed bound reflects subjects' beliefs aboutthe conditions under which particular questions are likely tobe asked (called "felicity conditions" by those who studyspeech acts). That is, subjects expect that elapsed time ques-tions framed in terms of days will be asked only for a limitedtime after an event. Further, they expect that questions abouta relatively trivial event (a home interview) will be asked onlyfor a limited time after the event. Subjects converge on 60days as the bound in our case. There are other possible sourcesof upper bounds that may arise in other cases. For example,people who sell air conditioners may impose an upper boundon reports from memory of the weights of window unitsbecause they know that these can be lifted by a single person(e.g., 75 lb). When subjects do impose an upper boundary onreports and there is considerable inexactness in memory, largebias effects will appear. For elapsed time estimates, the effectwill consist of a forward bias; for other quantity estimates, theeffect will consist of a downward bias. The existence of suchimposed boundaries can be inferred from the distribution ofreports because larger reported values will be sparse or non-existent.
Finally, consider the principle of rounding, which led toforward bias in temporal reports. We found overuse of pro-totypic values in estimation; the fact that the distance betweenprototypes increased across the range of possible values led tosystematic bias in reporting. A parallel situation may arise inany case where subjects are asked to report a recollection ofquantity, and the size of the unit used in rounding increasesas the quantity to be estimated increases. When unit sizeincreases, the distance between prototypic values will increase;hence, downward bias will be found in estimates of quantity.For example, consider a postal clerk asked for the weight (inounces) of the various packages he has mailed in a day. Theunits he uses in this case might be ounces, half pounds (8-ozunits), and pounds (16-oz units); the prototypic values wouldbe 8, 16, and 32. If the cut points for reporting prototypicvalue lie midway between the rounded values, the range forreports of 16 oz will extend up to remembered values of 24but down only to remembered values of 12. Hence, roundingwill lead to a downward bias in reporting. Reports may showan increase in the units of rounding as quantity increases evenwhen the larger categories are not named (like pounds,months, etc.). Consider physician reports of the number ofvisits by particular patients over the year. The physicians mayuse raw values up to roughly 5, then round by 5s to roughly20, and round by 10s past 20. Because the range for reportsof 10 visits will extend up to remembered values of 15 but
down only to remembered values of 7.5, rounding will leadto downward bias in reporting.
References
Baddeley, A. D., Lewis, V., & Nimmo-Smith, I. (1978). When didyou last ...? In M. M. Gruneberg, P. E. Morris, & R. N. Sykes(Eds.), Practical aspects of memory (pp. 77-83). New York: Aca-demic Press.
Barsalou, L. W. (1988). The content and organization of autobio-graphical memories. In U. Neisser & E. Winograd (Eds.), Remem-bering reconsidered: Ecological and traditional approaches to thestudy of memory (pp. 193-243). New York: Cambridge UniversityPress.
Friedman, W. J., & Wilkins, A. J. (1985). Scale effects in memoryfor the time of events. Memory & Cognition, 13, 168-175.
Hedges, L. V., & OIkin, I. (1985). Statistical methods for meta-analysis. New York: Academic Press.
Huttenlocher, J., Hedges, L., & Prohaska, V. (1988). Hierarchicalorganization in ordered domains: Estimating the dates of events.Psychological Review, 95, 471-484.
Kolodner, J. L. (1978). Memory organization for natural languagedatabase inquiry (Research Report 142). New Haven, CT: Depart-ment of Computer Science, Yale University.
Linton, M. (1986). Ways of searching and the contents of memory.In D. C. Rubin (Ed.), Autobiographical memory (pp. 50-67).Cambridge, England: Cambridge University Press.
Loftus, E. G., & Marburger, W. (1983). Since the eruption of Mt. St.Helens, has anyone beaten you up? Improving the accuracy ofretrospective reports with landmark events. Memory & Cognition,11, 114-120.
Medin, D. L., & Schaffer, M. M. (1978). Context theory of classifi-cation learning. Psychological Review, 85, 207-238.
Miller, R. (1985). Simultaneous statistical inference. New York:Springer.
Neisser, U. (1986). Nested structure in autobiographical memory. InD. C. Rubin (Ed.), Autobiographical memory (pp. 71-81). Cam-bridge, England: Cambridge University Press.
Neter, J., & Waksberg, J. (1964). A study of response errors inexpenditures data from household interviews. Journal of the Amer-ican Statistical Association, 59, 18-55.
Nosofsky, R. M. (1986). Attention, similarity, and the identification-categorization relationship. Journal of Experimental Psychology:General, 115, 39-57.
Oden, G. (1987). Concept, knowledge, and thought. Annual Reviewof Psychology, 38, 203-227.
Posner, M. I., & Keele, S. W. (1968). On the genesis of abstract ideas.Journal of Experimental Psychology, 77, 353-363.
Shepard, R. N. (1974). Representation of structure in similarity data:Problems and prospects. Psychometrika, 39, 373-421.
Smith, E. E., & Medin, D. L. (1981). Categories and concepts.Cambridge, Massachusetts: Harvard University Press.
Sudman, S., & Bradburn, N. M. (1973). Effects of time and memoryfactors on response in surveys. Journal of the American StatisticalAssociation, 63, 805-815.
(Appendix follows on next page)
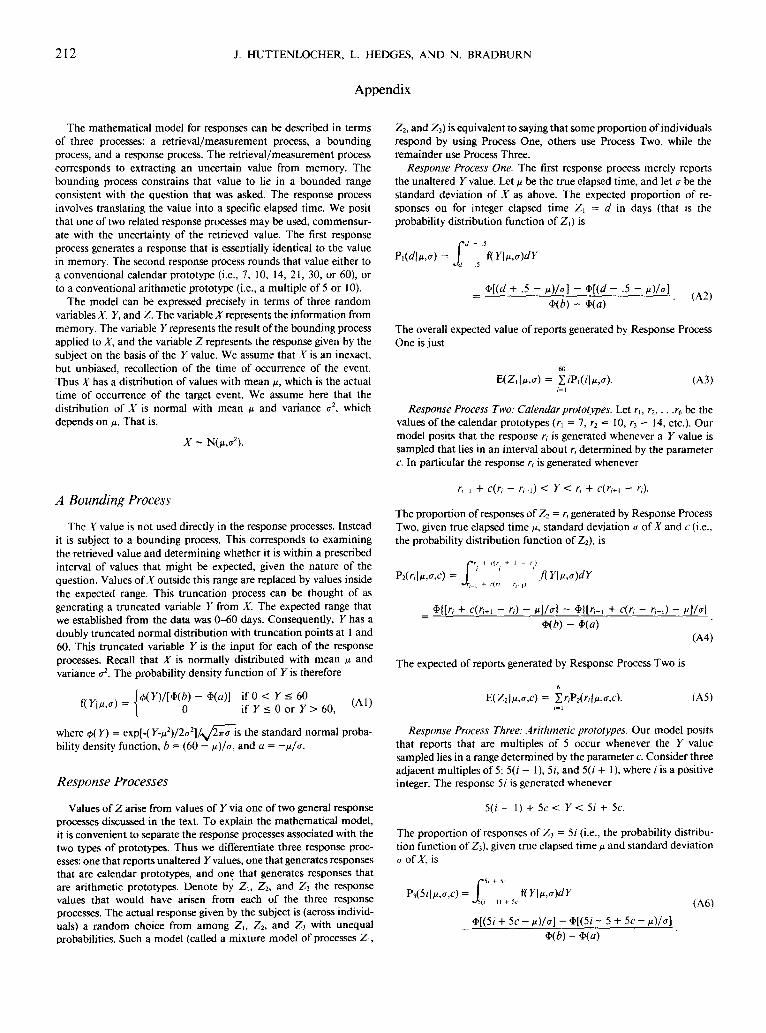
212 J. HUTTENLOCHER, L. HEDGES, AND N. BRADBURN
Appendix
The mathematical model for responses can be described in termsof three processes: a retrieval/measurement process, a boundingprocess, and a response process. The retrieval/measurement processcorresponds to extracting an uncertain value from memory. Thebounding process constrains that value to lie in a bounded rangeconsistent with the question that was asked. The response processinvolves translating the value into a specific elapsed time. We positthat one of two related response processes may be used, commensur-ate with the uncertainty of the retrieved value. The first responseprocess generates a response that is essentially identical to the valuein memory. The second response process rounds that value either toa conventional calendar prototype (i.e., 7, 10, 14, 21, 30, or 60), orto a conventional arithmetic prototype (i.e., a multiple of 5 or 10).
The model can be expressed precisely in terms of three randomvariables X, Y, and Z. The variable X represents the information frommemory. The variable Y represents the result of the bounding processapplied to X, and the variable Z represents the response given by thesubject on the basis of the Y value. We assume that X is an inexact,but unbiased, recollection of the time of occurrence of the event.Thus X has a distribution of values with mean n, which is the actualtime of occurrence of the target event. We assume here that thedistribution of X is normal with mean M and variance a2, whichdepends on p. That is,
X ~ N(M,ff2).
A Bounding Process
The X value is not used directly in the response processes. Insteadit is subject to a bounding process. This corresponds to examiningthe retrieved value and determining whether it is within a prescribedinterval of values that might be expected, given the nature of thequestion. Values of X outside this range are replaced by values insidethe expected range. This truncation process can be thought of asgenerating a truncated variable Y from X. The expected range thatwe established from the data was 0-60 days. Consequently, Y has adoubly truncated normal distribution with truncation points at 1 and60. This truncated variable Y is the input for each of the responseprocesses. Recall that X is normally distributed with mean n andvariance a2. The probability density function of Y is therefore
U(Y)/[$(b) -I °
if 0 < Y < 60if Y < 0 or Y > 60, (Al)
where 4>( Y) = exp[-( Y-p2)/2o2]/yfeiro~is the standard normal proba-bility density function, b = (60 — n)/o, and a = -n/o.
Response Processes
Values of Z arise from values of Y via one of two general responseprocesses discussed in the text. To explain the mathematical model,it is convenient to separate the response processes associated with thetwo types of prototypes. Thus we differentiate three response proc-esses: one that reports unaltered Y values, one that generates responsesthat are calendar prototypes, and one that generates responses thatare arithmetic prototypes. Denote by Z u Z2, and Z3 the responsevalues that would have arisen from each of the three responseprocesses. The actual response given by the subject is (across individ-uals) a random choice from among Z,, Z2, and Z3 with unequalprobabilities. Such a model (called a mixture model of processes Z,,
Z2, and Z3) is equivalent to saying that some proportion of individualsrespond by using Process One, others use Process Two, while theremainder use Process Three.
Response Process One. The first response process merely reportsthe unaltered Y value. Let n be the true elapsed time, and let a be thestandard deviation of X as above. The expected proportion of re-sponses on for integer elapsed time Z\ = d in days (that is theprobability distribution function of Z,) is
J d +
_ - .5
f{Y\n,<x)dY
.5 - - .5 -(A2)
The overall expected value of reports generated by Response ProcessOne is just
E(Z,|M ,<T)= (A3)
Response Process Two: Calendar prototypes. Let ru r2,. . .r6 be thevalues of the calendar prototypes (r, = 7, r2 = 10, r3 = 14, etc.). Ourmodel posits that the response /•, is generated whenever a Y value issampled that lies in an interval about r, determined by the parameterc. In particular the response r, is generated whenever
c(r, - /-,_, Y < r, r,+l - r,).
The proportion of responses of Z2 = r, generated by Response ProcessTwo, given true elapsed time ti, standard deviation a of X and c (i.e.,the probability distribution function of Z2), is
P2(ri
/-/• + Hr + 1 - r)
i\n,o,c) = ' ' ' j{Y\n,a)dY
i+i - n) - n]/a\ - $|[/j<S>\[r, C(r, - n-i) - n]/a
(A4)
The expected of reports generated by Response Process Two is
(A5)
Response Process Three: Arithmetic prototypes. Our model positsthat reports that are multiples of 5 occur whenever the Y valuesampled lies in a range determined by the parameter c. Consider threeadjacent multiples of 5: 5(( - 1), 5i, and 5(< + 1), where i is a positiveinteger. The response 5/ is generated whenever
5(; - \) + Sc < Y < 5i + 5c.
The proportion of responses of Z3 = 5/ (i.e., the probability distribu-tion function of Z3), given true elapsed time n and standard deviationa of X, is
'3(5/|M,ff,c)= I•JSO - I) + Sc (A6)
5c- i ; - 5 + Sc -
*(*) -
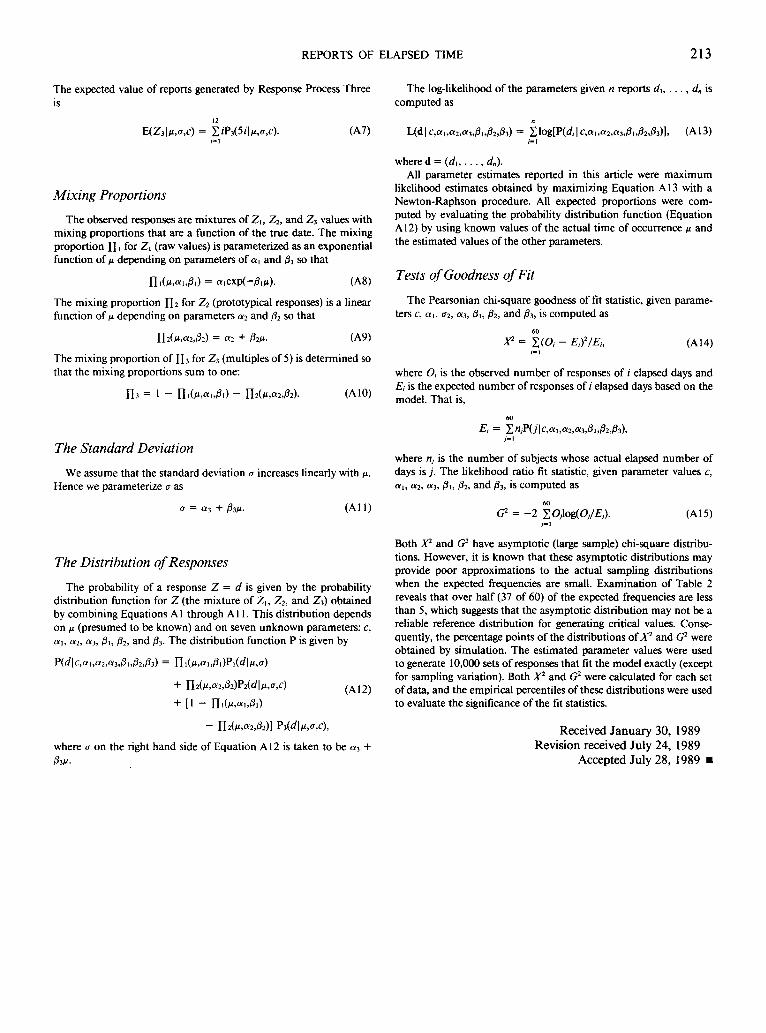
REPORTS OF ELAPSED TIME 213
The expected value of reports generated by Response Process Threeis
The log-likelihood of the parameters given n reports d\, ..., dn iscomputed as
E(Z3|M,<r,c) = (A7) L(d|c,a,,a2,a3,ft,ft,ft): ',|c,a,,a2,«3,ft,ft,ft)], (A13)
Mixing Proportions
The observed responses are mixtures of Z,, Z2, and Z3 values withmixing proportions that are a function of the true date. The mixingproportion Yl i for Zx (raw values) is parameterized as an exponentialfunction of /i depending on parameters of a, and ft so that
The mixing proportion YI2 for Z2 (prototypical responses) is a linearfunction of n depending on parameters a2 and ft so that
ft/f- (A9)
The mixing proportion of Y[3 for Z3 (multiples of 5) is determined sothat the mixing proportions sum to one:
fb= 1 - (A10)
where d = (d\,..., dn).All parameter estimates reported in this article were maximum
likelihood estimates obtained by maximizing Equation A13 with aNewton-Raphson procedure. All expected proportions were com-puted by evaluating the probability distribution function (EquationA12) by using known values of the actual time of occurrence n andthe estimated values of the other parameters.
Tests of Goodness of Fit
The Pearsonian chi-square goodness of fit statistic, given parame-ters c, a,, a2, oii, ft, |82, and ft, is computed as
X2-- , - E,f/Eh (A 14)
where O, is the observed number of responses of / elapsed days and£, is the expected number of responses of / elapsed days based on themodel. That is,
The Standard Deviation
We assume that the standard deviation a increases linearly with \i.Hence we parameterize a as
a = a3 + ft/u. (All)
Ei = En/PO'|c,a,,a2,a3,/8,,ft,/33),
where nj is the number of subjects whose actual elapsed number ofdays is j . The likelihood ratio fit statistic, given parameter values c,au a2, a,, £,, ft, and ft, is computed as
G2 = - 2 (A 15)
The Distribution of Responses
The probability of a response Z = d is given by the probabilitydistribution function for Z (the mixture of Z,, Z2, and Z3) obtainedby combining Equations A1 through All . This distribution dependson 11 (presumed to be known) and on seven unknown parameters: c,ai, «2, «3, 0i, ft, and ft. The distribution function P is given by
( A , 2 )
- Il2(M,«2,ft)]
where a on the right hand side of Equation A12 is taken to beftM-
Both X2 and G2 have asymptotic (large sample) chi-square distribu-tions. However, it is known that these asymptotic distributions mayprovide poor approximations to the actual sampling distributionswhen the expected frequencies are small. Examination of Table 2reveals that over half (37 of 60) of the expected frequencies are lessthan 5, which suggests that the asymptotic distribution may not be areliable reference distribution for generating critical values. Conse-quently, the percentage points of the distributions of X2 and G2 wereobtained by simulation. The estimated parameter values were usedto generate 10,000 sets of responses that fit the model exactly (exceptfor sampling variation). Both X2 and G2 were calculated for each setof data, and the empirical percentiles of these distributions were usedto evaluate the significance of the fit statistics.
Received January 30, 1989Revision received July 24, 1989
Accepted July 28, 1989 •