Analisi di facies della successione triassico-giurassica di Porto Pino (Sardegna sud-occidentale)
Upload
covenantuniversityCategory
view
2download
0
Ozean Journal of Applied Sciences 4(4), 2011
411
ASPECTS OF STRATIGRAPHY AND FACIES PROFILE OF CLASTIC DEPOSITS IN
DOMA FIELD, NIGER DELTA
ROTIMI OLUWATOSIN JOHN*, ADEOYE OLUSHOLA TAIYE**, OFOMOLA MERRIOUS OVIRI***
*Petroleum Engineering Department, Covenant University, Ota, Nigeria
**School of Earth and Mineral Science, FUTA, Akure, Nigeria
***Department of Physics, Delta State University, Abraka, Nigeria
*E-mail address for correspondence: [email protected]
______________________________________________________________________________________________
Abstract: The consistencies observed on lithologies encountered during exploration are often brief. They are usually
characterized by rapidly changing signatures due to the rapid depositional patterns. Well logs and Seismic data
employed in this study assisted in gaining insight into the Stratigraphy of the sand units and facies profile. By
mapping lithologies from well logs an attempt was made to identify the depositional sequence. Reflections around
important fluid markers were studied in detail on seismic sections. System tracts and the corresponding depositional
environments determined from the log motifs were extended for lateral significance on seismic lines. Well to seismic
tie was done to validate the recognition of strata patterns on the seismic sections for lateral facie classification. With
results presented in time slices, well log panels and seismic cross sections, the spatial distribution of the identified
hydrocarbon prone depositional facies was studied.
Keywords: facies, depositional patterns, Stratigraphy, reflections, markers
______________________________________________________________________________________________
INTRODUCTION
Resolving stratigraphic patterns along the spread of an exploration field entails an integrated approach for a robust
result to be achieved. Doma field has experienced successful exploration programs and an extra push is needed to
assist engineers in making proper planning for a proposed secondary recovery operation. Water injection has been
proposed to sweep hydrocarbon to production holes. This would be a huge success for the proposed mop-up of the
remaining oil only if there is a revisit on the Stratigraphy of the oil hosting lithologies in the petroleum rich clastic
facies of the Niger Delta.
Ozean Journal of Applied Sciences 4(4), 2011
ISSN 1943-2429
© 2009 Ozean Publication
Ozean Journal of Applied Sciences 4(4), 2011
412
The geology of the Tertiary section of the Niger Delta is divided into three Formations – Benin, Agbada and Akata,
representing prograding depositional facies distinguished mostly on the basis of sand-shale ratio and further
subdivided into depobelts as progradation proceeds into the deeper waters (Short and Stauble, 1965; Doust and
Omatsola, 1990; Kulke, 1995)
Stacher, (1995), documented the formation of Akata Formation initiated in the Paleocene and through the Recent. A
lowstand period characterized by low energy conditions and oxygen deficiency when terrestrial organic matter and
clays were transported to deep-sea water. A paralic sequence of alternating Lower Eocene-to-Pleistocene sandstones
and sand bodies with shale intercalations, which is known as the Agbada Formation overlies the undercompacted
Akata shales (Doust and Omatsola, 1990). An extensively massive, porous, and unconsolidated freshwater bearing
continental sands known as the Benin Formation caps the Niger Delta lithological cross section. The Doma field is
on the eastern portion, onshore Niger Delta.
MATERIALS AND METHODS
Digital logs from three wells and SEG Y Seismic volume constitute the basic data point for this study. However, well
log markers were available for two of the wells. In some of these markers, fluid contacts like water saturation level
(Sw), oil up to (OUT), and gas down to (GDT) were observed. Stratigraphic interpretations that focused on the
identification of the reservoir, source and seal prone depositional facies around these markers as these markers point
directly to prospectivity of the field was done. Although these markers are more of petrophysical markers than
stratigraphic markers because of the abundance of petrophysical properties attached to them.
FLUID MARKERS IN WELLS
The markers in well 2 include HD1000, HD2000, HD2400, HD5000, GC3000, GC7100 and FE3000 which has the
fluid contacts observed within them. The markers in well 3 include HD1000, HD2000, HD5000, JF4100, JF4200,
JF5000 and JF6000.
Check shot data available on well 3 was used for the well to seismic tie operation. It was observed that seismic
characters were related to stratigraphic markers and the well logs marker previously identified. This was important to
substantiate the occurrence and position of both markers and sand sequences identifies on the field of study. The tops
of sequence boundary (SB) one and two were tied to a moderately blue strong reflector labeled FF and high
amplitude reflection labeled UU respectively. In another instance the top of the fluid contact OUT (at depth 1016m)
in marker HD1000 was tied to a moderately high amplitude reflection on the seismic sections. The procedure
adopted via the check shot indicated that the tops of the reservoir sands in the area are represented on the seismic
volume by various amplitude reflections. The well to seismic match provides the basis for locating important seismic
reflection profiles also on well log.
Ozean Journal of Applied Sciences 4(4), 2011
413
RESULTS AND DISCUSSION
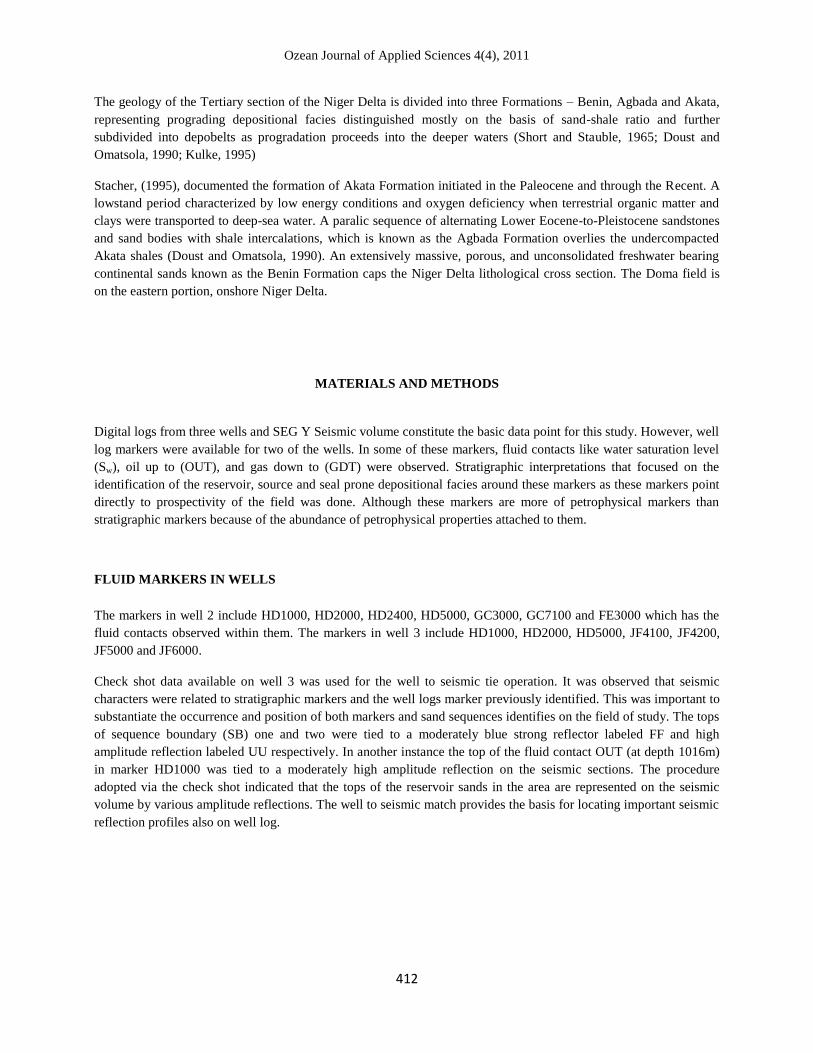
Markers from the wells as observed were united in terms of fluid content characters. Markers HD1000, HD2000 and
HD5000, were all observed in the two wells while others occurring have different identities and were not duplicated
like these three. In well B, The HD1000 was observed at the depth interval of 1750m and 1764m where ODT was
observed at the depth of 1761m. Water saturation in this zone is very low (20) and the implication is that the
hydrocarbon content may be high and this is supported by the high reading of the resistivity log (RT). In the same
well, markers HD2000 was observed at the depth of 1766m – 1809m and the fluid contacts within it include ODT at
the depth of 1809m (Fig 1). The HD2400 was observed at the depth interval of 1812m and 1830m where HCWC was
observed at the depth of 1817m. Water saturation in this zone is 17 and average porosity is 31. Markers HD3000 and
HD5000, were in included in this study because of their closeness to other markers.
Also in well C, The gas-oil contact/ oil-up to (GOC/OUT) was observed in markers JF4100 and JF4200 at the depths
of 3173m and 3200m. The gas up to (GUT) was observed in marker JF5000 at the depths of 3238m.
The hydrocarbon water contact (HCWC/WUT) was observed within the HD1000, HD2000 and HD5000 at the
depths of 1808m, 1824m and 2021m respectively.
Sequence boundaries were interpreted both on well logs and seismic data. These stratigraphic markers were initially
interpreted on well logs to validate the identity of the fluid markers. Sequence boundaries in the field were first
Figure 1: One of the wells in the field with well markers and fluid contacts
Ozean Journal of Applied Sciences 4(4), 2011
414
identified based on the interpretation of reflection terminations and unconformity surface seen on the seismic
sections assisted by interpretation of well log motifs. They were defined by looking for abrupt bases of thick low-
gamma ray- value intervals on the well logs (Catuneanu, 2006). The sequence boundary identification enabled the
division of the stratigraphic surfaces into sequences. Using these criteria, sequence boundary one and two defined
sequence one while sequence boundary two and three defined sequence two and sequence boundary three and four
defined sequence three. Within the sequences, proper analysis of stratigraphic features and facies classification were
then done.
Sequence boundaries
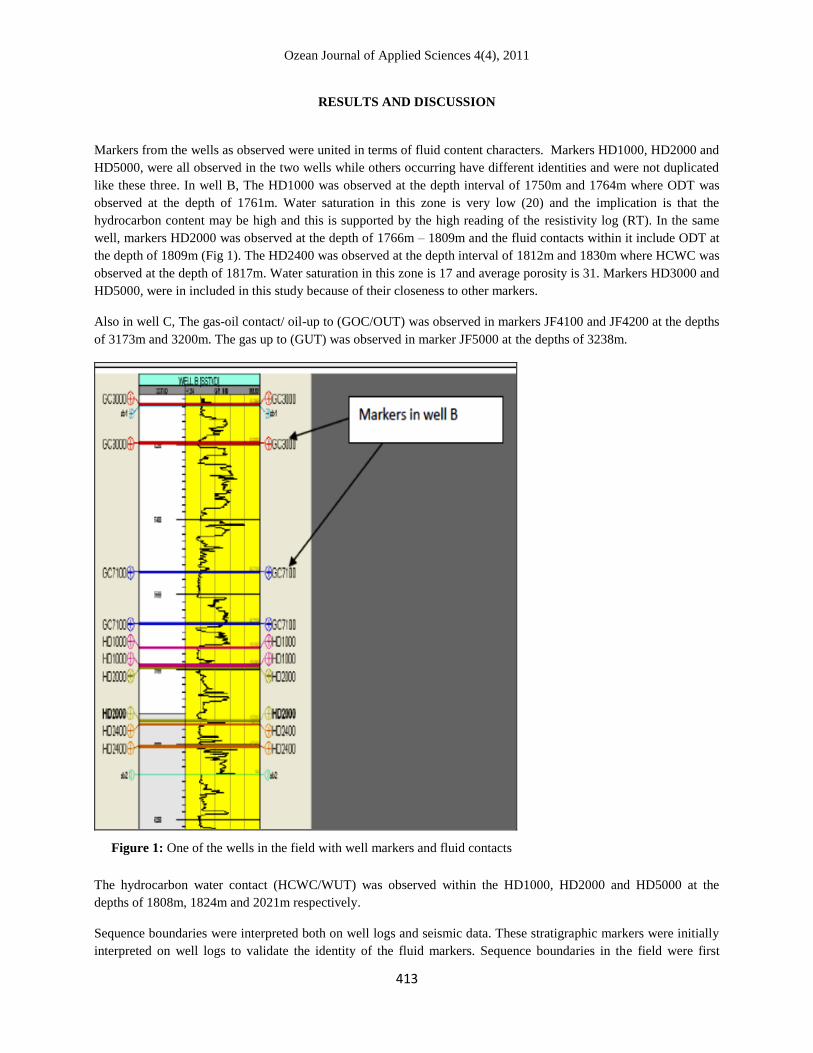
The oldest sequence boundary was observed in the three Wells with an average depth of 2882m. It is interpreted by
the sharp boundary between increase and decrease in gamma-ray readings. This boundary serves as the base of
sequence three which has intercalation of sand and shale in the lithology log. The overall log trend within the
sequence is very irregular. Log trends observed include coarsening upwards log signatures which typifies the
highstand system tract and the fining upwards log signature which is typical of the transgressive system tract.
Sequence boundary two is represented by a marked increase in gamma-ray values (figure 2). Above the sequence
boundary, gamma-ray values increase systematically then decrease in the same manner. This log signature follow a
Figure 2: Log motifs and position of sequences from 2 of the wells

Ozean Journal of Applied Sciences 4(4), 2011
415
bow trend as it signifies the start of the second sequence deposit. The sharp-based sequence represents a significant
change in depositional environment. The sharp boundaries with overlying and underlying sequences imply the
existence of an abrupt change from a low gamma coarse grained unit to a high gamma finer unit and back again in a
progradational pattern as the stacking of the parasequences progresses.
At an average depth of 1851m occurs the third sequence boundary. This marks the beginning of the last sequence as
it caps the sequence beneath it giving it an average total depth thickness of 244m. It is characterized by the sharp
boundary in alternating back turning (low and abrupt high) gamma-ray readings (figure 3). The boundary defines the
basal boundary of sequence one that contains the greatest preserved thickness.
Capping the clastic sequence studied is the fourth and youngest sequence boundary penetrated by all three wells in
the field. The average depth of 1557m was observed for it (Fig 4). This boundary is characterized by overall low
gamma ray values, corresponding to an increase in incoming sand in the lithology log. The overall log trend is very
irregular with distinct spikes of log motifs due to rapidly alternating lithologies (sand and shale). This either reflects
a multitude of discrete depositional events or a variable sediment supply (King et al, 1993).
Figure 3: Observed log patterns of sequence boundary 3
Ozean Journal of Applied Sciences 4(4), 2011
416
Stratigraphy and Facie patterns of Sequences
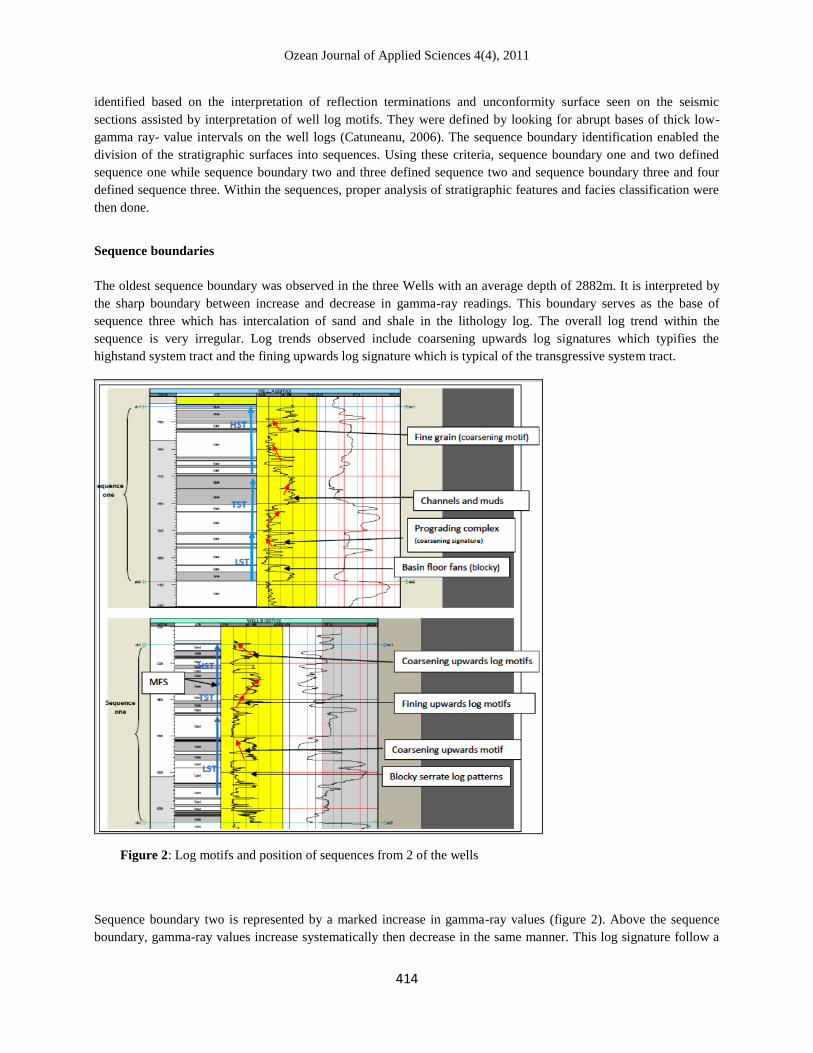
The basal Sequence 1 is about 219m thick from two wells. Like the overlying sequences, gamma ray values abruptly
decrease at the base of the sequence with blocky patterns signifying the lowstand portion of the sequence. This basal
interval with low gamma ray values is vertically divided by several thick intervals with slightly high and moderate
gamma ray values. The areas where gamma ray values increase abruptly in the middle of the sequence on the well
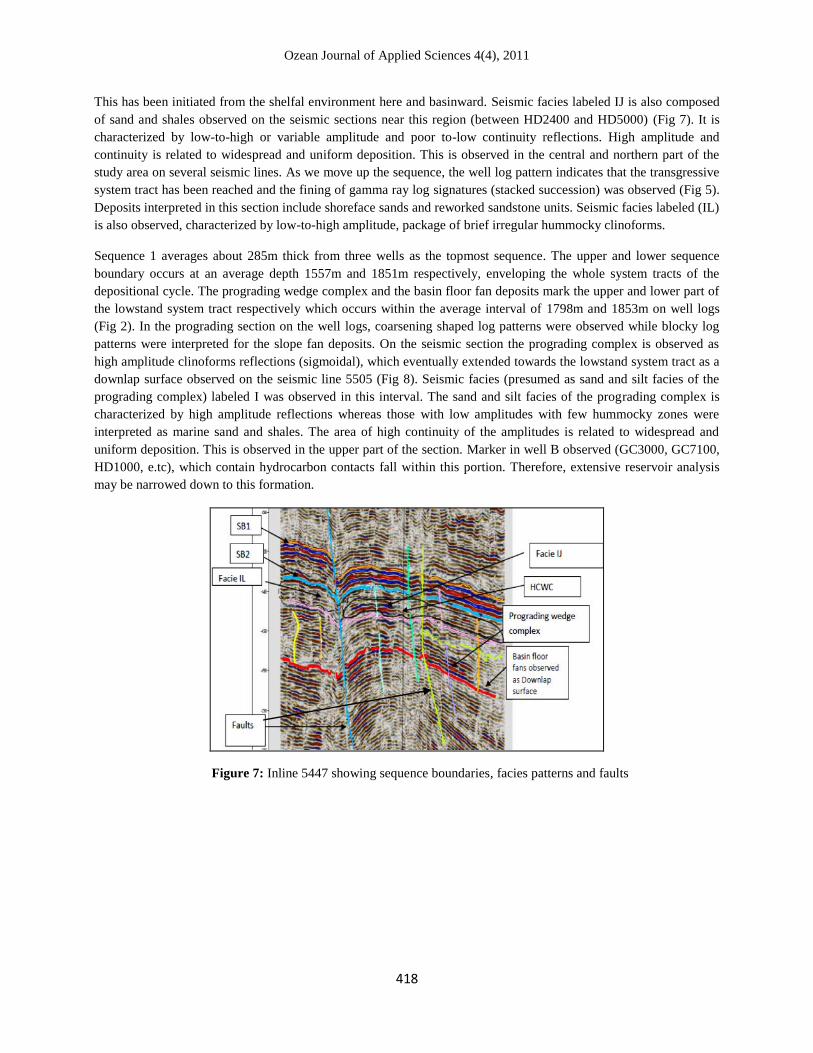
logs are interpreted to define the transgressive portion of the sequence due to fining upwards log signatures. In Fig 6,
on the seismic sections the entire sequences and sequence boundary are shown. The maximum flooding surface on
top of the transgressive sequence observed as low amplitude reflections and laterally extensive shale blanket is
sharply distinguished from the downward reflection and is predicted to be associated with the condensed section
spread-out from the shelf environment. Seismic facies labeled IB are confined mainly to this transgressive-
regressive portion of the sequence and are seen as hummocky (divergent) reflections. The interval of seismic facies
IB is really thin. This high amplitude and moderate-to-good continuity reflections seen have parallel-to-subparallel
reflections that are dominant in this seismic facies. Discontinuous reflections (mostly truncations) can also be seen
locally. This seismic facies represent the common reflection character of the Formations throughout the area. These
represent good image deposits of a fluvial-dominated environment.
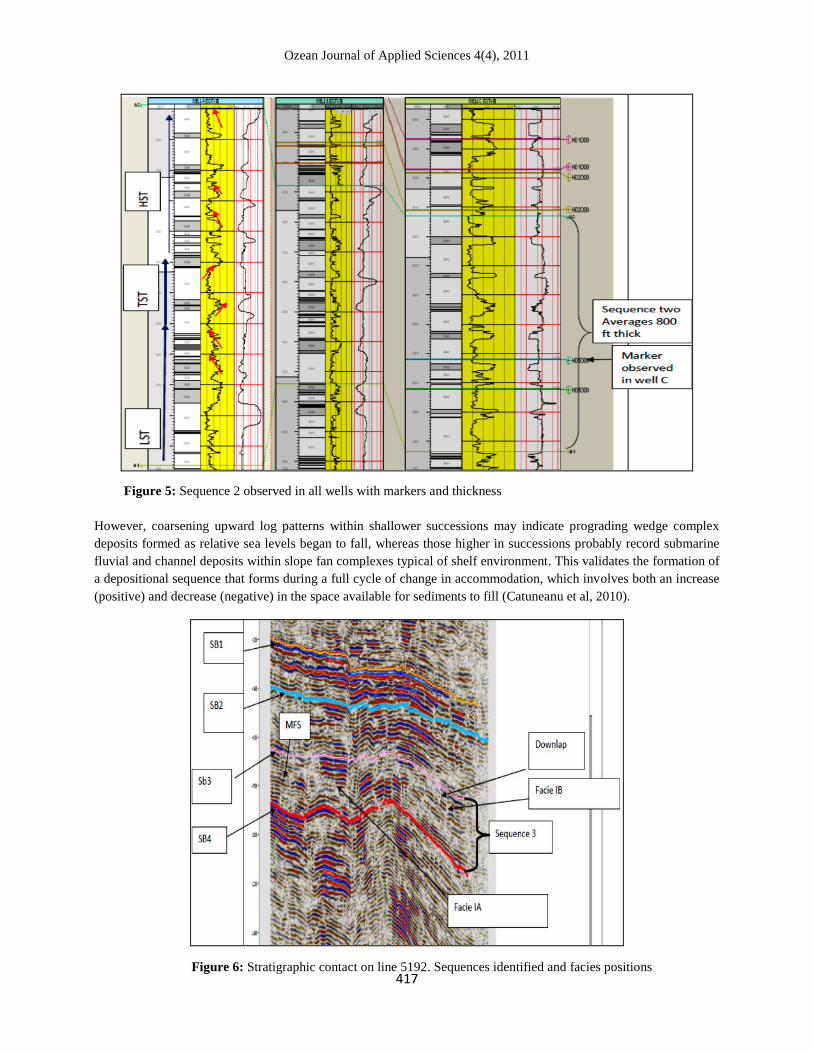
Sequence 2 averages about 244m thick from three wells where it was observed (Fig 5). The upper and lower
sequence boundary occurs at an average depth 1851m and 2207m respectively. The basin floor fans mark the
lowstand system tract. It occurs within the average interval of 1851m and 1981m on the well logs. The interpreted
log signatures for this zone were blocky log patterns.
Figure 4: Sequence boundaries 1 and 2 shown on wells 2 and 3
Ozean Journal of Applied Sciences 4(4), 2011
417
However, coarsening upward log patterns within shallower successions may indicate prograding wedge complex
deposits formed as relative sea levels began to fall, whereas those higher in successions probably record submarine
fluvial and channel deposits within slope fan complexes typical of shelf environment. This validates the formation of
a depositional sequence that forms during a full cycle of change in accommodation, which involves both an increase
(positive) and decrease (negative) in the space available for sediments to fill (Catuneanu et al, 2010).
Figure 5: Sequence 2 observed in all wells with markers and thickness
Figure 6: Stratigraphic contact on line 5192. Sequences identified and facies positions
Ozean Journal of Applied Sciences 4(4), 2011
418
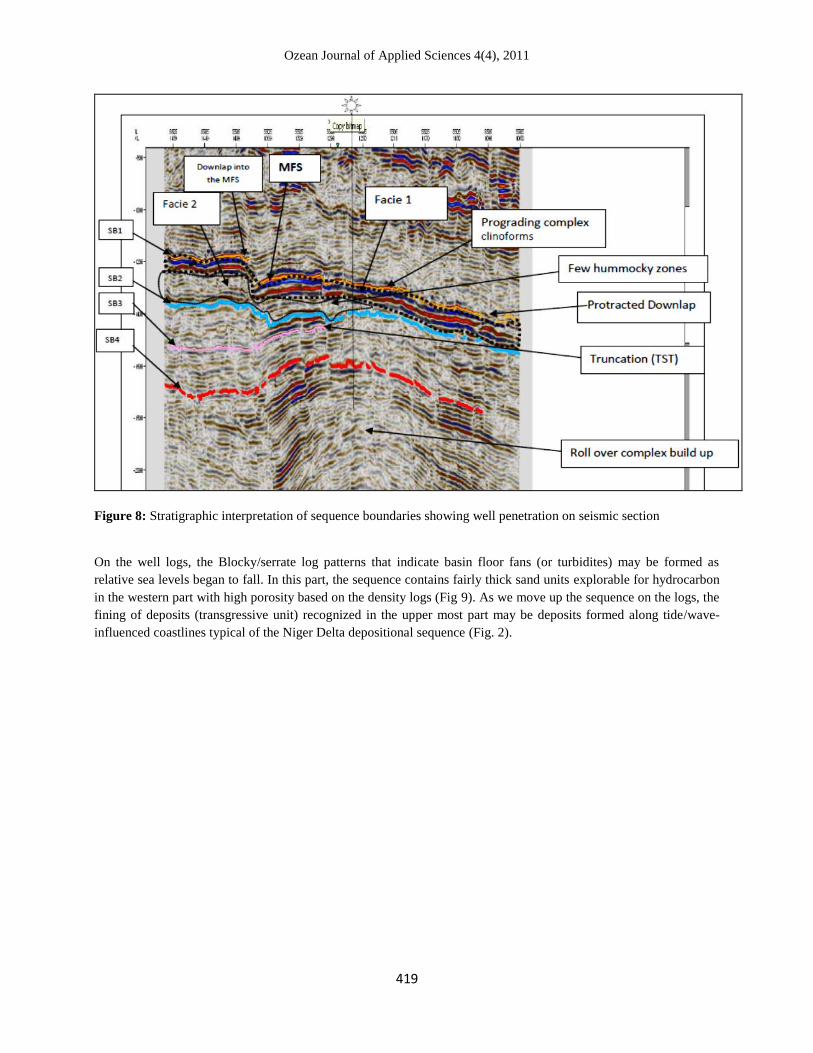
This has been initiated from the shelfal environment here and basinward. Seismic facies labeled IJ is also composed
of sand and shales observed on the seismic sections near this region (between HD2400 and HD5000) (Fig 7). It is
characterized by low-to-high or variable amplitude and poor to-low continuity reflections. High amplitude and
continuity is related to widespread and uniform deposition. This is observed in the central and northern part of the
study area on several seismic lines. As we move up the sequence, the well log pattern indicates that the transgressive
system tract has been reached and the fining of gamma ray log signatures (stacked succession) was observed (Fig 5).
Deposits interpreted in this section include shoreface sands and reworked sandstone units. Seismic facies labeled (IL)
is also observed, characterized by low-to-high amplitude, package of brief irregular hummocky clinoforms.
Sequence 1 averages about 285m thick from three wells as the topmost sequence. The upper and lower sequence
boundary occurs at an average depth 1557m and 1851m respectively, enveloping the whole system tracts of the
depositional cycle. The prograding wedge complex and the basin floor fan deposits mark the upper and lower part of
the lowstand system tract respectively which occurs within the average interval of 1798m and 1853m on well logs
(Fig 2). In the prograding section on the well logs, coarsening shaped log patterns were observed while blocky log
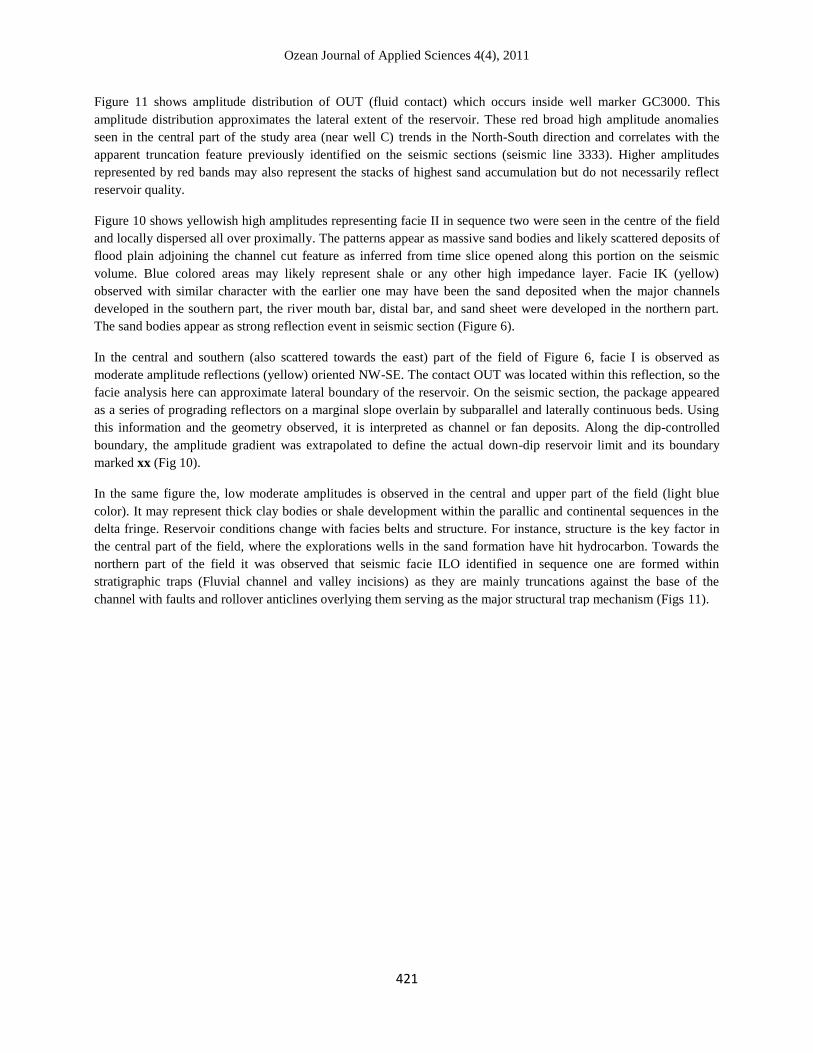
patterns were interpreted for the slope fan deposits. On the seismic section the prograding complex is observed as
high amplitude clinoforms reflections (sigmoidal), which eventually extended towards the lowstand system tract as a
downlap surface observed on the seismic line 5505 (Fig 8). Seismic facies (presumed as sand and silt facies of the
prograding complex) labeled I was observed in this interval. The sand and silt facies of the prograding complex is
characterized by high amplitude reflections whereas those with low amplitudes with few hummocky zones were
interpreted as marine sand and shales. The area of high continuity of the amplitudes is related to widespread and
uniform deposition. This is observed in the upper part of the section. Marker in well B observed (GC3000, GC7100,
HD1000, e.tc), which contain hydrocarbon contacts fall within this portion. Therefore, extensive reservoir analysis
may be narrowed down to this formation.
Figure 7: Inline 5447 showing sequence boundaries, facies patterns and faults
Ozean Journal of Applied Sciences 4(4), 2011
419
Figure 8: Stratigraphic interpretation of sequence boundaries showing well penetration on seismic section
On the well logs, the Blocky/serrate log patterns that indicate basin floor fans (or turbidites) may be formed as
relative sea levels began to fall. In this part, the sequence contains fairly thick sand units explorable for hydrocarbon
in the western part with high porosity based on the density logs (Fig 9). As we move up the sequence on the logs, the
fining of deposits (transgressive unit) recognized in the upper most part may be deposits formed along tide/wave-
influenced coastlines typical of the Niger Delta depositional sequence (Fig. 2).

Ozean Journal of Applied Sciences 4(4), 2011
420
Figure 9: corresponding high porosity values on density and sonic logs
In the transgressive system tract, interpreted facies and deposition environment are the shoreface sands. In figure 8,
rollover build up is seen at the base of the seismic section. This is where more transition in reflection character is
observed (low amplitudes and hummocky reflections) with no significant continuity. This is an indication that the
region is composed of another facie entirely. The Facies extends along the eastern part in the form of divergent
seismic reflections (Fig 7). The highstand system tract is marked by gradual decrease in gamma ray log indicating
coarsening upwards log signatures. Deltaic and shoreface sands are believed to be present within this interval, since
river profiles stabilize in the highstand system tract and the Niger Delta is a fluvio-marine environment, river valleys
and channels may also be present within this interval (tract).
Facies distribution and geometry
Sequence 1 and 2 were laterally examined for distinct properties to substantiate the profiling of subsurface
formations studied. Most of the hydrocarbon markers and contacts delineated are within either one or two of the
already identified facies. These fluid contacts projected across to determine the lateral spread of the units already
inferred as reservoir candidates have significant extent due to the high degree of erosion strongly associated with
tectonic subsidence expressed on the seismic sections as reflections with a protracted downlap surface. This was
more pronounced within sequence one and two in the southwestern part of the field. Also the alternation of sands and
shale within the sequence itself, provide the combination of source reservoir, and cap rock essential for hydrocarbon
generation, accumulation and trapping. This suggests that oils found in the reservoirs of the sequence may have been
generated from the shales within it. The Akata shale is also a potential and possible source bed within the average
depths of 410m and 518m.
Ozean Journal of Applied Sciences 4(4), 2011
421
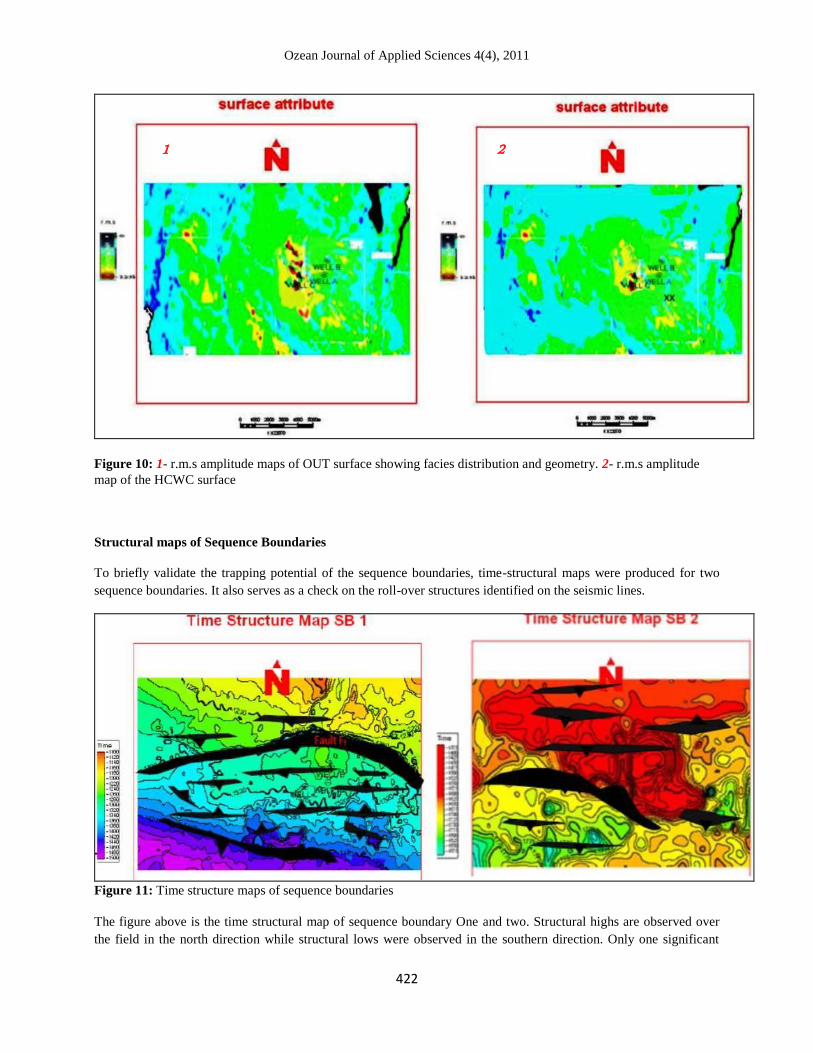
Figure 11 shows amplitude distribution of OUT (fluid contact) which occurs inside well marker GC3000. This
amplitude distribution approximates the lateral extent of the reservoir. These red broad high amplitude anomalies
seen in the central part of the study area (near well C) trends in the North-South direction and correlates with the
apparent truncation feature previously identified on the seismic sections (seismic line 3333). Higher amplitudes
represented by red bands may also represent the stacks of highest sand accumulation but do not necessarily reflect
reservoir quality.
Figure 10 shows yellowish high amplitudes representing facie II in sequence two were seen in the centre of the field
and locally dispersed all over proximally. The patterns appear as massive sand bodies and likely scattered deposits of
flood plain adjoining the channel cut feature as inferred from time slice opened along this portion on the seismic
volume. Blue colored areas may likely represent shale or any other high impedance layer. Facie IK (yellow)
observed with similar character with the earlier one may have been the sand deposited when the major channels
developed in the southern part, the river mouth bar, distal bar, and sand sheet were developed in the northern part.
The sand bodies appear as strong reflection event in seismic section (Figure 6).
In the central and southern (also scattered towards the east) part of the field of Figure 6, facie I is observed as
moderate amplitude reflections (yellow) oriented NW-SE. The contact OUT was located within this reflection, so the
facie analysis here can approximate lateral boundary of the reservoir. On the seismic section, the package appeared
as a series of prograding reflectors on a marginal slope overlain by subparallel and laterally continuous beds. Using
this information and the geometry observed, it is interpreted as channel or fan deposits. Along the dip-controlled
boundary, the amplitude gradient was extrapolated to define the actual down-dip reservoir limit and its boundary
marked xx (Fig 10).
In the same figure the, low moderate amplitudes is observed in the central and upper part of the field (light blue
color). It may represent thick clay bodies or shale development within the parallic and continental sequences in the
delta fringe. Reservoir conditions change with facies belts and structure. For instance, structure is the key factor in
the central part of the field, where the explorations wells in the sand formation have hit hydrocarbon. Towards the
northern part of the field it was observed that seismic facie ILO identified in sequence one are formed within
stratigraphic traps (Fluvial channel and valley incisions) as they are mainly truncations against the base of the
channel with faults and rollover anticlines overlying them serving as the major structural trap mechanism (Figs 11).
Ozean Journal of Applied Sciences 4(4), 2011
422
Figure 10: 1- r.m.s amplitude maps of OUT surface showing facies distribution and geometry. 2- r.m.s amplitude
map of the HCWC surface
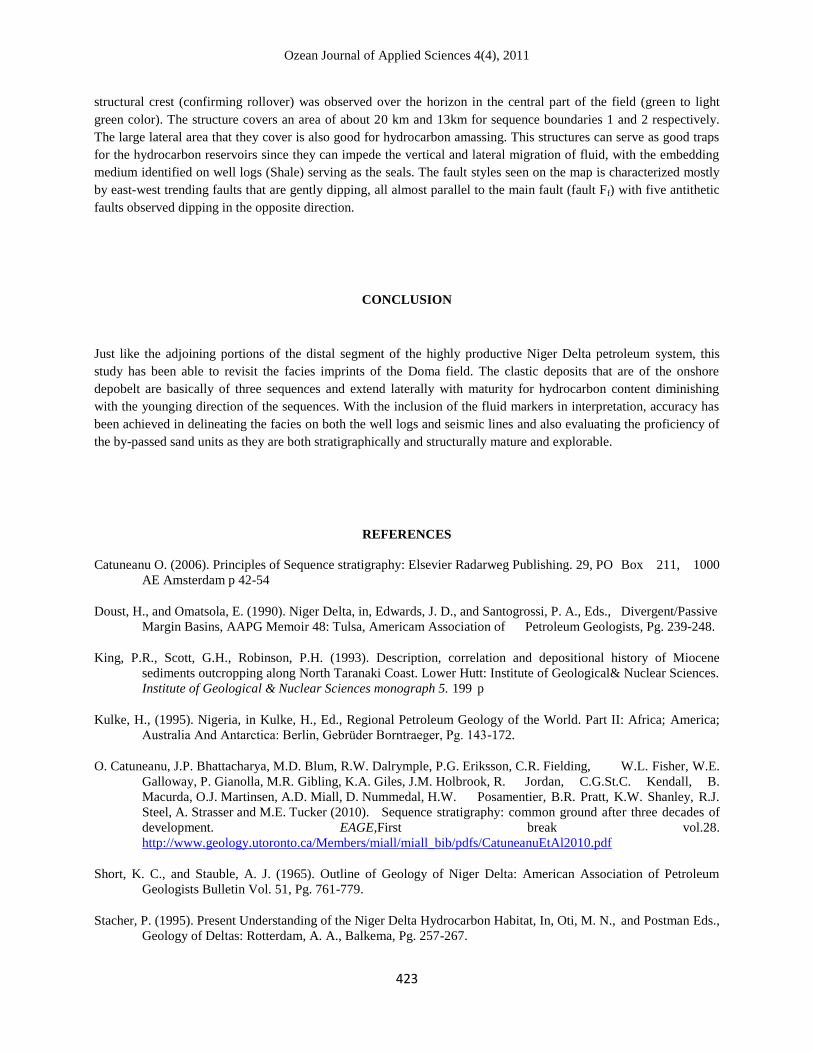
Structural maps of Sequence Boundaries
To briefly validate the trapping potential of the sequence boundaries, time-structural maps were produced for two
sequence boundaries. It also serves as a check on the roll-over structures identified on the seismic lines.
Figure 11: Time structure maps of sequence boundaries
The figure above is the time structural map of sequence boundary One and two. Structural highs are observed over
the field in the north direction while structural lows were observed in the southern direction. Only one significant
1 2
Ozean Journal of Applied Sciences 4(4), 2011
423
structural crest (confirming rollover) was observed over the horizon in the central part of the field (green to light
green color). The structure covers an area of about 20 km and 13km for sequence boundaries 1 and 2 respectively.
The large lateral area that they cover is also good for hydrocarbon amassing. This structures can serve as good traps
for the hydrocarbon reservoirs since they can impede the vertical and lateral migration of fluid, with the embedding
medium identified on well logs (Shale) serving as the seals. The fault styles seen on the map is characterized mostly
by east-west trending faults that are gently dipping, all almost parallel to the main fault (fault Ff) with five antithetic
faults observed dipping in the opposite direction.
CONCLUSION
Just like the adjoining portions of the distal segment of the highly productive Niger Delta petroleum system, this
study has been able to revisit the facies imprints of the Doma field. The clastic deposits that are of the onshore
depobelt are basically of three sequences and extend laterally with maturity for hydrocarbon content diminishing
with the younging direction of the sequences. With the inclusion of the fluid markers in interpretation, accuracy has
been achieved in delineating the facies on both the well logs and seismic lines and also evaluating the proficiency of
the by-passed sand units as they are both stratigraphically and structurally mature and explorable.
REFERENCES
Catuneanu O. (2006). Principles of Sequence stratigraphy: Elsevier Radarweg Publishing. 29, PO Box 211, 1000
AE Amsterdam p 42-54
Doust, H., and Omatsola, E. (1990). Niger Delta, in, Edwards, J. D., and Santogrossi, P. A., Eds., Divergent/Passive
Margin Basins, AAPG Memoir 48: Tulsa, Americam Association of Petroleum Geologists, Pg. 239-248.
King, P.R., Scott, G.H., Robinson, P.H. (1993). Description, correlation and depositional history of Miocene
sediments outcropping along North Taranaki Coast. Lower Hutt: Institute of Geological& Nuclear Sciences.
Institute of Geological & Nuclear Sciences monograph 5. 199 p
Kulke, H., (1995). Nigeria, in Kulke, H., Ed., Regional Petroleum Geology of the World. Part II: Africa; America;
Australia And Antarctica: Berlin, Gebrüder Borntraeger, Pg. 143-172.
O. Catuneanu, J.P. Bhattacharya, M.D. Blum, R.W. Dalrymple, P.G. Eriksson, C.R. Fielding, W.L. Fisher, W.E.
Galloway, P. Gianolla, M.R. Gibling, K.A. Giles, J.M. Holbrook, R. Jordan, C.G.St.C. Kendall, B.
Macurda, O.J. Martinsen, A.D. Miall, D. Nummedal, H.W. Posamentier, B.R. Pratt, K.W. Shanley, R.J.
Steel, A. Strasser and M.E. Tucker (2010). Sequence stratigraphy: common ground after three decades of
development. EAGE,First break vol.28.
http://www.geology.utoronto.ca/Members/miall/miall_bib/pdfs/CatuneanuEtAl2010.pdf
Short, K. C., and Stauble, A. J. (1965). Outline of Geology of Niger Delta: American Association of Petroleum
Geologists Bulletin Vol. 51, Pg. 761-779.
Stacher, P. (1995). Present Understanding of the Niger Delta Hydrocarbon Habitat, In, Oti, M. N., and Postman Eds.,
Geology of Deltas: Rotterdam, A. A., Balkema, Pg. 257-267.
Copyright © 2022 FDOKUMEN