Facies and Stratigraphy of the San Andres Formation (Mid ...
51
Facies and Stratigraphy of the San Andres Formation (Mid-Permian) Petroleum Province, Northwest Shelf of the Permian Basin, West Texas: A Resurgent Play Kevin A. Hiss David B. Williamson The University of Texas at Dallas GSA South-Central Section March 9, 2020
-
Upload
khangminh22 -
Category
Documents
-
view
0 -
download
0
Transcript of Facies and Stratigraphy of the San Andres Formation (Mid ...

Facies and Stratigraphy of the San Andres Formation (Mid-Permian) Petroleum Province, Northwest Shelf of the Permian Basin, West Texas: A Resurgent Play
Kevin A. HissDavid B. Williamson
The University of Texas at Dallas
GSA South-Central SectionMarch 9, 2020

• Environments of the San Andres formation on the Northwest Shelf in West Texas
• Complex interaction between sea level, climate, and geomorphology formed “world-class” carbonate reservoirs
• Varying targets for hydrocarbon production
• Quantitative approach to indicate the geologic history of the San Andres and effects of paleoenvironment on reservoir quality
Introduction

upper Leonardian
(Ruppel, 2019)
lower Guadalupian
272.3 Ma
268.8 Ma
Base Roadian
Base Wordian
San Andres Formation Age – Middle Permian
Presenter
Presentation Notes
The middle-Permian San Andres Fm. ranges in age from the uppermost North American Leonardian stage through the lower Guadalupian. Although, precise chronostratigraphic boundaries for the stratotype can’t be constrained.

Yoakum
Roosevelt
Lea
DM
OZONA ARCH
GM
AM
Gaines
AM Apache MountainsDM Delaware MountainsGLM Glass Mountains
OUACHITA OVERTHRUST
Permian BasinNorthwest ShelfStudy AreaAbo Reef Structure
GM Guadalupe MountainsSD Sierra Diablo
NEW
MEX
ICO
TEXA
S
GLM
S. PALO DURO BASIN
SD DELAWARE BASIN
MIDLAND BASIN
EASTERN SHELF
Hockley
Terry
Cochran
(Dutton, 2005; Ruppel, 2019)
San Andres production – shelf and platform carbonate reservoirs
San Andres Reservoirs Occur on Carbonate Platforms and Shelves
Presenter
Presentation Notes
This map shows the locations of San Andres oil & gas production (in blue). The largest reservoirs rim the Midland and Delaware Basins – occurring in shelf and platform carbonates.

Yoakum
Roosevelt
Lea
DM
OZONA ARCH
GM
AM
Gaines
AM Apache MountainsDM Delaware MountainsGLM Glass Mountains
OUACHITA OVERTHRUST
Permian BasinNorthwest ShelfStudy AreaAbo Reef Structure
GM Guadalupe MountainsSD Sierra Diablo
NEW
MEX
ICO
TEXA
S
GLM
S. PALO DURO BASIN
SD DELAWARE BASIN
MIDLAND BASIN
EASTERN SHELF
Hockley
Terry
Cochran
San Andres production – shelf and platform carbonate reservoirs
Cumulative ConventionalPermian Production
San Andres 50%
All other Reservoirs
50%
(Dutton, 2005; Ruppel, 2019)
Trend along the shelf & platform at the margin of Midland Basin
San Andres Reservoirs – Highest Cumulative Production of Permian Basin
Presenter
Presentation Notes
The San Andres has the highest cumulative production of any formation in the Permian Basin. More than 10.7 BBOE have been produced from the San Andres, accounting for ~50% of the conventionally-produced oil in the entire oil province. Notice that there is a clear trend in production on the shelves and platforms along the margin of the Midland Basin. These are “world-class” carbonate reservoirs. San Andres reservoirs on the Northwest Shelf, in particular, are some of the most productive in the Permian Basin. So, what were the geologic and geomorphic controls that formed this uniquely prolific oil province?

Yoakum
Roosevelt
Lea
DM
OZONA ARCH
GM
AM
Gaines
AM Apache MountainsDM Delaware MountainsGLM Glass Mountains
OUACHITA OVERTHRUST
Permian BasinNorthwest ShelfStudy AreaAbo Reef Structure
GM Guadalupe MountainsSD Sierra Diablo
NEW
MEX
ICO
TEXA
S
GLM
S. PALO DURO BASIN
SD DELAWARE BASIN
MIDLAND BASIN
EASTERN SHELF
Hockley
Terry
Cochran
All other Reservoirs(21.2 Bbbl)
(Dutton, 2005; Ruppel, 2019)
Morphology: Broad, low relief (~0.6°)
Dominant lithologies:
Dolomitized carbonates & anhydrites
Depositional environment:
Shallow lagoon & sabkha complexes
Sedimentation pattern:
Upward-shoaling prograding-aggrading sequences
Thickness: 1,200 – 1650 ft.
Rimmed Carbonate Shelf
San Andres Northwest Shelf – Rimmed Carbonate Shelf
Presenter
Presentation Notes
On the Northwest Shelf, the San Andres represents a broad, low relief, rimmed carbonate shelf. The predominant lithologies are dolomitized carbonates and anhydrites that were precipitated in shallow lagoon and sabkha complexes. A hierarchy of sea level fluctuations during an overall middle Permian regression resulted in cyclical stacking of upward-shoaling progradational-to-aggradational carbonate sequences. In the San Andres play fairway of W. Texas, the formation ranges from 1,200 – 1,650 ft. thick.

Yoakum
Roosevelt
Lea
DM
OZONA ARCH
GM
AM
Gaines
AM Apache MountainsDM Delaware MountainsGLM Glass Mountains
OUACHITA OVERTHRUST
Permian BasinNorthwest ShelfStudy AreaAbo Reef Structure
GM Guadalupe MountainsSD Sierra Diablo
TEXA
S
GLM
S. PALO DURO BASIN
SD DELAWARE BASIN
MIDLAND BASIN
EASTERN SHELF
Terry
NEW
MEX
ICO
HockleyCochran
Abo Reef Structure –lower Permian (Leonardian) shelf margin
(Dutton, 2005; Ruppel, 2019)
Carbonate Shelf Rim Overlies a Deep-Seated Shelf Margin
Presenter
Presentation Notes
Oil fields in the San Andres occur where low relief structures overlie deep-seated paleo topographic highs. On these structures, stratigraphically thicker sections of highly porous and permeable carbonates are prominent. The most prominent structural feature trends along the southern margin of the Northwest Shelf (in purple). This structural trend overlies a lower Permian shelf margin, atop the deep-seated lower-Leonardian stage Abo Reef structure.

CumulativeSan Andres Production
All OtherSan Andres Reservoirs(6.7 BBOE)
West TexasSan Andres (4.0 BBOE)
Yoakum
Lea
DM
OZONA ARCH
GM
AM
Gaines
AM Apache MountainsDM Delaware MountainsGLM Glass Mountains
OUACHITA OVERTHRUST
Permian BasinNorthwest ShelfStudy AreaAbo Reef Structure
GM Guadalupe MountainsSD Sierra Diablo
NEW
MEX
ICO
TEXA
S
GLM
SD DELAWARE BASIN
MIDLAND BASIN
EASTERN SHELF
Terry
Roosevelt S. PALO DURO BASIN
HockleyCochran
(Dutton, 2005; Ruppel, 2019)
Abo Reef Structure –lower Permian (Leonardian) shelf marginWest Texas San Andres Play Fairway
San Andres Play Fairway – West Texas
Presenter
Presentation Notes
The most prolific San Andres oil fields are situated in W. Texas, spanning Yoakum, Cochran, W. Hockley, and N.W. Terry Counties (in yellow). Cumulative production from this region is ~4.0 BBOE – nearly 40% of the cumulative total produced from the San Andres in the entire Permian Basin.

Yoakum
Roosevelt
Lea
DM
OZONA ARCH
GM
AM
Gaines
AM Apache MountainsDM Delaware MountainsGLM Glass Mountains
OUACHITA OVERTHRUST
Permian BasinNorthwest ShelfStudy AreaAbo Reef Structure
GM Guadalupe MountainsSD Sierra Diablo
NEW
MEX
ICO
TEXA
S
GLM
S. PALO DURO BASIN
SD DELAWARE BASIN
MIDLAND BASIN
EASTERN SHELF
Cochran Hockley
Terry
(Ramondetta, 1982a; Ramondetta, 1982b; Ruppel, 2019)
SourceRocks
Oil Fields
Migration
Abo Reef
Trend
Abo Reef
Trend
San Andres Play Fairway – West Texas
Presenter
Presentation Notes
In this region, the San Andres play fairway extends southward to the Abo Reef trend. Vertical migration of hydrocarbons through underlying strata – from source rocks of the northern Midland Basin facilitated accumulation in legacy fields along this trend. Traps along the Abo trend filled-to-spill, and lateral migration continued updip (northward), where successive trapping occurred in updip porosity-pinchouts. Reservoir facies grade shelfward into sabkha evaporites and terrigenous continental deposits and terminate along the Matador Uplift (in blue), at the southern margin of the Palo Duro Basin.

Permian Basin
Guadalupian
Equator
(Blakey, 2019)
Warming Climate and Near-Equatorial Latitude: Favorable for Sabkha Evaporites
Presenter
Presentation Notes
Waning-stage glaciation during the early and middle Permian and the shift from an icehouse to a greenhouse climate, coupled with the near-equatorial latitude of the Guadalupian stage Permian Basin, facilitated an increasingly arid climate. At the landward margins of the basin’s shelves and platforms, conditions were favorable for precipitation of sabkha evaporites and thick carbonate successions.

massive & nodular anhydrite
lime-rich mudstone
oolitic packstone and grainstone
algal-coated grainstone & mudstone
supratidalintertidal
subtidalrestricted
shoal activeshoal
N
mudstone & pellet packstone
(Ramondetta, 1982a; Ward et al., 1986)
Inner-Shelf Environments and Facies Tract
Presenter
Presentation Notes
This model shows a typical San Andres shelf facies tract. Supratidal environments were dominantly sabkha anhydrites. The intertidal zones are tidal flat environments - these are mainly mudstones and packstones. Subtidal environments range from a broad, shallow, subtidal lagoon – with lime-rich mudstones in the deeper lagoonal facies, and oolitic packstones and grainstones in the shallower shoal zone.

N
dolomitizing waters
hypersaline waters:supersaturated with dolomite
high porosity dolomite
(Saller, 2004; Ramondetta, 1982a; Ramondetta, 1982b)
Secondary Porosity Formed by Reflux Dolomitization
Presenter
Presentation Notes
Shelf rims facilitated the restriction of inner-shelf environments during sea level lows, creating hypersaline and schizohaline conditions, which were favorable for reflux dolomitization and formation of secondary porosity in inner-shelf carbonates (in blue). During sea level lows, subaerially exposed low-relief structures at the shelf rim were prone to enhanced porosity development due to refluxing of brines during base sea level fluctuations. These high-porosity structures (in yellow) are the primary target for conventional development in the San Andres.

N
dolomitizing waters
hypersaline waters:supersaturated with dolomite
Variable anhydriteplugged dolomite
(Saller, 2004; Ramondetta, 1982a; Ramondetta, 1982b)
Porosity Occlusion by Anhydrite Cement
Presenter
Presentation Notes
Dissolution of carbonates in supersaturated brines can also facilitate precipitation of anhydrite cement in the porous dolomitized carbonates. Because dolomitization and anhydrite plugging occur in similar conditions – at sea level lows – the occurrence of pore occlusion can be highly variable over short distances - complicating the distribution of porous reservoir facies in “off structure” targets.

Rise
(Lopez-Gamundi, 2019; Ross and Ross, 1987; Ruppel, 2019)
middle-Permian eustatic regression
San Andreseustatic
transgressions
Hierarchy of Sea Level Fluctuations
Presenter
Presentation Notes
An overall middle Permian sea level regression was punctuated by short-term transgressive pulses during San Andres time.

Rise
𝝅𝝅 Marker
UpperSan Andres
LowerSan Andres
UpperSan
Andres
LowerSan
Andres
(Lopez-Gamundi, 2019; Ross and Ross, 1987; Ruppel, 2019)
𝝅𝝅 Marker Bed Deposited at Sea Level Lowstand
Presenter
Presentation Notes
A regionally ubiquitious time-stratigraphic supratidal marker bed, known regionally as the Pi marker, was deposited across the San Andres shelf during the sea level lowstand – this marks the boundary between the Lower and Upper San Andres.

T
T
T
T
T
T
T
T
T
T
TR
R
R
R
R
R
R
R
R
R
R
Rise
High-FrequencyT-R Cycles
𝝅𝝅 Marker
UpperSan Andres
LowerSan Andres
UpperSan
Andres
LowerSan
Andres(Lopez-Gamundi, 2019; Ross and Ross, 1987; Ruppel, 2019)
High-Frequency Transgressive-Regressive Cycles
Presenter
Presentation Notes
Contributing further to the hierarchy of sea level fluctuations during San Andres time, higher-frequency transgressive-regressive cycles are well-defined by facies offset in the San Andres, and facilitate cyclical stacking of porous subtidal, and tight supratidal facies.
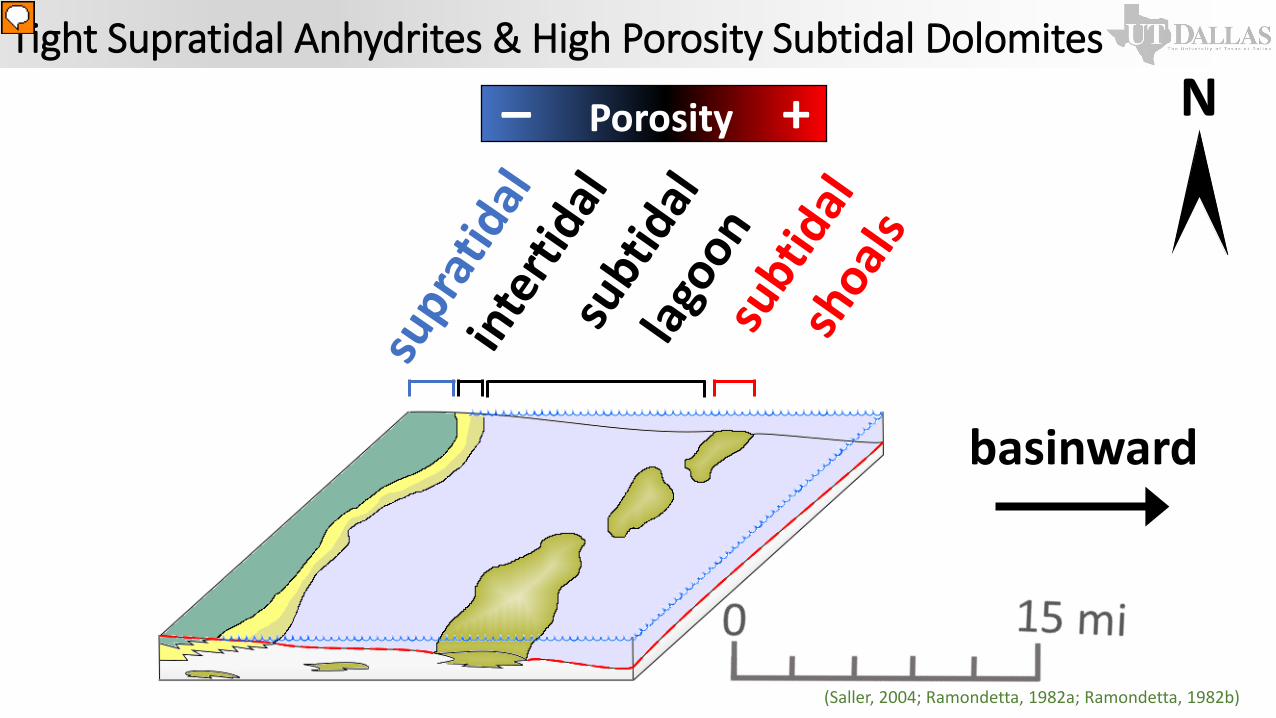
Tight Supratidal Anhydrites & High Porosity Subtidal DolomitesN– Porosity +
basinward
(Saller, 2004; Ramondetta, 1982a; Ramondetta, 1982b)
Presenter
Presentation Notes
Subtidal shoals were more prone to porosity enhancement by reflux dolomitization. Lagoonal and intertidal facies are increasingly tight and commonly have a highly variable porosity distribution – due to anhydrite-plugging of porous dolomite facies in dolomite-saturated hypersaline waters. Supratidal sabkha evaporites (anhydrites) are impermeable. Anhydrites and anhydritic dolomites in the Upper San Andres form an impenetrable seal, which helped to make Lower San Andres carbonates “world-class” reservoirs.

Sea Level
H
L
High-FrequencyT-R Cycles
N
upward-shoaling progradational-aggradational
(Ramondetta, 1982a; Ramondetta, 1982b; Ward et al., 1986)
Cyclical Stacking of Porous & Tight Facies
Presenter
Presentation Notes
This model shows how the hierarchy of sea level fluctuations affected San Andres stratigraphic architecture. High frequency transgressive-regressive cycles facilitated the cyclical stacking of porous and tight lithofacies. As you can see, topographically high shoals become deep-seated structures – influencing the placement and morphology of overlying structures. An overall sea level regression during the middle-Permian, coupled with intermediate transgressive-regressive cycles throughout the Guadalupian, caused an overall upward-shoaling, progradational-to-aggradational, migration of shelf facies.

thick porous dolomite
interbedded dolomite & anhydrite
N
(Ramondetta, 1982a; Ramondetta, 1982b)
Thick Reservoir Facies Grade Northward to Thin Beds
Presenter
Presentation Notes
The relationship between land and subsea facies greatly affected the distribution of San Andres reservoirs. The thickest porous zones, in the southernmost section of the play fairway, grade northward into interbedded anhydrites and dolomites. At the basinward section of the play fairway, subtidal environments were dominant, these fields in have thick, high-porosity pay zones – formed atop deep-seated paleo structures, such as the Abo Reef.

Intercrystalline Macroporosity – Vugular Pores Increase With Depth
(SEM images courtesy of Monadnock Resources, LLC)
intercrystalline macroporosity
Oversized grain-moldic pores
Presenter
Presentation Notes
These photomicrographs, courtesy of Monadnock Resources, are from vertical pilot wells in the San Andres. The red arrows show the typical intercrystalline pore structure in San Andres reservoirs.

Intercrystalline Macroporosity – Vugular Pores Increase With Depth
intercrystalline macroporosity
(SEM images courtesy of Monadnock Resources, LLC)
Oversized grain-moldic pores
vugularporosity increases with depth
Presenter
Presentation Notes
The green arrows show oversized voids. These grain-moldic pores increase with depth, and are, therefore, more common in the thicker reservoir sections, especially along the southern margin of the play fairway.

Thick Reservoir Facies Grade Northward to Discrete Beds
thick porous dolomite
interbedded dolomite & anhydrite
N
(Ramondetta, 1982a; Ramondetta, 1982b)
Presenter
Presentation Notes
In the northernmost section of the play fairway, cyclical stacking of intertidal and supratidal facies created thinner, discrete, porous pay zones, separated by anhydrite seals and anhydritic dolostones.

Compaction Drape and Fracturing Atop Low-Relief Structures
propagation of fracturesunder the overburden
carbonate shoal: Cycle 2
carbonate shoal: Cycle 3
carbonate shoal: Cycle 2
compaction
fractures in limestonebetween shales
fractures on crest
lagoonal mudstones
Ramp
lagoonal mudstones
North South
carbonate shoal: Cycle 1
Further Burial and Compaction
Shallow Burial and Compaction of Mudstones
Deposition of CarbonatesI
II
III
Abo Reef
Trend
Presenter
Presentation Notes
Successive deposition and burial of carbonates and mudstones atop, and on the margins of, the low relief shelf rim – also known as the Abo Trend – facilitated vertical fracturing along the crest of these structures. Continued burial and compaction facilitated the deepening of fractures. Dolomitizing waters were able to permeate through these fractures – further enhancing porosity and creating a migration pathway for hydrocarbon expulsion into the reservoir.

Outcrops in Guadalupe Mts. - ~150 mi. From W. Texas Reservoirs
WassonLevelland Brahaney
1 2 34
1 2 3 4Slaughter
Rio Hondo Rio Penasco Algerita Escarpment
NEW
MEX
ICO
TEXA
S
Guadalupe
Mts.
Northwest Shelf, W. Texas
(Kerans, 2014; Ruppel, 2019)
Presenter
Presentation Notes
Dr. Charles Kerans modeled San Andres stratigraphy from outcrop in the Guadalupe Mountains, north of the Delaware Basin (~150 miles from the study area) and used that model to describe the stratigraphic position of oil fields north of the Midland Basin.

Progradational-Aggradational San Andres Shelf Migration
NEW
MEX
ICO
TEXA
S
Guadalupe
Mts.
Rio Hondo Rio Penasco Algerita Escarpment
Guadalupe Mts.N S
(Kerans, 2014; Ruppel, 2019)
Presenter
Presentation Notes
Notice the prograding-aggrading nature of shelf environments in response to sea-level changes as the Permian carbonate margin stepped basinward. The best reservoir facies were deposited along the restricted shelf (in orange).
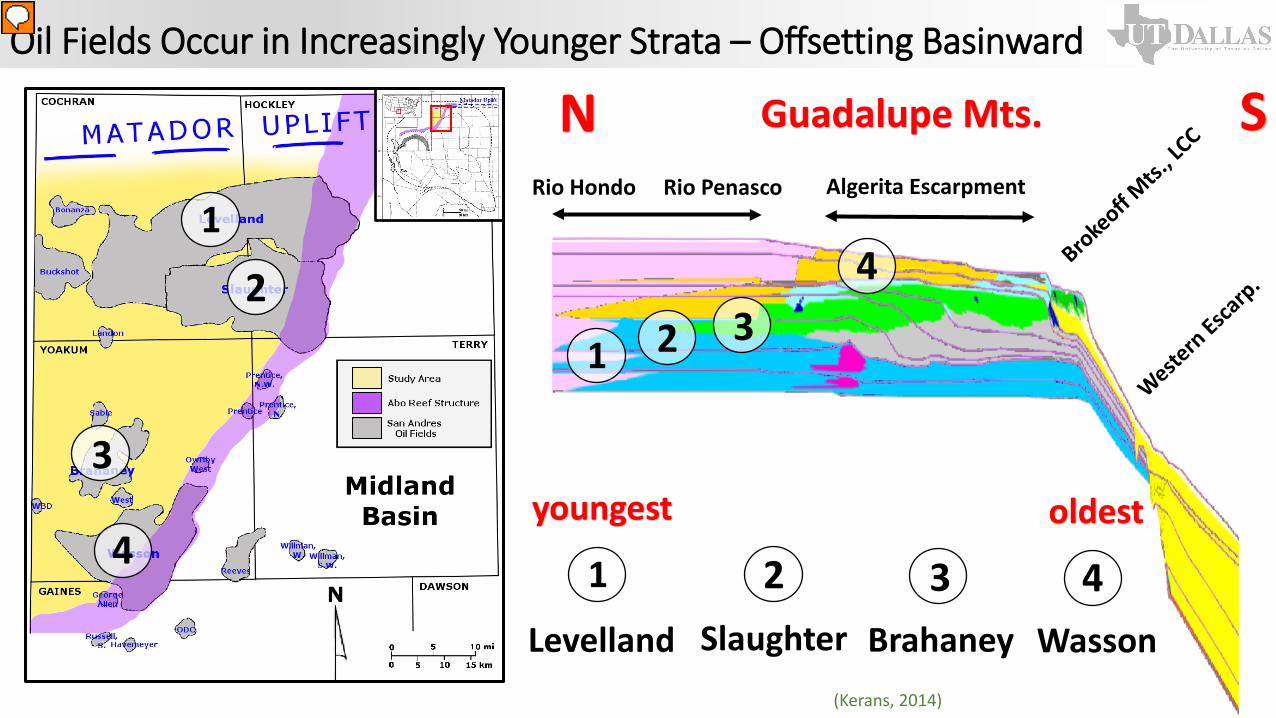
Oil Fields Occur in Increasingly Younger Strata – Offsetting Basinward
WassonLevelland Brahaney
1 2 34
1 2 3 4Slaughter
1
2
3
4
Rio Hondo Rio Penasco Algerita Escarpment
Guadalupe Mts.
youngest oldest
N S
(Kerans, 2014)
Presenter
Presentation Notes
Oil fields in this region, according to Kerans’ model, occur in increasingly younger strata – offsetting basinward.

Sabkha Evaporites Extend Southward During Mid-Permian Regression
Early Guadalupian (268 Ma)
Late Guadalupian (263 Ma)
San Andres at margin of Midland Basin open marine waters
Continued sea level fall: supratidal sabkhas extend over the Midland Basin
(Blakey, 2019)
Presenter
Presentation Notes
During San Andres time, this region extended along the northern margin of the open marine waters of the Midland Basin. As the middle-Permian eustatic regression continued, supratidal sabkha evaporites continued to extend basinward, sealing Permian Basin reservoirs. In the San Andres, however, the reservoir seal occurs at the Pi Marker – the boundary between the Upper and Lower San Andres.

Structure Map of the 𝝅𝝅 Marker – The Base of the Reservoir SealA
A’
(Ramondetta, 1982a; Ramondetta, 1982b)
Presenter
Presentation Notes
The contours show shelf structure at the time-stratigraphic Pi Marker. All San Andres reservoirs occur below this stratigraphic level. Above the Pi Marker, anhydrites and anhydritic dolomites of the Upper San Andres provide the seal for the reservoir. As you would expect, the shelf position of structural highs (circled in red) correspond with legacy oil fields.

Inner-to-Outer Shelf Reservoir Architecture
A0
500
1500
1000
2000
2500
Upper San Andres seal
A’sea level
A
A’
AboTrend
Matador Uplift
(Ebanks, 1990; Ramondetta, 1982a; Ramondetta, 1982b)
Presenter
Presentation Notes
The simplified cross section (left) shows the San Andres reservoir architecture – from north to south. The shelf dips gently (~0.5°) toward the basin. Because of the continuous forward-and-backstepping of shelf environments, successive stratigraphic traps were established in the form of updip porosity pinchouts. The red arrows correlate with structural highs circled along the cross-section line (right).

A0
500
1500
1000
2000
2500
Upper San Andres seal
A’sea level
A
A’
AboTrend
Matador Uplift spill
pointspill
pointspill
point
(Ebanks, 1990; Ramondetta, 1982a; Ramondetta, 1982b)
Migration and Successive Trapping in Updip Porosity Pinchouts
Presenter
Presentation Notes
Hydrocarbons migrated vertically, through the Abo Trend – at the southern margin of the play fairway. Once they encountered the Upper San Andres seal, they continued updip, and filled-to-spill the structurally low-relief reservoirs. Migration and filling of the Lower San Andres reservoirs is thought to have continued – forming a, once, much larger paleo oil reservoir.

980
1000
1020
1040
1060
1080
1100
1120
1140
1160
1180
1200
1220
1240
1260
1280
1300
0 10 20 30 40 50
Vertical Oil Saturation Profile
(Ruppel, 2019; Trentham and Melzer, 2019)
main pay zone: vertical target – occurs on low-relief structures
transitional oil zone:water-laden interval (decreasing oil saturation with depth & increasing water saturation)
Goldsmith Landreth San Andres Unit, Ector Co., TX
Oil Saturation (%)
Oil-water contact
Oil Saturation Continues Below the Conventional Fields
Presenter
Presentation Notes
The diagram shows the oil saturation profile in the San Andres Fm. for a well in Ector Co., TX. The main pay zone is the target for vertical development in legacy fields. As you would expect, this interval has the highest oil saturation. However, saturation continues below the oil-water contact – into the transitional oil zone.

980
1000
1020
1040
1060
1080
1100
1120
1140
1160
1180
1200
1220
1240
1260
1280
1300
0 10 20 30 40 50
Vertical Oil Saturation Profile
(Ruppel, 2019; Trentham and Melzer, 2019)
transitional oil zone:water-laden interval (decreasing oil saturation with depth & increasing water saturation)
Goldsmith Landreth San Andres Unit, Ector Co., TX
Oil Saturation (%)
Oil-water contact
(+) water saturation
(-) oil saturation
main pay zone: vertical target – occurs on low-relief structures
Oil Saturation Decreases With Depth; Water Saturation Increases
Presenter
Presentation Notes
Below the oil-water contact - as depth increases, water saturation increases, with a proportionate decrease in oil saturation.

980
1000
1020
1040
1060
1080
1100
1120
1140
1160
1180
1200
1220
1240
1260
1280
1300
0 10 20 30 40 50
Vertical Oil Saturation Profile
(Ruppel, 2019; Trentham and Melzer, 2019)
transitional oil zone:water-laden interval (decreasing oil saturation with depth & increasing water saturation)
Goldsmith Landreth San Andres Unit, Ector Co., TX
Oil Saturation (%)
San Andres basal limestone:Minor oil saturation indicates previous saturation to the base of the reservoir
Oil-water contact
(+) water saturation
(-) oil saturation
main pay zone: vertical target – occurs on low-relief structures
Indication of a Larger Paleo Oil Trap and Subsequent Flushing
Presenter
Presentation Notes
Interestingly, there is minor oil saturation in the basal limestone – indicating that this reservoir was once saturated all the way down to the base of the porous dolomite facies. So, what happened?
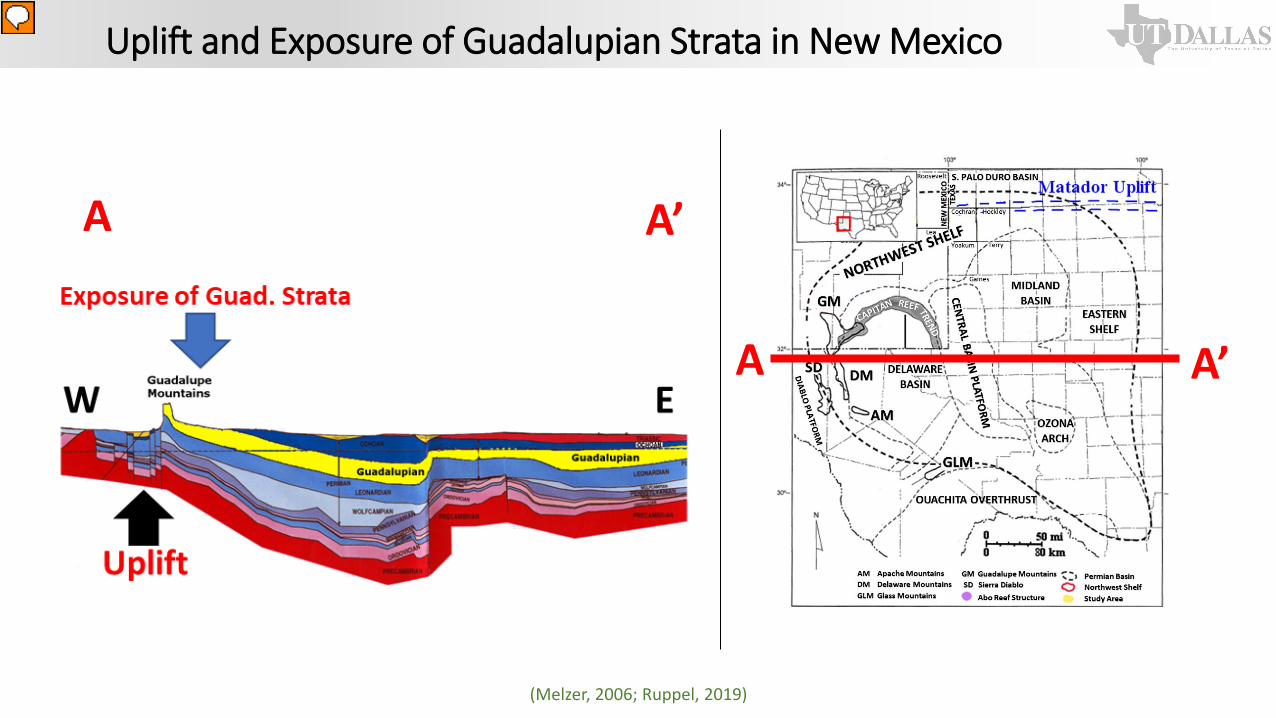
A A’
A A’
(Melzer, 2006; Ruppel, 2019)
Uplift and Exposure of Guadalupian Strata in New Mexico
Presenter
Presentation Notes
Uplift in New Mexico - associated with Laramide Orogeny tectonism – exposed Guadalupian strata. Creating an avenue for an influx of meteoric water into the San Andres reservoir.

(Ruppel, 2019; Trentham et al., 2015)
Influx of Meteoric Water and Sweeping of the Lower Oil Column
Presenter
Presentation Notes
On the left is a map of “fairways of sweep” throughout the San Andres reservoirs in the Permian Basin. The proposed pathways for water migration are shown in blue and San Andres oil fields are in shown green.

(Trentham et al., 2015)
Flushing of the Lower Oil Column
Presenter
Presentation Notes
In this region, the lower oil column was flushed in the southeast direction – following the dip of San Andres shelf.

(Melzer, 2006)
main pay zone (MPZ)
vertical target – on structural highs
transitional oil zone (TZ)
150-300 ft. thick water-laden interval below oil-water contact
residual oil zone (ROZ)
no primary oil recovery
horizontal target
Resurgent Play Extends Beyond the Flanks of Legacy Fields
Presenter
Presentation Notes
Legacy oil fields have a main pay zone. In other words – an economic conventional target for production via vertical wells. Beyond the flanks of legacy fields, the transitional oil zone - a 150-300 ft. thick interval that contains primary oil – or oil that is mobile and can be produced without secondary or tertiary recovery methods – is the target for the resurgent San Andres play. Although the transition zone has lower oil saturations, it’s still an economic target for horizontal drilling operations. Below the transitional zone, the residual oil zone has no mobile oil and is not a target for primary recovery.

Petrophysical Analysis Indicates Prograding-Aggrading Shelf
Presenter
Presentation Notes
Contrary to the typical approach of studying sedimentary facies and stratigraphy to identify drilling targets, this study utilized whole-core and petrophysical data from San Andres wells to confirm the progradational-aggradational nature of San Andres shelf strata. The map (left) shows a 431 sq. mi. area within Yoakum Co. Detailed petrophysical analyses were conducted for 73 wells (in blue). Dark red lines note the limits of vertical production (i.e., all wells outside of these fields are penetrating “off structure” strata).

N Methodology:
1. Calculate oil-in-place from petrophysical analyses
2. Indicate the depth of most saturated 100 ft. reservoir interval
3. Contour similar depths
Petrophysical Analysis Indicates Prograding-Aggrading Shelf
Presenter
Presentation Notes
For each well, total oil in place was calculated from petrophysical analyses. The interval with the best 100 ft. of reservoir (i.e., the interval with the highest calculated oil in place) was plotted. The depth of the interval with the “best 100 ft.” is indicated by the contours. The sub sea-level depth is represented by the scaled color scheme.

NResults:
The depth of the “best 100 ft.” interval indicates the depth of the restricted shelf margin.
Moving basinward (southeast), the depth of the restricted shelf margin indicates progradational-aggradational shelf migration.
Petrophysical Analysis Indicates Prograding-Aggrading Shelf
Presenter
Presentation Notes
Keeping in mind that the best reservoirs occur on the basinward margins of the restricted shelf, it’s clear that the data confirms the progradational-aggradational migration of shelf facies.

NResults:
The depth of the “best 100 ft.” interval indicates the depth of the restricted shelf margin.
Moving basinward (southeast), the depth of the restricted shelf margin indicates progradational-aggradational shelf migration.
Petrophysical Analysis Indicates Prograding-Aggrading Shelf
Presenter
Presentation Notes
Moving from shelf-to-basin (northwest-to-southeast), the progradational and aggradational migration of the shelf margin is clear. Where the contours are more widely distributed, it’s an indication of shelf environments stepping toward the basin. Where they’re closer together, it’s an indicator of a more aggradational movement.

N
Core Properties Within the “Best 100 Ft.” of Reservoir
Presenter
Presentation Notes
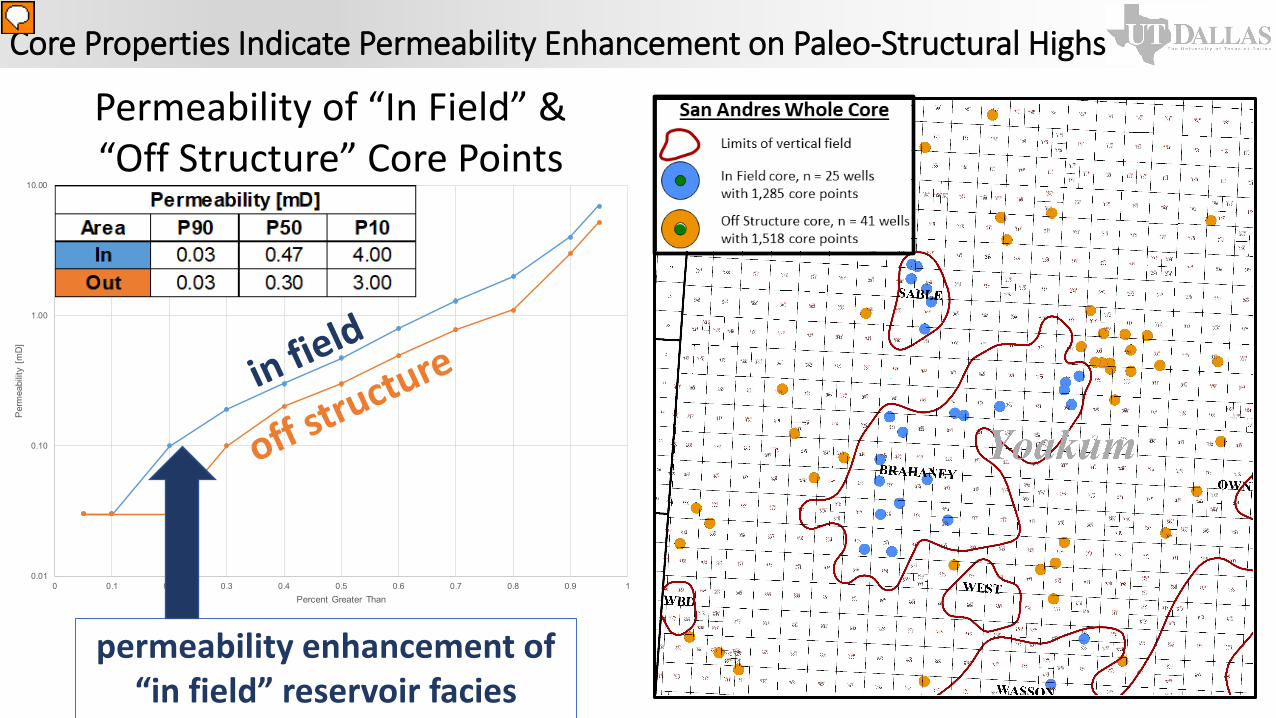
The grid on the right is of the same area. This map shows the distribution of wells with “whole core” data. Shown in blue are 25 “on structure” wells (i.e., wells within vertical fields). From these wells, 1,285 data points fall within the “best 100 ft.” of reservoir. 41 wells penetrating “off structure” targets (i.e., targets of the resurgent San Andres play) beyond the flanks of vertical fields contained data within the “best 100 ft.” interval. This study includes a comparative analysis of reservoir properties within the “best 100 ft.” interval in both targets.

0
2
4
6
8
10
12
14
16
0 0.1 0.2 0.3 0.4 0.5 0.6 0.7 0.8 0.9 1
Por
osity
[%]
Percent Greater Than
In Out
Porosity of “In Field” & “Off Structure” Core Points
Core Properties Indicate Porosity Enhancement on Paleo-Structural Highs
Presenter
Presentation Notes
The “probability of exceedance” curve (left) indicates the “degree of certainty” for porosity values at any given point within the best 100 ft. of reservoir. The blue line represents porosity values for “in field” reservoir, and the orange line represents “off structure” reservoir.

0
2
4
6
8
10
12
14
16
0 0.1 0.2 0.3 0.4 0.5 0.6 0.7 0.8 0.9 1
Por
osity
[%]
Percent Greater Than
In Out
Porosity of “In Field” & “Off Structure” Core Points
Core Properties Indicate Porosity Enhancement on Paleo-Structural Highs
Presenter
Presentation Notes
For example, the curve shows that, of our 1,285 “in field” core points, there was a 90% certainty that the porosity value of any particular point would be higher than 3.3%. Likewise, there was 10% certainty that the porosity would be greater than 13.3%.

0
2
4
6
8
10
12
14
16
0 0.1 0.2 0.3 0.4 0.5 0.6 0.7 0.8 0.9 1
Por
osity
[%]
Percent Greater Than
In Out
Porosity of “In Field” & “Off Structure” Core Points
porosity enhancement of “in field” reservoir facies
Core Properties Indicate Porosity Enhancement on Paleo-Structural Highs
Presenter
Presentation Notes
More importantly, the data clearly indicates that “in field” reservoir facies have enhanced porosity relative to “off structure” targets.
0.01
0.10
1.00
10.00
0 0.1 0.2 0.3 0.4 0.5 0.6 0.7 0.8 0.9 1
Per
mea
bilit
y [m
D]
Percent Greater Than
In Out
Core Properties Indicate Permeability Enhancement on Paleo-Structural Highs
Permeability of “In Field” & “Off Structure” Core Points
permeability enhancement of “in field” reservoir facies
Presenter
Presentation Notes
Likewise, the data for permeability shows the same trend – with “in field” reservoir facies showing enhanced permeability relative to “off structure” targets.

0
10
20
30
40
50
60
70
80
0 0.1 0.2 0.3 0.4 0.5 0.6 0.7 0.8 0.9 1
Wat
er S
atur
atio
n [%
]
Percent Greater Than
In Out
Water Saturation of “In Field” & “Off Structure” Core Points
greater water saturation in “off” structure reservoir
Core Properties Indicate Greater Water Saturation in “Off” Structure Reservoir
Presenter
Presentation Notes
Core analyses also indicate higher water saturation in “off structure” strata.

Water SaturationPermeabilityPorosity
• porosity enhancement by secondary dolomitization
• porosity occlusion in lagoonal or intertidal facies
• paleo-waterflood and sweeping of the lower oil column
Reservoir Quality Diminishes Off the Flanks of Legacy Fields
Presenter
Presentation Notes
From this data, it’s clear that reservoir quality diminishes off the flanks of legacy fields. For producers, this is an indicator of why it’s necessary to pursue the resurgent San Andres target with unconventional drilling methods. From a purely geological standpoint, this is a more quantitative depiction of the effects of porosity enhancement by secondary dolomitization on structural highs. Or porosity occlusion in lagoonal or intertidal facies – due to precipitation of anhydrite cement in hypersaline environments. The contrasts in water saturation are also a clear indication of which intervals of the reservoir were more thoroughly flushed during the paleo-waterflood.

• The San Andres Fm. on the Northwest Shelf in W. Texas represents a “world-class” carbonate hydrocarbon reservoir – formed by the complex interactions of supratidal and subtidal environments during a hierarchy of sea-level fluctuations and increasingly arid climatic conditions
• A paleo-waterflood flushed the lower oil column of the reservoir, leaving a distribution of distinct targets for production that vary in oil-water saturation, distribution, and method of production
• Petrophysical and core analyses of these targets provide a quantitative method of analysis of the prograding-aggrading migration of shelf environments, and the diminishing reservoir quality, moving from the “in field” to “off” structure reservoir
Takeaways

Blakey, R., n.d., Greater Permian Basin: http://deeptimemaps.com/greater-permian-basin-map-list/ (accessed October 21, 2019).
Dutton, S.P., Kim, E.M., Broadhead, R.F., Raatz, W.D., Breton, C.L., Ruppel, S.C., and Kerans, C., 2005, Play analysis and leading-edge oil-reservoir development methods in the Permian Basin: Increased recovery through advanced technologies: AAPG Bulletin, v. 89, p. 553–576, doi: 10.1306/12070404093.
Ebanks, W. J., 1990, Geology of the San Andres Reservoir, Mallet Lease, Slaughter Field, Hockley County, Texas: Implications for Reservoir Engineering Projects: Geologic and Engineering Approaches in Evaluation of San Andres/Grayburg Hydrocarbon Reservoirs - Permian Basin, Bureau of Economic Geology, p. 75–85.
Kerans, C., 2014, San Andres Formation: Outcrop to Subsurface Stratigraphic Framework: SlideServe, https://www.slideserve.com/tekla/san-andres-formation-outcrop-to-subsurface-stratigraphic-framework (accessed March 2020).
Lopez-Gamundi, C., 2019, INTEGRATED GEOCHEMISTRY AND SEDIMENTOLOGY OF THE WOLFCAMP B3 AND B2 INTERVALS, MIDLAND BASIN, TX: University of Oklahoma: <https://www.researchgate.net/publication/333516360_INTEGRATED_GEOCHEMISTRY_AND_SEDIMENTOLOGY_OF_THE_WOLFCAMP_B3_AND_B2_INTERVALS_MIDLAND_BASIN_TX> (accessed October 21, 2019).
Melzer, S. L., 2006, Stranded Oil in the Residual Oil Zone: Advanced Resources International and U.S. Department of Energy: Office of Fossil Energy – Office of Oil and Natural Gas: http://residualoilzones.com/wp-content/uploads/2018/02/Melzer2006.pdf (accessed November 17, 2019).
References

Ramondetta, P.J., 1982a, Facies and Stratigraphy of the San Andres Formation, Northern and Northwestern Shelves of the Midland Basin, Texas and New Mexico: Bureau of Economic Geology, The University of Texas at Austin, doi: 10.23867/ri0128d.
Ramondetta, P.J., 1982b, Genesis and Emplacement of Oil in the San Andres Formation, Northern Shelf of the Midland Basin, Texas: Bureau of Economic Geology, The University of Texas at Austin, doi: 10.23867/ri0116d.
Ross, C.A., and Ross, J.R.P., 1987, Late Paleozoic Sea Levels and Depositional Sequences: Cushman Foundation for Foraminiferal Research, Special Publication No. 24.
Ruppel, S.C., 2019, Anatomy of a Paleozoic basin: the Permian Basin, USA: Austin, TX, The University of Texas at Austin, Bureau of Economic Geology, v. 1.
Saller, A.H., 2004, Palaeozoic dolomite reservoirs in the Permian Basin, SW USA: stratigraphic distribution, porosity, permeability and production: Geological Society, London, Special Publications, v. 235, p. 309–323, doi: 10.1144/gsl.sp.2004.235.01.13.
Trentham, B. L., and Melzer, S. L., 2019, A "Cookbook" Approach to Evaluating Residual Oil Zones Completed as Horizontal Depressurizing (DUROZ) Wells in the San Andres Formation: AAPG: Search and Discovery, no. 51570, doi:10.1306/51570Trentham2019.
Trentham, B.L., Melzer, S.L., Vance, D.B., Kuuskraa, V., and Petrusak, R., 2015, Identifying and Developing Technology for Enabling Small Producers to Pursue the Residual Oil Zone (ROZ) Fairways of the Permian Basin, San Andres: Residual Oil Zones, http://residualoilzones.com/rpsea-ii/.
Ward, R.F., Kendall, C. G. ST., and Harris, P.M., 1986, Upper Permian (Guadalupian) Facies and Their Association with Hydrocarbons--Permian Basin, West Texas and New Mexico: AAPG Bulletin, v. 70, p. 239–262, doi: 10.1306/9488566f-1704-11d7-8645000102c1865d.
References