2.7 Sampling
19
2.7 Sampling In an EFSA, it is normally neither feasible nor desirable to survey every location and household affected by the emergency. A sample must therefore be drawn. A sample is a selection of households or individuals from the total affected population. The sample should represent the larger population and reduce the time and cost of data collection. If a sample is representative, generalizations about the total population can be extrapolated from the results of the sample survey. It is extremely important that the sample be drawn in a methodologically rigorous way. This section explains the key terms used in sampling, and provides guidance on choosing the most appropriate sampling methodology for a given situation. 2.7.1 Sampling frame The sampling frame represents the area and population that the assessment is intended to cover, for example, a region within a country or a particular population group, such as displaced people. The sampling frame must be defined at the start of the assessment planning process. The sampling frame may cover only areas and groups directly affected by the emergency. Alternatively, it may also include indirectly affected areas and groups, where the impact on the population can be just as severe. These include the areas into which displaced people have moved; 30 host populations for displaced people; and areas suffering economically as a result of the emergency, such as those whose markets depend on produce from a drought-affected area. 95 Part III / chapter 2: Planning an EFSA PART III Slow-onset emergencies In-depth assessment: Scenario 3: A slow-onset emergency, such as a drought or long-term conflict. • The crisis is neither urgent nor volatile. The situation has been slowly deteriorating for some time, and some factor has now triggered an assessment (see Section 2.1). • There are no time constraints, but the assessment results are needed soon for programming. • The area may be large or small. Stratified two-stage sampling is applied (see Box 3.2): zones (strata) → locations → households. Where possible, random samples of locations and households within those locations are used. If random samples are not feasible, locations are selected purposively, and households within these are selected randomly or purposively. Both semi-structured interviews and questionnaires surveys are undertaken. _____________ 30. Technical Guidance Sheet No. 1 Integrating Migration and Displacement into Emergency Food Security Assessments, WFP Emergency Needs Assessment Service, May 2007.
-
Upload
khangminh22 -
Category
Documents
-
view
0 -
download
0
Transcript of 2.7 Sampling

2.7 Sampling
In an EFSA, it is normally neither feasible nor desirable to survey every locationand household affected by the emergency. A sample must therefore be drawn. Asample is a selection of households or individuals from the total affectedpopulation. The sample should represent the larger population and reduce the timeand cost of data collection. If a sample is representative, generalizations about thetotal population can be extrapolated from the results of the sample survey.
It is extremely important that the sample be drawn in a methodologically rigorousway. This section explains the key terms used in sampling, and provides guidanceon choosing the most appropriate sampling methodology for a given situation.
2.7.1 Sampling frame
The sampling frame represents the area and population that the assessment isintended to cover, for example, a region within a country or a particular populationgroup, such as displaced people. The sampling frame must be defined at thestart of the assessment planning process.
The sampling frame may cover only areas and groups directly affected by theemergency. Alternatively, it may also include indirectly affected areas and groups,where the impact on the population can be just as severe. These include the areasinto which displaced people have moved;30 host populations for displaced people;and areas suffering economically as a result of the emergency, such as thosewhose markets depend on produce from a drought-affected area.
95Part III / chapter 2: Planning an EFSA
PARTIII
Slow-onset emergencies
In-depth assessment:Scenario 3: A slow-onset emergency, such as a drought or long-term conflict.• The crisis is neither urgent nor volatile. The situation has been slowly deterioratingfor some time, and some factor has now triggered an assessment (see Section 2.1).
• There are no time constraints, but the assessment results are needed soon forprogramming.
• The area may be large or small.
Stratified two-stage sampling is applied (see Box 3.2): zones (strata) → locations →households. Where possible, random samples of locations and households within thoselocations are used. If random samples are not feasible, locations are selectedpurposively, and households within these are selected randomly or purposively. Bothsemi-structured interviews and questionnaires surveys are undertaken.
_____________30. Technical Guidance Sheet No. 1 Integrating Migration and Displacement into Emergency Food SecurityAssessments, WFP Emergency Needs Assessment Service, May 2007.

The directly and indirectly affected areas and population groups are identified fromsecondary information and key informant interviews.
2.7.2 Types of sampling
The choice of sampling methodology depends on the time and resources available,the level of access and the specific objectives of the assessment. There are twomajor types of sampling approach, probability sampling and non-probabilitysampling. The following two sampling approaches are commonly used in EFSAs:
• Purposive sampling (non-probability sampling): The researcher decides whichparticular groups to interview. Non-probability sampling does not involve randomselection, so the results cannot be used to characterize the wider population. Itsvalue lies in selecting information-rich cases to gain a deeper understanding ofthe situation when random sampling is not possible. The researcher selects whatshe/he regards as representative sampling units, but the generalization offindings from such a sample can always be contested.
Purposive sampling techniques are normally used in initial and rapidassessments for rapid-onset emergencies.
• Random sampling (probability sampling): All members of the population have aknown, non-zero chance of being selected. Random sampling is based on formalstatistical theory, which allows reliable estimates to be calculated and minimizesbias. Results can be extrapolated to the entire population with a degree ofaccuracy that depends on the sample size and the variability of the indicator.
Random sampling techniques are normally used for in-depthassessments, usually in slow-onset emergencies, and in emergencysituations once conditions have stabilized.
Table 3.3 shows the circumstances under which each type of sampling is used.
96 Emergency Food Security Assessment Handbook / second edition

2.7.3 Purposive sampling
This section presents methods for initial and rapid assessments using purposivesampling.
2.7.3.1 Principles of purposive sampling
Purposive sampling might be used when any of the following conditions apply:• It is difficult to reach every area, household or individual member of thepopulation.
• Reliable information about population locations and numbers is not available.• There is insufficient time to visit the number of households or individuals neededfor statistical analyses using a random sample. The most severely affected areasare prioritized, for example, agricultural areas during a drought, or villagesinhabited by targeted groups during a conflict.
• There is strong evidence that nutrition and food security risks are concentratedin certain areas or population groups, such as particular livelihood groups ordisplaced people. In many cases, it is not possible to set up a sampling framethat allows these groups or areas to be stratified.
97Part III / chapter 2: Planning an EFSA
PARTIII
Sampling approach Circumstances
Non-probability Initial and rapid assessments
Purposive - Population data do not exist or are not reliable- Access is limited to certain areas- There is little time- The situation is unstable and changing continuously- Can be used for initial, rapid and in-depth EFSAs
Snowball - Very little information is available about the location of groups orindividuals
- People are reluctant to be registered on a list- Time is short- In an initial EFSA it can provide background information for asubsequent rapid or in-depth EFSA
Convenience - Time or access is limited- In an initial EFSA it can provide background information for asubsequent rapid or in-depth EFSA
Probability In-depth assessments
Random - Unbiased estimates with known precision are needed- Population data exist- All parts of the affected area are accessible- The situation is reasonably stable- There is sufficient time to visit all the selected households and carryout the required number of interviews
- Can be used for rapid and in-depth EFSAs in slow-onset emergenciesor once an emergency situation has stabilized
Table 3.3: Circumstances under which each type of sampling is used

• The assessment objectives necessitate in-depth investigation of specific issues.For example, if the EFSA is expected to provide detailed information about theimpact of market disruptions, groups of people who depend on the markets willbe prioritized, such as traders, cash crop growers and people who rely onpurchasing their food at markets.
Although the information collected through purposive sampling cannot beextrapolated to the entire population – as it can be in random sampling –generalizations can be extended to the wider population under the followingcircumstances:• Triangulation is applied to all data (see Part IV). In triangulation, data are collectedfrom numerous sources and their convergence, or otherwise, is appraised. If datafrom at least three reliable sources converge, the conclusions can be treated withreasonable confidence.
• Purposive sampling is combined with semi-structured interviews for primary datacollection (see Section 4.3.2). This allows in-depth discussion and, consequently,a greater understanding of the crisis, its causes and effects. Conclusions from allthe semi-structured interviews provide a sound basis for judging the extent towhich they can be extrapolated.
It is not known how representative the sample is, so generalizations madethrough the purposive sampling approach are subjective (or biased), andconfidence intervals for the estimates would be irrelevant.
Good purposive sampling depends on having a thorough knowledge of the context– the type of emergency and the characteristics of the population. Such knowledgeis initially gained through secondary data review (see Section 2.5). If secondary dataare incomplete or inaccurate, or if the situation is changing rapidly, sampling can beadjusted as the assessment progresses. For example, population groups and areasmay be added or removed as more information about the crisis is obtained.
Purposive sampling can be combined with random sampling techniques. Forexample, households might be selected through random sampling in a locationselected through purposive sampling. Note that this does not make the samplestatistically representative, which requires that the entire sampling process followrandom sampling principles (see Section 2.7.4).
2.7.3.2 Determining the sample size
There is no formula for setting the sample size for purposive sampling. Instead,judgements must bemade, based on the expected heterogeneity of areas, populationgroups, locations, households and individuals. If heterogeneity is high and units arevery different from each other, a large sample is needed, but the sample size alsodepends on the time and resources available. If heterogeneity is low and units aresimilar to each other, a smaller sample will suffice. This is illustrated in Example 3.3.
98 Emergency Food Security Assessment Handbook / second edition

If areas and population groups are heterogeneous, a separate sample size shouldbe estimated for each. The rule of thumb explained in Box 3.1 can be used,
99Part III / chapter 2: Planning an EFSA
PARTIII
An EFSA is undertaken in the urban and rural areas of a region affected by economiccollapse. One of the objectives is to determine the impact of the crisis on livelihoods. Theassessment team decides that to do this, they need to sample according to livelihoodgroups.
In the urban area, six main livelihood groups are identified:• civil servants;• traders;• professional workers: doctors, engineers, teachers, etc.;• salaried workers: shop assistants, storekeepers, construction supervisors, etc.;• casual labourers;• unemployed/beggars.
To understand the situation, and taking the time constraints into account, the teamdecides that ten households must be interviewed from each livelihood group. This givesa total sample size for the urban area of 6 x 10 = 60 households.
In the rural area, three main livelihood groups are identified:• farmers producing crops for consumption and sale;• pastoralists living from the consumption and sale of animal products;• landless farm workers.
Again, the team decides to interview ten households per livelihood group. The totalsample size for the rural area is therefore 10 x 3 = 30 households.
Example 3.3: Heterogeneous populations: implications for purposive sampling
As a rule of thumb based on empirical experience of household food security surveys,between 50 and 150 households per reporting domain can be included in a purposivesample, and the following guidance applied.
If locations are clearly very different from each other:• divide them into groups of locations with similar characteristics;• within each group, visit seven to fifteen locations;31• within each location, interview seven to ten households or individuals.32
If locations seem to resemble each other:• check that there are no less obvious characteristics that may influence household foodsecurity (see Section 2.7.3.4), such as:- geographical dispersion of the locations, which could affect crop productionpatterns, access to markets and other services, and roads;
- population size;
Box 3.1: Rule of thumb for estimating sample size in purposive sampling
_____________31. However, whenever possible, random probability sampling is preferable to purposive sampling.32. Here too, random sampling should be considered if it fulfils the assessment requirements.
(cont…)

In purposive sampling, the sample size can be adjusted during the assessment.For example, if it becomes apparent that all locations within a group are very similar,the number of locations to be visited can be reduced to seven or eight, instead often to fifteen. When households are seen to be very similar, the number ofhouseholds visited in each location can be reduced in the same way. Conversely,if there is more heterogeneity than expected, groups of locations may besubdivided and additional groups added.
2.7.3.3 Selection of geographical zones
In purposive sampling, the geographical zones to be covered are determinedaccording to the nature of the crisis and the assessment objectives:• If the crisis is small-scale and concentrated, the assessment may cover only thedirectly affected area, such as when flooding affects only one isolated part of acountry.
• In a sudden-onset crisis, early assessments will prioritize the zones directlyaffected, where lives are most at risk. Subsequent assessments may considerwider economic, social and health implications.
• In a slow-onset emergency affecting the whole country, such as in a drought ina small country that relies on agriculture, zones may be selected in any part ofthe country, but random sampling would be more appropriate if time andresources permit.
Wherever possible, it is useful to select a range of zones that include some directlyaffected, some indirectly affected and some minimally affected, to provide the basisfor comparison. This is rarely possible in sudden-onset emergencies, however, sozones are prioritized according to the expected severity of the situation in each.
In some situations, it is worth visiting areas covered by previous assessments toallow qualitative comparisons between current and previous situations.
100 Emergency Food Security Assessment Handbook / second edition
-distribution of ethnic or social groups within the locations, such as differentethnicities or social strata within communities, which may affect access to assets,including food and income;
- direct and indirect impacts of events, etc;• if differences exist, group the locations according to the chosen characteristic andproceed as indicated above.
If there is no information for identifying differences among locations:random sampling is applied, as described in Section 2.7.4.4; fewer locations andhouseholds can be sampled because the statistics derived cannot be extrapolated withknown confidence intervals, and time is limited. The number of locations can be ten tofifteen, with seven to ten households within each location.
(…cont)

2.7.3.4 Selection of locations within geographical zones
The locations - villages, communities or neighbourhoods - to be visited can beidentified in either of the following ways:• They can be selected according to the expected severity of the situation, or thecharacteristics of the locations and the people living in them. This method is usedwhen there are significant differences among the locations in a geographicalzone, or when constraints such as time and accessibility limit the number oflocations that can be visited.
• When locations are known to be similar, or when little is known about theircharacteristics, those selected should be more dispersed, and hence morerepresentative. The number of locations should also be increased – i.e. from tento fifteen (see Box 3.1).33
When choosing locations, it is important to minimize the “hub effect”34 In manyemergencies, humanitarian hubs develop in the affected areas, typically main towns,where aid agencies congregate, set up field offices and stockpile resources. Villagesclose to a humanitarian hub tend to receive more attention and services than thosefurther away. When choosing locations to visit for an EFSA, it is important to bearthis in mind and visit some locations that are less easily accessible.
The list of purposively selected locations to be visited can be changed during theassessment, for example, if it is found that initial assumptions about the mostaffected locations were wrong or incomplete. New locations can be added, andexisting ones removed from the list.
As with random sampling, it is better to visit a relatively large number of locationsand interview a few households in each, than to visit fewer locations and interviewmany households in each.
2.7.3.5 Selection of households and individuals within locations
Within each of the locations visited by the assessment team, households,individuals and groups are selected for interview. The aim is to achieve as validand accurate an impression of the location’s entire population as possible.
If the location is reasonably homogeneous and there is sufficient time, householdsand individuals can be selected through random sampling (see Section 2.7.4.5).
When time is limited, the groups expected to be most severely affected areprioritized. Within these vulnerable groups, households may be selected purposively,such as the most severely affected within the group. This gives the sample a high bias
101Part III / chapter 2: Planning an EFSA
PARTIII
_____________33. However, when the means allow, random sampling is still preferable.34. Guidelines for Emergency Assessment, International Federation of Red Cross and Red CrescentSocieties (IFRC), 2005.

towards the most affected. In this case no generalizations of findings to the generalpopulation can be made, only statements about the worst-affected households.
Alternatively, within the vulnerable groups, representative households can beselected by the analyst or, preferably, at random.For some social stratifications it is often difficult to develop a proper samplingframe, so purposive sampling is used. These groups include:• displaced people living in a host community;• the community hosting the displaced people;• the landless and the poor;• the livelihood groups that are expected to be most severely affected by the crisis,such as pastoralists during droughts or traders during market collapse;
• members of an ethnic group that is targeted during conflict.
It is advisable also to consider groups that are less severely affected. This gives abasis for comparison, and helps to confirm or reject initial assumptions aboutvulnerability.
2.7.3.6 Example of purposive sampling
Example 3.4 describes purposive sampling from an EFSA carried out in Rwanda in2006.
102 Emergency Food Security Assessment Handbook / second edition
In April 2006, WFP and partners undertook an EFSA in Rwanda to assess the impact ofdrought on household food security. The EFSA was triggered by indications of severehardship after two years of poor rainfall. Sampling was based on Rwanda’s administrativesystem: the country is divided into districts, which are subdivided into sectors, and theninto cells of 20 to 40 households each.
Sampling approachFive of the most drought-affected districts were identified from a review of field missionreports by various agencies and government services, and discussion with the countryoffice.
In each of the five districts, a purposive sample of eight cells was drawn. The cells wereidentified as follows:• The most affected sectors were selected by the district executive secretaries.• The head of each of the most affected sectors selected the most affected cells.
Within each selected cell, interviews were held with four to eight of the worst-offhouseholds. Key informant interviews, focus group discussions and market and healthcentre surveys were undertaken, to complement and triangulate the information.
This sampling approach did not provide an overview of the situation, as it focused on themost severely affected areas and households. However, given the time and informationlimitations, this type of sampling enabled conclusions to be drawn about the severity ofthe situation and how the worst-affected people can or cannot cope with it.
Example 3.4: Purposive sampling in the 2006 Rwanda EFSA

When purposive sampling is used, the assessment report should explain why ithas been used and describe the process for selecting which people to interview.
2.7.3.7 Snowball sampling
Snowball sampling can be used if neither random nor purposive sampling isfeasible. This may be the case when the population of interest cannot easily befound, such as refugees scattered across a large city, or when people do not wishto be identified, such as illegal immigrants or people affected by HIV/AIDS who donot want to be stigmatized.
Snowball sampling is undertaken as follows:• Key informants are identified on the basis of their knowledge of the emergencyand the people affected by it.
• The key informants are interviewed, and act as entry points by recommendingother people who can provide useful information.
• The next group of informants is interviewed and the process continues.
Snowball sampling incurs a high risk of bias. Each informant is likely to refer theassessment team to people that he/she knows. These people may all belong to aparticular sub-group within a larger population. For example, if the assessmentteam is looking for refugees, they may end up interviewing people from only aparticular region, or belonging to certain political parties or ethnic groups.
When snowball sampling is used, the assessment report should explain why it hasbeen used and describe the process for selecting which people to interview.
2.7.3.8 Convenience sampling
Convenience sampling is the least effective of the sampling approaches, but if timeand access are very short, such as during initial assessments, it may be the onlyoption. In convenience sampling, informants are chosen because they areaccessible. For example, if an initial assessment involves only one short visit to theaffected area, with little or no preparation, the EFSA team should talk to everyonewho is available; teammembers should apply judgement, such as by visiting health
103Part III / chapter 2: Planning an EFSA
PARTIII
A sample of the “worst of the worst” is severely biased towards the most food-insecure and is not at all representative of the five districts as a whole; no estimatesof numbers of affected households can be made.35
_____________35. As an alternative, local key informants can be asked to stratify the districts according to whether theyare “most affected”, “moderately affected” or “least affected”. Within each of these strata, further substratacan be defined. Households can be randomly selected within each substratum. If the population of eachsubstratum is known, the appropriate sample weights can be applied to make unbiased estimates of theprevalence of food-insecure households.

clinics and other places where they can expect to find good quality information.
With convenience sampling, the risk of bias is very high. Generalizations to otherareas and population groups must therefore be made with caution.
2.7.4 Random sampling36
This section presentsmethods for in-depth assessments using random sampling.
2.7.4.1 Principles of random sampling
Random sampling is based on the principle that each unit in a population hasexactly the same chance37 of being selected as every other unit. In an EFSA, a unitis usually a household when analysing food security, or an individual whencollecting anthropometric measurements.
In random sampling approaches, all selections within a stratum are maderandomly, including the selection of:• locations within the geographical strata;• households and individuals within the chosen locations.
Random sampling is the preferred method because, theoretically, it is the only onethat allows findings to be generalized to the entire sampling frame. It is used whenthere is need for statistically representative data that can be extrapolated to thewider population with a known degree of confidence, such as for estimating theprevalence of malnutrition or food insecurity.
Random sampling requires the following:• There must be sufficient information about the population, location and numbersto construct the sampling frame from which a random sample is to be drawn, andit must be possible to find each of the households selected for interview.Population lists or maps showing the location of each residence must exist, or itmust be possible to construct them.
• It must be possible to assess every area, household and individual within thesampling frame. There can be no physical or security constraints to access.
• There must be sufficient time and resources to visit the selected areas andinterview each selected household or individual, including travel time.
104 Emergency Food Security Assessment Handbook / second edition
_____________36. For more detailed guidance, see: Guidelines for Comprehensive Food Security and VulnerabilityAnalysis (CFSVA), WFP Food Security Analysis Service, January 2009, and Thematic Guidelines onSampling, WFP Vulnerability Analysis and Mapping Branch, December 2004.37. The probability of being selected does not have to be equal for each unit, see: Guidelines forComprehensive Food Security and Vulnerability Analysis (CFSVA), WFP Food Security Analysis Service,January 2009. It is enough that the probability is known and not zero, so that sample weights can beconstructed to calculate unbiased population estimates.

2.7.4.2 Geographical stratification
Normally an EFSA targets a specific area of a country, and a stratified two-stagesampling approach is often used within that part of the country.
Depending on the expected homogeneity of the survey area, geographical zonescan be selected in either of two ways:• If the characteristics of the population and the impact of the emergency areexpected to vary across the sampling frame, geographical zones are definedaccording to such characteristics as the extent to which each is expected to beaffected by the crisis. The survey area is stratified, meaning that zones aregrouped according to characteristics that are important for the food securitysituation. Random sampling of locations according to population size is thencarried out within each stratum. Results are representative of each stratum,results from the various strata can be compared, and the number of householdsto be targeted can be calculated for each zone separately. Such stratification isdesigned to ensure that each stratum is as homogenous as possible and thatthere are important differences among strata. A typical stratification could be theagro-ecological or livelihood zones in a country, or the areas that have beenaffected by a flood vs. those that have not. These approaches are illustrated inthe worked example in Section 2.7.4.6.
• If no particular food security pattern is expected across the survey area, the areacan be subdivided using the existing administrative divisions. If there are toomany of these, they can be regrouped. For example, in a survey covering eightprovinces of a country, three geographical strata could be maintained:stratum A - covering the three western provinces; stratum B - the three centralprovinces; and stratum C - the two eastern provinces.
Within a stratum, households and individuals can be chosen through eithertwo-stage sampling or simple random (direct) sampling.
105Part III / chapter 2: Planning an EFSA
PARTIII
Two-stage stratified sampling (see Section 2.7.3)
This is the most common approach used in an EFSA. The sample is defined in stages:1. Stratification: The geographical zones to be assessed are determined. In an EFSAthese are based on the expected extent of the emergency’s impact, and include bothdirectly affected and indirectly affected areas. For instance, for an assessment after thepassage of cyclone Nargis in Myanmar, the delta region was divided into a “severelyaffected”, a “moderately affected” and a “mildly affected” zone. Geographical zonesmay also correspond to those chosen in previous assessments, for the purpose ofcomparison.
2. First stage: The locations to be visited within the chosen geographical zones areselected. These might be villages, groups of villages, towns, neighbourhoods withintowns, livelihood zones, camps or any other unit appropriate to the local context and
Box 3.2: Two-stage and simple random sampling
(cont…)

2.7.4.3 Determining the sample size
The sample size is the number of surveyed units – generally households orindividuals – required to give the desired level of precision.
The sample size is calculated on the basis of the main characteristic of interest forthe assessment. For example, to estimate acute malnutrition among children under5 years of age, the sample size is calculated on the basis of the expectedprevalence of wasting. The number of households to be visited is derived40 from theaverage number of children under 5 per household.
This approach is problematic for food security assessments however, because nosingle food security indicator can be used to estimate the size of the sample. Ifbaseline studies exist,41 the proportion of food-insecure households in the baselinestudy can be adjusted according to the expected impact of the crisis.
106 Emergency Food Security Assessment Handbook / second edition
type of crisis. The locations are selected with probability proportional to size (PPS).383. Second stage: Within each location, groups, households or individuals are randomlychosen for interview, based on an existing or specially prepared list.
Two-stage sampling saves resources and time, as only selected locations are visited.However, the sample size must be increased to compensate for the relativehomogeneity of households within locations.39
The number of locations to visit and the number of households or individuals to interviewwithin each location depend on the total sample size required. This is estimateddifferently for random and purposive sampling (see Sections 2.7.3 and 2.7.4). In allcases, it is better to select a large number of locations and interview relatively fewhouseholds/individuals at each location than to select a small number of locationsand interview many households/individuals at each.
Simple random samplingHouseholds and individuals are selected from lists covering the entire area under study– i.e. all the units within the sampling frame. This avoids the need to select locations fromwhich to draw the sample. This approach depends on having up-to-date population listsand accurate data on the locations of households and individuals. It also depends onaccess; if the population is widely dispersed, it may not be possible to reach all unitswithin the time available for the assessment.
Because of these restraints, EFSAs rarely use simple random sampling, unless thesampling frame is small and geographically concentrated, such as in an internallydisplaced person (IDP) camp.
_____________38. Guidelines for Comprehensive Food Security and Vulnerability Analysis (CFSVA), WFP Food SecurityAnalysis Service, January 2009.39. ibid.40. Formore details see: EmergencyNutrition Assessment: Guidelines for FieldWorkers, Save theChildren, 2004.41. For example, the CFSVAs carried out by WFP.
(…cont)
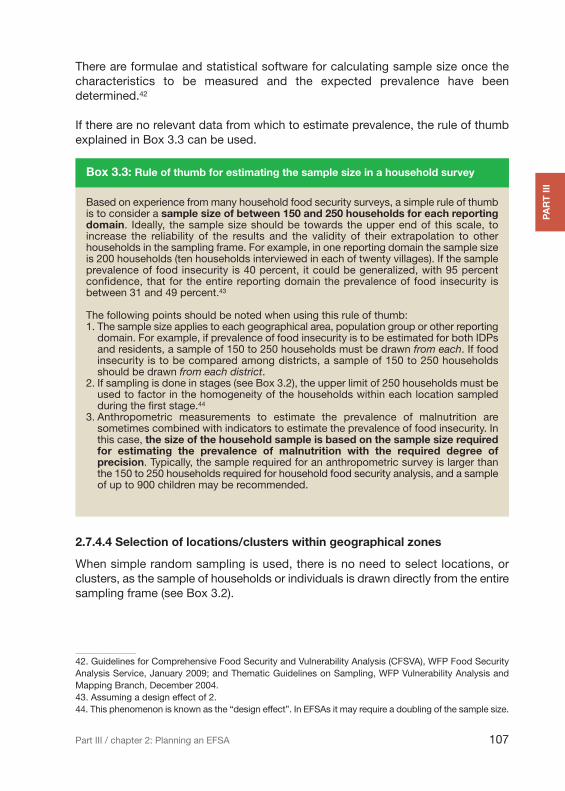
There are formulae and statistical software for calculating sample size once thecharacteristics to be measured and the expected prevalence have beendetermined.42
If there are no relevant data from which to estimate prevalence, the rule of thumbexplained in Box 3.3 can be used.
107Part III / chapter 2: Planning an EFSA
PARTIII
_____________42. Guidelines for Comprehensive Food Security and Vulnerability Analysis (CFSVA), WFP Food SecurityAnalysis Service, January 2009; and Thematic Guidelines on Sampling, WFP Vulnerability Analysis andMapping Branch, December 2004.43. Assuming a design effect of 2.44. This phenomenon is known as the “design effect”. In EFSAs it may require a doubling of the sample size.
Based on experience from many household food security surveys, a simple rule of thumbis to consider a sample size of between 150 and 250 households for each reportingdomain. Ideally, the sample size should be towards the upper end of this scale, toincrease the reliability of the results and the validity of their extrapolation to otherhouseholds in the sampling frame. For example, in one reporting domain the sample sizeis 200 households (ten households interviewed in each of twenty villages). If the sampleprevalence of food insecurity is 40 percent, it could be generalized, with 95 percentconfidence, that for the entire reporting domain the prevalence of food insecurity isbetween 31 and 49 percent.43
The following points should be noted when using this rule of thumb:1. The sample size applies to each geographical area, population group or other reportingdomain. For example, if prevalence of food insecurity is to be estimated for both IDPsand residents, a sample of 150 to 250 households must be drawn from each. If foodinsecurity is to be compared among districts, a sample of 150 to 250 householdsshould be drawn from each district.
2. If sampling is done in stages (see Box 3.2), the upper limit of 250 households must beused to factor in the homogeneity of the households within each location sampledduring the first stage.44
3. Anthropometric measurements to estimate the prevalence of malnutrition aresometimes combined with indicators to estimate the prevalence of food insecurity. Inthis case, the size of the household sample is based on the sample size requiredfor estimating the prevalence of malnutrition with the required degree ofprecision. Typically, the sample required for an anthropometric survey is larger thanthe 150 to 250 households required for household food security analysis, and a sampleof up to 900 children may be recommended.
Box 3.3: Rule of thumb for estimating the sample size in a household survey
2.7.4.4 Selection of locations/clusters within geographical zones
When simple random sampling is used, there is no need to select locations, orclusters, as the sample of households or individuals is drawn directly from the entiresampling frame (see Box 3.2).

The first step is to determine the number of clusters to visit within each zone orstratum. This depends on:• the sample size: the total number of households or individuals to interview(see Section 2.7.3.5);
• practical considerations, such as time, access, logistics and human resourceconstraints.
As explained in Box 3.2, it is better to select a large number of clusters andinterview a relatively small number of households/individuals in each than to selectfewer clusters and hold more interviews in each. The rule of thumb explained inBox 3.4 can be applied.
108 Emergency Food Security Assessment Handbook / second edition
Based on experience of assessing household food security, a total of ten householdsper cluster is usually sufficient. The main result of adding households in each cluster isan increase in the design effect. The sample size can therefore be decided according tothe following, based on the level of precision desired:• if the sample size is 150 households, at least 15 clusters should be selected, and atleast 10 households within each cluster;
• if the sample size is 250 households, at least 25 clusters should be selected, and atleast 10 households within each cluster.
Box 3.4: Rule of thumb for determining the number of clusters in a random sample
Clusters, often villages, within each zone are selected randomly with probabilityaccording to their size (see Section 2.7.4.6). The communities or villages to visit aredetermined according to the selected clusters. There may be more or less thanone cluster in a village.
In nutrition surveys of children under 5, it is common to use a 30 x 30 sample:30 locations are selected, and anthropometric measurements of 30 children aretaken in each location. The total sample size is therefore 900 children. It is advisableto fine-tune this sample size according to the expected prevalence of malnutrition.45
2.7.4.5 Selection of households or individuals within locations
In each location/cluster, simple random sampling of households or individuals iscarried out (see Box 3.2) in either of two ways:• Simple random sampling is preferred and can be used when accuratepopulation lists exist or can be created and when each of the listed householdscan be located and reached easily within the time available. All the householdsare listed. Households are then selected at random, using a random numbertable or by picking names out of a hat. This approach is feasible in small
_____________45. The 30 x 30 sample is valid for an expected prevalence of 50 percent and a desired confidence(at 95 percent) interval of +/- 5 percent, with a non-response rate of about 10 percent. For more guidance,see: A Manual: Measuring and Interpreting Malnutrition and Mortality, CDC and WFP, 2005.

communities and camps with known boundaries.• Systematic sampling is used when population lists do not exist, but each housecan be identified and reached within the time available. Households can be chosenby walking through the location and visiting houses at pre-selected intervals, suchas every tenth house, or by spinning a pen and counting off the houses in thedirection indicated. Both of these approaches are illustrated in Example 3.5.
109Part III / chapter 2: Planning an EFSA
PARTIII
Option 1: Houses are laid out in streets and each can be identified from either a map orobservation.Example: A sample of 15 households is to be selected from a total of 186 houses in thelocation:• Calculate the sampling interval by dividing the total number of houses by the samplesize. In this case: 186/15 = 12.4 houses.
• Round the sampling interval up/down. In this case: down to 12 houses.• Agree a starting point for the assessment, usually one end of a particular street.• Choose a number between one and the sampling interval randomly. In this case:between one and 12, say five.
• Count off five houses from the first identified. Interview this household.• Count off the next 12 houses and undertake the second interview in the twelfth.• Repeat the process at intervals of 12 houses until the entire location has been covered,and the sample of 15 households has been completed.
• If there are fewer than 12 houses in the street, continue the count in the next street.Clear instructions about the procedure should be given; for example, “at the end of thestreet, turn right into the next street”.
The process is illustrated in the following diagram.
Example 3.5: Selection of households or individuals within locations
(cont…)

110 Emergency Food Security Assessment Handbook / second edition
Option 2: Houses are not laid out in streets, but each can be identified by observationon the ground.46Example: A sample of three households is to be selected:• Stand in the centre of the location.• Spin a bottle on the ground or throw a pen in the air and watch where it lands.• Walk in the direction indicated by the end of the bottle or pen as far as the edge of thelocation, counting the houses passed. In this case, there are 15 houses.
• Calculate the sampling by dividing the number of houses by the sample size. In thiscase: 15/3 = 5 houses.
• Choose a number between one and the sampling interval randomly. In this case,between one and five. This is the first house to be visited.
• After this house, walk in the same direction and count another five houses. The fifth isthe second household to be visited. Carry out the same procedure to identify the thirdhousehold in the sample.
The process is illustrated in the following diagram.
_____________46. Adapted from Guidelines for Emergency Assessment, IFRC, 2005.
Household 1
Household 2
Household 3
1
2
3
4
6
10
13
15
12
5
7
8
9
11
14
(…cont)
2.7.4.6 Example of random sampling
An EFSA is being carried out in a conflict-affected area. Some people have beendisplaced to camps, while others remain in their homes. Two of the objectives ofthe EFSA are to determine the rate of under-5 malnutrition and to determine thelevels of food insecurity among both displaced and resident populations.
In this case, the affected area is the basis for the sampling frame and it is large,with villages and IDP camps widely dispersed. Although each of these locationscould be reached, there is insufficient time to do so. The dispersion means thatsimple random sampling of the whole population cannot be carried out. Instead, atwo-stage sampling approach is chosen (see Box 3.2).
The following steps are undertaken:
1. The population is divided into two strata: resident population and IDPs.
2. For each stratum, a sample of localities is needed. For residents, localitiesare defined as villages; for IDPs they are camps.
3. Because the rates of malnutrition are unknown and therefore cannot be usedto calculate the sample size more accurately, it is decided that a 30 x 30 clustersample will be drawn for each stratum, to obtain a sufficient number ofchildren for statistical analysis of the anthropometric data. Thus, 30 clustersare identified (stage 1), and 30 units – households or individuals –are selected in each cluster (stage 2). In each locality, 30 households will beinterviewed to estimate the level of household food insecurity, and 30 childrenunder 5 will be examined to determine their nutrition status.
4. The samples to be drawn are therefore:• resident population: 900 households and 900 children under 5;• IDP population: 900 households and 900 children under 5.Children under 5 are selected from the households where food securityinterviews take place. The sample size for each stratum is therefore900 households.
5. A table similar to Table 3.4 is constructed and its columns filled in asexplained in the following steps. A separate table is constructed for eachstratum: residents and IDPs.
6. To identify where the clusters will be located, the names of the localities –the villages and camps – are entered in the second column. To ensure a trulyrandom procedure, each location is assigned a random number and rankedin the table according to that number.
111Part III / chapter 2: Planning an EFSA
PARTIII

7. The best available population data for each of these localities are entered inthe third column. For the villages, this information may come from apopulation census or district-level records. Information on camps is obtainedfrom the NGOs, United Nations agencies and/or government organizationsthat manage them. Camp records should indicate the villages from whichIDPs come; this information may be used to modify the data on villagepopulations.
8. The best available data on the number of children under 5 in the populationare used. In this example, secondary data sources indicate thatapproximately 20 percent of the total population is under 5. These data areentered in the fourth column of the table.
112 Emergency Food Security Assessment Handbook / second edition
Randomizedorder
Geographicalunit
Estimatedtotalpopulation
Estimatedchildren6-59 months
Cumulativepopulation6-59 months
Attributednumbers
Numberof clusters
1 Locality F 2500 500 500 1-500 1
2 Locality N 1000 200 700 501-700 1
3 Locality D 800 160 860 701-860 0
4 Locality A 3250 650 1510 861-1510 2
etc. etc. … … … 1511-… …
Total 50000 10000 10000
Table 3.4: Table for identifying clusters
9. The sampling interval is calculated by dividing the population of childrenunder 5 by the number of clusters. In this case, the population of under 5children is 10,000 and the number of clusters is 30. The sampling interval istherefore 10,000/30 = 333.
10. The location of the first cluster is determined by randomly selecting anumber within the sampling interval of one to 333. Say that the randomlychosen number is 256, the first cluster is in locality 1 to which the numberrange 1 to 500 has been attributed.
11. The remaining clusters are identified by adding the sampling intervalsequentially to the starting number until 30 clusters have been selected. Inthis example:• the first cluster is at 256, in locality 1• the second cluster is at 256 + 333 = 589, in locality 2• the third cluster is at 589 + 333 = 922, in locality 4• the fourth cluster is at 922 + 333 = 1,255, in locality 4

The process continues until the required number of clusters have beenchosen. Note that the larger the population of the locality, the more clustersit contains.Therefore, locality 3, with a small population, has no cluster, while locality 4,with a large population, has two clusters. Hence the approach is calledprobability proportional to size (PPS).
12. Within each of the selected localities, households are identified by one of themethods explained in Example 3.5.
2.8 Human resources
Human resource requirements for an EFSA depend on the assessmentmethodology that has been chosen:• For an in-depth large-scale household survey, enumerators, field managers, dataanalysts, vehicles, drivers, translators, etc. will be needed.
• For an initial or rapid assessment based on purposive sampling and semi-structuredinterviews, fewer staff will be needed, but the people carrying out the interviewswill have to be very well trained and experienced.
Human resources should be drawn from the country office and partners in thecountry. If capacity is lacking at the national level, additional resources may berequested from the regional bureau and Headquarters, or consultants may beemployed.
Human resource needs also depend on the assessment type. The following staffmay be required:• Assessment managers and team leaders: See following paragraph onmanagement structure.
• Enumerators for questionnaire-based surveys: These individuals need to bewell-educated, resourceful and prepared to travel for the assessment period.They do not need in-depth knowledge of food security, nutrition or assessment,but should have at least a basic understanding of these issues and preferablysome experience of field-based research.
• Interviewers for semi-structured interviews and focus group discussions: Thesepeople require a good understanding of food security and nutrition, and must beexperienced in interview techniques.
• One translator should be available for each member of the field team who doesnot speak the local language. Ideally, translators should be hired at the sametime as the rest of the team, and should go through the same pre-assessmenttraining. Translators are sometimes hired in the field, in which case time shouldbe set aside to brief them on the assessment objectives and data collectionmethods.
113Part III / chapter 2: Planning an EFSA
PARTIII