New systematic sampling
15
J~rr%al af Statis tictil i)!trnein~ and lkferenc~ 1 (1977) 163-l 77, hlr%rth-Hslbnd Publishing Cumpany Hewived 16 March 1976; revised manuscript iz<*eived 15 November 1976 Recommended by H.O. Hartley, MN. Murthy In this 1~apm B new systematic sampling procedure has heel; suygcsted which provides the unbiased estimator of sampling variance, besides maintaining simplicity, On comparing the cffkiency of the sqggested procedure with USUB I systematic tsampling and simple random sampling, it htiis been observed :hat in situations where Ural systematic sampling performs better than simple random sampling, the suggested procedure also leads to &milar results, and for some si!untions it may provide better resrt’lts than even usual systematic sampling. 1. Introduction Systematic sampling has got the nice featvie of selecting the whole sample with just one random start. Apart from its simplici;y, which is of considerable importance, this procedure in many situations protides estimators more enicient than simple random sampling. But it su@ers from a serious defect, namely, that it is not possible to obtain an unbiased estimator of sampling va.;riatlce on the basis of a single sample. One polssiblc way of getting an unbiased variance e=stimator is through the use of interpenetrating systematic sampling. But it results in 18~~ 1: ptGsion and moreover, the sitnplicity of systematit l r. sampling is lost. Murt hy (X967) indicated that in the extreme but noi practical situation when n = (N + 1 )/I& it is possibk to estimate unbiasedly the sampling variance using circular systematic sampling. Padam Singh (1969) for the first time suggested a systematic selection procedure which provides unbiased sampling variance also. Further, Padam Singh (1975) considered the ge,ni-i-al question of unbiaxd variance estimation in systematic selection procedures, and provided a solution to Ihe problem. In this paper, a new systematic sampling procedure has been suggested, which Aile maintaining the simplicity of selection enables one to obtain an unbiased variance estimator too, It is also proposed to compare the efficiency of the suggested p~c~cedurc with usual systematic sampling and simple random sampling for various fypcs of populations. s asa ulatkm ~~~§~sts af Iv cjisthcl a is desired to be drawn from it. 163
-
Upload
independent -
Category
Documents
-
view
0 -
download
0
Transcript of New systematic sampling

J~rr%al af Statis tictil i)!trnein~ and lkferenc~ 1 (1977) 163-l 77, hlr%rth-Hslbnd Publishing Cumpany
Hewived 16 March 1976; revised manuscript iz<*eived 15 November 1976 Recommended by H.O. Hartley, MN. Murthy
In this 1~apm B new systematic sampling procedure has heel; suygcsted which provides the unbiased estimator of sampling variance, besides maintaining simplicity, On comparing the cffkiency of the sqggested procedure with USUB I systematic tsampling and simple random sampling, it htiis been observed :hat in situations where Ural systematic sampling performs better than simple random sampling, the suggested procedure also leads to &milar results, and for some si!untions it may provide better resrt’lts than even usual systematic sampling.
1. Introduction
Systematic sampling has got the nice featvie of selecting the whole sample with just one random start. Apart from its simplici;y, which is of considerable importance, this procedure in many situations protides estimators more enicient than simple random sampling. But it su@ers from a serious defect, namely, that it is not possible to obtain an unbiased estimator of sampling va.;riatlce on the basis of a single sample. One polssiblc way of getting an unbiased variance e=stimator is through the use of interpenetrating systematic sampling. But it results in 18~~ 1: pt Gsion and moreover, the sitnplicity of systematit l r. sampling is lost. Murt hy (X967) indicated that in the extreme but noi practical situation when n = (N + 1 )/I& it is possibk to estimate unbiasedly the sampling variance using circular systematic sampling. Padam Singh (1969) for the first time suggested a systematic selection procedure which provides unbiased sampling variance also. Further, Padam Singh (1975) considered the ge,ni-i-al question of unbiaxd variance estimation in systematic selection procedures, and provided a solution to Ihe problem.
In this paper, a new systematic sampling procedure has been suggested, which Aile maintaining the simplicity of selection enables one to obtain an unbiased variance estimator too, It is also proposed to compare the efficiency of the suggested p~c~cedurc with usual systematic sampling and simple random sampling for various fypcs of populations.
s asa
ulatkm ~~~§~sts af Iv cjisthcl a
is desired to be drawn from it.
163

164 D. Sirrgh, P. Singh
positive integers. The selection procedure tinder refevence consists of the following: (a) Select a random number r from 1 to N. (b) Starting with IP selkct u continuous units and thereafter remaining n - u( = v)
units with interval ci. Clearly the sample space corresponding to the selection procedure described above
contains N possible samples, and the sample point corresponding to the random uF;mber I- is given by
s, = ($, s:‘)
where $ consists of t ‘he anit indices r + 111 (p~lr = 0, 1, c . ., u - 1) and $’ consists of the unit indices r + u - I+ 11p’d, (PM’ = 1,2,. . ., u).
Here unit index N + r stands for unit index Y. The probability of sekctinp each sample is f/N, and thus the probability measure
associated with the selectkn procedure is given by
p= (P(sr)> : 1
F(&&=N’ p’:=I, 2,...,N
There are two parameters u and d in the above selection procedure, which should be chosen in such a way that the following basic requirement. of a good sampling design arc fulfi!led :
(i) Every sample must contain distinct units only. (ii) The inclusion probability for every pIair of units should be non-zero to ensure
unbiased variance estimation. Theorems 1 and 2 given below help in determining 21’ and d sa:isfying the
requirements (i) and (ii) respectively.
Tibeorem 1. A suficient condition for every sample to hwve ali distinct units in it under the suggested sampling procedure is
.
Proof. Under the suggested sampling procedure, the sample corresponding to the random start r consists of the units with indices
r, r + 1, . . ., r + u -- 11,
r+tc-- l+d, r-t+--l++d,...,r+u-l+vd.
Since the selection is circular, a sample which contains W,. as the first unit and at most li’,_ 1 as the last unit will have all distinct units in it. Thiq implies that the required condition for every sample to have &stkct un.its is that the index of the last unit in the sa be less tIlar1 the index of the first unit in the sample, or

Systematic sampling 165
since in the selection with random start r, the index r - 1 will come as index N + F - 1 only.
The above inequality implies
u+vdgv.
Theorem 2. Under the* suggested sampling procedure, the inclusion probability for. every pair of units is non zero f
ProoP. Table A represents the c!lfferences in the indices of the units selected with random start r in a sample.
Table A __I_---~----_-_
Unitindices r r+l r+2 .,. r+u-1 r-l-u-l+& r+u-1+2d . . . r+u-l+vd
r 01 2 . . . u- 1 r-I-1 0 1 *.. u-2
. . . . r-I-u-2
---
r+u-1 r+u-l+d
.
r+zLl+ud I
d+u-1 2d+u-1 . . . vd + u - 1 d+u-2 2di-u-2 . . . vd+u-2
d+l 2d+1 . . . z,d t 1
2d II
. . .
. . .
UC
(V- 1)d
d - --.. - --
The possible differences are
0 if 2d . . . Vd
1 d+l 2d+l . . . vd-i- 1 . . . . . , . .
II- 1 d+;-1 2d+k-1 . . . l Zlci t 24 - 1
Under the given condition dzz <’ uC it is easy to see that all possible diflerences upto ud + u - 1 are covered in Table A above. Also it is known that ibr a population of size IV, the
lar distance between never exceed itions ~+vd~$N+ 9, a Fences are cover
Now a~~ aXI possible differences t least once. the inclusi -zero.

Combining the results of Theorems 1 and 2, we observe that the valves of ti and d satisfying both the requirements (i) and (ii) are given by
The suggested procedusc together with t( and k satisfying the above relation will hereafter be known as Nvw Systt~~atic Samphg. The term ‘systematic” baa been used in the nomenclature, since the selection procedure resembles usual systematic sampling, tile resemblance being that the selection of only ane randam start is enough for obtaining the whole sample. The term ‘new’ has been inchtded in the numellclature to distinguish the suggested procedure with the existing one.
where r is any positive integer less than (u - 2). and
Putting the value of 17 and ~1 in terms of u we get
ii + 1111 - U2 --utW--~f6-~~~.
The left-hand side of the attive expression takes the minimum value for
(24
(2.5)
(2*6)
(2.7)
not-1 -td’(2N+4+t”-4t). (2.8)
The right-hand side of the above expression is monotonic increasing with t and WC~CXX, the n~il~i~~u~~ value of n can be obtained by putting t = 0, which i
(2.9)

Sjstemutic sampling 167
0n the other hand, a sample of size as large as (N - 1) can te selected by new systematic sampling, with v = n and v = 0.
Now, (2,9) imposes a restriction o:rcr n, the sample size. The limitation on sample size is not very serious for sampling-from a large population. However 7 sample of required size n not satisfying (2.9) can be selected in two or more phase: lie sampling at each phase heir? by new system&c sampling. Here the term *phase’ is used in the sense that the ultimate sample of required size is selected in stages.
Since pz and N are both integers the expression (2.9) can approximately be written as
n& fiN-. (2.10)
It is easy to see that the number of phases require 2, say p, for selecting a sample of required size n from a population of given size N by new systematic sampkg is given by
PZ log log (+N) - log log (in)
log2 ’ (2.11)
Let ni denote the size of the sample satisfying (2.10) at the i-th phase. The valet: of lli is given by
and
w hkh imply
nl 2 2” - l/z’) .Nl@ .
Thus the approximate number of phases required, say p, to arrive at the sample size n,
is given ‘iy
n > 2’ - 1/2P~llZP = l

As an example, the number of phases required to select a sample of sir&e 20 from a population of size 20 000 is approximately 2.
2.2. Cukulation’clrf inchsion probabilities and astimatkm pacedwe
In new systematic ssXmpling the Horvitz--Thompson (1952) estimate can be used for the estimation of pi?pulation mean. For the Horvitz-Thompson estimate, the knswledgc: of inclusbn probabilities for individual as well as pair wise units Is needed, which is being discussed in this section.
The coefficient matrix of a sampling scheme is defined as
c I
yuhrro . ,‘“‘V
CNl cN2 I.. CNN
c ri= 1 ifUiES,,
= 0 otherwise.
(2.12)
(2.13)
The coeficien t
the last row as
h’-(~l+ai) A , \
(0 0 ..I 0
matrix of the new systematic sampliq is circuiar with the elements of
r
I d d
+-----7- A
I \ +-\
lOO.,.O 10-O .*. lO...O 1L.l)
(2.14)
From coeficient matrix, the inclusion probabilities foi. individual units and pair wise units are given by
(2.15)
(2.16)

Proof, The i~&sion probabilityjbr o t&t tJI fk9m (2.15; eguds 1iN times the sum of the clemtnts of i-th TOW of the matrix C Since there are to 1% and (N’- n) 0’s in every row of the matrix (“, it is obvious that
1 xp==j;![(nx l)c(N-n)xo]~
= n,UV
Hen&e the proof.
For determining following eases.
for all i = 1,2,. . *, N . (2.18)
the inclusion probabilities for pair wise units we can consrder the
(2.:7)
0) N=vd+d-tu-1 (==N’say) (2, i 9)
(ii) Nwd+d-2+u, (2.:!(l)
(iii) Nad-t-d-1 +tc. (2.21 1
The case (i) is similar to the case N = nk of usual systematic sampling, in the sense that the selection of one more unit results in gtting thr, first unit af the sample repeated. Theorems 4, 5 and 6 respectively help i 1; ;t quick determination of inclusion probabilities in the above three situations. For given u and d, there exists one positive integer IPI satisfying
(w--2)d+1$4~(m- l)d+ 1. (2.22)
Further, in situation (ii) above there will be another positive integer bi satkfying
(k-l)J<&-N’skd.

Proof. Without loss afgenera!ity, Ietj be greater than i. For obtaining the values oft, there arise the following possibilities.
When j -. 1 = td there exist the possibilities (a), (b) and (c) only. In case (b), there are (u - 1 ) units at distance (l, (11 - 2) units at distance 2<1,. . .3 u -t units at distance! td,. . ., and 1 unit at distance (c - 1 )d. Ako if rng t, there will be m--t units at distance tn corresponding to the possibility (a). There is also one unit of s: at a circxlar distance td from one of the units of $ corresponding to the possibility (c). The above three possibilities. and the faz? tr-tat the selection is circular proves the result (i).
Whenj-isra- 1. exciuding the case j- i =td, there arises the possibility (a) only. Also there are (fr - 1 j units at distance i, (tr -- 2) units at distance 2, . ., and 1 unit at distance u - 1, which confirms the proof of result (ii). The proof for the rest.&. (iii) follows from result (ii) directly. becaze of the circular nature of the selection.
In the remaining cases, both the possibilities (c) and (d) are true which proves the result (iv). Thit; completes the proof of the th :orem.
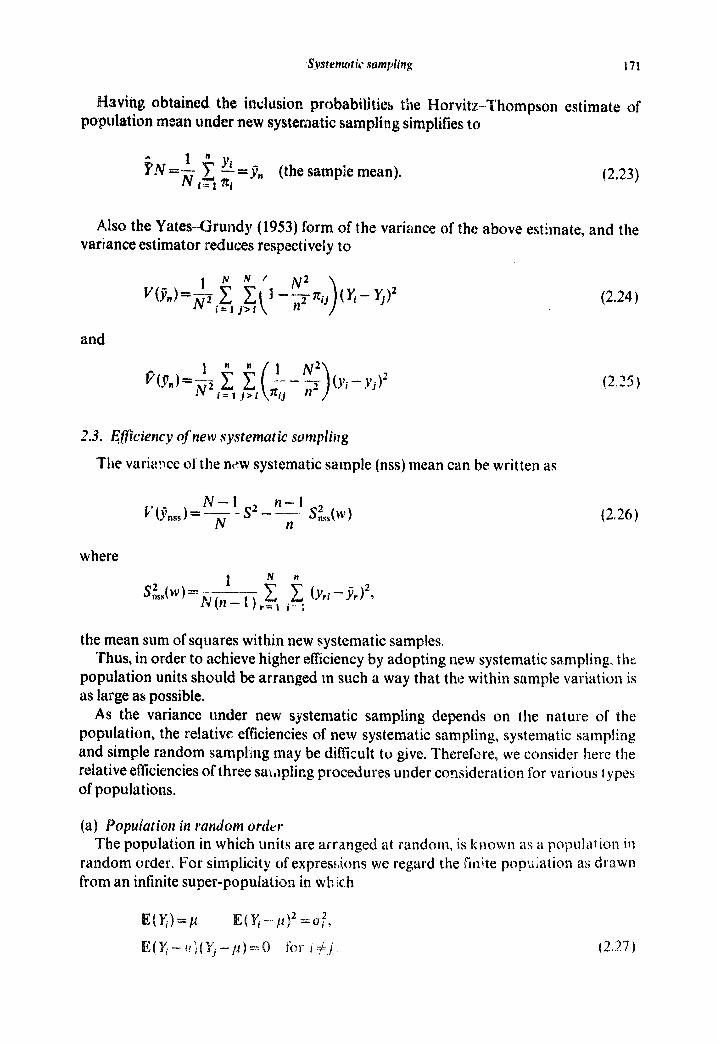
‘Having obtained the inelusion probabilities the Horvit;t--Thompson estimate of population mGan under new systematic sampling simplifies to
k!V =-_ L i yi =j” (the sample mean), i-z 1 ?fi
(2.23)
Also the Yates-Grundy (1953) form of the variance of the above estimate, and the variance estimator reduces respectively to
vi- yj>”
and
2.3. Elflciencv of rrew systematic sampling * . .
The varia!Jce of the n<w systematic sample (nss) mean can be written as
N-l 1 t’(,i’“,,)= --jq- - s* -n$ SQW)
(2.24)
(2.25)
(2.26)
where
the mean sum of squares within new systematic samples. Thus, in order to achieve higher efficiency by adopting n+zw systematic sampling the
population units should be arranged in such a way that the within sample variation is as large as possible,
As the variance under new systematic sampling depends on the nature of the population, the relative efficiencies of new systematic sampling,, systematic sampling and simple random sampling may be difficult to give. Thereftire, we consider here the relative efkiencies of three san,lpling procedures under consideration for various types of populations.
(a) Popdation in random order The population in which units are arranged at random, is known as a population in
random order. For simplicity of cxpreskns we regard the finite popliiation a~ drawn from an infinite super-population in wh ;c;h

The idea of regatdirrtg the finite pcqwlatian as drawn from an iPr finite super popuhtiun was given by C’ochran (1946’1. Ekre E denotes expectation over the super population.
For any single fir&e populh3n tlac variance of new systematic sample mean is given bY
Taking expectation over the super population model, we get
(2.28)
where
‘The variances for systematic sample mean and simple random sample mean are also known to be equal to (2.28), showing that three procedures under consideration are equally e!I’icient for populations in random order.
Populations in which the units with large, medium and small values ful!ow one another according to a regular repetitive pattern, are known as populations with periodic varialtisn. Suppose 8 is a periodic fbction of period 2h, For the variance of the new systemati,c sample mean, we consider the fobwing extreme situation wh-:n d is an C&I multiple of 11, z+ is even and tl = 2d. In this situation, the mean of the u continuous umts and also c!f the remaining 1’ units is equal to the population mean, pN. ‘Thus, the <ample mean equals thr: population mean, showing thereby the variance as zcra,
Also since under new systematic sampling, 1’1 continuous units are selected the procedure should not be generally less efaclcient than a simple random sample of size U.
Also, j:.? case of usual systematic sampling, the variance reduoes to zero when the sampling interval is an odd multiple of half the period, and equals the variance of the
interval is a multiple of the period of the cycle. Thus, for of the variance of ne’d s ,fstematic sampling is smaller as
it of the variance is the

Syxtennrflc sampfing , 173
considered 8s mure enicient than usual systematic Sampling for populations with periodic variation.
The populations in which the variant between elements in any group of con- tiguous elements increases steadily as the size of the group increases, are knolqn as auto-correlated populations, The efficiency of systematic sampling compared to simple random sampling for such a population was considered by Co&ran iI546) with the super-population model
Ww=P, E(I+)=tP for i==1,2,...,N
and
(2.29)
He obtained the variance expression for systematic sample mean and simple random sample mean as
and
(2.30)
(2.31)
Following Cochran (1946), the expected variance of the new systematic sample mean can be seen to be equal to
(2.32’
174 D. Sin& P. Singh
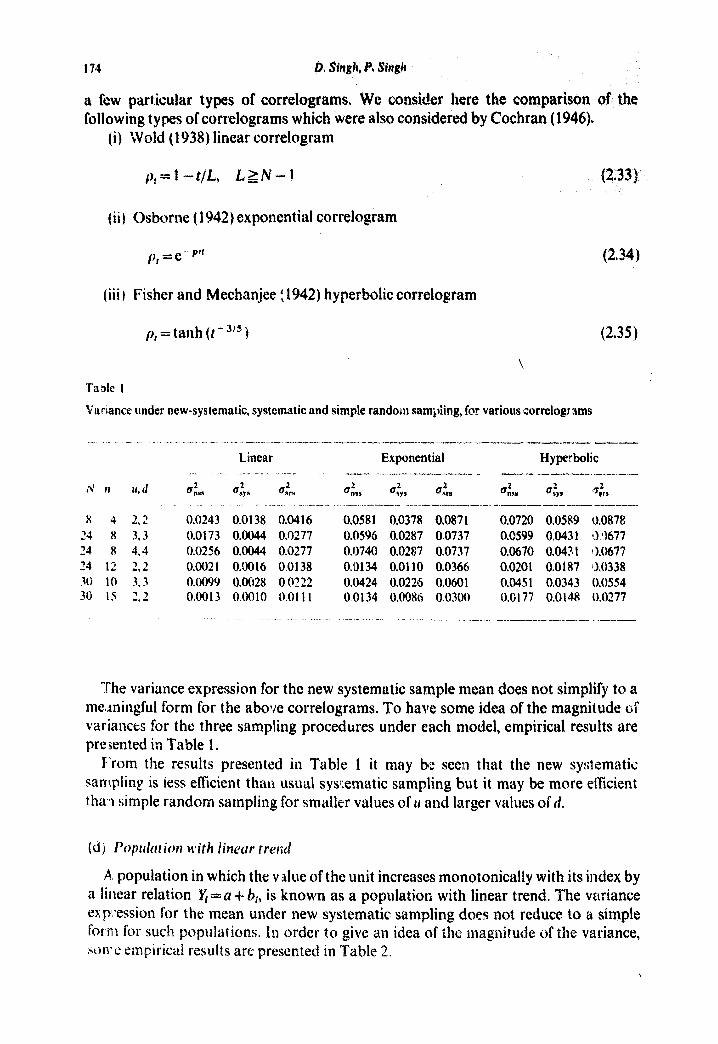
a few particular types of correlograms. We consider here the comparison af the following types of correlograms which were also considered by Cochran (1946).
(i) Weld (1 Y38) linear correlogram
pt=t--rJL, L&g-l
(ii) Osborne (1942) exponential correlagram
(2.33)
pt = $ -- ptr
(iii) Fisher and Mechanjee { 1942) hyperbolic correlagram
pt = tanh (t- 3!s )
(2.34)
(2.35)
\
\;‘uriance under new-systematic, systemstic and simple random sampling for various corrkqysms
- . . .-. _. __-. -___- -_ .____.__ - ._ -I__-_l_“-____--.___- ----- --n-1_
Linear Exponential Hyperbolic _-. ._--_ _ ._-_.-- ____._ __. -- -._._.._ -^___I-_ _ -d ,I -II_ ---_-
1J II 11, d de a,2y. drrs - d,, 4ys t&i dsil Q?ys +rs -_ ---e-e ---
t( 4 2.2 0.0243 0.0138 0.04 16 0.0581 0.0378 0.087 I 0.0720 0.0589 l0.0878 ‘4 T4 8 8 4.4 3.3 0.0173 0.0256 0.0044 0.0044 0.0277 0.0277 0.0596 0.0740 0.0287 0.0287 0.0737 0.0737 0.0670 0.0599 0.0431 0.043 1 10 0.0677 ‘1677
24 12 2.2 0.0021 0.0016 0.0138 0.0 134 0.0 110 0.0366 0.0201 0.0187 0.0338 30 IO 3.3 0.0099 0.0028 00222 0.0424 0.0226 0.0601 0.045 1 0.0343 0.0554 30 1s 2,2 0.0013 0.0010 0.011 I 0 0134 0.0086 0.0300 0.6 177 0.0 148 0.0277
- -. -_-_ _. _- -_ - __ ._.. . ._ _--_---.-- _-__x - -___.-__-- --.- - .I_ __.-
lrhe variance expression for the new systematic sample mean does not simplify Es a melrningful form for the above correlograms. To have some idea of the magnitude ciC variances for the three sampling procedures under each model, empirical results are presented in Table 1_
From the results presented in Ta.bllz 1 it may be seen that the new systematic: sampling is iess efficient thau usual systematic sampling but it may be more ef’ficient t ha ‘I simple random sampling for smaller values of 11 and larger values of n.
A, population in which the v Ale of the unit increases monotonically with its index by a linear relation & =Q + bi, is known as a population with linear trend. The variance ex p*ession for the mean under new systematic sampling does not reduce to a simple fwn~ for such populations. In order to give an idea of the magnitude of tile variance,
irical results arc presented in Table 2.

S}wemarfc samplfng , 175
Table 2
Variances under fpcw systematic, systematic uad simple random sampliqp, for populations with linear trend “-rrursurruur*r--~~~~---~~ 1__1*=.- m_..... _ --Ime-- --.- -
N / n u,d Wld UP”,) WLll J ~i~~~~~.....“omu.., em-.---
8 4 z2 0.4374 O”2500 0.?530 24 8 393 2.6041 0.6666 4.16661 24 8 494 3;8541 O&%6 4.166G 24 12 2.2 la3263 0,25OQ 2.0833 30 10 393 2.3067 0.6666 5*1&6!5 30 15 2,2 0.3121 0.2500 2,583 - -__-__yI -._ -P 1-P---- _I__-.y_---_-
Table 3
Holding sile, and the number of fruit bearing trees, in various populations --_.a _I ---- _--_. --a.-.-_---_...._A
S. no.
1 z 3 4 5 6 7 8 9
10 11 12 13 14 15 16 17 18 19 20 21 22 23 24
Holding sir!: in acres population A
----l-_- ___)-
12 10 2 2
30 30 20 4 5
38 5 7
1; 2
17 6 6
i4 6 7 6 2 6
14
No. of !‘ruit bearing wees population B
.ICI-_-.___.._l__-_.-__.-
9085 4889 1002 49’9
4341 3299 1762 508
1905 5916 1011 3568
s 607 1515 3568 3619 269
%iiY
2480 i624 1640 2486 731
2480 --. _ .^ .._ - .” ._.. __ . _ _ __ . . _._. _ _ __. _ ._--_ _- _- - .___ .__ __.... _l_---_---. -- ___ -- -
Evidently, the results are similar to those for auto-coTrelated popJations. NWV systemak sampling is less effkient than systematic sampling, kut more effkien~; than
* simple random sampling for smaller values of tl and largtx valuc:s of d.
(e) Nor ural populations
In each of’ the populatbxc3 in Ta 16 3 the ~~~u~at,io~~ sizs is 24 corresponds to operational bldings whose sizes are given in acres, and population B to
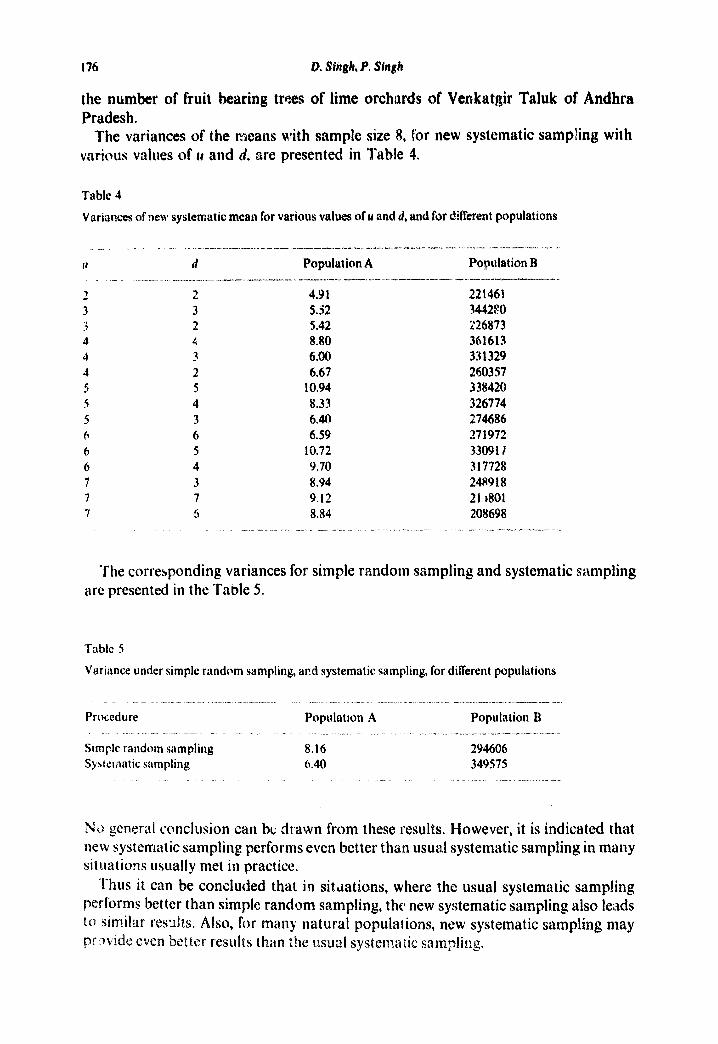
the number of fruit bearing tram of lime orchards of Venkatgir Taluk of Andhra Pradesh.
The variances of the means with sample size 8, for new systematic sampi’ing with various values of ti and d, are presented in Table 4.
Table 4
Varianw of new systematic mean for various values of u and 4, and for dlffercnt populations
P-w ^_a.._. -I^-........--L..a.“_.-L”_-._ .-_.l._ -,.-“-d- ___“.._._
u d Population A Population B __ - .--- -. _---
2 3 3 4 4 4 5 5 5 fi 6 6 7 7
__.-_-.. --.--..l.~__--_“..- --u_I__” .___. _ -I-_.II - -
2 4.91 3 5.52 2 5.42 4 8.80 3 6.00 2 6.67 5 10.94 4 8.33 3 6*40
6 6.59
5 10.72 4 9.70
3 8.94 7 9.12 6 8.84
. ..\._ -a-- ___1_ -*_
22 1461 3414280 226873 361613 33 1329 260357 338420 326774 2?4686 271972 33091 i 317728 248918 21,801 208698
‘The corresponding variances for simple random sampling and systematic sdlmpling are presented in the Table 5.
Table S
Variance under simple random sampling, ar.d systematic sampling, for different populations
- -. - . _. .- ._ _..__ --. ._ ._, .._ _ __. _ _ _. __ _ ._ __ -_____ _____. __.- __ _.-
Procedure Population A Population B ___~_l ____ -._-- - _ - _
Simple random sampling 8.16 294606 Sjswlatic sampling 6.40 349575
._ _. ._ _ _ . _” __ _.-. _._._ ._._
bh gcnerd conclusion can bc drawn from these results. However, it is indicated that new systematic sampling performs even better tha.n usual systematic sampling in many situatiox usually met iu practice.
Thus it can be concluded that in sit,\ations, where the usual systematic sampling performs better than simple: random sampling, the! new systematic sampling also leads to si Isa, for many natur sternatic sampling may
c .I\,

Acknowkdgement
The authors are the paper.
, thank:4 to the referees for their vabdde cornmeats in improving
References
Co&ran, WG. (1946). Relative accuracy of systematic iind stratified random samples for a certa,in class of population. Ann. Math. Stntlst. 17.
Sy*tetnutic sutnpl ‘ng 177
Fistic?, RI& and Mechanjee, W.A. (1922). The correlation of weekly rainfall, Qunrt, 1. Roy. Math. SOC. 48. Hc &, D.G. and Thompson, D.J. (1952). d generalisation of sampling without replacement from a finite
universe. J. Am. Statist Assoc. 64. Madow, WG and Madow, L.H. (1944). On the theory of systematic sampling. Ann. Math. Statist. 15. Murthy, MN. (1967). Sampling Theory und Methods. Stat. Publishing Society, Calcutta. Osborne, J.G. (i942). Sample surveys of systematic and random surveys of cover type areas. J. Am. Statist.
Am.%-. 3:‘. Padam Singh (i969). Contribution to systematic sampling. LJnpublished Diploma Thesis, I.A.R.S., New
Delhi. Padam Singh (1975). A new approach to systematic sampling. Unpublished Ph.D. Thesis, Delhi University. Weld, H. (1938). A study of the stationary time series. Uppsala. Yates, F, and Grundy, P.M. (1953). Selection without replacement from within strata with probability
proportional to size. J. Roy. Statis,‘. Sot. Ser. B-15.