Sampling Methods for Roadside Interviewing
21
31 Sampling Methods for Roadside Interviewing IRWIN MILLER, Graduate Research Assistant, Purdue University; P.E. IRICK, Assistant Professor of Mathematics, Purdue University; H.L. MICHAEL, Research Engmeer, Joint Highway Research Project, Purdue University; R. M. BROWN, In Charge Metropolitan Area Traffic Survey, State Highway Commission of Indiana PARTL SAMPLING THEORY PART I of the paper is concerned with an appraisal of the sampling errors in the estimates of the trip frequencies for the various cells of an origin-destina- tion traffic-survey tabulation. A mathematical exposition is given of the expected errors -vitien the sampling is done at random, by time clusters, and by volume clusters. The paper also discloses the results of an empirical investigation into the sampling errors that actually arose when various sampling methods were applied to the origin-desti- nation tabulations of the Lebanon and Kokomo, Indiana, surveys. These ex- perimental results were in general accord with the theory. It is concluded that on the average, for the large number of estimates in- volved in any one survey, the theory of random sampling will satisfactorily explain the errors 'v^ich arise from the various sampling methods proposed. The results given make it possible to predict the average errors and proba- bility limits for these errors when a particular amoimt and type of sampling has been done. Conversely, one can determine the amount of sampling nec- essary to keep the sampling errors within specified probability limits. PART n. PRACTICAL APPLICATION IN this second part of the paper, the practical application of sampling to actual field conditions is presented. Station arrangement and sampling procedure for obtaining samples of 50 percent and 25 percent as developed during the conduct of an origin-destination survey at Richmond, Indiana, are discussed. Operational procedure for two sampling methods, volume cluster and time cluster, is given for two sample sizes and for locations having various road- way conditions. Sampling on two-lane, three-lane, and four-lane highways carrying traffic volumes ranging from 1,000 to 12,000 vehicles per day is shown to be both practical and economical. The advantages of each of the two sampling methods for various locations are enumerated. It is concluded that the use of systematic sampling in the taking of roadside interviews is not only practical and economical but that it has definite opera- tional advantages. The conclusions indicate that a predetermined sampling procedure will place interviewing on a business-like basis that (1) is recog- nized by the vehicle operator and the community; (2) promotes efficient op- eration of the interviewing stations; and (3) produces statistically sound results. # IN recent years, origin-and-destina- tion studies have been of prime importance in the planning, design, and operation of highway facilities. The data from such surveys provide a basis for determining the demand, location, type, and magni- tude of new facilities, as well as important facts concerning their operation. The methods of obtaining the desired data have necessarily been of recent de- velopment. Data collection within the survey area has been by means of home interviews, postcards, observations of license plates, route interviews, or com- binations of two or more of these. All have been used with varying degrees of
-
Upload
khangminh22 -
Category
Documents
-
view
0 -
download
0
Transcript of Sampling Methods for Roadside Interviewing

31
Sampling Methods for Roadside Interviewing IRWIN MILLER, Graduate Research Assistant, Purdue University; P.E. IRICK, Assistant Professor of Mathematics, Purdue University; H.L. MICHAEL, Research Engmeer, Joint Highway Research Project, Purdue University; R. M. BROWN, In Charge Metropolitan Area Traffic Survey,
State Highway Commission of Indiana
PARTL SAMPLING THEORY
PART I of the paper is concerned with an appraisal of the sampling errors in the estimates of the trip frequencies for the various cells of an origin-destination traffic-survey tabulation.
A mathematical exposition is given of the expected errors -vitien the sampling is done at random, by time clusters, and by volume clusters. The paper also discloses the results of an empirical investigation into the sampling errors that actually arose when various sampling methods were applied to the origin-destination tabulations of the Lebanon and Kokomo, Indiana, surveys. These experimental results were in general accord with the theory.
It is concluded that on the average, for the large number of estimates involved in any one survey, the theory of random sampling will satisfactorily explain the errors 'v^ich arise from the various sampling methods proposed. The results given make it possible to predict the average errors and probability limits for these errors when a particular amoimt and type of sampling has been done. Conversely, one can determine the amount of sampling necessary to keep the sampling errors within specified probability limits.
PART n . PRACTICAL APPLICATION
IN this second part of the paper, the practical application of sampling to actual field conditions is presented. Station arrangement and sampling procedure for obtaining samples of 50 percent and 25 percent as developed during the conduct of an origin-destination survey at Richmond, Indiana, are discussed. Operational procedure for two sampling methods, volume cluster and time cluster, is given for two sample sizes and for locations having various roadway conditions. Sampling on two-lane, three-lane, and four-lane highways carrying traffic volumes ranging from 1,000 to 12,000 vehicles per day is shown to be both practical and economical. The advantages of each of the two sampling methods for various locations are enumerated.
It is concluded that the use of systematic sampling in the taking of roadside interviews is not only practical and economical but that it has definite operational advantages. The conclusions indicate that a predetermined sampling procedure wil l place interviewing on a business-like basis that (1) is recognized by the vehicle operator and the community; (2) promotes efficient operation of the interviewing stations; and (3) produces statistically sound results.
# IN recent years, origin-and-destina-tion studies have been of prime importance in the planning, design, and operation of highway facilities. The data from such surveys provide a basis for determining the demand, location, type, and magnitude of new facilities, as well as important facts concerning their operation.
The methods of obtaining the desired data have necessarily been of recent development. Data collection within the survey area has been by means of home interviews, postcards, observations of license plates, route interviews, or combinations of two or more of these. A l l have been used with varying degrees of

32
success, but only a few actual studies of the relative accuracy and the advantages and disadvantages of each of these methods have been reported. Only the home interview method has received important study toward placing it on a scientific, statistically sound basis (5). One of the purposes of such studies has been directed toward the proper selection of an adequate sample that would be just large enough to produce accurate results in the most economical manner.
Origin-and-destination data of persons entering or leaving the survey area are generally collected by means of roadside interviews at an external cordon. The methods ordinarily used to obtam the necessary information at the cordon result in the selection of a sample which, it is assumed, has been selected in a random manner. In a large majority of the past surveys it is probable that an luibiased sample was selected. A high percentage of the total traffic, however, was often interviewed, so as to minimize the possibilities of obtaining a bias. It is clearly recognized that such almost total samplmg is unwarranted if the sample selection is truly random.
The "Manual of Procedures for the Metropolitan Area Traffic Studies" of the Bureau of Public Roads states that "Representative samples of traffic passing each station in both directions should be interviewed. " The same manual suggests that in selecting the representative sample:
No attempt should be made to select for mter-view a definite predetermined percentage of vehicles passmg each station. The number of mterviews obtained will depend entirely on the number of interviewers assigned to the station and the number of vehicles passmg. The recommended policy is to assign sufficient personnel to each station
to interview approximately 50 percent of the traffic passing durmg peak periods. During the remaining hours of operation the crew will, of course, be able to mterview a greater percentage of vehicles passing the station.
The question, however, arises if the selection of such a sample is truly unbiased. Do the interviewers, as good as they may be, have the ability to select an unbiased sample in the field? Do some interviewers select a preponderance of obviously easy interviewees, local vehicles, vehicles containmg friends or relatives, or vehicles containing attractive girls? Do some interviewers select too-few foreign vehicles, trucks, or vehicles whose drivers were previously interviewed? Are interviewers prone to pass some vehicles through the station in the interest of less work for themselves? Under such a method, are the vehicles that are interviewed selected randomly over the hour or over that period for which factors are later to be computed?
These questions, undoubtedly, cannot always be truthfully answered in a manner which assures an unbiased sample. Furthermore, the question arises as to what size of sample will give adequate results. Certainly there can be no warrant to take a 7 5-percent sample if a smaller sample will give the necessary information as accurately as required.
It is generally recognized that a method which would assure the selection of a random sample would be of great value to roadside interviewing. The purpose of this paper is to examine the errors which could be expected from the use of various sampling rates and samplmg methods and the practicality of these methods under field conditions.
PARTI. SAMPLING THEORY
Irwin Miller and P.E. Irick
# AT a particular external-survey station, incoming traffic can be considered to originate at the station and have d, say, different destinations. Outgomg traffic destined for this station can have d different origins if d+1 is the total number of internal tracts and external stations. Vehicles passing through a single station can have one of second origin-destination (O. D.) combinations. For any one of these
O.D's we define the universe to consist of the N vehicles which could, by virtue of the direction of traffic flow, have had the specified O.D. during the time that the survey station is open. One universe serves for d O.D. cells in the (rectangular) O.D. tabulation. If this universe is sampled m some predetermined manner, the sample estimates of the universe O.D. frequencies are subject to chance variation. It is our

33
purpose to appraise these errors of estimation. We shall f i rs t consider the sampling theory that evolves when one makes certain assumptions about the universe and the nature of the sampling. Secondly, we shall show the results of an empirical investigation into these sampling errors.
RANDOM SAMPLING
Let T be the number of vehicles m a universe of N vehicles -which have a particular O. D. If a sample of n vehicles is chosen at random from the N, and t of these have the O. D . , then
T = ^ t (1)
is an unbiased e^imate of T. The sampling variance of T is known ( l , p l l 5 ) to be
(2) var(T) N _ ^ \ Nfpq N - i j n
where p = T/N, the universe proportion having the O. D . , and where q = 1 - p. We sh^l consider the coefficient of variation of T, CV(T), to b^ a measure of the percentage error in T which arises because of sampling variation. This measure is defined by
CV(T) =[var(T)3^ (3)
where Equation 3 gives the decimal equivalent of the percentage error. Substitution of Equation 2 into 3 gives
% (4) CV(T) N - n\ N / I - 1\
. N T T ) n IT N1 If the sampling rate is designated by T=n/N, and if N is large relative to T, we have the approximate formula
CV(T) II - r\ 1 \ r T
(5)
I Since the universe is not defined until
after the period of the survey, there is no opportimity to construct a chance mechanism for the selection of a random sample of n vehicles. One might regard any subset of the universe as being a random sample, but in such a case there would be no assurance that the foregoing formulas were applicable. As soon as one turns to some objective method for selecting the subset, then it becomes necessary to study the
sampling variances associated with this method. We shall discuss various cluster sampling methods.
CLUSTER SAMPLING General Theory
Let the universe be divided into G clusters of vehicles, and let the sample consist of g of these clusters. Each cluster is to be completely interviewed, and so there is no samplmg variation within clusters. It could be that the g clusters are drawn at random, or that they are chosen systematically, taking every k^'^universe cluster into the sample. Let t. be the number of
vehicles in the i**^ cluster (i = 1, 2 , . . . , G) which have the specified O.D. and let
g t = Z t. be the number of vehicles with the
i = l ^ O. D. which are found in the sample. If the expected or average value of each t^, with respect to all possible samples of the type selected, is T/G, where
T=5:t., then
^ G i= l (6)
is an unbiased estunate of T. The sampling variance of T is given ( l , p . 193) by
var(T) ={-^)f var(t.) where ^ G
var(t.) ='g-i^(t.
(V)
(8)
The cluster to cluster variance, var (t.), is a universe parameter peculiar to the universe and the clustermg device which has been used. Formula 7 is valid when the g clusters in the sample have been chosen at random from the G available clusters. If the sample clusters are taken systematically (2.p. 157).
va r (T)=[ l^ % (g-j) p.^f var(tj) (9)
where p. efficient defined by
g J=l IS the serial correlation co-
k(g-j)
(10)
i ^ j k - I ) / ^ ( s j) var(tp.

34
If the P.. values are negative, the implication is that sample clusters with unusually high t. values will be compensated for by other clusters in the sample with lower than expected t^. In fact, if the are sufficiently negative, var(T) from systematically chosen clusters will be less than var(T) from randomly chosen clusters. The equality of these two variances occurs when
(g-j) - -g(g - 1) pjk 2(G - 1)
(11)
There is empirical evidence, to be mentioned later, that Equation 11 may be satisfied on the average for the various O.D. cells in a given survey when particular types of clusters are used. More investigation of this sort should be done, but in the present discussion we shall use Equation 7 to describe the samplmg variation in f . Substituting Equation 7 mto 3 we have the expected error for cluster sampling.
CV(T)= G -G ^ / g
var(t,) - ^ 1 (12)
T A B L E 1
CHARACTERISTICS O F SAMPLING VARIATION IN TIME C L U S T E R MODELS
Time Cluster
30 mln
15 mln.
10 mln
25r
19T
14T
95% limits tor var(t|)
96T
49T
.31T
3 89
7 81 2.60 — — il.Ol 4 43 2.21
T " — - f -
If a sample of g clusters has been taken, var(t.) can be estimated by
var(t^)= • (G - 1) I GliTTTi^l
(13)
The question arises as to whether one can make any appraisal of var(t.) before a sample is taken. This can be done only if one assumes some mathematical model eft-theoretical mechanism for any particular clustering procedure. One mechanism described in the literature ( l , p . 198) assumes that the clusters obtained in any one sample represent a random selection from all possible clusterings of the N universe
. 0 LEGEND
BSERVEO VARIA NCES
98% PROS LINIT
vor(l| ) t
IBILITY > FOR y
/ •
/ / '
/
/
Y •
/ •
/ :•
• •
•
1000 9 S %
L vo
SOO
PR DBA MIT
(»l ) •
SILITY POR
49T
i
100 / /
1
400
/ /
200 /
/ /
/ • I
40 60 eO 100
T= NO OF VEHICLES WITH SAME 0-D 800 1000 ISOO
Figure 1. Observed quarter-hour-cluster variances (Lebanon universes).

35
O
• OB LEGEND
SERVED VARIANCES 1 • 98% PROBA
LIMIT vor(t|) a
BILITY FOR
9 6 T 3 .
y •
•
/ •
• -
•
•
20
IBOO
1 1 BsKi r
LIU <ar(t
1200
ROBABI IT F< ) • «
Lirr )R y at, /
\ ' l
900 i 1
eoo
1 1 •
-1
1 1/
•
12-0 0 eoo 1000 1800 40 60 SO 100
T : NO OF VEHICLES WITH SAME 0-0 Figure 2. Observed half-hour-cluster variances (Lebanon universes).
9S
>0I (t
% PROBABII LIMIT FOR |)> 9 6 T I I -
ITY
2 0 0 0 2 _ _
/ /
/ .
/ • LEGE
OBSERVED
1 : n o VARIANCES
.
/
/ /
/ r
/ •
. / /
/
—r—
/ e
. y •
~ t . — ; — , • •
T ' NO OF VEHICLES WITH SAME 0-0
Figure 3. Observed volume-cluster variances (Kokomo universes).

36
cars into the G clusters. This supposition leads to an average or expected value
E [ v a r ( t j ( ^ ^ j T ( l - g ) . (14)
We shall discuss two additional models which seem to be intimately related to prac -tical sampling procedures.
Time Clusters
In this method of sampling the survey period is divided into hours, then each hour into the same number of equal time intervals, say 15 min. Let G be the number of intervals m each hour, and t̂ be the total number, over all hours, of vehicles which have the O. D. in question and which are found in the i * ^ time interval. Then the extent of sampling variation, where the sample is to consist of g from the G clusters, is dependent upon var(t.) as in Equation 7 or 9 depending upon how the g clusters are selected. To estimate var(tp we shall assume that the T cars having the O.D. represent independent "trials" such that there is probability 1/G for each car to fall into any one of the G intervals. Under this assumption it can be shown that the expected value of each t̂ is T/G, and from
this that Equation 6 gives an unbiased estimate of T. Furthermore, from Equation 8, var (t )= ? . a \ , wherejf^ = f {t-Tf/T. (15)
' ^ 1=1 ^ G G "X.' follows the chi-squared probability law with G - 1 degrees of freedom. Since the expected value of C);* is G - 1, we have
e [ i varl (16)
and the corresponding expected error is, from Equations 16 and 12,
(17)
Probability limits for var(t.) can be set using tables of chi-square. Tkble 1 shows several values for Equation 16, upper 95-percent probability limits for var(t^), and corresponding values of the squared coefficient of variation for several sample sizes.
Among the various O. D. cells m any
one survey, it is almost certain that one will encounter varying degrees of lack of independence of the type assumed. It would seem that any theoretical model can only be true "in the large" and that its appropriateness can best be judged in the light of empirical evidence. Figure 1 shows quarter-hour variances for 68 cells m an 0. D. tabulation to be described later (Lebanon). Figure 2 shows the half-hour variances for the same cells. The solid and dotted lines are plotted from expected values and probability limits given m Table 1. The serial correlations for the quarter hour clusters in these cells varied considerably, but averaged to be -0. 33, which happens to be the value specified by Equation 11.
Tables 2 and 3 give the data for Figures 1 and 2 respectively. The t. values are vehicle counts over a 12-hr. period of time.
Volume Clusters
Suppose that the universe of N cars is divided into consecutive sets of c cars each so that there are N/c (approximately) such sets. We may take c to be the number of interviewers on duty at the survey station. Let g such sets be interviewed, then G - g sets waved through the station without being mterviewed, etc. Then the universe has been clustered into G clusters, g of which appear in the sample. The i^ '^ such cluster has t i vehicles which have the 0-D m question and (N/G)-ti which do not. We assume that, for every vehicle, the probability of havmg the O-D, p=T/N, is independent of the probability of being in any particular cluster, and that the latter probability is 1/G. This model then describes a 2 X G contingency table (2, p. 227) and, under the assumptions.
G" var(t ) (18)
has nearly the probability distribution of chi-squared with G - 1 degrees of freedom. The expected value of var(t.) is as m Equation 14, and using this average value in Equation 12 we obtain
CV(T)= /G-g^ ^ g T Nj (19)
where T is calculated from Equation 6. Again we have considered the systematic

37
T A B L E 2
Q U A R T E R HOUR VARIANCES - LEBANON DATA
T ' l '2 '3 '4 rar(t,) P 12 T ' l '2 '3 '4 varft,) P li
4 1 0 1 2 S -1 00 36 11 5 10 10 5 5 - 18 e 1 1 3 1 5 00 38 6 7 10 15 12 2 - 63 6 1 2 0 3 1 2 60 42 5 11 14 12 11 2 - 82 7 2 0 3 2 1 2 _ OS 43 14 12 10 7 5 1 - 58 7 1 2 4 0 2 2 - 49 44 13 11 8 12 3 5 - 89
S 2 2 3 1 5 ou 45 11 16 7 11 10 2 - 06 8 0 3 0 5 4 6 7( 48 15 12 15 6 13 5 33 g 3 3 2 1 7 8! 55 19 11 14 11 10 7 41
10 1 3 5 1 2 8 - 8i 59 15 12 15 17 3 3 - 87 11 3 3 3 2 2 - 331 88 19 20 12 17 9 6 - 53
11 2 3 2 4 7 63j 71 17 21 17 18 3 7 - 69 12 2 1 6 3 3 5 - 4! 72 22 11 18 21 18 5 - 46 12 5 2 4 1 2 5 80 74 15 17 24 18 11 2 - 82 19 4 8 1 2 3 7 69 78 16 12 23 27 34 2 -1 00 14 4 4 2 4 8 - 33 82 20 20 13 29 32 2 - 01
le 8 3 2 3 5 5 8 i 93 20 18 27 28 18 7 - 99 16 4 4 3 5 5 oo 94 27 25 22 20 7 2 - 72 17 4 5 7 1 4 7 - 33 99 17 26 29 27 21 2 - 71 20 5 4 5 6 S -1 00 105 31 27 20 27 15 7 - 93 21 5 4 5 7 1 2 - 89 no 31 22 26 31 14 2 - 86
21 4 3 7 7 3 2 _ 98 112 30 29 36 17 47 5 05 22 7 6 3 6 2 2 - 78 123 35 22 39 27 44 2 77 22 8 S 4 5 2 2 78 124 28 27 40 20 27 5 - 35 !4 10 4 4 8 6 0 _ 67 129 28 29 38 36 24 2 - 90 26 8 5 8 5 2 2 1 00 195 47 47 47 54 9 2 - 67
27 9 7 5 6 2 2 _ 94 198 46 52 48 52 8 8 85 27 7 4 12 4 10 7 41 203 54 47 56 46 18 7 - 02 28 8 8 6 7 1 5 Si 205 64 67 38 46 99 7 -1 00 29 5 10 5 9 S 2 95 226 62 65 66 43 70 2 21 32 11 3 7 11 11 0 - 82 236 53 59 58 86 21 5 30
93 14 6 8 5 12 2 2^ U l 303 278 286 244 461 2 22 34 7 9 7 11 2 8
2^ 218 303 323 305 287 182 8 -1 00
35 12 9 11 3 12 2 758 425 429 4'57 137 130 8 - 97 35 10 10 7 8 I 7 - 895 478 508 472 137 636 2 -1 00
T A B L E 3
H A L F HOUR VARIANCES - L E B A N O N DATA
selection of the g clusters to be equivalent to the corresponding random selection. Comparison of Equation 19 with 17 and Equation 18 with 15 shows that Table 1 can be used for this volume cluster model provided the factor q = 1 - ! I is inserted as a
N multiplier for each entry there. Figure 3 and the accompanying data in Table 4 shows 68 observed values of var(t|) from Kokomo universes where G = 2, g = 1, N = 2,000 (approx.). These variances, however, are not from true volume clusters as will be pointed out later. Table 1, modified as just stated, gives the solid and dotted curves in Figure 3.
In summary it should be pointed out that Formula 14 substituted mto Equations 12, 16, and 19 are very similar, and in fact, that all three are practically equivalent to Formulas 4 and 5. This is so because the assumptions made for cluster sampling have led to the conclusion that we shall expect cluster sampling errors to average to be the same as random sampling errors even though the two types of errors may be different for a single universe. Having discussed the theoretical sampling variation to be expected through the use of these methods, we now turn our attention to the
t *1 '2 varttj) '1 2̂ var(tl)
4 1 3 1.0 36 16 20 4 0 6 2 4 1 0 38 13 25 36 0 6 3 3 0 42 16 26 25.0 7 2 5 2 2 43 26 17 20 2 7 3 4 .2 44 24 20 4 0
8 4 4 0 45 27 18 20 2 8 3 5 1.0 48 27 21 9 0 9 6 3 2 2 55 30 25 6 2
10 4 6 1.0 59 27 32 6 2 11 6 5 .2 68 39 29 25 0
11 5 6 2 71 38 33 6 2 12 3 9 9 0 72 33 39 9 0 12 7 5 1.0 74 32 42 25 0 13 10 3 12 2 78 28 50 121.0 14 8 6 1 0 82 40 42 1 0
16 11 5 9.0 93 38 55 72 2 16 8 8 .0 94 52 42 25.0 17 9 8 .2 99 43 56 42 2 20 9 11 1 0 105 58 47 30.2 21 9 12 2 2 110 53 57 4.0
21 7 14 12 2 112 59 53 9 0 22 13 9 4.0 123 57 66 20 2 22 13 9 4 0 124 55 69 49.0 24 14 10 4 0 129 55 74 90.2 26 13 13 0 195 94 101 12 2
27 16 11 6 2 198 98 100 1 0 27 11 16 6.2 203 101 102 .2 28 16 12 4 0 205 121 84 342 2 29 15 14 .2 226 117 109 16 0 32 14 18 4.0 236 112 124 36 0
33 20 13 12.2 1111 581 530 650 2 34 16 18 .2 1218 626 592 289.0 35 21 14 12 2 1758 864 894 225.0 35 20' 15 6.2 1895 986 909 1482 2
observed samplmg errors which arose when these methods were applied.
DESCRIPTION OF EMPIRICAL INVESTIGATIONS
The results of census surveys taken at Lebanon and Kokomo, Indiana, comprise the universes from which samples were drawn in an empirical study of sampling variances. It was impracticable to interview every vehicle when traffic was unusually heavy, but over 90 percent of the traffic was interviewed in each survey, making it reasonable to regard these surveys as complete. Table 5 shows the O. D. frequencies for the Lebanon survey.
Traffic at Lebanon was interviewed at eight different external stations*, and the area was divided into 24 internal tracts. Vehicles passing through Station 8, for example, could have had 24 internal-external O.D. combinations, and 14 through-trip combinations (7 inbound and 7 outbound)

38
or 62 in all . For the O. D. Cell 8-010, the universe consists of N = 4703.4 vehicles inbound through Station 8. For the O-D Cell 8-3 the universe has been taken to consist of the 4,703.4 vehicles which went through Station 8 in the inbound direction, plus the 947.7 vehicles passing through Station 3 in the outbound direction, or 5,651.1 vehicles in all . As can be seen in Table 5, the respective T values for these cells are 91.6, and 184.8. These values are not actual counts, since the counts were adjusted for day to day and other variations by means of several factors (3).
T A B L E 4
V O L U M E C L U S T E R VARIANCES - KOKOMO DATA
St
100
8 0 0 0 1 0 0 0 0 s - l i .
UNIVERSE PtJPULATION OF OO CELL
Figure 4. Expected errors due to uniform sampling ( f o r various sampling ra tes) .
Types of Samples
The data for each universe interview was recorded on a punch card. The card showed the quarter hour of the hour in which the interview was taken and serial numbers were assigned to the cards within the quarter hours. However, these serial numbers were not necessarily m the order of occurrence of the interview, due to the fact that several interviews were being conducted simultaneously. Consequently, time-cluster samples were limited to rates of 25, 50, and 75 percent, and it was felt reasonable only to consider the volume cluster sample which compares even and odd serial numbers. Such rates are de-
T ' l '2 var(t,) T ' l '2 var(t,)
6 2 4 1.0 39 21 18 2.2 7 3 4 .2 1 40 19 21 1.0 7 3 4 2 > 42 20 22 1.0 8 5 3 1 0 42 20 22 1.0 9 6 3 2.2 42 17 25 16.0
10 5 5 0 45 23 22 .2 10 4 6 1 0 46 28 18 25.0 11 8 3 6 2 46 22 24 1.0 11 2 9 12 2 49 24 25 .2 14 8 6 1 0 55 29 26 2.2
15 12 3 20.2 57 19 38 40.2 15 8 7 .2 57 30 27 2 2 17 10 7 2.2 61 29 32 2 2 17 12 5 12.2 62 40 22 81.0 18 9 9 .0 62 36 26 25.0
19 10 9 2 65 33 32 .2 21 6 15 20 2 65 31 34 2.2 23 12 11 .2 66 29 37 16.0 25 16 9 12.2 71 35 36 .2 26 10 16 9.0 85 44 41 2.2
26 7 19 36.0 97 48 49 2 27 11 16 6.2 100 49 51 1 0 29 14 15 2 107 41 66 156.2 30 18 12 9.0 143 77 66 30 2 30 13 17 4 0 144 69 75 9.0
31 14 17 2 2 164 89 75 49 0 31 10 21 30.2 196 112 84 196.0 31 13 18 6 2 227 112 115 2.2 34 20 14 9 0 273 152 121 240 2 35 14 21 12.2 281 139 142 2 2
35 16 19 2.2 299 145 154 20.2 36 14 22 16 0 427 210 217 12.2 37 24 13 36.0 475 243 232 30.2 37 21 16 6.2 532 255 277 121.0
90 eoo
800 1000 2000 aooo 10000 stoi. a UNIVERSE POPULATION OP 0-0 CELL
Figure 5. Expected errors due to quarter-hour sampling.

39
T A B L E 5 ORIGIN AND DESTINATION UNIVERSE TABULATION O F NUMBER O F
VEHICULAR TRIPS FOR LEBANON BY-PASS " B E F O R E " STUDY
001 002 003 004 005
, 0 0 6 § 0 0 7 S008 e 009 i O l O g O l l , 012 "013 ^014 £ 0 1 5 _016 g017 oSOlO S019
020 021 022 023 024
External Stations - Origins External Stations - Destinations
1 3 5 ( 10 11 13 14 1 3 5 ( ) 10 11 13 14
3 7 1 1 1 1 2 2 1 5 1 3 0 0 0 0 001 5.4 0 0 1 2 4 4 0 0 0.0 0.0 0 0 16 7 2 3 1 3 15 3 1 2 0 0 2.2 6 3 002 7 3 4 5 1 5 16 6 4 5 2 4 1.1 12.0 6 7 4 7 11.1 24 9 5 3 4.0 1. 3 10.9 003 10.2 9.6 11 7 30 4 3.0 4.5 3 7 9 8
16 5 17 7 29 2 40 4 23 3 10 1 4 9 35 0 004 IS 9 19 9 32 3 34 5 16 9 6 5 4.3 18.4 5 5 2 4 10 2 24 8 5 9 10 0 9. 2 IS 1 005 6 1 1.1 5 5 32 5 4.4 2.0 11.9 9.2 2 4 12 9 11 3 30 9 14 5 7 8 11 7 18 9 006 5 5 10.4 9.8 32. 2 8.0 9.3 9.3 29 0 1 0 21.1 15 6 9 0 5.6 0.0 0 0 1 0 007 4 3 7.8 10 0 2.4 3.1 0.0 0 0 1.1
39 4 40 9 62 3 51 6 13 2 22 5 14. 3 59 8 1 008 49 9 55 9 59 2 54 8 15 9 15.6 17.8 54 3 8 1 17 1 19 4 42 4 6 2 7 4 12 8 24 7 '&009 14.5 21.5 20 0 48 9 10 5 3 4 11 7 24.8
41 1 50 9 57 0 91 6 33 3 42.7 26 6 67 1 t O l O 36 1 48.9 76 1 83 7 30 6 21 0 20 9 68 9 2 4 3 9 0 9 14 1 7.1 3 0 1 8 12.2 T Oi l 5.4 4.3 0.0 13 9 5.5 5.1 2.7 13 0 8.5 21.4 17 0 32 3 6 1 3 2 3 3 18 8 a 012 11 1 27 7 13 9 25 8 7 1 1.7 3 6 21 8 4 1 19.0 29 7 11 9 5 6 7 3 7 2 18 1 u 013 4 9 23 5 25 4 10 4 7 3 7 4 5 0 22.2
20 8 49.4 48 5 71 1 11 7 13 9 7 9 30 5 ion 25.2 37.8 40.9 63 9 14 9 11 5 12 2 31 7 163 2 193.9 203 0 278 7 97.3 100 3 74 5 167 6 ^ 015 134 1 129 9 199 5 242 5 78.1 104 8 72 1 47 9
12 9 28 5 76.3 39 9 18 2 29 7 29 8 33.3 l o w 14 3 26 8 61.4 41 6 31 8 38 1 25.0 29 1 16 8 16 0 28 4 84 9 18.5 36 9 15 6 27 3 S017 17 4 26 9 29 0 77 4 25 4 23 3 19 7 36 0 2 2 2.8 11 0 7 2 1.1 0 0 0 0 0.0 g018 4 1 1 0 5 3 7 7 3 8 0.0 0.0 2.3
15 1 17 9 27 0 56 5 18 4 19 0 6 0 23 8 019 15 5 22 4 34 2 52 3 19 3 17 8 11 4 32 2 6 5 3 7 4.5 29 2 5 3 1 1 4 7 16 5 020 7 4 1 3 6 7 23 7 9.3 1.2 2 2 11 8 9 1 20 8 33 0 46 3 18 5 16 7 10 9 35 8 021 16 2 14 6 30 3 41 9 18 8 17.9 12 7 40 3 1 3 1 0 16 S 6 2 1 3 0 0 0 0 2 9 022 3 0 0 0 8 7 9. 2 1.3 0 0 0 0 1 2 2 3 2 9 6.3 19 9 6 7 5 4 18 4 6 5 023 1 0 2.3 6 9 19 0 5 5 5 2 13 9 4 6 1 1 1 3 2 6 20 5 9 7 2 7 0 0 3 8 024 4 0 0 0 3 0 25.5 2.5 0 0 0 0 3 2
External Stations - Destinations
1 3 1 5 8 10 11 13 14 n 1 12 8 67 8 4175 6 102 8 10.6 3 6 0 0
J 3 4. 4 26 4 206 8 220 2 7 6 6 6 31 6 5 62. 0 27 2 38 4 65 6 14 4 15 6 111 0 8 3949 6 184 8 25 2 29 2 8 4 8 0 498 2
•at. 10 132 4 168. 8 62 6 30 0 3 2 1 2 198 4 g o U 13 2 4 6 9 4 11 4 2 6 0.0 12 0
13 0. 8 7. 2 18 0 9 0 1 2 1 2 1 0 & 14 0 0 44 2 131 6 523 8 218 0 8 0 2.4
sirable, however, in that they permit reasonable frequencies to appear in cells with small T values. The following samples were selected for study.
Sample 1 is a volume cluster sample, each cluster consisting of N vehicles. The sample selected represented the even serial numbers, and thus is a 50-percent sample with G = 2, and g = 1.
Sample 2 is a quarter-hour time-cluster sample. A 50-percent sample was obtained by choosing vehicles which were interviewed in alternate directions by quarter-hour time intervals. Thus, G = 4 and g = 2 in this case.
Sample 3 differs from Sample 2 only in the use of a half-hour time interval, or in that G = 2 andg = 1. Both Samples 2 and 3 would be expected to provide 50-percent samples, since the inbound universe was sampled in the periods during which the outbound universe was not sampled, and vice versa.
Sample 4 combines both the volume cluster technique of sample 1 and the time cluster sampling of sample 3. In this sample the even numbered vehicles were inter
viewed every other half hour, yielding an expected 25 percent sample.
Sampling Errors
^ After a drawing of any of these samples, T was computed from Equation 6 for each cell, and compared with the corresponding universe frequency, T. The relative error of estimate in this cell is given by the formula
e J ^ - ^ ' . (20)
Table 6 shows the relative errors in percent arising from Sample 2 drawn from the Lebanon imiverses. Similar tables have been constructed for the remaining samples from both surveys (4).
The variance of t i has been computed directly from the universe data in the case of cluster sampling. Graphs of these values versus T are typified by Figures 1, 2, and 3, and show that var (t^) is approximately proportional to T. Then it follows from the theory that
CV(T) =^yf~ (21)

40
•
!00
100 Ss^
— ^
f to
ao
2 0
10
ao
2 0
10
s
ao
2 0
10
V ao
2 0
10
ao
2 0
10
ao
2 0
10
^ « M
ao
2 0
10
s r . T5
ao
2 0
10
5
2
1
5
2
1
5
2
1
5
2
1
5
2
1
5
2
1
5
2
1 1 : ) in PO 6 0 _ p
BOOO 10000 I w l i l
UNIVERSE POPULATION OF <M> C E L L
Figure 6. Expected errors due to h a l f -hour sampling.
where K is a constant which will be left for the data itself to determme. In order to estimate K, let us first make the fo l lowing change of variables. Let
CV(T)]' (22)
When this is done. Equation 21 becomes Y = KX. (23)
Now each complete sample, as illustrated in Table 6, gives rise tos numbers ej, one for each O. D. cell, and the imiverse tabulation (e.g., Table 5) provides s corres-pondmg values T j . (The subscripts j are used to indicate that these values came from the jt^'O.D. cell). Smce ej is the only available estimate of CV(T) in the jth cell, we shall compute = e j our estimate of Y j , from this number. K is estimated by the method of least squares, using the formula
K = 1 X Y / I X j=l ^ ^ j = l
(24)
Under the assumption that ith
the errors arising in the j ' ^ ' * cell from all possible samples of the type selected are normally distributed with mean zero and standard deviation CV^tj), it is found (4) that the variance of K can be estimated with the aid of the statistic
Va rK .11=?' • (25)
This normality assumption has been validated (4) from the observed data for cells having more than 25 vehicles m the universe. We should not expect normal distribution of errors!or the smaller cells.
Computation of K together with its variance affords a way to evaluate the results of the plans, as well as a means for estimatmg var(ti). Table 7 exhibits these results for the four samples under Investigation with respect to the Lebanon and Kokomo universes. The computations have been carried out for Sample 4 m the manner outlined, although no theory is presented here for this type of sample. The general theory related to this method appears in the literature (1, p. 144). .
From Table l i t can be noted that K values for samples 2 and 3 were expected to have been 1.00 with upper probability limits of 2.60 and3.89 respectively. Table 7 indicates that the corresponding average empirical values for K were 1.18 and 1.34. The magnitude of the standard errors of these K values implies that the empirical estimates of K might vary considerably with more experimentation of the type done here, but also makes it credible that the observed sampling errors are fairly well in accordance with the theory which resulted in Table 1. On the other hand, smce all 4 K values from Samples 2 and 3 were greater than 1,
SO BOOi
2 0 0 0 0
100 2 0 0 aoo 1000 aooo aooo loooo «•«<.• UNIVERSE POPULATION OP 0 4 C E L L
Figure 7. Expected er rors due to two-stage sampling.

41
T A B L E 6
OBSERVED ERRORS (IN PERCENT) O F ORIGIN AND DESTINATION TABULATION SAMPLE 2 FOR LEBANON BY-PASS " B E F O R E " STUDY
001 002 0Q3 004 005 006
a 007 1 008 a 009 B 010 2 oil O 012 ' 013 S 014 M 015 H 016 H 017 £ 018 i ! 019 S 020
021 022 023 024
100 0 9 8 e 1
28 4 63 0
8 3 100 0 47 9 12 5 12 3 8 3
21 4 10 0 30 1 19.1 21 9 7 2 9 1
20 0 71 9
2 2 100 0 18 2
100.0
External Stations - Origins External Stations - Destinations
100 0 100 0 47 8 16 1 8 3
26 6 36 5 24 8 47 6 8 0
26.3 26 4 22.3 20 9 6 0
29 0 31.6
100 0 2 3
100 0 30.1
100 0 107 1 116 7
120 0 116 7
9 1 11 1 72 0 51 8 61 0 12 1 10 4 11 0
100 0 47 6 22 4 13 8 1 2
18 4 12 9 48.1 9 0
40 9 12 3 42 0 22 6
100 0
9 1 45 3
1 6 20 1 13 1 6 6
77 3 12 2 2 4 2 9
42 I 27 1 4 8 5 4
35 5 12 4
l l
I
10 U 13 14 1 3 5 8 10 11 13 14
100 0 100 0 0 0 0 0 001 107 7 0 0 0.0 109 5 0 0 0. 0 0.0 0.0 100 0 0 0 100 0 71 0 002 0 1 104 5 100 0 26 1 54.5 0.0 0 0 10 3
5 0 35 0 116 7 64 8 003 10 9 8 4 6 5 5 8 100 0 9 1 100.0 10 1 17 4 48 0 12 5 4 0 004 11 5 0 9 11 2 11 9 9 2 25 0 42 9 16 5 17 2 10 2 44 4 34 7 005 36 1 120 0 44 4 2 9 66 7 100 0 15 0 37 3 16 7 21 1 3 4 29 0 006 45 2 12 5 35 4 U 9 29.8 4 6 5 1 12.9 28 6 0 0 0.0 100 0 007 100 0 3.3 33 3 33 3 40.0 0 0 0 0 120 0 10 8 46 8 22 5 6 I 01 008 22 3 10 4 36 7 4 9 20 5 18 4 21.5 16 4 58 1 70.3 27 0 16 4 5,009 8 0 5 5 20 4 11 5 14 0 29 4 34 9 25 8 29 3 8 1 9 2 10 9 010 0 5 2 3 3 7 11 4 20 8 7 3 31 4 7 3
2 9 100 0 11 I 5 0 O O U 30 3 42 9 0 0 40 7 18 4 54 5 44 4 28 0 16 7 100 0 IB 8 24 7 012 9 3 46 2 98 7 7 6 51.4 0 0 56 5 7.9 17 9 47 2 38.9 20 2 013 29 2 26 4 33.3 4 8 36 I 69 4 8 3 0 8 39 7 15 9 12 8 32 7 014 3 4 4 1 23 5 6 8 43.8 58 9 27 7 3.9
7 5 17 0 16 8 5 4 H015 6 4 1 I 8 9 0 9 20 I 14 0 3 6 3.5 7 8 2 7 6 8 0 6 cd 016 3.9 11.8 6 6 8 0 47.1 8 1 0 8 40 8
19 8 29 7 10 4 10 4 c Ll
017 17 6 14 8 9 9 2 3 27.9 26 7 9 4 20 3 100 0 0 0 0 0 0 0 £ 0 1 8 50 0 0 0 53.8 51 8 31 6 0.0 0 0 9 1 22 0 5.3 63 3 U . l >S019 9 6 16 0 17 6 6 4 25 7 23 5 2 5 12.0 69 2 100 0 8 7 19 8 020 51 0 116 7 37 8 0 7 55 6 100 0 37.5 10 8 15 4 73 2 20 4 25 4 021 47 1 11 3 37.8 6 6 27 7 57.4 3 5 20 5
116 7 0 0 0 0 35.7 022 40 0 0 0 64 3 61 4 116 7 0 0 0.0 100 0 39 4 51 9 5 5 28 1 023 100.0 0 0 32 7 16 4 36 4 8. 5 3 0 21 4 27 1 23 1 0 0 36 8 024 45 0 0 0 6 7 2 2 31 6 0. 0 0 0 31 3
External Stations - Destinations 1 3 5 8 10 11 13 14
I 37 5 7 4 0 4 0 4 20 8 38 9 0 0 3 95 5 10 6 2 2 2 2 10 5 33 3 13 9 5 7 4 18 4 33 3 0. 9 59.7 15 4 21 1 8 1 1 6 8 15 9 10 3 2 4 10 0 2 9
10 16 9 0 5 8 0 40 0 43. 8 100 0 6 3 11 27 3 8 7 100 0 63 2 0 0 0 0 13 3 13 100 0 69 4 42.2 100 0 100.0 83 3 100.0 14 0.0 0 S 9 3 11 5 4 4 72.5 8 3
there is indication that the average sampling errors may be somewhat greater than shown in Table 1, but are well below the probability limits for average error shown there. It would follow from the theory that K for Sample 1 should turn out to be somewhat smaller than 1. It is not clear whether its failure to do so can be simply attributed.to the chance fluctuation expected in K, or to the uncertainty as to the true nature of sample 1 relative to volume clusters. Sample 4 produced K values of the order expected in 25 percent cluster sampling as indicated in Table 1.
K = K ' (27) and substitute for K in Equation 26 to have
log|cV(T))= % log K ' f - ^ - % log T. (28)
Figures 4 to 7 illustrate Equation 28 for the four samples studied. The solid lines on these figures are obtained from Equation 28 when the observed average K values are used. Dotted lines on these figures represent extrapolations to other sampling rates via Equation 27 and 28. The
values are also shown In Table 7.
Empirical Expected Error Curves
In Equation 21 we may take the logarithm of each side to obtain
loeiCV(^Tl = %\ogK-% log T. (26) When plotted on double logarithmic coordinates, this function is a straight line with slope -% and ordinate intercept / K . In accordance with the theory it is clear that K is a function of 1 - J , where r is the sampling rate. We write
T A B L E 7
VALUES O F K AND STANDARD ERRORS
Sample No
Universe Actual Rate of Sampling
ft Avg ft
K * Standard E r r o r otk
1 Lebanon Kokomo
.499 500
1.24 1 21 1 22 1 22 0 22
2 Lebanon Kokomo
496 501
1 21 I 16 1.18 1.18 0 21
3 Lebanon Kokomo
483 491
1.28 1 41 1 34 1 28 0 22
4 Lebanon Kokomo
242 247
1 59 S.93 4.26 1.38 0 92
42
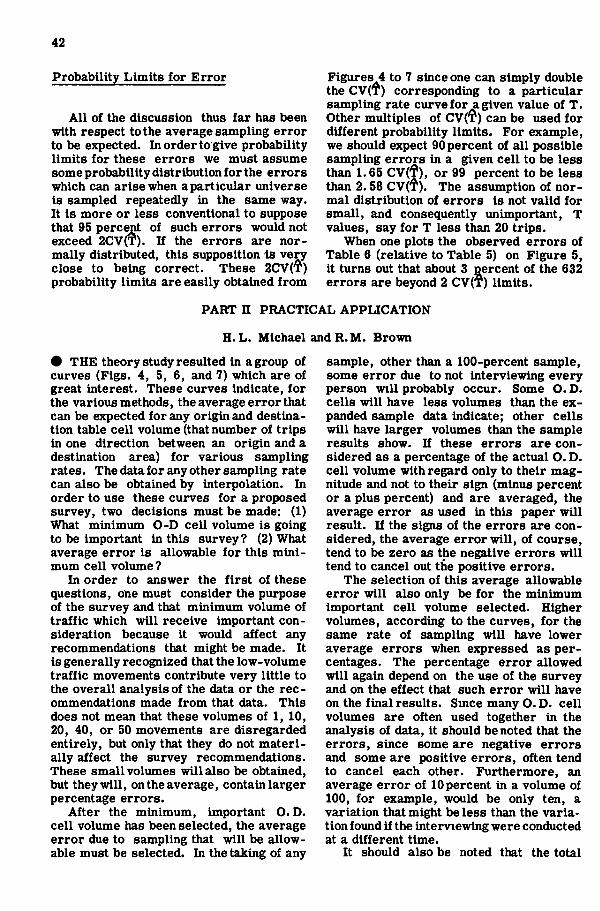
Probability Limits for Error
Al l of the discussion thus far has been with respect to the average sampling error to be expected. In order to give probability limits for these errors we must assume some probability distribution for the errors which can arise when a particular universe is sampled repeatedly in the same way. It is more or less conventional to suppose that 95 percent of such errors would not exceed 2CV(T). If the errors are normally distributed, this supposition Is very close to being correct. These 2CV(T) probability limits are easily obtained from
Figures 4 to 7 since one can simply double the CV(T) corresponding to a particular sampling rate curve for a given value of T. Other multiples of CV(T) can be used for different probability limits. For example, we should expect 90 percent of all possible sampling errors in a given cell to be less than 1.65 CV(T), or 99 percent to be less than 2.58 C V ( f ) . The assumption of normal distribution of errors is not valid for small, and consequently unimportant, T values, say for T less than 20 trips.
When one plots the observed errors of Table 6 (relative to Table 5) on Figure 5, it turns out that about 3 percent of the 632 errors are beyond 2 CV(T) limits.
PART n PRACTICAL APPUCATION
H.L . Michael and R.M. Brown
# THE theory study resulted in a group of curves (Figs. 4, 5, 6, and 7) which are of great interest. These curves indicate, for the various methods, the average error that can be expected for any origin and destination table cell volume (that number of trips in one direction between an origin and a destination area) for various sampling rates. Thedatafor any other sampling rate can also be obtained by interpolation. In order to use these curves for a proposed survey, two decisions must be made: (1) What minimum O-D cell volume is going to be important in this survey? (2) What average error is allowable for this minimum cell volume?
In order to answer the first of these questions, one must consider the purpose of the survey and that minimum volume of traffic which will receive important consideration because it would affect any recommendations that might be made. It is generally recognized that the low-volume traffic movements contribute very little to the overall analysis of the data or the recommendations made from that data. This does not mean that these volumes of 1, 10, 20, 40, or 50 movements are disregarded entirely, but only that they do not materially affect the survey recommendations. These small volumes wil l also be obtained, but they wi l l , on the average, contain larger percentage errors.
After the minimum, important O.D. cell volume has been selected, the average error due to sampling that wil l be allowable must be selected. In the taking of any
sample, other than a 100-percent sample, some error due to not interviewing every person wil l probably occur. Some O. D. cells wil l have less volumes than the expanded sample data indicate; other cells will have larger volumes than the sample results show. If these errors are considered as a percentage of the actual O. D. cell volume with regard only to their magnitude and not to their sign (minus percent or a plus percent) and are averaged, the average error as used in this paper wil l result. If the signs of the errors are considered, the average error wi l l , of course, tend to be zero as the negative errors wil l tend to cancel out the positive errors.
The selection of this average allowable error wil l also only be for the minimum important cell volume selected. Higher volumes, according to the curves, for the same rate of sampling wil l have lower average errors when expressed as percentages. The percentage error allowed wil l again depend on the use of the survey and on the effect that such error wil l have on the final results. Smce many O. D. cell volumes are often used together in the analysis of data, it should be noted that the errors, since some are negative errors and some are positive errors, often tend to cancel each other. Furthermore, an average error of 10 percent in a volume of 100, for example, would be only ten, a variation that might be less than the variation found if the interviewing were conducted at a different time.
It should also be noted that the total

43
traffic volume at an interview station has little to do with the selection of a sampling rate. The effect of the total volume is negligible if the cell frequency is small relative to the total volume. Furthermore, the sampling error in a cell which is large compared to volume is overestimated by not taking volume mto account. A samp-
plicable for those two cities. There is no evidence, however, to indicate that these two cities are distmctly different in the manner of traffic characteristics from hundreds of other cities in the United States. This fact, together with the weight of mathematical theory indicated in Part I , seems to indicate that the curves as de-
F i g u r e 8. Richmond, I n d i a n a , ma jo r r o u t e s and survey a rea .
ling rate, therefore, is on the safe side when it is based only on an important minimum O. D. cell volume and on an a l lowable average error for that volume. It is evident, therefore, that the selection of larger tracts with correspondmgly larger traffic volumes would be advantageous for accuracy reasons. Here again the uses of the survey data and the accuracy needed must be considered.
The curves developed from the Lebanon and Kokomo data and shown in Figures 4, 5, 6, and 7 are, of course, only truly ap-
veloped are applicable to surveys in other cities.
Use of Sampling Curves, Example
The State Highway Commission of Indiana authorized a complete origin-and-destination study for the City of Richmond, for the summer of 1952. This offered an excellent opportunity to apply the various sampling methods. The representatives of the cooperatmg agencies, the Metropolitan Area Traffic Survey Unit of the State High-

44
ROAD AND TRAFnC COHDITIONS AND SAHPUNO MKTHOD USED lUCBWOND TRAFFIC SURVEY
Average 24-Hoar loter- Sampling
Road Condltloofi Traffic viewlag Plan No Surface Shoulders Land use Volume Hours Deed
71 aravel Narrow Open Fields 202 None Hfloe 72 Gravel Narrow Open Fields 137 None None 7S 3-Lane Wide Open Fields 11,007 6am - 0 am Vol Closter
Ccmcrete 100% Sample 74 Asphalt Harrow <̂ >eD Fields 380 6am -10pm 100% Sample
7S Oravel Narrow <̂ >eD Fields 81 None Hone 76 Gravel Narrow <̂ >en Fields 853 None Hone 77 Gravel Narrow Open Fields 89 None Hone 78 Concrete Medium Open Fields 5,484 8am - 0am Time Cluster * 70 AqihaU Narrow Open Fields 1,114 0am -10pm 100% Sample BO Asphalt Narrow Restdentlal 3,808 0am - 0am Vol Cluster* 81 Gravel Narrow Open Fields 181 None None 8a AsphaU Narrow <^en Fields 1,004 0am - lam Time Cluster* 83 Asphalt Narrow <̂ >en Fields 480 0am -IC^m 100% Sample 84 Asphalt Narrow <̂ >ea Fields 2,162 0am - lam Time Cluster* 85 Gravel Narrow OptSk Fields 288 Hone Nooe 88 Divided Wide <̂ >en Fields 13,773 Oam - 0am Time Cluster
Concrete 87 Gravel Narrow Open Fields 93 Hone None 88 Gravel Narrow Open Fields 134 None None 89 Asphalt Narrow Opto Fields 552 Oam -10pm 100% Sample 90 AsphaU Narrow Open Fields 2,671 Oam - lam Vol Cluster* 91 Gravel Narrow Optai Fields 250 Hone None 92 Asphalt Narrow <^en Fields 3,506 Oam - lam Vol Cluster*
* l W f t uunple taken during atght boors of low TOlome coast RlctunODd, I n U a i i a , June - Jul ; , 195 !
way Commission of Indiana, the Bureau of Public Roads, and the Joint Highway Research Project of Purdue University, agreed to such sampling. It was further agreed that the minimum important cell volume would be considered to be 100 vehicles and that a 10-percent average error would be allowable for this cell volume. A total of 39 tracts for Richmond, a city of 38,000 people, was selected on the basis of land use and intensity of development.
A study of the curves for quarter-hour sampling (Fig. 5) and uniform sampling (Fig. 4) shows that for a cell volume of 100 and an error of 10 percent a sampling rate of slightly greater than 50 percent is necessary. A sampling rate of 50 percent was therefore chosen as one which would be practical in application. An average error of 10 percent in cell volumes of about 110 could be expected from this sampling rate.
Richmond, is a typical midwestern city. A principal east-west highway (US 40) passes through the city and four other state and federal routes pass through or terminate m the city (see Fig. 8). A cordon line around the developed area intercepted 22 roads and highways. The traffic volumes on these roads ranged from less than 100 to more than 13,000 vehicles on an average weekday (see Table 8). The roads varied from narrow, two-lane, gravel roads to modern, four-lane divided highways (see Table 8). These great differences m traffic volumes and roadway conditions permitted a study of the various sampling methods under many conditions.
The selection of the stations which were
operated was made according to the usual criteria of traffic volume. A few stations on county roads were operated that had total volumes of less than 500 in order to obtain the traffic pattern for county roads. Four other stations with volumes aroimd 2,000 vehicles per day were operated for 19 h r . , mstead of the usual 16 hr. because of rather large volumes of traffic between 10 pm. and 1 am. The exact location of all stations was made on the basis of the established criteria for safety.
The personnel required to operate the largest station was the determining factor for the number of mterviewers hired. Each interviewer was considered capable of taking 40 interviews per hour. The number of mterviewers required for each station for each hour for a 50-percent sample was thus determined (see Table 9). The number of men provided for each shift was then determined on the basis of the men needed durmg most hours of each shift. This method provided a rest period for usually one man at a time during the low-volume hours of the shift. Since the peak period of 3 to 6 pm. and the period 10 to 1 am. usually required several more men than other hours of these shifts, additional men were hired and assigned as necessary to the various stations during these hours (see Table 9). The necessary manual counters and crew chiefs required for the various stations were also determmed. One counter and one crew chief were normally assigned to each station, except that on those
P E R S O N N E L R E Q U I R E D P L A N F O R A T Y P I C A L CTATION R I C H M O N D T R A F F I C S U R V E Y
S a m p l i n g R a t e 50i& H o u r s o l O p e r a t i o n 6 A M to 6 A M S a m p l i n g M e t h o d T i m e C l u s t e r
M e n R e q u i r e d P r e S u r v e y V o l u m e I n t e r - C r e w
T i m e C o u n t v i e w e r s C o u n t e r s C h i e f s R e m a r l t s
6 - 7 a m 7 - 8 a m S - g a m 9 - 1 0 a m
1 0 - U a m 1 1 - 12 N 1 2 - 1 p m
1- 2 p m
2 - 3 p m 3 - 4 p m 4 - 5 p m 5 - 6 p m 6 - 7 p m 7 - 8 p m 8 - 9 p m 9 - l O p m
1 0 - U p m 1 1 - 1 2 M 1 2 - 1 a m 1- 2 a m 2 - 3 a m 3 - 4 a m 4 - S a m 5 - 6 a m
447 305 262 304 408 203 290 301
327 S49 527 403 290 237 186 177
160 148 124
33 51 43 40
120
U s e F o l l o w i n g C r e w 1 - S u p e r v i s o r * 1 - C r e w C h i e f 1 - C o u n t e r 4 - I n t e r v i e w e r s
U s e F o l l o w i n g C r e w 1 - S u p e r v i s o r * 1 - C r e w C h i e f 1 - C o u n t e r 4 - I n t e r v i e w e r s
Note 2 a d d i t i o n a l I n t e r v i e w e r s f r o m 3 p m - 6 p m R e l e a s e 1 I n t e r v i e w e r at 8 p m
U s e F o l l o w i n g C r e w 1 - S u p e r v i s o r * 1 - C o u n t e r 2 - I n t e r v i e w e r s
Note F r o m l a m - 5 a m t a k e 100 % S a m p l e S u p e r v i s o r to d i r e c t t r a f f i c a s n e c e s s a r y
O p e r a t e a l s o S ta t ion 102 on t h i s d a y
* A l s o S u p e r v i s o r of A b o v e S ta t ion S u p e r v i s o r to a s s i s t In I n t e r v i e w i n g d u r i n g u n d e r - m a n n e d h o u r s

45
TIME 9 0 0 - 9 ISAM FIRST GROUP
^ , INTFRVIEWERS ^
SECOND GROUP
3 I N T E R V I E W E R S
>« >» H *
N 0 N I N T E R V I E W I N G
D I R E C T I O N
I N T E R V I E W I N G O I R E C T I O N
P A S S T H R O U G H F O R IS M I N U T E S
E V E R T V E H I C L E
F O R 15 M I N U T E S
IS I N T E R V I E W E D
TIME 9 15- 9 3 0 AM FIRST GROUP
: ?l 1̂ *̂ — ^
I N T E R V I E W I N G
D I R E C T I O N
S A M E I N T E R V I E W E R S
SECOND GROUP
" S A M E I N T E R V I E W E R S
HON I N T E R V I E W I N G
D I R E C T I O N
E V E R Y V E H I C L E
F O R I S M I N U T E S
_IS I N T E R V I E W E D
P A S S T H R O U G H F O R I S M I N U T E S
Figure 9. Typ ica l t i m e - c l u s t e r method o f i n t e r v i e w i n g .
stations with more than 6,000 vehicles per day two counters and two crew chiefs were assigned. The crew chiefs also acted as traffic directors at heavy stations, especially during hours of peak volumes. Each shift's daily operation for all stations was also directed by a regularly employed supervisor. Typical station interview parties are also indicated m Table 9.
The preparation of such a personnel plan permitted the hiring and assignment of personnel in a most efficient and economical manner. The entire survey was conducted m seven interviewing days by a total crew for all shifts of 30 men (includes interviewers, manual counter, crew chiefs, and supervisors).
SAMPLING PROCEDURE AT THE ROADSIDE
Three sampling methods were used during the Richmond survey: (1) quarter-hour samples (time clusters), (2) uniform samples (volumeclusters),and (3) combination of (1) and (2).
The method used at each station was predetermined. Only one method of sampling was used at a station so as to mmi-mize the confusion that might occur if sampling methods were changed hourly. Sampling was conducted, at all stations
that had daily traffic volumes greater than 1,200 vehicles, during all hours that traffic volumes were expected to exceed 30 vehicles per hour in either direction. Sampling was not done at other stations or during other hours because one mterviewer for each direction had to be present anyway and he could easily interview all traffic.
Time-Cluster Sampling
The time-cluster sample as used here refers to the selection of a sample of the total traffic volume on the basis of a selected time mterval. Any time interval could, of course, be chosen for this method. Every vehicle that arrives at the station during a 1-min., 5-min., 15-min., or other chosen time period is interviewed and then no vehicles are interviewed during a correspondmg time period, the length of which is dependent on the selected sampling rate. If, for instance, a sampling rate of 50 percent is chosen, then inter-viewmg is conducted for all those vehicles that arrive at the station durmg 50 percent of the total time. The time interval chosen for the Richmond survey was 15 min. During one 15-min. period all vehicles that arrived at the station from one direction were interviewed and no vehicles were mterviewed in that direction during the

46
next 15-min. period. This process was then repeated for all periods of the day. The interviewers, however, were not idle every other quarter hour, but interviewed traffic first for 15 min. in one direction and then for 15 min. in the other direction. A typical example of this procedure is shown in Figure 9.
Each station was arranged so that interviewing for both directions could be carried on from the same location. The station arrangement was exactly the same as if both directions would have been interviewed at the same time, except that the stop sign for the direction not being interviewed was covered during the periods when the traffic could proceed without stopping. On four-lane roads the interviewing was conducted in two lanes in each direction while on other roads, including three-lane roads, mterviewing was done in one lane only for each direction.
Adequate personnel were assigned each shift, with added personnel durmg peak hours, to interview all traffic in the one direction. At the end of one time period in one direction and the simultaneous beginning of a time period m the other direction, interviews were of necessity taken in both directions at the same time. It is necessary in the time cluster sample to interview all traffic that arrives during the time interval. This means that at the end of some time periods there will be
some vehicles that arrived before the end of the period that are waiting to be interviewed. They must be interviewed. In the other direction, there are vehicles arriving after the beginning of the next period which also must be interviewed. This problem was solved at Richmond by taking a portion of the interviewers from the direction being interviewed about 1 or 2 min. before the end of the period and placing them in position to interview the traffic from the other direction at the beginning of the next period. The other interviewers continued in the first direction until all vehicles that arrived before the end of the period had been interviewed. They then began interviewing in the other direction. This system operated smoothly at Richmond, and m every case the changeover was begun and completed in less than 5 min. (2 mm. prior and 3 min. after). Usually the total delay was only a matter of 2 or 3 min.
The crew chiefs, of which there was always one and, on heavy stations, two, m addition to their normal duties of interview collection and review and general supervision of the station were given the foUow-mg responsibilities: (1) direct traffic as necessary (primarily traffic not being interviewed but passed through the station and, on four-lane roads, that traffic being interviewed m more than one lane); (2) announce the end of one time period and
INTERVIEWING IN BOTH DIRECTIONS AT SAME TIME
F I R S T I N T E R V I E W C L U S T E R
2 I N T E R V I E W E R S
I I N T E R V I E W E R S
S E C O N D I N T E R V I E W C L U S T E R
C A R S 3 A N D 4 N O T I N T E R V I E W E D
-I C A R S 4 , 9 , A N D S N O T I N T E R V I E W E D
N O T E C L U S T E R S C H A N C E IN T H E T W O D I R E C T I O N S O N L Y
A T T H E B E G I N N I N G O F A N H O U R IF N U M B E R OF
I N T E R V I E W E R S IN T H E D I R E C T I O N S C H A N G E
Figure 10. Typ ica l volume-cluster method o f i n t e r v i e w i n g .

47
the beginning of the next; (3) indicate to the interviewers the first and last car to be interviewed m each time period; and (4) select the number of specific interviewers' to be taken from mterviewing in the one direction before the end of the time period to get m position to begin interviewing in the other direction (number dependent on traffic volumes in both directions).
The crew chief or chiefs also had the assistance of the supervisor during peak periods and at heavy stations. All personnel were instructed to adhere to exactly 15-min. intervals.
Volume-Cluster Sampling
The volume-cluster sampling consists of interviewing consecutive vehicles in clusters or groups of a predetermined number and then not interviewing a cluster or group of vehicles of a size that is dependent on the sampling rate. The size of the cluster to be interviewed could be one or more. A single cluster size was not used in the Richmond survey, but a cluster equal to the number of interviewers working in each direction was used. Cluster sizes or number of mterviewers, however, were not changed during any one hour of operation but only at the beginning of an hour, if necessary. Cluster sizes depended on the volume of traffic expected (from previous observations and counts) in any one direction and were not the same during many hours for the two directions of one station. The actual clusters used ranged from one (every other vehicle for a 50-percent sampling rate) to six. Since all Interviewing by this method was at a 50-percent rate, a cluster of vehicles equal in number to the cluster interviewed was passed through the station without being interviewed. Figure 10 i l lustrates this type of sampling.
The station arrangement and personnel to operate the station were the same as for time cluster sampling. Interviewers were placed in the two directions by the crew chief or chiefs as volumes in each direction warranted, except that any changes were made only at the beginnmg of an hour. The first interviewer in each direction and the crew chief during heavy hours determined the first vehicle in each cluster that was interviewed and directed those vehicles in the cluster that were not interviewed through the station. Each
interviewer made one and only one interview for each cluster that was interviewed. This helped to maintain an accurate check of those vehicles interviewed and, at the same time, distributed the responsibility of getting accurate cluster sizes. Al l personnel were instructed to adhere strictly to the predetermined cluster size with no exception, except in the case of emergency vehicles.
Combination Time - and -Volume - Cluster Samplmg
In order to test a method of obtaining a 25-percent sample, a combination of the time -and - volume - cluster methods was used. This method simply obtained a sample by interviewing volume clusters within a time period. In short, interviews were taken during 15-min. intervals in one direction only and then not taken in that direction for the next 15 min. Instead of interviewing every vehicle, however, within the 15-min. period, only one half of the traffic was interviewed. This was accomplished by interviewing a cluster of traffic equal in number to the number of interviewers and then not interviewing an equal-sized cluster.
The procedure of station operation was the same as that for the time-cluster operation, with the modification that it was necessary for the first interviewer or the crew chief to pass a cluster through without interviewing and then to select the first car in each cluster to be interviewed. Only a cluster size of four was used with this method. A separate crew was used for operation m the other direction during alternate 15-min. periods. This procedure eliminated a quick change of direction for interviewers at the end of one period and the beginning of another, and gave each group of mterviewers a short period of rest during each half hour.
APPRAISAL O F SAMPLING METHODS
The success of these various methods was established after the first day for each method. The taking of a predetermined sample not only proved to be practicable but, it appeared, actually improved the interviewing process. The general public understands that there is such a thing as sampling and that it certainly should be more economical to in-

48
T A B L E 10
A C T U A L SAMPLING R A T E S B Y STATION F O R P E R I O D T H A T SAMPLING WAS C O N D U C T E D
RICHMOND T R A F F I C S U R V E Y
50% Sampling Rate Planned
Number Number Actual Sampling Hours Manual Inter Sampling
Station Method Sampled Count viewed Rate
73 Vol . Cluster 24 10660 5304 49.7 74 100% Sample 16 290 290 100 0 78 T i m e Cluster 20 5091 2637 51 8 70 100% Sample 16 891 888 99 7 80 Vol . Cluster 18 3535 1811 51 2 82 Time Cluster 14 1237 611 49 4 83 100% Sample 16 413 410 99 3 84 Time Cluster 14 1439 725 50.4 86 T i m e Cluster 21 9954 5077 51 0
3 1486 365 2 4 . 6 » 80 100% Sample 16 476 475 99 8 00 Vol . Cluster 14 1944 967 49.7 02 Vol . Cluster 14 1856 924 49.8
*25% Sampling rate planned
vestigate only a fraction of the total than to interview the whole. The public generally does not recognize the details necessary to take a sample; but from responses and discussions with motorists at Richmond, they view with approval a sampling method they can understand. The time-cluster and volume - cluster methods of sampling offered them that evidence. They could "see" the methodical, business-like selection of vehicles in 15-min. cluster or in one to six vehicle clusters and then the release of an equal-sized cluster. Time and time again the vehicle operators expressed approval of, in their words, "the business-like manner" in which the interviewing was conducted.
The selection of a fraction of the total also seemed to salve the ire of many of those residents who made many trips through the station in one day. They knew they had a gambler's chance to get through without being interviewed. They were gratified whenever they "won" and accepted the mterview in a sportsmanlike manner when they "lost."
The actual selection of the sample did not prove difficult by any of the methods. Table 10 indicates the actual sample selected during those hours when sampling was actually used. Table 11 shows the hour-by-hour sampling rates for two stations. Variances in the time-cluster rates were expected because of the actual variances that occur for traffic volumes in 15-min. periods. The volume cluster, if all procedure had been exactly followed,
would be almost exactly 50 percent for every station. Miscounts of the number of vehicles interviewed, or of the cluster passed through, or of the total at the station, or the failure of vehicles to stop are causes for variations. These causes, as indicated by Tables 10 and 11, were evidently controlled quite well. The use of competent crew chiefs and head interviewers did much to minimize the possibility of miscounts.
Although no consideration was given to vehicle type in the selection of the sample, approximately 50 percent of each type of vehicle was obtained. Table 12 lists the interviewing rate by vehicle type for two interview stations.
The use of the crew chief as a traffic director resulted in a speedier movement of vehicles through the station. He directed the vehicles to be interviewed to position speedily and efficiently; this left the mterviewer more time to concentrate on taking the interview and properly re cording it. He also kept the traffic flow-mg smoothly when not being interviewed. It appeared that the methods operated best when, especially during peak hours, he was the one who counted the vehicles that were not interviewed or selected the first and last vehicles that were interviewed. A crew chief as a traffic di-
T A B L E 11 ACTUAL SAMPLING RATES BY HOUR AT TYPICAL STATIONS
FOR RICHMOND TRAFFIC SURVEY
_IS_ Sampling Method 5o!? Volume Cluster
Number Actual Number Actual Manual Inter Sampling Manual Inter Sampling
Hour Count viewed Rate Count viewed Rate 6-7 am 522 264 50 6 511 284 55 6 7-8 ajn 507 254 50 1 454 229 50 4 8-9 am 529 265 50 1 507 255 50 3 9-10 am 558 279 SO 0 492 269 54 7
10-11 am 554 280 50 5 540 273 50 6 11-12 N 545 266 48 8 600 300 50 0 12-1 pm 561 283 50 4 582 287 49 3 1-2 pm 548 264 48 2 616 306 49 7
2-3 pm 565 275 48 7 598 321 53 7 3-4 pm 663 331 49 9 684 366 53 5 4-5 pm 776 392 50 S 767 398 51 9 5-6 pm 706 351 49 7 717 372 51 9
6-7 pm 559 270 48 3 632 290 45 9 7-8 pm 605 299 49 4 594 294 49 5 8-9 pm 550 283 51 5 668 322 48 2 9-10 pm 446 216 48 4 574 134 23 3*
10-11 pm 365 181 49 6 492 124 25 2* 11-12 M 290 142 49 0 420 107 25 5* 12-1 am 200 99 49 5 242 128 52 9 1-2 am 131 65 49 6 189 101 53 4
2-3 am 106 50 47 2 114 54 47 4 3-4 am 121 61 50 4 105 61 58 1 4-5 am n o 58 52 7 122 68 55 7 5-6 am 152 76 50 0 220 99 45 0
505& Time Cluster
*25% Sampling rate planned

49
rector appeared to be a must. Most of his other duties, such as collection and review of the mterviews, were handled by the shift supervisor on heavy volume stations.
The use of a predetermined sample also minimized the confusion at interview stations. Each man knew what he was to do, who he was to interview, and who he was not to interview. Durmg peak hours there was no doubt or confusion as to how long the line of waiting traffic should get
T A B L E 12
SAMPLING RATES FOR T Y P I C A L STATIONS BY T Y P E O F V E H I C L E FOR RICHMOND T R A F F I C SURVEY
Station No 1 73 86 Sampling Method >0% VolumeCluster 50 % Time Cluster M O . 0 1 Hours
Sampled 24 21
Number Sam-Vehicle Manual Inter- pUng
Type Count viewed Rate
Number Sam-Manual Inter- plijig Count Viewed Rate
Passenger Cars 8455 4199 49 7 Light Trucks 700 340 48 6 Medium Trucks 480 258 S3 8 Heavy Trucks 970 479 49 4 Buses 64 28 43 8
7808 3975 50 9 465 247 53 1 514 263 SI 2
1104 560 50 7 63 32 SO 8
before releasmg some or how many to pass through without mterviewing, since the interviewers were instructed to take the predetermined sample according to the predetermined method at all times. During peak hours some back-up of traffic did occur. It appeared, however, that a line of traffic formed almost mstantly (such as would occur from a large group arriving simultaneously), then stayed about the same length for a short period, and gradually disappeared within 5 to 10 min. This cycle, durmg peak periods, then often repeated itself. The maximum delay for any vehicle under either method was slightly less than 5 min. This maximum delay occurred only during very short periods of time during peak hours on high volume stations (12,000 vehicles per day). Many times no delay except for interviewing occurred, and during most hours of the day the maximum delay was two to 3 min.
The volume-cluster method appeared to work most efficiently and smoothly on two-lane roads where four interviewers or less m each lane handled the volume of traffic. More interviewers than this resulted in a decrease in the number of interviews an interviewer took per hour because of the longer lapse between inter
views, due to passing a large cluster through the station. The interviewing efficiency did not become serious, however, unless more than six interviewers per direction were used, since the traffic director speeded the movement through the station. This method worked better than the time cluster on narrow roads with poor shoulders, because all interviewers were permanently positioned and required less necessary space in which to operate. On the three-lane road this method, with mterviewmg in one lane per direction, worked quite well with as many as six interviewers on line in one direction.
The time-cluster method also worked best where the number of interviewers was four or less per interviewmg lane. With this method, since all vehicles were taken for a selected time period, speed of interviewmg was most important m order to prevent long lines of waiting traffic. This method required a little more working space for the interviewers, since they were required to change position every time period and since one direction of traffic was moving freely through the station. A little spare space in the center of the highway was advisable for obvious safety reasons. On the four-lane highway, with two interviewing lanes for each direction, this method worked excellently. A short time before the end of the time period, the mside lane was closed to mterviewing and the interviewers on that lane got into position to mterview in the outside lane of the other direction. After all required vehicles were interviewed in the first direction, the remainder of the interviewers there transferred to the inside lane of the second direction. Traffic in the direction that was not interviewed passed through the station in the outside lane. This made it unnecessary for interviewers to cross lanes of moving traffic. A careful plan of action for the short period at the end of one time period and the beginning of the next was extremely important for the time-cluster method in order to minimize confusion and to select all the proper vehicles in the sample.
A time period of any length could, of course, be chosen. The 15-min. period was selected for this survey for at least two reasons:
1. The original study of the Lebanon and Kokomo data was made for 15-min.

50
time clusters, since the field data were separated only for each quarter hour. This time period, mcidentally, proved to be the most accurate of all the methods studied with this data.
2. A shorter time period would have necessitated more frequent directional changes of mterviewmg. This has definite disadvantages as it increases chance of confusion and also has the statistical objection of increasing the number of times that the selection of the first and last vehicle is left up to an individual who may err as to its proper selection.
The selection of a shorter time period, however, might reduce the length of any waiting traffic lines. It appears that several studies of a shorter time cluster should be made.
It must be admitted that time- (and possibly volume-) cluster samples would have biases if a succession of cars would all have the same origm-destmation. If such movements were more likely to happen at a certain time than at another, a bias might occur if interviewing always began at a certain hour on the hour. One way to try to minimize such biases would be to leave to chance (such asspm a needle around the clock) when the interviewmg should begin. However, biases eliminated in some origin-destinations might be put into others in this way. It appears, therefore, that on the average starting at the beginning of an hour would be as good as could be done. From a practical point of view, it certainly would be best.
The combination time - and - volume -
cluster sample, although only used for 3 h r . , appeared to operate smoothly and efficiently. A 25-percent sample was taken without delaying traffic for long periods and with a small group of interviewers who obtained an average number of interviews per hour. Under the volume-cluster plan, the number of interviews per interviewer for this rate would probably be less because of the necessarily long waits between interviews while large clusters of traffic not being interviewed passed through the station. On the other hand, the use of the time-cluster method only would necessitate periods of time when the interviewers would not work at all . The use of the two methods together minimizes these disadvantages, but at the same time makes a changeover to another direction at the end of a time period difficult. A solution to this problem might be to allow a short time lapse between periods when no interviews for either direction would be taken. This, of course, would reduce the sampling rate and would have to be considered in ob-taming the desired size sample.
It must be emphasized that thorough planning is necessary to insure proper operation of any of these sampling plans. The required number of interviewers must be determined from presurvey counts and then that number selected and thoroughly instructed. Competent crew chiefs and head mterviewers are also a necessity. Above all , every one connected with the operation must realize the importance and understand the selection of the sample.
CONCLUSIONS
1. If the traffic passing through a roadside interview survey station is sampled m clusters, on either a time or volume basis, then, for the numerous estimates of O. D. trip frequencies associated with this traffic flow, the overall sampling variation is similar to that given by the theory of random sampling. When a delineation is made among the different types of cluster samples, experimental results from two independent surveys are in general accord with the correspondmg sampling theory derived from basic assumptions on the nature of the sampled universes.
2. The expected percentage sampling error, CV(T), for an estimate, f , of a true O.D. frequency, T , can be expressed by the relation
CV(f ) = (K/T) % where K depends primarily upon the samplmg rate, and, to a lesser degree, upon the method of sampling. Empirical values of K were obtained in this study and may be used to estimate the magnitude of sampling errors and their limits in probability. Conversely, the results can be used to select a sampling plan when a specified amount of sampling variation is to be a l lowed for a particular origin-destination survey.
3. It is evident that the use of a predetermined sampling process is both practicable and beneficial. A 50-percent sample was obtained with a mmimum of confusion in a business-like manner that was recognized and appreciated by the partici-

51
pating vehicle operators and the community. 4. The sampling procedure promoted
efficient operation of the interviewing station by minimizing confusion, and assured the selection of a sample whose chance variation could be appraised.
5. The time-cluster method performed more smoothly than the volume method on roads where traffic volumes could be handled by three or four interviewers per mterviewing lane and where adequate space for safe movement of interviewers between interview lanes was available.
6. The volume-cluster method operated more efficiently than the time cluster method on roads where traffic volumes required five or SIX interviewers or where roads and shoulders were narrow.
7. Either method operated well where only one or two interviewers were required.
8. The combination time-and-volume-cluster method appears to have possibilities where small samples (25 percent or less) are adequate.
9. A great deal of thought and study is necessary to determine the sampling accuracy which IS necessary for origin -destination studies. Specifically, the question
that requires study is: What is the allowable average error (or a certain probability error) for various ongm-and-desti-nation, rectangular-table, cell volumes? It may be that an average error of 10 percent for cell volumes of 100 may be more accurate than generally necessary.
10. Thorough planning of station operation and the assignment of adequate and competent personnel are required. This should include presurvey hourly traffic counts and excellent instruction of personnel.
11. The use of some sampling procedure not only will reduce the number of personnel required to conduct the field work but will also reduce the number of cards to be coded, key punched, and tabulated. Such reduction probably will be in direct proportion to the number of interviews taken. This not only reduces the cost of O.D. surveys but reduces the time necessary to complete such a study.
12. A number of other studies on similar or other sampling methods as well as studies on necessary size of sample would prove of benefit to the conduct of future origm-and-destinatiOR surveys.
ACKNOWLEDGEMENTS
The material presented in this paper was made possible by the cooperation of many individuals. The authors are especially indebted to K. B. Woods and A. K. Branhamof the Joint Highway Research Project, Purdue University, for their constant encouragement and helpful guidance: to A. D. May, J r . , formerly of the Joint Highway Research Project, for his interest and assistance in
Coffman, Bureau of Public Roads, for his invaluable advice and suggestions during the practical application study. Special acknowledgement is also given to many departments of the State Highway Commission of Indiana for their assistance and cooperation. To the many individuals who assisted with the preparation of the data and the report, the authors also wish to ex-
the initial phases of the study: and to S. F . press their personal gratitude.
R E F E R E N C E S
1. Deming, W. E . , Some Theory of Sampling, J . Wiley and Sons Inc. , New York (1950).
2. Kennery, J . F . and Keeping, E . S . , Mathematics of Statistics, Part Two, D. Van Nostrand Co. , Inc. (1951).
3. Michael, H. L . , "Traffic and Engineering Report of the Before and After Surveys of the Kokomo By-Pass", Thesis submitted to Purdue University in partial fulfillment of the requirements for the
neering (1951). 4, Miller, 1., "The Application of
Sampling Techniques to Highway Surveys", Thesis submitted to Purdue University in partial fulfillment of the requirements for the degree of Master of Science (1952).
5. Manual of Procedures for the Met-^tudies, ropolitan Area Traffic
Roads Administration (1946). 6. Manual of Traffic Engineering
Studies, Association of Casualty and Surety degree of Master of Science in Civil Engi- Co. (1945).