Allosteric Signaling in the Biotin Repressor Occurs via Local Folding Coupled to Global Dampening of...
22
Allosteric Signaling in the Biotin Repressor Occurs via Local Folding Coupled to Global Dampening of Protein Dynamics Olli Laine, Emily D. Streaker, Maryam Nabavi, Catherine C. Fenselau, and Dorothy Beckett * Department of Chemistry and Biochemistry and Center for Biological Structure and Organization, College of Chemical and Life Sciences, University of Maryland, College Park, MD 20742 Summary The biotin repressor is an allosterically regulated site-specific DNA binding protein. Binding of the small ligand, bio-5'-AMP, activates repressor dimerization, which is a prerequisite to DNA binding. Multiple disorder-to-order transitions, some of which are known to be important for the functional allosteric response, occur in the vicinity of the ligand binding site concomitant with effector binding to the repressor monomer. In this work the extent to which these local changes are coupled to additional changes in the structure/dynamics of the repressor was investigated using Hydrogen- Deuterium exchange coupled to Mass Spectrometry. Measurements were performed on the apo- protein and on complexes of the protein bound to four different effectors that elicit a range of thermodynamic responses in the repressor. Global exchange measurements indicate that binding of any effector to the intact protein is accompanied by protection from exchange. Mass spectrometric analysis of pepsin-cleavage products generated from the exchanged complexes reveals that the protection is distributed throughout the protein. Furthermore, the magnitude of the level of protection in each peptide from H-D exchange correlates with the magnitude of the functional allosteric response elicited by a ligand. These results indicate that local structural changes in the binding site that occur concomitant with effector binding nucleate global dampening of dynamics. Moreover, the magnitude of dampening of repressor dynamics tracks with magnitude of the functional response to effector binding. Keywords Allostery; HDX-MS; MALDI-ToF MS; biotin repressor Introduction Thermodynamic linkage or cooperativity is ubiquitous in biology and is integral to regulation of metabolism, gene transcription, and signal transduction. Despite its widespread nature, the physical-chemical basis of cooperativity is not yet understood. Classic work focused on modeling cooperative behavior evidenced in binding isotherms and kinetic analysis using the two-state allosteric MWC (1) or the stepwise Koshland Nemethy and Filmer (2) formalisms. These types of analyses provide low-resolution, mechanical views of cooperativity. However, elucidation of the mechanism of cooperativity requires determination of how a signal that impinges on one region of a biological macromolecule or complex is transmitted throughout *Corresponding author: Contact by e-mail at [email protected], telphone: 301-405-1812, fax: 301-314-9121. Publisher's Disclaimer: This is a PDF file of an unedited manuscript that has been accepted for publication. As a service to our customers we are providing this early version of the manuscript. The manuscript will undergo copyediting, typesetting, and review of the resulting proof before it is published in its final citable form. Please note that during the production process errors may be discovered which could affect the content, and all legal disclaimers that apply to the journal pertain. NIH Public Access Author Manuscript J Mol Biol. Author manuscript; available in PMC 2009 August 31. Published in final edited form as: J Mol Biol. 2008 August 1; 381(1): 89–101. doi:10.1016/j.jmb.2008.05.018. NIH-PA Author Manuscript NIH-PA Author Manuscript NIH-PA Author Manuscript
-
Upload
independent -
Category
Documents
-
view
2 -
download
0
Transcript of Allosteric Signaling in the Biotin Repressor Occurs via Local Folding Coupled to Global Dampening of...

Allosteric Signaling in the Biotin Repressor Occurs via LocalFolding Coupled to Global Dampening of Protein Dynamics
Olli Laine, Emily D. Streaker, Maryam Nabavi, Catherine C. Fenselau, and Dorothy Beckett*Department of Chemistry and Biochemistry and Center for Biological Structure and Organization,College of Chemical and Life Sciences, University of Maryland, College Park, MD 20742
SummaryThe biotin repressor is an allosterically regulated site-specific DNA binding protein. Binding of thesmall ligand, bio-5'-AMP, activates repressor dimerization, which is a prerequisite to DNA binding.Multiple disorder-to-order transitions, some of which are known to be important for the functionalallosteric response, occur in the vicinity of the ligand binding site concomitant with effector bindingto the repressor monomer. In this work the extent to which these local changes are coupled toadditional changes in the structure/dynamics of the repressor was investigated using Hydrogen-Deuterium exchange coupled to Mass Spectrometry. Measurements were performed on the apo-protein and on complexes of the protein bound to four different effectors that elicit a range ofthermodynamic responses in the repressor. Global exchange measurements indicate that binding ofany effector to the intact protein is accompanied by protection from exchange. Mass spectrometricanalysis of pepsin-cleavage products generated from the exchanged complexes reveals that theprotection is distributed throughout the protein. Furthermore, the magnitude of the level of protectionin each peptide from H-D exchange correlates with the magnitude of the functional allosteric responseelicited by a ligand. These results indicate that local structural changes in the binding site that occurconcomitant with effector binding nucleate global dampening of dynamics. Moreover, the magnitudeof dampening of repressor dynamics tracks with magnitude of the functional response to effectorbinding.
KeywordsAllostery; HDX-MS; MALDI-ToF MS; biotin repressor
IntroductionThermodynamic linkage or cooperativity is ubiquitous in biology and is integral to regulationof metabolism, gene transcription, and signal transduction. Despite its widespread nature, thephysical-chemical basis of cooperativity is not yet understood. Classic work focused onmodeling cooperative behavior evidenced in binding isotherms and kinetic analysis using thetwo-state allosteric MWC (1) or the stepwise Koshland Nemethy and Filmer (2) formalisms.These types of analyses provide low-resolution, mechanical views of cooperativity. However,elucidation of the mechanism of cooperativity requires determination of how a signal thatimpinges on one region of a biological macromolecule or complex is transmitted throughout
*Corresponding author: Contact by e-mail at [email protected], telphone: 301-405-1812, fax: 301-314-9121.Publisher's Disclaimer: This is a PDF file of an unedited manuscript that has been accepted for publication. As a service to our customerswe are providing this early version of the manuscript. The manuscript will undergo copyediting, typesetting, and review of the resultingproof before it is published in its final citable form. Please note that during the production process errors may be discovered which couldaffect the content, and all legal disclaimers that apply to the journal pertain.
NIH Public AccessAuthor ManuscriptJ Mol Biol. Author manuscript; available in PMC 2009 August 31.
Published in final edited form as:J Mol Biol. 2008 August 1; 381(1): 89–101. doi:10.1016/j.jmb.2008.05.018.
NIH
-PA Author Manuscript
NIH
-PA Author Manuscript
NIH
-PA Author Manuscript
the system. Recent development of experimental tools including dynamic methods in NMRspectroscopy, hydrogen-deuterium exchange detected by either mass spectrometry or NMRspectroscopy and computational tools have provided insight into structural and dynamicchanges that accompany energy transduction in biological macromolecules (3). Results of thesestudies have prompted development of models of signaling the extremes of which are thosethat posit defined pathways of allosteric communication (3,4) and global models that supportdistributed signaling that occurs through changes in the dynamics of the cooperativemacromolecule (5).
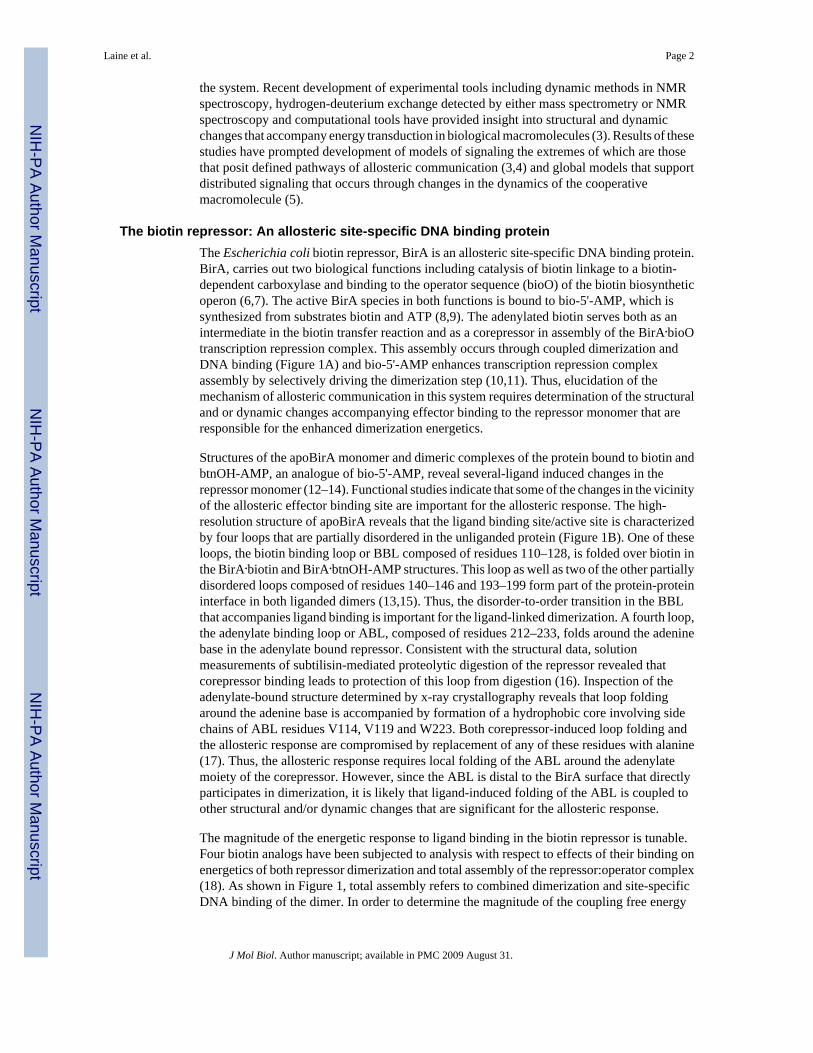
The biotin repressor: An allosteric site-specific DNA binding proteinThe Escherichia coli biotin repressor, BirA is an allosteric site-specific DNA binding protein.BirA, carries out two biological functions including catalysis of biotin linkage to a biotin-dependent carboxylase and binding to the operator sequence (bioO) of the biotin biosyntheticoperon (6,7). The active BirA species in both functions is bound to bio-5'-AMP, which issynthesized from substrates biotin and ATP (8,9). The adenylated biotin serves both as anintermediate in the biotin transfer reaction and as a corepressor in assembly of the BirA.bioOtranscription repression complex. This assembly occurs through coupled dimerization andDNA binding (Figure 1A) and bio-5'-AMP enhances transcription repression complexassembly by selectively driving the dimerization step (10,11). Thus, elucidation of themechanism of allosteric communication in this system requires determination of the structuraland or dynamic changes accompanying effector binding to the repressor monomer that areresponsible for the enhanced dimerization energetics.
Structures of the apoBirA monomer and dimeric complexes of the protein bound to biotin andbtnOH-AMP, an analogue of bio-5'-AMP, reveal several-ligand induced changes in therepressor monomer (12–14). Functional studies indicate that some of the changes in the vicinityof the allosteric effector binding site are important for the allosteric response. The high-resolution structure of apoBirA reveals that the ligand binding site/active site is characterizedby four loops that are partially disordered in the unliganded protein (Figure 1B). One of theseloops, the biotin binding loop or BBL composed of residues 110–128, is folded over biotin inthe BirA.biotin and BirA.btnOH-AMP structures. This loop as well as two of the other partiallydisordered loops composed of residues 140–146 and 193–199 form part of the protein-proteininterface in both liganded dimers (13,15). Thus, the disorder-to-order transition in the BBLthat accompanies ligand binding is important for the ligand-linked dimerization. A fourth loop,the adenylate binding loop or ABL, composed of residues 212–233, folds around the adeninebase in the adenylate bound repressor. Consistent with the structural data, solutionmeasurements of subtilisin-mediated proteolytic digestion of the repressor revealed thatcorepressor binding leads to protection of this loop from digestion (16). Inspection of theadenylate-bound structure determined by x-ray crystallography reveals that loop foldingaround the adenine base is accompanied by formation of a hydrophobic core involving sidechains of ABL residues V114, V119 and W223. Both corepressor-induced loop folding andthe allosteric response are compromised by replacement of any of these residues with alanine(17). Thus, the allosteric response requires local folding of the ABL around the adenylatemoiety of the corepressor. However, since the ABL is distal to the BirA surface that directlyparticipates in dimerization, it is likely that ligand-induced folding of the ABL is coupled toother structural and/or dynamic changes that are significant for the allosteric response.
The magnitude of the energetic response to ligand binding in the biotin repressor is tunable.Four biotin analogs have been subjected to analysis with respect to effects of their binding onenergetics of both repressor dimerization and total assembly of the repressor:operator complex(18). As shown in Figure 1, total assembly refers to combined dimerization and site-specificDNA binding of the dimer. In order to determine the magnitude of the coupling free energy
Laine et al. Page 2
J Mol Biol. Author manuscript; available in PMC 2009 August 31.
NIH
-PA Author Manuscript
NIH
-PA Author Manuscript
NIH
-PA Author Manuscript

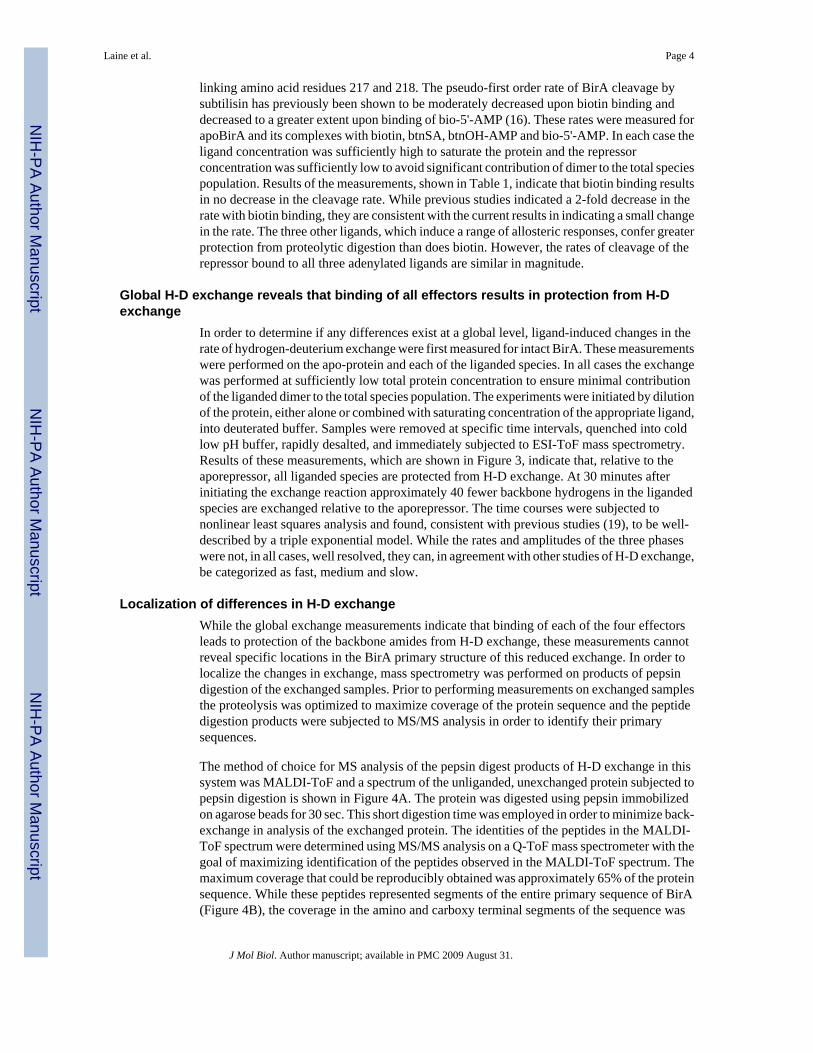
associated with each ligand, the free energies of dimerization and total assembly werecompared for the unliganded repressor and the repressor bound to each of the four ligands(Figure 2). Results of these studies allowed classification of two ligands, biotin and biotinoyl-sulfamoyl adenylate as weak effectors and biotinol-5'-AMP and the physiological effector,bio-5'-AMP, as strong. Thus, the presence of the adenine moiety, which should serve as anucleus for folding of the adenylate binding loop, is not sufficient to elicit the maximumenhancement of dimerization energetics. A notable feature of the thermodynamic data is thatfor the two weak effectors the coupling free energy measured for dimerization is not equal tothat measured for the total assembly process. Moreover, this coupling free energy was morefavorable for total assembly than for dimerization; suggesting the occurrence of ligand-linkedchanges in the monomer that promote DNA binding but not, necessarily, dimerization.
As discussed above, elucidation of the molecular basis of allosteric activation of BirA requiresdetermination of the structural and dynamic changes that occur in the repressor monomer inresponse to effector binding. The linkage between effector binding to the monomer anddimerization renders use of either x-ray crystallography or NMR spectroscopy inappropriatefor addressing this question in this particular system. Indeed, even the complex of BirA boundto the weakest effector, biotin, crystallizes as a dimer, presumably because of the high effectiveconcentration associated with crystallization (13). NMR spectroscopy is problematic for thesame reason. Hydrogen-deuterium exchange coupled to mass spectrometric (HDX-MS)analysis provides an alternative approach to determining ligand-linked structural and/ordynamic changes in the BirA monomer (19,20). This method has proven powerful in localizingchanges in the levels and rates of peptide backbone H-D exchange in proteins as they formcomplexes and it has been successfully applied to analyzing the allosteric response in severalprotein systems (21–24). Its major advantage over other techniques for analyzing the allostericresponse in BirA is that the exchange can be performed at concentrations at which even theliganded forms of BirA are predominantly monomeric.
The availability of four allosteric effectors that yield a range of functional responses in BirAprovides an opportunity to investigate structural/dynamic correlates to the allosteric response.In this work partial proteolysis and H-D exchange coupled to mass spectrometry are combinedto investigate ligand-linked changes in the BirA monomer. Results of partial proteolyticmeasurements reveal no correlation between the rate of cleavage of the ABL and the magnitudeof the allosteric response. Measurement of global H-D exchange on the unliganded andliganded intact BirA using ESI-ToF MS indicate that in all cases ligand binding results inprotection of the protein backbone from H-D exchange. MALDI-ToF MS analysis of pepsindigestion products of repressor exchanged in the absence and presence of saturating ligand wasperformed to localize the regions that changed in their levels of exchange at long time frames.These measurements reveal that ligand binding results, for the most part, in protection of localregions from exchange. Moreover, the protection extends from the N-terminal DNA bindingdomain to the C-terminal domain of the repressor. Furthermore, the extent of protection, interms of number of backbone amide hydrogens exchanged, is greatest for the physiologicaleffector, bio-5'-AMP. These results support a distributive model for transmission of theallosteric response in BirA in which local folding in the ligand binding site triggers changesin the dynamics of the entire protein.
ResultsIn the adenylate-bound structure of BirA the adenylate binding loop is folded around theadenine ring of the ligand and this folding contributes to the allosteric response. Therelationship between the loop conformation, as probed by subtilisin-mediated partialproteolysis, and the allosteric response associated with binding of each of the four effectorswas investigated. Initial cleavage of the repressor with subtilisin occurs at the peptide bond
Laine et al. Page 3
J Mol Biol. Author manuscript; available in PMC 2009 August 31.
NIH
-PA Author Manuscript
NIH
-PA Author Manuscript
NIH
-PA Author Manuscript
linking amino acid residues 217 and 218. The pseudo-first order rate of BirA cleavage bysubtilisin has previously been shown to be moderately decreased upon biotin binding anddecreased to a greater extent upon binding of bio-5'-AMP (16). These rates were measured forapoBirA and its complexes with biotin, btnSA, btnOH-AMP and bio-5'-AMP. In each case theligand concentration was sufficiently high to saturate the protein and the repressorconcentration was sufficiently low to avoid significant contribution of dimer to the total speciespopulation. Results of the measurements, shown in Table 1, indicate that biotin binding resultsin no decrease in the cleavage rate. While previous studies indicated a 2-fold decrease in therate with biotin binding, they are consistent with the current results in indicating a small changein the rate. The three other ligands, which induce a range of allosteric responses, confer greaterprotection from proteolytic digestion than does biotin. However, the rates of cleavage of therepressor bound to all three adenylated ligands are similar in magnitude.
Global H-D exchange reveals that binding of all effectors results in protection from H-Dexchange
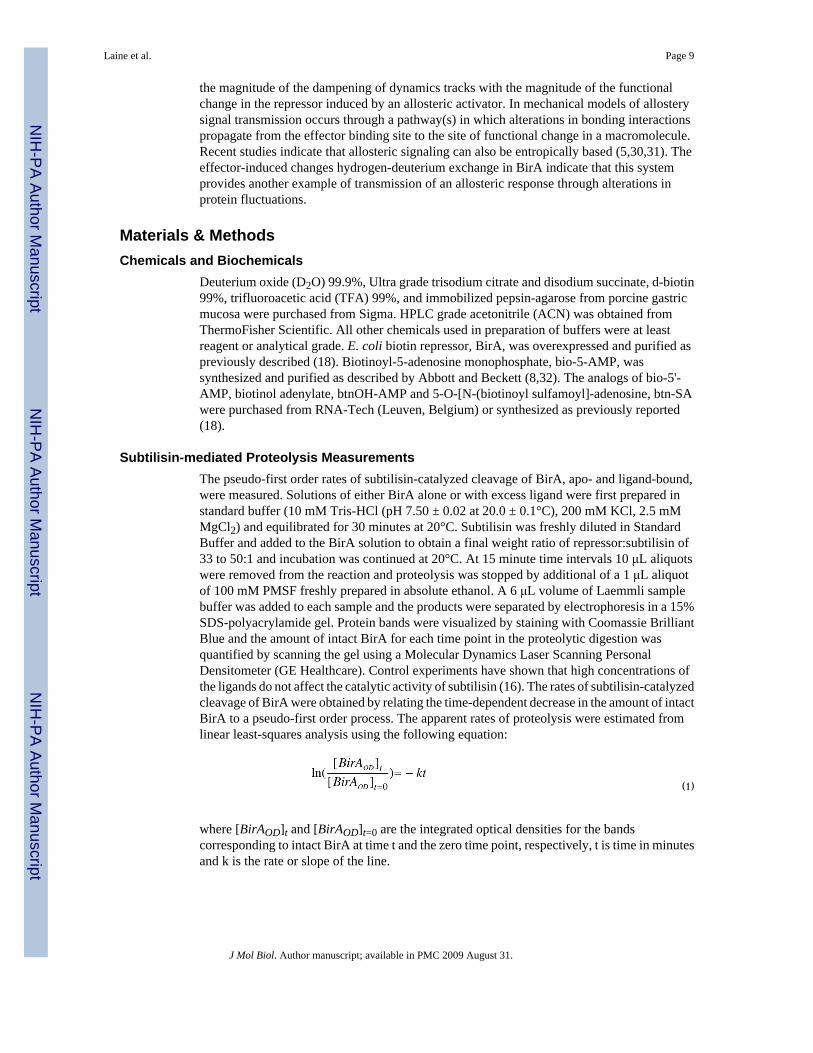
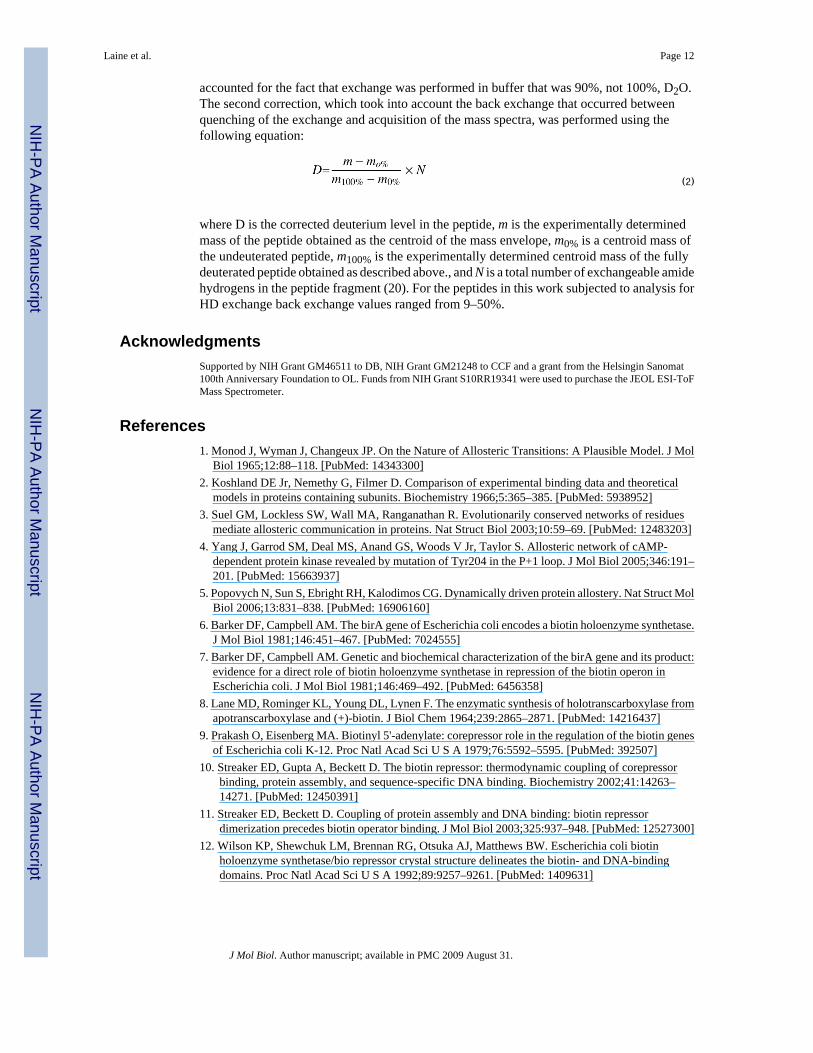
In order to determine if any differences exist at a global level, ligand-induced changes in therate of hydrogen-deuterium exchange were first measured for intact BirA. These measurementswere performed on the apo-protein and each of the liganded species. In all cases the exchangewas performed at sufficiently low total protein concentration to ensure minimal contributionof the liganded dimer to the total species population. The experiments were initiated by dilutionof the protein, either alone or combined with saturating concentration of the appropriate ligand,into deuterated buffer. Samples were removed at specific time intervals, quenched into coldlow pH buffer, rapidly desalted, and immediately subjected to ESI-ToF mass spectrometry.Results of these measurements, which are shown in Figure 3, indicate that, relative to theaporepressor, all liganded species are protected from H-D exchange. At 30 minutes afterinitiating the exchange reaction approximately 40 fewer backbone hydrogens in the ligandedspecies are exchanged relative to the aporepressor. The time courses were subjected tononlinear least squares analysis and found, consistent with previous studies (19), to be well-described by a triple exponential model. While the rates and amplitudes of the three phaseswere not, in all cases, well resolved, they can, in agreement with other studies of H-D exchange,be categorized as fast, medium and slow.
Localization of differences in H-D exchangeWhile the global exchange measurements indicate that binding of each of the four effectorsleads to protection of the backbone amides from H-D exchange, these measurements cannotreveal specific locations in the BirA primary structure of this reduced exchange. In order tolocalize the changes in exchange, mass spectrometry was performed on products of pepsindigestion of the exchanged samples. Prior to performing measurements on exchanged samplesthe proteolysis was optimized to maximize coverage of the protein sequence and the peptidedigestion products were subjected to MS/MS analysis in order to identify their primarysequences.
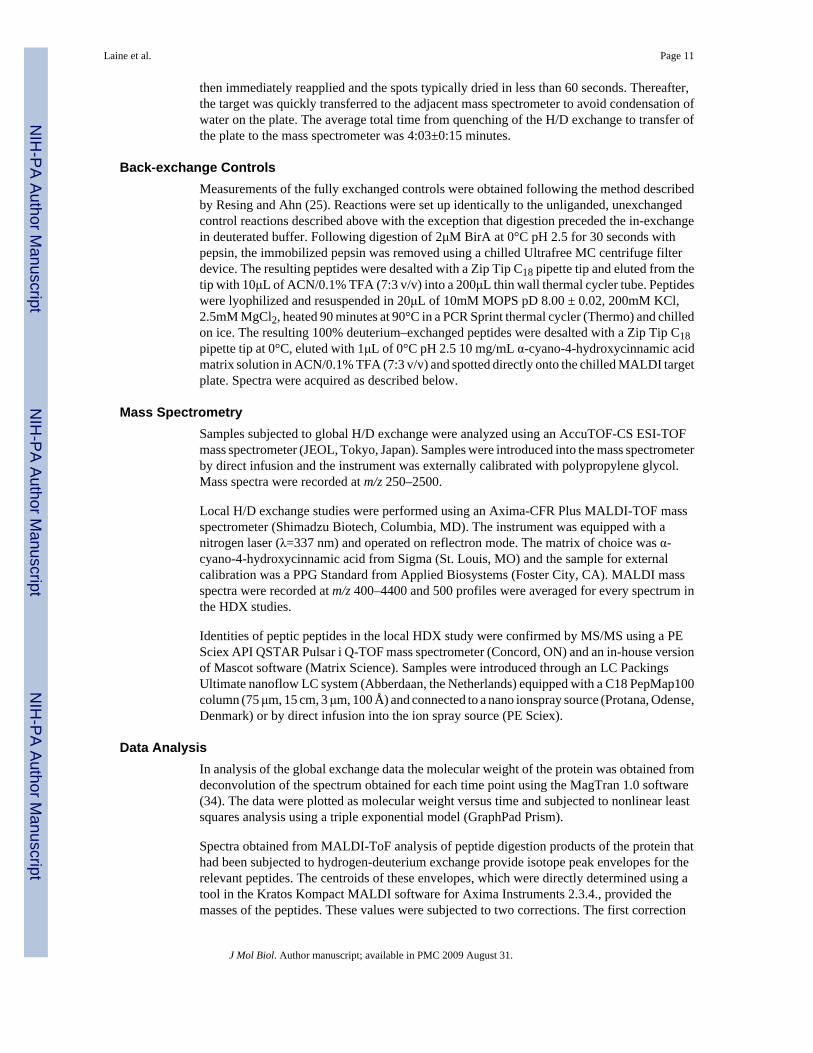
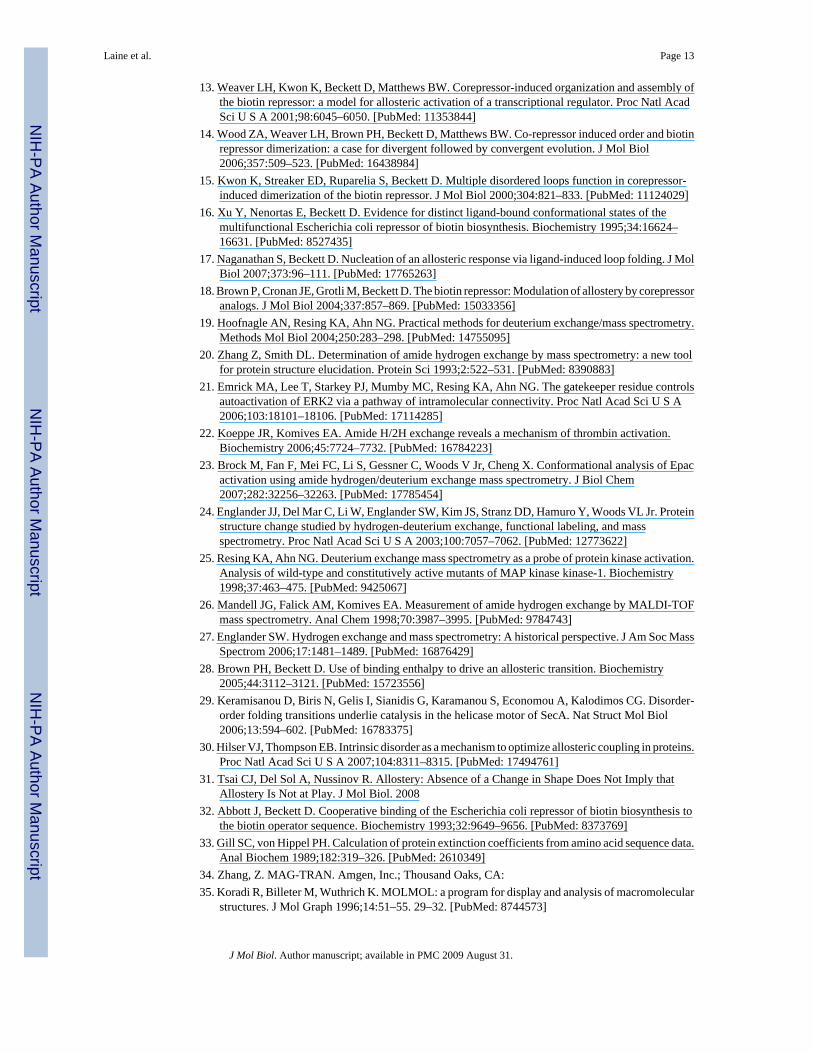
The method of choice for MS analysis of the pepsin digest products of H-D exchange in thissystem was MALDI-ToF and a spectrum of the unliganded, unexchanged protein subjected topepsin digestion is shown in Figure 4A. The protein was digested using pepsin immobilizedon agarose beads for 30 sec. This short digestion time was employed in order to minimize back-exchange in analysis of the exchanged protein. The identities of the peptides in the MALDI-ToF spectrum were determined using MS/MS analysis on a Q-ToF mass spectrometer with thegoal of maximizing identification of the peptides observed in the MALDI-ToF spectrum. Themaximum coverage that could be reproducibly obtained was approximately 65% of the proteinsequence. While these peptides represented segments of the entire primary sequence of BirA(Figure 4B), the coverage in the amino and carboxy terminal segments of the sequence was
Laine et al. Page 4
J Mol Biol. Author manuscript; available in PMC 2009 August 31.
NIH
-PA Author Manuscript
NIH
-PA Author Manuscript
NIH
-PA Author Manuscript
better than that obtained for the region that forms the central domain in the 3-dimensionalstructure.
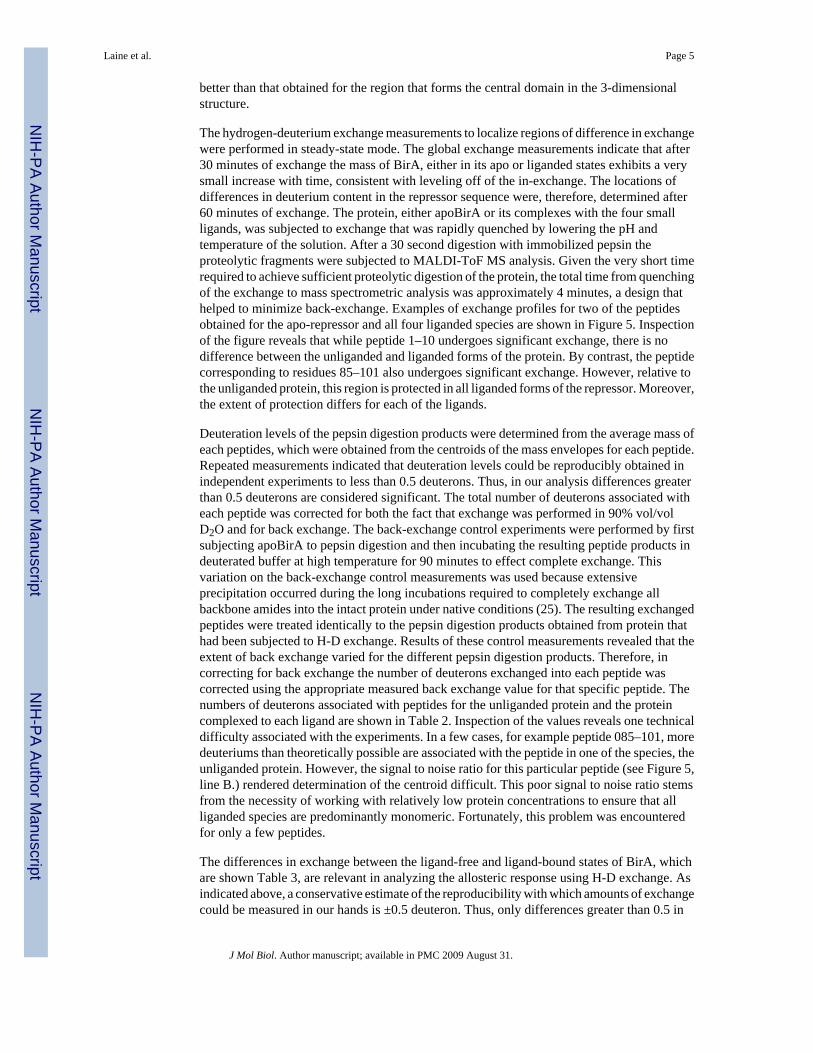
The hydrogen-deuterium exchange measurements to localize regions of difference in exchangewere performed in steady-state mode. The global exchange measurements indicate that after30 minutes of exchange the mass of BirA, either in its apo or liganded states exhibits a verysmall increase with time, consistent with leveling off of the in-exchange. The locations ofdifferences in deuterium content in the repressor sequence were, therefore, determined after60 minutes of exchange. The protein, either apoBirA or its complexes with the four smallligands, was subjected to exchange that was rapidly quenched by lowering the pH andtemperature of the solution. After a 30 second digestion with immobilized pepsin theproteolytic fragments were subjected to MALDI-ToF MS analysis. Given the very short timerequired to achieve sufficient proteolytic digestion of the protein, the total time from quenchingof the exchange to mass spectrometric analysis was approximately 4 minutes, a design thathelped to minimize back-exchange. Examples of exchange profiles for two of the peptidesobtained for the apo-repressor and all four liganded species are shown in Figure 5. Inspectionof the figure reveals that while peptide 1–10 undergoes significant exchange, there is nodifference between the unliganded and liganded forms of the protein. By contrast, the peptidecorresponding to residues 85–101 also undergoes significant exchange. However, relative tothe unliganded protein, this region is protected in all liganded forms of the repressor. Moreover,the extent of protection differs for each of the ligands.
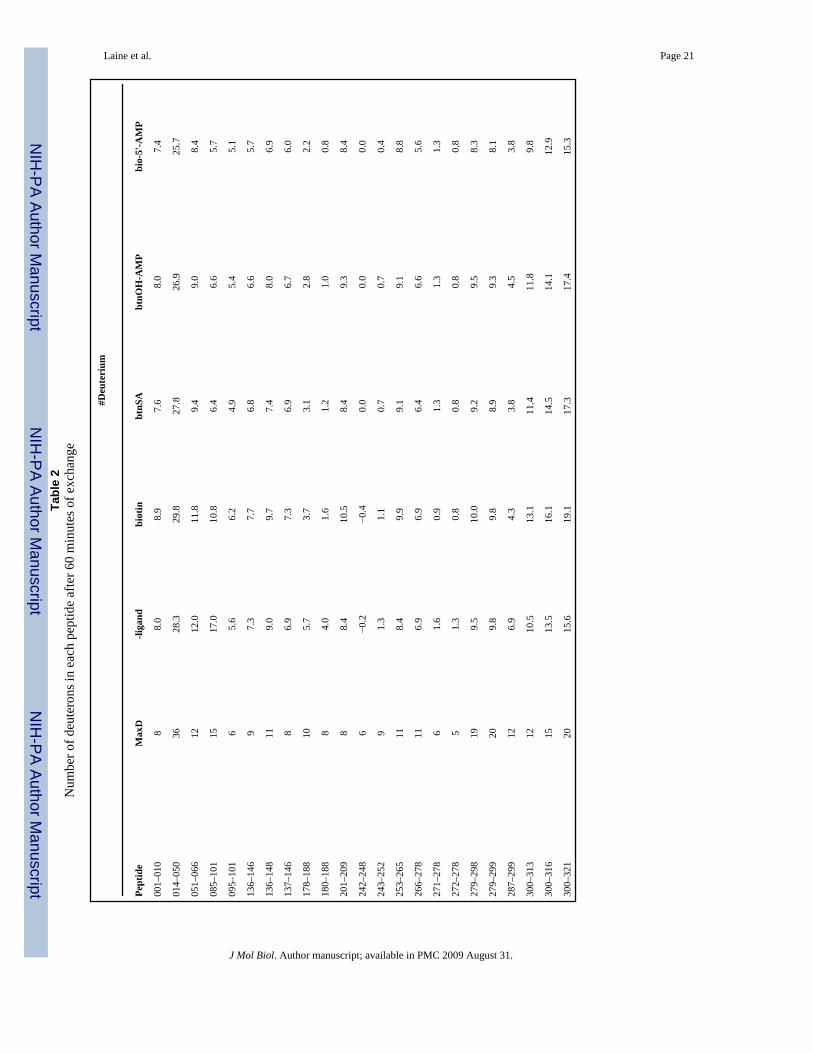
Deuteration levels of the pepsin digestion products were determined from the average mass ofeach peptides, which were obtained from the centroids of the mass envelopes for each peptide.Repeated measurements indicated that deuteration levels could be reproducibly obtained inindependent experiments to less than 0.5 deuterons. Thus, in our analysis differences greaterthan 0.5 deuterons are considered significant. The total number of deuterons associated witheach peptide was corrected for both the fact that exchange was performed in 90% vol/volD2O and for back exchange. The back-exchange control experiments were performed by firstsubjecting apoBirA to pepsin digestion and then incubating the resulting peptide products indeuterated buffer at high temperature for 90 minutes to effect complete exchange. Thisvariation on the back-exchange control measurements was used because extensiveprecipitation occurred during the long incubations required to completely exchange allbackbone amides into the intact protein under native conditions (25). The resulting exchangedpeptides were treated identically to the pepsin digestion products obtained from protein thathad been subjected to H-D exchange. Results of these control measurements revealed that theextent of back exchange varied for the different pepsin digestion products. Therefore, incorrecting for back exchange the number of deuterons exchanged into each peptide wascorrected using the appropriate measured back exchange value for that specific peptide. Thenumbers of deuterons associated with peptides for the unliganded protein and the proteincomplexed to each ligand are shown in Table 2. Inspection of the values reveals one technicaldifficulty associated with the experiments. In a few cases, for example peptide 085–101, moredeuteriums than theoretically possible are associated with the peptide in one of the species, theunliganded protein. However, the signal to noise ratio for this particular peptide (see Figure 5,line B.) rendered determination of the centroid difficult. This poor signal to noise ratio stemsfrom the necessity of working with relatively low protein concentrations to ensure that allliganded species are predominantly monomeric. Fortunately, this problem was encounteredfor only a few peptides.
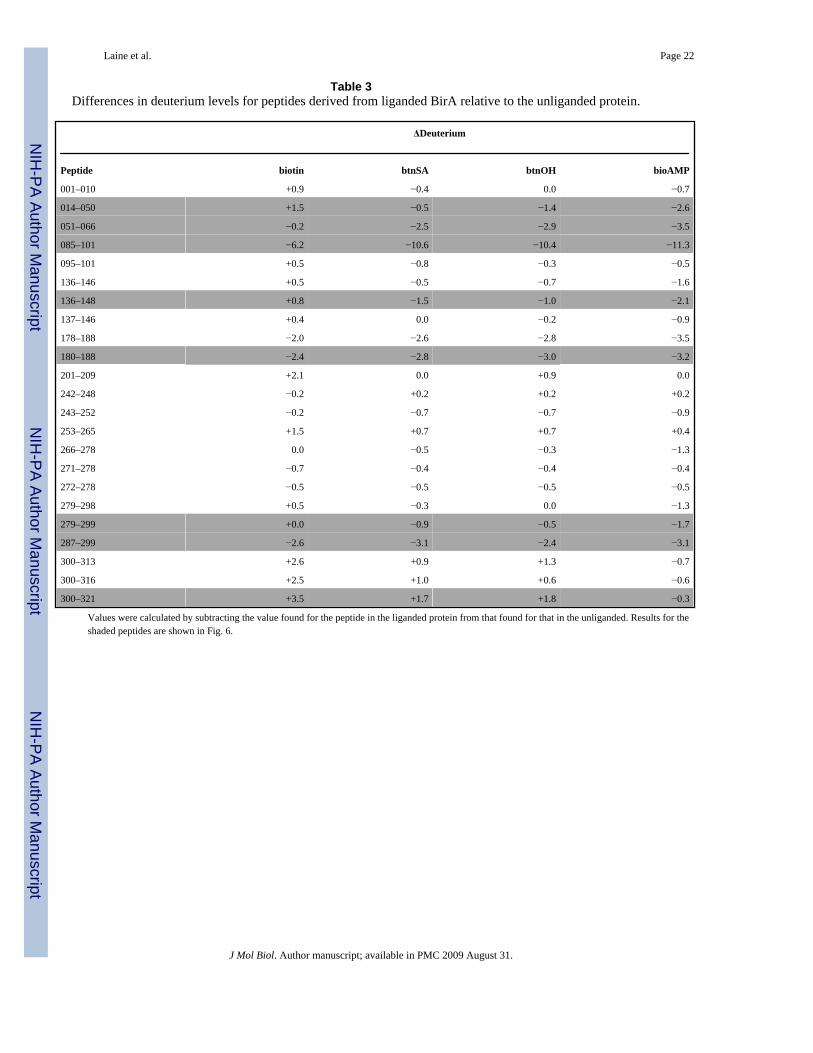
The differences in exchange between the ligand-free and ligand-bound states of BirA, whichare shown Table 3, are relevant in analyzing the allosteric response using H-D exchange. Asindicated above, a conservative estimate of the reproducibility with which amounts of exchangecould be measured in our hands is ±0.5 deuteron. Thus, only differences greater than 0.5 in
Laine et al. Page 5
J Mol Biol. Author manuscript; available in PMC 2009 August 31.
NIH
-PA Author Manuscript
NIH
-PA Author Manuscript
NIH
-PA Author Manuscript
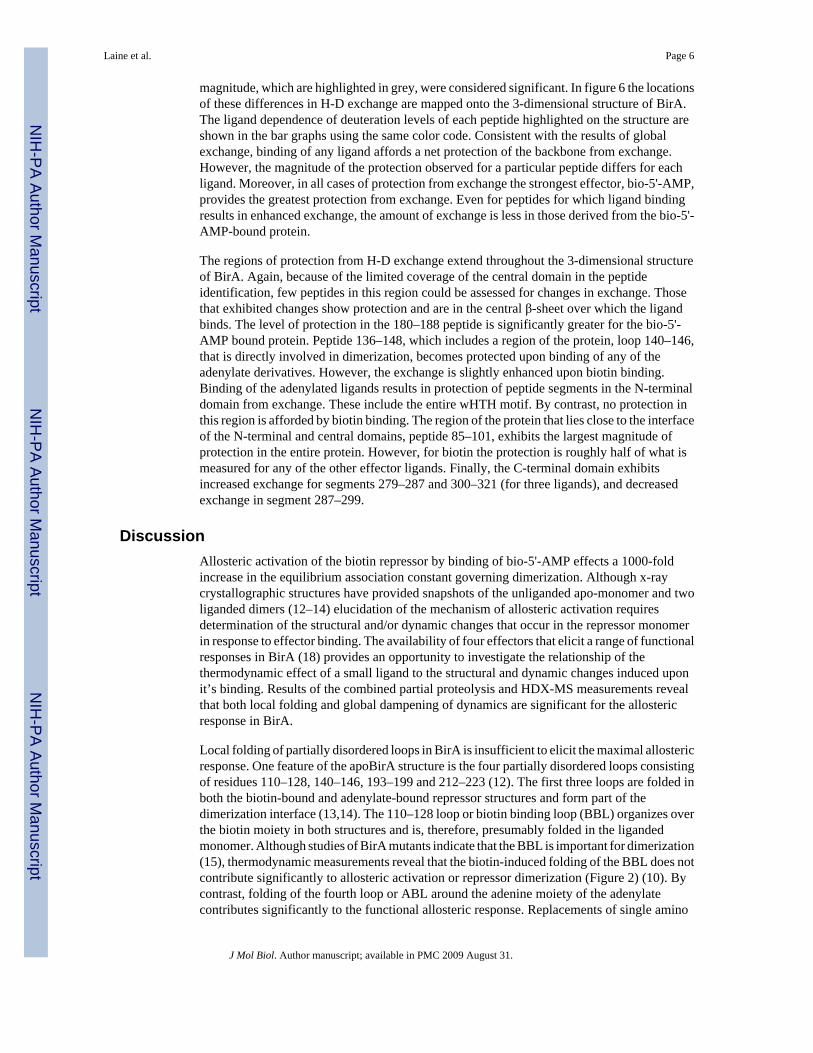
magnitude, which are highlighted in grey, were considered significant. In figure 6 the locationsof these differences in H-D exchange are mapped onto the 3-dimensional structure of BirA.The ligand dependence of deuteration levels of each peptide highlighted on the structure areshown in the bar graphs using the same color code. Consistent with the results of globalexchange, binding of any ligand affords a net protection of the backbone from exchange.However, the magnitude of the protection observed for a particular peptide differs for eachligand. Moreover, in all cases of protection from exchange the strongest effector, bio-5'-AMP,provides the greatest protection from exchange. Even for peptides for which ligand bindingresults in enhanced exchange, the amount of exchange is less in those derived from the bio-5'-AMP-bound protein.
The regions of protection from H-D exchange extend throughout the 3-dimensional structureof BirA. Again, because of the limited coverage of the central domain in the peptideidentification, few peptides in this region could be assessed for changes in exchange. Thosethat exhibited changes show protection and are in the central β-sheet over which the ligandbinds. The level of protection in the 180–188 peptide is significantly greater for the bio-5'-AMP bound protein. Peptide 136–148, which includes a region of the protein, loop 140–146,that is directly involved in dimerization, becomes protected upon binding of any of theadenylate derivatives. However, the exchange is slightly enhanced upon biotin binding.Binding of the adenylated ligands results in protection of peptide segments in the N-terminaldomain from exchange. These include the entire wHTH motif. By contrast, no protection inthis region is afforded by biotin binding. The region of the protein that lies close to the interfaceof the N-terminal and central domains, peptide 85–101, exhibits the largest magnitude ofprotection in the entire protein. However, for biotin the protection is roughly half of what ismeasured for any of the other effector ligands. Finally, the C-terminal domain exhibitsincreased exchange for segments 279–287 and 300–321 (for three ligands), and decreasedexchange in segment 287–299.
DiscussionAllosteric activation of the biotin repressor by binding of bio-5'-AMP effects a 1000-foldincrease in the equilibrium association constant governing dimerization. Although x-raycrystallographic structures have provided snapshots of the unliganded apo-monomer and twoliganded dimers (12–14) elucidation of the mechanism of allosteric activation requiresdetermination of the structural and/or dynamic changes that occur in the repressor monomerin response to effector binding. The availability of four effectors that elicit a range of functionalresponses in BirA (18) provides an opportunity to investigate the relationship of thethermodynamic effect of a small ligand to the structural and dynamic changes induced uponit’s binding. Results of the combined partial proteolysis and HDX-MS measurements revealthat both local folding and global dampening of dynamics are significant for the allostericresponse in BirA.
Local folding of partially disordered loops in BirA is insufficient to elicit the maximal allostericresponse. One feature of the apoBirA structure is the four partially disordered loops consistingof residues 110–128, 140–146, 193–199 and 212–223 (12). The first three loops are folded inboth the biotin-bound and adenylate-bound repressor structures and form part of thedimerization interface (13,14). The 110–128 loop or biotin binding loop (BBL) organizes overthe biotin moiety in both structures and is, therefore, presumably folded in the ligandedmonomer. Although studies of BirA mutants indicate that the BBL is important for dimerization(15), thermodynamic measurements reveal that the biotin-induced folding of the BBL does notcontribute significantly to allosteric activation or repressor dimerization (Figure 2) (10). Bycontrast, folding of the fourth loop or ABL around the adenine moiety of the adenylatecontributes significantly to the functional allosteric response. Replacements of single amino
Laine et al. Page 6
J Mol Biol. Author manuscript; available in PMC 2009 August 31.
NIH
-PA Author Manuscript
NIH
-PA Author Manuscript
NIH
-PA Author Manuscript

acid residues in the loop both disrupt folding and cause losses in free energy of allostericactivation ranging from 1.0 to 1.5 kcal/mole (17). In this work proteolysis measurements wereperformed on complexes of BirA bound to the four allosteric activators in order to determinethe extent of loop folding in the complexes. Previous results of combined bindingmeasurements using ITC and kinetic measurements of subtilisin-mediated proteolysis indicatethat the degree of protection from proteolysis agrees with the thermodynamic measure of loop-induced folding (ΔCp°) (17). The protection, as judged by the rates of subtilisin-mediatedproteolysis, are the same for btnSA, btnOH-AMP and bio-5'-AMP, consistent with similarextents of folding in all three complexes. By contrast, the coupling free energies at the levelsof dimerization are −1.0, −3.0 and −4.0 kcal/mole, respectively.
Hydrogen-deuterium exchange coupled to mass spectrometric detection was performed toinvestigate the response of the entire protein to effector binding. Results of globalmeasurements of time courses of deuterium exchange into the protein reveal that binding ofany of the four ligands results in net protection of the protein backbone amides from exchange.In order to localize the regions of protection pepsin digestion products of the exchanged proteinwere analyzed by mass spectrometry to determine the average deuterium content. This analysisis typically performed using either electrospray ionization or MALDI techniques (20,26).Based on trials performed on BirA pepsin digestion products using the two techniques withthe available instruments, the MALDI method provided better coverage of the proteinsequence. The MALDI-ToF measurements were performed using a modification of previouslypublished methods (26). However, the ease with which BirA is cleaved by pepsin allowed fora very short time between quenching of the exchange and mass spectrometric analysis. Onaverage there was a 3–4 minute interval between the quench and spectrum acquisition. Thespeed with which the analysis was performed minimized the levels of back exchange to 9 to50% with an average value of 33%. One of the challenges associated with analysis of thisparticular system by HDX-MS is that in order to avoid significant contributions from theliganded dimer to the species population exchange measurements were performed at arelatively low total protein concentration of 2 μM. This low concentration compromised thesignal to noise ratio in the mass spectra and, in some cases, rendered challenging thedetermination of average deuteration levels of peptides from the mass envelopes. In localizingdifferences in H-D exchange to specific peptide segments it is customary to measure thechanges in rates of exchange (27). However, the concentration constraints in the biotinrepressor system made such kinetic measurements challenging. Consequently, in this workonly differences in the steady-state levels of deuterium incorporation into pepsin digestionproducts were measured. Although this strategy precluded quantifying ligand-induced changesin the stability of specific regions of the protein (27), it does allow mapping of differences insolvent access to the protein backbone.
Mapping of ligand-induced changes in hydrogen-deuterium exchange indicates that segmentsof the protein sequence throughout the repressor three-dimensional structure become, for themost part, protected from H-D exchange when bound to the ligand. Even the very weak effector,biotin, elicits net protection. The majority of these differences in H-D exchange observed forthe apo- and liganded BirA species likely reflect changes in dynamics. This conclusion is basedon the known structures of the protein. The major structural differences between the apo-monomer and liganded monomer derived from the dimer structure are localized to the fourpartially disordered loops observed in the structure of the apo-repressor (12–14). Overlay ofthe apo-BirA and BirA.biotin monomer structures reveals root-mean-squared discrepanciesbetween α-carbon atoms for the entire protein of 1.26 Å. Thus, no dramatic changes in thestructures of regions outside of the loops occur upon ligand binding.
Several peptide segments of the repressor monomer that directly participate in dimerizationexhibit ligand-induced changes in H-D exchange. In the btnOH-AMP dimer regions of both
Laine et al. Page 7
J Mol Biol. Author manuscript; available in PMC 2009 August 31.
NIH
-PA Author Manuscript
NIH
-PA Author Manuscript
NIH
-PA Author Manuscript

the central and C-terminal domains form the intersubunit interface. The interface is, in part,composed of an extended β-sheet formed by side-by-side antiparallel alignment of the centralβ-sheets of the two individual monomers. The strand from each monomer that forms theintermolecular contact in this extended sheet contains residues 182–192 (13,14). H-D exchangemeasurements indicate that the peptide containing residues 180–188 is protected fromexchange upon binding of any of the four effectors and that the magnitude of protectioncorrelates with the magnitude of the functional response to ligand binding. In addition, peptide136–148, which contains loop 140–146 that directly participates in dimerization (13–15),becomes protected from exchange upon binding of btnSA, btnOH-AMP or bio-5'-AMP. Bycontrast, biotin binding slightly enhances exchange in this region. HD exchange in the centralsegment of the C-terminal domain, peptide 287–299, also decreases upon binding of all fourligands. Segment 293–295 forms part of the dimerization interface in the structure of repressorbound to btnOH-AMP (14). These changes in H-D exchange in segments that form part of thedimerization interface indicate that, even in the repressor monomer, effector binding inducesrigidity that may facilitate dimerization.
Several regions of the repressor protein that are distal to both the dimerization interface andthe ligand binding site are altered in their H-D exchange levels in response to binding effectors.For example, the peptide segment that undergoes the greatest ligand-associated protection fromH-D exchange extends from residue 85 to 101. Based on the values obtained for exchange intopeptide 95–101 (see Table 3), most of the protection in peptide 85–101 is associated withresidues 85–94. While this segment abuts the β-sheet that forms part of the dimerizationinterface, it is distal to the edge of the sheet that forms part of the interface. Differences inexchange are also observed in the N-terminal domain, which forms the DNA binding domain.Finally, even the far C-terminus of the repressor structure exhibits ligand-linked changes in H-D exchange. In this case binding of the three ligands biotin, btnSA or btnOH-AMP is associatedwith increases in exchange. In general ligand binding to BirA results in decreases in H-Dexchange for the majority of the protein sequence that could be analyzed. These results areconsistent with ligand-induced global tightening of the protein structure.
The global tightening of the repressor structure upon allosteric effector binding is inconsistentwith previous interpretation of results of thermodynamic measurements. Isothermal titrationcalorimetry measurements of binding of the four allosteric ligands to the BirA monomerindicate a correlation between the magnitude of the allosteric response and the ligand bindingthermodynamics(28). Weak effectors bind with large favorable enthalpies that are opposed byunfavorable entropies and strong effector binding is characterized by more modest favorableenthalpy and modest favorable entropy. These data were originally interpreted as indicatingthat in binding of the strong effectors some of the favorable enthalpy associated with bondformation between ligand and protein is used to drive an enthalpically unfavorable structuraltransition in the protein. If one focuses on the protein alone, the results of the HDXmeasurements, which indicate a global tightening of the protein structure, the extent of whichcorrelates with effector strength, do not support this interpretation of the thermodynamic data.Indeed, the increased tightening observed with the strong effectors should be accompanied byan enthalpic gain and an entropic loss, neither of which are observed in the thermodynamicdata. One possibility is that the differences in the thermodynamic patterns of effector bindingreflect solvent reorganization that would not be detectable in the HDX measurements.
The combined structural, thermodynamic and hydrogen-deuterium exchange measurementssuggest a two-stage model for transducing the signal for effector binding throughout the biotinrepressor structure. Disorder-to-order transitions in loops localized to the binding site initiatethe signaling process. Other allosteric processes have been shown to utilize analogous localizedordering (29). The H-D exchange measurements presented in this work indicate that the signalis propagated from the binding site to effect global changes in repressor dynamics. Moreover,
Laine et al. Page 8
J Mol Biol. Author manuscript; available in PMC 2009 August 31.
NIH
-PA Author Manuscript
NIH
-PA Author Manuscript
NIH
-PA Author Manuscript
the magnitude of the dampening of dynamics tracks with the magnitude of the functionalchange in the repressor induced by an allosteric activator. In mechanical models of allosterysignal transmission occurs through a pathway(s) in which alterations in bonding interactionspropagate from the effector binding site to the site of functional change in a macromolecule.Recent studies indicate that allosteric signaling can also be entropically based (5,30,31). Theeffector-induced changes hydrogen-deuterium exchange in BirA indicate that this systemprovides another example of transmission of an allosteric response through alterations inprotein fluctuations.
Materials & MethodsChemicals and Biochemicals
Deuterium oxide (D2O) 99.9%, Ultra grade trisodium citrate and disodium succinate, d-biotin99%, trifluoroacetic acid (TFA) 99%, and immobilized pepsin-agarose from porcine gastricmucosa were purchased from Sigma. HPLC grade acetonitrile (ACN) was obtained fromThermoFisher Scientific. All other chemicals used in preparation of buffers were at leastreagent or analytical grade. E. coli biotin repressor, BirA, was overexpressed and purified aspreviously described (18). Biotinoyl-5-adenosine monophosphate, bio-5-AMP, wassynthesized and purified as described by Abbott and Beckett (8,32). The analogs of bio-5'-AMP, biotinol adenylate, btnOH-AMP and 5-O-[N-(biotinoyl sulfamoyl]-adenosine, btn-SAwere purchased from RNA-Tech (Leuven, Belgium) or synthesized as previously reported(18).
Subtilisin-mediated Proteolysis MeasurementsThe pseudo-first order rates of subtilisin-catalyzed cleavage of BirA, apo- and ligand-bound,were measured. Solutions of either BirA alone or with excess ligand were first prepared instandard buffer (10 mM Tris-HCl (pH 7.50 ± 0.02 at 20.0 ± 0.1°C), 200 mM KCl, 2.5 mMMgCl2) and equilibrated for 30 minutes at 20°C. Subtilisin was freshly diluted in StandardBuffer and added to the BirA solution to obtain a final weight ratio of repressor:subtilisin of33 to 50:1 and incubation was continued at 20°C. At 15 minute time intervals 10 μL aliquotswere removed from the reaction and proteolysis was stopped by additional of a 1 μL aliquotof 100 mM PMSF freshly prepared in absolute ethanol. A 6 μL volume of Laemmli samplebuffer was added to each sample and the products were separated by electrophoresis in a 15%SDS-polyacrylamide gel. Protein bands were visualized by staining with Coomassie BrilliantBlue and the amount of intact BirA for each time point in the proteolytic digestion wasquantified by scanning the gel using a Molecular Dynamics Laser Scanning PersonalDensitometer (GE Healthcare). Control experiments have shown that high concentrations ofthe ligands do not affect the catalytic activity of subtilisin (16). The rates of subtilisin-catalyzedcleavage of BirA were obtained by relating the time-dependent decrease in the amount of intactBirA to a pseudo-first order process. The apparent rates of proteolysis were estimated fromlinear least-squares analysis using the following equation:
(1)
where [BirAOD]t and [BirAOD]t=0 are the integrated optical densities for the bandscorresponding to intact BirA at time t and the zero time point, respectively, t is time in minutesand k is the rate or slope of the line.
Laine et al. Page 9
J Mol Biol. Author manuscript; available in PMC 2009 August 31.
NIH
-PA Author Manuscript
NIH
-PA Author Manuscript
NIH
-PA Author Manuscript

Global H/D Exchange Study on BirA with Small LigandsTime courses of deuterium in-exchange to intact BirA in the absence and presence of ligandswere performed following the methods outlined by Hoofnagle et al. with the following changes(19). The biotin repressor protein was dialyzed extensively against Standard Buffer (10 mMTris pH 7.50 ± 0.02 at 20.0 ± 0.1°C, 200 mM KCl, and 2.5mM MgCl2) and its concentrationwas determined spectrophotometrically using a molar extinction coefficient of 47510M−1cm−1 at 280 nm (33). Solutions of BirA, both with and without the ligands biotin, bio-5'-AMP, btnOH-AMP, and btn-SA were prepared in Standard Buffer to give concentrations of20 μM protein and 30 μM ligand. All solutions were equilibrated for 30 minutes at 20°C.
Individual deuterium in-exchange reactions were produced by diluting 2 μL of the proteinsolution into a final volume of 20 μL with 20°C Standard Buffer made in D2O: 10mM Tris pD7.50 ± 0.02 at 20.0 ± 0.1°C, 200 mM KCl, and 2.5 mM MgCl2 to yield final concentrations of2μM protein and, in relevant samples, 3μM ligand. These protein and ligand concentrationsare sufficiently high to ensure saturation of the protein with ligand. Time points from 5 to 60minutes in-exchange were taken as 20 μL aliquots at appropriate intervals from a masterreaction of 100 μL, prepared by combining 10 μL of the original protein solution, with orwithout ligand, with 90 μL D2O Standard Buffer. All reactions were treated identically byquenching with 18 μL of 0°C 25 mM sodium citrate, 25 mM sodium succinate, pH 2.4 resultingin a final pH of 2.5, chilled on a dry ice/salt/ice bath for 10 seconds, desalted using anequilibrated 0°C Zip Tip C18 pipette tip (Millipore) and eluted with 0°C ACN/0.1% TFA (7:3v/v) in mQ H2O. Samples of unexchanged and exchanged protein were directly infused in anESI-TOF mass spectrometer to determine molecular weight.
Local H/D Exchange MeasurementsReactions for hydrogen-deuterium exchange followed by pepsin cleavage were performedaccording to the methods described by Mandell et al. with the following changes (26). TheStandard Buffer used contained 10 mM Tris pH 7.50 ± 0.02 at 20.0 ± 0.1°C, 200 mM KCl,and 2.5 mM MgCl2. Solutions of BirA, either as an apo (or unliganded) control, or with theaddition of the ligands biotin, bio-5-AMP, btnOH-AMP, or btn-SA at a molar ratio of 1:1.5were equilibrated in Standard Buffer for 30 minutes at 20°C. Hydrogen-deuterium exchangewas initiated by the dilution of 2 μL of each of these solutions into a total volume of 20 μLwith Standard Buffer prepared in D2O: 10 mM Tris pD 7.50 ± 0.02 at 20.0 ± 0.1°C, 200 mMKCl, and 2.5 mM MgCl2 to give 2μM BirA +/- 3μM ligand. A control reaction was similarlydiluted into Standard Buffer prepared in H2O and treated identically. In-exchange was allowedto proceed for 60 minutes at 20°C. Immediately prior to use, agarose-immobilized pepsin foreach reaction was exchanged twice with 500 μL of 0°C mQ H2O and twice with 500 μL of 0°C 0.1% TFA in mQ H2O and resuspended to 25 mg/mL w/v in 0°C 0.1% TFA in mQ H2O.The pepsin-agarose in a 100 μL aliquot, containing 95 units of pepsin, was pelleted at 3000rpm at −2°C for 30 seconds in an Eppendorf tube and excess liquid removed by carefulpipetting.
Following in-exchange, each reaction was chilled for 2 minutes on ice, quenched by theaddition of 80 μL of 0°C 0.1% TFA in mQ H2O, resulting in a final pH of 2.5, mixed, andtransferred to the drained pepsin-agarose aliquot on ice. Digestion reactions were briefly mixedand allowed to incubate at 0°C for 30 seconds before being separated from the immobilizedpepsin using a pre-chilled Ultrafree MC centrifuge filter device (Millipore) and centrifugationfor 30 seconds at 3000 rpm at −2°C. The liquid flow through was desalted on ice using a 0°Cpre-equilibrated ZipTip C18 (Millipore) pipette tip and peptides were eluted from the tip with1μL of 0°C pH 2.5 10 mg/mL α-cyano-4-hydroxycinnamic acid matrix solution in ACN/0.1%TFA (7:3 v/v). Eluant was directly spotted onto the MALDI target plate, prechilled on a −20°C freezer bag under vacuum in a dessicator. The vacuum was broken only to allow for spotting
Laine et al. Page 10
J Mol Biol. Author manuscript; available in PMC 2009 August 31.
NIH
-PA Author Manuscript
NIH
-PA Author Manuscript
NIH
-PA Author Manuscript
then immediately reapplied and the spots typically dried in less than 60 seconds. Thereafter,the target was quickly transferred to the adjacent mass spectrometer to avoid condensation ofwater on the plate. The average total time from quenching of the H/D exchange to transfer ofthe plate to the mass spectrometer was 4:03±0:15 minutes.
Back-exchange ControlsMeasurements of the fully exchanged controls were obtained following the method describedby Resing and Ahn (25). Reactions were set up identically to the unliganded, unexchangedcontrol reactions described above with the exception that digestion preceded the in-exchangein deuterated buffer. Following digestion of 2μM BirA at 0°C pH 2.5 for 30 seconds withpepsin, the immobilized pepsin was removed using a chilled Ultrafree MC centrifuge filterdevice. The resulting peptides were desalted with a Zip Tip C18 pipette tip and eluted from thetip with 10μL of ACN/0.1% TFA (7:3 v/v) into a 200μL thin wall thermal cycler tube. Peptideswere lyophilized and resuspended in 20μL of 10mM MOPS pD 8.00 ± 0.02, 200mM KCl,2.5mM MgCl2, heated 90 minutes at 90°C in a PCR Sprint thermal cycler (Thermo) and chilledon ice. The resulting 100% deuterium–exchanged peptides were desalted with a Zip Tip C18pipette tip at 0°C, eluted with 1μL of 0°C pH 2.5 10 mg/mL α-cyano-4-hydroxycinnamic acidmatrix solution in ACN/0.1% TFA (7:3 v/v) and spotted directly onto the chilled MALDI targetplate. Spectra were acquired as described below.
Mass SpectrometrySamples subjected to global H/D exchange were analyzed using an AccuTOF-CS ESI-TOFmass spectrometer (JEOL, Tokyo, Japan). Samples were introduced into the mass spectrometerby direct infusion and the instrument was externally calibrated with polypropylene glycol.Mass spectra were recorded at m/z 250–2500.
Local H/D exchange studies were performed using an Axima-CFR Plus MALDI-TOF massspectrometer (Shimadzu Biotech, Columbia, MD). The instrument was equipped with anitrogen laser (λ=337 nm) and operated on reflectron mode. The matrix of choice was α-cyano-4-hydroxycinnamic acid from Sigma (St. Louis, MO) and the sample for externalcalibration was a PPG Standard from Applied Biosystems (Foster City, CA). MALDI massspectra were recorded at m/z 400–4400 and 500 profiles were averaged for every spectrum inthe HDX studies.
Identities of peptic peptides in the local HDX study were confirmed by MS/MS using a PESciex API QSTAR Pulsar i Q-TOF mass spectrometer (Concord, ON) and an in-house versionof Mascot software (Matrix Science). Samples were introduced through an LC PackingsUltimate nanoflow LC system (Abberdaan, the Netherlands) equipped with a C18 PepMap100column (75 μm, 15 cm, 3 μm, 100 Å) and connected to a nano ionspray source (Protana, Odense,Denmark) or by direct infusion into the ion spray source (PE Sciex).
Data AnalysisIn analysis of the global exchange data the molecular weight of the protein was obtained fromdeconvolution of the spectrum obtained for each time point using the MagTran 1.0 software(34). The data were plotted as molecular weight versus time and subjected to nonlinear leastsquares analysis using a triple exponential model (GraphPad Prism).
Spectra obtained from MALDI-ToF analysis of peptide digestion products of the protein thathad been subjected to hydrogen-deuterium exchange provide isotope peak envelopes for therelevant peptides. The centroids of these envelopes, which were directly determined using atool in the Kratos Kompact MALDI software for Axima Instruments 2.3.4., provided themasses of the peptides. These values were subjected to two corrections. The first correction
Laine et al. Page 11
J Mol Biol. Author manuscript; available in PMC 2009 August 31.
NIH
-PA Author Manuscript
NIH
-PA Author Manuscript
NIH
-PA Author Manuscript
accounted for the fact that exchange was performed in buffer that was 90%, not 100%, D2O.The second correction, which took into account the back exchange that occurred betweenquenching of the exchange and acquisition of the mass spectra, was performed using thefollowing equation:
(2)
where D is the corrected deuterium level in the peptide, m is the experimentally determinedmass of the peptide obtained as the centroid of the mass envelope, m0% is a centroid mass ofthe undeuterated peptide, m100% is the experimentally determined centroid mass of the fullydeuterated peptide obtained as described above., and N is a total number of exchangeable amidehydrogens in the peptide fragment (20). For the peptides in this work subjected to analysis forHD exchange back exchange values ranged from 9–50%.
AcknowledgmentsSupported by NIH Grant GM46511 to DB, NIH Grant GM21248 to CCF and a grant from the Helsingin Sanomat100th Anniversary Foundation to OL. Funds from NIH Grant S10RR19341 were used to purchase the JEOL ESI-ToFMass Spectrometer.
References1. Monod J, Wyman J, Changeux JP. On the Nature of Allosteric Transitions: A Plausible Model. J Mol
Biol 1965;12:88–118. [PubMed: 14343300]2. Koshland DE Jr, Nemethy G, Filmer D. Comparison of experimental binding data and theoretical
models in proteins containing subunits. Biochemistry 1966;5:365–385. [PubMed: 5938952]3. Suel GM, Lockless SW, Wall MA, Ranganathan R. Evolutionarily conserved networks of residues
mediate allosteric communication in proteins. Nat Struct Biol 2003;10:59–69. [PubMed: 12483203]4. Yang J, Garrod SM, Deal MS, Anand GS, Woods V Jr, Taylor S. Allosteric network of cAMP-
dependent protein kinase revealed by mutation of Tyr204 in the P+1 loop. J Mol Biol 2005;346:191–201. [PubMed: 15663937]
5. Popovych N, Sun S, Ebright RH, Kalodimos CG. Dynamically driven protein allostery. Nat Struct MolBiol 2006;13:831–838. [PubMed: 16906160]
6. Barker DF, Campbell AM. The birA gene of Escherichia coli encodes a biotin holoenzyme synthetase.J Mol Biol 1981;146:451–467. [PubMed: 7024555]
7. Barker DF, Campbell AM. Genetic and biochemical characterization of the birA gene and its product:evidence for a direct role of biotin holoenzyme synthetase in repression of the biotin operon inEscherichia coli. J Mol Biol 1981;146:469–492. [PubMed: 6456358]
8. Lane MD, Rominger KL, Young DL, Lynen F. The enzymatic synthesis of holotranscarboxylase fromapotranscarboxylase and (+)-biotin. J Biol Chem 1964;239:2865–2871. [PubMed: 14216437]
9. Prakash O, Eisenberg MA. Biotinyl 5'-adenylate: corepressor role in the regulation of the biotin genesof Escherichia coli K-12. Proc Natl Acad Sci U S A 1979;76:5592–5595. [PubMed: 392507]
10. Streaker ED, Gupta A, Beckett D. The biotin repressor: thermodynamic coupling of corepressorbinding, protein assembly, and sequence-specific DNA binding. Biochemistry 2002;41:14263–14271. [PubMed: 12450391]
11. Streaker ED, Beckett D. Coupling of protein assembly and DNA binding: biotin repressordimerization precedes biotin operator binding. J Mol Biol 2003;325:937–948. [PubMed: 12527300]
12. Wilson KP, Shewchuk LM, Brennan RG, Otsuka AJ, Matthews BW. Escherichia coli biotinholoenzyme synthetase/bio repressor crystal structure delineates the biotin- and DNA-bindingdomains. Proc Natl Acad Sci U S A 1992;89:9257–9261. [PubMed: 1409631]
Laine et al. Page 12
J Mol Biol. Author manuscript; available in PMC 2009 August 31.
NIH
-PA Author Manuscript
NIH
-PA Author Manuscript
NIH
-PA Author Manuscript
13. Weaver LH, Kwon K, Beckett D, Matthews BW. Corepressor-induced organization and assembly ofthe biotin repressor: a model for allosteric activation of a transcriptional regulator. Proc Natl AcadSci U S A 2001;98:6045–6050. [PubMed: 11353844]
14. Wood ZA, Weaver LH, Brown PH, Beckett D, Matthews BW. Co-repressor induced order and biotinrepressor dimerization: a case for divergent followed by convergent evolution. J Mol Biol2006;357:509–523. [PubMed: 16438984]
15. Kwon K, Streaker ED, Ruparelia S, Beckett D. Multiple disordered loops function in corepressor-induced dimerization of the biotin repressor. J Mol Biol 2000;304:821–833. [PubMed: 11124029]
16. Xu Y, Nenortas E, Beckett D. Evidence for distinct ligand-bound conformational states of themultifunctional Escherichia coli repressor of biotin biosynthesis. Biochemistry 1995;34:16624–16631. [PubMed: 8527435]
17. Naganathan S, Beckett D. Nucleation of an allosteric response via ligand-induced loop folding. J MolBiol 2007;373:96–111. [PubMed: 17765263]
18. Brown P, Cronan JE, Grotli M, Beckett D. The biotin repressor: Modulation of allostery by corepressoranalogs. J Mol Biol 2004;337:857–869. [PubMed: 15033356]
19. Hoofnagle AN, Resing KA, Ahn NG. Practical methods for deuterium exchange/mass spectrometry.Methods Mol Biol 2004;250:283–298. [PubMed: 14755095]
20. Zhang Z, Smith DL. Determination of amide hydrogen exchange by mass spectrometry: a new toolfor protein structure elucidation. Protein Sci 1993;2:522–531. [PubMed: 8390883]
21. Emrick MA, Lee T, Starkey PJ, Mumby MC, Resing KA, Ahn NG. The gatekeeper residue controlsautoactivation of ERK2 via a pathway of intramolecular connectivity. Proc Natl Acad Sci U S A2006;103:18101–18106. [PubMed: 17114285]
22. Koeppe JR, Komives EA. Amide H/2H exchange reveals a mechanism of thrombin activation.Biochemistry 2006;45:7724–7732. [PubMed: 16784223]
23. Brock M, Fan F, Mei FC, Li S, Gessner C, Woods V Jr, Cheng X. Conformational analysis of Epacactivation using amide hydrogen/deuterium exchange mass spectrometry. J Biol Chem2007;282:32256–32263. [PubMed: 17785454]
24. Englander JJ, Del Mar C, Li W, Englander SW, Kim JS, Stranz DD, Hamuro Y, Woods VL Jr. Proteinstructure change studied by hydrogen-deuterium exchange, functional labeling, and massspectrometry. Proc Natl Acad Sci U S A 2003;100:7057–7062. [PubMed: 12773622]
25. Resing KA, Ahn NG. Deuterium exchange mass spectrometry as a probe of protein kinase activation.Analysis of wild-type and constitutively active mutants of MAP kinase kinase-1. Biochemistry1998;37:463–475. [PubMed: 9425067]
26. Mandell JG, Falick AM, Komives EA. Measurement of amide hydrogen exchange by MALDI-TOFmass spectrometry. Anal Chem 1998;70:3987–3995. [PubMed: 9784743]
27. Englander SW. Hydrogen exchange and mass spectrometry: A historical perspective. J Am Soc MassSpectrom 2006;17:1481–1489. [PubMed: 16876429]
28. Brown PH, Beckett D. Use of binding enthalpy to drive an allosteric transition. Biochemistry2005;44:3112–3121. [PubMed: 15723556]
29. Keramisanou D, Biris N, Gelis I, Sianidis G, Karamanou S, Economou A, Kalodimos CG. Disorder-order folding transitions underlie catalysis in the helicase motor of SecA. Nat Struct Mol Biol2006;13:594–602. [PubMed: 16783375]
30. Hilser VJ, Thompson EB. Intrinsic disorder as a mechanism to optimize allosteric coupling in proteins.Proc Natl Acad Sci U S A 2007;104:8311–8315. [PubMed: 17494761]
31. Tsai CJ, Del Sol A, Nussinov R. Allostery: Absence of a Change in Shape Does Not Imply thatAllostery Is Not at Play. J Mol Biol. 2008
32. Abbott J, Beckett D. Cooperative binding of the Escherichia coli repressor of biotin biosynthesis tothe biotin operator sequence. Biochemistry 1993;32:9649–9656. [PubMed: 8373769]
33. Gill SC, von Hippel PH. Calculation of protein extinction coefficients from amino acid sequence data.Anal Biochem 1989;182:319–326. [PubMed: 2610349]
34. Zhang, Z. MAG-TRAN. Amgen, Inc.; Thousand Oaks, CA:35. Koradi R, Billeter M, Wuthrich K. MOLMOL: a program for display and analysis of macromolecular
structures. J Mol Graph 1996;14:51–55. 29–32. [PubMed: 8744573]
Laine et al. Page 13
J Mol Biol. Author manuscript; available in PMC 2009 August 31.
NIH
-PA Author Manuscript
NIH
-PA Author Manuscript
NIH
-PA Author Manuscript

Figure 1.A. Assembly of the Biotin Operon Repression Complex occurs by coupled dimerization andDNA binding. Binding of the effector, bio-5'-AMP, induces repressor dimerization, which isa prerequisite to site-specific DNA binding to the biotin operator sequence. B. Model of theapoBirA structure with the positions of the four partially disordered loops highlighted. Themodels were created in MolMol (35) using PDB files 1hxd and 2ewn as input.
Laine et al. Page 14
J Mol Biol. Author manuscript; available in PMC 2009 August 31.
NIH
-PA Author Manuscript
NIH
-PA Author Manuscript
NIH
-PA Author Manuscript

Figure 2.A. Chemical structure of four ligands that activate biotin repressor dimerization to differentextents. The figures were created in ChemDraw. B. Coupling free energies associated withbinding of the effectors to the biotin repressor. The coupling energies associated withdimerization, ΔG°C, DIM, and total assembly of the repression complex, dimerization plus DNAbinding of the dimer, ΔG°C, TOT, are shown.
Laine et al. Page 15
J Mol Biol. Author manuscript; available in PMC 2009 August 31.
NIH
-PA Author Manuscript
NIH
-PA Author Manuscript
NIH
-PA Author Manuscript
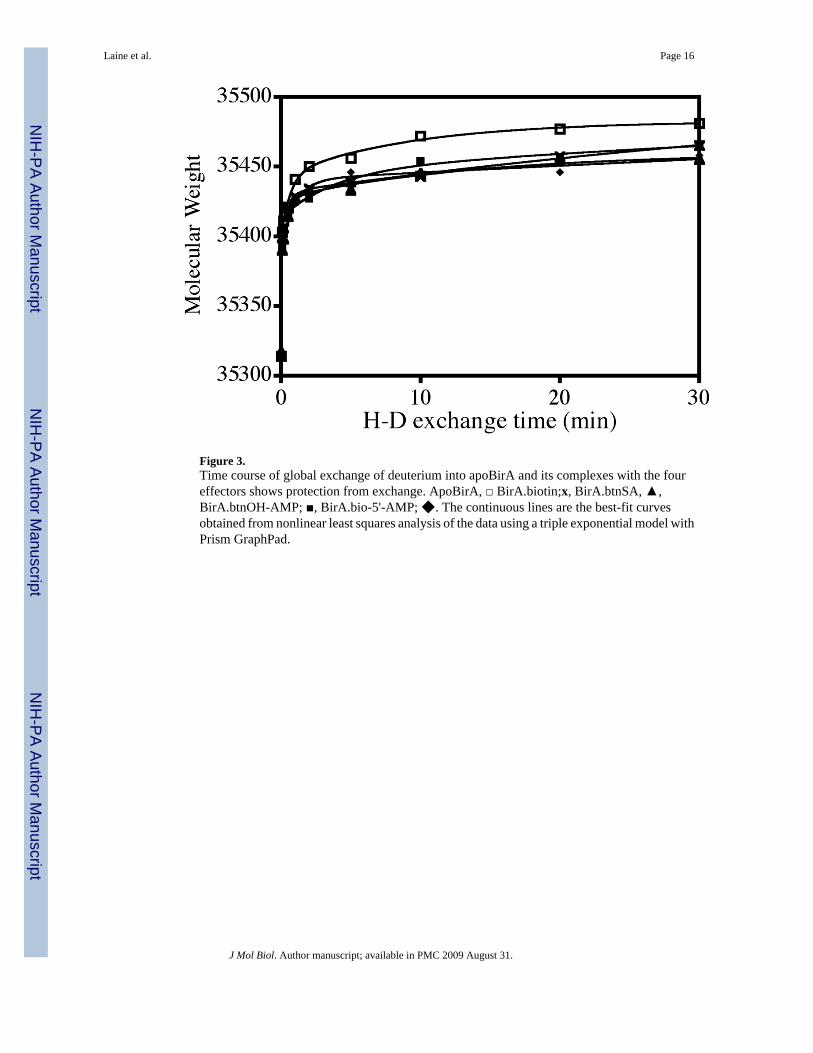
Figure 3.Time course of global exchange of deuterium into apoBirA and its complexes with the foureffectors shows protection from exchange. ApoBirA, □ BirA.biotin;x, BirA.btnSA, ▲,BirA.btnOH-AMP; ■, BirA.bio-5'-AMP; ◆. The continuous lines are the best-fit curvesobtained from nonlinear least squares analysis of the data using a triple exponential model withPrism GraphPad.
Laine et al. Page 16
J Mol Biol. Author manuscript; available in PMC 2009 August 31.
NIH
-PA Author Manuscript
NIH
-PA Author Manuscript
NIH
-PA Author Manuscript
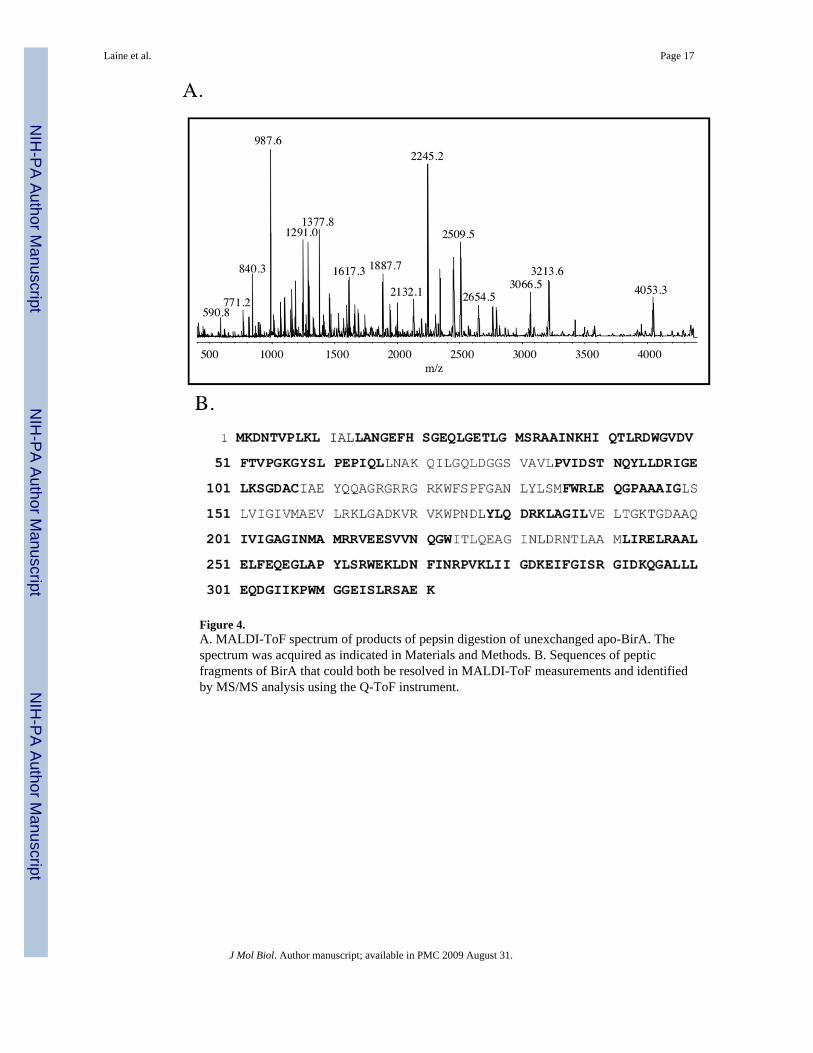
Figure 4.A. MALDI-ToF spectrum of products of pepsin digestion of unexchanged apo-BirA. Thespectrum was acquired as indicated in Materials and Methods. B. Sequences of pepticfragments of BirA that could both be resolved in MALDI-ToF measurements and identifiedby MS/MS analysis using the Q-ToF instrument.
Laine et al. Page 17
J Mol Biol. Author manuscript; available in PMC 2009 August 31.
NIH
-PA Author Manuscript
NIH
-PA Author Manuscript
NIH
-PA Author Manuscript
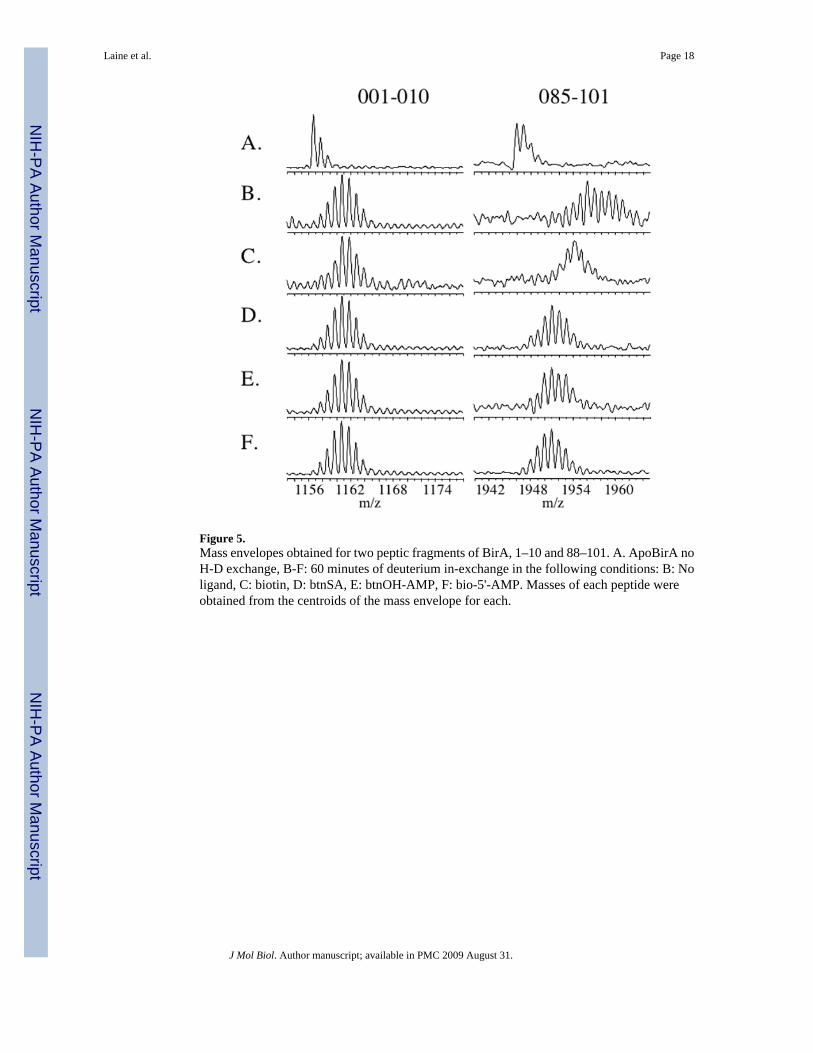
Figure 5.Mass envelopes obtained for two peptic fragments of BirA, 1–10 and 88–101. A. ApoBirA noH-D exchange, B-F: 60 minutes of deuterium in-exchange in the following conditions: B: Noligand, C: biotin, D: btnSA, E: btnOH-AMP, F: bio-5'-AMP. Masses of each peptide wereobtained from the centroids of the mass envelope for each.
Laine et al. Page 18
J Mol Biol. Author manuscript; available in PMC 2009 August 31.
NIH
-PA Author Manuscript
NIH
-PA Author Manuscript
NIH
-PA Author Manuscript
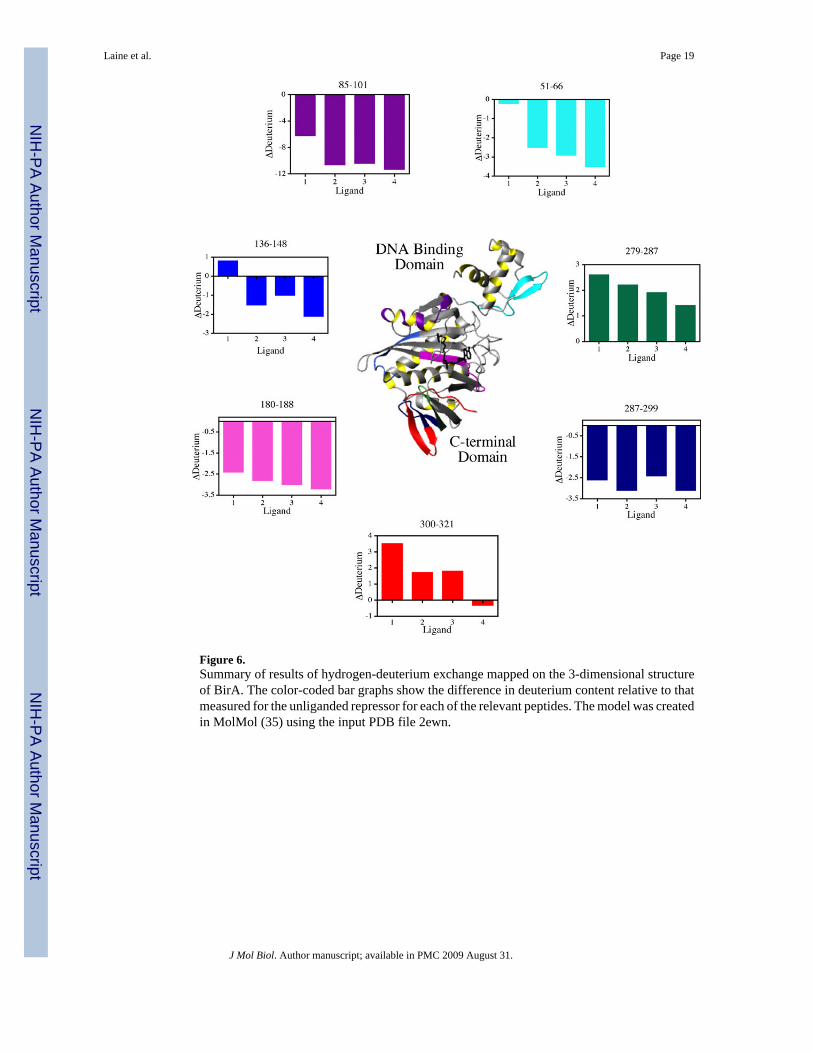
Figure 6.Summary of results of hydrogen-deuterium exchange mapped on the 3-dimensional structureof BirA. The color-coded bar graphs show the difference in deuterium content relative to thatmeasured for the unliganded repressor for each of the relevant peptides. The model was createdin MolMol (35) using the input PDB file 2ewn.
Laine et al. Page 19
J Mol Biol. Author manuscript; available in PMC 2009 August 31.
NIH
-PA Author Manuscript
NIH
-PA Author Manuscript
NIH
-PA Author Manuscript

NIH
-PA Author Manuscript
NIH
-PA Author Manuscript
NIH
-PA Author Manuscript
Laine et al. Page 20
Table 1Pseudo-first order rates of cleavage of the adenylate binding loop of apoBirA and its complexes with effector ligands.
Ligand rate (s−1)a
None 0.019±0.002
biotin 0.021±0.001
btnSA 0.0050±0.0004
btnOH-AMP 0.0042±0.0001
bio-5'-AMP 0.0038±0.0004aThe reported values represent the average of at least three independent measurements of the cleavage rate and errors are the 68% confidence limits.
J Mol Biol. Author manuscript; available in PMC 2009 August 31.
NIH
-PA Author Manuscript
NIH
-PA Author Manuscript
NIH
-PA Author Manuscript
Laine et al. Page 21Ta
ble
2N
umbe
r of d
eute
rons
in e
ach
pept
ide
afte
r 60
min
utes
of e
xcha
nge
#Deu
teri
um
Pept
ide
Max
D-li
gand
biot
inbt
nSA
btnO
H-A
MP
bio-
5'-A
MP
001–
010
88.
08.
97.
68.
07.
4
014–
050
3628
.329
.827
.826
.925
.7
051–
066
1212
.011
.89.
49.
08.
4
085–
101
1517
.010
.86.
46.
65.
7
095–
101
65.
66.
24.
95.
45.
1
136–
146
97.
37.
76.
86.
65.
7
136–
148
119.
09.
77.
48.
06.
9
137–
146
86.
97.
36.
96.
76.
0
178–
188
105.
73.
73.
12.
82.
2
180–
188
84.
01.
61.
21.
00.
8
201–
209
88.
410
.58.
49.
38.
4
242–
248
6−0
.2−0
.40.
00.
00.
0
243–
252
91.
31.
10.
70.
70.
4
253–
265
118.
49.
99.
19.
18.
8
266–
278
116.
96.
96.
46.
65.
6
271–
278
61.
60.
91.
31.
31.
3
272–
278
51.
30.
80.
80.
80.
8
279–
298
199.
510
.09.
29.
58.
3
279–
299
209.
89.
88.
99.
38.
1
287–
299
126.
94.
33.
84.
53.
8
300–
313
1210
.513
.111
.411
.89.
8
300–
316
1513
.516
.114
.514
.112
.9
300–
321
2015
.619
.117
.317
.415
.3
J Mol Biol. Author manuscript; available in PMC 2009 August 31.
NIH
-PA Author Manuscript
NIH
-PA Author Manuscript
NIH
-PA Author Manuscript
Laine et al. Page 22
Table 3Differences in deuterium levels for peptides derived from liganded BirA relative to the unliganded protein.
ΔDeuterium
Peptide biotin btnSA btnOH bioAMP
001–010 +0.9 −0.4 0.0 −0.7
014–050 +1.5 −0.5 −1.4 −2.6
051–066 −0.2 −2.5 −2.9 −3.5
085–101 −6.2 −10.6 −10.4 −11.3
095–101 +0.5 −0.8 −0.3 −0.5
136–146 +0.5 −0.5 −0.7 −1.6
136–148 +0.8 −1.5 −1.0 −2.1
137–146 +0.4 0.0 −0.2 −0.9
178–188 −2.0 −2.6 −2.8 −3.5
180–188 −2.4 −2.8 −3.0 −3.2
201–209 +2.1 0.0 +0.9 0.0
242–248 −0.2 +0.2 +0.2 +0.2
243–252 −0.2 −0.7 −0.7 −0.9
253–265 +1.5 +0.7 +0.7 +0.4
266–278 0.0 −0.5 −0.3 −1.3
271–278 −0.7 −0.4 −0.4 −0.4
272–278 −0.5 −0.5 −0.5 −0.5
279–298 +0.5 −0.3 0.0 −1.3
279–299 +0.0 −0.9 −0.5 −1.7
287–299 −2.6 −3.1 −2.4 −3.1
300–313 +2.6 +0.9 +1.3 −0.7
300–316 +2.5 +1.0 +0.6 −0.6
300–321 +3.5 +1.7 +1.8 −0.3
Values were calculated by subtracting the value found for the peptide in the liganded protein from that found for that in the unliganded. Results for theshaded peptides are shown in Fig. 6.
J Mol Biol. Author manuscript; available in PMC 2009 August 31.