Application of Biotin-4-Fluorescein in Homogeneous Fluorescence Assays for Avidin, Streptavidin, and...
16
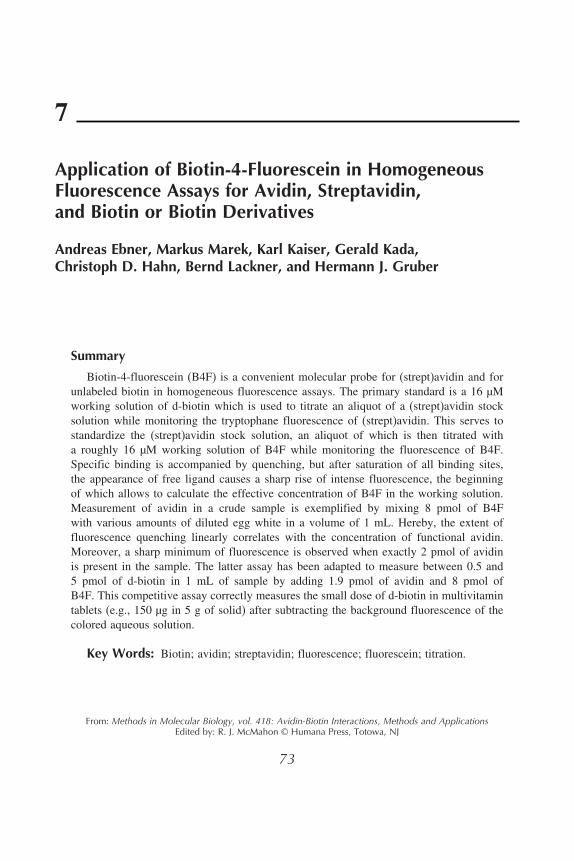
7 Application of Biotin-4-Fluorescein in Homogeneous Fluorescence Assays for Avidin, Streptavidin, and Biotin or Biotin Derivatives Andreas Ebner, Markus Marek, Karl Kaiser, Gerald Kada, Christoph D. Hahn, Bernd Lackner, and Hermann J. Gruber Summary Biotin-4-fluorescein (B4F) is a convenient molecular probe for (strept)avidin and for unlabeled biotin in homogeneous fluorescence assays. The primary standard is a 16 μM working solution of d-biotin which is used to titrate an aliquot of a (strept)avidin stock solution while monitoring the tryptophane fluorescence of (strept)avidin. This serves to standardize the (strept)avidin stock solution, an aliquot of which is then titrated with a roughly 16 μM working solution of B4F while monitoring the fluorescence of B4F. Specific binding is accompanied by quenching, but after saturation of all binding sites, the appearance of free ligand causes a sharp rise of intense fluorescence, the beginning of which allows to calculate the effective concentration of B4F in the working solution. Measurement of avidin in a crude sample is exemplified by mixing 8 pmol of B4F with various amounts of diluted egg white in a volume of 1 mL. Hereby, the extent of fluorescence quenching linearly correlates with the concentration of functional avidin. Moreover, a sharp minimum of fluorescence is observed when exactly 2 pmol of avidin is present in the sample. The latter assay has been adapted to measure between 0.5 and 5 pmol of d-biotin in 1 mL of sample by adding 1.9 pmol of avidin and 8 pmol of B4F. This competitive assay correctly measures the small dose of d-biotin in multivitamin tablets (e.g., 150 μg in 5 g of solid) after subtracting the background fluorescence of the colored aqueous solution. Key Words: Biotin; avidin; streptavidin; fluorescence; fluorescein; titration. From: Methods in Molecular Biology, vol. 418: Avidin-Biotin Interactions, Methods and Applications Edited by: R. J. McMahon © Humana Press, Totowa, NJ 73
Transcript of Application of Biotin-4-Fluorescein in Homogeneous Fluorescence Assays for Avidin, Streptavidin, and...
7
Application of Biotin-4-Fluorescein in HomogeneousFluorescence Assays for Avidin, Streptavidin,and Biotin or Biotin Derivatives
Andreas Ebner, Markus Marek, Karl Kaiser, Gerald Kada,Christoph D. Hahn, Bernd Lackner, and Hermann J. Gruber
Summary
Biotin-4-fluorescein (B4F) is a convenient molecular probe for (strept)avidin and forunlabeled biotin in homogeneous fluorescence assays. The primary standard is a 16 μMworking solution of d-biotin which is used to titrate an aliquot of a (strept)avidin stocksolution while monitoring the tryptophane fluorescence of (strept)avidin. This serves tostandardize the (strept)avidin stock solution, an aliquot of which is then titrated witha roughly 16 μM working solution of B4F while monitoring the fluorescence of B4F.Specific binding is accompanied by quenching, but after saturation of all binding sites,the appearance of free ligand causes a sharp rise of intense fluorescence, the beginningof which allows to calculate the effective concentration of B4F in the working solution.Measurement of avidin in a crude sample is exemplified by mixing 8 pmol of B4Fwith various amounts of diluted egg white in a volume of 1 mL. Hereby, the extent offluorescence quenching linearly correlates with the concentration of functional avidin.Moreover, a sharp minimum of fluorescence is observed when exactly 2 pmol of avidinis present in the sample. The latter assay has been adapted to measure between 0.5 and5 pmol of d-biotin in 1 mL of sample by adding 1.9 pmol of avidin and 8 pmol ofB4F. This competitive assay correctly measures the small dose of d-biotin in multivitamintablets (e.g., 150 μg in 5 g of solid) after subtracting the background fluorescence of thecolored aqueous solution.
Key Words: Biotin; avidin; streptavidin; fluorescence; fluorescein; titration.
From: Methods in Molecular Biology, vol. 418: Avidin-Biotin Interactions, Methods and ApplicationsEdited by: R. J. McMahon © Humana Press, Totowa, NJ
73
74 Ebner et al.
1. Introduction“Fluorescent biotins” are biotin-spacer-fluorophore conjugates which fall
into three categories. (i) Fluorescent biotins with poly(ethylene glycol) spacersretain high fluorescence even after binding to avidin or streptavidin (1,2). (ii)Fluorescent biotins with shorter spacers usually suffer from quenching afterbinding to (strept)avidin, and the quenching effect can be used for biospe-cific detection of (strept)avidin in the fluorimeter or fluorescence reader (1–5). Nevertheless, the residual fluorescence in the bound state can be highenough for detection in heterogeneous fluorescence assays, as exemplifiedby prelabeling of new streptavidin mutants with biotin-4-fluorescein (B4F),followed by gel electrophoresis in 0.1% sodium dodecyl sulfate (SDS)and subsequent visualization of the streptavidin band on a transilluminator(6). (iii) Some short biotin–fluorophore conjugates, such as biotin-4-Cy3and biotin-4-Cy5 (7), as well as lucifer yellow biocytin and cascade bluebiotin (G. Kada, unpublished results) fluoresce well, even in the boundstate, and are therefore good markers for (strept)avidin in heterogeneous assays.
The present study exemplifies the application of B4F in homogeneous bioan-alytical assays for (strept)avidin or for unlabeled biotin in complex, coloredsamples such as egg white or commercial multivitamin preparations, respec-tively. The primary standard is a 16 μM working solution of d-biotin. The firsttask is to titrate a defined aliquot of an approximately 2 μM avidin or strepta-vidin working solution with exactly 16 μM d-biotin which yields the effectiveconcentration of (strept)avidin. Immediately thereafter, an equal aliquot of thesame (strept)avidin working solution is titrated with a 10–16 μM workingsolution of B4F, yielding the accurate functional concentration of B4F. Allaliquots of the same batch of B4F are labeled with this effective concentrationand stored for up to 1 month at –20°C or for years at –70°C. Aliquots fromthe standardized B4F are used to measure avidin or streptavidin in sampleswhich may contain a large excess of other proteins (e.g., 103-fold to 104-foldas in egg white). Typically, 8 pmol of biotin is added to a sample containing<2 pmol of (strept)avidin, and the concentration of the latter is calculated fromfluorescence quenching, as compared to absence of avidin. Unlabeled biotin orbiotin derivatives (0.5–5 pmol) can also be measured in 1 mL of an unknownsample by adding 1.9 pmol of avidin and 8 pmol of B4F and comparing thefluorescence to a calibration curve with known biotin.
2. Materials2.1. Stock Solutions and Working Solutions of d-Biotin, Avidin,and Streptavidin
1. Buffer A: 100 mM NaCl, 50 mM NaH2PO4, and 1 mM ethylenediaminetetraaceticacid (EDTA), pH adjusted to 7.5 with NaOH.
Biotin-4-Fluorescein in Homogeneous Fluorescence Assays 75
2. Buffer B: Fatty acid-free bovine serum albumin (BSA) (e.g., Roche, 775827) isdissolved at 10 mg/mL in buffer A (e.g., 100 mg in 10 mL) and 1 mL aliquotsare stored at –20°C. Before use, a 1 mL aliquot is diluted with 99 mL buffer Ato obtain buffer B.
3. D-biotin stock solution (4 mM = 0.997 mg/mL, 244.3 g/mol) in buffer A: D-biotin(somewhat less than 99.7 mg) is weighed into a 100-mL graded cylinder. Thefinal volume V of the 4 mM d-biotin stock solution is calculated from the actualmass of d-biotin (M, in mg): V = M/0.997. The dry d-biotin is dissolved in bufferA at the final volume of V (in mL). Aliquots (e.g., 1 mL) are stored at –20°C forup to 1 month or at –70°C for years.
4. D-biotin standard solution (16 μM): One aliquot of the frozen 4 mM d-biotinstock solution is quickly warmed in approximately 25°C water and mixed beforeopening. Hundred microliters of 4 mM d-biotin is carefully diluted to 25 mLwith buffer A, and 500 μL aliquots are frozen in 500-μL Eppendorf tubes for upto 1 month at –20°C. Immediately before use, an aliquot is thawed in approxi-mately 25°C water, carefully mixed before opening, and immediately consumedor discarded.
5. Avidin stock solution (∼5 μM, 66,000 g/mol) and working solution (2 μM):Affinity-purified avidin from Sigma (A-9275) was used here, but pure avidin fromother sources is also suitable. Between 3 and 5 mg of solid is weighed into a glassvial and dissolved in 10 mL of buffer A. The UV-Vis spectrum is measured andA282 (per cm) is divided by the molar absorptivity of avidin (�282 =96,000/M/cm)to calculate the molar concentration. In a typical example, 4.2 mg of dry solid(batch specification 10.8 units/mg of solid and 11.9 units/mg protein, i.e., 83%of the theoretical activity of 14.4 units/mg avidin) dissolved in 10 mL buffer Ashowed A282 = 0.567 per cm, indicating a protein content of 5.8 μM. Taking intoaccount the 83% functional purity (see above), this corresponds to a functionalavidin concentration of 4.8 μM. This solution is diluted with buffer A (e.g., by afactor of 4.8 μM/2 μM = 2.4 in our example) in order to obtain a working solutionwith 2 μM functional avidin according to batch specifications.
6. Streptavidin stock solution (∼20 μM, 60,000 g/mol) and working solution (2 μM):The purchased quantity of 1 mg (16.7 nmol, Sigma, 85878) is dissolved in 833 μLof buffer A. Aliquots (exactly 200 μL each, ∼4 nmol) are distributed in 2-mLEppendorf vials, rapidly frozen in liquid nitrogen, and stored at –20°C or –70°C.Before use, one aliquot is thawed, shortly centrifuged to collect all liquid at thebottom, and mixed with 1.8 mL of buffer A. If desired, the molar concentrationcan be checked by measuring the UV absorbance A282 against buffer A anddividing by the molar absorptivity (224,000/M/cm).
2.2. Stock Solution and Working Solution of B4F
1. Dry aliquots of B4F (∼8 μmol each): 5 mg B4F (78 μmol, MW = 344.7, MolecularProbes, B10570) is dissolved in 2 mL ethanol, and 0.2 mL aliquots are dispensedin small threaded glass vials with a Hamilton syringe. The solvent is blown offwith argon or nitrogen gas. The vials are evacuated in a round-bottomed flask
76 Ebner et al.
for 1–2 h, filled with argon or nitrogen gas, screw-capped, sealed with Parafilm,and stored at –20°C or –70°C over desiccant (e.g., blue gel).
2. Dimethyl sulfoxide (DMSO) stock solution of B4F (∼500 μM): One dry portionof B4F (∼0.5 mg, ∼8 μmol) is dissolved in 1.5 mL of DMSO (analytical gradeor better) and stored at –20°C for <1 month or at –70°C for years.
3. Buffer C: 100 mM NaCl, and 50 mM H3BO3, pH adjusted to 9.0 with NaOH.Buffer C (pH 9) is solely used for estimating the molar concentration of a B4Fstock solution from the UV-Vis absorption spectrum because at pH 9 the molarabsorptivity �494 is known to be 68,000/M/cm. Please note that buffer C isinadequate for any experiments with avidin or streptavidin.
4. Estimation of B4F concentration in the DMSO stock solution: 40 μL of theDMSO stock solution is mixed into 1960 μL buffer C (not buffer A), andthe absorption spectrum is measured from 400 to 600 nm in a cuvette with1 cm light path. A494 (per cm) is divided by the molar absorptivity (�494 =68,000/M/cm) to give the nominal concentration of B4Flu. In a typical experiment,A494 = 0.859 per cm was measured, division by 68,000/M/cm gave a nominalconcentration of 12.63 μM in the cuvette and of 12.63 μM × (2000 μL/40 μL) =632 μM in the DMSO stock solution.
5. Working solution of B4F (∼16 μM in buffer A): Above, an aliquot of the DMSOstock solution has been diluted with buffer C (not buffer A) to estimate theapproximate concentration of fluorescent biotin by UV-Vis absorption. Now, aproper volume of the same DMSO stock solution is made up to 5 mL with bufferA (not buffer C) to obtain a ∼16 μM working solution. In our case (see step4), 5 mL × (16 μM/632 μM) = 0.127 mL of DMSO stock solution was carefullypipetted and rinsed into <4.8 mL buffer A, made up to 5 mL with buffer Aand carefully mixed. Five hundred microliter aliquots are quickly dispensed into500-μL Eppendorf tubes and stored at –20°C for up to 1 month or at –70°C foryears. After thawing in 25°C water, the solution is well mixed before openingand consumed within one workday.
3. Methods3.1. Standardization of Avidin or Streptavidin Working Solutionsby Titration with d-Biotin and Monitoring of Tryptophane Quenching
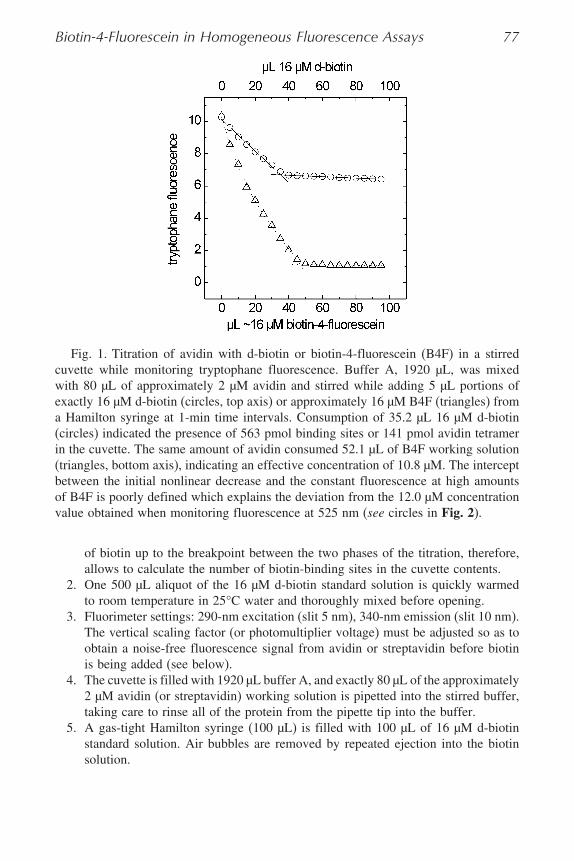
1. The biotin-binding pockets of avidin and streptavidin contain a tryptophan residue,the fluorescence of which is quenched upon binding of biotin. Although avidinand streptavidin contain additional tryptophan residues in each subunit, the totalfluorescence is quenched by 40% (8) or 30% (3), respectively, when four biotinsare bound per tetramer. Titration of (strept)avidin with a standardized solutionof d-biotin leads to a linear reduction of fluorescence up to the point at whichall biotin-binding sites have been filled with biotin (see Fig. 1). Further additionof d-biotin does not alter fluorescence, except for the very minor dilution effectand slow bleaching of tryptophan by the 290-nm irradiation. The consumption
Biotin-4-Fluorescein in Homogeneous Fluorescence Assays 77
Fig. 1. Titration of avidin with d-biotin or biotin-4-fluorescein (B4F) in a stirredcuvette while monitoring tryptophane fluorescence. Buffer A, 1920 μL, was mixedwith 80 μL of approximately 2 μM avidin and stirred while adding 5 μL portions ofexactly 16 μM d-biotin (circles, top axis) or approximately 16 μM B4F (triangles) froma Hamilton syringe at 1-min time intervals. Consumption of 35.2 μL 16 μM d-biotin(circles) indicated the presence of 563 pmol binding sites or 141 pmol avidin tetramerin the cuvette. The same amount of avidin consumed 52.1 μL of B4F working solution(triangles, bottom axis), indicating an effective concentration of 10.8 μM. The interceptbetween the initial nonlinear decrease and the constant fluorescence at high amountsof B4F is poorly defined which explains the deviation from the 12.0 μM concentrationvalue obtained when monitoring fluorescence at 525 nm (see circles in Fig. 2).
of biotin up to the breakpoint between the two phases of the titration, therefore,allows to calculate the number of biotin-binding sites in the cuvette contents.
2. One 500 μL aliquot of the 16 μM d-biotin standard solution is quickly warmedto room temperature in 25°C water and thoroughly mixed before opening.
3. Fluorimeter settings: 290-nm excitation (slit 5 nm), 340-nm emission (slit 10 nm).The vertical scaling factor (or photomultiplier voltage) must be adjusted so as toobtain a noise-free fluorescence signal from avidin or streptavidin before biotinis being added (see below).
4. The cuvette is filled with 1920 μL buffer A, and exactly 80 μL of the approximately2 μM avidin (or streptavidin) working solution is pipetted into the stirred buffer,taking care to rinse all of the protein from the pipette tip into the buffer.
5. A gas-tight Hamilton syringe (100 μL) is filled with 100 μL of 16 μM d-biotinstandard solution. Air bubbles are removed by repeated ejection into the biotinsolution.
78 Ebner et al.
6. Fluorescence is read (t = 0 min) and 5 μL of 16 μM d-biotin is added with stirring.At t = 1 min, fluorescence is read again and the next 5 μL aliquot is added withstirring. This step is repeated up to a total added volume of 95 μL biotin addition.
7. The fluorescence data are plotted versus d-biotin consumption, and the two linearperiods are fitted by straight lines, as shown in Fig. 1. The number of biotin-binding sites in the cuvette contents is calculated from the biotin consumption atthe intersection of the two lines. In Fig. 1, the breakpoint indicated a consumptionof 35.2 μL × 16 μM = 563 pmol of d-biotin for saturation of all specific bindingsites in avidin. This corresponds to 563/4 = 141 pmol of functional avidin tetramersin the cuvette, as well as in the 80 μL of avidin stock solution used to preparethe cuvette contents. Thus, the “functional” concentration of avidin tetramers inapproximately 2 μM stock solution is 141 pmol/80 μL = 1.76 μM.
3.2. Titration of a Known Avidin Standard with an Unknown WorkingSolution of B4F While Monitoring Fluorescence at 525 nm
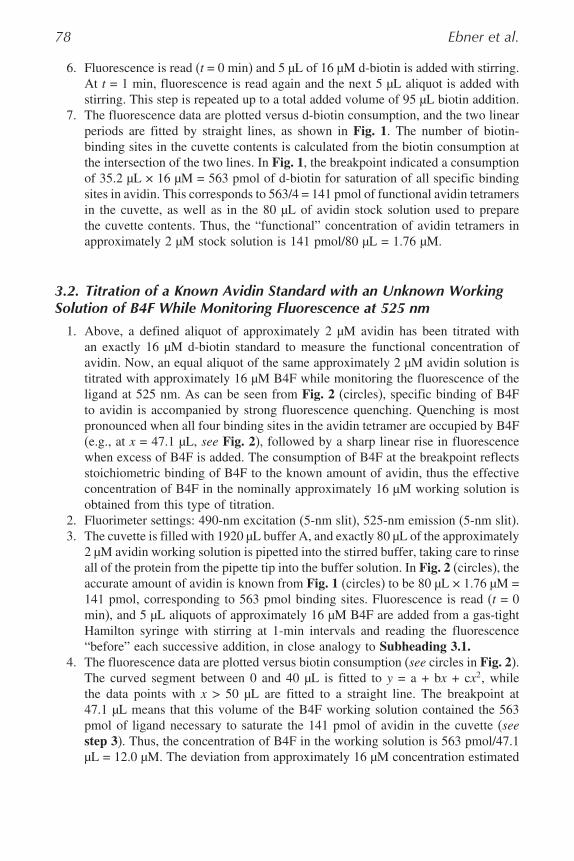
1. Above, a defined aliquot of approximately 2 μM avidin has been titrated withan exactly 16 μM d-biotin standard to measure the functional concentration ofavidin. Now, an equal aliquot of the same approximately 2 μM avidin solution istitrated with approximately 16 μM B4F while monitoring the fluorescence of theligand at 525 nm. As can be seen from Fig. 2 (circles), specific binding of B4Fto avidin is accompanied by strong fluorescence quenching. Quenching is mostpronounced when all four binding sites in the avidin tetramer are occupied by B4F(e.g., at x = 47.1 μL, see Fig. 2), followed by a sharp linear rise in fluorescencewhen excess of B4F is added. The consumption of B4F at the breakpoint reflectsstoichiometric binding of B4F to the known amount of avidin, thus the effectiveconcentration of B4F in the nominally approximately 16 μM working solution isobtained from this type of titration.
2. Fluorimeter settings: 490-nm excitation (5-nm slit), 525-nm emission (5-nm slit).3. The cuvette is filled with 1920 μL buffer A, and exactly 80 μL of the approximately
2 μM avidin working solution is pipetted into the stirred buffer, taking care to rinseall of the protein from the pipette tip into the buffer solution. In Fig. 2 (circles), theaccurate amount of avidin is known from Fig. 1 (circles) to be 80 μL × 1.76 μM =141 pmol, corresponding to 563 pmol binding sites. Fluorescence is read (t = 0min), and 5 μL aliquots of approximately 16 μM B4F are added from a gas-tightHamilton syringe with stirring at 1-min intervals and reading the fluorescence“before” each successive addition, in close analogy to Subheading 3.1.
4. The fluorescence data are plotted versus biotin consumption (see circles in Fig. 2).The curved segment between 0 and 40 μL is fitted to y = a + bx + cx2, whilethe data points with x > 50 μL are fitted to a straight line. The breakpoint at47.1 μL means that this volume of the B4F working solution contained the 563pmol of ligand necessary to saturate the 141 pmol of avidin in the cuvette (seestep 3). Thus, the concentration of B4F in the working solution is 563 pmol/47.1μL = 12.0 μM. The deviation from approximately 16 μM concentration estimated
Biotin-4-Fluorescein in Homogeneous Fluorescence Assays 79
Fig. 2. Titration of avidin with biotin-4-fluorescein (B4F) in a stirred cuvette whilemonitoring emission of B4F. Buffer A, 1920 μL, was mixed with 80 μL of 1.76 μMavidin (563 pmol binding sites, see Fig. 1) and stirred while adding 5 μL portions ofapproximately 16 μM B4F (circles) from a Hamilton syringe at 1-min time intervals.Consumption of 47.1 μL B4F at the breakpoint (circles) indicates a concentrationof 563 pmol/47.1 μL = 12.0 μM in the working solution of B4F. Parallel controlexperiments with the same amount of avidin but pre-blocked with 10 μL 4 mM biotin(open triangles) or without any avidin (filled squares) indicated that binding of B4F isfully specific.
from UV-Vis absorbance (see Subheading 2.2.) must be attributed to the factthat B4F has an actual molar absorptivity which significantly differs from thenominal value 68,000/M/cm at pH 9. The alternate explanation, that is, presenceof free fluorescein without biotin residues, is less likely because parallel thin layerchromatography of B4F indicated high purity (not shown). Moreover, the samediscrepancy has been observed before (4).
3.3. Estimation of Avidin in Complex Biofluids by Titration with B4F(“Forward Titration”)
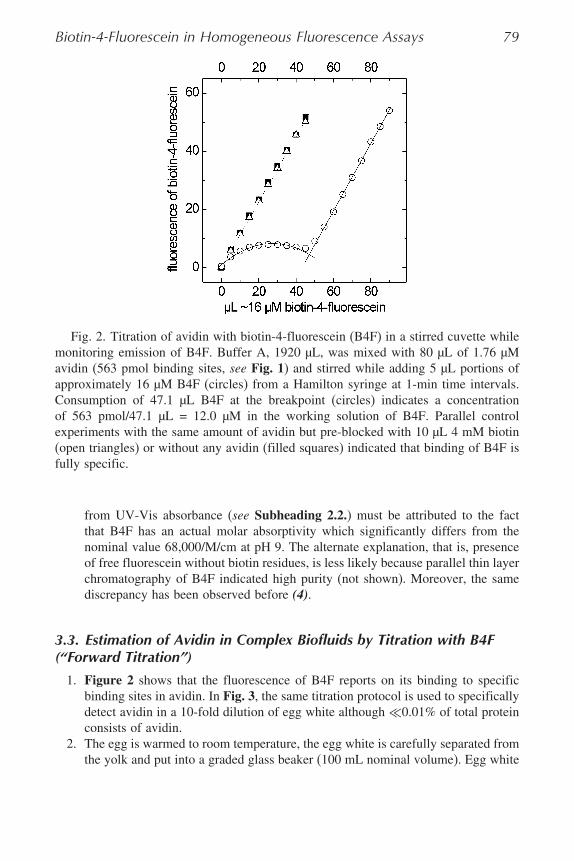
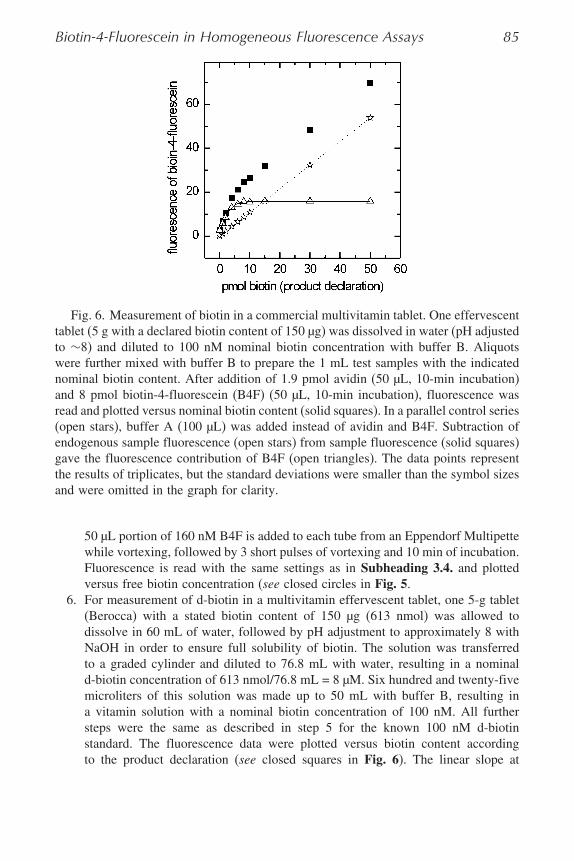
1. Figure 2 shows that the fluorescence of B4F reports on its binding to specificbinding sites in avidin. In Fig. 3, the same titration protocol is used to specificallydetect avidin in a 10-fold dilution of egg white although �0.01% of total proteinconsists of avidin.
2. The egg is warmed to room temperature, the egg white is carefully separated fromthe yolk and put into a graded glass beaker (100 mL nominal volume). Egg white
80 Ebner et al.
Fig. 3. Measurement of avidin in egg white with biotin-4-fluorescein (B4F). Ineach experiment, a 2 mL aliquot of 10-fold diluted egg white was titrated with 5 μLincrements of 10.1 μM B4F, in close analogy to Fig. 2, except that another batch ofB4F working reagent was used. The curves for egg no. 1, 2, and 3 (numbered from topto bottom) were vertically displaced by multiples of 15 fluorescence units to avoid dataoverlap, only the curve for egg no. 4 is shown as measured. The breakpoints betweenthe curved segments and the straight lines were determined as 12.3, 16.9, 29.5, and61.5 μL, corresponding to functional avidin contents of 31, 43, 125, and 155 pmol in2 mL of 10-fold diluted egg white, respectively. The total avidin and protein contentsof each egg is shown in Table 1.
contaminated with yolk must be discarded because the latter contains much d-biotin. The volume is recorded and the egg white is stirred with a magnetic spinbar without causing bubble formation. After 2 min, an equal volume of bufferis slowly added within 3 min. Ten milliliters of the mixture is transferred into agraded cylinder and diluted to 50 mL with buffer A.
3. In the fluorimeter cuvette, 2 mL of the 10-fold diluted egg white is stirred andtitrated with successive 5 μL aliquots from a approximately 16 μM B4F workingsolution at 1-min intervals, as described in Subheading 3.2. for a sample of pureavidin.
4. Figure 3 shows the results obtained with four different eggs. The bottom curveis shown as measured while the other curves have been vertically displaced by15, 30, and 45 fluorescence units to avoid overlap. The bottom curve shows thehighest avidin contents. The next curve indicates less avidin but it shows more
Biotin-4-Fluorescein in Homogeneous Fluorescence Assays 81
quenching in the breakpoint region than any other curve. This means that this eggwhite was least contaminated with biotin while in the other egg whites avidin hadbeen partially occupied with endogenous biotin.
3.4. Titration of a Known Amount of B4F with an Unknown Sampleof Avidin (“Reverse Titration”)
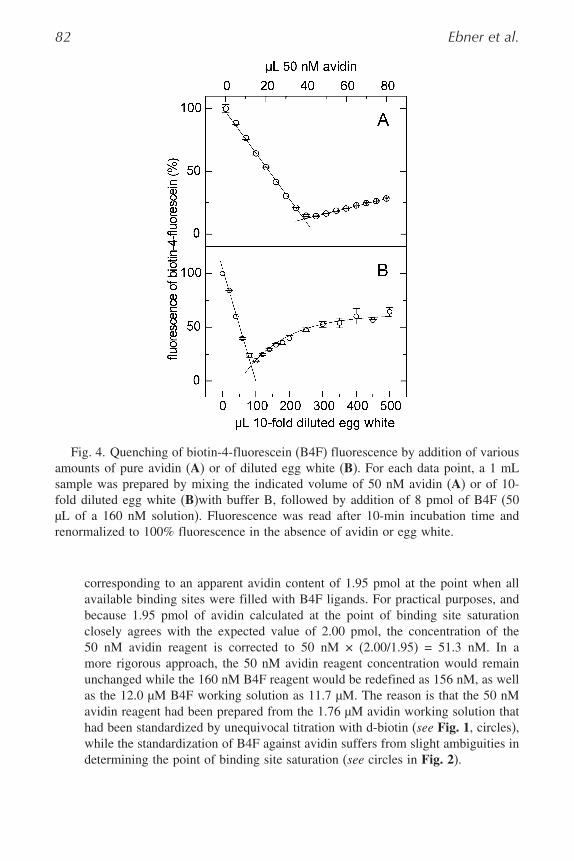
1. Gradual titration of avidin with B4F (“forward titration,” Subheading 3.3.) isaccompanied by a nonlinear fluorescence response (see Figs 2 and 3) becausefluorescence quenching is much stronger when 3–4 rather than 1–2 ligands arebound per avidin tetramer (4). In contrast, a linear dose response is observedin “reverse titration,” that is, when, for instance, ≤2 pmol of avidin tetramer isadded to a fixed amount of 8 pmol B4F. Under such conditions, B4F is eitherunbound or it takes part in a 4:1 complex between B4F and (strept)avidin, thusthe average fluorescence of the fluorescent biotins linearly correlates with theamount of avidin added (at 0 < x < 50 μL in Fig. 4A). Fluorescence quenchingis maximal when 2 pmol of avidin are mixed with 8 pmol of B4F (at x = 40 μLin Fig. 4A). Higher amounts of avidin, however, result in partial fluorescencerecovery because now less than 4 ligands are bound per avidin tetramer in whichcase quenching is weaker (at x > 40 μL in Fig. 4A). The same dose responseshave been reported for streptavidin (5) and for various derivatized forms of avidinor streptavidin (6).
2. Fortunately, a linear dose response of 8 pmol B4F is also observed when crudeegg white with <2 pmol of avidin is added to 8 pmol of B4F (see Fig. 4B), thus“reverse titration” is applicable to crude biological samples also.
3. Fluorimeter settings: 490-nm excitation wavelength (10-nm slit), 525-nm emissionwavelength (10-nm slit).
4. Twenty-five milliliters of 160 nM B4F reagent is prepared by dilution of an aliquotfrom the approximately 16 μM working solution that has been standardized asshown in Fig. 2 (circles). In our test series, 333 μL of 12.0 μM B4F was madeup to 25 mL with buffer A.
5. Twenty-five milliliters of 50 nM avidin reagent is prepared by mixing buffer B(not buffer A) with an aliquot of the approximately 2 μM avidin working solutionthat has been standardized as shown in Fig. 1 (circles). In our example, 710 μLof 1.76 μM avidin was made up to a volume of 25 mL with buffer B.
6. For a typical calibration curve, n × 17 polystyrene tubes (for n replicates, 4 mLtube volume) are filled with 1000 – x μL of buffer B (not buffer A) plus x μLof 50 nM avidin reagent (x = 0, 5, 10, … 80). To each tube, 50 μL of 160 nMB4F is added from an Eppendorf Multipette while vortexing, followed by 3 shortpulses of vortexing, 10 min of incubation, and reading of fluorescence in a smallcuvette, taking care to let the photomultiplier recover from shut-down each timeafter lid closure.
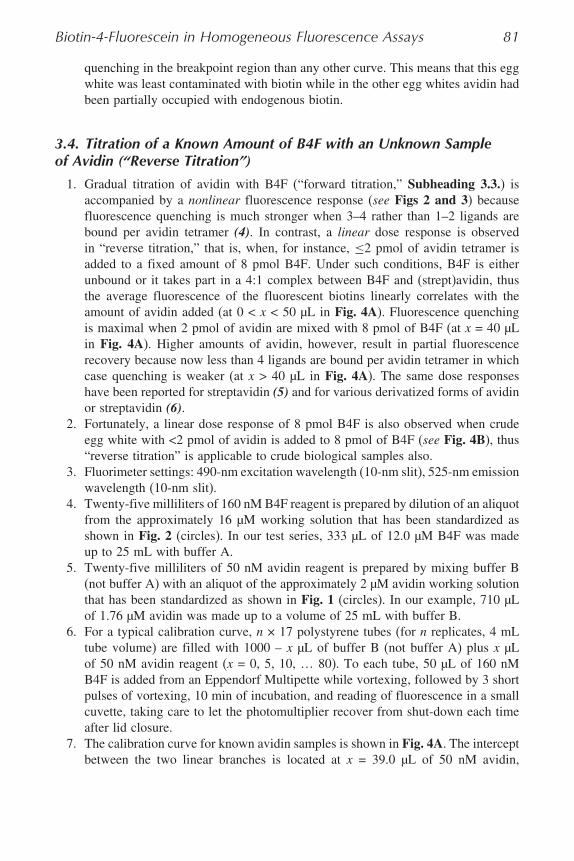
7. The calibration curve for known avidin samples is shown in Fig. 4A. The interceptbetween the two linear branches is located at x = 39.0 μL of 50 nM avidin,
82 Ebner et al.
Fig. 4. Quenching of biotin-4-fluorescein (B4F) fluorescence by addition of variousamounts of pure avidin (A) or of diluted egg white (B). For each data point, a 1 mLsample was prepared by mixing the indicated volume of 50 nM avidin (A) or of 10-fold diluted egg white (B)with buffer B, followed by addition of 8 pmol of B4F (50μL of a 160 nM solution). Fluorescence was read after 10-min incubation time andrenormalized to 100% fluorescence in the absence of avidin or egg white.
corresponding to an apparent avidin content of 1.95 pmol at the point when allavailable binding sites were filled with B4F ligands. For practical purposes, andbecause 1.95 pmol of avidin calculated at the point of binding site saturationclosely agrees with the expected value of 2.00 pmol, the concentration of the50 nM avidin reagent is corrected to 50 nM × (2.00/1.95) = 51.3 nM. In amore rigorous approach, the 50 nM avidin reagent concentration would remainunchanged while the 160 nM B4F reagent would be redefined as 156 nM, as wellas the 12.0 μM B4F working solution as 11.7 μM. The reason is that the 50 nMavidin reagent had been prepared from the 1.76 μM avidin working solution thathad been standardized by unequivocal titration with d-biotin (see Fig. 1, circles),while the standardization of B4F against avidin suffers from slight ambiguities indetermining the point of binding site saturation (see circles in Fig. 2).
Biotin-4-Fluorescein in Homogeneous Fluorescence Assays 83
8. The egg white series in Fig. 4B was prepared in the same way as the calibrationseries in Fig. 4A, except that the indicated volumes (see x axis) of 10-fold dilutedegg white (see Subheading 3.3.) were made up to 1 mL with buffer B before the50 μL portions of 160 nM B4F were added. Interestingly, the clear-cut titrationcurve in Fig. 4B was obtained from the egg white having the lowest avidincontent (see top curve in Fig. 4A). The breakpoint between the linear fall and thenonlinear rise in Fig. 4B was determined at x = 86.1 μL of 10-fold diluted eggwhite. At this point, 8 pmol of B4F was bound by exactly 2 pmol of avidin, thusthe avidin concentration in the 10-fold diluted egg white was 2 pmol/86.1 μL =23.2 μM, corresponding to 10.2 nmol (0.68 mg) of avidin in 44 mL of undilutedegg white for egg no. 1 (see Table 1). The discrepancy is explained by partialdenaturation (see Notes 1–9) at low avidin concentration in a stirred cuvette (seeFig. 3, Table 1) which is absent in unstirred plastic tubes (see Fig. 4B).
3.5. Measurement of Unlabeled Biotin in Complex Samplesby Competition with B4F for the Binding Sites in Avidin
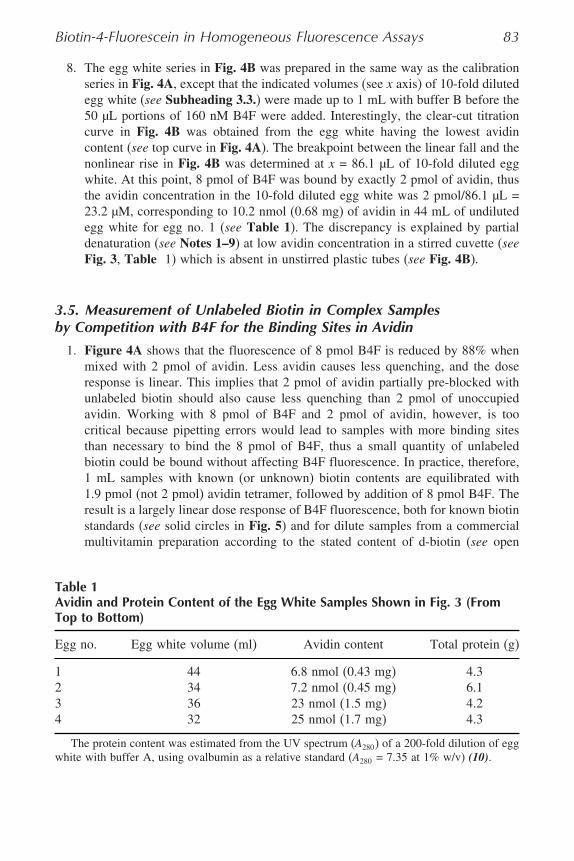
1. Figure 4A shows that the fluorescence of 8 pmol B4F is reduced by 88% whenmixed with 2 pmol of avidin. Less avidin causes less quenching, and the doseresponse is linear. This implies that 2 pmol of avidin partially pre-blocked withunlabeled biotin should also cause less quenching than 2 pmol of unoccupiedavidin. Working with 8 pmol of B4F and 2 pmol of avidin, however, is toocritical because pipetting errors would lead to samples with more binding sitesthan necessary to bind the 8 pmol of B4F, thus a small quantity of unlabeledbiotin could be bound without affecting B4F fluorescence. In practice, therefore,1 mL samples with known (or unknown) biotin contents are equilibrated with1.9 pmol (not 2 pmol) avidin tetramer, followed by addition of 8 pmol B4F. Theresult is a largely linear dose response of B4F fluorescence, both for known biotinstandards (see solid circles in Fig. 5) and for dilute samples from a commercialmultivitamin preparation according to the stated content of d-biotin (see open
Table 1Avidin and Protein Content of the Egg White Samples Shown in Fig. 3 (FromTop to Bottom)
Egg no. Egg white volume (ml) Avidin content Total protein (g)
1 44 6.8 nmol (0.43 mg) 4.32 34 7.2 nmol (0.45 mg) 6.13 36 23 nmol (1.5 mg) 4.24 32 25 nmol (1.7 mg) 4.3
The protein content was estimated from the UV spectrum (A280) of a 200-fold dilution of eggwhite with buffer A, using ovalbumin as a relative standard (A280 = 7.35 at 1% w/v) (10).
84 Ebner et al.
Fig. 5. Homogeneous fluorescence assay for unlabeled biotin. One milliliter samplesof buffer B with the indicated content of d-biotin (solid circles) were mixed with1.9 pmol of avidin (in 50 μL), incubated for 10 min, mixed with 8 pmol of biotin-4-fluorescein (in 50 μL), and incubated for another 10 min before reading fluorescence.The fluorescence at the highest biotin concentration was renormalized to 100%. Theopen triangles were measured from a commercial multivitamin tablet, and they areidentical to the open triangles in Fig. 6, except that the maximal fluorescence at highbiotin concentration was renormalized to 100% in this Fig. 5. All data points representthe results of triplicates, but the standard deviations were smaller than the symbol sizesand were omitted from the graph for clarity.
triangles in Fig. 5), taking into account endogenous fluorescence of the multivi-tamin solution (see Fig. 6 and below).
2. d-Biotin, 100 nm, is freshly prepared from 156 μL of a 16 μM d-biotin standardsolution (freshly thawed in ∼25°C water) plus buffer B (not buffer A) in a finalvolume of 25 mL.
3. Avidin, 38 nM, is prepared by proper dilution of the 50 nM avidin stock solution(see Subheading 3.4.) with buffer B (not buffer A). Based on the breakpointin Fig. 4A, the 50 nM avidin concentration had been corrected to 51.3 nM (seeSubheading 3.4.). Therefore, the 38 nM avidin solution was prepared by diluting18.5 mL 51.3 nM avidin reagent to 25 mL with buffer B.
4. The 160 nM B4F reagent is identical to that described in Subheading 3.4. (seeFig. 4A and B).
5. For the calibration curve (see closed circles in Fig. 5), 1000 – x μL of buffer B(not buffer A) and x μL of 100 nM d-biotin (x = 0, 10, 20, 40, 60, 80, 100, 150,300, and 500, optionally in triplicates) are mixed in 4-mL polystyrene tubes, and a50 μL portion each of 38 nM avidin is added from an Eppendorf Multipette whilevortexing, followed by 3 short pulses of vortexing. After 10 min of equilibration, a
Biotin-4-Fluorescein in Homogeneous Fluorescence Assays 85
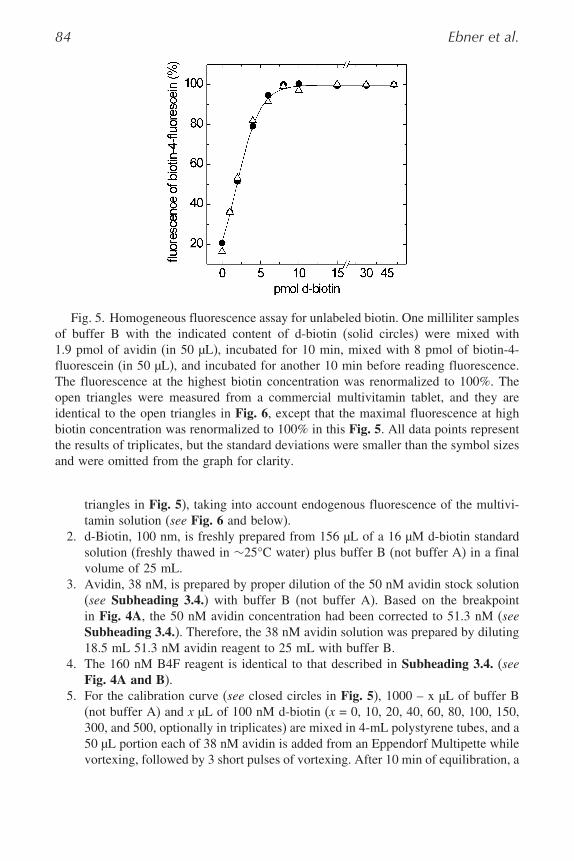
Fig. 6. Measurement of biotin in a commercial multivitamin tablet. One effervescenttablet (5 g with a declared biotin content of 150 μg) was dissolved in water (pH adjustedto ∼8) and diluted to 100 nM nominal biotin concentration with buffer B. Aliquotswere further mixed with buffer B to prepare the 1 mL test samples with the indicatednominal biotin content. After addition of 1.9 pmol avidin (50 μL, 10-min incubation)and 8 pmol biotin-4-fluorescein (B4F) (50 μL, 10-min incubation), fluorescence wasread and plotted versus nominal biotin content (solid squares). In a parallel control series(open stars), buffer A (100 μL) was added instead of avidin and B4F. Subtraction ofendogenous sample fluorescence (open stars) from sample fluorescence (solid squares)gave the fluorescence contribution of B4F (open triangles). The data points representthe results of triplicates, but the standard deviations were smaller than the symbol sizesand were omitted in the graph for clarity.
50 μL portion of 160 nM B4F is added to each tube from an Eppendorf Multipettewhile vortexing, followed by 3 short pulses of vortexing and 10 min of incubation.Fluorescence is read with the same settings as in Subheading 3.4. and plottedversus free biotin concentration (see closed circles in Fig. 5.
6. For measurement of d-biotin in a multivitamin effervescent tablet, one 5-g tablet(Berocca) with a stated biotin content of 150 μg (613 nmol) was allowed todissolve in 60 mL of water, followed by pH adjustment to approximately 8 withNaOH in order to ensure full solubility of biotin. The solution was transferredto a graded cylinder and diluted to 76.8 mL with water, resulting in a nominald-biotin concentration of 613 nmol/76.8 mL = 8 μM. Six hundred and twenty-fivemicroliters of this solution was made up to 50 mL with buffer B, resulting ina vitamin solution with a nominal biotin concentration of 100 nM. All furthersteps were the same as described in step 5 for the known 100 nM d-biotinstandard. The fluorescence data were plotted versus biotin content accordingto the product declaration (see closed squares in Fig. 6). The linear slope at
86 Ebner et al.
high biotin concentrations was obviously due to endogenous fluorescence of thevitamin solution in absence of B4F. This was confirmed in a repetition of thesame tube series in which 100 μL buffer A was added instead of 50 μL avidin and50 μL of B4F (see open stars in Fig. 6). The difference between the two curves(squares and stars) gave the fluorescence contribution of B4F in each sample.It was renormalized to 100% fluorescence at the maximal biotin content andplotted in Fig. 5 (open triangles). The perfect agreement with the calibration curve(see solid circles in Fig. 5) clearly shows that the tablet contained exactly thestated amount of d-biotin and that the correction method for endogenous samplefluorescence shown in Fig. 6 is valid.
4. Notes1. EDTA in buffer A is optional and can be omitted, if desired. The high buffering
capacity of 50 mM phosphate is necessary to quickly dissolve d-biotin whenpreparing the 4 mM stock solution. For all other purposes, buffer A can bereplaced by phosphate-buffered saline or similar.
2. Sodium azide (5 mM) may be used only to preserve the stock solutions ofavidin and streptavidin. Azide should be avoided in the measuring buffer and isstrictly prohibited in solutions of d-biotin and B4F as it greatly accelerates biotindegradation by an unknown mechanism.
3. Fluorescein is a particularly light-sensitive fluorophore, therefore, bright light isavoided and aluminum foil is used to protect samples of B4F from light.
4. For minimization of bleaching (of tryptophane and of B4F) in the fluorimeter,the shutter is kept closed until the start of the fluorescence titration. Bleachingcan further be lowered when reducing the excitation slit which results in a noisiersignal and can partially be compensated for by a longer integration time.
5. When titrating (strept)avidin with d-biotin, cumulative titration of one avidinsample in a stirred cuvette (see circles in Fig. 1) is much preferred becausenoncumulative titration (in a series of tubes with different biotin/avidin ratios)is tedious and the data scatter more than explained by imprecisions of pipetting.The obvious reason is that tryptophane fluorescence is relatively weak, thus themeasurement is sensitive to environmental dust (even with filtered buffers). Theamount of dust is constant in cumulative titration but variable in noncumulativetitration. As expected, no such discrepancy in the data quality of cumulativeversus noncumulative titration is seen when titrating (strept)avidin with B4Fand measuring fluorescence at long wavelength (see circles in Fig. 2, “forwardtitration”). Nevertheless, cumulative titration in the stirred cuvette is preferredbecause of much shorter assay time and because the gas-tight Hamilton syringeserves as a burette which ensures high volumetric accuracy even with untrainedpersonnel.
6. The procedures for titration of streptavidin with d-biotin of B4F are the same asfor avidin, and the data are very similar (3,4).
Biotin-4-Fluorescein in Homogeneous Fluorescence Assays 87
7. The results from the cumulative titration of avidin with d-biotin (see Fig. 1) wereconfirmed by noncumulative titration in two series with 17 polystyrene tubeseach: A variable volume of buffer A plus 25 μL of the same approximately 2 μMstock solution and a variable volume (0, 25, 50, � � � 400 μL) of exactly 1 μMd-biotin (prepared by diluting 16 μM d-biotin with buffer A) were mixed at afinal volume of 1 mL. After 10 min, each sample was poured in a small cuvette,and the fluorescence at 340 nm (10-nm slit) was read while exciting at 290 nm(10-nm slit). The plot of tryptophane fluorescence versus μL of 16 μM d-biotin(not shown) was similar to Fig. 1 (circles). The breakpoint at 179 μL 1 μMd-biotin (179 pmol) indicated an effective avidin concentration of 44.8 pmol/25μL = 1.79 μM in the approximately 2 μM avidin stock solution. The secondseries indicated a functional avidin concentration of 1.72 μM. Both values nicelyconfirm the 1.76 μM obtained in the cumulative titration shown in Fig. 1.
8. It should be mentioned that since the year 2003, no functional avidin has beendetectable in chicken eggs purchased in local stores, the only exception beingeggs from organic farms. The likely reason is the use of new animal feed withexcessive contents of d-biotin.
9. The egg white in the top curve of Fig. 3 was cross-checked with “reversetitration” (see Fig. 4B). The 1.5-fold avidin content found in the latter method(see Subheading 3.3. and Fig. 4B) indicates that cumulative titration in a stirredcuvette leads to significant denaturation at such low avidin contents, thus “reversetitration” in plastic tubes (see Subheading 3.4.) is the method of choice formeasurement of avidin in dilute samples. In contrast, only 2.5% disagreementbetween cumulative “forward titration” (see Fig. 2) and noncumulative “reversetitration” (see Fig. 4A) was found because the avidin concentration in the stirredcuvette was high enough (>100 pmol/2 mL, as in Fig. 2). It can be summarizedthat stirring in the quartz cuvette causes denaturation at <100 pmol of avidin (in2 mL of sample) which is not prevented by the high protein content of egg white,whereas long-term incubation and only short vortexing in plastic tubes does notcause any denaturation, even at very low (strept)avidin concentrations (as in Figs4–6), provided that 0.1 mg/mL of BSA is included (4,5).
AcknowledgmentThis work was supported by the Austrian Science Foundation (FWF-
P15295).
References1. Gruber, H. J., Marek, M., Schindler, H., and Kaiser, K. (1997) Biotin-fluorophore
conjugates with poly(ethylene glycol) spacers retain intense fluorescence afterbinding to avidin and streptavidin. Bioconjug. Chem. 8, 552–559.
88 Ebner et al.
2. Marek, M., Kaiser, K., and Gruber, H. J. (1997) Biotin-pyrene conjugates withpoly(ethylene glycol) spacers are convenient fluorescent probes for avidin andstreptavidin. Bioconjug. Chem. 8, 560–566.
3. Gruber, H. J., Kada, G., Marek, M., and Kaiser, K. (1998) Accurate titration ofbiotin-binding sites in avidin and streptavidin with biotin-fluorophore conjugates.Biochim. Biophys. Acta 1381, 203–212.
4. Kada, G., Falk, H., and Gruber, H. J. (1999) Accurate measurement of avidin andstreptavidin in crude biofluids with a new, optimized biotin-fluorescein conjugate.Biochim. Biophys. Acta 1427, 33–43.
5. Kada, G., Kaiser, K., and Gruber, H. J. (1999) Rapid estimation of avidin and strep-tavidin by fluorescence quenching or fluorescence polarization. Biochim. Biophys.Acta. 1427, 44–48.
6. Humbert, N., Zocchi, A., and Ward, T. R. (2005) Electrophoretic behaviour ofstreptavidin complexed to a biotinylated probe: a functional screening assay forbiotin-binding proteins. Electrophoresis 26, 47–52.
7. Gruber, H. J., Hahn, C. D., Kada, G., Riener, C, Harms, G. S., Ahrer, W.,Dax, T. G., and Knaus, H.-G. (2000) Anomalous fluorescence enhancement ofCy3 and Cy3.5 versus anomalous fluorescence loss of Cy5 and Cy7 upon covalentlinking to proteins and noncovalent binding to avidin. Bioconjug. Chem. 11,696–704.
8. Lin, H. J., and Kirsch, J. F. (1979) A rapid, sensitive fluorometric assay for avidinand biotin. Methods Enzymol. 62, 287–289.
9. The Handbook – A Guide to Fluorescent Probes and Labeling Technologies,http://probes.invitrogen.com/handbook/sections/0400.html.
10. Kirschenbaum, D. M. (1975) Molar absorptivity and A1% values for proteins atselected wavelengths of the ultraviolet and visible regions. Anal. Biochem. 64,186–213.