PROCEEDINGS OF THE 7 YSF SYMPOSIUM - National ...
205
Proceedings of the 7 th YSF Symposium 2018 PROCEEDINGS OF THE 7 th YSF SYMPOSIUM JANUARY 19, 2018 Young Scientists Forum National Science and Technology Commission
-
Upload
khangminh22 -
Category
Documents
-
view
1 -
download
0
Transcript of PROCEEDINGS OF THE 7 YSF SYMPOSIUM - National ...

Proceedings of the 7th YSF Symposium 2018
PROCEEDINGS OF THE 7th YSF SYMPOSIUM
JANUARY 19, 2018
Young Scientists Forum
National Science and Technology Commission

Proceedings of the 7th YSF Symposium 2018
7th YSF SYMPOSIUM
January 19, 2018
Organized by
Young Scientists Forum
National Science and Technology Commission
Chief Editor
Dr. Asitha Bandaranayake
Editorial Board
Dr. Darshani Bandupriya
Dr. Usha Hettiarachchi
Dr. Chulantha Jayawardena
Dr. Meththika Vithanage
Dr. Lasantha Weerasinghe

Proceedings of the 7th YSF Symposium 2018
© National Science and Technology Commission
Responsibility of the content of papers included in this publication remains
with the respective authors but not the National Science and technology
Commission.
ISBN: 978-955-8630-10-5
Published by:
National Science and Technology Commission
No. 31/9, 31/10, Dudley Senanayake Mawatha
Colombo 08
www.nastec.lk


Proceedings of the 7th YSF Symposium 2018 i
Table of Content
Message from the Chairman, National Science and Technology Commission
vi
Message from the Director, National Science and Technology Commission
vii
Message from the Steering Committee Chairman, Young Scientists Forum
viii
Forward by the Editors
ix
- Research Papers –
The effect of nutritional stress on cyanobacteria during its mass culturing A.M. Aasir, N. Gnanavelrajah, Md. Fuad Hossain, K.L. Wasantha Kumara and R.R. Ratnayake
1
Diversity of wild rice species of Sri Lanka: some reproductive traits A.V.C. Abhayagunasekara, D.K.N.G. Pushpakumara, W.L.G. Samarasinghe and P.C.G.Bandaranayake
7
Statistical assessment of potable groundwater quality in villages of Pavatkulam, Vavuniya N. Anoja
11
Maternal vitamin D levels during 3rd
trimester of pregnancy, lactation and its relationship with vitamin D level of their offspring among a selected population of mothers in Sri Lanka. K. Anusha, G.S.H. Liyanage and U.P.K Hettiarachchi
15
Phosphorus solubilizing ability of antagonistic fungi on Rigidoporus microporus isolated from Sri Lankan rubber growing lands P.W. Balasooriya, T.H.P.S. Fernando
and O.V.D.S.J. Weerasena
19
DNA extraction from Cinnamomum Zelanicum, Cinnamon: a simple and efficient method C.H.W.M.R. B. Chandrasekara, D.K.N.G. Pushpakumara and P.C.G. Bandaranyake
22
Effects of aqueous electrolyte concentration on electrochemical characterization of activated carbon-based super capacitors G. G. Chathuranga, H.T.D.S. Madusanka, S.P.A.U.K. Samarakoon, P.G.D.C.K. Karunarathna, U.S. Liyanaarahchi and C.A.N. Fernando
26
Inhibition of lipid oxidation in mechanically deboned meat by adding natural antioxidants W.V.A.H. Chathurika, E.A.P. Vinodini
, H.W. Cyri and C. Nishshanka
30

Proceedings of the 7th YSF Symposium 2018 ii
Microbiological changes during processing and shelf life in ultra-high temperature milk W.V.A.H. Chathurika
and J.K. Vidanarachchi
34
Vegetative propagation performance of Moringa oleifera Lam. D.M.G.C. Dissanayake and R.D.N Debarawatta
38
Synthesis of layered Γ-Alumina via the reaction of metal organic framework mil-53(Al)-Fa with N, N, dimethylformamide vapour W. D. K. K.Gnanarathna and A. C. A. Jayasundera
44
An assessment of urban coastal ecosystems as a landscape aesthetic in selection of housing location: a case study of Negombo lagoon in Sri lanka T.P.S.R.Guruge, U.K Jayasinghe-Mudalige, D Weerakoon and S.P Premarathne
47
Evaluation of wound healing activity of Ceylon cinnamon (Cinnamomum Zeylanicum) H.M.I.M.Herath, R.P.V.J. Rajapakse and K.Vivehananthan
54
Determinants of agro-based loan non-performance of People’s Bank in Kurunegala region, Sri Lanka H.B.C.M. Hitibandara, L.P. Rupasena, A.I.Y. Lankapura
and D.A.M. Perera
58
Comparative Study on bycatch ratio of selected small scale fisheries in Jaffna, Sri Lanka K. Kalaivanan, S. Sutharshiny and K. Sivashanthini
62
Impedance analysis of the Cu/N-Cu2o/P-Ag2o/N-Cu2o Photoelectrode at the electrolyte interface P.G.D.C.K. Karunarathna, S.P.A.U.K. samarakoon, G.G. Chathuranga, H.T.D.S. Madusanka, U.S. Liyanaarachchi and C.A.N. Fernando
66
Impact of gamma irradiation on the fatty acid profile of some traditional rice (Oryza sativa.L) varieties of Sri Lanka M.P.U.Kumara and E.M.R.K.B. Edirisinghe
70
Sub Chronic Toxicity assessment of antidiabetic medicinal plant extract mixture in healthy Wistar rats D.S.N.K. Liyanagamage, V. Karunaratne, A.P. Attanayake
and S. Jayasinghe
74
Sri-Lankan reference standards for spirometry in children aged 8-16 years G. Liyanage, M. Aaqiff and B.D.W. Jayamanne
77
Enhanced biodegradation efficiency of phenol by Klebsiella pneumoniae, Staphylococcus warneri, Klebsiella variicola and Ochrobactrum intermedium W.S.P. Madhuranga, K. Vivehananthan and M.P. Dassanayaka
82

Proceedings of the 7th YSF Symposium 2018 iii
Fabrication of Environment friendly visible Photodetector based on n-Cu2o/p-Cui heterojunction H.T.D.S. Madusanka G.G. Chathuranga, S.P.A.U.K. Samarakoon, P.G.D.C.K. Karunarathna, U.S. Liyanaarahchi and C.A.N. Fernando
86
Belt loop preparing mechanism of a belt loop attaching machine W.A.R. Nandana and M.A.D.R. Viraj
90
A comparative study on available matrices for quality assessment of a de-novo transcriptome assembly D.N.U. Naranpanawa, A.U. Bandaranayake and P.C.G. Bandaranayake
94
The Effect of Tragia involucratalinn. on high fat diet induced hyperlipidemic rats M. S. Pallie, P.K. Perera, C.L. Goonasekera, K.M.N. Kumarasinghe and L.D.A.M. Arawwawala
99
Yet another cantor-like set A.A.S. Perera and B.G.M.S. Sriyananda
103
Clay-biochar composites for sorptive removal of tetracycline antibiotics in aqueous media K. S. D. Premarathna, M. Vithanage, L. Weerasundara and
A.U. Rajapaksha
106
Gender differences of bio-impendence analysis, somatotyping and selected anthropometric markers of adiposity and the association with insulin resistance in healthy male and female population in Sri Lanka R.G.L. Rathnayake, U.P.K. Hettiaratchi and P.P.R. Perera
110
Prophylactic and therapeutic chronic anti-inflammatory effect of Acronychia pedunculata leaves on adjuvant-induced arthritis rat model W. M. K. M. Ratnayake, T. S. Suresh, A. M. Abeysekera, N. Salim and U. G. Chandrika
114
Characterisation of RGO as an electron acceptor on p-Cu2o and n-Cu2o Photoelectrodes S.P.A.U.K. Samarakoon, P.G.D.C.K. Karunarathna, G.G. Chathuranga, H.T.D.S. Madusanka, U.S. Liyanaarahchi and C.A.N. Fernando
118
Performances of the second generation of Ambakelle special palms with the year-round climatic variation C.R.K.Samarasinghe, M.K. Meegahakumbura, H.D.M.A.C. Dissanayake and L. Perera
122
Factors influencing fertilizer adoption by medium and large scale coconut farmers in Gampaha district, Sri Lanka S.D.N.M. Senadheera, A.M.K.R. Bandara and A.I.Y. Lankapura
126

Proceedings of the 7th YSF Symposium 2018 iv
Risk of metabolic syndrome: a comparison among hypertensive and non-hypertensive subjects T.K.R.R.Senarathne, U. P. K. Hettiarachchi and L.V. Athiththan
129
Acceptability and proximate valuation on a new biscuit by an underutilized fruit Pouteria campechina [Lavulu] J.M.A.M. Sewwandi, N.
Thiruchchelvan and U.M. A. Kumara
133
Fitting the Arima model of the under-five mortality rate in Sri Lanka N. Shaminy
136
Optimization of the protocol to assess the effectiveness of solvent extracts of prospective antagonistic plant species against white root disease of rubber M.K.R.Silva, T.H.P.S. Fernando and B.V.A. Umesha
140
Production of quality compost using locally available resources A. Sivachchanthirika and N.Gnanavelrajah
146
Evaluation of traditional practices to manage callosobruches sp. (pulse beetle) in black grams' storage W.G. Sunethra, U.M.A. Kumara and N.
Thiruchchelvan
149
The Effect of gamma irradiation on lipid deterioration of yellowfin tuna (Thunnusal bacares) fish muscle stored in ice I.H.W.Surendra, E.M.R.K.B.Edirisinghe and R.M.N.P.Rathnayake
152
Changes in values of Ph, Tvb-N, aerobic bacterial count and sensory score in Penaeus semisulcatus(De haan, 1844) during refrigerator storage S. Sutharshiny and C. Shobana and K. Sivashanthini
157
Distribution of Entomopathogens in northern Sri Lanka and their potential as bio-agents N. Thiruchchelvan, G Thirukkumaran and G. Mikunthan
162
Assessment of potential removal of Nitrate from synthetic medium by selected herotrophic bacteria – an approach for reducing Nitrate in groundwater of Jaffna peninsula A.Thurairajah, N. Gnanavelrajah and R.R Ratnayake
167
In vitro antioxidant, α -amylase and α- glucosidase enzymes inhibitory properties of five native wild fruits in Sri Lanka H.P.T. Wathsara, K. W. Samarakoon, Sang-Hoon Lee, U. Chanaka and P. Ranasinghe
170
Characterization of a Zinc rechargeable cell with a polyaniline cathode W.A.D.S.S.Weerasinghe, K.P. Vidanapathirana and K.S. Perera
174

Proceedings of the 7th YSF Symposium 2018 v
Developing a low-cost and intelligent environmental control system for greenhouses A.O.Wickramarachchi, K.D.D.S. Weerasekera, J.A.T.K. Wijerathne, R.A. Ragel and A.U. Bandaranayake
177
Analysis of badh2 gene in India, Pakistan and Sri Lankan rice varieties W.V.E. Withana, N.S. Kottearachchi
and J. Weerasena
184
Socio-demographic, occupational and behavioral risk factors that attribute to lumbar disc herniation and degeneration: a case control study in a selected Sri Lankan population N.D. Withanage, S. Prathapan, H. Peiris, S. Perera and L.V. Athiththan
186
Author Index
Panel of Reviewers

Proceedings of the 7th YSF Symposium 2018 vi
Message from the Chairman
National Science and Technology Commission
I am very happy to note that the Young Scientists Forum of the National
Science and Technology Commission (NASTEC) has organized the YSF
Symposium for the 7th consecutive year. This has now become an annual event
of the NASTEC calendar.
The YSF Symposium provides a platform for the young scientists of Sri Lanka to
present and discuss their research findings in a learned environment. In
addition, this symposium will help young and budding researchers of our
country to interact with each other and develop new research collaborations.
The deliberations made at the symposium will undoubtedly contribute to
improve the quality of the future research of our young scientists.
Research papers in several important fields that are identified in the National
Research and Development Framework (NRDF) prepared by the NASTEC are
presented at this symposium. These include water, food, nutrition, agriculture,
health, shelter, environment, energy, basic sciences, emerging technologies
and indigenous knowledge. In addition, some papers in the fields of
humanities and social sciences are also presented indicating the importance of
multidisciplinary approaches.
Immediate research and development interventions needed for enhancing the
economic development of our country and improving the quality of life of our
people have been identified and documented in the NRDF. This serves as a
guideline to select research topics that are of immediate importance to our
country. I request the young scientists to refer the NRDF, which is available in
the NASTEC website, when planning their future research.
The extended abstracts that were received by NASTEC were subjected to a
rigorous double blind review process and only the best papers were selected in
order to maintain the high quality of the symposium. I thank the reviewers for
their valuable contribution.
I thank the YSF Steering Committee and the NASTEC officials for successfully
organizing this symposium.
I wish the 7th YSF Symposium every success.
Professor M.J.S. Wijeyaratne
BSc (Sri Lanka), MSc (Michigan), PhD (Kelaniya), CBiol, FIBiol, FNASSL

Proceedings of the 7th YSF Symposium 2018 vii
Message from the Director
National Science and Technology Commission
As the Director/ CEO of National Science and Technology Commission
(NASTEC) it is my pleasure to issue this message on the occasion of the 7th
Annual Research Symposium of the Young Scientists Forum (YSF) jointly
organized by the NASTEC and YSF.
I take this opportunity to convey an important message to our young scientists
on the importance of revisiting the history of scientific research in Sri Lanka
and where we are now. Did we achieve our expectations by fostering science
and technology in this country well over half a century? If not, what should we
do as young scientists in this country? It is time for you to think about for you
to have a vision for the country. You might think; “that’s too ambitious.” You
would realize that it is not so when you act locally, i.e. in your working
environment with the intension of contributing something for your vision for
the country. Do not stop at that. Team up with your colleagues and broaden
the contribution. When you walk up in your career ladder make sure you have
followers for your vision. You will end up as a leader in the field of science and
technology yet humble enough to respect your seniors.
I hope that the 7th annual YSF symposium would be a great success which adds
values to future leaders in science in Sri Lanka.
Dr. Muditha Liyanagedera

Proceedings of the 7th YSF Symposium 2018 viii
Message from the Steering Committee Chairperson
Young Scientists Forum
It has been identified that the Young Scientists are having to fight harder than
past generations since there is a smaller share of the academic pie as the
number of PhDs are rising, government funding for research has plateaued or
declined, and success rates for grants is low (Maher and Anfres, Nature 2016).
A survey conducted by the Journal “Cell” in 2014 indicated that, a successful
young scientist succeed in funding and writing science as well as many non-
science activities, administrative work, convey and communicate science and
interdisciplinary nature. At such instance, Young Scientists Forum (YSF) of the
National Science and Technology Commission (NASTEC) has been one dwelling
for the young academics, researchers and scientists in Sri Lanka to advance
their scientific careers. The YSF Annual Symposium is one another platform for
the enthusiastic and energetic young scientists in Sri Lanka to show their
performances. I believe the 7th YSF symposium is a productive, informative and
enjoyable one.
It is my honor and privilege to be involved in 7th YSF Symposium, contributing
towards its continued success from 2001. At this proud moment, I would like
to convey my sincere gratitude to Professor M.J.S. Wijeyaratne, the Chairman
of NASTEC and to Dr. Muditha Liyanagedara, the Director of NASTEC for their
invaluable guidance and continued support for all the YSF activities including
the 7th Annual Symposium. I am indeed honored to have the contribution of
the panel of reviewers and evaluators to make the success story of the Annual
Symposium. The appreciative efforts of the dedicated and hardworking
Steering Committee of the YSF are behind the accomplishment, which you are
today experiencing. I wish to thank the Editorial Board and specially Dr. Asitha
Bandaranayake for his untiring efforts for producing the Proceedings of the
Symposium. A special appreciation goes out to Dr. Kalpa Samarakoon, Senior
Scientist of NASTEC and the Symposium Coordinator, for his efforts on all YSF
activities. I wish all the success to the YSF for its pathway to strengthen, build
and guide the Young Scientists in Sri Lanka.
Dr. Meththika Vithanage

Proceedings of the 7th YSF Symposium 2018 ix
Forward
It is with great pleasure, the Young Scientist Forum (YSF) present the
proceedings of the 7th YSF Symposium. The compilation of the peer reviewed
extended abstracts is a representation of the research and scholarly activities
of the members of YSF.
The annual research symposium of the YSF provides an ideal opportunity for
the local young scientists to share the research interests in various disciplines
and to initiate cross discipline collaborations. It is a place of networking, where
constructive scientific feedback is mostly nurtured.
For this year’s annual symposium, 69 extended abstracts were received. The
papers were sent to reviewers after a screening by the editorial board, and 46
extended abstracts were selected through a double-blind review process and
published in this proceedings.
We express our gratitude to all contributing authors for sharing outstanding
research contributions and for the panel of reviewers for invaluable feedback
to enhance the quality of this publication.
The editorial board would like to express their sincere gratitude to Professor
M. J. S. Wijeyaratne, Chairman, National Science and Technology Commission
(NASTEC) for his guidance extended to YSF throughout the year. We are very
much thankful for Dr. Muditha Liyanagedara, The Director, NASTEC for funding
and facilitating the events of YSF with great enthusiasm. Senior Scientist Dr.
Kalpa Samarakoon and NASTEC staff, and the members of the YSF Steering
Committee are also acknowledged for the immense support rendered in
organizing the symposium.
We wish the 7th YSF symposium a great success and extend warm wishes to all
the authors.
Thank You The Editorial Board The proceedings are available on the NASTEC website: http://www.nastec.lk.

Proceedings of the 7th
YSF Symposium - 2018
1
THE EFFECT OF DILUTION OF MEDIUM ON SELECTED CYANOBACTERIA DURING THEIR MASS CULTURING
A.M. Aasir1, N. Gnanavelrajah1, M. F. Hossain2,3, K.L. Wasantha Kumara2 and R.R. Ratnayake*3
1Department of Agricultural Chemistry, Faculty of Agriculture, University of Jaffna, Sri
Lanka. 2Department of Agricultural Biology, Faculty of Agriculture, University of Ruhuna, Sri Lanka.
3National Institute of Fundamental Studies, Kandy, Sri Lanka. *Corresponding author (email: [email protected])
Introduction Cyanobacteria are a group of gram-negative photosynthetic organisms. They have a highly diverse group of prokaryotic microorganisms exhibiting oxygenic photosynthesis and they are known for faster growth rates than terrestrial crops. They are considered to be one of the potential useful organisms to mankind in various ways. A number of important advances have occurred in cyanobacterial biotechnology in the recent years. Worldwide attention is drawn towards cyanobacteria for their possible uses in mariculture, food, feed, fuel, fertilizer, colourant, production of various secondary metabolites including vitamins, toxins, enzymes, pharmaceuticals, pharmacological probes and pollution abatement. Cyanobacteria require variety of nutritional elements such as N, P and some other macro and micro elements. During culturing of cyanobacteria such requirements are provided by BG 11 medium [1] and GO (BG 11-N0) [2] medium. In the growth of cyanobacteria, those nutritions play an important role on their growing pattern, amount of biomass production, content of biomass, activation of enzymes, enzymatic reactions and biosynthesis of compounds such as vitamins. In the commercial scale culturing of cyanobacteria, the use of those chemical medium will demand high cost. Nowadays, the great challenges in cyanobacterial based industry are the increasing cost of growing media and low biomass growth. Therefore, the major limitation for growing cyanobacteria at commercial scale is the high cost of the growing medium. If we want to successfully establish a cyanobacteria mass culture unit, we have to cut down the cost of media. One method to cut down the cost is through dilution of culture media. If any cyanobacteria are able to grow well in diluted media it will be beneficial. However, reductions on the concentrations of available nutrients may change the biomass production rate and the contents of biomass. The objective of the present study is to assess the possibility of mass culturing of selected cyanobacteria in different diluted concentration of media recommended for cyanobacteria and study the performance of selected cyanobacteria during such nutritional stress conditions.
Materials and Methods Unialgal strains of cyanobacteria Three cyanobacterial strains (U1 - Leptolyngbya sp., U2 - Phormidium sp., and U49 - Nostoc sp.)
were taken which were previously collected by biofuel research laboratory of the National Institute of Fundamental Studies (NIFS), Kandy, Sri Lanka.
Media preparation To culture non nitrogen fixing cyanobacteria (U1 - Leptolyngbya sp. and U2 - Phormidium
sp.), the BG 11 medium was prepared due to the method described by stainer and others [1]. To culture nitrogen fixing cyanobacteria (U49 - Nostoc sp.), the GO medium (BG 11- N0) was prepared according to the method described by Ripka and others [2].

Proceedings of the 7th
YSF Symposium - 2018
2
Mass culturing of cyanobacteria 1ml of initial inoculum was taken from those three different species of unialgal culture of cyanobacteria. Those inoculums were cultured in a glass tank with 30ls of 50% and 25% diluted BG 11 and GO media at pH 7.4. The tanks were kept under green house environment with natural light and temperature along with aeration by using aquarium pump (RISHEN RS 2800).
Plate 1: Mass culturing of cyanobacteria in 30ls of media.
Estimation of total dry biomass production Initial weights of filter papers (Whatman 42 Ash less) and volume of water containing cyanobacteria were recorded. Cells were separated from the water by continuous filtration. Then filter papers with cells were oven dried at 60 °C temperature to a constant weight, finally, weight of the filter papers with cells was measured and the weight of biomass was calculated.
Measuring optimum time for harvesting The optimum time for harvesting was identified from the growth rate of cyanobacteria. The growth rate of cyanobacteria was measured by using spectrophotometric method. The procedure in brief, absorbance of the culture (Optical density) was taken at the range of 660nm to 690nm wavelength. The highest values of absorbance of each cyanobacteria culture samples, during preliminary scanning, were selected to measure the growth rate. The highest absorbance obtained from each cyanobacterial culture, represents the wavelength of maximum sensitivity to quantify cyanobacteria samples. All further analyzed samples were read in this wavelength [3].
Quantitative analysis of total pigments The phycoerytherin (PE), phycocyanin (PC) & allophycocyanin (APC) Chlorophyll-a (Ch-a), Chlorophyll-b (Ch-b) and Carotene (Cx+c) pigments were determined using methods described by Sumanta, Bennett and others [4,5]. All determinations were carried out in duplicates.
Plate 2: Harvesting of biomass using 20 micron filter cloth
Harvesting of biomass Harvesting biomass from mass culture, flocculation method was applied. The pH of the culture was increased using NaOH and the biomass was allowed to sediment. After

Proceedings of the 7th
YSF Symposium - 2018
3
sedimentation the water was filtered using 20 µm cloth filter. Then the biomass was dried in oven and made fine powder for analysis.
Sohxlet extraction of lipid The initial weight of biomass was recorded and total lipid was extracted using sohxlet extraction apparatus where hexane was used as extraction solvent. Extracted solvent was evaporated using rotor evaporator. The remaining oil was transferred in a pre-weighed screw capped glass vial and the amount of lipid content was measured gravimetrically on w/w% of dry biomass by taking the difference in the pre and final weights of the vial. All determinations were carried out in duplicates.
Statistical analysis The data were analyzed by using SAS 9.0, significant variations between the means was evaluated by Duncan’s new multiple rang test. Results and Discussion Optimum Biomass Harvesting Time In this study, all the cyanobacteria strains showed the same growing pattern including lag phase, log phase, and steady stage. Moreover, in all treatment the strains showed the same growth level up to first week, after that different growth levels were observed. In the U1 strain, which was grown in 50% concentrated BG 11 media, showed the steady state growth from fourth week (Figure 1). Therefore the optimum time for harvesting of biomass could be 4
th weeks onwards. While increasing the nutritional stress to the U1 by
reducing the concentration of nutrition in the media into 25%, similar trend was observed. Although, the lower growth rate was observed in 25% diluted media. U2 strain also showed the same observations in 50% and 25% concentrated BG 11 media. At the same time, U49 in 50% & 25% of GO medium showed the steady state after 5
th
week in optimum biomass harvesting time. In the previous study with non-diluted BG11 and GO media (100%), the optimum biomass harvesting time showed the steady state growth from fifth week [6]. Since, 25% and 50% had lower media concentration; the cyanobacteria had a nutritional stress during the growth. Therefore, they grew faster than that of 100% media. At the same time, U49 was a nitrogen fixing cyanobacteria and they may fix atmospheric nitrogen in enough amounts for their growth during nutritional stress. Therefore, they showed the lower growth rate and took longer period to get steady state compare to U1 & U2 strains. However, cyanobacteria developed a diversity of adaptive mechanisms for survival in extremes of environmental, nutritional and other stresses and also synthesize some reserve components for their living, under conditions of imbalanced nutrition [7].
Figure 1: Absorbance of cyanobacterial concentration during mass culture in different diluted media U1 - Leptolyngbya sp. U2 - Phormidium sp. U49 - Nostoc sp.

Proceedings of the 7th
YSF Symposium - 2018
4
Dry Biomass, Total pigment and Lipid Content in Different Diluted Levels of Media. In the present study, the high dry biomass was recorded in U1 (12.03 mg/ml) followed by U2 (6.81 mg/ml) in 50% BG11 medium and 4.42 mg/ml dry biomass was recorded in U49 of 50% diluted GO media. In the same trend, dry biomasses were recorded in 25% diluted media of BG11 & GO, U1 (8.12 mg/ml), followed by U2 (3.43 mg/ml) and U49 (2.78 mg/ml) (Figure 2). In the previous study with non-diluted BG 11 and GO media (100%), U1, U2 and U49 gave dry biomass 50, 1.4 and 12.9 mg/ml respectively [6]. 25% & 50% diluted media was effective to get quick growth. Therefore, at the initial stages biomass concentration was higher. At the same time the cell death was also quicker. In case of 100% media, initially cell growth was slow however, finally highest biomass was obtained. In the present study, U2 gave high dry biomass production in diluted media compare with U2 in non – diluted medium (Figure 2). Figure 2: Dry biomass of different selected strains of cyanobacteria in 100%, 50% & 25% concentrated BG 11 and GO media. U1 - Leptolyngbya sp. U2 - Phormidium sp. U49 - Nostoc sp
Total pigment was also reduced in all strains during dilution of media, although, reduction in total pigment during dilution from 50% to 25% was insignificant in U2. In the diluted 50% media, highest total pigment was recorded in U2 50 (54.13 µg/ml), followed by U1 50 (50.26 µg/ml), U49 50 (17.66 µg/ml). The same trend was recorded in 25% diluted media, U2 25 (54.67 µg/ml), U1 25 (27.3 µg/ml) & U49 25 (11.36 µg/ml) (Figure 3). In the previous study with non-diluted BG 11 and GO media (100%), U1, U2 and U49 gave total pigment as 102.32, 128.14 and 176.26 µg/ml respectively [6].
Figure 3: Total pigment content of different selected strains of cyanobacteria in 100%, 50% & 25% concentrated BG11 and GO media. U1 - Leptolyngbya sp., U2 -Phormidium sp., U49 – Nostoc sp. Means with the same letter are not significantly different.
In the present study, the high lipid % of dry biomass was recorded in U1 (9.27 ± 0.43)% followed by U2 (6.87 ± 0.33)%, and U49 (3.27 ± 0.49)% of 50% diluted BG11 and GO media. At the same time, the high lipid % of dry biomass was recorded in U2 (5.36 ±

Proceedings of the 7th
YSF Symposium - 2018
5
0.45)% followed by U1 (3.98 ± 0.06)%, and U49 (1.41 ± 0.61)% of 25% diluted BG11 and GO media (Figure 4). In the present study, the lipid content of U1 in 25% BG11 medium and U49 in 50% GO medium were not significant differences. Others had the significant differences. The values of lipid % of U1 & U49 in diluted media were recoded in reduced amount compare with non – diluted media. Althoug, the lipid % of dry biomass of U2 in 50% BG11 medium gave approximately same lipid % value of U2 in non – diluted BG11 medium (U2 100 – 6.08%, U2 50 – 6.87%)(Figure 4). It was observed that under nutritional stress conditions nutrients utilization efficiency may be increased in U2 than others. Therefore, more lipid may be synthesized in body mass. Soydemir and others have studied that in very low concentrations of nutrients at the time of harvesting; the cells are expected to accumulate lipids [8].
Figure 4: Lipid content (%) of different selected strains of cyanobacteria in 100%, 50% & 25% concentrated BG 11 and GO media. U1 - Leptolyngbya sp. U2 - Phormidium sp. U49 - Nostoc sp. Means with the same letter are not significantly different.
The Table 1 shows the percentage of reduction in dry biomass, total pigment (TP) and lipid content of selected cyanobacterial strains, during dilution of BG11 and GO media from 100% to 50%, and 100% to 25%. In this study, U2 showed the increment in dry biomass of 50% & 25% diluted BG 11 media by 79.43% and 59.15% respectively. At the same time, U2 showed an increment in lipid accumulation by 11.5% in 50% diluted BG 11 medium and it showed 11.84% reduction in 25% diluted medium. However, during dilution of both media high percent of reduction was observed in 25% dilution than 50% dilution. Table 1: Percentage of reduction in dry biomass, Total pigment (TP), and Lipid content during dilution of BG 11 and GO media.
Sample ID
Dilution 50% Dilution 25%
Dry biomass (%)
TP (%) Lipid content (%)
Dry biomass (%)
TP (%) Lipid content (%)
U1 75.94 46.57 56.17 83.7 73.32 82.84 U2 -79.43 57.76 -11.5 -59.15 57.34 11.84 U49 65.72 85.98 78.8 78.43 93.55 90.86
Conclusions and Recommendations In the present study, dry biomass of U2 increased by 79.43% and 59.15% during 50% and 25% dilution of BG 11 medium. Dry biomass production efficiency of U2 was higher than other two strains in the nutritional stress condition. Among the dilutions of media, the high percentage of biomass production efficiency was recorded in U2 during 50%

Proceedings of the 7th
YSF Symposium - 2018
6
dilution of BG11 medium than 25% dilution of the medium. At the same time, lipid % is also same in non – dilution and dilution conditions. Therefore, 50% BG11 diluted medium is cost effective medium to cultivate U2 cyanobacteria strain. References [1] R. Stanier, R. Kunisawa, M. Mandel And G. Cohen-Bazire, "Purification and
Properties of Unicellular Blue-Green Algae (Order Chroococcales)", Bacteriological reviews, vol. 352, pp. 171-205, 1971.
[2] R. Rippka, J. Deruelles, J. Waterbury, M. Herdman and R. Stanier, "Generic Assignments, Strain Histories and Properties of Pure Cultures of Cyanobacteria", Journal of General Microbiology, vol. 111(1), pp. 1-61, 1979.
[3] L. Rodrigues, A. Arenzon, M. Raya-Rodriguez and N. Fontoura, "Algal density assessed by spectrophotometry: A calibration curve for the unicellular algae Pseudokirchneriella subcapitata", Journal of Environmental Chemistry and Ecotoxicology, vol. 3(8), no. 2141-226X, pp. 225-228, 2011.
[4] N. Sumanta, C. Haque, J. Nishika and R. Suprakash, "Spectrophotometric Analysis of Chlorophylls and Carotenoids from Commonly Grown Fern Species by Using Various Extracting Solvents", Research Journal of Chemical Sciences, vol. 4(9), no. 2231-606, pp. 63-69, 2014.
[5] Bennett and L. Bogorad, "Complementary Chromatic Adaptation in A Filamentous Blue-Green Alga", The Journal of Cell Biology, vol. 58(2), pp. 419-435, 1973.
[6] M. F. Hossain, "Bio-diesel and potential for other value added products from fresh water cyanobacteria in Sri Lanka and their morphological and molecular characterization,"Ph.D. dissertation, University of Ruhuna, Sri Lanka, 2017.
[7] S. Agrawal and U. Pal, "Viability of dried vegetative cells or filaments, survivability and/or reproduction under water and light stress, and following heat and UV exposure in some blue-green and green algae", 2017.
[8] G. Soydemir, U. Keris-Sen, U. Sen and M. Gurol, "Biodiesel production potential of mixed microalgal culture grown in domestic wastewater", Bioprocess and Biosystems Engineering, vol. 39(1), pp. 45–51, 2016.

Proceedings of the 7th
YSF Symposium - 2018
7
DIVERSITY OF WILD RICE SPECIES OF SRILANKA: SOME REPRODUCTIVE TRAITS
A.V.C. Abhayagunasekara1, P.C.G. Bandaranayke*2, W.L.G. Samarasinghe3 and D.K.N.G. Pushpakumara4
1Rice Research and Development Institute, Batalagoda, Ibbagamuwa, Sri lanka,
2Agricultural Biotechnology Center, University of Peradeniya, Sri lanka,
3Plant Genetic Resource Center, Gannoruwa, Peradeniya, Sri lanka,
4Department of Crop Science, Faculty of Agriculture, University of Peradeniya, Sri lanka
*Corresponding author (email: [email protected])
Introduction The genus Oryza consists of twenty-four species. Of them two are cultivated; Oryza sativa and Oryza glaberrima and 22 are wild [1]. The wild Oryza species have either 2n=24 or 2n=48 chromosomes represented by the AA, BB, CC, BBCC, CCDD, EE, FF, GG, HHJJ, or HHKK genomes [2]. The wild relatives of cultivated rice pose valuable traits to be used in future breeding efforts.
There are 5 five wild rice species reported in Sri Lanka. They are Oryza nivara, Oryza rufipogon [AA], Oryza eichingeri, Oryza rhizomatis [CC] and Oryza granulate [GG]. Of those O. rhizomatis grows in partially shaded areas/open grass lands and has only been reported in Sri Lanka; hence considered endemic [3]. Other species are found in geographically and ecologically diverse environment [4]. Some of these habitats are threatened due to various human activities and immediate actions are needed for conservation of these valuable genetic resources. Identification of morphological difference among them is vital for conservation and future breeding efforts. Among them, traits linked with reproductive parts of the plant are considered as most important. Since most of the morphological traits are influenced by the environmental factors, evaluating them in the same environmental condition is essential. The work presented here is a comparative study on the morphological difference of some reproductive traits of five wild rice species in Sri Lanka assessed under the same environmental conditions.
Materials and Methods Sample collection A field survey was carried out to collect wild rice species during the period of January to March in 2015. The samples were collected from the previously identified locations from North Western, North Central regions and Yala National Park [5]. Specimens were identified based on the morphology of the vegetative and reproductive parts of the plant. Total of 14 O. rhyzomatis accessions, 3 accessions of O. nivara, 3 accessions of O. eichingeri, 2 accessions of O. granulate and 1 accessions of O. rufipogon were collected. All samples were planted in 5 L buckets in three replicates at the plant house of Agricultural Biotechnology center. About 6 months after establishment, one plant from each replicate was evaluated for the decided characters.
Characterization and data analyze Morphological characterization of reproductive part of the 5 wild rice species was done following the descriptors for wild and cultivated [Oryza spp.] published by IRRI. Totally 4 quantitative and 8 qualitative characters of flower, panicle and seed were recorded. The cluster analysis was done using SPSS [16 versions] to assess the morphological diversity.

Proceedings of the 7th
YSF Symposium - 2018
8
Results and discussion Basic statistics for 12 characters are presented in Table 1. The highest variance among tested characters was observed in awn color. The highest variation of awn color was observed in O. nivara accessions. Most of accessions had purple color awns, but few accessions were found with whitish color awns. O. ruffiphogon also had purple colored awns. Some O. rhyzomatis accessions collected from Yala area had no awn while some accessions had tawny awns. Awn color of O. eichingeri ranged straw to tawny. Presence of awn is another trait varied significantly among species. All O. granulate accessions were awn less. Both O. nivara and O. ruffiphogon species had fully developed awn while O. rhyzomatis and O. eichingeri had partially developed awns. While the anther color of O. nivara and O. ruffiphogon was yellow, O. rhyzomatis, O. eichingeri had brown/straw color anthers. Though stigma color of O. granulate was white, all other species had purple colored stigma. Panicle distance, define as the distance from base to lowest spikelet insertion [mm] and panicle length, defined as the length of main axis of panicle measured from the panicle base to the tip are other highly varied characters observed among 5 wild rice species. The highest panicle distance was reported in O. rhyzomatis [30 cm] and the shortest was O. nivara [3 cm]. Both O. ruffiphogon and O. eichingeri had average panicle distance of 26 cm while it was 9 cm in O. granulate accessions. O. rhyzomatis and O. eichingeri had comparatively higher panicle length [41,43 cm] compared to O. granulate [9 cm].
Table 1. Descriptive statistics for 8 morphological characters associated with reproductive parts of wild rice species in Sri Lanka
Attribute Minimum mm
Maximum mm
Mean Std. Devia Variance
Panicle arrangement 1.00 1.00 1.00 .00 .00
Num. of panicle basal branch. 2.00 10.00 6.24 1.39 1.94
Panicle distance 1.00 50.00 22.67 12.98 168.37
Panicle texture of main axis 1.00 1.00 1.00 0.00 0.00
Panicle length 8.00 65.00 36.58 16.14 260.48
Panicle attribute of branches 1.00 9.00 3.82 1.85 3.45
Awn length 0.00 10.00 2.46 3.10 9.62
Anther length 1.00 5.00 2.19 .63 .40
Hierarchical cluster analysis was done and the dendrogram was developed using ward linkage and Euclidean distance method. There are two main clusters identified at the similarity level of 20. All the accessions of O. eichingeri [InRc 9,13 and 14], O. rhyzomatis [InRc 1,2,3,5,6,7,15,16,17,18,19,20,21 and 22] and O. granulate [InRc12] grouped into cluster 1. Whereas all O. nivara [InRc 4,8 and 10] accessions and O. ruffiphogon [InRc 23] accessions were in cluster 2. This shows that O. eichingeri, O. rhyzomatis and O. granulate share majority of similar characters than two other species. Interestingly both O. eichingeri and O. rhyzomatis belong to CC genomic group of Oryza officinalis complex. Similarly, both O. nivara and O. ruffiphogon in cluster 2, are belonging to AA genomic group of Oryza sativa complex.
Conclusion and Recommendation Morphological differences in reproductive traits could differentiate the wild rice species found in Sri Lanka. Further analysis on other morphological traits and a compressive molecular study are highly recommended.

Proceedings of the 7th
YSF Symposium - 2018
9
Figure 01: Descriptive Analysis of Qualitative data. Rescaled Distance Cluster Combine
C A S E 0 5 10 15 20 25
Label Num +---------+---------+---------+---------+---------+
InR15 14
InR18 17
InR19 18
InR22 21
InR8 8
InR20 19
InR21 20
InR12 11
InR4 4
InR10 10
InR23 22
InR3 3
InR6 6
InR7 7
InR5 5
InR1 1
InR2 2
InR16 15
InR17 16
InR9 9
InR13 12
InR14 13
Figure 02: Dendrogram developed according to the similarities among wild rice accessions based on Ward linkage and Euclidean similarity distance method.
Acknowledgement: The authors acknowledge the financial support of the International Research Center [ grant InRC/RG/13/01] of University of Peradeniya.
Cluster 02
Cluster 01

Proceedings of the 7th
YSF Symposium - 2018
10
References [1] K. K. Jena. “The species of the genus Oryza and transfer of useful genes from wild
species into cultivated rice, O. sativa.” Breeding Science, vol 60, pp. 518–523,2010. [2] D.S. Bar and G.S. Khush “Alian introgression in rice.” Plant Mol. Biol, vol. 35, pp. 35-
47, 1997. [3] D.A. Vaughan. “A new rhizomatous Oryza species (Poaceae) from Sri Lanka.” Bot J
Linn Soc. Vol.103, pp. 159-163, 1990. [4] A.S.U. Liyanage and G. Senanayake The Atlas of selected crop wild relatives- Rice,
Vigna, Banana, Cinnamon and pepper. Agriculture press, Gannoruwa, Peradeniya, 2010, pp. 11-31.
[5] A.S.U. Liyanage. “Eco-geographic survey of crop wild relatives.” Agriculture press, Gannoruwa, Peradeniya, 2002.

Proceedings of the 7th
YSF Symposium - 2018
11
STATISTICAL ASSESSMENT OF POTABLE GROUNDWATER QUALITY IN VILLAGES OF PAVATKULAM, VAVUNIYA
N Anoja* National Water Supply and Drainage Board
*Corresponding author (email: [email protected])
Introduction In Sri Lanka, groundwater is one of the most precious natural resources. Majority of people depend on it for their sustenance with no expense to the State. Almost 80% of the rural population in Sri Lanka rely on groundwater for their domestic needs today because of its availability throughout the year. Main towns in Jaffna, Batticaloa, Mannar, Puttalam, Vavuniya depend almost 90% on the groundwater supply [1]. The groundwater resources in Vavuniya have been under serious threat over the past few years with the intensive resettlement and infrastructure development after the civil war and extensive application of fertilizer in agricultural activities together with high extractions resulting rapid groundwater depletion, and groundwater pollution [2]. The aim of this study is to statistically assess the distribution of physicochemical parameters of groundwater in Pavatkulam villages of Vavuniya.
Material and Methodology Study Area The villages of Pavatkulam are situated in Vengalacheddikulam divisional secretariat of Vavuniya, Northern Province of Sri Lanka. Samples were collected from four villages of Pavatkulam. People in this area consume water from tube wells and open dug wells.
Sampling and Testing Hundred and Five (105) samples were collected for the study based on the population. Standard sampling technique was used when sampling. Pre-cleaned polypropylene bottles were used to collect the samples for physical and chemical quality testing and Electrical conductivity, Turbidity, TDS and pH testing were done using portable HACH instruments and Total Hardness and Calcium were measured by EDTA titration and Nitrate, Phosphate and Fluoride by spectrophotometric method of HACH DR5000. All the testing procedures were based on APHA and SLS 614:2013.
Data Analysis Normal distribution analysis was carried out using Microsoft Excel 2010 and Pearson correlation analysis was done using SPSS 24.0 software. Results of the statistical analysis are given in Table 1.
Results and Discussion Turbidity Turbidity is a measure of cloudiness or degree of clarity of the water. Turbidity of the area was in the range of 0.24-16.10 NTU with the median of 1.12 NTU and 24% of the samples were above the SLS limit of 2 NTU. There was a significant difference between the mean and the median which indicated turbidity was not distributed in a normal and symmetric way and standard deviation (2.2) showed readings were not close to each other. Positive skewness indicated turbidity was distributed in a higher side and right direction of the tail. High Kurtosis indicated the curve is leptokurtic.

Proceedings of the 7th
YSF Symposium - 2018
12
Table 1: Normal Distribution analysis of parameters tested
PARAMETERS MIN MAX MEDIAN MEAN SD SKEWNESS KURTOSIS TURBIDITY 0.24 16.10 1.12 1.78 2.20 3.75 18.88
PH 6.49 8.06 7.31 7.27 0.32 -0.28 -0.16 EC 214 2210 1007 1051 358 0.41 0.43
NITRATE 0.44 132.46 7.09 14.41 21.15 3.46 13.88 FLUORIDE 0.16 2.54 1.02 1.07 0.42 0.65 1.05
PHOSPHATE 0.19 2.95 0.66 0.74 0.36 3.00 14.44 TDS 139 1437 655 684 235 0.45 0.47 TH 104 928 442 445 138 0.45 1.17
CALCIUM 14 245 93 96 36.36 0.93 2.38
[All the values are in mg/L Except pH, EC and Turbidity, Units of EC- µS/cm, Turbidity- NTU]
pH pH of the samples was in a range of 6.5-8.06 with the median of 7.31 and all the samples were within the SLS limit of 6.5 to 8.5. Small difference between the mean and median reflects that pH was almost normally distributed in groundwater and negative skewness indicated, data were distributed slightly lower side than median and have left tail. The pH data were close to each other and platykurtically distributed.
Electrical conductivity (EC) The Electrical Conductivity (EC) is the ability of water to carry an electric current. EC of the samples varied from 214 -2210 µS/cm. 86% of the sample were above the SLS limit of 750 µS/cm. There was a difference between the mean and the median and EC was not distributed in a normal and symmetric way and standard deviation (358) showed readings were not close to each other. Positive skewness indicated EC was distributed slightly higher side to median and right direction of the tail. Kurtosis showed platykurtic distribution. Data have been represented in Figure 1 and 2.
Figure 1: EC Distribution Figure 2: Fluoride Distribution
Fluoride Dry Zone of Sri Lanka contains high level of fluoride in groundwater. Water Fluoride of the area varied in a range of 0.16 – 2.54 mg/L and 47% of the samples were above the SLS limit of 1.0 mg/L. Fluoride was almost normally distributed in groundwater and positive skewness indicated data were distributed slightly higher side and have right tail. Fluoride data were close to each other and platykurtically distributed.
1 6 11 16 21 26 31 36 41 46 51 56 61 66 71 76 81 86 91 96 101 106 0
0.5
1
1.5
2
2.5
3 Fluoride Distribution mg/L
SLS limit

Proceedings of the 7th
YSF Symposium - 2018
13
Total Dissolved Solid (TDS) TDS was in the range of 139-1437 mg/L with the median of 655 mg/L and 80% of the samples were above the SLS limit of 500 mg/L. TDS was not distributed in a normal and symmetric way in groundwater and data were not close to each other. Standard deviation represented 68% of the samples were distributed within the range of 449- 919 mg/L. Positive TDS was distributed slightly higher side to median and right direction of the tail and have platykurtic distribution.
Nitrate Nitrate in groundwater may results from point sources such as sewage disposal systems and livestock facilities, non-point sources such as fertilized agriculture [3]. Highest Nitrate concentration was 132.46 mg/L and Nitrate content in groundwater varied from 0.44-132.46 mg/L. Only two samples out of 105 samples tested were above the SLS limit of 50 mg/L. Significant difference between the mean and median indicated the presence of outliers and it did not have normal distribution in groundwater. Data points were spread out and distributed in higher side to median and have right tail and curve was leptokurtic and distributed near to median.
Phosphate Highest concentration of phosphate was 2.95 mg/L and only that sample was above the SLS limit of 2 mg/L. Phosphate was almost normally distributed in groundwater and positive skewness indicated that data were distributed in higher side and has right tail. Phosphate data were close to each other and showed leptokurtic distribution.
Total Hardness (TH) and Calcium Hard water is characterized with high mineral contents that are usually not harmful for humans [4]. Hardness and calcium of the samples are varied from 104-928 mg/L and 10-245 mg/L respectively. Hardness of 91% of the samples and calcium of 37% of the samples were above the SLS limit. Both Total hardness and calcium were distributed almost normally as they showed small difference in mean and median. Both have positive skewness and platykurtic distribution. Based on the results water can be categorized as very hard water.
Correlation Analysis Correlation coefficient was calculated to identify the correlation between the parameters. Pearson’s correlation coefficient is usually denoted by Þ and It can vary from -1 (perfect negative correlation) through 0 (no correlation) to +1 (perfect positive correlation) while the variables with the values -0.5 < p < 0.5 are supposed to be significant. Table 2 presents the Pearson correlation coefficient matrix between major physicochemical parameters of groundwater.
There was significant positive correlation of Electrical conductivity with TDS, Total Hardness and Calcium and it represents Electrical conductivity of the groundwater increases with increasing TDS, Total hardness and calcium and EC has weak positive relation with Nitrate, Fluoride, pH and Turbidity and weak negative relation with phosphate.

Proceedings of the 7th
YSF Symposium - 2018
14
Table 2: Correlation Matrix between Physical, Chemical Parameters tested
Turbidity pH EC NO3- F PO4
3- TDS TH Ca
2+
Turbidity 1 pH 0.114 1 EC 0.17 0.156 1
NO3- 0.003 -0.042 0.343 1
F 0.024 0.057 0.106 -0.146 1 PO4
3- -0.26 -0.217 -0.066 -0.02 0.15 1 TDS 0.172 0.154 0.999 0.339 0.1 -0.07 1 TH 0.087 0.157 0.917 0.429 0.032 -0.044 0.919 1
Ca2+ -0.005 0.036 0.8 0.512 -0.014 -0.034 0.805 0.897 1
The pH gave negative correlation with Nitrate and Phosphate. Calcium showed significant positive correlation with EC, Nitrate, TDS, and Total Hardness. Phosphate showed negative correlation with almost all parameters except Fluoride.
Conclusion and Recommendation The present study clearly reveals that most of the physical and chemical parameters are above the SLS 614:2013 in groundwater sources and water in this area is very hard and highly mineralized. In comparison to all other parameters, there is a significant problem of extremely high levels of Total Hardness, Fluoride and Total Dissolved Solids.
Statistical Analysis of Pavatkulam area provides an insight into the underlying factors controlling the groundwater quality and the observed wide range, high standard deviation in some of the parameters are indications that there are substantial differences in the groundwater quality within the study area.
The results of current study indicate that the drinking water used by the people residing in villages of Pavatkulam, is not potable. Some essential treatment needed to convert the groundwater into drinkable water. So, boiling and filtering or Reverse Osmosis treatment like pre- treatment system should be practiced for drinking water.
Continuous monitoring of groundwater should be carried out to identify the seasonal variation of groundwater quality and as it is an agriculture area, the effect of using fertilizer and pesticides should be evaluated.
Awareness on effect of drinking highly mineralized water should be created among general public in Pavatkulam area.
References [1] C.R. Panabokke, “Groundwater Conditions in Sri Lanka: a geomorphic
perspective”. National Science Foundation of Sri Lanka, 2007. [2] ADB. Environmental Impact Assessment on the proposed surface water extraction
from a reservoir across Per aru, Vavuniya district, Volume 1, 2012. [3] D. Behm, “The Fouling of Wisconsin's Lakes and Streams (Special Report)”, The
Milwaukee Journal, 1989, p. 2. [4] WHO. Health criteria and other supporting information 101: 2. 1984

Proceedings of the 7th
YSF Symposium - 2018
15
MATERNAL VITAMIN D LEVELS DURING 3RD TRIMESTER OF PREGNANCY, LACTATION AND THE RELATIONSHIP WITH VITAMIN D LEVEL OF THEIR OFFSPRING AMONG A SELECTED POPULATION OF
MOTHERS IN SRI LANKA
K. Anusha*, G.S.H. Liyanage and U.P.K. Hettiaratchi Faculty of Medical Sciences, University of Sri Jayewardenepura, Sri Lanka
*Corresponding author ( [email protected])
Introduction High prevalence of vitamin D deficiency has been established among children and adults in tropics and sub tropics. Major source of vitamin D is sunlight. Some food items such as oily fish (salmon, mackerel, sardines; cod-liver oil), liver, other organ meats, egg yolks, fortified dairy products contain substantial amount of vitamin D. However, most food items that contain vitamin D are less affordable to most from lower socio-economic class. Inadequacy of sun exposure due to urbanization, environmental pollution and limited outdoor activity is reported as reasons for vitamin D deficiency [1]. Vitamin D plays a major role in calcium metabolism. It is also responsible for variety of other non skeletal functions such as immune functions, Preliminary, type 1 diabetes, cancers, respiratory illness, and psychiatric illnesses [2].
The consequences of vitamin D deficiency are likely to worsen during pregnancy because of the active trans-placental transport of vitamin D. Infants of vitamin D deficient lactating mothers are at risk of developing vitamin D deficiency as breast milk is a poor source of vitamin D [3]. Therefore, it is evident that requirement for vitamin D is higher in pregnant/lactating mothers and growing infants. Vitamin D supplementation is not included in the routine care of pregnant/lactating mother or infant in the state run clinics. In Sri Lanka, a study conducted in the Southern province among women in the reproductive age group, has shown that vitamin D deficiency (defined as < 10 ng/mL) as 40.5% [4]. Moreover, a study conducted to identify micronutrient status among urban preschool children in Ragama, Sri Lanka, has detected vitamin D deficiency in 5.6% of the population(defined as <10ng/ml) [5]. However, Vitamin D status of pregnant women, lactating mothers and infants in our country are lacking.
Thus, the objectives of this present study were to evaluate the maternal vitamin D levels during 3
rd trimester of pregnancy, lactation and the relationship to neonatal vitamin D
levels of the offspring.
Material and Methods Mothers with multiple pregnancies, serious medical problems (non-obstetric), disabilities that could be related to bone metabolism, maternal pregnancy induced complications (pregnancy induced hypertension and gestational diabetes), premature delivery and offspring with congenital abnormalities were considered as exclusion criteria and excluded from final analysis.
Pregnant mothers (n=104) in their 3rd
trimester attending obstetric clinic at Colombo South Teaching Hospital (CSTH) were invited for the study. Basic information was gathered by a pre-tested interviewer administered questionnaire after obtaining informed written consent. A brief physical examination including anthropometry was carried out. A blood sample was collected for analysis of vitamin D, parathyroid

Proceedings of the 7th
YSF Symposium - 2018
16
hormone (PTH), calcium, alkaline phosphatase (ALP) and inorganic phosphorus at recruitment and follow up visits were arranged. These parameters are considered as measures of metabolic bone diseases and previous studies stated the relationship between these biochemical parameters. PTH and ALP inversely correlated to vitamin D levels whereas calcium and inorganic phosphorus showed positive correlation with vitamin D. Delivery details were taken from birth records. Mother and the baby were reviewed between 4-6 weeks after delivery. Reminders via telephone calls (maximum of 3) and a stipend for transport was provided for these parents. At the follow up visit in addition to clinical examination of the baby and the mother, blood samples were collected for biochemical analysis. Blood samples were transported in ice and stored at -20˚C after serum separation, until analysis.
Analysis of 25-(OH)D was done by VIDAS 25 OH Vitamin D Total in serum using the Enzyme Linked Fluorescent Assay (ELFA). It is very well correlated to the Liquid Chromatography-Mass Spectrometry reference method with cross reactivity of 100% with 25 OH Vitamin D3 and 91% with Vitamin D2. Inorganic phosphorous (IP), calcium and alkaline phosphatase (ALP) were measured using auto analyzer. The DRG (EIA-3645) Intact-PTH ELISA was used for quantitative determination of intact-PTH in serum. Statistical analysis was performed using SPSS (version 15.0) software package. Data analyses were done in two ways. Initially maternal and infant bone biochemistry was considered as continuous variables and correlation analysis was done. Data were log transformed where necessary. Subsequently, Spearman correlation was applied to assess the influence of maternal vitamin D on vitamin D status of the offspring. Secondly the maternal vitamin D levels were grouped according to the Institute of Medicine (IOM) of the National Academy of Sciences in the USA as 25 (OH)D < 10ng/mL as deficient, 10-20 ng/mL as insufficient and > 20ng/mL as sufficient levels. Then one-way ANOVA was performed. Results were presented as mean ± standard deviation (SD). Statistical significance was considered at 95% confidence interval (p<0.05).
Results and Discussion Mean age of the maternal population was 29±6 years. Majority of the mothers were housewives (81.7%). Half of the population (54.8%) had only primary education. The mean gestational age at birth was 38.8±1.2 weeks and mean age of the infants at follow up was 37±7 days. Majority (53/104) were girls.
The biochemical parameters of both mother and the infant are given in the table 01. Serum calcium and inorganic phosphorus were in the normal range. Although mean PTH was in the normal range despite having vitamin D deficiency, it showed a significant negative correlation with vitamin D levels in both mothers and infants; pregnancy (r=-0.292;p<0.01), lactation (r=-0.247;p<0.05) and infancy (r=-0.280;p<0.01).
Table 01: Vitamin D status and bone biochemical parameters of the population
Biochemical Parameters Pregnant mothers
Lactating mothers
Infants mean ± SD
Corrected calcium (mmol/L) 2.29±0.16 2.17±0.10 2.52±0.10
Inorganic phosphorous (mmol/L) 1.32±0.21 1.30±0.22 2.14±0.20
ALP (IU/L) 194±172.7 121.1±25.5 415.7±107.6
PTH (pg/mL) 23.8±22.1 41.3±38.3 28.6±23.0
Vitamin D (ng/mL) 18.6±7.2 20.6±7.0 11.4±5.6

Proceedings of the 7th
YSF Symposium - 2018
17
We investigated the relationship between mothers’ vitamin D values with infant vitamin D levels both by spearman correlation and ANOVA (after dichotomizing mother’s vitamin D levels into 3 groups).
Spearman correlation showed a significant linear relationship between mother’s vitamin D both in pregnancy (r=+0.486; p<0.05) & lactation (r=+0.489; p<0.05) with infant vitamin D status.
Dichotomization was done according to IOM classification (table 2). 14.4% and 5.8% mothers had vitamin D deficiency during pregnancy and lactation respectively. Majority of the infants had vitamin D deficiency (Table 2). Subsequently, one-way ANOVA was performed to study the relationship between vitamin D statuses of the infant against maternal vitamin D levels according to IOM grouping (Table 3). Infant vitamin D levels were in the normal range when the maternal vitamin D was sufficient. Thus deficient mothers (both in pregnancy & lactation) are more likely to have deficient infants.
Table 2: The distribution of vitamin D levels in the study population
Vitamin D level Pregnant mothers n (%)
Lactating mothers n (%)
Infants n (%)
Deficient 15 (14.4) 06 (5.8) 67 (64.4)
Insufficient 51 (49.0) 46 (44.2) 25 (24.0)
Sufficient 38 (36.5) 52 (50.0) 12 (11.6)
Table 3: Distribution of infant vitamin D levels among maternal vitamin D grouping
Infant vitamin D levels (Mean ± SD) ng/mL
One-way ANOVA
Pregnancy Deficient Insufficient Sufficient
8.36±1.33
10.02±4.42 14.46±7.72
F value : 11.127
P = 0.000
Lactation Deficient Insufficient Sufficient
9.73±2.69 9.59±4.48
13.20±6.25
F value : 5.762
P = 0.004
Conclusions and Recommendations High level of vitamin D deficiency was observed among infants in the study population. Majority of the mothers were either deficient/insufficient with regard to their vitamin D levels. Most importantly, maternal vitamin D status influences the infant vitamin D level; deficient mothers may have deficient infants. These findings together with existing data emphasise the need for further assessment of vitamin D status and evaluation of the requirement for vitamin D supplementation in a nationally representative sample. Thus, research in this area needs support and funding from governmental and non-governmental organizations to obtain a comprehensive picture of vitamin D status in all age groups.
Acknowledgement Financial assistance was given by the research grant of University of Sri Jayewardenepura (ASP/01/RE/MED/2015/40).

Proceedings of the 7th
YSF Symposium - 2018
18
References [1] K. Agarwal, M. Mughal, P. Upadhyay, J. Berry, E. Mawer and J. Puliyel. The impact
of atmospheric pollution on vitamin D status of infants and toddlers in Delhi, India. Arch Dis Child. 2002;87(2):111-3.
[2] U. Mehlawat, P. Singh and S. Pande. Current status of Vitamin-D deficiency in India. Innov Pharm Pharmacother. 2014;2(2):328-35.
[3] S.T. Ali, K.Z. Naqvi, M. Maqsood and S. Thontia, Prevalence of Vitamin D Deficiency among Postpartum Women and their Newborns: a cross-sectional study in Karachi, Pakistan. Pak J Surg. 2013;29(1):41-5.
[4] M. Rodrigo, M. Hettiarachchi, C. Liyanage and S. Lekamwasam. Low serum vitamin D among community-dwelling healthy women in Sri Lanka. Health. 2013;2013.
[5] E. Marasinghe, S. Chackrewarthy, C. Abeysena and S. Rajindrajith. Micronutrient status and its relationship with nutritional status in preschool children in urban Sri Lanka. Asia Pacific journal of clinical nutrition. 2015;24(1):144-51.

Proceedings of the 7th
YSF Symposium - 2018
19
PHOSPHORUS SOLUBILIZING ABILITY OF ANTAGONISTIC FUNGI ON rigidoporus microporus ISOLATED FROM SRI LANKAN RUBBER
GROWING LANDS
PW Balasooriya1, 2, THPS Fernando*1, OVDSJ Weerasena2 1Department of Plant Pathology and Microbiology, Rubber Research Institute of
Agalawatta, Sri Lanka 2Institute of Biochemistry, Molecular Biology and Biotechnology, University of Colombo,
Sri Lanka *Corresponding author (email:[email protected])
Introduction Natural Rubber (NR) is very significant in our economy. Since the last few years traditional rubber cultivation has been expanded to non-traditional areas like intermediate zone and dry zone in order to make cultivation sustainable. In here that is necessary to control the economically important diseases. At the present White Root Disease (WRD) is the most destructive root disease caused by Rigidoporus microporus, among the rubber plantations during the recent past and has now become a threat in plantation crop industries and reforestation programmes causing huge economic losses. In Sri Lanka many isolates of R. microporus with varying virulence have been obtained from different rubber growing areas and the disease is common in the wet areas of Sri Lanka. In Sri Lanka it has been estimated that 5 – 10% of the cultivated rubber lands are under bare patches due to this disease and area affected is increasing at an alarming rate[1].In order to control the pathogen, Tebuconazole and Hexaconazole can be used as systemic fungicides. However, due to the toxicity and the environmental persistence of these chemicals, biological control methods can be used as an environmental friendly solution to reduce the usage of chemicals. Use of antagonistic fungi has become very important for integrated pest management targeting
[2]. Phosphorus is one of the major
plant nutrients limiting the plant growth. Phosphorus deficient plants grew vigorously for the first two years and gradually appear yellowish brown or bronze discoloration of the upper lamina surface and purpling of the underside. When the deficiency was acute the lamina turned upwards at the tip and become scorched leading to reduction of the yield. Soil contains large reserves of phosphorus and more than 95% of its present in the form of insoluble phosphate. Soil fungi contribute to convert them into soluble phosphorus so that plant can easily utilize them
[3]. The main objective of this
experiment is to identify effective antagonistic fungi against R. microporus with the potent of phosphorus solubilizing ability.
Methodology Isolation of soil fungi Soil fungi were isolated from the Kalutara, Rathnapura, Monaragala, Ampara, Polonnaruwa and Vavuniya districts using dilution plate technique. Pure cultures were maintained in PDA throughout the experiment.
Selection of best antagonistic fungi Dual plate culture method was used to test the antagonistic ability of selected fungi against R. microporus
[4]. Best antagonistic fungi were isolated according to the results
obtained from the dual plate culture test and calculation.

Proceedings of the 7th
YSF Symposium - 2018
20
Calculation:
I =
∙R1 − R2
R1 × 100%
Where, I =Percentage of inhibition R1 =Radius of the pathogen in control
R2 =Radius of the pathogen towards the antagonist
Selection of phosphorus solubilizing fungi Sterilized Pikovskayas agar medium was poured into sterilized petri plates. After solidify the media, 5mm plug from the edge of the 6 days old antagonistic fungi were inoculated at the center of the plate. The plates were incubated at 29±1
0C for 7 days and colony
diameter and diameter of solubilization zone were measured[5].
Solubilizing Index (SI) = colony diameter +halo zone diameter colony diameter
Results and Discussion More than thirty visually different fungal strains were isolated from the soil. The results obtained from the dual plate culture test indicated that eleven fungi out of thirty had higher antagonistic ability (Figure 1). They showed more than 60% inhibition against Rigidoporus microporus. It is very important to control the white root disease before it converts to epidemic. Use of chemical controlling methods could be hazardous to human being and environment. As a solution to reduce the chemical usage, one of the fungi or combination from these eleven fungi can be added to the soil in order to control the white root disease. Eleven antagonistic fungi which identified as better antagonists have presented in Figure 1.
Figure 1: Percentage inhibition of antagonistic fungi against R. microporus
According to the morphological and microscopical observations, Iso 01,02 & 09 were identified as Aspergillus spp, Iso 06,07,08 & 11 as Trichoderma spp and rest were unidentified.
50556065707580859095
100
Iso 01 Iso 02 Iso 03 Iso 04 Iso 05 Iso 06 Iso 07 Iso 08 Iso 09 Iso 10 Iso 11
Polonnaruwa Kalutara Ratnapura Ampara MonaragalaVavuniya
%in
hib
itio
n
Isolate name

Proceedings of the 7th
YSF Symposium - 2018
21
1
1.5
2
2.5
3
Iso 01 Iso 02 Iso 03 Iso 04 Iso 05 Iso 06 Iso 07 Iso 08 Iso 09 Iso 10 Iso 11
P S
I
Isolate Name
Figure 2: Phosphorus solubilizing index (SI) of antagonistic fungi
Eight Isolates were showed phosphorus solubilizing ability (Figure 2) among all the eleven isolates. The highest phosphorus solubilizing ability was recorded in Isolate 04. Isolate 04 and 05 were collected from the wet zone of the country. All the other Isolates were collected from the dry zone and the intermediate zone. Hence most of the isolates have adapted to rough climatic conditions. All the Aspergillus isolates showed phosphorus solubilizing ability comparing to Trichoderma spp. By applying these microorganisms, White Root Disease can be controlled and reduce the usage of chemicals in the rubber fields. Phosphorus solubilizing ability is an extra benefit to the rubber tree to obtain phosphorus from the soil.
Conclusion As an environmental friendly method to control the White Root Disease, above fungal isolates can be used. Increase of available phosphorus level is an additional benefit that can be gain by these antagonistic fungi to overcome the phosphorus deficiency in the soil and combination of the isolates may increase the effectiveness.
Acknowledgement Financial assistances by National Science Foundation (NSF) under the research grant No RG/2016/AG/01 is acknowledged.
References [1] W.P.K. Silva. “White root disease caused by Rigidoporus microporus in Sri Lankan
rubber plantations”, Proceedings of International Workshop on White Root Disease of Hevea Rubber,. Colombo, Sri Lanka, December, 2010, p.28-31.
[2] L.S. Thomashow and D.M. Weller. “Current concepts in the use of introduced bacteria for biological disease control: mechanisms and antifungal metabolites”. Plant-microbe interaction Springer US, pp187-235,1996.
[3] N. Pradhan and L.B.Sukla. “Solubilization of inorganic phosphates by fungi isolated from agriculture soil”. African Journal of Biotechnology, vol.5(10), 2009.
[4] C. Dennis and J.Webster. “Antagonistic properties of species-groups of Trichoderma: III. Hyphal interaction”. Transactions of the British Mycological Society, vol.57(3), pp.363-IN2,1971.
[5] F. Elias, D. Woyessa and D. Muleta. “Phosphate solubilization potential of rhizosphere fungi isolated from plants in Jimma Zone, Southwest Ethiopia”. Int J Microbiol,2016:5472601.

Proceedings of the 7th
YSF Symposium - 2018
22
DNA EXTRACTION FROM Cinnamomum Zelanicum, CINNAMON: A SIMPLE AND EFFICIENT METHOD
C.H.W.M.R.B. Chandrasekara1, P.C.G. Bandaranayake1,2,*, D.K.N.G. Pushpakumara3
1Agricultural Biotechnology Centre, Faculty of Agriculture, University of Peradeniya, Sri
Lanka, 2Dept of Plant Sciences, University of California, Davis, CA, USA
3 Faculty of Agriculture, University of Peradeniya, Sri Lanka
* Corresponding author (email: [email protected])
Introduction Cinnamomum Zelanicum known as true cinnamon is an economically important crop in Sri Lanka. The nature of the cinnamon flower and the flowering behavior ensure cross pollination than selfing. Therefore, identification of superior genotypes is a key for the genetic improvements. Further, DNA barcoding and species identification of genus cinnamomum is essential for incorporating traits from the wild relatives. Though there is considerable amount of work done on morphological and biochemical aspects of cinnamon, molecular work is limited. Having good quality DNA is a key for any molecular biological work. There are many DNA extraction protocols developed for different plant species as well as cinnamon species [1]. However those need to be optimized before using for another species. Therefore, the main objective of this study was to optimize a simple, inexpensive and rapid procedure for DNA isolation from cinnamomum zelanicum without compromising the yield and purity of DNA.
While some DNA extraction protocols are based on the cetyltrimethylammonium bromide (CTAB) [2], others based on sodium dodecyl sulfate (SDS) [3]. However those methods do not work equally well with all cinnamon species due to the differences in biochemical compositions. Some polyphenolic compounds, polysaccharides and RNA present in DNA samples act as PCR inhibitors. Inclusion of sodium chloride (NaCl) into SDS lysis buffer and polyvinylpyrrolidone (PVP) into CTAB lysis buffer are strategies for removing polysaccharides and polyphenolic compounds respectively. Polysaccharides and polyphenolic compounds covalently bind with NaCl and PVP and co-precipitate during organic extraction [4]. Therefore, combination of NaCl, PVP and organic extractions were introduced to existing protocols to increase the quality and quantity of extracted DNA.
Materials and Methods About 100 mg of leaves and bark from two cinnamon varieties released by the Department of Export Agriculture, Sri Lanka were used as the materials for all five methods described below. a) SDS method: Plant materials cut into small size pieces were transferred into a micro-
centrifuge tube containing 500-700 µL of lysis buffer (1% SDS, 1% PVP, 0.5 M NaCl) and vortexed for 20 seconds. Then the sample was centrifuged at 13000 rpm for 5 min and the supernatant was transferred into a new tube. An equal volume of isopropanol was added and mixed by inverting. After incubation at room temperature for 5 min, centrifuged at 13000 rpm for 5 min. The supernatant was discarded and the DNA pellet was washed with 500 µL of 70% alcohol followed by air

Proceedings of the 7th
YSF Symposium - 2018
23
drying. The DNA pellet was re-suspended in 30 µL of nuclease free water and stored at -20 °C.
b) CTAB method: Sample was ground using 500 -700 µL pre-warmed 2× CTAB extraction buffer (50 mM CTAB, 950 mM NaCl, 100 mM Tris pH 8.0 and 20 mM EDTA pH 8.0 and 0.2% β mercaptoethanol) and incubated for 1 hour at 60°C while mixing at every 15 min. Then an equal volume of chloroform/isoamyl alcohol (24:1) was added and centrifuged at 13000 rpm for 15 min. The supernatant was transferred to a fresh tube and chloroform/isoamyl alcohol extraction was repeated one more time. DNA was recovered by ethanol precipitation.
c) Modified SDS method: The Phenol/chloroform/isoamyl alcohol (25:24:1) extraction was carried out twice as the modification to the originally described method in (a).
d) Modified SDS method: The SDS method described above (a) was modified as described below. Half volume of 5 M NaCl was added to the supernatant recovered from lysis buffer, mixed vigorously and centrifuged at 13000 rpm for 10 min.
e) Modified CTAB method: The CTAB method described above (b) was modified by including a Phenol/chloroform/isoamyl alcohol (25:24:1) extraction twice.
The quantity and quality of isolated total genomic DNA was determined by spectrophotometric method, with NanoDrop (Nano2000, Thermo scientific) and by agarose gel electrophoresis stained with ethidium bromide.
Two types of PCR reactions were carried out with DNA extracted from above methods. A universal plant barcoding primer set identified for the ribulose 1, 5 bisphosphate carboxylase/oxygenase gene, rbcL, (forward: 5’ATGTCACCACAAACAGAGACTAAAGC3’, and reverse: 5’CTTCTGCTACAAATAAGAATCGATCTC3’) was used to test the possibility of extracted DNA for specific amplifications. PCR was carried out in a 25 µL reaction volume containing lx PCR buffer, 1.5 mM MgCl2, 200 µM dNTP (Promega, Cat No: U1515), 0.2 µM of each primer (Integrated DNA technologies), 50 ng of DNA, 0.8 µM spermidine and 1 Unit Go Taq Flexi DNA polymerase (Promega, Cat No: M8295). The PCR cycle consisted of 94 °C of initial denaturation for 5 min, followed by 35 cycles of 94 °C for 1 min, 55 °C for 30 seconds and 72 °C for 1 min and final extension at 72 °C for 5 min. A total of 10 µL from each PCR product was separated using 1 % agarose gels.
The DNA extracted from method (d) was further amplified by inter simple sequence repeat (ISSR) markers (865, 846, 841, 825, 835 and 808) from University of British Colombia (UBC) to test the possibility of extracted DNA for genotyping.
All experimental measurements were carried out in duplicates and were expressed as mean ± standard error of mean. Experimental data were analyzed using Statistical Package for the Social Sciences (SPSS) 17.0 for Windows
® (SPSS Inc.). A one-way ANOVA
was used to determine the significant differences (p<0.05) in means of DNA concentration and absorbance values between different DNA extraction protocols.
Results and Discussion While the NanoDrop reading gives an idea about the quality and the quantity of extracted DNA, it can be further confirmed by running the samples on a 1% agarose gel. In this experiment, both analyses confirmed the presence of DNA in samples extracted from all above methods (Table 1, Figure 1-x). There was no significant difference (p>0.05) in DNA yield among different extractions (Table 1). The absorbance ratios at

Proceedings of the 7th
YSF Symposium - 2018
24
260/280 and 260/230 provide the evidence for quality of extracted DNA. It is considered that both values are around 2.0 in good quality samples. The low 260/230 values suggest the presence of carbohydrate in extracted DNA. Further, the low 260/280 values suggest the presence of phenol or other reagents associated with the extraction protocol. As such all the DNA samples of (a) and (b) extractions and leaf DNA extracted from (d) and (e) protocols were contaminated with protein.
Table 1: Quality and quantity of DNA extracted from cinnamon leaves and bark using different methods.
DNA extraction method
Tissue type DNA concentration (ng/µL)
260/280 260/230
Protocol (a) leaves 69.8±1.0 0.95±0.22 1.12±0.15 bark 67.1±3.0 1.02±0.13 1.21±0.17
Protocol (b) leaves 65.2±2.8 0.89±0.17 1.29±0.19 bark 62.8±1.8 0.77±0.18 1.13±0.11
Protocol (c) leaves 60.0±2.2 1.82±0.16 1.14±0.21 bark 65.0±1.5 1.63±0.21 1.19±0.19
Protocol (d) leaves 59.0±1.5 0.76±0.12 1.29±0.15 bark 56.0±2.2 1.81±0.15 1.16±0.19
Protocol (e) leaves 56.1±3.3 0.90±0.04 1.23±0.14 bark 64.0±4.0 1.84±0.13 1.17±0.34
The presence of DNA doesn’t mean the success of PCR. There are invisible PCR inhibitors. Although DNA was present in all the extractions, PCR was successful in DNA extracted from bark tissue using (c), (d) and (e) protocols (Figure 1-y). The additional modifications introduced in (c), (d) and (e) protocols could have removed PCR inhibitory phenolic compounds and other secondary metabolites. None of the leave samples were successfully amplified by PCR. Previous studies have shown that cinnamon bark and leaf differ significantly in their chemical composition and cinnamldehyde, eugenol and camphor being the major constituents posing problems in downstream applications of DNA [5].
Figure 1 (x): Agarose (1 %) gel electrophoresis of genomic DNA extracted from different protocols. (y): PCR amplification of genomic DNA extracted from different methods using rbcL primer. (a), (b), (c), (d) and (e) represent different protocols. M1- 1 kb molecular weight marker (cat no.
promega G571A), M2-100 bp molecular weight marker (cat no. sigma p9364 ), L-leaf, B-bark.

Proceedings of the 7th
YSF Symposium - 2018
25
Of the three methods resulted successful PCR amplification, (c) and (e) involves organic extractions, need toxic chemicals such as phenol and chloroform. Further (c) and (e) are time consuming compared to (d). Therefore protocol (d) was selected as the preferred method for DNA extraction from cinnamon bark. Among the tested ISSR markers 841, 825, 835, 808 were amplified from the DNA extracted from method (d) confirming the suitability of DNA for trickier PCR reactions (data not shown). Further, this method avoids the use of liquid nitrogen for sample grinding that makes the modified method further beneficial and cost effective.
Conclusions and recommendations Several modifications introduced into original protocols provide the opportunity to extract good quality DNA from cinnamon bark for PCR amplifications. The modified SDS method is a rapid and low cost protocol to obtain sufficient quality and quantity of DNA for PCR amplification of any gene from Cinnamomum Zelanicum. Further, the optimized methods could be used to extract DNA from plant species having similar biochemical profiles.
Acknowledgment This work has been funded by the National Science Foundation Sri Lanka. (Grant No: NSF Grant SP/CIN/2016/01) References
[1] V.P. Swetha, V.A. Parvathy, T.E. Sheeja, B. Sasikumar. “Isolation and amplification of genomic DNA from barks of Cinnamomum spp”. Turkish Journal of Biology, vol. 38(1), pp.151-155, August. 2014.
[2] J.J. Doyle, J.L. Doyle. “A rapid DNA isolation procedure for small quantities of fresh leaf tissue”. Phytochem. Bull. vol. 19, pp. 11-15, December. 1987.
[3] K.C. Sika, T. Kefela, H. Adoukonou-Sagbadja, L. Ahoton, A. Saidou, L. Baba-Moussa, L.J. Baptiste, S.O. Kotconi, E.W. Gachomo. “A simple and efficient genomic DNA extraction protocol for large scale genetic analyses of plant biological systems”. Plant Gene, vol. 1, pp. 43-45, March. 2015.
[4] G. Fang, S. Hammar, R. A. Rebecca. “Quick and inexpensive method for removing polysaccharides from plant genomic DNA”. Biotechniques, vol. 13(1), pp. 52-54, Jul. 1992.
[5] P.A. Paranagama, S. Wimalasena, G.S. Jayatilake, A.L. Jayawardena, U.M Senanayake, A.M. Mubarak, “A comparison of essential oil constituents of bark, leaf, root and fruit of cinnamon (Cinnamomum zeylanicum Blum) grown in Sri Lanka”. Journal of the National Science Foundation of Sri Lanka, vol. 29(3-4). pp 147-153, January. 2001.

Proceedings of the 7th
YSF Symposium - 2018
26
EFFECTS OF AQUEOUS ELECTROLYTE CONCENTRATION ON ELECTROCHEMICAL CHARACTERIZATION OF ACTIVATED CARBON-BASED
SUPERCAPACITORS
G.G. Chathuranga1,2, H.T.D.S. Madusanka1,2, S.P.A.U.K. Samarakoon1,2, P.G.D.C.K. Karunarathna1,2, U.S. Liyanaarahchi1,2 and C.A.N. Fernando*1,2
1Department of Electronics,
2Nanotechnology Research laboratory, Department of Nano Science Technology,
Faculty of Applied Sciences, Wayamba University of Sri Lanka, Kuliyapitiya *Corresponding author (email: [email protected])
Introduction Conventional capacitors are limited because of their low energy capacity. As a result, the search for a new material led to a new type of capacitors called supercapacitors or utracapacitor. Supercapacitors consist with high surface porous materials, a separator and an electrolyte. The purpose of this work is to optimize the supercapacitor performance by investigating the effects of electrolyte concentration. In this study, we used activated carbon as high surface area electrode material and paper separator as the separator. The electrolyte directly affects on voltage window and its resistance Energy density is proposational to the square of the voltage window, while the ionic resistivity is inversely proportional to the cells power capability [1]. As the literature discussed, effects of electrolyte concentrations are discussed by using Na2S04[2]. But in another literature, highest specific capacitance reported for aqueos potasium hydroxide (KOH)[3]. So, we selected KOH as the electrolyte for this study. Three different conceration values (0.1, 1 and 5 M) of potasium hydroxide were get. The electrochemical properties and capacitance measurements of supercapacitor electrodes were studied in a two-electrode system by cyclic Voltametry (CV) Galvano static charge-discharge and electrochemical impedance spectroscopy (EIS) using AUTOLAB PGSTAT 128N (Metrohm, Netherlands).
Materials and Methods Materials Localy developed Activated carbon powder and potassium hydroxide (Sigma aldrich) were used as material
Preparation of Electrolyte Potassium hydroxide(Sigma-Aldrich) 5.11 g was measured by electronic balance (OHAUS-PA413) then added 30 ml deionized water. 5 M potassium hydroxide solution was used as stock solution of electrolyte. 0.1M, 1M and 5M KOH solutions were prepared by dilution techniques.
Fabrication of supercapacitor Stainless steel was used as the electrode substrate after subsequently washed with acetone, alcohol and deionized water for 30 min in an ultrasonic bath. Carbon slurry was prepared by mixing mass of 12 mg activated carbon powder and potassium hydroxide (Sigma-Aldrich) were ultrasonically mixed and then the homogeneous slurry was pasted several times which led to obtain a certain areal mass was obtained for all electrodes. Then the electrode was dried in vacuum tube at 50
0C for 1h. Finally, positive negative

Proceedings of the 7th
YSF Symposium - 2018
27
electrodes were sandwiched by a paper separator. It contains with electrolyte. The electrode assembly holds tightly in designed test cell.
Electrochemical measurements Cyclic Voltammetry (CV) and Chronopotentiometry were performed to investigate capacitive performances of the supercapacitors. A two-electrode measurement technique was carried out for the electrochemical measurements. For both samples, Cyclic Voltammetry scans were carried out with a voltage window 1 V in the range from -0.5 V to 0.5 V at scan rate in the range 5 mVs
-1. The charge-discharge measurements
were conducted at the 1.2 mA current. The capacitor charge from 0 V to 1 V. Electrochemical Impedance Spectroscopy measurements were performed between 0.1 Hz and 100 kHz at 10 mV amplitude signal.
Results and Discussion Cyclic voltammetry (CV) evaluates quantitative and qualitative data relating to the electrochemical phenomena occurring in the active materials of the working electrode. The CVs of ideal capacitor perform with rectangular shape of CV. However, upon increasing the scan rate, this ideal behavior is distorted with a gradual loss in cell specific capacitance. The Figure 01:(a) show the CV measurements for different concentrations of electrolyte. It clearly shows more closely rectangular shape, consist at 1 M concentration. Specific capacitance can be calculated from the CV measurement. According to equation no 1, specific capacitance value is directly proportional to the integrated area of under the CV curve, integrated areas are 9.4 x 10
-4,15.9 x 10
-4 and
12.7 x 10⁻⁴
Vm for 0.1 M, 1 M and 5 M concentrations respectively. When increasing the electrolyte concentration, integrated area increases in low concentration and decreases in high concentration. So, there are not directly proportional relation between the electrolyte concentration and the specific capacitance. This observation is consistent with the reported literature [4]. The specific capacitance of an electrode was calculated from the CV curves by using equation no 1.
(1)
Where Cs represents the specific capacitance (F g-1
), I is the current (A), V is the potential (V), S is the potential scan rate (Vs
-1), ΔV is the potential window (V), and m is
the mass of the electroactive materials in the electrodes (g). In the equation 1, is
the integral area under the CV curve [4].
To investigate the influence of electrolyte concentration of active carbon-based supercapacitor, we measured the charge-discharge curve for different electrolyte concentrations while keep in constant current. Figure 01:(b) shows the charge discharge curves for 0.1 M, 1 M and 5 M electrolyte concentrations at the current 1.2 mA. It can be seen that the charge discharge curves are linear. The charge time and discharge time of 5 M concentration electrolyte supercapacitor is less than those of 1 M electrolyte supercapacitor and longer than those of the 0.1 M electrolyte supercapacitor. So that, the slope of discharging curve varies similar to the discharging time. The slope of discharging curve is directly proportional to the discharging capacitance. Hence discharging capacitance is also varying similar way of discharging time with respect to the electrolyte concentration. Most of supercapacitors do not display ideal capacitive behavior due to internal resistance. The principal resistance is the equivalent series resistance (ESR). It includes ohmic resistance of the electrolytes resistance from the cell

Proceedings of the 7th
YSF Symposium - 2018
28
design and other resistance. It can be determined by two methods such as charge-discharge curve and electrochemical impedance spectroscopy.
Figure 01: (a) Cyclic Voltammetry of supercapacitor for three different electrolyte concentrations at the scan rate of 5 mVs
-1: (b) charge-discharge measurements of
supercapacitor for different electrolyte concertations at the 1.2 mA current
In charge discharge method, ESR can be calculated at the initial discharge, a sudden drop in potential observed that is referred as the IR drop and calculating the ESR requires dividing IR drop by the twice the current applied [5]. In this study, same current is applied for each concentration. RESR(0.1M) >RESR(5M) > RESR(1M), where RESR(0.1M) – ESR resistance of 0.1 M supercapacitor, RESR(1M) – ESR resistance of 1 M supercapacitor
RESR(5M) – ESR resistance of 5 M supercapacitor.
Figure 02: Nyquist plots of fabricated supercapacitor for different concentrations: (a) 0.1M supercapacitor, (b) 1M supercapacitor and (c) 5M supercapacitor and enlarge view
From the Nyquist plot, the inter section of the impedance curve at the x-axis corresponds to the ESR value. Figure 02 represents the Nyquist plots of 0.1 M supercapacitor, 1 M supercapacitor and 5 M supercapacitor respectively. It can be seen

Proceedings of the 7th
YSF Symposium - 2018
29
that observed ESR value is varying as, RESR(0.1M) >RESR(5M) > RESR(1M). We can clearly see the variation due to different concentrations of electrolyte, because of same conditions and materials were maintained throughout this study.
In the literature [3], the electrolyte concentration showed a strong effect on supercapacitor capacitance. For example, electrolyte concentration is high, the ion transport within the electrode layer will be easier, leading to an effective building up for double layer. However, if the electrolyte concentration is too high, the ion activity may be reduced due to less water hydration, resulting in decreases in ion mobility. Therefore, an optimized electrolyte should exist.
Conclusions and Recommendations In order to optimize supercapacitor performances by effects of electrolyte condition, from the cyclic voltammetry, charge discharge and electrochemical impedance spectroscopy it was observed the optimum performance was obtained in the concentration of 1 M KOH among 0.1 M, 1 M and 5 M concentration profiles.
References [1] Burke, “R&D considerations for the performance and application of
electrochemical capacitors”. Electrochimica Acta, 53(3), pp.1083-1091, 2007. [2] Z.B. Wen, Q.T. Qu, Q. Gao, X.W. Zheng., Z. H. Hu., Y.P. Wu, Y.F. Liu, and X.J. Wang,
“An activated carbon with high capacitance from carbonization of a resorcinol–formaldehyde resin”. Electrochemistry Communications, 11(3), pp.715-718,2009.
[3] J.P. Zheng, and T.R. Jow, “The effect of salt concentration in electrolytes on the maximum energy storage for double layer capacitors”. Journal of The Electrochemical Society, 144(7), pp.2417-2420, 1997.
[4] T. Chen, and L. Dai, “Carbon nanomaterials for high-performance supercapacitors”. Materials Today, 16(7), pp.272-280, 2013.
[5] R. Kötz, and M. Carlen, Principles and applications of electrochemical capacitors. Electrochimica acta, 45(15), pp.2483-2498, 2000.

Proceedings of the 7th
YSF Symposium - 2018
30
INHIBITION OF LIPID OXIDATION IN MECHANICALLY DEBONED MEAT BY ADDING NATURAL ANTIOXIDANTS
W.V.A.H. Chathurika*1, E.A.P. Vinodini 2, H.W. Cyril 3, C. Nishshanka4 1, 2
Department of Animal Science, Faculty of Agriculture, University of Peradeniya, Peradeniya, Sri Lanka
3National Livestock Development Board, Narahenpita, Colombo, Sri Lanka
4Keells Food Products (PLC), Ekala, Ja-Ela, Sri Lanka
*Corresponding author (email: [email protected])
Introduction Mechanically Deboned Chicken Meat (MDCM) means the product obtained by removing meat from flesh-bearing bones after boning of poultry carcasses, using mechanical means resulting in the loss or modification of muscle fiber structure [1] which is economically substantiated as a raw material for preparation of this product [2]. MDCM is subjected lipid oxidation, which results off flavors and color deterioration. The addition of antioxidants is an alternative for retarding lipid oxidation. The synthetic antioxidants used currently have been found to exhibit various health effects which have led to growing interest in natural antioxidants in meat products [3]. The objective of this study is to inhibit lipid oxidation in MDCM by adding Moringa (Moringa oleifera), Hummingbird (Sesbania grandiflora) flower and leaves, Tomato and Curry (Murraya koenigii) leaves as natural antioxidants and to compare antioxidant activity with synthetic antioxidants.
Materials and Methods
Sample preparation Different concentrations of Moringa pod (2.5%), Moringa leaves (2.5%), Hummingbird flowers (2.5%) and leaves (2.5%), Tomato (2.5%), Curry leaves (2.5%), Tomato (1.25%) with Moringa Pod (1.25%), Ascorbic acid (2.5%), Ascorbic acid (1.25%) with Moringa Pod (1.25%) were incorporated in MDCM with three replicates for each treatment. Oxidation was measured using 2-thiobarbituric acid-reactive substances (TBARS) and pH and color values were determined on the 3
rd day of storage at 4 ⁰C.
Determination of Antioxidant activity The effect of onion on lipid oxidation in the meat model systems was evaluated by measuring TBARS value, during storage at 37 °C. Sample (10g) were combined with 5ml of 10% trichloroacetic acid (TCA) and 1 ml of 0.15% antioxidant BHT and homogenized for 2 min. The extract was combine with 2mL of 0.08 mol/L TBA reagent and heated in a boiling water bath 100 ⁰C for 5 min. After cooling, the absorbance of the resulting solution was measured at 531nm, and the TBARS values were expressed as mg of malondialdehyde (MDA) per kg sample, calculated using 1, 1, 3, 3- tetramethoxymethane (TEM) as the standard. Determination of pH Five grams of samples were weight into a beaker and 50 mL of distilled water was added into that and the mixture was thoroughly homogenized for 1 minute (BM-4, Nissei, Nihonseki Kaisha ltd., Japan). Before getting the reading pH meter (pH 211, Hannah Instruments, Mauritius) was calibrated using 4.00 and 7.00 buffer. Then the pH was read using this calibrated pH meter.

Proceedings of the 7th
YSF Symposium - 2018
31
Table 1: Mean values of TBARS and pH values
Data represent as mean ± SE (n=3). Mean value in the rows superscripted by different letters for TBARS value and pH values were significantly different at p< 0.05.
Colour analysis The colour parameters were measured using a chroma meter (5140, No: 453, WPA Linton Cambridge, United Kingdom) and expressed as lightness (L*), redness (a*) and yellowness (b*) throughout the 3 days storage period at 4 °C.
Statistical analysis All data were analysed by using Completely Randomized Design (CRD) and one-way ANOVA using SAS software package (Version 9.1). Means of the treatment and time were separated using the Duncan’s Multiple Range Test (p<0.05).
Results and Discussion Table 1 shows the results for TBARS and pH values on the 3rd day of MDCM. The results for TBARS were lower (p < 0.05) in the MP, ML, SF, SL, T, CL, MP+T, AA and AA+MP treatments when compared with the Control. The MP, ML, T and MP+T treatments showed no differences between treatments. AA and AA+MP were the treatments with the lowest TBARS value, therefore more effective in inhibiting lipid oxidation (p < 0.05) than the other treatments.
Regarding pH determination, it was observed that the pH in the control was higher (p < 0.05) than in the other treatments. The sample containing tomato had a lower pH value. The MP, CL and AA treatments showed no differences between treatments. Though AA+MP and ML had no difference both of two treatments were different from all other treatments (p < 0.05). SF and MP had no difference between two treatments.
MDCM is highly susceptible to rancidity due to the large area in contact with oxygen, displaying high levels of fat, lipids and calcium in its composition. Antioxidants are widely used to retard or inhibit lipid oxidation in foods. The antioxidants’ mechanisms of action happen when competitively binding to oxygen, slowing the initiation step, interrupting the propagation step by destroying or binding the free radicals, inhibiting the catalysers or stabilizing the hydro peroxides. Antioxidants should not be toxic, display high activity at low concentrations, should concentrate on the surface of the food grease phase, should withstand food processing, and also contribute to the stability of the final product [5].
Treatments TBARS pH
Moringa pod (MP) 0.736 ± 0.02b 6.076 ± 0.04c, d
Moringa leaves (ML) 0.744 ± 0.05b 6.150 ± 0.06d
Hummingbird flower (HF) 0.998 ± 0.12c 6.290 ± 0.02a, b
Hummingbird leaves (HL) 0.903 ± 0.07c 6.223 ± 0.03b, c
Tomato (T) 0.692 ± 0.01b 5.966 ± 0.11e
Curry leaves (CL) 1.446 ± 0.03d 6.153 ± 0.06c, d
Moringa pod + Tomato (MP + T) 0.712 ± 0.01b 6.030 ± 0.02a,b
Ascorbic Acid (AA) 0.553 ± 0.02e 6.136 ± 0.06c,d
Moringa pod + Ascorbic Acid (MP+AA) 0.463 ± 0.01e 6.070 ± 0.06d
Control (C ) 2.190 ± 0.06a 6.361 ± 0.07a

Proceedings of the 7th
YSF Symposium - 2018
32
Table 2: Mean values of Lightness (L*), Redness (a*) and Yellowness (b*) of MDCM
Data represent as mean ± SE (n=3). Mean value in the rows superscripted by different letters for Lightness (L*), Redness (a*) and Yellowness (b*) were significantly different at p< 0.05.
Colour is an important factor for consumer acceptance of meat and its products. The shelf life and quality of meat products are strongly influenced by the initial meat quality, additives, packaging parameters, and storage conditions. Reaction conditions such as temperature, time of heating, pH, and presence of antioxidants and metal ions are known to significantly affect the colour developments [4].
Table 2 shows the results for L*, a* and b* values on the 3rd day of MDCM. As seen in Table 2, all values of L*, a* and b* (P < 0.05) were affected by the addition of antioxidants. The lowest values for parameter a* were found in SF and SL added treatments (P < 0.05). No significant differences were found between the control samples and those with added MP, ML, SF and SL (P > 0.05).The highest b* values were obtained for AA and AA+MP treatments. However there was no difference between those two treatments (P < 0.05).
In general, as the storage days number increased, a* and b* values decreased, the amount of discoloration increased, and the discoloration was darker. As the storage day number increased, the oxymyoglobin pigment form was shifted to metmyoglobin as lipid oxidation also increased. The iron in oxymyoglobin is in the reduced state (Fe2+), but the iron in metmyoglobin is in the oxidised state (Fe3+). The effectiveness of an antioxidant, in terms of colour stability, is determined by its ability to keep iron in the reduced state which results in a desirable colour. Once iron has been oxidised, it cannot be converted back to its reduced state, thus the shift from oxymyoglobin to metmyoglobin is permanent [6].
Conclusions and Recommendation The samples with Moringa pod and ascorbic acid combination had lowest TBARS values. Colour parameters changed significantly during the storage time. Ascorbic acid and Moringa pod combination as antioxidants inhibited metmyoglobin formation and stabilized red meat colour. Therefore Moringa pod and ascorbic acid combination is effective in reducing oxidative rancidity in MDCM. Among natural antioxidants, Moringa pod and tomato combination is effective in reducing oxidative rancidity in MDCM.
Treatments Colour
Lightness (L*) Redness (a*) Yellowness (b*)
(MP) 44.43 ± 0.30c,b 11.23 ± 0.20d 6.43 ± 0.40b
(ML) 44.26 ± 0.11b,c 11.30 ± 0.20d 6.50 ± 0.36b
(HF) 43.90 ± 0.26b,c 10.80 ± 0.43d 7.56 ± 0.32b
(HL) 43.20 ± 0.34c,d 10.10 ± 0.10d 7.43 ± 0.40b
(T) 41.06 ± 0.77d 22.50 ± 0.52a 2.13 ± 0.05c
(CL) 38.10 ± 1.47e 17.46 ± 0.35b 4.06 ± 0.20c
(MP + T) 44.16 ± 0.15a,b 19.56 ± 0.25c,d 8.43 ± 0.20a,b
(AA) 44.76 ± 0.15a,b,c 14.86 ± 0.60b,c 10.30 ± 0.55a
(MP+AA) 45.10 ± 0.20a,b,c 15.23 ± 0.32b 10.33 ± 0.20a
(C ) 47.45 ± 2.34a 11.66 ± 2.97c,d 7.51 ± 2.21b

Proceedings of the 7th
YSF Symposium - 2018
33
References [1] J. Kureljušić, N. Rokvić, N. Karabasil, J. Petrović, B. Kureljušić and N. Jezdimirović.
“Finding of salmonella spp. In mechanically separated meat.” In Second International Symposium of Veterinary Medicine 2016 Jun 22 (p. 204).
[2] T. Püssa, R. Pällin, P. Raudsepp, R. Soidla and M. Rei. “Inhibition of lipid oxidation and dynamics of polyphenol content in mechanically deboned meat supplemented with sea buckthorn (Hippophae rhamnoides) berry residues.” Food chemistry. 2008 Mar 15; 107 (2):714-21.
[3] B. Rubio, B. Martínez, M.D. García-Cachán, J. Rovira and I Jaime. “Effect of the packaging method and the storage time on lipid oxidation and colour stability on dry fermented sausage salchichón manufactured with raw material with a high level of mono and polyunsaturated fatty acids.” Meat science. 2008 Dec 31; 80 (4):1182-7.
[4] M. Antolovich, P.D. Prenzler, E. Patsalides, S. McDonald and K. Robards. “Methods for testing antioxidant activity.” Analyst. 2002;127(1):183-98.
[5] J. Bigolin, C.I. Weber, A.A. da Trindade. “Lipid oxidation in mechanically deboned chicken meat: Effect of the addition of different agents.” Food and Nutrition Sciences. 2013 Jul 26;4(08):219.
[6] D.A. King, J.M. Behrends, B.E. Jenschke, R.D. Rhoades and S.B. Smith. “Positional distribution of fatty acids in triacylglycerols from subcutaneous adipose tissue of pigs fed diets enriched with conjugated linoleic acid, corn oil, or beef tallow.” Meat science. 2004 Aug 31;67(4):675-81.

Proceedings of the 7th
YSF Symposium - 2018
34
MICROBIOLOGICAL CHANGES DURING PROCESSING AND SHELF LIFE IN ULTRA HIGH TEMPERATURE MILK
W.V.A.H. Chathurika* and J.K. Vidanarachchi
Department of Animal Science, Faculty of Agriculture, University of Peradeniya, Peradeniya, Sri Lanka
*Corresponding author (email: [email protected])
Introduction Milk is known to be the most complete food found in nature. However, milk is highly vulnerable to bacterial contamination and is easily perishable [1]. Due to Ultra High Temperature (UHT) and aseptic technology, the shelf life of milk is extended from 21 days in traditional pasteurization to 4 months [2]. Processing milk at high temperature is expected to destroy all the microorganisms with their vegetative cells and endospores. Yet, spore-forming spoilage microbes and their spores can survive in high temperature treated milk and germinate into vegetative cells, which could reach populations high enough to cause spoilage or constitute food safety risk within a few days [3].
This study aimed to determine the distribution/occurrence and the levels of aerobic spore-forming bacteria and thermo resistant spore-forming bacteria during UHT milk processing and storage that contributes to the evaluation contaminant spore forming bacteria in the manufacturing process of UHT milk.
Materials and Methods
Sample preparation
Seventy two samples were collected from selected stages during UHT milk manufacturing at one of the reputed milk processing company in Sri Lanka, in a period of 42 days at a rate of two sampling per week with twelve replicates for each sample.
Counting of Aerobic Spore-Forming Bacteria Aerobic and thermo resistant spore counts were determined in triplicates by the method described by Orleans [4].
Total viable count Total viable count was carried out by pour plate method using Nutrient Agar.
Statistical analysis Statistical analysis of the data was performed by Analysis of Variance (ANOVA) using Completely Randomized Design (CRD) and then the least differences (LSD) were conducted to find the significant differences among the different mean values. SAS 9.2 version statistical software was used for data analysis and the significant differences were determined at (P<0.05).
Results and Discussion The study revealed that there was a difference (p<0.05) in the percentages of aerobic spore formers and thermo resistant spore formers in the raw ingredients (raw milk, skim milk, whey powder, cocoa powder milk), UHT milk after packaging before storage and UHT milk stored at 35 °C for 3, 7,and 14 days. As shown in Table 1, the prevalence level of thermo resistant spore formers were considerably lower than the mean count of aerobic spore formers in raw milk, skim milk, whey powder, cocoa powder, pasteurized milk and UHT milk stored.

Proceedings of the 7th
YSF Symposium - 2018
35
Table 1. Mean counts of spore forming bacteria in raw ingredients and unit operations Thermo resistant spores Aerobic total spore
Thermophiles Mesophiles Thermophiles Mesophiles Raw milk
1.68 ± 0.06ᵃ 1.06 ± 0.08ᵃ 2.63 ± 0.10ᵇ 3.56 ± 0.06ᶜ
Skim milk
1.72 ± 0.09ᵃᵇ 1.24 ± 0.23ᵃ 2.67 ± 0.10ᵇ 3.45 ± 0.10ᶜᵇ
Whey powder
1.28 ± 0.05ᵃ 0.9 ± 0.13ᵃ 1.39 ± 0.17ᵃ 2.28 ± 0.27ᵇ
Cocoa Powder
1.71 ± 0.24ᵃᵇ 1.13 ± 0.10ᵃ 2.4 ± 0.44ᵇ 2.99 ± 0.30ᵇ
Pasteurized milk
0.58 ± 0.16ᵃ 0.38 ± 0.19ᵃ 0.78 ± 0.31 0.91 ± 0.21
UHT milk Before storage
0.06 ± 0.60ᵃ 0.05 ± 0.04ᵇ 0.06 ± 0.10ᵃ 0.04 ± 0.04ᵃ
UHT milk stored at 35°C /3 days
0.11 ± 0.60ᵃ 0.77 ± 0.04ᵇ 0.04 ± 0.09ᵃ 0.15 ± 0.21ᵃ
UHT milk stored at 35°C /7 days
0.23 ± 0.10ᵃ 0.21 ± 0.07ᵃ 0.27 ± 0.18ᵃᵇ 0.41 ± 0.18ᵇ
UHT milk stored at 35°C /14 days
0.32± 0.14ᵇ 0.18 ± 0.07ᵃ 0.27 ± 0.19ᵃ 0.50 ± 0.35ᵇ
Means ± Standard Error, Each sampling point n=36
ᵃ˴ ᵇ˴ ᶜ˴ ᵈ Means in the same row not sharing a common superscript letters are significantly different at p<0.05.
As shown in Figure 1, the mean count of thermo resistant spore formers were gradually decreased throughout the production process and increased considerably in UHT milk stored at 35 °C for 3 days by 41.7%. The mean counts were drastically increased within the storage period of 14 days. The study justified the level of aerobic spore formers were significantly (p< 0.05) higher than the level of thermo resistant spore formers in milk.
Figure 1. Changes in mean counts of thermo-resistant spore- forming bacteria at different stages of UHT milk manufacturing.
The mean aerobic spore forming colony count of pasteurized milk before UHT treatment was 1.3 × 10¹ CFU/mL. The mean count of aerobic spores decreased in UHT milk by 88.10% and increased considerably in UHT milk stored at 35 °C for 3 days by 41.7%.The mean aerobic colony count was significantly difference (p<0.05) in pasteurized milk, UHT milk and UHT milk after storage as shown in Figure 2. The findings of the present study have confirmed that pasteurization alone cannot get rid of all the bacteria in milk.

Proceedings of the 7th
YSF Symposium - 2018
36
Figure 2. Changes in mean counts of aerobic spore- forming bacteria at different stages of UHT milk manufacturing.
The mean total viable counts were ranged from 5.36 Log CFU/mL to 0.00 throughout the production process of UHT milk as shown in Figure 3. This study was revealed that the total viable counts of raw milk were exceeding the recommended level (1 × 10
5
CFU/mL).The total viable counts in final product were not detected. This result was deduced that the UHT treatment was effective, comparing the mean total viable counts before and after sterilization. However, these results were not assured that no contamination will occur as the process proceeds and all the pathogens and microbes would be inactive/ present.
Figure 3. Changes in mean counts of total viable count at different stages of UHT milk manufacturing.

Proceedings of the 7th
YSF Symposium - 2018
37
Conclusion and Recommendation Highly heat-resistant spores have appeared as a problem in the dairy industry only relatively recently. It can be assumed that these spores were and still are initially introduced with the raw ingredients which probably harbour new and unknown spore-forming species. This study has shown that the significance of aerobic spore forming bacteria and thermo resistant spore forming bacteria in raw ingredients, various unit operations during manufacture of UHT milk and during storage.
This makes the possibility for manufacturers to be alerted to spore forming bacterial counts that exceed certain control limits, during a manufacturing run of UHT milk. Aerobic spore quality of most of the raw milk samples collected was not satisfactory as indicated by their bacterial loads. However, milk and raw ingredients were found to be safe for the consumer after pasteurization and UHT treatment.
From the present study, it can be concluded that raw ingredients are the primary factors influencing the number of aerobic spore forming bacteria and thermo resistant spore forming bacteria in final products. Even though aerobic spores and thermo resistant spores are reduced to the acceptable level during UHT manufacturing process, the mean count of spores are gradually increased during the time of storage. When the time increases, the mean count of spores are increased. Hence, aerobic spore-forming bacteria and thermo resistant spore forming bacteria at the process of UHT milk represent an important hurdle.
References [1] FOODS, R.O.V.D.I. 2006. Joint FAO/WHO Food Standards Programme. [2] K. Grijspeerdt, L.Mortier, J. De Block and R. Van Renterghem. Applications of
modelling to optimise ultra-high temperature milk heat exchangers with respect to fouling. Food Control. 2004 Mar 31; 15 (2):117-30.
[3] S.P. Oliver, K.J. Boor, S.C. Murphy and S.E. Murinda. Food safety hazards associated with consumption of raw milk. Foodborne pathogens and disease. 2009 Sep 1; 6 (7):793-806.
[4] K.A. Orleans. Microbiological and Chemical Changes During Shelf-life in Regular and Chocolate Milk (Doctoral dissertation, The Ohio State University).
Proceedings of the 7th
YSF Symposium - 2018
38
VEGETATIVE PROPAGATION PERFORMANCE OF Moringa oleifera lam.
D.M.G.C.DISSANAYAKE and R.D.N DEBARAWATTA*
Department of Horticulture and Landscape Gardening, Faculty of Agriculture and Plantation Management, Wayamba University of Sri Lanka, Makandura.
*Corresponding author (email : [email protected])
Introduction Moringa oleifera Lam. is commonly known as Drumstick and it belongs to the family of Moringaceae. M.oleifera is grown in over 82 countries in the world [1]. It was commonly known in over 200 different names such as murunga, murungai, drumstick, tree of life, miracle tree, horseradish tree, etc. [2]. Moringa oleifera is native to Northwestern and sub Himalayan region of India [3]. It is widely distributed through the world such as North, South and Central Americas, Cambodia, Philippines and the Caribbean Islands [4].
Moringa oleifera is small to medium sized ever green or deciduous plant with 10 to 12m height. Wood is soft and have deep root system. Leaves are commonly tripinnate and spirally arranged. Flowers are bisexual, small and yellowish-white in color. Fruits (pods) are usually 20 cm- 50 cm long and linear three sided, pendulous pods with nine longitudinal ridges with greenish light brown in color [5]. Moringa oleifera is a tree which can resistant to drought and that can be grown in diverse soils, except water logging conditions. Slightly alkaline clay and sandy loam soils are preferred to cultivate M. oleifera with good drainage conditions [3].
Moringa oleifera is widely used as a vegetable (leaves, green pods, flowers), for spice (mainly roots), for cooking and cosmetic oil production (seeds). Further, all parts of plants are used for medicinal purpose [5]. M. oleifera has a remarkable range of medicinal value and high nutritional value. Particular parts of this plant contain important minerals. As well as it is a good source of protein, vitamins, β–carotene, amino acids and numerous phenolics [6]. Moringa oleifera pods, seeds, leaves, and roots are used as animal fodder, vegetable and plant growth enhancers [7]. Further, it has been reported that M. oleifera contains more iron than spinach [8]. In Sri Lanka, M. oleifera is known as “Murunga” and it is commonly available in dry zones areas such as Kalpitiya, Jaffna, Monaragala and Mahiyanganaya etc. There are no recommended varieties found in Sri Lanka and the local variety present in Sri Lanka bears fruits twice a year. The availability of M. oleifera is seasonal in the local market. However, M. oleifera fresh pods, fresh leaves, dried leaves and seeds were exported to Europe and Asian countries from Sri Lanka [9].
Moringa oleifera can be grown easily by seeds and cuttings. Seeds of M. oleifera planted 2 cm deep and get germinated within 1-2 weeks. The germination percentage of M. oleifera is usually high in India, but the survival percentage is decreased to 0% in two weeks after seed germination [10].
Further, the stem cuttings can be used as planting material when cultivating M. oleifera. However, plants raised from seeds take long time to produce fruits [2]. Hence, for the commercial scale production, it is important to develop a vegetative propagation technique. Therefore, this study was conducted with the objective of identifying the best propagule type and propagation medium to propagate M. oleifera at commercial scale production.

Proceedings of the 7th
YSF Symposium - 2018
39
Materials and Methods Experimental Site
The study was conducted at Faculty of Agriculture and Plantation Management Wayamba University of Sri Lanka, from May to September 2017.
Planting Material Collection Moringa oleifera cuttings were collected from Makandura area and 30 cm long cuttings were obtained for the study representing 03 maturity stages viz. hard wood, semi hard wood and softwood cuttings.
Field Experiment Cuttings with different maturity stages were planted in black color polythene bags (Width = 19 cm, height = 30 cm and gauge = 600) in four different potting mixtures. Potting mixtures were pre moistened before planting the cuttings and base of the cuttings were treated with 3-Butric Acid (0.3% I.B.A). One hundred and fifty cuttings were used to represent each cutting type and a total 600 cuttings were used in the experiment. Altogether, 12 different treatments were used (Table 2). Treatments were factorially combined according to the Complete Randomized Design (CRD) with three replicates and four treatments.
Poly bags were placed inside a propagator covered with transparent polythene (gauge 500, relative humidity 73% and temperature 30
0C). Cuttings were irrigated twice a
week and fungicide captan (ethanathiol, 1.2 g/1 L of water) was applied twice 4 WAP (weeks after planting) and 7 WAP respectively. During the experimental period, fertilizers were not applied; however, the insecticide was sprayed at 6 WAP (Admire 1ml/1 L of water).
Table 1. Composition of potting mixtures and moisture availability Potting Mixture Content of Potting media Moisture Percentage of Potting
Mixture M 1 Top soil 14.5 M 2 Top soil : Sand 1:1 5.3 M 3 Top soil : Sand : Coir dust 1:1:1 14.6 M 4 Coir dust : Sand 1:1 14.4
Table 2. Treatment combinations used for the study
(Note : M 1 – Top soil. M 2 – Top soil : Sand 1:1, M 3 – Top soil : Sand : Coir dust 1:1:1, M 4 – Coir dust : Sand 1:1, C 1 - Soft wood cutting, C 2 - Semi hardwood cuttings, C 3 – Hardwood cuttings)
Potting Mixture Cutting Type
Combination Treatment
M1 C1 M1 + C1 T1 M1 C2 M1 + C2 T2 M1 C3 M1 + C3 T3 M2 C1 M2 + C1 T4 M2 C2 M2 + C2 T5 M2 C3 M2 + C3 T6 M3 C1 M3 + C1 T7 M3 C2 M3 + C2 T8 M3 C3 M3 + C3 T9 M4 C1 M4 + C1 T10 M4 C2 M4 + C2 T11 M4 C3 M4 + C3 T12

Proceedings of the 7th
YSF Symposium - 2018
40
Data Recording and Analysis Ten weeks after planting number of roots and shoots, fresh weight of shoots and roots, dry weight of shoots and roots (oven dried 80
0C for 48 hours) were recorded. Further,
survival percentage of cuttings was calculated. Data were analyzed by Statistical Analysis Software (SAS 9.4 version) by General linear model (GLM).
Results and Discussion Propagation Ability of Vegetative Parts All the three cutting types and all the potting mixtures used for the experiment were produced new shoots and new roots. Therefore, it was obvious that three different cutting types and all the potting mixtures have ability to generate a novel plant.
Table 3. Propagation ability of vegetative parts of Moringa oleifera
Potting mixture Survival percentage (%)
Soft wood Semi hard wood Hard wood M 1 32 32 46 M 2 22 30 32 M 3 22 30 34 M 4 32 34 38
(Note : M 1 – Top soil. M 2 – Top soil : Sand 1:1, M 3 – Top soil : Sand : Coir dust 1:1:1, M 4 – Coir dust : Sand 1:1)
Survival percentage of cuttings Table. 3 illustrated that, the highest survival percentage was recorded in hard wood cuttings (46%) grown in top soil media and the lowest survival percentage (22%) was detected in soft wood cuttings grown in M 2 (Top soil: Sand, 1:1) and M 3 (Top soil: Sand: Coir dust 1:1:1). This indicated that, hardwood cuttings were able to survive than other cutting types.
Probability values of Growth Parameters The significant difference was recorded in number of roots, root dry weight and shoot dry weight. Further, there was no significant difference of number of shoots and survival of roots (Table 4). However, number of roots, shoots and shoot dry weight were highly contributed for survival of cutting than other growth parameters.
Table 4. Probability values of different growth parameters
Note: *significantly different at p <0.05
Number of shoots and roots Figure 2. revealed that, the highest number of shoots (74) were formed in hard wood cuttings in T3 combination. While, the lowest number of shoots were recorded (14) in T4 treatment combination.
Number of roots was influenced for the establishment of M. oleifera cuttings. The highest number of roots (85) were formed T 12 treatment combination which was hard wood cuttings (C3) in M4 (Coir dust: Sand 1:1 ratio) than other combinations. The lowest number of roots was recorded (13) in T 4 combination. (Figure 1).
Growth parameter P value Number of roots 0.0001*
Number of shoots 0.5508 Root dry weight 0.0152* Shoot dry weight 0.0001* Survival of roots 0.9754

Proceedings of the 7th
YSF Symposium - 2018
41
Shoot dry weight and root dry weight Significantly, the highest mean shoot dry weight was recorded in T 2 and T 3 combination (Table 5). Further, the lowest shoot dry weight was recorded in T 10 (0.0275) and T 4 (0.0625)
combinations. However, it can be stated that, T 2 (M 1 + C 2 )
and T 3 ( M 1 + C 3) combinations were better in shoot development.
There was a significant difference recorded in mean root dry weight among the different potting mixtures. Significantly the highest mean root dry weight was recorded T 9 combination (0.0725) which included hard wood cuttings grown in top soil: sand: coir dust (1:1:1) in root development.
Figure 1. Root number and shoot number of different treatments
Moringa oleifera is a most demanded seasonal vegetable in Sri Lanka. It is perform high yield under the warm and dry conditions with some supplementary fertilizer and irrigation. It is a multipurpose tree, can be used as vegetable, medicine, fodder, as a spice, etc. and a study reported that M. oleifera products can be used to treat diseases such as diabetics, heart diseases, cancer etc [11].
Table 5. Root dry weight and shoot dry weight of different treatments
Note: Means followed by the same letter in column are not significantly different at 0.05 probability level. (RDW=Root dry weight, SDW=Shoot dry weight)
36 41
58
13
25
40
83
29
66
23
42
85
34
52
74
14
34
44
25
43 40
24
36
51
0
10
20
30
40
50
60
70
80
90
1 2 3 4 5 6 7 8 9 10 11 12
Nu
mb
er o
f ro
ots
an
d s
ho
ots
Treatments
No. of roots No. of shoots
Treatment RDW (g) SDW (g)
T1 0.0175g 0.5850c T2 0.0325e 0.9075a T3 0.0350d 0.8925a T4 0.0225fg 0.0625f T5 0.0200g 0.2975d T6 0.0325ef 0.1925e T7 0.0450c 0.1175ef T8 0.0550bc 0.5750c T9 0.0725a 0.7176b
T10 0.0225g 0.0275f T11 0.0425d 0.7300b T12 0.0600b 0.7025b

Proceedings of the 7th
YSF Symposium - 2018
42
Both vegetative propagation and sexual propagation can be used for the plant material production of M. oleifera. Although sexually propagated plants take long time to produce to flowers and pods. Therefore, vegetative propagation techniques can be used to develop the production of M. oleifera. The present study was conducted to the reveal best type of propergule and potting mixture of M. oleifera for the commercial scale production. According to the present study, all the cuttings types were able to develop a new plant hence, the survival percentage of hard wood cuttings were higher than other cutting types. A study reported that 30 cm long both semi hardwood and hardwood cutting performed better than softwood cuttings [12]. However, present study revealed that the hardwood cutting type was better than other cutting types.
According to the different growth parameters of used for the study, number of roots, root dry weight and shoot dry weight were highly contributed for cutting establishment of M. oleifera. The highest number of roots, shoots and shoot dry weight were recorded T3 combination (Top soil: Hard wood cutting, 1:1) was performed better than other combinations. Contrastingly, the highest number of roots was recorded in T 12 combination and significantly the highest mean root dry weight was revealed in T 9 combination. The highest number of roots was formed in coir dust: sand 1:1 media in hardwood cuttings. However, the highest root dry weight was revealed in T 9 combination. Which included top soil: sand: coir dust, 1:1:1 ratio with hard wood cutting. Further, the highest number of shoots was developed in T 3 combination than other combinations.
When consider about the moisture percentage of different potting mixtures (Table 1) the moisture availability was similar in M1, M3 and M4. But, the highest moisture percentage was revealed in M 3 potting while the lowest was shown in M 2 potting mixture, therefore, the lowest survival percentage of three different cutting types were noted in M 2 potting mixture.
However, three different cutting types have the ability to develop a novel plant without the effect of the maturity stage. According to the root dry weight of cuttings, T 9 combination can be recommended as the best combination. Further, the hardwood cuttings were recommended as the best cutting type and top soil: sand: coir dust, 1:1:1 ratio can be recommended as the best potting mixture was successful in root formation due to the availability of highest moisture percentage than other potting mixtures.
Conclusion and Recommendation The present study revealed that the survival percentage of hard wood cuttings were higher than other cutting types. Therefore, it can be suggested that the hard wood cuttings which was grown in top soil: coir dust: sand 1:1:1 ratio can be used to produce rooted M. oleifera at commercial scale production.
References [1] C.N. Kunyanga, J.K. Imungi and V. Vellingiri. “Nutritional evaluation of indigenous
foods with potential food-based solution to alleviate hunger and malnutrition in
Kenya”, Journal of Applied BioScience, vol.67,pp. 5277 – 5288, 2013.
[2] C. Ramachandran, K.V. Peter and P.K. Gopalakrishnan.”Drumstick (Moringa
oleifera): a multipurpose Indian vegetable”. Journal of Economic Botany, vol.34,
pp. 276 – 283, 1980.

Proceedings of the 7th
YSF Symposium - 2018
43
[3] D.A.S. Abdul.”Economic importance of Moringa oleifera in Tafa local government area of Niger State”. NDE Project. Federal College of Forestry Mechanization, Kaduna, Nonigeria, pp. 34, 2007.
[4] J.F.Morton. “The horseradish tree, Moringa pterigosperma (Moringaceae). A boon to arid lands”. Journal of Economic Botany, vol. 45 No. 03, pp. 318–333, 1991.
[5] H.S.U.Rebecca, M. Sharon,A. Arbainsyah And D. Lucienne.” Moringa oleifera:
medicinal and socio-economic uses”. International Course on Economic Botany.
National Herbarium Leiden, Netherlands. Pp. 2 – 6, 2006.
[6] F.Anwar, S. Latif, M. Ashraf and A.H. Gilani.”Moringa oleifera: a food plant with multiple medicinal uses”. Journal of Phytotherapy research,Vol. 21 No. 1,pp. 17-25, 2007.
[7] W. Nouman, S.M.A. Basra, M.T. Siddiqui, A. Yasmeen,T. Gull. And M.A.C. Alcayde. “Potential of Moringa oleifera L. as livestock fodder crop: a review”. Turkish Journal of Agriculture and Forestry,vol. 38 No1,pp. 1-14, 2014.
[8] S. Sreelatha, A. Jeyachitra and P.R. Padma. “Antiproliferation and induction of apoptosis by Moringa oleifera leaf extract on human cancer cells”, Journal of Food and Chemical Toxicology,vol. 49 No. 6, pp. 1270-1275, 2011.
[9] Anon, (2011).The miracle tree in Asia. Available From: http://www.sundaytimes.lk/1102 Plus/plus_14.html [Aug. 24 2017].
[10] P. Mathenge.” Growth Performance of Moringa oleifera Planting Materials Derived from Cuttings and Seeds”, Journal of Plant science and ecology,vol 1. No.4,pp. 142-148,2015.
[11] S. Hussain, F. Mallik. and S. Mahmood. “Review: an exposition of medicinal preponderance of Moringa oleifera i(Lank.). Journal of Pakistan Journal of Pharmaciutical Science, vol. 27. Pp. 397 – 403.
[12] C.A. Boasiako and R. Enninflu. “Effects of growth medium, a hormone, and stem cuttings maturity and length on sprouting in Moringa oleifera Lam.” The Journal of Horticultural Science and Biotechnology, vol. 86 No. 6. Pp.619-625, 2011.

Proceedings of the 7th
YSF Symposium - 2018
44
SYNTHESIS OF LAYERED γ-ALUMINA USING INTERACTION BETWEEN METAL ORGANIC FRAMEWORK MIL-53(Al)-FA AND N, N,
DIMETHYLFORMAMIDE VAPOUR
W.D.K.K. GNANARATHNA1 and A.C.A. JAYASUNDERA*1,2 1Postgraduate Institute of Science, University of Peradeniya
2Department of Chemistry, Faculty of Science, University of Peradeniya
*Corresponding author (email:[email protected])
Introduction Metal oxides are important in applications such as catalysis, energy storage, electronics and optics. Acidic metal oxides like Al2O3, TiO2, CeO2, V2O5, WO3 and basic metal oxide like MgO, CaO, SrO, BaO and Li2O can act as catalysts. Acidic metal oxides are important in catalytic oxidation of hydrocarbon. Al2O3 and WO3 have strong acidic sites. Dehydration of alcohols, cracking of hydrocarbon, alkylation and esterification are some reactions which metal oxide act as catalysts [1].
Alumina contains polymorps as γ, σ, η, θ, κ, β and χ. Alpha alumina is a polymorph with low surface area. Gamma and eta alumina are highly porous which is suitable for catalytic applications. Tetragonal character of eta alumina is much weaker than gamma alumina [1].
Preparation of layered γ-alumina is important because it can act as a more efficient catalyst due to higher surface area. The problem is the lack of a method to prepare microscopic layered γ-alumina. We report a method to prepare microscopic layered γ-alumina using interaction between metal organic framework MIL-53(Al)-FA and N,N, dimethylformamide vapour.
Methodology MIL-53(Al)-FA was prepared by refluxing aluminium chloride hexahydrate and fumaric acid in N,N, dimethylformamide (DMF) at 127
oC. The resultant material was washed
with excess DMF and dried at room temperature. Dried MIL-53(Al)-FA was heated with DMF up to 200
oC. The resultant material was calcined at 910
oC.
Experimental results Attenuated Total Reflection (ATR) peaks at 643, 695, 805, 993, 1094, 1154, 1254, 1417, 1476, 1603 and 1673 cm
-1 were observed in MIL-53(Al)-FA. The powder diffraction
peaks were observed at 2θ, 10.48o, 14.86
o, 20.98
o, 31.66
o and 42.55
o.
Figure 1. FTIR spectrum of MIL-53(Al)-FA and PXRD pattern of MIL-53(Al)-FA.
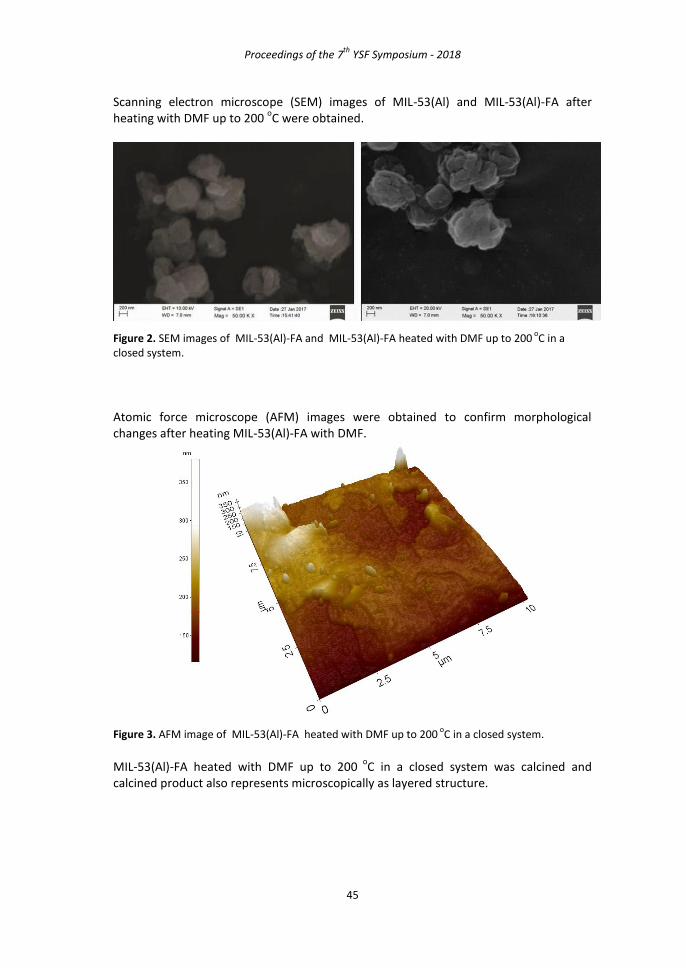
Proceedings of the 7th
YSF Symposium - 2018
45
Scanning electron microscope (SEM) images of MIL-53(Al) and MIL-53(Al)-FA after heating with DMF up to 200
oC were obtained.
Figure 2. SEM images of MIL-53(Al)-FA and MIL-53(Al)-FA heated with DMF up to 200 o
C in a closed system.
Atomic force microscope (AFM) images were obtained to confirm morphological changes after heating MIL-53(Al)-FA with DMF.
Figure 3. AFM image of MIL-53(Al)-FA heated with DMF up to 200 o
C in a closed system.
MIL-53(Al)-FA heated with DMF up to 200 o
C in a closed system was calcined and calcined product also represents microscopically as layered structure.

Proceedings of the 7th
YSF Symposium - 2018
46
Figure 4. SEM image of resulted material obtained from calcination of MIL-53(Al)-FA which heated with DMF (calcination temperature 910
oC). The circle indicates the layered structure. Thickness of
these structures should be lesser than range of 7-14 nm.
Discussion ATR peaks and PXRD pattern are very similar to reference data [2]. Formation of metal organic framework MIL-53(Al)-FA can be confirmed. Significant morphological changes were observed in SEM image after heating MIL-53(Al)-FA with DMF. Layered structure was confirmed by using AFM image. Calculated layer height has distributed range of 7-14 nm.
Figure 5. AFM image of MIL-53(Al)-FA which heated with DMF up to 200 o
C in a closed system. Circles indicate dislocated 2D layers.

Proceedings of the 7th
YSF Symposium - 2018
47
MIL-53(Al)-FA is a somewhat flexible metal organic framework. It consists of diamond shape channels prepared from fumarate linkers and continuous inorganic chain which contains of octahedral metal clusters. The bridging groups in inorganic chain are hydroxo groups. These hydroxo groups can form strong hydrogen bonds with nitrogen atoms in DMF and undergo two step phase transition as lp → np → lp. Large pore (lp) is a higher volume phase and narrow pore(np) is lower volume phase. After lp → np transition and before complete second step(np → lp) of the phase transition, it undergoes phase coexistence(few lp layeres between each two np layers simultaneously). Due to mismatch of layers, it undergoes layer –by-layer shear deformation by shear forces [3].
Figure 6. Schematic representation of MIL-53framework after first event of lp → np transformation, which involves in plane shear of 2D layer of cells in a direction orthogonal to the channel axis.
PXRD pattern of calcined product was obtained and confirmed as γ-alumina according to peaks in JCPDS card number 29-0063.
Figure 7. PXRD pattern of obtained γ-alumina
Conclusion Layered γ-alumina can be prepared using interaction between metal organic framework MIL-53(Al)-FA and N,N, vapour. This material can be used as a high efficient catalyst.
References [1] S.D. Jackson and J.S. Hargreaves, Metal Oxide Catalysis, Weinheim: Wiley-
VCH,2009. [2] F. Jeramias, D. Frohlich, C. Janiak and S.K. Heninger, RSC Advances 2014,4,2016. [3] F.X. Coudert, A. Boutin, A. Fuchs and V. Neimark, J.Phys Chem Lett 2013, 4, 3198-
3205.

Proceedings of the 7th
YSF Symposium - 2018
48
AN ASSESSMENT OF URBAN COASTAL ECOSYSTEMS AS A LANDSCAPE AESTHETIC IN SELECTION OF HOUSING LOCATION:
A CASE STUDY OF NEGOMBO LAGOON IN SRI LANKA
T.P.S.R. Guruge*1, U.K. Jayasinghe-Mudalige1, D. Weerakoon2 and S.P. Premarathne3
1Faculty of Agriculture and Plantation Management, Wayamba University of Sri Lanka,
2Faculty of Science, University of Colombo,
3Faculty of Graduate Studies, University of Colombo
*Corresponding author (email:[email protected])
Introduction Aesthetics are often included as a category of cultural ecosystem services [1], and refers to the “beauty or aesthetic value in various aspects of ecosystems” i.e. scenic drives or a housing location. Further the aesthetic services have few other operational definitions as an appreciation of natural scenery [2] as well as a link in rural areas with the amount or formation of open space in agricultural or forested types [3]. Residential lands are always demanded according to basic human needs. The price of a land depends on the physical factors as well as the surround environment and the quality of those environmental factors. Natural environment has a substantial impact on the land value as that can contribute profoundly to the quality of urban life, which has been largely ignored as a deliverable of ecosystems. Urban green spaces, water bodies and good environments provide amenities and services that contribute strongly to the quality of urban life and is often difficult to measure [4, 5]. Thus the importance of natural environment to the well-being of cities and citizens is often neglected in urban planning and development policies [6]. On the other hand, identification of the land price determinants and their contribution will help policymakers, property developers and buyers to initiate more accurate bid values that avoid price exploitation in land markets. This study attempts to work out the key determinants of urban residential land prices and the contribution of natural environment or scenic beauty towards the land value.
The Negombo urban area was selected as the study site, which has a clearly defined natural environment (i.e. lagoon with good scenic view) and a property market with sufficiently large number of players, which minimize the potential market and policy failures through competition. Negombo land consumption is restrained by Negombo lagoon which has consumed about 40% from the total land area (Table 01). In addition to limitation pose by the lagoon, the supply of land for commercial purposes is further restricted by domestic properties (Figure 01).
Table 01 Land consumption in Negombo
Figure 01 Property distribution in Negombo lagoon
Description Extent
(Hectares) Percentage
Building 1523.25 32.49% Non-Agricultural lands 119.08 2.54%
Home garden 651.21 13.89% Coconut lands 272.86 5.82%
Agricultural lands 30.94 0.66% Grass lands 222.22 4.74%
Common places 17.81 0.38%
Lagoon 1851.43 39.49%

Proceedings of the 7th
YSF Symposium - 2018
49
Materials and Methods Modeling the links between view quality and land prices Lancaster introduced [7] a new approach to consumer theory, whereby consumers consider a good as a collection of characteristics. People allocate their budget across characteristics while the technological inability to substitute characteristics may restrict the margins on which environmental goods and services can be valued. Building on this understanding, multi-attribute utility theory formalizes by proposing that total utility as a function of the characteristics of goods or services. A simple example would be where utility, U, from food consumption is a linear function of the contents C, P and V: U= aC+bP+cV. Here, the parameters a, b, and c reflect the weightages of three components in determining utility for food consumption, where these parameters represent the marginal monetary value of each characteristic.
This logic forms the basis for hedonic pricing models of valuation used below. The value of market goods (i.e. property), depends upon the characteristics of the house and its location, as well as surrounding environmental amenities or dis-benefits. Simply, the price of a property would be: Here, the q is a vector of location of specific environmental amenities, S is a vector of structural characteristics of property such as size, no of road access …, and N is a vector of characteristics of the neighbourhood in which the property is located such as accessibility to parks, stores and workplace, distance to school, etc. Thus, the hedonic approach involves estimation of the implicit prices of the neighbourhood, structural and environmental location [8].
Although the dependence between the property’s price and comfort characteristics is qualitatively well established in hedonic theory, it gives little guidance with respect to the appropriate functional form for the hedonic model. To determine the best functional form, a maximum-likelihood Box-Cox hedonic model was estimated. The Box-Cox transformation of a variable z is written and defined as follows: . The
following variant of the Box-Cox model was estimated: , where y is the sales price, D is a vector of dummy
variables, X is a vector of continuous variables, and are parameter vectors, and is the Box-Cox parameter. Special cases involve (Osborne et al., 2010) to the λ = 1.00 (no transformation needed; produces result identical to original data), λ = 0.50 (square root transformation), λ = 0.33 (cube root transformation), λ = 0.25 (fourth root transformation), λ = 0.00 (natural log transformation), λ = -0.50 (reciprocal square root transformation), λ = -1.00 (reciprocal/inverse transformation and so forth).
The methodology followed in the present study is based on spatial analysis of real estate property data by using a hedonic pricing model to estimate the impact of several variables towards housing prices in Negombo.
The first step in application of Hedonic technique is estimation of Hedonic price equation. The dependent variable of the equation is the price of the property. Seven independent variables namely size of the land, distance to the nearest bus route, distance to the drainage, distance to the nearest school, distance to the Negombo public hospital, distance to the nearest supermarket, and number of access to the road were identified as important attributes to the proposed hedonic model. The infrastructures like the electricity and water service were excluded as it has marginal

Proceedings of the 7th
YSF Symposium - 2018
50
impact in selecting a property in an urban area. Both lagoon view and the distance from the lagoon were taken to assess the impact of natural environment towards property price. The type and quality of view are often difficult to define and relatively small number of studies has examined the value of the view in literature [9, 10]. In most of the studies the view was not specified [10, 11]; only a few studies attempted to distinguish between views on the basis of type (mountain, ocean, lake, and valley) and quality [9]. Therefore, in this study, the lagoon view properties were classified into three quality categories ranging from “full lagoon view”, “poor partial view” to “no view”. In general, quality was determined based on degree of obstructions and subjective adjustment for visual impact i.e. a view with some but not significant obstruction was ordinarily classified as a full view.
So, the regression model to be tested as follows;
Property value= f (LZ, DIBR, DIDR, DISC, DIPH, DISM, NOAR, DILN, VIEW) LZ=size of the land DIBR=distance to the nearest bus route DIDR=distance to the drainage DISC=distance to the nearest school DIPH=distance to the Negombo public hospital DISM=distance to the nearest supermarket NOAR=number of access to the road DILN= distance to the Negombo lagoon VIEW=lagoon view
Data collection The price of the property or property value could be obtained through many sources of data which include actual market transactions, census of population and housing and professional appraisal of properties for taxation or other purposes. Actual transaction data are preferred over the other sources as they provide revealed preferences rather than estimated values and stated preferences. The superiority of market transaction data lies on the assumption that property market is in equilibrium. But the official records of property transactions have artificially low values because of the tax evasive tactics. Professional estimates of property values may be good source of data but not always available. However, there is a well-functioning market for residential lands in Negombo. Since property developing agencies are involved, property sales values provide good source of data for using hedonic pricing methods in Negombo.
Therefore, the primary data were gathered by means of a structured questionnaire-based survey of property developers. Land sites were selected by connecting registered property developers in Sri Lanka. There were 10 developers who had 10 land sites in Negombo, within the radius of 12km from lagoon. The plots were drawn to increase the variation within plots. Thus, the data were gathered on 100 plots that were situated apart from each other and available for sale during the first quarter of 2016. Geographic information systems (GIS) technique was used to obtain the distances. View quality was determined through a personal inspection.
Data analysis This section is estimating a standard hedonic model with view as a dummy variable (coded 1 if the property has a view and 0 if no view). Box-Cox model was estimated to

Proceedings of the 7th
YSF Symposium - 2018
51
determine the best functional form. The λ values were derived for the dependent variable and explanatory variables in continuous form. The estimated λ for sales price (dependent variable) and most of the continuous variables were zero or closer to zero than all the other cases (i.e. λ= 0.02). Therefore, those variables were transformed into natural log form and tested for the hedonic regression. The coefficient of those continuous variables express the percentage change in sales price associated with a 1% change in the property characteristic. The percentage impact on sales price for dummy variables was computed from where β is the coefficient value for the
characteristic.
Results and Discussion The model fits at 95% (Table 02) and, seven of the variables were significant (except to the distance from the property to the drainage and nearest supermarket), with the expected sign (Table 02). Sales price decreases with the property size, distance from property to the main bus route, nearest school, and Negombo public hospital (100% increase in each variable reduces the sales price by 8%, 14%, 5%, and 40% respectively). Proximity to the government hospital found to be the highest contribution due to the lack in a fully occupied private hospital to cater the human needs in Negombo region. Larger the lot size, increases the total price and get more concessions, which results reduction in unit price. Sales price increases with the number of access points to the land. Hundred thousand rupees worth property with a single access point would sell for Rs.113,900 if it has multiple access points. This variable was taken as a dummy variable i.e. coded 1 if the property has a single point and 2 with multiple points. Table 02 Hedonic regression
As hypothesized, the exposure to lagoon view has a sound and significant effect on property value at 95% confidence level. The coefficient of 0.072 suggests that a property with view is approximately 7.5% higher than those with no view, where the other characteristics constant. In monetary terms, results imply that Rs.300,000 residential property with no view would sell for Rs.322,500 if it has a view. Further the distance
Standardized Coefficients Sig.
Beta P value Constant .000* view (dummy) .072 .000* Land size -.080 .034* Distance to bus route -.140 .000* Distance to drainage -.008 .533 Distance to school -.048 .026* Distance to hospital -.396 .000* Distance to super market -.006 .439 Distance to lagoon -.230 .000* Number of access points (dummy) .139
.000*
Model R R Square Adjusted R Square Std. Error of the
Estimate 1 .963(a) .927 .918 .08698

Proceedings of the 7th
YSF Symposium - 2018
52
from lagoon to the property has a significant impact too i.e. a 100% increase in distance will reduce the property price by 23%.
The value of the view may vary depending on distance from the lagoon. Along the coastline, lagoon access is blocked by either railroad tracks, commercial or industrial development. It is unlikely that proximity to the lagoon is valued for its own sake, over and above the impact on views. Thus, in common, greater distance lowers the value of a view. But just after a certain value (the maximum distance that would make an impact towards lagoon view) the lagoon distance may independent from the property price and such a relationship cannot be measured due to the variation in other attributes.
Therefore inorder to reduce the the impact of other factors, the properties were filtered within 1km from the lagoon. Then the model was tested where the Property price was estimated as a function of View, Distane and the Interaction variables. The interaction effect of both proximity and view towards the sales price was tested by using the interaction variable. All the three variables were significant and those could explain 22.6% from property price (adjusted R
2). The coefficient on interaction variable was
negative and significant (at 95% CL). When interaction variable is included, the impact of view is determined by the estimated coefficients of both the view dummy variable and the interaction (view and distance) variable. More specifically, the total percentage impact of lagoon view on sales price can be computed from; where β is the coefficient of the view dummy variable, and ϒ is the coefficient of the interaction variable.
Conclusions and Recommendations The outcome of the study indicates that seven key determinants, including the number of access points to the land, size of the land, distance to main bus route, school, hospital, distance to lagoon and lagoon view have significant impact on land prices of Negombo. According to this study the respondents have poor concern towards the infrastructures like access to drainage and access to the supermarkets. There is a huge demand for the Negombo government hospital due to lack of private hospitals to cater the needs of populace. This study further indicates that the presence of lagoon view increases the market price by 7.5% per perch compared to a similar property without lagoon view. Further with 100% increase from lagoon distance to the property, decrease the sale price by 23%. The interaction between the view and distance were considered and the value of view vary depends on the distance from the lagoon. More specifically, the more distance the view, the smaller the view premium, due to the quality of view and access. Based on these results, it appears that the impact of environmental attributes in addition to the detailed property characteristics can add considerably substantial contribution to the residential property values in an area with a natural resource. This demonstrates the importance of considering the environmental aspects in property developments to make an efficient property market. On the other hand, natural view of ecosystem as an element of urban landscape assesses the values of view as a cultural ecosystem service to urban community. Further this value can be used to compare the values between different user groups, which allow recognition of greater cultural sensitivity and trade-offs to human well-being.

Proceedings of the 7th
YSF Symposium - 2018
53
References [1] Assessment, M. E. (2005). Ecosystems and human well-being: wetlands and water.
World resources institute, Washington, DC 5. [2] De Groot, R. S., Alkemade, R., Braat, L., Hein, L., and Willemen, L. (2010).
Challenges in integrating the concept of ecosystem services and values in landscape planning, management and decision making. Ecological complexity 7, 260-272.
[3] Chan, K. M., Goldstein, J., Satterfield, T., Hannahs, N., Kikiloi, K., Naidoo, R., Vadeboncoeur, N., and Woodside, U. (2011). Cultural services and non-use values. The Theory and Practice of Ecosystem Service Valuation in Conservation, 206-228.
[4] Chiesura, A. (2004). The role of urban parks for the sustainable city. Landscape and urban planning 68, 129-138.
[5] Van Herzele, A., and Wiedemann, T. (2003). A monitoring tool for the provision of accessible and attractive urban green spaces. Landscape and urban planning 63, 109-126.
[6] Luttik, J. (2000). The value of trees, water and open space as reflected by house prices in the Netherlands. Landscape and urban planning 48, 161-167.
[7] Lancaster, K. J. (1966). A new approach to consumer theory. Journal of political economy 74, 132-157.
[8] Farber, S. C., Costanza, R., and Wilson, M. A. (2002). Economic and ecological concepts for valuing ecosystem services. Ecological economics 41, 375-392.
[9] Benson, E. D., Hansen, J. L., Schwartz, J., Arthur L, and Smersh, G. T. (1998). Pricing residential amenities: the value of a view. The Journal of Real Estate Finance and Economics 16, 55-73.
[10] Geoghegan, J. (2002). The value of open spaces in residential land use. Land use policy 19, 91-98.
[11] Geoghegan, J., Wainger, L. A., and Bockstael, N. E. (1997). Spatial landscape indices in a hedonic framework: an ecological economics analysis using GIS. Ecological economics 23, 251-264.

Proceedings of the 7th
YSF Symposium - 2018
54
EVALUATION OF WOUND HEALING ACTIVITY OF CEYLON CINNAMON (Cinnamomum zeylanicum) IN ALBINO MICE
H.M.I.M. Herath*1, R.P.V.J. Rajapakse2 and K.Vivehananthan1
1Department of Biotechnology, Faculty of Agriculture and Plantation Management,
Wayamba University of Sri Lanka, Sri Lanka 2Department of Veterinary Pathobiology, Faculty of Veterinary Medicine and Animal
Science, University of Peradeniya, Sri Lanka *Corresponding author (email: [email protected])
Introduction Ceylon cinnamon (C. zeylanicum) is the fourth most valuable spice in the world. It belongs to the family Lauraceae and ever green plant. Ceylon cinnamon has very low coumarin content which reduces the liver and kidney damage with prolong use. Cinnamaldehyde (trans- cinnamaldehyde) (TC), an active constituent isolated from the stem bark of cinnamon, is a low molecular weight cinnamic acid analogue with slight solubility in water. This aromatic aldehyde has been widely experimentally evaluated for its biological and pharmacological properties, including anticancer, anti-oxidative, anti-inflammatory, antimicrobial and immunomodulatory activities [1]. Cinnamon is useful as a medicinal plant with many therapeutic properties.
Physical and chemical injuries or microbial infections cause wounds. Research on “drugs from plant sources” is a newly developing area. Most of the drugs obtained from plant sources are known to increase the healing of different types of wounds [2]. Plants extracts can be applied for a long time due to its non-toxic effect. Ceylon cinnamon has proven that, it serves to accelerate the wound healing process and specially increased epithelialization [1]. No similar research had been done to investigate wound healing activity of aqueous extraction of Ceylon cinnamon in Sri Lanka.
This study focused to evaluate wound healing activity by an in vivo method, using an aqueous extraction of Ceylon cinnamon.
Materials and Methods Plant materials and preparation of extract Cinnamon bark quills were obtained from Central Research Station (CRS), Department of Export Agriculture, Sri Lanka, and bark quills were ground to produce a fine powder. Cinnamon bark powder was stored at room temperature. An aqueous extraction of Ceylon cinnamon was prepared by dissolving 50 g of bark powder in 200 mL of distilled water and heating for 30 min at 60
oC using a heat stirrer (Stuart). The, plant extract was
then filtered through a muslin cloth and concentration of final cinnamon filtrate was 40.5 mg/mL. Final concentration was measured by oven dry method.
In vivo experiment Experimental animals Eighteen Albino male mice (37.5±7.5 g) of approximately two months of age obtained from Medical Research Institute, Sri Lanka were used as experimental animals and were divided into three groups of six each. The animals were kept in standard environmental conditions of temperature (22 ± 3
°C), humidity (60 ± 5 %), and a 12hr light/ dark cycle at
Faculty of Medicine, University of Peradeniya. Diameters of wounds were periodically

Proceedings of the 7th
YSF Symposium - 2018
55
measured using a Vernier caliper during the experiment. During the experiment mice were administered a standard pellet diet and water. Ethical statement The study was approved by the Faculty Ethics Committee, Faculty of Veterinary Medicine and Animal Science, University of Peradeniya, for animal experiment. Excision wound model After induction of anesthesia with 2 % xylazine and 10 % ketamine (60 mg/kg) mice were kept in a ventral posture on a surgery table. Hair was cut in the dorsal area from the scapula to the ilium and prepared for surgery. A circular, full thickness surgical wound with diameters of 7mm, 1 cm away from both sides of the backbone was made with a 7 mm biopsy punch (Acu-Punch-U.S.A). Using this excision wounding method, the epidermal, dermal, hypodermal, and panniculus carnosus layers were removed completely [3].
Treatments After making of surgical wounds, all mice were coloured with non-toxic picric acid and divided into three groups. To group A, an ointment comprising 405 mg/kg cinnamon, to group B distilled water 0.2 mL as positive control, were administered orally. Group C was the control group and did not receive any treatment. All mice were monitored daily for 12 days. Wound area was monitored on fourth, eighth and twelfth days.
Statistical analysis Statistical analysis was carried out using Graphpad prism version 4.03 to analyze significant difference between the treatment and control group. A value of p<0.01 was considered significant.
Results and Discussion
Figure 1. Photographs of wound enclosure over 12 days of treatment group and control group in excision wound model in mice

Proceedings of the 7th
YSF Symposium - 2018
56
Figure 2. Wound area (mm2) of treated group and control group over 12 days in mice, Control
group- received 0.2 ml of distilled water, Cinnamon – 0.2 ml with the concentration of 40.5 mg/mL.
In vivo method Aqueous extractions of plants were not much significantly used to treat for wounds. Various treatments (analgesics, antibiotics, and nonsteroidal anti-inflammatory drugs) are available for the wound management but a majority of these therapies has numerous bad side effects [4]. Therefore, AEC was used to investigate the wound healing activity of Ceylon cinnamon.
Wound healing process was assessed by administering of higher concentration of AEC (405 mg/kg) and distilled water orally for experimentally induced excision wounds in mice. Concentration of aqueous extraction of cinnamon was determined based on the body weight of mice. Distilled water was given as positive control, because Cinnamon was dissolved in distilled water and distilled water is known to have an effect on wound healing. Results showed that, up to day 4, there was no significant difference between treated group and positive control group (p>0.01). Up to eighth day, contraction was significant in treated group compared to positive control group (p<0.01). Wounds had undergone shrinkage and contracted in treated group (Figure 2).
On the day 12, wound area was 0.69 ± 0.02 mm2 (data were not presented). It revealed
that, wounds have enclosed abundantly in treatment group compared to control group on day 12 (Figure 2).
On the fourth day, scab formation on the wounds which protects the wounds from inflammation, was greater in treated group compared to control group. Results showed that, on the day 4, there was no significant difference between treated group and positive control group (p>0.05) (figure 3). When healing process came to eighth day, granulation tissues were greatly formed in treated group compared to control group. Over 12 days, AEC involved with four steps, hemostasis, inflammation, proliferation and remodeling. Healing process was successful as all phases had occurred in proper sequence and time frame.
0
5
10
15
20
25
30
35
40
45
50
0 4 8 12
Wo
un
d a
rea
(mm
2)
Post wounding days
Cinnamon
Control

Proceedings of the 7th
YSF Symposium - 2018
57
Although the wound healing process is a normal biological process in the body, AEC stimulated the wound healing process of excision wounds in mice. It revealed that AEC which contained trans-cinnamaldehyde can be used as a stimulator of wound healing process. Other compounds such as eugenol, cinnamaldehyde, anti-oxidants and phytochemicals of Ceylon cinnamon are known to promote the wound healing due to their anti-inflammatory, anti-fungal and anti-bacterial properties which seem to be responsible for wound contraction and increased epithelialization [1].
Conclusions and Recommendations Up to eighth day, 40.5 mg/mL concentration of AEC promoted the better enclosure of wounds by improving the conditions such as contraction at the wound site compared to control group. Ceylon cinnamon can be improved as a medicine for the required standard with further researches, which can be used against different types of wounds of human in future.
References [1] M.R. Farahpour and M. Habibi, Evaluation of the wound healing activity of an
ethanolic extraction of Ceylon Cinnamon in mice. Journal of Veterinarni Medicina, 2012. 57(1): p. 53-57.
[2] T.K. Biswas and B. Mukherjee, Plant medicines of Indian origin for wound healing activity: a review. International Journal of Lower Extremity Wound, 2003. 2(1): p. 1643-1645.
[3] L.A. DiPietro, J.D. Zuckerman and A.M. Szpaderska, Differential injury responses in oral mucosal and cutaneous wounds, Journal of Dental Research, 2003. 82(8): p. 621-626.
[4] R.R. Shenoy, A.T. Sudheendra, P.G. Nayak, P. Paul, N.G. Kutty and C.M. Rao. Normal and delayed wound healing is improved by Sesamol, an active constituent of Sesamumindicum (L.) in Albino rats, Journal of Ethnopharmacology, 2011. 133(2): p. 608-612.

Proceedings of the 7th
YSF Symposium - 2018
58
DETERMINANTS OF AGRO-BASED NON-PERFORMING LOANS OF PEOPLE’S BANK IN KURUNEGALA REGION, SRI LANKA
H.B.C.M. Hitibandara *1, L.P. Rupasena1, A.I.Y. Lankapura1 and D.A.M. Perera 2 1Department of Agricultural Economics and Extension, Faculty of Agriculture, Rajarata
University of Sri Lanka,
2Department of Accountancy, Faculty of Business Studies and Finance, Wayamba
University of Sri Lanka *Corresponding author (email:[email protected])
Introduction A country like Sri Lanka, where agriculture plays a significant role in the economy, would generate multiple benefits with any type of financial assistance targeted on the agriculture sector. For this purpose, agricultural credit plays a pivotal role as a leading source of financial support for the farming community. Already, the crucial role of agricultural credit targeting poverty mitigation, livelihood diversification and entrepreneurship development among the farming communities has been recognized across the world [1]. Higher risk attached to the agriculture sector makes more difficulties to the farmers in maintaining customary savings. Thus, the provision of loans is a prime contribution to defeat obstacles linked to the financial aspects of agriculture. Various financial institutes in Sri Lanka initiated a number of agro-based loan schemes over the years to cater to the above necessity. However, one indicator of effective financial institute is the loan repayment performance of the borrowers [2]. High repayment rates are associated with benefits both for the financial institute and the borrowers [3]. Nevertheless, these financial institutes, including People’s Bank have experienced a huge financial pressure owning to the regular poor loan recovery rates. In case of People’s Bank, this occurrence gets acute in the Kurunegala region compared to other regions in the country. Thus, this study aims to identify the determinants of the poor recovery rates of Agricultural loans in order to minimize the likelihood of such behaviors through inventive strategies.
Materials and Methods The study was conducted in the service area of People’s Bank, Kurunegala Region by employing multistage stratified random sampling technique. At first stage, four branches out of 22 representing more than 60 percent of the non-performing borrowers of the region were chosen. A sample of 250 agricultural loan borrowers consisting of 200 non-performers and 50 performers were drawn using stratified random sampling technique at the second stage. Primary data were collected mainly from the key person interviews and focus group discussions whilst secondary data were extracted from the bank records. Simple descriptive analytical techniques, factor analysis and Binary Logistic Regression techniques were used in the data analysis.
Factor analysis was exercised to find out the major factors affecting on non-performance of agro-based loans. Age, gender, civil status, monthly income level, loan amount, number of dependants in the family, type of collateral, number of previously obtained loans, repayment period set by bank and the existence of loan monitoring system were among the considered variables. Binary logistic regression was employed to examine the loan repayment status of the customers. The binary variable "status of repayment" was utilized as the dependent variable. The model that describes the status

Proceedings of the 7th
YSF Symposium - 2018
59
of repayment is given below. Both SAS and SPSS software were used to estimate the model.
𝑙𝑜𝑔𝑖𝑡𝑌 = 𝛽0 + 𝛽1𝑋1 + 𝛽2𝑋2 + ⋯ … + 𝛽𝑛𝑋𝑛
Where; 𝑙𝑜𝑔𝑖𝑡𝑌 = Dependent variable (repayment status) 1 represents the consumers who were none performing (not recovered the loan within 90 days) 0 represents the consumers who performed well in recovering the loan (recovered the loan within 90 days) 𝛽0 = Intercept 𝛽1, 𝛽2 𝑡𝑜 𝛽𝑛 = Estimated coefficients 𝑋1, 𝑋2 𝑡𝑜 𝑋𝑛.= Independent variables
Results and Discussion The descriptive analyses revealed that the majority of the sampled farmers were less educated, where 62 % received formal education up to grade eight. Majority of the non-performing borrowers were in to the lower income level of Rs. 10,000 - 25,000 per month. Among the non-performing borrowers, 52% had previously obtained loans and only 24% of the total non-performers had undergone a proper loan-monitoring mechanism.
The factor analysis disclosed four factor groups that jointly explain 56.3% of the total variation of the dependent variable. Among factor groups, loan monitoring (0.68) and availability of previous loans (0.78) received the highest factor loadings under factor 01 and 02 respectively, while demographic factors such as civil status (0.77) and number of dependents in the family (0.71) were identified as key related variables in factor 03 and 04 respectively.
Table 1. Analysis of Maximum Likelihood Estimates Parameter DF Estimate Standard
Error Wald Chi-Square
Pr > ChiSq
Intercept 1 -10.8681 2.6168 17.2497 < .0001 Age 1 0.0866 0.0387 4.9969 0.0254* Monthly_income_level 1 1 1.6612 0.7203 5.3184 0.0211* Monthly_income_level 2 1 0.2825 0.7616 0.1376 0.7107 Loan_amount 1 1 -0.8223 0.8706 0.8922 0.3449 Loan_amount 2 1 -0.9748 0.8739 1.2442 0.2647 Dependants 1 2.7164 0.4993 29.5979 < .0001* Repayment_period 1 1.5398 0.8739 3.1042 0.0781 Previous_loans 1 2.5695 0.7098 13.1049 0.0003* Gender 1 -0.6220 0.3257 3.6463 0.0562 Civil_status 1 -0.9006 0.3684 5.9775 0.0145* Collateral 1 0.1976 0.3377 0.3422 0.5586 Loan monitoring 1 -1.3627 0.3536 14.8525 0.0001*
*At 5% significant level. Monthly income level (average income of past six months) level 1 = (Rs. 10,000 - 25,000), level 2 = (Rs. 25,000 - 40,000) and level 3 = (Rs. 40,000 - 55,000). Loan amount level 1 = (Rs. 50,000 - 150,000), level 2 = (Rs. 150,000 - 250,000), level 3 = (Rs. 250,000 - 350,000).

Proceedings of the 7th
YSF Symposium - 2018
60
According to the results of Binary Logistic Regression, age, monthly income level, dependants, previous loans, civil status and loan monitoring were identified as statistically significant variables (p<0.05) in determining the non- performance of agro based loans (Table 1). In detail, the monthly income level 1 (Rs. 10,000 - 25,000) is affecting significantly higher (Odds ratio/OR = 36.78) compared to the monthly income level 3 (Rs. 26,000 - 55,000). Simply, the possibility of being non-performing is 36.8 times higher in income level 1 compared to income level 3. In general, with lower levels of income, the amount of money remained to repay loans are diminished. This substantiates previous findings [4] in the literature. However, related to the loan amount, the current study does not support previous research [4] in this area.
Results of the odds ratio estimates are given in Table 2. When the number of dependents in the family (OR = 15), previous loans (OR = 13) and age of the farmer (OR =1.09) increases, the likelihood of being non-performing also increases. The comparison between married and unmarried loan borrowers revealed that the possibility of being non-performing decreased by 83.5% for married borrowers as compared to the category of unmarried. The effect of multiple income sources might be the major causative factor behind this relationship. The existence of a proper loan monitoring mechanism also decreases the possibility of being non-performing by 94% compared to a system without monitoring mechanism.
Table 2. Odds Ratio Estimates
Effect Point
Estimate 95% Wald
Confidence Limits Age 1.09 1.011 1.176* Monthly income level 1 vs. 3 36.776 0.829 >999.999* Monthly income level 2 vs. 3 9.264 0.191 450.444 Loan amount 1 vs. 3 0.073 <0.001 6.97 Loan amount 2 vs. 3 0.063 <0.001 6.028 Dependants 15.126 5.685 40.246* Repayment period 4.663 0.841 25.858 Previous loans 13.060 3.249 52.495* Gender Male vs. Female 0.288 0.08 1.033 Civil status Married vs. Unmarried
0.165 0.039 0.7*
Collateral Person vs. Property
1.485 0.395 5.579
Loan monitoring Yes vs. No
0.066 0.016 0.262*
*At 5% significant level. *At 5% significant level. Monthly income level (average income of past six months) level 1 = (Rs. 10,000 - 25,000), level 2 = (Rs. 25,000 - 40,000) and level 3 = (Rs. 40,000 - 55,000). Loan amount level 1 = (Rs. 50,000 -150,000), level 2 = (Rs. 150,000 - 250,000), level 3 = (Rs. 250,000 - 350,000).
Conclusions and Recommendations The study concludes that, with increasing age, number of dependants, existence of previously obtained loans and decreasing monthly income level have significantly increased the likelihood of being a non-performing borrower, whilst civil status (married) and existence of a proper loan monitoring mechanism significantly decreased the likelihood of this event. Therefore, it is recommended to strengthen the existing loan monitoring system, in order to minimize the low recovery rate.

Proceedings of the 7th
YSF Symposium - 2018
61
References [1] L. Poliquit, "Accessibility of rural credit among small farmers in the Philippines",
Massey University, Palmerston North, New Zealand, 2006. [2] R. Sengupta and C. Aubuchon, "The Microfinance Revolution", Federal Reserve
Bank of St. Louis Review, vol. 90[1], pp. 9-30, 2008. [3] M. Godquin, "Microfinance Repayment Performance in Bangladesh: How to
Improve the Allocation of Loans by MFIs", World Development, vol. 32, no. 11, pp. 1909-1926, 2004.
[4] M. Reza Kohansal and H. Mansoori, "Factors Affecting on loan Repayment Performance of Farmers in Khorasan-Razavi Province of Iran", Conference on International Research on Food Security, Natural Resource Management and Rural Development, Iran, 2009, pp. 1-4.

Proceedings of the 7th
YSF Symposium - 2018
62
COMPARATIVE STUDY ON BYCATCH OF SELECTED SMALL SCALE FISHERIES IN JAFFNA, SRI LANKA
K Kalaivanan, S Sutharshiny*, K Sivashanthini
Department of Fisheries, University of Jaffna, Jaffna, Sri Lanka. *Corresponding Author (email: [email protected])
Introduction Bycatch is commonly referred to as incidental catch of non-target fish and other organisms. It has long been a matter of great concern in the Indo-Pacific Ocean and has been a persistent problem for decades, because it remains largely undocumented. Most of the bycatch studies have focused on industrial fisheries, leaving a lack of information regarding small-scale fisheries, in particular towards effort, catch and bycatch [1]. Assessing by-catch has important implications for biologic and socioeconomic considerations in the fisheries management.
North coastal waters of Sri Lanka are geographically enriched with fish biomass due to the continental shelf. Approximately 25 % of the populations in Jaffna district directly or indirectly depend on fisheries sector for their livelihood. According to the statistical data (Ministry of Fisheries, Sri Lanka, 2014), gill nets are still the major fishing gear and have substantial demand every year. Traps, particularly sirahu valai, have been universal gear in the Jaffna peninsula.
Small-scale fishing and the associated bycatch have been received little attention in Sri Lanka. By catch species composition in Jaffna is still not elucidated so far. Therefore, the aim of the present study is to quantify bycatch ratios of the small-scale fishery in order to establish a knowledge baseline from which changes in bycatch ratios can be monitored and to inform decision making processes for future fisheries management plans. Materials and Methods Sampling The present study was monitored the catches in selected small scale fisheries with observation of the landing sites, Mathakal, Kurunagar, Kachchai, Marudankeni and Thondamanaru. Field visits were made once a month for each landing sites during the period from July 2016 to December 2016. A total of 30 fishing trips were conducted during the study period. Small scale fisheries: crab net, trap, cast net, sirahuvalai and hook and line were selected to estimate the catches in the landing sites of Mathakal, Thondaimanaru, Kachchai, Kurunagar and Maruthankerny respectively. Dimension of the gears are shown in Table 1.
Estimation of biomass of target and bycatch species Biomass of target and bycatch species of respective fishing gears were measured in Kg and expressed in percentage. The bycatch ratio (BCR) is defined as the ratio of bycatch to total catch, whereby total catch equals landings plus bycatch. Discards in bycatch species were also observed at the landing sites.
Target and bycatch species were identified using FAO species identification field guide for fishery purposes.

Proceedings of the 7th
YSF Symposium - 2018
63
Table 1: Description of the structure of the gears used in small scale fishery
Type of gear Description of the structure
Cast net Circular or oval net with a leaded foot line around the outside; and 6 m in diameter; Mesh size between 20 mm and 40 mm; 3/4 lb - 1 lb per ft of lead weight on a net; Twine diameter mesh size are 9 to 12 ply.
Sirahuvalai Length of leader net is 30-50 m, Mesh size-10-50 mm, Diameter of the chamber is 8m and the mesh size is 15 mm-50 mm, twine diameter mesh size are 9 to 14 ply. The height and diameter of the pole are 11-12 m and 50-75 mm.
Longline fishery A squid jig is a baited or artificial lure with one or more sets of pointed hooks or spikes, used to catch squid. Three squid jigs are used for a longline.
Crab net The range of the meshes is 8 mm to 150 mm; The range of length is 45 m to 95 m, or at request; The range of height is 1.8 m to 4 m. Multifilament nylon net, Silky Net (premium quality), multi-monofilament nylon or multifilament polyamide are used in this gear. Lead weight on a net is 1 lb – 1.5 lb per ft. Mesh size is 9 to 18 ply.
Traps Length - 500 mm x Width - 350 mm x Height - 250 mm. There are two entrances not larger than 65 mm. Mesh size between 10 mm and 40 mm. Metal or bamboo basket is used for the construction.
Estimation of biomass of target and bycatch species Biomass of target and bycatch species of respective fishing gears were measured in Kg and expressed in percentage. The bycatch ratio (BCR) is defined as the ratio of bycatch to total catch, whereby total catch equals landings plus bycatch. Discards in bycatch species were also observed at the landing sites.
Target and bycatch species were identified using FAO species identification field guide for fishery purposes.
Statistical analysis The data were statistically analysed using SPSS Software, version 10 (Stat Soft, Inc. 1995, Tulsa, OK, USA). The BCR among the fisheries were analyzed by one way Analysis of Variance (ANOVA). Significant differences were expressed at p< 0.05.
Results and Discussion In castnet fishery, landings were composed of 6 species of bonefishes (Gerres sp., Chanos chanos, Goat fish, Lethrinus sp., Mugil sp., Sphyraena sp., Sillago sp.) and 3 crustacean species (Mud crab, Blue swimming crab, Prawns) in Kachchai during the study period (Table 2). All the bycatch species were marketed and also used for dry fish preparation. Considerable discards were not recorded in the cast net fishery during the study period. BCR value of cast net fishery was 0.57 ± 0.05 (Figure 1). Table 2: Species composition of different types of fisheries
Description
Cast net in Kachchai
Sirahuvalai in Kurunagar
Long line in Marunthan-
kerny
Crab net in Mathakal
Traps in Thondai-manaru
Target Gerres sp Prawn Squid, Cuttle fish
Crab Siganus
By catch Milk fish Goat fish Lethrinus mugil Barracuda sillago, Mud crab, Blue swimming crab, Prawns
Puffer fish Plotosus japonicus
Sea bird Dolphin Leather head sea turtle, Chunk
Starfish, Chunk, Ray Immature crab
Mud crab, shrimps, immature bony fishes

Proceedings of the 7th
YSF Symposium - 2018
64
cast net/Kachchai
, 0.57, 22%
Sirahuvalai/ Kurunagar, 0.48, 19%
Crab net/ Mathakal , 0.61, 24%
Longline / Maruthanker
ny , 0.59, 23%
Traps/ Thondaiman
aru, 0.31, 12%
Figure 1: Bycatch Ratio in selected small scale fisheries
Penaeus semisulcatus, P. indicus and P. monodon are targeted species in the sirahuvalai fishery. Puffer fishes were the highest % (11%) of bycatch species during the study period and it was utilized for dry fish production. The results highlight a hotspot of highest number of discarded Plotosus japonicas in the Kurunagar landing sites.
In longline fishery, Jik/ tackle / lures are used for aggregating device. Landings were dominated by non- target species in the longline fishery (Figure 2).
Out of the 54% of bycatch of all fisheries, the highest % of bycatch was recorded in cast fishery, while the lowest % of bycatch was in Traps (Figure 2).
Baited traps are the traditional device in the Thondaimanaru site. Target species of this gear is Siganus sp. Comparatively the amount of bycatch is very low. Identified bycatch species are mud crab and shrimps.
Estimated BCR of cast net, Longline fishery, crab fishery and sirahuvalai fishery are significantly higher than that of other fisheries, therefore theses fisheries are not selective for the target species.

Proceedings of the 7th
YSF Symposium - 2018
65
Figure 2: Percentage of target and bycatch species in different types of fisheries
(* significantly (p< 0.05) the highest percentage of species)
Sri Lanka is one of the few countries with very high estimates of cetacean bycatch in the late 1980s. Greater than 40 000 cetaceans may have been killed annually in Sri Lankan artisanal gillnet fisheries at the time. But the lowest bycatch levels were observed in the purse seine in the Indian Ocean Tuna fisheries.
Conclusion and recommendations Traps fishery is the most selective fishing gear than that of other fishing gears. The highest % of bycatch was recorded in cast fishery, while the lowest % of bycatch was in Traps. The results demonstrate it is essential to develop integrated management system in the future in order to minimize the fishing pressure on non-target species.
Acknowledgement We express our gratitude to the fishers of the respective landing site for their collaborations at the landing.
References: [1] J.S. Zimmerhackel, A.C. Schuhbauer, P. Usseglio, L.C. Heel and Pelayo Salinas-de-
Leon. “Catch, bycatch and discards of the Galapagos Marine Reserve small-scale handline fishery.” PeerJ, Vol. 3, No. e995, pp. 1-18, 2015.
[2] J.E. Moore, T.M. Cox, R.L. Lewison, A.J. Read, R. Bjorkland, S.L. McDonald, L.B. Crowder, E. Aruna, I. Ayissi, P. Espeut, C. Joynson-Hicks, N. Pilcher, C.N.S. Poonian, B. Solarin and J. Kiszka. “An interview-based approach to assess marine mammal and sea turtle captures in artisanal fisheries.” Biological Conservation, Vol. 143, pp. 795–805, 2010.
0
10
20
30
40
50
60
70
80
castnet/Kachchai
Sirahuvalai/Kurunagar
Crab net/Mathakal
Longline /Maruthankerny
Traps/Thondaimanaru
% o
f sp
ecie
s co
mp
osi
tio
n
Types of fishery
Target species
Bycatch species
* *
Proceedings of the 7th
YSF Symposium - 2018
66
IMPEDANCE ANALYSIS OF Cu/n-Cu2O/p-Ag2O/n-Cu2O PHOTOELECTRODE AT THE ELECTROLYTE INTERFACE
P.G.D.C.K. Karunarathna1,2, S.P.A.U.K. samarakoon1, , G.G. Chathuranga1,2 , H.T.D.S. Madusanka1,2, U.S. Liyanaarachchi1,2 and C.A.N. Fernando*1,2
1Department of Electronics,
2Nano-technology Research Laboratory, Department of Nano Science Technology,
Faculty of Applied Sciences, Wayamba University of Sri Lanka, Kuliyapitiya, Sri Lanka *Corresponding author (email:[email protected])
Introduction The synthesis of transition metals and their oxides were reported due to its special physical and chemical properties. Among them Cu2O is a promising material with potential applications in electrode material, catalysis and gas sensors [1,2]. Cu2O is a direct bandgap semiconductor which is highly use for solar energy conversion due to its bandgap (≈ 1.9 – 2.2 eV) and relatively high absorption coefficient in visible region [3]. Silver oxide is also a well-known metal oxide, having much attention due to its unique optical, electrical and magnetic properties. It is a p-type semiconductor material having a narrow bandgap of ~ 1.4 eV. When Ag2O irradiates to UV light, it behaves as an effective electron absorbing agent and while under visible light irradiation it acts as an efficient photosensitizer [4]. Therefore, in this research study these two metal oxides were used to fabricate the photoelectrode. A considerable photocurrent enhancement of 80% was measured at the Cu/n-Cu2O electrolyte interface in a photo-electrochemical cell with the introduction of a thin layer of p type Ag2O between n-Cu2O layers. The enhancement in photocurrent is attributed to the creation of copious electron-hole pairs due to the introduction of a sub monolayer narrow bandgap Ag2O.
Materials and Methods Well cleaned copper plates (1 cm × 3 cm) were immersed in to a 0.005 M CuSO4 solution and boiled for 30 min to obtain an n-Cu2O terminating layer on the copper substrate. During the boiling, a fixed volume of CuSO4 solution was maintained to provide the same experimental conditions for different preparation conditions. The Cu/n-Cu2O substrate was dipped in a solution containing 0.1 M AgNO3 to form a uniform layer of Ag2O particulates. The amount of Ag2O formed on the Cu/n-Cu2O substrate was controlled by controlling the dipping time. After deposition of Ag2O particulates, samples were dried. Then, the Cu/n-Cu2O/p-Ag2O substrates were again boiled in the 0.005 M CuSO4 solution for 15 min. Results and Discussion The variation of photocurrent with various dipping times of Cu/n-Cu2O in the 0.1 M AgNO3 solution is shown in Figure 1. It is clearly seen that the photocurrent enhances with the increase of Ag2O deposition time compared to that of the photocurrent density produced for the bare n-Cu2O- electrolyte interface (≈ 1 mA/cm
2). It is interesting to
note that the maximum photocurrent occurs when the deposition time is nearly 5 seconds. We conjecture that it is at this critical time that the Ag2O film coverage is between a space coverage of particulates and its coverage as a continuous film. The later would prohibit the efficient passage of light through the structure.

Proceedings of the 7th
YSF Symposium - 2018
67
Figure 1. Photocurrent Vs. Ag2O deposition Time (Sec.)
To explain the surface morphologies and elemental analysis for fabricated samples, scanning electron microscopy (SEM) images and energy dispersive X-ray (EDX) analysis are used and the results are shown in the figure 2 (a-f). Compared with the bare Cu2O in figure 2(a), the formation of sub monolayer narrow band gap Ag2O is clearly observed in figure 2(b). Due to the formation of the top most Cu2O layer, some of Ag2O particles disappear in figure 2(c). But the formation of Ag2O layer is confirmed from EDX in figure 2(f).

Proceedings of the 7th
YSF Symposium - 2018
68
Figure 2 (a-c) SEM images of the top view for the Cu/n-Cu2O, Cu/n-Cu2O/p-Ag2O and Cu/n-Cu2O/p-Ag2O/n-Cu2O respectively. (d-f) EDX of the top view for the Cu/n-Cu2O, Cu/n-Cu2O/p-Ag2O and Cu/n-Cu2O/p-Ag2O/n-Cu2O respectively.
To futher characterize the structure-properties of the fabricated samples UV-vis spectroscopy, time development of photocurrent for Cu/ n-Cu2O/p-Ag2O/n-Cu2O cells, Fourier Transform Infrared (FTIR) spectra, Energy Dispersive X-ray Spectroscopy (EDX) and X-ray diffraction (XRD) were done [5].
Beside that the further study of charge transfer kinetics and internal resistance of the fabricated samples, EIS analysis was done and results are shown in figure 3 (i). As in the Nyquist plot all the plots show two partially overlapped semicircles in medium to low frequency region. The corresponding equivalent circuit for Cu/n-Cu2O, Cu/n-Cu2O/p-Ag2O and Cu/n-Cu2O/p-Ag2O/n-Cu2O cell system is shown in figure 3 (ii). The first semicircles in the high frequency region is due to charge transfer resistance (RCE) and double layer capacitance (CCE) at the counter electrode (CE)/electrolyte interface. The second semicircles in the mid frequency region is due to the charge transfer resistance of the recombination process (Rr) and interfacial capacitance (Cµ) at the semiconductor/electrolyte interface. The Rr, Cµ and calculated electron lifetime (τn) of the different cells determined from EIS analysis are listed in table 1. The larger value of Rr implies the retarded backward reaction of injected electron transfer at semiconductor/electrolyte interface. i.e. reduced interfacial recombination resulting in high efficiency. The density of states and the surface recombination sites are indicated from Cµ.
Another parameter which is related to recombination rate and the electron transfer rate is the electron lifetime (τn). It can be calculated from following equation.
τn = Rr Cµ (1)
As presented in table 1, the electrode with Cu/n-Cu2O/p-Ag2O/n-Cu2O has the largest electron lifetime than the other two electrodes.
Table 1. Parameters obtained from the fitting results of the electrochemical impedance spectra.
Electrode Rr (Ω) Cµ (µF) τn (mS) Cu/n-Cu2O 31.9 438.74 13.995 Cu/n-Cu2O/p-Ag2O 128 287.02 36.738 Cu/n-Cu2O/p-Ag2O/n-Cu2O 166 331.79 55.077
Conclusions and Recommendations The fabrication of a partial Ag2O layer on the Cu2O electrode is shown to substantially enhance light absorption and create copious electron hole pairs due to the narrow band gap of Ag2O. Thus, the n-Cu2O electrode was synthesized with Ag2O for 5 s and produced an increase in photocurrent of ~80%. The EIS analysis was used to describe the electron lifetime in the photoelectrodes.

Proceedings of the 7th
YSF Symposium - 2018
69
Figure 3: (i) Nyquist plots for (a) Cu/Cu2O (b) Cu/Cu2O/Ag2O (c) Cu/Cu2O/Ag2O/Cu2O (ii) Equivalent circuit used to fitting the Nyquist plots
References [1] S.Venkatachalam, H. Zhu, C. Masarapu, K. Hung, Z. Liu, K. Suenaga and B. Wei, “In-
situ formation of sandwiched structures of nanotube/Cu x O y/Cu composites for lithium battery applications”, ACS nano, 3(8), pp.2177-2184, 2009.
[2] C. M. McShane and K.S. Choi, “Photocurrent enhancement of n-type Cu2O electrodes achieved by controlling dendritic branching growth”, Journal of the American Chemical Society, 131(7), pp.2561-2569, 2009.
[3] A. Mittiga, E. Salza, F. Sarto, M. Tucci and R. Vasanthi, “ Heterojunction solar cell with 2% efficiency based on a Cu2O substrate”, Applied Physics Letters, 88(16), p.163502, 2006
[4] X. Wang, S. Li, H. Yu, J. Yu, andS. Liu, “Ag2O as a New Visible‐Light Photocatalyst: Self‐Stability and High Photocatalytic Activity”, Chemistry-A European Journal, 17(28), pp.7777-7780, 2011.
[5] P.G.D.C.K. Karunarathna, S.P.A.U.K. Samarakoon, C.A.N. Fernando, V.G. Harris and S. N.T. De Silva, “Large photocurrent enhancement in the Cu/n-Cu2O/p-Ag2O/n-Cu2O photoelectrode at the electrolyte interface”, Materials Research Express, 4(6),2017

Proceedings of the 7th
YSF Symposium - 2018
70
IMPACT OF GAMMA IRRADIATION ON THE FATTY ACIDS PROFILE OF SOME TRADITIONAL RICE (Oryza sativa.L) VARIETIES OF SRI LANKA
M.P.U. Kumara and E.M.R.K.B. Edirisinghe* Dept. of Physical Sciences, Faculty of Applied Sciences, Rajarata University of Sri Lanka
*Corresponding author (email: [email protected])
Introduction Rice (Oryza sativa L.) is relished by many people as a staple food because of its flavour and texture. About 80% of world rice is produced from the cultivation of Asian rice. Sri Lanka has a rich treasure of traditional rice cultivars and there are about 2000 conserved traditional rice varieties [1]. Many varieties are very high in nutritional value and medicinal properties and most are resistant to extreme climatic conditions, soil conditions, diseases and pests. Traditional rice cultivars have paramount importance because those cultivars have evolved thousands of years in the local soil.
Spoilage is a main problem to the food and its shelf life. Traditional rice varieties can be undergoing immediately spoilage due to effect of microorganisms such as yeasts, bacteria or fungi with their fragrance and texture. Therefore, some food preservation method is required to protect traditional rice. Gamma irradiation is a novel food preservation technique used is several countries all over the world. It is a high energy treatment thus may cause change in food quality especially due the changes in lipids [2]. The fatty acids of lipids play an important role in human health and nutrition. The essential fatty acids needed for many biological function of the body are synthesized by plants, thus are dietary requirements. This study was done to determine the effect of gamma irradiation on fatty acids composition of traditional rice verities in Sri Lanka.
Methods and Materials Eight different traditional rice varieties were collected from several Villages of Anuradhapura District of North Central Province in Sri Lanka in February of 2017. The collected varieties were, Heenati, Kuruluthuda, Suwandel, Hatadaa, Gonabaru, Rankahawanu, Kahamala and Madathawalu.
A set of one kilogram of each rice variety were selected as a controller samples. Another set of a kilogram of rice varieties were subjected to gamma irradiation from Cobalt 60 source using 5kGy dose from Sri Lanka Gamma Center (SLGC) of the Atomic Energy Authority of Sri Lanka. The absorbed dose rate was measured using Harwell dosimeter, and irradiated samples and non-irradiated samples were stored in pesticides resistant cupboard of chemistry laboratory in Rajarata University of Sri Lanka until analyze.
Extraction of fat in rice The total fat content in irradiated and non-irradiated rice samples were extracted by Soxhlet method described by the AOAC methods [3]. Methyl esters of extracted fatty acids (FAME) were prepared by transesterification methods and the prepared FAME were then separated and identified by Gas Chromatography–Mass Spectrometry (GC-MS).
GC-MS Analysis GC-MS analysis of FAME was performed by using Shimadzu QP 2020 GCMS, equipped with a Rt-2560 fused silica capillary GC Column (100m x 0.25mm x 0.20µm). For GC-MS detection, an electron ionization system with ionization energy of -70eV was used. The

Proceedings of the 7th
YSF Symposium - 2018
71
obtained peaks were identified and quantitatively determined by comparing with the library available in the instrument and retention times of methyl esters in a standard mixture from Larodane fine Chemicals AB, Sweden.
Results and Discussions Results of Non-Irradiated traditional samples showed that the fatty acid profile of rice comprised of several fatty acids, predominantly with Vaccenic acid (C18:1), Linoleic acid (18:2) followed by Palmitic acid (C16:0) (Table 1). The amount of Stearic acid (C18:0), Lignoceric acid (C24:0) and Behenic acid (C22:0) also noticeable, but trace amount of γ-Linolenic acid (C18:3), Arachidic acid (C20:0), Gondoic acid (C20:1) and Pentacosylic acid (C25:0) were present. The results were comparable with Zhout Z. et. al [4]. The result of irradiated rice varieties with 5kGy showed small changes of fatty acid compositions in some varieties. The amount of Vaccenic acid (18:1) in control sample of Heenati rice was reduced from 40.36% to 36.40%. However, small increment of Palmitic acid (C16:0) in the irradiated sample also indicated in irradiated rice (Figure 1). Fatty acid composition of most rice varieties including Kuruluthuda rice was not showed any considerably change in their fatty acid profile.
However, Heenati and Hatadaa varieties showed significant difference in 16:0, 18:10, 18:1 and 18:2 fatty acids after irradiation.
Figure 1: GC-MS ion Chromatograms of “Heenati” rice(a) 5kGy irradiated sample (b) non- irradiated sample.
(a)
(b)

Proceedings of the 7th
YSF Symposium - 2018
72
Table 1: Fatty acids composition in non-irradiated and irradiated rice
Fatty Acid
PERCENTAGES OF FATTY ACID %
Heenati Kuruluthuda Suwandel Hatadaa Gonabaru Rankahawanu Kahamala Madathawalu
0kGy 5kGy 0kGy 5kGy 0kGy 5kGy 0kGy 5kGy 0kGy 5kGy 0kGy 5kGy 0kGy 5kGy 0kGy 5kGy
C16:0 18.49 19.02 19.54 19.59 17.12 18 20.65 16.57 20.64 18.53 17.73 17.85 18.28 16.99 18.95 19.44
C18:0 4.69 3.7 4.26 4.24 4.02 3.92 5.88 3.88 4.32 4.19 3.57 4.17 3.1 4.18 3.68 4.01
C18:1 40.36 36.4 37.04 37.15 38.04 38.35 39.23 41.02 38.02 36.57 38.31 39.35 35.47 35.91 37.07 37
C18:2 26.19 25.46 27.82 27.06 31.86 30.66 21.31 28.87 26.81 28.52 30.45 29.62 25.76 26.77 28.79 28.43
C22:0 0.84 0.82 1.03 0.95 0.93 0.96 1.04 0.83 0.91 1.37 0.75 0.63 0.68 0.6 1.22 0.98
C24:0 2.02 1.63 2.15 1.18 1.84 2.08 2.02 1.94 2.05 2.9 1.77 1.55 1.44 1.42 2.65 1.92
Non-irradiated sample=0kGy, Irradiated sample= 5kGy

73
Some references indicated that high dose gamma irradiation (>10kGy) may cause some toxic chemical from fatty acids such as 2-Alkylcyclobutanones (2-ACB) [1]. However, there is no indication of such formation at this low level irradiation. Furthermore, Irradiation of beef [5] at 5 kGy reduced the total amount of unsaturated fatty acids, especially of the poly-unsaturated type, and increased the total amount of saturated fatty acids. However, during this study, only minor changes in several fatty acids were observed after 5kGy irradiation. Conclusions
The fatty acids composition in traditional rice varieties mainly comprise of Linolenic acids, Myristic acid, Palmitic acid, Stearic acid and Vaccenic acid. The gamma irradiation caused very limited impact on fatty acid profile of rice, thus can be considered as useful food preservation technique.
References [1] A.L. Ranawake, U.G.S. Amarasingha, and N. Dahanayake; Agronomic characters of
some traditional rice (Oryza sativa L.) cultivars in Sri Lanka, J.Univ.Ruhuna, vol. 1, pp.3-9, March 2013
[2] J.T Liberty., D.I Dickson., A.E Achebe. and M.B. Salihu, An Overview of the Principles and Effects of Irradiation on Food Processing & Preservation, International Journal of Multidisciplinary and Current Research. [Available:: http://ijmcr.com]
[3] AOAC. Official Methods of Analysis( Method 945.16), 15th
ed, Association of official analytical chemists, Washington,DC, 1990
[4] Z. Zhou, C. Blanchard, S. Helliwell and K. Robaradsa, Fatty acid composition of three rice varieties following storage ; School of Science and Technology, Australia (2002 march 21) Journal of cereal science (2002) pp. 1-9
[5] Minami I., Nakamura Y., Todoriki S. and Murata Y.; Effect of γ-Irradiation on the Fatty Acid Composition of Soybean and Soybean Oil; Bioscience, Biotechnology and Biochemistry, Vol.76, 900--905, 2012

Proceedings of the 7th
YSF Symposium - 2018
74
SUB CHRONIC TOXICITY ASSESSMENT OF A SELECTED ANTIDIABETIC MEDICINAL PLANT EXTRACTS MIXTURE IN HEALTHY WISTAR RATS
D.S.N.K. Liyanagamage1, V. Karunaratne1, A.P. Attanayake*2, S. Jayasinghe1
1Department of Chemistry, Faculty of Science, University of Peradeniya, Sri Lanka
2Department of Biochemistry, Faculty of Medicine, University of Ruhuna, Sri Lanka
*Corresponding author (email: [email protected])
Introduction Diabetes mellitus is one of the most prevalent chronic diseases worldwide. Recent data shows that there are more than 1.1 million diabetic cases in Sri Lanka [1]. Although multiple pharmacological agents have been introduced for the management of diabetes mellitus, globally the total number of people with diabetes is still increasing. In recent years, plant derived neutraceuticals have received considerable interest as effective and safe in the management of diabetes mellitus. Synergistic properties are one of most attractive features in the antidiabetic actions of herbal medicine based nutraceuticals, due to the presence of variety of bio-active compounds within a single medicinal plant extract mixture [2]. Herbal remedy composed of leaves of Murraya koenigii (L.), cloves of Allium sativum (L), dried fruits of Garcinia queasita Pierre and dried seeds of Piper nigrum (L) has been used in Sri Lankan Ayurvedic medicine for the management of diabetic mellitus. The acute antihyperglycaemic effect of the hot water extract of above plant mixture has been proven in streptozotocin induced diabetic rats previously. The present study was performed to determine the sub chronic toxicity of the above hot water extract mixture in healthy Wistar rats. This was done in order to proceed with the development of a value added plant derived nutraceutical for the management of diabetes mellitus.
Materials and Methods Plant materials The dried fruit rinds of Garcinia quaesita , leaves of Murraya koenigii, seeds Piper nigrum and cloves of Allium sativum were collected and above medicinal plants were taxonomically authenticated by comparing specimens at the National Herbarium of the National Botanical Gardens, Peradeniya.
Preparation of combined plant extracts The fresh leaves of Murraya koenigii, dried fruits of Garcinia queasita, dried seeds of Piper nigrum and cloves of Allium sativum were collected and washed immediately with running water and allowed them to air dry. Once the plants parts were dried, 100 g of each individual plant material were ground together to obtain the plant mixture. Hot water extract of the mixture was prepared by refluxing 100 g of combined plant mixture in distilled water (500 mL) for three hours.
Experimental animals Healthy male rats of Wistar strain (200±25g, 12 weeks of age) were purchased from the Medical Research Institute, Colombo. They were housed in standard environmental conditions (Temperature 25 ± 2°C and light and dark cycle) at the animal house of Faculty of Medicine, University of Ruhuna. The animals were maintained on a standard laboratory diet of pellets with free access to water. Ethical clearance for the animal

Proceedings of the 7th
YSF Symposium - 2018
75
study was approved by the Ethical Review Committee of Faculty of Medicine, University of Ruhuna, Sri Lanka (09.03.2016.3.8).
Toxicity study of combined medicinal plant mixture in healthy rats Rats were randomly divided to two groups (n=6/group). The first group served as the untreated healthy control group received distilled water daily. The rats in the second group received the hot water extract of combined medicinal plant mixture at the therapeutic dose (1.0 g/kg), daily for 28 days. The rats were observed daily for clinical toxicity signs and mortality. The body weight of each rat was measured during the experimental period at weekly intervals and on the day of sacrifice. The amount of food consumption and intake of water were measured daily. The fasted (12 h) rats were sacrificed on the 28
th day of the experiment. The heart, lung, small intestine, liver,
spleen, pancreas and kidney and stomach were isolated and relative organ weight was calculated. The selected serum biochemical parameters including serum concentration of alkaline phosphatase, aspartate aminotransferase, alanine aminotransferase, glucose, creatinine and urea were estimated using spectrophotometric enzyme assay kits. Haematological parameters (full blood count) including haemoglobin, total red blood corpuscles, platelet count, red cell indices including packed cell volume, mean corpuscular volume, mean corpuscular hemoglobin (MCH) concentration, total white blood corpuscles, percentage of neutrophils, lymphocytes, eosinophils and monocytes were estimated using an automated haematological analyzer [3].
Statistical analysis Statistical analysis was performed using Minitab statistical software. Data were subjected to independent t-test. Statistical significance was considered at p< 0.05.
Results and Discussion Mortality or any significant alteration in the behavior was not shown in two groups of rats throughout the period of 28
days. There was no significant difference (p > 0.05) in
body weights of animals, consumption of food and intake of water between plant extract treated group and the control group. The oral administration of hot water extract of combined medicinal plant extract mixture over 28 days did not produce any significant change in the relative weight of the organs (i.e. The heart, lung, small intestine, liver, spleen, pancreas, kidney and stomach) at the therapeutic dose when compared with the control group rats (p>0.05). There was no statistical difference in the listed biochemical parameters (Table 1). Further, no significant change was observed in the haematological parameters in plant extract treated rats compared to the control rats (p>0.05).
Table 1. Effect of plant extract mixture on selected biochemical parameters in healthy Wistar rats [Each value represents the mean ±SEM (n=6/group). The independent t-test showed no statistical difference between the parameters studied in treated healthy rats compared to untreated healthy rats p>0.05.]
Biochemical parameter in serum Healthy control rats Plant extract treated rats Alkaline phosphatase (U/L) 59.66±1.61 61.88±1.17 Alanine aminotransferase (U/L) 42.43±1.56 44.05±1.20 Aspartate aminotransferase (U/L) 149.54±1.26 147.78±1.30 Glucose (mmol/L) 4.80±0.33 4.50±0.20 Creatinine (mg/dL) 1.2118±0.08 1.35±0.08 Urea ( mmol/L) 16.98±1.60 19.51±1.17

Proceedings of the 7th
YSF Symposium - 2018
76
Hot water extract of combined medicinal plant mixture did not interfere with normal body metabolism due to the absence of significant difference in consumption of food, intake of food. Alanine aminotransferase (ALT), aspartate transaminase (AST) and alkaline phosphatase (ALP) are sensitive enzymes used in assessing the severity of hepatocellular damage. Insignificant difference in serum concentration of these parameters upon prolonged administration of the hot water medicinal plant extract mixture reveals that the extract does not destroy the secretary functions of the liver. In the haematological assessment, absence of any significant effect on red blood cells
(RBC), MCV, and haemoglobin values of the plant extract treated rats suggest that the erythropoiesis, morphology, or osmotic fragility of RBC are not affected and also absence of changes in neutrophils, lymphocytes, and monocytes suggest that the safe condition of the immune system and lack of damage to the tissues. The histopathology assessment of selected body tissues of test rats on H&E stained sections are in progress.
Conclusions and Recommendations The results demonstrated that the plant extract mixture composed of leaves of Murraya koenigii (L.), cloves of Allium sativum (L), dried fruits of Garcinia queasita Pierre and dried seeds of Piper nigrum (L) was toxicologically safe in healthy Wistar rats. The results will be useful in the development of neutraceutical from the plant extract mixture for the management of diabetes in near future.
Acknowledgement Financial assistances by University Grant, University of Peradeniya (URG/2016/52/f).
References [1] P. Katulanda, P. Ranasinghe, R. Jayawardana, R. Sheriff and D. Matthews.
"Metabolic syndrome among Sri Lankan adults: prevalence, patterns and correlates," Diabetology and Metabolic Syndrome, vol. 4, no. 1, p. 24, 2012.
[2] G. Davì, F. Santilli and C. Patrono. "Nutraceuticals in Diabetes and Metabolic Syndrome," Cardiovascular Therapeutics, vol. 28, no. 4, pp. 216-226, 2010.
[3] Mukinda and P. Eagles. "Acute and sub-chronic oral toxicity profiles of the aqueous extract of Polygala fruticosa in female mice and rats," Journal of Ethnopharmacology, vol. 128, no. 1, pp. 236-240, 2010.

Proceedings of the 7th
YSF Symposium - 2018
77
SRI-LANKAN REFERENCE STANDARDS FOR SPIROMETRY IN CHILDREN AGED 8-16 YEARS
G. Liyanage*1, M. Aaqiff2, B.D.W. Jayamanne3
1Department of Paediatrics, Faculty of Medical Sciences, University of Sri
Jayewardenepura 2Colombo South Teaching Hospital
3National Dengue Control Unit, Ministry of Health
*Corresponding author (email: [email protected])
Introduction Spirometry is considered a useful and an easy to use investigation that helps in the management of children with chronic respiratory disorders. There are many spirometry standards published that suit different nationalities and ethnic groups. Third National Health and Nutrition Examination Survey III (NHANES III) in the USA and recent Global Lung Function Initiative (GLI) study of the European Respiratory Society Task Force are some of them [1,2].
Sri Lanka has not published spirometry standards for children. Few studies in Sri Lanka have published reference equations for adults [3]. Therefore, for interpretation of spirometry, we often refer South Indian values. Therefore, this study was designed to establish spirometric reference values for healthy Sri Lankan children.
Methods School children between 8-16 years participated in this study. The sample size was calculated based on variance of peak expiratory flow rate from a previous study [4]. The study sample was selected through a multistage cluster sampling technique. Sri Lanka is divided into 25 districts. We clustered the districts into five groups based on the population size in each district (Group I- < 500×10
3, Group II- 500-800×10
3, Group III-
800-1,200×103, Group IV- 1,200- 1,600×10
3 & Group V- >1,600×10
3). This enabled
adequate representation of highly populated areas when sampling was performed. One district was drawn from each stratum (each group of districts). The variables considered were degree of urbanization, geographic proximity, ethnicity and altitude. Each district has 2-4 educational zones. One educational zone was selected randomly by using lots. Taking one zone minimised the amount of travel necessary in moving from one stand to the next considering geographic proximity of schools. This enabled lessening of the cost on logistic requirements for investigators. All schools were stratified according to the type of school with regard to gender (Girls’/Boys’/Mixed schools with both boys and girls). Two schools from each group were randomly selected. The sampling rate in each school was designed to include the desired number of sample persons for each age-sex domain. All selected students were given questionnaires to take home for their parent/guardian to complete. Questionnaire consisted of three parts. Part 1 was on questions of socio-demographic and family characteristics. Part 2 contained questions based on validated ISAAC questionnaire [5] and questions on acute respiratory illnesses and other chronic disease. Part 3 contained information on exposure to household and environmental risk factors of asthma. The questionnaire was pretested before use. Consent was obtained from parent/guardian, and assent was obtained from children more than 12 years. Completed questionnaires were reviewed. Children with any
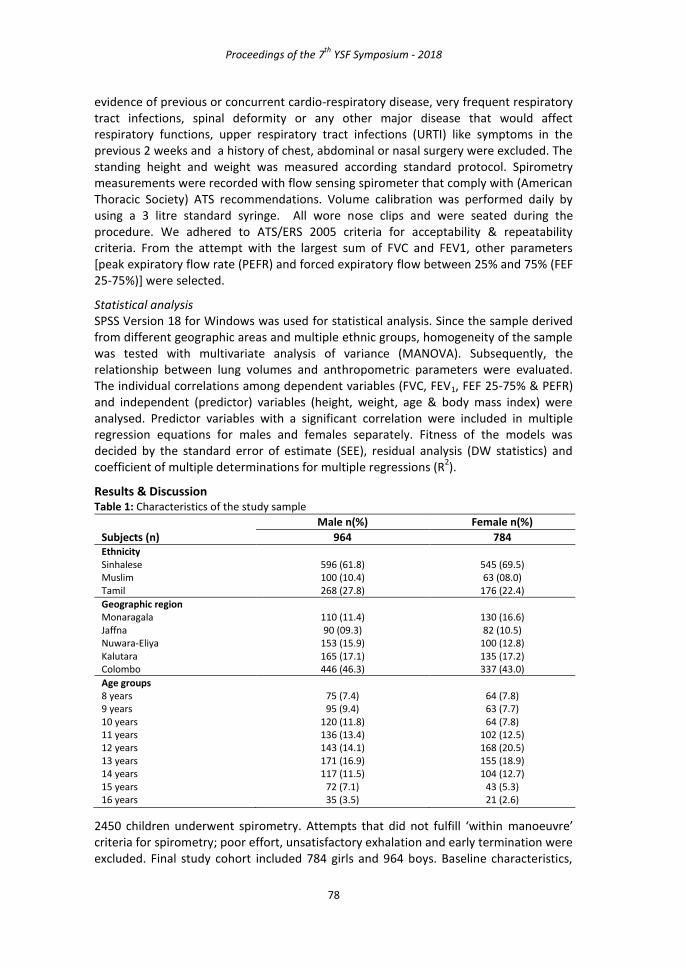
Proceedings of the 7th
YSF Symposium - 2018
78
evidence of previous or concurrent cardio-respiratory disease, very frequent respiratory tract infections, spinal deformity or any other major disease that would affect respiratory functions, upper respiratory tract infections (URTI) like symptoms in the previous 2 weeks and a history of chest, abdominal or nasal surgery were excluded. The standing height and weight was measured according standard protocol. Spirometry measurements were recorded with flow sensing spirometer that comply with (American Thoracic Society) ATS recommendations. Volume calibration was performed daily by using a 3 litre standard syringe. All wore nose clips and were seated during the procedure. We adhered to ATS/ERS 2005 criteria for acceptability & repeatability criteria. From the attempt with the largest sum of FVC and FEV1, other parameters [peak expiratory flow rate (PEFR) and forced expiratory flow between 25% and 75% (FEF 25-75%)] were selected.
Statistical analysis SPSS Version 18 for Windows was used for statistical analysis. Since the sample derived from different geographic areas and multiple ethnic groups, homogeneity of the sample was tested with multivariate analysis of variance (MANOVA). Subsequently, the relationship between lung volumes and anthropometric parameters were evaluated. The individual correlations among dependent variables (FVC, FEV1, FEF 25-75% & PEFR) and independent (predictor) variables (height, weight, age & body mass index) were analysed. Predictor variables with a significant correlation were included in multiple regression equations for males and females separately. Fitness of the models was decided by the standard error of estimate (SEE), residual analysis (DW statistics) and coefficient of multiple determinations for multiple regressions (R
2).
Results & Discussion Table 1: Characteristics of the study sample
Male n(%) Female n(%)
Subjects (n) 964 784 Ethnicity Sinhalese Muslim Tamil
596 (61.8) 100 (10.4) 268 (27.8)
545 (69.5) 63 (08.0)
176 (22.4)
Geographic region Monaragala Jaffna Nuwara-Eliya Kalutara Colombo
110 (11.4) 90 (09.3)
153 (15.9) 165 (17.1) 446 (46.3)
130 (16.6) 82 (10.5)
100 (12.8) 135 (17.2) 337 (43.0)
Age groups 8 years 9 years 10 years 11 years 12 years 13 years 14 years 15 years 16 years
75 (7.4) 95 (9.4)
120 (11.8) 136 (13.4) 143 (14.1) 171 (16.9) 117 (11.5)
72 (7.1) 35 (3.5)
64 (7.8) 63 (7.7) 64 (7.8)
102 (12.5) 168 (20.5) 155 (18.9) 104 (12.7)
43 (5.3) 21 (2.6)
2450 children underwent spirometry. Attempts that did not fulfill ‘within manoeuvre’ criteria for spirometry; poor effort, unsatisfactory exhalation and early termination were excluded. Final study cohort included 784 girls and 964 boys. Baseline characteristics,

Proceedings of the 7th
YSF Symposium - 2018
79
anthropometry and spirometry parameters of the study sample are shown in table 1 & 2.
Table 2: Descriptive statistics of anthropometry and spirometry parameters of the study sample
Homogeneity of the sample was evaluated with multivariate analysis of variance (MANOVA), thus confirming that the sample is homogeneous and the equations obtained could be generalized among ethnic groups and geographic regions. Minor differences that were noted in MANOVA may have been due to probability and unexpected dropouts that did not warrant different equations for different ethnic groups and different geographic areas (see supplementary tables).
Predictor variables considered for inclusion in the models were age, standing height and weight. In developing a model, age is anyway a required variable in interpreting spirometry. Among all anthropometric parameters standing height showed the best correlation for both males and females. Regression analysis of spirometry parameters with age and height were performed with different transformations (Table 3).
Table 3: Estimated coefficient associated with independent variables for spirometry indices for the two genders
Gender FVC FEV1 FEF 25-75% PEFR FEV1/FVC Male Constant Age Height R2 value *LLN
-3.889 0.066 0.035 78.4
0.037
-3.210 0.067 0.028 78.0
0.028
-2.619 0.099 0.023 52.0
0.027
-5.515 0.252 0.040 61.1
0.047
0.965 0.002 -0.001 01.8
-
Female Constant Age Height R2 value *LLN
-2.625 0.071 0.026 68.0
-2.227 0.062 0.023 68.3
-2.205 0.096 0.024 41.5
-2.968 0.203 0.023 43.3
0.970 0.000 0.000
0.9 -
*Lower limit of normal (LLN-5th percentile) is estimated as height coefficient - (1.64 × S.E of height coefficient)12 , H: Height in metres, A: Age in years, S.E.: Standard error
Comparison of spirometry equations We computed the mean of individual subject differences between measured values and predicted mean values from the present study, NHANES III for Caucasians, GLI 2012 for South East Asians and South Indians. Bland and Altman plots were also used to investigate the relationship of the discrepancies between the measured/observed values and predicted values derived from non Sri Lankan reference equations (Figure 1). Our predicted means for FVC, FEV1, PEFR and FEF 25-75% for both females and males are poorly matched to predictions from GLI 2012 for South East Asians and NHANES.
Parameter Males Females
Mean SD Min Max Mean SD Min Max Height in cm 147.30 14.20 115 186 146.20 11.77 102 178 Weight in kg 36.90 12.64 17 96 37.26 11.49 20 86 Body Mass Index (BMI)
16.65 3.62 10.25 46.65 17.10 3.65 10.37 38.95
FVC 2.32 0.71 1.06 4.82 2.06 0.51 0.88 3.73 FEV1 2.04 0.61 0.96 4.13 1.86 0.45 0.78 3.08 FEV1/FVC 88.18 5.29 66 100 90.42 5.83 60.40 106 FEF 25-75% 2.52 0.83 0.86 5.74 2.48 0.71 0.67 4.47 PEFR 4.35 1.42 1.35 9.48 3.82 1.09 1.19 7.30

Proceedings of the 7th
YSF Symposium - 2018
80
South Indian equations are the most commonly used for spirometry interpretation in Sri Lanka. Similarities were found in measured values of the present study and predicted means of South Indian males and females. Maximum mean difference noted was 140ml for FVC in females. Reason for fewer differences between means of Indian predictions and observed means of our study could have been due to similarities in body physics and similar geographic characteristics. Therefore, it is evident that normative values for spirometry should be population specific and interpretation of spirometry using other non Sri Lankan references could lead to errors.
To the extent that our literature survey has indicated, this is the first study to publish spirometry prediction models for Sri Lankan children. We included healthy children without chronic cardiac or respiratory diseases. Further, children with recent history of acute respiratory illnesses were excluded. The selected group of children was from a socio-demographically representative population. Age, gender, geographic area and ethnicity are some of the attributes that were considered in the selection of the sample. We chose multiple linear regression models to obtain equations.
Conclusions & Recommendations The present study provides the best available spirometry data for Sri Lankan children aged 8 to 16 years. The differences in predicted spirometry parameters derived from our study compared to values obtained from other studies emphasizes the importance of using appropriate reference values relevant to the local population, in diagnosis and follow up of patients with respiratory diseases. Predictions based on models established elsewhere may not be appropriate to assess lung conditions appropriate to local population. The reference values established in this study will be applicable for use in all ethnic groups and all geographic regions, including highlands in Sri Lanka.
Figure 1. Bland-Altman plots for predictions of FEV1 based on observed values and predictions from the new equations (a), NHANES III (b), GLI-SE Asians (c) and South Indians (d) for males.

Proceedings of the 7th
YSF Symposium - 2018
81
References [1] J.L. Hankinson, J.R. Odencrantz and K.B. Fedan. “Spirometric reference values from
a sample of the general U.S. population”. American Journal of Respiratory and Critical Care Medicine 1999; 159:179–87.
[2] M. Udupihille. “Spirometric and flow standards for healthy adult non-smoking Sri Lankans belonging to the Sinhalese ethnic group”. Ann Hum Biol. 1995;22:321-36.
[3] C.K.W. Lai, R. Beasley, J. Crane, S. Foliaki, J. Shah and S. Weiland. “Global variation in the prevalence and severity of asthma symptoms: Phase Three of the International Study of Asthma and Allergies in Childhood (ISAAC).” Thorax 2009; 64:476-83.
[4] P.H. Quanjer, S. Stanojevic, T.J. Cole, et al. Multi-ethnic reference values for spirometry for the 3–95-yr age range: the global lung function 2012 equations. European Respiratory Journal 2012; 40: 1324-43.
[5] V.K. Vijayan, A.M. Reetha, K.V. Kuppurao, P. Venkatesan and S. Thilakavathy. “Pulmonary Function in Normal South Indian Children Aged 7 to 19 Years.” Indian Journal of Chest Diseases and Allied Sciences 2000; 42:147-56.
[6] International study of asthma and allergies in childhood. Available from: http://isaac.auckland.ac.nz/resources/tools.php?menu=tools1

Proceedings of the 7th
YSF Symposium - 2018
82
ENHANCED BIODEGRADATION EFFICIENCY OF PHENOL BY Klebsiella pneumoniae, Staphylococcus warneri, Klebsiella variicola AND
Ochrobactrum intermedium
W.S.P. Madhuranga *, K. Vivehananthan and M.P. Dassanayake Department of Biotechnology, Faculty of Agriculture and Plantation Management,
Wayamba University of Sri Lanka, Sri Lanka *Corresponding Author (email: [email protected])
Introduction Environmental pollution has become an issue of serious international concern since the start of the industrial revolution. Normally, in developing countries, large volumes of untreated wastewater are discharged to the natural water resources. In Sri Lanka about 80% of used water is released as untreated wastewater to the environment [1].
Phenol is a constituent of Bisphenol A, Caprolactam, Phenylamine, Alkylphenols and a basic raw material for the production of general industrial organic compounds and paints. Phenol may cause health effects and genetic disorders on human body. Phenol is highly toxic to aquatic animals such as fish and crustaceans. The recommended maximum phenol concentration of drinking water is 0.001 mg/L in Sri Lanka [2].
Due to the above effects, it is necessary to remove phenol from industrial wastewater. Bioremediation is a cost-effective alternative over conventional wastewater treatment methods, which emphasizes the detoxification and destruction of pollutants by acclimatized microorganisms like bacteria, fungi, cyanobacteria and algae. Bacteria are commonly used in treating phenol in wastewater. Among many phenol biodegrading bacterial species, Pseudomonas putida, Rhodococcus erythropolis, Bacillus brevis, Nocardioides simplex are the common bacteria that are used to treat wastewater contaminated with phenol.
This study is focused to enhance the phenol degradation efficiency of already identified four bacteria, Klebsiella pneumoniae, Staphylococcus warneri, Klebsiella variicola and Ochrobactrum intermedium [3] by using different bacterial combinations. The objective of this study is to evaluate the phenol degradation of individual bacteria and bacterial consortia for comparing the degradation efficiency of phenol in the synthetic media. The output of this study will lead to development of highly efficient bioremediation solution to treat phenol contaminated wastewater.
Materials and Methods Preparation of Bacterial Cultures The bacteria, K.pneumoniae and S. warneri grown at maximum phenol concentration of 1600 mg/L and other two bacteria, K. variicola and O. intermedium grown at maximum phenol concentration of 1700 mg/L [3] were cultured and maintained in mineral salt media (MSM) under respective phenol concentrations.
Morphological, Biochemical and Molecular Characterization of Bacteria Bacteria were characterized by colony morphology characters (size, shape, margin, texture, opacity and pigments), Gram staining, antibiotic resistance (in 50 µg/mL of Ampicillin and Streptomycin) and Molecular identification using 16S rRNA gene sequences.

Proceedings of the 7th
YSF Symposium - 2018
83
Estimation of Phenol and Preparation of Phenol Standard curve 4-aminoantipyrine spectrophotometric method [4] was used to detect the phenol in the samples. Samples were reacted with 0.009 M 4-aminoantipyrine dye in the presence of 0.005 M Pottasium ferricyanide at pH 10. Optical density (OD) at 510 nm of the reactants was recorded. Exact phenol concentration was calculated using a developed standard curve.
Phenol Degradation by individual Bacteria and bacterial combinations Initially, bacterial inoculum of four selected bacteria were inoculated to MSM containing respective highest tolerable phenol concentration i.e. K. pneumoniae and S. warneri to 1600 mg/L phenol and K. variicola and O. intermedium to 1700 mg/L separately. Then 11 different bacterial combinations were prepared by mixing bacteria as shown in the Table 01 and inoculated to MSM containing 1600 mg/L phenol. Bacterial inoculation was done using the procedure described by Sun et al [5]. All the tests were done in triplicates with the control without any bacterial inoculation. Samples were collected at regular time intervals and tested for the residual phenol.
Table 01. Different bacterial combinations and the reference code.
Bacterial combination Code
K. pneumoniae & S. warneri II K. variicola & O. intermedium III K. pneumonia & O. intermedium IV S. warneri & K. variicola V S. warneri & O. intermedium VI K. pneumonia & K. variicola VII K. pneumonia, S. warneri & K. variicola VIII S. warneri, K. variicola & O. intermedium IX K. pneumonia, K. variicola & O. intermedium X K. pneumonia, S. warneri & O. intermedium XI K. pneumonia, S. warneri, K. variicola & O. intermedium XII
Results and Discussion Characterization of Bacteria Bacterial colony of all four bacteria varied from punctiform to moderate with circular entire margins and smooth texture. Three bacteria produced white color pigments and appeared as opaque colonies but O. intermedium produced light yellow pigment giving a translucent appearance. All three bacteria were gram negative bacillus while S. warneri was gram positive coccus. All the four bacterial isolates showed the resistance to ampicillin but only O. intermedium was grown in streptomycin containing medium. These bacterial isolates were identified to their species level using 16S rRNA sequence analysis [3].
Preparation of Phenol Standard Curve The standard curve was prepared to estimate the concentration of phenol in samples. The equation derived by the standard curve developed using this method is Y = 0.117x + 0.001 where Y is concentration of the phenol and x is OD at 510 nm. R
2 is 0.9926. This
equations can be used in estimation of phenol in any sample by using this method.
Degradation of the Phenol by Individual Bacteria All the four bacteria showed successful and complete degradation of phenol in MSM containing synthetic phenol within 144 hr of culture inoculation. However, both K.

Proceedings of the 7th
YSF Symposium - 2018
84
pneumoniae and O. intermedium recorded highest phenol degradation rate (Figure 1), by degrading phenol (K. pneumoniae phenol; 1600 mg/L and O. intermedium; 1700 mg/L) completely after 72 hr of culture inoculation with similar degradation pattern (Figure 01).
Figure 1. Phenol degradation by four selected bacteria in synthetic phenol media with control.
Figure 2. Phenol degradation by two bacterial combinations in synthetic phenol media with control. II -K. pneumoniae & S. warneri, III- K. variicola & O. intermedium , IV- K. pneumoniae & O. intermedium,V- S. warneri & K. variicola, VI- S. warneri & O. intermedium, VII- K. pneumoniae & K. variicola, I- Control
Figure 3. Phenol degradation by three bacterial combinations in synthetic phenol media with control. VIII- K. pneumoniae, S. warneri & K. variicola, IX- S. warneri, K. variicola & O. intermedium, X- K. pneumoniae, K. variicola & O. intermedium, XI- K. pneumoniae, S. warneri & O. intermedium, I- Control
Figure 4. Phenol degradation by four bacterial
combinations in synthetic phenol media with
control. XII- K. pneumoniae, S. warneri, K. variicola & O.
intermedium, I- Control

Proceedings of the 7th
YSF Symposium - 2018
85
Degradation of the Phenol by using different combinations of bacteria There was a clear increase in phenol degradation rate by using the different combinations of bacteria compared to that of individual bacteria (Figure 1). All the bacterial combinations with two bacteria, degraded phenol within 120 h of bacterial inoculation where combination VII (K. pneumoniae & K. variicola) showed the highest phenol degradation rate degrading 50% of 1600 mg/L within about 48 hours followed by the combination III (Figure 2). In the bacterial combinations with three bacteria (Figure 3) and all the four bacterial combinations (Figure 4) showed further enhancement in phenol degradation efficiency by degrading total phenol within 72 h (figure 2) and 50 h (Figure 3) respectively.
Conclusions There were clear increase in phenol degradation efficiency by different bacterial combinations compare to that of individual bacteria. The bacterial combinations with four selected bacteria degraded 1600 mg/L phenol completely within 50 hr. This outcome is significant in developing a future a bioremediation plan to treat phenol contaminated wastewater.
Acknowledgement The authors would like to express their gratitude to the University Research Grant, (SRHDC/RP/04/16-13) Wayamba University of Sri Lanka for the financial support and non-academic staff members of the Department of Biotechnology and Department of Horticulture and Landscape Gardening, Faculty of Agriculture and Plantation Management, Wayamba University of Sri Lanka for their support during the research period.
Reference [1] S. Thrikawala, L.H.P. Gunaratne, E.R.N. Gunawardane. “Impact of different tariff
structures on residential water demand: A case study from Kandy, Sri Lanka.” Tropical Agriculture Research, Vol. 20, pp. 60-72, 2008.
[2] Anon. “Drinking water standards, Sri Lanka Standards for potable water”. Internet: http://www.investsrilanka.com/images/services/pdf/drinking-water-standard.pdf ,2013 [Sep.19, 2017].
[3] M. P. Dassanayaka, K. Vivehananthan, G. H. C. M. Hettiarachchi. “Screening of potential phenol biodegrading bacteria from petroleum contaminated wastewater in Colombo Sri Lanka”, in Proc. Of 3
rd Research and Developmental Study
Symposium of the National Water Supply and Drainage Board, Sri Lanka. 2017, p.140-143.
[4] R. J. Lacoste, S. H. Venable, J. C. Stone. “Modified 4-Aminoantipyrine Colorimetric Method for Phenols.” ACS Publications, Vol. 1, pp. 1246–1249, 1959.
[5] J.Q. Sun, X. Hauang, Q.L. Chen, B. Liang, J.G. Qiu, A. Waseem, S.P. Li. “Isolation and Characterization of three Sphingobium sp. Strains capable of degrading isoproturon and cloning of the catechol 1, 2- dioxygenase gene from these strains.” Microbiological Biotechnology, Vol. 25, pp. 259-268, 2009.

Proceedings of the 7th
YSF Symposium - 2018
86
FABRICATION OF ENVIRONMENT FRIENDLY VISIBLE PHOTODETECTOR BASED ON n-Cu2O/p-CuI HETEROJUNCTION
H.T.D.S. Madusanka1,2, G.G. Chathuranga1,2, S.P.A.U.K. Samarakoon1,2, P.G.D.C.K. Karunarathna1,2, U.S. Liyanaarahchi1,2, C.A.N. Fernando*1,2
1Department of Electronics,
2Nanotechnology Research laboratory, Department of Nano Science Technology,
Faculty of Applied Sciences, Wayamba University of Sri Lanka, Kuliyapitiya *Corresponding author (email: [email protected])
Introduction Photodiodes are type of optoelectronic photodetectors which are sensitive to visible light region. These devices are used in numerous applications from day to day consumer electronics to more complicated applications such as research instruments, space cameras and optical data communication systems [1]. Most of the photodetectors in the optoelectronic field employ Nano or micro structured inorganic semiconductor compounds of rare elements such as gallium (Ga), germanium (Ge), indium (In) or toxic elements such as cadmium (Cd), sulfur (S), selenium (Se) etc [2]. Although these kind of compound exhibit high carrier mobility and high absorption coefficients, they raise health and environmental hazards when produced on an industrial scale [3]. Therefore, fabrication of photodetectors using earth abundant and nontoxic materials is highly desired. Cu2O based thin film photovoltaic devices are one of approach to this problem and it has gained an extensive attraction of scientific community due to their high efficiency, high stability and considerable lower manufacturing cost. Cuprous iodide (CuI) is also a semiconductor material which exhibit interesting features such as electro-sensitivity, photosensitivity and large band gap energy (3.1 eV) [4]. With the use of Cu2O & CuI as n type and p type semiconductor materials, a novel photodiode visible light sensor was fabricated and characterized.
Materials and Methods Fabrication of n-Cu2O/p-CuI junction on Cu substrate Commercially available 99.99% purity copper plates were used as the substrate for synthesizing n-Cu2O thin layer. The Cu plates were well cleaned until a mirror like surface can observed. The growth of n-Cu2O layer was carried out by hydrothermal method using an aqueous 0.005 M CuSO4 solution [5]. The p-CuI layer was fabricated on top of the n-Cu2O layer by drop cast method using a mix solution of acetonitrile and CuI powder. Number of solution drops were controlled to acquire maximum light sensitivity.
Assembling of sample photodiode A sandwich type cell was assembled to measure electrical parameters. Cu substrate was used as one negative electrode and the upper (positive) electrode on n-Cu2O/p-CuI layers was prepared by mounting a well cleaned FTO plate. The FTO plate was cleaned ultrasonically using distill water for 20 minutes. Thereafter using an acetone solution and using ethanol. Finally, upper electrode and Cu substrate with n-Cu2O/p-CuI layers properly fit together to obtain the sandwich type photodiode cell with an active area of 1 cm
2 x 1 cm
2.
(a)

Proceedings of the 7th
YSF Symposium - 2018
87
Characterization of samples The crystalline phases of the samples were characterized using Regaku Ultima IV x-ray diffractometer (XRD). Shimadzu 1800 UV/Visible spectrophotometer was used to analyze diffuse reflectance spectra from the prepared samples. The electrical characteristics were done using Metrohm Autolab (PGSTAT 128N) instrument and Nova 2.0 software. 20W natural white LEDs used as the visible light source. TES 1332A Digital Lux-meter was used to measure the intensity of white light. Results and Discussion UV/Visible diffuse reflectance spectra were used to analyze the optical properties of the prepared samples. Fig. 1 (a) graph indicate the pure p-CuI absorption curve including a sharp absorption edge at about 414 nm which is consistent with the wide-band gap of CuI (band gap = 3.00 eV). Figure 1 (b) shows n-Cu2O on Cu substrate which has an absorption within the region of 400 – 700 nm. After the formation of n-Cu2O/p-CuI heterojunction on the Cu substrate the overall visible light sensitive was improves as shown in Fig. 1 (c) curve.
Figure 1. UV/Visible diffuse reflectance spectra for (a) p-CuI on Cu Substrate (b) n-Cu2O on Cu Substrate and (c) n-Cu2O and p-CuI on Cu Substrate
The fabricated n-Cu2O and n-Cu2O/p-CuI layers were individually characterized by X-Ray dffraction (XRD) to confirm their structural propeties and lattice formation as shown in Fig. 2. The XRD pattern of Cu/n-Cu2O shows the corresponding lattice planes as (110), (111), (200), (220), (311) for n-Cu2O layer. The Cu/n-Cu2O/p-CuI XRD pattern confirm the formation of p-CuI layer on the n-Cu2O layer by showing the same lattice planes of n-Cu2O within the p-CuI lattice planes.

Proceedings of the 7th
YSF Symposium - 2018
88
Figure 2. X-ray diffraction pattern of Cu/Cu2O layer and Cu/n-Cu2O/p-CuI layer
Figure 3 shows the typical semilog I-V characteristic curve for n-Cu2O/p-CuI heterojunction Photodiode light sensor under the illumination of 555 nm (4.5 mWcm
-2)
white LED. Comparing the dark condition, the illuminated condition has shown increased current levels in both forward and reverse biases. It confirms that the fabricated p-n heterojunction device can act as a photodiode.
Figure 3. Semilog I-V curve of the n-Cu2O/p-CuI photodiode

Proceedings of the 7th
YSF Symposium - 2018
89
Also it can be seen from the Fig. 3 that the n-Cu2O/p-CuI photodiode shows maximum sensitivity (Iphoto/Idark) of 3500 near zero bias, suporting its self-powered mode of operation. This is further verified by measuring the photocurrent of n-Cu2O/p-CuI photodiode at zero applied bias under a pulsating white light source at an interval of 10s. A fast reponce at the rise and fall edges (~5 ms) of the currents and good repeatability were clearly observed in the both white light on and off cases.
Conclusions and Recommendations In summary, this work presented an approach for fabrication of a self-powered, environmentally friendly and earth-abundant photodiode by using easy fabrication methods such as hydrothermal and dropcast. The photocurrent results show that the self-powered photodiode has high sensitivity (3500) to visible light. Moreover a rapid photoresponce with (~5 ms) rise time and fall time is observed. We believe that our demonstration of n-Cu2O/p-CuI hetrojunction photodiode is an important step towards environment friendly visible photodetector designs.
References [1] T. Zhai et al., “A comprehensive review of one-dimensional metal-oxide
nanostructure photodetectors,” Sensors, vol. 9, no. 8, pp. 6504–6529, Aug. 2009. [2] O. Game, U. Singh, T. Kumari, A. Banpurkar, and S. Ogale, “ZnO (N)–Spiro-MeOTAD
hybrid photodiode: an efficient self-powered fast-response UV (visible) photosensor”, Nanoscale, 6(1), pp. 503–513, 2014.
[3] M. K. Ladwig, “Potential Health and Environmental Impacts Associated With the Manufacture and Use of Photovoltaic Cells Potential Health and Environmental Impacts Associated with the Manufacture and Use of Photovoltaic Cells DISCLAIMER OF WARRANTIES AND LIMITATION OF LIABILITIES”, Available at: http://www.energy.ca.gov/reports/500-04-053.PDF (Accessed: 22 September 2017).
[4] M. N. Amalina, Y. Azilawati, N. A. Rasheid, and M. Rusop, “The properties of copper (I) iodide (Cul) thin films prepared by mister atomizer at different doping concentration,” Procedia Eng., vol. 56, pp. 731–736, 2013.
[5] C. A. N. Fernando, P. H. C. De Silva, S. K. Wethasinha, I. M. Dharmadasa, T. Delsol, and M. C. Simmonds, “Investigation of n-type Cu2O layers prepared by a low cost chemical method for use in photo-voltaic thin film solar cells”, Renewable Energy, 26(4), pp. 521–529, 2002.
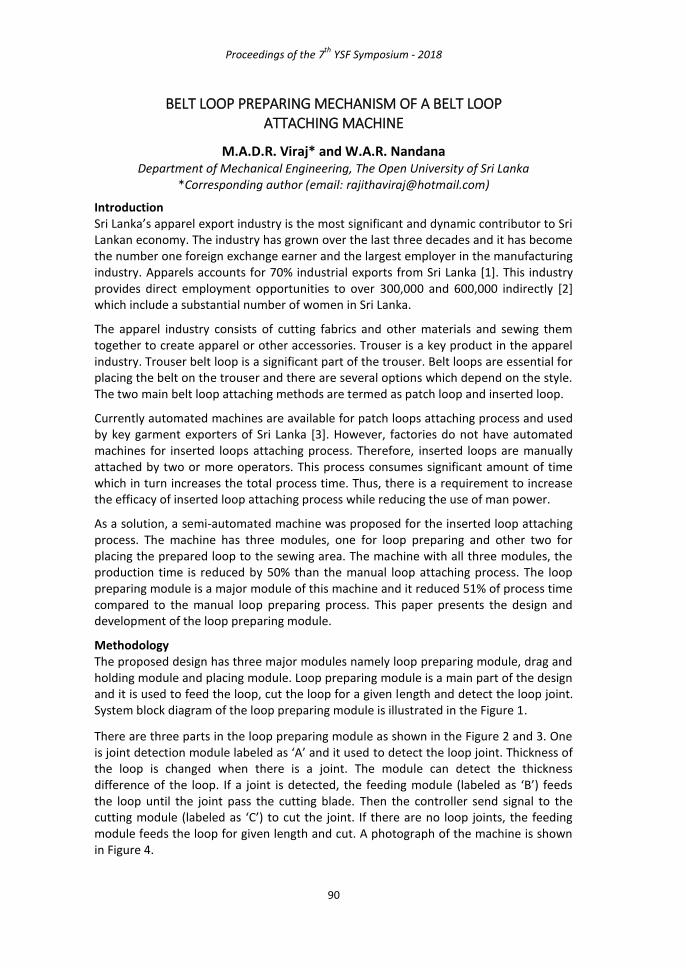
Proceedings of the 7th
YSF Symposium - 2018
90
BELT LOOP PREPARING MECHANISM OF A BELT LOOP ATTACHING MACHINE
M.A.D.R. Viraj* and W.A.R. Nandana
Department of Mechanical Engineering, The Open University of Sri Lanka *Corresponding author (email: [email protected])
Introduction Sri Lanka’s apparel export industry is the most significant and dynamic contributor to Sri Lankan economy. The industry has grown over the last three decades and it has become the number one foreign exchange earner and the largest employer in the manufacturing industry. Apparels accounts for 70% industrial exports from Sri Lanka [1]. This industry provides direct employment opportunities to over 300,000 and 600,000 indirectly [2] which include a substantial number of women in Sri Lanka.
The apparel industry consists of cutting fabrics and other materials and sewing them together to create apparel or other accessories. Trouser is a key product in the apparel industry. Trouser belt loop is a significant part of the trouser. Belt loops are essential for placing the belt on the trouser and there are several options which depend on the style. The two main belt loop attaching methods are termed as patch loop and inserted loop.
Currently automated machines are available for patch loops attaching process and used by key garment exporters of Sri Lanka [3]. However, factories do not have automated machines for inserted loops attaching process. Therefore, inserted loops are manually attached by two or more operators. This process consumes significant amount of time which in turn increases the total process time. Thus, there is a requirement to increase the efficacy of inserted loop attaching process while reducing the use of man power.
As a solution, a semi-automated machine was proposed for the inserted loop attaching process. The machine has three modules, one for loop preparing and other two for placing the prepared loop to the sewing area. The machine with all three modules, the production time is reduced by 50% than the manual loop attaching process. The loop preparing module is a major module of this machine and it reduced 51% of process time compared to the manual loop preparing process. This paper presents the design and development of the loop preparing module.
Methodology The proposed design has three major modules namely loop preparing module, drag and holding module and placing module. Loop preparing module is a main part of the design and it is used to feed the loop, cut the loop for a given length and detect the loop joint. System block diagram of the loop preparing module is illustrated in the Figure 1.
There are three parts in the loop preparing module as shown in the Figure 2 and 3. One is joint detection module labeled as ‘A’ and it used to detect the loop joint. Thickness of the loop is changed when there is a joint. The module can detect the thickness difference of the loop. If a joint is detected, the feeding module (labeled as ‘B’) feeds the loop until the joint pass the cutting blade. Then the controller send signal to the cutting module (labeled as ‘C’) to cut the joint. If there are no loop joints, the feeding module feeds the loop for given length and cut. A photograph of the machine is shown in Figure 4.

Proceedings of the 7th
YSF Symposium - 2018
91
According to the calculations total friction force acting on the loop is 3.06N. The required operating pulse speed of the stepper motor (feeding) was determined as 116Hz and the required torque is 0.038Nm.
Figure 1. The system block diagram
Figure 2. Isometric view of the belt Figure 3. Exploded view of the belt loop preparing mechanism loop preparing mechanism
Figure 4. The belt loop attaching machine with the developed belt loop preparing mechanism
A motor was selected according to those design requirements. The required force from pneumatic cylinder to the cutting mechanism was obtained as 110.5N and a compact cylinder with 20mm bore and 25mm stroke was selected. It is able to produce 188N force if compressed air pressure equal to 6x10
5 Nm
-2. Loop joints are detected by
identifying the variation of loop thickness. An analog inductive proximity sensor is used as the thickness measuring sensor of the loop detecting mechanism. An optical
Controller (PLC) Loop / loop joint
detecting transducer
Cutter position detecting transducer
Motor drive
Cutting mechanism (pneumatic)
Foot paddles (operator inputs from
sewing machine)
Feeding actuator (stepper motor)
Feeder arm actuator (pneumatic double
acting cylinder )
pneumatic solenoid valve
pneumatic solenoid valve

Proceedings of the 7th
YSF Symposium - 2018
92
proximity sensor is used to detect the cutter position. XC3-32RT-E PLC was selected as
the controller by considering the requirement such as required response time (77s) inputs and outputs [4].
Results and Discussion After the design and development of the machine, test results were obtained from the machine by performing the operation in a factory environment. The work study considered the time taken for sewing five loops (for one trouser) and the output loop length versus the given length.
Time study The time taken for the process was obtained by carrying out a work study. Three work-studies were carried out to obtain the time taken by the machine for sewing five loops and it is defined as a cycle time for a trouser [5]. First the machine was operated by an unskilled operator in a workshop environment. Cycle time is defined as Tcyl1 for five loops. Sample size (n) was selected as 100. Finally, the average time for a cycle, Tcyl1= 26 sec was calculated by using the equation 1.
(1)
Second work study has done in an actual production environment in a garment factory. Two machine operators, skilled and unskilled were selected. The cycle times taken by the unskilled and skilled operator are defined as Tcyl2 and Tcyl3 respectively. Tcyl2 is 33 sec and Tcyl3= 31 sec according to the equation 1.
Figure 5. Cycle time of belt loop attaching process
Figure 5 illustrates the amount of time taken by existing manual method and the developed machine. Manual method takes 70.8 seconds for attaching all loops for a trouser. When considering the cycle time of the existing inserted loop attaching method and the suggested method (fabricated machine), the time is reduced around 50%. Therefore, one machine can be utilized for two production lines as show in figure 7.
The layout which is shown in Figure 6 has two production lines L1 and L2. The process B represents cut and marking operation of a loop and the process C is attaching a loop. The process A represent the process which happened before the process B and the process D represents the process after the process C. The proposed machine is capable of reducing three human resources from each two production lines according to the layout shown in Figure 7.
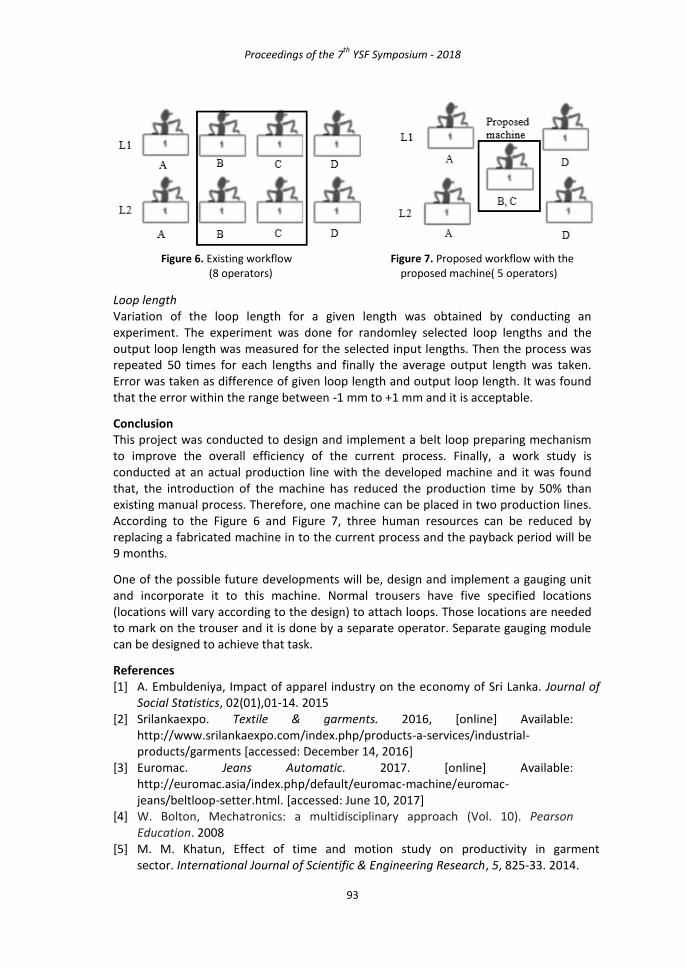
Proceedings of the 7th
YSF Symposium - 2018
93
Figure 6. Existing workflow Figure 7. Proposed workflow with the
(8 operators) proposed machine( 5 operators)
Loop length Variation of the loop length for a given length was obtained by conducting an experiment. The experiment was done for randomley selected loop lengths and the output loop length was measured for the selected input lengths. Then the process was repeated 50 times for each lengths and finally the average output length was taken. Error was taken as difference of given loop length and output loop length. It was found that the error within the range between -1 mm to +1 mm and it is acceptable.
Conclusion This project was conducted to design and implement a belt loop preparing mechanism to improve the overall efficiency of the current process. Finally, a work study is conducted at an actual production line with the developed machine and it was found that, the introduction of the machine has reduced the production time by 50% than existing manual process. Therefore, one machine can be placed in two production lines. According to the Figure 6 and Figure 7, three human resources can be reduced by replacing a fabricated machine in to the current process and the payback period will be 9 months.
One of the possible future developments will be, design and implement a gauging unit and incorporate it to this machine. Normal trousers have five specified locations (locations will vary according to the design) to attach loops. Those locations are needed to mark on the trouser and it is done by a separate operator. Separate gauging module can be designed to achieve that task.
References [1] A. Embuldeniya, Impact of apparel industry on the economy of Sri Lanka. Journal of
Social Statistics, 02(01),01-14. 2015 [2] Srilankaexpo. Textile & garments. 2016, [online] Available:
http://www.srilankaexpo.com/index.php/products-a-services/industrial-products/garments [accessed: December 14, 2016]
[3] Euromac. Jeans Automatic. 2017. [online] Available: http://euromac.asia/index.php/default/euromac-machine/euromac-jeans/beltloop-setter.html. [accessed: June 10, 2017]
[4] W. Bolton, Mechatronics: a multidisciplinary approach (Vol. 10). Pearson Education. 2008
[5] M. M. Khatun, Effect of time and motion study on productivity in garment sector. International Journal of Scientific & Engineering Research, 5, 825-33. 2014.

Proceedings of the 7th
YSF Symposium - 2018
94
A COMPARATIVE STUDY ON AVAILABLE MATRICES FOR QUALITY ASSESSMENT OF A DE-NOVO TRANSCRIPTOME ASSEMBLY
D.N.U. Naranpanawa1, A.U. Bandaranayake2 and P.C.G. Bandaranayake*1
1Agricultural Biotechnology Center, Faculty of Agriculture, University of Peradeniya
2Department of Computer Engineering, Faculty of Engineering, University of Peradeniya
*Corresponding author (email: [email protected])
Introduction Advances in Next-generation sequencing (NGS) technologies have offered the opportunity for in-depth studies about various species. Among these technologies, transcriptome sequencing and assembly serves as a great source in studying non-model organisms. While methods are optimized for already sequenced model organisms, no optimized pipeline for De novo transcriptome assembly. However, any downstream analyses performed, including functional annotations and differential gene expressions depend on the quality of transcriptome assembly. Over the years, a multitude of quality metrics have been established to assess the quality of a transcriptome assembly. The current study focused on assessing the assembly quality of several widely used matrices, such as the GC content of an assembly, contig statistics and unigene statistics. But, given that only a few of them accurately reflect the assembly quality, this study focuses on testing the most reliable metrics for evaluation. Transcriptome sequencing data of tropical sandalwood, Santalum album [1] was used for the analysis.
Materials and Methods Sequence data S. album data generated by Illumina sequencing, deposited in NCBI under the accession number PRJNA297453, was accessed through NCBI sequence database using the NCBI SRA toolkit. The samples represented RNA-seq data of three development stages characteristic of oil-producing sandalwood trees; Sapwood (SW), Transition Zone (TZ) and Heartwood (HW), generated through the Illumina platform.
Quality control of raw reads Before starting the assembly or further analysis, the raw reads were examined for certain quality metrics. FastQC is one such program that is widely accepted to evaluate the quality of the reads as well as the GC content of the sequences and the presence of overrepresented sequences. These metrics indicate if the raw reads need to be trimmed for adapter sequences before assembling. Especially, the reports of ‘Per base sequence quality’ and ‘Overrepresented Sequences’ generated by FastQC assessment are important metrics for the quality control.
Since FastQC indicated that the sequence reads were of low quality, further steps were taken to increase the quality so that consequent assembly quality is not decreased as well. Trimmomatic was used for this purpose, by optimizing the program to filter the reads until a certain quality threshold is reached. In addition, Trimmomatic was also utilized to remove adapter sequences that contribute to reads of lower quality. A succinct description of the methodology is presented in Figure 01.

Proceedings of the 7th
YSF Symposium - 2018
95
De Novo assembly For De novo assembly of non-model organisms, several platforms and assembly tools exist. But among these, Trinity assembler is one of the most evaluated and assessed tools for De novo assembly [2]. Trinity is also bundled with the Trimmomatic tool, which can be used for the quality control of the raw reads before assembly. It is also useful that Trinity is a free and open-source platform which allows the user to optimize the performance or the process of assembly as per need.
To run the assembly process of the raw reads, necessary files in fastq format were concatenated first since there are multiple RNA-seq files from different libraries. Then, De novo assembly commands were executed on these data files using a shell script in Trinity. In these commands, various assembly parameters were optimized which included parameters for trimming using Trimmomatic as well. The assembly was performed on a server with 32 cores and 128 GB random access memory. When the process finishes, all the raw reads are assembled by Trinity into small nucleotide sequences called ‘contigs’. Since these initial contigs are not useful for analysis, they are further required to be clustered into larger sequences. Scripts provided with Trinity were used to avoid redundant transcripts and cluster the contigs into ‘unigenes’.
Assembly quality assessment and validation Once the assembly is complete, it should be assessed to determine the quality before proceeding with further analyses. Trinity itself provides a Perl script to retrieve basic statistics about the assembly. This was used to gain a basic understanding about the assembly including the number of contigs assembled, GC content, and N50 statistics of contigs and unigenes. While there are many quantitative as well as qualitative methods to further evaluate the assembly, this study focuses on some of the most widely used methods; Bowtie, BUSCO assessment and TransRate.
Bowtie Bowtie program allows the alignment of the sequence reads back to the transcriptome assembly obtained with Trinity. This process provided statistics as to how many cleaned reads actually represent the assembly. If at least 70% of sequence reads were mapped back to the assembly, the quality is considered high.
BUSCO BUSCO assessment tool was used to perform this evaluation by searching the assembly in the reference database ‘eukaryota_odb9’. Reference databases were downloaded from the BUSCO web site and a database closest to the species of interest was chosen for a better evaluation. The presented statistics from the validation included the percentage of complete orthologs found (single copy and duplicates), fragmented and missing orthologs as well. The higher the percentage of single copy orthologs reported, the better the quality of the transcriptome assembly is supposed to be.
TransRate TransRate program was used to obtain a number of quality metrics in order to further validate the transcriptome assembly. Among the measures, the percentage of good mappings and assembly score was used to evaluate the assembly, which provide an assessment as to how complete the assembly was. The assembly score ranges from 0 to 10 according to the specifications of TransRate, and a higher assembly score would indicate a higher quality transcriptome assembly.

Proceedings of the 7th
YSF Symposium - 2018
96
Figure 1. A summarized computational pipeline for De Novo transcriptome assembly, and quality assessment and assembly validation
Results and Discussion The RNA-seq dataset that was downloaded from NCBI had a volume of 58 GB and 124 Gbps in total. When these raw reads were assessed with FastQC, the generated reports indicated that all fastq files contained low quality reads. After trimming the adapter sequences and low quality reads using Trimmomatic, a total of 628,438,851 bases were assembled into 771,200 contigs using Trinity De Novo assembler. These contigs were further clustered into 604,666 unigenes with a mean length of 561bp and N50 value of 659 (Table 1). The contig N50 statistic indicates that at least half of the assembled contigs are of that contig length. But given that this statistic could be biased due to lowly expressed isoforms [3], it does not guarantee a solid metric for the quality of the assembly.
Table 1. Summary statistics of sequence data and De novo assembly
Description Statistics
Sequence reads Raw reads 124 Gbps
Cleaned reads 35 Gbps
Assembly GC content (%) 39.13
Contigs 771200 Number of bases 628438851 Mean length (bp) 814.88 N50 1405 Unigenes 604666 Number of bases 339069641 Mean length (bp) 560.76 N50 659
Quality Assessment
De Novo Assembly
Quality Control
Data accession Raw
sequence reads
FastQC
Trimmomatic
Obtain contigs
Obtain unigenes
Bowtie BUSCO TransRate

Proceedings of the 7th
YSF Symposium - 2018
97
Using Bowtie, the read representation in the assembly was calculated (Table 2). Analysis showed that the percentage of proper pairs were higher than the expected threshold of 70% alignment for a quality assembly. Table 2. Summary of statistics of Bowtie validation
Read Type Count % Proper pairs 145103817 83.45 Improper pairs 17730957 10.2 Right only 5553993 3.19 Left only 5495262 3.16
Total aligned rnaseq fragments 173884029
The BUSCO assessment performed for determining the number of complete orthologs demonstrated that more than 90% of the assembly were complete orthologs and less than 7% were fragmented, indicating that the assembly quality is high in return (Table 3).
In contrast, evaluation of the assembly using TransRate indicated that the assembly score is considerably low as well as the percentage of good mappings of reads, which suggests that the assembly is of low quality (Table 4). This shows the differences of results generated through different platforms developed for such analysis. Of the three methods used, both Bowtie and BUSCO assessments validated the assembly as high quality. It is believed that the TransRate assembly could be biased against a large number of lowly expressed transcripts [3]. This analysis shows the necessity of optimization of analysis pipeline is for De Novo assembly of RNA-seq data. Table 3. Summary of statistics of BUSCO validation
BUSCO type Count %
Complete 278 91.7
Complete and single-copy 78 25.7
Complete and duplicated 200 66
Fragmented 21 6.9
Missing 4 1.4
Total BUSCO groups searched 303
Table 4. Summary of statistics of TransRate validation
Read mapping metrics Value Fragments 181844966 Fragments mapped 31616682 Fragments mapped % 0.17 Good mappings 28474573 Good mappings % 0.16 Transrate assembly score 0.0105 Transrate optimal score 0.0618 Good contigs 318291 Good contigs % 0.41

Proceedings of the 7th
YSF Symposium - 2018
98
Conclusions and Recommendations In this study, various metrics by different tools and programs were used to assess the quality of the sandalwood transcriptome assembly. While NAME THEM validated the assembly to be of good quality, TransRate indicated otherwise. For further evaluations, unigenes obtained from the Trinity assembly can be mapped to reference transcript databases such as SwissProt, which would present statistics on length coverage.
References [1] J. M. Celedon et al., “Heartwood-specific transcriptome and metabolite signatures
of tropical sandalwood (Santalum album) reveal the final step of (Z)-santalol fragrance biosynthesis,” Plant J., vol. 86, no. 4, pp. 289–299, 2016.
[2] L. A. Honaas et al., “Selecting Superior De Novo Transcriptome Assemblies: Lessons Learned by Leveraging the Best Plant Genome,” PLoS One, vol. 11, no. 1, p. e0146062, Jan. 2016.
[3] M. Dapas, M. Kandpal, Y. Bi, and R. V. Davuluri, “Comparative evaluation of isoform-level gene expression estimation algorithms for RNA-seq and exon-array platforms,” Brief. Bioinform., vol. 18, no. 2, pp. 260–269, 2017.

Proceedings of the 7th
YSF Symposium - 2018
99
THE EFFECT OF Tragia involucrata Linn. ON HIGH FAT DIET INDUCED HYPERLIPIDEMIC RATS
M.S. Pallie*1, P.K. Perera1, C.L. Goonasekera2, K.M.N. Kumarasinghe2 and L.D.A.M. Arawwawala3
1Institute of Indigenous Medicine, University of Colombo, Sri Lanka
2 General Sir John Kotelawela Defense University, Rathmalana, Sri Lanka
3 Research & Development Complex, Industrial Technological Institute, Malambe
*corresponding author (email: [email protected])
Introduction The use of herbs as a source of medicine is as old as mankind and can be traced back to fifth millennia in the form of written documents of the early civilization in China, India and Near East. According to World Health Organization (WHO), about 65-80% of the world’s population living in developing countries depends essentially on plants as their primary health care [1].
Tragia involucrata L. (TI) which is commonly known as Wel kahambiliya (Sinhala) and Indian stinging nettle (English) is a widely used medicinal plant especially by Sri Lankan traditional medical practitioners. Experimentally, the plant shows a wide range of biological activities such as, anti-diabetic, anti-cancer, hypolipidaemic, diuretic, antioxidant, anti-inflammatory, analgesic, wound healing, anti-bacterial etc. Hyperlipidaemia is defined as elevations of fasting total cholesterol concentration which may or may not be associated with raised triglyceride concentration [2]. Lipoproteins which transport lipids in the plasma can also become elevated in hyperlipidaemia [2].
TI has been traditionally used for the treatment of hyperlipidaemia. Flavonoids are known to possess hyperlipidaemic activity and a number of antioxidant flavonoids [3] have been characterized in TI suggesting its hypolipidaemic action. Hence, in the present study an attempt was made to screen the hypolipidaemic activity of the hot water extraction of TI whole plant at the therapeutic dose of 550 mg/dl in butter induced hyperlipidaemic male Wistar rats.
Materials and Methods Plant material Whole plants of T. involucrata were collected from the Western province (from Athurugiriya) of Sri Lanka at flowering stage during the period of January - March 2017. The plant was authenticated by the Curator of National Herbarium, Department of National Botanic Gardens, Peradeniya, Sri Lanka. A voucher specimen was deposited at the National Herbarium of Department of National Botanic Gardens, Peradeniya (voucher specimen No. 1 - Rajagiriya) and at the herbarium at the Institute of Indigenous Medicine, University of Colombo, Rajagiriya, for future reference. The Bulk plant material was cleaned, washed, shade dried and ground into powder and stored in air tight polythene containers with proper labeling.
Animals Healthy adult male Wistar rats (weight: 180 - 220 g; age: 8 weeks old) were purchased from Medical Research Institute, Borella, Sri Lanka for the experimentation. They were housed under standardized (temperature: 24 - 26 °C, photoperiod: approximately 12 hours natural light per day, relative humidity: 50 - 55%) animal house conditions and fed

Proceedings of the 7th
YSF Symposium - 2018
100
with standard rat feed prepared according to WHO. standards and water ad libitum. Ethical clearance for the animal study was obtained from the Ethical Review Committee of Faculty of Medicine, General Sir John Kotelawala Defence University, Ratmalana, Sri Lanka. (Project No - RP/2013/12)
Preparation of hot water extract (HWE) Plant material (60 g) was boiled in 1.92 L of distilled water (DW) and the final volume was reduced to 240 mL by gentle boiling for over 4 hrs. The hot water extract was freeze dried and stored at 4°C until further use. This process was repeated until the necessary amount of freeze dried extract was obtained.
Hyperlipidemic inducer A 60% high fat diet was given to cause hyperlipidaemia. Butter was used as the fat source [4]. A volume of 5 ml/200 g body weight (b.w). was given to the rats apart from their usual diet. The diet was given for 21 days continuously prior to giving the test drug, reference drug or the negative control.
Experimental Design Group I did not receive the high fat diet (Negative control). Group II, III, and IV received a high fat diet for 21 days prior to giving the test drug, reference drug or the negative control. On the 22
nd day the relevant extracts were given to the relevant group.
Group I – negative control received 2 ml distilled water orally
Group II (HFD induced negative control) – received 2 ml of distilled water orally
Group III (HFD induced test drug group) – received the test drug in 2 ml distilled water orally (550 mg/kg TI hot water extract)
Group IV (HFD induced reference drug group) – received the reference drug Atovastatin 0.83 mg/kg* rat b.w. in 2 ml distilled water orally (*human dose converted to rat dose [5])
Sample Collection At day 0 after the HFD was given, blood was collected from 12 hour fasted animals from the tail to evaluate the lipid profiles of the four groups. At the end of 14
th and 28
th days,
blood was collected again from tail vein after overnight fasting for the study of the lipid profile (Total cholesterol - TC, triglycerides - TG, Low Density Lipoproteins - LDL, Very Low Density Lipoproteins - VLDL and High Density Lipoproteins - HDL cholesterol)
Statistical Analysis Results were presented as mean ± SEM (Standard Error Mean). The significance of difference among the groups was assessed using SPSS 22 software. P<0.05 was considered significant.
Results and Discussion Results showed that on day 14 there was a significant decrease (p<0.05) in TC, VLDL, and TG in the HFD fed test drug group and significant decrease (p<0.05) in TC, LDL, VLDL, and TG in the HFD fed reference drug group compared with the HFD fed negative control group and day 0 (Table 1). On the 14
th day of treatment, TC level of the rats fed with
HFD test drug had reduced by 18.2%, VLDL level had reduced by 55.6%, and TG level had reduced by 49.2% compared to the HFD fed negative control rats. In HFD fed reference drug given rats TC level had reduced by 31.3%, VLDL level had reduced by 49.2%, and TG

Proceedings of the 7th
YSF Symposium - 2018
101
level had reduced by 46.7% on the 14th
day compared to the HFD fed negative control group.
Table 1. Effects on the lipids profile of hyperlipidemic male Wistar rats treated with the reference drug, test drug, and distilled water on 0 days, 14 days, and 28 days
Data are expressed as mean ± SEM. n=6 *P < 0.05. TC – Total Cholesterol, HDL – High Density Lipoproteins, LDL – Low Density Lipoproteins, VLDL – Very Low Density Lipoproteins, TG –Triglicerides Results on day 28 exhibited a significant decrease (p<0.05) in TC, VLDL, and TG in the HFD fed test drug group and significant decrease (p<0.05) in TC, VLDL, and TG in the HFD fed reference drug group compared with the HFD fed negative control group and day 0 (Table 2). On the 28
th day, TC level had reduced by 16.2%, VLDL level had reduced by
54.4%, and TG level had reduced by 45.1% on HFD fed test drug given rats compared to the HFD fed negative control group. On the 28
th day of HFD reference drug given rats TC
level had reduced by 23.4%, VLDL level had reduced by 51.1%, and TG level had reduced by 40.5% compared to the HFD fed negative control.
The study shows that the TI hot water extract exhibits hypolipidemic activity by significantly reducing (p<0.05) TC, VLDL, and TG levels. It is also evident that TI extract has markedly reduced VLDL and TG level compared to the reduction of TC levels. As any other type of fat, TGs are transported in the bloodstream by lipoproteins such as chylomicron and VLDL. These two lipoprotein remnants help to build plaques in the arteries which is known as atherosclerosis and therefore considered as atherogenic. Hence, high levels of TG may increase the risk of cardiovascular diseases and low levels of TG may be protective.
Earlier studies have shown that plant based flavonoids demonstrates hypolipidaemic activity. A previous study performed on different fractions of Tragia involucrata L. has identified a number of 08 antioxidant flavonoids using Liquid chromatography and mass spectroscopy characterization. Hence, it can be suggested that these flavonoids may be responsible for the hypolipidaemic action of the hot water extraction of the plant. Therefore, TI can be made into a value added product after carrying out clinical trials on hyperlipidaemic patients.
Groups Non-HFD Negative control (Group I)
HFD negative control (Group II)
HFD test drug group (Group III)
HFD reference drug (Group IV)
0 days
14 days
28 days
0 days
14 days
28 days
0 days
14 days
28 days
TC (mg/dL)
73.5 + 5.1 98.4 + 2.1
107.0 + 5.4
98.4 + 2.1
105.1 + 4.8
87.5 + 2.8*
82.5 + 1.8*
88.4 + 3.1
73.5 + 1.9*
75.4 + 1.6*
HDL (mg/dL)
26.8 + 2.8 38.1 + 1.8
34.4 + 1.6
35.2 + 1.2
38.5 + 1.1
37.1 + 0.4
35.9 + 0.6
38.0 + 0.9
36.3 + 0.4
36.3 + 0.4
LDL (mg/dL)
31.9 + 3.5 34.8 + 2.5
35.5 + 2.6
33.9 + 1.8
38.5 + 4.9
36.4 + 2.8
36.4 + 2.8
32.5 + 1.8
22.2 + 1.9*
32.7 + 2.2
VLDL (mg/dL)
17.7 + 2.8 30.4 + 2.5
31.5 + 2.1
30.7 + 2.2
28 + 1.6
14.0 + 0.7*
14.0 + 0.7*
26.3 + 1.0
16.0 + 0.5*
15.0 + 0.7*
TG (mg/dL)
78.1 + 12.8 134.7 + 3.1
138.5 + 5.2
134.9 + 4.0
140.2 + 8.0
70.3 + 3.7*
74.1 + 5.9*
129.5 + 2.1
73.8 + 3.6*
80.2 + 2.6*

Proceedings of the 7th
YSF Symposium - 2018
102
Conclusions and Recommendations Tragia involucrata L. hot water extraction at the therapeutic dose of 550 mg/kg body weight significantly reduced (p<0.05) TC, VLDL, and TG levels in butter induced hyperlipidemic male Wistar rats. Further studies should be carried out to test the mechanism of action of the TI hot water extract to evaluate the mode of action. TI is a potential candidate for treating hyperlipidaemic subjects.
References [1] Anonymous. WHO Traditional Medicine strategy 2002 – 2005. Geneva: World
Health Organization, 2002. [2] R.H. Nelson. “Hyperlipidemia as a Risk Factor for Cardiovascular Disease”. Prim
Care, 40(1), pp. 195–211, March 2013. [3] C.T. Sulaiman, I. Balachandran. “LC/MS characterization of antioxidant flavonoids
from Tragia involucrata L.”. Beni-suef university journal of basic and applied sciences, pp. 1-5, 2016.
[4] A. Sowmya, T. Ananthi. “Hypolipidemic activity of Mimosa pudica Linn on Butter Induced Hyperlipidemia in Rats”. Asian Journal of research in Pharmaceutical sciences, vol. 1: 4, pp. 124-127, 2011.
[5] G.E. Paget, J.M. Barnes In: Lawrence DR, Bacharach, AL. (Eds.). “Evaluation of Drug Activities,” in Pharmacometrics. New York: Academic Press, 1996.

Proceedings of the 7th
YSF Symposium - 2018
103
YET ANOTHER CANTOR-LIKE SET
A.A.S. Perera* and B.G.M.S. Sriyananda Department of Mathematics, Faculty of Science, University of Peradeniya, Peradeniya
*Corresponding author (email: aasp.pdn.ac.lk)
Introduction The Cantor ternary set 𝐶 is the most commonly cited example of a perfect nowhere dense set with zero Lebesgue measure. There are veriety of other examples obtained by procedures similar to that of construction of the Cantor ternary set, known as Cantor-like sets. Some Cantor like sets have positive Lebesgue measure and these “fat Cantor-like sets” provide examples of perfect nowhere dense sets with positive Lebesgue measure. In the construction of the Cantor ternary set and in all its known generalizations producing Cantor-like sets, the intervals removed are symmetric about the points chosen from the original interval. In this study, we construct a Cantor-like set by removing intervals which are not symmetrical about the points chosen from the original interval. Our construction produces a “Cantor-like dust” in a “faster manner” compared to almost all the other generalizations producing thin Cantor-like sets, where the word “thin” means “having zero Lebesgue measure”.
Materials and Methods For this construction, let 𝛽 > 0 and as for the Cantor ternary set, we first trisect the closed unit interval[0,1]. We then remove two open intervals each of length 3𝛽
containing the trisection points 1
3 and
2
3 asymmetrically about these points. The intervals
removed at this first step are (1
3− 2𝛽,
1
3+ 𝛽) and (
2
3− 𝛽,
2
3+ 2𝛽) as illustrated in the
Figure 1.
Figure 1. Initial steps for the construction of the set 𝐶𝛽
Let 𝐽𝛽(1)
be the union of the remaining intervals. Then
𝐽𝛽(1)
= [0,1
3− 2𝛽] ∪ [
1
3+ 𝛽,
2
3− 𝛽] ∪ [
2
3+ 2𝛽, 1].
At the second step, each of these closed intervals are trisected and two open intervals
each of length 3𝛽2 are removed in a manner similar to the first step. Let 𝐽𝛽(2)
be the
union of the remaining intervals. Then
𝐽𝛽(2)
= [0,1
3(
1
3− 2𝛽) − 2𝛽2] ∪ [
1
3(
1
3− 2𝛽) + 𝛽2,
2
3(
1
3− 2𝛽) − 𝛽2] ∪ … ∪ [1 −
1
3(
1
3− 2𝛽) − 2𝛽2 , 1]
Continuing this way, at the 𝑘th
step, we trisect each closed intervals obtained at the (𝑘 − 1)st
step and remove two open intervals each of length 3𝛽𝑘 asymmetrically as
before about each trisection points. Let 𝐽𝛽(𝑘)
be the union of the remaining closed
intervals. Now, we define the Cantor-like set 𝐶𝛽 by 𝐶𝛽 = ⋂ 𝐽𝛽(𝑘)∞
𝑘=1 .

Proceedings of the 7th
YSF Symposium - 2018
104
Results and Discussion The length of the open interval removed in the first step of the construction is 6𝛽. Also, the lengths of the open intervals removed in the second and the third steps of the construction is 2 × 3 × 3𝛽2 and 2 × 32 × 3𝛽3, respectively. In general, the length of
the open intervals removed in the 𝑘th step of the construction is 2 × 3𝑘−1 × 3𝛽𝑘 . Hence the sum of the lengths of the intervals removed in the construction is 6𝛽 +
2(3𝛽)2 + 2(3𝛽)3 + ⋯ + 2(3𝛽)𝑘 + ⋯. Since the sum of this infinite series is 6𝛽
1−3𝛽, and
the maximum length that can be removed is 1, we must have 6𝛽
1−3𝛽≤ 1. This gives us
𝛽 ≤ 1
9. This Cantor- like set Cβ is a fat Cantor set when 𝛽 <
1
9 since its Lebesgue
measure is positive. When 𝛽 =1
9, we can obtain a thin Cantor –like set, C1
9
.
According to the definition of the Hausdorff-Besicovitch dimension 𝑑 given in [1] and
[3], we have 𝑑 =ln 𝑁
ln 1
𝑟
, where N is the number of self-similar pieces and r is the
contraction factor.
For the Cantor-like set Cβ, this gives us 𝑑 =ln 3
ln(1
𝛽) .
For 𝛽 =1
9, Hausdorff-Besicovitch dimension of C1
9
is 𝑑 =ln 3
ln 9= 0.5. We note that, for
the Cantor ternary set, it is 𝑑 =ln 2
ln 3≈ 0.630930.
Another intresting property is that the elements of C 1
9
can be written in base 9
without using the digits 1, 2, 3 ,5, 6 and 7. That is
C 1
9
= 𝑥 ∈ [0,1] ∶ 𝑥 = ∑𝜀𝑘(𝑥)
9𝑘∞𝑘=1 with 𝜀𝑘(𝑥) ∈ 0, 4, 8 for 𝑘 ∈ ℕ.
Now, as in [2] and [3], we can define a mapping between C 19
and [0,1] by
𝑓(𝑥) = 𝑓(∑𝑎𝑛
9𝑛) = ∑𝑏𝑛
3𝑛∞𝑛=1
∞𝑛=1 where 𝑏𝑛 =
0 if 𝑎𝑛 = 01 if 𝑎𝑛 = 42 if 𝑎𝑛 = 8
.
Using the above mapping 𝑓, we can construct a new function 𝑔: [0,1] → [0,1] by the following procedure: In the 𝑘𝑡ℎstep of the construction of C 1
9
, 𝑔 is defined as
𝑔(𝑥) =3𝑘−2
9𝑛 for all 𝑥 ∈ (36𝑘−35
9𝑛 ,36𝑘−32
9𝑛 ) for 𝑘 = 1, 2, … , 3𝑛−1 and
𝑔(𝑥) =3𝑘−1
9𝑛 for all 𝑥 ∈ (36𝑘−31
9𝑛 ,36𝑘−28
9𝑛 ) for 𝑘 = 1, 2, … , 3𝑛−1.
This Cantor-like function is not one-to-one, maps C 1
9
onto [0,1], continuous, monotone
increasing, differentiable almost everywhere and constant in each of the open intervals as in [4]. In this study we constructed a new Cantor-like set by removing open intervals asymmetrically. According to the value of 𝛽, it can be either a fat Cantor set or a set with Lebesgue measure zero. It is interesting to note that the Cantor-like set constructed above form the corresponding Cantor-like dust in a “speedy manner”.
Conclusion The Cantor-like set C
1
9
constructed above is sparser than most existing generalizations.

Proceedings of the 7th
YSF Symposium - 2018
105
References [1] Chovanec F. “Cantor Sets”, Science and Military Journal; Liptovský Mikulás, vol.
5.1, pp 5-10, 2010. [2] R.Dimartino W. U., “On Cantor-like sets and Cantor-Lebesgue Singular function”,
arXiv:1403.6554v1 [math.CA], pp 1-16, 2014. [3] R.Dimartino W. U., “Excursions on Cantor–Like Sets”, arXiv:1411.7110v1[math.CA],
pp 1-7, 2014. [4] Dovgoshey O. M., “The Cantor function”, Expo. Math., vol 24, Issue 1, pp 1 – 37,
2006.

Proceedings of the 7th
YSF Symposium - 2018
106
CLAY-BIOCHAR COMPOSITES FOR SORPTIVE REMOVAL OF TETRACYCLINE
ANTIBIOTICS IN AQUEOUS MEDIA
K. S. D. Premarathna1, M. Vithanage2, L. Weerasundara3 and A.U. Rajapaksha*2
1Post Graduate Institute of Science, University of Peradeniya, Peradeniya, Sri Lanka
2Faculty of Applied Sciences, University of Sri Jayewardenepura, Gangodawila,
Nugegoda, Sri Lanka 3Chemical and Environmental Systems Modeling Research Group, National Institute of
Fundamental Studies, Kandy, Sri Lanka *Corresponding author (email: [email protected])
Introduction Tetracycline (TC) antibiotics have been effectively used against wide range of gram-positive and gram-negative bacteria in both human and veterinary therapies and in livestock maintenance [1]. After metabolization, non-metabolized fraction is excreted to environment as still-active compounds [2]. Freely available antibiotics in the environment have resulted antibiotic-resistant bacterial strains, thus antibiotic treatments have become ineffective and results persistence of infection in the body. Therefore, development of effective methods to eliminate antibiotics particularly from drinking water and groundwater is a timely requirement. Recently adsorbent prepared by using agricultural resources and waste materials (biochar, activated carbon) and naturally originated clay materials have been used as low-cost sorbents for the removal of organic/inorganic contaminants. Open disposal of municipal solid waste (MSW) has become a problem in Sri Lanka and it creates atmospheric pollution through greenhouse gas (GHGs) and volatile organic compound (VOCs) emission whereas water and soil pollution via landfill leachate. Thus, conversion of MSW to biochar has a potential to act as a universal solution for many environmental problems. The applications and mechanisms of clay-biochar composites for antibiotic removal have seldom been investigated for the best of our knowledge. Therefore, the objective of the current study was to improve biochar further for removing TC antibiotic from aqueous media using municipal solid waste biochar (MSW-BC), montmorillonite (MT) MSW biochar composite and red earth (RE) MSW biochar composite.
Materials and Methods Stable clay suspensions of MT and/or RE were prepared separately (50 g clay in 2 L deionized (DI) water) followed by sonication of the mixture for 30 minutes in an Ultrasonicator (Rocker). Then 250 g of MSW biochars were added to clay suspensions and the mixtures were shaken for 2 hours [3]. The clay-biochar suspensions were filtered and BC-Clay feedstocks were oven dried at 80°C in an oven overnight. The clay treated biomass feedstocks were packed tightly into ceramic crucibles and slow pyrolysis was done at a rate of 7 °Cmin
-1 under oxygen limited conditions in a muffle
furnace (MTI, Richmond, CA). The pyrolysis temperature was increased to 500 °C and held constant at 500 °C for 30 minutes. Untreated MSW feedstock was also pyrolyzed under same pyrolysis conditions. All the biochar samples were washed with DI water several times to remove impurities, dried in an oven at 80 °C and sealed in a container for further testing. The resulting clay-modified and raw biochar samples were henceforth referred to as MSW-MT, MSW-RE, and MSW respectively.

Proceedings of the 7th
YSF Symposium - 2018
107
The effect of pH on the sorption was studied by adjusting the pH in the range of 3 - 9. The adsorbent concentration was kept at 2.00 g L
-1 of solution containing 20 mg L
-1 TC at
25 °C. The pH was adjusted with 0.1 M HNO3 or NaOH. After 12 hours of contact time, final pH was measured. The samples were then filtered using Whatman 0.45 µm PVDF disposable filters and TC concentrations in the solutions were measured at 268.6 nm wavelength using a spectrophotometer (Shimadzu UV160A).
The adsorption isotherm was determined with different TC solution concentrations ranging from 0.25 to 250 mg L
-1 for 6 h. Adsorbent concentration of each sample was
2.00 g L-1
and pH was kept in 7 – 8 range throughout the experiment. After 6 hours samples were withdrawn from shaker, pH values of the samples were measured and filtered using Whatman 0.45 µm PVDF disposable filters. Absorbances were measured at 268.6 nm wavelength using spectrophotometer (Shimadzu UV160A). Data were modelled using Langmuir isotherm, Freundlich isotherm and Temkin isotherm models. Isotherm regression curves were plotted using non-linear regression by Origin Ver. 6.1.
Results and Discussion TC adsorption capacities of biochars between pH 3 – 9 varies as follows, MSW- MT biochar composite > MSW-RE biochar composite > MSW biochar. TC adsorption capacity of MSW biochar is increased with increasing pH up to pH 5.0 and then decreased with further increase of pH (Figure 1). Maximum adsorption capacity was observed at the pH 5.0. Similarly MSW-RE biochar composite indicated maximum adsorption at pH 7.0, and then adsorption capacity is decreased with increase of pH. MSW-MT biochar has shown greater TC sorption compared with other two biochars in the pH range 3.0 – 9.0. Maximum adsorption was observed at pH 7.0. The pH of all the biochars were in basic range (MSW – 9.55, MSW-MT – 9.51 and MSW-RE – 8.99). Therefore, they are acting as a successful adsorbent in its basic pH range. Highest adsorption capacity of MSW-MT biochar for TC results due to presence of MT particles on MSW biochar surface which adsorb cationic, neutral and monoanionic species of TC mainly via electrostatic interactions as well as strong non-electrostatic interactions [4].
Figure 1. The pH vs TC adsorption capacities of MSW biochar, MSW-MT and MSW-RE biochar composites.

Proceedings of the 7th
YSF Symposium - 2018
108
The distribution of adsorbate molecules between the liquid and solid phase under the equilibrium state can be described using adsorption isotherm models. Three adsorption isotherm models were used to the fit the isotherm experimental data. Equations are listed below
qe = Qmax KLCe Langmuir model (1 + KLCe)
qe = KfCe 1/n
Freundlich model
qads = RT In(ACe) Temkin model b
Where KL, Kf, and A represents the three model coefficients, respectively; qe (mg g-1
) is the amount of TC adsorbed per unit weight of adsorbent at the equilibrium, Ce (mg L
-1) is
the equilibrium solution concentration of the adsorbate, Qmax (mg g-1
) is the maximum amount of TC adsorbed, n, and b are constants for Freundlich and Temkin respectively. R is the universal gas constant (8.314 J K
−1 mol
−1), T is the absolute temperature.
(a) (b)
(c) Figure 2. Adsorption isotherm fittings of biomass (a). MSW biochar, (b). MSW-MT biochar and (c). MSW-RE biochar to Freundlich and Temkin fitting. The symbols represent experimental results at pH range 7.00 - 8.00 and the solid line represents the calculated results using non-linear curve fitting.
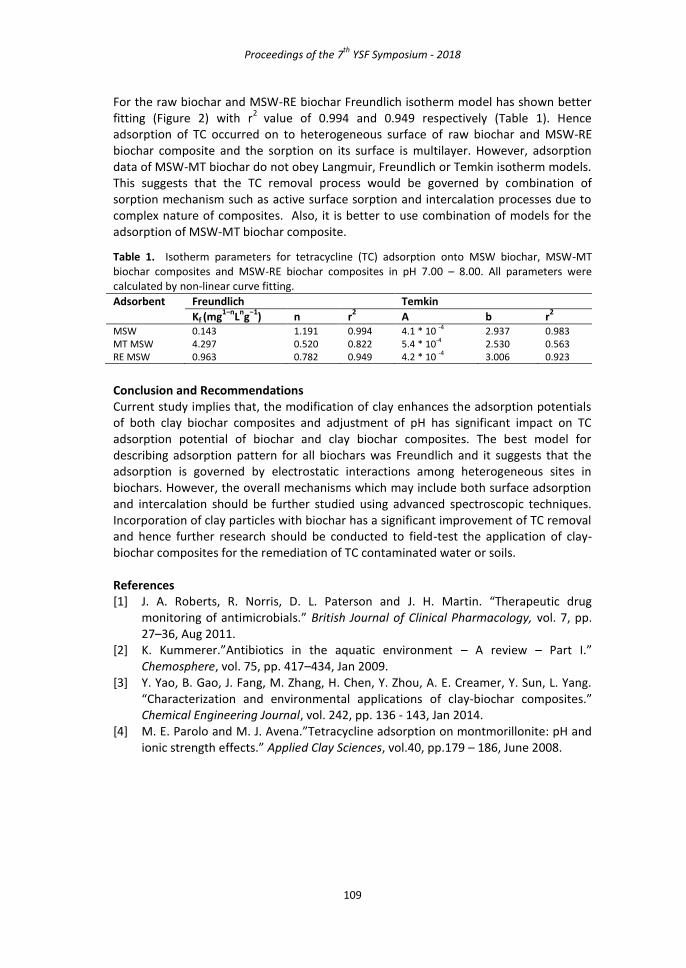
Proceedings of the 7th
YSF Symposium - 2018
109
For the raw biochar and MSW-RE biochar Freundlich isotherm model has shown better fitting (Figure 2) with r
2 value of 0.994 and 0.949 respectively (Table 1). Hence
adsorption of TC occurred on to heterogeneous surface of raw biochar and MSW-RE biochar composite and the sorption on its surface is multilayer. However, adsorption data of MSW-MT biochar do not obey Langmuir, Freundlich or Temkin isotherm models. This suggests that the TC removal process would be governed by combination of sorption mechanism such as active surface sorption and intercalation processes due to complex nature of composites. Also, it is better to use combination of models for the adsorption of MSW-MT biochar composite.
Table 1. Isotherm parameters for tetracycline (TC) adsorption onto MSW biochar, MSW-MT biochar composites and MSW-RE biochar composites in pH 7.00 – 8.00. All parameters were calculated by non-linear curve fitting.
Adsorbent Freundlich Temkin
Kf (mg1−n
Lng
−1) n r
2 A b r
2
MSW 0.143 1.191 0.994 4.1 * 10 -4 2.937 0.983 MT MSW 4.297 0.520 0.822 5.4 * 10-4 2.530 0.563 RE MSW 0.963 0.782 0.949 4.2 * 10 -4 3.006 0.923
Conclusion and Recommendations Current study implies that, the modification of clay enhances the adsorption potentials of both clay biochar composites and adjustment of pH has significant impact on TC adsorption potential of biochar and clay biochar composites. The best model for describing adsorption pattern for all biochars was Freundlich and it suggests that the adsorption is governed by electrostatic interactions among heterogeneous sites in biochars. However, the overall mechanisms which may include both surface adsorption and intercalation should be further studied using advanced spectroscopic techniques. Incorporation of clay particles with biochar has a significant improvement of TC removal and hence further research should be conducted to field-test the application of clay-biochar composites for the remediation of TC contaminated water or soils. References [1] J. A. Roberts, R. Norris, D. L. Paterson and J. H. Martin. “Therapeutic drug
monitoring of antimicrobials.” British Journal of Clinical Pharmacology, vol. 7, pp. 27–36, Aug 2011.
[2] K. Kummerer.”Antibiotics in the aquatic environment – A review – Part I.” Chemosphere, vol. 75, pp. 417–434, Jan 2009.
[3] Y. Yao, B. Gao, J. Fang, M. Zhang, H. Chen, Y. Zhou, A. E. Creamer, Y. Sun, L. Yang. “Characterization and environmental applications of clay-biochar composites.” Chemical Engineering Journal, vol. 242, pp. 136 - 143, Jan 2014.
[4] M. E. Parolo and M. J. Avena.”Tetracycline adsorption on montmorillonite: pH and ionic strength effects.” Applied Clay Sciences, vol.40, pp.179 – 186, June 2008.

110
GENDER DIFFERENCES OF BIO-IMPEDANCE ANALYSIS, SOMATOTYPING AND SELECTED ANTHROPOMETRIC MARKERS OF ADIPOSITY AND THE
ASSOCIATION WITH INSULIN RESISTANCE IN HEALTHY MALE AND FEMALE POPULATION IN SRI LANKA
R.G.L. Rathnayake1, U.P.K. Hettiaratchi*1 and P.P.R. Perera1
1Faculty of Medical Sciences, University of Sri Jayewardenepura
*Corresponding author (email: [email protected])
Introduction There is a well established difference of body composition between males and females for a given body mass index [1]. The lean mass is significantly higher in males compared to females and adiposity is higher in females compared to males [1]. Furthermore, males generally show more central obesity, while femlaes show more peripheral fat distribution [1]. When the fat distribution is considered, males show a high level of visceral adiposity compared to subcutaneous fat distribution.
Bio impedance analysis (BIA) is a simple technique which is used to assess the body fat level. This technique is based on the principle of resistance which is generated against an electrical current which passes through the human body. Reference methods of measurement of lean body mass, adiposity, visceral fat levels and subcutaneous fat levels require advanced and expensive techniqes like Magnetic Resonance Imaging, Hydrodensitometry which are not practical to be used in a normal laboratory and a clinical setup. When the measurement of body composition is considered, anthropometry is a feasible and a practical method to be used in clinical practice. For the measurement of adiposity, the most commonly used indicator is Body Mass Index (BMI). Other than that, there are different formulae developed for the calculation of body fat percentage using anthropometric measurements.
However, when assessing the risk with regard to the development of non-communicable diseases, the lean body mass is not considered as a risk marker. There is no anthropmetric index which can be used to represent lean mass. “Mesomorphy” which is a component of somatotytping may have a place to be used as an indicator of lean body mass.
“Somatotyping” is another method of body composition assessment and the final measurement is given as a somatotype. “A somatotype is a description of the present morphological conformation which is expressed in a three numeral rating, consisting of three sequential numbers, always recorded in the same manner. Each numeral represents the evaluation of three primary components of physique which describe individual variations in human morphology and composition”[2]. This concept was originally described to classify the human physique by Sheldon et al in 1940 and was modified by Heath and Carter in 1967 [2].
Three components where numeral ratings were given in somatotyping are Endomorphy (relative fatness in individual physique), Mesomorphy (relative musculoskeletal development pre unit of height (lean body mass relative to the height) and Ectomorphy (relative linearity based on height/cube root of weight ratios/evaluate the form and degree of longitudinal distribution of the first and second components) [3].

Proceedings of the 7th
YSF Symposium - 2018
111
The objectives of the current study were to compare the markers of body composition measured by anthropometric methods, Bio-impedance analysis, and somatotyping by gender and determine the association of the measurements obtained from above methods with insulin resistance in a selected population.
Materials and Methods Apparently healthy 54 females and 46 males without a history of Type 2 diabetes mellitus or other non-communicable diseases, living in the Elehera divisional secretariat area in Polonnaruwa district and subjects attending the Family Practice Centre, University of Sri Jayewardenepura were recruited for the study. Ethical approval for the study was obtained from the Ethics Review Comitte, Facutly of Medical Sciences, University of Sri Jayewardenenpura.
Biochemical analysis Ten hour fasting blood samples were collected for the assessment of Insulin Resistance (IR) of the population. Fasting Blood Glucsoe (FBS) level was assessed using Glucose Oxidase method. Serum insulin level was assesd using ELISA technique.
Insulin resistance was calculated using HOMA-IR equation (homeostatic model assessment).
HOMA-IR values ≥2.6 were considered as insulin resistant based on the findings of a research done locally by Palangasinghe [4].
Assessment of body composition Anthropometric measurements were taken to evaluate the body fat distribution. Waist circumference (WC), waist-to-hip ratio (WHR), waist-to-thigh ratio (WTR) and body mass index (BMI) were used as measures of adiposity.
Body fat percentage (BF%), sub-cutaneous fat percentage (SCF%) and skeletal muscle percentage (SM%) were assessed using bio-impedance analyser.
The somatotypes were calculated using the “anthropometric method” following the Heath-Carter anthropometric somatotype instruction manual. Triceps, subscapular, supra-spinal skinfolds were taken to calculate the endomorphy [Endomorphy = - 0.7182 + 0.1451 (X) - 0.00068 (X
2) + 0.0000014 (X
3); X =]. Humerus breadth, femur breadth, arm
girth, calf girth and calf skinfolds were measured to calculate mesomorphy [mesomorphy= 0.858 x humerus breadth + 0.601 x femur breadth + 0.188 x corrected arm girth + 0.161 x corrected calf girth – height 0.131 + 4.5]. Height and weight measurements were taken to calculate the ectomorphy. Ectomorphy was calculated by different equations depending on the height to weight ratio (HWR) [(If HWR ≥ 40.75, ectomorphy = 0.732 HWR - 28.58) (If 40.75 > HWR < 38.25 then, ectomorphy = 0.463 HWR - 17.63) (If HWR ≤ 38.25 then, ectomorphy = 0.1)].
Statistical analysis Statistical analysis was performed in two stages. First, the measured parameters were compared between females and males. Then both female and male populations were devided in to four groups based on their insulin resistance (as insulin resistant and non-insulin resistant) and differences were assessed in female and male groups separately. The significant differences of the mean parameters of the two groups were analysed
HOMA-IR = [fasting plasma insulin (mu/ml)*fasting blood sugar (mmol/l)]/22.5 (2)

Proceedings of the 7th
YSF Symposium - 2018
112
using the student t-test. When the distribution of the variables was not normal in at least one of the compared groups, Mann-Whitney U-test was applied. P values of <0.05 were considered as significant.
Results and Discussion Mean age of females was 40 years while that of males was 44 years. Thirty one percent of the study population reported a family history of T2DM.
BMI, BF%, SCF% and endomorphy were significantly higher among females. On the other hand WHR, WTR, skeletal muscle percentage and ectomorphy were significantly higher among males (Table 01).
Table1. Distribution of assessed variables among female and male subjects
Variable Female (SD) Male (SD) P
Waist circumference 83.06 (±9.16) 84.83 (±8.71) 0.325
BMI 24.79 (±4.35) 23.04 (±3.35) 0.042
Waist-to-hip ratio 0.86 (±0.06) 0.90 (±0.04) 0.000
Waist-to-thigh ratio 1.83 (±0.29) 1.97 (±0.71) 0.005
Body fat % 34.36 (±4.56) 24.27 (±4.55) 0.000
Whole body subcutaneus fat % 29.59 (±5.14) 19.73 (±20.95) 0.000
Whole body skeletal muscle % 23.52 (±2.26) 30.73 (±2.30) 0.000
visceral fat level 7.41 (±4.68) 8.33 (±3.97) 0.160
Endomorphy 6.21 (±1.29) 4.29 (±1.46) 0.000
Mesomorphy 4.90 (±1.71) 4.48 (±1.31) 0.180
Ectomorphy 1.18 (±1.20) 2.23 (±1.34) 0.000
Fasting blood sugar (mg/dl) 86.62 (±15.21) 85.24 (±8.24) 0.530
fasting insulin level 11.68 (±4.36) 11.63 (±6.66) 0.369
insulin resistance 2.58 (±1.55) 2.45 (±1.40) 0.609
When the male and female populations were divided in to groups based on the IR values there were 19 insulin resistant female subjects, 10 insulin resistant male subjects, 35 non-insulin resistant female subjects and 36 non-insulin resistant male subjects.
Insulin resistant female population showed significantly higher values in WC, BMI, BF%, subcutaneous fat percentage, viscerla fat leves and endomophy, compared to the non–IR female group. On the other hand, non-insulin resistant female group showed significantly higher values in skeletal muscle percentage, mesomorphy and ectomorphy.
When the male population is considered, IR group showed significantly higher WTR, subsutanoeus fat percetnages and endomorphy compared to the non-IR group.
Conclusions and Recommendations Results of the current study show that males have a significant central fat distribution while femlaes have a significant peripheral fat distribution. However, when insulin resistance is considered, both markers of central and peripheral fat distribution showed applicability as valuable risk evaluation markers among females. On the other hand, somatyping also demonstrateted it’s potential as a valuable metabolic risk indicator especially in females.
Since males did not show a significant association with asesesed risk indictors, futher studies should be carried out with a larger sample to test whether either indicators of central fat distribution or peripheral fat distribution are better for risk evaluation in

Proceedings of the 7th
YSF Symposium - 2018
113
males, especially the somatotyping technique, since somatotyping parameters showed significant differences between the IR and non-IR females. Table 2. Distribution of assessed variables among female and male subjects based on insulin resistance
Varible Female Male
Non-IR (SD)
IR (SD) P value
Non-IR (SD)
IR (SD) P value
WC 81.13 ± 8.70 86.60 ± 9.15 0.040 83.69 ± 7.16 88.94 ± 12.48 0.064
BMI 23.38 ± 3.55 27.38 ± 4.58 0.002 22.66 ± 3.11 24.45 ± 3.94 0.230
WHR 0.85 ± 0.07 0.86 ± 0.05 0.673 0.90 ± 0.03 0.92 ± 0.06 0.091
WTR 1.81 ± 0.22 1.86 ± 0.38 0.625 1.85 ± 0.17 2.42 ± 1.45 0.043
Body fat % 33.37 ± 4.23 36.17 ± 4.72 0.038 23.86 ± 4.77 25.72 ± 3.52 0.149
subcutaneus fat %
28.07 ± 4.51 32.38 ± 5.15 0.004 16.38 ± 4.44 31.77 ± 43.72 0.017
Skeletal muscle %
24.01 ± 2.15 22.60 ± 2.22 0.003 30.97 ± 2.16 29.84 ± 2.71 0.149
visceral fat level
6.11 ± 3.39 9.79 ± 5.80 0.018 7.81 ± 3.62 10.20 ± 4.78 0.108
Endomorphy 5.89 ± 1.21 6.81 ± 1.22 0.012 4.06 ± 1.40 5.15 ± 1.43 0.020
Mesomorphy 4.36 ± 1.47 5.89 ± 1.71 0.002 4.33 ± 1.18 5.01 ± 1.66 0.173
Ectomorphy 1.55 ± 1.32 0.48 ± 0.42 0.000 2.33 ± 1.26 1.84 ± 1.64 0.165
References [1] Geer EB, Shen W. Gender differences in insulin resistance, body composition, and energy
balance. Gender medicine. 2009;6:60-75. [2] Singh S. Somatotype and disease–A review. The Anthropologist: International Journal of
Contemporary and Applied Studies of Man. 2007; 3:251-61. [3] Carter J. The heath-carter anthropometric somatotype-instruction manual. San Diego, USA.
2002. [4] Menik L, Palangasinghe S. Comparison of insulin resistance by indirect methods-HOMA,
QUICKI and McAuley-with fasting insulin in patients with type 2 diabetes in Galle, Sri Lanka: A pilot study. Online Journal of Health and Allied Sciences. 2006;5(1).

Proceedings of the 7th
YSF Symposium - 2018
114
PROPHYLACTIC AND THERAPEUTIC CHRONIC ANTI-INFLAMMATORY EFFECT OF Acronychia pedunculata LEAVES ON ADJUVANT-INDUCED
ARTHRITIS RAT MODEL
W. M. K. M. Ratnayake1, T. S. Suresh*1, A. M. Abeysekera2, N. Salim3 and U. G. Chandrika1
1Department of Biochemistry, Faculty of Medical Sciences,
2Department of Chemistry, Faculty of Applied Sciences, 3Department of Botany, Faculty of Applied Sciences,
University of Sri Jayewardenepura, Gangodawila, Nugegoda, Sri Lanka. * Corresponding author (email: [email protected])
Introduction Chronic inflammatory diseases remain one of the world’s major health problems. Hence, there is a great deal of interest in the field of medical research for the inflammatory response. As a result of adverse effects of existing allopathic anti-inflammatory drugs, there is an attraction for investigations of the efficacy of plant based drugs used in the traditional medicine.
Acronychia pedunculata (“Ankenda” in Sinhala, Family: Rutaceae) is a small evergreen tree found in Sri Lanka and the leaves, stems, roots and fruits have been used for centuries in folk medicine for the treatment of various diseases. Our previous studies have shown that 70% ethanol extract of leaves of this plant has significant anti-inflammatory activity on carrageenan induced rat paw oedema model [1] which is widely used for determining the acute phase of the inflammation, as well as on formaldehyde induced paw oedema model which is a model for sub-chronic inflammation
[2]. All of these scientific findings contribute to solicit the anti-
inflammatory activity of this plant. Hence, in the present study an attempt has been made to evaluate its’ prophylactic and therapeutic action on chronic inflammation on adjuvant-induced arthritis rat model.
Material and Methods Plant material Fresh A. pedunculata leaves were collected from Kottawa area in Colombo district. It was authenticated and a voucher specimen (KMR002) was deposited at National Herbarium, Department of National Botanic Garden, Peradeniya, Sri Lanka
Preparation of plant extracts One hundred grams of fresh leaves were refluxed with 500 mL of 70% ethanol for two hours. The extract was filtered and the filtrate was evaporated under reduce pressure to dryness. The residue was collected and dissolved in 0.5 % carboxymethyl cellulose (CMC) for oral administration to rats.
Ethical clearance The protocol for animal experiment was approved by the Ethics Review Committee of the Faculty of Medical Sciences, University of Sri Jayewardenepura, Gangodawila, Nugegoda, Sri Lanka (No. 35/15). International guidelines and recommendations of Federation of European Laboratory Animal Science Associations (FELASA) were followed for handling of animals. Assay was carried out at the Animal House of University of Sri Jayewardenepura, Sri Lanka.

Proceedings of the 7th
YSF Symposium - 2018
115
Animals Healthy adult male, Wistar rats weighing 150-250 g were purchased from Medical Research Institute, Colombo 8, Sri Lanka. Rats were housed under standard conditions with a natural light-dark cycle and fed with standard diet and water ad libitum. The animals were acclimatized for at least one week to the laboratory conditions prior to the experiment.
Preventive and therapeutic assays for adjuvant-induced arthritis Wistar rats were randomly selected and grouped (n=6/ group). There were 4 groups of rats per each assay as healthy control, negative and positive control and test group. Group I of each served as healthy control animals and all other groups were induced with arthritis by a single intra-dermal injection of 0.1 mL of suspension of Freund’s Complete Adjuvant (FCA) containing 0.05%w/v Mycobacterium butyricum in to a footpad of the left hind paw
[3]. Among the arthritis induced animals, negative and
positive control groups were orally administered 1.0 mL of CMC and 20 mg of celecoxib / kg b. w in 1.0 mL of CMC respectively. The test group received 200 mg / kg of b.w of 70% ethanol extract of A. pedunculata leaves (EAPL) in 1.0 mL of CMC, which was identified as the effective dose in acute and sub chronic anti-inflammatory assays. For the study on the preventive effect, adjuvant was injected in the day 0 and animals were orally treated as above daily from day 0 to day 19. According to the Stevension et al, the onset of arthritis appears on approximately on day 10 post injection and it had been found for typical compound screening experiments that 19 days is sufficient [4]. Hence 19 days was selected as the duration for prophylactic assay. For the therapeutic effect study, adjuvant was injected in the day 0 and animals were orally treated from day 14 to day 28. The animals were allowed to develop arthritis and then therapeutic administration of the extract was started. The body weight, thickness of hind paw pad and thickness of ankle joint were measured alternatively between period of 3 and 4 days.
All the results were expressed as mean ± standard error of mean (SEM). Data were analyzed using one way analysis of variance test (ANOVA) to determine the significance of the difference between the control and test groups. p- values < 0.05 were considered as statistically significant.
Results and Discussion A significant enhancement in thickness of hind paw pads and ankle joints was observed in all the adjuvant injected groups as compared to healthy control rats in both experiments. In adjuvant injected rat group, swelling and redness developed in the injected hind paw and ankle joint and it reached maximum intensity on day 3 (first swelling phase). Thereafter, swelling slowly subsided until the tenth day and then began to swell again (second swelling phase). Oral administration of EAPL as well as the celecoxib from the day of adjuvant injection (day O) significantly (p < 0.05) suppressed the swelling phases. The figure 1a and 1b show the percentage inhibition of oedema formation at hind paw and ankle joint, respectively, in the prophylactic assay. As shown in Figure 1a and Figure 1b, the maximum percentage of inhibition of oedema formations at hind paw and ankle joint were found to be 84.2 % and 86.0 % respectively at 19
th day
for the group that received EAPL, while it was 77.6 % and 76.0 % for celecoxib group.
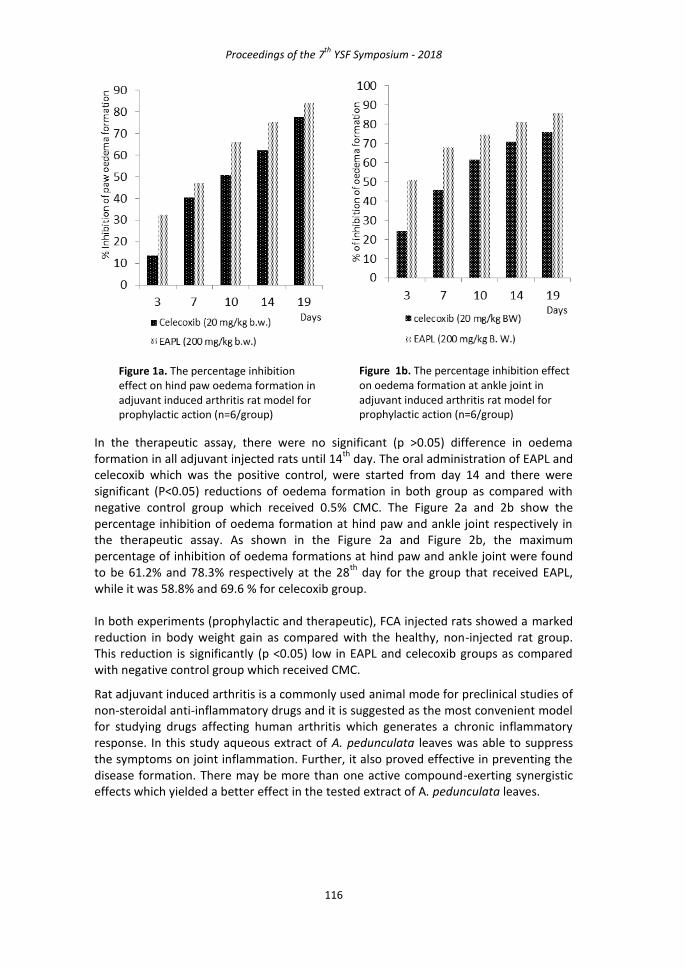
Proceedings of the 7th
YSF Symposium - 2018
116
In the therapeutic assay, there were no significant (p >0.05) difference in oedema formation in all adjuvant injected rats until 14
th day. The oral administration of EAPL and
celecoxib which was the positive control, were started from day 14 and there were significant (P<0.05) reductions of oedema formation in both group as compared with negative control group which received 0.5% CMC. The Figure 2a and 2b show the percentage inhibition of oedema formation at hind paw and ankle joint respectively in the therapeutic assay. As shown in the Figure 2a and Figure 2b, the maximum percentage of inhibition of oedema formations at hind paw and ankle joint were found to be 61.2% and 78.3% respectively at the 28
th day for the group that received EAPL,
while it was 58.8% and 69.6 % for celecoxib group. In both experiments (prophylactic and therapeutic), FCA injected rats showed a marked reduction in body weight gain as compared with the healthy, non-injected rat group. This reduction is significantly (p <0.05) low in EAPL and celecoxib groups as compared with negative control group which received CMC.
Rat adjuvant induced arthritis is a commonly used animal mode for preclinical studies of non-steroidal anti-inflammatory drugs and it is suggested as the most convenient model for studying drugs affecting human arthritis which generates a chronic inflammatory response. In this study aqueous extract of A. pedunculata leaves was able to suppress the symptoms on joint inflammation. Further, it also proved effective in preventing the disease formation. There may be more than one active compound-exerting synergistic effects which yielded a better effect in the tested extract of A. pedunculata leaves.
Figure 1a. The percentage inhibition effect on hind paw oedema formation in adjuvant induced arthritis rat model for prophylactic action (n=6/group)
Figure 1b. The percentage inhibition effect on oedema formation at ankle joint in adjuvant induced arthritis rat model for prophylactic action (n=6/group)

Proceedings of the 7th
YSF Symposium - 2018
117
Conclusions and Recommendations The present study on 70% ethanol extract of A. pedunculata leaves has demonstrated that it has significant chronic anti-inflammatory properties and it justifies the traditional use of this plant in the treatment of various types of inflammation.
Acknowledgement Financial assistance by World Class University Project (WCUP) under the research grant number Ph. D. /15/ 2012 is gratefully acknowledged.
References [1] W.M.K.M. Ratnayake, U.G. Chandrika, T.S. Suresh, A.M. Abeysekara and N Salim,
Anti-inflammatory activity of Acronychia pedunculata leaves, (In) Proceedings of Annual International Research Sessions of the University of Peradeniya (iPURSE ), pp. 342. 2016.
[2] W.M.K.M. Ratnayake, T.S. Suresh, A.M. Abeysekara, N. Salim and Chandrika, U. G., Sub chronic anti-inflammatory activity of Acronychia pedunculata leaves on formaldehyde induced rat hind paw oedema model, (In) Proceedings of 4
th
International Conference on Ayurveda, Unani, Siddha and Traditional Medicine (ICAUST), Institute of Indigenous Medicine, University of Colombo, pp. 86. 2016.
[3] S. G. Suke, H. Negi, P. K. Mediratta, B.D. Banerjee and K.K. Sharma, Anti-arthritic and anti-inflammatory activity of combined pioglitazone and prednisolone on adjuvant-induced arthritis, European Journal of Pharmacology, 718, pp .57-62. 2013.
[4] C.S. Stevenson, L.A. Marshall and Morgan, In vivo models of inflammation, 2nd ed, Birkhauser Verlag, Berlin, pp .16-17, 2016.
Figure 2a. The percentage inhibition effect on hind paw oedema formation in adjuvant induced arthritis rat model for therapeutic action (n=6/group)
Figure 2b. The percentage inhibition effect on oedema formation at ankle joint in adjuvant induced arthritis rat model for therapeutic action (n=6/group)

Proceedings of the 7th
YSF Symposium - 2018
118
CHARACTERISATION OF RGO AS AN ELECTRON ACCEPTOR ON p-Cu2O AND n-Cu2O PHOTOELECTRODES
S.P.A.U.K. Samarakoon1,2, P.G.D.C.K. Karunarathna1,2, G.G. Chathuranga1,2, H.T.D.S. Madusanka1,2, U.S. Liyanaarahchi1,2 and C.A.N. Fernando*1,2
1Department of Electronics,
2Nanotechnology Research laboratory, Department of Nano Science Technology,
Faculty of Applied Sciences, Wayamba University of Sri Lanka, Kuliyapitiya *Corresponding author (email: [email protected])
Introduction Since Cu is a abundant and attractive material, researchers have focused on fabricating semiconductor devices. Its oxides are famous in fabricating photovoltaic devices because of their favorable electrical and optical properties. Among them, Cu2O is most commonly used since it has a direct bandgap of ~2 eV. It is available as both n and p types. Many methods are reported to fabricate n and p type Cu2O [1]. But here we have discussed very simple methods to fabricate p-Cu2O and n-Cu2O.
Since recent years, graphene has been devoted in research due to its excellent properties as electrdes and electrolytes in a range of energy devices. Reduced graphene oxide (rGO) is the comparable easiest way to produce graphene. In this study, rGO layer acts as an electron acceptor to enhance the charge separation of photogenerated electrons [2]. It accepts electrons transferred to it from semiconductor layer and direct them toward the load. For n-Cu2O photoelectrode, the excited electrons transfer towards the Cu substrate and therefore to efficiently exract them, a thin rGO layer is deposited before fabricating the n-Cu2O layer. But in p-Cu2O, the photogenerated electrons transfer towards the electrolyte. Therefore a rGO layer is deposited on top of the p-Cu2O layer to obtain an efficient charge separation. The schematic structures for rGO/ n-Cu2O and p-Cu2O/ rGO is illustrated in figure 1.
Figure 1. Schematic structures of (a) rGO/ n-Cu2O (b) p-Cu2O/ rGO photoelectrodes
(a) (b)

Proceedings of the 7th
YSF Symposium - 2018
119
Materials and Methods Preparation of rGO layer The rGO layer was deposited by reducing GO using electrophoretic deposition technique. GO used in this study is prepared from natural graphite by using modified Hummers’ method [3]. Prepared GO was dispersed in distilled water and a GO solution of pH 4 was made. Sample electrode and a Pt plate were immersed in that solution and a 10 V direct current voltage was applied between the sample and Pt plate for various time intervals. Here, positive terminal was connected to the sample electrode. After deposition of rGO layer, samples were air dried.
Preparation of n-Cu2O layer rGO deposited Cu substrate was immersed in a 0.005 M CuSO4 solution and boiled for several times until deposition of n-Cu2O layer on top of the rGO layer. Here, boiling time controls the n-Cu2O layer thickness.
Preparation of p-Cu2O layer Well cleaned Cu plates were insered into a muffle furnace. Starting from room temperature, it was heated to 300
0c at a rate of 100
0c min
-1 and kept at that
temperature for 30 minutes more. Then it was cooled down again into room temperature.Finally a nano sized Cu2O layer was appeared on the Cu substrate.
Characterization of samples Diffuse reflectance spectra were obtained by SHIMADZU 1800 UV spectrophotometer. The morphology of the samples was observed using a Zeiss Evo LS15 scanning electron microscope. The photocurrent measurements were done using Hokuto Denko HA-301. A JUSCO CT monochromator was used to measure the photocurrent action spectra. The photocurrent quantum efficiency (ɸ %) was calculated from equation 1.
ɸ% = [number of electron created / number of photons incident] ×100% 1
All EIS measurements were done using Metrohm Autolab (PGSTAT 128N).
Results and Discussion The photocurrent action spectra for n-Cu2O, rGO/ n-Cu2O, p-Cu2O and p-Cu2O/ rGO photoelectrodes were shown in figure 2. The absorption edges of these four photoelectrodes were 640 nm, 648 nm, 625 nm and 635 nm respectively. A photocurrent enhancement can be clearlyobserved for both n and p type photoelectrodes after introducing the rGO layer. Another advantage of rGO layer is the facilitation to collect photogenerated electrons readily suppressing the electron hole pair recombination.
Scanning electron microscopy (SEM) images reveal the information about the surface morphology of the fabricated samples. Figure 3 (a-d) show the SEM images of n-Cu2O, rGO/ n-Cu2O, p-Cu2O and p-Cu2O/ rGO photoelectrodes. From figure 3(a) and 3(b), it is shown a reduction of the size of n-Cu2O crystals after introducing the rGO layer compared to the n-Cu2O crystals formed on bare Cu substrate. From figure 3(c), it is clearly seen that a homogeneous Cu2O layer was formedon the Cu surface due to rapid migration of O2 to the Cu surface during heating process. Further from figure 3(d), it is observed that the structure of p-Cu2O did not change due to the introduction of the rGO layer.

Proceedings of the 7th
YSF Symposium - 2018
120
Figure 2. Photocurrent spectra of (a) n-Cu2O and rGO/ n-Cu2O (b) p-Cu2O and p-Cu2O/ rGO photoelectrodes (ɸ%- photocurrent quantum efficiency λ- wavelength)
Figure 3. SEM images of of (a) n-Cu2O, (b) rGO/ n-Cu2O, (c) p-Cu2O and (d) p-Cu2O/ rGO photoelectrodes
Electrochemical impedance spectroscopy (EIS) analysis was done to study the conductivity and charge transferring of the samples. For that three electrodes system was used. As shown in Figure 4 (a) and 4 (b), the Niquist plot after introducing a rGO layer has a much smaller radius than that of bare n-Cu2O and p-Cu2O, which is similar to that reported in other studies [4]. Since the diameter of the semicircle is an indicator of the charge transfer resistance, it is clear that the resistance is reduced after introducing a thin rGO layer [5].
(a) (b)

Proceedings of the 7th
YSF Symposium - 2018
121
Figure 4. Niquist plots (a) n-Cu2O and rGO/ n-Cu2O (b) p-Cu2O and p-Cu2O/ rGO photoelectrodes (Zre- impedance (real part) Zim- impedance (imaginary part))
Conclusions and Recommendations A remarkable photocurrent enhancement of ~50% with a significant stability can be achieved in both n-Cu2O and p-Cu2O after introducing a thin layer of rGO, since it acts as an excellent electron acceptor. Also it facilitates efficient charge separation by reducing its resistance and acts also as a conductive layer. References [1] C.A.N. Fernando, P.H.C. De Silva, S.K. Wethasinha, I.M. Dharmadasa, T. Delsol, and
M.C. Simmonds, “Investigation of n-type Cu2O layers prepared by a low cost chemical method for use in photo-voltaic thin film solar cells”, Renewable energy, 26(4), pp. 521-529, 2002.
[2] P.D. Tran, S.K. Batabyal, S.S. Pramana, J. Barber, L.H. Wong, and S.C.J. Loo, “A cuprous oxide–reduced graphene oxide (Cu2O–rGO) composite photocatalyst for hydrogen generation: employing rGO as an electron acceptor to enhance the photocatalytic activity and stability of Cu2O”, Nanoscale, 4(13), pp.3875-3878, 2012.
[3] W.S. Hummers Jr, and R.E. Offeman, “Preparation of graphitic oxide”, Journal of the American Chemical Society, 80(6), pp.1339-1339, 1958.
[4] Wang, X. Li, Y. Zhao, W. Wu, J. Chen and H. Meng, “Preparation and characterizations of Cu2O/reduced graphene oxide nanocomposites with high photo-catalytic performances”, Powder Technology, 261, pp.42-48, 2014.
[5] X. An, C.Y. Jimmy, and J. Tang, “Biomolecule-assisted fabrication of copper doped SnS 2 nanosheet–reduced graphene oxide junctions with enhanced visible-light photocatalytic activity”, Journal of Materials Chemistry A, 2(4), pp.1000-1005, 2014.
(a) (b)

Proceedings of the 7th
YSF Symposium - 2018
122
PERFORMANCE OF THE SECOND GENERATION AMBAKELLE SPECIAL COCONUT VARIETY UNDER VARYING RAINFALL AND TEMPERATURE
CONDITIONS
C.R.K. Samarasinghe, M.K. Meegahakumbura*, H.D.M.A.C. Dissanayaka and L. Perera
Genetics and Plant Breeding Division, Coconut Research Institute, Lunuwila, Sri Lanka *Corresponding author (email: [email protected])
Introduction Coconut is the most extensively grown and used palm species in the world. It is a major plantation crop in Sri Lanka that contributes 0.7% to the GDP and 9.86% to the agriculture GNP (Central Bank of Sri Lanka, 2016). Coconut plays a significant role in socio-economic life of Sri Lankans as a livelihood crop. During recent past coconut industry of Sri Lanka suffered heavily from long and unpredictable droughts occurred as a result of global climate change. Drought and excessive heat reduce nut yield by reducing nut setting and increasing immature nut fall. It has been estimated that there is a 2/3
rd of annual yield loss caused by drought and excessive heat. (Coconut Cultivation
Board of Sri Lanka, 2013). Moreover, none of the coconut cultivars used today gives stable yields under drought and excessive heat creating a crisis in the coconut industry. Therefore, development of cultivars giving stable yields even under drought conditions is the most sustainable solution to mitigate the effect of changing environment. Selection of genotypes giving stable yields over the years is the essential first step in developing drought tolerant coconut cultivars.
Isolated Seed Garden (ISG) Ambakelle, Coconut Research Institute has the most extensively selected and largest tall coconut population in Sri Lanka. A study had been carried out at field no 01 and 02 of Isolated Seed Garden (ISG) Ambakelle using 16 years (1966-1982) of individual pick wise yield data to select palms showing a stable and moderately higher yields even under adverse climatic conditions. In this study 84 palms have been selected by using Finlay and Wilkinson method and the selected palms have been named as Ambakelle Special palms (AS) (Wickramaratne 1987). The seednuts obtained from Ambakelle Special mother palms are issued as AS while the seednuts obtained from the unselected palms at ISG are issued as CRIC60 which is the most extensively cultivated coconut cultivar in Sri Lanka. In 1992 a second generation of AS palms have been developed by paired crossing and have been planted at the field no. 11A of ISG with CRIC60 as the control. The present study was conducted to compare the performance of this second generation of AS palms under changing climatic conditions from January 2014 to December 2016 based on pick wise yield data.
Materials and Methods: Hundred and fifty palms from AS and CRIC60 at field no 11 of ISG Ambakelle, Arachchikattuwa were selected for the study. This site belongs to the agri-ecological zone Low country Intermediate Zone (IL3), (Punyawardena, 2008). The central coordinates of the location is 7° 41"27.31" N and 79° 53" 48.31" E and the average elevation is approximately 35 m above the mean sea level. The soil in the site is favorable for coconuts and belongs to Ambakelle soil series within the major soil group Alluvial (Mapa, 2010).

Proceedings of the 7th
YSF Symposium - 2018
123
Bimonthly nut yield (pick) data were collected from the selected palms for the duration of January 2014 to December 2016. Data were analysed by General Linear Model (GLM) procedure and mean separation was done through Dunacan Maltiple Range Test by using SAS 9.1.3 portable version. Descriptive statistics and matrix plot graph were obtained by using MINITAB 17 software.
Results and discussion: The mean annual nut yield of AS during 2014-2016 was 109 nuts/palm while the mean annual nut yield of CRIC was 90nuts/palm and this difference was statistically significant. Furthermore, a significant year to year variation was observed with respect to nut yield. However, the interaction of cultivar x year was not significant (Table 01).
When considering the stable yielding character under varying rainfall and temperature conditions (Figure 01), the first quartile value (Q1) of annual nut yields of AS was 82nuts/palm compared to 59nuts/palm in CRIC60 revealing lesser variation of nut yields among AS palms. Moreover, the Coeffient of Variance (CV) of AS was lower compared to CRIC60 with respect to both annual per palm yield and pick-wise per palm yield revealing higher yield stability of AS compared to CRIC60 (Table 01).
Figure 1: Total monthly rainfall and mean maximum monthly temperature in ISG Ambakelle from January-2014 to December-2016.
Table 01: Mean nut yield per year and per pick yield and related descriptive statistic values of two different coconut cultivars in ISG from 2014 to 2016.
0
5
10
15
20
25
30
35
40
45
0
100
200
300
400
500
600
J M M J S N J M M J S N J M M J S N
2014 2015 2016
Mea
n m
on
thly
rai
nfa
ll (m
m/m
on
th)
Year/Month
Rainfall
Tmax
Mea
n m
on
thly
Tm
ax (
oC
)
Parameters CRIC60 Ambakelle Special
Mean yield (nuts/Year) 90.4±2.1b 108.8±2.1a Coefficient of Variance (CV) 48.81 39.82 Q1 59.00 82.00 Q3 122.00 135.75
Mean yield (nuts/pick) 13.56b 16.33a Coefficient of Variance (CV) 103.79 83.85 Q1 0 6.0 Q3 22 24

Proceedings of the 7th
YSF Symposium - 2018
124
Two matrix plots were drawn using CV and mean yield as X and Y variables respectively. When 100% of CV was considered as the reference, over 80% palms of AS population showed a lower CV than reference (Figure 02) while only 50% of CRIC60 palms showed a lower CV than reference (figure 03) revealing high yield stability of AS over CRIC60. AS Palms that showed higher mean pick-wise yield and lower CV can be used as parent palms (in future coconut breeding programmes.
Figure 01: Visualization of mean yield/pick of selected 2nd generation AS palms with CV value
Figure 02: Visualization of mean yield/pick of selected CRIC60 palms with CV value
Proceedings of the 7th
YSF Symposium - 2018
125
Conclusion The results of current study indicated a positive selection in the second generation of AS palms for high and stable nut yield/year and nuts/pick compared to commonly cultivated CRIC60. Findings of this study could be used to select better mother palms for future breeding programme towards developing drought tolerant coconut cultivars/hybrids.
Refference [1] Central Bank of Sri Lanka, Annual report of year 2016: Central Bank, Colombo, Sri
Lanka. [2] Coconut cultivation Board of Sri Lanka. Effect of water deficit (drought) on
growth/productivity of coconut. http://www.coconut.gov.lk/web/?p=effect-of-water-deficit-on-growth&locale=en. 2013.
[3] R.B. Mapa, Introduction, in: Mapa.R.B., Somasiri.S. and Dassanayake. A.R. (Eds.), Soils of Dry Zone of Sri Lanka. Soil Science Society of Sri Lanka., Peradeniya, Sri Lanka. pp.1-6. 2010.
[4] B.V.R. Punyawardane, Evolution of climatic zones in Sri Lanka, in: Punyawardane, B.V.R. (Eds.), Agro-climatological Zones and Rainfall Pattern in Sri Lanka (in Sinhalese), Department of Agriculture, Sri Lanka. pp. 44-113. 2008
[5] M.R.T. Wickramaratne, M.R.T. Breeding coconut for adaptation to drought. COCOS 6:16 23, 1987.

Proceedings of the 7th
YSF Symposium - 2018
126
FACTORS AFFECTING FERTILIZER USAGE BY MEDIUM AND LARGE SCALE COCONUT FARMERS IN GAMPAHA DISTRICT, SRI LANKA
S.D.N.M. Senadheera, A.M.K.R. Bandara and A.I.Y. Lankapura
Faculty of Agriculture, Rajarata University of Sri Lanka
*Corresponding author (email: [email protected])
Introduction Coconut cultivation plays an economically and socially important role in Sri Lanka being one of the key sources of direct and indirect livelihoods. The contribution of coconut sector towards the country’s total agricultural GDP is 10.1%. The production is mostly concentrated in Kurunegala, Puttalam, and Gampaha districts, whilst medium (36%) and large-scale (64%) growers occupy a significant position in Gampaha District. However, the productivity of the sector has been declining over the years. In comparison to other regions, Gampaha District has experienced a rapid downturn in the productivity, putting a serious pressure on country’s economy. Previous researches have disclosed that low adoption levels of good management practices and adverse environmental impacts are the major causative factors for poor performance in coconut cultivation [1]. Moreover, substandard fertilizer application has been identified as a prime contributory factor for low production figures reported in coconut cultivation in short run as well as in long run. Thus, this study attempts to identify the factors affecting on the use of fertilizer by medium- and large-scale coconut farmers in Gampaha District, in order to recommend pragmatic strategies to overcome this issue.
Materials and Methods The study was conducted in Gampaha District at three selected sites namely Divlapitiya, Mirigama, and Minuwangoda, which cover all the major coconut-growing regions within the District. Altogether, 227 farmers were selected using a multistage quota sampling with proportion allocation method.
Primary data were collected mainly from the questionnaire survey, key person interviews and focus group discussions. Descriptive analytical techniques, factor analysis and Binary Logistic Regression techniques were used in the data analysis. Prevalence of favorable weather pattern, credit use, advice supports, yield per acre, income per acre, age, family labor, gender, education level, ownership of land, existence of other income sources, land extent, cropping pattern, membership status of related institutes were among the variables considered in this study.
Binary logistic regression was employed to identify the factors/variables affecting on fertilizer application of the sampled farmers. The status of fertilizer application (apply/not apply) was used as the dependent variable. Following model describe the status of fertilizer application.
𝑙𝑜𝑔𝑖𝑡𝑌 = 𝛽0 + 𝛽1𝑋1 + 𝛽2𝑋2 + ⋯ … + 𝛽𝑛𝑋𝑛 Where; 𝑙𝑜𝑔𝑖𝑡𝑌= Dependent variable (Fertilizer application status) 1 represented the farmers, those who were applying fertilizer 0 represented the farmers, those who were not applying fertilizer 𝛽0 = Intercept 𝛽1, 𝛽2 𝑡𝑜𝛽𝑛= Estimated coefficients 𝑋1, 𝑋2 𝑡𝑜 𝑋𝑛.= Independent variables

Proceedings of the 7th
YSF Symposium - 2018
127
Results and Discussion The descriptive analysis revealed that 37.44% and 16% of the farmers only used inorganic and organic fertilizers respectively, whilst 92% of the sampled farmers applied at least one type of fertilizer. Moreover, majority of the farmers (85.9%) applied supplementary materials such as ash and salt in addition to organic and inorganic fertilizer.
The factor analysis disclosed five factor groups that cumulatively explain 55% of the total variation. Factor 01 represents technical items such as availability of advisory services (Factor loading = 0.73), land size (0.66) and availability of credit facilities (0.65). Factor 02 represents the monetary aspects such as income per acre and yield per acre. Both factor 03 and 04 collectively represent variables related to demographic characteristics where, age and gender represent highest loadings of each group respectively.
Results of Binary Logistic Regression revealed that prevalence of favorable weather pattern, usage of supplementary materials, availability of credit facilities and organic fertilizer application were identified as statistically significant variables (p<0.05) in determining the application of inorganic fertilizer for coconut cultivation (Table 1).
The prevalence of favorable weather pattern has increased the possibility of applying inorganic fertilizer by 258 times compared to non- prevalence of such a situation. Generally, coconut growers consider well on the prevailing weather and these findings are in conformity [2] with the previous research findings. Similarly, the usage of supplementary materials has improved the likelihood of applying inorganic fertilizer by 30 times compared to non-usage of supplementary materials. Additionally, the credit usage has improved the chance of applying inorganic fertilizer [3] by 6.3 odds value. In general, any type of financial assistance would expand the potential expenses and consequently farmer is getting a higher chance to purchase more inorganic fertilizer. However, the application of organic fertilizer has negatively affected (- 2.0018) the event of inorganic fertilizer application. The possibility of applying inorganic fertilizer is decreased by 98% when a farmer is applying organic fertilizer to the field. In other words, farmers those who are applying organic fertilizer tend to apply lesser amount of inorganic fertilizer.
Table 1: Binary logistic regression results for inorganic fertilizer
Parameter Estimate Error Pr>ChiSq Odds ratio
Intercept -1.0682 0.6594 0.1052 Considering favorable weather pattern
2.7756 0.4334 <.0001* 257.541*
Use of supplementary material 1.6974 0.6172 0.0060* 29.811* Credit usage 0.9196 0.3252 0.0047* 6.292* Pest control practicing 0.6662 0.3542 0.0599 3.790 Weed control practicing -1.0157 0.4334 0.0599 0.131 Organic fertilizer application -2.0018 0.6133 0.0011* 0.018*
*significant at 5%
The study also identified that practicing moisture conservation methods, available credit facilities, practicing animal husbandry and inorganic fertilizer application were significantly affecting (p<0.05) on applying organic fertilizer. On the other hand, usage of supplementary materials, yield, and family size were identified as significant factors affecting the decision of applying fertilizer in general.

Proceedings of the 7th
YSF Symposium - 2018
128
Conclusions and Recommendations The study concludes that the consideration on weather pattern, usage of supplementary materials and credit usage significantly increase the chance of applying inorganic fertilizer for coconut. The organic fertilizer application significantly decreases the likelihood of applying inorganic fertilizer for coconut. The study suggests developing policies aimed at improving the existing credit scheme for buying fertilizer.
References [1] E. Mwachiro and R. Gakure, “Factors affecting the coconut industry from
benefitting the indigenous communities of Kilifi District, Kenya", Inter. J. Humanit. Soc. Sci, vol. 1, no. 4, 2011.
[2] P. Pathiraja, G. Griffith, R. Farquharson and R. Faggian, "The Sri Lankan coconut Industry: current status and future prospects in a changing climate", Australasian Agribusiness Perspectives, pp. 1-23, 2015.
[3] M. Waithaka, P. Thornton, K. Shepherd and N. Ndiwa, "Factors affecting the use of fertilizers and manure by smallholders: the case of Vihiga, western Kenya", Nutrient Cycling in Agroecosystems, vol. 78, no. 3, pp. 211-224, 2007.

Proceedings of the 7th
YSF Symposium - 2018
129
RISK OF METABOLIC SYNDROME: A COMPARISON AMONG HYPERTENSIVE AND NON-HYPERTENSIVE SUBJECTS
T.K.R.R. Senarathne, U. P. K. Hettiaratchi* and L.V. Athiththan
1Department of Biochemistry, Faculty of Medical Sciences, University of Sri
Jayewardenepura. *corresponding author (email:[email protected])
Introduction Hypertension is a major health risk factor attributing to the increase in global morbidity and mortality, in both developed and developing countries. It is reported that the prevalence of hypertension is higher in low-income countries. A Sri Lankan study found a prevalence of 28.36 % among a study population in 2009 [1]. Hypertension is not only a major risk factor of cardiovascular diseases (CVD) that attribute to about one third of all deaths worldwide, but is also considered as a key feature of the metabolic syndrome (MS), accounting for nearly 85 % among people with MS. Other common features of MS are atherogenic dyslipidaemia and hyperglycaemia. Abdominal obesity and insulin resistance have been identified as the predominant underlying risk factors for MS.
Various criteria used to predict MS are based on above mentioned metabolic risk factors [2]. Worldwide prevalence of MS has increased significantly over the past two decades. Studies have shown approximately 20 -25 % of world’s adult population have MS and they are prone to have a threefold greater risk for CVD morbidity and fivefold greater risk for developing type 2 diabetes mellitus (T2DM). In addition, prevalence of MS among Sri Lankan adults is increasing at an alarming rate, where one fourth of the Sri Lankan population were affected during the year 2005-2006 [3]. Many studies have focussed on the importance of preventing MS in order to reduce morbidity and mortality [2]. As hypertension is a key feature of MS and could be measured easily, this could be used as an important screening tool to detect MS. Hence, the aim of the present study was to compare the presence of characteristic features of MS in a population of hypertensive and non-hypertensive males and females according to National Cholesterol Education Program Adult Treatment Panel III (ATP III) and new International Diabetic Federation (IDF) criteria and to find out the percentage of MS with both criteria. Further, as subjects in their fourth to sixth decades are affected mostly with hypertension; subjects within the age range of 35- 55 years were selected for this study.
According to the IDF criteria, MS is defined as the presence of large waist line (central obesity): waist circumference (WC) ≥ 90 cm for South Asian men and ≥ 80 cm for South Asian women plus any two of the following four features [2].
1. High triglyceride level: ≥ 150 mg/dL (1.7 mmol/L), or obtaining treatment for high TG.
2. Decreased high density lipoprotein cholesterol (HDL): < 40 mg/dL for male, < 50 mg/dL for female, or obtaining treatment for low HDL cholesterol
3. Raised blood pressure (BP): systolic BP ≥ 130 mm Hg or diastolic BP ≥ 85 mm Hg, or obtaining treatment for hypertension
4. Increased fasting blood sugar (FBS) level: ≥ 100 mg/dL (5.6 mmol/L) or obtaining treatment for high blood sugar.

Proceedings of the 7th
YSF Symposium - 2018
130
According to the ATP ΙΙΙ criteria, MS is defined as the presence of at least 3 of the above mentioned 5 features.
Materials and methods Study design and participants A case control study was carried out at the Family Practice Centre of University of Sri Jayewardenepura, Nugegoda. The study was approved by the Ethics review committee of Faculty of Medical Sciences, University of Sri Jayewardenepura. This study involved 120 participants in the age range of 35-55 years. Informed written consent was obtained from all the participants prior to inclusion in the study. Hypertensive adults (diagnosed as hypertension >140/90 mmHg and/or on antihypertensive drugs) were included in the ‘Test’ group and non-hypertensive adults who were not diagnosed for hypertension and with normal blood pressure <120/80 mmHg, were included in the ‘Control’ group. Subjects who were pregnant, having severe diseases, having physical impairments and who disliked to participate in the study were excluded. Among the 120 subjects, 60 were hypertensive. The female and male distribution in each hypertensive and non-hypertensive groups were similar (n=30).
For the analysis of FBS, 10 hours of overnight fast and for triglycerides and HDL cholesterol 12 hours of overnight fasting period was considered. About 1 mL blood was drawn after 10 hours of overnight fast and collected into an Eppendorf tube containing NaF for analysis of FBS using Biorex diagnostics, Glucose kit. (The cut off value for FBS is >100 mg/dL) [2]. For lipid profile (triglycerides, HDL), 3 mL of blood was collected into properly labelled centrifuge tubes. Analysis was done using Stanbio cholesterol LiquiColor kit. (The cut off value for TG is >150 mg/dL, HDL is < 40 mg/dL for men and <50 mg/dL for women) [2]. Blood pressure was measured using a mercury sphygmomanometer by a qualified medical professional. WC was measured according to the standard method using a validated non stretchable commercial tape. (WC ≥ 90 cm for South Asian men and ≥ 80 cm for South Asian women) [2]. Percentages of MS among hypertensive and non-hypertensive groups were determined according to both ATP III and IDF criteria.
Statistical analysis Means, frequencies and significance of difference in each parameter between hypertensive group and non-hypertensive group were analysed using statistical package for social sciences (SPSS) version 21. In the statistical analysis, P <0.05, was considered as the level of significance.
Results and discussion: Table 1: Mean values of biochemical and anthropometric parameters.
[P < 0.050 was taken as significant. *Difference is significant at 0.05 level]
parameter
Hypertensive group Mean ± Standard Deviation
Non-hypertensive group Mean ± Standard Deviation
Male Female Male Female FBS (mg/dL)* 101.1±26.9* 114.5±68.9* 79.4±15.4 100.8±48.00 WC (cm) 95.0±8.6* 90.6±8.1 88.0±7.7 86.6±9.0 TG level (mg/dL) 131.4±114.5 123.6±55.5* 122.3±56.8 87.6±36.9
HDL cholesterol level (mg/dL) 41.4±8.9 47.4±10.0 38.4 ±8.0 46.1±7.3

Proceedings of the 7th
YSF Symposium - 2018
131
Studies have observed an association between hypertension and diabetes [4]. People with hypertension have a higher risk for developing diabetes. The present study findings support the above fact by showing a significantly higher mean FBS in the hypertensive group compared to the non- hypertensive group (p <0.05).
Table 2: Percentage of subjects with biochemical and anthropometry parameters beyond the
risk cut off value.
According to a report of ATP III, hypertension is associated with elevated triglycerides. In the present study too hypertensive group showed a higher average triglyceride value compared to the non-hypertensive group.
Many studies have found a close association between obesity and hypertension. Central obesity is strongly associated with hypertension. It is suggested that characteristic hyperinsulinemia in obesity, mainly central obesity, lead to the development of hypertension by sodium retention and activating the sympathetic nervous system. Central obesity which is measured by WC is considered as one of the main underlying factors and one of the main features of MS [4]. Therefore, central obesity can be considered as a better indicator to determine the risk for MS. In the present study WC was used to measure central obesity and it was significantly higher in the male hypertensive group compared to the male non-hypertensive group while the mean WC was higher than the risk cut off value in both hypertensive and non-hypertensive females.
Table 3: Number of subjects with MS according to IDF and ATP III
According to IDF criteria to determine MS, among 60 hypertensive subjects, 30 subjects (50 %) had MS where it was only 4 subjects (6.67 %) in the non- hypertensive group. According to ATPIII criteria, among 60 hypertensive subjects, 36 subjects (60 %) had MS while it was only in 6 (10 %) subjects in the non-hypertensive group. The percentage of subjects with MS was significantly higher in the hypertensive group when compared to the non-hypertensive group according to both ATP III and IDF criteria, (p < 0.05). There was no significant difference between male and female hypertensive groups with regard to the MS percentage. Studies have reported that,
Parameters
Hypertensive group
Non-hypertensive group
Male Female Male Female
FBS 40.0 % 26.7 % 6.7 % 13.3 % WC 70.0 % 90.0 % 40.0 % 76.7 % TG level 28.0 % 30.0 % 28.0% 10.0 % HDL cholesterol level 44.0 % 6.7 % 60.0 % 0
MS IDF including hypertension
IDF without including hypertension as a feature of MS
ATP III including hypertension
ATP III without including hypertension as a feature of MS
hypertensive 30* 12 36* 13
non-hypertensive 4 6

Proceedings of the 7th
YSF Symposium - 2018
132
the prevalence of MS in hypertensive patients is higher than in non-hypertensive subjects, which support the findings of the present study [5].
Conclusion and recommendation Significantly higher mean values of FBS were observed among both male and female hypertensive groups compared to non- hypertensive groups while mean WC was significantly higher in hypertensive males and mean TG level was significantly higher in hypertensive females. Percentage of subjects with MS was significantly higher in the hypertensive group compared to the non-hypertensive group according to both ATP III and IDF criteria.
These findings emphasize the urgent need to develop national strategies for the early detection, adoption of preventive measures and also to make people aware of the impact of the metabolic syndrome on their health, in order to reduce the societal burden of cardiovascular disease morbidity and mortality.
References [1] P. Katulanda, A. De Vas Gunawardena, G. Constantine, M. Sheriff and D.
Matthews, Prevalence and correlates of hypertension in Sri Lanka. 2009. [2] G. Alberti, P. Zimmet, J. Shaw, S.M. Grundy, The IDF consensus worldwide
definition of the metabolic syndrome. Brussels: International Diabetes Federation. 2006:1-23.
[3] P. Katulanda, P. Ranasinghe, R. Jayawardana, R. Sheriff and D.R. Matthews, Metabolic syndrome among Sri Lankan adults: prevalence, patterns and correlates. Diabetology & Metabolic Syndrome. 2012;4(1):24.
[4] N. Mikhail, M.S. Golub and M.L. Tuck, Obesity and hypertension. Progress in cardiovascular diseases. 1999;42(1):39-58.
[5] S.E. Kjeldsen, L. Naditch-Brule, S. Perlini, W. Zidek and C. Farsang. Increased prevalence of metabolic syndrome in uncontrolled hypertension across Europe: the Global Cardiometabolic Risk Profile in Patients with hypertension disease survey. Journal of hypertension. 2008;26(10):2064-70.

Proceedings of the 7th
YSF Symposium - 2018
133
ACCEPTABILITY AND PROXIMATE EVALUATION OF A NEW BISCUIT DEVELOPED USING Pouteria campechina [LAVULU] FRUIT FLOUR
J.M.A.M. Sewwandi, N. Thiruchchelvan* and U.M. Aruna Kumara
Department of Post-Harvest Technology, University College of Anuradhapura, University of Vocational Technology, Sri Lanka.
*Corresponding author ([email protected])
Introduction The Pouteria campechina (Kunth) Baehni (Lavulu or Yellow sapote) belongs to the family Sapotaceae. It is an underutilized fruit crop and commonly grown in Sri Lankan home gardens [1]. Lavulu are quite neglected as dessert fruit by the people compared to other tropical fruits. But it has high amount of nutrients compared with other major fruits. This fruit contains high amount of beta-carotene, iron, calcium and protein. In additions, it has many medicinal values such as beta carotene highly effect on the eye vision of human. Therefore, a study was undertaken to establish the processing procedure of Lavulu biscuit and evaluate their organoleptic and nutritional properties.
Materials and Methods The experimental studies were carried out in laboratories of Post Harvest Technology, University College of Anuradhapura, University of Vocational Technology, Sri Lanka.
Development of processing parameters Lavulu fruit flour (LF) was prepared as follows; Properly mature ripe Lavulu fruits were washed, peeled, sliced and then dried at 60
oC and 36 h and then grinded. Six different
ratios of Lavulu fruit flour: Rice flour (RF) were used for the production of biscuits with other ingredients mentioned in table 1. Prepared biscuits samples were baked at 150
oC
in 20 minutes.
Table1: Different recipes for the biscuits preparation
Ingredients T1 (Control)
T2 T3 T4 T5 T6
Lavulu Flour (LF) (g)* 00 [00] 75 [25] 100 [33.3] 150 [50] 225 [75] 300 [100] Rice Flour (RF) (g)* 300 [100] 225 [75] 200 [66.6] 150 [50] 75 [25] 00 [00] Sugar (g) 125 125 125 125 125 125 Margarine (g) 75 75 75 75 75 75 Desiccated Coconut (g) 40 40 40 40 40 40 Egg 02 02 02 02 02 02 Milk Powder (g) 10 10 10 10 10 10 Ginger (g) 10 10 10 10 10 10 Baking powder (g) 2.5 2.5 2.5 2.5 2.5 2.5 Baking soda (g) 2.5 2.5 2.5 2.5 2.5 2.5 Vanilla (g) 03 03 03 03 03 03 Water (ml) 25 25 25 25 25 25
*Values indicated in the parenthesis are percentage (%)
Acceptability evaluation of the developed products All the six different treatment samples were tested for appearance, colour, taste, texture, aroma and overall acceptability by a sensory panel consisting of 30 panelists with a nine point hedonic scale [2, 3]. Gathered data were analyzed by the Kruskal –Wallis test of the MINITAB statistical package. From the sensory evaluation; best biscuit was selected for the proximate analysis and storage studies.

Proceedings of the 7th
YSF Symposium - 2018
134
Proximate analysis for the selected biscuit from the sensory evaluations Crude ash, and crude fat content of the developed biscuit product was determined using triplicates according to the standard methods of AOAC [4]. Moisture percentage, Acid insoluble ash and acidity of extracted fat content of the developed biscuit was determined using the methods described by Sri Lanka Standards Institute (SLS) [5]
Result and Discussion Acceptability by the people through a sensory panel results revealed in figure1. T4 (50% LF), T5 (75% LF) and T6 (100% LF) treatments were significantly different from the control T1 (100% RF). All tested parameters such as appearance, colour, texture, aroma, taste and overall acceptability (P-value (pv) <0.05). And they ranked as non-acceptable category by the people. Appearance (pv 0.130), colour (pv 0.058), taste (pv 0.918) and overall acceptability (pv 0.074) were not significantly different for the treatments T3 (33% LF) and control T1. But aroma and texture of T3 significantly different from the control. T2 (25% LF) compared with control T1; aroma (pv 0.160) and taste (pv 0.387) were not significantly different and other parameters were significantly different from the control. Sensory evaluation was resulted T3 is the best biscuit recipe amongst tested samples. Therefore T3 is selected for the further studies.
Figure1: Compressions of the sensory parameters with different ratios of Lavulu flour added biscuit products with rice flour biscuit
Proximate analysis of the biscuits for the SLS Standard Quality analysis of the selected biscuit compositions were revealed in the table2. As per the Sri Lankan Standard (SLS 251:1991) [5] the maximum moisture percentage which biscuits should contain is 6 %, acid insoluble ash is 0.05 % and acidity of extracted fat is 1 %. Newly developed Lavulu based biscuit consist the moisture 3.06 %, acid Insoluble ash 0.012 % and acidity of extracted fat 0.041 %. It is clearly said that, developed biscuit qualities are tally with the Sri Lankan standard (SLS 251:1991).
0
2
4
6
8Apperance
Colour
Aroma
Texture
Taste
Overall
T1 [C] T2 T3 T4 T5 T6

Proceedings of the 7th
YSF Symposium - 2018
135
Table2: Quality analysis of the biscuit from the Lavulu flour (Dry basis)
Quality parameters *Percentage (%)
Ash 1.581±0.187
Fat 15.79±0.048
Moisture 3.067±0.058
Acid insoluble Ash 0.012±0.003
Acidity of extracted fat 0.041±0.005
*All the values are the means of the triplicates (± standard deviation)
Conclusions and Recommendations Lavulu flour with rice flour ratio of 1:2 [33.3 %: 66.6 %] is the best combination for the biscuit production and it’s mostly accepted by people and yielded the best quality matched with Sri Lankan standard (SLS), even though need to have a complete nutritional analysis for the nutrients composition and evaluation of storage ability of biscuits essential for a marketable product in future.
References [1] D.K.N.G. Pushpakumara, LAVULU Pouteria campechiana (Kunth) Baehni. Available:
http://www.worldagroforestry.org/downloads/Publications/PDFS/BC07321.pdf [Oct. 30, 2017].
[2] K.G.L.R. Jayathunge, R.A.N.S. Kapilarathne, B.M.K.S. Thilakarathne, M.D. Fernando, K.B. Palipane, and P.H.P Prasanna. “Development of methodology for production of dehydrated tomato powder and study the acceptability of the product.” Journal of Agricultural Technology, vol. 8, no. 2, pp. 751-759, 2012.
[3] S. Srivastava, T.R. Genitha, V. Yadav. “Preparation and quality evaluation of flour and biscuit from sweet potato.” Journal of Food Processing and Technology, vol. 3, no. 12. pp. 1-5, 2012.
[4] AOAC. “Official Methods of Analysis.” Association of Official Analytical Chemist, Inc., Verginia, Vol. 2, pp. 69-81, 1990
[5] SLSI. “Sri Lankan Standards SLS 251:1991.” Sri Lanka Standards Institutions, pp. 7- 20. 1991.

Proceedings of the 7th
YSF Symposium - 2018
136
FORECASTING UNDER FIVE MORTALITY RATE IN SRI LANKA USING TIME SERIES ANALYSIS
N.Shaminy* 1Postgraduate Institute of Agriculture, University of Peradeniya,
*Corresponding author (email: [email protected])
Introduction The development of a country can be measured with health, social and economic conditions. However, health status of people in a country vitally mark the socio economic factors, and under-five mortality rate is one of the key pointer of child well-being including health status [1-3]. Fourth part of United Nations’ Millennium Development Goals (MDGs) says that for assessing and monitoring progress in child health status under five child mortality rate is the major factor [4]. Also, it has the target of reducing high rates of infant and child mortality (IMR) by two thirds to be reached by 2015 [2, 4].
UNDP Human Development Report 2004 said that Sri Lanka has been successful in reducing its infant and child mortality rates over the last half-century (MDG4). Further, in this period between 1946 to 2000, Sri Lanka has been one of successful developing countries in the world in terms of infant and child mortality reduction (WHO) The infant mortality rate fell from 141 deaths per 1,000 live births in 1946 to a mere 13 deaths per 1,000 live births by 2000 (MDG4). The vast majority of under-five deaths are caused by diseases that preventable readily or treatable with proven, cost effective and quality delivered interventions. Therefore achieving low rates of under-five mortality is of central importance for social well-being and human development. Further reduction in under-5 child mortality rate is one of the United Nations’ Millennium Development Goal to reduce the poverty and country development. At this, forecasting of child mortality rate under five age group is vital for designing the future public policy areas of economic and social concerns. Thus, this study was carried out with the objective of identifying univariate time series model of the mortality rate, under 5 (per 1,000 live births). Box-jenkins approch method is the one of the best method used to model the data to forecast the future values using the past data. Besides this background, it is necessary to measure the level of child well-being and its rate of change by a particular method [5].
Materials and Methods Secondary yearly data obtained from World Bank website (1960 to 2015) is exhibited in Figure1. It clearly show the downward trend along the year. Data were used to identify the best time series model. In model development step the dataset was tested for various smoothing techniques and ARIMA models.
In my study ARIMA model was performed in the following steps. First it divided into two part, namely, integrated component and the ARMA model. Then the ARMA model divided into two as autoregressive (AR) and moving average (MA). The ARMA model is a combination of the AR and MA represented in (1)
𝑦𝑡 = 𝛽0 + 𝛽1𝑦𝑡−1 + …………. + 𝛽𝑝𝑦𝑡−𝑝 - 𝛼1𝑢𝑡−1 - 𝛼2𝑢𝑡−2 - ………. - 𝛼𝑞𝑢𝑡−𝑞 + 𝑢𝑡 (1)
Where p & q are integers greater than or equal to zero.

Proceedings of the 7th
YSF Symposium - 2018
137
Figure1: The time series plot for the period from 1960 to 2014
The three steps of this model, such as identification, estimation and model checking are elaborated as follows. Firstly, the stationary of the time series is established next the conditional mean model for the given data is identified. For AR model the sample autorcorrelation function (ACF) tails off, whereas the partial autocorrelation function (PACF) cuts off after q number of lags. For MA process the sample ACF cuts off after q lags, but the PACF tail off, Proceed with the ARMA model. Then the model parameter are estimated by utilizing the maximum likelihood method. Finally the model checking is performed by the randomness of the residuals. The residual are required to be uncorrelated and normally distributed. Then the forecasting perform with the chosen model over the future finite time space.
Results and Discussion The outlier of the under-five child mortality (in 2004) has been adjusted using double exponential smoothing method with the parameters of α (level) = 0.647, γ (trend) = 0.251450 and with low MAPE value 6.78, which indicates greater suitability in Figure2.
Figure2: The time series plot of the smoothed U5CMR.
The ARIMA model is performed for forecasting of U5CMR. The Mean Absolute Percentage error (MAPE) is selected to be the forecasting accuracy measures.
2014200519961987197819691960
100
80
60
40
20
0
Year
mo
rtal
ity
rate
Time Series Plot of mortality rate
2014200519961987197819691960
100
80
60
40
20
0
Year
U5
CM
R
Time Series Plot of U5CMR

Proceedings of the 7th
YSF Symposium - 2018
138
𝑀𝐴𝑃𝐸 = 100
𝑛(∑ |
𝑡 − 𝑥𝑡
𝑥𝑡
|)
Where n is the number of values, 𝑥𝑡 is the actual value, 𝑡 is the forcasted value and t is time.
The ARIMA model was constructed by reducing the error, ARIMA (2, 1, 0) fitted well to the series. Therefore, demonstrates the ARIMA (2, 1, 0) model was used to forecaste the child Mortality rate, under-5 (per 1,000 live births) with lowest MAPE 0.606866 Under- five child mortality ARIMA (2, 1, 0) model by using Box-Jenkins approach.
(1-1.8217B + 0.8625 ) (1-B) = -0.07262 +
Figure3: Actual and forecaste values of U5CMR.
Figure3 illustrate the actual and the forecaste values for U5CMR for the same period and all the values of the calculated are relatively close to the actual value. As can be seen the developed ARIMA time series model for U5CMR was able to forecaste the future U5CMR values more accurately.
Figure 4. Illustration of the rate of change of under-five mortality over the last 55 years.
605550454035302520151051
100
75
50
25
0
Time
U5
CM
R
Time Series Plot for U5CMR(with forecasts and their 95% confidence limits)

Proceedings of the 7th
YSF Symposium - 2018
139
Table 1: Forecasted value of the under-5 child mortality rate.
Accordingly (Table 1), Sri Lanka has a significantly decreasing trend of the child mortality rate than would be expected on the basis. . In 2020 the under-five child mortality will be approximately 5 out of 1000 birth from the unimodal ARIMA (2, 1, 0) of Sri Lanka since it will be 7 from the model ARIMA (1, 1, 0) which is fitted for south Asian countries (5).
Conclusions and Recommendations Our study has revealed the fitted time series model by using ARIMA technique for the under-5 child mortality rate, although a serviceable representative time series model for the country is important to access the forecast accuracy using the model and quantify the forecast error
Limitation Priority areas for such analytic work are as follows: to develop better methods to assess data quality and adjust for known bias, particularly underreporting; to understand mortality patterns due to conflicts, civil unrest, and natural disasters; and to generate appropriate estimates of uncertainty around estimates. References [1] K. Hill, D. You, M. Inoue and M.Z. Oestergaard, Technical Advisory Group ofthe
United Nations Inter-agency Group for Child Mortality Estimation, ChildMortality Estimation: Accelerated Progress in Reducing Global Child Mortality, 1990–2010. PLoS Med 9(8): e1001303. 2012
[2] L. Alkema and J.R. New, Progress toward global reduction in under-five mortality: a bootstrap analysis of uncertainty in Millennium Development Goal 4 estimates. PLoS Med 2012;9:e1001355
[3] UNICEF; World Health Organization; World Bank; United Nations. Levels & trends in child mortality report 2014: estimates developed by the UN InterAgency Group for Child Mortality Estimation [2015 Feb 17]. Available:http://www.data.unicef.org/fckimages/uploads/1410869227_Child_Mortality_Report_2014.pdf.
[4] United Nations. The Millennium Development Goals Report 2011, The United Nations, New York. 2011
[5] T. K. Chakrabarty. Forecasting rate of decline in infant mortality in South Asia using random walk approximation. Interrnational Journal of Statistics in Medical Research .pp 282-209. 2014
Year Forecasted Values(Mortality rate) 2016 9.1916 2017 8.5333 2018 7.6728 2019 6.6004 2020 5.3163

Proceedings of the 7th
YSF Symposium - 2018
140
OPTIMIZATION OF THE PROTOCOL TO ASSESS THE EFFECTIVENESS OF SOLVENT EXTRACTS OF PROSPECTIVE ANTAGONISTIC PLANT SPECIES
AGAINST WHITE ROOT DISEASE OF RUBBER
M.K.R. Silva*1, T.H.P.S. Fernando1 and B.V.A. Umesha2 1
Rubber Research Institute of Sri Lanka, 2Rajarata University of Sri Lanka
*Corresponding author (email:[email protected])
Introduction
White Root Disease (WRD) caused by Rigidoporus microporus is the most serious root disease of rubber in Sri Lanka due to its fast spreading nature. There are no WRD resistant clones of rubber available and its control is very difficult [1-2]. It is found in all most all rubber-growing countries throughout the world, including Indonesia, Malaysia, Sri Lanka, Thailand, West and Central Africa.
Since 1930s, many chemicals and control measures had been tested and recommended for the control of plant diseases. The currently recommended management practices are mainly directed at preventive approaches based on the removal of the infectious source. Since 1930s many chemicals had been tested and recommended for the control of the disease and the drench application of two systematic fungicides Tebuconazole and Hexaconazole is currently recommended in control applications.
Fungicides have been known to have a negative effect on human health, cause environmental pollution and leave residues in the agricultural soil [3]. Moreover, high cost of chemical fungicides and availability limit their use by small-scale farmers. Pollution and accumulation of toxic chemicals in our food chains compels us to use non-chemical methods for disease management in agricultural crops.
Controlling the disease using a biological approach could be important in terms of cost, environmental impacts and health hazards. Based on the antibiotic content, several plant species have been identified which release antibiotic exudates and cause changes in biochemical and physical properties of the soil and reduce the infection of the white root disease. The antagonistic plants affect directly and indirectly on the development of white root fungus in the soil. The direct effect occurs due to the release of antifungal exudates from the roots of the plant. Indirect effects are caused by alterations in soil biochemical-physical properties. Furthermore, it has been revealed that the use of antagonistic plants can be integrated with the other preventive methods to increase the effectiveness in controlling white root disease. The effectiveness of planting Galangalee (Alpinia galanga), Turmeric (Curcuma domestica), Snake plant (Sansevieria trifasciata) and Cathedral bells (Kalanchoe pinnata) around three months old rubber have been reported to have a potential to protect the rubber plants from the infection of the [4].
In vitro antagonistic effect of the aqueous extracts of some local plant species has been tested and field evaluations have been carried out [5]. In those studies, some positive inhibitory effect over disease has been revealed. However, it is evident that in in vitro studies, the effectiveness of the different botanicals greatly depend on the type of solvent used for the extraction, as the extraction of the relevant compound/(s) is related to the polarity of the compound/(s) and the relevant solvent. Therefore, it is of prime importance to further clarify the potential use of these plant extracts by testing their effectiveness when extracted in different solvents. However, for the in vitro evaluation

Proceedings of the 7th
YSF Symposium - 2018
141
of the effectiveness of these plant extracts over the fungus, the extraction protocols as well as the evaluation methods have to be optimized. Therefore, this trial was carried out to compare the efficacy of the different extraction protocols as well as evaluation methods for the in vitro evaluation of the potential plant extracts in different solvents.
Materials and methods
Selection of the plant species and the preparation of the fungal material A laboratory study was conducted at the Department of Plant Pathology and
Microbiology, Rubber Research Institute of Sri Lanka, Agalawatta. Four potential antagonistic plant species: Galangalee (Alpinia galanga), Wild ginger (Curcuma xanthorrhiza), Ginger (Zingiber officinale) and Garlic (Allium sativum) were selected based on the results of previous studies. In each experiment, three concentrations of the botanicals (V/V %) i.e. 5%, 10% and 25% were tested in three solvents: Methanol, Ethanol and Diethyl ether. For each experiment, five replicates were maintained. The fungus Rigidoporus microporus (the isolate Rm2) was grown on Malt Extract Agar (MEA) at room temperature in 9cm diameter petri dishes and was maintained by periodical sub culturing throughout the study period.
Evaluation of the effectiveness of different extraction procedures In order to evaluate the inhibitory effect of each extract, extractions were prepared in two methods.
a. Preparation of the extract with dried powder
Preparation of the dried powder Freshly uprooted root pieces were cleaned thoroughly using distilled water and 70% alcohol solution. After scraping the peel, those samples were cut in to small pieces and oven dried for two days under 50
0C. Then the properly dried rhizome particles
were ground in to fine powder using a heavy duty grinder.
Solvent extraction by mechanical shaker
Six grams of oven dried powder was weighed and put in to 500 ml conical flask. Then 200 ml of solvent was added in to the same flask and sealed it by cotton plug with aluminium foil. Then whole flask was properly covered with a black polythine. Shaking was done for 8 hours by mechanical shaker and the samples were filtered by no.01 whatman filter paper to remove the trash materials remaining. Rotary evaporation was carried out to obtain the three concentrations of the botanicals (V/V %) i.e. 5%, 10% and 25%.
Preparation of extract amended media
With the extracts obtained from the powder form extraction of the solvents, the root extract amended culture media was prepared by dissolving the relevant weight of MEA within the relevant volume of plant extract and distilled water. Then the media were sterilized by autoclaving for 20 minutes at 121
0C and 15 psi.
b. Preparation of the extract by crushing the fresh plant material
Under this method, the freshly uprooted root pieces were cleaned thoroughly by using distilled water and 70% alcohol solution. After scraping the peel, they were crushed, filtered and solvent extraction was carried out with the three solvents by

Proceedings of the 7th
YSF Symposium - 2018
142
separating funnel. Then the three concentrations of the extracts were prepared by the rotary evaporation.
Assessment of the effectiveness of the different inhibition-evaluation methods This test was performed in three laboratory methods; Poisoned Food Technique (PFT) described by Schmitz in 1930 [6], Soil Fungicide Screening Test (SFST) described by Zentmeyer in 1955 [7] and with colony growth testing method in liquid medium.
a. Poisoned Food Technique Approximately 10ml of extract amended MEA was dispensed into the each petri dish. Each petri plate was inoculated at the centre of the dish with a mycelial disc of 6 mm in diameter, which was taken from the periphery of actively growing five-day-old culture of the pathogen.
Colony diameter measurement was taken starting from the third day and was continued until the sixth day. At each reading, actual diameter was obtained after subtracting 6 mm from each reading. The mean of the four- radius readings perpendicular to each other was taken as the mycelial radius of each plate. In the control experiment, the relevant volume of the respective solvent was used instead of the extract. Percent inhibitions of growth in each of the treatment were calculated with respect to the control by the equation given by Vincent (1927) [8].
The percentage of inhibition over control: I = (C - T) / C x100
Where, I = Percentage Inhibition over control C = Growth of pathogen in control T = Growth of pathogen in treatment
b. Soil Fungicide Screening Test Fifteen grams of top soil was autoclaved and placed in sterile boiling tubes. The fungus was grown on MEA medium at room temperature. A mycelial disk (6 mm diameter) was obtained from the edge of 5-day old culture was transferred to the soil surface of each tube. Another fifteen grams of sterile soil was placed over the mycelial disc. Afterwards, 10ml of the desired root extract solution was gently poured over the mud surface. In the control experiment, the relevant volume of the respective solvent was used instead of the extract.
The open ends of the tubes were covered with aluminium foil and the tubes were incubated for 24 hours at room temperature. At the end of the incubation period tubes were emptied and the mycelial discs were washed with sterile distilled water to remove any adhering mud particles. The discs were placed with the mycelial surface down, on the surface of 10ml of MEA in a petri dish, and were incubated till the colony had grown. After the incubation period, the colony diameter was measured and the percentage of inhibition over control was calculated as mentioned above.
c. Colony growth in liquid medium Mycelial discs of WRD-causing pathogen were cultured on antagonistic plant extract-amended Malt Extract (ME) medium and flasks were kept under normal light and dark conditions. The three concentrations of the extracts were prepared. In the control experiment, the relevant volume of the respective solvent was used instead of the extract. After the incubation period, the solution containing the mycelia was filtered by Whatman No: 01 filter paper and then the mycelial mat was oven dried.

Proceedings of the 7th
YSF Symposium - 2018
143
Finally, the mycelial dry weights were taken compared to mycelial dry weights grown in pure ME medium. The percentage of inhibition over control was calculated for the mycelial dry weight.
Data analysis
For all PFT, SFST and colony growth test in liquid medium, the analysis of variance was done for percentage inhibition over control using the statistical software SAS and the mean separation was done by using the tukey’s test.
Results and Discussion
When using the plant extracts in methanol and ethanol solvents, the controls already gave an inhibition in all three experiments: PFT, SFST and liquid medium experiments. Therefore, the trial proceeded with the extractions of diethyl ether.
Evaluation of the effectiveness of different extraction procedures According to the results, the extraction procedure with dried powder was effective for all three solvents. The results are presented under the next sub topic. However, when the crushing of the fresh plant material was performed, Methanol and Ethanol extracts could not be separated using the rotavapor process. According to the Roul’s law, due to the strong hydrogen bonds, the high polar solvents cannot be separated through the rotavapor process. Therefore, the preparation of the extract by crushing the plant material followed by rotavapor process is not suitable to get the plant extracts into high polar solvents.
Assessment of the effectiveness of different inhibition-evaluation methods a. PFT and SFST According to both PFT and SFST results, the percentage inhibition of four selected plant species differs from one plant to another (figures 1 and 2). Increasing the concentration from 5% to 25%, increased the inhibition percentage of all the three species except for garlic. For the concentration levels of 5% and 10%, wild ginger plant had the highest inhibition rate than galangale, ginger and garlic. However, for the 25% concentration level, both wild ginger and galangale plants showed same high inhibition value and there is a gradual increase of the inhibition rate of ginger from 5% to 25%. However, garlic showed the lowest inhibition rate than other three plant species in all concentrations. As garlic contain fat < 1%, the diethyl ether-soluble antagonistic compound content is very much low.
b. Colony growth in liquid medium
There was no significant difference between wild ginger and galangale (figure 3) for all concentration levels. For the 5% concentration levels, there was no significant difference between ginger and garlic. At 10 % concentration level ginger was different from galanagale and garlic. For the 25% concentration levels there is no significant difference between wild ginger, galangale and ginger, while Garlic shows a difference from all other three species inhibition values.
Moreover, it was noted that, under this method, the mycelial disc make a ball-like mycelial structure in the wild ginger extract-amended liquid medium. However, the Galangale extract did not form such a structure (figure 4). Due to that reason, the mycelial dry weight of wild ginger became high and the percentage inhibition became lower than in Galangalee. There are more antagonistic chemical compounds present in

Proceedings of the 7th
YSF Symposium - 2018
144
a ab a
a
a a
b
bc
a
b
c b
0102030405060708090
100
5% 10% 25%
Mea
n v
alu
e p
erce
nta
ge
inh
ibit
ion
re
lati
ve t
o c
on
tro
l (
%)
Concentration level (V/V%)
Wild Ginger
Galangale
Ginger
Garlic
a a
a
b b
a
c c
b
d d c
0
20
40
60
80
100
120
5% 10% 25%
Mea
n p
erce
nta
ge
inh
ibit
ion
re
lati
ve t
o c
on
tro
l (
%)
Concentration level (V/V%)
Wild Ginger Galangale Ginger Garlic
the diethyl ether extract of wild ginger and consequently, the pathogen might have produced rhizomorphs (an aggregative mycilial form) as a defense mechanism for the stress conditions.
Figure 1: PFT results of percentage inhibition of selected plant species at different concentration levels
Figure 2: SFST results of percentage inhibition of selected plant species for selected concentration levels
Figure 3: Percentage inhibition results of mycelial dry weight test of selected plant species for selected concentration levels
a a
a
b b
a
c c
b
d d c
0
20
40
60
80
100
120
5% 10% 25%
Mea
n p
erce
nta
ge in
hib
itio
n
rela
tive
to
co
ntr
ol
( %
)
Concentration level (V/V%)
Wild Ginger Galangale Ginger Garlic

Proceedings of the 7th
YSF Symposium - 2018
145
Conclusions and recommendations The extraction procedure with dried powder can be effectively used for the extraction of plant-origin compounds into solvents with wide range of polarity. However, crushing of the fresh plant material followed by separation cannot be used to extract botanicals into high polar solvents such as methanol and ethanol.
The percentage inhibition of a selected plant species varies in different solvents. The three tests: PFT and SFST tests can be used to evaluate the inhibitory action of the different plant species against the white root disease-causing fungus. However, liquid medium test has some complications as it shows low inhibition values due to the formation of rhizomorphs within strong inhibitory compounds.
Figure 4: Morphological differences of the mycelial disc in (a) Ether extract of wild ginger-amended ME (b) Ether extract of Galangale-amended ME.
References [1] John, K.P., 1958. Inoculation experiments with Fomes lignosus Klotzsch. J. Rubb.
Res. Inst. Malaya, 15, pp.223-229. [2] Gohet, E., Van Canh, T., Louanchi, M. and Despreaux, D., 1991. New developments
in chemical control of white root disease of Hevea brasiliensis in Africa. Crop Protection, 10(3), pp.234-238.
[3] Soytong, K., W. Srinon, K. Rattanacherdchai, S. Kanokmedhakul, and K. Kanokmedhakul. 2005.
[4] Situmorang, A., H. Suryaningtyas, and T.R. Febyanti. 2010. Control of white root disease using antagonistic plant on rubber plantation. P. 82-96. Proc. International Workshop on White Root Disease of Hevea Rubber. Colombo, Sri Lanka
[5] Silva, M.K.R., Jayasinghe, C.K. and Tennakoon, B.I., 2017. Evaluation of the antagonistic effect of different plant species on white root disease causing fungus: Rigidoporus microporus. Journal of the Rubber Research Institute of Sri Lanka, 94.
[6] Schmits, H. 1930. A suggested toximetric method for wood preservation. Industrial and Engineering Chemistry Analytical Edition 2: 361-363
[7] Zentmeyer, C. A. (1955). A laboratory method for testing soil fungicides with Phytophthora cinnamon as test organism. Phytopathology 45: 308-404
[8] Vincent, J. M. 1927. Distortion of fungal hyphae in the presence of certain inhibitors. Nature: 850
A B a b

Proceedings of the 7th
YSF Symposium - 2018
146
PRODUCTION OF QUALITY COMPOST USING LOCALLY AVAILABLE RESOURCES
A.Sivachchanthirika*, N.Gnanavelrajah Department of Agricultural chemistry, Faculty of Agriculture, University of Jaffna
*Corresponding author (email: [email protected])
Introduction Municipal Solid Waste (MSW) is a serious environmental issue in Sri Lanka. The Municipal Solid Waste generation in Sri Lanka is about 6400 tons [1]. According to the nature of Sri Lanka’s municipal solid, composting is one of the better disposal options than land filling and incineration, and it is an environmentally sound practice as well as economically viable option for our country. The use of compost is considered as an essential activity in the sustainable agriculture. Jaffna municipal council runs a commercial composting process using municipal solid waste at Kakaitheevu. However, their final product has poor quality in terms of low nitrogen and higher sand percentage (33%) [1]. Therefore, there is a need to enhance the quality of municipal solid waste compost with suitable value addition. Therefore, this study aimed to produce good quality compost, incorporating locally available resources such as cow dung, Palmyrah leaf, Gliricidia leaf, and panchagavya. Panchagavya is an organic product which is a blend of five products obtained from cow, namely dung, urine, milk curd and ghee [2]. The slow rate of composting can be enhanced by introducing appropriate microbes. As panchagavya is rich in different kinds of microbes it has been studied and found to enhance decomposition rate of composting. The objectives of present study are to identify a suitable composition of raw materials to produce commercial scale quality compost using available resources and assess the suitability of panchagavya as source of microorganisms to enhance decomposition rate.
Materials and Methods Experiment was conducted in completely randomized design with eight different treatments and three replicates. Treatments were prepared according to the C, N content of raw materials which were adjusted to initial C/N ratio of about 40:1. Treatments were, T1- municipal solid waste + Gliricidia leaf + cow dung, T2- municipal solid waste + Gliricidia leaf + cow dung + 5% panchagavya solution, T3- Palmyrah leaf + cow dung, T4-Palmyrah leaf +cow dung + 5% panchagavya solution, T5- municipal solid waste + Palmyrah leaf + cow dung, T6- municipal solid waste + Palmyrah leaf + cow dung + 5% panchaagavya solution, T7- municipal composting mixture, T8- Municipal composting mixture + 5% panchagavya solution. Panchagavya solution was prepared according to the standard procedure [2]. The treatments were composted in plastic bin for two months period. After two months, compost samples were taken from each treatment for following analysis. Total organic carbon and total nitrogen [3] were determined to calculate the C: N ratio. To determine the conversion ratio samples were passed through 4 mm sieve [1].
Statistical Analysis The data were statistically analyzed using Statistical Analysis Software version 9.1.3(SAS, 2009), and Duncan’s multiple range test was used to compare means.
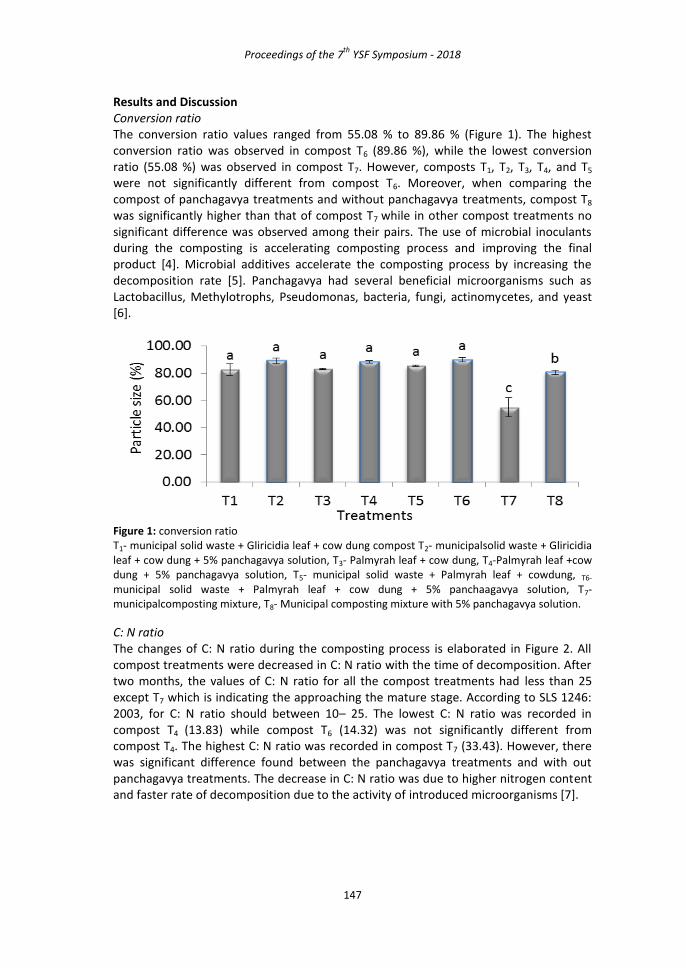
Proceedings of the 7th
YSF Symposium - 2018
147
Results and Discussion Conversion ratio The conversion ratio values ranged from 55.08 % to 89.86 % (Figure 1). The highest conversion ratio was observed in compost T6 (89.86 %), while the lowest conversion ratio (55.08 %) was observed in compost T7. However, composts T1, T2, T3, T4, and T5 were not significantly different from compost T6. Moreover, when comparing the compost of panchagavya treatments and without panchagavya treatments, compost T8 was significantly higher than that of compost T7 while in other compost treatments no significant difference was observed among their pairs. The use of microbial inoculants during the composting is accelerating composting process and improving the final product [4]. Microbial additives accelerate the composting process by increasing the decomposition rate [5]. Panchagavya had several beneficial microorganisms such as Lactobacillus, Methylotrophs, Pseudomonas, bacteria, fungi, actinomycetes, and yeast [6].
Figure 1: conversion ratio
T1- municipal solid waste + Gliricidia leaf + cow dung compost T2- municipalsolid waste + Gliricidia leaf + cow dung + 5% panchagavya solution, T3- Palmyrah leaf + cow dung, T4-Palmyrah leaf +cow dung + 5% panchagavya solution, T5- municipal solid waste + Palmyrah leaf + cowdung, T6- municipal solid waste + Palmyrah leaf + cow dung + 5% panchaagavya solution, T7- municipalcomposting mixture, T8- Municipal composting mixture with 5% panchagavya solution.
C: N ratio The changes of C: N ratio during the composting process is elaborated in Figure 2. All compost treatments were decreased in C: N ratio with the time of decomposition. After two months, the values of C: N ratio for all the compost treatments had less than 25 except T7 which is indicating the approaching the mature stage. According to SLS 1246: 2003, for C: N ratio should between 10– 25. The lowest C: N ratio was recorded in compost T4 (13.83) while compost T6 (14.32) was not significantly different from compost T4. The highest C: N ratio was recorded in compost T7 (33.43). However, there was significant difference found between the panchagavya treatments and with out panchagavya treatments. The decrease in C: N ratio was due to higher nitrogen content and faster rate of decomposition due to the activity of introduced microorganisms [7].

Proceedings of the 7th
YSF Symposium - 2018
148
Figure 2: C: N ratio T1- municipal solid waste + Gliricidia leaf + cow dung compost T2- municipalsolid waste + Gliricidia leaf + cow dung + 5% panchagavya solution, T3- Palmyrah leaf + cow dung, T4-Palmyrah leaf +cow dung + 5% panchagavya solution, T5- municipal solid waste + Palmyrah leaf + cowdung, T6- municipal solid waste + Palmyrah leaf + cow dung + 5% panchaagavya solution, T7- municipalcomposting mixture, T8- Municipal composting mixture with 5% panchagavya solution.
Conclusions and Recommendations According to the result obtained from conversion ratio in terms of particle size, it revealed that use of panchagavya does help to increase the decomposition compared without panchagavya application. Out of eight different compost treatments, the lowest C/ N ratio and the highest decomposition rate were recorded in municipal solid waste + Palmyrah leaf + cow dung + 5% panchaagavya solution combination (T6) compost. Depending on the availability of raw materials individuals or organizations could adopt appropriate treatments and produce quality compost.
References [1] N. Kannan, M. Prabhaharan, and V. Jeyapiratha, Field trail of enriched compost in
redyellow latosol of Jaffna Peninsula, Sri Lanka. Am-Euras.J.Agric. & Environ. Sci., 7 (4): pp. 370- 373, 2010.
[2] K. Natarajan, Panchagavya – manual. Other India Press, Mapusa, Goa, India. 33, 2002
[3] Y.P. Kalra, Methods used for soil, plant and water analysis at the soils laboratory of the Manitoba. Saskatchewan region, 1967- 1970. Environ. Can., Can.For. Res. Cent., Edmonton, Alberta, Canada. Inf. Rep. 6935-2, 1971.
[4] N.D.Q. Ribeiro, T.P. Souza, L.M.A.S. Costa, C.P. Castro and E.S. Dias, Microbial additives in the composting process. Ciência e Agrotecnologia, 41(2): 159- 168, 2017
[5] L.Y. Lim, L.S. Chua and C.T. Lee, Effects of microbial additive on the physiochemical and biological properties of oil palm empty fruit bunch compost. Journal of Engineering Science and Technology, 10- 18, 2015
[6] M. Maheswari, P. Dhevagi, C. Udayasoorian and S. Natarajan, Panchagavya commercial input in agriculture. Proceeding on Nation. Conf. on Glory of Gomatha, Dec. 1-3, 2007, S.V. Veterinary uni., Tirupati, A.P., 41- 45, 2007
[7] C.K. Manjunatha and M.V. Ravi, Evaluation of quality and nutrient status of enriched compost. IOSR Journal of Agriculture and Veterinary Science, 6 (2):19- 23, 2013

Proceedings of the 7th
YSF Symposium - 2018
149
EVALUATION OF TRADITIONAL PRACTICES TO MANAGE Callosobruches sp. (PULSE BEETLE) IN BLACK GRAMS' STORAGE
W.G Sunethra, U.M. Aruna Kumara and N. Thiruchchelvan*
Department of Post-Harvest Technology, University College of Anuradhapura, University of Vocational Technology, Sri Lanka.
*Corresponding author ([email protected])
Introduction Black gram (Vigna mungo) is an important pulse crop in Sri Lanka and excellent source of protein. It is used as human food because, it is rich in protein and easily digestible [1]. Black gram is damaged by several pests and diseases, especially during storage. Post-harvest losses and quality deterioration, caused by storage pests, are major problems throughout the world. Though chemical control of stored product pest is predominant, traditional pest control techniques are still practiced especially in rural areas. Most plants may provide potential alternatives to the currently used chemical control as they constitute a rich source of bioactive molecules. Plants or plant based materials with insecticidal properties have been used traditionally for generations in the history [2]. Traditional treatments are particularly relevant for small scale subsistence farmers during postharvest storage of their commodities. In this context botanicals have many advantages over synthetic pesticides because they are normally gathered locally by producers and can provide an inexpensive method of pest control during storage [3]. For the majority of farmers in the world, commercial insecticides are often too costly. Similarly many uneducated producers use synthetic pesticides inappropriately leading to environmental and human safety hazards as well as promoting insecticide resistance. For this reason a research study was conducted using traditional practices to manage the storage pests of black gram.
Methodology Experimental site and design A series of experiments were conducted at the laboratory of the Department of Post-harvest technology, University College of Anuradhapura, University of Vocational Technology, Sri Lanka. The mean ambient temperature and the relative humidity during the experimental period were 30.5±2
0C and 65±10 %, respectively.
Experiment 01- Plant leaves Plants leaves of Azadirachta indic (neem), Vitex nigundo(nika), Citrus macroptera (citrus) and Ocimum teniflorum (thulsi) were collected and dried under the shade for two days. 10g of dried leaves were mixed with 50g of black gram (1:5 ratio) in storage chamber.
Experiment 2- Ashes 10g of ash from different sources such as cow dung, paddy husk, neem wood, Strychnosnux-vomica (kaduru) wood ash were separately mixed with 50 g black gram.
Experiment 3 Another experiment was arranged with black gram mixed with sea sand, dried chili, coconut oil and camphor. The sea sand were used 1:2 ratio and 10g of dried chili small pieces, 2ml of coconut oil ,5g of camphor pieces and these all the treatments applied in to 50g of black gram containers.

Proceedings of the 7th
YSF Symposium - 2018
150
All these treatments were set up to check the field infestation of pests affect to black gram storage. Experiments were designed using plastic containers (24 cm diameter 12cm height) with tight fitting lids were used as storage chambers to prevent pests infestation during storage. All the experiments were set up to with a non-treated control. Every treatments replicated four times. Then, daily monitoring for the pest development and pest damage, total pests count were observed and recorded up to three months of time. Gathered data were analyzed according to the one-way ANOVA and means separation was done by Fisher LSD method using MINITAB ver17.
Results and Discussion Results revealed that, from the experiment 01, live pest in all the leaves treatments significantly different from the non-treated control (table1) and the least development of the Pulse beetle (Callosobruchus sp.) population was found in neem. (DG 2.75±0.5), (LP 1.5±0.57) & (DP 0.75±0.95) but in non-treated control (NTC) LP, DP and DG were 287.3±12.05, 59.3±2.68 and 345.5±13.84 respectively. Disna and Rohan [4] Reported, ethanol extracts of neem and thulsi leaves are effective against legumes storage pests’ control. Table2 revealed that, all the ashes significantly different from the non-treated control in terms of LP, among that Kaduru wood ash yielded the maximum control of pest (LP 9±1.55), (DG 41±7.65) and NTC shown LP 444±22.3 & DG 567±29.1.Third experiment (Table3) Coconut oil completely prohibited as zero pest as zero damage and next to that camphor yielded 2.5±1 LP, 0.0 DP and 2.5±0.577 DG. But in NTC shown LP 322.8±10.66, DP 85±12.44 and DG 411.5±11.53. Table1: Efficacy of the different leaves against storage pests of the black gram
Treatments (Leaves) Live pests (LP) Dead pests (DP) Damage Grains (DG) Neem 1.5±0.57c 0.75±0.95b 2.75±0.5b Vitex 176±9.3ab 162.5±6.1a 339.3±14.4a Citrus 64.3±12.6bc 98.5±19.5ab 165±32.8ab
Thulasi 156.3±13.8abc 147.3±12.1ab 302±25.6ab Control (Non treated) 287.3±12.05a 59.3±2.68ab 345±13.84a
All the values are the means of the four replicates (±Standard deviations), values that is contains same letter in a same column not significantly different according to the Fisher LSD method at 95% Confidence interval
Table2: Effect of the different ashes from different sources against storage pest of the black gram
Treatments (Ash) Live pests (LP) Dead pests (DP) Damage Grains (DG) Cow dung 16.5±3.03c 39.3±7.58b 55.8±10.6c
Paddy husk 41±4.9bc 89±11.09ab 130.3±16.1bc Neem wood 201.3±14.5b 211±16.12a 359±26ab
Kaduru wood 9±1.55c 29±5.53b 41±7.6c Control (Non treated) 444±22.3a 126±7.46ab 567±29.1a
All the values are the means of the four replicates (±Standard deviations), values that is contains same letter in a same column not significantly different according to the Fisher LSD method at 95% Confidence interval.
Table3: Effect of the different treatments against storage pest of the black gram
Treatments Live pests (LP) Dead pests (DP) Damage Grains (DG) Sea sand 93.3±5.6bc 103±6.71ab 201±12.53ab Dried chili 159.3±12.2b 196±14.9a 357±27.3a Coconut oil 0.0±0c 0.0±0b 0.0±0b Camphor 2.5±1c 0.0±0b 2.5±0.577b Control (Non treated) 322±10.66a 85±12.44ab 411±11.53a
All the values are the means of the four replicates (±Standard deviations), values that is contains same letter in a same column not significantly different according to the Fisher LSD method at 95% Confidence interval

Proceedings of the 7th
YSF Symposium - 2018
151
Conclusions and recommendations Black gram storage pests can be managed by adding neem leaves or camphor or mixing with Kaduru ash. However, coating of black gram with coconut oil is the best control method as no pest attack over a period of three months. References [1] B. Saminathan. “Effect of Chromium studies on germination and Bio chemical
content of Black gram (Vigna mungo (L.) Hepper.).” International Journal of Advanced Research, Vol. 1, no. 7, pp. 216-222, 2013.
[2] F. A. Talukder. “Plant products as potential stored product insect management agents–a mini review,” Emirates Journal of Agricultural Science, vol. 18, pp. 17–32, 2006.
[3] S.Rajendran and V. Sriranjini. “Plant products as fumigants for stored-product insect control,” Journal of Stored Products Research, vol. 44, no. 2, pp. 126–135, 2008.
[4] D. Ratnasekera and R. Rajapakse. “The potential use of indigenous plant materials against Callosobruchus chinensisL. and Callosobruchus maculatus L. (Coleoptera, Bruchidae) in stored legumes in Sri Lanka.” Journal of Bio pesticides, vol. 5, pp. 88-94, 2012.

Proceedings of the 7th
YSF Symposium - 2018
152
THE EFFECT OF GAMMA IRRADITION ON OXIDATION AND HYDROLYSIS OF LIPIDS IN YELLOWFIN TUNA FISH MUSCLES
I.H.W.Surendra*1, E.M.R.K.B.Edirisinghe1 and R.M.N.P.Rathnayake2
1Department of Physical Sciences, Faculty of Applied Sciences, Rajarata University of Sri
Lanka, Mihintale, Sri Lanka, 2Sri Lanka Gamma Center, Atomic Energy Board of Sri Lanka, Biyagama, Sri Lanka
*Corresponding author (email:[email protected])
Introduction Food irradiation technology is a technology that improves the safety and extends the shelf life of foods such as pasteurization, canning and freezing methods. The difference is that gamma irradiation is using ionizing energy while other methods using heat energy. It applied for diverse food problems such as sprouting potatoes, insect formation in seeds and early maturation of fruits. Several studies have been reported that gamma irradiation in low doses under 10 kGy kill most microorganisms without deterioration of food quality.
Fresh and processed fish is an ever-increasing demand food product in global due to its nutritional value. Fish is a good source of the long chain n-3 polyunsaturated fatty acids (PUFAs), mainly docosahexaenoic acid (DHA) and eicosapentaenoic acid (EPA). In general cooking, thermal treatment and higher storage temperature are known to increase the susceptibility of PUFAs toward lipid oxidation. Since these fatty acids available in high amount only in sea food, it is necessary to ensure the stability of fatty acids throughout to the consumer. Tuna and tuna like species are contain high global economic value and prevalence in international trade for canning and sashimi. Yellowfin tuna (Thunnus albacares) are large pelagic fish which are commercially important in many countries due to its high demand from international market.
Since the novel technologies have been introduced, such as gamma irradiation, the resources have to be used for the sustainable development in food industry. The objective of this study was to use gamma irradiation technique and assess the effect followed by storage in ice on lipid deterioration of yellowfin tuna fish muscle.
Materials and Methods Fish Samples Fresh yellowfin tuna (Thunnus albacares) used in this study were collected from Trincomalee landing site, 2017. Samples were degutted, deheaded and filleted and packed in sealed polythene bags and kept on polystyrene boxes with ice for irradiation.
Gamma Irradiation Irradiation was conducted in Sri Lanka Gamma Center at Biyagama, using a Cobalt 60 radioactive welding chisels. The given irradiation doses were 1 and 3 kGy and the absorbed doses were measured by polymethyl methacrylate (PMMA) dosimeters. Fish samples were maintained at 0 ± 2 ˚C during irradiation by using ice packaging in polystyrene box. Control fish samples were kept in polystyrene boxes with ice at ambient temperature of 25 ± 2 ˚C. After the irradiation all samples were stored in ice at 4 ± 1 ˚C temperature and were examined at 0, 7, 14, 21, 28 and 35 days of storage periods.

Proceedings of the 7th
YSF Symposium - 2018
153
Lipid Extraction Lipid was extracted by Bligh and Dyer (1959) method. Sample (25 g) was homogenised with 75 mL of a methanol: chloroform mixer (50:25) for 2 minutes. The homogenate was added with 25 mL of chloroform and homogenised for 30s. Then 25 mL of distilled water were added and homogenised again for 30 s. The homogenate was centrifuged at 3000 rpm for 15 min. The chloroform phase was drained off into a 50 mL volumetric flask and top up with chloroform.
Peroxide Value (PV) The peroxide value was determined according to AOAC method [1]. The chloroform extract of lipids was mixed with acetic acid and saturated potassium iodide, and then titrated with standard sodium thiosulphate solution with the presence of starch.
Thiobarbituric Acid Value (TBA) The acid extraction TBA method was performed as described in Lynch and Frei [2]. Sample was homogenised with potassium chloride and BHT (Butylated Hydroxy Toluene). The homogenate was incubated with TBA (Thiobarbituric acid) and trichloroacetic acid in a boiling water bath for 10 min. After cooling at room temperature for 20 min, the pink chromogen was extracted with n-butanol and its absorbance was measured at 532 nm. .
Free Fatty Acid Value (FFA) Free Fatty acid values were determined by using titration method with standard sodium hydroxide solution according to the method describe in AOAC method [3].
Statistical Analysis Comparison of lipid oxidation in different irradiation dose over storage time was performed using a general linear model- factorial analysis of variance (ANOVA) and significant differences (p < 0.05) among doses were determined. Multiple comparisons were carried out by the Fisher pairwise comparison. All statistical treatment was done with the software Minitab, version 17.
Results and Discussion Lipid deterioration is one of the main cause for low shelf life of fatty fish due to the progress in oxidation and hydrolysis of fatty acids in fish. The stability of lipids in yellowfin tuna during storage in ice was evaluated by assessing peroxide value and thiobarbituric acid values. Figure 1 shows that immediately after irradiation the peroxide values were significantly reduced (P<0.05) with respect to the irradiation dose. There was an increase in PV up to a certain point during storage period, followed by a decrease in these values to certain stage with the storage period. Results showed that all irradiated and control samples were generally increase PV with storage time up to 28 days of storage followed by a sudden decrease for all except for the control. Beside all sample varieties, 3 kGy irradiated tuna muscle showed highest PV value (210.53 meq O2 kg
-1 of meat) while 1 kGy irradiated and control samples showed 132.35 and 87.30 meq
O2 kg-1
of meat respectively.

Proceedings of the 7th
YSF Symposium - 2018
154
Figure 1. Effect of gamma irradiation and storage period on peroxide value of tuna fish muscle (mean ± standard deviation)
Figure 2. Effect of gamma irradiation and storage in ice on TBA value of tuna fish muscle
Figure 2 shows that TBA value was decreased with the storage time period. The formation of TBA followed a similar trend as PV in immediately after irradiation. It showed a reduction of formation of TBA at 0 days of storage in irradiated samples than control samples. According to the results, after the 7
th day of storage 3 kGy irradiated
tuna showed general increase with storage period up to 21 days of storage period, but the value obtained was not exceeded the value obtained at 0 days of storage in control

Proceedings of the 7th
YSF Symposium - 2018
155
tuna sample. In contrast, 1 kGy irradiated samples showed reduction with storage up to 28 days of storage period and then increased with the storage. However, the highest values were observed at 0 days, 35 days and 21 days at control, 1 kGy and 3 kGy irradiated tuna muscles respectively. The increase in TBA value during storage may be attributed to the increase of oxidation of unsaturated fatty acids. The reduction of TBA value after the highest value obtained in the process may be due to the meat slow down the process of lipolysis and thus may lead to the lower levels of lipid peroxides. Therefore, it can be effect for both processes in lipid oxidation, as well as the influence of the storage conditions, the irradiation dose and the type of fish. Lipid oxidation is a complex autocatalytic procedure operating in two phases. In first phase, the initial products of oxidation are obtained such as peroxides and conjugated dienes. During second phase, lipid oxidation is attributed to the combination of free radicals with O2 to form hydro peroxides. Due to the high reactivity combined with unstability of the products, they decompose to aldehydes, ketones, alcohols, acids or hydrocarbons. These secondary oxidation products which can change fish quality. One of the most important products of oxidation is malondialdehyde (MDA), which is susceptible to be a carcinogenic initiator and mutagen.
Figure 3. Increase of Free Fatty Acid (FFA) Content of Control, 1 kGy and 3 kGy irradiated Tuna fish muscle stored in ice (mean ± standard deviation)
The results of in this study revealed that both irradiation and storage bring an increase of lipid oxidation in tuna fish muscles. This observation is in agreement with results of irradiated meatballs during storage [4] and study about the effect of brine concentration on lipid oxidation and fatty acid profile of hot smoked tuna stored at refrigerated temperature [5].
Hydrolysis of ester bonds in lipids by enzymatic action or heating in the presence of water liberates free fatty acids (FFA). The accumulation of FFA during the processing or storage of fish influences the quality of the final fish quality and the period of useful life.

Proceedings of the 7th
YSF Symposium - 2018
156
Figure 3 illustrates the variation of FFA value of gamma irradiated tuna fish muscle with respect to control sample stored in ice for 35 days of storage. The formation of FFA, immediately after irradiation does not showed any significant different to the non-irradiated control samples. Generally it was increased with storage time period and showed its highest value at 28 days of storage in all sample varieties. Beside all, 1 kGy irradiated tuna sample showed highest value of FFA ( 88.12 ± 7.33 %) at 28 days of storage days while 3 kGy irradiated sample and control sample showed 74.21 ± 0.00 % and 53.15 ± 3.96 % respectively.
Conclusions and Recommendations Peroxide and FFA values were increased as the irradiation dose and storage period increased to its maximum levels and reduced with the storage time period. The results obtained in this study suggest that the lipid deterioration of yellowfin tuna fish muscle samples which were stored in ice for 35 days were not significantly effect by the gamma irradiation.
Acknowledgement Financial assistance by National Research Council (NRC) under the research grant no: NRC 15-020 is acknowledged.
References [1] AOAC 2002, Official methods of analysis of the Association of Official Analytical
Chemists, 14th ed., Arlignton, 2002. [2] S.Lynch and B. Frei. “Mechanism of copper and iron dependent oxidative
modification of human low density lipoprotein”. Journal of Lipid Research, vol .34, pp.1745-53, 1993.
[3] AOAC 1992, Official methods and recommended practices of the American Oil Chemists Society, 4
th ed., Champaingn American Oil Society, USA, 1992.
[4] U. Gecgel. “Changes in some physiochemical properties and fatty acid composition of irradiated meatballs during storage”. Journal of Food Science and Technology, vol. 50, pp.505-13, Jun 2013.
[5] N. Guizani, M.Rahman, M.Al-Ruzeigi and S. Sureshchandran. “Effects of brine concentration on lipid oxidation and fatty acids profile of hot smoked tuna (Thunnus albacares) stored at refrigerated temperature”. Journal of Food Science and Technology, vol. 51, pp.577-82, March 2014.
Proceedings of the 7th
YSF Symposium - 2018
157
CHANGES IN VALUES OF PH, TVB-N, AEROBIC BACTERIAL COUNT AND SENSORY PROPERTIES OF Penaeus semisulcatus DURING REFRIGERATED
STORAGE
S. Sutharshiny*, C. Shobana and K. Sivashanthini Department of Fisheries, University of Jaffna, Jaffna, Sri Lanka
* Corresponding Author (email: [email protected])
Introduction Shrimp fishery is considered as one of the major potential body in the fisheries sector in Sri Lanka for expansion of the economy. Wild fresh catches and processed P.semisulcatus are great commercial value all over the world and mostly consumed by the Japanese and Taiwanese. Shelf life of shrimp has become a major concern in fishing industry all over the world. As shellfish products are usually highly perishable, their quality decreases quickly after death due to chemical reactions (such as lipid fractions and the formation of biogenic amines and hypoxanthine) and microbiological spoilage [1]. Preservation of shellfish in refrigerator is one of the most efficient ways of retarding spoilage in order to extend its shelf life and to limit microbial and enzymatic activity. The value of chemical, physical and microbial are considered to be a useful indicator of the limit of shrimp acceptability in order to increase fish exports and foreign exchange earnings.
Though there are some studies on shelf life of fishery products, studies on P.semisulcatus in Sri Lanka are still not elucidated so far. Therefore, the aim of the present study was to investigate the shelf life and freshness quality of P.semisulcatus refrigerated storage in terms of sensory, microbiological and chemical changes in order to address baseline information on limit of storage of shrimp in the Freezer compartment of refrigerator.
Methodology Shrimp collection and storage Freshly caught shrimps at a weight of 60 – 80 g shrimps / kg and a total length of 15 – 20 cm shrimps / kg were purchased at the auction market in Jaffna Peninsula during the period of January to November 2016 and transported to the laboratory. The shrimps were washed and cleaned in flowing water and beheaded, peeled and deveined. It was placed in sterile Reynolds zipper polythene bags and distributed uniformly in the freezer compartment of refrigerator at -2
oC
to 0
0 C with shrimp/crushed ice ratio of 1: 2 (W/W)
for up to 19 days.
Using standard methods, sensory, microbiological, chemical and physical analysis for each were performed on days 0, 2, 5, 7, 9, 12, 15 and 19. On the day of analysis, six specimens were taken randomly. Of these six specimens, three were used for sensory analysis and reused to chemical and physical analysis. The other three were used for microbiological analysis. The specimens were allowed to thaw by water immersion method.
Sensory analysis Sensory analysis on the basis of general appearance, flesh colour, texture and odour of shrimp was performed by a sensory panel of six experienced assessors. The guidelines

Proceedings of the 7th
YSF Symposium - 2018
158
used to assess the quality are given in Table 1. The sensory scale was applied on whole samples from day 0 to day on which until fish spoiled, in order to obtain quality index score. Each attribute is scored from 0 to 5, where 0 represented best quality and any higher score indicated poorer quality.
Table 1: QIM scheme for sensory evaluation of P.semisulcatus
Determination of Total volatile base nitrogen (TVB-N) Hundred g of flesh of each sample were homogenized with 200 ml of 7.5 % (v/v) aqueous trichloroacetic acid (TCA) solution in a blender for 1 min. The homogenate sample was centrifuged at 3000 rpm for 5 min and the supernatant liquid was filtered using suction pump. A 25 milliliter of the filtrate was loaded into a Kjeldahl distillation tube, followed by 5 ml of 10 % (w/v) aqueous NaOH solution. Steam-distillation was performed using a vertical steam-distillation unit, and the distillate was received into a beaker containing 15 ml of 4 % (v/v) aqueous boric acid solution up to a final volume of 50 ml. The titration was performed against aqueous 0.5 N Sulphuric acid solution.
Physical analysis The samples were homogenized in distilled water in the ratio 1: 10 (W/V). The pH of fillet was determined using a pH meter
Microbiological analysis A 25 g of shrimp was transferred to a blender. Peptone water (225 ml of 0.1 %) with salt (NaCl, 0.85 % [W/V]) was added, and the mixture was homogenized for 60 s. Serial dilution was carried out and 0.1 ml of sample was spread on Nutrient Agar Medium under aseptic conditions. Plates were incubated at 37
0C for 24-48 hrs. Three replicates
were also made. Aerobic bacterial count was made after incubation and the results were expressed as log CFU/g.
Statistical analysis The data were statistically analyzed using SPSS Software, version 10 (Stat Soft, Inc. 1995, Tulsa, OK, USA). The data were checked for normal distribution with one sample Kolmogorov-Smirnov test and the variances were checked in the Levene’s test for
Quality characteristics Description Score
General appearance Bright shining and iridescent Slight dullness and loss of brightness Definite dullness and loss of brightness Dull
0 1 3 4
Flesh Colour White colour of fresh prawn Slight pink colour Pink colour Dull/discolour
0 1 3 5
Texture Firm, consistent and elastic Moderately soft and some loss of elasticity Some softening Soft and Watery Flesh with juice
0 1 2 3 5
Odour Fresh sea odour Neutral odour Slight off odour Ammonicalodour Rotten odour
0 1 2 3 5

Proceedings of the 7th
YSF Symposium - 2018
159
0
2
4
6
8
10
12
14
16
18
20
Day 0 Day2 Day 5 Day7 Day 9 Day 12 Day 15 Day 19
Tota
l de
me
rit
sco
re
Storage Time (Days)
homogeneity. Then the data were analyzed by one way Analysis of Variance (ANOVA). Significant differences were defined as p < 0.05.
Results and Discussion Sensory evaluation The sum of demerit scores of stored P.semisulcatus is shown in Figure 1. The initial quality characteristics scores of the fresh shrimp were 0 and it was increased with storage time. The panelists indicated the shrimps stored for the first three days had excellent quality and acceptable condition was found until 9
th day of storage. On 12
thday
the quality was found completely deteriorated and crossed the point of rejection. The acceptability of stored P.semisulcatus for human consumption was found up to on the 9
thday of storage. Shamshad (1990) [2] recorded the shelf life of shrimp from 7 hours at
35ºC to 13 days at 00C.
Figure 1: Sensory assessment of P.semisulcatus stored in Freezer compartment of Refrigerator
Changes in pH values Table 2 shows the values of mean and standard deviation of pH of P.semisulcatus stored in Freezer compartment of refrigerator at -2
0C to 0
0C during 19 days. The initial pH value
of fresh shrimp was measured to be at 6.65 ± 0.31 and the end pH value was 8.25 ± 0.34 during storage for 19 days in refrigerator and there were significant differences (p = 0.02) from the initial values to the end of storage period. Due to the formation of basic compounds by the enzymatic degradation after death of animal, the pH values will be more or less constant / slightly increase. pH values ranged between 6.65 ± 0.31and 8.25 ± 0.34 and the value of preserved shrimps reached to 7.07 ± 0.81 on the 9
th day. A
relationship between pH and acceptability of shrimps in a study by Shamshad (1990) [2] showed that when pH reached above 7.5 the shrimp were rated unacceptable or spoiled.

Proceedings of the 7th
YSF Symposium - 2018
160
Changes of Total Volatile Base Nitrogen Table 2 shows the values of mean and standard deviation of TVB-N of P.semisulcatus stored in refrigerator at -2
0C to 0
0C during19 days. Total volatile bases such as ammonia,
trimethylamine and to a lesser extent dimethylamine together with other volatile amines are formed during spoilage of shrimp. The value of TVB-N is significantly different between fresh and lightly preserved seafood and therefore the level of TVB-N is considered as a useful index of microbial spoilage [3].
Table 2: Values of mean and standard deviation of pH, aerobic bacterial count (log CFU/g), total volatile base nitrogen (TVB-N) (mg/ 100g) in P.semisulcatus stored in refrigerator at -2
0C to 0
0C
during19 days
Parameters Storage time (days)
0 2 5 7 9 12 15 19
pH
6.65±0.31a
6.85±0.32a
6.85±0.28a
6.96±0.72a
7.07±0.81a
7.62±1.01a
7.85±0.75a
8.25±0.34b
TVB-N
7.02±0.01a
8.42±0.01b
16.82±0.01c
25.18±0.10d
28.03±0.03e
30.24±0.54f
50.45±0.02g
176.41±0.37h
Aerobic Bacterial count
4.96±0.
13a
5.55±0.3
3a b
6.09±0.6
6b
7.11±0.5
5c
7.59±0.2
7c
9.37±0.6
2d
uncount
able
uncounta
ble
[Different letters in the same row indicate significant differences (p< 0.05)]
At the beginning of the storage, TVB-N value in the fresh P.semisulcatus was 7.02 ± 0.01 mg/ 100g of wet weight. A significant (p<0.05) increase of TVB-N values observed from the day 0 to the end of the day storage. However, the values gradually increased from day 0 to day 12 (33.71 ± 0.13 mg/100g), a sudden rise of the values found outwards of the day 12 (33.71 ± 0.13 mg/100g). Gulsun (2009) [4] proposed that the quality classification of fish and fish products regarding TVB-N values would be ‘‘high quality” up to 25 mg/100 g, ‘‘good quality” up to 30 mg/100 g, ‘‘limit of acceptability” up to 35 mg/100 g, and ‘‘spoilt” above 35 mg/100 g. In the present study, TVB-N value of P.semisulcatus at the 9
th day was 28.03 ± 0.03 mg/100g, which is the limit of
acceptability for storage. Hence, the P.semisulcatus is stored until 9 days considered for human consumption.
Changes of aerobic bacterial count Table 2 shows the values of mean and standard deviation of aerobic bacterial count of shrimps stored in refrigerator at - 2
0C to 0
0C during 19 days. There were increases in
aerobic bacterial count over the storage period and showed highly positive regression (R
2 = 0.96: Figure 2).
Initial (day 0) aerobic bacterial count of fresh shrimp samples was 4.96 ± 0.13 log CFU/g and aerobic bacterial count of fresh shrimp significantly (p < 0.05) increased during storage such that by day 5, it was 6.09± 0.66 log CFU/g, and by day 9, it reached 7.59±0.27 log CFU/g. Cadun(2005) [5] reported that the International Commission on Microbiological Specifications for Foods (ICMSF) stipulated an aerobic plate count of 7 log CFU/g for frozen shrimp. In the present study, acceptability of stored P.semisulcatus was considered until day 9 for human consumption. The value of aerobic bacterial count was a peak on day 12 and uncountable bacterial growth was observed on day 15.

Proceedings of the 7th
YSF Symposium - 2018
161
y = 0.3524x + 4.7227
R² = 0.9608
4.5
5.5
6.5
7.5
8.5
9.5
10.5
0 1 2 3 4 5 6 7 8 9 10 11 12 13 14
log
C
FU
/g
Storage time (Days)
Figure 2: Changes in aerobic bacterial count (log CFU/g) of P.semisulcatus stored in Refrigerator at - 2
0C to 0
0C
Conclusion Based on the sensory score, chemical, physical and microbiological analysis, it was concluded that P.semisulcatus has a shelf life around 9 days when stored in freezer compartment of refrigerator at - 2
0C to 0
0C.
Acknowledgement: The authors are grateful to the authorities of University of Jaffna, Sri Lanka for the financial support and facilities provided (URG/2015/01).
References: [1] Y. Ozogul, F. Ozogul and C. Gokbulut.“ Quality assessment of wild European eel
(Anguilla anguilla) stored in ice.”Food Chemistry, Vol. 95, No.3, pp. 458-465, 2006. [2] S.I. Shamsad, K. Nisa, M. Riaz, R. Zuberi and R.B. Quadri. “Shelf life of shrimp.
(Penaeusmerguiensis) stored at different temperatures.”Journal of Food Science, Vol. 55, No. 5, pp. 1201-1205, 1990.
[3] P. Dalgaard. “Fresh and lightly preserved seafood,” inShelf-life evaluation of foods, 2
nd ed., C.M.D. Man and A.A. Jones, Ed, USA: Aspen Publishing Inc., 2000, pp. 110-
139. [4] O.Gulsun, K. Esmeray, O. Serhat and O. Fatih. “Sensory, microbiological and
chemical assessment of the freshness of red mullet (Mullus barbatus) and goldband goatfish (Upeneus moluccensis) during storage in ice.” Food Chemistry, Vol. 114, pp. 505–510, 2009.
[5] A. Cadun, S. Cakli and D. Kisla. “A study of marination of deepwater pink shrimp (Parapenaeuslongirostris, Lucas, 1846) and its shelf life.”Food Chemistry, Vol. 90, pp. 53, 2005.

Proceedings of the 7th
YSF Symposium - 2018
162
DISTRIBUTION OF ENTOMOPATHOGENS IN NORTHERN SRI LANKA AND THEIR POTENTIAL AS BIO-AGENTS
N. Thiruchchelvan*1, G. Thirukkumaran2 and G. Mikunthan1 1Faculty of Graduate Studies, University of Jaffna
2Department of Agricultural Biology, Faculty of Agriculture, University of Jaffna
Jaffna, Sri Lanka *Corresponding author: ([email protected])
Introduction Entomopathogenic microbes which are naturally associated with natural and agroecosystems cause for significant mortality of the insect species. Natural mortality plays a significant role to keep the natural balance among insect populations. Better understanding of naturally occurring entomopathogens could help to develop a pest management tool, which is known as microbial pesticides. However, the naturally occurring entomopathogens particularly nematodes and fungi have been poorly studied in Sri Lanka or limited to the study of nematodes and fungi associated with wood termites and tea termites [1]. There is a great need for study of naturally occurring entomopathogens; therefore, this study was conducted with the objective of assessing the identities, distribution of entomopahogenic nematodes and fungi in Northern Sri Lanka to develop them as potential biological control agents to use in management of crop pests.
Materials and Methods Distribution of entomopathogens in Northern Sri Lanka Isolation of entomopathogenic fungi was done through a routine survey using random aerial sampling method in Northern Province of Sri Lanka (2013-2016). A fungal species was isolated from the mycosed insect cadaver at the paddy field of Government Seed production farm at Murunkan, Mannar. Pure culturing of isolated fungal species and their identification were done using fuskey [2].
Soil Sampling Totally 423 soil samples were collected from different locations of Northern Province, Sri Lanka for the isolation of entomopathogens. Vegetable fields at Jaffna and Kilinochchi districts and selected home gardens in Jaffna, Vavuniya, Mullaitivu, Mannar and Kilinochchi were visited and soil samples were collected from a depth of 15 cm [3] by using a hand shovel and augur [4]. Soil samples were transferred into separate polyethylene bags and labeled. All the samples were brought to the Laboratory of Department of Agricultural Biology, University of Jaffna and stored. Water was sprinkled to the soil samples, which were too dry, and stored overnight at room temperature [4]. Sampling sites and positive sites for the entomopathogens were mapped out using the GPS coordinates and ArcGIS software. Isolation of both fungal and nematode entomopathgens from the soil samples was done through insect baiting method as suggested by Kaya and Stock [4]. Nematode infested cadver was transferred to separate moisture chambers and few more of larva were added to enhance its multiplication. Isolated nematode culture was maintained throughout the research period with the help of life stages of Tribolium castaneum.

Proceedings of the 7th
YSF Symposium - 2018
163
Host range and potential of nematode as biological agent for pest control Host range was checked with nematodes using moisture chamber method [4]. Five of insect stages (larva or pupa or nymph or adult) were placed per Petri-dish. EPNs infective juveniles (IJs) with distilled water (3 ml) were applied topically on insect stages with the concentration of 20,000 IJs ml
-1, each sample was replicated ten times.
Mortality of insects was observed and recorded day by day up to 15 days after inoculation (DAI). Non-infested insect samples were checked repeatedly for the further confirmation.
Results and Discussion Aerial and soil samples sites were mapped out using GPS coordinates and arcGIS software (Plate 1). Nematodes infection were observed only in three samples out of 423 samples survey in Northern Sri Lanka. Nematode infection was observed in Jaffna (Kamparmalai) and Mullaithivu (Alampil and Semmalai) districts. Nematodes isolated from the Jaffna soil sample was effective and infested on tested pests listed in table1 and multiplied for further study. Jaffna nematode isolate was named as isolate jfn-1. Other two sites isolates were failed to multiply in insects. Aerial sample; fungal infected cadaver was collected from the paddy field of government seed production farm at Murunkan, Mannar. But it’s failed to infect the tested pests listed in table1.
Plate 1: Sampling sites for entomopathogens of Northern Sri Lanka, during (2013-2016)

Proceedings of the 7th
YSF Symposium - 2018
164
Isolation of mycopathogen Morphological characters of isolated fungus from a cadaver (Plate 2a) was observed as follows; White colour mycelia with cottony colony growth all over the body (Plate 2b). The mycelium was branched, septate, and production of macro and micro conidia were found when subjected the fungus under hanging drop technique. The fungus was grown well in Potato dextrose agar; however, its growth was comparable in Saboraud medium. Plate 2c explains the characters of sickle shaped macro-conidia from the isolated fungus. The conidia had clear separations with 4 - 5 Septa, and micro conidia was observed with single septae, rarely aseptate. Based on these morphological characters, the isolated fungus was identified as Fusarium sp. (Keith 1996). Pathogenicity of the isolated fungus, Fusarium was checked with major types of insect pests species (table1) applying on them topically. Fungal infection was not recorded even in one sample of tested insect and non-insect species. It may due to the heaviest drought during the years of 2013, 2014 and 2015. Nematode was yielded the superior pathogenicity than fungal pathogen. Plate 2: Entomopathogenic fungus isolated from the insect cadaver. (a) mycosed cadaver (b) Pure culture on the PDA (c) macro and micro conidia of the fungus (10X40)
Nematode isolate jfn-1 A nematode was isolated and multiplied successfully (Plate 3) and nematode infestation on insects was confirmed. Isolated nematode culture was maintained throughout the research period with the help of life stages of red flour beetle as its bait. According to the morphological and morphometric characteristics, the nematode was belonging to the Family Cephaloboideae; however, for confirmation of identity, a sample was sent to CABI, UK.
a b
c

Proceedings of the 7th
YSF Symposium - 2018
165
Entomo-pathogenic efficacy of isolate jfn-1 Host range and range of entomo-pathogenicity were checked against different insect pest stages in different insects’ order. Tested insects host ranges were listed in the table 1. Infestation of nematodes on the insect pests’ life stages such as larva or nymph, pupa and adult were tested up to 15 days after inoculation. Results revealed that order coleopteran and lepidopteran insects more susceptible for isolate jfn-1 infestation than other order of insect pest, even though tested dipteran pests failed to infest by nematodes. Isolate jfn-1 highly intent to infest on coleopteran insect pest stages such as T. castaneum and Ephilachna vigintioctopunctata. Table 1: Host range of nematode isolate jfn-1 on different insect pests
Common name Scientific name DAI Larva Pupa Adult
Coleoptera
Red flour Beetle Tribolium castaneum 3
Spotted beetle Epilachna sp. 5
Rice weevil Sitophylus oryzea 5
White grub Phyllophaga ephilida 6 - -
Bananaweevil Cosmopolites sordidus 15 X X
Black beetle Oryctes rhinoceros 15 X X
Lepidoptera
Rice moth Corcyra cephalonica 3 -
Diamond Back Moth Plutella xylostella 5 -
Brinjal Shoot and Fruit borer Leucinodes orbonalis 6 -
Moringa leaf roller Noorda blitealis 7 - -
Cabbage semilooper Thysanoplusia orichalcea 7 -
Okra fruit borer Earias vitrella 7 -
Leaf roller Epicorsia oedipodalis 7 X -
Moringa caterpillar Eupterote mollifera 9 X -
Diptera
Fruit fly (Guava) Bactrocera correcta 15 X X X
Fruit fly (Bitter gourd) Bactrocera cucurbitae 15 X X X
Phorid fly Megaselia scalaris 15 X X X
Mosquito Anopheles sp. 15 X X X
Hemiptera Nymph
Bean Aphid Aphis fabae 5
Dusky cotton bug Oxycarenus hyalipennis 5
Chili aphid Aphis sp. 5 X
Mango hopper Amritodus atkinsoni 6
Papaya Mealy Bug Paracoccus marginatus 15 X X
Tomato Mealy Bug Pseudococcus sp. 15 X X
- infestation observed, X- infestation not observed, – -not checked, DAI- Days After Inoculation

Proceedings of the 7th
YSF Symposium - 2018
166
Plate 3: Third stage nematode juveniles (IJs) emerging out from the infected pupa of Tribolium castaneum (X 40) (arrows showing the juveniles).
Conclusions and recommendations Nematode isolate jfn-1 showed high entomo-pathogenicity on major coleopteran and lepidopteran pests in Sri Lanka and the isolate jfn-1 did not infect the tested dipteran species. Due to its selective nature and being native to Sri Lanka, jfn-1 isolate has very high potential to use as a biological agent in Sri Lankan environmental conditions, especially for managing coleopteran pest populations. References [1] L.D. Amarasinghe. “Entomopathogenic nematodes from the coastal belt of Sri
Lanka and their efficacy in controlling termites.”Pest Technology, Vol. 2(2), pp. 125-129, 2008.
[2] S. Keith. “Fuskey.” [online] Available: http://caab.ctu.edu.vn/gtrinh/fuskey.pdf, 1996. [May.20, 2015]
[3] R.J. Stuart, M.E. Barbercheck, P.S. Grewal, R.A.S. Taylor and C.W. Hoy. “Population biology of entomopathogenic nematodes: Concepts, issues, and models.” Biological Control, vol.38, pp. 80–102, 2006.
[4] H.K. Kaya and S.P. Stock. “Techniques in insect nematology.” In Manual of Techniques in Insect Pathology, pp. 281-324, 1997.

Proceedings of the 7th
YSF Symposium - 2018
167
ASSESSMENT OF POTENTIAL REMOVAL OF NITRATE FROM SYNTHETIC MEDIUM BY SELECTED HEROTROPHIC BACTERIA – AN APPROACH FOR
REDUCING NITRATE IN GROUNDWATER OF JAFFNA PENINSULA
A.Thurairajah1, 2, N. Gnanavelrajah1 and R.R Ratnayake*2 1 Faculty of Agriculture, University of Jaffna, Sri Lanka
2National Institute of Fundamental Studies, Hantana Road, Kandy, Sri Lanka
*Corresponding author (email: [email protected])
Introduction The removal of nitrate in groundwater is of great interest because excessive nitrate in groundwater and surface water is a growing problem worldwide including Sri Lanka, mainly due to excessive application of fertilizers. The World Health Organization has set a limit of 11 mg/l NO3
- - N for human consumption. Consumption of excess nitrates can
have several detrimental health effects such as methahemoglobinemia, stomach cancer and adverse reproductive outcomes [2]. Groundwater is the major natural water resource in the Jaffna Peninsula, Sri Lanka, where, population is entirely dependent on the groundwater resources for all the purposes [3]. The water samples in wells where there is agricultural activity have NO3
- - N levels between 20 to 50 mg/l [4]. Though
nitrate contamination of ground water has been reported in Sri Lanka, there has been little research reported on remediation of such pollution except few phytoremediation studies [5]. Thus it is necessary to remove nitrate from groundwater resources to reduce its harm to the environment. Nitrate from the contaminated water can be removed by ion exchange, reverse osmosis, electro dialysis and some other chemical treatments. The most promising and versatile approach being studied is biological denitrification. Biological denitrification is highly selective and efficiency of the process is very high and can reach nearly 100%, which is not matched by any other methods available for nitrate reduction. Since most of the nitrate reducing bacteria are heterotrophs, source of organic carbon is an important component of the denitrification process. Usually, dissolved carbon sources, such as ethanol, methanol, acetate or glucose, are used as electron donor for nitrate reduction. The aim of the present study is to identify the applicability of five selected bacterial strains for nitrate removal in synthetic medium. The best five strains were selected based on the efficiency of nitrate removal (>50%) from nutrient broth. They were assessed for potential of reducing nitrate content in synthetic medium with glucose as a carbon source and control.
Materials and Methods Sample collection, Isolation and cultivation Environmental samples such as; compost, swine manure, soil sample from municipal solid waste dumping place, paddy soil and poultry manure were collected for isolation of denitrifying bacteria from Jaffna District. Cultures were cultivated aerobically on specific medium with glucose as sole carbon source [6].
Screening of denitrifiers Different screening criteria were used to categorize the isolated cultures and obtain the desired strains. In initial categorization cultures with dissimilar (morphology) cultural characteristics were selected and screened using their natural capabilities to degrade nitrate on BTB (Bromothymol Blue) medium with nitrate [6]. For quantification studies nutrient broth with nitrate was used.

Proceedings of the 7th
YSF Symposium - 2018
168
Nitrate reduction in synthetic medium Nitrate removal of the five selected isolates were evaluated in modified mineral salt medium (potassium dihydrogen phosphate, 0.1 gl
–1; dipotassium hydrogen phosphate,
1gl–1
; calcium chloride, 0.005 gl–1
; magnesium sulphate, 0.1 gl–1
; pH 7) with 0.5% of glucose as carbon source. In briefly, fresh culture suspensions of strains were prepared in sterile distilled water with equal density. 0.5 ml of an inoculum was inoculated to 50 ml of mineral salt medium containing 150 mg/l of KNO3 and incubated for four days at 30
oC at 120 rpm in mechanical shaker for 96 hours. The control was also kept with the
same concentration of nitrate but without carbon source and bacterial inoculum.
Analytical methods Liquid samples were drawn at 24 hours interval in aseptic condition and centrifuged at 10000 rpm for 20 minutes. The, supernatant was used for NO3
- -N analysis by using
colorimetric method [1].
Tentative identification of strains Gram staining, catalase test, motility test, glucose acid test and starch hydrolysis test were performed for tentative identification of strains.
Data analysis Statistical analysis was done by using Minitab.
Results and Discussion Isolation and culturing of bacteria In the present work, glucose was used as external carbon source for biological nitrate reduction by heterotrophic bacteria in synthetic medium. Selected five strains A2, A13, A15, A19 and GB (unidentified) were isolated from municipal compost, swine manure, municipal solid waste dumping place, paddy soil and poultry manure respectively, from Jaffna district.
Figure 1: Concentration of nitrate nitrogen in synthetic medium inoculated with five bacterial strains in four days of incubation
Nitrate removal in synthetic medium The concentration of nitrate nitrogen in the medium contains glucose treated with different strains are shown in Figure 1. A similar pattern of reduction was observed for most of the strains. The significant difference was observed in all treatments (bacteria strains) with control (21.175 mg/L) after four days of treatment. At the end of the day no significant difference was observed between the strains A19 and GB. All the strains
0
5
10
15
20
25
Initial 24hrs 48hrs 72hrs 96hrsCo
nce
ntr
atio
n o
f n
itra
te
nit
roge
n(m
g/l)
Time (hours)
A13
A15
A19
A2
GB

Proceedings of the 7th
YSF Symposium - 2018
169
reduced nitrate nitrogen below permissible level (11 mg/l). Highest reduction was observed by strain GB and A19 after four days. Strain A2 showed continuous reduction of nitrate in four days of incubation. Strain GB had highest nitrate reduction (93.7%) in 48 hours of incubation. All the strains reduced the nitrate nitrogen below permissible level (11 mg/L) at 48 hours of incubation. After 48 hours of incubation, except A2 strains, concentration of NO3
- - N started to fluctuate. This might be due to different
mechanisms for strains to perform heterotrophic nitrification and caused by the oxidation of intermediates due to brief exposure to air during sampling for analysis [7]. Tentative identification of selected five strains are summarized in Table 1 below. All five strains were observed as catalase positive, motile and gave positive result for glucose acid test.
Table 1. Tentative identification of strains
Descriptor A2 A13 A15 A19 GB Gram staining (+) (-) (+) (-) (-) Catalase test (+) (+) (+) (+) (+) Motility test (+) (+) (+) (+) (+) Glucose acid test (+) (+) (+) (+) (+)
Conclusion The experimental results showed that all the strains tested, educed the nitrate nitrogen below 11 mg/L (WHO limit) (from 21.175 mg/L of NO3
- - N) in four days of incubation
with glucose as external carbon source. Among those strain GB had highest NO3- - N
reduction (93.7%) in 48 hours of incubation. Strains A2, A19 and GB reduced NO3- - N
more than 80% in four days of incubation. Strains A13 and A15 were found to have 62.7% and 72% of nitrate reduction in four days of incubation. Possibly almost all the strains A2, A13, A15, A19 and GB could be potentially used for bioremediation of nitrate contaminated groundwater of Jaffna district.
Acknowledgement Financial assistance by National Science Foundation, Sri Lanka (NSF/SCH/2016/03).
References [1] J.M. Anderson and J.S.I. Ingram, Tropical Soil Biology and Fertility: A Handbook of
Methods. Soil Science, 157(4), 265, 1994 [2] M.H. Ward, "Workgroup report: drinking-water nitrate and health—recent findings
and research needs," Environmental health perspectives, vol. 113, p. 1607, 2005. [3] T. Jeyaruba and M. Thushyanthy, "Health hazardous: nitrate-N in groundwater and
soil in intensified agricultural areas," 2013. [4] V. Navaratnarajah, "Water problems in the Jaffna peninsula," in 20th WEDC
Conference in Affordable Water Supply and Sanitation, 1994, pp. 160-170. [5] T. Sundaralingam and N. Gnanavelrajah, "Phytoremediation potential of selected
plants for Nitrate and Phosphorus from ground water," International journal of phytoremediation, vol. 16, pp. 275-284, 2014.
[6] N. Takaya, M. A. B. Catalan-Sakairi, Y. Sakaguchi, I. Kato, Z. Zhou, and H. Shoun, "Aerobic denitrifying bacteria that produce low levels of nitrous oxide," Applied and environmental microbiology, vol. 69, pp. 3152-3157, 2003.
[7] J. Zhang, P. Wu, B. Hao, and Z. Yu, "Heterotrophic nitrification and aerobic denitrification by the bacterium Pseudomonas stutzeri YZN-001," Bioresource Technology, vol. 102, pp. 9866-9869, 2011.

Proceedings of the 7th
YSF Symposium - 2018
170
IN VITRO ANTIOXIDANT, α -AMYLASE AND α- GLUCOSIDASE ENZYMES INHIBITORY PROPERTIES OF FIVE NATIVE WILD FRUITS IN SRI LANKA
H.P.T. Wathsara1, K. W Samarakoon2, Sang-Hoon Lee3, U.Chanaka1 and P.Ranasinghe*1
1Modern Research and Development Complex, Industrial Technology Section, Sri Lanka
2National Science and Technology Commission, Colombo 8, Sri Lanka
3 Research Division for Food Industry Platform Technology, Korea Food Research
Institute, Republic of Korea. *Corresponding author (email: [email protected])
Introduction Antioxidants are the molecules which play a major role in human health as it prevents the damage, caused by free radicals. Reactive oxygen species (ROS) are the most common radicals and excessive production of ROS, impaired antioxidant system and mitochondrial dysfunction leads to the oxidative stress [1]
. This results the one of the
pathological condition diabetes where by the alteration in enzymatic systems, lipid peroxidation, impaired Glutathione metabolism and decreased Vitamin C levels. Higher plants are the potent sources of natural antioxidant which maintain the human wellbeing and combating diseases. The world health organization (WHO) promotes the use of herbal drugs to treat diabetes over the synthetic drugs to overcome the limitations and side effects, due to their potentials to reduce hyperglycemic conditions and to reduce its complications [2]. Hence the use of natural agents has become the alternative sources in western medicine. Sri Lanka is the country with a high degree of biodiversity whereas the approximately 120 species of wild fruits have been recorded and most of the wild fruits are underutilized due to the unidentified nutritional values, poor awareness, and modernization of agricultural practice. Most of the wild fruits have been used as therapeutic agents in traditional medicine. Hence the objective of the present study was to investigate in vitro antioxidant and anti-diabetic activities of five native wild fruits that could be used as a potential source for neutraceuticals.
Materials and Methods Different parts of plant materials (leaves and fruits) of native wild fruit plants including, Careya arborea(kahata), Garcinia xanthochymusis (rata goraka), Mangifera zeylanica (etamba), Passiflora foetide (padagedi) and Syzygium zeylanicum (marang) were collected from different regions around Sri Lanka in March to May 2017 and samples were authenticated. All samples were lyophilized and ground to fine powder and subjected for cold extraction in 100% methanol by sonication. The qualitative analyses of phytochemicals were estimated using standard methods. The total polyphenol content was determined by using Folin-Ciocalteu reagent method where gallic acid used as reference standard and total flavonoid content was determined by aluminium chloride colorimetric method with quercetin as reference standard. The radical scavenging activities were evaluated by DPPH radical scavenging assay and ABTS
+
decolorization assay. Inhibition of peroxy radical induced oxidation was evaluated by oxygen radical absorption capacity (ORAC) whereas ferric reducing ability was determined by using FRAP assay with modification in 96 well micro-plates [3]. Trolox used as reference standard for antioxidant activity assays and results were expressed as mg of Trolox equivalent per g of extracts. The in vitro anti-diabetic activity was assayed

Proceedings of the 7th
YSF Symposium - 2018
171
by α-amylase inhibition and α-glucosidase enzyme inhibition assays where acarbose used as standard [4]. Statistical Analysis The data expressed as mean ± SD and the significance of the difference was determined by Graph pad Prism version 6.07 for Windows. Results and Discussion The study is designed to investigate antioxidant potentials and inhibition of α-amylase and α-glucosidase enzymes. Qualitative analyses of phytochemicals showed the presence of bioactive compounds whereas the fruits of C. arborea recorded to have five types of phytochemicals (alkaloid, flavonoid, phenol, saponin and tannin). The total phenol content was ranged from 5.7 to 256.6 mg GAE/g of extract and fruits of C. arborea (256.6 ± 8.8 mg GAE/g of extract) showed highest phenolics content whereas total flavonoid content was ranged from 0.5 to 25.4 mg QE/g of extract and G. xanthochymus (25.4 ± 3.6 mg QE/g of extract) showed highest flavonoid content. Antioxidant activities were evaluated by several assays such as DPPH, ORAC, FRAP and results are shown in table 1.The DPPH free radical scavenging activities were ranged from 10.9 to 666.6 mg TE/g of extract and leaves of C. arboreafound to have highest scavenging activity with value 666.6 ± 86.4 mg TE/g of extract. The ORAC values were ranged from 29.9 to 382.4 mg TE/g of extract and highest was recorded in leaves of G. xanthochymus with value 382.4± 23.6 followed by leaves of C. arborea, leaves of S. zelanicum and leaves of M. zeylanica with values 308.1 ± 23.2, 238.8 ± 50.2 and 232.1 ± 8.7 mg TE/g of extracts respectively. Ferric reducing activities of plants ranged from 6.5 to 255.4 mg TE/g of extract and highest was recorded in fruits of C. arborea with value 255.4 ± 22.8 mg TE/g of extracts followed by leaves and fruits of M. zeylanica with values 124.8 ± 4.0 and 123.1 ± 15.4 mg TE/g of extracts respectively. All the plant samples tested for α-amylase inhibition activity showed different degree of inhibition activities (Table 2) and some plants exhibited dose dependent inhibition activities. The acarbose standard drug showed IC50 value 88.0 ± 1.4 μg/mL and crude extract of S. zelanicum leaves showed highest inhibition activity compared to acarbose with IC50 22.1 ± 1.1 μg/mL followed by fruits of S. zelanicum, leaves of C. arborea, fruits of M. zeylanica and fruits of C. arboreawith values 34.9 ± 0.1, 150.3 ± 2.5, 181.3 ± 2.1 and 265.2 ± 5.7 μg/mL respectively. This might be due to the presence of various compounds in plant extracts such as phenols, flavonoids, saponins, steroids, alkaloids and terpenoids.
The crude extracts subjected for α -glucosidase enzyme inhibition assay showed no significant inhibitions with the different concentrations tested, 400 μg/mL, 200 μg/mL and 100 μg/mL respectively.
α-amylase enzyme inhibition activity of M.zeylanica, S.zelanicum and C.arborea could be due to the presence of high polyphenol content as they possess the ability to bind with active sites of protein and alter their catalytic activity. Significant positive correlations were found versus total polyphenols - DPPH and total polyphenols - FRAP values with pearson r values 0.5223 and 0.7547 respectively. Results suggests there is a relationship with phenol concentrations and their radical scavenging ability and reducing property as their structure bears one or more aromatic rings with one or more hydroxyl groups thereby becoming stable resonance-stabilized phenoxyl radicals.

Proceedings of the 7th
YSF Symposium - 2018
172
Table 1: The total phenol content, total flavonoid content and antioxidant activities of five native wild fruits in Sri Lanka
*TPC (mg gallic acid equivalents/g of extract), **TFC (mg quercetin equivalents/g of extract), FRAP (mg Trolox equivalents/g of extract), ORAC (mg Trolox equivalents/g of extract), DPPH (mg Trolox equivalents/g of extract), Phytochemicals represent as, Alkaloids= A, Saponin=S, Tanin=T, Flavonoid=F and Phenol=P
Table 2: α -Amylase inhibition activities of five native wild fruits in Sri Lanka
*Values mentioned after ± sign, indicates standard deviation of the mean
Scientific
Name
Local Name
Part of the plant
*TPC
**TFC
DPPH
ORAC
FRAP
Phytochemica
ls M.zeylanica Etamba Leaves 186.1 ± 8.8 5.1 ± 0.5 237.8 ± 13.2 232.1 ± 8.7 124.8 ± 4.0 S,T,A,P
Fruit 111.0 ± 4.5 0.5 ± 0.1 349.7 ± 21.8 117.6 ± 15.8 123.1 ± 15.4 S,T,P P.foetide Padagedi Leaves 21.5 ± 1.6 4.3 ± 0.2 10.9 ± 1.3 46.2 ± 3.6 11.9 ± 1.5 A,S,T,P
Fruit 19.0 ± 1.1 2.5 ± 0.2 11.1 ± 1.8 29.9 ± 1.4 6.5 ± 0.3 T,F,P G.xanthochymus Rata Goraka Leaves 17.4 ± 0.6 25.4 ± 3.7 22.0 ± 1.8 382.4 ± 23.6 58.3 ± 4.4 S,F,P
Fruit 5.7 ± 0.2 3.9 ± 0.8 16.5 ± 0.3 51.5 ± 3.7 20.7 ± 4.2 A,S,F,P S.zelanicum Marang Leaves 128.7 ± 6.4 11.5 ± 0.5 32.3 ± 6.6 238.8 ± 50.2 60.0 ± 5.4 A,S,F,P
Fruit 25.7 ± 1.1 1.6 ± 0.3 13.0 ± 2.5 62.2 ± 4.5 54.2 ± 4.8 A,S,F,P C.arborea Kahata Leaves 199.9 ± 19.5 4.7 ± 0.2 666.6 ± 86.4 308.1 ± 23.3 37.8 ± 3.7 F,T,A,P
Fruit 256.6 ± 8.8 4.1 ± 0.3 366.5 ± 12.1 135.0 ± 13.5 255.4 ± 22.8 A,S,T,F,P
Scientific Name Local name Part of plant Concentration μg/mL
135 270 540
M. zeylanica Etamba Leaves 8.5 ± 1.2 37.2 ± 1.3
30.5 ± 0.5 38.9 ± 0.7
Fruit 76.1 ± 1.4 89.9 ± 1.0
P.foetide Padagedi Leaves 2.8 ± 0.4 7.7 ± 1.1 30.7 ± 1.0
Fruit 12.7 ± 0.3 12.7 ± 0.3 19.5 ± 1.3
G.xanthochymus Rata Goraka Leaves 12.7 ± 0.3 19.9 ± 1.8 30.7 ± 0.6
Fruit 6.2 ± 1.8 21.1 ± 2.7 31.0 ± 2.4
S.zelanicum Marang Leavea 87.5 ± 1.0 95.6 ± 0.3 98.7 ± 0.8
Fruit 74.7 ± 0.3 78.7 ± 0.3 82.8 ± 2.4
C.arborea Kahata Leavea 46.1 ± 0.7 66.2 ± 0.6 87.6 ± 1.0
Fruit 22.1 ± 1.2 44.3 ± 1.3 60.0 ± 0.3
Proceedings of the 7th
YSF Symposium - 2018
173
Conclusion All native plants tested in this study are rich sources of antioxidants of which Careyaarborea and Mangiferazeylanicaare most potent. Syzygium zeylanicum, Careyaarborea, and Mangiferazeylanicapossess significant anti amylase activity which may be potent sources for management of postprandial hyperglycemia. Further studies in isolation and characterization of bioactive compound in these fruit extracts are necessary.
Acknowledgement The authors are grateful to acknowledge the financial assistances by Research Division for Food Industry Platform Technology, Korea Food Research Institute, Republic of Korea under the research collaboration with Industrial technology institute, Sri Lanka, titled ‘Biological activity evaluation system assistant project for application of Sri Lanka native plants’ of the grant No100654.
References [1] S. Bajaj and A. Khan. “Antioxidants and diabetes”. Indian journal of endocrinology
and metabolism, vol. 6(Suppl 2), pp.S267, Dec.2012.
[2] B. Joseph and D.Jini, “Insight into the Hypoglycaemic Effect of Traditional Indian
Herbs used in the Treatment of Diabetes”,Medical journal of medicinal plants,
Vol.5(4),pp.352-376,2011.
[3] P. Ranasinghe, G.A. Premakumara, C.D. Wijayarathna and W.D. Ratnasooriya.
“Antioxidant activity of Caryotaurens L.(Kithul) sap”. Tropical Agricultural Research.
Vol. 24(2), pp.117- 125, Jun.2012.
[4] H. Dehghan, Y. Sarrafi and P. Salehi. Antioxidant and antidiabetic activities of 11
herbal plants from Hyrcania region, Iran. “Journal of food and drug analysis”. Vol.
24(1), pp.179-88, Jan 2016.

Proceedings of the 7th
YSF Symposium - 2018
174
CHARACTERIZATION OF A ZINC RECHARGEABLE CELL WITH A POLYANILINE CATHODE
W.A.D.S.S. Weerasinghe*, K.P. Vidanapathirana and K.S. Perera Polymer Electronics Research Group, Faculty of Applied Sciences,
Wayamba University of Sri Lanka, Kuliyapitiya, Sri Lanka.
* Corresponding author (email: [email protected])
Introduction The increasing demand for the energy is globally considerable challenge not only in the view of generation but also in storage. Rechargeable cells and super capacitors are in the focus of current research due to their key role towards mobile energy, as such in electric vehicles, mobile phones, Laptop computers and mobile sensors etc. [1]. Lithium- ion batteries (LIBs) of ‘rocking–chair’ technology are the most popular among the energy storage devices. But Li is expensive, highly reactive and fire explosion potential risk of LiBs due to thermal runaway is very high. Li also poses an environmental problem at the stage of disposing [2]. Hence attention has been focused towards developing low cost non- Li rechargeable cells. There are several substitutes such as Zn, Cu and Mg to replace Li though they do not possess higher charge capacities as Li. The state of the art of LIBs containing transition-metal oxides as cathodes, is associated with significant costs and environmental concerns (toxic). These cathodes are inherited with the problem of rate capability, because of their poor lithiation and de-lithiation rates. In this respect, development of alternative cathode materials which are abundant, non-toxic and inexpensive with higher capabilities given high priority. Electroactive conducting polymers, such as polypyrrole (PPy), Polyaniline (PANI), Polythiophene (PTH) and their derivatives have been extensively studied as electrode materials because of their high electronic conductivity and reversible redox chemistry [3]. Among them, Polyaniline is found to be the best, because of its reversible redox capability, high stability both in air and aqueous medium and low production cost. In this study, performance of a Zn rechargeable cell with a PANI based cathode is reported. PANI was protonated or oxidized in aqueous Sulfuric acid (H2SO4) medium. A gel polymer electrolyte based on polyvinylideneflouride (PVdF), ethylene carbonate (EC), propylene carbonate (PC) and zinctrifluoromethanesulfonate (ZnTF) was used as the separator.
Materials and Methods Preparation of cathode Monomer Aniline (Aldrich) was distilled and stored under refrigeration prior to use. Aniline was electrochemically polymerized on to a commercial grade stainless steel (type 304). For polymerization, a three electrode set up was used where Ag/Agcl and Pt electrode served as reference and counter electrodes, respectively. Monomer concentration was 0.40 M.
Concentrated sulfuric acid (H2SO4 - Aldrich) of 0.5 M was used as the oxidizing agent. Polymerization current density was 7 mA cm
-2 by maintaining charge density of 1200 mC
cm-2
. Area of deposition was 1 cm2. After polymerization, films were rinsed with distilled
water and let to dry. Mass of the PANI film was 0.5 mg.

Proceedings of the 7th
YSF Symposium - 2018
175
Preparation of Gel Polymer Electrolyte (GPE) Polyvinylidenefluoride (PVdF) (Aldrich), zinc trifluoromethanesulfonate (Zn(CF3SO3)2 – ZnTF) (Aldrich), ethylene carbonate (EC) (Aldrich) and propylene carbonate (PC) (Aldrich) were used as received. Starting materials were magnetically stirred well and heated at 120
0C for 30 minutes. The hot mixture was pressed in between two glass
plates. Thereby, it was possible to obtain a bubble free thin film and it was left overnight in a vacuum desiccator. Conductivity of the electrolyte was found to be in the range of 10
-3 S cm
-1.
Fabrication of rechargeable cell A circular shape electrode was cut from Zn metal received from Aldrich. An electrolyte film of the same shape and area was cut and it was sandwiched in between the Zn electrode and the PANI electrode. The cell was housed in a brass sample holder.
Electrochemical Impedance spectroscopy (EIS) Impedance data were collected in the frequency range 0.01 Hz to 400 kHz at the room temperature using computer controlled frequency response analyser (Metroham, AUTOLAB-M 101). Cyclic Voltammetry test (CV) CV test was carried out using the Zn electrode as the reference and counter electrodes and PANI electrode as the working electrode with computer controlled potentiostat/Galvanostat (Metroham, AUTOLAB-M 101). Scan rate used was 5 mVs
-1.
Cycling was done in the potential window 0.7 V to 1.4 V for 300 cycles continuously. Using cyclic voltammogram, the charge, Q involved in the redox reactions was calculated by the area of the graph of differential capacity (Cd) versus potential. Here, Cd
= i
s where i is the current and s is the scan rate.
Galvanostatic Charge-Discharge test (GCD) The cell was charge up to 1.4 V and kept for equilibrium state until the desired current was reached. Then it was discharge to 0.8 V. Similarly, continuous charge-discharge cycles were obtained in the potential window of 0.8 V to 1.3 V under a constant charge-discharge current of 1 mA for 1000 cycles. Using the charge discharge curves, the
discharge capacity of the cell was calculated using the equation, charge Q = i (t) where
i is the discharging current and (t) is time interval for voltage change. Specific discharge capacity was determined by dividing the capacity value by the weight of single electrode. Results and Discussion The rechargeable cell of the configuration Zn/GPE/PANI showed an open circuit voltage of 1.32 V and this value is in par with the results of aqueous zinc-polyaniline secondary battery by Li et al., [4]. Figure 1 shows the Nyquist plot of the EIS test. Theoretically, high frequency intercept of the plot gives the bulk electrolyte resistance (Rb) and the semi-circle arc at the intermediate frequencies represents the charge transfer resistance (Rct). Having low values as 3 Ω and 19.8 Ω for Rb and Rct respectively, the cell is electrochemically low resistive. Low frequency part corresponds to the diffusion process and charge accumulation in PANI cathode. CV shows an anodic peak at 1.12 V, and cathodic peak and at 0.9 V, as the electrochemical system is undergoing a reversible diffusion–controlled process [5]. Amount of charge participated in CV test of 300 cycling

Proceedings of the 7th
YSF Symposium - 2018
176
is 0.228 C. With the GCD test results, the discharge capacity of the cell was found to be 26 mAhg
-1. Around 63% charge retention is observed after 1000 continuous charging–
discharging cycles.
Figure 1: Nyquist plot of the rechargeable cell of the configuration Zn/GPE/PANI within the frequency range of 0.01 Hz to 400 kHz.
Conclusions and Recommendations A rechargeable cell in the configuration of Zn/GPE/PANI was successfully fabricated and characterized with an open circuit voltage of 1.32 V and discharge capacity of 26 mAhg
-1. Even though the results of the cell are not comparable with Li based cells, this
will be a good option for low power requirements. Acknowledgement Financial assistance provided by National Science Foundation under the research grant RG/2014/BS/01, RG/2015/EQ/07 and Wayamba University of Sri Lanka under the research grant SRHDC/RP/04/16-17(R2) are acknowledged.
References [1] S. Muench, A. Wild, C. Friebe, B. Häupler, T. Janoschka, and U. S. Schubert,
“Polymer-Based Organic Batteries,” Chem. Rev., vol. 116, no. 16, pp. 9438–9484, 2016.
[2] P. Ping, Q. Wang, P. Huang, J. Sun, and C. Chen, “Thermal behaviour analysis of lithium-ion battery at elevated temperature using deconvolution method,” Appl. Energy, vol. 129, pp. 261–273, 2014.
[3] Z. Wang, C. Xu, P. Tammela, P. Zhang, K. Edström, T. Gustafsson, M. Strømme, and L. Nyholm, “Conducting Polymer Paper-Based Cathodes for High-Areal-Capacity Lithium-Organic Batteries,” Energy Technol., pp. 563–565, 2015.
[4] S. Li, G. Zhang, G. Jing, and J. Kan, “Aqueous zinc-polyaniline secondary battery,” Synth. Met., vol. 158, no. 6, pp. 242–245, 2008.
[5] D. Linden and T. B. Reddy, “Handbook of batteries,” in Cell, 3rd ed., McGraw-Hill, 2004, p. 2.22-2.23.

Proceedings of the 7th
YSF Symposium - 2018
177
DEVELOPING A LOW-COST AND INTELLIGENT ENVIRONMENTAL CONTROL SYSTEM FOR GREENHOUSES
A.O. Wickramarachchi, K.D.D.S. Weerasekera, J.A.T.K. Wijerathne, R.A. Ragel and A.U. Bandaranayake*
Department of Computer Engineering, University of Peradeniya. *Corresponding author (email:[email protected])
Introduction In a normal environment, it is difficult to achieve the optimum conditions needed for plant growth and yield. Therefore, proper environment monitoring and controlling of the environment is needed to provide the optimum conditions necessary for a plant. Greenhouses are used to control the environmental factors and provide such ideal conditions for plant [1, 2]. However, even in greenhouses, the actuators that control the environmental factors needs to be properly designed to consistently maintain the ideal conditions needed for the plants.
In a survey of the existing greenhouses in University of Peradeniya we saw that most of the actuators were controlled manually according to written logs. According to the users of these greenhouses, the main problem they face is that they have to visit the greenhouse frequently to get the logs of the state of the conditions and to control the actuators accordingly. In essence, we learned that the regulation of the climatic conditions inside greenhouses in Sri Lanka is often done manually, which is very time-consuming, tedious and sometimes inefficient.
The solution for this particular problem is to automate the monitoring and controlling part of the greenhouse [3]. Even though fully-automated greenhouses are commercially available, their cost is very high, making those unviable for a developing country like Sri Lanka.
To address the problems mentioned above, we propose to build a low-cost system to monitor those environmental conditions in real time and control the environment according to the requirements that particular plant need [4]. To achieve this we have divided our system into three areas, and have developed the following solutions for each.
Monitoring Sensor Network: built the sensor network using low-cost devices.
Controlling frontend: A user-friendly web-based monitoring and controlling interface that can be easily configured by the farmer.
Controlling backend: Two pronged approach of traditional means of rule-based controlling systems, and adopting a machine-learning approach based on Artificial Neural Networks.
Materials and Methods We developed the low-cost sensor network using DHT11 temperature and humidity sensors, Decagon 10HS soil moisture sensors, and BH1750FVI digital light intensity sensors. The details of the development of sensor network are excluded from this paper due to space constraints.
The general architecture of the proposed solution is given in Figure 1.

Proceedings of the 7th
YSF Symposium - 2018
178
Figure 1. General architecture of the system
The EMCS architecture can be divided in to the following parts,
1) Sensor network 2) Actuator network 3) EMCS backend with Node.js 4) MongoDB Database server 5) Tensorflow Neural Network Backend
Sensor network will get the soil moisture, temperature, humidity and light data from the sensor nodes. Then, those data will be fletched by the Node.js server and sent in to the mongo DB database server. We need this data to get the future predictions which is done by the Tensorflow backend and then the final predictions will be sent to the Actuator network. This Actuator network will work to create the optimum micro climate inside the greenhouse.
Table1. Plant Conditions
Environmental Condition
Plants
Tomato Bell Pepper Salad Temperature (ºC)
First Stage Day Night
24-25
20
25-26
26-28 23-24 20-21
Second Stage 20 -25 15-20
23 20
23 22-23
Third Stage 20 18
23 17
23 21
RH% (VPD) 75-80
(0.4-0.8 kPa) 70-80
(0.4-0.7 kPa) 75-85
(0.4-0.8 kPa)
Light Condition 18 20
N.a. N.a.
24 20

Proceedings of the 7th
YSF Symposium - 2018
179
The first phase of our project is to develop the rule based model. This rule based model can be deployed by the farmer on their own using the user interface “deploy rules” in the System. So, this needs the knowledge of the experiences of the farmer but in here we collected the recommended data for the plants from the Agricultural Department of University of Peradeniya (Table 1).
These datasets are not applicable to every greenhouse because the climate in the location where the greenhouse is situated may differ from place to place. So, it is essential to develop a Neural Network model to predict the actuator status inside the greenhouse in real time [5, 6].
First, we used MATLAB tool to check the accuracy of the neural network using pattern classification. So, we used patternet in matlab to get the Actuator status of the greenhouse. We used 4 features, viz., temperature, humidity, soil moisture and light condition as the input to the Neural Network. The output of the neural network is ventilation fan 1 status and the mini water pump status.
After training and running the neural network in the MATLAB and looking at the performance of the Neural Network, we moved to tensorflow Deep learning framework to develop the Neural Network because we need to make these actuator predictions inside the server.
We used Deep Neural Network (DNN) in tensorflow to predict the actuator status of the greenhouse. Here is the architecture of the neural network which we have used.
Architecture - [10,20,10]
Accuracy - 87.67%
Steps – 2000
DNN we used in tensorflow has 3 layers which consist of 10, 20 and 10 hidden neurons respectively. Using our training dataset, we trained this neural network. It has four features as inputs and actuator status as the output.
Results and Discussion User Interface of the EMCS The user interface and user experience is the most important part in this system. As mentioned above, we developed a rule-based system which can be controlled very easily by the farmer. The user interfaces for main controlling system, rule deployment and rule configuration are given in figures 2, 3 and 4.
Figure 2. User Interface for the main controlling system

Proceedings of the 7th
YSF Symposium - 2018
180
Figure 3. Rule Deploying interface of the System
Figure 4. Rule Configuring interface of the System
Results of the Neural Network using MATLAB
Figure 5. Accuracy of the “patternet” in MATLAB

Proceedings of the 7th
YSF Symposium - 2018
181
The error reduces after more epochs of training. Figure 5 shows that the data training is getting to a stable status after fifteen epochs. The training stops after fifteen consecutive increases in validation error, and the best performance is taken from the epoch with lowest validation error.
Figure 6. Confusion Matrix gain by MATLAB
The confusion matrices in figure 6 show the accuracy percentages of the training data and test data. It can gain the idea of how the training and testing dataset performed in the neural network in MATLAB.
Results of the Neural Network using Tensorflow The DNN we used in tensorflow has 3 layers which consist of 10, 20 and 10 hidden neurons respectively.

Proceedings of the 7th
YSF Symposium - 2018
182
Figure 7. Confusion Matrix gain by MATLAB
Following Figure 8 shows the accuracy of the neural network over the epochs in the tensorflow neural network. After a few hours of training (depending on your machine's speed), the script should have completed all 14 000 steps. Finally got a final confusion matrix, along with an accuracy score, all run on the testing set. Here for this model we got 87% of accuracy.
Figure 8. Accuracy graph of the Neural Network using Tensorflow
Figure 9 shows that the error rate of the neural network has been reduced over some epochs.

Proceedings of the 7th
YSF Symposium - 2018
183
Figure 9. Loss of DNN using Tensorflow
Conclusions and Recommendations As the conclusion, it is evident that the use of neural network model is easier than using rule based models, as it saves time and effort. The system we developed is able to monitor a greenhouse in real-time and setup rules to control the actuators. Then, using those datasets generated by the system, we could train a neural network and use the trained neural network to get the actuator predictions which can be used to create the optimum micro-climate inside the greenhouse.
To further improve this system, we can apply image processing to detect the growth and the diseases of the plants. Going further, optimization of the neural network model to gain the maximum performance inside the greenhouse could be carried out.
References [1] M.H. Jensen, A.J. Malter, “Protected agriculture: a global review”. World Bank
technical paper no. WTP 253. Washington, D.C., 1995. [2] W.A.P. Weerakkody, L.H.P. Gunaratne, and B.C.N. Peiris, “Implications and
prospects of protected culture as a novel technology to foster horticulture in Sri Lanka”, P.405, In Abstracts of 26
th International Horticulture Congresss (IHC),
Toronto, Canada, August 2002. [3] David Ehret, Anthony Lau, Shabtai Bittman, Wei Lin, Tim Shelford. “Automated
monitoring of greenhouse crops”, Agronomie, EDP Sciences, 2001, 21 (4), pp.403-414.
[4] N. Hassan, S. I. Abdullah, A. S. Noor, and M. Alam, “An automatic monitoring and control system inside greenhouse,” in 3rd International Conference on Green Energy and Technology (ICGET), 2015, pp. 1–5, IEEE, 2015.
[5] M. A. Bussab, J. I. Bernardo, and A. R. Hirakawa, “Greenhouse modeling using neural networks,” in Proc. of the 6th WSEAS Int. Conf. on Artificial Intelligence, Knowledge Engineering and Data Bases, pp. 131–135, 2007.
[6] G. A. May, M. A. Lanoue, M. Bethel, and R. E. Ryan, “Expert system for controlling plant growth in a contained environment,” Nov. 10 2009. US Patent 7,617,057.

Proceedings of the 7th
YSF Symposium - 2018
184
ANALYSIS OF BADH2 GENE IN SELECTED RICE VARIETIES OF INDIA, PAKISTAN AND SRI LANKA
W.V.E. WITHANA1, N.S. KOTTEARACHCHI*1 and J. WEERASENA2
1Department of Biotechnology,Faculty of Agriculture and Plantation Management, Wayamba University of Sri Lanka, Makandura,Gonawila(NWP), 60170, Sri Lanka
2Institute of Biochemistry, Molecular Biology and Biotechnology,
University of Colombo, Sri Lanka *Corresponding author ([email protected])
Introduction Rice is considered as one of the most important cereal crops which feed more than fifty percent of the world population as the staple food. Fragrance properties of rice have become an important quality trait because it determines the market price of the rice, along with the grain shape and size. Literature showed that rice consists of both volatile and semi-volatile compounds which are responsible for the diverse aroma in fragrant rice. There are 100 s of volatile compounds identified causing fragrance of rice. Among them 2-acetyl-1-pyrroline (2AP) is regarded as the major aromatic compound which contributes for the fragrance in rice [1].
The 2AP biosynthesis occurs due to non-functional BADH2 enzyme, which encodes by badh2 gene. It is reported that the fragrance is due to a recessive allele located on chromosome 08 leading to a non-functional BADH2 enzyme [2]. The critical mutation that occurred in exon 07 with 8bp deletion and three SNPs leads to fragrance is reported in many fragrant rice varieties including Basmati and Jasmine rice. A gene with this type of mutation is referred as badh2.1 allele. The badh2.1 allele encodes truncated non-functional BADH2 protein, which induces a premature stop codon with 251 amino acids instead of 503 amino acids, which is encoded by the complete badh2 gene. The suggested model of badh2 gene contains 15 exons and 14 introns. At present, there are ten possible allele types identified from badh2.1 to badh2.10, and they contribute to the fragrance in rice [3].
In this study, we attempted to detect potential fragrance causing mutations and respective varieties via in silico analysis of badh2 gene based on sequences available in Rice SNP-Seek-Database of IRRI (International Rice Research Institute). This research has identified fragrant rice accessions in India, Pakistan and Sri Lanka that would enhance the varietal choice of rice breeders and farmers of the region.
Materials and Methods Extraction of badh2 Sequence Sequences from India, Pakistan and Sri Lanka were obtained from Rice SNP-Seek Database developed by IRRI (http://oryzasnp.org/) under locus accession number Os08g0424500 for chromosome 08. Altogether 254 rice varieties representing India, Pakistan and Sri Lanka were analyzed.
Mutation Identification and Multiple Sequence Alignment All sequences were aligned using blast alignment tool at NCBI (ncbi.nlm.nih.gov/blast/) with reference to cds of Oryza sativa indica (https://www.ncbi.nlm.nih.gov/nuccore/eu770319.1).

Proceedings of the 7th
YSF Symposium - 2018
185
Results and Discussion Variations of badh2 gene in South Asia This study showed the genetic diversity of badh2 gene of 254 accessions from India, Pakistan and Sri Lanka. The analysis detected that out of all sequences examined, badh2.1 allele and badh2.7 alleles were in higher frequency (Table 1). The badh2.1 allele was present in India and Pakistan. The badh2.7 allele that showed 1 bp insertion in 14
th
exon, was present in all countries. Since these two alleles have proven the ability of producing high concentrations of 2AP, farmers and breeders can utilize the accessions to be used in future fragrant rice production and breeding programs.
Table 1. Rice accessions found with badh2.1 and badh2.7 allele
Country badh2.1 badh2.7
India ARC 7263 ARC 14709 Bajal CR 44-1 JC 1 JC 157 Keya Nunia
ARC 7425 ARC 11751 ARC 14901 UPRH 58 Local Bhat
Pakistan Basmati surkh - 161 Basmati -1 Bara pashwari -390
Jhona
Sri Lanka None Kurulu Wee
Allelic variations of badh2 gene in Sri Lankan rice accessions Among the 47 accessions of rice varieties, Kurulu Wee was showed G insertion in 14
th
exon region. Kurulu Wee can be considered as fragrant rice variety as it was previously proved by Dissanayaka et al [4]. Accordingly, Kurulu Wee accession of Plant genetic resources center, Sri Lanka (Ac. No 04903) contained badh2.7 allele which cause fragrance by producing only 476 amino acids sequence, which is a truncated protein. This finding was validated by in silico analysis conducted with IRRI IRGC accession No.66615-1, Kurulu Wee rice variety.
Conclusions and Recommendations In silico analysis of rice accessions across India, Pakistan and Sri Lanka, detected two allele types of badh2 gene. Rice varieties identified with badh2.1 allele and badh2.7 allele were the predominant alleles that cause fragrance in these countries. Therefore, these data can increase the varietal choice of rice breeder and farmers to be used in their fragrant rice breeding and production work. References [1] R.G. Buttery, L.C. Ling, B.O.Juliano and J.G.Turnbaugh. Cooked rice aroma and 2-
acetyl-1-pyrroline. Journal of Agricultural and Food Chemistry.;31(4):823-826. 1983 [2] L.M. Bradbury, T.L. Fitzgerald, R.J. Henry, Q. Jin and D.L. Waters. The gene for
fragrance in rice. Plant Biotechnology Journal. 3(3):363-370. 2005 [3] M.J. Kovach, M.N. Calingacion, M.A.Fitzgerald and S.R. McCouch. The origin and
evolution of fragrance in rice (Oryza sativa L.). Proceedings of the National Academy of Sciences. 106(34):14444-14449. 2009
[4] S. Dissanayaka, N.S. Kottearachchi, J. Weerasena and M. Peiris, Development of a CAPS marker for the badh2. 7 allele in Sri Lankan fragrant rice (Oryza sativa). Plant breeding. 133(5):560-565.2014

Proceedings of the 7th
YSF Symposium - 2018
186
SOCIO-DEMOGRAPHIC, OCCUPATIONAL AND BEHAVIOURAL RISK FACTORS THAT ATTRIBUTE TO LUMBAR DISC HERNIATION AND
DEGENERATION: A CASE CONTROL STUDY IN A SELECTED SRI LANKAN POPULATION
N.D. Withanage*1, S. Prathapan2, H. Peiris3, S. Perera4 and L.V. Athiththan3
1Department of Allied Health Sciences,
2Department of Community Medicine,
3Department of Biochemistry,
Faculty of Medical Sciences, University of Sri Jayewardenepura 4The Central Hospital, Colombo 8
*Corresponding author (e-mail: [email protected])
Introduction Lower back pain (LBP) is a common musculoskeletal disorder that affects most people at some point in their lives. This has been considered as a major health problem worldwide due to its high impact on socio-economic burden of a country. Several studies have revealed that 60 - 80 % of the general population suffer from LBP and it is also recorded as the key cause for 9 – 19.5 % of sick leaves among employers [1, 2]. Among several causes for LBP, lumbar disc herniation and degeneration (LDHD) is rated as the main determinant. Lumbar disc herniation (LDH) is the localized displacement of intervertebral disc beyond the limits of intervertebral space. Although several studies have been carried out to determine the exact cause of LDHD, none of them have given promising findings. Though it has been suggested that individual, social, occupational and behavioural factors could contribute to LBP associated with LDHD [1];age, sex, heavy occupation, mechanical loading, smoking and strenuous sporting activities have been studied extensively [1, 3].
Studies have stated that degeneration usually commence at a very early stage of life, where mild changes are seen in the first decade of life and more significant changes in second decade onwards. However, some studies have emphasized that LBP and LDHD are common in the fourth to fifth decade of life [2]. Although the prevalence of LBP increases with age, studies have shown that there is no linear relationship between age and LBP, thus suggesting the association of multiple factors. It is documented that males are more prone to the development of LDHD compared to females [4]. Occupational factors, including severe physical loading is a strong determinant of LBP. Furthermore, several studies have found strong association with smoking and LDHD. However, there are no reported studies regarding LBP associated LDHD in the Sri Lankan context. Hence this present study was carried out to identify the relationship of selected socio-demographic, behavioural and occupational factors with LDHD in Sri Lankan subjects.
Materials and Methods Study design and setting A case-control study was carried out at the Central hospital and the Faculty of Medical Sciences, University of Sri Jayewardenepura after obtaining written consent from all the participants. The study was approved by the Ethics Review Committee of Faculty of Medical Sciences, University of Sri Jayewardenepura.

Proceedings of the 7th
YSF Symposium - 2018
187
Study subjects Test: Subjects (n = 104) who had back pain and confirmed as lumbar disc herniation/degeneration with Magnetic Resonance Image (MRI) by a consultant neurosurgeon and a consultant radiologist. Control: Individuals (n=104) without back pain at least during the previous one month prior to the study.
Data collection A Standardized, interviewer administered questionnaire was administered to each patient enquiring their socio-demographic data, daily activities, physical and behavioral activities, work status, general health status and current health condition.
Statistical data analysis Frequencies, percentages and Odds ratios were calculated using SPSS version 20.0. A p value ≤ 0.05 was considered as statistically significant.
Results and Discussion Among the study subjects, slightly higher percentage were males (51.9 %) whereas other studies have also reported a higher prevalence of LDHD among males. Results of the present study showed that the mean age for cases to be 43.6 ± 15.8 years and for controls 43.2 ± 15.2 years. A higher percentage of female patients (16.3 %) were affected with LDHD at the age group 51 – 60 years, whereas males were affected (15.4 %) at a younger age group of 31 – 40 years. Studies have shown that LBP associated with LDHD is most common in the fourth to fifth decade of life, present study findings of mean age correlate well with the majority of reported studies [2].
On enquiry, majority of cases (56.7 %) had not encountered any predisposing conventional factors which cause LDHD. However, most of the cases were engaged in daily physical activities which cause a severe or moderate strain to back compared to controls (Table 1). Some studies on a similar theme have affirmed that heavy lifetime and leisure time physical activities have an association with LBP and LDHD [3]. Interestingly, some studies found contradictory findings suggesting that physical activities during leisure time (either sports or daily physical activities) is not associated with LDHD. However, present study findings suggest that severity of daily physical activities cannot be disregarded in LBP associated with LDHD.
Numerous studies have found that there is a significant association between LDHD and strenuous sporting activities [3]. Although a high percentage of cases (46.2%) and controls (44.2 %) of the present study had engaged in sports, the findings suggest that there is no significant difference between cases and control (Table 1).
Present study emphasizes that there is a significant association in the level of physical demanding nature of occupation (occupational risk factor) between cases and controls. It was revealed that those employed in severe to moderate level of risk of occupation had a 5.96 fold risk for LDHD when compared to those employed in light or non-risk occupations (Table 1). Findings regarding the association of occupational risk factors and LDHD are in accordance with several reported studies [3, 5].
Smoking has been found to be a major risk factor for LDHD in many studies and findings of the present study are in agreement with this finding, (Table 1). It is suggested that nicotine in cigarettes may cause narrowing of blood vessels and hence impair the flow

Proceedings of the 7th
YSF Symposium - 2018
188
of blood and nutrients to the disc causing disc cells to degenerate. However, consumption of alcohol did not have a significant association with LDHD. Table 1: Distribution of behavioral and occupational risk factors among cases and controls
Variable Cases Controls Odds ratio (95 % CI)
n % n %
(i) Severity of daily physical activities
(a) Heavy/moderate strain to back
(b) Light strain/sedentary
66
38
63.5
36.5
38
66
36.5 63.5
3.01*
(1.7 - 5.3)
(ii) Engaged in sports (a) Yes (b) No
48
56
46.2 53.8
46 58
44.2 55.8
1.08
(0.62 -1.86)
(iii) Level of physical demanding nature of occupation
(a) Severe and moderate (b) Light and others
8 53
13.1 86.9
2 79
2.5 97.5
5.96* (1.22 – 29.18)
(iv) Social habit (a) Smokers (b) Non-smokers (c) Alcohol consumers (d) Non alcohol consumers
17 87 33 71
16.3 83.7 31.7
68.3
05 99 29
75
4.8
95.2 27.9
72.1
3.87*
(1.37 – 10.92) 1.20
(0.68 – 2.18)
n=number of subjects
Conclusions and Recommendations Present study confirms that LDHD is predominant in the fourth to fifth decade of life. Furthermore, the current study showed that a high level of leisure-time physical activity caused a severe to moderate strain to back, in addition to the occupational factors and smoking as risk factors for LBP associated with LDHD. Based on the study findings, it is recommended that proper ergonomics be followed when handling heavy physical and mechanical loads either as leisure-time activities or as demanded by the occupation.
Acknowledgement University Grants Commission (Grant no-VC/DRIC/PG/2013/SJP/02) for the financial assistance.
References [1] Pietri, F. Leclers, A. Boitel,L. Chastang, J.F. Morcet, J.F. Bondet, M., "Low-back pain
in commercial travelers".Scandinavian journal of work, environment & health, 1992: p. 52-58.
[2] Urban, J. and S. Roberts, "Degeneration of the intervertebral disc". Arthritis Research and Therapy, 2003. 5(3): p. 120-138.
[3] Manek, N.J. and A. MacGregor, "Epidemiology of back disorders: prevalence, risk factors, and prognosis".Current opinion in rheumatology, 2005. 17(2): p. 134-140.
[4] An, H.S. Silveri, C.P. Simpson, J. Micheal, F. Paul,S. Chet, S. Fredrick, A. Balderston, R.,"Comparison of smoking habits between patients with surgically confirmed herniated lumbar and cervical disc disease and controls".Clinical Spine Surgery, 1994. 7(5): p. 369-373.
[5] Battié, M.C. Videman, T. Gibbons, L.E. Manninen, H. Gill, K. Pope, M. Kaprio, J., "Occupational driving and lumbar disc degeneration: a casecontrol study".The lancet, 2002. 360(9343): p. 1369-1374.

Proceedings of the 7th
YSF Symposium - 2018
189
Author Index
Name Initials Page Name Initials Page Aaqiff M 77 Peiris H 186 Aasir AM 1 Perera L 122 Abeysekera AM 114 Perera NWPS Abhayagunasekara AVC 7 Perera KS 174 Anoja N 11 Perera AAS 103 Anusha K 15 Perera PPR 110 Arawwawala LDAM 99 Perera PK 99 Ariadurai SA Perera S Athiththan LV 129, 186 Perera DAM 58 Attanayake
AP 74 Prathapan S 186
Balasooriya PW 19 Premarathna KSD 106 Bandara AMKR 126 Premarathne SP 48 Bandaranayake AU 94,177 Pushpakumara DKNG 7,22 Bandaranayake PCG 7,22,94 Ragel RA 177 Chanaka U 170 Rajapakse RPVJ 54 Chandrasekara CHWMRB 22 Rajapaksha AU 106 Chandrika UG 114 Ranasinghe P 170 Chathuranga GG 26,66,
86,118 Rathnayake RGL 110
Chathurika WVAH 30,34 Rathnayake RMNP 152 Cyri HW 30 Ratnayake WMKM 114 Dassanayaka MP 82 Ratnayake RR 1,167 Debarawatta RDN 38 Rupasena LP 58 Dilshani AKDN Salim N 114 Dissanayake HDMAC 122 Samarakoon SPAUK 26,66 ,
86,118 Dissanayake DMGC 38 Samarakoon KW 170 Edirisinghe EMRKB 70, 152 Samarasinghe CRK 122 Fernando THPS 19,140 Samarasinghe WLG 7 Fernando CAN 26,66,
86,118 Senadheera SDNM 126
Gnanarathna WDKK 44 Senarathne TKRR 129 Gnanavelrajah N 1 ,146,
167 Senevirathne RMRD
Goonasekera CL 99 Sewwandi JMAM 133 Guruge TPSR 48 Shaminy N 136 Herath HMIM 54 Shobana C 157 Herath UL Silva MKR 140 Hettiarachchi UPK 15,110,1
29 Sivachchanthirika A 146
Hitibandara HBCM 58 Sivashanthini K 62,157 Jayamanne BDW 77 Sriyananda BGMS 103 Jayasinghe S 74 Sunethra WG 149 Jayasundera ACA 44 Surendra IHW 152

Proceedings of the 7th
YSF Symposium - 2018
190
Karunaratne V 74 Suresh TS 114 Kottearachchi
NS 184 Sutharshiny S 62, 157
Kumara MPU 70 Thiruchchelvan N 133,149,162
Kumara UMA 133, 149
Thirukkumaran G 162
Kumara KLW 1 Thurairajah A 167 Kumarasinghe KMN 99 Umesha BVA 140 Kalaivanan K 62 Vidanapathirana KP 174 Karunarathna PGDCK 26,66,86,
118 Vidanarachchi JK 34
Lankapura
AIY 58,126 Vinodini EAP 30 Lee SH 170 Viraj MADR 90 Liyanaarahchi US 26,66,
86,118 Vithanage M 106
Liyanagamage DSNK 74 Vivehananthan K 54,82 Liyanage G 77 Wathsara HPT 170 Liyanage GSH 15 Weerakoon D 48 Madhuranga WSP 82 Weerasekera KDDS 177 Madusanka HTDS 26,66,
86,118 Weerasena J 184
Md. FH Weerasena OVDSJ 19 Meegahakumbura MK 122 Weerasinghe WADSS 174 Mikunthan G 162 Weerasundara L 106 Mudalige UKJ 48 Wickramarachchi AO 177 Nandana WAR 90 Wijerathne JATK 177 Naranpanawa DNU 94 Withana WVE 184 Nishshanka C 30 Withanage ND 186 Pallie MS 99

Proceedings of the 7th
YSF Symposium - 2018
191
PANEL OF REVIEWERS
Dr. T. Karandaketiya Dr. U. Hettiarachchi Dr. H.M.A. Herath Dr. S. Mahavithanage Prof. C.A.N. Fernando Dr. C. Perera Prof. P. Samarasekara Dr. K. Atthanayake Dr. V.G.T.N. Vidanagama Prof. S. Suresh Dr. J.N. Senadeera Prof. U.G. Chandrika Dr. S.N.T. De Silva Dr. P. Jayewardena Dr. N.R. Abeynayake Dr. C. Hewage Dr. R.G. Ragel Dr. R. Perera Dr. D.G.K. Dissanayake Prof. S. Wimalasekara Dr. D. Attygalle Dr. N. Rajapaksha Dr. D.A.S. Amarasinghe Dr. K. Hemachandra Dr. C.L. Jayawardena Prof. T. Madujith Dr. N. Adassoriya Prof. D. Costa Dr. C. Beneragama Dr. S. Kodithuwakku Ms. P.K.C. Buddhini Dr. V. Herath Prof. N.S. Kottearachchi Dr. S. Jayathilake Ms. W. Nandanee Dr. D. de Croos Dr. J.K. Walpita Dr. D.C.T. Dissanayake Dr. R.M.A.U. Rajapaksha Dr. H.D.D. Bandupriya Dr. R. Wanigathunge Dr. A.M. Wikramasuriya Dr. B.G.N. Sewwandi Dr. J. Dissanayake Dr. K.D.P.P. Gunathilake Dr. S. Ariyawansa

Proceedings of the 7th
YSF Symposium - 2018
192
YSF Steering Committee
2017
Coordinator
Dr. Kalpa W. Samarakoon, National Science and Technology Commission
Chairperson (YSF)
Dr. Meththika Vithanage, Faculty of Applied Sciences, University of Sri Jayewardenapura
Steering Committee Members
Dr. Kasuni Akalanka, South Asian Institute of Technology and Medicine
Dr. Asitha Bandaranayake, Faculty of Engineering, University of Peradeniya
Dr. Darshani Bandupriya, Faculty of Sciences, University of Colombo
Mr. Akila Jayasanka Herath, IT Centre, Wayamba University of Sri Lanka
Dr. Usha Hettiarchchi, Faculty of Medical Sciences, University of Sri Jayewardenapura
Dr. Chulantha Jayawardena, Faculty of Engineering, University of Moratuwa
Dr. Upanith Liyanaarachchi, Faculty of Applied Sciences, Wayamba University of SriLanka
Dr. Kasun Meegahakumbura, Coconut Research Institute
Mr. Pradeep Piyathilaka, National Institute of Fundamental Studies
Dr. Roshan Ragel, Faculty of Engineering, University of Peradeniya
Dr. Lasantha Weerasinghe, Faculty of Agriculture, University of Peradeniya