Proceedings of the Symposium on Dungeness Crab Biology ...
432
Lowell Wakefield Fisheries Symposia Series AKU tli N-OO3 C3 Proceedings of the Symposium on Dungeness Crab Biology and Management University of Alaska Alaska SeaGrant ReportNo. 85-3 April 1989
-
Upload
khangminh22 -
Category
Documents
-
view
0 -
download
0
Transcript of Proceedings of the Symposium on Dungeness Crab Biology ...

Lowell Wakefield Fisheries Symposia Series
AKU � tli � N-OO3 C3
Proceedings of the
Symposium on Dungeness Crab
Biology and Management
University of AlaskaAlaska Sea Grant Report No. 85-3
April 1989

Lowell Wakefield Fisheries Symposia Series
October 9-11 1984
Anchorage, Alaska, USA
Brenda R. MelteffSymposium Coordinator
University of AlaskaAlaska Sea Grant College ProgramFairbanks, Alaska 99701
Alaska Sea Grant Report No. 85-3April 1985
Proceedings of theSymposium on Dungeness Crab
Biology and Management

Acknowledgments
Sponsors of the Symposium on the Bioiooy and Management of DvnoeoessCrab, the third in the Lowell Wa kefiel 6 Fisheries Symposia Series, arethe Alaska Department of Fish and Game, The Crustacean Society, and thePacific Sea Grant College Program.
Manuscripts for thi s publication were provided camera-ready by theauthors and compiled and printed by the Alaska Sea Grant College Programcooperatively supported by NOAA, Qffice of Sea Grant. and ExtramuralPrograms, U.S. Department of Commerce under grant number hIAB2AA-0-00044F, project number A/75-01; and by the University of Alaska withfunds appropriated by the state.

Table of Contents
PAGE
V11PREFACE
WELCOIBIE AND INTPODUCTION
Welcome.Dle Mathisen
Introduction,Steve Pennoyer
SESSION I- OVERVIEWS
Overview of the California Dungeness crab, Cancerma ister, fisheries.
onald W. Warner
An overview of Oregon Dungeness crab fishery withmanagement concepts for the future
Oarrell Demory27
Tile Bs ge ess c ah, C c ~a iste , fish i.s f B itishColumbia.
G. S. Jamieson37
A brief review of the coaanercial fisheries for Cancerma ister in southeast Alaska and Yakutat waters, withemp asks on recent seasons....
Timothy M. Koeneman61
Dverview of the Prince William Sound management areaDungeness crab fishery
Al Kimker77
The Lower Cook Inlet Dungeness crab fishery from 1964-1983... 85Margaret F. Merritt
Overview of the Washington coastal Dungeness crab fishery.... 33Steve Sarry

sodiah island coamercial hu g ess, C cer ~ma rater,fishery.
Martin F. Eaton97
SESSION II: LIFE HISTORY
Ecology, growth, and population dynamics of juvenileDungeness crab, CD cer ~na 'st hans. i' Grays ua ho ~ ,Washington, 1980~1
Bradley G. Stevens and David A. Armistrong119
Sampling design and methodology for juvenileDungeness crab surveys.....
Donald R. Gunderson, David A. Armstrong andChristopher Rogers
135
The role of estuaries in Dungeness crab early lifehistory: A case study in Grays Harbor, Washington..
David A. Armstrong and Donald R. Gunderson145
Abu dance a d growth of Ca c ~inter young-of-the-y ain the nearshore environment.
Kenneth R, Carrasco, David A. Armstrong, Donald R.Gunderson and Christopher Rogers
171
Age a d growth of male b g ess cr bs, C ~ cer ~rrrstuin northern California.
Rona'id W. Warner185
189
SESSION III: MORTALITY
A review of Dungeness crab diseases in the PacificNorthwest and Alaska.
Theodore R. Meyers, Thomas C. Shirley, Susan M.Shirley, Albert K. Sparks, and J. Frank Morado
209
Condition of Dungeness crabs, Cancer ma ister, at abenthic deposit of decomposing~ar : P ys>ca traumaand reduced reproductive success.
Lincoln Freese and Charles E. O'Clair223
Responses of Dungeness crabs, Cancer ma ister, exposedto bark debris from benthic deposs ts at og transferfacilities: Survival, feeding, and reproduction...,...,
Charles E. O'Clair and Lincoln Freese227
A recent history of the Orca Inlet, Prince WilliamSound Dungeness crab fishery with specific referenceto sea otter predation.
Al Kimker231
Molt increments, annual molting probabilities, fecundityand survival rates of adult female Dungeness crabs innorthern California.
David G. Hankin, Nancy Diamond, Michael Mohr andJames Ianelli

SESSION IV: POPULATION DYNAMICS
gsaamlcs af 0 ge ess c ab, Ca cer ~ma tater, lsrrse offcentral and northern California.
Paul N. Rei lly245
Fine scale spatial distribution of Cancer ma istermegalopae and its relevance to sampT>ng metho o ogy...
J. Booth, A, Phillips and G. S. Jamieson273
Modeling a fishery characterized by uncertain resourcesand a multi-purpose, heterogeneous fishing fleet - theEureka Dungeness crab fishery.
J. J. Fletcher, W. E. Johnston and R. E. Howitt287
Proposed explanations for fluctuations in abundance ofDungeness crabs: A review and critique.
David G. Hankin3D5
Iaftlatf of a Ila ge ess c ab, Ca cer ~ma later, hebft tstudy in North Puget Sound..
Paul A. Dfnnel, David A. Armstrong and ChristopherDungan
327
SESSION V: CONTRIBUTED PAPERS
Biases in crab tag recovery data.Nancy Diamond and David G. Hankin
341
Feeding in relation to morphometrics within the genusCancer; Evolutionary and ecological considerations....~eter Lawton and Robert W. Elner
357
Oceanography of Cook Inlet and its relation toDungeness crab distribution.
A.J. Paul381
Evidence that a single size-class of Cancer ma ister hassupported the Yakutat coaanerciai fish~ery s nce t e I981-1982 season.
Timothy M. Koeneman393
401
LIST OF ATTENDEES. 419
The controversial use of the insecticide Sevin in PacificNorthwest estuaries; Its effects on Dungeness crab,Pacific oyster, and other species.
David V. Buchanan' Daniel L. Bottom, and DavidA, Armstrong


Welcome
and Introduction


Welcome
Ole MathisenDean, School of Fisheries and ScienceUniversity of Alaska, juneau
I have been given the privilege of extending a hearty welcome to allthe participants of this symposium on Dungeness Crab Hioloqy andManagement. I am afraid that my credentials are not fully impeccablesince my interest has been directed toward other organisms. However,this meeting strikes an early chord in my memory, The first trip I evermade aboard a fishing vessel in the 05A was with a crab boat fromAberdeen, Washington.
As I scan the program and the list of attendants and look at thisaudience, it appears like a "Who's Who" in contemporary invertebratemarine biology a'long the Pacific Coast. The symposium committee hasworked hard to organize a constructive program and has assembled anarray of impressive speakers dealing with life history, populationdynamics and management problems. Clearly, the proceedings of thissymposium wi 1 1 result in a volume which wi 1 1 rema i n as a storehouse ofour present knowledge of the Dungeness Crab.
But since I am pulling up in years and have part'.cipated in a number ofmeetings and symposia, both national and international, permit me tostrike a disconsonant chord by asking: Are we really making progress,or, phrased in another way, Are we really asking the kind of questionswhich should be raised in this decade? I have witnessed the period withthe breakthrough of formal population dynamics in the 50s, andelaborate management models in the 60s, both single and multi -speciesmodels, which were partly made obsolete or inadequate in the 70s. Weare finally gaining some insight into the structure of an aquaticpopulation and the way life history strategies have evolved. As aresult, we catch glimpses of the capacity of the living organisms torespond in a manner which ultimately wi 1 1 benefit survival of thespecies in question. The harvest process involves much more thanremoving a certain number of specimens from a population. What reallyis happening is an alteration of the structure of the population.

Perhaps the changes which we are observing fn vital populationparameters, decline in abundance and susceptibil ity to stress anddiseases, are primarily due to changes in the underlying populationgenetics. This brings the conference back into a more general andpenetrating framework of all the processes taking place in theenvfronment and espec1ally in the case of an important decapod thecoupling existing between primary and benthic production.
I suppose that what I am tryfng to br1ng across fs the new era which weare entering with a need for a much more basic understand1ng of thfspart1cular organism, its evolutionary history and its latentposs1bilities to respond favorably to an altering environment in thecontext of survival values, rather than a fragmented study of single orlimited events.
This again brings us back to another central theme for species underharvest, Regardless of how much we study and how many facts we areassembling, there will always remain a large residue of unknownfactors. For exploited species, this is tantamount to making managementdecisions in the face of uncerta1ntfes. Again the quest1on is ra1sedabout' the underlying risk function which must govern the decfs1onmaking process. If observed from this angle, this symposium may producesome important side benefits.
I encourage participants in this conference, in addition to delivery oftheir prepared speeches, to engage freely in expression of the thoughtsthat we all harbor of the underlying processes which govern theexterna'1 manifestations and ultimate survival of the peculiar creaturewe know as C c ' t
In this endeavor, I extend to the participants of this conference mybest wishes for new and innovative solutions to old problems.

Introduction
Steve Pen@oyerDeputy CommissionerAlaska Department of Fish andCame, juneau
Dungeness Crab Mana ament
The dungenees crab fishery in Alaska historically has been a verysmall part af aur total shellfish fisheries picture. In 1980, thestatewide harvest of king and tanner crab was 315 million pounds,compared to only 6.4 million pounds af dungeness <about three percentof total value! . The dungeness crab harvest has provided a season tocertain small boats in Alaska in limited areas, but overall, was not asignificant economic factor to our crab fleet. Our total crabmanagement and research budget was only 2.5 million dollars in 1984and quite naturally, a very small amount of it about five percent!was spent on dungeness crab research and management.
Reviewing our management af the past few years, I can find very littlein the way of flexible management applied to the species. In-seasonemergency orders, when issued, have generally revolved aroundsoftshell periods and concern about high CPUE and handling mortality.I could only find one emergency order in recent years related to adecline in CPOZ and a concern for associated handling of mOrtalitiesdue ta high effort. Statewide, size limits for males and restrictionsagainst taking female crab are the same for all areas. Seasons arealso similar, with some variation in opening dates by area, basedprimarily on local desires, more than any biological data. Generally,the seasons are very lengthy and there appears to be no directrelationship between regulatory seasons and sensitive periods ofbreeding/molting for crab. Closed seasons in some areas seem to havejust been a mechanism to force removal af the pats from the waterduring periods of relatively low CPUE to avoid incidental harvestingand derelict pot problems. Apparently, management has been entirelythe three-8 system in its least restrictive form, with harvest relatedmore to the amount of effort placed on the stocks than any directmanagement of the fishery.

Mast of our past reports imply that the size of the Alaskan harvesthas been more an economic factor related to the status of stocks andthe market along the west coast. A relationship probably daes exist,but the degree to which Alaskar; stock statue--and the status of othershellfish fisheries in Alaska � inf>uences the relationship is notclear, A d t t in the last three years is obvious,
It is common knowledge that economics drive the fisherv. and thatsimple protection by sex and size limits with some seasonal monitoringwould be adequate to protect the stocks and insure sustainableutilization of the harvestable surplus. Recently, however, thisfiehery haS expanded dramatically. From 1980 to 19S3, the number ofvessels increased by 347 percent, and the catch by 263 percent.Dungeness became eight percent of the total shellfish value statewide,and 32 percent af the total landings. The tremendous increase ineffort and harvest in recent years, coupled with a lack of concretebiological data, should lead us to question this simplistic approachto management, Work to date has certainly not given us the answers towhat the carrect approach should be.
Our documentation on dungeness crab populat.iona in Alaska has been, atleast. until recently, very poor. Exploitation rates, popu] ation size,recruitment levels, growth rates, and even age structure far mostpopulations are largely unknown. We need to analyze whether currentsize limits are appropriate for stocks throughout the range in Alaska.work is needed to determine the amount and impacts of handling thatoccurs an sublegal ma3e and female crab. There has been na gearresearch done on mesh size or escape ring effectiveness. While therehas been some tagging, for most areas, we have little knowledge afwhat comprises a stock of dungeness crab.
It seems to me there are a number of questions abaut our programdirectian here in Alaska that need to be answered. We need to examinethe data base available on Alaska dungeness crab and ask ourselves ifit is adequate, and then suggest either further monitoring orresearch, as might be appropriate. We need to look at our three-Ssystem of management and decide if it is doing the job. what are theadvantages and disadvantages of the current system? Are we reallyaddressing the adequacy of seasonal restrictions versus softshellperiads? Should we be attempti.ng to achieve same level of exploitationrate? Should we be somehow restrictinq the amount of handling ofsublegals and females that occurs, and is this a problem? Should we beconsidering some sart of rotational management by area, or othermanagement schemes? Our department needs to answer all of thesequestions to caz'ry out our conservation mandate,
In addition, the Alaska Baard of Fisheries may wish to considervarious socioeconomic allocation questions in regard to the dungenesscrab, depending on the life history of the animal. If, in fact,recruitment is highly variable and successful fisheries are maintainedon single age classes over a long period of time, it is possible theboard may wish ta spread economic harvest over a number of years.Dungeness crab are alsa important to local area commercial fisheriesand local area sport and personal use fisheries, About 90 percent ofthe dunqenens crab commorcial permit holders are residents of nlssks,and about 85 percent of these operate aut of boats under 50 feet inlength. Do we have an adequate data base for the Board of. Fisheries toaddress these questians? Dungeness crab are an important recreational

fishery, and they are also important to the tourist industry, yetthere are problems in stringing out the harvest to cover these typesof activities in an intense commercial fishery. I do not have answersto most of these questions, but from a management sense, they need tobe addressed and I am hoping they can be at. this symposium.
I understand the symposium will be providinc us with regionalperspectives on management strategies, data collected and researchunder way. Hopefully, we can eliminate assumptions about what is andwhat is not known about the animal. We all have limitations on ourtime, and it is difficult to keep current. We may be able to poolresources to coordinate research activities and data analysis. Ourbudgets are always limited and all fisheries are demanding moreattention, more precise date/management, and more accurate allocationsto competing users. The symposium will al!ow the experts on dungenesscrab population dynamics and biology to meet with the managers todiscuss their different perspectives on the centraI questions ofconservation and allocation.
We need tc decide if dungeness crab are in need of a more aggressivemanagement prOgram in Alaaka. I am Sure that dungeneSS, like any Otherof our resources, do lend themselves to same estimation of optimum andmaximum sustained yield. I am sure that a rational system ofregulations could be developed that would ensure that biologicalsurplus would be harvested in an orderly manner by users, according topriOrities established by the Board of Fisheries. I am not sure wha*such a program would cost or what level of sophistication would bejustified by the value of the resource. I think this symposium is anexcellent chance to start trying to address this issue.
Selfishly, from the department's standpoint, I hope that suggestionsfor an adequate Alaskan fisheries management program is the primaryoutput of this forum. I hope that department managers can learn aboutthe biology of the animal, can gain knowledge about other west coastmanagement systems, and can develop, in concert with peer scientistsand managers, new potential research plans and potential managementSChemeS. I think yOur agenda ia eXCellent, and cOverS mOSt Of thenecessary ground, In the area of research, it does contain a workshopon future research needs chaired by the department, I guess the oneadditional thing I would like to have seen on the agenda is a parallelworkshop critique of the Alaskan management system and suggestions forimprovement baaed on the aggregate experience from all the sessions inthe symposium. If this cannot be formally or informally a pert of thesymposium, I am going to suggest, within my own department, that atsome point after the symposium proceedings is published, a group ofmanagers and research scientists get together and perform such acritique. I would like to see that critique presented to the AlaskaBaard Of Fieheriea at their Spring ShellfiSh meeting, and therecommendations incorporated into our FY 87 budget process nextspring.


Session I
Overviews


Overview of the California Dungenesscrab, Cancer magister, fisheries
Ronald W. WarnerCalifornia Department of Fish and GameEureka, California
INTRODUCTION
ih*diii tD i *i,i ~it*, i iCalifornia. The northern California fishery occurs in the ares fromthe Oregon border to Point Arena, California and includes the porteof Crescent. City, Trinidad, Eureka, snd Fort Bragg Figure 1!, Southof Point Arena, parts of landing, for the central California fisheryare Bodega Bay, San Francisco, Half Hoon Bay, Noes Landing,, snd MorroBay Figure 2!.
MANAGE NEN T
The northern California crab season. hae opened on December 1 ei.nce1967 and, sine.e 1957, has closed on July 15 Table 1! . The season maybe extended to August 31 by order of the Director of the Depart eaitt ofFish and Came if it. is determined that the extension will nat harm theresource Table 2! . In central California crabs are in. marketable con-d tlan abaut 1 month earli.er, so the seasan opens on the second Tues-day in November snd closes June 30- If requested, the season may beextended under the aforementioned conditions to July 31.
Only male crabs, 6$ inches carapace width, may be taken. Not more than1'%%d of any load or lot of crabs may be less than 61 inches snd none lessthen 5 3/4 inches may be possessed The standard unit of gear is scircular trap, approximately 40 inches i.n diameter, snd 75 pounds inweight. Every crab trap must have two 4!t-inch diameter escape open-ings. If side openings are used, one of those openings must be locatedso that st least. one-half of the opening ie in the upper half of thetrap. Traps may be set 18 hours in advance of the opening of the sea-son; however, gear dropped prior to that time must be unbai.ted and haveunhooked llde-

C a C
0 C 0
'0 C 4 0 N a 4.0 c 0
V S
C I
IIICClIL
12

Ill� 'ae IrrFIGURE 2. Genital California porte ol landing lor the Dungenoaa arab tinhorn

Table l. California Crab Seasons, 1950-1984
Close Close
July 31
~Den
Nov. 15Nov. 15Dec. 15
It
July 31July 31
Dec. 15 June 30~ t
Nov, 15 Nay 31
Dec. 15 July 15
2nd Tuea.NovII
Hay 31
2nd Tuea.Nov.II
June 30
Dec. 8
Dec. 1
Aug. 31
July 15'I I
Aug. 31
July 15Aug. 31
July 31
June 30II
July 31July 15Aug. 31
14
Northern California Oregon border to Pt. arena!
1950-511951-521952-531953-541954-551955-561956-57195 7-581958-591959-601960-611961-621962-631963-641964-651965-661966-671967-681968-691969-7019 70-711971-7219 72-7319 73-741974-751975 761976-771977-781978-791979-801980-811981-821982-831983-84
Central California Pt. Arena to Hexkcan border!

Table 2 Dungeness Crab Cox>sere.ial Fishery Landings During SeasonExtension July 16->tu!guet 31! in Northern California.
TotalExtension Landin s lb
TotalSeason Landi s/lbSeason
28,000
No extension
15
1983-84
1982-83
1981-82
1980-81
1979-80
1978-79
1977-78
1976-77
1975-76
1974-75
1973-74
1972-73
1971-72
4,478 >548
4,696,337
10>104,432
10,889,831
12,233,334
6,993,965
12>898�61
24>811 >936
15,381,870
1,400>485
323,982
1,046,245
2,355,063
1,284
1�43
4,201
No extension
617,261
49,600
No extension
No extension
4,929
17,138

A California law which requires trawl vessels to operate 3 miles be-yond the coastline was enacted to avoid canfli.ct between crabbers andtraw1ere end also serves to protect juvenile bottomfish which use thatarea as a nursery No more than 500 pounds of trawl-caught Dungenessmay be landed per trip Most crab landings by trawlers are incidentaland total annual landings by this gear are negligible
Crab landings fluctuate dramatically in the northern california fish-ery but have remained at depressed levels for over 20 years in centralCalifornia Both fisheries have been the subject of considerable dis-cussion and study regarding rhe causes of their individual. patterns.Environmental. and density dependent factors have been hypothesized asexplanations for fluctuations in northern California, while the issuesof physical oceanography, predation, and pollution have been closelyexamined in the central California fishery.
FISHERY
The port of Norro Bay is on the extreme southern end of the commercialrange of Dungeness crab. This port also occupies the southern snd ofthe pink shrimp, Pandalus jordani, range. The crab fishery began herein 1947 and initial landings were relatively low, peaking, at 433,DOO lbduring the 1950-51 season Figure 3!. Subsequent landings were spora-dic after that snd since the mid-1970s there has been little or no ef-fort.
To the north of Morro Bay i.s Nose Landing on Monterey Bay This areais alaa part Of the SOuthern edge Of the Dungeneee crab CasIzercialrange. During the 1930s, gill nets with 8+ to 11-inch web were usedin the fishery. In recent years landings have been sporadic with onlyminimal effort expended Figure 4!.
San Francisco has a long and colorful history of crab fishing datingback to about 1860 and from 1918 to the early 1960s, about 200 to 250vessels engaged in the fishery which yiel.ded as much as 8,900,000 lb ina season, 1955-56 Figure 5!. Since that time landings have been de-pressed end only 100 to 165 vessels fish in the area now. Landingsduring the 1983-84 season were only 857,000 lb, although that figurewas the highest recorded in 14 years and well above the 10-year aver-age of 511,000 lb.
Noya Harbor at Fort Bragg is the mast southerly port in the northernCalifornia area. It is home to a sizeable trawler fleet, but only 25to 40 vessels are cr abbers. Some effort is directed at a small, localpopulation of crabs in the Usal area, but most vessels travel north tothe Eel River vhere the bulk of the catch occurs. Fort Bregg landingsfluctuate in phase with Eureka landings Figure 6! and the 10-yearaverage is 517,000 lb.
Total annual landings in the northern California ports of Eureka,Trinidad, and Crescent City have experienced sharp changes. The catchdropped ta a record law of 320,00D lb in 1973-74 and jumped three sea-sons later to a record high 25,000,000 lb Figure 7!. Eureka, a portciry on Humboldt Bay, has a crab fleet camposed of a mixture of vesselsranging from dories ta draggers. The her or entrance to Kumboidt Bayis very rough during winter starms and on many days prevents the fleetfram exiting to acean waters. The 10-yesr average landings for this
16

4rr
75- 80-78 81
55-86
70-71
1$4'7- 5048 51
55-58
50-51
SEASDst
IO 8
1535-35
40-41
46-48
60-51
50-51
70-yt
55-65
55-85
75-75
80-81
SEASOM
IaCIZ 0IL
O 8 0
ylGQR83. Dungeness crab ccrnmercr ~ 1 riahary landtngs in Ilorro Say
FtGURE 4. Dengenesa Crab Ccmmerolal tracery tsndrnga in MOnterey gay

na~ P
0I ICCQ
Ieaea
I0
Inom e
081 Cl
i e
0
~aa
SOHIlOd 90 SNOIlllg
D Q %ICU.
a 4I
EE0 El
~ Je ~ I
C ClO

IS
10
m O
ss-88
ISSS- SS-sa se
'70- 7 8- 80- 83-71 78 81 84
80-81
SEA80N
O ?
1990-$1
80- 83-81 84
19
loQ ?
O A
ill?O
X
FIODRES. Dunsanaaa ara'b aornmaral ~ I Iiabary landlns ~ lnFarl Srasa, Calilorni ~
SS ~ 80- as- 70- 78-Se 81 SS 71 Te
SEASONIEIJREKA, TRINIDAD, CRESCENT CITY!
FIGURE 7, Dunsanaaa arab Commarcl ~ I Ilaaaly landinsaIn Nortbarn Casyornia

port are 3,850,000 lb.
About 20 miles north of Eureka is the port of Trinidad, whirh is asmall anchorage protected from northwesterly winds and very popularwith suzzIertime sport salmon fishermen. During the winter, 25 to 30small crab boats ate moored in the harbor, whirh is fully exposed tostorms from the south. This fleet fishes primarily within a 10-mileradius of the ancharage and many fish late into the season. Average10-year landings for Trinidad are 800,000 lb.
Crescent City, the most northerly port in California, is home to manylarge, multipurpose fi.shing vessels. Also, many boats from out of thearea tie up there prior to the opening of crab season. The 200 vesselswhich fish crab from this port have sn easy exit to rhe sea becausethere is no bar to contend with. During the last four crab seasons,aver 707. of total northroast crab landings occurred in Crescent City Figure 8!. The 10-year average is 5,740,000 lb.
LANDING TRENDS
Northern California landings display a cyclic pattern characterized by6 or 7 years of goad production followed by 4 years of poor producrion Table 3!. The 10- and 20-year averages are 10.4 snd 8,700,000 lb,respectively,
Since landings peaked in 1976-77, there have been some significantchanges in the character of the fishery. Effort in terms of vesselswas greatest during the record seasan in 1976-77 with 439 boats Fig-ure 9!. Thereafter, landings have dropped to low levels but efforthas remained high, possibly due to hard rimes in other fisheries. Thegroundfish snd shrimp fisheries have suffered from stock declines andovercapi.talization; consequently, many of the large vessels involvedin those fisheries now go crabbing for the first month or two of theseason. An influx of dory fishermen also keeps the effort high. Doryfishing for crab became popular during the high abundance years whencrabs were easy to catch. Now, these boats, with their limited cap-abilities, stay in business during low abundance years by fishing sballow areas not frequented by larger, slower vessels. They also fishlate into the season when volume is low bur. price is sufficiently highto make a profit. In contrast to earlier years when the fishery con-sisted primarily of mid-sized, combination crab and salmon vessels, thefishing power of the modern fleet is highly mixed.
Since the late 1970s, the majority of crab landings have occurred dur-ing the first 2 months of the season Figure 10!, In the 1983-84 sea-son, 84L of the catch wss landed during the first month and 95K of to-tal landings was across the docks after the second month of fj.shingLandings have been somewhat more evenly spread out during earlier sea-sons because of landing limits and more limited fishing power. Im-proved marketing has eliminated landing limits once imposed by proces-sors. Out-of-area and out-of-state buyers have been eager to take allthe product available. Large, multipurpose fishing vessels can pro-duce more volume than the traditional single-purpose crab boat berausethey handle mare peer snd can fish at night and during rough sea con-ditions. Average-sized vessels, once accustamed to 4-month seasons,now feel the pinch caused by season compactian.
20

O Z
n.0 nt
Z 0 7l- 72- 7$- 74 7S- 78- 77- 78- 78- 80- 81- 82- 48-72 72 yn '78 78 77 74 78 80 St 82 8'2 Si
SEISOIt
FIQVRE 8. osnssnsss crss ssnrrnsrcl ~ I Itshsry tsndlnSs In Esrsks, yrlsldsd, ssd Crssesnt City
21

Table 3. Dungeness Crab Cosssercial Fishery Cyclic Averages ib!in gorthern California.
AverageLandings
Ei h Period
AverageLandings
Lo» PeriodTotal
Landi sSeason
9,735,310
1,922,148
10,474,386
1,281,444
13,330>590
4,587,4421982-8383-84
4,696,3374,478>548
10-Year Average =10,388,95020-Year Average = 8,693,249
22
1955-5656-5757-5858-5959-6060-61
1961-6262-6363-6464-65
1965-6666-6767-6868-6969-7070-71
1971-7272-7373-7474-75
1975-7676-7777-7878-7979-8080-8181-82
7,964,8779>891,6369,103,185
11,719,79610}105!9739,626>391
3>109>294640,895534,536
3>403,868
9,155,83610>076,13011,213,52711,728,06413>474,260
7>198�99
2,355,0631,046,245
323>9821,400,485
15,381,87024,811,93612,898,7616,993,965
12,233,33410,889,83110 > 1041432

IaulIOsiIu
0 Z
50 53Sl
First month Cf Ilshlrlg
01450-
SI
SEASOH
23
e 50Z6 gyrc
70
50Iu
10
50- 55- 40- SS 70- 7551 55 51 54 71 78
SEASDHfEURE KA, TRINIDAD, CRESCEHT CITY!
F10URE y. Horlhorn Californl ~ Dungonsss crabccmmorcl ~ I ~ ffort vassalsl
SS- 40- SS. 70- 75- 40- $3-hg 41 44 71 70 et go
FIQDRE 10, Horthorn Callfornl ~ Dunyonaas crab commorciai tlabarylandings durlny first month and first and second monthsof flohlny.

Low crab volume and high demand have created increased prices Figurell! . In the 1970-71 season, the initial price wes $0.25 per pound; the1983-84 seasan began at $1.45 per pound. prices as high as $2.20 perpound late in the season have helped sustain small vessels with lowoverhead
SUMMARY
The Dungeness crab fishery in northern California appears in goodhealth. Historically, landings have always returned to high levelsfollowing law production years. Fishing has been poor for two consec-utive seasons and the outlook for the 1984-85 season is probably forthat trend to continue; however, there appears to be an extremelystrong 1984 year class, which could initiate an upward swing in land-ings possibly as early as the 1987-88 seasan.
Crab abundance in the San Francisco area has remained at low levels forover 20 years. Landings during the 1983-84 seasan of 857,000 lb, ad-mittedly the highest in 14 years, are still very low. The 1984 yearclass also looks very strong in San Francisco, but. the historical re-cord of depressed populations off that area should instill caution asfar as expectations for increased production is concerned.
ABSTRACT
I i ilf I D 1 i, i ~R, * ' lit hvested in ocean waters from Norro Bay ta Crescent City. Hnti1 the ear-ly 1960s, San Francisca produced signi.ficant quantities of crabs, butsince then has experienced a maj or decline in abundance. Landings inMorro Bay and Monterey are negligible, while vhe northern Californiaparts of Fort Bragg, Eureka, Trinidad and Crescent City yield the bulkof present day landings. Crab abundance has fluctuated widely, withlandings in some years shifting fram 0.3 ta 25 million pounds over a4-year period. Since the mid-l950s, production in northern Californiahas been characterized by 6 or 7 years of good fishing, averaging 10ta 14 million pounds, followed by 4 years of poor fishing with a 1 to2 million pound average. Opening day price to the fisherman has in-creased from $.25 per pound in 1969 to $1 45 per pound in 1983. In-tense fishing effort has accompanied increases in the value and land-ings of crab, and had stayed at a high level since the season of 1975-76. With increased effort, the complexion of the fishery in the northhas changed to one dominated by 1args vessels, fishing vast quantitiesaf gear during day and nig'ht periods, even in turbulent seas. Smallervessels, with more limited capabilities, have experienced a financialsqueeze si.nce 80 percent, or mare, of total landings no& occur duringthe first month of fishing. In order to compete, some small vesselsnaw roncentrate in shallow areas, where less gear is set.

IN ID~ la
» IlCt ID
0»'4 '4IID aI 4IDI IDI I
~ 4I0
arI I IU
alDl IDI ea a IO 4 O 4 a rD a 4 a 4rrl II 0 w 4 4 0 I 4
II IV Sl S 3918d
25


An overview of Oregon Dungenesscrab fishery with management
concepts for the future
Darrell OemoryOregon Department of Fish and WildlifeNewport, Oregon
Introduction
Oregon's Dungeness cr ab fishery is composed of commercial and sportentities with the commercial port~on accounting for 98% of total har-vest. The sport harvest is mostly in several estuaries while thecommercial harvest is 1OCated in the ocean with a minor eStuary COm-ponent.
Catch and Effort
Catch records date from 1889 when 6,600 pounds of crabs were landedand remained under one million pounds until 1933. By 1937 catches hadincreased to five million pounds. Since 1937 catches have ranged from3 to 18 million pounds, becoming cyc'lic in 1963 with highs and lowsoccurring at 7 to 10-year intervals.
Effort statistics date from 1948 and up to 1970 fewer than 150 boatspartiCipated in the f iShery, SinCe 1970 there haS been a steady in-crease in the number of boats which peaked at 570 in 1980. The numberhas since declined to 325 in 1984.
Prior to 1960 catch and effort peaked ln March, April and May, but inmore recent years most of the harvest takes place during the first 2munthS of the SeaSon.
Mana ement Strate
Management of the Dungeness crab fishery evolved, in part, from fish-ing practices and dictates of dealers. In 1947 the state legislaturetransferred the responsibility from local count ies to a state agency.
27

g9
gI
gggg t9fill f999 t 999 ggyg 19yg g999
Figure 1. Oregon Dungeness crab harvest and nugggber of boats.
Regulations
Regulations have been few and relatively simple and pertained to sea-son, gear, and crab sex and size.
Season. Prior to 1948 the season was open all year. There were sum-mer and fall closures in 1948 and 1949 and from 1950 through 1963 thearea south of Cascade Head opened November 15 and closed August 15while the area north of Cascade Head opened Oecember 15 and closedSeptember 15. In 1964 the split areas were combined into one and theseason closed August 15 with 30-day extensions granted 5 times. From1978 thrOugh 1983 the SeaSon clOSed September 15 with one 30-day ex-tension. In 1984 the closing date was once again set at August 15.
A closed season generally reflected the time when most crabs weremolting and in a softshelled state. The rationale for the closure wasto reduce handling mortality of soft crabs and to insure maximumyield from the resource. Experience taught us that molting and soft-shelled state were highly variable with a tendency for molting tooccur earlier on the south coast.
Sex and size. Only male crabs at least 6-1/4 inches in width areTages t taaaaerci ~ l fish y. S a cc sages ce f this eg ~ isticlittle data has been collected on female crabs in Oregon.
28

Gear . The legal gear in Oreqon for Dungeness cr ab are ring nets orpots with escape ports, Seginning in 1983 pots must also have a de-struct device that will allow crabs to escape from lost or derelictgear. Standard pots range in size from 32 to 48 inches in diameter,but pots up to 8 feet in diameter were developed for a short-livedhelicopter fishery.
A buoy branding method is now pendinq for all pots fished in Oregonwaters.
Problems
Crowding and conflicts
There was a time when the peak of the crab harvest occurred in March,April and May, but as more people entered the fishery more of them be-gan fishing at an ear lier time. Over the past 10 years well over SOpercent of the harvest is taken in the first two months of the season.The glut of boats and gear in traditional fishing areas on opening dayfs a sight to behold. This, in turn, has prompted some fishermen toexpand fishing into nontraditional areas both inshore and out to80-100 fathoms and has resulted in conflicts with shipping, trawlers,trollers and other crabbers, as inshore crabbers reason that the deepwater crabbers are intercepting crab on their way to inshore waters.
One rationale held by some crabbers for keeping pots in certain areasis to keep drag fishing away from crab grounds. That trawlers catchcrab is well known, but how much rea1 damage is done by trawlers ispoorly documented. When the crab season closes and pots are removed anumber of trawlers immediately move into the vacated areas.
Poor Utilization
During the last month of the season in the past 4 years a major fish-ery has developed on recently molted crab. Heavy sorting at sea wasrequired and some fishermen did a much better job than others, but asubstantial amount of marginal quality crab was landed, In a veryshort time matters got out of hand and more marginal crab was landedwhich enticed more fishermen into the fishery. The result was thatconsiderab'1e low yield crab meat was put on the markets which drovethe price to fishermen down, Excessive handling at sea with a higherthan acceptable mortality and waste of the resource resulted. In 1984the season was shortened by two weeks although a similar request bystaff in 1983 was rejected.
Sport-commercial conflict
FOr all praCtiCal purpOSeS the sport fiShery iS COnfined tO eStuarieSalong with a small commercial fishery. A series of meetings with bothusers revealed that many sport crabbers are opposed to covvnercia1crabbing in estuaries on philosophical grounds . Others site crowding,unfair advantaqe and overfishing by coxvnerci al users. The bottom linewas that commercial crabbing in estuaries is now prohibited on week-ends and all holidays, and gear limited to rings only and no nmre than15 rings per boat.
29

The Canvnon Denominator
All of the above problems have a coxvnon denom1nator--too many boatsand too many pots. With the rapid increase in the number of boatscame a similar increase in the number of pots, from 30,000 in 1970 to130,000 1n 1980. As lang as entry into the fishery is unlimited theproblems wi 11 continue and most 'likely worsen.
What To Do
Given enough time many fishery problems solve themselves. However,the current situation has been greatly influenced by some actions ofthe past. A big push for easy money for boat loans during a few yearsof abundant resources inticed many people into fisheries both to catchand to process. Markets, dollar value, inflat1on and product quality or lack of it! are only a few of the factars that have put us wherewe are today. As resources diminished and hard economic t1mes besetus the reality of free enterprise has hit us hard. Perhaps just wait-ing for something to happen will demand too high a price.
! do not have the space nor time nor expertise to thoroughly explorethe complexities of modern day comrephensive fisheries management.But ! do offer same thoughts.
First, we need to recognize that there are differences in and amongresources, resource users and managers. In that context we need tolook mare to regional management scenarios and not just aur ownstates. Crabs don't recognize our boundaries, neither do fishermennor the mar ket place . My pitch is ta identify and quantify the prob-lems and then resolve them through a rational management plan. Startshave been made through the state-federal project in 1974 and the pMFCdraft plan of 1977-79. Let us proceed, preferably on a state level.
Effort control
I mentioned exceSsive effort as being the cormmn denominator to mostof our fishery problems. To affect any such measure of control sev-eral things must happen. First, there must be a major policy changeat top level from one of "let industry come up with something" to oneof promoting orderly development. Some small steps in some f1sherieshave been made, i.e., the roe herring fishery in Yaquina Bay, limita-tions on squid trawling permits, and the Puget Sound crab fishery.Once the policy change is made, we will then have to develop the database for entry control, Since much of the information will be eco-nomic in nature new staff will be required and the tools to do thejob, And we must work in a multifishery context because we, as crabmanagers, are not in this alone.
Ny vision of regional management centers around area licensing similarto that of Alaska where differenceS are recognized and incorporatedinto a management strategy. Along with licensing would be gear iden-tification and adequate enforcement capability.
30

Some 6enefits
There will, of course, be many problems and questions encountered withany significant change in management policy. 6ut we need to dwell onthe benefits.
If fishing power is matched reasonably well to resource capabilitythen the overall worth of the resource should improve. We should seeboth the price and market much more stable than at present. We shouldalso see more of the catch spread out over more of the year and lessenthe first of the year glut� . What I' 1 1 call the Oregon experience,where large amounts of unfilled crab are caught and processed, will begreatly r educed to nonsignificance, thus, improvi ng the utilization ofthe resource, With less effort economic impacts in lean times will bereduced as will conflicts with other users.
Conzaunication
I realize that this is an oversimplification of a complex and dynamicsituation, What we must do is talk to one another in our agencies,the industry, the consumer, and the final entity, the lawmakers.
To borrow someone elses title: If not now, when; If not here, where;If not us, who?
References
Catch and effort data from unpublished reports, Oregon Oepartaent ofFish and Wildlife.
Abstract
Catch records date from 1889 when 6,600 pounds of crab were landed,and remained under one million pounds until 1933. 6y 1937 catches hadincreased to five million pounds. Since 1937, catch has ranged from 3to 16 million pounds annually, becoming cyclic in 1963 with highs andlaws occurring at 7-10 year intervals.
Effort statistics date from 1948 and up to 1970 fewer than 150 boatsparticipated in the fishery. Since 1970 there has been a steadyincrease in effort which peaked at 570 in 1980. The number has sincedeclined to 370.
Crab management prior to 1947 was controlled by each coastal county,but in 1947 the State Legislature tranSferred the reSpanSibility tO astate agency. Our management policy, at first, was one of maximumsustained yield, but in recent years became optimum yield.
Regulations have been fairly simple: a closed season which generallyreflected the softshell stage of the crabs, a size limit of 6-1/4inrhes, ma'les only, gear limited to pots or ri ngs, 4-1/4 inch escapeports, and a pot destruct device to allow crabs to escape from lostgear.
31

The management policy and strategy has worked fairly well over thelong term, but as effort increased in crabbing as well as in otherfisheries, problems arose.
The opening day syndrome was honed to a fine edge, traditional crab-bing areas were crowded with pots, crabbing expanded into other fish-ing grounds and shipping lanes, sport-commercial conf!icts arose, andpoor use of the available resource occurred as fishermen and pro-cessors felt pressured to compete even though quality of the crabs waspoor and markets suffered.
Crab fishing has a future in Oregon, but serious discussion must begiven to alternative management strategies: effort control and fleetreduction to get resource and effort into balance; regional managementconcepts that recognize resource differences and fishermen inter-actions; and the political system for decision making.
32

Overview of the Washington coastalDungeness crab fishery
Steve BarryWashington Department of FisheriesMontesano, Washington
Introduction
The coastal Washington fishery occurs pr'.mari ly in the ocean betweenPt. Grenville and the Columbia RiVer fn depthS Of up tO 65 fathamS.Smaller fisheries occur in the 15 M. area south from Destruction Islandand in the three large southern coastal estuaries: Grays Harbor,Willapa Bay, and the Columbia River. About 10 percent of the seasonalcatch is taken fn the estuaries--most of this from Wi 1 1 apa 8ay, TheDestruction Island fishery is a spring-summer fishery because crabs areusually not avaifable earlier in the season. The main fishing portsare Westport in Grays Harbor, Bay Center and Tokeland fn Willapa Bayand Ilwaco and Chinook in the Columbia River.
Tagging studies indicate that the Destruction Island stock fs probablyseparate, although abundance appears to parallel the larger southernstock. The range of the southern Washfngton-northern Oregon stockextends from Pt. Grenvi lie at least as far south as Cape Lookout,Oregon--a distance of about I18 14.
The Personal Use and Commercial Fisheries
The personal use fishery occurs primarily in the coastal estuaries inthe spring and sumpter. Although scant data exists to estimate thepersonal use catch, it is probably one percent or less of the annualcoavnercfal harvest. The season is open year-round with an fndfvidualdaily bag limit of six male crabs per day, six inches or larger. Eachperson may fish two traps or ring-nets. Traps must have one 4I-inchescape port.
Responsibility for management of the commercial fishery has beendelegated by the Paciffc Fisheries Hanagement Council to the separate
33

states, w1th the provision that the states cooperatively marage theresource,
Since 1950, the commercial catch has ranged from 2.5 million pounds�981-82 season! to 18,4 million pounds �968-69 season!. Crab abun-dance has been cyclical with peaks in 1948, 1958, 1969, and 1977, andlows in 1951, 1964, 1974 ~ and 1982. Effort increased dramatirallyfollowing the peak seasons of 1968-69 and 1969-70. In recent years,reduced sa'Imon harvests have caused salmon fishermen to turn to thealready over-capitalized crab fishery to replace income. This, inturn, has caused traditional crab fishermen to increase their etfort.A result of this has been increased fishing effort in the spri~g andsurmner. Table I contains pertinent catch, effort and fleet sizeinformation far the commercial fishery since 195O.
Over the last 35 years, the season opening date for the cormrrercra!season has ranged from December I to January 1, while the seasonclosing date has ranged from September 15-30, except in 1966 whp'n 1'twas October 15. The reason for the variation in season opening dateshas usually been to achieve uniformity with Oregon. The need tor auniform season opening has become more important as size and mobilityof the fleet has 1ncreased. Since the early 1970s, the season has beenset as December I through September 15. The seasan has been extendedby 15 days when crab condition warrants.
The season closure in the fall has been 1n effect since the early 1940sbecause recruitment molting of male crabs usually occurs in the latesummer or fall. The season closure during this time minimizes mortal-ity on newly molted crabs soft-shells! due to fishing operations andincreases meat yield by minimizing harvest of unfilled crabs. In someyears, the scheduled season opening date may occur before optimum meatcondition has been reached. In this situat1on, meat condition must bebalanced against the need for a uniform season opening date, It hasbeen necessary to delay a scheduled December I opening date twice i n 15seasons.
Basic regulat1ons for the cormnercial fishery include a m1nimum sizelimit of 6I i~ches, harvest of males only and the release of soft-shells, Traps are required to have two circular 41-inch diameterescape ports. The newest regulat1on 1984! requires a vessel to have ahold inspection prior to the season opening. The purpose of thisregulation is to minimize the opportunity for illegal fishing activitydur1ng the pre-season "gear setting" period vrhich begins 88-hours priorto the actual opening date, The gear-sett1ng period was adopted in anattempt ta mitigate the competitive disadvantage in setting gear thatsmaller boats have at the season openings,
There are no "lirrited entry-type" restrictions on licenses, vessels, orthe amount of gear in the coastal fishery, though there is a licensemoratorium and gear limitatio~ in the Puget Sound fishery. Sentimentof fishermen on the coast for "limited entry" seems to have increasedin recent years.
WDF Biolo 1cal Work
Biological work can be separated 1nto two categories; routine samplingand specific studies . The primary purpose of sarap'ling activities is to
34

Table I. Catch and effort data for theDungeness crab fishery.
coastal Washington coaanercial
Estimated
Number of
Pots'
Number of
Deliveries
Lbs. Number of
Boats'Season Landed
'Figures given for 1950-51 through 1966-67 seasons from U.S. FisheryStatistics; accuracy is unknown. 1968 to 1984 data from WDF.
a?ncludes 21 boats from Oregon and California.
35
1950-511951-521952-531953-541954-551955-561956-571957-581958-591959-601960-611961-621962-631963-641964-651965-661966-671967-681968-691969-701970-711971-721972-731973-741974-751975-761976-771977-781978-791979-801980-811981-821982-831983-84
3,255,8263,364,1125,295,6776,418.0575,801,1238 >547,876
10,876,23610,961,1197,685,5256,911.2995,865,4154,384 >2344, 112,6643,342,3416,296 >500
10, 165,3958,422,551
10,789,89318,433,89617,745,64312,552,0379,199,7014,339,2213,663,9585,119.1058,516,055
11 >673 >9957, 368,6607,979,4036,546,5442,689,1422,564,7663,972,5554,700,000
696976
11688
102939397
1059388
103959083817097
138
17314712912713814113513512310595
101121
10,65010,30011,67518,30D15,60018,22513,60D14,90016,80021,58518,51517,55018,11517,96517,84517,27518,40017,50021,30033,000
40,60041,00031,10G29,10037,40034,90037,10042,40040,30033,40030,30032,400
3,9745,2804,'7506,1235,2966,4443,8584,2244,6364,5543,7344,0834,4064,3964,0144,2504,1114,1635,4747,3765,7216,2005,1534,3784,8505,5805,5995,6165,5154,4923,4703,5224,693

monitor the molting cycle of adult ma le crabs. Samples for size andshell condition data are routinely taken from commercial landings andaboard coxxsercial or WDF vessels. Shell condition grading is based onthe hardness of the carapacp when moderate finger pressure i.e.,squeezing! is applied to the ventral carapace. Grade I is character-ized as "hard-shelled". A Grade III is a crab in the "soft-shelled"stage as a result of a recent molt. Grade II is an intermediate stage.Grade I crabs may be noted as "old shells" based on the appearance oftheir exoskeleton. High percentages of "old shelled" sublega I-si zedmale crabs are sometimes noted in sumner samples; this can be anindicator of Impending molting activity. Sampling during the closedseason is conducted during October and November to obtain shell condi-tion data. Although we are frequently asked by some fishermen and thepress for pre-season abundance predictions, we feel that the CPHE fromour sampling, which is usually only one sample-set of 30 traps for twodays each month, is an unreliable index of abundance. However, lowCPUE in conjunction with other indicators may suggest low recruitment.Samples of female crabs, noting size, shell condition and reproductivestatus are also routinely taken.
The specifi c studies have covered a variety of a reas. Tagging studieson the southern coast were conducted in 1980 and 1981 using Petersondisc tags on legal-sized males to determine distribution and movement,The results indicate that a general in-shore movement occurs during thefall with a tendency for movement to be directed toward one of thethree estuaries. Experiments on handling mortality of large, soft-shelled male crabs have been conducted. Preliminary results indicate asubstantial mortality rate occurs--probably in the range of 20 percenttO 40 perCent. Weight-Width data Was cOllected to determine if thiStype of data could be used as a replacement for the she' ll gradingsystem as a method for assessing crab condition i.e. meat content/-quality. Results were mixed and therefore inconclusive. Sampling ofjuvenile populations in Grays Harbor and Wi llapa Bay was di sconti nuedafter several years when it was learned that adequate sample levelscould not be obtained with the available ma~power.
36

The Dungeness crab, Cancer magister,fisheries of British Columbia
G. S. JamiesonDepartment of Fisheries arId oceansNanaimo, British Columbia
Abstract
The Dungeness crab fishery in British Columbia consists ofgeographically distinct subfisheries, the major ones of which arelocated in McIntyre Bay and northern Hecate Strait, Chatham Sound, theFraser River estuary, the west coast of Vancouver Island, and thesouthern Gulf Is lands near Saani ch. During the 1960s, north coastlandings dominated the total catch, but since then, landings have beenrelati vely low. In contrast, south coast landings have remainedrelatively constant and now account for most of the provincial catch .Landings from each subfishery have fluctuated substantially over time,
It is estimated that at least 20% of landings are unreported, and thi scombined with the widespread nature of the overall fishery makes datainterpretation difficult . Nevertheless, fleet characteri sti cs and themultispecies nature of each subfishery are discussed. The overallfishery is a dynamic one, with about 40% of the fleet bei ng replaced onan annual basis. About one-third of the 350 or so vessels involved lhthe fishery each year land crab exclusively, with the main alternatespecies exploited being salmon. Economic data by species, vessel sizeand area are discussed in the context of exploitation patterns.
Introduction
g ge ess c b Ica cet ~ma isa ! na e been iisb d in g itisa cci sanasince the late 1%Os, Until recently, crab was the most valuablepacific invertebrate species coxvnerci ally exploited in Canada. In 1983,crab ranked eighth Table I! among all pacific fisheries, second amonginvertebrate~, in landed value $2.6 million!. Landing statistics formany high price invertebrate species are known to be underestimated,since a significant portion of the catch is often sold directly to the
37

Table 1. Landed weight and valm of British Colunbian fisheries for 1%2 asreported on sales slips. Solve: Pnnual Sunsary B.C. Catch Statistics1%2. Econanics and Statistics Branch.
Landed vain�0 3 S!
Catch t!
*!ncluies landings of B.C. fishermen at U.S. ports.~incl ules 107 t not reported on sales slips because of export mm ket.
38
SalmonHerringHal ibuNSab1 ef i shthrring spawn-on-kelpRoc kfi shBeod u:kCrab"*LingcodShrimp and prausPacific codSolesIntertidal cl ansAbaloneIbgf ish
62,56328,5982,3823, 912
17710, 356
3,1351,C024,040
6894.6892, 8971> 159
542,037
16 5> 10231, 799
7,0946> 8474,1303, 9322, 8142, 6272,4392> 1952.0991, 6271> 141
457413
1 2 34 56 789
10ll12131415

public without any documentation. It is estimated that about 8% of crabsales slip data were missing in 1983 from vessels reporting at leastsome crab catch and that an additional unreported catch of 10-20% of thereported catch is landed by other fishermen R. Harbo pers. comm.!,However, in the absence of better quality fishery data for the CanadianDungeness crab fishery, I have assumed that underreporting of catch hasbeen generally consistent between years and areas. In this paper, I usesales slip data to characteri ze geographically distinct Dungeness crabfisheries in British Columbia. Existing management rationalle andregulations are presented and the impact of alternate, compet i ngfisheries in a multi-species fishing environment is discussed. Methot in press! has recently addressed the rationale behind Americanmanagement regulations and has discussed American exploitation ofDungeness crab in the context of the excessive fishing capacity ofAmerican Dungeness crab fleets. This paper provides a complmentaryCanadian per specti ve, expandi ng on the management overview of theCanadian Dungeness cr ab fishery by Jamieson in press!,
~fh Pi shor
The Canadian Dungeness crab fishery has been centered at thenortheastern corner of the 0ueen Charlotte Islands, Chatham Sound, thewest coast of Vancouver Island around Tofino, the Victoria area, and theestuary of the Fraser River Fig. I!. Some of these fisheries werebriefly described a few decades ago Tofino area: Spencer 1932; I}ueenCharlotte Islands: McMynn 1951! and the Georgia Strait fishery has beenrecently surmnarized by Ketchen et al, �983!. In general, however,little published fishery information is available.
Canadian Dungeness crab landings peaked in 1967 at 2405 t Fig. 2! andat this time, the primary fishing grounds were in the shallow waterbanks adjacent to the 0ueen Charlotte Islands in Hecate Strait and DixonEntrance. In the late 1960s, northern crab landings decreased andalthough effort days fished! has subsequently increased substantially Fig. 2!, crab landings from this region have remained relatively low.Landed price was relatively stable prior to 1971, but has sinceincreased about seven-fold Fig. 2!. In real terms, ie. accounting forinflation Vancouver Consumer Price Index. Statistics Canada!, crabprice has increased 2.6 fold. New markets have also been developed, andnorthern crab are regularly transported alive by sea or air from theDveen Charlottes directly to American buyers,
In the south of the province, effort has also increased althoughlandings have remained near historic levels Fig. 2!. Most Dungenesscrab populations in the province are now exploited cormnerci ally Bernard1982! and any future major increase in landings is expected to reflectfluctuations in year-class strength or a price increase rather thanexpansion of the fishery into previously unfished areas.
Present crab landings as reported on sales slips include all Cancer,Paralithodes and Lithodes landings. There have been some minor king~eras Paralithod s caatschati d t tllodos aatair ~ t 1aadl O f othe north coast in recent years. Little, if any, cormrrercial fishing ofC. dr cadet ~ s o C. d a 'les has occ d.
The British Columbian coast has been divided into eight geographicalareas Fig. I, Table 2! representing what I perceive to be relativelydiscrete crab fisheries. These areas do not necessarily define
39

n"r
Washington
Fig. 1. The geographic boundaries of the eight, geographically distinctDungeness crab fisheries identified in British Columbia.Reference symbols are: IICI, IIueen Char'lotte Islands; CS,Chatham Sound; CC, Central Coast; JS, Johnstone Strait, QYI,west coast of Vancouver Island; GS, Georgia Strait; FR, FraserRi ver estuary; V ~ Vi ctoria.
40

OTAL3000
2 504O
2 00 cl
4 42000
X53ICO 1000
I 50
4I 00
IIX
10u.U.UI
0.50
alu
North Coact'160
25
120
ec
60C3
~ 1200Cr
Eftort!
600
Catch
600
Fig. 2. Annual Dungeness crab catch, effort and unit price statisticsfor British Columbia in the years 1952-82. North and Southcoasts refer to north and south of Cape Caution respectively.
41
SS eO ea To TS EO
YEAR
2.0O1
1.2 K44O
0.4I-
50
e
15I5

A ~GMrah
Statistical districtsArea code
NI! CS! CC! JS! GS! V! RVI ! FR!
I, 23,4,56-10, 3011-1314-1819-2021-2728, 29
�ueen Charlotte IslandsChathas SoundCentral CoastJohnstone StraitGeorgia StraitVictoriaMest Vancouver IslandFraser River
B. ~Sec les
~gi s c«le ~Scf es
all sal«nids ~0nco h h and sa np!
~ui 1 sas ~st ale is~C1 ~ ~hs ~a11asii, 1 cl di g her 1 g sp - .h lpall rockfish Sebastes! species
~llexa renn d 1 1 di g li gcod ~hiadon! a d gree 1' ~ gs ~he a ««us!: 0 did *; hl fish Ann~!orna fia«ria!: a ddogfish SIIualus acanthias!Pie onset'd *, 1 di g ~Hi o loss s Ra!idee
ail pandalid species shrisp and prawn!
Ca ~mister ith pos ihl 1 1 di gs ofca cer graductus, t thud «L~ a a
Paral i thodes ca!ntschati ca
Sal s!n
Halibut
Herring
Rockfish
Roundf i sh
Flatfish
Shrins!
Crab
all aollusc species
any other species landed coneercially
Molluscs
Other
42
1Table 2. Definitions of geographical and species groupings used in thispaper,

different crab stocks, as population mixing in the larval stages atleast undoubtedly occurs among many of these areas, but it does considergeographical differences, the relative ax!bility of fishing vessels ineach area and historical fishing patterns.
t. ~ist r is o 1 the ie majo p 1 fished ~ b t sh t 1 mbiafor which there is unlimited entry to the fishery. Any vessel licensedin category A, 8, or H all salmon!, C general!, G geoduck: ~pano e~ab s t !, K ash!amish: A o 1 ~ orna 1 b i !, t ttaiibet: ~tl loss s~ate a e 1s!, S sh imp tra, o !p o osddiish tr eel! my �sh forcrabs using trap gear. On average, 7300 vessels have been licensed tofish each year over the past 15 years, but because some vessels aremulti-licenced, si aple addition of the numbers for the various licencecategories in a given year cannot be used to establish accurately thenumber of vessels that may potentially fish crab. Of the 8583 vessellicences issued in British Columbia in 1983, 6715 licences would permitcrab fishing, suggesting that about 5000-6000 vessels of the 7217vessels actually 'licenced might potentially do so. Only about 350vessels annually actually did so in recent years Table 3!.
A defined Dungeness crab fleet, consisting of vessels dedicated tofishing crab over a number of years, appears to be very small in BritishColumbia, as the turn-over rate of vessels participating in the crabfishery is high Table 3!. Over the years 1979-83, 37% of the vesselsparticipating in the previous year have on average dropped out of thefishery each year; 41% of the vessels participating each year have beennew to the fishery. 0f the 948 vessels which participated in thefishery from 1978-83, 52% participated for only one year and only 5'Lparticipated for all six years.
Canadian crab landings as a whole do not demonstrate clearly thecyclical fluctuations in abundance Fig. 2! which have characterizedso m geographically more discrete, American crab fisheries, and inparticular the northern California crab fishery I4cKelvey et al.,1980!. Subfishery landings fluctuate Fig. 3! but with the presentpreliminary analysis, it is unclear how landings reflect crab abundanceper se.
With respect to landings from the Oueen Charlottes, the recent decreasemay partially reflect a changing market and associated catch reportingproblems; some crab fishermen fishing Oueen Charlotte waters areinadvertently not providing sales slip data to Canadian authorities.However, there is anecdotal evidence from fishermen that a prolongeddecrease in crab abundance has occurred si nce the late 1960s. A morecomprehensive evaluation of past Canadian crab fishery statistics todetermine if other such vagaries exist seems justified before morerigorous analyzes are initiated.
When a fishing fleet is not dedicated to exploiting a specific species,catch of a species does not always reflect the relative abundance ofthat speci es but, may be influenced by the relative economic return fromother competing fisheries. Relative to Dungeness crab landings inAmerican states Table 4!, recent British Columbia crab landings arerelatively low in magnitude. An explanation for this low Canadianharvest 1s not known and it is unclear as to whether fishery, habitat,oceanographic or biotic factors are nest important.
The characteristics of those vessels fi shing crab in 1983 Table 5!

Table 3. Number of vessels actively participating in the Dungeness crabfishery on an annual basis, and the number of years of participation byvessels between 1978 and 1983.
No. of active vesselsRange* of potentialnumber of active
crab vessels d New Departed TotalYear
~ >caber of licences in the largest single licence category ie. A! tothe total number of licences issued in all licence categories permittingcrab fishing A, 8, C, G, K, L, S, T and Ni, assuming complete and nomulti-licencing of vessels respectively.
No. of active vesselsNo. of years ofactive participation
1978-83
Total
44
197819791980198119821983
4677 - 64444602 � 69614543 � 67874547 - 67354470 - 66174364 - 6715
49319391655749
252147 168 105 315191 150 124 341227 140 114 367238 114 128 353235 128 118 363
5220
10 7 6 5
1000
BO
160
80
landings in the eight fisheriesColumbi a. Reference symbols andare described in Table 2 and Fig. 1
Fig, 3.
~ 160
C7
01950 55 60
Annual Dungeness crabidentified in Britishgeographic boundariesrespect i vely,
65YEAR
70 75 80

Table 4. Dungeness crab landings t! by political region for the years1978-83 Source: Pac. Nar. Fish. Coen. Annual Rep., 1978-83!.
Calendaryear B.C. AlaskaFishing season California Oregon Washington
6260 4717 32663765 7439 37656214 8255 29485352 4309 11794763 3946 11632404 1859 1814
*landings reported as of Septenber 1, 1984
Table 5. Number of vessels fishing crab in 1983 and their average length,presented by geographical area see Table 2 for area code explanation!, Datawas available for only 338 of the 363 vessels which fished crab in 1983.
Number of vessels fishing and their average length m!
IO 10 «20
Areacode L n
20.821.4
30.935.622.629.6
12.0 7Total 149 7,7 26.1
46
0CICSCCJSGSVWVIFR
1977-781978-791979-801980-811981-821982-83
310112962454151
9,07.77.47,67.87.47.48.1
2840256751346753
13.412.812.012.211.812.312.411.4
197819791980198119821983
1DB9 32661043 29031542 26761270 70761002 7348843» 5216

indicate that crab fishing is predominantly a small boat fishery. Of the363 vessels fishing crab in 1983, length infarmation was available for338 vessels and of these, 44% were <10 m in length, 64% were10 m «20 m, and only 2% were >20 m. The overall average length was10.4 mo slightly shorter than the average length of vessels reported forthe California crab fishery Dahlstrom and Wild 1983; Methot in press!,Evaluation of the mobility of Canadian crab fishing vessels betweenidentified fishing areas was determined by comparing locations offishing activity with the vessel 's designated home port, which wasestimated from the registered mailing address of each vessel owner,Actual home part information was only available for 1981 and for onlyabout 26% of all licensed vessels, but of the 101 crab fishing vesselsin that year for which bath data were available, 90'% had identicaladdress and hearn port area locations. On the basis of this highcorrelation, the fishing areas of the 261 vessels in 1983 for whichowner addresses could be found was determined from sales slip data Table 6!. Of the total nuraber of fishing records reported bycrab-fishing vessels, an average of 47% for all species fished,including crab, and 68% from crab alone were made by fishermen in thearea in which the owner resided, Fishing in other areas thus largelyoccurred while fishing species other than crab and this was rm3st oftenin geographically adjacent areas, as might be expected from therelatively small size of the vessels invo'Ived.
Between areas, the greatest number of fishing records in 1983 was fromGeorgia Strait around to the west coast of Vancouver Island �8% of thelanding records for all species; 83% of crab landing records!. Only 2%of the total number of crab fishing records were from the OueenCharlotte Islands, although sorrm landings are known to be missing.Mevertheless, the region with the greatest intensity of crab fishing atthe present is the south coast of the province.
Cor o t ~R! st1oos
Methot in press! has described in detail rmrch of the managementrationale behind American crab regulations and to a large extent, theseapply to the Canadian fishery as well Miller 1976; Jamieson inpress!. Canadian crab fishery regulations have as general objectivesconservation of the resource, maintaining stability of landings,maintaining product quality and recognizing and addressing sorialconcerns. Restrictive measures include control of gear type, minirmrmcrab size at landing, season and areas closures, and althoughoperationally ineffective, a license requirement Table 7!. In contrastto American regulations Methot 1986!, Canadian fishermen may legallyfish female crabs, berried or not, so long as they raeet the minirmrmsho11 fdth, spf t pf . of 165 �15 f C !r od ot s!.This minimurx size limit applies to both sexes but because female crabsseldom reach this size, relatively few female crabs are actuallyfished. On occasion, though, large female crabs may occurin abundanceand landings from certain locations may primarily consist of only femalecrabs.
When a minirmrm size limit for crab was first introduced inta Canadianfishery regu 1 atians is uncertain, but it appears to have been in the1910's and was presumably set so that male crabs would be mature for 2-3years before they recruited to the fishery. There is na publishedevidence that this specific rrrini mum size is optimal.
47

O OIID NOE I/I0 NClCO CE
4CIClIOLIO CIE
CO DIEJEEJ
CJ
ICE- OLE OIEEVl CJ g
EJ XCJ EC
N
C
IJI
a%0Icl
W IEEEO
0 NK CJIC
CJDS
w 0 N H H Yl 0 0 e Ol + N w CO CO WN N OI N m W CJI CO CO C/E 0 I/E N ~ IN W N A A CO N P N Ct ct CEJ EO'N A N
0 0 ~ 0 0 O O 0 CIE CIE N ECI 0 0 ICI CEJcf r
0 0 0 0 0 0 EO 4 CO W OI ICI Q 8 W CON-N N POP-
+QOQQOO+N++t CL CO+CO/EIEO N W
O 0 CIJ O ECE CIJ CEJ W Ct Cu Ct N O 0 CO OICE m
A O CIJ Q 0 Q C EJE CO OI N e CO QI/EP N I
NOICE+r WECIQctNQQ~Qd 0CEI EO
4 0 CO g 0 0 6 8 w w N 0 w 0 N 0CEJ
Qg g +CO 0 COO OO0 ON 0+0
D D D D D D DEC ICI CJ IO IC Id CJ IEEC I- C C I I- ECC O 4 0 CC L3 CC CJ Cf CJ CC 0 CC 0 CC O
CO Q W N w ECJ O CtlN ct 4 P! EO
I/I 0 I/E E/IC7 V u 0 CO ! R JJ
~R1atian
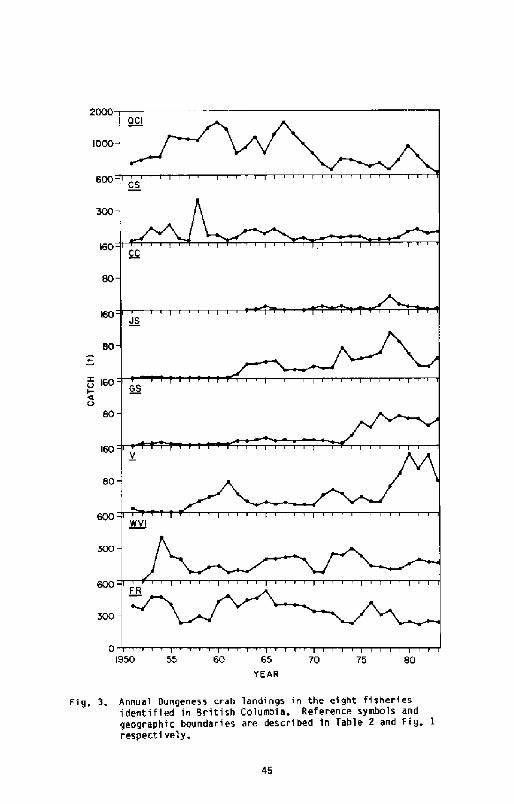
Gear typeClosed areasClosed seasonsLicence requiredGear limitationsEscape ports requiredTrap destruct devicerequi redGear identificationrequired
Unlawful to have gearin water <ring a closure
fiiniaaan frequency oftending traps specified
mi ninum carapace widthFemales retainableSoft-shell crab definedReturn sublegal crabs unharamd unharmed undefined!
Bag limit
YesYesNoNoYesNoNo
YesYesYesYesHoYesNo
Yes Yes
Yes Yes
Ho Yes
YesYesNoYes
YesYesHoYes
No
49
Table 7, Presence or absence of specific fishery regulations in therecreational and cmmmrcial dungeness crab fisheries of British Coluabfa.

While a minimum size limit is the main management tool, area and seasonc'Iosures of the commercial fishery have been introduced in specific baysand areas to address local concerns, including navi gati on, pollution,the landing of soft-shell crabs, and the preser vation of native andsports fisheries. The decision to close and/or open local crabfisheries may be made by fishery officers, management biologists and/orarea managers. Existing, pre-determined closures to prevent the landingof soft-shelled crabs may be a relatively poor method of maintaining ahigh product quality, as depending on ocean climate, the temporaloccurrence of moulting can vary on an annual basis. In-seasonmonitoring should really be effected if optimal closure dates are to bedetermined; present closure dates are established at least one year tnadvance, Alternate xmthods might be; I! to expect, buyers to controlproduct quality through a differential price structure based on shellhardness, and the absence of such a scheme suggests that poor productquality is not as important to the processor as perceived by theresource nmnagers. This approach has the additional advantage ofminimizing enforcement and management costs; 2! to routinely moult stagea subsample of the conmmrcial crab catch. using a method similar toAiken's �973! for lobster, and to close the fishery when moulting of apredetermined fraction eg. > 20%! is inminent. This is being proposedin the management of Gulf of St. Lawrence snow crab Chionoecetes~oilio! R, Elner, pers. conm.!
Gear restriction in the coavnercial fishery appears ambiguous as thePacific Shellfish Regulations Anon, 1983! state that only traps, dipnets, and ring nets may be used, while the 1984 Commercial FishingGuide, Pacific Region, a less authorative publication but one xmrewidely distributed, states that only spears, ji gs, gaffs, rakes, orsharp pointed instrunmnts are restricted, The status of trawling isthus uncertain, although relatively few crab are reported as beinglanded by this fishing method I t in 1983!.
Only one escape port is required in Canada in commercial traps, incont rast to the two required by American state regulations, The escapeport must be a minimum of 100 mv in diameter if circular or 50 by 100 mmif rectangular, and xust be located not more than 10 cm below the frameat the top of the trap. This is smaller than the 108 mx �10 am inAlaska! diameter escape ports required in American traps. Thedi sadvantage of having only one escape port is that occasionally a crabwi Il block it. Escape port size could probably be slightly larger,allowing the release of more subl egal size crabs with little increase i nthe escapement of legal size crabs, as indicated by Wild and Tasto�983!, The cost of requiring all neer traps to meet new specificationswould likely not be great, but such a requirement might be unattractiveto fishermen. Ho prograamm is presently planned in British Columbia toinvestigate this subject.
There is some concern that 'lost traps will continue fishing ie, ghostfishing!, since no trap destruct deviceS are required in BritishColumbia. The extent of such fishing is difficult to assess and thenumber of traps lost annually is presently unknown. Methot in press !reports that about I0% of American traps are lost annually .
In suxvnary, Dungeness crab have been nmnaged passively in thatregulations have not generally been used to modify landings on an annualbasis. Present regulations have mostly been in effect for decades.Oami eson in press! has suggested that the widespread nature of the
50

fishery and the absence from it of the larger fish processing companiesmay have hindered in the past development of an effective 'lobby for crabinterests. The collapse of northern crab landings in the early 1970'sresulted in little new research and no change in the management of theresource. Fishermen have become more organized in recent years andtheir participation fn discussions on the study and management of crabis encouraged.
M~ttt- ' t ~At
Vessels used for fishing crab are mostly small, inshore vessels andinclude herring ski ffs, salmon trollers, and long-liners. A few largervessels, such as seiners, draggers and blackcod vessels alsoparticipate, making the Dungeness crab fishery only a part of a suchlarger vuitf-species fishery complex.
To put the relative magnitude of the crab fishery into perspective, onefirst has to appreciate the dominating effect salmon fishing has overother British Columbian fisheries Table 1!. [n 1982, salmonrepresented 71% of the total landed value $202,3 million! from allfisheries in British Columbia. In contrast, the landed value of crab $2.6 million! was 1.1% of this total, The total landed value of allspecies fished by vessels which landed crab was only 3% of the totallanded value of all regional fisheries. This relative importancecontrasts significantly with the fisheries of central and northernCalifornia, where the landed value of Dungeness crab in 1983 was $U.S.7.9 mill fon, or 19,1% of the total landed value of all species 'Hethot,1985!,
To investi gate the characteristics of multi� -species fishing by crabfishing vessels, the species fished by these vessels were allocatedamong 10 species gr ouping Table 2! whi ch include all coxvnercfa1 speciesfished in British Columbia. Crab landings from vessels which cou ld notbe identified were excluded. Table 8 i ndi cates the total number ofvessels involved duri ng the years 1978-83, their relative involvement ineach species fishery, and the average annual dollar return per vessel.Relatively little fishing occurred for flatfish and molluscs and so datafor these species groups was combfned with the 'other' group in thistable. There were relatively large increases in the number of vesselsff shing crab in 1978 and 1979, but since then, number of acti ve vesselsper year has been about 350 �'able 8!. Among these vessels, there hasbeen a general increase in their involvement i n salmon and shrimpfishing, but for the other species groups, no consistent pattern appearsevident. In terms of average price in recent years, only crab showedboth a general annual increase and a real price increase Table 8!,after accounting for 58% inflation between 1978-83 Vancouver ConsumerPrice Index, Statistics Canada!. Average annual dollar return pervessel peaked in 1982 and in 1983, it dropped to a level $19,100! lastencountered in 1978-79. The relatively high price of crab suggests thatover the near future, there is likely to be sustafned pressure on crabin an effort by fishermen to increase their income. Any increase incrab price or abundance will likely be reflected by increased effort asindicated by the recent tendency of fishermen to remain fn the fishery Table 3!.
A similar analysis was conducted for each geographical area Table 9!for the major species groups fished there, and it was evident that theprovincial pattern is largely the result of changes in fishi ng act i vity
51

IIIO'I
OIO.
O
OI
52
~Mr IOIClC92IEO EO IO g ~ IA
~QRNNQ
m N IO m IO mIO IA IO M ~ IOIOP! V!PIP! N
OI IO OlN ad N 8 IO N
pwmcr g I
IO W cr Ct IIl &
N W O Pl CII 4AN W g N W&
IO ~C IC Olg& 8
IC m0 4I
W N A IO O IO~ ~ ~ ~OI IO N N N COwNNNN
I I I I I
a IONSOIIOWNNMwW
Ct N ct ID Cf 'tt
Ill/ g Ol~ + ~ ! wIOIOIOO
w IO w IO w wIO ~ ~ ~ ~ IO
+ w 6 0 HO
g~ IOQ ~p92 P! N N ID 'Il'
N H le R N IOw N Cl N IC N~ ~NANNA
QQmR

Table 9. Ilm A! rrmbrrof active flddrsl vessels mrd gl artrq}enid for vesel RF ! bfye ilr the m4!rr spa:les gnps fidel see Tkle 2 fw cede rsylrrmtiorl!.
k Nnherofvemels
Saimn Hslbd: 06 Saisrrr Ihl~ 04 Sahrn Rmlfi* 9rtsp 0*
Salnn lhrrdfl* Srmp 0'4 Sairsn Qrmp Crh
2 Z? 16 75 285 22 16 87 247 18 17 68 286 26 16 64 267 16 5 40 264 12 4 3l 18
8. Areale~ lsr vessel QR!
Sahm Haling 08! Saisrn HalhC 0'cb
Sa'Imm fbuxlfidr Srhp 04 Salssrr 9risp 0k
19 6 2 4 4BI 7 1 4 510 1 3 4 635 1 1 4 I05 1 2 4 86 0 1 3 4
53
19919K1%l1%01%91918
19131%219ll1%619t91978
1991%E1%%1%919r9
199198?1911Igg1%9
14 13 13 2418 11 23 2126 12 31 2418 16 21 V13 12 21 2015 17 14 19
16 27 19 12V Z3 19 2536 23 34 1427 19 64 1142 39 44 1333 13 39 12
75
8 8 616
202317XI
Zl
9221414227
10
8 7 64 2
53
33311714
49 ll 7434 15 6924 138! 7 39Zi 8 4416 4 25
3 2 9V 6 86 5 101 21 11 52 4 8

in a few specific geographic areas. In terms of number of crab vesselsactively participating in each fishery, the only areas showingmajor increases were the west coast of Vancouver Island WVI! andVictoria V !, Off the west coast, increased participation by crabfishing vessels in salmon, roundfish and shrimp fishing occurred.Around Victoria, shrinp and groundfi sh fishi ng showed i ncreased crabvessel participation. In both areas, number of vessels fi shi ng cr abalso increased. These trends were not generally correlated with anincrease in the landed dollar return per vessel by species grouping,which suggests that increased effort may have negated any increase inincome. The only instance of a consistent increase in income per vesselby species group was for crab in Chatham Sound, a location where thenumber of vessels fishi ng showed no clear trend over the six-year timeperiod.
When fishing activity and economic return among subfisheries and speci esgroups is compared for a specific year 1983!, it is evident that mostearned income by vessels which fish crab is actually from crab Table10!. Thirty-nine percent of the total landed value for all speciesfished was represented by crab. However, this was only because 32% ofthe vessels fished crab exclusively Table 12!, and in a comparison ofaverage dollar return per vessel between species groups, crab ranked adistant fourth $7500! behind herring $30,600!, halibut $26,200!, andsalmon $21 ' 600! Table 10 !. The greatest total landed value by area S1.9 million! occurred off the west coast of Vancouver Island, whereasthe largest average income per vessel was in the queen Charlottes $28,100!, followed by the west coast af Vancouver Island $16,900! andChatham Sound $16,700!.
The income earned from a vessel is both a functi on of the species fishedand often, its relative size. Crab accounted for 63, 32, and 29% of thetotal average income from small <10 m!, medium TO<<20 m! and large >20 m! vessels respectively Table 11!. The smaller the vessel, theless it was used for multi� -species fish i ng. While thi s generalizationmay apply to the province on a whole, for vessels in the Fraser Riverestuary, relatively little multi-species fishi ng was evident, Almostthe enti re income earned by these vessel categories came from crabfishing.
The effect of vessel size on crab landings was further analyzed bycomparing income earned through crab fishing alone among those vesselsused to fish crab exclusively and those vessels used in fishing otherspecies as well Table 12!, On the west coast of Vancouver Island,full-time crab fishermen earned considerably more through crab fishingthan did fishermen fishing crab along with other species, and for theselatter fishermen, crab fishing appeared to be a relatively minoractivity. In contrast, i n the F raser River esturary, the highest crabincome was earned by the numerically fewer, multi-species fishermen,while a large number of fishermen appeared to fish only crab but inrelatively smal I quantities, This may reflect the close geographicalproximity of this latter site to Vancouver, a major urban area, and theresulting participation of many part-time fishermen who have primaryjobs in other industries.
Finally, the seasonal nature of crab fishing was analyzed to establishhow fishermen allocated their effort among alternate fisheries open atthe same time. The major species landed in the major crab fishing areaswere considered Table 13! ~ and the most, obvi ous feature was that alone
54

r 0 r 0 hl'o ct r 0 IOe 0tn 0 cr rc N IrlIO RVa e Oa
40 4 4 ~ C 'tr N sa cv saa ~ ~Oar oO � 0CI4
4 44
0 '4 N Cva ~ ~Irl 0 0 N 0va4'0 e04
04 CDCV Sa an e 0 00 CV CV rn e Ct r
4 4CV
4'g I-C
0 0 4 0 e O NC ~ ~N ca e N e 0 CV0 ~ ICt+
N e 4 cv 0CV rc e «I OI !0 IttaCv cr NI e ttcnloa
L
104 4N e
0 0 O 0 ' tta ata' 0 40 0
DIC00*
'0 C cv rv r- rv 4 r tn e0 o o o r e Iv' o ~ t cv
StCI
I Irl0 ~0VlCt 044 aIIIC '04 C4
eoettaar~ ~ ~OOCV0O0
4St
OtC
«ltII ra 0 tDI e 0 r O
Irl~ ~o 4 o 0 o 0 CV'ta O DCva4 trt+. Ct4 0D 0 'e 0 Io e
r 0 e ra O O ar 0 eN CV0 0 4 0 CVCV~ n4To Io et
CV I0 eO
SOB $>eearO~ I
CC 0aa I4 4C. C3 In 'In
55
4 44 a44 4cc44a 44
0 C8 4S ztat
00 CC
4 Ilt4 +'4 Sl 4t CO
CV 0 ICI Ivl va vl cv
0 e Cv r e 0 lv g
e 0 0 e 4 cvrerrag
0 e CV 0 CV Oa Sa NN CV N
0 r- CV e e ra CV
CV 0 e 0 N 0 Ita 0
0 CV ra Ct NCV CV YI ICI CV 00 0 ar I
e N IO N CD
0 0 0 IV 0 r ltlCV
CI g r e 0 0 g
cv ra g cv 0aN~ -RIVOr I-CV
0 0 0 Ct tn CV 0 I0 tn lst
RSVP" g
0 Novaesao 0 0r ol vt
greooeoeN eSa
eeecaorN g CV g g trt Dt
Sl0 ano Vt trt 4 g 0O CS 0 0 0 > 4 IL

Table ll. The nunber of vessels fishing and the average valu. of a vessel's1983 landing by vessel length and area see Table 2 for area codeexplanation!, All = all species inclu!ed; Crab = ~ly crab landings.
Hnmber of vessels fishing and the aveage val ~of ! andings �0 5! by vessel length m!
Area code SpeciesV n Vn V n
CS
CC
IVI
FR
25.5 7 85.88.1 7 24.5
149 10. 7 182.149 6. 7 182
Total* AllCrab
«not the total of the nunber of vessels froa each area since a singlevessel may fish a nunber of areas.
56
AllCrabAl 'ICrabAllCr abAl 1CrabAl 1CrabAllCrabAllCrabAllCrab
3 32 283 0 4 8
10 6.6 409 4.9 24
11 9.8 252 0 3 6
29 3.0 6721 1. 1 4162 4.8 5143 2, 7 3545 4. 7 3441 4.0 2941 9 2 6732 7 7 3751 8.7 5345 89 40
25.610. 418.013. 1
7,21. 9
31. 23,05.52.66.92.9
21. 3ll. 09.29.0
2 99.72 78. 23 37.92 5.2003 3L2
0.12 4.9D1 55.D1 04 32.22 2.400

Table 12. The nuaber of vessels fishing and the average vaiu. of a vessel's1983 landing by vessel length and area see Table 2 for area codeexplanation!. C = those vessels that fished only crab; C+ = the valu ofcrab landings for those vessels that fished other species as veil as crab.
Nusber of vessels fi~hing and the average value oflandings �0 ! by vessel length m!
<10 10 « 20 0
Area SpeciesCode v n
86,170. 3
CS
CC
0.1
0. 03,01.8
NCI
FR
11,4 16.7 6
Total C 63C+ 86
3,028. 1
8. 5 535,4 129
57
CC+CC+CC+CC+CC+CC+CC+CC+
2 1 73
2 0 8132419231820123510
0.6 40.1 45.9 121.2 120.3 3
30.5 161.5 252.1 143.5 213. 3 185.0 11
10. 0 123.9 256.3 30
18. 0 10
108 110.0 180 0
13.2 21.4 02.4 03,8 02.5 124 02.6 024 03.8 1
21.1 16. 27.8 0
12.8 0

a L«3
Ct th elh EI 4 C 0 ElElCl Lo
4 I O
4
El
40 L.0
N'0 4 IE
lh
4 0 4 A.Cl
C D E 4 N «! lh
I0
0 Ici IN AI lh I CE e loe e Et ES eIA4 0 0 N CC Irl CR CD Ih «!ICIIO N01 I eN
C 0VtE!-El«S
L 0
L 0I e lh A.C!EI N
0 4 ICl
ICl
Al I! Al N rflN Al C!C
EIC Sff'0 0C 0EI 0
El0 S-
I! rN O' 0 N N CS0 eCO N Et
Ih e e lhN4 lh lh 0 CIEI Cl CE loN
' '4IA L0
El Rt- E 0 0 4IC a
58
4L 04 rl4IS 40 IaEtC C0�EI CEl4IA
0 SI
4 L 4«r
C 4 ElCr
0 0 I«th.
5A
a L«3Cr
L I
Z E-
4 C 0 E 0IO
L > C Ol C C- ! «rA O 0 0 0 4 0 0C Ih 0 T CI I-
EIIL«4
LIE I/I
8E4
'0 EsC 4a LClT
I 4Ih
D ltC PIO C! lh4X
E EI
e 4 c e '0 e N IO 4 0' 0 0 Nr r e e e IA e e ht eN rh ht N N HN
O' Ih N IO O' lr' 0 0 Ici NC
co 'N 4 cs c IA IA ol 4 r N NN 'N Irl IO lh Ol «0 A N El IA V92 Cl'0
4 Et I L > C � Oto A ! 0+.4 4 0 0 a 0 0 0 4 0 0 4 oIE x c $ '1 N c e «! z «!

among all the species groups considered, crab fishing occurred in allmonths of the year in every area. Bad weather during the winter monthsreduced landing in most areas, and for all areas combined, landingspeaked in July and August but were substantial from May to October. Theoccu rr- nce of other fisheries has little obvious effect on monthly crablandings by area, which seem to be most influenced by local seasonalcrab cl osures . Thus, in the Fraser River and Dixon Entrance, closure ofmajor grounds in the spring May I to July 15: soft shell! and thesurrmrer July 10 to Sept 20: soft-shell� ! respectively reduced somemonth's landings. The F raser River closure seems to result in highlandings on reopeni ng of the fi shery, presumably because of both theexpectati on by fishermen of high landings and a result i ng effortincrease, and an increase in crab catchability because of warmer watertemperatures and their recent moulting.
In conclusion, crab fishing in British Columbia is part of a large,rmrlti -species fishi ng complex wi th pr onounced geographical areadifferences. It is difficult to characterize, and is a very dynamicfishery with many parti ci pants enteri ng and leaving on an annualbasis, Although crab fishing is of significance in terms of dollarvalue, it has been so aver-shadowed by salmon and herring fisheries thatrelatively little research and management effort has been devoted toit. However, studies are presently underway or are being proposed toinvestigate more fully crab biology and rrxrlti -species fisheryimplications arising from change in existing regulations in any of theassoci ated fisheries. This should permit improved understanding of howfi sheri es impact on each other and of the importance of havingrelatively minor, unlimited entry fisheries to buffer fluctuations inincome from 1 arger, higher profile fi sheries.
I wish to thank D. Heritage and W. Carolsfeld for their technicalassistance, W. Grider for her assistance in providi ng licensing data,our Word Processing Unit for typing and T. Butler, Or. P. Breen,D . Carson, R. Mylchreest and Dr. H. Sl oan for their constructivecomments and review.
References
Aiken, D. E. 1973. Proecdysis, setal development and molt predirtionin the American lobster Homarus americanus!. J. Fish. Res. Bd.Canada 30: 1 337-1344.
Anon, 1983. Pacific shellfish regulations. Mo. 105. Departmental Actsand Regulations Manual. Department of Fisheries and Oceans,Government of Canada.
Bernard, F. R ., ed. !. 1982, Assessment of i nvertebrate stocks off thewest coast of Canada 1981! . Can. Tech . Rep, Fish. Aquat . Sci,1074; 39p.
Dalstrom, W. A. and P. S. Wild. 1983. A history of Dungeness crabfisheries in California. pp. 7-24. In: D. W. Wild and R. M.Tasto, eds ! tife history, environment, and mari cultu r studi es ofth h ga ss c at. Ca ~it, 'th ph t th tCalifornia fiShery reSOurCe, Calif. Dept. FiSh, and Garne, Bull.172: 1-352 p.
59

Jamieson, G. S. A perspertive on invertebrate fisheriesmanagement-the British Columbian experience. In. Jamieson, G. S,and N, Bourne ed.!. Invertebrate stock assessment and management.Can. Spec, Publ. Fish, Aquat. Sci.: in press.
Ketchen, K, S., N, Bourne, and T. H. Butler. 1983. History and presentstatus of fisheries for marine fishes and invertebrates in theStrait of Georgia, British Columbia. Can. J, Fish. Aquat, Sci, 40:1095-1119.
HcKelvey, R, a D, Hankin, K. Yanosko and C. Snygg. 1980. Stab'le cyclesin multi -stage recruitment. models; an application to the northernc ~ 11inr ' Dn 9 ness crab ca r ~isle t ri heries. c . J.Fish. Aquat. Sci, 37: 2323~
McMynn, R. G, 1951. The crab fishery off Graham Island, BritishColumbia, to 1948. Bull. Biol. Board Can. 91: 21p.
Methot, R. D� Jr. Management of Dungeness crab fisheries. In:Jamieson, G. S. and N, Bourne ed.!. Invertebrate stock assessmentand management, Can. Spec. Pub. Fish. Aquat. Sci,: in press,
Hiller, R. J. 1976, North Acveri can crab fisheries: regulations andtheir rationales. Fish, Bull. 74: 623-633.
Gp ~ r, G. J, 1932. the cn ia1 rab, Ca r ~ma iste Dana, inClayoquot Sound, Vancouver Island. Bull. Biol. Board, Can, 30:18p.
Wild, D. W. and R. N, Tasto eds.!. 1983. Life history, environment,and mari culture studi es of the Dungeness crab, Cancer mac~ister withemphasis on the central California fishery resource. Maioli . Dept.Fish. and Game, Fish. Bull. 172: 1-352p.

A brief review of the commercialfisheries for Cancer magister in
southeast Alaska and Yakutat waters,with emphasis on recent seasons
Timothy M. KoenemanAlaSka Department Of FiSh arid CamePetersburg, Alaska
Descri tion of Fisheries
Yakutat.
Two distinct fisheries exist within Statistical Area A. Dungeness crab,Cancer ma ister, are harvested from the exposed open-ocean coast betweenCape Fa rweather and Cape Suckling which encompasses the Yakutat Fishery Fig. 1!. This fishery is most similar to major Dungeness fisheries inOther areaS, in that prime fiShing grOundS are ShallOw pOrtiOnS � to 30fathoms! of the continental shelf influenced by adjacent estuaries.Yessels participating in the Yakutat fishery have orimarily been non-reSident veSSelS, utilizing Standard oCean DungeneSS gear, whiCh iSindependently suspended from buoys in sets along depth contour lines.Coammn bait is a mixture of squid and herring, and natural populationsof subtidal razor clams, Silqua patula, are present in the substrate,Dungeness crab harvested ~vari t e YaYYutat fishery are of extremely goodquality in terms of size and shell color. Waters on either side of IcyBay have been traditionally good harvest areas, with waters of' YakutatBay to Cape Fairweaiher contributing to a 'lesser degree. Historically,the greatest production of the harvest is taken during June and July.
Southeast Alaska.
The Southeast Alaska fishery is conducted in the convoluted bays, andestuaries south and east of Cape Fai rweather, extending to Dixon Entrance Fig. 2!. This fishery is primarily a bay fishery with di stri cts 5, 6,8, 13, and 14 contributi ng significantly . The Sti kine River delta ofdistrict 8 and the Duncan Canal estuary of district 6 have been histori-cally important fishing locations. Yessels participating in this fisheryare primarily smaller vessels ported in various Southeast Alaska communi-ties. However, beginning with the 1981/82 season, an influx of largernon-resident vessels entered the fishery. Pots are individually fi shed
61

Figure l. Location of the Gulf of Alaska Coastline Utilized inthe Yakutat Commercial Dungeness Crab Fishery.

Figure 2. Location of the Gulf of Alaska coastlineutilized in the Southeast Alaska commercialDungeness crab fishery.
63

in small numbers in bays and along straits and sounds. Fishing along theedge of the Stikine River delta is similar to the large-stringed oceanfishery. Historically, significant harvests occur from June throughSeptember. Most crab of ocean quality are processed for a meat-packproduct, In recent years, some of the harvest has been flown 1ive tomarket,
~Re I ~ t'o
Existing regulations concur to traditional size and sex regulationsimplemented in other Dungeness crab fisheries, but compromise traditionalregulations by allowing the fisheries to be conducted during potentialmolting and mating seasons. Historic notes from the comnercial fisheriesand past research information indicate that: molting, mating and egg-bearing periods in Southeast Alaska and Yakutat are very similar toother Dungeness stocks. During low effort levels and slow-paced fish-eries the effects of handling crab during sensitive life history stagesmay be sionificantly less than during high effort levels and intensefisheries, The magnitude of such handling mortalities have not beendetermined to date, but intuitively high effort levels during intensefisheries from May through August are a detriment to stock conditions .Handling mortalities are increased as inexperienced operators enter thefisheries.
Major regulations pertaining to the Yakutat and Southeast AlaskaDungeness fi sheri es are very similar at the current time.
l. Male only harvest,
Minimum legal size of 6,5 inches in carapace width excludingtenth antero-lateral spines!.
3, No water storage of gear during closed seasons.
4. Registration prior to fishing.
5. Alaska Department of Fish and Game number marked on each buoy.
6. Both the Yakutat and Southeast A'iaska districts are super-exclusive. Valid registration in one district precludes thatvessel from fishing in another district or area in thatregistration year.
7. Two 4- 3/8 inch escape ri ngs are required, and a maximumtunnel perimeter of 30 inches is prescribed.
8. In Southeast Alaskan the season begins on July 1 and extendsthrough February 28, except for a small area near Sitka wherethe season is September 10 through February 28. In Yakutat,the season extends from May 1 through February 28.
9. In the Southeast Alaska fishery no more than 300 pots pervessel may be fished, and in Yakutat the pot limit is 600 potsper vessel. Also, a number of closures in the vicinity ofpopulation centers in Southeast Alaska have been establishedto provide a priority for subsistence users,

Historic Pets ective, 1915-1959
Available documentation for the period 1915 through 1959 is scant andconsists primarily of short paragraphs on all species of crab for allregions of Alaska. Very little mention is made of market conditions,effects on production levels from other fisheries, or other factors.Initial mention of the commercial fishery for Dungeness crab in thePetersburg d~str~ct occurred in 1915 when a small quantity, 14,395pounds of various products Table 1!,were either consumed locally orshipped to Puget Sound ports Bower and Aller 1917!. In 1921 the tisheryexpanded significantly in Southeast Alaska and Some interesting noteswere provided: Harvest was restricted to males over 6 inches in carapacewidth; primary molting period was from dune through August; and meatyield from a 6 to 9 inch crab was slightly less than B ounces Bower1922!. A marked expansion in this fishery occurred in 1933 Fig. 3!,particularly in the Cordova area Bower 1922! and this may have been inresponse to improving market cOnditions mentioned for 1934 Bower 1935!.In 1935 a two-month sumer closure was instituted, but the specificreason was not elucidated Bower 1936!. In 1936 the minimum legal sizewas increased to 7 inches carapace width including tenth antero-lateralspines! but factors leading to the increase are not mentioned Bower 1937!.The discussion in the 1936 report introduces the assumption that pt iordiscussions of minimum legal sizes reflected an inclusion of the tenthantero-lateral spines. Beginning in 1936, harvest data was presented intabular form and identifies three basic products: canned, cold packedmeat, and whole-in-shell. Within the canned product four differentsizes were utilized 6-1/2 ounce, 1/2 pound, 1 pound, and 20 ounces!,and cold packed meat was available in either l, 5, or 10 pound cans Bower 1937!. Documentation identifying reasons for harvest fluctuationsduring the period 1940 through 1959 were not available, with the excep-tion of poor market conditions effecting the 1956 fishery Thompson andErickson 1960!. It has generally been acepted that significant eftortin the Southeast, and Yakutat fisheries have been a result of improvedmarkets for Alaskan crab due to declining harvests in other PacificCoast areas.
1.0
0,5
1915 1920 1925 1930 1935 1940 1945 1950 1955 1960
Figure 3. Historic commercial harvests of Dungeness crab, Cancero~oiote, P o ~ st tl tlc t g ~ e Sgi ~ s t ce t t p r Ui g!.Portions of 1925-'l927, 1930, 1932, and 1933 harvests includePrince William Sound. Data are in pounds of processed product,
65

Table l. Historic ccssercial harvests of Dungeness~~t, t ~St t' t
Area A Dixon Entrance to Cape Suckling! .Data frcm l925-1927, 1930, 1932 and 1933inclucles Prince William Sound harvest.Data fran 1915 through 1959 in pour@a ofprocess8cI meat,
Poumis Year Pours Year PourdsYear
14,935
2, 1604,320
480
66
191519161917191.81919
19201921192219231924
19251926192719281929
19301931193219331934
1935193619 3719381939
8,03099,000
113,27433,360
121,374
140,093167,253101, 37293,940
193,291
92,105191401
296,625523,074249,247
435, 530234,255215,045146,14241,514
19401941194219431944
19451946194719481949
19501951195219 53l954
19551956195719581959
19601961196219631964
55,98865,91529, 47546, 966
109,707
172, 206122,397
77,18422,633
114,537
306,706738,983813,0784441118336,872
670,783302,832122,462149,813
11422,292
1,993, 1671, 695, 0003,922,9904r679,6604,633,240
1965196619671968l969
197019711972l9731974
19751976197719781979
19801981198219831984
3,302,6702,496,1774,064,6163,996,8092,324,400
2,289,3001,668,7002g592,9003,085,9001,726,800
1,208,6001,054,500
237,7002,569,1002,158,719
1,381,2416,751,1598,838,9004,555,2001,728, 100

Recent Histor , 1960- 1984
Documentations of occurences in the Dungeness fishery for this periodcan be found in numerous Alaska Department of Fish and Game documentsincluding: Annual Management Area Reports, Regional Shellfish Analyses,and reports to the Alaska Board of Fisheries. Beginning at this time,harvest data for Southeast Alaska and Yakutat were separated Tables 2and 3!. However, similar trends have been exhibited in both fisheries.Declining harvests in other Pacific Coast Dungeness fisheries producedgood market conditions for Southeast Alaska and YakuCat productsduring the early 1960's. The Southeast Alaska fishery peaked in 1964and declined through the 1970'S Fig. 4!.
o 6
y.O I � I
0 1964 1968 19691970
19751976
19801981
19841985
Fiqure 4. Recent ~isl Harvests of Dungeness Crab, Cancermaqister, fran the Southeast ard Yakutat Fisheries.
67
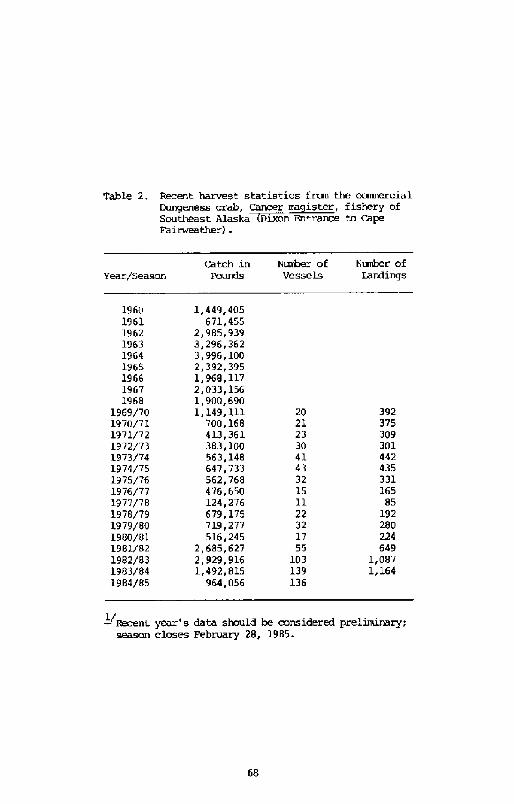
Recent harvest statistics fran the conmerciaiDungeness crab, Cancer ma~ister, fishery ofSoutheast Alaska~Dixon Entrance to CapeFairweather! .
Table 2
Number ofVesseLs
Nunber ofLandingsYear/Seasan
1/� Recent year's data should be considered prelirainary;season closes February 28, 1965.
68
19601961l962196319641965196619671968
1969/701970/711971/721972/731973/741974/751975/761976/771977/781976/791979/601980/811981/821982/831983/841964/65
1,449,405671,455
2,985,9393,29613623,996,1002,392,3951, 968, 1172,033,1561,900,6901, 149, 111
700, 168413,361383, 100563,148647,733562,768476,650124,276679,175719,277516,245
2,685,6272,929,9161,492,815
964,056
20212330414332151122321755
103139136
39237530930144243533116585
192280224649
1r 0871, 164

Becent harvest statistics fran the ~ialDungeness crab, Cancer m~aister, fishery ofYakutat, Alaska TCape Faxrweather to CapeSuckling! .
Table 3
Catch inPourds
Number ofVessels
Number oflandingsYear/Season
196019611962196319641965196619671968
1969/701970/711971/721972/731973/741974/751975/761976/771977/781978/791979/801980/811981/821982/831983/841984/85�
69
543,7621,023,545
937,0511,383,298
637,140910,278528,060
2,031,4602,096,1191,207,3971,589,9451,250,1182,207,0612,532,7781,097,508
628,879542,726131,052
1,875,0881,474,149
881,6813,300,1585,880,4093 i I33r 531
763,994
Season closed July 15, 1984.I/
1110 8122219
16 8 21319 716335439
107889199
2741731292811
1349956
175356493

Results of research projects ind1cated that survivaL of the 1964 yearc lass was poor, and resulted in reduced legal stock abundance in thePetersburg area during 1967. The reasons for low harvests in the 197 1through 1974 period are not explained. Intuitively, Southeast Alaskanmar kets should have been good. With the most recent decline in theWashington, Oregon, and California fisheries, which began with the1979/80 season, effort and subsequent harvests in Southeast Alaskaincreased dramatically to a peak of over 2. 9 million pounds during the1982/83 season. Since that season, effort has remai ned hi gh, exvesselprices have increased, and harvests have decreased significantly. Itis apparent that effort during the past four seasons have been suffi-cient to capture a high proportion of the available legal stock, andthese recent harvests are a fair esti mate of stock abundance. Averagesize, expressed as carapace shoulder width, peaked during the 1982/83and 1983/84 seasons. Perhapa this is an indication that the strongestyear-class contr1buting to the fishery during recent seasons was the1978 year-c'lass. Economic conditions, and the unavailability of viablealternative fisheries for many Southeast AL aaka fishermen has resultedin a petition for limited entry in this fishery.
As previously amntioned, occurrences in the Yakutat f1shery are similarwith the exception that reaSOnably high harvests did occur from 1971through 1974. These high harvests may be attributable to the greaterproportion of Washington ported vessels that parti cipate in the Ya kutatfishery. As such, these vessels are more sensitive to market. and stockabundance conditions in Washington, Oregon, and California.
Harvests during the 1981/BZ through 1983/84 seasons have been the hi gh-est on record and correspond to record effort levels, Effort was highonce again during the 1984/85 season and the resulting harvest was low.It is apparent that the available stock has been harvested and futureharvests wi 1 1 depend upon recrui tment entering the fishery . Extensivedockside sampling was conducted in the Yakutat fishery, and resultss uggest that the most recent fisheries were a result of a strong 1978year class. This aspect will be discussed to a greater degree in an-other presentation,
Available Research Information
From approximate'ly 1965 through 1969 various Dungeness crab researchorojects were conducted by Alaska Department of Fish and Game employeesin the Petersburg-Wrangell area. Data was collected primarily by Mr.Carl Lehman and summarized through the Bureau of Commercial FisheriesOuarteriy Progress Reports. Mr. Oliver Osborn first attempted toformally summarize the data at a later date 1970! but did not completethis project. Addi tiona 1 analysis of methods, data, and summar i zat1 onshould be accomplished. But, due to the current interest in the AlaskanDungeness fisheries, some of the summarized data is presented as pre-viously written,
Growth.
Between 1965 and 1969 plastic, spaghetti ephemeral line tags were placedon 5,250 male and femaLe Dungeness crab in the Duncan Canal and St, JohnHarbor areas. A total of 230 males and 67 fema'les were recaptured aftermolting. L1 near regression analysis of premolt carapace width measuredjust anterior to the tenth antero-latera'l spines! versus postmolt cara-pace width was accomplished from data for males Table 4! and females Table 5!.
70

Average carapace width, absolute incrmmnts andpercentage increments for male Dungeness crab,Ca ~t, ' Southe t Alaskaand Osborn, Unpublished! .
CarapaceWidthRange mn!
NumberCrab
~led
CarapaceWidth
Prmx>lt Postaolt
GrowthIncr arents
Absolute Percent
Total 230
Average carapace widths, absolute incresents, andpercentage increments for female Dungeness crab inSoutheastern Alaska Le!man and Osborn, Unpublished!
Table 5.
CarapaceWidthBange mm!
GrowthI nc ranents
Absolute Percent
NumberCrab
SaaSled
CarapaceWidth
Premo1t Postsmlt
67Total
70-74120-124125-129130-134135-I39140-144145-149150-154155-159160-164165-169170-174175-179
50-5 485-89
100-104110-114115-119120-124125-129130-134135-139140-144145-I49150-154
1 2 6 9131123336451
11 2
1 1 1 2 8 I6
12l412
6 3
74.0122,5126.7132.6136.9142.8147,2152.2157.2162.0165.8172.8177.5
51.089.0
100.0113.0116.9120.0126.5132.5137.1141.7146.2151.7
90.0147.5155.5161.6163,3169.8175.2180.2185.4189.9193.8199.5207.5
65.0106.0113.0130,0132.4138.0146.3149.7153.7158.5160.5167.7
1.6. 025.028.829.026.427.028.028.028.227.928.026.730.0
14.017.013.017.015.518.019.817.216.816.814.316.0
22202322191.91918lB17171617
271913151315161312121011

Resulting least squares regression equations are:
Y = ,943x + 36.6 andY = .924x + 27.8 where
For malesfor females-
Y = postmolt carapace width in mn andx = premolt carapace width in rrm.
200
160
120
80
40
20080 120 16040
Prmnlt Carapace width in Hillimeters
Figure 6. Increase in Carapace Width Per HOlt Of Adult DungenessCrab, in Southeast Alaska Leam and Osborn, unpublished!, anda Qxnparison with Similiar Canadian Data Butler 1961! . Canadiandata adjusted frcm carapace width including tenth antero-lateralspines tc carapace width excluding tenth antero-lateral spinesaccordinq to Poole �965! .
72
These data were compared to similar data from British Columbia Butler1961!. which had been adjusted to exclude the tenth antero-lateral spinesand found to be comparable Figure 5!,

Molt frequency.
Data was gathered from 335 recaptured males and 179 recaptured females.Results indicate that males molted annually up to the 155 to 159 mm sizerange, and begs~ to molt with decreasing frequency after attaining thatsize Table 6!,
Females began to show a similar tendency to molt with decreasing fre-quency after reaching the 135 to 139 mm size range Table 7!.
Molt timing.
Data indicating population molt times was collected from Duncan Canaland St. John's Harbor from 1965 through 1969. These data suggest thatmost males molted between late winter and mid-summer months Table 8!.Based upon observations of females with eggs, it appears that most fe-males molt and mate during the susnmr months, as eggs are carried fromSeptember through March Table 9!.
It appears that the life hi story of Dungeness crab in portions of South-east Alaska is similar to that described in other geographic 1ocations.However, the above research information should be viewed with cautiondue to the limited geographic area and time frames within which the datawas collected. Additional research is needed to confirm previous find-ings,
Table 6. Holt frequency of 335 recaptured male DungenessRb, CBllCSI ~t, ' ll t f
carapace width, excluding tenth antero-lateralspines Zelman and Osborn, Unpublished! .
Size Class CarapaCe HOltedwidth in Prior to
nss. ! Recapture
Recaptured RecapturedAfter 1 Year After 2 Years
Without WithoutMolting Molting
1 25
4 49
131419 8
73
130-134135-139140-144145-149150-154155-159160-164165-169170-174175-179180-184185-189190-194195-199200-204
3 1003 1001 1003 752 100
10 594 173 61 21 2
7 4119 7943 9038 8852 8542 8635 8123 92ll 1001 100

Table 7. Mlt frequency of 179 recaptured fanaleD lit ttttt tt, C oa ~tmillimeters of carapace wLdth, excludingtenth antero-lateral spines Lehnm ardOsborn, Unpublished! .
Size Class Recaptured Recaptured carapace Molted After 1 Year After 2 Years
width in Prior to Without Withoutmn. ! Recapture Mlting Nolting
111211
6 1
92712617 3
31320
Table 8. Sumnsry of data on the ocm~xm of softshellmale Dur~ness crab, ~ mm~ister, franDuncan Canal and St, John's Harbor, 1965through 1969 Lehman and Osborn, Unpublished! .
Nmnberof Crabs
Numberof Soft
Crabs
Percentof SoftCrabs
128
73
74April
Nay
June
39900
677
July
August
September
1034 82
1345
849
390
319
129
0.6
1.6
74
130-134135-139140-144145-149150-154155-159160-164165-169170 � 174
1 85 29
31 7429 8331 9428 874 802 1001 100
5.5
4.1
12. 2
4.3
0.9
7.9
0.7
0.5
0.5

Table 9. S~ of egg occurrence data on untaggedfemale Dungeness crab, Cancer m~aister,fran Duncan Canal and St. John's HarEar,1965 thrcugh l969 Ietman and ~,Vnpublished! .
Numberof CrabWith R[~G
Percentof Crab
with ~sSag%edanth
51
32
ll 8
April
782Hay
June 1296
1764July
August
September
October
1457
693 35
357 66
232
15 36.6
Table 10. Canparison of Durgeness crab size and agedata between British Colurbia <Butler 1961!axxl Southeast Alaska ~tions le!menarx! Osborn, Unpublished! .
Hales FanalesBritish ~st British Southeast
Instar Age Columbia Alaska Colmhia Alaska
6.59.3
12.0 12,9 12.016.0 17.3 16 0
22.629,036.046.658,372.790.1
109,9127.5142.3156.4169.0
adjusted to exc3ude tenthto allow ccsparison.
35.047.065.076.0
Note: Brit.ish Columbia dataantero-lateral spines
75
1 2 3 4 56 7 8 9
10ll1213141516
6.59.3
12.917.3
I 22.629.036.046.658,372.790.1
II 111.5III 137.1zv 164.4V 193. 6
VI 224.9
12. 5
0.0
0.8
0.3
0.2
0.1
5.5
18.5
37. 5

REFERENCES
Bower, W.T. 1922, Alaska Fishery and Fur Seal Industries in 1921.Appendix V to Report to the U.S. Co mnissioner of Fisheries for1922. Bureau of Fisheries Document No. 933. Washington D.C.1922. Page 46.
Bower, W,T. 1934. Alaska Fishery and Fur Seal Industries in 1933.Appendix II to Report of Commissioner of Fisheries for Fiscal Year1934. Washington D.C, 1934. Page 289.
Bower, W.T. 1935. Alaska Fishery and Fur Seal Industries in 1934.Appendix I to Report of Co mt issioner of Fisheries for Fiscal Year1935. Washington D.C. 1935. Page 49.
Bower, W.T. 1936. Alaska Fishery and Fur Seal Industries in 1935.Appendix I to Report of Co N issioner of Fisheries for Fiscal Year1936. Washington D.C. 1936. Page 46.
Bower, W.T. 1937, Alaska Fishery and Fur Seal Industries in 1936.Appendix II tO RepOrt Of COmmiSSiOner Of FiSherieS far FiSCal Year1937. Washington D.C. 1937. Pg. 324.
Bower, W,T. and H,D. Aller. 1917. Alaska Fisheries and Fur Ind~striesin 1915. Appendix III to the Report to the U.S. Co m issioner ofFisheries for 1915. Bureau of Fisheries Document No. 834.Washington D.C. 1917. Page 68.
Butler, T,H. 1961. Growth and Age Determination of the PacificEdible C ab, Cancer ~aiste, J. Eistl. Res. Bd. Canada.18 �!: 873-~
Lehman, C.W. unpublished. Bureau of Co snercial Fisheries quarterlyProgress Reports, Dungeness Crab Research 1965 through 1969.
Osborn, D.S. unpublished. Growth and Molt Patterns of the Adultll g C b C c ~mist D ~ ! in E nthea t Alaska.Informal Report 1970.
Osborn, O.S. unpublished. Dungeness Crab Molt Data. Informal Report1970,
Osborn, D.S. unpublished. Remarks on Female Dungeness Crab. InformalReport 1970.
Osborn, O.S. unpublished. Su mnary of Data on Occurance of Soft-shelledMale Dungeness Crab. Informal Report 1970,
Poole, R.L. 1965. Preliminary results of the Age and Growth Study ofthe M rket Crab Cancer ~ma inter! in California: The Ag and Growthof Cancer ma is term rodega Bay. In: Proceedings of Symposiumon Curstacea, art II at Ernakulan, India. Jan. 12- 13, 1965.Pages 553-567.
Thompson, S.H. and D.W. Erickson, 1960. Alaska Fishery and Fur SealIndustries, 1956. Fish and Wildlife Service Digest No. 45.Washington D.C, 1960. Page 64.
76

Overview of the Prince William Soundmanagement area Dungeness crab
fishery
Al KimkerAlaska Department of Fish and CarneCordova, Alaska
Abstract
The Prince William Sound Management Area 's adjacent to northcentralGu'If of Alaska and extends from Cape Suckling to Cape Fai rfield.
Historically there are two major areas in the Prince William SoundNanagemenb area where Dungeness crabs Cancer m~aisbe j e c i iiyharvested: �! Drca In'Iet District and~2 Copper River District.
The Drca Inlet District, which is irrnrediately adjacent to the comunityof Cordova, has provided a fishery that allows participation by smallvessels in an area protected from adverse sea conditions. Historicallythe fishery has occurred in the fall months with annual catches rangingto I.s million pounds. Recent arrival of a large group of sea otters ~Enh dra lutris!, a major predator of the Dungeness crab, has led to adramatic dodecine in abundance of crabs.
The Copper River District is usually a sumer-fall fishery. Thisexposed area is subject to heavier sea conditions and longer runningdistances to market, thus requiring larger vessels. Harvests haveranged from 78,000 to 1, S million pounds, Salmon drift gi linet mortal-ities have effected stock conditions.
General
The Prince William Sound Management Area is adjacent to northcentralGulf of Alaska and extends from Cape Suckling to Cape Fai rfield Figure 1!.
77

CcpF ~ irC
P lllddm~n em~a
Figure 1. Prince William Sound Dungenesscrab districts.
78

There are two major areas in Prince William Sound where Dungeness crabs Cancer ma later ! are convvercially harvested: I! Drca Inlet Districta~n opper iver District, Dungeness are also taken from the OrcaBay portion of the Nor them District as well as western Prince 'WilliamSound; however, this ha~vest is proportionally very small and is eithertaken incidental to the Tanner crab fishery or by one or two smallvessels targeting on Dungeness crab.
Historical catch from the entire management area has fluctuated from alow of 300 thousand pounds taken in 1976 to two million pounds taken in1978 Figure 2!. Prices, which are inversely effected by the successor fail ure of the traditional Dungeness crab fi sheries in Washington,Oregon and California, have until recently dictated the effort leveland resultant catch; i .e. in years of low price, such as 1976, theeffort level was low and the resultant catch was not a true reflectionof stock abundance. However, since 1980, when general crab abundance inthe state began to decline, fishermen have been forced to fish for lowerprofi t margi ns thus maximizi ng effort i n shellfish fi sheries regardlessof price.
Management strategy for both the Copper River and Orca Inlet Districtsis as follows:
1.! Oenerally avoid fishing during significant softshell periods.2.! A minimum legal size of 6.5 inches,3.! Males only, and4.! Recruit fishery,
Co er River District
The Copper River District is a late spring through early fall fisherydue to prevailing adverse weather conditions which prohibit fishing inthe winter . Vessel sizes range from small seine type vessels of 32feet up to medium sized crab vessels of 70 feet. A 250 pot limit, whichis successfully enforced due to fishermen cooperation, generally in-hibitss larger crab vessels from fishing the district. Fishing norma'llyoccurs between the mean low water line and 10 fathoms. This is a re-flection of the location of legal males.
Commercial harvest in the Copper River District has fluctuated signifi-cantly. Since 1978, when effort level has been consistently high, thecatch has varied from a low of 379 '.l ousand pounds in 1983 and 1.5million pounds in 1981 Table 1!.
The season for the Copper River District opens April 1 and continuesthrough December 31, except for the Controller Bay area which closes onOctober 15. The season dates are set to coincide with the time of yearwhen the weather permits fishing. The crabs are consistently in theirfi rmest shel 1 condition in late fall through spring; however, sea andicing conditions during winter are such that the majority of the timethe district is unfishable. Also, stuck and lost gear caused by thisseasonally bad weather creates an unnecessary source of mortality onthe large crabs which are in the gear and cannot get out via the escaperings.
Another extraneous source of mortality which cannot be avoided is lossto gillnets. The Copper River Drift Oillnet Fishery for three species
79

o 16
14
12r e
10V 0+P o. 8A 4-
D
TlV C
S- hS 69 71 73 75 77 79 81 83Year
Figure 2. CoaIsercial Dungeness crab catchy Prince William SoundManagement Area, 1969 - 1984.

Table 1, Prince Willim Sound Area Dungeness crab catch, 1960-1984.
OrcaInletPounds
CopperRiverPounds
TotalCatchPoundsYear Vessel s Vessels
O
No
336,69678,22378,848
437,865458,613290,149654,410254,933506,751
878,696738,634509,824724,673806,377559,164818,041290,332735,609
323
Year
1978 1,319,4511979 504,7701980 659,6671981 1,503,5741982 757,9111983 379,0941984 ' 678,639
684,439123,245
No fishingNo fishingNo fishingNo fishingNo fishing
34 49,57132 20,924
31,1525,6834,221
51134
17
16 5 52 2 1
12191018'16 9 9
2,053,461652,924690,819
1,509,257762,132379 60r678,673
'As of August 30, 'l984.
81
1960196119621963196419651966196719681969197019711972l9731974197519761977
1,524,326990,242
1,353,1901,216,8461,290,9291,240,372
999,341data available
579,279541,822660,411430,976286,808347,764269,015163,63135,399
228,858
Copper Orca NorthernRiver Inlet District TotalPounds Vessels Pounds Vessels Pounds Vessels Catch

of salmon, red, king and silver, occurs in the near shore area wherecrab concentrations are heaviest. Crabs become entangled in the netsas they drag across the bottom causing nearly 100 percent mortalitiesof entangled crabs during the softshell period.
There is also a gear conflict between the drift gillnets and crab pots,Unfortunately this is sometimes resolved with cut crab lines as opposedto cooperation. Nevertheless, this gear loss is a source of Dungenessmortality that could be avoided,
Fishing in the spring and early surmrrer, when the mqlt and softshellperiods normally occur, causes a unique management problem. TheDepartment's Prince William Sound 14anagement Area policy on closuresdue to softshells is dependent, upon two factors: 1! the relativeabundance of softshells, and 2! the level of vessel pa rticipation.During the 1979 season, when the softshell abundance was average andthe effort was high, the district was closed until the crab reached acondition where handling mortality and limb loss were diminished.However, in 1984, the abundance of softshells was high, but only threevessels were fishing, thus the season remained open as fishermenavoided areas of softshel1 abundance.
Drca Inlet District
The Orca Inlet District, which is immediately adjacent to the communityof Cordova, has provided a fi shery that allows partic i pation by smallvessels in an area protected from adverse sea conditions. The largestvessels were in the 40 foot seiner class; however, the majority of thevessels were smaller than 40 feet with some as small as the 24 footstern-picker gii'Inetter. Crab fishermen could leave the harbor in themorning, lift their 100 pots the pot limit in this district!, anddeliver to the processors by early afternoon. Concentrations of legalcrabs were found from mean low water to 10 to 15 fathoms.
This protected body of water was not effected by seasonally adverseweather conditions thus the fishery was not opened unti l the crabs werein a hardshell condition.
Prior to the decline in abundance in 1979 due to otter predation, theDungeness population was beginning to recover from another decline whichwas caused by habitat loss and degredation as a direct result of the1964 earthquake and siltation from the Copper River. Catch variedfrom 35 thousand to 684 thousand pounds Table 1!.
In the early to mid 1960's the annual catch exceeded one million pounds catch records prior to this are not reliable as to specific locationof harvest!. The 1964 earthquake caused an average uplift of six feetin Orca Inlet thereby resulting in a significant habitat loss.
The resultant habitat 'loss, due to uplift, and the continuing substraterhange caused by the Copper River outflow had dramatic effect on boththe Dungeness crabs and its primary prey species, razor clams ~5ili uapratula! Nickerson 1975!.
The Drca Inlet season WaS not opened in 1984, as it hasn't been since1980, because of extremely low a bundance as identified by the pre-season index value, which was less than one legal male per pot.
82

The reason for the continued suppression of the Dungeness crab papula-tiee i Ort I 1st is predatiaa hy the sea atter ~ash d a 1 atri s!. Theotter arrived in large numbers during 1979 and imnediately impacted theDungeness crab stock. The most recent count of sea otters in DrcaInlet in 1983 tallied well in excess of 500 animals Schreidt 'l983!.According to a recently completed study, when Dungeness crab areavailable, adult otters are capable of eating 14 crabs per day Garshelis 1983!. Needless to say this equates to significant predationand a continued suppression of the stock,
83

~Biblia a h
Garshelis, D.L. 1983. Ecology of Sea Otters in Prince William Sound,AlaSka. Ph. D. DiSS., UniV. Of MinnesOta, MinneapOliS, Minn. 321 pp,
Ni ckerson, R.B . l975, A critical analysis of some razor clams ~Sill ua patala Dixon! populations in Alaska. Alaska Dept. of Fishand Game. 294 pp.
Schmidt, W.T. 1983. Aerial survey of sea otters in the Cordovavicinity. U.S. Fish and Wildlife Service, unpubl. rep. Spp.
84

The Lower Cook Inlet Oungeness crabfishery from 1964-1983
Margaret F. MerrittAlaska Department of Fish and CameHomer, Alaska
AbstractDungeness crabs have been harvested in the inner bays of Lower CookInlet, Alaska, since the early 1900's. In 1973 a relatively largestock of Dungeness crab was located in outer Kachemak Bay off BluffPoint and the majority of the fishing effort has shifted to this areain recent years. The Lower Cook Inlet Dungeness crab fishery isprimarily dependent on market demand and natural fluctuations in thepopulation. When catches of crab on the west coast are low, LowerCook Inlet Dungeness crab landings tend to increase . From 1968 to1983, the ex-vessel value of the fishery has ranged from an estimated$7,200 to $1,598,200, with a mean value of $440,100 per year. Themean catch from 1961 to 1983 is 615,200 pounds, with the highest re-ported at 2.1 million pounds in 1979. The number of vessels partici-pating in the fishery between 1961 and 1983 has ranged from 2 to 117,with a mean of 36. Nanagement is based on area closures, gear res-trictions, and sex and size limitations. There are no establishedguideline harvest levels for Lower Cook Inlet Dungeness crab. No bio-logical assessment program has been developed for Lower Cook InletDungeness crab, although some tagging studies have been conducted. Abivariate covariance matrix was used to estimate area covered by tag-ged Dungeness crab. The model indicated that size of area covereddiffers between geographical areas and the sexes. Non-overlappingadult movements and morphological variation may suggest the existenceof various stocks of Dungeness crab in Lower Cook Inlet.
HiStor Of the FiSherThe Lower Cook Inlet area is described as those waters west of a lineextending south from Cape Fairfield and north of a line extending eastfrom Cape Douglas Figure Ij. The Lower Cook Inlet Dungeness crabfishery primarily occurs within bays: Kachemak Bay, Seldovia Bay,Sadie Cove, etc. Local residents from Homer, Seldovia and Port Graham
85

Figure 1. Lower Cook Inlet, Alaska.
are the primary participants in the fishery . The majority of Dungenesscrab are harvested from the Southern District. While son» landingshave historically occurred in the Outer and Eastern Districts, fishingGulf of Alaska and Cook Inlet waters is not as productive as bay fish-ing and offers greater hazards.
Dungeness crabs have been harvested intermittently in the Lower CookInlet area since the early 1900's. Canning of Dungeness meat was con-ducted in Seldovia from 1920 to '1925. The next major effort was in theearly 1950's when a yearly peak catch of 1.5 million pounds �80.4 met-ric tons! was recorded. Prior to 1973, fishing was conducted entirelyin the inshore waters of Kachemak Bay and the smaller bays of the LowerKenai Peninsula. During 1973 a relatively large stock of Dungeness crabwas located in the Bluff Point area of outer Kachemak Bay. The majoriiyof the fishing effort has shifted to this area in recent years and isconducted in the depth range from 15-40 fathoms �7-73m!.
The Lower Cook Inlet Dungeness crab cosa»rcial fishery is primarilydependent on market demand. Historically, when catches of crab inWashington were depressed, Lower Cook Inlet Dungeness crab landingsincreased Figure 2!. A change in relationship became apparent in 1977,when Lower Cook Inlet catches became parallel to those of Washington.
86

This may indicate that LowerCook Inlet: catches are now tiedmore directly to overall marketdemand for crab product ratherthan to the harvest of Dungenesscrab from Washington. Sustainedhigh prices may be responsible inpart for the recent changes inmarket action of Lower Cook InletDungeness crab.
21 .1QI
Il s:I:Oc714
ua
Additional limiting factors tothe Dungeness crab fishery in
Figure 2. Dungeness crab commer-. Lower Cook Inlet are tidal actioncial catch from Washington solid and inclement weather, partic-line! and Cook Inlet in millions ularly in t+ Diuff Point area.of pounds by year. During extreme tidal fluctuations,
which occur normally twice permonth in summer through fall,pot buoys sink below the surfaceexcept at slack tide periods,
limiting the amount of time boats can pick their gear . Regulationsallow a twelve-month season on Dungeness crab, but fishermen generallyconfine harvest to July through October - storms and ice passage severe-ly restrict winter harvest. Due to inconsistent fleet effort, it can-not be determined to what degree crab abundance affects the harvest.Certainly market demand, environmental conditions and crab abundanceall play a significant role in determining fleet effort and harvest ofDungeness crab in Lower Cook Inlet.
Table I . Lmamr Cook Inlet L'ungeness crab catches. number of parttclpatlnl vessels, number of landvnss.nbt. - 2,204.62 poundal, and ea-vessel values.
ta-vessel ValuePratePound Total
Scanner Humber Ga tch'fear Vessels Landln 4 Pounda petric Tons
Bate 5ource 401 416 Statlsttcal Catch Reportsgl Price per pound ranged from 50 45 to 50.75, malort tt purchased at SC.65 plus.
87
1961196219631964196519661967196819691970'1 97T19721973197419751976l97719781979198019811982I983
IZ155022145 2 79
102224543436121051826596
11777
189269
1.3603411052813
2244150
13620652561910212394
680'I, 3261,1832,0721,8701,283
193,683530,770
1.677.2044Z3,04174,211
129,5607.168
487,85949,894
209.8'l997,16138.930
310,048706,910362,815119,29875,834
I .214,7162.130,9631,866,696'!,859,759
832,603750.838
87.8240. 8760.8191.933.758.83.3
221.322.695,244.117.7
140.6320.7164.654. I34.3
551.0966.6B46.7843. 6377,6340.6
50. 14,145.13,15.39.52.55. 536. 515.40.7550
0,700.831.01
5 68,3007.234
27.72614.57415,182
161,224388 .800194.46861.438N,286
789.5651,598,222
933,3481.301.831
691.060758.346

From 1968 to 1983, the ex-vessel value of the fishery has ranged froman estimated $7,200 to $1,598,200, with a mean value of $440,100 peryear Table 1!. The mean catch from 1961 to 1983 is 615,200 pounds,with the highest, reported at 2,1 million pounds in 1979. The conva-ercial catch and ex-vessel value show similar trends in fluctuationsthrough time, except in 1980, when the catch remained high while theprice per pound dropped. In 1983, the price per pound increased whilethe catch decreased Figure 3!.
C3ID18
12 "x
C3188 18
C!C312
6g~ 6!
2.1
~1.4
0,7
lit6-
'1 968 1980 1973 1981
Figure 4. Ex-vessel value ofDungeness crab in Cook Inletcompared to CPUE solid line!by year.
Figure 3. Ex-vesse'I value ofDungeness crab in Cook Inletcompared to commercial catchin millions of pounds solidline! by year.
The catch per unit effort or CPUE number of crabs per pot! showslittle correlation to ex-vessel value� . While the CPUE and value app-eared to be directly correlated from 1972 to 1975, CPUE has recentlydeclined �98 I to 1983! while the value of the harvest has increased Figure 4!.
Monitoring of the Southern District sport/subsistence fishery forDungeness crab was initiated in 1978 with an interview creel census,and it was estimated a total of 3,570 crab or 7,140 pounds! weretaken, comprising 0.6 percent of the total 1978 harvest for Lower CookInlet. No census was conducted in 1979 or 1980. In 1981, monitoringof the harvest was initiated through a mail-out questionnaire, and itwas estimated that 22,928 crab �5,856 pounds! were taken, or 2.4 per-cent of the total harvest. In 1982 and 1983, the estimated sportharvests were 9,956 crab �,3 percent of the total catch! and 14,l30crab �.6 percent of the total catch!, respectively Mills, 1982,1983!.6y regulation, males of any size may be taken in this fishery.
Mana ement of the Fisheranagement strategy is based on the 3-S concept: sex, season, size .
There are no established guideline harvest levels for Dungeness crabin the Lower Cook Inlet area. Only males greater than 6.5 inches �65mn! may be harvested, with seasons varying according to regulation Table 2!. Upper Kachemak Hay was historically closed May-August�975-1978! tO prevent harvest of crab in the soft-she'll condition, butin 1979 this regulation was repealed. The 61uff Point area was his-torically closed �977-1983! January-April to force fishermen to pickup their gear when fishing success declined in the fall. This closure
88

Tablv t . Bistorical darelnpmrnl nf Cook Inlet Bunqeness rrab cosinercialfishery regulations, 1964-84
Pot I iniit1964-78.1979-80:1981 ' f14:
156 in Southern BistrictZSC ln remainlnq Cook Inlet districtslio 1 mlt150 ln 5outhern lkistrictHo limit in remaining Cook Inlet districts
5easons1964-74:1975-�:1977-18:
Iqo r.losed seasonUpper Kathemak Bny closed nay-Upper Kachemak Bay closed Aay ~Bluff Point area closed JanuaryBluff Point area closed JanuaryNo closed season
AuqustAuqust� April� April1979-83:
1984
Size and Sen1964-75: Ho limit1976-84: Females and males less tnan 6 5 incnes �63am! nay not be taken
1964-84: Buoy I *ntification1978-84: Tunnel eye opening not greater than 30 inches �6srss!1979-84: Tuo circular escape rings nf 4 3/8 inches limn!
was repea1ed in 1984,
Pot limits have varied by regulatory year, with the majority of theregu'lations limiting pots to 150 in the Southern District; other LowerCook Inlet districts have either had a requirement for a 250 pot 1imitor no limit. Pot specifications inc1ude a tunnel eye opening notgreater than 30 inches �6 cm!. This regulation was established in1978 to prevent king crab pots from being used prior to the king crabseason under the guise of Dungeness gear. Effective in 1979, potsmust have two circular escape rings of 4 3/8 inches �1 cm!.
Lower Cook Inlet is a non-exclusive registration area for Dungenesscrab, which requires fisherlgen to register prior to fishing, but doesnot limit the number of non-exclusive areas they may fish during aseason. This is in contrast to exclusive registration areas, whichlimits the fisherman to fishing in that area only.
89
riving force behind harvest of a resource.Since the decline in king crab abundance and harvest, demand forDungeness crab has increased, and some Lower Cook Inlet crab fishermenhave become dependent in recent years on Dungeness crab for economicsurvival Figure 5!. From 1969 to 1976, the Dungeness crab harvest inLower Cook Inlet comprised �.3 to 3.0 percent of the total shellfishcatch Iiueirolo et al 1977!. In 1983, Dungeness crab comprised llpercent of the total catch, There are five processors based in LowerCook Inlet and similar to loca1 fishermen, the smaller processors

current'Iy rely on Dungeness crabfor their business success, whichconsists of local marketing. Thelarger processors interviewedhave increased the proportion ofDungeness crab handled over pre-vious years to 10 to 15 percent oftheir total purchases, but sincethe decline in king crab somemust expand into new bottomfishmarkets to operate successfully.
20
15
u 10
a.
1970 1976 1982 The largest plant processes aboutFigure 5, Percent value of Dunge- 75 percent of the Lower Cook Inlet
ness crab catch relative to Dungeness crab catch and ships atotal Cook Inlet shellfish value mini~urn of 99 percent of its pur-by year, chase of Dungeness crab to the
west coast for marketing; lessthan one percent is marketed in Alaska. Another large plant marketsabout 90 percent of its Dungeness crab outside Alaska . Lower Cook Inletcrab is shipped frozen and competes with the west coast fresh market.Processing capabilities enable a single plant to process the currentDungeness crab catch in Lower Cook Inlet. This signals over-capacityand indicates the necessity for market d1versification.
Examination of the fleet composition provides 1ndicators of the localbioeconomics. The Lower Cook Inlet Dungeness crab fleet average vessellength is about 36 feet llm! and average engine size is 240 hp, which,according to Butcher et al �981! categorizes the fleet size as "small",relative to all vessels operating in Alaska. Small vessels are typical-ly local Alaskan Fishing operations versus large vessels originatingoutside Alaska! and tend to be involved in the harvest of other fish-eries salmon, halibut, shrimp!. Dungeness crab fishermen interviewedrealize a net profit of approximately 30-35 percent. This contrastswith the estimate by Butcher et al �981! of a 20 percent net profitfor small vessels.
The mean gross ex-vessel value per vessel participating in the LowerCook Inlet Dungeness crab fishery from 1974-78 was $7,768, $1,554 to$2,719 net!, From 1979-83 the mean gross value per vessel was $12,633,�,526 to $4,421 net!. These are minimum values, because the totalnumber of vessels registered as f1shing Dungeness crab are not consid-ered the "core" fleet. Several boat owners register for the fisherybut are not active participants!. Thus, the mean gross profit toDungeness crab fishermen has increased by 38.5 percent during the pastfive years, and is reflect1ve of increased demand. however, the low netprofits realized necessitate participation in additional fisheries.Unfortunately, the Alaska Departments of Revenue, Coxmmrce and EconomicDevelopment and Fish and Game do not have available data bases on thebioeconomics of a given fishery by locality. Thus, the relationshipsbetween Lower Cook Inlet Dungeness crab harvest, local market devel-opment and dependenry on west coast Dungeness crab demand can only bespecu'Iated. Based on interviews with local processors, it appears thatharvest of Lower Cook Inlet Dungeness crab is still dependent on thewest coast catch which sets the price and market demand for frozenAlaskan Dungeness crab.
90

gg 9 g rab has provided information on adult moveaentand rateS Of diSperSiOn. Tagging Of feneleS and Sublegal maleS OCC-orred in upper Kachemak Bay and on the coast between Port Graham andChina Poot in 1963. Tagging of legal males off Bluff Point occurred in1975, 1976, 1978 and 1979. although returns from 1975 and 1976 did notprovide accurate information on location Davis 1976, 1977, 1979, 1981!,
In a review and re-analysis of the Dungeness crab tagging data in LowerCook Inlet, plerrltt �984! examined movements for size of area coveredby recaptured individuals from a given tagged population. Studies onsmall ma!rmal demographics has produced many statistical techniques todefine home ranges of tagged individuals, and a bivariate covarfancematrix Jennrich and Turner 1969! was chosen to estimate area coveredby tagged Dungeness crab. This model assumes that activity is distrib-uted according to the bivariate normal dist,ribution. Van Winkle �975!contends that the matrix model is free of sample size bias and can beused for quantitative comparisons. !uantitative estimates allowedrelative comparisons between areas and sexes, and also indicated degreeof overlap of adult movements from different areas.
The model indicated that size of area covered by tagged crab differsbetween geographic areas and sexes Table 3!.
Table 3 Est!mated hare range sizes lA4! and rates of d!spersion !a ! For2tagged Obngenels crab in Coos 1 ~ let by area and year.
A mi.2 a mi rday!2 .2Tag release Ho ao.rear
1963 Port GrahamBarabara/
HubbleGeldoria5adiu CourHonorIH:Kaon
1250.070.080.240.320.82
14737360
145271
2267101918
21.544.681. 3
207.2257.7
h. 680 62
Bluff I' t.Bluff Pt.
21CI323
79121
121.1132.5
19781979
The mean square coefficient of dispersion Skellam 1951! shows somecorrelation with size of area covered. Tag returns from the fleet in1963 indicated that crab in Port Graham and Seldovia Bays during thetag recovery period tended to remain in the general area of those bays,but crab tagged along McKeon Flats tended to fgigrate extensively alongthe coast. Interviews with fishermen support the thesis that certainbays contain Dungeness crab which t,end to remain within the generalarea of those bays.
Tag returns from the fleet in 1978 and 1979 indicaged that Bluff P~intcrab migrate within an approxilhately 121 to 133 mi~ �13 to 344 km !area off Bluff Point during the tag recovery period, and area covereddoes not tend to overlap with those crab tagged along the coast betweenPort Grahamand China Pout or in upper Kachemak Bay. Non-overlappingmovements of adults tagged in different areas suggests that these adultsmay be to sone extent reproductive'ly isolated. Larval drift movementsImzst be considered prior to suggesting the existence of separate stocks.Oceanic currents in Kachemak Bay consist of several stable and predict-
91

able gyres Krull and 'Williamson 1969, Patchen et al 198'I! which mayincrease localization of larval settlersent, Catch sampling observa-tions note morphological variations between inner bay crab. which tendto be more bluish in color and larger. Processors recognize Bluff Pointcrab and offer a higher price to fishermen. These observed variationsmay be more environmentally induced than genetic, but still point todifferences in growth conditions. The concept of Dungeness crab stocksalong the same coast line 1s not novel. California Fish and Garr» hasidentified Dungeness crab stocks and manages each with different fish-ing seasons based on environmentally induced differences in crab con-dition Soule and Tasto 1983!. Study of Lower Cook Inlet Dungenesscrab biology by area may reveal that the great degree of variability inshell condition observed in the overall Southern District populationmay in fact be correlated to microhabit, and may occur on a predictablebasis. Shell condition can be a significant 11miting factor in market-able catch per unit effort because of variability in shell conditionbetween areas and years. Processors in generat do not purchase soft-shell crab. Fishermen interviewed stated their catches of soft-shelllegal males can vary between 5 to 90 percent, with the percentage ofhard-shell tending to increase but not consistently! over the season.
The only shell condition data gathered during the tagging operationswas in 1963, when 71.8 percent of the sublegal males examined werefound in a soft-shell condition, as compared to 1.1 percent of females,in the same tagging areas during the same tirse interval. The greaterincidence of soft-shell males captured may indicate behavioral d1ff-erences between the sexes. Fishemen contend that females bury in thesand during soft-shell condition and are thus not as susceptible to potcapture, The difference in shell condition may also indicate thatmales and females vary in their reproductive cycles and in their re-sponses to extrinsic factors affecting the molt. Changes in growthrate after sexual maturity may also occur between the sexes.
Tagging also provides estimates on fish1ng mortality, which in theBluff Point area ranged from l9.5 percent in 1978 to 38.3 percent in1975. These estimates are considerably less than the estimated fishingmortality of legal males �3 to 87%! in California Gotshall 1978!.
Length frequencies for Dungeness crab were obtained from samplingcormrrercial landings in Homer and Seldovia in 1973 to 1975, 1978 to 1980,and 1982, and from tagging studies off Bluff Point in 1975, 1978 and1979. Cormr»rcial catch sampling of Bluff Point crab occurred duringthe initial years of this f1shery and reflects the size distribut1onof a previously unexploited population. The mean carapace width ofBluff Point legal males sampled in the corrm»rcial fishery from 1973 to1975 ranged from 190 to 200 mm. No changes in size distribution werenoted during this time period, except that the very large crab �30+mm!caught in 1973 were not available in subsequent years. In 1978, meancarapace widths of tagged legal male crab were eight percent smaller�82 . 7 + 1 0 .0 mm! than in 1975 . In 1 979 and 1980 a larger cohortappeared to enter the Bluff Point fishery . Mean width in September1979 was 193.3 mm and in 1980 was 195.7 rrN.
Catch sampling indicates that Bluff Point legal male crab tend to beslightly larger than upper Kachemak Bay crab. In 1980, mean carapacewidths of Bluff Point crab were 195.7 rmn, 14.8 percent larger thanupper Kachemak Bay crab. In August 1982, mean width of Bluff Po1nt

crab was 187.7 nss, 6,5 percent larger than Bay crab Figure 6!.
10
C m L K
D 10 160 180 20D 220Carapace width mm!
Figure 6. Percent carapace width in 2 mm increments of legal maleDungeness crab from the 8'1uff Pt. and Upper Bay comnercial fisheries.
The average weight of 'lega'1 male Dungeness crab in the Bluff Pointcommercial fishery from 1978 to 1983 was 2.35 pounds �066 g!. This is15 percent greater than the average weight of legal male crab in theinner bay fishery east of the Homer Spit �.04 pounds or 925 g! duringthe same time period, Differences in size between the Bluff Point andupper Kachemak Bay Dungeness crab may result from 1! different ratesof growth per molt or 2! different exploitation rates as they affectthe size distribution of a given population.
93

REFERENCES
Butcher, W., J. Buteau, K. Hassenmiller, G. Petry and S. Staitieh.1981. Economic impacts of the Alaska Shellfish Fishery: aninput-output analysis. NOAA Technical memorandum. NMFS F/NWC-9,103 pp.
Davis, A. 1976. Dungeness crab in Cook Inlet. Lower Cook Inlet DataReport No. 76-1, Department of Fish and Game, 30 pp.
. 1977. Dungeness crab; Fishing in the Cook Inlet area - 1975Lower Cook Inlet Data Report No. 77-1, Alaska Department of Fishand Game, 19 pp.
. 1979. Dungeness crab fishing in the Cook Inlet area, 1978.Lower Cook In'let data report 79-5. Alaska Department of Fish andGame, 20 pp.
. 1981. Dungeness crab of the Lower Cook Inlet area 1979-80Seasons. Lower Cook Inlet data report 81-4, Alaska Department ofFish and Gas», 23 pp.
Gotshall, D. 1978. Catch-per-unit-of-effort Studies of NorthernCalifornia Dungeness crabs, California Fish and Game 64�!:189-199.
Jennrich, R., F. Turner. 1969. Measures»nt of non-circular home range.Journal of Theoretical Biology, 22:227-237.
Krull, J. and R. Williamson. 1969. Oceanographic Survey of KachemakBay, Alaska. U.S. Department of Interior, Fish 5 Wildlife Service.105 pp.
Merri tt, M. 1984. Migratorv orient, ation of tagged Dungeness crab inLower Cook Inlet and implications for stock identification. LowerCook Inlet Data Report Series, Alaska Department of Fish and Game, in press!.
Mills, M. 1982. Statewide harvest survey data. Federal Aid in fishrestoration and anadromous fish studies, Alaska Department ofFish and Game. Volume 23. 118 pp.
1983. Ibid. Voiun» 24, 118 pp.
Patchen, R ., J . Bruce and M. Connolly. 1981 . Cook Inlet CirculatorySurvey: 1973-75, U.S. Department of Cotnt»rce, NOS OceanographicCirculatory Survey Rep. No. 4, 89 pp,
Ilueirolo, E., E.A. Walker, B. Muse, D.J. Reed, J.C. Baker, 1977.Alaska Shellfish Bio-Fconomic Data Base, 157 pp.
Skellam, J. 1951. Random dispersal in a theoretical population.Biometrika, 38:196-218.
Soule, M. and R. Tasto. 1983. Stock identification studies on theDungeness crab, Cancer ma ister. Qn Life history, environn»nt,and mariculture studies o the Dungeness crab with emphasis onthe central California fishery resource, California Department

of Fish and Game, FH 172; pgs. 39-42.
VanWinkle, W. 1975. Comparison of several probabilistic home rangemodels. Journal of Wildlife management. 39�!: 118-123.
95


Kodiak Island commercial Dungeness,Cancer magister, fishery
Martin F. EatonAlaska Department of Fish and CameKodiak, Alaska
Introduction
The Kodiak Archipelago located between 56' N. lar.itude and58'50' N. 'latitude and 151' W. longitude and 156' W. longitude is someof the most productive waters for shellfish in the north Pacific Ocean Figure I!. Since the beginning of statehood in 1959, these watershave produced 620 million pounds of king crab Parali thodescamt hatica!, 280 iilio pounds f ta crab Chio ca~les bai di~74 mi I I ion p de of ahri p Pa d us b a is ! d dd I I I i pou df dunes ss ab Ca ~ma i~ter . It is quit appa e t fro these
catch figures that dungeness crab has been a minor fishery, whencompared wi th the other shellfish fi sheries . The primary reason thatdungeness production has been lower than the other fisheries is thardungeness habitat is 1 imi ted in area and competiti on from the othercrab speci es is very fierce on the prime dungeness grounds. Asecondary reason the production was suppressed is that the Alaskaproduct has had to compete in the market place with crab caught on thewest coast of the United States and Canada. When production was largeon the west coast, Alaska catches were held artifically low, as can beseen from Table 1 and Figure 2. For example in 1962 when the Kodiakfishery began, the harvest for the West. Coast and Canada was only 14.7million pounds compared to 10.1 million pounds for Alaska and 1.9million pounds for Kodiak. The low harvest led fishermen andprocessors to tap the Kodiak resource for the fi rst time in 1962 Table 2j. Not only did the Kodiak dungeness fishery depend on catchesof West Coast crab, but the catches from the Cook Inlet, Prince WilliamSound and Southeast areas in Alaska also influenced Kodiak production.In 1963, the catch in Kodiak was 2.4 miI!ion pounds; in 1964, 4.1million pounds; in 1965, 3.3 million pounds; but in 1966, it decreasedto 1, 1 million pounds primarily because the rest of Alaska's dungenesscatch increased from 1.7 million pounds in 1965 to 10.4 million poundsin 1966.
97

98

Table 1. Historic dungeness catch from Kodiak, Alaska, west coast statesand Canada in thousands of pounds, 1962-1981.
Canada 8 U.5.West CoastAlaskaKodiak TotalYear
*California catch not included.
99
19621953195419651966196719681969197019711972197319741975197619771978197919801981
1,9042,48 74, 1623,3111,1486,6636,8295,8345 >7411,4452,0592,000
75063987
1131,3621,3132,0112,614
10,18010,2214 >7331,742
10,4496,5794,4753,8633,3882,3043,2384,3864,5832,3231,4511,0635,8544,2608,991
12,287
14,73114 >88322,18636,79334,71939,48248,60550,63638,41021,72512,80611,44613,56038,51558,89636,00437 >613»30,347»16,649»14,597
26,81527 >59131,08141,84646,31652,72459,90960,33348,11325,47418,10317,83218,89341,47760,43437,18044,82935,92031,54529,498

60
50
40
0 30
20
10
a a o a e a o o a e e a e o o o e o e a
,.igure 2, Alaska's dungeness catch production corrpared to West Coastcatch prnduct ian 1962 - 1981.
100

Table 2. Oungeness catch by geographic area, by year, in thousands ofpounds.
Southeast/!Southwest
North SouthMainland MainlandYear Northeast Eastside Westside
35.461. 589.1
131.2363.4206.4
244. 9380. 6513. 5
1,475.01,409. 32,571.3
TOTAL 2,412. 1 10,961.2 27,042.8 11,579.3 3,227,9 7,853.9
PERCENT 4'X 17% 43' 18K 12%
1Combine from 1962 to 1976 and called Southend,
2Oata not available,
101
19621963196419651966196719681969197019711972219731974197519761977197819791980198119821983
165.3180.7159,864,989.4
265.9219.2131.137.6
180.2NA30.1
.9
63.9830.1832.4605.6
1,331.9930.1907.8
1,211.8400.4617,0NA
331.2259.0
.3103.3420.7459.1224.2510.8484.l437.5
493.1201.7
1,088.4944.6289.0
4,658 . 74,273.83,930.03,242.8
545.0730.9NA42.7
7.5
1,085.91,774,21,621,8
881.6241.0313.5801,1617.3934.7248.6284.9NA29. 443.5
1.617,868.7
154.51,087.9
855.0516.3
97.3139.7
13.066.810.0ll,7
NA116. 3120.419.9
1,2366.4192.5229.5811.2577.4454,6
314,6312.4533.6395.976.0
270.1545,272.6
204.0202.5246.4NA
200.3208.366.96.9
277.1148.6800.8
1,550.2856,9564.6

The most dramatic illustration of the U.S. West Coast and Canadianability to influence dungeness catches 1n Alaska is seen in Figure 2.Beginning in 1977, West Coast and Canadian production has been steadilydeclining while A'laskan and Kodiak production has been 1ncreasing. Thegraph lines on Figure 2 for 1981 almost touch each other indicating thestrong interaction and dependence the catches have on the two areas,
Descr1 tion of the Area
The Kod1ak dungeness fishery occurs in the geographical areadefined 1n the 1983 Shellf1sh Regulation book as the Kodiak Distr1ct,The Kodiak District includes all waters south of the latitude of CapeDouglas �8'52' N. latitude!, west of the longitude of Cape Fairfield�48'50' W. longitude! and east of the longitude of Cape Kumlik 157'27 ' W. longitude! Figure 3! .
The district is further div1ded into seven management sections fordungeness crab Figure 3!, Dungeness crab are found in all thesesection; however, some are more productive than others. Beginning withthe Northeast section; which compri ses the area from Cape Chi niak northtc the northernmost tip of Shuyak Island including Chiniak Bay, MarmotBay and Southeast and Northeast Afognak Island, Most of the land areais heavily timbered with Sitka spruce. The bays of Kodiak Island,wfere dungeness are caught, are large b road sheltered shallow bays averaging 60 meters in depth!. The potential habitat for dungenesscrab could be quite 'large; however, these bays are also inhabited byking and tanner crab which are fierce competitors with dungeness.During high populations of king and tanner crab, dungeness catches inthese bays are very sma'll, F1shermen report that their dungeness potscatch king crab. It is not known whether the dungeness populations arelow dur1ng high king crab populations, or whether the king crab aremore act1ve feeders keeping the dungeness «rab out of pots.
The Afognak Island bays, where dungeness are found, arecharacterized by being 1ong, narrow and deep bays �00 meters! withshallow areas �0 meters! formed by stream mouths. These areas arequite small and appear to be marginal habitat for dungeness, as theAfognak Island catches have been historically very small. In fact, theNortheast section has produced only four percent of the historicharvest of dungeness crab.
The Eastside section includes pr1 mari ly two large bays, Ugak andK liuda, wh1r.h are relatively long, broad and deep �00 meters!. Thesebays are characterized by having large shallow water areas 1nhabited bydungeness crab . These a reas are located in the numerous small baysinside the two larger bays. In addition to these large productivebays, shallow water habitat exists on the exposed beaches from CapeChiniak south to Dangeious Cape. This a rea is one which would compareto the open ocean hab1tat found on the west coast of Oregon andCalifornia. The sha'liow water �0 meters! extends three miles offshore in some areas.
Ii 1s in these waters that dungeness are found co-habi tati ng wi thrazor clams. The Eastside section production has accounted for 17perCent Of the KOdiak dungeneSS historic harveSt Table 2!.
The Southeast secti on includes the waters south of Cape Bar nabasto Cape Trinity, inr.luding Sitkinak Island. The Southeast sect1on has
102

QpIIIcga
103

some minor production areas located in typically deep water bays withnarrow bands of shallow water near shore where dungeness are found.The major production areas, however, are located at Ocean Bay and inthe water surrounding Sitkinak Island. In 1983 this section accountedfor 1.9 million pounds,
The section which most resembles the West Coast fishery of openocean beaches is the Southwest section, which extends north of CapeTrinity to Cape Ikolik then to the southernmost tip of Cape Kilokak.In 1977 the Southwest and Southeast sections were created from asection called the Southend. These two sections have historicallyaccounted for 43 percent of the Kodiak dungeness harvest Table 2!.
The Alaska Peninsula also supports a dungeness crab fishery, ThePeninsula is divided i nto two sections; the North Main'land and SouthMainland sections Figure 3!. The North Mainland and South Mainlandsections are comprised of primarily open ocean beaches with a few deepand narrow bays. The North 'Mainland has historically been moreproductive than the South Mainland accounting for 18 percent of theKodiak dungeness harvest.
The final geographic area that comprises the management units ofthe Kodiak dungeness fishery is called the Westside. This area coversthe waters west and south of the northern tip of Shuyak Island to CapeIkolik. This area has an extremely rugged, high cliffed, rockycoastline, Dungeness crab are found in long narrow deep bays such asUganik and Uyak bays Figure 3!. They also occur in Kupreanof straitsalong the southern shore of Raspberry Island, The Westside secti on hastraditionally produced 12 percent of the Kodiak harvest,
In sunnnary, the Kodiak Island, Afognak Island and Pacific side ofthe Alaska Peninsula comprised the Kodiak dungeness fishery, Thehabitat is highly variable, as are the dungeness populations found ineach of the areas.
Distribution of S ecies
No population estimates of dungeness crab have been calculatedusing standard survey techniques in the Kodi ak Management area.Dungeness crab distribution is obtained from the fishing fleet. Alldungeness crab fishermen are required to report their catch of legalmales by statistical catch area Figure 4 Table 3!. The connnercialcatch data certainly is a good indicator of legal male distribution;however, no sublegal male or female distribution estimates can becalcu lated since females and sublegal males are returned to the sea .As can be seen on Figure 4, the maj ority of crab are concentratedaround the Trinity Islands.
Dungeness crab have traditionally been fished in waters less than30 meters; however, some catches have been reported in water depthsgreater than 160 meters. The species seem to inhabit primarily shallowwater areas less than 30 meters! in both bays and beach areas exposedto wave action. The crab seem to prefer sandy or mud bottom substrate.
104

105

8
V P
OYO. 'g4 4VV I4 OV
4
4
v 84
8$
4 OgiR8i
$8 ' giiiX ' '8$88
4%484 ''Ri4
g'58' 'i 4 4a
$4888 '84L IOOO
4 4 O'IlOl
4 Vtlt OtC3
8 el 5 s
4'Ryy88'8'$ 'S ' '8
4 SI 88 888$$$$ S 8RO
-Q8$ aalu
O 4
$88884Cf 8
I06
Ot4O 4VVV V4 OOO'
4 4.V
OO j
I4 44 Ch
tt 4'OD COl O 4O VPCl OO4' OUt 4
4c OO~ I VOO' I844
iii ':- ' ' Rik ' " ill
!~ ' '==%Rig'=8
'$V' O'o' ' ' ' ' ' ' '4'
$iiii' 's 'i ' ' '
55LJCi' ' ' ' 'Ki '8 i

The Commercial Fisher
The dungeness fishery has historically held minor economicimportance, when compared to the salmon, shrimp, king crab and tannercrab fisheries. As was mentioned in the introduction of this report,the fishery started only in 1962. The amount of harvest seems to bedictated by the West Coast dungeness harvest, and to some extent, stockstatus of salmon and other shelIfish in the Kodiak area.
The fishery began in 1962 when 1.9 million pounds were harvested.The fishermen were paid nine cents a pound. It was not until 1964 thatthe number of vessels were recorded, and in 1969, the number of potlifts wet e recorded. In 1971, the number of crab were also reported Table 4!.
In 1967, vessel size was recorded by ten foot increments. As canbe seen from Table 5, 66 percent of the fleet has traditionally beencomposed of vessels less than 49 feet keel 'length. The sha'liow waterand protected bays of Kodiak can be efficiently fished by smallervessels. The larger vessels have been primarily fished in offshorewaters. The Department has conducted gear surveys since 1979 gatheringthe number of pots fished by each vessel, In 1979, skippers reportedaveraging 441 pots per vessel; and in 1983, this figure jumped to 581pots per vessel.
The largest production months in the Kodiak fishery havetraditionally been in July and August. When the fisheries were openfor 12 months a year, for example, the catch in 1968 for July andAugust was 3.2 million pounds compared to 3.6 for the other ten months Table 6!.
~Re Uiatir
In most fisheries the amount of regulations governing the fisheryis directly proportional to the effort level and population size of thetarget species. In the 1962 Kodiak dungeness crab fishery, the seasonwas open for 12 months a year, only seven inch male crab could beretained and the crab had to be captured using pots or ring gear. In1963, the fishermen had to identify their gear by marking their buoyswith the Department registration number; and in 1964, the 5tate forbidtransporting live dungeness crab using fishing vessels from statewaters.
In 1969 king crab stocks were at very low levels in Kodiak. Inorder to protect these king crab stocks, dungeness crab fishing wascurtailed from these grounds during the molting period from May I toJune 15. In 1971, the Department defined a dungeness pot as a pot witha tunnel eye opening which does not exceed 30 inches in perimeter. By1975, all dungeness vessels were required to be registered and tankinspected prior to fishing in each statistical area. In addition,vessel skippers had to notify the Department before leaving thesestatistical areas,
TD7

Cl
N
0 Cl0
000 Ct00
w NW N
ILIIrl dlVldl! rdItcLLJ555
dr 0Ol C0O 0
K dltd
Ch 0c a.
A-
00 ctLACQ
CQ NI 0N r
rpl rtlLA 'Cf'Id
0
0 OO0III CI
0 tt-O
Ctt
VlLl-
C Ctlat LI0 0.Cl 0
ctCh
CI
0O
LA LA~ tO CQCh M~ 'W N
CJ+JrdCJ 0CO
ICILl5- COChCQ
Ch0
ct
cCI�0
tlatClrdI�
N Pret LArd 44450Ch tl Ch ChLLJ!
ioe
cr5-0
IC Qtd Ol
0 DCrd rdIJNIO OlLJCJ
0 J IddlI-td cC5O rrdIrt LJCJ JJIrtCI0I JJC td0 IA
0 0 00 0 0 00 00 0 00 0 0 0 0 0 0 00 0 00 0 0 00 0 0 0 00 0 0 0 0 00 00 0 0 0 0 0 0 0 0 0 0 0 0 0 0 0 0 CI 0 0LA hOl 4 IO ct ct 0 ct 0 Pl 0 Pt ct N m ID r 0 Cht OI ct 4 ID m 0 4 N 0 IA OI ~ m N ct 0 Ot ~ Om pl w cl ch ol cQ 'N co o pI m o h ch cQ ct h
m m ct
Ch Ch Ch N m Pl ct 4 ct CQ 0 0 w ~ LA 0 LA LA ID 0 LA 40 0 0 + w w ~ ~ ~ + ct LA ct 4 w Pt r r ct r r 0
PJChLO4 m Pic tt N to cr crt Ch cl ct
IJ! tt w Pl ID CO t CO w ct CO ct LA Pl LI LA CQ CQct N LA ID w 0 4 ID w 4 t ct ~ ct CO 0At ~ r O 0 m IA ~ m ~ LA 0 OO IA N Ot LA ct0 ttt LANNCQ�4CtCtCtCI h t IAOHCtCt
0 m w + N A O IA Pl A R CO N ct92Ct Cl ~ N 4 LO ~ ~ Cl m LD LO m ct ICICh CO h Ot Ct 0 t Ct CQ 4 Ch N W LA Ct0 Ot 0 0 + ct 4 ct m m r h LD w mch ct ch ct LA 0 t Ch m 0 ch cO 0&N +N W W N ct Ltl
N rc o � H cCI cQ ct 4 4 I m 0 4 4 0 4 m H cOCI r 0 4 4 N Pl 4 Pl N LA H + N 0 ID Pl 4 ~ ct~ ID Lo 4 0 '4 ct CO LA ID 0 cO ~ 0 m Lo I ct m ~N H CQ m OL ct w LA Ch 0 0 05 rc m N m W LCI 4 N4 ~ ct IO N m ct ct ID 0 ID Pl � ~ Lo w w LO ct LAH Pl A 4 cQ cQ t ct O 0 h 4 ~ m m 0 tLA LA wcl' Pl w 4 Lo LA IA w N N NLAcl Ct
mOctOINNmf OVILAIDIDIA 4 CQ m tc t Pl LA LA N ct N 0CQ N 0 m m cQ cO IA O IAID 4 ctt r t cO 4 OO LA cQ ct 'ct ct&4 mOmc &Ol'LA&OctLA N Q Pl m 4 IA 0I lo 0 0
CJ N N
I I Ch ANcdmOIPIctctNmlDctNO A+0~mNN a ectNmNmct Nrc N N N LA + 0
h ct ID & ct Ot 920 LA CQ m 4 N N ct LO LO Pl I tct lA tt ID ct pl m LA w N w co w LA w K pl ch 4 w IPl Pl ~ ct ID ct Pl w Pl ct w w ~ N w 4 tt 0ct Ch
mct ctN Pl gI I
4 Cc cO tt 0 ~ N Pl ct ID 4 tc cO Ch O a N m4444P I I I I t h M~lc cO OcQ OCh Ch Ctl tt Ch Ch Ol Ch Ch OI Ol Ch OI Ch Ol Ol Ch Ol
~mCOdL tl5- wtdI- ~ILIIJ 5-tdCh 5-0 ILI5- LI
CQ 05-
N CO
Cl tdCt- M
� tt
Ol
N 5-Qlw JOEcd OlC LJt I0 0Id J:5-td 0ar I-
tlat ~0.0 IOC E0 Irt C
CJCr CLID 0W N

Table 5. Kodiak dungeness crab vessel numbers and lengths, 1967-1983.
VESSEL LENGTH IN FEET!10/ 20/ 30/ 40/ 50/ 60/ 70/ 80/ 90/ 100/
Year 19 29 39 49 59 69 79 89 99 109 TOTAL
2 131 33 37 5 14 2
TOTAL 22 64 135 170 59 62 44 34 4 1 595
AVERAGE 1.2 3.8 7.9 10.0 3.4 3.6 2.6 2.0 .2 � 35
PERCENT 3X 1]X 23% 29% 10% 10'4 7% 6X
109
1967 � - 51968 1 3 71969 2 5 111970 1 3 51971 1 4 31972 1 1 91973 10 3 111974 � - 71975 � - 31976 - � 119771978 - 1 71979 - 1 81980 - 2 41981 1 4 71982 2 22 201983 3 15 27
5ll5867
1274
28
127
142930
3 38 41 25 22 46 44 52 1
5 1
13 12 15 5
10 107 14
23 3 3
14 5
22 44 2531
18432933
1 2434512215
4 220282142
106103

CQCQ rmUQI ham clh 4 CINthmoNm Nc ar eater a40CQmmaa avcN m Oam ochr mcv I aa O
I NCU O QO44N CQ 0a O D l4CUCher nt 4a
fh 4 Ul ID
I�IO at CI QQ 0 e IA Ant v 4 mrQQ r emRmeoar
4 Ir Ch4 aPI DCQ
4 e ch eN
Ul � N In 092 oNKmmamQ
O[ N COUQ
O ChICIm w cQO CV VQ ChCCtl I Ir a cam
N peI Nat QJ
mthf 4thUI IIIenJ4 tInca
am AN CI f c mICI Ul rer cher ofhNae hIA IrJ at 4 CQ N CQmeal I QeCU e H
N PIN Oeaaeem
Q ma fhfhNQCQUt meeNfhvt Ner mchai e athamc4 CUOCUI
o nt cO a e D ln IA In IOI NChlCQ 4 rh a e4 4 I hl4 I moat
Nina 0 UIIDNoer er 4N eCU Q e a CU fh IOIll@CUD N afQUI l&
rh 4 4 ch ch U1Qal Xcha Nmaloa IAQJONmN hant OCUOQINI DfhQJ f Oe 1cCINl OmNOeNo ma
IA fl CINNeloo tat ecl a4V ea ONI I UlenlCUO.JUVl O ChchmCQC0 r meNCQCh0 rCh U92 Ql m 4 Ql nlrc rh m 4 cc a cO
O O A 4 al Ul4 Ch 4 4 nt e0 rhr mammr at fhemmr 001 Nmm atm trna Ch 4 fat Dl I 4 4 0 U QJ
mNeall CQIAO htht& CQNm O Otfll 014 he I Ole QCUeammO Ng
e Ut Vt Ch th rh VQ
92Ama 0'eohJoo nt tDe0 cath cr rantmaa rnl lae NIA e
r mfheN fhmN 1ON t vl IA ol cr ICImenlnl 01� m CQ N e N mr ID o 0 N Dt hlN O U hhr NIQICQIO mal
fh IO IO 10 CU N OQ ID hmQ v0 IQ lnmN
CU 'cr Ul � Ul IofhC m DlCQQmN Am 4 nt N cr ch4 m cD Q 4 Ch4 0 th
U92Ul OJCOQ ftN o 4 N e N VlU et nlaolfh CQIDaaN4IDAI ONI 0 IA CU rh
Ch I Ol ID CU IA N OIQQ'IO mOIAQNW lat Ocl~ I NNemnl rh e m If
A act 0 V I I Jhea ar atmNVC 401t th CU CO D 01 Ilt UlOO4oorA r Oint
I D0 CU
oe chCUN CQ N 4 Ol e NrmeN&e
t I IOCU'IO tlCCta 0lft th~ fl a c5
LU UIt IIJJJQct aaa4 IA NCt I U92
Vta I Ql tN 4 Q Q a
8 a o fh u uLU UJ UIVl 92ft Ul
aoo O ONlnhlm I ct malChr yntm
NmNN aaalVl IA
Tl0IC
� OW aO 0m al O O r IXtI N IO rh chr +ther
rh ht
QtI
Nme 44 cQaoC '0 QU144CJ 0 DImaamnaa t'0aNNvtemmr Nm
Q
Vl'0 0
I ClQtQI~:
ICDI 4 0a rVQO IArfh I
I OCOlAJ
e chmmIO ntr

In 1976, the season was set at May 1 through December 31, andduring the closed period all crab pots had to be stored on dry land.By 1977, fishermen were concerned with non-commercial crab escapingfrom their gear and instituted the requirement of two circular 4 3/8inch escape rings in each pot located on the upper half of the verticalplane. Also, the size limit was decreased to six and one-half inchesinside measurement from seven inches outside measurement in 1977. In1978, all pots had to contain a termination device which would renderthe pots inoperable, if the pot was 'tost. Finally in 1981, the seasonwas changed from May 1 to February 1.
In surnnary, these are the regulations in effect that are currentlyused to manage the dungeness fishery in Kodiak.
Fisher Mana ernent
The Kodiak area dungeness fishery management strategy is based onthree main criteria: size, sex and seaso~. The fishermen are allowedto harvest as many male crab over six and one-half inches carapacewidth! from May 1 until February 1, This management strategy has beenin effect since 1962; and as can be seen on Table 6, the harvest hasfluctuated from a high of 6.8 million pounds in 1968 to a low of 87,000pounds in 1976.
No quotas have been set on dungeness crab in the Kodiak area forprimarily two reasons, First, no Alaska Department of Fish and Gamepopulation estimates are available on which to base a quota. Second,the harvest of six and one-half inch crab assures that the reproductivepotential of the stock is protected,
As was mentioned in the Regulatory section, fishermen must abideby many administrative regulations in addition to size, sex and season.The Department of Fish and Game monitors and requires fishermen toprovide information about their cormrrercial catch of crab. Thefishermen must report every landing made to the Department with thefollowing information: a. date of landing; b. area caught;c. number of crab; d. number of pounds, e. number of pots pulled;and f, of course, the vessel name and skipper. This information isreported by the Department on a monthly basis. In addition to dataprovided by fishermen, Department personnel interview fishermen whilethey are unloading thei r catch; sampling crab for width, condi tion andaverage weight. These dockside samples were instituted in 1968, when746 crab were measured to obtain a mean carapace width of 189 rnn Table 7!.
Research
In April of 1968, the first research data on dungeness crab wascollected by Morris in Saltery Cove. Morris used the dungeness crabvessel, JAN M, to catch dungeness in pots and recorded widthfrequencies, shell age and egg condition. In May of 1968, McMullencollected the same information from trawl surveys conducted in SantaFlavia, Ugak, Kalsin and Middle bays.
111

Table 7. Catch per pot and mean carapace width dungeness crab, Kodiakarea.
MeanCarapace 1
~ll l d t hSampleSize
AverageWt./Crab
AverageCatch/PotYear
1 Measured immediately. Anterior to the 10th lateral spine.
112
1968196919701971197219731974197519761977197819791980198119821983
12 9 6 6 33 4 9
12
6 4 9 9 4 4
746
2,04154250
996209
1,101NA
163928474
1,097622561
1,978
189
193189189179186178NA
186181180177180181180
2.62.72.62.52.22.22.02.32.42.22.02.02.12.32.3
In 1970, the first formal research program was started by 8rownand Jackson. Jackson began a tagging program with the objectives todefine growth per molt, age class composition and migration. He taggedI,915 crab in 1970 releasing them around Kodiak Island from fourdifferent vessels Table 8!. Jackson recorded depth the crab werecaught, measurement inside and outside spines and carapace damage. Thetagging program continued until 1972, Unfortunately, these studieshave not been published, and the information was retrieved fromDepartment files. No intensive analysis of the data has beenattempted. Table 8 presented i n this report summa ri zes tag release andreturns, and Table 9 lists the incidence of molting. It appears fromTable 9 that, of those crab measured, on the average one millimeter amonth is gained by molting crab,
No current dungeness crab research program exists in the Kodiakarea. After reviewing the unpublished data on dungeness in the area;the author would recomnend continuation of the tagging program, and thedocumentation of the molting period in each major producing area,
Stock Status
The Kodiak dungeness crab stocks are at the edge of their knownrange MacKay 1942 !. The only indi cator of population size in the areais based on commercial harvest. The commercial harvest figures mayhave appropriately mirrored the population size in years of intensiveharvest; however, for those years 1974-1977! the harvest was heldartifically low because of market resistance. The abundance of crabwill fluctuate as a result of natural cycles in the populations; andthe current management strategy objective to harvest all males over sixand one-half inches will, undoubt.edly, perpetuate the cyclicfluctuation, The harvest is strictly dependent on the strength of theincoming recruit class, as most known habitat is presently cormrrerciallyfished.
The dungeness crab populations has sustained harvests of over fourmillion pounds each year since 1981 Table 4!. Compared to thehistoric average harvest of three million pounds, the stocks appear tobe at moderately high levels.
Conclusions
The Kodiak area dungeness crab fishery began in 1962 on stocksthat inhabit the periphery of their range. The harvest has beenprimari ly dictated by market conditions, which have been based ondungeness harvests on the west coasts of Canada and the United States.The dungeness fishery has held relative minor importance in the Kodiakarea, until recently with decline in the shrimp stocks and closure ofthe king crab fishery. With the fisheries greater economic impact onthe comrunity, the Department of Fish and Game should establish apermanent dungeness research program to provide growth informationwhich would be used to set a biological size limit that would insurethe reproductive potential of the stock be protected.
113

dj LCP ddjdj 0 NIDO dQPId PdW 0O OI�
ID 0 Cd 0 IPP IDdl Cd CD 0 < g>
dj I41 0 Ljj IPPI~ jd O O Cjj dj IDd!
I0Cjl
000 0
OOO ~O
0 00000
0 H 00 0 00
djWO 0
ICI dj 0 cj O
00Cjl
PdQPw 0 dd 0 0
dlOO54 Adj NO
P NOdjr
a N O CCP ct
ONHOON0
0 dj + 0 0 Ijj 0 0 0
Ql
O 4P OO O
O O O LCI ~
CF DID IC>P dd 40't j HOdjsCPI
0 IIIIO CCP +IDO QP
O QP
IDOOOO 0
0000+NO dj
I I I I I
I I I I I
~ ID CCP w Pj 4 0O IA WN &PIPINGN H CjjCCP cCP dj 0 ICjj CCP CO 0 ID~ CCP N N IO
CjlO 4-
ICP
I-QlO
COI
ID
CCP djI IN NID ID
I IOP NID ION NdjCPI
0 OIdCjl
IdPd I
VlQlQIOI
O
I-
d O Id
dP ClOl QlIdPdQlO CPK Cd
OOCt IDI IICI IDNN
0 0Cjl djI IOIID IDN N
IPP dl
dj PI-CPI IdI � IPP
OO
CJI fd0 E
IdO+0 II/P
41dlI-C ld
CI OId MCPI dC
0 00ID wdjI I I~ CCP CXPID ID ID'NNN
CPdPQldj CCIPd djIdVct R 0
IdO 'N
OPCPP
C djJJId OdPIPP
N OII0 OI
C-QIdd
E 41
QPQl
E O

Size atRelease~mm
PercentRecoveries
Molted
AverageGrowth/
th t.Number
RecoveredNumberMal ted
130-134
135-139
140-144
145-149
150-154
155-159
160-164
165-169
170-174
175-179
180-184
185-189
190-194
195-199
200-204
50 1.12
100 .80
71 ,88
33 1.2018
47 23 ,99
17 .8436
16 ,90
19 .86
12
TDTAI/AVERAGE 170 18.832 .97
1 Those crab which were recovered and measured.
115
Table 9. 0ungenesslcrab molting incidence for tags recovered1971-1974 , Kodiak Is! and, Alaska.

LITERAT1IRE CITED
Alaska Department of Fish and Game, Westward Region Shellfish Report tothe Alaska Board of Fisheries, March 1984,
Alaska Department of Fish and Game, Annual Reports, Kodiak Area, 196Z,1963, 1964 and 1968.
Alaska Department of Fish and Game, 1984 CoEnEEercial ShellfishRegulation.
4 y. Il ld 1'.e., 1942. The Pecii c Ed hl C 4, C ~icte .Bull. Fish. Res. Bd. Canada LKII. p. I-3Z.
horth Pacific Fishery Management Plan for Dungeness Crab, December1976.
116

Session II
Life History


Ecology, growth, and populationdynamics of juvenile Dungeness crab,
Cancer magister Dana, in GraysHarbor, Washington, 1980-1981
Bradley G. StevensNational Marine Fisheries ServiceKodiak, AlaskaandDavid A. ArmstrongUniversity of WashingtonSeattle, Washington
Dungeness crabs, ~n~r !BB!~ were collected regularlyfrom May 1980 to July 1981 in Grays Harbor, Washington.Distributions growth, and feeding habits were studied forseveral age groups, Many crabs entered the estuary asmegalops in April of both years; intertidal mudflats wereimportant habitats for the earliest instars. Highestdensities of crabs occurred in suirmer, and in the outerestuary. Crabs einnigrated from the estuary at various ages.Mature females must leave to spawn. Prey preferenceschanged with age/size; the most important were shrimp ~nggn spp! end iuveni le f ish, Crabs fol lowed shi'impmovements into littoral areas, especially at night Thedifferential use of habitats by age groups of crabs wasprobably more closely related to food preferences thensalinity; no differences in osmoregulatory ability weredemonstrable between large and small crabs, Population sizeranged from 3.3 to 39,0 million crabs winter to summer!i75'L of the sumner population estimate were early instars.Grays Harbor is an important resource which contributessubstantially to recruitment of coastal Dungeness crabpopulations, and may serve as a model for crab-estuaryinteractions.
The Dungeness crab, ~r lgggi:~r Danae supports a largecoitniercial fishery in Washington coastal waters and is a topbenthic predator in the marine ecosystem. Numerous authorshave published studies on Q. !Bs g~~ ecology MacKay, 1942;Cleaver, 1949; Butler, 1960; Gotshall, 1978b,c!, but only afew have conducted studies on estuarine populations Butler,
119

Fig. 1. A. West coast of North America; arrow indicates siteof Grays Harbor. Washington, USA; B. Map of Grays Harbor,showing sites of ~~yr IMg~r collection 1- 13!, Stations14 and 15 were not sampled regularly. Sol~d lines indicateboundaries of strata used for population estimation.
1956i Gotshall, 1978a!, and those that did indicated thatestuaries msy be important nursery areas.
Grays Harbor is a large, shallow estuary on the coast ofWashington State Fig. I!. It has a total surface area ofabout Z00 square km, of which about half is exposed mudflatsat low tide. Annual rainfall exceeds 100 inches, Locatedat the mouth of the estuary is Westport, site of one of thelargest Dungeness crab fisheries on the coast. Aberdeen, atthe eastern upstream! end Of the eatuary, iS a maIOr IOgexporting center, serving the Olympic Peninsuia andsouthwest Washington. For this reason, artificiallydeepened navigation channels have been maintained toAberdeen since about 1910 by the U.S. Army Corps ofEngineers USACE!.
in 1978, the USACE funded a study of the effects ofdredging on Dungeness crabs in the estuary which showed thatiarge numbers of crabs were kiiled and injured duringchannel inaintenance dredging Stevens, 1981!. During thatstudy, I observed large numbers of Iuvenile crabs in mostportions of the estuary, and conc luded that it was probablysn important nursery area, but that it's role as such hadbeen largeiy overlooked. As a result of these observations,I requested and obtained funding from the USACE to study theecology and distribution of !uvenile Dungeness crabs in theestuary.
The objectives of the research program were:1. to determine ihe distribution of crabs in the
estuary,
120

2. to determine their diel activity patterns,3. to estimate growth of crabs in the estuary,4, to determine how crab distribution was related to
a! food habits, sndb! salinity tolerance'
5. to estimate the estuarine population size of !uvenilecrabs' snd
6. ultimately, to understand why , crabs lived in theestuary and how important this resource wss to them.
Because of the multiple goals of this study, I will treatthe methods snd results of each oblective separately.
~i~t f!8' ~ !IAg~
Hsbiiats sampled ranged from deep to shallow, sandy tomuddy, and oceanic to freshwater regions Fig. 1!. Crabsware collected at stations 1-9 with s 4,9 m otter trawl withs 6 rrwi stretch mesh cod end liner, and ring nets with 12 rrIrimesh were used at stations 10-12. Trswls were made within 2h of spring low tides, snd were measured by placing anchoredbuoys ai each endpoint, than fixing their positions bycompass triangulation. Oistance towed wss converted to areaswept' and crab density standardized to crabs per hectare.ANOVA snd regression analyses were conducted on log-transformed data.
Crab density was greatest in surrmer at all stations. snddecreased to very low values in winter Fig. 2!.Additionally, crab density was greatest near the estuarymouth, and decreased with distance upstream, Thesedifferences were both statistically significant at p~O,OI Ftest; Stevens snd Armstrong. 1984!.
in April of 1980 and 1981. large numbers of megaiops stagelarvae entered the estuary as free swillmers or attached to
and first through third instsrs wereabundant by late flay. Three ma!or carapace width cw!frequency modes were distinguishable in the spring of bothyears Fig. 3!, which were concluded to represent distinctyear classes. Abundance and growth data were analysedseparately for each age-class siza-group!. In 1980, young-of-the-year YOY!, or 0~ age crabs, were present at alltrawl sampled stations. These were mosi abundant at station5, in the south branch of the estuary, near mud flats andextensive eelgrass ~I~ spp.! beds. The I+ crabs werethe most widespread throughout the estuary, comprisingalmost 80'L of crabs collected at the farthest upriver sites,9-12 Fig. 4!. The 2+ crabs were most abundant in the outerestuary' with small numbers elsewhere. Age 3~ crabs werecollected ~nfrequently by the trawl but were nixserous inthe harbor, ss shown by trap coliections; Stevens, 1981! andwere restricted to the outer estuary, especially stations Iand 3. Closer examination of mudflats sd!scent io statiOn 5and similar areas in the northern portion of the estuaryrevealed fairly high densities > 1 per square m! of early
121

40100
3280
24
1640
20
00
1980 19811980 'I98120x
16Q!
12O0!
8
1980 19811980 198140
3210
24
1980 1981 1980 'I981
Fig. 2. Crab density for all stations in Grays Harborsafnpled in 1980-81. A] Station 1; B! Stations 2 filled!and 3 open!; C! stations 4 filled] and 5 open!; D!Stations 6 filled] and 7 open]; E! Stations 8 filled!and 9 open!; F] Stations 10 filled], 11 open], and 12 dl arnoiids! . Trawi s~l ing stat i ons 1-9 shown as crabs/ha;ring net sa~ling stations 10-12! shown as crabs/net. EachpOint repteSentS a Single sainple.

instars ouried in the mud which was exposed at low tide. Icalculated that trawl-estimated densities of this size-groupreflected only 0.033 of the probable actual densities.
Growth analysis wes based on the assumption that three ma!OimadeS preSent eaCh Spring repreSented Separate year ClaSSeS.By September, YOY crabs averaged about 40 rnti cw. This sizegroup virtually disappeared during winter. but reappeared inspring of 196 1, with an average cw of about 45 rwti. thus theydid not appear to grow appreciably during winter Fig. 5!.This pattern of slow winter growth occurred among all agegroups. Dry weight vs. width regreSSiOns were notsignificantly different for inales <132 mm! and females�112 inri! , so a combined regression equation wascalculaied1
Log weight g! = -4.064 + 2.832 log cw nm!10 10
0 5:ID 21..15.III J
+ 010052
dZf&IflllRll~ffli~>2a0
~iiit>Tii~0
D
0 15 20 55 50 25 IXI 105 120 155 150 155
0 '15 5D 55 50 75 00 9205 120 155 15D 155
Corapoxn Widih in S mm Ini020015
123
Fig. 3. carapace width frequencies of all crabs caught bytrawl at stations 1-9 in Grays HarbOr, 1980 81. NuinberSexpressed as log I,base 10! lcatch + 1!. Box for eachsampling period snows date, numbei of crabs measured. meanCarapace width overall lin rgri!, and stanClard deviation.

This equation was used to calcuiate mean weight from meanwidths, There appeared to be an inflection point in thegrowth curve about late August, so IH values were calculatedseparately for spring-summer and fall-winter growth stanzas Table 1!. The dry weight of YOY crabs approximatelydoubled each month until September. One year aftermetamorphosis, they weighed, on average, 282 times the dryweight of a first instar.
From studies of San Francisco Bay, Tasto 1983! and Collier 1983! concluded that only one year-class occupied thatestuary, and that crabs grew to about 100 rmri cw in one year.compared to ocean-reared crabs which grew only haif as fast.
SITE 15.4
AGEGROUP
~ HxiHIHHHiH 0 +1+2+3+
1 2 3 4CRABS HECTARE ' x 100
10 0 2 4 6 8 10CRABS PER RING NET
Fig. 4. Mean number of crabs/ha stations 1-9! or ciabs/net stations 10- 12! over the entire study period, by age-class.Age 0+ vertical dashed lines!, 1+ open bar!, 2~ filledbai !, and 3H slanted dashed lines! shown.
124

Dr Wei htYear 4 May 29 Aug 22 Aprclass 1980 1980 1981
k % wt k L wtgain gain
1980 0 02 1.75 5,561979 4.02 11.75 21.461978 24.30 59,70 98.71
1. 118 2060. 268 310.225 25
0. 147 15. 80.075 7.80.063 6.5
979
'XI-ci
9BO
991
M J J A 5 0 I4 0 J F M A M J J
f9 Bii9BO
Fig. 5 Mean width of four age-classes of crabs �+, 1+ ~ 2+,3+! in Grays Harbor. 1980-81 Mean width ~ 1 SE! shown foreach age-class within each sampling period.
125
Table 1. Weight-specific growth rates and percent dryweight increase of three year -c lasses of g~nr mltgi~r inGrays Harbor, WA. Weights calculated from mean carapacewidth of each year-class by regression equation. Growth permonth calculated for Spring-Suiinier May-August! and F all-Winter September-April! growth stanzas.

This contradicts my interpretation of growth in GraysHarbor, and would ~ndicate that growth is much faster in SanFrancisco Bay, or that Tasto's sampling techniques ciid nateff icientily catch the smallest crabs. Although it isconceivable that growth rates could differ between estuarineand ocean reared crabs, it is unlikely that growth rateswould differ so drastically between these two estuaries. Alarge proportion of the California study was conducted bysane ling crabs with ring nets with 25 or 45 ran mesh. Thiswidth was prabably too great to capture the first 5 to 7instars, and may explain why the smallest crabs were soirifrequent in their bay area callections. Furthermore, my~nterpretation is supported by periodic diel collections inGrays Harbor see below! in which thousands of crabs weremeasured aver a 3 day time period. These samples were anorder of magnitude larger than those collected in SanFrancisco-San Pablo Bays by Tasto or Colilier.
Dial trawl sampling was conducted at two stations, one in adeep channel station 3! and one on an ad!acent tidallyinundated sand-mud flat station 13! During four quarterly3-day sampling periods June and September' 1980, andJanuary and April. 1981!, tows were made during every slacktide at the channel site, and during high tides only at thefiats site Stevens et al , 1984!.
In the channel, crab densities tended to be greater at lawtide, but not significantly. This pattern occurred in ailseasons except spr~ng, when it was reversed, probably as aresult of heavy rainfall and consequent high river flows.Generally, crab densities tended to be greater in thechannel than on the flats, due to frequent exposure of thelatter. Catches in the channel decreased at night, whereasdensities on the flats increased at this time, producing asignificant interaction effect in January and over all datacombined Fig. 6!. Since regression analyses showed verylittle dependence of catches on salinity' I concluded thatthese differences were a response to the movements of preyorganisms, primarily the shrirrXi ~g� ~ERST?ail B. andtwo congeners, Q. !!J~~ , and Q. ~t~fLLCJJr. ~ whosetatal abundance on the fiats increased by 1-2 orders ofmagnitude at night Stevens et al., 1984!.
The previous conclusion relating ta food availability waswell supported by studies on the food habits of the crabs inGrays Harbor. Stomach contents were analysed fram 410 crabscollected at both diel-sampling sites in ail seasons ~ and .attwo additional sites farther upstream stations 7 and 8!.Data were analysed by the use af ihe Index of RelativeimpOrtance Stevens et ai.. 1982!.
Prey preferences showed few differences between day andnight, or sites ssm~ led. Some seasonal changes in diet were
6

PIGH YIOE TRAWLS
I 8XLU
I- C F C F CC~ FP C F C FYIPS SEPT JAII APRIL ALL1988 1988 1981 198I
Fig. 6 Mean densities 9 1 SE! of C. ragger during hightides showing differences between day and night trawls atchannel and flats sites. Day/night differences weresignificant q<0.05] where marked wityh an asterisk,Significance levels of the light/site interaction are notedabove each SeaSOn. CI channel; FI flatS, N=3 for all meansexcept April. flats n=2!.
apparent, related to prey availability. Diel patterns ofstomach fullness showed no consistent pattern, beingdifferent in every season. The greatest differences wereapparent when diets were compared between size-classes ofCrabS Fig. 7!. Small Craba <60 YTEri CW] preyed most heavilyon small bivalves. Medium crabs �1-100 YYEri cw! preyed lesson bivalves and more on crustaceans and luvenile fish.Larger crabs > 100 Yitri cw! preyed mostly on smail f i sh, andproportionately less on bivalves and crustaceans. The mostimportant prey items overail were the Crangonid shrimp,consumed by all size groups to some degree. A small amountof cannibalism also occurred, especially among the smallestand largest size groups Stevens ei al , 1962]
Although regression analyses of catch data sho~ed littleinfluence of salinity, this variable still appeared to be agood general indicator of crab distributions if notabundance. In particular, 09 and 1+ crabs were moreabundant in lower salinity areas than were larger crabs,thus indicating that smaller crabs might have better
127

126.2 mm79.1 mm39.7 mm
60
40
CC 20
20
U Q40
60
80.6 rein�6!
117. 7 mm�4 !
47.4 mm�9!
Fig. 7 Relative composition of diet of 3 size-classes of g.~ collected from outer estuary stations 3 and 13! or
inner estuary stations � and 8!. Mean carapace width andnisiiber of crabs are shown for each group. Bar lengths areeouivalent to percent of total lRi for each prey category.
physiological adaptation or tolerance to such habitats.Many other studies of crustacean osmoregulation showdifferences in osmoreguiatory ability related to age, size,sex, or developmental stage Gilbert, 1959; Hunter and Rudy,1975i Bishop et al., 1980!
128
To test for differential osmoreguietory ability, crabs werecaptured from the outer estuary in March, 198 1, andclassified as small �8-97 iiIri, mean 80 3 mti, n=58! or large 103- 157 mii.,mean 126. 1 rini, n=26!. Crabs of both size-

groups were placed in traps in a tidal creek whereaalinitiea varied from 0 to l0 ppt, at two sites "dock",and farther upstream, "creek"! about 3 km apart. Blood andambient water samples were collected periodically over 9 55h period and frozen Samples were later thawed and theirosmolality was determined with a Wescor vapor-pressureoamometer.
Blood osmolality dropped rapidly in both size groups ofcrabs at both sites, from an initial mean of 850 mQsm toabout 620 mgsm after 32 h Fig. 8!. From then on itremained fairly stable, and did not appear to fluctuate witharraiient levela, WhiCh were muCh lower and fluCtuatedgreatly. Contrary to my initial expectations, there were nosignificant differences in blood osmolality between largeand small crabs t-teat, r»0.05!,
3illJ
E8 sooE
I-500
3OO
m
30
io
i0 30 30 40 SOHOURS OF ExPosURE
Fig. 8 ftean osmolal ity + l sE! of ~ B!~~ hemolyiis3hend ambient water. Two size-classes tested at two sites.First point measured after overnight holding at collectionsite in outer estuary. ride levels shown at top. SC,C=small crabs in creek. SC,D= smali crabs at dock, LC,D=large crabs at dock.
129

From the above data it is now possible to construct sgeneral hypothesis concerning early life history ofDungeness crabs in Grays Harbor Fig, 9!. Although matingmay occur in the harbor. all spawning takes place offshore no gravid females were ever found ~nside the estuary-.Reilly 1983! reached the same conclusion for San FranciscoBay!. Larvae develap offshore Laugh, 1976! but eventuallyreturn to the nearshore zone and enter the estuary asrnegalops in April or Msy. Some crabs may enter ss first orsecond instars ailso, These first stages settle on or nearrnudflst areas, where they consume abundant small bivalvesand crustaceans. As they grow and develop they show anontogenetic change in habitat preference that is moreclosely keyed to dietary preferences than ta salinitypatternS. All siZe classes becOme leSS abundant in Winter.possibly leaving the estuary, and many return in the spring.During their second year they spread out through the estuaryseeking larger fOad SOurCeS Shrimp!. AS they mature, theyconcentrate near the estuary mouth ~here iarge numbers ofjuvenile fish are available ss prey. Eventually the femalesleave the eStuary far SpaWning, Snd perhaps for better fOOdsources as well e g. razor clams!. Some mature maiesremain in the estuary and support s smsii carrmercial fisherythere.
Zoss
Fig. 9, General hypothesis for eariy life history of ~in estuaries. Relative magnitude of postisrvsl
settlement along coast is unknown. Numbers indicatepredominant location of age groups, Many probably leave theestuary atter age I. All spawning is oceanic.
130

ILtj i2 ~I~I
The "corrected" density estimate of 39.0 million crabs rnsuirlrrer of 1980 is the most dense estimate of a population of
IMgj~ ever reported calculated for an area of 100square km, or approximately 0.4 crabs per square m!. Thewinter population dropped by an order of magnitude. whetherthis decline was due to burial, errrriigratron, mortality orother factors is currently unknown. The populationincreaaed again the fOIIOwing Spring, priOr tO arriVal Ofthe 1981 year-class.
Table 2. Results of the population size estimationfor juvenile ~ 0!sgj~~ in Grays Harbor.
Efficiency TotalFactor Crabs
millions!
SeasonsAge-Group
InitialEstimate
millions!
Surrmerp+1+2+Tots I
0.963.96I'08
0,0330.50.5
28.97.92.2
39,0
Fall-klinterp+1+2+Tots I
0.82.30.23.3
0,19I . 160. 10
0.250.50.5
Springp+1+2+Total
0.250.50.5
0.231.481:95
0.93.03.97.8
131
In order to guage the relative importance of the estuary tocrabs, and the relative magnitude of impacts from dredging.crab density data were used to calculate the population sizeof juvenile crabs in the estuary, A stratified randomtechnique was used for which strata were definedencoiiipassrng each sarrp ling stat~on, and replicstes were thetows taken there within a given seasonal period Fig. 1! SeeStevens and Armstrong, 1984, for confidence limits and otherdetails!. Crab abundance wss calculated for each age-classin each of 3 seasonal periods: surrrrrer, fall-winter, andspring. Separate trawl efficiency factors were derived forYOY crabs in Surnrrer � 033, SS deSCribed abOVe!, adult crabs�.5, based on Gotshsll, 1978a!, and YOY crabs from fallthrough spring �.25 ' an interpolated value!. "Correctedabundance" was calculated by applying these factors toinitial abundance estimates. No confidence intervals couldbe calculatecl for the final estimates Table 2!.

Mortality rates for adult crabs are approximately 0.2 Jow,1965!. Rates for juveniles are unknown but are probably muchhigher in their first year. Using rates of 0.8, 0.5, and0.2 for 0.5, 0.5, and 2.5 years respectively, I calculatedthat the 1980 cohort of 29 million YOY crabs ~ould bereduced to 4.6 million adult males by age 3.5, at which timethey should be recruited to ihe corimercial fishery Stevenssnd Armstrong, 1984!. If the assumption is made thatequivalent recruitment of early instars occurred to WillapaBay, a nearby estuary of simiiar size to Grays Harbors thenabout 9.2 million adult male crabs could have been madeavailable to the coastal fishery by January 'l985. ThisSmOunt repreaentS abaut 240% of the annual mean landinga inWashington coast ports for the period 197 1-1980 about 3.85million crabsj. Since landings have fluctuated greatly inthat time period, these estimates, if taken literally' mayindicate s good year class in 1980. Howevers due to thespeculative nature of these estimates and the manyassumptions involved, they should be interpreted simply toimply that the recruitment of juvenile crabs to these twoWashington estuaries probably represents a relative'lysignificant contribution to Washington coastal crab stocks,
FFF. jar~
The results of this research serve to emphasize a number ofiirportant questions concerning Q BIftgi ~r biology whichremain to be answered.
1. What is the exact nature and extent of intertidalhabitat usage by early instar crabs2
2. What is the relative importance of nearshore coastalhabitat for YOY crabs, compared to estuaries likeGrays Harbor2
3, What is the burial behavior of Dungeness crabs, andhow does this behavior affect trawl densityestimates and dredging iiimacts2Is growth in the estuary more rapid than offshore.and how does differential growth affect theinterpretation of year classes and growth rates2If estuaries sre as important for nursery areas ssthey now seem to be in Washington, what is therelative importance of numerous small estuariesalong the Oregon coast to conmierciai fisheriesthere7
The potential contribution of estuaries as nurseries formarine life is very great. Therefore it is imperative thatextensive steration or development of these habitats shouldbe permitted only after careful consideration of possiblelite>aCta tO indigenaus fauna, particularly those Of obviOuSeconomic importance.
132

LITERATURE CITED
Bishop, J. M., J. G. Gosselink, and J. H. Stone. 1980.Oxygen consumption and hemol ~h osmolality of brownshrimp, ~n B ~~~. Fish. Bull. 76i741-757.
Butler, T. H. 1956. The distribution and abundance of earlypostlarval stages of the Br~tish Columbia ccxixrierciaicrab. Fish. Res. Bd. Can., Prog. Rep. No. 107i22-23.
Butler, T, H. 1960. flatur lty and breeding of the Pacificedible crab, ~n rJIygi~t r Dana. J. Fish. Res. BoardCan. IT.641-664.
Cleaver. F. C. 1949. Preliminary results of the coastalcrab ~~i~ ~~! invest i gat ion, Wash. State Dep.Fish., Biol, Rep. 49Ai47-62.
Collier, P. C. 1963. Movement and growth of postlarvalDungeness crabs' ~ IMigJJI3J.r. in the San Franciscoarea. Chapter 9 ~ Wild. P., and Tasto, R. [eds.!, Lifetiistory ~ environments and maricuiture studies of iheDungeness crab, g~ac 10y~, with emphasis an theCentral California fishery resource. Calif. Dep. FishGame, Fish Bull. 172i125-133.
Gilbert, A. B. 1959. The composition of the blood of theshore crab, ~~11WB ~ Pennant, in relation to sexand body size, I. Blood conductivity and freezing po~ntdepressions. J. Exp. Biol. 36:113-119.
Gotshall, D. W. 19'78a. Relative abundance studies ofDungeness crabs, ~ ~iBJJ~, in NorthernCalifornia. Cal. Fish Game 64:24-37.
Gotshall, D. W. 1978b. Catch-per-unit-of-effort of NorthernCalifornia Dungeness crabs, ~r magJJxt~r. Cal. FishGame 64i189- 199.
Gotshall, D. W, 1978c. Northern California Dungeness crab,~r IBILikl~, movements as shown by tagging. Cal,Fish Game 64:234-254.
Hunter, K. C. and P, P, Rudy ~ Jr. 1975. Osmotic and ionicregulation in the Dungeness crab, ~gggr mgg~gr Dana.Comp. Biochem, Physiol. 5 IA:439-447.
Jow, T. 1965. Caiifornia-Oregon cooperative crab taggingstudy. Pacific Mar. Fish Coinri. Rep. for the years 'l963-64. 16- 17: 51 52.
Lough' G. 1976. Larval dynamics of the Dungeness crab,~r rJIagj~. off the Central Oregon coast. 1970-TIFish Bull 74i353-375.
133

MacKay, D. C, G. 1942, The Pacific edible crab, ~~Bull. Fish. Res. Board Can, 62:1-32.
Reilly, P. N. 1983. Dynamics of Dungeness crab.~m IrtLLB~, larvae off Central and Northern California.Chapter 6 jJ! Wild, P., and Tasto, R. [eds,!, Lifehistory, environment, and mariculture studies of theDungeness crab, ~r B!f}gj~r, with emphasis on theCentral California fishery resource. Calif. Dep. FishGame, Fish Bull. 172:57-84.
Stevens, B. G, 1981. Dredging-related mortaiity ofDungeness crabs associated with four dredges operatingin Grays Harbor, Washington. Wash. Dep. Fish. andUSACE, Rep. No, DA-79-45. I41 pp.
Stevens, B. G., D. A. Armstrong, and J. C. Moemen. Dielactivity of an estuarine population of Dungeness crabs,
macLi~~r, in relation tO feeding andenvironmental factors. J. Crust. Biol. 4:390-403.
Stevens, B. G., D. A. Armstrong, and R. Cusimano. 1982.Feeding habits of the Dungeness crab ~n r 0!sLi~r asdetermined by the Index of Relative Importance. Mar.Biol. 72:135-145.
Stevens, B. G., and D. A. Armstrong, 1984. Distribution,abundance and growth of Juvenile Dungeness crabs, ~n rm~i T, in Grays Harbor estuary, washington. Fish.Bull. 82�!:xxx-xxx.
Tasto, R. N. 1983. Juvenile Dungeness crab,studies in the San Francisco Bay area, Chapter 10 jnWild, P., and Tasto. R. eds.!. Life history,environment. and mariculture studies of the Dungenesscrab, ~nr m~is~tr, wi th emphasis on the CentralCalifornia fishery resource. Calif. Dep, Fish Game,Fish Bull. 172.135-154.
134

Sampling design and methodology forjuvenile Dungeness crab surveys
Donald R. Gunderson, David A. Armstrong andChristopher RogersUniversity of WashingtonSeattle, Washington
Direct population estimates of juvenile Dungeness crabs, where thegoal is to use area swept and quadrat sampling methods to determinepopulation sizes, presents a number of challenges. First instarjuvenile crab are known to settle out in a variety of habitais,ranging from open coast to estuaries, and from continental shelf tolittoral zone, In addition, they are quite small down to Grrmcarapace width! and c'losely associated with the substrate, burrowinginto it at times. In the course of a Sea Grant investi gation onpopulation sizes and dynamics of Dungeness crab in Grays Harbor andthe adjacent Washington coast Armstrong and Gunderson; C arrasco etal., this symposium!, an approach has been developed to deal withthese characteristics in a manner that is as operationally andstatistically efficient as possible. This involves a combi nati on ofthree different surveys: a transect line-quadrat survey of theintertidal zone within Grays Harbor, a stratified random trawl surveyof the subtidal zone within Grays Harbor Figure 1!, and a systematic by depth! track line survey of the adjacent continental shelf F igur e2!,
G ~E1 ed
Otter trawls are quite effective for sampling demersal fauna. and theyare of proven effectiveness in resource assessment surveys Hayes,1983!. The hpriZOntal net mOuth opening is maintained thrOughhydrodynamic forces generated by trawl doors, however, and is highlyvariable. The mouth opening has been shown to vary with water depth,scope ratio, bottom conditions, towing speed, and rigging features Wathne, 1977; Main and Sangster, 1979; West, 1982 !.
136

Figure 1. Survey desi gn used to sample Dungeness crab densi ty wi thinGrays Harbor 1983. Four strata are shown, ea ch dividedinto one kilometer grids subtidal areas only!. Randomlyselected stations are shown as dark circles.
136

6 5
Figure 2. Continental shelf survey area and station array darkcircles! used to estimate populations of juvenile Dungenesscrab. Shown are three strata �, 6, 7! that includestations in comon depth intervals from 5 m to 73 m � fmto 40 fm!.
137
STRATI& 7TQTa. Ales aaA
lOII
aI r gg !r
I

This is probably a minor problem with full-scale commercial trawls,but is of greater signifi cance in the case of scaled-down otter traw isthat have been developed for use off small boats Mearns and Allen,1978; Gibbs and Matthews, 1982! in shallow coastal waters. This isparticularly true when the doors are rigged so that only a shortdistance separates them from the net itself.
Traditional beam trawls Carney and Carey, 1980!, where the mouth ofthe trawl is comp 1etely surrounded by a ri gid metal frame, provide analternative to the otter trawl in small-boat sampling, but are moreawkward to store and deploy. The plumb staff beam trawl has a longhistory of commercial use Amos. 1984!, and offers an additionalalternative. A nearly constant mouth opening is maintained by a rigid"beam" aluminum conduit in our application!, which can be removedafter each set. Little storage space is required, and the net can bedeployed and retrieved from a small vessel by hand.
The Ellis Highliner demersal sampling system, a modified plumb staffbeam trawl developed for our work on Dungeness crab Gunderson andEllis, 1984! is shown in Figure 3. This system was scaled for useaboard a 6.4 m Boston Whaler within coastal estuaries, and for largercommercial fishing vessels 11-2 lm! in nearshore areas of the opencoast.
Small juvenile Dungeness crab down to 6 avs carapace width! andflattish down to 20 mm total length! were the principle targets inour surveys, and the sampling system was designed to sample t.hem aseffectively as possible. The net was designed and rigged to followthe contours of the seabed closely while the "tickler" chain arrayscrubs the bottom in advance of the net, The net is of relativelylight construction and is fished with 30-60 m of 3/8-in. .95 cm!nylon towline. Nylon stretches when under strain, acting as a shockabsorber when the net "hangs up" on the bottom, reducing gear damageor loss.
Three series of SCUBA dives were undertaken in order to evaluate theeffectiveness of the net when pulled from the Boston Whaler, and tomeasure its mouth opening. 1n addition, the net was compared with ashrimp try net Headrope length = 4.9 m! used previously in Dungenesscrab survey work Gotshall, 1978; Stevens, 1982!.
These observations showed that the final trawl design Figure 3 !ma i ntained the desired shape and confi gur at ion under operationalconditions, with good bottom contact along the entire length of thefootrope. The footrope tended to dig into the substrate where it wassandy, and the main crossing chains in the tickler chain array alsomaintained good bottom contact. The tickler chain array, togetherwith the turbulent zone created behind it, dislodged small organismsfrom ihe substrate and lifted them into the water colum where theycould be trapped by the net.
The horizontal spread net width! could be readily determined eitherby measuring the net opening itself while the gear was in operation,or by measuring the distance between tracks left in the sand by thetwo lower wingtip weights. The effective width was determined to be2.3 m, while the vertical opening was estimated at .6 m.
138

System developed for sampling juvenile Dungeness crabsand flatfish. 1 � 5.1 m footrope; 2 � 4.1 m headrope;3 � 1.0 m breastlines; 4 � tickler chain arrays, 4.3 and4.9 m sections of 1,9 cm chain; 5 � wingtip weight, 6.0 x40.6 cm, 9.5 kg; 6 � beam, 3,8 cm x 3.1 m aluminum conduit;7 � quick release snap; 8 - upper net bridle, 1.0 cm x1,8 m; 9 � lower net bridle, 1.3 cm x 1.4 m; 10 - 7.6 cmcork float; 11 - ribline; 12 - main body of net, 14 mm lumen~ square knotless nylon; 13 � cod-end, with 5.5 mmliner; 14 � emergency retrieval line, with 20 cm float;15 - beam bridle, 1. 3 cm x 3. 1 m. Total length, wi ngs tocod-end is 7,9 m. Further information available fromEllis Highliner Fishing Gear, P,O, Box 55028, Seattle,WA 98153.
139

The shrimp try net used in previous Dungeness crab surveys failed tocontact the bottom adequately, a feature which greatly reduces itsutility for species such as Dungeness crab and flatfish. The footropenever got. closer to the bottom than about 5 cm, and only the loops ofchain attached to it actively contacted the substrate. This was trueeven with scope ratios in excess of 10: 1 and towing speeds as slow as1 kn.
Day-night comparisons of trawl efficiency were conducted duringSeptember 12-14, 1983, in order to examine the sampling efficiency ofthe trawl. These comparisons were all conducted from the 15 moffshore fishing vessel "SPIRIT", and a total of 15 pairs �0 total!of usab1e tows were made. The taws were made outside the entrace toGrays Harbor, Washington Lat 46 '50' to 46 56'M, depth = 23 to 38 m!,within an 8 x 2 nautical mile survey area. Mean towing speed was 2,0kn during the daytime hauls and 1.8 kn at night. A 5:1 scope ratiowas used during these toss although this was increased at shallowdepths �0 m of warp for depths less than 5 m, 100 m for depths of 5-20 m!.
Mean day-night catch rates were compared statistically using a t-testafter log x+1! transformati on S issenwine, 1978!. Size compositiondata were also collected during the day-night studies, in order toevaluate size- specific differences in capture efficiency. Size data
2were compared statistically by using k tests for homogeneity.
The day-night comparisons failed to detect any statisticallysignificant differences �. 05 level! in mean catch per nautical mileor size composition for Dungeness crab. Although mean catch rate wasgreater during the night 37. 2 versus 23 . 1 crabs/km!, the differencewas nonsignificant both for the t-test P=.242! and the Mann-Whitneytest P . 141!, This suggests that the net was equally effectiveduring both periods.
Dungeness crab are known to burrow into the substrate during the day Barr, 1980!, and the system was designed to dislodge them, A singlenighttime SCUBA dive by Barr op cit! indicated that burrowing did notoccur at night, so that the failure to detect any significant day-night difference in either catch r ate or size composition forDungeness crab suggests that the system design tended to successfullyovercome any burrowing behavior that may have occurred.
In contrast, Gotsha 11 �978! found highly significant . 05 level!differences in catch rate between 6 pairs of day-night tows forDungeness crabs when using a try net similar in size and design �.9 mheadrope, 3 m mouth width! to the one observed during our SCUBA work.Catch per tow was 75 percent greater during the night than it wasduring the day.
~Sm lan Methods
Four different strata were delineated within Grays Harbor Figure 1!,and each was divided into lxl km grids. Several of these were thenselected randomly from each stratum, with the constraint that no twostations could be adjacent. The number of stations selected from each
140

was proportional to the estimated abundance Armstrong et.al., 1982 !of crabs there, the largest number of stations being allocated tothose strata where abundance was greatest. Few crabs exist in theupstream portion of the estuary, east of stratum 3 Armstrong et.al.,op. cit.!. The allocation procedure was reviewed once the data fromthe 1983 survey became available, and an additional station was addedin both stratum 1 and stratum 2.
We attempted to sample each station bimonthly, from April toSeptember, sampling during low tide series, when the network ofchannels that characterize the Grays Harbor estuary Figure 1! areeasiest to locate and navigate. Trawling had to be confined to slacktide periods, in order to insure proper operation of the gear. Inorder to allow for a full working day the stations situated insmaller, unmarked channels were occupied during low slack, whilestations in the more easily navigable main channels were occupied athigh slack. Wean towing speed was 1,4 kn.
The small mesh �.5xvn! used in the cod-end liner frequently resultedin the net filling with detritus, gravel, mud etc. so that all towshad to be relatively short. In 1983, the mean distance fished in theestuary was 289 m. This made it imperative that the distance fishedbe measured as accurately as possible in order to keep the percenterror within acceptable bounds.
Within Grays Harbor, a method was developed whereby an anchored buoywas deployed at the point where the net first contacted bottom aftersetting, and where it was estimated to leave the bottom during theretrieval process. The distance between these buoys was measured withan aptical range finder, and by taking the measurements from aposition between the two buoys, the precision was usually within about+ 10%
The sampling design for the continental shelf survey consisted of asystematic series of stations placed along three tracklines Figure2!. The tracklines were oriented perpendicular to the bathymetry, andlocated off Copalis Head, Grays Harbor and Cape Shoalwater WillapaSay!, Stations were originally placed at 3, 5, 10, 15, 20, 25, 30 and35 fm �.5, 9.2, 18.3, 27.5, 36.6, 45.8, 54.9, and 64. 1 m!. Whererocky or untrawlable bottom was encountered, the station was moved offtransect until a trawl could be successfully completed at that depth,The transects were sampled in Way, July, August and September of 1983.In 1984, replicate trawls were added at 15 and 20 fm, and the 35 fmstations were dropped at each transect, based an a review of theprevious year's findings on bathymetric distribution.
Distance fished in the continental shelf area was determined by usingLoran C, and estimating the time the gear arrived on bottom and leftbottom from the wire angle. Host of the error in deter mining distancefished probably came from the latter process, since Loran C has aprecision of + 15-90 m.
Twenty minutes was the usual target for tows made in the continentalshelf area. However, large catches of sand dollars were frequentlyencountered inside of 5 m, and rocky bottom characterized severa 1other sites, so that taws at some stations were eventual'iy reduced toonly 5 to 10 minutes. In 1983, the average distance fished in the
141

continental shelf area was 1.2 km. i>lean towing speed was 1.8 kn.
Catch processing and sampling procedures were similar in both theGrays Harbor and continental shelf survey areas. The catch wassorted, weighed, and length observations taken for selected species.The usual practice was to measure carapace width for each crab in theCatCh. In a few inStanCeS, where large catcheS Of 0-age Crab Wereencountered, random subsamples never less than 20%! of the catch weretaken for width measurments.
Surveys of the intertidal zone within Grays Harbor have beenrestricted to detailed quadrat sampling for seasonal trends inabundance within eelgr ass and "shellhash" areas that provide refugefor sma 11 Dungeness crabs. In September 1984 transects of the entireGrays Harbor study area were made from an HH-3 Albatross helicopter,quantifying the pe~cent ground cover and areal extent of both eelgrassand shellhash. The helicopter was made avai fable by the II.S. CoastGuard, and a 11 transects were flown during low tide. More thoroughtemporal coverage of eelgrass habitat is anticipated in 1985.
Future Studies
Research to date has indicated that substrate type is an importantdeterminant of the distribution and abundance of juvenile Dungenesscrab. In 1984, we began systematically ~oting any evidence of gravel,mud, detritus and epiphytic vegetation in trawl catches, and plan toundertake detailed mapping of substrate types using side-scan sonarand underwater video in 1985/86. In 1984, the Army Corps of Engineerssurveyed a 70 square mile area off Grays Harbor using thesetechniques, and ana'lysis of the results is currently underway.Ideally, the delineation of sampling strata and allocation of samplingeffort would take the distribution and importance of habitat type sand, mud, gravel, shellhash, rocks, etc.! into consideration.
In 1985, the overall scope of the surveys wi 11 be expandedconsiderably and surveys within Wi 1 lapa 8ay wi 11 be added, Offshore,two more transects wi 11 be added, bringing the total number to 5.These transects wi 11 be spaced more closely and the southernmosttransect will extend south to Leadbetter Pt. We also anticipatefurther examination of the efficiency of the plumb staff beam trawlsystem, using direct SCU8A observations of crab densities, andcomparing the results with the densities determined from trawl haulsmade in the same area,
ACKNOWLEDGEMENT
This project was supported by Washington Sea Grant and we are indebtedto the director and staff for their help and encouragement,
142

References
Amos, 0. I984. Different varieties of beam trawl cauld be used inAmerican fisheries. Nat. Fisherman, May:53-55.
Armstrong, D.A., B. Stevens and J. Hoeman. 1982. Distribution andabundance of Dungeness crab and crangon shrimp, and dredging-related mortality of invertebrates and fish in Grays Harbor, WA.Technical Report to U.S. Army Carps of Engineers, Seattle. N NACW67-80-C0086. 349p.
Barr, L. 1980. Population and behavior studies of Dungeness crabs atSteamer Bay, Alaska. Monthly Report April! Northwest and AlaskaFisheries Center: 1-10.
Carney, R.S. and A.G. Carey, Jr. 1980. Effectiveness of meteringwheels for measurement af area sampled by beam trawls. Fish.Bu 1 1 . 78 � !: 791-796.
Gibbs, P,F. and J. Matthews, 1982. Analysis of experimental trawlingusing a miniature otter trawl to sample demersal fish inshallow estuarine waters. Fish. Research 1:235-249.
Gotshall, D.W. 1978. Relative abundance studies of Dungeness crabs,Cancer maoister, in northern California. Calif. Fish. and Game
: 24:~
Gunderson, D.R. and I.E. Ellis. 1984. Development of a plumb staffbeam trawl for sampling demersal fauna. Submitted to FisheriesResearch.
Hayes, M,L, 1983. Active fish capture methods, In: FisheriesTechniques, L.A. Nielsen and D.L. Johnson eds.!. pp 123-145.
Main, J. and G.I. Sangster. 1979. A study of bottom trawling gear onboth sand and hard ground. Scottish Fish. Res. Rept. 14: 1-15.
Main, J, and G.I. Sangster. 1981. A study of the fish captureprocess in a bottom trawl by direct observations from a tawedunderwater vehicle. Scottish Fish. Res. Rept. 23: 1-21.
Mearns, A.J. and M.J. Allen. 1978. Use of small otter trawis incoastal biological surveys. Env. Prat. Agency Rept. EPA-600:1-33.
Sissenwine, W.P. 1978. Using the USA research vessel spring bottomtrawl survey as an index of Atlantic mackerel abundance. ICNAFSelected Papers, No, 3:49-55,
Stevens, B.G. 1982. Distribution, abundance, and food habits of theg ngeness c an, ca se ~a iste, i G y na nn, ii ni gtn .Ph.g. Dissertation, Univ. Washington, Seattle. 213 pp.
Wathne, F.W. 1977. Performance of trawls used in resourceassessment. Marine Fish. Rev. 39�!:16-23.
143

West, C.W. 1982. Oevelopment and app'iication of bottom tr awlinstrumentation systems in fisheries resource assessment."Oceans 82" Conference Record, Marine Technology Society,Washington, B.C., pp. 766-772,
Abstract
In order to obtain quantitative estimates of the size of subtidaljuvenile crab populations in Grays Harbor, Washington, a stratifiedsystematic grid! sampling design was developed. Strata were selectedon the basis of homogeneity of habitat, and smnpiing effort wasallocated among these strata on the basis of previous estimates ofcrab abundance. A series of tracklines was set up in the open coastalregion around Grays Harbo~ and Wi 1 lapa Bay, in order to compare thedensity and population dynamics of continental shelf populations withestuarine populations.
A new type of demersal trawl was designed specifica1ly forquantitative sampling of subtidal juvenile crabs, and some preliminaryevaluations of its performance and efficiency were undertaken.Because of the small mesh used in the cod-end, the net was frequentlyfi11ed with debris, making short tows and precise estimation ofdistance fished a necessity.
Juvenile crabs also make extensive use of "shellhash" and eelgrasshabitat wi thin the intertidal zone at Grays Harbor. This necessitatesestimating both the geographical extent of these habitat types, andthe density of crabs within each,
Future plans for alterations in the scope, sampling design andsampling methodology of these surveys, are also discussed.
144

The role of estuaries in Dungenesscrab early life history: A case study in
Crays Harbor, Washington
David A. Armstrong and Donald R. CundersonUniversity of WashingtonSeattle, Washington
Introduction
Although most of the Dungeness crab fishery and ali reproductiveevents occur along the coast, there are several studies that point tothe importance of estuaries in the life cycle of Cancer ma ister.During the life history of this species, ovigerous f~ema es are oundonly along the open coast where eggs hatch and five zoeal stagesdevelop Lough 1976!. However, upon molt to megalopae there is a welldocumented movement of this last larval stage toward shore Lough1976; Cal. Fish and Game 198 1; Rei lly 1983! and entry directly intoestuaries Stevens and Armstrong 1984 for Grays Harbor; Reilly 1983for San Francisco Bay!. iiewly metamorphosed first insiars areabundant in estuaries Butler 1956, 1961; Gotshall 1978; Stevens andArmStrong 1984. Tasto 1983! which has led to the notion that theyserve as nursery grounds for young-of-the-year YOY=D+! and 1+ ageclass crab.
Present management plans for Dungeness crab can put no specific valueon the importance of estuaries to the fishery other than to say ingenera 1 terms that they may be significant. It is therefore difficultto argue to what extent estuaries like Grays Harbor and Willapa Bayshould be protected, what sort of development should be allowed and~here its location within an estuary might be compatible with habitatrequirements oi crab.
P Ians to alter and develop estuaries will be proposed for decades tocome. A warning as to the possible impact on Dungeness crab resultingfrom extensive and poorly planned development of Washington estuariescan be taken frorx San Francisco Bay. In 1957 landings of crab at SanFrancisco exceeded 9 million lb. but by 1960 and for the last two
145

decades landings have usually been about 0.5 million lb. Farley1983!, Hypotheses to account for the demise of this fishery includeimpacts to the bay caused by extensive dredging, landfill, municipaland industrial developraent and concommitant pollution, and theenormous agricultural drainage that enters the bay complex see reviewby Armstrong 1983; Wild and Tasto 1983 !. The San Francisco estuaryhas been estimated to shelter up to 80% of incoming YOY in some years Tasto 1983!, which suggests that loss of vital habitat couldsignificantly reduce recruitment to the offshore fishery.
Due to the coavnercial importance of Dungeness crab in Washington stateand the potential impact on the species caused by an expanded dredgingprogram in Grays Harbor, the Army Corps of Engineers COE! sponsoredresearch work in 1980-81 on both crab populations and dredgeentrainment that provided substantive data on the magnitude, abundanceand distribution, timing of movement and habitats of the species Armstrong et al. 1982; Stevens and Armstrong 1984 !. Based oncalculations of crabs entrained per cubic yard removed by differentgear in several seasons, these authors predicted that up to 2.6million crab would be ki!led during operations through summer while1.5 million might be killed if dredging was restricted to an extendedwinter season of September through February. As a fraction of theannual population estimated to be 28 million in 1980, Armstrong etal . 198Z, but revised upward to 39 million by Stevens and Armstrong1984!, a year-round operation might kill 4.6% of the population eachyear, but a winter operation could kill Z6% of a much smaller residentpopulation in that season see Stevens this symposium proceedings!.
The contribution of YDY juveniles in Grays Harbor to the offshorefishery 3.5 years later was calculated by Stevens and Armstrong 1984!based on an initial 0+ population of 29 million revised upwar d from18 million calculated by Armstrong et al, 1982!. By using a varietyof mortality rates from 2 = 0.8 to 0,5 in the first year and 0.2 Jow1965! thereafter, they calculated that 4.6 million males might surviveto the fishery, a number that could be doubled to account forrecruitment from Wiliapa Bay. The ten year average landings from theWashington coast are about 3. 85 million cr ab based on an averageweight of 0.9kg/crab!, which leads to the conclusion that Washington'sfishery could be supplied entirely from recruits that settledinitially in coastal estuaries; this conclusion, however, is tentativebecause of sweeping extrapolations required from the data.
While this study provided the best estimate of crab density andpopulation abundance in Grays Harbor or any west coast estuary to thattime, it still embodied two important problems: 1! sample stationswere restricted to an area in and near the main navigation channeland, thus, the extrapolations from station density to total populationabundance was based on no information for large segments of theestuary including several habitats thought to be important forjuvenile crab e.g. shallow eelgrass flats!; and 2! the gear a smallotter trawl! was considered inefficient for very small crab althoughno study of this issue was made.
As an outgrowth of this first program, we acquired funding fromWashington Sea Grant to begin a program in 1983 that has as itsobjectives the following:
146

1. Contrast juvenile crab abundance in Grays Harbor estuary tothat offshore.
2. Improve the survey design for the estuary by increasingspatial coverage, and using improved gear.
3. Include, for the first time along the Washington coast, anoffshore trawl survey coincident with that in the estuary seeCarrasco et al . this symposium! .
4. Contrast crab population structure, mortality and growth ratesbetween the two systems.
5. Study the occurrence of juvenile crab on different substratesin order to identify sediment type and/or materials ofgreatest importance to early instars.
Methods and results to date for certain components of this project arereported elsewhere in this symposium proceedings by Gunderson et al.on sampling design, methodology and gear, and by Carrasco et al, oncrab populations offshore. In this particular report we describeresearch and results in Grays Harbor estuary during !983. and considerdata in light of other studies of Dungeness crab population dynamicsand general ecology of the species.
Methods and Materials
Sampling Design and Gear.
Details of these aspects of the project are given by Gunderson et al. this symposium! and only paramount features will be noted here. Thestratified random survey design of Figure I was based, in part, onwork of Stevens and Armstrong I984! in Grays Harbor but was expandedto include sample stations throughout navigable areas of the estuary;notably the North Bay stratum 2 ! and South Bay stratum 4! wherevirtually no work was done previously although the areas were thoughtto be important to juvenile crab based on habitat such as eelgrass.The subtidal area up to mean lower low water Ml.LW! was digitized andstored on the National Marine Fisheries Service computer Seattle! touse in calculations of population abundance from station density. Thelargest subtidal area occurs in stratum 1 �65 1 ha! and the smallestin stratum 4 830 ha!. The total area of 8,545 ha is about 17,6 timessmaller than that 150,800 ha! digitized for calculation of offshorepopulations see Carrasco et al. this symposium!. It is important toremember that all estimates of population size given in this paper arefor subtidal areas on1y; the intertidal is treated separately on asmall scale!.
Twelve sampling trips were conducted in 1983 from April to earlyOctober and 17,102 crabs were caught, sexed and measured. The surveygear described by Gunderson et al. this symposium! worked well and,in all respects, seemed to be superior to the semiba lion otter trawlused by Stevens and Armstrong 1984! . It is our impression that thenet actually excavates slightly on certain substrates since catchescontaining large amounts of sand, mud and fine detritus were rathercommon. Although more efficient than the otter trawl, no specificmeasure of efficiency of the plumb staff beam trawl has been made to
147

0 0 0
Ql1-
148
Q/0
rQQQ/
Q
V 1/1VlQlQtQlfr1
CL
00 ~
00
Qr0 rQ
Qr r/1rO
0 Q1QlrQrrl VQlrQ V
0 /Q0U:rQ
vl 005-
Ql1-/Qr/10
0 /JrO0 r-rI/1

date and thus no correction factors are applied to populationestimates in this report as done by Stevens and Armstrong 1984!.~so slattern Estimates
Population estimates are based on the area swept method, using theestimator,
C;
where P = population estimateA. = area of stratum i1
a = area swept per km by the trawl, asSuming an effectivewidth of 2.3m
C. = mean catch rate number caught per km fished! for1stratum i, based on n hauls1
n-1C
1 n ~ 1j1 j=l
h = number of strata,
This corresponds to the three depth strata 5-15m, 16-40m, and 41-73m see Carrasco et al,, this proceedings!for the offshore survey area,and to the four geographic strata defined in Figure 1 for the 6raysHarbor survey area.
On assumption that the survey stations within each stratum arerandomly distributed with respect to the crab population, and thattotal population estimates are normally distributed around the actualpopulation for that area, 95% conficence limits for P wereapproximated by:
p Var P!'
! Var C,1
Var f. 1
n = number of effective degrees of freedom Cochran 1962!.e
149
hA
P = Ka
i=1
t O.95, n !e
h
where Var P = z a
i=1n ~1
z C.. - Ci!j=l

Size frequency observations were obtained for each catch, usually bymeasuring each individual in the catch. Subsampling was occasionallynecessary, particularly when large numbers of YOY were encountered inthe catch. These length frequency observations, weighted to the catchper unit effort numbers/ha!, were then expanded from the totalestimated population to obtain estimates of population size for eachmillimeter increment, by stratum, These estimates were then summedacvoss all strata and plotted on a percentage basis to obtain sizecomposition data which, in turn, provided the basis for modal analysisand analysis of the catch by age group. In addition, size-at-age datafrom Cleaver 1949! and Stevens and Armstrong 1984! were also used toset width ranges for several year classes �+, 1+, and others! overtime.
Intertidal ~Surve
A limited intertidal survey of two areas was conducted, one in theSouth Bay Stratum 4; Fig. 1! in an eelgrass habitat and one along theSouth Channel on an expansive mudflat with patchy covering ofshellhash and eelgrass see inset of Fig. 8!. Small quadrat areas of
20.2-1.0m were excavated to a depth of about 2 to 5 cm and sorted forcrab on nine sampling trips at the South Channel site and on fourtrips in the South 6ay. A population estimate was calculated for alarge portion of the intertidal flat at the South Channel site byestimating the percentage cover of shell and eelgrass from a series ofrandomly arrayed tv ansect lines, A mean value of 16.5X optimal coverin this area n=10, + 1 S.O. = 7.8%! was used as a multiplier to
6 2 6 2correct the total area of the estimate �5.8 x 10 rn ! to 2.6 x 10 mconsidered to be well suited for crab see Fig. 8!. Helicopterflights over this region in summer, 1984, were used to verify that theentire area depicted in Figure 8 is qualitatively like that used fOrground cover transects in a restricted area near the South Channelproper.
Results
Size and growth.
First samples collected in April, 1983, indicated that YOY crab hadnot arrived in the estuary in peak numbers, and that the populationwas composed primarily of 1+ and 2+ animals from approximately 30 to120 rmn carapace width CW; Fig . 2! . In early May, arrival of the 1983year class produced a strong mode between 7 to 10 rwrr, the size offirst and second instar juveniles. Thereafter, the size mode for 0+remained distinct from the rest of the population as the YOY grew froma mean CW of about 7 mm in early May to 36 rrwr by October, 1983 Figs.2 and 3!.
Modal analyses and size-at-age discrimination were not sostraightforward with older juveniles. The size boundary betweensmal'fest 24 and largest 1+ crab was never eaay to distinguish but wasset at about 70 to 90 rmn over time between May and September Fig. 2;Table I! in order to calculate population abundance by age class. Inseveral months e.g. April, June, August!, 1+ juveniles appeared to be
150

10 11 12 12 I ~ 15 IS
0 0 2 5 11 0 I I I 2 152ISL
ISSQ2
?'.
IL 2bJ
10 11 12 12 12 15 IS
0 2 'I 10 12 11 I? I'I 15I.ENCSI-I If251
Figure 2. Size composition of the Dungeness crab population in GraysHarbor strata combined! by month in 1983. Data arecombined for two trips per month in April-August, one eachin September and October.

45
40
K K35
T 30
25
20K LJz 15
K 10
9 LQ
HONTH
Figure 3. Mean carapace width of 0+ Dungeness crab from settlement inlate Apri'1 through early fall. Size of Grays Harborpopulation shown as solid circles; offshore populationsshown as triangles. Also shown are mean bottom watertemperatures during several months in both study areas.Bar = +1 SE.
152

0+ 1+
January
February
March
Apri 1
6-10 29-69May
7-27 33-74June
July 6-34 35-84
40-907-39August
September
October
7-49 50-95
11-54 55-100
153
Table 1, Approximate size range mm! of crabs collected in GraysHarbor, based on modal analysis. Data from the 1983 SeaGrant survey were used for age 0+, while informationpresented in Cleaver �949!, Stevens �982! and Stevens andArmstrong �984! and obtained during the 1983 Sea Grantsurvey was used for 1+ crab.

bimodal in size distribution for example in June, modes for 1+ craboccurred at about 40 and 55 mm Fig. 2! suggesting the presence of twoor more populations originating possibly as different cohorts of 0+ inthe year of metamorphosis, or 0+ that settle in different habitat andsubsequently grow at different rates.
Size-frequency data were used to set size ranges for the 0+ and 1+ ageclasses Table 1!. Population estimates for 2+ and older crab were notmade as of this report! because of our belief that the data areequivocal and require further analyses. For all age classes, therewas a broad range of sizes that appeared to develop soon aftersettlement of an incoming year class. YOY juveniles in June, 1983,ranged in size from 7 to 28 mm or first to fifth or sixth instar, andthis size differential continued through time so that 0+ in Octoberranged from 18 rmh to more than 50 mm CW Fig. 2!.
Subtidal populations by area and age class.
Total o ulation. The total subtidal crab population in Grays Harborincrease dramatically over a three week period from 2.5 million inlate April to 18. 1 million in mid-May, 1983 Table 2; Fig . 4A! . Thepopulat.ion remained rather stable between 18.1 to 21.6 million throughAugust and declined to 14 .4 million and 1 1.9 million in September andOctober, respectively; by January 1984 only 917,000 crab wereestimated for the estuary Table 2!, The precision of these data isgood since + 2 SE of the means are 42-69%.
Distribution and numbers of crab within the estuary changed month tomonth in strata 1 and 2 but remained relatively constant in strata 3and 4 Fig. 48!. Populations increased quickly in stratum 1 largestsubtidal are of 3651 ha; Fig. 1! to over 13 million crab during thesecond trip in May, then declined to 3 million in early July Fig.48!. The crab population of stratum 2, however, continued to increasethroughout late spring to mid surmher when it reached a level of about12.6 million due to a consistently higher density of crab, although inan area only 69% as lar ge as stratum 1 Table 2; Fig. 1!. Thesequential change in estimated populations between str ata 1 and 2might indicate passage of crab from offshore through the mouth of theestuary into stratum 1 and then redistribution elsewhere in theestuary.
Total population estimates in strata 3 and 4 were comparablethroughout most of the sampling season and ranged from a few hundredthousand to about 1.5 million crab in each area Fig. 48; Table 2!.Although stratum 4 is about half the subti dal area of stratum 3, crabdensity was typically twice as high in the former area.
Po ulation ~b ~a e class. The contribution of 0+ and 1+ crab to thetota estuarine potu ation was significant, and ranged from 67% in Mayto 92% by September differ ence between total crab of Table 2 and 0+and lt population values of Figures 5 and 6!. The 0+ crab thatentered the estuary in early May reached a subtidal population of 4.8million in that month and were located primarily in stratum 1 Fig.5!. This population had declined, however, to 1.2 million in June butrecovered to 4.6-7.0 million in July to October, and was locatedprimarily in the Worth Bay stratum 2! after June Fig, 5!, Thepercentage of the total estuarine population comprised of 0+ crab
154

Table 2. Dungeness crab mean density and estimated population bystratum see Figure 1! for the total estuary, April throughOctober, 1983. RE is the relative error; the percent of themean covered by 2 standard errors.
STRATUM DENSITYAREA HA! NO/BA �SE!
POPULATIONMILLIONS �SE!
1.717 1.706!0.238 0.194!0.358 0.261!
470 95
231 271
467!77!
168!324!
36512516
3 15484 830 0.225 0.269!
5/83 18.077 ]1 .186!RK = 62%
3651 2267 2642!3157 2220!643 561!
�34 440!
8.2787.9440.9960.8$9
2$] 61548830
7.2849.2321.2041.2$5
6,'83 18,976 8,428!RE = 44%
3851 ]995 3669 778
]5]2
1918!]839!419!$18!
25] 6
3 4 11548830
3651 4.416 2 573!12.616 7.892!1.534 1.207!1.]39 0.791!
7/83 19,705 8.425!RE = 43%
.22,6408
,06
25163 15484 830
8.003 6.029!11.186 6.86]!0.992 0.420!1.423 0.276!
3651 .37.52,05.07
8/83 2].605 RE
9.147!42%2516
]548830
1
2 3 4,3Q.4505
.11
5.644 5.582!6 .4$8 6.8Q5!0,731 0.379!1.$70 1.643!
Q.030!63%
365125161548830
9/83 14.403 RE
2,976 1.476!365125161548830
25531804
10/83 11.896 RE
7.492!63%6.247 6.789!
2,196 2.7$6!0.477 0.517!
1/84 O.Q]7 0.451!RE = 49%
1
2 34
1]1! 0.466 0.403!365125161548830
128 94
121 33
51262003
78!19!40!
0.236 0,196!0.187 0.029!0.027 0.033!
12]0 70$!5014 3137!991 779!
]372 9$3!
2192 1851!4446 2727!641 271!
1715 332!
]546 ]529!2567 2740!472 245!
1891 1980!
815 404!2483 2698!]4]9 ]781!575 623!
9.64$!� $86! 0.868! 0.365!
7.00]! 4.626! 0.648! 0.430!
STRAT MONTH ESTUARY TOTALPROP /YEAR MILLIONS �SE!
68 4/83 2,537 1,758!09 RE = 69%14
,09
46440605
38490$07

60282624
I 2016�
ri 6 2 6 9 lorroNTH
12
I � 9 6K 5
6 6
Figure 4A. Population estimates of total crab weighted by strata andcombined from April-October, 1983. Shown are means and avertical bar of 22 SE for both cruises of each monthcombined one cruise each in September and October!.
Figure 4B. Same data as in Figure 4A but presented separately for eachcruise and stratum see Figure 1!.
156

K3
CI
2
2.0
g1 5
K1 ~ 0
I-
o 0ANTH
Figure 5. Population estimates for 0+ juvenile Dungeness crab in GraysHarbor from April to October, 1983. Data are shown forstrata 1 through 4 see Figure 1!.
157

GRAYS HARBOR � CANCER l$01STER � 1983
10
lD 7K CI
K
4
a,
03 4 5 6 7 8 9 10 11
1.5
K1 0
cc 0 3 4 5 6 7 8 9 10 11MONTH
Figure 6. population estimates for 1+ Dungeness crab in Grays Harbor,April to October, 1983. Data are population means of twotrips combined per stratum from April-August, one trip eachSeptember and October,
158

increased from 26% in May to 54% in October, indicating either thatsome portion of the older I+ and 2+ crab populations left the estuary,or that 0+ moved in from offshore or down from littoral flats intochannels.
Populations of 1+ crab increased substantially between April to May inall strata particularly stratum 2 in North gay, an area of extensivechannels where bottom water temperatures are relatively high in thesummer 16-17 'C! . The estimated number of I+ crab in stratum 2 byJuly was 7.8 million but had declined to 1.4 mi11Ion by October Fig.6!. Combined across all strata, 1+ crab were the numerically dominantage group in the subtidal portion of the estuary for most of thesummer and reached population levels of 12 to 13 million animalsbetween June to August; about 70% and 57%, respectively, of total crabduring that period Table 2; Fig. 6!.
Older crab were substantially less abundant than 0+ and 1+ crab in theestuary during the 1983 field season except in Apri! and May when theywere about 68% and 33% of the total population, respectively. Again,the uncertainty of size-age demarcations for 2+ crab and older causedus to forgo separate population estimates for age classes older than1+. However, based on the length-frequency data of Figure 2, it isevident that 2+ crab in April about 80-100 mm CW; 6utler 1961;Stevens and Armstrong 1984! were a large percentage of what wasotherwise a fairly low estuarine crab population at that time Fig .4!. While the percentage of older crab declined by May to 33% of thetotal population, these animals were still about 6. 2 million of the18. 1 million estimated for that month Table 2; Fig. 4!. However,both as a percentage of the total population and absolute number,older crab declined steadily from June to October until they were 1.1million 9%!, in the latter month.
Intertidal populations.
Three intertidal habitat types were surveyed during the surwrrer of1983: one in dense eelgrass lostera marina! located in the South Bay,stratum 4; one in shellhash located along the South Channel in stratum3 Fig, 1!; and finally open mud/sand in both locations,
The only age class found in samples taken from mid May to October was0+ juveniles. Only on the first trip in May were juveniles found insamples taken on exposed sand and mud; thereafter, no juveniles werecaptured on or buried in substrate that did not have some type ofprotective over-cover, Oensities of 0+ crab in eelgrass ranged from
2 27/m in May to 2/m in July Fig. 7!, substantially higher than values
2of 0. 1 to 0.5/m for total crab found subtidally by trawl Table 2!.Shell debris contained the highest densities of 0+ crab found in 1983,
2with initial mean values of about 90 to 115/m just after settlement
2in May that then declined quickly to 8-16/m in June and July, and
2thereafter were about 2-3 crab/m until October Fig. 8!.
Shell debris was composed almost entirely of ~Ma arenaria soft
159

DATE - 5/liN lO
!= +2SE
7/103
$/93
160
Figure 7. 0+ Oungeness crab densities in thick eelgrass beds in SouthBay, Grays Harbor in the summer of 1983 stratum 4', seeFigure 1!, A calculation of population abundance was notmade because there is no recent measure of the extent ofsuch beds in the estuary.

dP
CT
C 0
LIJI/P
ttd
Z CPdl5-CIILP
161
TOTAL CIIAS ARSClelCE I x10 I
c II/ON I ALISNEO SVHQ
0 DlllId Gl IdCJC Id0.I/IP d/Id 0 3I
lltId Vl0 Id IdE+PdP GP I/I4J/: dtC c04 00 IdC dP0 0 CLV 0l D.O dd
Id IO I/II/Ic0 ld
Id 0 d/0 d/V MId+ct<. I/I4 ' C0 3 d/0+P V E0I/I PO ~C Dcfog
dPId ~0 LIPO I/I
+Il ILICL Ddt
VVl Dc cPLI
D dl P/PE l-d/C PLP0 E

shelled clam! but also contained Macoma nasuta bent nose clam!.2
Shelf was distributed in patches about 0.5 to 2.0 m in area, often inshallow depressions covered by 2-5 cm cf water and sometimes mixedwith sparse eelgrass. As noted previously, such material wasestimated to cover I6,5% of the large intertidal flat between the!!orth and South channels of stratum 3, an area equivalent to about 2.6
2million m of optimal juvenile crab cover Fig. 8!. Crab densities
2per m extrapolated to the full area of shell coverage resulted inpopulation estimates in excess of 300 million in May, 8 to 18 millionin June and July, and about 5 to 7 mi'Ilion in August to October Fig.8!.
Discussion
Grays Harbor estuary as a nursery.
Tne first definition required in a discussion of estuaries asnurseries is that for "nursery" itself and what constitutes suchhabitat for, in this case, a species of crab whose adult populationsare primarÃy located in the nearshore coastal zone. Easiest is tosay that a "nursery" is where young of a species occur and grow;implicitly, the very young such as YOY Dungeness crab and not so mucholder, subadult juveniles. To be of use in the context of the lifehr t y cyct ~ of c. ~ rriste . ho eoe, the def ~ rtfoo o rt be odemore precise, aTbeit somewhat a posteriori with 1983 data inhand.From this perspective nursery habitat is where:
1, A numerically important portion of the juvenile populationresides during periods or stanzas of significant growth.
a! The extent or scope of such habitat will depend on thescale of comparison; e.g. the estuary may be truer"nursery" habitat than the open coast, but within theestuary juveniles of the species of interest may resideprimarily in eelgrass, tidal channels, on mudsubstrates, etc.
b! More than one juvenile subadult! age ciass may utilizethe nursery system; there is no attempt to apply thedefinition only to the youngest age class of a species.In this sense, juveniles may preferentially use thenursery for more than one year following birth ormetamorphosis! as a reflection of continued advantagesin that over other habitats.
2, An advantage is imparted to siblings reared in the "nursery"compared to those within other habitats,
a! The advantage may be conferred through a combination ofbiotic and abiotic factors food, temperature, refuge,fewer predators! that enhance survival and/or growthwhile in the system.
162

b! The provision for enhanced growth relates to pointNo. 1 in that habitat may be "nursery" in oneseason but not in another if conditionsdeteriorate - e.g. decreased temperature inwinter.
Based on this definition of nursery habitat, juvenile stages ofseveral cojwiiercial Crustacea have been shown to depend substantiallyon estuaries� . Blue crab, Cal linectes ~sa idus, 0+ j uveni 1es mature inChesapeake Bay and other estuaries of the At 1antic coast where theyare significantly more abundant in eelgrass compared to unvegetatedareas Heck and Thoman 1984; Summerson and peterson 1984!. The recenthi stori c reduction in extent of eelgrass in that estuary as we 1 1 asdeterioration of water qua 1ity documented as increased spatial extentand temporal durati on of anoxi a are viewed as direct threats tosurvival of juveniles and vitality of the fishery Officer 1984; Orthand Moore 1983!. Juveniles of penaeid shrimp from North Carolina toTexas require warm, low salinity water for rapid growth followingmetamorphosis offshore and they move into estuaries to maximize theseconditions Costello and Allen 1966; Weinstein 1979!. Turner 1977!found a positive correlation between commercial yields of Penaeus spp.a»d the a ee of est 1 egetatfoa ~ 1 1 1 titodes het atarea, depth or volume of estuarine water. Over the last 15-20 years,loss of estuagine habitat considered vital to juvenile penaeid shrimpposes a threat to that fishery along the Gulf Coast states Christmasand Etzold 1977!.
lh t VOY a d ~ lder 1 Yeoile t ges f C. ~aister ~ e p es testuaries has been known for a number of years and stated inqualitative terms by several authors Butler 1956; Gotshall 1978;Tegelberg and Arthur 1977!. The supposition, however, that west coastesto ~ les ar ~ import t 1 the life cycle of C. ~missa 's ootintuitively attractive to some biologists for two reasons primarily:1! C. mac ister is not an exceedingly strong osmoregulator Engelhardtand Oehnel 1973; Caldwell 1977! and thus not considered as likely anestuarine resident as blue crab, penaeid shrimp or west coastcrangonid shrimp and; 2! west coast U.S. estuarine habitat is notnearly so extensive as on the east coast. The latter point isparticularly important since San Francisco Bay of central Californiaand Grays Harbor and Willapa Bay of southern Washington are the onlyestuaries of appreciable size along this section of coast. NorthernCa 1iforni a and Oregon have no large estuaries although small systemsare numerous.
The issue of osmoregulatory capabi iity and physiological capacity totolerate low salinity conditions is probably not critical to thearguments concerning estuarine nurseries since the timing ofsettlement and use of estuaries are seasonal and miss major periods ofvery low salinity. From data of the present study and that of Stevense d A st ~ g jlggei, YOY C. ~mi t e te the est ary ia early Mayand apparently leave by fall, thereby avoiding the period of peakrainfall, November to March Armstrong et al. 1982!. Throughout mostof the estuary where juvenile abundance is highest, it is uncommon forbottom water salinities to be less than ZOojyoo and they are typicallygreater than 25 jfoo, high enough to ensure that b 1ood osmolar ityremains stable Hunter and Rudy 1975!. In fact, lower salinitybegi nning in late fa 11 may be one of several stimuli that cause crab
163

to leave the estuary.
istu fne vers s Offshn e ~pa 1atio nhu da c
The issue of size of west coast estuaries and whether they couldprovide adequate habitat for YDY and older juveniles is bestconsidered in light of our findings on relative estuarine/offshoredens i ti es, population sizes and growth rates .
Juvenile crab density was consistently higher in Grays Harbor estuarythan offshore in 1983, From May through September mean crab densitieswere usually well in excess of 1000/ha and values from 2,000 to4,000/ha were not uncommon in most strata of the estuary Table 2!,whereas mean densities offshore were usually less than 10D to 300/ha[only stratum 6 in May had a mean density ! 1,000/ha; see Carrasco etal. this symposium!. Comparing estimates of total populations, GraysHarbor supported 38%, 44% and 19% more crab than calculated foroffshore in the months of July, August and September, respectively.The exception was in May when 283% more crab were calculated for theoffshore than in the estuary �9 million versus 18 million!; adifference that was, however, quickly attenuated in favor of a higherestuarine population although in an area 17.6 times smaller than thearea of'fshore!. It is important to note that the potentialcontribution of Wi 1 1 apa Bay south of Gr ays Harbor to estuarinejuvenile crab populations could equal or exceed values estimated forthe latter system as noted by Stevens and Armstrong 1984!. In accordwith these indications that Washington estuaries are important to 0+and 1+ crab, Tasto 1983! estimated that up to 80% of an incoming yearclass might reach the San Francisco estuarine complex and reside thereup to a year.
In addition to a large subtidal population of juvenile crab that wasdominated by If anima'Is in June through August, a substantia'1intertidal population of 0+ crab was calculated from less rigoroussampling in shellhash and eelgrass, which further underscores thevalue of an estuary to Dungeness crab. A single region of intertidalflats in the estuary Fig. 8! was estimated to contain over 300million 0+ crab just after settlement in May. The population declinedto a more sustained number of 5 to 10 million through summer, 1983 arange comparable to subtidal estimates of 0+ crab throughout theentire estuary. The rapid decline in numbers from May to Juneindicates that mortality and/or emigration is high when initialdensities are excessive and it seems likely that a portion of thisintertidal, shellhash population continuously moves from there tostocks in the adjacent subtidal areas. Suck movement may be provokedby intraspecific agonistic interactions exacerbated within limitedcover, or result when crabs physically outgrow such habitat, Althoughth dy ~ amies f inta tid 1 O venin e O. ~ntste pop 1 tians a ~ po 1yunderStood at this time, the magnitude of abundance appears to behigh.
While this Dungeness crab program began primarily as a study of 0+estuarine population dynamics, evidence from ours and other studies Stevens and Armstrong 1984; Tasto 1983! points to the importance ofestuaries for 1+ juveniles. Between June through August, 1983, 1+crab were estimated to be 12 to 13 million in the subtidal of GraysHarbor, but dec lined in abundance offshore from 8 to 2 million during
164

this same period. Although much more extensive an area, the offshoreregions supported only 15K as many 1+ as found in the estuary late inthe summer. This ratio has caused us to examine more closely thehypothesis that the age class deriving most benefit from the estuaryis 1+ rather than 0+ Dungeness crab.
Growth Rate
Several studies of juvenile growth rates indicate the process isaccelerated in estuaries or within nearshor e coastal embayments wherewater temperatures are relatively warm, Stevens and Armstrong �984!studied growth of 0+ and 1+ juveniles in Grays Harbor and found thatsix months after metamorphosis flay to October! 0+ crab averaged 40 mnin carapace width CW! and by one year were 50 mn. This indicatesthat 0+ crab in Washington estuaries may molt 6 to 8 times during thefirst suuvner growing season after which the frequency apparentlydeclines with the onset of winter and larger size. A more dramaticindication of seasonal growth is based on change in dry weight overtime. First instar crabs at 7 mm CW aweigh O.Z g dry weight whilecrabs of 50 mm CW weigh 5.7 g, a 280-fold increase, The monthlyweight- specific growth rate k! for 0+ crab in summer of 1980 was206% dry weight per month which declined to 15.8X through winter.
Even greater growth rates were reported by Tasto 1983! for 0+ crabin San Francisco Bay that reached 90 to 100 uvn CW one year aftermetamorphosis. However, this conclusion can be disputed on the basisthat the author inadvertently combined year-classes in his length-frequency analysis and biased collections toward larger crab by usingring nets.
Despite this potential error, information from this and our 1983 crabprogram shows that populations of Of crab that sett!e directlyoffshore grow significantly slower than those in the estuary Fig. 3!.YOY in Grays Harbor grew from a first i nstar size of 7 mm in May to amean carapace width of 38.3 nm sixth instav! by October, 1983, Meanbottom water temperatures were 15 -16 'C during this time while thoseoffshore were 8.5 -10 C. Perhaps as a consequence of this, 0+ craboffshore had reached a mean width of only 15 uvu in September, amixture of third and fourth instars. This difference in size is asubstantial difference in weight that equates to a mean value of 2.57g dry weight for estuarine YOY �8 uvu! and O, 18 g for offshore YOY �5mm! based on width-weight regress i ons of Stevens and Armstrong 1984 ! .YOY juveniles offshore of San Francisco Bay in the Gulf of theFarallones also grow substantially slower than estuarine crab Tasto1983; Fig. 3,7! although, as previously noted, the upper size rangeassigned to 0+ may be wrong. In the fall of 1977, the data show a 0+mode offshore at about 28-30 uvn CW while in the estuary a goodproportion are up to 60 uvu,
Advantages to more rapid growth include decreased time to reproductionand greater avoi dance of predators� . The second point may be criticalto population survival since mortality of young, small instars isapparently very high. For example, Reilly 1983! showed that
t ~ tly ~ it e eaatiom ei j ee ii C, mtitte tate f o ttemaaht fdemersal fish captured in San Francisco Bay and in the Gulf of the
165

Farallones was on crab 7 to 30 mm CW.
Thus, from the perspectives of both absolute population size andre I ati ve growth rate, the hypothesis that Grays Harbor provideSnursery habitat for a significant portion of the Washington coastCtungeness crab population is still tenable. I!uantitative estimates ofjuvenile density in Grays Harbor and similar levels of production inWillapa Bay would support the supposition of Stevens and Armstrong�984 ! that a major por tion of the offshore fishery is initiallydependent on estuarine habitat. Particularly important in thisregards is the role of intertidal shellhash and eelgrass to 0+juveniles which likely face intense predator pressures both irr theestuary and offshore, coming in part as cannibalism. In 1980 Stevensand Armstrong 1984! and 1983 present study! 1+ crab were numericallydominant in the subtidal regions of Grays Harbor, and even crab thissmall have been shown to be significant predators of conspecifics Stevens et al. 1982!. Thus 0+ may only survive subtidally in areasof the estuary where stick, shell, macroalgae and dislodged eelgrassafford epibenthic refuge. Otherwise, intertidal regions of such coverlikely play an important role in 0+ survival since larger crab andother predators e.g. staghorn sculpin, ~Le gtocottus armatus! onlyfo eg the t flood t1des rgtefeos et el. rggdT, ~ rreeT e c ohare always more dense in vegetated areas than in adjacent, unvegetatedareas Heck and Orth 1980; Heck and Thoman 1984! and, in part, thisprobably accounts for protection from their older and largerconspecifics that exert tremendous predatory pressure on fauna whentrrey forage on more open sandf'lets Summerson and Peterson 1984!.Analysis of Grays Harbor intertidal data collected in 1984 andforthcomi ng in 1985-86 should help to clarify the extent of juvenilemetamorphosis and survival in intertidal habitat,
While large estuaries may enhance juvenile survival and growth insouthern Washington and central California, no large estuaries ofcomparable size occur for over 400 km of coastline from northernCalifornia to the Columbia River. To what extent then are crabpopulations of that area dependent on juvenile recruitment toestuaries as opposed to directly offshore? The area of numerous smallestuaries may constitute appreciable habitat for juvenile crab givendensities recorded for Grays Harbor. For exmnple, the subtidal andintertidal areas ha! of Coos Bay �502, 2510!, Siietz �67, 314!,Nestucca �71, 234! and Hetarts �21, 889! estuaries total 2960 ha and3947 ha, respectively Oreg. Oept. Fish Wildl. 1979!; in addition towhich there are the Siuslaw, Alsea, Y aquina, Sand Lake, Ti llamook, andNehalem estuaries as well. Together they could potentially providehabitat for a substantial portion of 0+ and 1+ juveniles.
Conclusion
As an expansion to this program stated in 1983, we wi 1 1 study Wi 1 lapaBay in 1985-86 as well as continue population surveys of Grays Harborto establish a four year data base for the latter estuary. Futher,the offshore study Carrasco et al., this symposium! will be increasedin spatial coverage to more accurately estimate populations along thecoast, We hope to better map various estuarine and coastal substratesand COmpare relative crab densities on eaCh, Throughout thiS programwe have collected additional abundance and biomass data on crangonidshrimp and several species of fish. When combined with biological and
166

physical information from other programs we anticipate that a morecomprehensive picture of Dungeness crab ecology and populationdynamics will emerge in the future.
We express our sincere appreciation to Kenneth Carrasco andChristopher Rogers who have provided expertise and good cheer in thefield, analytical support and many other contributions to thisprogram. Many other people helped in collection, entry and analysesof data: J. Armstrong, R. 6lack, J. Chaiton, G. Jensen, P. LaR iviere, T . Lind ley, J, Little, L, McEwen, and R, Palac i os. DonSamuelson and Dan Baxter of the ~S irit were skippers of great ski 1'!and perseverance. 1'his program was supported by the University ofWashington Sea Grant Program and the National Marine FisheriesService. Logistic support was kindly provided by the U.S. CoastGuard, Westport, Washington.
Abstract
Population dynamics and distribution of 0+ and 1+ juvenile Dungenesscrab were studied in Grays Harbor, Washington from April to October1983 in order to compare the relative importance of that system taareas offshore. A stratified, random survey design and improved netwere the bases of biweekly sampling in the estuary. Total populationestimates were 2.5 million in April but increased to 18,1 million inMay with the arrival of 0+ as megalopae larvae! and 1~ juvenile agec'lasses primarily. The estuari ne population increased to 21.6 millionin August but declined to 11,9 million by October; in January, 1984,less than 1 million crab were estimated to be in the estuary.
While 1+ crab were numerically dominant in subtidal regions of theestuary, 0+ crab were also abundant there but more so on intertidalf lets covered by shellhash and ee lgrass. Survival af 0+ crabimmediately following settlement and metamorphosis seems to bedependent on refuge habitat in the form of shell, allochthonous stick,litter, dislodged ee lgrass and macraa lgae.
Compared ta the offshare region, Grays Harbor supported consistentlyhigher densities of juvenile crab as well as greater populations upto 44% more! than found offshore in most of 1983 although theestuarine area used to estimate population abundance is 17,6 x lessthan the offshore area!. Growth of 0+ crab was significantly greaterin the estuary where they were about 2.5 x wider carapace width! and14.3 x heavier dry weight! by September than siblings that settledoffshore. These data indicate that a major estuary like Grays Harborcan serve as important nursery habitat for 0+ and 1+ Dungeness crab,
167

Literature Cited
Armstrong, D.A. 1983. Cyclic crab abundance and relationship toenvironmental causes. In: From Year to Year: InterannualVariabilit of the Environment an Fis eries of t e u f ofAlaska W.S. Wooster ed. . Seatt e: Washington Sea Grant.
Armstrong, D.A., B. Stevens and J. Hoeman. 1982. Distribution andAbundance of Dungeness Crab and Crangon Shrimp, and Dr edging-Related Mortality of Invertebrates and Fish in Grays Harbor,Washington. Technical Report to U.S. Army Corps of Engineers,Seattle. N. NACW 67-80-C-0086. 349 pp.
Butler, T.H . 1956. The di stribut i on and abundance of earlypostlarval stages of the British Columbia commercial crab.Fish, Res. Board Can., Prog, Rep. No. 107:22-23.
1961. Growth and age determination of the Pacific ediblec ab Cancer ~ma iste bane. J. Fish. Res. 8 d C ~, 18;873.891
Caldwell, R,C. 1977. Biological Effects of Pest ici des on theDungeness Crab. Ecological Res. Series, U.S. EPA, No. EPA-600/3-77-131. 125 pp.
California Department of Fish and Game. 1981. Dungeness CrabResearch Program 1974-1980, Calif. Dept. Fish 6 Game, Mar.Resourc. Admin. Rep., 81-3!:1-13.
Christmas, J.Y. and D.J. Etzold. 1977. The shrimp fishery of theGulf of Mexico, United States: A regional management plan. GulfCoast Research Laboratory. Tech. Rep. Mo. 2: 1-128.
Cleaver, F.C. 1949. Preliminary results of the coastal crab Cancermaqister! investigation. Wash. State. Dept. Fish. Biol. Rep.AA 2~2.
Costello, T.J. and D.M. Allen. 1966. Migrations and geograhicdistribution of pink shrimp, Panaeous duorarum, of the Tortugasand Sanibel grounds, Florida. U.S.F.W.S. Fish. Bull. 65�!:449-459.
Coch ~ ~, bi.G. 1962. ~5m lin Tach irl es. Joh il lay nd Sons, ReYork, 330 p.
Engelhardt, F. and P. Dehnel. 1973. Ionic regulation in the Pacificedible c ab, Cn cer acliste 8 !. Ca . J. 2 l. 51:735-763.
Farley, T. 1983. The Dungeness crab research program; Direction andorganization. In: Life Histor Environment and MaricultureStudies of the Dun eness Crab Cancer ma ister with m as s onthe entra Ca i Orn a F Sher eSOurCe, . W. Wi an .N. TaStOeds. . a i . ept. ish arne, Fish Bull. 172, pp. 25-37.
Gotshall, D.W. 1978. Relative abundance studies of Dungeness crabs,C«~it,i a th Clif i.C.FihG66�6-3T.
168

Heck, K. and R. Orth. 1980. Structural components of eelgrass Zostera marina! meadows in the lower Chesapeake Bay - Decapodcrustaceans. Estuaries 3:289-295.
Heck, K. and T. Thoman. 1984. The nursery role of seagrass meadowsin the upper and lower reaches of the Chesapeake Bay. Estuaries7:70-92
Hunter, K.C. and P,P. Rudy, Jr. 1975, Osmotic and ionic regulation~ the On ge e c b C ~i t pa a. Ccmp. 8 och
Phys i o 1 . 51 A !: 439-447.
Jow, T. 1965. California-Oregon cooperative crab tagging study. In;Pacific Marine F isheries Commission 16th and 17th Annual Reportsfor the Years 1963-1964, pp. 51-52.
Lough, G . 1976. Larval dynamics of the Dungeness cr ab, Cancermaqister, off the central Oregon coast, 1970-71. Fish. BB~ 8 .74::6';iW75.
Officer, C.B., R.B. Biggs, J.L. Taft, L,E. Cronin, M,A. Ty'ier and W.R.Boynton. 1984. Chesapeake Bay anoxia: origin, development, andsignificance. Science 223:22-27.
Oregon Department of Fish and Wildlife. 1979. ~Estuar Inventor~Re ort Series. Vol. 2, Nos. 1, 3, 4, 6. Research and evelop-ment Section, OOFW, Portland, OR.
Orth' R.J. and K.A. Moore. 1983. Chesapeake Bay: An unprecedenteddecline in submerged aquatic vegetation. Science 222:51-53.
eeiiiy, p.h. 1983. p d t'on on 8 ngen ~ ss c abs. Ca ce ~tte,studies in central California, In: Lif'e Hi star Environmentand Mariculture Studies of the Dun eness Crab Cancer ma isterwith Em hasis on the entra a i ornia isher Resource, .WWg an .N, asto eds. . Ca if. Dept. Fish arne, Fish Bull.172, pp. 155-164.
Stevens, B. and D.A. Armstrong. 1984. Distribution, abundance andgrowth of juvenile Dungeness crabs, Cancer ~ma ister!, in GraysHarbor estuary, Washington U.S.A. Fis~h. Bu 1.~2 in press!.
Stevens, B.G., D.A, Armstrong and R. Cusimano. 1982. Feeding habitsof the Dungeness crab Cancer ma ister! as determined by theindex of relative importance. Mar. iol. 72:135-145.
Stevens, B., D. Armstrong and J. Hoeman. 1984. Diel activity of an~ st ~ a i e popn1 ti f iie g ness c abs, Cence ~nisserelation to feeding and environmental factors. Z. Crust, Biol.4:390-403.
Summerson, H, and G, Peterson. 1984. Role of predation in organizingbenthic communities of a temperate-zone seagrass bed. Mar. E'col.Prog. Series 15:63-77.
taste, 8.11. 1983, 1 oeni1e 11 ge ess c ab, C ce ~it, st di ~ sin the San Francisco area. In: Life Histor Environment and
169

Nariculture Studies of the Dun eness Crab Cancer ma Ister withEm basis on the Centra California Fisher Resource. P.W. Wi d
Game, Fish Bull. 172,an R.N. asto eds. . Ca if. Dept. Fishpp. 135-154,
Tegelberg, H. and R. Arthur. 1977. Appendix N: Dungeness crabs,In: IiIaintenance Dred in and the Environment of Gra s Harbor.Prep. by Wash. Dept. of Eco ogy for the U.S. Army Corps ofEngineers, Seattle District.
Turner, R. 1977. Intertidal vegetation and commercial yields ofpenaeid shrimp. Trans. Amer. Fish, Soc. 106:411-416.
Weinstein, hf. 1979. Shallow marsh habitats as primary nurseries forfishes and shellfish, Cape Fear River, North Carolina. Fish.Bull. 77:339-357.
Wild, P,W. 1983. The influence of seawater temperature on spawning,egg development, and hatching success of the Dungeness crab,Ca ce ~aister. i: Life Hasta E i i ~ d ii icultu e~o the Dun eness Crab Cancer ma ister with Em hasis on the
.W. W and R.N. astoish Bull. 172, pp. 197-214.

Abundance and growth of Cancermagister young-of-the-year in the near-
shore environment
Kenneth R. Carrasco, David A. Armstrong,Donald R. Gunderson and Christopher RogersUniversity of WashingtonSeatt! e, Washington
Ounqeness crab megalops larvae are known to enter both estuaries andnearshore areas, either passively or actively, where they metamorphoseto the first juvenile instar stage Gutler 1956, Lough 1976, Rei lly1983. Stevens and Armstrong 2984!. rt is not k nown, however, if theeventua 1 recru'.tment of young-of-the-year YOY=O+ ! to the adult stocksrelies exclus',vely on either the estuaries or on the nearshore areas,or perhaps if features of both areas are exploited to favorappropriate steps in the species' ontogeny. Likewise, it is not knownif the meqalopae somehow target towards the mouth of an estuary, orrather if they are uniformly spread along the coast and only afortuitous few are swept into the mouth. Although megalopae weresomet'.mes seen more than 50 km off the coast, Rei lly �983! reportedthe highest densities offshore from Eureka to San Francisco ',n theGulf of Fara11ons within 10-15 km of Pt. Reyes, and also inside SanFrancisco Bay ',tself. Evidence from Stevens and Armstrong �984! andthis present Sea Grant study indicates that an incoming year classwill enter nearshore areas and estuaries as megalopae near the surfaceor, perhaps, deeper in the water column, and then settle on varioussubstrates to metamorphose. However they arrive, Oungeness megalopaeand first instars are found both inside estuaries as well as in thenearshore coastal zone which necessitates sampling each area withidentical qear to qain a realistic assessment of the respectivecontribution of each system to the ult.:mate recruitment of YOY intothe adult population.
As a part of the same two-year Sea Grant project described byGunderson et al. and Armstrong and Gunderson both papers, thisSymposium!, this paper describes results of nearshore crab samplingdone concurrently with the estuarine prOject, The principlecomponents of the nearshore proqram were to: 1! survey Ounqeness crab
171

population densities in the nearshore area, particularly as a function'of depth; 2! determine size at age; 3 ! determine if a year classsettles as a single cohort or several through the season; 4!extrapolate crab density to an estimate of population abundance fordirect comparison with the estuary; 5 ! determine the relative growthand mortality rates of YOY, agai n as compared with the estuary and;6! character',ze benthic habitats to qualitatively correlate withsettlement and/or survival patterns.
As the 1984 field season ended just weeks before this Symposium, theenti re two year data set was not yet available for consideration . As aresult, only the 1983 data is presented in this paper the seniorauthor w i 1 I analyze both the 1983 and 1984 nearshore data as part ofhis Master's thesis!.
A note on terminolOgy: the termS "nearShOre" and "OffShOre" are attimes used interchangably in the literature. For the purposes of thisreport, which deals exclusively with the more shallow areas of thecontinental shelf, the term "nearShOre" will be uSed eSsentially aS anoun and "offshore" will be used to indicate a relative direction froma specified point.
MATERIALS ANO METHODS
This section will amplify relevent points beyond those addressed byGunderson et al this Symposiura! in their description of the equipmentand sampling methods utilized i n both the nearshore and estuarinesegments of this project.
The area offshore of Westport, Washington, is characterized by afairly uniform continental shelf with a shelf break at 2OO metersdepth about 50 or 60 km offshore. The typical spring/surmner northwestwinds of the Pacific Northwest of the United States are associatedwith upwelling events and are the norm after the spring transition,while in winter winds are variable, generally southerly, and notassociated with upwel ing Huyer and Sraith 1983 !.
Since the very limited data on offshore distribution of Dungeness YOYon the continental shelf indicates a preponderance in the relativelyshallow areas Wick ham et al. 1976; and Gotsha 11 1978! . three transectlines were established nearshore in the v',cinity of Grays Harbor F igure 1!. One line was located just south of the mouth of GraysHarbor, another 28 km to the north off Copalis Head, and ihe thirdtransect was located off Cape Shoalwater at the mouth of Wi llapa Bay,17 kra to the south of the Grays Harbor transect. In 1983, eightstations were located on each transect line at depths of 6, 9, 18, 27,31, 46, 55, and 64 meters or, respectively, at 3, 5, 10, 15, 20, 25,3O, and 35 fathoras!. Unfortunately, even moderately poor weatheroften precluded sampling at the 6 meter station near the surf zone.
Three strata were defined that grouped the two shallowest stations �and 9 m in Stratum Number 5; Strata 1 to 4 were areas in Grays Harborestuary! on a 1 1 three transect lines, the three intermediate stations�8, 21, and 37 m in Stratum Number 6!, and the three deepest �6. 55and 64 m in Stratum Number 7!. The east-west boundaries of the strata
172

StrataNumbers: 6 5
CO
I aStratum Hect
5 6 7
2.7
Depths: 73m 40m 15m 5m
Figure l. Nearshore survey area and station array dark circles! usedto estimate populations of juvenile Dungeness crab. Shown are threestrata �,6,7! that include stations in common depth intervals from5 m to 73 m � fm to 40 fm!,
173

were the depth isobaths midway between the most adjacent stations ofany two strata, while the north-south boundaries are assumed in thisreport to be lines nine km north or south of the outermost transectlines. Digitizing these strata on the Burroughs computer at the NMFSNorthwest and Alaska Fisheries Center in Seattle yielded areas of allthree strata in hectares. The total area of all three strata isapproximately 150, 000 hectares 151 kmm!, whi ch is an area about 18t:mes greate~ than the subtidal area of Grays Harbor estuary. Stratum5 constituted 13% of the total nearshore area while Strata 6 and 7comprised 33% and 55%, respectively.
Sampling trips in 1983 were made during daylight hours on May 28 and29 with a third day on June 10, postponed because of weather!, July17 through 2D, August 14 though 16, and September 12 through 16. A 55ft salmon-charter boat ~S irit of Westport, Captain Don Smxuelson,skipper! was equipped with the appropriate hydraulics and a boomarrangement to deploy and retrieve the plumb staff beam trawldescribed by Gunderson et al. this Symposium!.
Determination of distance towed was calculated from LORAN C readingsobtained on board ship. The program LORAN AND DISTANCE was used onthe NMFS Burroughs computer to generate latitude/longitude coordinatesand CalCulate diStanCe Over grOund. USing the area-Swept teChnique net width = 2.29 m!, density of crab in numbers per hectare wascalculated.
Commencing with the second trip in July, 1983, a Niskin bottle waslowered to the bottom by hand on alternate stations to collect watersamples, and a bucket was used to collect surface water at the samelocation. A pocket thermometer was used to measure the temperature ofthe water samples and a refractometer was used to determine salinities.
Crabs were sexed and measured to the nearest millimeter on board theboat un less very large numbers of YOY were caught in which casesamples were processed later in port. Data analyses were accomplishedon the Burroughs 7800 computer at the Alaska and Northwest FisheriesCenter in Seattle and on the CDC 170-750 Cyber computer at theUniversity of Washington.
RESULTS AND DISCUSSION
Crab Densities
Densities of crab per hectare for each station trawled in 1983 aredisplayed in Figure 2 with stratum boundaries indicated by dottedlines between depth intervals. It should be kept in mind that thelack of any symbol indi cates an absence or a negligible amount ofcrab, while a null sign indicates that no tow was made at a station usually due to bad weather!. Densities for each strata weredetermined by combining the appropriate stations on all three transectlines within each stratum. The mean number of crabs per hectare bystratum, two standard errors, and number of tows are displayed inTab'Ie 1. 8ri efly, the highest densities of Dungeness crab were foundin May and decreased through the sampling season. viewing the seasonas a whole, the densities were generally highest at the more shallow
174

II
K ae
~ OO
««- a s',w w0 w«Ar 5I«« I f i %7«-a ~,vI~ c«««5
20, 25 Xl 3%l7 45 557>a ao aagl $1e
Ã7 355$7
« L tO0
~ DO
VII l 0 i '0 « RO i tS XI« ~ ~ l w D l'I l 4$ Ib «5 ' ~> ~ sa, 'as m sa57~ I 7
~ sl I 0 ~~ ~ ~ l 1 ~~ l«as« I
Depth
Figure 2. Absolute densities of crab per hectare for each stationtrawled in 1983. Each quadrat presents findings from one trip withdensities at the Copalis Head CH!, Grays Harbor GK!, and WillapaBay WB! transects, "r " indicates no sample was taken. Blanksindicate a sample was taken but no crabs were caught.
175

Table 1. Mean density of Dungeness crab by stratum, by trip, in uearshorestudy area in 1983, as crabs per hectare " Mean No/HA"!: two standarderrors "2SE"!; and number Of toms "N"!.
Stratum NumberAll StrataCombined
6~l-4
Ta'ble 2. 1983 width ranges by age. by trip, using data from pigure 4; theresulting proportion of each age class relative to the whole population; andthe estimated population abundance in millions for each age class in allthree nearshore strata combined,
Proportion Relativeto Mhole Po ul tion
Estimated Pop.Abundance millions
6-163 5-66
176
M~aMean No/HA2SEN
~dulMean No/HA2SEN
~Au uatMean No/HA2SRN
"Mean No/KA2SE
Mont'hiu e 0~res
M~aD+1+
"Others"
~Ou 10+1+
"Others"
Allust0+1+
"Others"
D+14
'Others"
3281582
2031453
135804
206215'5
6-3.622-65
>65
6-1633-68
>68
6-2733-73
>73
11141003
9
12416310
11514211
1524839
0.840.120.04
0.610.230.15
0.610. 15D. 24
0. 14D. 18D.68
2024 7
2'5428
625711
58,08.32.8
7.52.82.1
7.31.82,9
1.62.17.9
60154818
988421
916725
1314249

stations, particularly the 18 to 37 m stations of Stratum 6, anddeCreaSed aS depth fncreased alOng eaCh tranSeCt Table 1!. At the64-meter �5 fm! station the densities were consistently smal!.
~P ~ 1 atro Estldato
For the purposes of comparing the nearshore area with results from theconcurrent Grays I-larbor estuarine program Armstrong and Gunderson,this Symposium! and, additionally, for comparison between years andbetween areas within a year, an estimate of population was derived bymultiplying mean stat.:on densities by the digitized ar ea of individualstrata, and then sunmring the results for the entire nearshore area.Total population esti~ates, all strata combined, are displayed inFigure 3. From 69.0 million crab in May, the estimate dropped to12.3, 12.0, and finally 11.6 mfllion in July, August, and September,respectively. Overall mortality for all crab dur',ng the lg83 samplingseason was estimated at 83%. In terms of depth intervals, Stratum 6 intermediate depths! had the highest population abundance throughmost of the season despite a substantial decrease between late May andmid July F iqs. 3, 6, 7, 8! . Significantly, however, Stratum 5 nearest shore! had consistently high crab densities and a large totalpopulation through the summer although it constitutes only 13% of theentire nearshore area used for population estimates . Stratum 7, thedeepest, supported the fewest crab, particularly in September Fiqs.6, 7, 8!, despite beinq the largest in area.
Size and Growth
Width frequencies as one-millimeter increments are displayed in F',gure4 as the percentage of the total estimated population of all strata.YOY �+! and 1+ juvenile crab width r anges were relatively dist i nctthrough time, but siqnif',cant overlap in sizes of older crab caused usto combine them into an "Other" category although in September 2+crab are probably the group from about 85 mm to 120 rmn!, Through thesummer, growth of the 0+ and the 1+ nearshore crab was slower than theestuarine crab of the same age Armstrong and Gunderson, thisSymposium! . The 0+ nearshore crab grew only slightly from the 7 to10 mm range first and second instars! in May to the 10 to 20 rrmr ranqe third and fourth instar! in September. Similar 1y, the 1+ nearshorecrab had a mode of about 35 to 37 mm in May and incr eased to about 55mm in September. The width ranqes of each age and the resultingproportions of each age cateqory relative to the whole population aresunmarfzed in Table 2.
~ad Class a d Strat ~PA lotto s
The width ranqes were applied to the previously derived arealpOpulatiOn eStimateS tO find the pOpulatien S',ze of eaCh age CategOryand to detect trends through the season Fiqure 5!. Of the three aqegroups, abundance of YOY �+! crab decreased most over time, From ahigh of 58.0 mill',on animals estimated for May 84% of the entirepopulation!, the population declined markedly through the season to
177

C Jd0
td QlC0. VQ0 E«L 0
t/I t«IQlC IdQt C-tVC«d ZQJ a0
X ? Itttt-0 td0 tdQlCId0«L !CE Cll0 IQI I/IN tllI/C0
Vlr«lOl QlI C
Ql Ql
JN3383da
CN33N3d CN33d3d JN33N3d
QlQ Qt0tt�0 CJ
I/CCt VlOlOlD K«ll C/0 0r OlCl 5E0O
I/IQJQI C0Z
Id Ol* 0
QJ tttPJ QICI-C 2 tddl' 0 !alL QtQt Etd C C!L Vt
178
i SW~ 33«CJ i NatiC3andC33
«0 «IQC CJ
QJ 'a a0
QI tdQJ0 L td
CdVl 0td CI/Itd l
QJC QJ
0 lJJ 0td N-C0. 00 VlCl /dCtlVl
0.QJC/C /0td0 O!I +/d CNX +D CtC0 /VN-04 + Ql0Itd tt- td0 J-tO CQJ QJ+ «/t llCt td4- C 0.0 QJCJ QJ
OJ C-t30 CCQI ' Cd3 Ql t/I0 Vt tdtd QlVI Ql l-l. CJCU o OlC '00K 0Ql Cv~ ~ «II
«0 QDC td
QlC «I EQJ dla/0 CvE 0l- QJ dl

IAO3 OfrSHQRE, ALI. SIR4}A, o'I AGE m � 4+E}----< - -- fr}fmm
6 ~E
r
IL .L8 9 IO
HOR IH
Figure 5. Population estimates of each age category through the 1983sampling season, all three strata combined.
Sl ralum
r s 6 7 S O ION}N} H
Figure 6. Population estimates of 0+ YOY! crab in 1983, by stratum,

IXINI»
Figure 7. Popo'l ation estimates of 1+ crab in 1983, by stratum.
Stratum68-- -.
J ~ ~ ~
2 S 2 a S 1O»QNI »
Figure 8. Population estimates of 2+ and older crab, described in thetext as "others', by stratum.
180

about 1.6 million �4% of the population! in September. There is asimilar, but less dramatic, decrease in 1+ crab through the summer.Indeed, the lt population essentially leveled out in August andSeptember at about two million crabs, s lightly higher than the finalpopulation of 0+ crab. The older crab, the "Others" category,increased from about 2 million in July to 8 million in September, duepossibly to immigration of larger crab from the estuary in the fa11when the bottom water temperature starts to decrease there Stevensand Armstrong 1984; Armstrong and Gunderson, this Symposium!.Population abundances of different age classes in the three strata areshown in Figures 6 through 8 . The population trend of 0+ crab Fig, 6!thrOugh the SeaSOn underSCOreS the initial impOrtanCe Of Stratum 6where there was a very dramatic decline from about 49.2 million 0+crab in May to a population nearly equal to that in Stratum 7 byAugust although both declined to virtually zero by September . InStratum 5, however, D+ crab were actually most abundant in September.This late summer increase of 0+ crab in Stratum 5 might also be due tosome immigration from the adjacent Grays Harbor estuary, or fromStratum 6.
Compared to 0+ individuals, 1+ crab were generally less common Figure 5!. This age group was most densely distributed in Stratum 5but was relatively rare in both the offshore and the intermediatestrata, By July of the 1983 sampling season, Stratum 5 contained thehighest population of 1+ Dungeness crab despite the sma11 area of thisnearshore zone.
The "Others" category Figure 8!, representing the 2+ and older crab,presented an enigma in population trends. These older crab maintaineda constant popu 1 ation level through the sampling season untilSeptember when they increased to 7. 9 mi 1 1ion from 2. 9 mi 1 lion inAugust. This increase was exclusively limited to the intermediatedepths of Stratum 6, and may again represent possible movement of 2+and older crab out of the Grays Harbor estuary beyond the we 11-mixedshallow stratum.
Benthic Habitat
The habitat bottom type! sampled by the trawl generally tended to beconsistent at. indiv',dual sampling stations. There did appear to besome variation in epibenthic vegetation perhaps related to temporalchanges in the quantity and quality of organic debris flushed from thebordering estuaries. The only real similarity between all of thetransects was the presence of sand dollars Dendraster excentricus! atthe 0 e shallo statlo s, The 0 ays 0 ~ hor a 0 0 oooo Gay traosestsconsistently had many of these animals in the 6- and 9-meter �- and5-fathom! stations, never deeper, but they were coaxnonly encounteredthrough the 18-meter �0-fathom! station on the Copalis Head transect.
The Copalis iiead transect often had cobble or gravel at theintermediate depths which caused difficulty in retrieving the gear!while the two deeper stations at 55 and 64 m 30 and 35 fm! had a rocksubstrate that often tore the nets. Gear damage and the low abundanceof crab at the deep stations on all three transects prompted us todrop those at 64 m �5 fm! in 1984. While virtually no terrestrial or
181

marine vegetation matter was found on the Copa1is transect, 7osteraspp., Viva, Enteromor ha, and terrestri al matter deciduous ~eaves,sticks,~p ne cones were found at the intermediate depths of the GraysHarbor transect. Even more of this terrestrial and marine vegetationwas found on the Wi llapa 8ay transect. Such epibenthic debris, whichdid not originate in the locale of the sampling station, was found onthat transect from 18- through 46-meters 10 through 25 fm! peaking at37-meters �0 fm!. A substantial portion of the 1983 YDY wereassociated with such estuarine material suggesting an associationbetween newly settled juveniles and "refuge" habitat.
Larval Recruitment and the El Wino
The 1983 Dungeness crab year class may have been exposed to warmsurface water anomali es resulting from the well-publicized E 1 Wino of1982-83. As the zoeae were in the water column at the peak of thephenomenon in February and March of 1983 Fluharty 1983!, thesurvival, growth and food supplies of the 'larvae were possiblyaffected. The highest surface temperatures observed during ourtwo-year project occurred in July of 1983, the first trip thattemperature observations were made, of up to 17.8'C. Thesetemperatures were significantly higher than temperatures observed inthe following, more typical year of 1984 at analogous stations anddates.
In his study of the effects of temperature and salinity on the growthof Dungeness crab larvae collected off Oregon, Reed 1969! found thatof five temperatures tested at various salinities, zoeae showed bestsurvival 88$! and development at 10 to 13.9'C and 25 to 30 ppt,factors typical of those nearshore waters. Survival of zoeae was lessat 17.8 ' 60-7DX! but any further extremes of temperature resulted inmuch higher mortality. A decrease in salinity exacerbated themortality, especially at temperature extremes. Similarly, Wild �983!found that temperature effected Dungeness crab eggs as well as zoeae.As experimental temperatures increased from 10 to 17'C in normalsalinities, both the egg mass volume and hatching successprogressively decreased.
Indirect effects by the anomolous warm temperatures are morespeculative, but there are ',ndications that product',vity in the springof 1983, and hence food supply for the zoeae, was probably reducedbecause of the El Wino F luharty 1984 ! . Among other influences onDungeness larval mortality, Lough �976! discussed the importance offood adequate both in abundance and in si ze for efficient ingestion.Especially crucial during the first few weeks of zoeal life,temperature anomalies could alter the opt',mum timing of these factorswith deleterious effects on Dungeness larval survival.
The trends in year class and population abundance discussed in thispaper should be viewed cautiously for several reasons. First is theinherent problem of attempting to derive reasonable conclusions fromthe data of a single year in a field of study of a species so subjectto interannual variability. Dur imminent consideration of the entiretwo-year data set and the continued funding of the offshore componentof this project, will provide an opportunity to evaluate this
182

variability and establish a norm. A second, unexpected reason to becautious, which was at once a complication and an opportunity, was theEl Nina of 1983. A complication insofar as our observations duringthat year possibly do not reflect the norm af abundance anddistribution, and yet an opportunity as we fortuitously began ari gorous sampling program in a year of extremely anomalousoceanographic conditions. Again, this data will be particularlyvaluable once a more complete data base is collected and 1983 can beviewed in retrospect.
ACKNOWLEDGEMENT
This project was supported by the Washington Sea Grant Program and weare indebted to the director and staff for their help and encouragement.
Abstract
The megalopae of a Dungeness crab year class are known tometamorphose and settle in both estuaries and the nearshoreenvironment along the coast. However, the re 1ative contribution ofeach habitat to the ultimate recruitment into the adult population isunknown. The newly metamorphosed crab in the nearshore area may be inan inferior environment with less refuae from predators, lowertemperatures, and less available food but these factors may becompensated for by the much larger area avai'lable for settlement thancould be provided by an estuary.
A two year Sea Grant project, begun in the spring of 1983, studied thepopulation dynamics of Dungeness within the Grays Harbor estuary andalong the nearshore coastal zone outside the mouth. Objectives of thenearshore component of the project were to: 1! assess Dungness crabpopul at'.on densities; 2 ! determine size at age; 3 ! characterizesettlement; 4 ! estimate population abundance in the study area; 5!determine relative growth and mortality rates; and 6] characterizebenthic habitats. Possible implicat!ans of the 1982-83 F1 Nino arebrief ly discussed.
The 1983 data are treated exclusively as the 1984 sampling seasonended shortly before the coxvnencement of this Symposium. Only oneperiod of settlement of young-of-the-year YOY=O+! was detected; thesefirst and second instars of 7-10 mn carapace width grew to only 10-20mm �rd and 4th instar! by September. The highest densities of theseYOY crab were found in the nearshore areas. After an initial largefirst and second instar population, the YOY abundance droppeddramatically through time until the only sizable populat',on was foundin the nearshore stratum of 5 to 15 xmters depth. Overall mortalityof all age classes through the sampling season was 82K.
183

Literature Cited
Armstrong, D. 1984. The role of estuaries in Dungeness crab early1',fe h',story; a case study in Grays Harbor, Washington. AlaskaSea Grant, this Symposium.
Butler, T.H. 1956. The distribution and abundance of early postlarvalstages of the British Columbia commercial crab. Fish. Res.Board can., Prog. Rep. No. 107:22-239
Fluharty, D. 1984. 1982-83 El Nino Summary, El Nino Task Force.Institute for Marine Studies, University of Washington, Seatt 1e.
Gotshall, D . W. 1978. Relative abundance studies of Dungeness crab,Cancer ma ister, in northern California. Calif . Fish Game,~24-
Gunderson, D., D. Armstrong, and C. Rogers. 1984. Sampling desi gnand methodology for juvenile Dungeness crab surveys. A'laska SeaGrant, this Symposium.
Huyer, A. and R. Smith, 1983. Pacific northwest. Pp. 1155-1157 in-.J. Allen ed.!, PhySical oceanography Of COntinental ShelVeS.Rev. Geophys. Space Phys., 21�!: 1149-1I81.
Lough, G. 1976. Larval dynam',cs of the Dungeness crab, Cancer~ triste . off the ce ~ t a1 tl eton coast. 1970 71, Fish. -es11.
74:353-375.
Reed, P. 1969. Culture methods and effects of temperature andsalinity on surv',val and growth of the Dungeness crab Cancermaqister! larvae in the laboratory. Can., Fish. Res. Bd., J.,PEP!: 389-397.
net.11y, p. 1983. Oynamics singe 'ess c ah, Cence ~ast, 1off centra1 and northern California. In: Life history,environment, and mariculture studies of the Dungeness crab,Cancer ma i ster, with emphas i s on the central California fisheryresource, au W. W',ld and Robert N. Tasto eds.!, Calif. Dept.F;sh 7 Game, Fish Bulletin 172, pp. 57-84,
Stevens, B. and D. Armstrong. 1984. Distribution, abundance andgrowth ofj uveni le Dungeness crabs, Cancer ma ister!, in Gr aysHarbor Estuary, Washington USA. Fish.~Bu . In press!,
Wickham, D . E., R . Sh leser, and A. Schuur . 1976 . Observations on theinshore population of Dungeness crab in Bodega Bay, Calif, FishGame 62�!:89-92.
W',ld, P.W. 1983. The influence of seawater temperatures on spawning,egg development, and hatching success of the Dungeness crab,Cancer ma ister. In: Life history, environment, and mariculturestSu es o t e Dungeness crab, Cancer ma ister, w',th emphasis onthe central California fishery resource, Pau W. Wild and RobertN. Tasto eds.!, Calif. Dept. Fish ar Game, Fish Bullet-:n 172,pp. 197-213.
184

Age and growth of male Dungenesscrabs, Cancer magister, in northern
California
Ronald W. WarnerCalifornia Department of Fish and GarneEureka, California
Age and growth studies on Dungeness crabs Cancer ma ister! have beenconducted in British Columbia NacKay and Weymouth 1935 ; Washington Cleaver 1949!; British Columbia's Queen Charlotte Islands Butler1961!; Bodega Bay, California Pools 1967!; and San Francisco, Calif-ornia Collier 1983! . Length frequency analysis, tagged crab returns,and observations of molting crabs were used in these earlier studiesfor growth determination. My study documents the age and growth ofmale Dungeness crabs in northern California with emphasis on the 1972year class by applying these methods to an isolated year class, in timeseries, over several years.
Dungeness crabs were captured in ocean waters by trawl and c.rap on an-nual surveys conducted during fall months from 1972 to 1977. Periodictrawling for juvenile crabs took place in Eumboldt Bay in 1972 and 1973.Crabs in bays and offshore waters were tagged with Ploy anchor tags anda $2,00 reward was paid for recovered tagged crabs.
There were 103 recoveries from a total of 7,930 tagged individuals.Size at age wes determined for 33 crabs. Average eire of 1972-yc crabsat 3 and 4 years was 151 7 and 167.7 mm, respectively. Grabs of the1973 yc averaged 160.5 and 181.2 ssn for the same ages, One 197-mm crabwas recovered at 5 years of age.
A total of 35,264 crabs was caught during the 6-year survey period.Age 4izs! group parameters were calculated by using, the separation pro-cedure of Nacdonald and Pitcher �980! Means for 1-, 2-, 3-, and 4-year-old 1972-yc trawl-caught crabs were 24,7, 93,8, 140.8, and 172-7 mm,respectively. Trapped crabs of the 1972 yc averaged 133 .5, 151.8, 176.l,and 188.6 mm for ages 2, 3, 4, snd 5, respecrively The means for 3-and 4-year-old trapped crabs were more meaningful than those for trawledcrabs because of much larger trap sample si.zes.
185

Instar sizes were camputed from regression formulas by Collier �983!.A starting point of 150.7 mm far the 14th instar was used. calculatedinstar sizes were plotted in conjunction with means of crabs of knownage to produce a growth curve.
After comparison of instar widths for Pacific coast crabs~ differencesin growth rates were demonstrated which ultimately determine the per-centage of legal sized crabs entering the fishery in the 14th instarAt. age 3, 28/ of the 1972 yc recruited to the fishery, while approxi-mately 60'7. of the faster growing 1973 yc recruited in the 14th Lnstarat 3 years of age
Age and growth of Dungeness crabs i.n northern California is similar tothat reported by Cleaver �948! in Washington, Growth in BritishColumbia Butler 1961! is slightly slower, with negligible recruitmentat 3 years, but the maj ority recruited at 4 years. Botsford �983!,in a cursory examination of a portion af unpublished data used for thisreport, concluded that. northern California crabs are slow growing, witha large portion of the crabs recruiting at 5 and 6 years of ags. Bisconclusions are inconsistent with results presented here and by Cleavez�949!, Butler �961!, and Poole �967!.
This study has shown that mals Dungeness crabs Ln northern Californiaare, with mi.nar exception, recruited at age 4. The percentage of crabswhich enter the fi.shery at 3 years varies.
ABSTRACf
li ~ I dig th i l D g i i ~t *imined fram studies conducted during the period 1972 ta 1977. Annual.ocean surveys, with concurrent trapping and trawling at selected sta-tians, yielded length frequency data, in time series, for specific yearclasses. Recoveries of crabs tagged at known ages elucidated upon sizeat age Observations of molting crabs and single molt tag returns pro-vided malt Lncrement information used to calculare instar sizes. Internpretatian of Length frequency data for an unusually abundant 1972 yearclass was facilitated by the precedence of very weak year classes whichhelped mitigate cohort aver'lap. Age size! group parameters from Lengthfrequency data were generated by a computer programmed separation pro-cedure. Sires of the 19 72 year class for ages 1 to 5 years were 24 . 7,93 .8, 150 7, 176 l,and ! 88.6 mm, respectively. Corresponding calculatedwidths were 26.6, 100,2, 150.7, 177.9, and 206.S mm foz ages 1 to 5.Tagged 1972 yc crabs were 108.0, 1S1.7, and 167 7 mm for ages 2 to 4.The percentage of northern California Dungeness crabs which attain theLegal size of 159 mm at 3 years is variable; however, with minor excep-tion, they are fully recruited at 4 years of age.
186

REFERENCES
Botsfard, Louis W. 1984. Effect af individual growth rates on expectedbh' f hh Clif 'D8b 8~2!fishery. Can. J. Fish. Aquat ~ Sci. �1!:99-107.
Butler, T. H. 1961 Growth and age determination of the Pacific edibleb, 4 ~f D, C ., Pt h. k . 8 ~ ., l., 1S�!:1873.891.
Cleaver, Fred. 1949. Preliminary results of the coastal crab Cancert. ! 2 g tl.. 8 I D p. I'' h., Bl. I 8 p., 494247 Ill.
Call.ier, Patrick C. 1983 . Movement and growth of past-larval Dungeness4 ~t, I h S I' «, p. 125133. 1
Wild, Paul W., Robert N Testa, ed. Life history, environment endI d' fth II gb,4~it, th
phasis on the c.entral California fishery resource. Calif. Dep FishGame, Fish Bull. 172 352 p.
Macon!.aid ! P. D . N. and T. J . Pitcher. 1979 . Age graups from size-fre-quency data: a versatile and effi.cient method of analysing distribu-tion mixtures . JFRBC. 36; 98 7-1001 .
Nackeyp Donald C. G., and Frank W. Weymauth. 1935. The growth of the2 'fl d'bl* b, C ~t* D, C, Bt 1. Bd., 3�!8191-212.
Poolep Richard L. 1967. Preliminary results of the age and growthdy f h k I C *~t! 1 4 lif I th g d
g tl I C ~t * ' 8 d g 8 y, p, 553-567, 1 Sy p, C ~ *cea, Ernakulam, India, 1965 . Ptoc. part 2. Mar. Biol. Assoc., Nanda-pam Campy India, 945 p.
187


Molt increments, annual moltingprobabilities, fecundity and survival
rates of adult female Dungeness crabsin northern California
David C. Hankin, Nancy Diamond, Michael Mohrand james lanelliHumboldt State UniversityArcata, California
Introduction
Although the Ricker stock-recruitznent, Leslie matrix and other modelsof population dynamics are often formulated exclusively in terms off i*, &1 f *D ~ ~ : ~ ~ *centrated almost exclusively on male crabs. Failure to devote researchattention to female crabs is undoubtably explained by the facts thatcoznrnercial female harvest is prohibited in most West Coast fisheries only British Columbia allows comme rcial harvest of females that ex-ceed legal sise for males! s and that females are smaller and haveless commercial value or potential value than do males. However, asthe models suggest, females are normally z ega rded as the more izn-portant sex frozn a population dynamics perspective and, in the usualfishery context, should receive more research attention than malesrather than less. This is particularly true for a polygaznous speciessuch as the Dungeness crabs where very few adult znales znay ensureinsemination of virtually all adult females PMFC l978; Poole andGotshall 1965! .
McKelvey et al. �980!, assuming an underlying endogenous explanationsshowed that fluctuations in landings of znale Dungeness crabs in thenorthern California fishery could be most plausibly explained bydensity-dependent egg /larval survival mediated through fluctuations intotal egg production of the unexploited female stock see Hankin, thisSyznposium, for a critique of this and othe r hypotheses! . Becausetheir conclusions rested on extremely tentative data. concerning age andg rowths fecundity and survival rates of adult female Dungeness crabs,they recommezxled that study of the demographic statistics of femaleDungeness crabs receive immediate and priority attention.
This pape r presents the principal results of a three year CaliforniaSea Grant-sponsored project specifically designed to allow determina-
189
tion of the vital demographic statistics of adult female Dungenese crabsin northern California. Research consisted prixnarily of a tag-recoveryproject in which more than 12,000 adult fexnale crabs were tagged andreleased z laboratory generation of xnolt increments froxn 185 femalesremoved from pre-mating embraces ~ and estimation of total fecundityof IZZ adult female crabs. From results of these studies x we havebeen able to paint a remarkable picture of the life history of adult fe-male Dungeneee crabs. In particularz w'e found strong size-dependenceof molt increments ~ molting probabilities, fecundity and survivalx.ates; such dependence waa often unexpected. Among fexnalee exceed-ing 155 mm carapace width, fecunditiea were often low Z00-400,000eggs!, annual molting probabilities we xe effectively zero, and annualsurvival rates were about IO%%uo,' these figures were far lese than thosefor smaller younger adult female crabs �25-135 mm carapace width! .Based on these findingsz and other bits of evidence, we present anargumezxt for senescence among adult female Dungeneaa crabs.
The intention of this paper is to present a concise descriptive reviewof the znore significant of our findings. As a consequence ~ details ofcertain metbodologiee ere only briefly sketched or occasionally omittedeo aa to present an overall perspective of the life history of adult fe-male Dungenese crabs within the confines of a single brief paper.Where appropriate, reference ia made to existing and/or contemplateddocuments in which relevant details may be found. We hope that thisobvious sacrifice of' completeness of detail is more than coznpeneatedfor by the reader' s ability to qxxickly and easily grasp ouz principalfindings.
Materials and Methods
The northern California comznercial fishery for xnale Dungenees crabsopens I December and runs through 30 July unless extended throughAugust by California, Fish and Game!. Thus, a single comznercialseason spans two calander years. project activities were necessarilyclosely linked with the commercial fishing seasons in part becauseail field research took place on board a contracted commercial crabfishing vessel out of Trindadz Califoxniaa and because most tagrecove ries were received from cooperating commercial fishermen,but also because of Dungenesa crab life history. In particular, oviger-oue female Dungeness crabs are most frequently captured in trapsduring the xnonthe of December and January. To simplify presentationof methods and re suits z whe re it would otherwise be awkward to men-tion two calender years, project "years" have been defined ae twelvemonth periods beginning I December of 1980, 1981 and 198Z. Thus zfor exaznple, the first project year spanned the period I December 1980through 30 November 1981. An additional convention involves the ueeof the tex'm "large" in reference to the size of female crabs; "large"will consistently refer to female crabs of carapace width a 155 mxn.
More than 12 a000 adult female crabs x anging in carapace width fromabout 85 to 172 mm were tagged and released between the mouth ofthe Mad Rivet' �0 55' N! and Freshwater Lagoon � I 15' N! duringthe znontha of January through March of 1981-1983 at depths of 10-24 fathoms �8-44 rn!. See Diamond and Hankin, this Sympeoium, forsite maps and detailed descriptions of release locations!. Crabs weremeasured to O. I mm across the widest part of the carapace excludingthe tenth ante rolateral spines!, and were tagged at the posterior epi-meral suture with numbered FLOY anchor tage Model FD-68B!.
190

During 1983 tagging activities a qualitative assessment of moltinghistory of each tagged crab was made based on visual examination ofcarapace condition degree of fouling, blackening ar'ound joints, etc.!.Crabs were classified as a! molted during most recent molting season, b! unce rtain molt history, or c! failed to molt during most recent and possibly previous! molting seaeon e! . Recoveriae were receivedprimarily from commercial fishermen, although small numbers wererecovered during tagging activities. Recovery data provided by fisher-men included date, depth and location LORAN-C reading or coastallandmark! of recovery. Because commercial crab traps in northernCalifornia have large mash size �0-100 mm on diagonal! and two w10.3 cm diameter escape ports, recoveries of tagged crabs by com-mercial fishermen were biased toward larger crabs by trap sizeselection. To allow statistical adjustment for such bias» and to allowcapture and tagging of small adult females I.00-135 mrn!» speciallydesigned crab traps, which were non-selective above about 85 mrncarapace width, ware fished parallel with commercial trap gear. SeeDiamond 1983; Diamond and Hankin» this Symposium» for details re-garding trap size selection and modified experimental traps.!
During late April through early June of 1981 and 1982 when femalemolting and mating takes place in northern CaLifornia!, the contractedcommercial fisherman and his crew collected females from pre-matingembraces for us. Females are found paired with males in such em-braces just prior to female molting; when the female molts, the hard-shelled male mates w!th the soft-shelled female in the true matingembrace. ! These females were brought to the Talonichar Marine1 eboratory in Trindad where they were held until molting took place,usually within four days. Premolt and poetmolt carapace widths wererecorded for 185 such females which molted in the Laboratory.
Most ovigaroue females were collected during late December throughearly January of the second and third project years from traps fishedfrom the contracted vessel; additional recoveries of tagged ovigerouscrabs were received at the Telonicha t Marine Laboratory. Collectedfemales carried eggs which were usually bright orange in color and atan early etage of development» well before the eyed etage and larvalrelease. Females were immediately placed in Bouin's Quid ~ on boardthe vassal or at the Laboratory, so as to minimize physical damage toegg masse e; live ovige roue females tend to physically "tear" at theirown agg masses when handled. Fernale widths we re measured,molting condition was assessed es described above or known from tag-recovery records, and egg maeeee were removed from females andtransferred to fresh Bouin's fluid in which they remained for about onemonth prior to processing. Processing consisted of a drying and clean-ing protocol which resulted in production of a small volume of dried,cleaned, hardened and separated eggs. For the second year's collections,at least six random 0.020 g eubearnplas were counted from each driedegg maes. Total facundities and variances of estimated facunditieewere estimated using a mean-per-unit estimator Cochran 1977!. Forthird year collections» only a portion of collected specimens wereactually eubeamplad 8 subearnplas of 0.020 g each!, but all specimenswere processed to produce dried egg masses, For those egg massesfor which estimates were not based on eubeampli»»g, total facundtttasand variancae of estimated fecundities were estimated from d~ied eggmass weight based on a regression of estimated total fecundities againstdried egg me.ss weight among subsarnplad specimens. This statisticalprocedure allowed ue to mmimize subsampling effort and expand the
191

number of epecixnens for the third project year. Details of eaxnplepreparation and statistical analyeee will be presented in Hankin andlaaelli in prep.! .
A total of 36Z female crabs were collected ia non-selective trapsduring late May of 1983 and were classified as a! recently molted, or b! failed ta molt during most recent xnolting eeasonx according tovisual examination of carapace condition. Because the molting seasonhad only just concluded by late May of 1983 Mohrs unpublished!,visual assessment of xnalting history was xnost accurate at this timeof year. Recently molted fexnales cauld be readily distinguished fromthose that had failed to molt.
Linear regreseione were used to describe the relations between moltincrements and premolt carapace widths for tag-recovery data andfor data gene rated from pre-mating embrace females that molted inthe Laboratory. Techniques for comparison of x egression lines Snedecor and Cochran 1967! were used to coxnpare tag-recovery andLaboratory/pre-mating exnbrace regression lines so as to examine theeffects of tagging on molt inc rexnente. Annual xnolting probabilitiesfox adult females were estimated using two independent methods.Eetimators which accounted for biasee due to tag loss and commercialtrap size selection were developed and applied to tag-recovery data.For these analyses, only those crabs which a! were released prior to1 April and b! were recovered after 1 June of the year of tagging butbefore 1 April of the following year were included in analyses. Thisrestricted analyeee to those crabs which should have had just a singleopportunity ta molt, Details of tag-recovery-based molting probabilityeetimators are presented in Diamond �983! aad Diamond and Hankin,this Symposium. An independent eetixnator developed by Mo'hr unpub-lished! was applied to shell condition data collected during late May of1983 and to analagous data collected during tagging activities in Januaryof 1983. Multiple regressions, with molting hietoxy as a dummy variable Draper and Smith 1981!,were used to statistically account for thevariation in total fecundity as a function of carapace width and moltinghistory. All teste of statistical significance were made at 5%, Finally~survival rates for large adult female crabs those > 155 mm carapacewidth! were estimated from the sequence of x ecove ries of crabs taggedin each of the three project years fallowing techniques presented inBrownie et al. �978, Model 1! and Younge and Robeon �975!. Survivalrates for smaller crabs could not be directly estimated, but qualitativecomparisan of recovery sequences for smaller crabs allowed inferenceof relative surviva1 rates as compared with larger crabs.
Results
Of xnore than 1ZsOOO adult female crabs which were tagged and released,just over 6OO crabs were recovered as of 31 August 1984. Overallrecovery rate was about 5%, but recovery rates were strongly eize-dependent and reflected coxnxnercial crab trap size selection. Foradult females > 155 mm carapace width, recovery rates wexe about11%; for fexnales falling between 124 aad 136 mxn recovery rates wereonly about 2. 5% . Qf the total recoveries s Z89 had been at large througha single molting season and could be used for tag-recovery-based es-timatore of annual molting probabilities; 111 of these had molted andcould be reliably used for molt increxnent regreseione Table 1!.
192

Table l. Total number of female Dungeness crabs tagged andrecovered by size as of 31 August 1984!.
NumbersRecovered
Mid - Point Nurnbe rs~T
60712037Totals '
Molt increments.
Molt increments declined linearly with increasing female carapa.cewidth for both tag-recovery and laboratory/mating embrace data..Molt increments for adult females of 100 mm averaged about 19 mm~whereas molt increments for females of 150 rnm averaged about 1Zmm. Regression lines of molt increments against premolt size werenot significantly different between tag-recovery and laboratory-genera-ted data, thus suggesting that tagging had no statistically significanteffect on molt increments of released crabs Figures 1 and 2!.Variation about the molt increment regression Figure 2! was approxi-mately constant over the full range of premolt carapace widths.
Molting probabilitie s
A total of 289 crabs was recovered after a sing!.e molting season atlarge, of which only 111 had molted. Failure to molt was most evidentamong larger female crabs Table 2! . A total of 53 crabs was recovered
193
86.589.592.595,598.5
101,5104. 5107.5110.5113.5116 5119.5122,5125.5128.5131,5134. 5137.5140.5143. 5146. 5149. 5152. 5155. 5158.5161.5164,5167. 5170. 5
3 02
4 16
12234375
131215301491611782918
1139124213 831 14892291576849725311927
8
0 0 0 00 00 00 2
4 4 5 92832435256494387765732
23 3 1

25
20
LN 15~ ~o'+ i
0
e
10 OQ 0 115 120 125 '130 135 140 145 150 155PRE-MOET SllE Imrzl
Figure 1. Molt increments plotted against pre-molt carapace widths ~Solid symbols - recoveries of molted crabs at large througha single molting season. Open symbols � recoveries of crabsat large through two molting seasons s but which molted onlyonce. Solid line indicates regression of increment againstpre-molt size for solid symbols.
25
20
I I 15~ e ~
10 0 90 95 105 110 115 120 125 130 135 140 145 150 155PRE-ROl1 SIEE laIsl
Figure Z. Molt increments plotted against pre-molt carapace widthsfor tag -recovery and laboratory/mating embrace data com-bined. SolM circlssand open symbols as for Figure 1; aster-isks are for laboratory-generated data. Solid line showsregression line for combined datas solid symbols only.
194

Table 2, Recoveries of tagged crabs at large for a single xnoltingseason. Size indicates carapace ~idth at tagging.
Mid -Point T otalRecovered
NctMolted Molted
Totals: 178 ill 289
after having been at large through two xnolting seasons. Again, fre-quency of molting was greater for smaller crabs than for larger crabsand douhle molte were evident for a few sxnall crabs Table 3! . Reco-veriee of crabs that had been at large through three molting seasonshave been few, but displayed the saxne trends as seen in Tables 1 and2l molting was more frequent among smaller crabs Table 4!. Forlarge crabs those z 155 mm carapace width! r total recoveries havebeen 80: of these, 79 were recovered after one molting season atlarge and one was recovered after two molting seasons at large. Nonehad molted.
Data px'esented in Tables 2-4 are, as previously mentionedr biased bysize selection in the cornme rcial fishery recovery gear, A naive cal-culationr which would calculate annual molting probability simply aethe fraction of recoveries which returned molted for a particular sizeinterval at tagging, would show a steep decline in xnolting probabilitiesfrom about 135 mm through 155 mm; beyond 155 mm molting probabili-ties were effectively zero. However, these calculations would be a!positively biased by trap size selection a crab that molted to a largersize would be more likely to be recovered than would a crab of thesame initial size that hsd failed to molt,!, and b! negatively biased bytag loss through the molt a crab which loses its tag while moltingobviously cannot be recovered! . The coxnbined effect of these twobiaeee ie uncles.r, although we suspect that the principal effect is apositive bias in molting probabilities estimated via the naive calculation.Figure 3 shows results of applying the developed molting probabilityestimatore to a! tag-recovery data and b! shell condition data, aswell as the naive calculatione. Estimates derived by the three methods
195
113. 5116. 5119. 5122.5125.5128.5131,5134. 5137. 5140. 5143. 5146. 5149. 5152.5155.5158,5161.5164.5167, 5170.5
0 0 10 12 5
4 7 8ll1617ZB2526ll
12 3 1
1 1 133
ll9
21182114
4 3 0 0 0 0 0 0
1 12 14 5
1613282632302131252611
12 3 1

Table 3, Recoveries of tagged female crabs at large through twomolting seasons. "- . -" indicates uncertainty regarding oneor two molts based on increment from tagging to recovery.
Mid - Point One TwoMolt Molts
TotalRec ove red
NoMolt
Table 4. Recoveries of tagged female crabs at large through threemolting seasons,
T otalRecove red
TwoM~ol s
OneM~
1' id-Point No
are not in agreements but all suggest a pattern of rapid decline inannual molting probabQities beginning somewhere between 130 and135 mm cs.rapace width! to effectively zero for crabs with carapacewidths in excess of 155 mm.
F e cundity .
Estimated total fecundities of 35 female Dungeness crabs collectedduring the second pro]ect year s.re presented in Figure 4. Totalfecundity was not significantly linearly related to carapace width forthese data. Failure to discover a significant increasing trend of totalfecundity with increasing carapace width prompted a more extensivefecundity sampling program during the third year. Expanded samplesize was made possible by the discovery that total fecundity estixnatesde rived by subsampling were highly correlated with dried egg mass
196
113.5116.5119.5122.5125.5128.5131. 5134. 5137.5140. 5143. 5146. 5149. 5152. 5155.5158. 5161. 5
119. 5122.5125.5128.5131. 5134. 5137. 5140. 5143. 5
0 10 00 0002 06 -?- 05 7 06 07 08 05 02 00 00 00 00 0
1
0 0 1 12 7
6 6 710
6 2
3 0 0 1
1
2 0 2 03 14 l

1.0
.8
~ 7
I m .6o
40 2
3
0 ~ 2 110 120 130 140 150 160 170CARAPACE WIDTH in mm
Figure 3. Estimated annual molting probabilities for female Dungeneescrabs plotted against female carapace width ~ 'RAW DATA"= naive calculations described in teM', cBIA-ADJUSTED" =estimates based on tag-recovery data, adjusted for gearselection and tag lose.
15
Ih I12
Da2LJ
6
I C 110 120 130 140 150 160 170CARAPACE WIDTH in mm
Figure 4. Estimated total fectusiity plotted against carapace width forspecimens collected during the second project year, Allestixnates are based on subsampling of dried egg xnasses,
197

weights Figure 5!. Confidence intervals based on subeampling werealways within + 10% of the estixnated total; those derived from theregression of estimated total fecundity against dried egg mass weightwere roughly t 100,000 eggs and, for moat specimens, were between4 10-?0% of the estimated total. Apparent variatian in size-specificfecundity was therefore real and not a result of estimation methods;errors of estimation were small compared to size-specific variationaxnong estimated fecundities. Combined fecundity estimates for thesecond and third project years ar'e plotted on Figure 6 as are estimatesfar ten California crabs collected from the Farallone Islands whichappear to belong to the sarae eet of data. Hines, pere. comm.! .Clearly, fecundity was only weakly r'elated ta female carapace wirlthin both years' collections. A regression of total fecundity againstcarapace width was significant for the thix'd year' s data, but couldexplain only about 6% of the total variation in estimated fecundity.It is worth noting that variation among these data ie far greater thana-mong those data presented in Mayer �973! for Washington crabs;however, Mayer bad no crabs exceeding 145 mm carapace width.
1S
elD
12
I 4 2 9
M 4 Isr 3
DRY EOG AIIASS WgltEHT. R
Figure 5. Estimated total fecundity, determined by subsaxnpling,plotted against dry egg mass weight for epecixnene collectedduring the third project year. Solid line indicatee regressionline .
Recoveries of tagged ovigerous females revealed that fernale Dunge-nees crabs cou!d extrude viable egg masses without having maltedduring the most recent molting /mating season e!. Of a total of 96tagged ovigeroue crab which were recovered after a single moltingseason at larger only?5 had molted ~ Seventeen ov!geroue femaleswere recovered after two molting seasons at large and, of these,
198

15
O ~12
lOR 9
Q C 6xnI~ fE 3 I
ax 120 130 140 150 160 170CARAPACE WIQTH in mm
igure 6. Estimated total fecundity plotted against carapace width forspecixnens collected during the second �981! and third �982!project yeax's and for ten specimens collected off the Faral-lone Islands, California courteey of A. Hines ~ pere. comm.!
none had molted twice and three had failed to molt for two consecutiveseasons. Tag recovery data thus conclusively showed that annualmolting and mating were not required to allow female Dungenees crabsto extrude viable egg me.sees.
That female crabs could extrude viable egg masses in the absence ofmolting suggested to us that at least part of the apparent variation insize-specific fecundity might be attributed to molting history. Whenused as a categorical or dummy variable in a multiple regression con-text, the addition of molting history increased the amount of explainedvariation in fecundity froxn about 6% carapace width alone! to about30% carapace width and molting history! . For crabs which had moltedduring the most recent molting season, total fecundity significantlyincreased with carapace width. For crabs which had fai1ed to moltin the most recent and perhaps previous! molting season s!, totalfecundity significantly decreased with carapace width. Using the "extra"sums of squares principle" Draper and Smith 1981!, we found thatthe regression line for the xnolted group wae significantly differentf roxn the regression line for the group that had failed to molt, but notfrom the regression line for the uncertain group. The regression linefor the g roup that had failed to molt wae significantly diffe rent fromboth the molted and uncertain groups' regression lines Figure 7!.Details of these analyeee will be presented in Hanlctn and Ianelli inprep.! .
199

15
Ih I
O x12
I I Z Il gts
6I-~ C
3
xe 110 120 130 140 150 160 170CARAPACE WIDTH in xnm
Figure 7 ~ Estimated total fecundities for crabs which had failed tomolt during most recent molting season e! NO MOLT! ~ hadmolted during most recent molting season MOLT!, or haduncertain molting history UNCERTAIN! plolted againstcarapace width. Solid lines indicate regression lines forMOLT and NO MOLT groups respectively.
Survival rates.
Because annual xnolting probabilities for ls.rge adult female crabswere effectively zero, and because crabs of this size were fully vul-nerable to the comxnercial recovery gear, it wae possible to ueemethods presented in Brownie et al, �978! and Youngs and Robe on�975! to estixnate annual survival x'ates for these crabs based on thesequence of recoveries for each of the three year's releasee. Table5 displays the recovery matrix used for these estimates; the matrix.consists of recoveriee of crabs which were recovered within 365 day"years" of the original dates of release as suggested by W.D Youngs ~pere. comm.!, Estimated annual natural xnortality rates M! were,on an instantaneous basis, 1.984 and 2. 533 fox' the first and secondyears' releases, giving annual natural survival rates of 0. 1375 and0. 0794 respectively. Conddence intervals for these two survival rateestimates overlapped, thus indicating that estimated survival ratesdid not differ significantly between years.
The contrast in recovery pattern between large axxl sxnall femaleswas striking. Table 6 shows an analogous recovery matrix for crabsreleased at sizes between 125 and 140 mm. In contrast to Table 5,there are significant numbers of these smaller crabs that were re-covered in the third year after tagging. If one assumes that all crabsof this smaller size range a! molted into fully vulnerable sizes > 155 mxn! by the third year at large, b! had the same annual survival
200

Table 5. Number of crabs a 1S5 mrn carapace width released in eachproject year and number of these crabs recovered during365 day 'year" periods following date of release.
Year' RecoveredYearReleased
Numb e rReleased 2 3 4
198119821983
9 0 058 2 0
34 8
518384465
47
Year Recoveredh1umbe rRe le as ed
YearReleased I 2 3 4
30 19 13 026 13 5
8 4
i98119821983
17251922464
rates as did the large crabs 0 and c! no tags were lost during rnolte,then there were nearly ten tixnee ae many email crabs recovered intheir third yea» at large from those released during 1981! than wouldhave been expected based on these assumptione �3 vs. 1.39!, A con-clusion that smaller adult fernale crabs have much higher annual sur-vaival rates than large adult females ie inescapable. An annual naturalsurvival rate of about 50% appears compatible with recovery data forthese smaller females. It is worth noting that Reilly and Sails �978!found that survival tates for C. irroratus females were 5-10% duringth ! tt y flh' 0 t ~0-45%f ygggg f 01
t fth' gy 0 ' ! gg t thtC ~ ~t dC.' tmay be closely related in an ecological sense,
Discussion
The results presented in this paper have allowed us to develop a fas-cinating and unexpected description of the life history of adult femaleDungeness crabs. Of the generated project results, only the findingthat molt increments declined linearly with increasing cax'apace widthwae expected. Other project results caused us to radically revise ouroriginal preconceptione concerning the basic life history of femalecrabs. Below we give what we feeI ie a description of the female'slife history which is consistent with our project results.
The relationship between the age of a female Dungeness crab andcarapace width is clearly a complex one. The rapid dec!ine in annualmolting probabilities from about 135 mm through IS5 mmg to zerobeyond 155 mm, means that the correiation between age and carapacewidth becomes proxx res eively wea'ker as females reach sizes exceeding135 mm. Using the molt increment regression presented in this paper Figure 2! and an average carapace width two years after settling of110 mm, it appears that almost all females reach a carapace width of
201
Table 6. Number of crabs with carapace widths 'a 125 mrn but 5 140 mmwhich were released in each project year, axxd nuxnber ofthese crabs recovered during 365 day "year" periods follow-ing ds.te of ~sleaze.

about 128 mm at three years of age molt increments for crabs of110 mm average about 18 mm and annual molting probabilities for e,110 mrn premolt size appear close to one! . At a carapace width of 128mms molt increments are about 15 mm and molting probabilities arestill nearly one, so that the majority of females probably reach a cara-pace width of about 143 mm at age four. Beyond age four, fexnalesbelonging to a single year class xnay have many possible modal! sizesdepending on succeeding molt history. A size of 155 xnm could bereached as early as age five if a female molted from age four to agefive. In contrast, a six year old fernale could conceivably still be thesize of an "average' four year old female; assuming that successivemolts are independent of one another and that annual molting probabili-ties for a premolt size of 143 mm are about 0-5, the probability thata six year old fernale would have the sama size as a four year oldfemale is about �-0.5!x�-0,5! = 0.25 . An "average" female crabprobably molts annually from age three to age four but then takes twoyears to reach a size of abeut 156 mm at age six. Having reached thissize ~ annual survival rates are very low about 10%! ixnplying thatmaximum longevity is probably not much more than 7 or 8 years of age.Mohr unpublished! hae been developing a c rustacaan growth modelwhich incorporates both size-specific molting probabilities and eize-epecific variation in molt increments; this model should provide a farbetter description of the age and growth relation for female Dungenesscrabs than the above crude coxnputations, Nevertheless, the absence ofa strong correlation between age and size of fexnalas means that lengthfrequency data for female Dungeness crabs are extrexnely difficult tointerpret ~ Diaxnond �983! used sophisticated distribution separationxnethods to extract size structure froxn carapace width frequency datacollected over the three project years, but wa have not presentedresults of those analyses hare; their interpretation is by no meansstraightforward.
Tha strong size-dependence of annual molting probabilities was unex-p tdb C.~t* M th C k t My hll ehfemale ie in a soft-shelled condition, immediately after molting Hartnoll 1969!, Butler �961! first speculated that large fernale Dun-geness crabs xnay not xnolt annually based on observations of carapacecondition! and he called our attention to a report by Lehman and Osborn�970! which gave tag recoveriee for female Alaskan Dungeness crabs;their data are entirely consistent with our much larger tag recoverydata set. Clearly, many adult female Dungenees crabs do not molt andmate annually, However, recovery of tagged ovigeroue crabs that hadbeen at large through two xnolting seasons without having molted con-clusively demonstrated that female crabs must be capable of retainingviable sperm for periods of at least 2.5 years. The delay from matingin April-May to extrxwion and fertlization of eggs in November is aboutsix months in northern California. Hence, failuxa to molt for two yearswhile still extruding a viable egg mass implies an ability to retainviable sperm for at least 2.5 years beyond an original molting/matingevent.! Extrusion of egg maeeee by females that failed to xnolt has alsobeen observed in laboratory settings by Wild pers. comm.! ~ Jamieson pere. comm.! and in this study. More remarkable still is the labora-tory observation by W'ild pare ~ comm.! that females can molt withoutmating and still produce viable egg masses, although these egg massesappear to be sxnaHer than "normal".
It ie possible that size -dependent declines in annual molting probabili-
202

ties and sperm reterxtion abilities are a fairly general feature of thereproductive biology of Cancer crabs; they are certainly not unix}ue toC.~t* .0 1' 1 1 1t gp bb'1st 'tthi
h b d tdt th E p d'bl b,c.pet Bennett 1974; Hancock and Edwards 1967; Hancock 1965! and for theEast Coast rock crab, C, irroratus Haefner and Van Engel 1975.ReiHy and Saiia 1978! . Hancock �965! noted the ability of C. ~ayxruefemales to retain cps rxn for long periods and to extrude viable eggxnas see in the absence of xnolting and mating. It eeexns likely, in fact,that the ability to retain viable sperm for long periods of time and toextrude viable egg maesee in the absence of molting and mating is anevolutionary adaptation to the observed declines in annual moltingprobabilities ae adult female crab size increaeee. Declinee in moltingprobabilities are themselves probably a reflection of energetic con-straints. As female crabs become largerp the energetic expense ofreproduction apparently becoxnee large enough to eventually px'eventthe additional energetic expense of growth via molting; the advantagesof large size and increased fecundity apparently conflict with the ad-vantages of repeated x'eproduction at a sxnaller size. Although repeatedreproduction appears to dominate this "conflict" p there are obvioustradeoffs which result. Female Dungeness crabs that extruded eggmasses without having molted cax'ried significantly fewer eggs at agiven size! than did females that had molted and mated in the mostrecent molting season see Figure 7! . In factd total fecundity actuallydeclined with increasing carapace width among those crabs which werevisually characterized as having failed to molt for one or more molt-ing eeaeone or that we re known to have failed to molt based on tagrecovery data. This apparent statistical decline in fecundity with in-crea. sing size may, however, reflect declines in molting probabilitiesrather than a real size-dependence of fecundity among crabs whichhave failed to molt. It is likely that many of those females that wecharacterized as having failed to have molted had in fact failed tomolt for two xnolting seasons rather than just one; this would be espe-cially likely for females with carapace widths in excess of 150 mm.The "uncertain" group probably contained a mixture of crabs whichhad failed to molt for just a single season and crabs which had moltedduring the most recent molting season. Because the uncertain groupwas not statistically different from the group which had molted, butwas significantly different from the group which had not molted, itseems most probable that nuxnbers of eggs extruded at a given size!progressively decrease with number of molts missed ~ At this pointwe can only speculate as to the biological basis for euch a decline.Progressively fewer sperm or perhaps lese viable sperm may remainas a female fextilizes successive broods at extrueion. Alternatively,continuing physical damage to pleopods, which are not regeneratedif crabs fail to molt, may phsyically prevent a large female froxncarrying a "normal" si~ed egg xnaes. Thie issue and the issue of thetradeoff between reproduction and growth both appear to warrantbasic studyg froxn physiological and life history-theoretic perspectives ~
Finally, results from this study have led ue to the conclusion thatadult female crabs become senescent, The decline in molting probabi-lities with increasing eize, the decline in egg nuxnbere among thosecrabs that failed to molt, and the very low annual survival rates �0tyd!for large female cxabs are all entirely consistent with an hypothesisof senescence and aU likely have a physiological basis. One cannothelp but be awed by the volume of a Dungene es crab's egg mass as
203

compared to total body volume. How lang can an animal continue tomake this kind of reproductive investments Apparently, female Dunge-ness crabs can make such a continued reproductive investment onlywith diminishing success and with dramatic reduction in survival rates.And» there are other bits of evidence, some rather anecdatal, whichsuggest senescence. The largest female Dungeness crabs in northernCalifornia are not handsome animals; they are heavily fouled and pre-sent a dramatic visual contrast with relatively clean large males andsmaller females see also Butler 1961! . The egg maeeee produced bythese large females are often not only small, but they also look "poor' »hard as it is to judge such a vague notion, Meat yields fram large fe-males are highly variable and are often lower in percentage than forsmaller females Hankin, unpublished!. Furthermore, large femalesare lethargic animals when compared to their smaller counterparts�.
Ironically» we would not have been able to develop this scenario ofsenescence were it not for fishery management policies that prohibitcommercial harvest of female Dungeness cr'abe. H female crabs wereharvested, then larger individuals would have been removed from thepopulation by fishing ~ leaving only smaller females that showed littleevidence of senescence. Although prohibition of fernale harvest haslittle biological basis, results presented in this paper suggest that theresource of large females ie probably small anyway, Survival rates forlarge females are very low and transition to these sizes > 155 mm! ieprobably slaw due to low annual molting probabilities for crabs of about140 � 145 mm. Hence, a fishery targeted on large fernale Dungenees crabwould probably rapidly deplete available f emales and, over the longterm, be very small compared to the existing male fishery. However,it seems unlikely that harvest of such large females would have anysignificant impacts an recruitment ~ Most large females will producesmall numbers of perhaps "poor" quality eggs, and these females haveonly one or at most two years to live survival rates are about 10%! .McKelvey et al ~ �980! pointed out that harvest of females exceedingsame specified carapace width could have the beneficial effect ofdamping fluctuations in year class strength of Dungenees crabs» if theyare caused by density-dependent egg/larval survival ~ It mey indeed bepossible to have too many females on spawning grounds. British Colum-bia allows commercial harvest of females that exceed the size of legalmales and fluctuation in the aggregate British Columbia landings arenoticeably smaller than those for other areas see Hankin, this Sympo-sium!, It may be worth considering the pos eibility that limited comme r-cial harvest of female Dungenees crabs hae contributed to the relativestability of Dungeness crab landings in British Columbia.
Acknowled ements
This study would not have been successful without the assistance ofmany Humboldt State University Fieheriee students Craig Bovberg»Kip Bottonley, Tirn Helms» Gretchen Bishop, Ryoji Maeda, ShunjiFujiwara, Chet McKenzie!» the generous services of the skipper of theErnie 'G'» Mike Clasby, and his crew Curtis Ihle and Mitch Farro!,the cooperation of commercial crab fishermen from northern Californiaand southern Oregon» and the assistance of the California Departmentaf Fish and Gama» in particular Ran Warner. We Sank them all fortheir help, We dedicate this paper to Terry Butler whose studies ofmale Dungeness crabs have withstood the tests of time and remain aecurrent as when they were first published; we hope that our
204

studies of female Dungenese crabs will meet that same test of time.This work ie the result of research sponsored in part by NOAA,National Sea Grant Collage Programs Department of Coxnmercep undergrant number NA80AA-D-00120, through the California Sea GrantCollege Program, and in part by the California State Resources Agency,project numbet R/F-72. The U.S. Government is authorized to repro-duce and distribute for governmental purposes. We thank CaliforniaSea Grant for their support.
Literature Cited
Bennett, D.B. 1974, Growth of the edible crab Cancer ~a,rus L,!off South-West England. J. Mar. Biol. Assoc. U. K. 54x 803-823.
Brownie, C., D.R. Anderson, K.P. Burnham, and D.S. Robson. 1978.Statistical inference from band recovery data - a handbook.Resource Pub. 131. U,S. Dept, Interior, Fish Wild. Serv. pWaehingtonf D.C. 212 pp.
Butler, T.H. 1961. Growth and age deterxnination of the Pacific ediblebG ~ ~ ~ t I D .J.ylh. R*.B dC .!l!�33-
889.
Cochranp W.G. 1977. Saxnpling techniques, 3rd edition. Wiley, N. Y.482 pp.
Diaxnondf N. 1983. Dexnographic statistics and annual molting proba�bQ't' I th Mtdt f D d g* b G ~~ ttnorthern California. Unpub. M.S. thesis p Humboldt State U. ~Arcata, Calif. 106 pp.
Draper, N.R., and H. Sxnith. 1981. Applied regression analysis, 2ndedition. Wiley, N.Y. 709 pp.
Haefner, P.A., and W.A. Van Engel. 1975. Aspects of molting,growth and suxvival of male rock crabs, Cancer irroratus p inChesapeake Bay. Chesapeake Sci. 16' .25322 .
Hancockp D.A. 1965 Yield assessment in the Norfolk fishery forb c Bel !.Rpp.p.-v.R .c .p .It.
Explor. Mer 156:81-94.
Hancockx D,A., and E. Edwards. 1967. Estimation of annual growthth ddl b C Re L!.f.c .p* .It,
Explor. Mer 31: 24~24,
Hartnollp R.G. 1969. Mating in the Brachyura. Cruetaceana 16: 161-181,
Lehxnan, C . p and O. Osborn. 1970. Dungeness crab research. COM-73-11164. NTIS ~ U.S, Dept. Commerce, Springfield, Va. 43 pp.
McKelvey, R., D. Hankinp K. Yanosko, and C. Snygg. 1980 ~ StablecyClee in multistage recruitment modelsl ao applicatfdogf to the
Rh C ltf ' D g** b G o ~tf1' h y.Can ~ J. Fish. Aquat. Sci. 37: 2323-2345.
205

Mayer, D.L. 1973. The ecology and therxnai. sensitivity of the Dunge-*b,~cm~t,M1tdp*sftt 5 th
community in Similk Bay, Washington. Ph. D. x Univ. Washing-ton. 188 pp.
PMFC. 1978. State/federal Dungeness crab fishery managementp rog r am. Dungen e s s c r ah biological and e c onoxnic data 1974-1977. Pacific Marine Fisheries Commission, Portland, Or,
Poole, R., and D.W. Gotshall. 1965. Regulations and the market crabfishery. Outdoor Calif. 26 9!: 7-8.
Reillyx P.N., and S.B. Saila. 1978. Biology and ecology of the rockcrab, Cancer irrorstus Say, 1817, in southern New Englandwaters. Crustaceans 34: 121-140.
Youngsx W.D., and D.S. Robson. 1975. Estixnating survival ratesfroxn tag returns: mod.el tests and saxnple size deterxnination.J. Fish. Res. Board Can. 32: 2365-2371.
206

Session III
Mortality


A review of Dungeness crab diseases inthe Pacific Northwest and Alaska
Theodore R. Meyers, Thomas C. Shirleyand Susan M. ShirleyUniversity of Alaska, JuneauJuneau, Alaskaand
Albert K. Sparks and j. Frank MoradoNational Marine Fisheries ServiceSeattle, WashingtonAbstract
Natural diseases wf thin any animal population can be a factor in theoverall cyclfc nature of animal abundance. This is especfally true infi shery stocks wher e management and resul tfng harvest pressures mayunwfttfngly favor disease-causfng organisms. Very lfttle literatureexists concerning specific dfseases of Dungeness crab, Cancer ~acals-ter . COnditi OnS revieWed here 1 noluder 1! Chlamydi a-Trike SyStemfCfnFectfon A.K. Sparks, J.F. Morado and J.W. Hawkes, in press!; 2!metacercar.ial encephalomyeloneur opathy Sparks and !fibbits 1981!; 3 !systemic cilfate disease Arsrstrong et al. 1981; Sparks et al.1982 !; 4! egg and larval mycosi s ArsrMs r ong et al. 1976; Armstrongand Fisher 1977!; 5! epibiotic fou'!ing of eggs !Ffson et al. 1975;Fisher and Wfckham 1976!; 6! she11 disease J.G. Chan fn Qnder|sann1977; C . O'Claf r, unpub1i shed data!; 7! fdiopathic gr anulomatosis Sparks 1980!.
Introductfon
The cyclical natura fn abundance of Dungeness crab Cancer ma f ster!comprfsi ng the paciffc Northwest ffsheries has been weWW acumen ed Botsford and Wfckham !975; HcKelvey et al. 1980!. Such f!uctuatfonsi n yearly catch have a nfne year peter o3 in California and a twelveyear period in Washington and Oregon. However, the increasing amp'li-tude of the regular cycling pattervr as the fishery has expandedsuggests the possibility of an eventual crash McKelvey et al.1980!. Durfng the 1982-83 commercfal season a total of 27.5 millionpounds of Dungeness crab were landed collectfvely from Calffornia� .7 million pounds!. Oregon �.1 mfllfon pounds!. Washfngton �.1mf1!ion pounds!, Brftish Columbfa �.8 mf1'!ion pounds! and Alaska�1.8 million pounds! Paciffc Ff shing Yearbook 1984!. From pre-vfous years, crab numbers have continued to decline in Oregon and
209

Haturally occurring diseases can be an underlying 1fmftfng factor inthe cyclical gr.owth, survival and recrui tment success of any animalpopulation. This fs especially true when additional stressors suchas human exploitatfon of stocks and/or po11utfon further enhanceopportunfstic disease causing or-ganisms. At present there are veryfew diseases described in Dungeness crab, especfally within the morevulnerable young-of-the-year and I+ age classes. Those diseaseswhich have been reported wfll be reviewed in two groups Tab1e I!; I!dfseases which are pathogenic and either cause or have potential ofcausing crab death; 2! diseases or lesfons of unknown signfficance.The nemertean worfrr, Carcfnonemertes errans, which fs a corrmrensal and
Table 1. Reported Diseases
patho enfc Dfseases
nf ~ ngenenn C ee, Cancer ~afnter.
Reference
1. Chlamydfa-lfke systemfc infection Sparks, Morado and H awk es,in press
Sparks and Hfbbits 19812. Netacercar ialencephalomyeloneuropathy
Armstrong et al. 1981;Sparks eT aT. 1982
Armstrong et Wa . 1976; Arm-strongg and Fisher 1977
3. Systemf c cilf ate df sease
4. Egg and larval mycosfs
Dfseases of Unknown Si nificance
HiESOn et al, 1975; FiSherand lRc%%am 1976; Ffsher1976; Wickham 1979
Chan cited in Sfnderemann1977; C. O'Clair, perso-nal corrmrrnfcatf ons
Sparks '1980; Morado andSparks, unpublfshed data
1. Epibfotfc fouling of eggs
2. Shell dfsease
3, Idiopathic granulomatosfs
210
California fishing grounds. Washington has shown a slight improve-ment in total catch from the previous year �.6 millfon pounds! andthe British Co'Iumbfa fishery remafned low but stationary. The 1983Alaska landfngs declined to a little over half of the 1982 harvestdue to an fncrease fn fishfng effort by boats displaced from the de-preSSed ffSherfeS in the "1OWer 48" PaCiffC FfShfng YearbOOk 1984!.At thfs wrftfng no statf sties wer e avaflable for the 1984 season.Although over harvest would seem to be a ma!or contrfbutfng factor incrab declines, past management experience by state and federal biol-ogists emphasized that the r.eproductive capacity of the crabs shouldnot be influenced by ffshfng effort. Female crabs have been protect-ed as well as undersized males whfch have at least one opportunity tomate before entering the fishery. Consequently, there may be otherFactors influencf ng Dungeness crab abundance fncludfng such environ-mental faCtOr S aS Curr entS PaCifiC Mari ne FiSher feS COmrr. 1965 !,upwellfngs Petersen 1973!, ocean temper.atures Wild 1980!, densftydependent bf otic factors Botsford and Mickham 1975, 1978; Mckelveyet al, 1980! and possfbly disease. It is the latter variable whfchls aaIdressed fn thfs revie~.

Chlamydia-lfke systemfc infection A.K. SpaAs, J.F. Norado and J.W.Hawkes, f n press! .
Mortalftfes of feral adult Dungeness crab withfn pots and corwnercfaiholding facilitfes in Nfllapa Bay and narthern Puget Sound, Nashing-ton, have been associated with an intracellular. chlamydia-like agentfnfectfng crab tissues. The gram negatf ve organism reaches a maxfmumprevalence of IOL fn Dungeness crab during wfnter cold water tempera-tures beginning fn December and contfnuing through March. Thisdfsease is systemic involving dffferent cell types wfthf n many organsystems, but targets upon connective tfssue cells, especially withinthe hepatopancreas and b'ladder. The histologic appearance of fnfectedhost cells fs characterized by marked hypertrophy and large, basophf-lfc cytoplasmfc microcolonfes of the causative agent. Such cellsbecome necratfc and severe fnfectfons result fn replacement of norma!tissue architecture with large nzrnotonous fields of the organfsmmaking fdentiffcatfon Of tfssue type dffffcult. Transmfssion eleCtronmicroscopy of fnfected hast cells has shown the mfcrocolonies to becomprfsed of a prokaryotic organfsm having some forfns resembling pre-vfously reported ch'famydia or chlamydia-lfke organisms fn vertebrate Storz, 1971! and fnvertebrate Harshbarger et al. 1977; Meyers 1979!animals . However, thfs f s the i'irst chlamydla-Trike agent reported ina decapod crustacean A.K. Sparks, J .F. Morado and J .!f. Hawkes, inpress!. Although the organism has not been cultured fn vftra, ft hasbeen mafntafned fn viva by laboratory passage from crab to crab. In-fected crabs become~ethargic, contafn minute bodies of the organfsmwithfn their hemolymph and eventually die. Consequently, the vfru-lence of this pathogen for Dungeness crab fs unequivocal, but its im-pact on lfmiting recruftment fn feral crab populations needs furtherfnvestfgatfon. It fs entirely speculative, but the mass mortalitiesof nearly 9,000 older female Dungeness crabs �40 mn carapace wfdth!observed on Nashington and Oregon beaches durfng 1979 and '!981 mayhave been assacfated with this chiamydfa-Ifke agent. prelfmfnary his-tological examfnatfon of some of these crab mortalities fndicated asystemic bacterial infection, but the true etiology was never substan-tiated Stevens and Armstrong 1981!. Those crabs observed were prob-ably only a fraction of the total mortal ity, possibly representing asignificant lass of a reproductfvely fmpartant age group from thosecoammrcfal fisheries Stevens and Armstr.ong 1981!.
Netacercarial encephalOmyeloneurOpathy
Netacercariae of an unfdentfffed trematode species were found encystedwithin hfstologfc sectfons of nervous tissues fromm 4.3S BI!88! ofDungeness crab randoaly collected fram northern Puget Sound andNfllapa Bay, Nashington Sparks and Hibbfts 1981!. More recently,other cases of parasitfzed Dungeness crab have been observed in thesame areas as well as fn Alaskan waters J .F. Morado and A,K. sparks,personal coammnfcatfon!. Nervous tfssues affected included majorperipheral nerves, brain, thoracic ganglion and the lamina ganglio-narfs of the eye. In most parasi tfzed crabs only a single metacer-caria fs observed in sectfons of indfvidua1 nervous tissues, Excep-tions do occur in which crabs have many of thefr major nerves encystedwith metacercarf ae. In the less severe cases, parasftfzed crabs shawno c'finical si gns of disease. However, heavily parasitized crab are
211

clearly atax1c. Histopathologfcal findings fn all specimens examinedindicated compaction and/or necrosis of surround1ng nervous tissuescontainfng trematode cysts. This parasfte has the potentfa'I to debf-li tate and possfbly kill Dungeness crab hosts, but only if encystedmetacercarfae ~each high numbers. Such a condftfon may cause dfsrup-ti on of nervous f nnervatfon to maj ar organ systems and certainly limbsas fndfcated by ataxic crabs Sparks and Hfbbits 1981!. The fnitfallow prevalence of the parasite fs consfdered conservative since ser1alsectioni ng of the entire ner vaus system was not feasible. Encystedworms were not visible at gross necropsy, consequently no freshmaterfal was avaflable for taxonomic fdent>ffcatfon. All trematodemetacercar1ae prevfously reported in marine crabs have belonged tothe famfly Microphallidae, and none were found exclusively withfnnervous tissues Sparks and Hfbbits 1981!. Sections of the Dungenesscrab metacercarfae resembled Mfcrophallus carcfnf, fn Carcinus maenasf om Ruat 9 ft in stan sr eM~T, 1% T seine. ~ le ~an t e samehost fkom lloods Hole, massachusetts stullkatkl o571, a*capt th ~ typf-Cal mfCraphal 1 id anteriOr SpineS Were nOt apparent Sparka andHfbbfts 1981!. S1mflar metacercar1ae have also been abserved exclu-sively within the ne vous tissue of sh«imp ~Cran a alaskensl ~ from uashfngtan Norado and Sparks 1983!.
Systemic ciliate disease
Paranophrys maggii, a holotrfchous cflfated protozoan, has been repor-ted as a Tacuuua fve pathogen af marine crustacea fncluding Carcfnusmaenas o the a ittany coast palsson 930 a d Oundeness cTrarramOregon Arv strong et al . 1981! . P ar anophrgrs sp. has al so beendescrfbed in Dungeness crab from Mas~sng~an,>parks et al, 1982! andfram the marfne fsopad, Gnorfmas haerama ore onensWs near AfagnakIsland, Alaska Hibbfts an par s . In a t on, a Par.ana h s-lfke cfliate has been observed within the hemolymph and t ssues o amOrfbund captfve golden king crab Lfthades ae u1s ina! collected~ a Halnes. Alaska l.e. Heye ~, unpuhhhshud d ta . Parano hr s sp,
fs general ly consider ed a secondary invader requ1r ng a pr maryportal af entry into the hast through fnjury of the exoskel eton.Thus, the disease can be a problem among captive crabs in overcrawdedconditions, especially if injured by handlfng or by each other. Thecfl 1 ate becomes systemic by invasion of the host circulatory systemwhere it multfpl1es and spreads to other organs while consuminghemocytes as well as other tissue ce'lls. Death of the crab hostprobably r.esults fram massive destructf on and dysfunction of majororgan systems Sparks et al. 1982 !. In captive Dungeness cr.ab atleast 40X have succumber! to thfs disease which exhibits a prepatentperiod of 9 ta 26 days following fnjury Are strong et al. 1981!.Infected crabs show progressive clfnfcal sfgns of lethargy, anorexiaand ataxfa before death. Diagnosis can be made by examining hemolymphfrom f nf ected cr abs for the motile c11f ates. Hi stopathol ogf ca!features in moribund Dungeness crab fnfected wfth Parano hr s sp.include almost complete destructfon of c1rculatfng an t ssue hemocy-tes accompanied by severe systemic necrosis of major argans andmyri ads of cflf ates withf n the tfssues Spa&s et a'I . 1982 ! . Althoughthe transmfssi on and perpetuation of this parens te is favored bycrowded artiffcfal holdfng facilitfes, the d1sease has been observed1n one field case of Dungeness crab Spa&s et al. 1982 ! and fn feralCarCfnuS maenaS PO1SSan 1930!. At thfS wr1tfng tua Of the authOrSl!rlar a O anr!npar.kS! haVe paSSaged ParanO hr S Sp. 1n DungeneSS Crabfor about 1 1/2 years by inject ons o nfected cr.ab hemolymph.
212

Egg and 1ar val mycosi s
The fungus, La enfdfum sp., fs a reported pathogen fn eggs and larvaeof laboratory reare ungeness crab fn Oregon Armstrong et al. 1976;Armstrong and Fisher 1977!. As much as 5-10% of the total egg massabout the periphery of the sponge in f ndfvi dual female crabs maybecome infected� . Such areas appear discolored and cotton-'like andare comprised of neer otfc eggs. Fungus infection fn Dungeness crablarvae may result fn mortalftfes of up to 40% within 24 hours Arm-strong et al, 1976!. Clinical signs of diseased larvae fncludesettlement to the bottom of the rearing vessel, progressi ve opacityof the tissues and a similar cotton-lfke appearance occurring afterdeath as in infected eggs. Egg and larval tissue opacftfes resultfr om rapidly growing myceli al masses of septate sparingly! hyphae andaccompanyfng tfssue neer osf s . The cotton-like appear ance fs causedby hyphae penetratfng to the exterfor of egg shells or larval exo-skeletons. Discharge vesfcles, formed by amer.gent hyphae, releasef nfectfve, motile bi flagellated zoospor es which penetrate uni nfectedeggs and larvae to perpetuate the disease. Naupiff of the brfneshrimp, Artemfa salina, whfch may be used as food for crab larvae canalso become On 'ectect with the fungus and transmit the df sease. Oncef nfected, crab larvae do not respond to tr eatment although transmf s-sion of the disease may be reduced by pestfcides such as trffluralfn�.005 mg/L! and captan � .06 mg/L ! Armstrong et al, 1976 !, Duringan epfzootfc, control of the disease can only be accompli shed bydiscarding infected crab larvae, di sfnfecti on of rearfng containersand starting over with uncontamfnated water and anfmals. Continuedgood cultural hygiene fncludfng removal of detrftis, uneaten food anddead larvae, will reduce the possi bi'if ty of future epf zootfcs.
Larfenldlua calli nectesasfa,rig o possibly fdentfcal fungal patha-gen, causes the same dfsease syndrome in eggs of feral blue crab,Callinectes ~sa fdus, and in laboratory reared blue crab larvae CouchTVZ~a~noz~ea . 1944; Rogers-Tal bert 1948; Bl and and Amerson1974!. This sameWungus has also occur.red on the eggs of other feralcrabs such as Pano eus herbstii and Libinia dubra Bland and Amersonlplol and o t e eggs o~t e a n cle, CReeohrgfa patula Johnson andBonner 1960!. La enidium sp. is also a severe pathogen fn egg andlarval culture o penae shrimps Cook 1971; Lightner and Fontafne1973; Barkate et al. 1974; Lfghtner 1977! and lobster, Homarus amerf-canus Nilson et aT. 1976! where some success fn fungal treatmentnraslieen achieved with malachite green Fisher et al. 1978!. A freshwater~ta enfdlu Ifke fungus has also been responWs bTe for lapactlng yearlyrecruitment of the copepod Df t i fn an alpine Cali-fornia lake Redffeld and
Lar enfdfum sp. fs apparently ubiquitous fn the aquatic environment.Tt may 6e a normal epfbfoti c saprophyte on shrimp Lightner 1976 !which may be the case for other crustacea as well. It is clear thatLa enfdfum sp. fs an fmportant egg and larval pathogen of many crusta-cea n rearfng facilfties and ft can affect egg survival in wfld bluecrab and the rwcruftment of feral freshwater copepods. At present,there fs no evidence to indicate that this fungal agent fs an fmpor-tant pathogen affecting feral Dungeness crab populations.
Dfseases of Unknown Sf nfficance
Epfbfotfc fouling of eggs
213

Epfbiotfc fouling of eggs fn wild Dungeness crab was ffrst reported byFfsher and Mfckham �976!. Organfsms involved fncluded those resem-blfng the blue green algae DSCfllataria and RiyilaraCea, the baCterial.e cothri, the gliding hactae So e iatoasnart eascilla and'rVa ce Td stalk d p oto*aans Ritson e s . 1975: fTsier an Tckhan1976!, Egg mortalfties fn wild crabs, paWr. icularly occurrfng at theedges of clutches and fn older more developed embryos, were correlatedwfth the presence of some of these epibionts. The cause of embryodeath was postulated as suffocation due to thfck epibiont growth andsubsequent trapping af detrftfs. Laboratory studies seemed to corro-borate a proportional cause and effect relationship of epibiontdensitfes with egg mortality Fisher. 1976!. It was further suggestedthat these fouling organi sms were a cantr fbutf ng factor fn the declfneof the San Francisco area Dungeness crab fishery Fisher and Wfckham1976 !, Previous literature regarding fouling of crustacean eggsindicated that di rect embryo death only occurred fn situations in-volving fungal ar ganisms able to penetr-ate the egg shell Rogers-Talbert 1948; Anderson and Conroy 1968!. In reality, epfbioticfouling organfms are ubiquftous on all life stages of many othercrustaceans, being noticed particularly fn reared species includinglobster, the prawn Pandalus platyceros, various penaeid shrfmps andcrayfish Overstreet~J3; Baraaate et ai. 1974; Rilson et al. 1975;Couch 1978; Ffsher et al. 1978 !. RoRalf ties due to 7oulTng havebeen significant in penaeid shrimp culture when thfck mats of fila-mentaus and non-filamentous epibfonts colonize gill surfaces Barkateet al. 1974; Lightner et al. 1975! or entangle larvae and postlarvae,&us, interfering wi tR Sliavf or- and molting H flson et al. 1975;Lightner and Supplee 1976!.
ufckham �979! later reported that epfbiont fouling fn wild Dungenesscrab eggs indirectly resulted from the feedfng activities of thenemertean pr edator, Carcinonemertes errans. Norm feces and organf cmatter released from punctur ed crab eggs apparently provides a richsubstrate pr omotfng fouling organisms. Crab egg death was attributeddfrmctly to worm feeding and could be cor.related with worm di strfbu-tfan rather than epfbiont blooms rmsuitfng from nutrfent rich efflu-ents Mfckham 1979! . Consequently, the true significance of foulingorganfsms in causing dfrect egg mortalities in wild Dungeness crab fsnot yet clear.
Shell disease
Although shell disease has not been descr f bed in Dungeness crab, thereare unpublished reports from washington J.G. Chan cited in Sindermann1977! and AlaSka C . O' Claf r, per SOnal COmnunf CatiOn!. The latterobservation f nvolves a blackened er osi ve candition of the distal legsegments in crab fnhabftfng logging sites wfth large amounts of barkchips among the sediments. At present, no fnfectious agent has beenfmplicated but rather a toxic cause fs suspected.
In other crustaceans, shell dfsease is commonly caused by chitfnoclas-tfc bacteria infectfng both natural and cultured decapod populationsas reviewed by Johnson �983!. In wild crustacean populatfons she' lldisease typfcally has a low prevalence except in reports for Alaskanking crab, Paralithodes camschatfcdr ggnd P. platypus Bright et el.cited ln stnrleermann an Ro~se Toortg677, %ego IFanne c ab, clmonoe-cetes tanneri Bar oss et al. 1978! and crnustacea including crangon~she genre nock crabs, cence 1 orat s, from pal lated senate do p
214

sftes in the Mew Tariff Bight area Gopalan and Young 1975; Young andPearce 1975!. Captive populations of decapods, particularly lobsters,may also develop high pr.evalences of shell disease with accompanyinghfgh morta1ity rates Tay1or 1949!. Dfsease develops following damageto the nonchftfnous outer epfcutfcle by mechanical injury, microbialdegradation Baross et al. 1978; Cipr fani et al. 1980! or paSSibly bychemfcal pollutfon Young and Pearce 1975!. TI e underlyfng chitfnouscutfcle then becomes colonized by chitfnivorous bacteria causfngerosion from secreted lipases. Addftfonal bacterial secretions ofchftf nases and prateases cause progression af the shell 'lesion tounderlying soft tfssues Cfprfani et a!- 1980!. Shell lesians aremost cormnon an ventral surfaces beginning as small whfte foci whichbecame cratered, friable and blackened fram melanizatfon. The lesionscoalesce often resultfng fn lost appendages as well as gf'll er osfan Hess 1937; Sawyer and Taylor 1949; Tay1or 1949; Rosen 1970!. Iflesfons progress to soft tissues molting cannot e!fmfnate the dfsease,but continues to a fatal outcome. Adhesions of old and new cuticlecaused by tissue necrosis prevent successful ecdysf s Fisher et al.1976!. Varfous bacterfa1 genera have been associated wfth crustaceanshell dfsease including Yfbrfo, Beneckea, Pseudomonas, Alteromonas,~ttrfllum. photohacterlum earl uhuipic Sed ~rtpuo actena Trace rrtr;~oo: and La~ton %~Am orskf et al. 1975; Anderson and Conray 1968;Baross et al. 1978; Ciprfanf e aT. 1980!. Under captfve candftfonsshell disease can be contact transmitted from animal to animal, butexperimental inoculatians have met wfth success as wel1 as failure Bright et al. cited fn Sfndermann and Rasenffeld 1967; Malloy 1978;Ciprianf et al. 1980!. Predisposing factors of shell disease appearto include excessfve organic substrates, chemical pollutfon, handling,overcrowding and warm water temperatures Haod and Meyers 1974; Ffsheret al. 1978!.
The sfgnfficance of shel'I dfsease fn affectfng the recruftrxent of Dun-geness crab fn feral populations fs stf11 completely unknown.
Idiopathic granulomatosfs
Multiple granulomata have been descr.f bed irr histologfc sectiorrs frorxseveral Dungeness crab �4K! callected fram the Puget Sound area ofwashington State Sparks 1980 !. The gr anulomata typically occur fnthe connective tissues of the midgut wall and are of two types, Typeone is smaller and more frequent; consists of a melanfzed center withfew surrounding hemocytes and is located throughout the rsf dgut wall,but f s most numerous beneath the epithelial basement membrane . Thesecond type fs a larger granulorxa wfth a central melanized core sur-rounded by a large co11ar of hemocytes. This latter lesfon fs uncom-mon and located in the deeper. connective tissues of the midgut wall.Specfal stains have shown no evfdence for the etiological nature ofthese lesions. It has been speculated that they are r.eactfons to twodifferent biologfc forefgn bodfes based upon their dffferences fnsize, morphology and location in the midgut wall Sparks 1980!.Affected crabs were cli nfcally normal ather+fse, suggesting thatthese lesions may only be of academfc interest regardfng Dungenesscrab health, Simflar foreign body gr anulomata have been reported fnas many as 1009 af Alaska Dungeness crab examined from bark sedimentsfn loggfng areas J .F. Morado and A.K Sparks, unpublished data!. Thetoxf c nature of these sedmfments fs under investigation C . 0 'Clair,unpublished data! and may have some rtelevance to the hfgh prevalenCeof granulomata fn Dungeness crabs from these habitats. Reports of
215

1dfopathic granulomata do exist for other crustacean specfes as well Lightner and Redman 1977!.
~Smnar
The var fous Dungeness crab fisher fes in the Pacfffc Northwest andAlaska are presently decl fn1ng, some more than others. Regardless ofwhether these declines are part of the cyclical nature of the ffsh-erfes, management programs should examine all relevant aspects ofDungeness crab biology including parasftfsm and dfsease. Superfi-c1ally, the 1 fteraturw suggests that not many diseases occur inDungeness crab. However, such an assumpt1on may well be 1n errarunless based upon more investigative effort than has been expended.Recent f nvesti gatfons of other decapod species within the PaciffcNorthwest and Alaska have revealed several new disease entftfesand/or. fnforfnatfon regardfng prmvfous'ly descrfbed agents. Thesecontrfbutfons may be of potential value for future comparative diseasestudies of Dungeness crab from the same areas. Such discoverfesfnclude the following: the mycotic b'lack mat syndrome fn tanner crabC. ba1rdi Sparks and Hi bbfts 1979; Sparks 1982 !; microsporfdf anZfSeaaes of Alaskan kfng crab A.K. Sparks and J .F. Norada, unpub-lfshed abstract, 17th Annual Neetfng of the Sacfety for InvertebratePathology, U.C. Davfs, 1984! pink shrimp P. jordanf! Dlson andLannon 1984! and sand shrimp Cra~n an francfscorueel'TT'. Norado andA.K. spurts, Iac. cit3; putaBve he«@estrus- Tte Infectio s InAlaskan king cr~6 KX. sparks and J.F. IJ!orado, loc. cft!; rhfzace-phalan parasftfSm by BrfarasaCcuS callosus fn Alaskan k1ng crab A.K.spa as anc J.f. Me a~o, unpu ss e~a ~ rect. 16th Annual Meeting ofthe Sacfety for Invertebrate Pathology, Cornell Unfversfty, Ithaca,N.Y., 1983; Hawkes et al. in press!; r1ckettsfa-11ke infection ofAlaskan blue k1ng craaf johnson 1984!; systemic bacterial and Cflfatedfseases of Alaskan king crab T.R. Neyers, unpublished data!.
References
AmbarSk1, R.L., G. LapfCCOlO, G.F. AmbOrakf and J. Huner. 1975, Adfsease affecting the shell and soft tf ssues of Louisiana cr.ay-fish Procambarus clarkii. 2nd Int. Symp, Freshwater Crayffsh,Baton Rouge, Laufsfana pp. 299-316.
Anderson, J, I.W., and D,A. Conroy. 1968, The signffi cence of diseasein preliminary attempts to rafse Crustacea 1n sea water. Bull.Dff. Int. Epfzoot. 69;1239-1247.
Armstr.ong, D.A., D.V. Buchanan, and R.S. Caldwell. 1976. A mycosfscaused by La enidfum sp. in laboratory reared larvae of theDungeness cra , Cancer magfster, and possfble chemfcal treat-raents. J . Inverteeer . Path~a . :329-336 .
Amstrang, D.A. and N.S . Ffsher. 1977 . Fungus disease of DungenessCrabS. In C.J . Sfndermann ed. ! "DfSeaSe DfagnOSfS and COntralfn North Xmer fcan 'Marine Aquaculture" pp.137-141. Elsevier Scf.Publ. Co., N.Y.
Armstrong, D.A., E.rf. Burreson, and A.K. Sparks. 1981. A ci'iiate fn-fect1on Parano hr s sp,! in laboratory-held Dungeness crabs,cancer ~aa ste . . Inuerteo . pathoi. 31:261-2 ' 9.
216

Barkate, J.A., C.R. Laramore, Y. Hirnon, and H. Persyn. 1974. Somemarf ne mf croorgan92 sms related to shrfmp df seases. Proc. 5 thAnnu. Meeting World Marfcult. Soc., Charleston, S.C. pp 267-282.
Bar oss, J.A., P.A. Tester, and R.Y. Morfta. 1978. Incidence, micro-scopy, and etiology of exoskeleton lesions fn the tanner crab,Chfonoecetes tanneri, J. Fish, Res. Bd. Can. 35:1141-1149.
Bland, C.E. and H.Y. Amerson. 1974. Occurrence and distribution fnfiorth Carolina waters of La enidium callinectes Couch, a fungalparasite of blue cr.ab ova. esapeake YcM~32-235.
Botsford, L.W. and D.E. Wickham. 1975. Correlation of upwellfng in-dex and Dungeness crab catch. U.S. Ffsh. Wildl. Serv. Fish.Bull. 73:901-907.
Botsford, L .W. and D.E. Wi ckham . 1978. Behavfor of age-specffic,denSity-dependent mOdelS and the nOr them CalifOrnia DungeneSS
c ab Cancer~a1ste 1 fishe 3. J. F1sh. Res. ~ 4. can. 33:033-843.
Cipriani ~ G.R., R.S. Wheeler, and R.K. Sfzemore. 1980. Characteri-zation of brown spot disease of Gulf Coast shrfmp. J. lover tebr.P athol . 36:255-263.
Cook, D.W. and S.R. Lofton. 1973. Chftfnocl astic bacteria associ-ated with Shell diSeaSe in PenaeuS Shrimp and the blue Crab. J .Wfldl. Dfs. 9: 154-159,
Cook, H.L. 197 1, Fungi parasitic on shrimp. FAO Aquacult, Bull.3�!:13.
Couch, J.A. 1978. Diseases, parasites, and toxfc responses of com-mercfal penaefd shrfmps of the Gulf of Mexfco and south Atlantfccoasts of North Amerfca. Fish. Bu'll. 76;1-44 .
Couch, J .N . 1942 . A new fungus on crab eggs. J . Elfsha MitchellSci . Soc. 58 .158-162 .
FfSher, W.S. 1976. Relatfonshfp of epfbfotfc fouling and mortalitiesaf eggs nf the Ilangeness crab itance ~niece !. J. Fish. Res.Bd, Can. 33;2849-2853.
Ffsher, W.S. and D.E. Wickham. 1976. Mortalitfes and epfbiotfc foul-ing Of eggS frOm wild pOpulatiOnS Of the DungeneSS Crab, CanCer~na istet. Fish. ga11. 74:201-207
Ffsher W.S., T.R. Rosemark and E.H. Nflson. 1976. The susceptibi-1! ty of cultured American lobsters to a chi tf nolyti c bacterium,Pr.oc. 7th Annu. Meeting Wor.'fd Marfcult. Soc., San Diego, CA, pp.511-520 .
Fisher, W.S,, E.H, Nilson, J,F. Steenbergen, and D.Y. Lightner . 1978.MfCrObfal diSeaSeS Of Cultured 1ObSterS: A reVfew. AquaCulturm14:115-140.
Gopalan ~ U.K. and J.S. Young. 1975. Incidence of shell disease inshrfmp fn the Mew York Bf ght. Mar. Polfut. Bull. 6: 149-153 .
217

Harshbarger, J.C,, S.C. Chang, and S.V. Otto. 1917. Chlamydiae withphages! mycoplasmas and rickettsiae in Chesapeake Bay bivalves.Scf ence. 196: 666-6 t8.
Hawkes, C.R., T.R. Meyers, and T,C, Shirley. In press. Parasftfsm ofthe blue king crab, Paralithodes ~lat ~us Brandt!, by the rhi-cacepbelaa Bvt ~ vosiccuus cd lusus ~ascVmH . 3. lavevcebPathol.
Hess, E . 1937 . A shell disease fn lobsters Homarus amerf canus!c ~sed by cbibi ~ ivo o s bacse ta. 3. Biol. rsS. Bees .~35fl-362.
Hibbits, J. and A.K. Sparks. 1983. Observations on the histopathol-ogy caused by a parasf tfc cf 1 fate Par an~ohrys sp.?! fn the
41:51-56.
Hood, M.A. and S .P . Meyers. 1974 . Distribution of chf tinoclastfcbacteria fn natural estuarine waters and aquarial systems. InR.S. Ambor ski, M,A, Hood and R,R. Miller eds.!, "Proceedingsof Gulf Coast Regional Symposium on Diseases of Aquatic Animalsupp, 115-121. Publ. No. LSD-SG74-05, Louisiana State University,Baton Rouge, LA.
Johnson, P .T . 1983 . Diseases caused by vfr uses, rfckettsfae, bacterf aand fungi. In A.J . Provenzano Jr . ed! "Pathobiologym pp. 1-78 .The Biology Wo Crlrstacea, Vol. 6, Academfc Press, NV.
Johnson, P.T. 1984. A rfckettsia of the blue king crab, Paralfthodes~la ypus. J . Inver tebr . Pathol . 44;112 -113 .
Johnson, T.W., Jr. and R.R. Bonner, Jr. 1960. La enfdium callfnectesCouch in bar nacle ova. J . Eli sha Mitchell c . oc . 7�:T4 r-~
Lightner, O .V . 1976 . Epizootiology of two mycoti c dfseases f n the cul-turee of penaei 4 shrimp . Proc . 1st Int . Colloq. I nver tebr.Pathol,, Kingston, Ontario, pp 179-183 .
Lightner, D.V. 1977. Larval mycosis of shrimps. In C.J. Sindermann ed.! mDfsease Diagnosis and Control in North American MarineAquaculture, " pp. 36-41. Elsevier, NY .
Lightner, D .V . and C.T . Fontai ne. 1973 . A new fungus disease of thewhfte shrfmp PenaeuS Setfferus. J. Invertebr . Pathol. 22:94-99.
Lightner, O.V. and R.M Redman, 1977, Histochemical demonstration ofmelanin fn cellular fnflammatory processes of penaefd shrimp.J . Inver tebr. Pathol. 30:298-382 .
Lfghtner, D . V. and V .C . Supplee . 1976 . A possfble chemical controlmethod for filamentous gill dfsease. Proc. 7 th Annu. MeetingWorld Maricult. Soc., San Diego, CA, pp 473-479,
Lfghtner, O.V., C.T, Fontafne and K. Hanks. 1975. Some forms of gilldisease fn penaeid shrimp, Proc, 6th Annu. Meeting World Mark-cult. Sec., Seattle, QA, pp 347-365.
218

Malloy, S.C. 1978. Bacteria I nduced shell df sease of lobsters Homarus amerfcanus! J . 'Wildl. Dfs. 14:2-10.
MCKel vey, R ., D. Hankfn, K. Yanqsko and C. Snugg . 19BO . Stable cy-cles in multistage recrui tment models; an applfcatf on to t' heoo ther Callfo la D ge ess c ab Cases ~ma fate l flshe y.Can. J . Fish. Aquat. Sci. 37: 2323-234Y.
Meyers, T.R. 1979. Prelimfnary studies on a Chlamydfal agent fn thedigestive diverticular epithelium of hard clams Mercenariae ceoarl ~ c. f om Great south s y, aau lo b~s. Ills.
~7FT89,
Morado, J.F. and A.K. Sparks. 1983. Infection of nervous tissue ofshrimp, Crangon alaskensis, by trematode metacercariae. J.Invertebr. Pataao1. ~FI -423.
Wilson, E.H., W.S. Ffsher, and R.A. Shl eSer. 1975. Filamentous fn-festatfons obse ved on eggs and larvae of cultured c>ustaceans,Proc. 6 th Annu. Meetf ng 'World Marf cul t. Soc., Seattl e, WA,pp 367-375.
Wilson, E.H., W.S, Ffsher, and R.A. ShleSer. 1976. A new mycosfsof larval lobster Homarus amerfcanus!. J. Invertebr. Pathol.27: 177-183.
Olson, R,E. and C.N. Lannan. 1984. Prevalence of mfcrosporfdfan in-fection in commercfally caught pink shrimp, Pandalus jordanf.J. I nvertebr. Pathol, 43:407-413.
Overstreet, R.M. 1973. Parasftes of some penaeid shr imps with empha-sis on reared hosts. Aquaculture 2:105-140.
Pacific Fishing Yearbook. 1984. Dungeness crab. Pacfffc Ff shingPartnership, Grange Prfntfng.
Pacffic Marine Ffsheries Coassfssfon. 1965. Discuss on following thereport on Dungeness crabs. 16th and 17th Ann. Rpt. Pac. Mar.Ffsh. C mm . pp. 38-39,
Peterson, W.T. 1973. Upwelling fndices and annual catches of Dunge-ness crab, Cancer magfstero along the west coast of the UnitedStates. Fi s~u ~:902-910.
Poisson, R. 1930. Observations sur Ano~hr s sarco ha a Cohn = A.ma ii Cattaneol infusoire holotrT8ie marine e sur son parasT-t sme possible chez certafns crustaces. Bull. Biol. Fr. Belg.64;288-331.
Redfield, G.W. and W.F. Vincent. 1979. Stages of infection and eco-logical effects of a fungal epidemfc on the eggs of a lfmnetfccopepod. Freshwater Bfol. 9;503-510.
Rogers-Talbert, R. 1948. The Fungus La enidfum callfnectes Couch oneggs' ol' th bl c ~ b I Ch sm* ay. ~ . II eHole, Mass!. 95:214-228.
219
Rosen, B. 1970, Shell dfsease of aquatfc crustaceans. In S.F. Snf-eszka ed.!, "A Symposium an Diseases of Fishes and SMe !fishes',pp 409-415. American Fisheries Socfety, Hashfngton, D.C.
Sandoz, M ., R . Rager s and C.L . Nerrcombe. 1944, Fungus infection ofeggs of the blue crab, Calf inectes ~sa f dus Rathbun. Science99:124-125.
Sarryer, V. H., Jr . and C.C. Taylor. 1949 . The effect of shell diseaseon the gill and chftfn of the lobster Hoamrus amerfcanus!.Mal e hept. Sea Shove Pish. Ses. hull. ho. ~pp.
Sfndermann, C.J. 1977. Disease Dfagnosfs and Control in Rorth Amer-ican Marine AquaCulutre. Elsevfer, H.V. 329 pp.
Sindermann, C.J. And A. Rosenfield. 1967. Prfncfpal diseases of com-mercfally fmportant marfne bivalve mallusca and crustacea.Ffsh. Bull. 66:335-385,
Sparks, A.K. 1980. Multfple granulomas fn the midgut of the Dunge-ness c ab, cancer ~mister J.. 1 vetoer, pathol. 33;323-329,
Sparks, A.K. 1982 . Observations on the histopathalogy and probableprogressfon of the disease caused by Trichomaris invadens, aninvasive ascaeycete, 1 the tenne cra~onnoc~ees a rdi.J. Inver.tebr. Pathol. 40:242-254.
Sparks, A.K. and J. Hibbfts. 1979. Black mat syndrome, an fnvasivemycotf c disease of the tanner. crab, Chfonoecetes hair di. J.I nvertebr. P athol . 34'.184-191,
sparks, A.K. and J. Hibbfts. 1981. A trematade metacercarfa encys-ted 1 the ner es of the aungeness c ab, Ca c ~na late .. J.Invertebr. Pathol. 38:88-93.
SparkS, A.K., J. Hibbits and J.C. Fegley. 1982. Observations on thehistopathology of a systemfc ciliate Parano hr s sp.7! diseaseln the Dungeness crab, Cancer ~a later. , nvettel! . Patllol.39:219-228.
Stani er, J . E,, M.A. Ifoodhouse and R.L . Griffin. 1968 . Lf ght andelectron microscope observations an the metacer cari ae of aS elotrema sp. Trematode: Mfcrophallidae! encysted in Carcfnusmaenas. , Invertebr. Patho'l. 10; 169-282 .
Stevens, B.G. and D.A. Armstrong. 1981. Mass mortality of femaleDungeness crab, Cancer magfster, on the sauthern 'Ilashfngtoncoast. Ff sh. Bul~ 949W97,
Storz, J, 1971- Chlamydia and Chlamydfa-Induced Dfseases. C.C. Tha-mes, Sprfngffeld, Illinois. 358 pp,
Stunkard, H.N, 1957. The morphology and life hfstory of the dige-netic trematode, Micr+phallus Sfmflis Jagerskiold, 1900! Baer,loa3. ni 1. o 11. 333!~2sC.
220

Taylor, C.C, 1949. A study of 'lobster she' ll disease with observa-tionss and reconmgendati ons, Iaaine Dept. Sea Shore f i sh. Res.Bull. April 1949, 5 pp.
Hickham, D .B. 1979 . Carcinonemertes errans and the fpuling andoo t Irty of ggs of the On ganesa cyah. Cence arrfste . A.Fish. Res. Bd. Can. 36:1319-1324.
Wild, P.W. 1980. Effects of seawater temperature on spawning, eggdevelopment, hatching success and population fluctuations of thetl ganesa c. O. Cancey~a1ste . CAICOyl ~ pt. 21:112.120.
Young, J .S . and J .B. Pearce. 1975 . Shell disease in crabs and 1 ob-sters from the New York Bight. Mar. Pollut. Bull. 6:101-105.
221


Condition of Dungeness crabs, Cancermagister, at a benthic deposit of
decomposing bark: Physical traumaand reduced reproductive success
Lincoln Freese and Charles E. O'ClairNational Marine Fisheries ServiceAuke Bay, Alaska
Abstract
Loqs harvested in southeastern Alaska are usually rafted to mills andshipping ports. Logs enter the stream at log transfer facilities LTF's! where deposits of decomposing bark accumulate on the bottom,Depths of these deposits range from a few cm to 1 m. Thoughconsidered epibenthic organisms, Dungeness crabs Cancer ma ister!frequently burrow into benthic sediments. Alterations in su stratecomposition or interstitial water chemistry where hark depositsimpinge on crab habitat could cause deleterious changes in residentcrabs. We report here the results of a field study designed todetermine the nature of the responses of adult female Dungeness crabsto marine benthic bark deposits.
We compared crab populations at or near LTF's with those at nearbycontrol sites in six bays in southeastern Alaska. The bays used inthe study included Freshwater Bay and Corner Bay, Chichagof Island;Saook Bay and Appleton Cove, Baranof Island; Rowan Bay, Kuiu Island;and Traitors Cove, Revillagigedo Island. SCUBA divers hand collected787 adult female Dungeness crabs at the study sites in March 1982 Traitors Cove!, April 1982 Corner Bay!, May 1982 Freshwater Bay,Appleton Cove, Saook Bay, and Rowan Bay!, and April 1983 Rowan Bay!.Crabs were generally rare at LTF's and were never seen burrowed intothe bark, except at Rowan Bay. Crabs were common at the Rowan Bay LTFand were often seen burrowed into the bark deposit there. All crabscollected at Rowan Bay were from the bark deposit; all crabs fromother LTF's were collected outside of the bark deposits, at distancesranging from 3 to 300 m.
Immediately after each dive, the reproductive condition ovigerousover non-ovigerous! and the number of missing leg segments were notedfor each crab. The left rear pleopod with attached eggs was then
223

removed from each crab. This sample was used to estimate relativefecundity, egg mortality, and density of Carcinonemertes errans in
eggs.
Concentrations of sulfide and ammonia products of anaerobic organicdecomposition! were measured in interstitial water collected from thebark deposits at LTF's and from sediments at control sites.
Rowan Bay was the only site where crabs were found burrowed into thebark; therefore, Rowan Bay data were treated separately in thestatistical ana'Iyses. Statistical tests included two-way analysis ofvariance ANOVA! and two-way analysis of covariance ANCOUA! fornormally distributed data. Wilcoxon's signed-ranks test was used fordata not meeting the assumptions of AHOVA or ANCOUA. The G-test forindependence was used for binomial data.
Sixty-six percent of the 787 female crabs collected were ovigerous.The percentage of ovigerous crabs at the Rowan Bay LTF wassignificantly G-test; P <0.001! lower than at its control site inboth 1982 and 1983 �0.A vs 85.7% in 1982; 36.4X vs 66.5% in 1983!.At bays other than Rowan Bay, ovigerous crabs always outnumberednon-ovigerous crabs near the LTF's. The percentage of ovigerous crabswas significantly higher near the LTF's at Corner Bay P <0.001!,Freshwater Bay P <0.05!, and Appleton Cove P <0,05! t6in at thecontrol sites. Ho significant differences in the percentage ofovigerous crabs were found between treatments at Traitors Cove orSaook Bay.
ANCOVA factors = treatment X year; covariate = crab width! indicatedsignificant effects due to treatment P <0.001! and year P = 0.001!on relative crab fecundity at Rowan Bay. Fecundity of crabs at theRowan Bay LTF averaged 44'K of that. at the control site. AHCOVA factors = treatment X location; covariate = crab width! with datafrom other study sites failed to show a significant effect due totreatment on fecundity; between bay differences in fecundity weresignificant P = 0.006!.
ANCOVA factors = treatment II year; covariate = egg developmentalstage! showed significant effects due to treatment P = 0,002! andyear P = 0.002! on crab egg mortality, Egg mortality at the RowanBay LT7 averaged twice that at the control site. Egg mortality atLTF's other than the Rowa~ Bay LTF did not differ from the controlsbut did vary significantly ANCOUA; P = 0.001! between bays.
The mean density of C . errans expressed as number of worms plusnumber of worm egg str1 ngs per 1,000 crab eggs! in crab egg clutchesat the Rowan Bay LTF was twice as high as that at the control site inboth 1982 and 1983. The ANCOVA covariate = egg developmental stage!showed a significant P = 0,014! treatment effect on this variable;the effect of year was not significant, Worm density at other sitesdiffered significantly ANCOUA; P = 0.029! between bays but notbetween treatments. Worm density and crab egg mortality were highlycorrelated r = 0.94; P <0.001!.
224

Crabs at the Rowan Hay LTF averaged four more missing leg segmentsthan did control crabs. These differences were significant ANOVA; P<0.05! over four sample periods Nay 1982, July 1982, November 1982,and April 1983!. No consistent pattern of differences was observed atthe other study sites.
Significantly higher levels of sulfide Wi lcoxon's signed-ranks test;P <0.05! and ammonia ANOVA; P <0.05! were found in interstitial waterat LTF's than in interstitial water in control sediments. Differencesin sulfide concentrations between LTF 's and controls ranged from 1. 1 Xhi gher Saook Bay ! to 37.7 X higher Appl eton Cove! . Differences inamnonia concentrations between LTF's and controls ranged from 1.05 Xhigher Saook Hay! to 8.2 X higher Appleton Cove!,
Comparison of crab populations at the LTF vs control site at Rowan Bayindicate that LTF's can alter the benthic substrate in such a way asto cause somatic and reproductive abnormalities in Dungeness crabs.The most likely effect of LTF ' s on Dungeness crabs is the localizedobliteration of suitable benthic habitat. Dv i gerous crabs burrowdeeply into sediments, probably to protect themselves or their eggsfrom predators. Crabs that burrow into coarse woody debris tooviposit as observed at Rowan Hay! could lose eggs, beforecementation of eggs to the setae is complete, because of largeinterstices betwee~ individual pieces of woody substrate,
Chemical changes associated with the decomposing bark, rather thantextural changes, are more likely to have caused the reproductiveabnormalities in the crabs at the Rowan Hay LTF. Levels of productsof anaerobic organic decomposi tion sulfide and armnonia ! in the barkdeposit at the Rowan Bay LTF were higher than those found in controlsediments. These toxic compounds may have directly or indirectlycaused the reproductive abnormalities.
225


Responses of Dungeness crabs, Cancermagister, exposed to bark debris from
benthic deposits at log transferfacilities: Survival, feeding, and
reproduction
Charles E. O'Clair and Lincoln FreeseNational Marine Fisheries ServiceAUke Bay, Alaska
Abstract
Dungeness crabs associated with the benthic bark deposit at. a logtransfer facility LTF! in Rowa~ Bay, Kui u Is 1 and, Alaska, have shownsomatic and reproductive abnormalities. Crabs in other bays insoutheastern Alaska which contai n LTF's appear to avoi d bark deposits Freese and O'Clair, this volume!. We attempted to determine whetherbark from other LTF's in southeastern Alaska could also causedeleterious changes in Dungeness crabs with a 9D-day laboratoryexperiment in which recently molted female crabs were exposed to barksubstrates, Dur main objective was to determine the success of eggextrusion of the crabs on bark substrates, but we also studied otheraspects of reproduction, surviva 1, and feeding,
Crabs were hand collected at two sites without bark deposits Freshwater Bay, Chichagof Island; and Saint James Bay ! in Alaska .Bark debris was collected at two active Rowan Bay; Kennel Creek,Chichagof Island! and two i~active Corner Bay, Chichagof Island;Appleton Cove, Baranof Island! LTF's, Crabs were randomly placed inliving stream tanks inside dimensions, 208 cm x 54 cm x 56 cm; IOcrabs/tank!, the bottom of which was covered with 10 cm of bark orclean sand control tank!. The crabs were held in flowing seawater inthe treatment tanks throughout the experi ment. Each treatment was runin triplicate. Temperature, salinity, dissolved oxygen, pH, andturbidity were measured in the water above the substrate in each tank.Concentrations of ammonia and sulfide were measured above and in theinterstitial water below the surface of the substrate. Statisticaltests were the G-test of independence for binomial data, theKruskal-Wallis test for data not meeting the assumptions of theanalysis of covariance ANCOVA!, and one-way ANCOVA with crab width asthe covariate for normally distributed data, Scheffd's test was usedfor a tract ia i caaaa iaaaa.
227

The concentration of sulfide in the interstitial water of the bark inthree of the four bar k treatments was significantly greater �1-64times greater than control concent rat i on s; Kru s ka1 -Wa 1 1 i s test, P�.001! than that in the control sand, There was no difference ininterstitial sulfide concentrations between the Corner Bay treatmentand the control. The bark in the Corner Bay treatmentcontained mor e 1 arge pieces and fewer fines creating largerinterstices between particles and probably promoting faster diffusionof sulfide into the overlying water. Because crabs are armonatel ic,the concentration of ammonia in the control sand as well as that inthe bark treatments increased rapidly, The concentrations of atmnoniain the interstitial water of the bark from Rowan Bay exceeded iwicethe control concentrations! thai in the sand substrate of the controltanks Kruskal-Wall is test, P �.005!, but concentrations of ammoniain the interstitial water of the other bark treatments were similar tothose in the control tanks.
Crabs exposed to bark from the Appleton Cove LTF had 10 times greatermortality than did control crabs G-test, P=0,004!. Iiortality ofcrabs in the other bark treatments was not significantly differentfrom the control crabs P x0.05!.
:rabs were fed clean squid mantles replenished daily. Feeding rates g squid/crab/hr ! were measured every other day . Feeding ratesgenerally declined in the first half of the experiment during whichtime the rates of control crabs were similar to those of crabs in thebark treatments ANCOVA, P >0.05!. However, in the second half of theexperiment, rates tended to stabilize at which time feeding rates ofcontrol crabs exceeded those in the bark treatments ANCOYA, P<0.001!, The difference in rates was attributed to the Appleton Covetreatment where feeding rate was reduced ta less than half of thecontrol crabs scheffe's test, P �.01!.
Fecundity was estimated by calculating the mean individual egg weightfrom samples of 300 egqs taken fram each crab and dried at 70 C! io aconstant weight. The number of eggs in each clutch was estimated bydividing the mean individual egg weight into the total dry weight ofthe clutch. Forty-ni ne of the 150 exper i menta 1 animals extruded eggs .The proportion of crabs extruding eggs was similar between treatrents G-test, P=O. 19! averaging 40%. However, the egg clutches of thosecrabs in the Rowan Bay and Corner Bay treatments were significantly�cheffe's test, P <0.001! smaller �7%%d and 35K, respectively, of thecontrol fecundityT than were those of the control crabs.
Ovarian indices were determined for crabs which did not extrude eggsduring the experiment. The ovaries were removed from these crabs anddried at 80'C! to a constant weight. Total tissue weight excludingthe ovaries was determined by drying at 80'C! and weighinq the crab without ovaries!, digesting the crab tissue in 10$ potassiumhydroxide, and then drying the remaining shell ta a constant weight.Tissue dry weight was obtained by subiractina shell dry weight fromcrab dry weight excluding ovaries! before digestian, The quotientresulting from ihe division of ovary dry weight by total tissue dryweight excluding avavies! was multiplied by 100 io obtain the ovarianindex. There was na difference between the ovarian indices of crabsin the bark treatments compared with control crabs ANOVA, P >0.05'J.
228

We conclude that Dungeness crabs exposed to bark from LTF's other thanRowan Say can suffer reduced survival, inhibited feeding, and reducedfecundity. The deleterious effects are not necessarily induced byrecently deposited bark alone. The Appleton Cove LTF had beeninactive for 17 years prior to the time we collected bark there forthe experiment. Dur results indicate that Dungeness crabs burrowedinto bark can extrude smaller clutches than crabs in naturalsubstrates, but that exposures of three months are not sufficient tocause obvious changes in ovarian condition. Sulfide appears to pIay amore important role than ammonia in contributing to the deleteriouschanges in crabs. However, the synergistic effects of highconcentrations of sulfide and armenia and other factors not measuredin this study such as large populations of anaerobic bacteria in theinterstitial water should be considered in future studies of theeffects of large accumulations of decomposing organic material onDungeness crabs,
229


A recent history of the Orca Inlet,Prince William Sound Dungeness crab
fishery with specific reference to seaotter predation
Al KimkerAlaska Department of Fish and CarneCordova, Alaska
INTRODUCTION
Orca Inlet is located in Prir ce William Sound adjacent to the communityof Cordova in the north Gulf of Alaska Figure 1!. Water depths rangefrom intertidal bars to approximately 30 fathoms i n Nelson Bay . Nostof the Inlet is less than 5 fathoms in depth including some of the mainchannels� . Orca Inlet is approximately 20 miles long and 2 miles wide .
Historically Orca Inlet has contributed a significant poundage ofg g ess hs C ~ ~cist te th ti i fishe y i thePrince William Souncnu4anagement Area Table 1!. It has also providedcrabs for subsistence use by the residents of the Cordova area.
A decline in abundance of crabs became noticeab'te within a few yearsafter the 1964 earthquake, which caused a major uplift of 6 to 7 feetin Orca Inlet. This resulted in loss of habitat for both the Dungenesscrab and one of its dominant prey species, the razor clam Siliquapatula!. The crab population began to stabilize, external ~o normalfluctuations in abundance, in the early 1970's. The second decline inabundance, which began in 1979, correlates with the arrival of a largenumber of sea otters Enhydra lutris! in the area Garshelis 1983!.This was followed by three yea~rs o no fishing due to lack of abundanceas identified by the Department's test fishing program,
The Department has conducted annual test fishing for Dungeness crabsince 1977 for two reasons; to estimate abundance of legal males �.5inches, 165 mm, in carapace width! for commercial harvest, and toascertain whether or not the shell condition of the crabs is sufficientlyhard to wa 'rant openi ng the commercial fi shery . If the cra bs are in asoftshell condition, the test fishing continues periodically untilresults of the shell condition sampling justify a fishery.
231

figure 1. Prince uffliau Sauna. Guar ui 41aaaa.
232

Table
Year
333;69678,22378,848
437,865458,613290,149654,410254,933506,751
878,696738,634509,824724,673806,377559,164818,041290,332735,609
323
Ul!u!nm!
NorthernDistrict
PoundsCopper River ~ Orca In'I et
Pounds !a' PoundsTotalCatchYear
1,319,451504,770659,667
1,503,574757,911379,094826,788
19781979E 98019819298292 9831984
121910 No18 No16 No9 No
10 No
684,439123,245fishingfishingfishingfishingfishing
3432
49,571 1720,924 1631,152 55;683 54,221 2
511 2150
2,053,461652,924'690,819
1,509,257762,132379,605826,938'
'Includes 3,985 pounds taken incidentally during the calendar year 1979portion of the 1978-79 Tanner crab season.
'Preliminary� .
233
19601961196219631964196519661967'I 9681 96919701971197219731974197519761977
Prince William Sound Area Dungeness crab catch, 1960-84,
Copper River Orca Inlet Total CatchPounds Vessels Pounds Vessels Pounds
1,524,326990,242
1,353,1901,21 6,846l90!9291,240,372
999,34'INo dar.a available
579,279541,822660,41I430,976286,808347,764269,0151 63,63I35,399
228,858

METHODS
Six stations, chosen systematically withi n the Orca Inlet a rea, wereutilized for the annual test, fishing program. A systematic approachwas used in selecting the sites due to the very shallow waters of OrcaInlet and the resultant limitations put on the Department's researcher 1 ~Mo ta ~e
Five coremercial type Oungeness crab pots were spaced in line 0.25 milesapart at each station. The two 4 3/8 inch escape rings were closed oneach pot to allow for greater chance of retention of small crabs, Eachpot contained one balt box filled with chopped herring. The soak timewas 24 hours.
All crabs caught were sexed, shell aged, and the cara pace width wasmeasured to the nearest millimeter . Egg bearf ng condition of allfemales was recorded . Other fi sh and crabs captured wer e noted . Allhalibut were measured to the nearest centimeter, and condition of allgroundfi sh including halibut was recorded .
This year the survey was conducted on August 21 and 22. The survey isnormally conducted in Latter August, as this gives the most timelyresults relative to the earliest possible regulatory opening date forthe commercial fishery, which is September 1.
RESULTS
A total of 321 crabs, consisting of two legal males, 239 sublegal males,and 80 females' were caught fn 29 pot lifts. As only two legal maleswere caught, the number of legal s caught in the index remained at theextremely low level of O,O7/pot Table 2!. The average number of pre-recruits declined from 4.8 in 1983 to 2.0 in 1984; however, the malessmaller than pre-recruits less than 140 mm! increased from 2,9 to6.2/pot. The average number of females caught per pot increased from0.5 in 1983 to 2.8 in 1984. This gain was due to the large number offemales caught in the Mud Bay station. The overall catch per pot ofall crabs increased from 8.2 ro 11.1. The gain was due to the inc reasein small females and small males caught in the Mud 8ay station. Catchby individual station varied trom a high of 36,4 total crabs/pot in MudBay to a low of 0.4 crabs/pot at Shepard Point Table 3!,
Thirty nine percent of the maL es captured were soft shel 1 ed . Forty sixpercent of the females were in a soft shelled condition. None of the80 females captured were bearing eggs. Of the two Legal males taken,one was a newshell and one was an oldshell. Of the females, 37 weresoft, shells, 39 were newshells ~ 3 were oldsheiis and 1 was very old.The size of the two legal males was 1 65 and 1 67 mm, whf le the averagesize of the females was LLL mm. The average width of the 58 pre-recru i ts 1 40-1 64 avn! was 149 mm, while the average width of those 1 81males Less than 1 40 mm was 1 1 9 mm . The smallest male captured was 72nvn and the smallest female was 91 mm.
Ten halibut Hf o lossus stenole is! were caught, two of which weredead. This was ent ca to t e num er of ha'Libut caught in 1983, butwas a decline in number of halibut from the 1980, 1981 and 1982 levelsof 29, 23, and 17 respectively. The average size of the halibut caught
234

Table 2. Results of the annual Orca Inlet Oungeness crab surveys,I 977-84.
TotalAvg. No. Avg. No, Avg.pre- ' Others Avg. No. No. No. ComsercialRecruits/ Males/ Females/ Crab/ Pots CatchPot Pot Pot Pot Pull ed �bs. !
1977 11 9 5 7 0 01 3 41978 27.8 2,7 0.3 3.01979 7,Z 10.7 0,6 4.61980 3,0 4.1 0.1 0.5198I 1 l 25 02 071982 0. 03 0.8 1,1 0. 71983 0,03 4.8 2.9 0.51984 0.07 Z.IQ 6.2 2.8
' I egal males are equal to or greater than 6,5 inches �65 nvs! incarapace width.
' Pre-recruits are males greater than or equal to 5 .5 inches 1 40 nm !and less than 6.5 inches �65 sva! in carapace width.
' Others are males less than 5.5 inr,hes �40 nsn! in carapace width,
235
Avg. No.Legal'Males/Pot Index
Yea ~Nbe
21.033,323,06.54.52.78.2
11,1
29 228,85827 684,43930 123,24529 No fishing30 No fishing29 No fishing29 No fishing29 No fishing

Table 3. Results of the 1984 Orca Inlet Dungeness crab survey bystation.
Avg. No. Avg. No. TotalPre- ' Other' Avg. No. Avg. No.Ilecrui ts/Pot Males/Pot Females/Pot Crab/Pot4
Avg. No.Legal'Hales/PotStation
6.2 2.80,07 2.0Total
Legal males are equal to or greater than 6.5 inches �65 mm! incarapace width,
Pre-recruits are ma 1 es greater than or equal to 5 . 5 i nches � 40 mm !and less than 6.5 inches �65 mm! in carapace width.
Others are males less than 5,5 inches �40 mm! in carapace width.
' 5 pots were pulled for each station except in Deep Bay where 4 potswere pulled one was lost!,
236
3 Mile BayMud BayGrass IslandDeep BayShepard ' Pointlew England
0000,300.2
0.40.21,0
10.00.51,8
0.423.09.62.80.00,8
0.013.21.02.30.00.0
0.836.411,615.30.42.8

was 463 mm with a range of 420-610 mm. Pot tunnel size restrictsentry of larger halibut, which do exist in the Inlet.
Incidental catch of other fish included 59 ye11owfin sole Limandaaspera!, four starry flounder Platichthys stel'latus! and two rocVsoSSe Lepidapsetta bilineata!.
A Linear regression analysis was run on the index number x! and thecommerciaL rrab catch y! for the years 1977-79 y = 12,068x - 24,070and r = .99!. The commercial catch figures, which are in pounds, wereconverted to crabs . The regression values are in number of crabs,
Applying the l 984 index number af 0 . 07 cra b per pat to the regressionequation yields an estimated harvest of -23,225 crabs with a 95 percentconfidence interval of -51,781 crabs to 5,331 crabs. The confidenceinterval for the regression coeffi ci ent slope� ! at the 95 per centleve'I is 1 0,465 crabs to 1 3, 671 crabs .
D ISCOSS ION
As was the case for the past three years, the 1 984 estimated abundanceof crabs did not warrant the openi ng of either the commerciaL or sub-sistencee fi sheri es in Orca Inlet . Although the regression analysisestimated an unlikely negative quantity of crabs for a 1984 harvest,the data sufficiently shows a very 'linear relationship between theindex numbers and commercial harvests. Even with the regressionresults as they are, a downward trend in abundance is clearly evident.
The severe reduction in abundance of the Orca Inlet Dungeness crab isexplained by the arrival of the sea otter in Orca Inlet in 1979 Ga rshel is 1 983 ! . Ga rshel is ci tes numerous publications which documentthe impact on shellfish populations which have declined due to otterpredation . Garsheli s ' s own observations in 1 980 and 1 981 of the ottersin hlelson Bay, in the northern portion of Orca Inlet, yielded an annualconsumption estimate by sea otters of 370,000 Dungeness crabs. Throughdirect observation Gar sheli s observed that sea otters were capable ofeati ng 1 4 Dungeness crabs per day in the lgelson Bay portion of OrcaInlet.
In 1983 the number of sublegal crabs caught increased fourfold overthe number captured in 1982 Table 2!. Taken at face value this in-crease may be construed as the beginning of a recovery in Orca Inlet.These sublegal crabs move into the desirable habitat of Orca Inlet fromthe deeper waters of Orca Bay. This movement occurs during the summermonths after the spring mo'lt. Summer vessel traffic reduces the numbersof sea otters in much of the area occupied by Dungeness and the indexstations in Orca Inlet; therefore reducing summer predation in portionsof the Inlet Garshelis 1983!. However, as the vessel traffic issignificantly r educed in the fa1 1 due to the end of commercial salmonfishing, the otters once again disburse throughout the Inlet forfeeding purposes. Based on Garshelis's previously mentioned feedingobservations, it appeared improbable that the 1983 sublegal Dungenesswould have survived ta become legal sized in 1 984, This is preciselyWhat occurred. Survival of the pre-recruits as meaSured ay the 4.8i ndex number in 1 983 was 0. 07, the legal index number in 1 984 Table 2 ! .
237

Figure 2 a and 2b show histograms of the size frequencies of all malescaptured in the 19B3 and 1984 indices respectively. The large yearclass of pre-recruits in 19B3 under normal cooditfons would haveyielded a significant amount of legal crab fn 1984: the figuresgraphically illustrate that this was not the case.
The Drca Inlet Dungeness Fishery will remain closed to commercial andsubsistence ffshing until the abundance of legal males shows a signif-icant increase coupled with a stabilization in a bundance of the sub-legals and females. Both David Garshelis and the author believe thissituation is an unlfkely occurrence without a major change in the otterpopulation. Garshelfs and the author believe that the Brea InletDungeness crab population is at such a depressed state that even if thecurrent atter population in the Inlet was reduced by nearly 100 percent,the Dungeness would not recover as continued recrui tment of otters intothe Inlet wou'ld be sufficient to keep the crab population at a depressedlevel.
Sirree arrival of the sea otter fn Drca Inlet, the Deep Bay station hasusually had the largest annual index number Table 4!. This yearhowever, Deep Bay was second to Mud Bay in total crab number as MudBay had an unusually large amount of small females and males below thepre-recruit size Table 3!. Deep Bay has maintained an of the highestannual index catches due to frmoigration into Dree Inlet by newly moltedcrabs from the deeper waters of Orca Bay which is immediately adjacentto Deep Bay Figure 1!. The presence of a relatively large amount ofsublegal Dungeness crabs in Drca Bay was documented in 1983 and to alesser extent in 1984 by the Prince William Sound Tanner crab surveys.The Dungeness are protected from otter predation in Or ca Bay as mostof the bay is deeper than the 97 meter �18 feet! maximum depth atwhich an otter has been found Wewby 1975!,
Irrvefgratfon of relatively large numbers of crabs into Orca Inlet fromOrca Bay is symptomatic of strong year classes fn Dr ca Bay. Thesestrong year classes cannot last. In fact, that part of the 1984 Tannercrab survey conducted in Orca Bay showed a decline in Dungeness catchfrom 1983. Once the available food supply in Orca Inlet diminishesthe otters will move elsewhere in scarc'h of food. The likely area ofimmigration would be the Copper River/Kayak Island area Figure 1 !where there currently fs a large population of Dungeness crabs Table 1!and razor clams. In the Aleut',ans a similar situation occurred whereotters emigrated to sparsely populated islands with abundant food Kenyon 1969!. The emigration out af Drca Inlet to the Capper River/Kayak Island area is already occurring according to observatfons bycommercial fishermen, the author, and an otter count by the U.S.Fish aod Wildlife Service fn August of 1983 Schmidt 1983!,
In surmMtfon, Garshelis �983!, Julius Reynolds ADFBG Area GameBiologist!, and the author believe that the commercial Dungeness crabfishery in Orca Inlet is unlikely to be resumed in the near future.Management of sea otter may be necessary arrd should focus upon thepending conflict in the Copper River/Kayak Island area .
238

40
30
10
90 110 12 0 130 140 150 160 1 '7 0104 114
Size in 5 mm groups
Figure 2a, Size frequency d i stri bution of male Dungeness crabs caughtin the 1983 Orca Inlet Index.
40
10
15 0 3. '70100 11 0 120 130 140 1509094 104 114
Size ih 5 mm groups
Figure 2b. Size frequency distribution of male Dungeness crabs caughtin the 1984 Orca Inlet Index,
239
07473-0-
n = 222 malesAvg. width 142 mm
124 134 144 154 164 174
n = 241 malesAvg. width = 127 mm
124 130 144 154 164 174

Table 4, Total crab' index values, Qrca Inlet Dungeness crab survey,1977-84.
Survey Tear
1977 1 978 1979 1980 1 981 I982 1 983 1984Station
Total 21.0 33.3 23.0 6.5 4.5 2.7 8.2 11.1
' Total crabs including both sexes and all sizes.
240
3 Mile BayMud BayGrass IslandDeep BayShepard PointNew England
'I9.0 27,019.0 27,530.8 3'1.620,8 32.617,8 45.620.2 32.0
29.1 23.414.0 2.821,4 1.631.3 4.618.0 4.822,6 8.4
3.40.82.6
15.00.64.4
1,80,40.29,02.61,8
8.6 0.80.6 36.46.4 11.6
20,6 15.33.0 0.4
'10.2 2.8

LITERATURE CITED
Garshelis, D. L. 1983. Ecology of the Sea Otters in Prince WilliamSound, Alaska� . Ph . D. Diss ., Univ . of Minnesota, Minneapolis, Minn,321 pp,
Kenyon, K. W. 1969. The sea otter in the eastern pacific Ocean,N. Am. Fauna 68. 352 pp,
Newby, T . C. 1 975 . A sea otter ~Enh dra 1 utri s ! food dive record� .Mu rrelet 56;7,
Schmidt, W. T. 'l983. Aerial survey of sea otters in the Cordovav i ci nity, U,S . Fish and Wildlife Service, unpu bl . rep. 5 p.
241


Session IV
Population Dynamics


Dynamics of Dungeness crab, Cancermagister, larvae off central and
northern California
Paul N. ReillyCalifornia Department of Fish and GameMenlo Park, California
INTRODUCTIONThe Dungeness crab, Cancer ma//srer, passes through five zoeal stages and
one mega opal stage after hatching from eggs carried on the abdominal pleopodsof the lernale Figure 25!. A pre-zoeal stage of approximately 10 to 15 minduration has been obsecved in the laboratory and, although it has not beencollected in the field, is considered a normal developmental stage MacKayi 934; Buchanan and Millernan 1969!, The zoeae are entirely planktonic. Themega ops, the final larval stage, is planktonic until settling to the bottom andmolting to the first post-larval instar. The larval stages range in length tip ofrostral spine to und of telson! from approximately 2.5 mrn for stage I zoeae to11.0 rom for megalopae Poole 1966!.
Several field studies report on the occurrence of Dungeness crab larvae,Vanous observations in the Gulf of the Faraliones off San Francisco are recordedin California Department of Fish and Game researc h cruise reports between 1956and 1970. Dungeness crab larvae were recorded at a Gulf station during apreafesign study on marine waste disposal Brown and Cakfwe l 1973!, Wick-hain �979b! collected megalopae in plankton tows and on the hydroid Ve/e//ave/e//a in ocean waters near Bodega Head, California. Lough �974 and 1976!found a!I zoeal stages and megalopae in Oregon waters in 1970 and 'I 971 Mayer�973! reported the occurrence of mega!apse in Similk Bay, Washing on, Onthe east coast, Sandifer �973 and 1975!, in a study of decapod crustaceanlarvae in and near Chesapeake Bay, reported on the occurrence of rock crab,C. irroratus, larvae and discussed transport and recruitment of larval stocks.hievertheless, Dvngeness crab larval dynamics and li/e history were not wellunderstood when we began our study.
The purpose of our study was to investigate Dungeness crab larval life historyand relate field observations of distribution, relative abvndance, and behaviorto possible mechanisms associated with the decline and continued low level ofthe crab resource in central California. Our studies were conducted from 1975to 1980.
MH HODOLOCYWe initiated our larval sampling having limited past experience with methods
and equipment necessary to achieve our objective. As a result, we frequentlyaltered procedvres during the study after considering factors such as efficient useof vessel time, experimental gear, probable larval stages we would encounterduring a cruise, and knowledge gained from previous cruises.
This article «as reprinted from Lira History, Erivironaent, and Maricultura Studtes ofthe Due9ahess Crab, Caocar ~He istar, With Emphasis on the Centre'! California FisheryResource. Fish Bot I~et o 1~3. Edited by Paul W. wild and Robert M. Taste.'Marina Resources Brooch, California Department of Fish and Gama.
245

ftCIIRE ZS Zonal stages I-V rmf mqplopa of the Dungeness crab; A. Zoeal stage I, g. Zonalstage It... from Peale tgtg!.
246

Field Samplingln 1975, the majarity of ovr plankton sampling in the Gulf Figure 11! consist-
ed of horizontal, discret~th rows at the surface and at depths of 5, 15, and25 m where possible! using a 0.5-rn diameter, 0,505-rnm mesh plankton netwith opening and closing capabilities. Several bottarn ta surface oblique towswere conducted at shallow stations less than 15 m! with a 0.5-rn, 0.343-mmmesh net. This same net was used for all surface and oblique tows in SanFrancisco-San Pablo Bay Figure '! that year. Fram December 1975, we rou-tinely included one oblique tow at each plankton station.
A series af I-day cruises was conducted in the Gutf and the Bay using the0.3a3-mm meSh net frOm DeCember 1975 tO March 1976. After theSe Cruises,we discontinued sampling with this mesh size because of problems with cloggingduring a phytoplankton bloom in the Gulf. The 0 505-inm mesh proved adequatefor retaining stage I zaeae. During major cruises in March and April-May 1976,one oblique and four discrete-depth tows were conducted at each Cuff station.For the May-June cruise of that year, plankton sampling at Gulf stations wasreduced to surface and oblique tows to allow for trawling operations at a timewhen we expected to find early post-larval instars,
During a major cruise in January-February 1977, sampling procedures weresimilar to the previous spring. However, 97 of 137 discretezfepth tows in the Gulfw'ere made with a 12-inch �.305-rn! diameter, 0,505-mm mesh, opening-clos-ing Clarke-Bvmpus sampler which was equipped with a flowmeter ta measurethe volume of water filtered. The small mouth diameter and high flow imped-ance at normal towing speed approximately 2 knots! made its use impractical,particv !arly at offshore stations where brac hyvran larval densities were low. Thissampler was no longer used after a 3-day cruise in rnid-March when we beganto vse digital Aawmeters anached to the 0,5-m opening-closing and other 0,5-rndiameter, 0.505-mm mesh nets. Prior to the use of flowrneters, volume of waterfiltered had been calculated using towing speed of the vessel, duration of tow,and area of the mouth of the net.
In January !977, we began conduCting some plankton tawS at night tO investi.gate vertical migration of Dungeness crab larvae. In April 1977, 12 stations weresampled once during the day and once at night to compare day versus nightcatches of rnegalopae in surface and oblique taws. All surface and oblique tawswere conducted with the 0.5-m, 0,505-rnrn mesh net during this cruise, For 6aywork in May 1977, we attached a 0.5-m diameter, 1.0-rnrn mesh net to a towingsled Figure 26! to sample plankton within 1 m of the bottom. This larger meshsize retained all Dungeness crab larval stages except possibly stage I zoeae.However, we used it only when we expected to find late-stage IV and V ! zoeaeand megalopae.
Our sampling routine for early-stage zaeae during the January 1978 cruise wassimilar to previous years, although many oblique and discrete-depth tows in theGulf were conducted at night to determine venical distribution af stage I zoeae.We also made replicate taws at three stations to estimate sampling variabilityof stage I densities. A I-day, eight-station transect fram the Golden Gate ta theFeral!on Islands was sampled three times from December 1977 to February 1978during the !978 larval season, On major crvises in March and Apri978, bottomtows were made with the sled to determine if late-stage zoeae were associatedwith the ocean bottom. Routine oblique and discrete-depth taws also wereconducted during the spring cruises.
247

Ftqt/gk 26, Towing sled and nel used to sample plankton at ocean bottom, photo by paulW. Wild.
We completed three transects to the Farallon Islands between December 1978and March 1979, the last on a chartered commercial salmon troller. In 1979, weconcenu ated our efforts on late-stage zoeae and megalopae. During the March20-29 cruise aboard the R/V OCONOSTOTA, chartered from Moss LandingMarine Laboratories, we extended our sampling out of the principal study areanorth to Cape Mendocino and to 18S km from shore {Figure 16!. We madeoblique tows with the 1.0-mm mesh net to 100-m depth or the bottom ats!ta!!ower stations. Discrete-depth plankton samples were taken at selected sta-tions. The April-May 1979 cruise in the Gulf and Bodega Bay area IFigure l7!consisted of surface and oblique taws with the 1.0-mm mesh net.
As we determined the minor importance of the Bay relative to Dungeness crablarval dynamics, we reduced our effort there. We conducted 65 Bay planktontows in 1975, 77 in 1976, SO in 1977, 29 in 1978, 23 in 1979, and 0 in 1980.
Limited sampling during the 1980 larval period began with three transects tothe Farallon Islands between late December 1979 and late January 1980, all ofthese aboard a chartered commercial crab boat. In early April, we chartered acommercial salmon troller from Fort Bragg IFigure 18! and the R/1/ CAYUSEfrom Moss 'Landing Marine Laboratories to obtain additional data on the distribu-tion of megalopae in northern and central California. Sucface and oblique towswere conducted with the 1.0-mm mesh net, and discrete-depth tows with theopening-closing net were made in the Bodega Bay area.
We obtained additional data on distribution and abundance of larvae innorthern California Figure 1S! by sampling along transects off Eureka in Febru-ary and April 1977, March 1978, March 1979, and January 1980.
248

We occasionally used methods other than plankton tows to sample rnegalo-pae. In June 1977, April 1978, April � May 1979, and April 19&0, we dipnetted V.ve/e//a from ocean surlace waters to examine for presence of rnegalopae, Wealso dipnetted megalopae which were attracted to a nightlight suspended overthe water from our anchored vessel at various Gulf locations during our April-May 1979 cruise.
All plankton samples were preserved in I y% buffered formalin upon cogec-tion. The following data were recorded for each sample: date; cruise, station, andaccession numbers; station depth; tow type horizontal or oblique!, time, depth,and duration; and volume of water filtered. We calculated tow depth aftermeasuring wire angle and amount of wire out,
Laboratory Operations
Cruise Samp/esPlankton samples were returned from the field to the Men a Park laboratory
where they were inspected and settled volume was measured. We used aFolsom wheel to split samples in whic h brac hyuran densities were high general-ly those samples collected in the Bay and at nearshore coastal stations! or thosein which the settled volume exceeded 200 rnl. A series of 2-ml aliquots, takenwith a Stempel pipette, was analyzed if densities remained high after splitting.We examined the entire sample, or all of one of the split portions, with abinocular microscope. Brachyurans were removed, identified to family or, forCancer larvae, to species and stage, and enumerated. Densities of brachyurans no./rn' of water filtered! were recorded on standardized computer formswhich were keypunched and stored. Selected inorphological measurements ofall Cancer larval stages were recorded. Larvae were identified by using publishedand unpublished manuscripts and samples of larvae cuitured at the Depart-ment's Marine Culture Laboratory near Monterey.
Ca/COF/ Samp/esCaICOFI California Cooperative Oceanic Fisheries Investigations! cruises
have collected plankton samples off the California and Baja California coastssince 1949. These samples are curated by Scripps Institution of Oceanography,La Jolla, California. We examined samples taken between 1949 and 1979 alongtransects perpendicular to the coastline between the Oregon border and Pt.Santa Cruz and to approximately 320 km seaward Figure 27!. Fto samples werecollected north of Pt. Santa Cruz in 1955, 1957, 1967, 1970, 1971, 1973, and 1974,Only in ' 949, 1950, 1958, and 1960 were samples collected north of Pt. Reyes.We analyzed samples taken from january to early May for presence of brachyu-ran larvae, The number of samples examined from any one year ranged from6 to 74. Although spaced widely in distance and time, they provided somehistorical data on occurrence and distribution of Dungeness crab larvae offCalifornia. Data recorded for each sample included the following: date; cruiseand station number, station depth and distance from shore; time, depth, andduration of tow; and volume of water filtered. Brachyuran larvae were identifiedand enumerated by the methods discussed previously.
249

FIGVRt lr. Cenlrst and northern California CatCOFt Itsttwe, taaa-tarS,
RESULTSFrom April 1975 through April 1980, we collected 1,914 plankton samples;
1,670 were from ocean stations and 244 from Bay stations. Routinely recordedplankton station data are summarized in Appendices IV and V. In addition, weexamined 404 CalCOI:I samples, all from ocean stations. Our samples yielded11,560 Dungeness crab larvae and 1,91 0 were found in CalCOfl samples Table5!; only two zoeae and 97 rnegalopae carne from Bay stations.
250

Table S, Numbme of Dungenem Crab Latuae by Stage Cegeetmf bom gtogrem amt CalCOylSamfatae
Timing Of Larval OCCurrenCeSThe initial appearance of Dungeness crab larvae by stage in our studies and
Ca COF I samples ranged from mid-December for stage I zoeae to early Marchfor megalopae Table 6!. Mel Willis Calif. Dep. fish and Game, unpublisheddata! found stage I zoeae in the Gulf in late November 1969. We found stageI zoeae at low densities as late as mk -May.TARLE S, Range amf Eargeat Date of rbat Oueerreeeea of Dungeness Crab Larval Stages in
~ rogram aed Calcosl saregler.
We found ovigerous egg brooding! female Dungeness crabs in the Culf asearly as late September, although most apparently spawn during October andearly November; most of the larvae hatch by late lanuary. We estimated timeof hatching from changes in density of stage I zoeae and time of First occurrenceof stage II zoeae or, as in 1975 and 1977, we inferred it from first occurrencesof late-stage zoeae. Onset of hatching was early when Gulf water temperaturesduring late fall and early winter were warm and later when they were cool.Each year here was apparently one peak hatching period in the Gulf of 1 to 2weeks duration Table 7! although a small amount of hatching occurred earlierand or! extended well into the spring.
The !anuary 6, 1978 appearance of a stage II I zoea occurred in the same larvalperiod in which we found stage I zoeae on December 12, 1977 Table 6!, Wedid not sample between these dates, but some stage II zoeae most likely werepresent in late December that year.
gated on the first appearance of post-iarval crabs each spring in the study area Tasto, Chapter 9!, I estimate the length of the larval period time for develop-ment of individual larvae! in central California to be approximately 105 to 125days; approximately 80-95 days are required to complete the five zoeal stagesand the remaining 25-30 days are spent in the megalopal stage,
251

TABLE 7. Sstkoates ol Peak Halekiog Periods for Dungeness Crabs aod Lteoo Decernber-lsouarl Sos Surfase Tosopesstoios io the Gulf ol lke Sssagooes for larval SeasonsSerg-1SNL
' ~ uKluo arI lar Ibe rsu rsbx Is du usoud dsis iar Ibs rb d «seo
Although no CalCOFI samples were collected north of Pt. Reyes in earlyJanuary, we cogected some data to compare relative timing of larval develop-rnent in central and northern California. In January 19B0, we sainpled transectsI day apart in the Gulf and off Eureka Zoeal stages I and Il occurred in bothareas in approximately equal proportions. In mid-February 1977, we Found stageIY zoeae off Eureka, They occurred in CalCOFI samples from northern Californiaas early as January 24 in 1960, while stage V zoeae and megalopae were presentas early as February 15 and March 8, respectively, similar to results from centralCalifornia.
However, during our late March 1979 cruise, stage III zoeae occurred atdensities similar to stage V zoeae in oblique tows off Eureka, but were scarcein central California. Ten days previously, samples off Eureka yielded relativelyhigh densities of stage II and ill zoeae during a time when we expected to findprimarily late-stage zoeae, Thus, these data indicate that the major hatchingperiod appears to be longer in northern California which wovkf result in a longerlarval season for the northern California population as a whole.
Distribution of Larvae lit Say artd GulfZoeae
We never found ovigerous female Dungeness crabs in San Francnco Bay eastof the Golden Gate Bridge nor any other evidence that the larvae hatch there.In 244 plankton tows in the Bay, the only Dungeness crab zoeae we collectedwere one stage I and one stage II, both on February 13, 1976 in central 5anFrancisco Bay. Hatching of other Cancezlarvae does occur in the Bay, and wecollected ovigerovs females and early-stage zoeae of the red crab, C. pmohcissgslender crab, C, gracilis, rock crab, C. anrennarius, and yellow crab, C. anihorryfthere durin our study.
During the 5 years of the study, we found stage I Dvngeness crab zoeae atmost of our routinely sampled Gulf stations I Figure 281. Relatively high obliquetow densities of stage I zoeae were found at Gulf stations with bottom depthsof 30 to 70 m. On 26 occasions, stage I zoeae were «ollected in these tows atdensities greater than 20/100 ms, only one of these occurred at a station notwithin this depth range. During the January 6-1 2, 1978 cruise, stage I zoeae wereabsent at many stations within 5 km of shore and in theouter reaches of the GulfI Figure 29!.
252

FIGVR% aL ofsfrfbntion of ounfaness crab stage I snd Ii casse in Ifse Calf of Ihe FsraNonos,1975-slab
253

FIGvas zs. Oblique tow densities Iuusebes/tease ! of Ouetteeew crab stage 1 seeaete theCull ol the Fasagenes, faeuasy 6-t$ tsytk
Our data suggest that Dungeness crab larvae occupy a unique niche amonglarval brachyurans in the Gulf, At most stations greater than 30-rn depth, Dunge-ness crabs were the most common brachyuran stage I zoeae in our lanvarysamples, usually occurring at far greater densities than any other species, Occa-sionally, they co-occurred with stage I C prookscrus and C. oregonensis, butthese species have a longer hatching season in central California, particularly Cprotfuc/us.
Diel vertical migration of Dungeness crab stage I zoeae was evident in dayand night samples collected from discrete depths during the January 6-'I 2, 1978cruise. The zoeae were more abundant at Ihe surface by night and at 15- and25-m depths by day Table 8>; using the multi-way contingency table method,.day versus night densities at these levels were significantly different P = 0 01 ! .
Horizontal dispersal was evident during the early zoeal stages. On the faragonIslands transect on January 14, 1976, all stage I zoeae were found between 13and 26 km from shore. Two weeks later they occurred from 1 to 42 km fromshore, although densities within 13 km were Iow.
Our MarCh 1978 cruise waS COnduCted after a large plurne Of estuarine waterhad entered the Gulf IFigvre 22! . At this time, we found only stage I and tl zoeaein Gulf samples, all at low densities. AII stage Ii zoeae were associated with waterin which surface sagnity was greater than 32 ppt, even though approximately50o/o of the Cuilf surface water ranged in salinity from 23.2 to 31.7 ppt. Inlaboratory studies, salinities within this range did not adversely affect larvalsurvival I Reed 1969!. Thus, low salinity probably did not cause mortality in the
254

Gulf, but advancement of estuarine water apparently aided offshore movementof zoeae.
zasta a. tsnnsilies INo /tgotn'! oi oungennst crab stage I zonae in the Gull ol the garsl-Ionos, january &12, tortS
rvrgiv srnouhr
We observed similar results dunng December 1979 and January 1900 whensubstantial rainfall arrd Delta outflow caused an extensive plurne of estuariru..water in the Gulf Reilly, Chapter 51. On the December 27, 19r 9 transect to theFarallon Islands, no stage I zoeae were found within 20 km seaward of theGolden Gate Bridge but maximum densities occurred 25 to 35 km seaward. Theplume extended into the Gulf approximately 15 to 20 km. On January 21, 1900,the plume had advanced to 40 km seaward. Stage I densities had decreased from32 to 56/IQO m' to 3 to 8/100 m'; most oF the zoeae probably had molted tostage Ii by then. We only collected stage II zoeae seaward of the plume at ourmost distant station.
255

Continued movement of zoeae out of the Gulf was evident as the stagesprogressed I Figure 30! During the entire study, we collected only 65 stage III,26 stage IV, and 10 stage V zoeae inshore of the 500-fm 915-m I depth contourwhich lies approivmateiy 10 km seaward oF the Farallon Islands No stage Vzoeae were found within 36 km of shore. On March 3, 1979, at a station 4 kmseaward oF the Islands, densities of stage I, II, ill, and IV zoeae were 4, 13, 15,and 5/100 m', respectively.
To determine whether scarcity oi late-stage zoeae in our Gulf samples couldbe dve to zoeae descending to the ocean floor, which previous plankton towsprobably had not sampled adequately, we conducted 27 bouorn tows with theplankton sled during March and April 1978 cruises and one additional tow inApril 1980. Although Cancer larvae occurred in these tows at densities as highas 2,090/100 m', no Dungeness crab larvae were found. No late-stage Dunge-ness crab zoeae were collected in any plankton taws in the GulF in '1978 and1980. Thus, we could no compare bottom and oblique taws In fact, late-sAgezoeae were absent from Culf waters during most of our sampling.
ik/ega/apaeAlthough late stage zoeae were mos abundant offshore, we Frequently col-
lected megalopae at routinely sampled Gulf stations from April ta June Figure30! . In 1976, 14 rnegalopae were captured in the Gulf, all in the northern section.In April 1977, we captured 366 rnegalopae. The highest densities occurred in theGulf within 15 km of Pt Reyes Surface isotherms during the same periodshowed colder water entering the Gulf from the north I Figure 21! It is possiblethat rnegalopae were transported in o the Culf with it. In May 1977, and Apriland May 1978, our total catch of 20 megalopae again carne from the northernGulf. In June 197T, we dipne ted more than 500 V. ve/e//a from Culf surfacewaters Although these coelenterates occurred throughout the Gulf, those carry-ing megalopae were only tound north of the entrance to San Francisco Bay andwithin 20 km ot shore. During the April-May 1979 cruise, which extended to theBodega Bay area in Ihe northern Gulf, relatively high dens ties of megalopaeagain occurred within 15 km of Pt. Reyes, Ivlegalopae also occurred at relativelyhigh densities north of Pt. Reyes within 10 km oF shore One station yielded 306megalapae in a 10-min SurfaCe tOW 1139/100 rn'i. Few Or nO megalOpae Werefound at stations farther seaward. Dvnng the April 1980 cruise, we sampledstations o 50-km seaward of Bodega Bay and mega opae occurred only within31 km of shore.
In April 1979, we conducted a series of night-light stations from our researchvessel. In Drakes Bay Figure 'IT! the light a tracted an estimated 100,000megalopae within an hour's time on each oF two successive nights. Smallernumbers were anracted in Bodega Bay and central San Francisco Bay and a fewwere observed near 5outheast Farallon Island.
In the southern Gulf, station 961 [Figure 14!, 24 km from shore, yielded goodcatches of megalopae on three occasions, 5urface tow densities during the April1977 and April � May 1979 CrViSeS Were 14 and 21/100 m', reSpeCtively. We alSOdi pnetted 100 V, ve/e//a at this station on April 30, 1979 and found 50 megalopae,the highest ratio of megalopae to V. ve/e//a we observed derring the study.However, most southern Culf stations generally yielded few or no rnegalopae,
266

FIGVaf m Dieuflwdon of Dundenma crab eloge III, IV, and Y aoeae and megelopae in IheGulf of ihe FemHones, 1FF5-1~
257

Day vs. Ndffrr Dist6buffons. Thirty-four Gulf stations were occupied duringthe April 1977 cruise when 366 rnegalopae were collected. We sampled 12stations, once by day and once by night, to determine vertical distribution ofmegalopae, We statistical'ly compared megalopal densities for day versus nightsurface and oblique taws Table 9! using Student's t-test. Day and night surfacetow densities were not significantly different, nor were day and night oblique towdensities. I-lowever, day surface tow densities were significantly greater than dayob!iqve tow densities P= 0.05! and night surface tow densities were significant-ly greater than night oblique tow densities P=0.01 !. ln April 1980. at a nightstation 4 km west of Bodega Bay, a series of discrete-depth tows at the surface,5 m, 15 m, 25 m, and an oblique tow yielded mega!opal densities no,00m'! of 3.7, 15.8, 5,6, 0.0, and 2.5, respectively. These data show that megalopaeoccur more frequently in the upper 15 m of the water column. Their verticaldistribution differs from that of stage 1 zoeae in that relatively high densities ofrnegalopae occur in the upper 15 m during both day and night.TAalz 9, ensiliaa I No,00 m ! of ponaanaar Crab Maaalopaa io the Gulf of ihe faral-
loner, April &-11, 1$7z
As megalopae approach the molt to the juveni!e stage, they settle to thebottom. Although megalopae were found throughout the Gulf, they were foundat the bottom primari!y in the nearshore zone and occasionally in the Bay.Although their presence in stomachs of demersal fishes indicates that sett'lingoccurred to a maximum booorn depth of 60 rn Figure 31 !, of 995 megalo paetaken from demersal fish stomachs outside the Bay, 965 occurred at stations withdepths less t!tan 25 rn, including samples from the Pt. Reyes-Bodega Bay area.
We collected 97 rnegalopae in plankton tows in central San Francisco Baybetween the Golden Gate Bridge and the Richmond-San Rafael Bridge. Onemegaiopa in the stomach of a Pacihc staghorn sculpin, Lepfocofrus armaitis,collected near Pinole Point in San Pablo Bay represents the maximum penetra-tion into the Bay in our samples. We did not have sufficien data to determinethe statistical significance of mega!opal densities in surface and obliqve rows inthe Bay However, on Iv ay 6, 1979, at a station near the Golden Gate Bridge,an oblique iow yie ded 44 rnegalopae compared to only four megalopae in asurface tow of similar duration. This suggests thai megalopae may be carried into
258

FIGURE 31, Distribution ol newly settled Dungeness «rab megalopae front Bodega Bay loPt. San Pedro, based on Rsb stoma«b analysis, 1971-1979.
the Bay by bottom currents after settling in the Gulf or that they descend fromsurface waters as they enter the Bay.
Distribution of Larvae From the Gulf to Northern CaliforniaOne cruise conducted in March 1979 Figure 171 provided much of the data
from which distributions of various stages in northern and central California weredetermined. This cruise, conducted from the Gulf to Cape Mendocino and to100 nautical miles �85 km! seaward, collected all Oungeness crab larval stages
259

including 11 stage I, 19 stage II, 129 stage III, 103 stage IV, and 681 stage V zoeae,and 18 megalopae, Before 1979, we did not encounter any stage V zoeae in theGulf study area. The March 'I 979 cruise extended farther offshore and apparentlycoincided with a peak occurrence of stage V zoeae in California.
ZoeaeOffshore Oispersa/. The pattern of larval distribution demonstrated substan-
tial offshore dispersal as zoeal stages pcogressed Figures 32 and 33 !. All stageI and II zoeae were found within 50 km of shore while stages III-V extended to185 km from shore. Maxirnurn offshore dispersal was apparent dunng stage III.We collected stage ll and III zoeae at relatively high densities ofF Cape lvlendo-cino at one station over the continental shelf where we observed a well-definedcolor change in the surface water. The salinity inshore ol the boundary was 0,5ppt less than that immediately seaward. This may have been the boundary ofcoastal water diluted by winter rain and runoff; earlyetage zoeae occurredseaward of it. Stage V zoeae were collected at stations 24 to 186 km from thecoast but were most abundant from 40 to 150 km. They occurred farther fromshore ofi Cape Mendocino and Pt. Arena than in the vicinity of the Gulf.
Relative age of stage V zoeae on this March 1979 cruise, as determined byreadiness to molt also suggests continual offshore dispersal of zoeae. Readinessto mok was determined by exarninabon for withdrawai of tissue horn the exos-keleton, particularly in dorsal and rostral spines and the telson. Larger percent-ages of stage V zoeae close to molting were found farthest from shore Table10!.TAalz 10. P rcrmagrr ol Oooaenorr Crab Slagr V Zorse Close to hioltioa, March Ze-sy.
tS7%
Of 168 stage v zoeae collected in obiique tows during this cruise, 98.8oboccurred at stations with depths in excess of 500 fm 915 rn!, while 72%% of thesiations sampled had depths greater than this. A step-wise multiple regressionanalysis was performed with stage V zoeal density as the dependent variable andstation depth, latitude, distance from shore, time of day, surface temperature,surface salinity, 25-m temperature, and 25-m salinity as independent variables.A coefficien of multiple determination r '! of 0,18 was obtained with all inde-pendent variables included in the regression. Among the independent variables,depth contributed most to the overall r' �r'= 0.11!, followed by latitude �3r'=0.04!. However, the overall low r' indicates that very little �8'Yo! of thevariation in offshore dispersal is explained by these variables.
i.imited data from stations sampled off Eureka Figure 15! from 1977 to 1980also indicate offshore dispersal of 'larvae. In March 1978, for example, all stageV zoeae occurred seaward of the continental shelf, over the continental slope depth 200 to 1,000 m!. However, the Eureka tranSeCtS extended Only 53 kmseaward, and it is likely that we sampled only part oF the offshore range of the
260
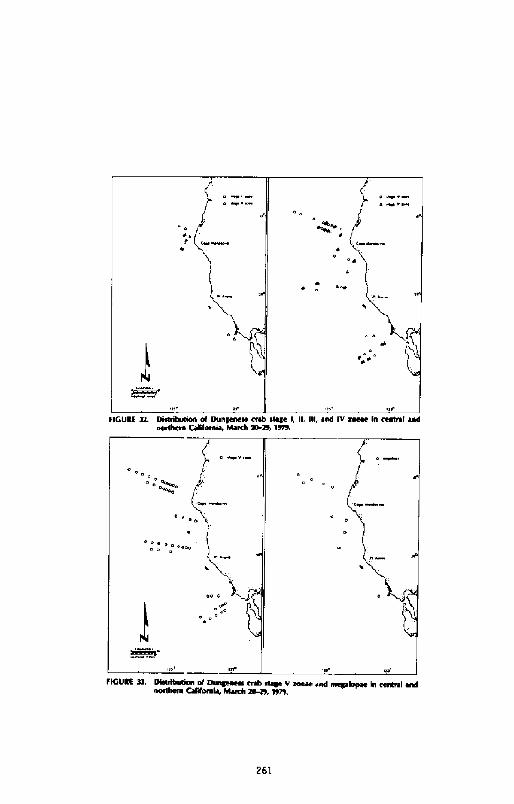
FIGURE XL Diaribudnn Of Dungeneaa Crab Stage I, II, III, and IV aneae in Cental andnertbern ~ haarCb Dn Ea, 1Ã%
FIGURE 31, ~ of anrganess crab stage V cease and nregabrgae in central andorntbern Cagforn4, adarcb 2a-Ee. teFS.
261

late-stage zoeal population in that area.The fact that nearly all stage V zoeae were collected seaward of the continen-
tal shelf does not imply a causal relationship with water depth, but is most likelya result of dispersal by ocean currents.
D/e/ migration. Nigh surface ows were conducted at 25 stations during thelate March 1979 cruise. Densities of stage V zoeae at two of these stations, one75 km seaward of Pt. Arena and he other 74 km seaward of Cape Mendocino,were 374 and 154/100 m', respective y Only four daytime surface tows wereconducted at stations within the range of occurrence of stage V zoeae and nolarvae were found. At one night s ation in which s age V zoeae were collectedat the surface 9/100 m'!, none were found in tows at 5, 15, and 25 m. Thehighest densities of stage III �5/100 m'! and IV 134/100 m'I zoeae observedduring the study also occurred in night surface tows. Although we did not havesufficient data to test statistically for vertical migration, it appears hat late-stagezoeae exhibit similar diel behavior as stage I zoeae in tha they occur morefrequently in surface waters by night than by day.
Mega/opaeAll 18 megal opae collected during the March 1979 cruise had molted recently,
as evidenced by soft exoskeletons. Megalopae were more abundant in surfacethanin oblique tows and occurred from 34 o 148 km from the coast. By contrast,1 month later we found megalopae aggregated nearshore.
Ca/CO/-/ Samp/esResv! s from the CalCOFI collections mvs be considered in the context of
their sampling plan, which was designed as a fish egg and larval survey thatextended more than 1,000 km from the coast, and in which collection effortswere less imense in the nearshore zone than in ovr study. Nevertheless, Ca!COFIresults support our observations. Ivlost Dungeness crab larvae I >9896! oc-curred within 200 km of shore and distribution of the larvae provides furtherevidence of offshore drift during zoeal development with subsequent inshoremovement of the rnegalopae Figures 34, 35, and 36!. Only 10 of 733 stage Izoeae were collected seaward of the 500-fm 915-rn! dep h contour, while 109of 110 stage V zoeae were found in this range. Substantial drift offshore, o 143km, was observed for zoeal stage il. The occurrences of one stage III zoea 235km seaward and one megalopa 296 km from shore exemplify the potentialoffshore drift that may occur during larval deve!opment. By con rast, only oneof 57 megalopae collected in March was found within 90 km of shore, while 77of 82 megalopae occurred there in Apnl.
Relative Abundance of Larvae
Ajax/m zr� Der sr'ties by 5tageThe terms "low" and "high" have been used frequently in this chapter to
describe larval densi ies. A summary oi maximum densities from oblique towsfor each larval stage Table 'l l ! may serve to define the above terms and allowcomparisons between years and with other studies. The rnaximvrn oblique towdensity 896/100m'! of stage zoeae in 1976 Table ll ! was the highestdensity
262

FIGURE Sa DistrRwtion of DursEeners crab staue I and II zoeae in central and northernCalifornia fnun calcosl saplie, tsao-ters.
u
FIGURE SS. Dissribudou ol Dunpeness crab stage Rl and IV zoeae in central and northernCalilorrds from CaICOFI sampiee, tote-ters.
263

fIGURE Za. Oissskwlien et Onneenesa crab slake V zeeae and snake!apse in cenlsat andnonhem Cakfernia trine CaICOSI sasnikes, IS4S-terz.
of Dungeness crab larvae we collected. However, a 'i 5-m tow in january 1978yielded stage 1 zoeae at a density of 544/100 m'.
Discrete depth tows at times resulted in considerably higher densities thanoblique tows, reflecting vertical distribution of 'larvae. For example, maximumdensities of stage V zoeae and rnegalopae, observed in surface tows in 1979,were 374 and 139/100 ms, respectively, compared to 't4 and 16/100 m' inoblique tows in 1978 and 1979, respectively Table 11!.
Samp/I'ng Vari ah//I'/yThe distribution of planktonic organisms is non-random and usually patchy
Cushing 1962; garnes and Marshall 1951! and considerable variability oftenoccurs in plankton samples. To analyze for variability in our samples, five repli-cate oblique tows were taken at each of three stations during the night of january12, 1978. The tows were conducted sequentially at 10-min intervals while theship circled. A normalizing logarithmic trans/ormation was performed on thedata and 95ei6 confufence limits were determined for mean densities of stage Izoeae in the tows ITable12!. The unusually high standard deviation in our datafrom station I �5 reaulted frOm the abaenCe of stage 1 zoeae in one of the tows.Subsequent analysis indicated that zoeae occur more abundantly in surfacewaters at night and, thus, oblique tows would have a greater probability ofmissing surface "patches" of zoeae than surface tows. However, results from
264

265

stations 'I068 and 1116 are within the range of variability for individual crusta-cean species reported by other workers, as summarized by WIebe and Hollandf1968!. Ovr sampling effort proved adequate to show differences of at least oneorder of magnitude.
TAILS 12. Sasnptlna VssishiTity ol Stage l Zoese Innn letsgeate Ohgque Stenkten Towe inthe Gulf of the Sarsgones, lnnosry tz 1170 Ix No./1& sn~ y log, s!.
o +rod em usI,s v~aso v+ u ~ ~r suoosanoso use
Relationship to JrVater TemperatureAn inverse relationship was observed between relative abundance of stage I
zaeae in the Gulf and water temperature. The highest density of stage I zaeaewe collected occurred in January 1976 when Gulf temperatures during Decem-ber 1975 � January 1976 Table 7! were colder than any other December-Januaryperiod dunng the study. Gulf temperatures dunng December 1976-January 1977were warm and, although we began sampling in January, we missed the peakstage I zaeal period which was early that year. The 1979 larval year class, thestrangest during our studies, also hatched in relatively cold water, while the 1978and 1980 year-class hatches occurred during warmer conditions and resulted inlower larval production. Student's t-test was used to compare mean densities ofstage I zoeae from oblique tows taken on Golden Gate-Farallon is4nds transectsfrom 1976 to 1980 using the transect that produced the best catch each year,There was considerable variability in individual samples and the only statisticallysignificant difference was that mean density for 1976 was greater han that for1980 P=005, t=2.35, d.f.=10!.
Central Cailfornia vs, lslorfhem CaliforniaOn lanvary 22, 1980, stage I zoeae occurred at a maximum density of 290/100
rn ' off Eureka, while the highest density in the Gulf for the 1980 larval year classwas 56/100 m' on Decesnber 27, 1979. In March 1979, transects i20 to 30stations each! to 185 km seaward off Cape Mendocino, Pt. Arena, and the Gulfyielded average densities of stage V zoeae in oblique tows of 1.3, 0 7 and 0 4/100rn', respecovely. These data suggest that zoeal abundance may be directlyrelated to the magnitude of the spawning stock which presumably is larger innorthern California.
266

Stage / Zoeae vs. /vtega/opae in the GulfThe relative abundance of stage I zoeae and megalopae in the same year class
in the Gulf were not consistently related. We sampled too late in 1975 and 1977larval seasons to estimate adequately stage I zoeal densities. In 1976, stage I zoealdensities were high, but the catch of megalopae was poor. In 1979, stage I zoeaeand rnegalopae were relatively abundant, while in 1978 and 1980 densities ofboth were low.
Mega/opae vs. JuvenilesThe relative abundance of megalopae was consistently related to strength of
the new year class of post-larval crabs in the Gulf and he Bay Tasto, Chapter9, Reilly, Chapter 10!. juvenile year classes in 1976 and 1978 were relativelyweak and catches of megalopae also were poor in both years Stronger juvenileyear classes occurred in 1977 and 1979 when mega opal abundance also washigh. During the peak rnegalopal period estimated from highest catches!, theaverage density for surface tows in the Gulf was 4.1 and 0.1/100 m' in 1977 and1978, respectively. In the Pt. Reyes-Bodega Bay area the average density forsurface tows during April-Ivtay 1979 was 18.6/100 m'. Limited data suggest thatthe 1980 year class of megaLopae was weak; average surface tow densities duringour April 1980 cruises in the Fort Bragg and Bodega Bay-Pt. Reyes areas were0.3/100 m' and 0.5/100 m' respectively,
Ca/COFI Samp/esData from CalCOFI samples Table 5! were sparse when considered in the
context of time and geographical area. Thus, no definite conclusions could bereached concerning pre. and postdecline years or geographical variations inabundance,
Dl SCU SS ON
Timing of Larval OccurrencesWe observed the peak hatching period of Dungeness crab larvae In the Gulf
of a Farallones to vary from late December to early January. Hatching wasearly when temperatures during the December-january period were warm andlater when they were cool. Laboratory studies with ovigerous Dungeness crabsverify this inverse relationship be ween water temperature and both egg devel-opment and hatching times Wild, Chapter 16!.
I arval development time also has been shown io be inversely related to watertemperature Poole 1966! Reed 1969!. Reed �969! reported a developmenttime of approximately 90 days to the megaiopal stage at 10 C and 25 to 30 pptsalinity. Complete larval development time in Poole's laboratory studies withwater temperature constant at 10.6 C was 111 days. However, only one of hislarvae reached the first post-larval instar. Gaumer �969! found that 109 dayswere needed at 11 C to complete larval development. Lough �974! observedthe peak appearance oi stage I zoeae in mid- to late January in Oregon waters.He estimated length oi the larval penod to average approximately 130 days.Because winter temperatures in central California generally are 2 to 3 C warmer
267

than in Oregon waters, my estimate of the length of the larval period �05 toS days! appears to be reasonable.
Distribution
Horizontal OispersalMost Dungeness crab !arvae in central California hatch and complete their
early zoeal development during the Davidson Current period when the generalpattern of circulation along the coast has a net northward movement Reid andSchwartzlose 1962; Pirie and Steller 1977!. We were not able to discern north-ward or southward alongshore! drift of larvae in our samples; however, Lough�976! concluded that northward larval transport, based on the average speedof the Davidson Current in Oregon waters, could be up to I S0 miles �80 km!per month.
We found that considerable offshore movement of larvae occurs during zoealstages II-V. The larvae appear to be transported seaward from the onset ofhatching, but most molt to the second zoeal stage before reaching the continen-tal slope, Offshore movement of zoeae appears to be aided by estuarine runoffand possibly also by upwelling, especially for late stages in the Pt. Arena andCape Mendocino areas. Geostrophic flow offshore may occur throughout theyear in central California north to Cape Mendocino Richard Parrish, NMFS,pers. commun. !.
The factors influencing larval distribution north of Cape Mendocino are lessclear. We found zoeae to be farther fram shore in northern than in centralCalifornia, yet onshore flow occurs during january and February north of CapeMendocino Richard Parrish, NMFS, pers. commun.!. It seems possible thatsome larvae occurring in northern California waters in March could havehatched in central California and were transported offshore by estuarine runoffand carried northward by the Davidson Current. Caumer �971! theorized thatlarvae hatching in northern California in December could be carried narthwardto British Columbia by the time they settled out.
Studies of larval distribution in Oregon contrast in part with results of ourstudy. Peterson et al. �979! concluded that surface waters are transportednorthward and onshore from October to March in Oregon. Laugh �976! foundthe majority of early stage Dungeness crab larvae within 10 miles �6 km! afshore and attributed this to retention by an onshore component of the DavidsonCurrent. However, Lough �974! fOund Stage III-V zOeae and megalOpae atstat!ans 45 to 60 miles �2 to 96 km! from shore which also suggests offshoredrift similar to results from our study. Lough did not capture any Dungeness crabstage V zoeae within 16 km of shore. He reasoned that the volume of waterfiltered at inshore stations was inadequate and that late-stage zoeae may beassociated with the ocean bottom. We did not collect any Dungeness crablarvae in bottom taws with the plankton sled in the Gulf in March and April 1978or April 1980.
Our results demonstrate the recruitment of megalopae to nearshore oceanwaters af central California following a period in which stage V zoeae weregenerally absent within 40 km of shore. Lough �974! observed large numbersof megalopae within 10 miles �6 km! of the Oregon coast during April and May
268

in 1970 and 1971. In 1975, Wickham �979b! dipnetted V. ve/e//a seaward ofBodega Bay to 24 km and found megal opae only on those within 10 km of shore.In Ivtay 1976, Wickham �979b! observed two distinct bands ot mega!opec insurface waters I and 8 km of shore of Bodega Bay with an estimated averagedenSity Of I /rn'. MOre reCendy, aging Of mega Opae by intermO!t Staging Hat-field, Chapter 7! has provided further evidence oi'inshore transport. Megalopaethat were more advanced in their development occurred closer to shore and inSan Francisco Bay in central California.
We were unable to determine the mechanism for inshore transport of megalo-pae which occurs at a time when offshore Ekman transport of surface watersinduCed by nOrth Wetterly windS iS COmmOn. StudieS by BOurke et al. '1 971 ! OffOregon, indicate that wind-driven water motion may extend to a depth of 10m and that Bow in the Eckrnan surface layer is offshore, kachey and Fothergill�953! found that winds greater than 10 mph will influence the magnitude anddirection of surface currents, but that a given surface current is a complexmixture of wind current, tidal current, and semi-permanent current. In centralCaliforriia, the arrival of megalopae in nearshore waters generally occurs in Aprilaffer the onset of predominantly northwest winds in March Figure 24!. FromApril to june, winds blow predominantly from the northwest with Ekman trans-port directed offshore which makes it difficult to understand how megalopaebecome aggregated nearshore, The formation of counter~!oc kwi se eddies in thevicinity of headlands during the upwelling period is a possible explanation.
Northwesterly winds blowing toward the coast in the spring cause rafts of V,ve/e//a to wash ashore in central California Wickharn 1979b!; mega!opec areoften found attached to them. We have found the occurrence of these hydroidsin central California to be sporadic. Therefore, althovgh they occasionally maybe of importance as inshore transporters, they could not account for the annualrecrviunent of megalopae. Recruitment from the north covkl explain the pres-ence of megalopae in the Cvtf in lune 1977 after a major period of settling andmolting to the juvenile stage had occurred in early April. Dipnetting of V. ve/e//ain !une yielded an average of I megalopa/10 V. ve/e//a in the northeasternsection o the Gulf, an area of approximately Ix�' m'. A!though we did noiestimate the average density of V, velella, a conservative va ue of 1/100 m'would indicate that almost 1 million mega!opec were present on V. ve/e//a. Aia maximum speed of 20 km/day Schwartzlose and Reid 1972!, the CaliforniaCurrent could transport megalopae from the Oregon border to Pt. Reyes duringan average 25-day mega opal period. Temperatures south of Cape Ivlendocinoduring the spring of 1977 were colder than in any other year of the study; thiswov d prolong development and extend southerly transport.
Larvae of the anomuran sand crab, Emerita arta/oga, frequently co-occurredwith Dungeness crab larvae in offshore samples from the Ca!COFI collection andovr study Ha geld, Chapter B!. Efford �970! discussed several aspects of theplanktonic life history of E. ana/o//a which closely parallel those oi' the Dunge-ness crab. Developrnem time from hatching to settling is approximately 4months and rnegalopae begin to arrive on California beaches in large numbersby April. He proposes a hypothesis in which larvae drift from one current toanother and back again via interconnecting eddies. In this manner many wouldbe retained nearshore. No evidence, however, is presented from plankton sam-ples to support this concept.
269

Mayer �973! related the recruitment of megalapae into Similk Bay, Washing-ton to tidal and density currents The megalopae that occasionally enter centralSan Francisco and San Pablo Bays most likely are transportedby density currentsof high-salinity bottom water. The vertical extent of these currents is not known,but we observed a halocline at approximately 5 rn in the Gulf near the GoldenGate during periods of high Delta outflow. Conomos et al. �970! fovnd thatseabed dnfters released within 25 km af the Bay entrance moved into the Bay,
Sandifer �973 and 1975! noted that many species of decapod larvae inChesapeake Bay were more abundant in rhe lower layer of the water columnwhere net transport is upstream. This distributional adaptation would retain themin the estuary. C. irroraivs larvae were occasionally found in low concemrationsin the Bay. However, he found no tendency for C irrorarvs ksrvae to concentratenear the bottom, surface and bottom concentrations were 44,3'% and 55,79k,respectively. No megalopae or stage V zoeae were collected. Apparently mostC inoratvs larvae hatch offshore and some are retained within the Bay bychance only. Sandifer concluded that the Chesapeake Bay population is appar-ently restacked by migration of animals from the inner-shelf area. Bigford �979!speculated that passive migration of C irrorarvs stage V zoeae, megalopae, andjuveniles, aided by bottom currents, is a major factor in recruitment to Chesa-peake Bay. We ovnd high densities of Dungeness crab stage V zoeae in nightsac ace tows offshore and aggregations of rnegalopae in the upper layer of thewater column nearshore and occasionally in San Francisco Bay.
Vertical MigrationAnalysis of our field data shows that stage I Dungeness crab zaeae undergo
die vertical migration; they were captured more frequently near the surface bynight and at 15- and 25-rn towing levels during the day. The data also suggestthat later zoeal stages have a similar diurnal distnbution. These behavioral adap-tations may be related to observed patterns of d spersal and aggregation. Dvringearly zoeal development in winter, nights are longer than days and larvae wouldthus spend more time in surface waters. They would then be influenced moreby estuarine runoff and would be transported offshore. In comrast, we observedthe highest densities of megalopae in the upper 15 m both day and night in thenearshore area. It is unclear how this change in vertical orientation affects theirhorizontal distribution.
In laboratory studies, Cavrner �971! reported that Dungeness crab zoeaeand megalopae displayed positive phototaxis to light intensities of 25 and 240ftc and a negative response to 990 ftc. Megalopae exhibited the strangest nega-tive response to the water surface or light. He predicted that larvae in the oceanwould approach the water surface at night and the opposite response should beexpected during daylight hours. However, he implied that the ~l re-sponse may be a trait of cultured rnegalopae and reported field obselvations ofmegalopae actively swimming arr the surface in Yaquina Bay, Oregon during theday.
lacoby �980! tested responses of Dungeriess crab larvae to fight intensitiesof 4, 20, 90 and 4500 ftc, The latter corresponds to full sunlight at the oceansurface in central California. Stage III, IV, and V zoeae moved toward brighterlight than stages I and II, but megalopae nxwed only toward the dimmest light
270

unless pressure was increased. However, rnegalopae never moved oward thebrightest light
Iacoby found that all Dungeness crab larval sMges could detect gravity andpressure changes but that their responses were too inconsistem to predict fieldbehavior. Big 'ord �977 and 1979! reported that stage and III C. irrorarur weregeonegative and stages I, IV and V were geopositive without directional lightor increased pressure. Megalopae remained on the bonorn of the experimental«harnber. He observed a "pre-mega opal" behavior pattern as the fifth stageprogressed in whiih depth maintenance by swimming was reduced gradually,
Larval Abvndarrr e and Sampling Variabr7� yI did not find a consistent relationship between larval abundance and subse-
quent recruitment to the commercia! fishery for a given year class. We begansampling stage I zoeae in January 1976. This relatively strong zoeal year class,which was followed by weak megalopal abundance, contributed to he fisheryduring the 1978-79 and 1979-80 seasons; the 1977 larval year class with highestmega opal abundance con tnbuted to the fishery in 1979-80 and 19 Kx4, assurn-ing 3 and 4-year lag times. Landings were above average for northern Cali 'orniaand remained low in central Ca ifornia Figure 10!. Gregory Lough OregonState University, unpublished manuscript! could not relate Dungeness crablarval abundance in ' 970 and 1971 to commercial landings in Oregon. Ivleanabundance of early-s age zoeae at Four inshore stations in Lough's study was 680and 190/100 m' in 1970 and 1971, respectively. These are in the same order ofmagnitude as maximum stage I zoeal densities in 1976 and 1979 in the Gulf.Lough found that Oregon crab landings in 1974 and 1975 were extremely lowand sirni ar for these 2 years. Compounding our problem is lack of knowledgeoF the ultimate destination oF larvae produced in the Gulf. If larvae return to thearea of hatching, then comparisons of stage I zoeal densi ies between areas maybe valid. On the other hand, larval production in the Gulf may contribute torecruitment in northern California and or! some may be lost by offshore drift.
We attempted to rninirnize sampling vanability by using larger mesh for col-lecting late-stage zoeae and megalopae, thereby reducing avoidance, usingflowrneters to determine the amount of water filtered, and samp4itg frequentlyto minimize effects of non-random spatial distribution of larvae. Variability in oursampling results was small enought to enable us to discern differences in averagelarva densities of at least one order of magnitude. Lough �974! conducted sixi'eplicate tows at one station in Oregon waters and reported 95/ii confidencelimits of 4 to 2484'/ii for seven species of brachyurans. He anributed this widerange to the low number of larvae collected No Dungeness crab larvae werefound in these tows. Series o duplicate tows the same year yielded more narrowlimits e.g, 44 to 23 Ab for C. regcroesis stage II zoeae!, although the range forDungeness, crab megalopae, 3 to 322K'o, was high. Confidence limits for singleobservations for individual crustacean species, summarized by Wiebe and Hol-land �968!, ranged from 14.3-698'/ii to 59-1 69iik. Confidence limits for two ofour three sets of replicate tows For stage I Dungeness crab zoeae Table 12!were within this range.
We found a direct relationship between stage I zoeal producnon, relativeabundance of megalopae, and resultant strength of year c asses o Juvenile crabs
271

in 1978 and 1979, but in 1976, zoeal production was high and recruitment ofmega!noae and Iuveniles to the Gulf and gay was low. However, Wickham�979b! found megalopae to be abundant in waters off Bodega Bay in 1976. Itis possible that large numbers of megalopae were transported from he north to he Bodega Bay area but did no penetrate farther south into the Gulf, or thatour sampling missed the major period of reciuitrnen of rnegalopae in the Gulfthat year. However, results of stomach content analysis of demersal fishesIReilly, Chapter 10! indicate that our sampling effort did not miss the majorperiod of recruitment into the Gulf; very few young-ol- he-year juvenile crabswere found in the stomachs of fishes collected in the Gulf and Bay that year.
Several other s udies have investigated relationships between larval produc-tion of commercially important Crustacea and spawning stocks. For examp e,Scara �964! sampled American lobs er, Homarus amencanos, larvae incoastal Canadian waters from 1949 to 1961 and could find no conclusive rela- ionship between larval and subsequent stock abundance, although he conclud-ed that here was a possible direct relationship between abundance of stage Ilarvae and parent stock density. An es imate of total abundance of stage I larvaeof the lobster H. gammarus was calcu!a ed by Nichols and Lawton f1978! fora portion of coastal England. Their estimate was extremely low when comparedwith the potential from the available breeding stock ovigerous females�! For hat
CONCLUSIONSOur primary goal was to identify life history stages of the Dungeness crab that
are cri ical o high recruitment and survival in the Gulf of the Farallones and SanFrancisco Bay. These areas provide habitat for crabs which are recruited into theSan Francisco area commercial fishery. We consider a "critical" stage to be oneduring which a year class of crabs suffers sufficient mortality or displacement sothat relative abundance of subsequen stages results in a small population andlow fishery landings.
The most consistent relationship we observed during the study was that therelative abundance of megalopae was directly related to the subsequent yearclass of juvenile crabs. Most of the megalopae we collected nearshore were inadvanced stages of development Ha field, Chapter 7!, Thus, if a relatively argenumber of larvae reach the late rnegalopal stages, a good year class of juvenilecrabs should result. Therefore, the late megalopa to early juvenile instar perioddoes not appear o be a "critical stage". One indicauon of the potential recruit-rnent of megalopae to nearshore areas was an observation by Lough F1974! ofan oblique plankton tow density of 800/100 m' in Oregon waters This is 50 timesgreater than the maximum density we found in any oblique Iow in our studyarea.! I is possible that present recrui ment levels of megalopae, although varyingsubstantially during the study, are still one or more orders of magnitude belowthat necessary to sustain the commercial Fishery at historic levels in centralCaliforni.
We did not find a consistent relationship between relative abundance of stageI zoeae in the Gulf of the Farallones and subsequent rela ive abundance ofmegalopae of the saine year class. Therefo e, survival or displacement duringzoeal stages and early inegalopal development apparently are "critical" to thestrength of a year class of juvenile crabs. The sampling procedures did not allowus to define more precisely which early life stages are the most critical.
272

Fine scale spatial distribution ofCancer magister megalopae and itsrelevance to sampling methodology
J. Booth, A. Phillips and C. S. JamiesonDe part me nt of Fi she ries and OceansNariaimo, BritiSh COlumbia
abstract
The vertical and horizontal spatial patterns of Cancer ma istermegalOpae in Dixon EntranCe in northweStern Brit~iS O u ia were foundtO be non-random, iaegalOpae were mOSt abundant in the upper 25 m Of the~ater column, concentrating in the neuston layer at dawn and dusk, Thevertical pattern is probably consistent between areas. Preciseq ~ u tit ti upli g i t. ~tt gulop equi tu o ~ tuse of a neuston tow and a bongo net undulated vertically through theupper water column.
The horizonta! spatial pattern of megalopae was found to beoverdi spersed along transects run perpendi cu 1 ar to the shore and tidalcurrents, with a patch dimension of about 2-4 km.
Horizontal patch size and distribution are probably site and timespeci fi c, making it impractical to recoavaend a standard sampling desi gnfor all situations.
Introduction
The Dixon Entrance - Hecate Strait region around the Queen CharlotteIslands is a major Dungeness crab Cancer magi ster! fishing area inBritish Columbia Jamieson, this sy~mpos umT. TBs fishery, like otherDungeness crab fisheries, is characterized by fluctuations in catchwhich are generally thought to reflect variable recruitment, One factorwhich may influence year-class strength is larval survival. "Larvalwastage", defined here as the transport of the larvae away from theadult population into areas unsuitable for survival, nas received much
273

attentfon as a possible cause of varfabflfty in larval surv1val Lough1976; Re111y 1983; JOhnSOn et al., thiS SympaSfum!. StudieS Of 'larValspatial patterns off the central and northern California coast Reilly1983! and the Oregon coast Laugh 1976! fndi cate that the zoeal stagesdrift offshore; however on molting to the nmgalops stage the larvaeapparently return inshore by soxm yet unknown mechanism, The oceancirculation patterns in the Oueen Charlotte Islands region differ fromthose along the open west coast of California and Oregon, Thus C.ma fster larval distribution patterns and transport mechanisms may alsoe quite different.
As part of a larger 1nvestigatian of the distribution and larvalsurvival of C, m~atster in Dixon Entrance Booth unpub. data!, thisstudy discusses~actors affecting sampling methodology for C, xm 1stermegalopae. Earlier plankton work fn D1xan Entrance 1982 and 191ndicated three major concerns in designing an effectfve 'larval sarr4rlfngstr ategy:I. A non-random horizanta'I and vert1cal dfstribut1on.2. Pronounced diel m1grati ons .3. Inherent bias in gear performance and tow techniques,
Study of the fine-scale temporal and spat1al patterns of distribution ofthe megalaps stage was initiated in July 1984 in Dixon Entrance toaddress these issues.
The megalaps stage was chosen for study for three reasons. Because ofits relat1vely large s1ze, coarse-mesh nets can be used which reduce theproblem of net drag and clogging. Because the large eegalopae can beeasily pfcked out of samples, sample analysis is rapid and aninteractive sampling strategy is possible. Finally, the biology of themegalops stage was percei ved to be part1cularly important as ind1vidualsin this life stage ierst locate a suitable location for settlement andSubSequent Survival . The Spatial di Stri butf On Of megal Opec and thef ruse of physical oceanographic transport mechan1sms might be of prfmaryimportance in understanding causes of year-class flucations inabundance.
Methods
The study was conducted from July 6 to 17, 1984 in Dixon Entrance fromthe 45 rx R/V G.B. REED. The weather was calrx and overcast throughoutthe ll day period.
Plankton tow methods.
Two types of nets were used: An otter neuston sampler Sameoto andJaraSzynSk1 1969; MaSOn and PhillipS, in preSS! and Standard bangOnets. Both gear types had black net frames ta reduce avoidancebehaviour by the megalopae, General Oceanic flowmeters mounted fns1deand 0.5-1.0 mn black nitex nets with salfd PVC codends. The crosssectional areas of the neuston and bongo nets were 0.21 m and 0.25 mrespectively, All taws were made off the starboard s1de of the vesselat taw speeds of 1,5-2.0 m s- r.
A 5-minute neuston taw sampled a d1stance of approximately 650 m, or150 ms of water from the surface to 0.41 m depth, TOwing distance wasvaried depending on the density of megalapae. Bongo gear was tawed in 3different ways: the first, referred to as an 'undulating bongo tow'
274

consisted of repeatedly lowering and raising the bongo gear at a speedof 0.3 m s 1 while the ship steamed forward at 1.0-1.5 m.s ' thuscausing the net to undulate between the desired depth strata, In thisway a minimum flow volume of 300 m3 through each net was achieved.Two depth strata could be sampled simultaneously by adding a second setof bongo gear at a fixed distance above the first set, For instance,with two sets of gear separated by a vertical distance during towing of25 m, the upper set could be undu'lated between 0 and 25 m while thelower set sampled between 25 and 50 m, The two other ways in whichbongo nets were towed included, oblique bongo taws between the surfaceand 3 m off the bottom and surface bongo tows. Undulatf ons wereachieved by repeatedly lowering and raising the bongo net over thecoarse of one tow.
Vertical samp11ng design:
The di el pattern of vertical distribution of C. ma i ster megalopae wasdocumented over a 48 hour period at two stati ons; tat on 1 at 55 mdepth and Station 2 at 27 m depth Figure 1!. Three other stations wereOCCupi ed fer ShOrter periedS te meaSure the vertiCal mavement Ofmegalopae at dawn and dusk when it was predicted to be most pronounced Stations 3, 4, 5; Fig. 1!. At the two 48-hour stations Stations 1 and2!, an undulating bongo tow with two nets in tandem and a neuston towwere made every 2 hours with more frequent taws during dawn and dusk.The two nets of the undulating bongo tow were separated by a
Figure 1. Transect and station positions in Dixon Entrance, July 1984.
275

ui~rance af half the mixed layer depth which was determined using anApplied Microsystems CTO. Thus the entire mixed layer depth «assampled. At the other three stations, only neuston tows at 5 to 10minute intervals during the dawn and dusk periods were made,
The data from stations 1 and 2 were combined in a one-way analysis afvariance of the rank value of the density of megalopae over time foreach depth stratum, nested by station, The data were combined into 4hour time-of-day periods for statistical analysis.
Analysis of net bias.
Comparisons of the relative efficiency of three sampling techniques weremade. These included:1, Surface neuston to oblique bongo tows at dusk.2. Single deep undulating bongo to oblique bongo taws during the
day.3. Surface neuston to surface bongo tows during both the day and
night,
Four tows of each type were made for the neuston/oblique bongo and deepundulating bongo/abli que bongo tow comparisons� . The surface bongo towwas used concurrently with the neuston tow on all of the transectsoccupied during the fine scale horizontal spatial pattern survey.
Horizontal sample desi gn,
The fine scale <1000 m! horizontal spatial pattern of megalapae wasmeasured along four transects whi ch ran perpendicular to thep redami nantly eastward tidal current along the north shore of GrahamIs land Crean 1967 ! transects 1 to 4; Fig, 1!, Consecutive 5-minute�50 m! neustan taws were made along the transects. Tows were madethroughout a 24-h period except at dawn and dusk, when the fixedstations were occupied. Although a 'time of day' bias was present alongthe transects, adjacerrt stations were sampled at similar times and thusfine scale horizontal patterns could still be detected.
Plots of the estimated densities of megalapae in the tows alang thetransects, analysis of the fr equency distribution of these densities andautacarrelati on analysis were used to describe the feature of thehorizontal spatial pattern of megalopae.
Results
The pattern of megal opae distribution varied with time of day at bothStations 1 and 2 Fig, 2 and 3!. The occurrence of megalopae variedsignificantly between time of day in each depth stratum Table 1!. Thedensity of megalopae was greatest between 1600 and IB00 h in both theupper and lower parti on of the mixed layer. In the neust on layerhowever, densities were greatest at dawn �400 ta 0800 h! and dusk �000to 2400 h! with the average density of the megalopae in the neustonlayer two orders of magnitude greater than that in the water columnbelow it. The time period with the next hi ghest density in the neustonlayer was the period between dawn and dusk �000 to 0400 h!. Scheffe'smultiple-rompari son of means procedure failed to shaw a significantdifference between any two mean ranks in any of the depth strata.
276

20 h
00 00 6'00
DEPTH ~ NEUSTON ~73', 0-24m ~e 24- 50m
Fi ~ 2 R 1 t b of t'a ~t galopa i tb ttooand upper and lower halves of the mixed layer at Station 1, July 11-13,1984.
100
90
80
a' 50
20
IO
0 0 00 6.00
DEPTH: ~ NEUSTON ~0-24m ~24-50mFige e 3. Relati e be t of C ~late mgalopa i tb to ~and upper and lower halves of the 333i xed layer at Station 2, July 8-10,1984.
277�
10 0
RDIFD1
o 60-1
70~ X
60
w 50
u. 40O
1200 1800 000 600 1200 1800 0:00 600TIME OF DAY
12700 18.00 0 00 6700 12 00 18:00 0 00 6 00T I M E OF DAY

Table 1. Friedman'S tWO Way analySiS Of variance blOCked by StatiOnwith Sheffe's multiple range test for density of megalopae in theneuston layer, and upper and lower halves of the mixed layer during 4hour time of day periods at Stations 1 anri 2, July 1984, Dixon Entrance.
Scurce of variation df SS % F
Z109.56 Z8.6875.56
Tirre of d4y peri od 6 12667.37within tirre of day period 57 4192.13total 63 16849.50
Houston layer nmrstrm tcw!
Upper half of mixed layer Tirre of day period urxhlating bongo tcw! within tirrm ot day period
total
6 17156.2157 4563.2963 21719,50
2859.37CUB
35.72
6 18433.78 3MTZ.X58 4192.72 72.2964 22626.50
Lrxrer half Of rrfxed layer Tine Of day periOd undrlating bongo ter! within tine of day period
total
Upper half ofnd xed I ayer
Lcwer half ofnrl xed layerDepth Strata
Meanrank
MeanH rank 'HTine period
13.628.19
'pe!.IX01
In general C. ma ister larvae were more abundant in the upper half ofthe mixed layer an n the lower half. At the deeper of the 48 hrstations, Station 1 �5 m! the mixed 'layer was approximately 40-50 mdeep. The average density of nmgalopae between 0 and 24 m was greaterthan or equal to that between 24 and 50 m in all but two of the 30tows. In shallower water, at Station 2 �7 m! ~ where the mixed layerextended to 20-25 m, the average density between 0 and 12 m was greaterthan or equal to that between 12 and 24 rn in 23 of the 32 tows.
At all stations the diel changes in surface densities were clearlydefined Figures 4a and 4b!. A Friedman's test of the hourly variationin neuston megalopae density by station was significant p<0.0001!.
278
M$44X04XWBX0800-12�12%-16001600-ZIOl2XOEM!rsinimler siiyr diff.in rank%xirrrxn range ofranks
13.4114.8913.319.75
13.1317.709.65
11
18 8 8 810
13.2116.7512.3816.432D.5618.7514,15
12
18 8 78
10
14.3618.03lb.8811.6925.3113,2513.3
1119
8 8 810

Bi+ u& Bee IR gl 16'+ 66:+ 6:Qiae a' Rav
Figam 4a: M fe8es Bl Ceaeer meaisler aeaetatim e tte Reaataahafar et $4iae t-4 tatf tlt{, tttee Betreee
IIIIN
6 E 6 / I6In'
zl ss
ream Bh. fences et ieaiilf at Caeeer Refuter ~ hi the Ruchehe ~ aeh a Sut' S~ M B
The comparisons between the neuston tow and oblique bongo tow and thedeep undulating bongo tow and oblique bongo teer did not show significantdifferences between the mean estimated megalopae densities calculatedfrom the different sampling methods. In both comparisons, however,estimated density from the oblique bongo tow was 61ways the lowest andoccasionally this net caught no megalopae in instances w'hen othermethods showed their presence Table 2!,
279

Table 2. Comparison of neuston and deep undulating bongo tow n»thodswith oblique bongo tows by one-way AHOVA.
Nmter lemm rLmberof cf gmxplqee
Toe ape tgegs per 1X m
4 22~ 478.97 Fl 6 3' P0.134 OP O.fog
Aly 17 0136-BKS Nsustmd>lfye ixxxp
Ply 16 89-UX Iamp Nxbl<fng fxvgcp 4Rlfy» bc'> 4
0.56 OdP Fl 4 ld8 p42!OA! fV5
The distribution of C . ma ister megal opae in the neuston layer alongtransects perpendi cuTar to t e tidal current and shore was hi gh92yvariable and was complicated by differences in the time of day when tawswere made. Transect 1, which met Graham Island at Rose Spit, wassampled between 0200 and 0800 h to 54'25' H on the offshore leg. Theoffshore leg north of 54'25'8 and the inshore leg were sampled duringthe day, ~hich explains the lower abundance of megalopae. Oay-nfghtdifferences in megalopae density at the surface were apparent along alltransects Fig, 5! ~
lgeEpg eIe
e=ee IZ QQyxhe Qr DlY
ge Qe
Figure 5. Kffect of tfme of day on the surface distribution of Cancer~aa tate galapas on north-south transects. July lpga, ptaon E t a ce
280
A difference in net efffciency was also observed when the surface bongotows were compared to the concurrently made neuston tows. The bongotows always caught fewer megalopae then the neuston taws ~ This may beattributable to proximity of the bongo net to the ship's hull. Thebongo net was always less than 2 m fron the ship's hull, The megalopaehad 11-18 sec to move away and avoid the bongo net. The neuston net wastowed 20-25 m from the ship's hull and mega'fopae were less likely to beinfluenced by the ship's presence. The bongo net with its 200 kg weightand central bridle may also have been more conspicuous, thus increasingavoidance behaviour.

Horizontal variation in density was evident despite the 'noise' createdby diel vertical migration Fig. 6!. The density of megalopae along thetransects was patchy and had a negative binomial frequency distribution.The mean density along transect 1 when daytime tows were included in theanalysis Table 3!, was 11 times less than the variance, with 50% of thetows having no megalopae in them.
Table 3. Oescriptive statistics for Cancer ma ister megalops abundancecontinuously sampled along north-south transects us ng 5 minute - 650 m! neuston tows,
% Tom with learn deisiiy dmsiQ cfIsaber segsl~ of nmml<qae - azxelqzm
Tive of dlt Trmeect of tovs preet per IX m' 32 52/x per X6 m3
Autocorrelation analysis of the log transformed densities of nmgalopaealong the portions of transects 1 and 3 sampled during the night showeda rapidly decreasing correlation as intertow spacing was increased from1 to 3 tow lengths �.65-92,95 km! Fig. 7!, Autocorrelation decreasedagain with intertow spacings of greater than 6 tow lengths �.9 km! andwas non-significant p<0.01! at spacings of 9 tow lengths � km!.This suggests that under calm weather conditions C. ma ister megalopaeconcentrations are about 2-4 km in size perpendicular to t e current.lf the intertow distance is increased beyond 4 km it becomes possible tocompletely miss sampling a concentration of megalopae. This isdemonstrated by the changes in estimated sman abundance and standarddeviation along transect 1 with variable tow spacings Fig. 8!. As theintertow spacing was increased to 3.25 km i.e. only the results fromevery 6th tow were used!, the mean density estimate and standarddeviations tended to decrease.
281
01541911Ol~
0ay mid1034-1859K-W
Ii!+ os0154-Glg01~
1 137 KA 184 1K11 1L04 X&3 49 53.1 1.43 784 5& 134%
2 68 34/3 03! 0.44 0.%' 2 j24 88 295 0.41 0.99 2.41 GBt
1 37 67& 3 95 54A! 13.77 3i&3 27 44.4 2' 11.97 5'. 1381

TRANSECT I54'25' ~es 254425'
20' 2Cr
1010
540 0 .5 I 1.5 2 2 5
NUMBER/100 m454'25'
5'0 10 20 50
NUMBER/100 mg54 25 TRANSECT 3
20'
IQ'
Ol 50. 0 920
27222»NUMBER/IQO m4
Fig r S. Distria ti 7 Cancer ~mi t aeg ~ Iapa I ~ g t sects1-4, Duly 1984, Dixon Entrance.
282
IsgCgD15
121Cg15'
eg
Iag
I-
IeaCg15'
5' 0 I 2 3 4 5 EeNUMBER/100 m

08LI
g I 5 0402
O 0 0 13 26 39 6.2 66 78 91 104 11.7 130AILONIETERB BETWEEN BTART OF TOWS
6 I r ! 0 2281 f 0 01, II = 141
Figure 7. Autocorredlation of log transformed density of Cancermagister megalopae sa16pled in 5 minute �5I! IB! neuston tows alongtransect 1, 131 45'W, July 1984.
20W Z Al
O Z 10 0 O 20 40 60 BO6TAIIDARO DENIATION
Figure 8. Effect of distance between tows on the estimate of meandensity and its standard deviation in the neuston along transect 1 OixonEntrance, July lg84. Number on plot is number of towlengths �50 m!between end of one tow and the start of the next neuston tow.
283

Discussion
The vertical distribution of megal opec observed in th is study i sconsistent with the results of laboratory behavi oural experix»ntsreported hy Jacoby 198?! and Gaumer �973!. Roth studies found thepbotota is of C. barrister mgatopae to be positi e at lr llgbtintensities but negative at high light intensity. This could arcountfor the upward movement of x»galopae at dawn and dusk; tines of lowlight intensity at. the surface, In the absence of light, the megal apaemay maintain themselves in the upper water column by negative geotaxiswhich is activated by the increased pressure they encounter as they sinkta lower depths. Such a response has been demonstrated in laboratorystudies for the fifth zaeal instar Jacaby 1982!, This behaviouralbasis for depth regulation suggests that the vertical distribution ofC. artist ga lope obs d I bt« i t ld I b f d iOther areaS. SOme variability in depth diStributiOn may be aCCOuntedfor by behaviaural changes with intermolt stage development Hatfield1983!, Strong mixing from wind or tidal currents may temporarilydisrupt these patterns,
To maximize sampling efficiency it is suggested that only the upper 25 mbe sampled, The lower sampling depth should be deeper when strongsurface mixing occurs ~ An undulating bongo tow is the recogmnendedtechnique for sampling megalopae. !t does not, however, efficientlysample the neuston layer and so a neuston tow should be madecancurrentfy, especially during the hours around dawn and dusk.
The 'patchy' horizontal spatial pattern of C. ma ister megalops may haveresulted from the action of fine scale physTca processes. The patchynature of zooplankton spatial patterns is a well recognized phenomenon e.g. Hardy 1936, Cassie 1963, gAiebe !970, Smith et al, 1976!, Physicalmechanisms which have been proposed as causative forces for patchformatian are convergent zones resulting fram tidally forced internalwaves Kamykowski 1974; Zeldis and Jillett 1982; Cobb et al. 1983;Levasseur et al. 1983; Shanks 1983!, Langmuir cells Stavn 1971!,oceanic fronts leldis and Jillett 1982! and mesoscale eddies Gower etal, 1980!, As with vertical distribution patterns, patches aresusceptable to disruption by surface mixing Levasseur et al, 1983!.The dominant components of the physical circulation differ betweenareas, and sa the characteristics of the horizontal distribution ofC. ma ister megalapae will also likely vary, Optiraal horizontal towspac ng w 1 thus have to be established far each new study, Thevertical sampling strategy, however, should be applicable to all areaswhere vertical currents can be overcome by the megalapae.
The authors would like to thank Drs B, Hargreaves, J. Mason and C, 'Noodfor helpful advice and corxments. R. Lainchbury, C. i.awrence. L.Marinelii, G. Roscavitch and J. Thompson helped with collection of dataat sea. The co-operation of the officers and crew of the G.B. REED wasmuch appreciated.
References
Cassi e, R . M, 1963. Mi crodistributian of plankton. Oceanogr, 'Mar.Ri ol. Anngr. Rev. 1: 223-252.
284

Cobb, J, S�T, Gubransen, 8, F. Phillips, D. Wang and M. Systo.1983, Behaviour and dfstribution of larval and early juvenileHomarus americanus. Can. J. Fish. Aquat. Sci. 40: 2184-2188.
Creen, P. B. 1967. Physical oceanography of Dixon Entrance, BrftishColumbia. Fish, Res, Board Can. Bull. 156: 66 p.
Gaumer, T. F, 1973, Controlled rearing of Dungeness crab larvae andthe influence of environmental condftfons on their survival.Cogmxer, Fish, Res, and Oev, Act Closing Rep. Nov. 16, 1975 to June1971. Fish. Coxvn. Oregon, Proc. Rep. 43 pp.
Gower, ti. F. Rop K. L. Denman and R. S. Holyer. 1980. Phytoplanktonpatchfness indicates the fluctuations spectrum of mesoscale oceanicstructure. Nature 288: 157-159.
Hardy, A. C. 1946. Observations on the uneven distribution of theoceanic plankton. Discovery Rep. 11: 511-538.
Hatfield, S. E. Intermolt stagfng and distribution of Dungeness crab,cancer ~ma iste, egaiopae. ch pt 7. p. 85 96. 7, siiid, p.E. and R. N. Tasto. Ed. Life history, envfronment and nmrfculturestudies of the Dungeness crab Cancer magi ster with emphasis on thecentral California fishery resource. C~ai7, Fish. Game Fish Bull.172: 352 pp.
Jacoby, C . A. 1982. Behavi oural responses of the larvae of Cancerma i ster Dana ! to light, pressure and gravity. Mar. Behav.P ys o . 8�!: 267-283.
Jae eso, g. s. The 8 ~ ge es ah � ~ist 6 fish ries ofBritish Columbia: This Symposium,
Johnson, O. F., L. 'W. Botsford, and R. Nethot Jr, The influence of windon larval drift and cycles in Dungeness crab populations: ThisSymposium,
Kamykowski, O. 1974. Possible interacti ons between phytop lankton andsemi -diurnal internal tides. J. Nar. Res. 32: 67-89.
Levasseur, M., J. C, Therrriault and L. Legendre. 1983. Tidalcurrents, winds and the morphology of phytoplankton spatialstructures, J, Mar, Res, 41: 655-672.
Lough, R . G. 1976 . Larval dynami cs of the Dungeness crab, Cancermaqister, off the central Oregon coast, 1970-71, U,S, Hat NMar.PTs~erv� Fish, Bull,, 74�!: 353-376.
Mason, J, C. and A, C. Phillips, 1985. An improved otte~ surfacesampler, U.S. Natl, Mar. Fish. Serv., Fish. Bull. in press!.
Rei lly, P. N. 1983, Dynamics of Dungeness crab, Cancer ma ister,larvae off central and northern California. ~apter , p. 7-84.In Wild, P. W, and R. N. Tasto. Ed. Life history ~ environment andmariculture studies of the Dungeness crab. Cancer ma ister, withemphasis on the central Calfforni a fishery resource. a if. Fish.Game. Fish, Bull. 172, 352 pp.
285

Sameoto, O. D. and L, 0. Jaroszynski. 1969. Otter surface sampler: anew neuston net, J. Fish. Res. Board Can, 25: 2240-2244 ~
Shanks, A. L, 1983. Surface slicks associated with tidally forcedinternal waves may transport pelagic larvae of benthicinvertebrates and fishes shoreward, Mar. Ecol, Prog. Ser. 13:311-315.
Smith, L. R., C. 8, Miller and R. L, Holton, 1976. Small-scalehoriZOntal diStribution Of COaStal Cupepods, ,1. EXP. Mar. Bi Ol,Ecol. 23: 241-253.
Stavn, R. H, 197 1. The horizontal-vertical distribution hypothesis;Langmuir circulations and ~Oa hnia distributions, Limnol.Oceanogr. 16�!; 453-466.
Niche, P. H. 1970. Small-scale spatial distribution in oceaniczooplankton. Limnol. Oceanogr. 15: 205-718.
Zeldi s, J . R. and J. B. Ji 1 lett . 1982. Aggregation of pelagic Muni dere aria Fabricius! Oecapoda, Anomura! by coastal fronts andnterna waves. J. Plankton Res. 4�!: 839-857.
286

Modeling a fishery characterized byuncertain resources and a multi-
purpose, heterogeneous fishing fleetthe Eureka Dungeness crab fishery
J. j. FletcherPurdue UniversityWest Lafayette, indianaand
W. E. Johnston and R. E. HowittUniversity of CaliforniaDavis, California
Abstract
The principal goal is to develop a method to analyze the economiceffects of fishery management policies when: �! the biologicaldynamics of the fish stocks are not known; �! the fishing fleet ismultipurpose I.e., capable of fishing in more than one fishery eachyear!; and �! the fishing fleet is heterogeneous i.e., composed of smixture of vessel types snd configurations with differing coststructures!. The methodology is developed in an application to theEureka Dungeness crab fishery on the northern California coast.
Fisheries economics has been dominated by the application of thecannonical model of s renewable resource with suitable bioeconomicgrowth relations assumed known or estimable. However, growthrelationships have not been quantified for many species of interest, andthe data necessary to do so do not appear to exist today. Additionally,most models include s single species harvested by a homogeneous fleet,while commercial fishing fleets are often composed of a variety ofvessels. Their operations are better described as multispecies harvesting a number of species simultaneously!, multipurpose harvesting different spaciee at different times of the year!, or both.
Problems with theoretical models do not alter the necessity offormulating management policies for fisheries, nor do they diminish theneed for economic input into this process. What is necessary isrecognition of both the limitations of the traditional approach and theneed to develop alternative approaches that are applicable using thedata now available.
We present an approach to quantitative economic analysis of commerci.alfisheries useful for policy modelling given current limitations. A
287

simulation model of the behavior of the Eureka crab fleet is developedincorporating Lnterseasoual dynamics of the biological populationderived from a multiple time aeries model and intraseasonal dynamicsbased on a behavioral model af fleet behavior. Iu the absence ofadequate bioecanomic models, a multivariate, linear, time series madelof the Box-Jenkine type can provide adequate intertemporal relationshipsfar certain policy evaluations. The intraeeasoaal behavior of acommercial fishing fleet in an open-access fishery under the broader setof assumptions is explained and combined with the interseasonal timeseries output ia a Monte Carlo simulation of the Eureka Dungeness crabfleet in order to assess the effects of alternative managementpolicies.
The effects on the simulatiaa autcomee provide insight into thereactions of the fleet to management decisions. Results for eachscenario are compared to results of a base run made under the currentstructure of the industry. The changes in outcomes far each scenariofrom the base run are interpreted as the estimated effects of managementpolicy.
introduction
The abstract of this paper describes the general thrust of work reportedin the senior author's dissertation Fletcher 1980! aad more recently,in a more succinct form Fletcher et al. 1984! ~ The present proceedingspaper sleo reflects the research attempt to summarize revenue, cost, andother vessel characteristics of the Northern California ar EurekaDungeneee crab fleet Fletcher and Johnston 1980, Fletcher snd Johnston1984!.
Da s of fishi average year!Crab AlbacoreSalmon
-percentage-
VesseL size:
39 foot, and smaller40 to 49 faut50 foot, snd larger
403327
242848
54388
The interaction of these two characteristics manifests itself in theapparent higher specialization of smaller vessels on Dungenese crab sndon salmon. Furthermore, fleet behaviar ie also influenced by relative
288
Two important characteristics of this fleet are, first, that it is~lt 92 ~ h t.t t * i 1 tt fl p t 11 dig fcrab, salmon, and albacore at Califarnis ports and, in addition, landsalmon and albacore in Oregon. Thus, vessels participating ia theEureka Dungeness crab fishery often operate in two ar more fisherieseach year. The second characteristic of the fleet is its heterogeneousnature which affects vessel efficiency in alternative fisheries viacapacity and configuration characteristics. For example, the percentagedi.etributian among the three fisheries varies considerably by vesselclass in an average year of harvest:

shifts among the three fisheries co the extent permissable, by capacity,coafiguratioa and other vessel constraints in years of below or aboveaverage harvests. Total days fishing, as reported by Eureka vesseloperators, on the three fisheries ia the aggregate, were:
Da s of fishiAbout-average
Yeargelow-average
YearAverage
Year
Vessel size:
39 foot, and smaller40 co 49 foot50 foot, and larger
60 days90 days
100 days
100 days135 days140 days
l40 days180 days180 days
Additionally, there is considerable variation in fleet size ia absolutenumbers the Eureka crab fleet was defined to include only vesselslanding at least 1,000 pounds of crab at north coast ports over theseason, based oa California Department of Pish and Game CDPG! dataj.The number of vessels identified in the fleet over the past two decadeshas varied from a low of only 20 vessels in 1974 to a high of 181 in1977, only three years later.
In an important way, cycles in abundance among the three fisheriesiaflueace fishing eftort via landings aad ofcea inversely-relatedprices and/or expected revenues!. Sor example, the senior author earlyobserved apparent correlations among Dungeness crab and king snd silversalmon landings; acceptable biological models to explain that behavioris noc yet clearly known Botaford et al. 1982! . Thus, theseinteractions aad the uncertain nature of the fisheries importantlyinfluence harvests and the economics of the Eureka Duageness crabfleec.
289
The paper proceeds with a section describing the fishery ia more detail,fOllOwed by a general deatriptiaa Of the aaalytital mOdel utilixed insimulating the fishery under open access aad under several alternativemanagement policies. The analysis differs importantly from that whichWOuld be logiCally prOpcaed at a COnfereaCe Such SS thiS Where thetypical participant is likely to be a biologically-orieated scientist ormanager. It was our assessment that necessary biological models werenot yet available with sufficieat precision to provide a bioeconomicmodel of tbe fisheriee. We use a statistical time series approach whichcombines all available information contained in data sets of biologicalaad economic variables to provide short- to medium-run estimates ofvariables we identified as important for future policydecisioas � namely, crab and salmon revenues aad fleet size or capacity.The multiple time series approach used can be considered che "positiveeconomic" analog to the usual bioeconomic approach, which if and whenavailable with precision caa displace this sort of analog ia futurepolicy analyses of management alternatives.

The Eureka Dun eness Crab Fleer
Characteristics of the fleet
As noted above, most vessels participating in the fishery aremultiple-purpose vessels capable of operating in two or more fisheries,vith the ability to participate in additional fisheries varying withsize and configuration characteristics. The analysis simplifies theheterogeneous nature of the fleet by using two representative types ofvessels. "Small" vessels represent vessels under 40 feet in Length,typically crabber-trollers primarily active in the crab and salmonfisheries and, to a much lesser degree, in the albacore fishery when themigration passes close to shore. "Large" vessels in the 40 foot andlarger class are of two distinct types: trollers and trawlers. Theformer ate owned predominantly by albacore highliners � those who followthe albacore migration from southern California waters north along thecoast from early summer to late fall. The travlers ars of tvo types:those dragging for groundfish and those trawling for shrimp. Hostdraggers participate in the crab fishery only during years ofexceptional abundance, whereas shrimpets appear in tbe crab fishery mostyears.
The above classifications are rough characterizations of the types ofvessels operating on the north coast. Because the number of trawlvessels that operate in the crab fishery are small, the study assumesthat the activity of the crab fleet can be approximated by that ofrepresentative "small" and "large" crabber-troller vessels. Koredetailed information on the production patterns, revenues, andassociated coats sre given in FLetcher and Johnston �984!.
Landings, values, and exvessel prices of crab, salmon, and albacore fotthe period, 1946-1981
As defined in the study, the Eureka Dungeness crab fishery includeslandings st Fields Landing, Eureka, and Trinidad on the notth coast ofCalifornia. Seasonal crab landings at these ports are characterized bya tea-yesr cycle. Similar cycles have been noted for other crabfisheries along the vest coast from San Francisco to British Columbia.The change in landings from the low to high point in the cycle vasespecialLy evident in the 1974-77 period, Although price vss a recordhigh, both landings and value reached a postvsr low during the L974season. Two years later the exvessel value peaked at nearly $8 million,a 26-fold increase. Landings set new records the folloving year vhen11 million pounds of crab were landed during the 1977 season, up sharplyfrom the 1974 season total of less than 200,000 pounds.
Landings, values, aud exvessel prices for 1946 through 1981 are given inTable 1. Because of marked price changes over the period of study, alleconomic data are presented in terms of "real" 1980 dollars, "Real"1980 dollars sre obtained by dividing annual nominal prices by theCOneumer PriCe lndeX GPI! fee that year. The number Of VeSSelS landingat Least 1,000 pounds of crab at Eureka ports is also reported for the1954-1981 period. Figure 1 depicts patterns over the period forlandings, vsluee, end vessel numbers. Natu the generaL ten-year patternin Landings. Five or six years of above average landings are followedby four ot five years of landings belov average.
290

J0 t,5 C.4 4CC 8 5
5'5 5 44
v 4 a 5 4 00 aze5 d 5 45 OK-»»« 0
5 5'5~ I5
55 C
D 4O I 5 I
I
5 5
0 4 5* 5 5 4 5 4 I0 0 0 0 O DaDao 0 oo 0 oOODOOOI
IC
55g
I 55
58 0
C5 ca
5 a5
h «0 5' 4 5' oo 0 o 4 c 4 da 50r 0 O O0»aor4 Ia
'0 0add~ raadI » 4
5 O
C53 a5
ICI 05 4 0 45
5~ I
55O Oa a
00 5'aoavl
0 4 rdad445 4 55»
V 5
e
5
C 5 4 0 I I
' ~e 55 5VI55'55-
CP5
5It
~ ~ICC Vl5 5 5
4 e
5~ ~5'5 ~0
0 55 55
55 5 58'
r-e 0 "elR~ 'Od rd ««»» 4 o ad0 44 00
alI
5 VC4 5 5
4 55
C 50
291
ed
5
IEI5 a00 4
I
50
C5e 50 e
~ 55.5 5
540 ad- 4 v aoaddl VD 04 I I 5 ra 00 cl 4 dr o taI
050440.54 l4404 44»o 0 405 5 oza 4 4DIV 0 04 4 4 5' 0
CI 0 ~ d«add'4 I0404oaO484000««dt dddd'Dad.I04d
~ '5'5'5'5 ~ ~ ~ 44'Clalv'00»«o la»0405'CD td 4 4 4 5C C C 5 C C 5 C
40 ~ 4440 0 ro Ooe 5 4 0 4«« I I 4 4 0 5 l4 I 0 4 5 4Daaooaa ~ a ~ aooaaaaoaooooodd ~ 5 odi coo
o 0 OO I I Dcto 4 Dao 40««
d5 4 do td»0 4D4445' I4 l4 0 4a did dta 4 0 4«d 4
5 0 0 5 92 4 0 5 0 4 I 5 O I 4 4 5 5 5td4«d I 44 ~ 44o44445505 005
J 55 55 55I 5
5V'55 5
5 5 55 C 5Vt tt5 4
55
55
i 445
a5 5I5
5 g5
5 'll5455V
5 aV0dl

tars tees1 Sea tsve 1 Sss t eee 1 Sea ter S
Figure 1. Eureka Crab DataNu arbor Ol arab boate � by 10!Crab landings mtttions ol pounds!
...........,...,, . Ervssest value rnNons ol 10M dottsrsl
Economically, value price times total catch! is more important toindividual operators Ln the fishery than are landings. The percentagechange in value between high and low points in the cycle is less rhanthe percentage change in landings. That is, the effect of changes incatch on gross income is moderated, since prices are high low! in yearsof low high! landings. If the change in price is large compared to thechange in catch, value and catch may even move in opposite directions,For example, sharp price declines from 1976 to 1977 lowered the value14 percent despite a 30 percent increase in catch.
The number of boats in the crab fishery follows the same general patternas the landings and value data, but with peaks and troughs general.lyoccurring one or two years later. The increase in the number of boatsas value declines e.g., between 1959 and 1960, 1970 and 1971, 1976 and1977! may reflect the fishery's delayed r'esponse to economic factors.
The salmon data contained in Table 1 pertain to all commercial salmonlandings from Fort Bragg to the Oregon border � the "Eureka Area" asdefined in data reports of the California Department of Fish and Game.Landings and values, shown in Fi.gure 2, closely track each other throughthe mid-1970s, when values increased sharply relative to landings due tosubstantial price increases.
292

1050 10051070 1075 1000
Figure 2. Northern California Salmon DataSalmon landings reit!tons ol pounds!Exressel Value rnggons ol 5 990 dollars!
It is especially difficult to find data on the albacore fishery whichare representative of the opportunities relevant to Eureka vessels. Forsmaller boats, the distance from shore during the summer migration hasmore effec.t on cat.ch of albacore than has actual abundance. As distanceincreases, greater numbers of smaller boats are precluded from thefishery due to restricted fuel capacity and safety considerations.Thus, the California albacore data, contained in Table 1 are moregenerally applicable to larger vessels, often operated by highliners,Albacore landings reached a peak in 1950 and the landings have trendeddownward since. However, the decrease in landings since 1915 has beenpartially offset by gradually increasing prices as shown by theconvergence of the value and landing lines in Figure 3.
10
1055 1000 1$0$1070 1075 1000
Figure X California Albacore DataAlbacore landings millions ol pounds!Exvessel Value mitt!one of 1990 dollars!
Z93

Exvessel prices of crab, slamon, and albacore for the postwar years aredepicted in Figure 4. Crab prices have followed a cyclical pattern,moving gradually upwards. Prices tend to be high when landings arelow � most obvious during the 1973-75 period; then prices drop whenlandirgs increaser as happened in 1977 ' Salmon prices followed anupward trend through the early 1960s, leveled off until the mid-1970s ~and then increased sharply, nearly doubling between 1975 and 1979. Noteespecially the increase in salmon prices relative to those of crab andalbacore. Albacore prices were strong after the war, but droppedthrough the 19%Os and remained rather constant through the 1960s.Prices trended generally upward during the 1970s except for reducti.onsin the period 1974-76. 92 Ne rem
INIFigure ~ . gvvmeel prloee � egg dogare per pound!
Awrage euveveel salmon prloeAremge evrevivu arab prleeAVerage numeral aguveem perm
Summary of the Analytical Model
While the proceedings of this symposi.um may reveal more preciseknowledge of the causal dynamic relationships in the fisheries importantto the Eureka Dungeness crab fleet � most importantly, the crab andsalmon fisheries--our evaluation in the mid to late 1970s was that thebasis for building reliable bioeconomic models for those fisheries wasnot at hand. We, thus, sought an alternative approach which mightpermit the modelling of fleet behavior and responses to managelgentalternatives. The basic components reflect fleet. dynamics resultingfrom the aggregate of individual vessel operator decisions--in our casethat of representative "small" and "large" crabber-trollers � thatinclude arguments for expected returns to par'ticipation in a fishery asa function of price, abundance, variable costs, and t.he total number ofother participants.
The problem of ruodeling the dynamics of fleet entry and exit is centralto the problem. Qne approach is to consider fleet behavior directly.Assume fishermen form their expectations of fleet size rationally. In
ethe aggregat.e, expected fleet size, N , adjusts in proportion g! to thet'
Z94

present value of expected returns, Y . shen the cost of switching istsmall and the decision can be revised annually, a fisherman need only beconcerned with the expected profitability each season:
ewhere R is the cxpecced total revenue generated by the fishery
during the season andeC is the expected cost of production.C
Revenues depend on the expected fleet size, expected abundance of thes e
resource, A , and expected pri.ce, P
�!
These relations define a pair of implicit simultaneous equations infleet size aud revenue variables that are embodied in the sought-forbioeconomic models! and a set of exogenous variabLes.
The time series on fleet capacity developed for this study correspondsto fleet capacity each year in terms of a sCandard measure of fishingeffort Bannesson 1978! . Let St, Yst and Lc, YLC be, resPectively, thenumbet of vessels and the total landings, of the small and la~gesubfleets each year. If the unit of effort is defined as a vesselfishing for a season, the catch-per-unit-effort CPUE! is the averageannual crab catch per vessel. The ratio of the CPUE of large boats CoChat of small boats defines the relative efficiency of large to smallboats, REC. That is, the fleet capacity in small boat unite each year,Fc, is given by;
Pt Lt YLC7LC!i YSC7st! + sc st YLtiYst + 1! �!
lhe average measure of relacive efficiency over the 1954-1977 period was1.25 a one tailed test of equal average efficiencies was rejected atthe I percent level!. A regression of the natural log of the relativeefficiency measure against time indicated no bias in technical
295
Entry and exit decisions by fishermen depend on revenue, not catch .Previous crab demand studies Wix 1976; Erickson 1975! indicate Chat theprice of King crab and personal income in California are significant inexplaining the exvessel price of Dungeness crab. In the absence of adynamic model describi.ng these variables, a multivariate time seriesmodel is used in this study. It includes any past trends in a dataseries regardless of the cause. A reflection of underlying behaviorrelations including price variability is obtained using harvestrevenues, rather than quantities. The analysis is based on thesi.multaneous modeling of three data series on �! crab revenues,�! salmon revenues, and �! crab fleet capacity.

efficiency gains. Thus, the effective fleet capacity In small boatunits was calculated from subfleet data using the estimated relativeefficiency of 1.25 for large vessels.
A jOInt eOdel Of the three revenue and capaCity Seriee failed tO prOvidesufficiently accurate one step ahead forecasts of Eureka crab revenues.The difficulty was traced to an extreme jump in the crab revenue seriesbetween 1975 and 1976. Given that this change was an anomalyindependent of the usual structure, intervention analysis a dummyvariable technique! was used, with a pulse variable equal to one in 1975and zero elsewhere introduced into the model. As a consequence, thewithin sample forecasts over the 1968-1981 period were improvedsignificantly. The empirical model is specified and discussed in moredetail elsewhere I>letcher 1982; Pletcber et al. 1984!; its existencesuffices for the purpose of this presentation.
Partioular prOblemS aSSOCiated With multipurpeae, heterogeneOue fiahingfleets have only tecently been treated in the literature Nuppert 1979;Anderson 1980; Holt 1982; NcKelvey 1983!, The model used iu the studyhas similarities to those of Bolt snd NcKelvey. An implication derivedfrom the model is that, in addition to the usual economic iue ficienciesthat arise under open access, there sre also efficiency losses due rothe heterogeneous composition of the fleet.
To model intevseasonal fleet-behavior, ooe can abstract from thebiological dynamics and concentrate on recruiteent, Rq ~ and escapementSj, for each species. Escapement differs from recruitment only througfitotal fleet harvest, H~. All other interactions are relegated to theI oterseasonal model, wf>ich alsO takes as given any current regulationdesigned to protect the reproductive capacity of the stock, e.g., gearrestrictions and season limitations. This framework is appropriate forfisheries such as the Dungeness crab where growth and reproduction occurprimarily during the season closures.
ignoring natural mortality, tbe stock of fish for each species, xj t!,decreases over the season as fish are harvested. The fishing season foreach species has maximum lengthy Tj> either through regulation ornatural availability. To avoid confusion, each fishing unit is referredto as a vessel. The catch rate per vessel, hI t!, is assumedproportional to the total stock by the catcbaSility coefficient, qj sothat hj t! qjxj t! .
Let Ni be the number of vessels in subfleet i. All Ni vessels fish forspecies j until switching time tij, where tij Tj The number ofvessels active in fishery j at time t, Nj t! > is represented by the stepfunction;
Nj t ! ZNij t! Nij t! Ni t < tijI
'Nij t! = 0 t > tij�!
xj 't!qjNj t!xj t! �!xj�! Rj and 0 t < Tj
296
Nij t! thus represents the number of vessels in subfleet I fishing forspecies j at time t. The stock level decreases by the total fleet catcheach day:

Total fleet fishing effort for any species up to time t, Fj t!, is thetotal number of vessel-days fished ro that point.
Fj t! ~ Hj t!t + I Hktkj k tkj<t! �!
Solving �! for xj t!, the fish stock during the season and theescapement can be represented by:
xj t! m rje j j 0 < t < Tj �a!
dxj lj! Sj �b!
This function is continuous, bounded, and differentiable at all but afinite number of points and therefore integrable on O,T]. The exvesselprice for each epeciee, pj, is assumed constant over the seasan. Eachvessel from fleet i hae annual fixed costs, Ii, and constant operatingcosts per dsy in fishery j, cij, which can include opportunity costsassociated with alternative fisheries. Annual profit for a classvessel ie, tbus, represented by;
o
Under open access, each fisherman seeks to maximize profits by choosingeffort levels in each fishery, ti~, given seasonal constraints ~ Tj, andthe number of vessels in each subfleet, Ni. Ae the second orderconditions are guaranteed by the functianal forms, tbe first orderKuhn-Tucker conditions FOC! represent conditions for a maximum:
pjqjRje j j ij � ci' ui' < 0-q F ti ! 9a!
9b! Tj - tij! > 0
asia ,j!tij - ah7auij! pij 0
tij! Og uij! 0
9c!
9d!
To this point, the number of vessel classes and species has not beenspecified and the FOC are applicable ta any number of species and vesseltypes. Considering the diverse nature of the fleet active in fisherieesuch as the Dungeneee crab, daily casts may be expected to vary
297
Assuming a vessel participates in a given fishery, equation 9a!emphasizes that each vessel fishes until daily revenue is reduced todaily caste or the eaasou ends. If the season ends first, uijrepresents the profit rate at the end of the season for speciee j for atype i vessel, or equivalently, the amount a fisherman would pay to fishan additional day-

substantially among perticipaats . If daily costs include opportunitycosta for both the vessel aad the captain, the variation across thefleet increseee. Considering the necessary conditions for profitmaximizatioa, the decrease in effort observed as the season progressesis seen as a reflection of rational decisions by participants tomaximize profits. Vessels with high costs may fish for s given speciesfor only a short time while those with low costs may continue to fishthroughout the season.
The necessary conditioae csn also be need to show the relationshipsamong Wily cost, price, sad escapement. Choose i to represent thevessel class with minimum daily costs in fishery j, say cij'. Solviogthe revenue for the last fishing day of a type I vessel on species j andusiag tbe complementary slackness conditions 9c!, one gate:
~iV tS' �0!
Escapement for aay stock is then inverse1y related to price aad fishingeffectiveness technological inputs! and directly related to dailyvariable costs of the most efficient vessel. If ulj is zero eo that theseason constraint ie not binding the usual case for meay open-accessfisheries!, equality holds in �0! aad escapement is determined bymarginal profitability conditions. If the season constraiat ie binding,these conditions set a lower bound on escapement. If annual ecoaomicprofits are zero for «11 vessels, the number in each subfleet ie inequilibrium in the sense that there is no iucenti.ve for additional boatsto eater or for any participant to eirher leave or invest in changingvessel characteristics.
Mote that an equilibrium under open-access for a heterogeneous fleetimplies an additional kind of inefficiency. Whereas loss of efficiencyby s homogeneous fleet results from the operation of aa excess number ofvessels, an additional lose results from excess usa of relativelyinefficient vessels over at least e portion of the season. This can beeasily seen by assuming that �0! is an equality, so that the mostefficient vessel stops fishing before the season ie fiaished. Lessefficient vessels with higher variable costs would have quit earlier inthe season, but would have still fished too long for social optimslity.Tbie follows because social costs could be reduced by restraini.ng lessefficient vessels eo that the more efficient vessels could fishthroughout the season. Coasequently, costs could be reduced without ereduction in fleet eire.
The simulation model was ultimately developed to aid understanding ofthe behavior of open access fishing fleets, to study the effects of aset of proposed management alternatives on fleet behavior aad toevaluate the economic effects of these management alternatives on thefleet. Tbe model simulates crab fleet capacity aad crab revenuee,capturing both intra- and interseasonal fleet behavior. Theinterseasonsl dynamics are derived from tbe multivariate time seriesmodel. Intreseasonal behavior is based on the behavioral model modifiedto reflect characteristics reflected in tbe historical behavior of thefleet.
298

Characteristics peculiar to the Dungeness crab fishery are included toobtain a model adequate for policy analysis. For example, processorshave often imposed restrictions or quotas on the quantity of crabpurchased daily from individual fishermen during the first pert of theseason. The effective opening of the crab season was delayed by pricenegotiations at least one month for five of the eighc seasons in the1970-77, All vessels do not fish crab for the same length of time; somefish for a few weeks while others ffsb for crab throughout the season.
The salmon fishery is not a singLe stock of fish, but rather is amultispecies fishery composed of king and silver salmon. Each of thesecan be further divided by stream of origin. All of the fish do notenter the fishing grounds simultaneously, but arrive over an extendedtime. Thus, catch per vessel per unit tfme fishing is relativelyconstant over a substantial portion of the season and the salmon ffsherydoes not seem to have exhibited the same crowding effect as the crabfishery durfng the period of analysis.
Crab fishing patterns vary according to characteristics of individualvessels. Since larger vessels have higher variable and opportunitycosts Fletcher and Johnston 1984!, as catch declines over the season,they tend to quit fishing for crab sooner than smaller vessels.Differences in cost factors are captured by dividing the fleet inro twosubfleets for each year.
Fishermen still fishing crab when the salmon season opens have anadditional dec.ision to make. They not only consider the profitabilityof fishing crab versus not fishing, but must consider the relativeprofitability of continuing to fish for crab versus swf.tchfng tosafmon.
The dynamic "positive economic" model used fn the absence of abioeconomic model consists Of a set of stochastic differanre equationsderived from the multivariate time series model. The differenceequations provide the values for: �! the initial capacity of theEureka crab fleet each year in small-boat units ~ Ft, �! a season totalfor crab revenues available from the Eureka fishery in 1980 dollars,TCRt., and �! the annual value of the northern California salmonharvest, TSRt, also in 1980 dollars.
Intraseasonal behavior is a discrete time monthly! version of theprofit maximizing short-run models described by equations 9a-d!. Themain simulation routine consists of three nested loops. The inner loopis the model of intraseaeonal behavior and performs a month-to-monthsimulation of the fleet capacity and size of each subfleet. Revenuesfor individual vessels, each subfleet, and the entire fleet arecalculated given the initial data provided by the interseasonal model.The middle loop represents the interseasonal model and controls thesimulation over a period of years. For each year to be simulated, thedifference equations are evaluated and updated to provide forecasts ofthe seasonal crab revenues, annual salmon revenues, and the capacity ofthe crab fleet at the start of each season. The outer loop performs aMonte Carlo experiment on the output variables of the simulation model.The simulation over the entire time horizon is repeated and thestatistics for various output variables are calculated for individualyears and the entire simulation period.
299

Summer of Selected Simulatian Results
The simulation model was used to examine the effects of landingrestrictions and potential management policies on the fleet and thesocial benefits attributed to the Eureka crab fishery. Randomsimulations over the 1982-1991 cycle of the fishery were computedassuming alternative policy scenarios snd compared to those of a runmade under the then current institutional structure of the mfd- to late1970s. The alternative sceneries considered included the effects ofuniform lending quatas for all vessels, of limited entry programs farthe Eureka crab fishery, of a unfform coastwide January first seasanapening, and the effects of single species management policies an amultipurpose fleet. Empirical results are discussed in detail inPletcher �982! snd fn Pletcher et al. �984!; here we presentqualitative summaries of the outroees generated by Honte Carlorepetitions of the simulation model. These conclusions result from meanstatistics from an average of 100 iterations of the simulation modelover a ten-year period spproxfmating the average length of recent cyclesin the crab fishery.
Impacts of marketing restrictfons
By the 1970s, the intensification of fishing effort on the Eureka crabstock resulted in large landings during the first few weeks af mostseasons, with the consequence that tbe harvest capacity of the fleetsurpassed the capacity of buyers to process and market the catch. Inadditian, the local bargaining unit negotiated crab and salmon prices toinclude a provision that proeessars were obligated to buy from allmembers of the unit, and the unit was to be open to all fishermen whowished to Joini The agreement, thus, tended to exacerbate the problemaf redundant capital by praviding a ready market for all new entrants,and as fieet capacity inereasee, so dfd total landings during the firstpart of the season. Proressors reacted by limiting the amount of crabthey weald buy from each fisherman each day.
The limits were primarily implemented as daily quotas pet boat and vereindependent of boat capacity. The efi'ects of such restrictions wasconsidered by comparing simulation results under alternative relativeefficiency sssumptfans for large vessels. The average effi.cieney ratioover the historfeal period was estimated to be 1.25, but observations onyears of average landings when fewer restrictions were imposed indicateda value of 1.50-1
The simulation results fmply that uniform landing restrictions on allvessels as imposed by processors in the past had a disproportionatelyadverse effect on larger vessels with higher costs and largercapacities. The varying effects on vessels types of the quotas used byprocessors to limit production causes distortions in the production
The effect of changing the assumed relative efficiency from 1,75 to1.50 is significant. Simulations based on the continuation ofhistorical, open-access fleet behavior were performed assuming arelative effiefeney of 1.25 and 1.50. Met revenue per large boat permonth increases by more than $1,200; this may be taken to be areflection of the costs of restricting the productivity of largevessels.
300

patterns of heterogeneous fleets. Any policy based in quotas has thepotential for substantial equity problems and management plans shouldrecognize possible asymmetric effects of policies among participatns ina heterogeneous fleet.
By the L980s, some operators have been able to establish new markets andare fishing without landing restrictions, thus reducing the effect oflanding limits. To reflect the ability of larger boats to now fish moreproductfvely, the relative efficiency value of 1.50 is used for theremainder of the policy simulations
Limited entry programs
Several NonCe Carlo simulations were run to examine the effect ofmaximum fleet size capacity! on revenues, In the open-access fisherywhere there were no maximum fleet size specified, net revenues for bothLarge and small boat classes were negative indicaring entry in excess ofthe open access equilibrium, implying that revenues were not sufficientto cover all of the long-cun costs � variable and fixed costs.
The effect of lowering the capacity constraint is not large until thelevel of 100 units of small-boat capacfcy is reached . As the capacityconstraint is lowered further, remaining vessels fish longer. ForLimits of 60 units or lees, the average season length approaches thelegal limit of eight monChs showing greater capital utilization. At thesame time, the average coral fleet revenue decreases since fewer boatscatch slighCly fewer crab. Net revenues for the fleet increase untilthe capacity reduction effect exceeds the cost savings. At first, Cheloss in value to the consumer is smaller than the gain in net revenue.The decrease in catch is more than offset by the cost savings, so theincrease in producers' surplus must exceed any loss in consumers'surplus. To this point, the change in social welfare from management ispositive. The gain exceeds the loss unr.il the fleet size is reduced to50 units. The model indicates a gain in net revenue of over $850,000per year from a policy limiting capital to 50 units compared to theopen-access fishery. Since total revenues decrease by only $LS7,000 'the fleet size of 50 units would appear to be socially preferred amongthe alternatives compared.
Thus, the analysis of the historical profit structure of Che Eureka crabfleet indicates that encty into that f'shery has been in excess of theopen-access equilibrium . Assuming the open-access framework continues,the sLmulation results for the next ten years indicate the problem ofexcess capacity will remain but that total fleet capacfty is likely todecrease moderately from current levels. Substantial benefits can beobtained by limiting and reversing! capital investment fn the fishery.
Uniform coastwide crab season opening
The possibility of changing the opening date of the crab season toprovide a uniform cosstwide opening date has been discussed in therecent tri-state-federal study Pacific Narine Fisheries Commission,1978!. The effeCte Of Changing, the Opening date Can be Simulated Withinthe model by delaying the north coast opening until January first. Thepolicy wss Chen considered for rhe traditional open-access fishery andin conjunction with the limited entry outcome of constraining the fleetto 50 units.
301

It fs obvious that fn order to maintain the same aanual laadings for sshorcer season, s larger fleet would be required. Net revenues must, asa coaaequence, decline. A coast-wide January I uaiform season opeafagfor the Dungeness crab fishery would have little impact underopen-access. Under restricted entry, a shorter season would require alarger fleet to mafntafn the same harvest levels. And when capacity fslimited, an additional cost must be added to the impact of chaagiagseasoa lengths ia the analysis. Interactive effects of the two policiescannot be igaored. There sre, thus, real costs to changing the startingtime of the season ff tbe fleet capacity were approximately optimal.
Cross effects of salmon msaagement on the crab fishery
It wss hypothesixed that economically important interactfoa effectsoccur when simultaneously available species are harvested by amultipurpose fishing fleet. For the maJority of Eureka Dungeness crabfleet effort, the most common alternative species harvested fs salmon.The simulation model caa be used to examiae some of the possible crosseffects of implementing single species maaagement policies oacomplementary fisheries harvested by a multipurpose fleet. Such wereconsidered in several salmon-crab interaction examples, but results weresuch that cross effects were aot significant.
The legal seasons for crab snd salmon have historically overlapped fromthe April 15 start of the salmon season until the ead of the crabseason. However, few of the crab vessels were aormally active in thesalmon fishery prior to Hay 1. The initial hypothesis that interactionsare important wss, thus, aot substantiated by the simulatioa results,aad not surprisingly, givea tbe lack of substantial actual simultaneousfishing for crab and salmoa. Under open-access, the crab season is overbefore the salmon seasoa begins. When a capital limiting policy isimposed on the crab fishery but the salmon fishery remains open-access,crab are so profitable that salmon are igaorad se a more attractiveeconomf c alternative.
Since the opening of the salmon season hse often bees delayed byfisheri.es managers over the past few years, an obvious test wss toconsider the impact of such closures on the Eureka crab fleet. Again,there was aoae, given recent fishery patterns of the north coast fleet.Historically, the crab fishery is already terminated for much of theeffort before the salmon sessoa is opened. Eesults are identical forboth the open-access and limited entry scenarios.
The Research ~ends
This paper develops aa approach perhaps useful ia asaessiag the impactsof alternative management policies. The application to a heterogeneous,multipurpose fleet with stock uaCertaiaties fa s aovel approach using a"positive economic" analog to the more desirable bioeconomic approach.The insufficient precision of existent bioeconomic models for thesefi.sherfes make the particular approach takeo both feasible and ofsufficient long-tern validity to warraat further modification snddevelopment lending to clearer evaluation of managemenr. alternatives.We, of course, would applaud the concomitant development of improvedbioeconomic models as well.
302

References
Anderson, Lee G. 1980. "The Economics of Hultipurpose Fleet Behavior,"processed paper, College of Hsrine Studies, Department ofEconomics, University of Delaware.
Botsford, Louis W., Richard O. Hethot, Jr., and James E. Wiles. 1982,Cy It C t t I h 9 lif I RIHf tl I ~dh *h
~tt h!,SII SI O.gt h!dDgCb Ct !9th,"Ptl Blitt ~ .
E I 1, I Ed d. 1971. h E I ~gd f C ~PCP bl: 91 ~ g C 9 yt*h y th ~ght t C t,unpublished Ph.D. Dilssertation, The University af Hichigsn.
PICh,J ldJ. 1981. ~!H F~Nltl R ICh~gc~cfci She I hEbc*bFlhy,unpublished Pb.D. Dissertation, University of California, Davis.
Fletcher, Jerald J. and Warren E. Johnston. 1980 ' "VesselCharacteristics and Summery kReport af Landings and Revenues of theBorthern California Crab Fleet: Cosstwide Summary Data Base1974-76," U.S. Department of Commerce, National Hsrine FisheriesService, Southwest Fisheries Center, La Julia, CA, AdministrativeReport LJ-81-04C.
Fletcher, Jerald J. and Warren E. Johnston. 1984. "An EconomicAnalysis of Eureka Crabber-Troller Vessels," University ofCalifornia, Division of Agriculture and Natural Resources, GianniniFoundation Information Series So. 84-1.
Fletcher, Jersld J., Richard E. Rowitt, end Warren E. Johnstoa. 1984 '"Hauagement of Multipurpose, Heterogeneaus Fishing Fleets UnderUncertainty," Department of Agricultural Economics Working paper,University of California, Davis, 35 pp ~
Hannessoo, Rognvsldur. 1978. Economics of Fisheries, Oslo:Universitetsforlaget,
Holt, Suzzaue. 1981. "Hultipurpose Fishing Behavior under Open Accesssnd License Limitation," processed paper, Crown College, Universityof California, Santa Cruz, October.
Ruppert, Danniel D. 1979. "Implications of Hultipurpose Fleets andHixed Stocks for Control Policies," Journal of the FisheriesResearch Board of Canada, 36�!: 845-854.
HcKelvey, Robert. 1983. "The Fishery in e Fluctuating Environment:Coexistence of Specialist and Generalist Fishing Vessels in aNltppFI**,"J I fB I *tlg I ~7HC,10�!; 287-309.
P lft tl I Pth t* C I I . 1978. ~DC 9~PC fth St t -Pd I~M~P. P tl d. OR
ill*, J h R. 1967. S 8 I C ld I 1 ~IH" " C b~MI 1, p blt hg N.S. Fh I, Il g St t ll t *I y.
303


Proposed explanations for fluctuationsin abundance of Dungeness crabs: A
review and critique
David G. HankinHurr! boldt State UniversityArcata, California
Int r od uct i on
Dramatic fluctuations in commercial landings of Dungeneee crabs C ~t*! h dth gh tth P fi N th tfor the past several decades Figure I! . These fluctuations have frus-trated fishery managers, commercial fishermen, fish processors andconsumers. Mange re feel they have little, if any, control over fish-eries; commercial fishermen are faced with substantial year-to-yearvariation in crab abundance and fishing effort, 'invasions ' of fiche r-men from neighboring areas having poor catches, and widely varyingmarket prices; processors have found it difficult to expand marketsfor a product with unreliable supply, and are often forced to freeze alar ge portion of catches thue significantly decreasing product quality!;consumers are baffled by striking within and between year variation inthe price they must pay for Dungenees crab and in availability of freshcrab. However, despite the "misbehavior" of t' he resources Dungenesscrabs support important and apparently fully exploited fisheries inCalifornia, Oregon, Washington and British Columbia, and there isincreasing exploitation of Dungeneee crabs in Alaska, resulting in partfrom serious declines in king crab abundance.
Fishery research scientists e in contrast to those use r groups withserious personal stakes in this resource, have been intrigued ratherthan frustrated by the dramatic fluctuations in crab landings. Manyfishery scientists have been unable to resist the temptation to "explain"these fluctuations including the author I! . Early attempts at explanationconcluded that fluctuations reflected market conditions rather thanactual crab abundance Clark and Bonnot 1940!. However, Cleaver I 949! found that fishing effort remained fairly steady throughout ex-treme Washington landings fluctuations and he concluded that landingstherefore reflect r'eal fluctuatione in crab abundance. Many subsequentstudies have presented alternative "explanations for landings fluctua-
305

tions and there hae been complete agreement on just a single point;naxnely, that landings fluctuations do indeed, however crudely, reflectreal and substantial variation in abundance of Dungeness crabs. Inaddition, there hae been misplaced, but nearly unanimous, agreexnexxtthat landings fluctuations are a direct reflection of fluctuations incrab year class strength.
e XIo15
p EI$ 5
~ 15
5
However, year class strength need not be determined during sensitiveearly life stages, Forney �976! showed that walleye year class strengthin Oneida Lake, New Yorka wae principally deterxnined by a! predationby yellow perch, and b! cannibalism by adult walleye on walleye juve-niles; year class strength was not determined until well after earlylife stages. Hankin �980! showed that cannibalism by juveniles onnewly born fry could have major effects on recruitment in laboratoryfish populations. Boteford and Wickhaxn �978! indeed proposed thatcannibalism was ths principal cause of Dungeness crab fluctuations,thus implying that year class strength must be determined after
306
For moat species of fishes or crus-ALASKA taceans, year class strength ie
determined during early life stages,egg or larval. These stages arexnoet sensitiVe to fluCtuations inenvironxnentel conditions and /orpredator abundance, and survivalrates during these early life stagesare usually extremely low �0
WASR IRGTO N 10 6!. Very small changes in mor-tality rates through these lifestages can thus give rise to verysubstantial fluctuations in survivalrates and resulting year class
OREGON strength. For exaxnple, an aVerageadult female Dungeneas crab mayproduce 106 eggs per year ~ Ofthese, a very rOugh average of two
35 muSt suxViVe to beCOme adult toNORTHERN CALIFORNIA ensure population replacexnent.
Hence, xnortality from egg to adultIC would be 0.999998! almost all of5 this mortality would take place
during egg and larval stages. If195A 56. 5s. 60 62. aa.aa as ra rl. 7A 76 rs-57 59 6 I 63 65 67 69 7 I 73 75 7 7 7'9 mortality rates w'e re just 99 ~ 99 Ja
SIE AS OR of this figure for a particular yearClass 7 the resulting mortality rate
Figure I . Commercial landings oi' would be 0. 999898 ~ This ve ryDungeneee crabs from Alaska small change in xnortality rate,through northern Californi~. hovrever, wouM change the xeeult-Reproduced from Wild �983!. ing survival rate from about 10-6
to 10 4: in this manner year classstrength might easily fluctuate over two orders of xnagnitude. This kindof simplistic, but compelling, calculation haa led most researchers tofocus on early life stages of Dungeneae crabs in their searches for pos-sible explanatione for fluctuations, Cleaver �949!, PMFC �964!,Wickhaxn �979!, Wild �9807 1983! and McKelvey et al. �980! have allconcluded, using very different arguments, that year class strengthmust be deterxnined during egg and/or larval stages.

metamorphosis of larvae and settling of juvenile crabs. Peterson�973! speculated that fluctuations in landings arose not from fluctua-tions in early life survival, but from fluctuations in survival ratesand /ar molting success of sub-legal adult male crabs.
This paper reviews and critiques eix of the more recent and/or marecontroversial of the proposed explanations for Dungeness crab fluctua-tions. Primary attention is placed on the northern California fisherybecause the author'e research has concentrated on this fishery McKelvey et al. 1980; McKelvey and Hankin 1981; Hankin et al., andDiamond and Hankins this Symposium! and because fluctuations innorthern California landings have been more dramatic and more regu-lar than in other Northwest fisheries. Critique of the proposed expla-nations consists of subjecting each of them to twa tests, one biologicalin nature and one statistical in nature. None of the proposed explana-tions convincingly pass both tests. But two of the six �! Wild 1980,1983 s and WUd et al. 1983' and �! McKelvey et al. 1980! convincinglypass one test and cannot be rejected by the remaining test. These twoexplanations are complementary, rather than conflicting ~ and bothsuggest that year class strength must be determined during early lifestages, prior to metamorphasis and settling af juveniles,
Six Pro peed Zx lanatione
Proposed explanations have been classified according to whether theprincipal hypotheeieed causes for fluctuations are density-independent environmental factors! ot. density-dependent usually internal biologi-cal controls! . Density-independent environmental factors have beenimplicated by:
�! Peterson �973!: upwelling -induced effects on moltingsuccess and/or survival rates of sub-legal adult malecrabsl
�! Love and Westphal �981!: sunspot activity and its statisti-cal correlation with crab landings data' and
�! Wild �90, 1983! and Wild et al. �983!: fluctuatiane inocean water temperatures and their effects on egg survival ~
Density-dependent controls have been proposed by'.�! Wickham �979!: density-dependent egg mortality resulting
from a predatory nemertean worxns Carcinonemerteecrt ans:
�! Batsford and Wickham �978!: density-dependent juvenilesurvival resulting from cannibalism by older crabs' ,and
�! McKelvey et al. �980!: density-dependent egg/larvalsurvival mediated through fluctuation in the total eggproduction of the unexploited fernale stock,
Two Minimal Tests
The relative raerits of each of the above hypothesee were evaluated bysubjecting each hypothesis to the twa teste described below. Proposedexplanations that failed one or both tests were rejected ae lackingminimally adequate support. Those explanations that could not befound to fail one or both tests were judged most plausible.
Test 1: Biological.
A proposed explanation should be:
307

a! supported by and must certainly not conflict withexisting biological knowledge concerning Dungeneee crabs;and
b! judged "plausible" from an ecological perspective.In applying the biological test~ a! required a direct and straightfor-ward comparison of an explanation with existing biological data, but b! required qualitative and subjective judgements which are, however,routinely made of necessity in fiche ries research.
Test 2: Statistical.
For explanations involving an environmental factors there must be a!a statistically significant correlation between that factor and fishery
datas and b! analyses used to generate that correlation s! must appearfree of apparent bias. For mathematical models of density-dependence f a! models must be capable of roughly matching empirical fishery timeseries especially the observed period of apparent fluctuations! a and b! there should be a significant statistical 'fit" of the model to empiri-cal fishery data. See Botsford �981! and McKelvey and Hankin �981!for a detailed consideration of this second test in the context of mathe-matical models.!
Landin e Versus Year Class Stren th
Almost all studies of Dungenee e crabs have assumed that annual landingsdata provide a suitable proxy for year class strength. This assumptionappears to have originated from Cleaver's �949! early research andwas first contested by Gotshall �978!, then McKelvey et al. 1980! a andmost recently by Methot and Boteford �982! . McKelvey et al. arguedthat the striking fluctuations in northern California fishing effort Figure 2! should have produced significant fluctuations in exploitationrates. If this were true, ther landings data would include contributionsfrom two or more year classes of crabs and would not be a directsimple reflection of year class strength,
McKelvey et al.'e arguments were based on classical fishery mortalitymodels Ricker 1975!, but also on some previously unpublished analysesof the northern California fishery which are reproduced here graph-ically as Figures 3 and 4. Figure 3 shows that the statistical correlationbetween a season' s commercial landings and an index of pre-eeasonabundance number of legal males per trap! was quite weak. However,when the pre-season index was multiplied by fishing effort meaeuredas total pote fished!, a remarkably good statistical relation wae achievedbetween actual landings and this combined measure of initial abundanceand fishing effort Figure 4!. Unexplained va.riation in landings wae re-duced from 45~jo Figure 3! to just 15/a Figure 4!; this occurred despitethe fact that the pre-season index wae measured as numbers of crabswhereas landings were measured as pounds of crab. The clear irnplica-tion of these figures wae that fishing effort must indeed elbert an impor-tant influence on annual exploitation rates, at least in northern Califor-nia.
Methot and Boteford �982! recently concluded that exploitation rateshad indeed varied significantly in the northern California fishery, butthey discounted the earlier analysee of McKelvey et al, In particular,they challenged McKelvey et al.'e contention that exploitations rateshad generally increased over time in the northern California fisher y.
308

50
40a
au 30
20
I a 10 45 50 55 eo 65 70 75YEAR
Figure Z. Estimated number of pots fished in the northern Californiafishery, 1943-1978,
24
C5 12R Z 60
PRE-SEASON CA'TCH PER POE
Figure 3. Northern California commercial Dungeness crab landingsplotted against pre � season catch per pot measured as number oflegal males! for the period 1962-1977. Vertical lines indicatedeviations of landings data from the indicated predictive regresionline. Data from R. Warner, California Fish and Game.
309

24
~18
O ~12Ci
R 0 1 2 3 4 5 6C4TCH pER pOT e pOTS FISHEO x10 S
Figure 4. Northern California commercial Dungenees crab landingsplotted against s. combined measure of pre-season catch per potand fishing effort number of pote fished! . Same data as for Figure3. Vertical lines indicate deviations of land ings data from the indi-cated predictive regression line.
Figure 5 s however shows that exploitation rates estimated by the twogroups of researchers, using independent methods, *re in rather re-markable agreement, Difference in interpretation regarding the exis-tence of a generally increasing trend in exploitation rates appears tohinge on the longer times series employed by McKelvey et al. �980!as compared to that used by Methot and Botsford �982! and seems arather minor point ~
Studies by McKelvey et al. �980! and Methot and Botsford �982! arethus in substantial agreement that r~loitation rates have not remainedconstant in the northern California fisherys nor have they remainedhigh enough so that virtually all legal melee are harvested each season as has been assumed by most fishery scientists!. As a consequence,fluctuations in landings may give a misleading and erroneous pictureof real fluctuations in year class strength. Hence, any study that reliessolely on the statistical correlation between landings and some factor density-dependent or density-independent! must be viewed with skep-ticism. Thus far, only McKelvey et al. �980! have attempted extractionof year class strength from landings data. Their extracted estimates ofyear class strength, although crude, suggest real cyclic fluctuationsin yee.r class strength with a pe riod of 9-10 years in northern California.Although analyeee similar io those presented by McKelvey et al. andMethot and Botsford have not been made for other West Coast fisheries,it seems likely that exploitation rates have varied significantly in allcrab fisheries. Crab landings data are probably s. very poor proxy foryear class strength in all fisheriee,
310

.8Ixe~.6
0 I ~.40 ~ 2
65 70 7SYEAR
Figure S. Estimated exploitation rates in the northern CaliforniaDungenese crab fishery, 1944-1979. hiethot and Boteford's estiznateswere based on comparing actual landings with Leslie estixnates ofinitial abundance of harveetable crabs. Hankin' s estimates werebased on classical fishery mortality models see McKelvey et al.1980 for explanation! .
Cri ue of Pro peed ~ lanations
1. Upwelling, Peterson �973! investigated the statistical correlationsbetween suxnxned euxnmer upwelling indices and crab landings froznnorthern California, Oregon and Washington. By manipulating lag-times, he found that upwelling wae significantly and positively correla-ted with crab landings in northern California and Oregon at a 1.5 yearlag~ and in Washington at a 0. 5 year lag. Based on these findings ~ heargued that upwelling, through ite effect on food availability, znusthave a significant impact on survival rates and/or molting success ofsub-legal adult xna1e crabs.
Although Peterson'e hypothesis passes the statistical test, Botsfordand Wickham �975! showed that although crab landings were cyclic,upwelling time series were not; they thus rejected the upwellinghypothesis in favor of density-dependent internal controls. However,Petez'son'e hypothesis may be more seriously challenged on biologicalgrounds. There are no biological data which support an hypothesis ofstrong upwelling effects on survival and /or molting success of sub-legal adult male crabs, and there are data which conflict with thishypothesis. The upwelimg hypothesis would require that landings arelargely independent of year class strength in the sense that upwellingeffects among sub-legal adult males would mask any earlier-estab-lished year class strength! and thus that upwelling must producenearly 50-fold variation in survival rates and/or molting success northern California landings have ranged from about 0. 5 - Z5 x 106pounds!. Although research has shown that sozne adult zna1e crabs maymise znolts, the vast majority do not. Poole �967! stated that up to
311
10-15% may miss molts, whereas Warner pere. comm.! hae found ron the basis ot mating marks, that from 0-25% may miss molte.Variation in adult male molting success seems far to small to accountfor any but a very minor part of the required variation; hence s theprimary effect ot upwelling would have to be on adult survival rates.This is contradicted by Warner'e pers. comm.! studies of northernCalifornia Dungeness crab. Over a five year period, Warner' foundthat re!ative abundance of several year classes of crabs could bereadily tracked through trawl data eeriee. According to Peterson'shypothesis s the effect of upwelling would be so strong that one wouldnot expect the relative abundance of a cohort to remain fairly constantover a period of years. Upwelling-induced variation in survival rateswould mask any direct relation between year class strength at agethree and subsequent availability of age four and five crabs. Finally,it is biologically implausible to expect such pronounced upwellingeffects on crab life stages which are a priori fe,r lese sensitive tosuch effects than are early life stages,
Z. Sunspot Activity. Love and Westphal �981! proposed that fluctua-tions in total annual West Coast landings of Dungeness crabs reflectedfluctuations in mean annual sunspot number. They freely admittedthat they had no direct biological connection in mind and it is thus im-possible to subject their proposed explanation to the biological testHowever, it is possible to subject their hypothesis to the statisticaltest ~ in particular as regards possible bias of analysis methods.
Love and Westphal summed landings from all Pacific Coast areas intheir analyses, thus deriving landings data which are of uncertainquality. Figure 1 shows that landings fluctuations of Dungeness c rabsare not strictly synchronous in all areas; in fact, Botsford and Wick-harn �975! found that period of apparent fluctuations ranged tromabout 9 years in California to 12 years in Oregon and Washington.Because periods of sunspot activity appear to follow an. 11 year cycle,summation of landings could easily be regarded as a thinly disguisedmethod to achieve an approximate period of landings fluctuation ofabout 11 years and to thereby gene rate a significant correlation be-tween summed landings and sunspot activity. Love and Weetphal didnot justify their summation of landings data, nor did they presentresults of correlation analyses separately applied to regional fisheries.
A more serious objection may be raised concerning Love and West-phal's analyses of these summed landings data. Figure 6 reproducestheir plot of tota1 crab landings and sunspot numbers. For again un-justifiedd reasons s they treated each of the first two "cycles" �955-1964, 1965-1975! independently and thereby generated substantialpositive correlations �.90, 0. 87! between sunspot activity and land-ings l they chose to ignore remaining data. They then found that legsof 5 years resulted in largest significant negative correlations for thetwo cycles; these results were to be expected, because 5 years wae asclose to half a period out of phase as was possible, and were not inde-pendent of the previous results. One roust ask: Why did they not com-pute the correlation between the two variables over the entire 1955-1980 period for which they had data 7 Inspection of Figure 6 suggeststhe answer: they would have found a far smaller correlation. Readingdata crudely off of Figure 6, the computed linear correlation betweenthe two variables over the entire data set was about 0. 5; sunspotactivity could thus account for about Z5% of the variation in total crab
312

20060
160
120
Z
60
40200
YEAR
Figure 6. Total annual West Coast Dungeness crab landings and meanannual sunspot numbers for the period 1955-1980. Redrawn fromLove and Westphal �981! .
landings throughout the West Coast. Although statistical tables willverify that this correlation is indeed statistically significant e it iehardly "such stuff as dreams are made on' . Also the residual patternfor the entire period indicate e serious lack-of-fit eee Draper andSmith 1981! .
To summarize, Love and Westphal'e proposal lacks any biologicalbasis and statistical correlation analyses employed in their study arenot clearly free of bias. One hopes that their paper wae intended as atongue-in-cheek satirical commentary on the controversy surroundingthe various proposed explanations for fluctuations in crab abundanceand that the editorial staff of Fishery Bulletin wae well aware of thesatirical nature of the piece. If this wae not the case, then the pape ris a sad commentary on existing peer review standards for Notes inwhat otherwise is a solid publication of fishe ries research.
3. Ocean Water Temperatures. Wild �980! first proposed that fluctua-tions in ocean water temperatures during the egg brooding periodwere responsible for the "crash" of the central California fishery andat -least partially responsible for fluctuations in northern Californiacrab landings this proposal has been more recently restated in Wild�983! and Wild et al. �983! . The proposal wae based on two differentlines of evidence ~ First, plots of crab landings and ocean water tem-peratures during egg brooding periods were not inconsistent with thishypothesis for the central and northern California fisheries Figures7 and 8!. The dramatic decline and "collapse" of the central Californiafishery coincided with a dramatic increase in ocean water tempera-tures to near l6 C three years previous during egg brooding stages.0
313
500Z 'Ct4 O
- 40
v924z 30
Z � e
55 60 65 70 75 80

r r APNEA OffRSEnfES3 CI2AS LAYYCIIIYCSSr SrflSOIY
gdb 4
X
ISIS
V s 13ltIf
f442 l922l94 2 l952 1947
20gZg IS
0IOI2J
0IAl3
3 «2I IAI I
ldI940 l945 l920YEAR
f555I 550
Figure 8. Northern California Dungenese crab landings and meanocean water temperatures four years pervious during eggbrooding periods. Reproduced from Wild et al. �983! withpe rmis sion.
ln northern California5 peak landings in the 1975-76 and 1976-77!season s! cOincided with unueually low te2nperaturee du~ing eggbrooding periods four years previous. Lag-times for these figuresseem appropriate for the delay between brooding of eggs to fisheryrecruitznent m the two areas and Warner pe rs. comm.! found thatmuch of the 1976-77 northern California landings consisted of crabswhich were first recruited in the 1975-76 season. Second, and farmore important 5 Wihi found significant temperature-related effectson egg brooding period, egg mortality and hatching success among
314
Figure 7. Central California Dungenese crab landings and mean oceanwater temperatures three years previous during egg broodingperiods. Reproduced from Wild et al. �983! with permission.

laboratory-hald female Dungeness crabs ~ Egg brooding periods wereinversely related to water temperature: at 16. 7 C egg masses hatchedin an average of 64 days in contrast to 123 days at 9.4 C. Egg massvolumes declined rapidly at 16.7 C ~ indicating eg~ mortality Figure9!, Egg mass hatching success was greatest at 10 C where an averageof 685,000 larvae were produced par agg mass. The overall averageat ambient temperature �2,9 C and 13.9 C! was 275,000, and at16.7 C only one egg mass out of 8 produced any significant number oflarvae �00,000!; at least half of these died shortly after hatching ~'Wild's temperature affects are also corroborated by earlier studiesby Mayer �973! who also found increasing egg mortality with increas-ing water temperature.
X2
I IPt9srs
4. Carcinonemertes errane i a crab egg predator. Rotsford and Wick-ham �978! first mentioned the possibility that C. errans might be im-plicated in crab landings fluctuations ~ but ie Wickham �979! who hasbeen most closely associated with this possibility. Wickham �979!found that central California female Dungeneee crabs had "epidemic"infestatione of C. arrans and that infestations appeared to be increas-inf off northern California and Washington. He speculated that wormabundance might be tied to crab abundance and that periods of extremely
315
Figure 9. Trends of egg mass volumewith time as a function of watertemperature among laboratory-held female Dungenees crabs. Re-produced from Wild �983! withpa rmis sion.
Wild's research represents thebest-documented evidence of asigniticant relation between anenvironmental factor and survivalof a Dungeness crab life stage,The ocean water temperature hy-pothesis passes the biologicaltest in convincing fashion; labora-tory results were achieved attemperatures which are encoun-tered by Dungeneee crabs in theirnatural envirorunents and dernon-etrated striking the rmal sensiti-vity of eggs. The statistical re-lations between crab landingsdata and ocean water tempera-tures were marginally significant eee Wild et al. 1983!, but werefar less striking than were thelaboratory results. Nevertheless,Figures 7 and 8 are certainly pro-vocative in their euggestione ofimportant temperature effects onlandings. On balance ~ Wild's pro-posal passes the biological testin convincing fashion, but passesthe statistical test in an incon-vincing fashion. Of the proposedenvironmental hypotheses, thisproposal is unquestionably themost persuasive thus far pub-lished.

high crab abundance could drive worm populations to an unusual equfli-brium in which epidemic worm densitiee were maintained and crabstocks remained at depressed levels. Wickham concluded his 1979paper with the following: "The increased densities seen at Eureka. andWashington over the past few years may indicate that these populationse.x'e in danger of passing into the high worm equilibrium. If this occurs,the entire continental United States Dungenees c rab fishery could col-lapse to levels comparable to those at San Francisco..." . Statexnenteof this sort have caused the egg predator worm hypothesis to receiveby far the most media attention of existing hypotheses: front pageheadlines in at least the San Francisco Chronicle 8 May 1980! andEureka'e Times-Standard �3 March 1981!, and extensive reportingin the National Fisherman May 1981!. It is without doubt the mostcontroversial of existing hypotheeee .
There seems no question that C. errans hae, in soxne years, been asignificant source of crab egg mortality in some Pacific Coast areas.However, in part because worm densitiee have not been recorded forlong periods of time, it is difficult to evaluate the plausibility ofWickham's hypothesis. The thesis that periods of exceptionally highcrab abundance could drive crab populations to new high worxn equili-bria appears to have been xnotivated in part by the "crash" of thecentral California fishery and the apparent "ominous" paraflel beha-vior of the northern California fishery Figure 10! . In both of thesefisheries, axnplitude of landings fluctuations increased over time; thecentral California fishery collapse took place just after the highestlandings on record. However, McKelvey et al. �980! observed thatthe apparent increasing amplitude of northern California landings waexnore likely a reflection of generally increasing fishing effort andcorresponding incx eased rexnoval rates for available crabs than ofreal crab abundance see Figure 12, later in this paper!. More recent-ly Methot and Botsford �982! have generated a similar figure whichxnakes the eaxne suggestion their Figure 3! . Landings data since 1979for the northern California fishery have failed to suggest that immi-nent collapse prophesied by Wickham eee Warner ~ this Symposium!.
A possible biological weakness of the egg predator theory is thatfeeding of worms ie inhibited by worm density, thus causing worm-induced egg mortality to have an apparent maximum of 50-60'fo Wickham 1979! . An hypothesis which involves early life stages mustaccount for fluctuation in early life survival of about 50-fold as wellas an average mortality x ate of x sayx 0.999990. Clearlye the x'e mustbe far more significant mortality factors during early life stages thanC. errane. However, if survival beyond the hatching stage weredensity-independent, then fluctuations in worm-induced egg mortalitycould indeed give ri.ee to fluctuations in resulting survival xates whichwould be commensurate with those required.
The current status of this proposal ie unclear. A recent report Johnston et al. 1981!, of which Wickhaxu was co-author, stated that"studies of the crab egg predator G. errans have shown that thisworm does not appear to cause the cyclee in abundance. Worxn abun-dance does not change rapidly enough with crab abundance...". It isxny understanding that Hobbe et al. this Symposiuxn! have morerecently arrived at a simflar conclusion. C. errans appears an un-likely candidate for the cause of fluctuations in landings of Dungeneesc rabe.
316

10
06
F020
0sCr
rr 02
0 20-21 30-31 C0-/.1 50-51 60-51Crab seasan
Figure 10. Apparent parallel increasee in peak cai'ches of Dungenesscrabs in the northex'n California Eureka! and central Cali-fornia San Francisco! fisheries. Reproduced froxn Wickhaxn 1979!,
4. Cannibslisxn. Botsford and Wickham �978! developed an age-structured coxtinuous-time mathematical model in which juvenile sur-vival rates depended on cannibaliexn by older crabs. They assumedthat instantaneous juvenile mortality due to cannibalism was propor-tional to a weighted density of older crabs . Each crab was weightedaccording to its maes raised to the 0,8 powers thus giving greatestweight to large legal-sieed male crabs a1xl les,st weight to sxnaller fe-males and younger crabs. Using accepted life history parameters formale crabs and guestimated parameters for fexnsle crabs s they showedthat cannibalisxn of this sort could indeed give rise to cycles of abun-dance. Further, they showed that intensive and e~clusive harvest oflarge male crabs could give rise to increasingly unstable cycles ofincreasing amplitudel this latter result was original and provocative.
McKelvey and Hankin �981! gave a detaiLed explanation for their earlier hicKelvey et al. 1980! rejection of the cannibalism hypothesis. Firststhey argueds the Botsford-Wickham model failed ta produce cycles ofthe length which would be required to roughly mimic landings timeseries; xnaximum model periods regardless of parameter manipulations,was about 8 years, whereas period for actual landings was between 9and 10 years. Figure 11, which superixnposes perfect sine ~aves ofperiod 8 and LO which are initially in phs,se, illustrates the obvious andcxitical importance of xnodel period ae a criterion for xnodel plausibility,Second, the apparent trend of increasing fishing effort and exploitationrates in the northern California fishery see Figures 2 and 5! would >according to the Boteford-Wickhaxn xnodel, result in a reduction ofcycle period to less than 8 years; there has been no evidence for thiseffect see Figure 1!. Thirds the apparent increasing amplitude ofnorthern California landings fluctuations wae probably not a direct re-flection of increasing axnplitude and instability of underlying year classstrengths but rather the result of increasing fishing effort and increasingremoval rates for large xnales. These issues are all considered, ing reat detail and from apposing views, in Botsford �981! and McKelvey
317

'I5 20 25 30TIME, t
TO
Figure 11. Superimposition of perfect sine waves of periods 8 and 10,Note that waves begin in phase, but that by t=18 less thantwo full cycles of period 10! the period 8 cycle is at a mini-mum while the period 10 cycle is at a maximum,
and Hankin �'381! and there is little point in rehashing them here.
However, a far more serious objection to the Botaford-Wickham can-nibalism model, which can be raised with equal persuasiveness re-garding McKelvey et al. 's attempt to model cannibalism, is that can-nibalisrn was incorrectly modeled as a biological phenomenon. Butler pers. comm.! first pointed this out to the author, and this same pointhae more recently been made by Stevens et al. �982! and suggested byBotsford �984!. Butler �954! and Stevens et al. �982! both found thatcannibalism on newly-settled and early inetar crabs was far moreprevalent among other Juvenile crabs than among adult crabs those> 100 mm carapace width! ~ But eee Cotshall 1977 which may conflict!,Stevens et al. �982! also pointed out that this finding wae consistentwith theoretical premises of optimal foraging strategy which suggestthat prey size shou!d increase with predator ~ ise; younger, sma!lercrabs should be more likely to prey upon newly-settled and or earlyinstar crabs than should older, larger crabs.
318
The impact of cannibalism by crabs of different sizes must depend on a! duration of contact between predator and prey, b! number of preyconsumed per predator per unit times and c! predator abundance. Theabove studies showed that cannibalism rates were greater for smaDercrabs than for larger crabs, and tt must certainly be the case thatthere are more of these younger smaller crabs than there are oldermale crabs because of intensive fisheries. Thus, for cannibalism by

larger crabs to be more important than cannibalism by smaller crabs,duration of contact between large crabs and newly-settled crabs end/orearly inetare would have to be faz' longer than duration of such contactfor sznaller crabs. However, published studies suggest exactly thereverse. Juvenile crabs lese than two years of age and less than 100mm carapace width! generally inhabit shallow water nursery areas roften bays Collier 1983; Armstrong et al. 1981!, and are probably incontact with large adults only during the short period of time it maytake for a newly-settled crab to migrate from deeper waters if settlingindeed took place in deeper waters! to shallow water nur'eery areas.In Humboldt Bay Warner, pere, comm,! and San Francisco Bay Collier 1983! juveniles do not leave these shallow waters until about1.5 years of age beyond settling. During this period they are in contactwith other juveniles ot' the same year cle.se and with newly-settled and/oz early inetar crabs of the succeeding year class; adult crabs are vir-tually nonexistent in these areas. Diaznond [1983!, fishing crab trapswhich were non-selective above 85 mm carapace width, collected veryfew juvenile crabs less than 100 rnm! in deeper water �0-24 fathom s!areas of high adult crab abundance. Thus, duration of contact betweenlarge adults and newly-settled and/or early inetars must be smell com-pared to such duration of contact between juvenile crabs and newly-settled and/ar early instar crabs. Stevens et al. �982! also presentedevidence of significant within year class cannibalism among earlyinstar crabs. Thusr the assumptions made by the Botsford-Wickhamand McKelvey et al. models of cannibalism � that effects of cannibalismdramatically increase with crab size and are therefore principally dueto adult crabs � are contradicted by available biological data.
Some possible implications of these basic biological findings concern-ing cannibalism, ae they might apply to behavior of mathematicalmodels which formulated cannibalism in accord with these findings,were recently suggested by Botsford �984!: "If cannibalism were byjuveniles it would cause a znore stable population azei cycles of shorterperiod if there were any...''. In the extreme rase of intense ranniba-lisrn by yearling crabs on young-of-year crabs, alternating year classstrength could result: an exceptionally strong year class could ensure,through cannibaliemr that the following year class wae exceptionallyweak. This kind of phenomenon was long ago discussed by Ricker �954!in reference to largernouth base, where yearlings may prey extensivelyan young-of-year after adult bass leave their nests . Alsor Hankin �980!docuznented alternating periods of good and poor survival of newly-born guppy fry es e, direct result of cannibalism by larger juveniles inrefuge areas. Thus, if cannibalism were correctly modeled r generatedcycle period would be far less than the maximum of 8 years thus fazgenerated by the original Boteford-Wickhern model and cycles might beeliminated ar, in extreme cases ~ there might be dramatic oscillationein year class strength of period two, The discrepancy between modelbehavior and empirical fishery behavior would then convincingly ruleaut the cannibalism hyaplhesis as a plausible candidate for observedfluctuations in landings of Dungenees crabs.
6. Density-dependent Egg/Larval Survival. McKelvey et al. �980!used variants of a general age-structured discrete-time mathematicalmodel to investigate the plausibility of several proposed explanationsfor Dungenese crab fluctuations. They reproduced the behavior of theBotsford-Wickbam cannibalism model, but rejected this znodel ae im-plausiblee for previously stated reasons. Instead, they proposed that
319

deneitydependent egg/larval survival wae a more plausible hypothesis.They found that density-dependent egg /larval survival could resultfrom fluctuations in the total egg production of the unexploited femalestock and that, because females were not harvested, such fluctua-tions would be unaffected by fishing effort ~ Further~ thie mechanismcould easily give rise to cycle periods of 9-19 year'e, thus mimickingapparent fluctuations in northern Galiforxna lax@Huge data and in ex-tracted eetixnates of year class strength.
Using regression methods ~ McKelvey et al. were able to produce asatisfactory statistical match between their model's behavior andempirical fishery behavior. This xnatch wae partially reflected in thecorrespondence between a! actual fishery landings data and eetixnatedinitial harve stable abundance Figure 12! and b! their xnodel simulationoi this earns figure Figure 13!. Although the correspondence betweenthe two Figures is obviously imperfect, general qualitative features offishery and model behavior appear eimilar assai period of Quctuationeare in agreement. lt is important to note that only McKelvey et al.have dared to pres ent such a figure which allows visual aeeessment ofmodel performance. No such figure exists for the Botsford-Wickhamxnodel' it would resemble Figure 11 this paper!.
12
~ 10exO
!40X
e
K O 4 0 43 45 $0 S5 eo eS yo yg ygYEAR
Figure 12 ~ Eetixnated initial harveetable abundance uppex line! andactual crab landings lower line! in the northern Californiafishery. Reproduced froxn IVlcKelvey et al. �980!.
320

I ~
a ILo ~
e IIA s
1 sI ~ 1 ~ I ~ s ~ I ~ ~ I ~IJ
vsaa
Fi ure 13.g . McKelvey et al. 't'
~ s m el sim
dr 1
ion assumed densit d «ion of Figure 12, g-1 y- ependent e /laim
riven by estimated 1 ' gg arval survival and wwas
y see Figure 5! ~ peprod d f e northern Ca]iforniaom McKelvey et al. �980!
Botsford in Botsford 1981; Methot ad ot od 98, o fots ord et al.
e vertheless, Botsford �981!en y al. s conclusions rested o
was correc
rn D b H k's o a project designed to establish
no
s a ish these basic fernal lif h'ararn . ' ates derived in this study wereararnete r estim
a e e istor
amental levels whrch would rnfluence the
mot; b! 1ose eaceedin 155 survive.l rates for lara y
a ge adult females
ere ver low and d 10' ' *~ p ab y about 50%; and d! frnuc ighe r ~ rob a
es or smaller o
all f 1 th hada failed to mol
e cundit amon
ly molted snd mated. Tpt1 ade in McKelve et al.'s
e . ese results
age and older ongevity was assumed to bo ea s6;ey e al.'s model:
nd d tobapproach!; c! surviv
e zero a feature of
was insensitive to at least th'y . s original assumptions rM Kel t 1
is ory were close, in substancp ons regarding fernale
s ance and effect, to the findings of
321

Hankin et al. this Symposium!. No reproductive role was assigned tocrabs beyond age 5 � an assumption not incaznpatible with the greatlyreduced survival rates and lowered fecundity of large adult females-and assumed survival rates for younger female crabs �0%! seeznclose to correct, Were these new findings incorporated into a zevisedversion of McKelvey et al. 's models there ie no reason to expect thatthere wouM be any substantial impacts on model behavior or on themerits of their arguments foz' density-dependent egg/larval survival,
Of the published mathematical madels of density-dependence whichpurport to explain the fluctuations of Dungeness crabs, only the modelof McKelvey et al. can zneet the statistical test of significant agree-ment between model performance and empirical fishery data. However,because there are no biological data with which to directly assess theplausibility of density-dependent egg /larval survival, the biologicalplausibility of the madel must rest principally on an a priori azgumentthat egg/larval stages are most likely to exhibit density-dependentsurvival. Dungenese crab larvae are usually released in early Januaryin northern California, some three to four months before the onset ofupwelling Peterson 1973! and associated increases in planktonic food.A liznited food resource during larval stages could indeed give rise todensity-ziependent larval survival and Reilly'e �983! work on centralCalifornia larval Dungenese crabs has suggested that year classstrength is established during sazne larval stage, priar to the mega-lopae etage and znetaznorphoeie. However, Lough �976! had greatdifficulty establishing causes for larval mortality sznong OregonDungenes s crabs.
Discus ezon
Of the eix proposed hypothesee, only one � sunspot activity � seeznsutterly lacking in merit. Although the cannibaliszn hypothesis failedboth statistical and biological teste, there is no question that cannibal-ism is a real and frequent phenomenon in Dungeness crab populations.Furtherz the cannibaliezn hypothesis hae led to the development andexamination of original mathematical population znodels which may seeapplication in fisheriee other than those for Dungeneee crabs. The up-welling hypothesis passed the statistical test, in a possibly epuriausfashion Botsford and Wickhazn 1975! z but failed the test of biologicalplausibility and conflicted with available biologicaldata. Present dataare insufficient to allow a thorough evaluation of the crab egg predatorworzn hypothesis, but data collected thus far do not appear to implicateC, errans as the principal cause for fluctuations. This ie not to saythat cannibalismz egg predation by a neme rtean worzn and/or upwellingdo not play significant roles in the dynamics of Dungeness crabs; theyprobably can, and in some years do. Ratherz these factors seem im-plausible causes for the regular, perhaps cyclic, fluctuations in land-ings of Dungeness crabs. As such, they can be best regarded as pos-sible second order factors that znay significantly modify some moreimportant first order factor e! which ie principally responsible.
Wild's hypothesis that ocean water temperatures during egg broodingperiods exert profound effects on egg survival is etz ongly supported bylaboratoz'y ree*rchz but plots of cz'ab landings in central and northernCalifornia and ocean water temperatures with appropriate lags! areonly qualitatively suggestive of e. direct link between crab landings andwater temperatures; statistical correlations between crab landings and
322

ocean water temperatures are significants but weak. The density-dependent egg/larval hypothesis of IvlcKelvey et al. passes the statisti-cal test; model behavior and fishery data are in significant statisticaland qualitative agreement. However~ there are no existing data whichone could use to refute or support the suggestio~ that egg/larval survivalis indeed density-dependent. Collection of data on either larval densities Reilly 1983, and this Symposium! or total stock egg production Hankinet al., this Symposium! both pose serious sampling problems and it isunlikely that direct evidence of density-dependent egg/larval survivalwill be forthcoming in the near future. On the other hand, density-dependent egg /larval survival is a priori plausible as it argues thatyear class strength must be determined during sensitive early lifestages.
Thu 9 y of the existing proposed explanation s f o r fluctuations of Dung eness crabs ~ no single hyopthesis clearly passes both minimal tests ina convincing fashion. Hypotheses of Wild and McKelvey et al. are inagreement that year class strength must be determined during egg /larval stages and these hypotheses are not opposing but are rathercomplementary to one another. McKelvey and Hankin �981! stated that~according to their hypothesis ~ a decrease in survival during early lifestages from density-independent causes! could have the result ofdamping fluctuations in abundance and reducing population size; thissituation is not unlike that which took place in the central Californiafishery after the collapse and succeeding relatively warm years.Wild's research suggests that the recent record northern Californialandings �975-76s 1976-77! may have been associated with s. significantcold water enhancement of egg survival which resulted in an exception-ally strong year cia.ss; the model of McKelvey et al. failed to predictthese peak landings. The coexistence and mutual interaction of thesehypotheses seems well worth further exploration. It seems unlikelythat environmental factors do not exert profound effects on early lifesurvival of Dungeness crabs; it seems equally unlikely that Dungenesscrabs are exclusively at the mercy of such factors and have no internal,density-dependent controls which would convey stability properties topopulations .
Finallys it is probably wise to stress that existing explanations forfluctuations in Dungeness crab abundance are by no means satisfactory.The rough synchrony of landings flurtuations off northern California,Oregon and Washington is indeed suggestive of a large scale environ-rnental effect PMFC 1964! . Fluctuations in ocean water temperaturescould indeed produce such large scale effects. For example ~ the recentEl Nino event may have coast-wide impacts on Dungeness crab stocks .Alternatively, dynamics of Dungeness crab stocks may be linked insome fashion~ perhaps through larval drift and larval exchange betweenadjacent stocks .
The objective of this paperwas neither to promote particular hypothesesnor to strike down alternative hypotheses. Rather ~ the objective was tosubject each hypothesis to the same two minimal tests so as to allmvan assessment of the relative merits of existing hypotheses. This exer-cise strongly suggested that year class strength of Dungeness crabs isindeed established during early life stages, egg and/or larval. If thissuggestion is true, then future research on dynamics of Dungenesscrabs should focus on egg and larval stages. Until and unless data aregathered which refute this suggestion, it seems foolish to invests funds
323

and research efforts into avenues which cannot pase even zninimalstatistical and biological tests and which are highly implausiblecandidates for causes of the fluctuations in abundance of Dungenesscrabs.
Acknowled ements
I thank Ron Warner for openly sharing data from hie studies ofnorthern California Dungenese crabs: these data proved valuable inassessing the relative merits of existing hypotheses for crab fluctua-tions. I also thank Paul Wild for helpful discussions of his researchon female Dungenees crabs; I hope that I have done justice to hisstudie e.
Literature Cited
Armstrong, D.A., B.S. Stevens p and J,C. Hoeman. 1981. Distribu-tion and abundance of Dungeness c rab and crangon shrimp anddredging-related mortality of invertebrates and fish in GraysHarborp Washington. U.S. Army Corps of Engineers p Seattle.
Bostford 3 L,W'. 1981. Comment on cycles in the northern CaliforniaDungeneee crab population. Can. J. Fish. Aquat. Sci. 38; 1295-1296 .
1984 ~ Effect of individual growth rates on expectedbehavior of the northern California dungeness crab Cancer
t ff' h y, C, J, F' h. Aq t.S '.41:99 � 141.
Botsford, L,W,, and D.E. Wickham. 1975, Correlation of upwellingindex and dungeness crab catch. Fish. Bull. U.S. 73: 901-907.
1978, Behavior of age-specificdensity-dependent models and the northern California dungeness
hfC~tf'hy.J.F'h.R.BdC.33;833 -843,
Botsford, L. W., R.D. Ipiethotp and W.E. Johnston. 1983. Effort dy-namics of the northern California Dungeness crab Cancer m~ais-ter! fishery. Can. J. Fish. Aquat. Sci. 40: 337-346.
Butler p T,H. 1954. Food of the commercial crab in the Queen Char-loBe Islands region. Fish. Res�. Board Can., Prog. Rep. No.99: 3-5.
Clarkp G,H,, and P. Bonnot. 1940, The utilization of the Californiacrab resource. Calif. Fish Game Bull. 26�!: 374-376.
Cleaver, F.C, 1949. Preliminary results of the coastal crab Cancer~t ' t'4 t . W h. D*pt. 3" h. B 1. R p'. N49A: 47-82.
Collier, P. C. 1983 ~ Movement snd growth of post-larval dungeness4 . C ~t, 'oth S oF .PP 133-134
IN Wild, P.W. p and R.N. Tasto, Editors. Life history, environ-ment and mariculture studies of the dungenese crab, Cancer~t*, 'th+»* ph ' th t 1C 1'fCalif. Fish Game, Fish Bull. 172.
324

Diamond, N. 1983. Demographic statistics and annual molting praba-bCitt K th Mutt f 1 d g* 6 C ~tnorthern California. M.S. thesis, Humboldt State U. 3 Arcata.
Diamond 9 N., and D.G, Hankin. 1984. Biases in crab tag-recoverydata. This Symposium.
Draper g N.R. g and H, Smith. 1981, Applied regression analysis, Zndedition, W iley 3 N . Y .
Forneyg J.L. 1976. Year-class formation in the walleye Stizostedionvitreum vitreurn ! population of Oneida Lake, New York, 1966-73. J, Fish. Res. Board Can. 33 783-792.
Gotshall, D. 1977 ~ Stomach contents of northern California dungeness* b, C ~t!. C lif. F' h* d C * 63: 43-51.
Hankin, D.G. 1980. A multistage recruitment por cess in laboratoryfish populations: implications for models of fish population dy-namics�. Fish. Bull. U.S, 78: 555-578.
Johnston, W.E., C. Haadr L,W. Botsford, and W.E. Wickham. 1981.Economics of fisheries and aquaculture development. PP 142-143IN Calif. Sea Grant College Program 1978-1980 Biennial Report.Sea Grant Rep. Na. R-CSGCP-004.
Lough, R.G . 1976. Larval dynamics ai' the dungeness crab, Cancer~te, ff th* * t 1 C g t, 1970-71. F' h. Bull.U.S. 74: 353-375.
Love, M,S,, and W,V. Westphal ~ 1981. A correlation between annualth fd g b,c ~t, 4 * 1
sunspot number. Fish. Bull. U.S. 79: 794-795.
Mayer g D.L. 1973. The ecology and thermal sensitivity of the dunge-* b,C ~t,+M ltd 9 ' f't b th'
community on Similk Bay, Washington. Ph.D. die sertationB U, afWa,sh. ~ Seattle.
McKelvey, R., end D. Hankin. 1981. Reply to comment on cycles inthe rorthern California dungeness crab population. Can. J. Fish.Aquat. Sci. 38: 1296-1297.
McKelvey, R. g D. Hankinr K. Yanosko, and C. Snygg. 1980 ~ Stablecycles in multistage recruitment models: an application to the
th Clif d g 1 C ~it h y.Can. J. Fish. Aquat. Sci. 37' 2323-Z345.
Methot, R.D., and L.W. Botsford. !982. Estimated preseason abun-dance in the California dungeness crab fisheries. Can.3 . Fish. Aquat. Sci. 39, '1077-1083.
Pacific Marine Fisheries Commission. 1964. Status of the PacificCoast dungeness crab fishery. 17th Ann. Rep. Portland, Or.
325

Pete rsonp W. 1973. Upwelling indices and annual catches of dungenessb,C ~t, 1 gth t t fth P'tdStt
Fish. Bull. U.S. 71'. 902-910.
Poole, R.I . 1967. Preliminary results of the age and growth study ofthe market crab in California' .the age and growth of Cancer~t'BMgBy.P.Syp.d t *M.B'l.Assoc. India II. '553-567,
R illy, P.N. 19gl. Dy ' td»g * * *b C * ~t ,~larvae off central and northern California. PP 57-85 IN Wild,P. W., and R.N. Tasto, Editors. Life history, environment ~ and
lt hM1* Mfh d»g* * * b,C» ~twith emphasis on the central California fishery resource. Calif.Fish and Game, Fish Bull. 172.
Ricker, W,E, 1954. Stock and recruitment. J. Fish. Res�. Board Can.11: 559-623.
1975. Computation and interpretation of biological statis-tics ot fish populations. Bull. Fish. Res. Board Can. 191.
Stevens, B.G., D.A. Armstrong, and R. Cusimano. 1982. Feedinghb't ftb d g bC ~t d t ' dbythe index of relative importance, Mar, Biol. 72: 135-145.
Wickhsm, D. E. 1979 ~ Predation by the Nemertean Carcinonemertes~ gg fth d g* bC ~it .Md
Biol. 55: 45-53.
Wild, P, W. 1980. Effects of seawater temperature on spawning p eggdevelopment, hatching success, and population fluctuations of thed g b, C ~t . C 1CQP1 R p. 11: 113-139.
Wild, P.W. 1983. The influence of water temperature on spawning, eggdevelopment, and hatching success of the dungeness crabp Cancer~t. PP 197-119 1N W ld, P.W., d R.N. T t, Kd'tLife history p environment, and mariculture studies ot the lunge-
~ b,C ~t, fth pl* 1 th t ~ 1C1'-fornia fishery resource, Calif. Fish and Game, Fish Bull. 172.
Wild, P.W. s P.M.W. Law, and D.R. McLain. 1983. Variations inocean climate and the dt.n' sness crab fishery in California. PP175-188 IN Wild, P.W., and R.N. Tastop Editors. Life history,environment, and mariculture studies of the dungeness crab,C ~t, th ph th* 1 1C lb' ' f' h-ery resource. Calif. Fish and Game, Fish Bull. 172.
326

Initiation of a Dungeness crab, Cancermagister, habitat study in North Puget
Sound
Paul A. Dinnel, David A. Armstrong andChristopher DunganUniversity of WashingtonSeattle, Washington
Introduction
The 0 ge ess c ~ ah, ta ce arrtste, has hee the hje t fand sports fisheries on the west coasts of the United States andCanada since as early as 1848 Dahlstrom and Wild 1983!. Of thescientific studies specifically designed to understand Dungeness crabeCOlOgy, nOne have addreSSed the 1OCally impOrtant. crab reSOurCeS Ofthe inland waters of Puget Sound, Hood Canal, the Straits of Juan deFuca, or the U.S. portion of the Straits of Georgia.
Pugei Sound Dungeness crab stocks support a cosvnercial and sportsfishery of 1.3 to 2 million pounds annually PMFC 1982! yet verylittle is known about the nearshore distribution, habitat preferencesor recruitment dynamics of these stocks. Recent studies in coastalestuaries have supplied evidence that habitat type is cri tica 1 duri ngthe early life history stages and that shallow embayments may beimportant nursery areas Stevens and Armstrong 1984!.
Recently, the state of Washington has given more emphasis to theprotection of sens i ti ve ecological habi tats when considering shorelinedeve lopment permits. Presently, the Washington Department ofFisheries WDF! has been asked to consider the possible impact of anumber of shoreline projects that might affect crab. As a result, theUniversity of Washington School of Fisheries in conjunction with WDF,IIDAA/Sea Grant and the Lugmai indian Tribe have initiated a major studyin north Puget Sound and the Straits of Juan de Fuca to document thehabitat requirements of local crab stocks. The purposes of this pape~are to describe the rationale, objectives and methods associated withthis .new study and to discuss some early observations based on thefirst four months of field work.
327

Rationale
The dramatic and sustained depression of crab resources in the SanFrancisco Bay area from the early 1960's to the present day serves asa reminder that fishery stocks can be fragi'le and slow to recover seereview by Armstrong, 1983!. Although the decline in San Francisco crabstocks may be partially attributable to changing oceanographicconditions such as water temperature Wild et al, 1983!, othersubstantial impacts related to loss of nursery habitats and pollutionhave been identified Wild and Tasto 1983!.
Studies in coastal estuaries such as San Francisco Bay Tasto 1983 !,Humboldt Bay Gotshall 1978! and Grays Harbor Stevens and Armstrong1984; Armstrong and Gunderson, these proceedings! have shown thatprotected embayments may serve as nurseries estimated to contribute asmuch as 83% of the adult crabs in an offshore fishery Tasto 1983!following migration of the young recruits out of the estuaries,Similar studies also suggest that habitat type is critical d~ringearly life history stages of Dungeness crab, particularly followingmetamorphosis and settlement of the first instar juveniles through thenext five to six months Stevens and Armstrong 1984; Armstrong andGunderson, these proceedings!. Indeed, Cleaver 1949 ! concluded that"The facts of the Dungeness crab! fishery point to a large dependenceupon the survival of young from the hatch of each brood year."Predation on juvenile crabs is probably heavy during the first fewmonths of their existence, the survivors being highly dependent onSubStrateS that affard Shelter frOm predatorS aS well aS adequate fOOdsupply e.g. eelgrass, shellhash, algae, stick debris, etc.!.
In Puget Sound, there is a limited amount of such nearshore intertidalhabitat and the extent of its utilization by both young-of-the-year YOY! crabs and later 'life history stages is not at all documented.Reasons to study crab biology and ecology in regard to substrate andhabitat are based partially on proposed development in the form ofdredging and landfill, as well as our concern for the possible impactOf induStrial pOllutiOn On inVertebrates in nearShOre SyStemS. Thelimited amount of intertidal and subtidal habitat that might offerappropriate refuge for Dungeness crab in Puget Sound is increasinglythreatened by numerous projects. Among pending proposals to constructmarinas and port facilities are those at Lurrmi Bay, Birch Bay, CherryPoint, Tulalip Bay, Harbor Point, Everett and Anacortes. Virtuallyall of theSe projects would include dredging and/or fill of intertidalhabitat. Hence, there is a critical need for well defined studies todocument the importance of the nearshore habitats to Dungeness crabsuccess.
~Ob ect e
The present efforts on the newly initiated Puget Sound crab studydove-tail the interests and needs of two different sponsors. Theprimary efforts are di rected towards an overall vi ew of nearshorehabitat utilization by crabs . The specific objectives of this portionof study include:
l. dentificati on of sampling gear and strategies for samplingintertidal and subtidal habitats for all age classes ofDungeness crab.
328

2. Initiation of a sampling pragram in several selected areasof north Puget Sound and the Straits of Juan de Fuca.
3. Estimation from first year sampling efforts af:
a ! recruitment timing, distribution, strength and habi tatpreferences of the 1984 year c'lass;
b! timing and extent of inshore-offshore migrations byjuveniles and adults and;
c! timing and location of adult molting, mating and eggproduction.
4. Refinement of sampling strategies for use during thefollowing twa years of study.
A secondary, site-specific portian of the program pertains to LummiBay which has been proposed for the site of a new boat marina. Vesselaccess ta the marina will be provided by dredging a four meter deepchannel across approximately 1500 meters of intertidal flats and areaaf shallow channels, Specific objectives of this portion of the studyinclude:
1, Establishment of a "baseline" af Dungeness crab resources inLummi Bay.
2, Rank the importance of various habitat and substrate typesto Dungeness crabs.
3, Determine crab abundance as a function of depth and distancefrom shore.
4. Define localized migratory patterns of both adults andjuveniles.
5. Determine periods of recruitment to nearshore habitats faruse in determination of least detrimental times for channeldredging.
6. Development of information for assessing the usefu lness ofpossible future management/mitigation proposals relative toDungeness crab habitat loss.
~Sam iir Sii ~ i Methods
Present sample sites include Birch Bay, Cherry Point, Lummi Bay, HalePass, Bellingham Bay, Samish Bay and Padilla Bay in north Puget Soundand Dungeness Bay on the Straits of Juan de Fuca Figure 1!. Aportion of the embayments named above are sampled intertidally at lowtide using established transects and subtidally down to 12 m depth!by beam trawl and pats. A 11 of the abave areas except Dungeness Bay!are additionally sampled in deep subtida1 �5 to 150 m deep! offshoreareas with the same beam trawl used for the shallow stations.
329

Figure 1. Map of northwest Washington showing the primary samplingareas for Dungeness crabs in north Puget Sound and theStraits of Juan de Fuca,
330

Subtidal samp1ing,
The primary gear for sampling both shallow and deep subtidal crabhabitats is a 3-meter plumb staff beam trawl see Bunderson et al.this proceedings! with a small mesh cod end liner to retain all post-larval instar stages. The traw1 is towed at approximately 2 knots fortwo to five minutes and the catches sorted for all species of Cancercrabs and associated floral and faunal groups. A second subtidaTsampling tool consists of baited commercial crab pots �2 to 24 hoursoak times! lined with fine-mesh vexar screen to retain crabs greaterthan approximate1y 20 mm carapace width. The shallow subtidalsampling is conducted approximately once a month while the deep trawlstations are sampled 3 to 4 times per year.
Intertidal sampling.
Intertidal habitats are being assessed for crab density by samplingalong representative transects running from the high tide level downto lower low water approximately -I m contour!. Samp1es arecollected randomly along each transect during low tide periods fromwithin the various habitat types. Each sample consists of an area
20.25m in size with the upper 4-5 xxn excavated and screened to removeDungeness crab and related species. Intertidal samples are presentlyco11ected at monthly intervals.
Other smnp1e methods.
Additional sampling methods under consideration for future useinclude: I! ring nets fished for short durations i.e. less than anhour; 2 ! hydraulic or suction sampling devices to help quantify thebeam traw1 efficiency for YOY crabs on various substr ates; 3!underwater diver transects and; 4! underwater video systems.
Results and Discussion
Field data collected during the first four months of this study arebeing prepared for computer-assisted analyses and are not availablefor presentation at this time. However, for the purposes of thisreport, a two-week �7 July to 8 August, 1984! set of data has beenselective1y analyzed to illustrate some of the 1984 sower fieldobservations. This data set is based on the following samples: 1!206 intertidal samples collected from Birch, Lummi and Samish Bays; 2!23 shallow-water � to 12 m depth! beam trawls in Birch, Lummi andSamish Bays and; 3! 24 deep-water �5 to 150 m depth! beam trawlsoffshore of Birch, Lummi, Bel 1 ingham, Samish, and P adi 1 la Bays.
C c ~iste dist ~ ib tie
The basic catch summary for each type of sample effort Table I! showsthat the e eas a disti ct st atiiicatib ai C, ~aiste age ci ~ sees bydepth during this period. All of the 280 Dungeness crabs recoveredduring the low tide intertidal transects were YDY �+ year class!measuring less than 35 mm carapace width while a1most a11 157 of 164 !of the deep-water trawl catch was composed of adults > 2+ yearclasses! measuring more than IOO xm width, The shallow-water trawl
331

I/1GICrEIQVI
N
N OQD O3Ilj NE
Cj.QJGlO
IllVl
CI.Gl3Vl
VI
CCErQVj
U rQCD
N Gl
IGI!rQ
GICII1 GlrQ
L GlV IQ
GICQrQI- rQGr VI P!ct <
3 Cfl
Cj aC4 O.E IuO >
O X NCjnj O
3CD
ICI
E EGlCGEIQV1
O O O O
+IO O
OU L QlL
Vl
0 IQ3 ErljCIP
O I/O+ QCD+
+
~ IVl
Gl!jDct
+
+ AlQJ
C QlIDQC
CD
QlVDfQ
332
VI3a IQEfQVl
rQGl
O
CD lfj
L CjfQGl IflCG cr1EIQVl GICj
rQrf-Cj +rrQCj Cjul Ql
Cjrlj GlCCE I�ID CD
GlCjlIQ EL rQ IC92Gr vr ' OCC ~
CQCflIQ E OGl I/I« ~
O O O 0
O O w N
ECfj
N O Q-CD
Ql
E IQ
vDO
3CI
I LF
N

stations showed an intermediate catch distribution by size with eachyear class being represented Table I!, although YOY were 5x moreabundant than adults.
The complete lack of crabs older than 0+ in the intertida'l samples maybe a reflection of two ci rcumstances: 1! limited sample area � 206
2 20.25 m samples comprised a total sample area of only 51.5 m while a
2single shallow beam trawl tow covered an average of 489,2 m and; 2!intertidal � m depth! beam trawls during high tide periods did catcholder crabs �2 1+ and 2 - 2+ year class crabs in nine intertidaltaws!. It is probable that a portion of the larger C. ma ister moveoff the flats into deeper water during low tide periods Gotshail19/8; Stevens and Armstrong 1984 ! although subsequent intertidalsamples have shown that adult crabs do bury in the exposed substratesduring low tides.
The virtual absence of 0+ C, ma ister at deep stations / of 164crabs! suggests three possib'lities: settlement is insignificant atdepths greater than about 15 m; 2! settlement occurs but mortality ofYOY is almost 100K or; 3! settlement occurs but surviving YOY moveinto shallow water.
The size-depth stratification of Oungeness crab is further illustratedby size-frequency h i stograms for each sample type Figure 2! . Thisset of histograms again reflects the nearshore concentration of 0+crabs and the transition away from YOY habitat with increasing depth.
ii - do dist. ib tie bf se fo 0 1t t. arriste I> 100carapace width! is also apparent from the beam trawl samples.Females outnumbered males by greater than a 2; 1 ratio �9. 2X females!in the deeper trawls while males outnumbered females �6.3% males! inthe Shal'lOw trawlS even thOugh the spprtS/CObmner cial crab fiShery wasremoving legal i.e . ' 152 mm! males from shallow water during thistime. None of the adult females were gravid during this summer samp'leperiod.
Crab densities.
The distribution data summarized in Table 1 is also presented as2
calculated crab dens i ties crabs/100m ! s ince the average areassampled were substantially different for each catagory. For adultcrabs > 2+ year classes! the densities were very similar for theshallow and deep tows while the 1+ year class absent from the deeptrawls! was approximately half as dense as the adult crabs iri theshallow water tows. The average YOY intertidal density of 560 0+
2crabs/100m is based on sampling methodology which is essentially 100Kefficient for young crabs. however, two factors must temper thisdensity estimate: 1! YOY settlement and early instar mortality! isonly partially complete as of the first week in August we observedsettlement of megalopae as late as October I of this year! and; 2 !this density estimate is hased on a variety of samples frotv differentsubstrate compositions as well as degree and type of substrate coverand tide height. Oensities of 0+ crabs in the intertidal samples
333

Is
I ss
Figure 2.
2 2ranged from 0/m in clean sand without cover to as high as 60/m insmsples with optimum substrate anu c ver e,g. eelgrass and smallcobble covered with detrital algae!. The a arent densities of 0+crabs in the shallow and deep subtidal areas smsp ed by beam trawl areapproximately 500 and 19,000 times less respectively! than intertidalstations collected by hand. However, this comparison assumes a trawlefficiency of 100%, an assumption not supported by the comparisonsbelow.
Trawl efficiency.
Gotshall �978! used SCU64 diver transects in conjunction with 4.9 mtry-net trawls to estimate the eff iciency of the try-net for capturingC. ma ister in Humboldt Bay, California. 6otshall estimated anovera efficiency of 45% for two year classes �+ and 1+! of C.
t
334
I saa
104iis
s
Size-frequency histogram for all Dungeness crabs caught indeep �5-100 m depth! and shallow �-12 m depth! trawlsand in the intertidal samples collected at low tides.

A similar first approximation! estimate of trawl efficiency can begenerated for this study for the 0+ crabs by comparing relativedensities of YOY between the intertidal stationS cOllected by hand atlow tide and by beam trawl at high tide. Mine intertidal tows threeeach from Birch, iLuavni, and Samish Bays! produced 42 YOY crabs which
2is a density of 1.5/100m as compared to the low tide estimate of
2560,0/100m Table 1!. These figures suggest a trawl efficiency onthe sand substrate of those bays of only 0.27% for juvenile crabs< 35 m in carapace width. The possible reasons why this estimatediffers so greatly from Gotshalls' estimate of 45% are at least three-foldd: 1! our estimate is based only on the 0+ year class instead ofboth 0+ and 1+ crabs; 2 ! divers in the previous study may have failedto observe a substantial proportion of YOY crabs often buried in thesubstrate to avoid predation and; 3! our estimates were generated fromintertidal areas with substantial often very thick! eelgrass Zosteramarina! or algal cover whereas Gotshalls' estimates came from subuti achannels free of significant plant cover.
Restraint must be used in the interpretation and application of theestimate of beam trawl efficiency for YOY crab generated above. Thisestimate was developed from a samlieg effort that was not specificallydesigned to assess trawl efficiency and iS best used to formulateworking hypotheses and specific smnpling schemes to quantify the trawlefficiency over various types of substrate and vegetation cover agoal of our 1985 proposed work!. Trawl efficiency may prove to bevery dependent on substrate type and cover. Most of the intertidalsubstrates sampled during this study were cmapact sands and siltysands, often with medium to thick eelgrass or algae cover. Compactsubstrates especially with plant cover! may cause the trawl to "skim"over the substrate surface without "biting in" as has been observedfor the more silty, less consolidated substrates typically found inGrays Harbor. In that estuary, high densities of YOY juveniles takenby beam trawl are invariably associated with epibenthic cover such asterrestrial debris, shell, and detrital eeglgrass and macroalgae whichare readily caught along with silt/mud sediments as the net excavates Armstrong and Gunderson, these proceedings!. Nevertheless, it isclear that uncritical application of Gotshall's estimate of try-netefficiency �5%! may be in error by one or two orders of magnitude forYOY crab in certain substrates, especially sand with thick eelgrasscover.
Conclusions
The results presented in this paper are based on incomplete analysesof a two week period of sampling during an initial four month study in1984. Other Dungeness crab studies have detailed major populationchanges between seasons and between years. These same changes will,no doubt, be observed for Puget Sound crab stocks over the course ofthis program.
The brief results presented here point to the distinct importance ofshallow nearshore areas for post- larval recruitment success and forforaging areas for the age claSSes 1+ and older. An impOrtant aSpeCtof this study will be the determination of habitat preferences for
335

each life stage of Dungeness crab. Observations to date suggest thatYOY are most often associated with habitats that offer some type ofcover e.g. ee'1grass, algae, shells, cobble, wood debris, etc.; seealso Armstrong and Gunderson, these proceedings; Stevens and Armstrong1984 !, probably as a means for avoiding omnipresent predators.Similar data is also being collected for related species of Cancer
o Cc. c od ot ~ e. c. g ilia, c. ~oe ~ e aie aod c. a te ~i ~and should provide interesting inter-species comparisons ofdistribution and abundance as a function of substrate.
This work has been jointly supported by funds from the Washington SeaGrant Program, the Washington Department of Fisheries and the LummiIndian Tribe. The authors are indebted to Richard Burge, RichardBaumgardner, Randall Butler and Todd Peterson of the Department ofFisheries Shellfish Laboratory, Br enon, Washington; Paul Wage,Michael MacKay, Merle Jefferson, Joseph Hillaire, Thomas Edwards andDean Mike of the Lummi Indian Fisheries Laboratory; and GregoryJensen, Jeffrey Lang, Gregory Blair and Anthony Whi ley of theUniversity of Washington School of Fisheries. We also express ourappreciation to Glyn F1eury and Danial Moriarty Graysmarsh Fare! forpermission to use their private intertidal property and to FrankProffitt and Richard Shideler for permission to use the Sandy PointCommunity Marina 1aunch ramp.
336

References
Armstrong, D.A. 1983. Cyclic Crab Abundances and Relationship toEnvironmental Causes, In: From Year to Year. InterannualVariability of the Environment and Fisheries of the Gulf ofAlaska and the Eastern Bering Sea. W.S. Wooster ed.!,Washington Sea Grant Publication, WSG-WO 83-3, pp ID2-110.
Cleaver, F.C. 1949. Preliminary Results of the Coastal Crab Cancerma ister! Investigation. Wash. Department of FisheriesBio ogical Report No. 49A:49-82.
DahlStrOm, W.A. and P.W. Wild. 1983, A HiStnry Of DungeneSS CrabFisheries in California. In: Calif. Department Fish and Game,Fish Bu II . No . 172: 7-24 .
Gotshall, D.W. 1978. Relative Abundance Studies of Dungeness Crabs,Cancer ma ister, in Norther n California. Calif. Fish and Game~64: 24-3
Pacific Mar ine Fisheries Corrmriss ion PMFC!. 1982. 35th Annua I Reportof the P.M.F.C, for the Year 1982. R.G. Porter, ed.! Portland,Oregon.
Stevens, 6,G, and D.A, Armstrong. 1984. Distribution, Abundance andGrowth of Juvenile Dungeness Crab, Cancer ma ister, in GraysHarbor Estuary, Washington, U.S.A. Fish. 6ull. In Press!.
1 t, M.M. 19113. 3 ue ile 0 ge ess C aa, Ca ce ~hist, it diin the San Francisco Bay Area. In: CaTii DDepartment Fish andGame, Fish. Bull, No. 172:135-154.
Wild, P.W. and R.N. Tasto Eds.!. 1983. Life History, Environment andMa c itu e stud e f th 0 g s c 0. caace striate, itsEmphasis on the Central California Fishery Resource. Calif.Department Fish and Game, Fish. Bull. No. 172: 352pp.
Wild, P.W., P.M.W. Law and D.R, McLain. 1983. Variations in OceanClimate and the Dungeness Crab Fishery in California. In;Calif. Department Fish and Game, Fish. Bull. No. 172;175-178,
337


Session V
Contributed Papers


Biases in crab tag recovery data
Nancy Diamond and David G. HankinHumboldt State UniversityArcata, California
Introduction
During the years 1981 � 1983, we tagged and released 12~037 adultfemale Dungeness crabs in northern California as part of project ac-tivities designed to determine basic life history parameters and move-ments of female crabs. Realizing these objectives required that weplace substantial reliance on tag recovery data from the northernCalifornia commercial fishery. Although these and other data allowedus to develop a remarkable description of the life history of adult femaleDungeness crabs Hankin et al., this Symposium! ~ analyses of tsg re-covery data were seriously confounded by sampling biases. In particu-lar: 1! movement analyses were biased by temporal and spatial depar-tures of fishing effort from random or uniform distributions; and 3!estimation of annual molting probabilities was biased by a! commercialcrab trap size selection, and b! loss of tags through rnolts.
The observation that analysis of tag recovery data for movements ofcrabs or other fishes is biased by the distribution of fishing effort isnot new. Edwards �979!s Bennett and Brown �983!s and McKoy �983! samong others, have all presented qualitative cons1derations of the pos-sible impacts of non-random fishing effort on attempted analyses oftag recovery data for movement patterns. It is obvious that animals canbe recovered only at a! locations where animals are presents and b! locations where fishermen are present. Tag recovery data thereforegive no information on movements of animals at a! locations whereanimals are present, but b! fishermen are not. Previous attempts atdiscerning movements of Dungeness crabs based on tag recovery datahave not ignored this problem Gotshall 1978!, but analyses have been
tuitive and subjective rather than quantitative and objective. That issinferences concerning apparent movements have been drawn largelyfrom visual inspection of tag recovery data rather than through use ofstatistical methods. In this paper we show that circular statistics may
341

be used to test for the significance of directed rnovemente of adultfemale Dungeness crabs and we briefly contrast our results withGot shall�' s ea rlie r wo rk,
To our knowledge, there have been no previous attempts to adjust forbiases that result from size selection of cornrnercial trap gear ineetiznation of annual molting probabilities . Hancock and Edwards �967!,
dd ' »ld' f 1 it' dd b drifts dC. nd, dno adjustments for size selection biaeee because they felt that commer-cial recovery gear was nonselective over the range of sizes withwhich they were concerned, Hodvever, they mentioned the possible im-portance of size selection in their paper and this problem cannot beignored in analyses of tag recovery data for Dungeness crabs. Sizeselection of commercial Dungenees crab traps in northern California!results from the large mesh size �0-100 nun on diagonal! of tr'aps,the usual r equirement for two �09 mm diameter! escape ports tominimize capture and handling of sub-legal rosie and female crabs! zand provision ot one or two large width about 50 mm! triggers onentrance tunnels to traps. These features of crab tr'ap design causeretention rates for sznall crabs to be far less than for large crabs,In the context ot estimation of annual molting probabilities, this meansthat tagged crabs that molt to larger sizes will have higher probabilitiesoi being recovered in commercial gear than will crabs of the samesize at tagging that fail to molt. Thus, size selection by crab trapsresults in a positive bias in estimates of annual molting pzobabilities:molted crabs are more likely to be recovered than are nonmoltedcrabs. In contrast, tag loss through molting results in a negative biasin molting probability estimates. Crabs that lose tags through moltscannot be recovered, and it is likely that tag loss *mong crabs thatmolt is greater than tag lose among those crabs that fail to molt. Useof crab tag recovery data for estimation of annual znolting probabilitiesthus requires that one account for both ot these kinds of biases.
The intention ot this paper is to illustrate the nature and potential im-pacts of those biases which confounded our analyses ot crab tag re-covery data and, where possible, to point out some steps which couldor should be taken to adjust for or minimize those biases. Becausemore formal peer-reviewed manuscripts are in preparation or reviewon both the subjects of annuaL molting probabilities of female Dungeneeecrabs and on their movements, presentation of the nature of biasesand of possible responses to those biases has been Limited in scope anddetail. However, future publications will provide full details of present-ed analyses and existing and/or contemplated publications hav* beenreferenced as appropriate.
Materials and Methods
Adult fernale Dungeness crabs were captured, tagged, zneasured andreleased frozn a contracted commercial crab fishing vessel out ofTrinidad Bay �1o03'N!, California, during January through March of1981, 1982 and 1983. In all years, tagging wae coznpleted prior to thestart of the annual molting /mating season which takes place from earlyApril through May in northern California. Most tagging took place be-tween the mouth of the Mad River �0o55'N! and Freshwater Lagoon�1 51'N! at depths of 18-22 m �0-12 fathoms! in 1981 and 1982d and22 and 44 m �2 and 24 fathoms! in 1983. Carapace widths were mea-sur ed to 0. 1 mm across the carapace excluding the tenth ante rolateral
342

spines�. Numbered FLOY anchor tags Model 0 FD68B! were insertedat the posterior epimeral suture to ensure high retention rates throughmolts see Pools 1967; Edwaxds 1965: and Butler 1957 for previoussuture tagging studies with Cancer cx abs! .
Commerrial fishermen were asked to return tagged crabs with the date,depth and location either LORAN-C readings or specific coastal land-mark! of recovery. As incentive for return of tagged crabs, an annual$500 drawing was held in which one tag was drawn from all those tagsreturned during a fishing season; the fisherxnan who had returned thewinning tag received the award.
Movexnent vectors straight line distances froxn release to recovery!were determined for crabs that were recovered at distaxxces exceeding2 km from the release site for two seasonal periods: a! the winter oftagging December through February!, and b! the spring followingtagging March through July!. These two seasons were adopted so as toallow comparison with earlier movement analyses by Gotshall �978! xa,nd also because they allowed separation of crab movements into thosebefore and during the annual spring molting/mating season. Individualxnovement vectors within each of four designated release areas whichdiffered in habitat characteristics! were summed using vector algebra,and then circular statistics Rayleigh and Moore's tests; see Batschelet198>! were used to determine the possibility of significant directionalmovement Diamond and Hankin, in review!. Movements less than Zkm were judged to be within the measurement error surrounding releaseand recovery locations and were assigned Qx0! rectangular coordinateswith no polar equivalents! . Because analysis ot recovery data formovements was performed by period of recovery, and because wefound no statistical dependence of distance travelled on numbers ofdays at lax ge, number of days at large befoxe recovery were not m-corporated in analyses.
Size selection curves for commercial crab traps were deterxnined byparallel i'ishing of nonselective experimental traps and selective com-mercial traps as recommended by Beverton and Holt �957! and Pope�975! . Experimental nonselective traps were custoxn-buUt, designedon the basis of laboxatory and field investigations, and had xnesh sizeof 55 mm on diagonal, six 25 mm wide triggers per entrance tunnel,and closed escape ports. Retention in these experixnental traps was100 la for crabs exceeding 85 mm carapace width. Based on the nuxrberoi' crabs retained at size in nonselective and selective commercialtraps, paraxneters of a commercial gear selectio~ curve wexe esti-mated following procedures presented in Pope �975; see also Diamond1983 x Appendix A! . Traps were usually fished for two days, but soaktixne ranged from two to seven. days. Comps,rieon of numbers andsizes retained in nonselective and selective traps showed that soaktixne did not influence size selection and retention rates when trapswere fished for two days or longer before being pulled.
However, during the early ps.rt of the fishing season in northern Cali-fornia, fishermen frequently fish traps for periods of one day or lesswith the re suit that c rabs are still activiely feeding on bait and t orhave not had the tixne or developed the "desire" to attempt escapefrom traps. This short soak time prevented comxnercial traps fromexhibiting their true selective properties whirb appear to requiresoaks of two days or Longer!, Actual tag recovery rates for "small"
343

crabs �35-145 rnm! as compared to "large" crabs > 155 mm! weremuch higher than would have been predicted on the basis of the com-mercial trap selection curve for soaks of two days or longer, There-fore, we developed an alternative method by which to quantify the rela-tive re c ove r y rate e for c rab s of differing s iz e e . For thi s method weused recovery data fram crabs that were recovered during the earlypart ot the season following tagging prior to March 1! . Because thesecrabs did not have an opportunity to molt, size at recovery was thesame as size at tagging. We computed size-specific recovery ratesessentially as the actual numbers recovered for a certain size intervaldivided by the numbers released. Relative size-specific recoveryrates were then obtained by dividing the a! expected! recovery ratefor crabs that molted to a particular expected! size by b! recoveryrate for crabs of the same initial size that had failed to molt ~ Theexpected recovery rates for molted crabs were thus based on recoveryrates for nonmolted crabs of the same size ae those crabs that hadmolted. More satisfying descriptions of the logic behind proceduresand more detailed descriptione of actual calculations are presentedin Diamond �983! .
Tag loss during molting was estimated from laboratory experimentsin which premating embrace females were tagged prior to molting inthe laboratory. To test the passibility that tags might be lost due tothe mating process itself, rather than due to molting per se, we com-pared tag lose between groups of females that a! molted in the absenceof males and b! molted in the presence of males and mated at thattime. Time from tagging until molting in the laboratory ranged from1 to 37 days.
Re suits
Movements and migrations
The seasonal pattern of commercial fishing effort in northern Califor-nia is governed by a combination of weather conditions and Dungeneescrab life history. Gotshall �978! stated that effort ie distributedfairly evenly at depths of 18-75 m at the start of the season � Decem-ber! continuing through about March. As large ocean swells and surfsubside s fishing effort raovee inshore during the spring months s culmi-nating in what our local fishermen call the "beach run' usually duringApril or May! when fishing effort ie concentrated in shallow waters < 18 m! along beach areas. This "beach run" coincides with the springmating season at which time often dense sggregatione of legal-sizedmale Dungeness crabs congregate inshore in ehallaw sandy areas tomate with newly molted females. Thus, the early distribution of fish-ing effort approximates a random distribution within the areas boundedby 18-75 m, whereas the distribution of fishing effort during the springis highly concentrated in shallow beach areas.
Figure 1 ehawe the four release areas which were considered in move-ment analyeee: Area I - an exposed sandy beach; Area II � a protectedrocky coast; Area Ill � an exposed rocky coast; and Area IV - an ex-posed sandy beach. Visual examination ot winter movement vectors forone of these areas Area I! suggested a possible northward movementduring the winter period Figure 2! . However, statistical tests of thesummed resultant vectors withi~ this and other areas, as well ae faraII areas combined, failed to support an hypothesis of significant
344

41' 40'
ster444
16 Ke
40'40'
Figure l. 3dap of release locations in northern California. Physicalcharacteristics of the four distinct release locations I-IV! arebriefly described in text.
directed movement during winter Figure 3!; all tests were non-signifi-cant p>. 05! . In contrast 4 individual movement vectors during thespring suggested highly directed inshore movements, particularly inArea II I'igure 4!; summed resultant vectors for Arena II and III, andfor all areas combined Figure 5!, were indeed significantly directedinshore p< . !. However, because tag recovery data were clearlybiased toward recovery of crabs that had moved inshore during the
345

III IITE R
RRER I
41 00'
/ IIS
Figure 2. Winter movement vectors for female Dungeness crab taggedand released frcnn Area I see Figure I! . Note that, although themajority of movement vectors appear to suggest a general north-ward trends circular statistics used to test for such a trend failedto support an hypothesis of directed winter movement. Vectors aredrawn to scale of coastline.
346

IS
t
Wig TE R
ILL IREIS
41'00'
10 Im
spring, these statistical tests were of dubious validity; the test assurn-ptions of randonBy distributed fishing effort we re clearly violated bythe concentration of fishing effort in shallow sandy areas during thisseason.
347
Figure 3. Summed resultant vectors for female Dungeness crabs taggedand released in Areas I-?V, and for all Areas combined, that wererecovered during winter months, Note that, although three of thesummed resultant vectors ere in a northern directions there wereno statistically significant directional movements in any of the fourareas or for all areas combined. Movement vectors are on samescale as coastline and asterisk denotes combined data,

SPRINC
ARRI E
41'OO'
Figure 4. Individual spring movement vectors for adult female Dunge-nese crabs tagged and released in Area II eee Figure I!. Note thatall but one of the vectors have an either south or inshore direction.However, recovery locations for these tagged crab also correspon-ded with locations of most concentrated fishing effort during thespring months. Vectors are drawn to scale of coastline.
348

INS
l SPRING
AI.I. ARKAS
41 00'
i0 Xm
Figure 5. Summed resultant vectors for movements of crabs in areasI-IV and for all areas combined asterisk! during spring months.Ndethat, three out of the four summed vectors for distinct releaselocations suggest movement south and inshore, and that the suxnxnedvector for all areas combined is also in a south and inshore direction.Movement vectors in areas I! and III were significant, as was themovement vector for aQ areas combined. Iloweee, recovery lo-cations for crabs generally corresponded to areas of concentratedfishing effort, thus invalidating an ixnplicit assumption that fishingeffort is randomly distributed. Vectors are drawn to scale of coast-line .
349

Annual molting probabilitie e
Commercial ear selection. A comparsion between numbers of adultfemales retained at size in commercial traps and in nonselectivetraps dramatically illustrated the potential significance of gear selec-tion bias in tag r ecovery data. This comparison is best reflected inthe generated commercial gear selection curve Figure 6! . For theopen port commercial trap gear, 50% retention wae achieved at 153mm, and 100/e retention began at 155 mm; this is essentially a 'knife-edge" selection curve. Below 134 mm carapace width, retention waseffectively zero, As an illustration ot the potential magnitude of com-mercial trap size selection bias which could result, coneide r recoveryof two crabs each tagged at 140 mm, one of which molted to 153 rnmbefore recovery. The molted crab would have a commercial gear re-tention rate of 50%%uo, whereas the nonmolted crab would have a rententionrate of about 0.3%; the ratio of these retention rates is about 150:1.However, as previously mentioned, the above calculation assumes thatall traps were fished for two days or longer before being pulled. Thealternative method which we used to calculate relative recovery r ates based on empir ical recovery data, not the gene rated selection curve!showed that the crab that molted to 153 mrn would have been about 6times more likely to be recovered than the crab that had remained at140 mm.
1.0
0.9
0.7
0.6
a O.S
m 0.4
cr 0.3
0.2
0.1 0 110 120 130 140 160 160 170S l E mm
Figure 6, Selection curves for female Dungenese crabs captured byopen port commercial crab t rape, closed port commercial crabtraps, and nonselective experimental traps modified as de-scribed in text. Size ie carapace width, excluding tenth antero-lateral spines, Note that selection curves for males would not bethe same as for 1'emalee because of different width/depth relation.
350

~Tt t' ~ Tt tMttt I l p t ttl ~ dt f f l*crabs that molted in the absence and in the presence of adult malecrabs. Tag loss through molting wae not significantly different betweenthe two groups. Laboratory tag retention rates averaged about 0.90for both groups combined and 95% confidence Limits for tag retentionr ates we re from 0.84 to 0. 96. Hodtfever p because the period fromtagging to molting was so brief in the laboratoryp these figures shouldprobably be regarded ee upper limite for tag retention rates.
0. 8813742
0, 91744
81 0.90090
An estimator for annual moltin robabilitiee. An estimator thatattempts to account and adjust for the biasee of gear selection and tagLose was developed in Diamond �983! and is presented below:
tt 1P x! =
N x! ~ F x+ 6! ~ T
M x! ~ F x!
where:
p x! = annuaL probability of molting from size x;
N x! = number of crabs recovered after one molting season atlarge that were tagged at size x and had not molted;
M x! = numbe~ of crabs recovered after one molting season at1arge that were tagged at size x and had molted:
6=6 x! = expected! molt increment for a crab tagged at size x',
F x! = recovery rate for crabs of size x;
F x+6!=recovery rate for crabs at size x+6 i,e, for crabs thatmolted to size x46 from size x!;
T = estimated! tag retention rate through one molt.
The form of this estimator is such that, in practice, it ie not necessaryto separately estimate the recovery rates F x! and F x+6!; what ie re-quired ie an estimate of the ratio of the two recovery rates [i.e.F x+6! /F x! I .
ln the numerical examples which follow, we attempt to illustrate themanner in which this estimator accounts for biaeee of crab trap eizeselection and tag lose, and to show the substantial impact that failureto account for such biases could have on estimates of annual moltingprobabilities. All examples are baaed on the following hypotheticalset of data:
351
Male Present
Male Absent
Pooled
~PT d I'Rt' dT Rt* t' Rt*

x = 140 mm; N x! = 8; M x! = 18; x+5 = 153 mm.
Thus, Z6 crabs [N x! i M x! ] were recovered that hed been tagged atan initial size of 140 mm x!; of these 26 crabs, 18 [M x! t had moltedto a size of 153 mm x+5!.
Zxample 1. No commercial gear selection.
In the absence of commercial gear selection, all molted end nonmoltedcrabs would be recovered at the same rates, regardless of size, so thatF x! = F x+6! and F x+6! /F x! = 1 ~ If there is no tag lose i.e, T = 1!,then equation �! reduces to the simple and intuitive estimator of annualmolting probability: the ratio of the recovered crabs that molted to thetotal number of crabs that were recovered. This ie the "naive" esti-mator discussed in Hankin et al., this Symposium!. That is,
AP x! = M x!
M x! + N x!N x!M x!
18
18 + 8
The effect of correcting for negative bias due to tag loss is to slightlyincrease the resulting estimate of annual molting probability. Forexample, if T = 0 . 7, then
M x!55P x ! *
1 + ~N'TM x!
M x! + N x! ~ T
18 = 0.7618 i 8 ~ � 7!
Example Z. Size selective comme rcial recovery gear.
F x+5!/F x! = 6,05
Using the same recovery data as above and assuming that there is notag 1Oss T= 1! N the mOlting prObability estimator gives:
1 1P x! = = 0,27
1 1 ~N 1.F + 1 + �.55.55I18
M x! ~ I' x!
352
For x = 140 rnm and x+5 = 153 mm, our empirical estimates of recove ryrates gave:

Thue ~ adjustment far size selection bias results in a substantial re-duction in the estimate of annual molting probability from 0.69 Example1! to 0.27, Correcting for tag loss would again slightly increase theestimate of annual molting probability. For this same exampLe, if T =0. 7, then the moltiag probability estimate would be 0.35 which shouldbe compared with the biased estimate of 0.76 ia example I!.
Discus sion
Gotshall �978!, based ou visual inspection of plotted tag recovery data,proposed that adult male Dungenese crabs moved northward in northernCalifornia during winter months, and then southward and inshoreduring the spring. Our analyses of movement data from female Dunge-ness crabs in northern California suggest that the apparent trend ob-served by Gotshall was probably not statistically significant; wintermovemente af females had no statistically significant directionaltendency. Regardless of the statistical conclusion regarding wintermovemente, however, analyses of these movements were not seriouslybiased by the distribution of fishing effort. With the exception of cr absthat may have moved into very deep waters > 75 m!, the distributionof fishing effort during the winter was such that movements of taggedc rabe in all directions should have been equally Likely to have beenrecorded. In such a case, the use of circular statistics to evalu-ate the significance of pcs eible tendencies of crabe to move in particu-lar directions seems a substantial improvement over qualitative andsubjective visual methods ae used by Gotehall!.
There ie no question in our minds that many adult female Dungenesscrabs move inshore ta molt and then mate with adult males in shallowsandy areas during the spring in northern California. However, thefraction af the female population that engages in such rnovemeate re-mains unknown. Because fishing effort was concentrated in shallowwaters during the eprmg months, movements of females that hadmoved to deeper waters or remained offshore would nat have been re-corded in propartion to their frequency had they taken place. However,if substantial numbers of female crabs remained offshore during thespring, or actually moved further offshore, we are reasonably confi-dent that they would have to be females that were not destined to moltand mate during the spring moLting/mating season. Because it ie notnecessary for adult females to molt and mate each year in order toproduce and extrude viable egg masses in the fall Diamond 1983;Henkin et al., this Symposium!, it ie indeed possible that some femalesmay remain offshore during the spring. If these females were destinedto molt, one wauld expect aggregations of legal-sized males in offshorelocations and associated concentrations of fishing efforts these are noCobserved in the northern California fishery. Given these coneide rations,we feel confident that there is indeed an inshore spring mating migrationamong female crabs that are destined to malt and mate. Definitiveproof that such a migration of females takes place for all females, re-gardless of molting state, would require an expensive large-scaLesampling program in which vessels were chartered «o fish at all depthsduring the spring months so as to ensure that fishing effort for tagrecoveries! would be uniformly distributed. Although this kind ofapproach has been successfully applied in small-scale localized crabtag recovery proj ects eee Hyland et al ~ L984!, we are hesitant to ad-vocate such an approach for studies of movements of Dungenees crabsin most West Coast areas.
353

In contrast to a relative inability to adjust for possible biases due tothe distribution of fishing effort, it seems possible theoretically atleast! to attempt adjustment for biases resulting from comme rcialcrab trap size selection and tag loss through molts. Above aU else,it seems most important to fieb nonselective crab traps alongsidecommercial crab traps so as to allow assessment of the degree ofsize selection bias. Several advantages result from comparisons ofsize frequencies of crabs captured in the two gear types. First, theminimum size of full vulnerability to the cornrnercial crab traps canbe readily established. For crabs exceeding this size of first full vul-nerability to commercial gear, it is unnecessary to make any adjust-ments for commercial gear size selection in analysis of tag recoverydata for molting probabilities or survival rates; see Hankin et al.,this Symposium!. Second, use of nonselective traps ensures that sig-nificant numbers of small crabs will be captured and allows for thetagging of these small crabs. Finally, length frequency analysis ofdata collected from nonselective traps can lead to a meaningful assess-rnent of stock size composition; this is virtually impossible based onsize frequencies collected from comme rcial crab traps or fr om com-mercial rrab traps with closed escape ports, Size selection curves infixed commercial trap gear Figure 6! have such a steep slope thatcollected length frequency data have little practical value for animalssmaller than the legal size for male Dungeness crabs.
Although the estimator that we developed can in theory account forbiaeee due to size selection and tag lose, there were serious practicalproblems involved in actual application of the estimator to collecteddata, First, as pointed out previously, the se lective properties offixed crab trap gear appear to sensitively depend on trap soak time.Traps exhibited their full selective properties only after having beenfished for two full days or more without rebaiting. Because earlyseason soak times in northern California were often lese than two days,Ge of the formal fitted gear selection curve generated estimates ofmolting probabilities not presented! which were probably biased atleast as severely as were ''naive" calculations which omitted considera-tion of possible size selection altogether. Our reliance instead uponempirically-derived relativ* recovery rates wae certainly a preferablealternative to ignoring size selection bias altogether', but it too hadpractical problems in application. First, we implicitly assumed thatrecovery rates depended only on size and not on molting history orcondition. It is possible that this assumption ie false', freshly moltedcrabs may more aggressively search out food and may enter traps athigher rates than nonmolted crabs. Secondr the use of early seasondata to estimate relative recovery rates wae, in part, invalidated bythe general trend of increasing soak time for traps as the commercialfishing season progressed and catch rates for legal males d.ropped.Hos'ever, during the beach run most traps are once again fished forless than two day soaks. Because most recoveries took place duringthe early season and during the spring beach run, the ove rail effectof changing soak time is unclear.
Finally, it is likely that the tag retention rates reported in this paperare overestimates of real tag retention rates. Tagging conditions inthe laboratory are obviously more favorable than on board a vesselduring a winter storm at sea., and results of laboratory tagging maytherefore not give an accurate reflection of tag retention in the field.For example, we observed that tage had migrated away from the
354

suture line on some recovered crabs that had ~olted; many of thesecrabs would probably have Ioet thei r tage if they molted a second time.In addition, the length of time from tagging to molting was far shorterfor laboratory � tagged crabs than for field-tagged crabs. Tag retentionmay depend on the degree of development of the newly-forming exo-skeleton at the time of tagging. Presumably, this new exoskeleton willbe more completely formed by the time molting is imminent whenlaboratory tagging took place! ae opposed to several months in advanceof molting when field tagging took place! . Improved field-derived es-timates of tag retention rates could probably be derived from analyeeeof data collected from a double tagging study. If crabs were taggedwith anchor tags at both the right and left sides of the posterior epi-meral suture, then the relative numbers of molted and nonmolted re-cove ries which retained one and two tags could be used to estimatetag loss through molting and to distinguish such lose from tag loss notassociated with molting. We hope to ca,rry out such a double taggingstudy on adult female Dungenese crabs in the future.
Acknowled emente
This work is the result of research sponsored in part by NOAA,National Sea Grant College Program, Department of Commerce, undergrant number NA80AA-D-00120, through the California Sea GrantCollege Program, and in part by the California State Resources Agency,project number F F-72. The U.S. Government is authorised to repro-duce and distribute for governmental purposes. We thank CaliforniaSea Grant for their support.
Literature Cited
Batscheletp E. 1981. Circular statistics in biology. Academic Prese,London. 371 pp.
B* tt, ~ .B., dC.C, B . 1933. C b C * Rbt ! *-ments in the English Channel. J, Mar. Biol. U. K . 63' .371-398.
Beverton, iR, J,H. ~ and S. J ~ Holt ~ 1957. On the dynamics of exploitedfish populations. Min. Agric. Fish and Food U.K.!, Fish. Invest.Ser. II, 19. 533 pp.
Butler, T.H. 1957. The tagging of the commercial c rab in the QueenCharlotte Islands region, Prog. Rep. Pac, Coa.et States 109: 16-69.
Diamondp N. 1983. Demographic statistics and annual molting proba-b'll'it' f tb* & ll f 1* C 3* * b C * ~t! 'northern California. Unpublished 1vl.S. thesis, Humboldt State U.,Arcata, Calif. 106 pp.
Edwards, E. 1965. Observations on growth of the edible crab Cancer!. R pp. P.-V. R . C . p* . 1 t. Z pl . !d*
]56: 62-70.
1979. The edible c rab and its fishery in British waters.Fishing News Books, Farnham. 142 pp.
355

Cotehallg D.W. 1978. Northern California Dungeness crabp Cancert, t h bytgg'g.CI.P'hC
Hull, 64: 234 -2 54 .
Hancockp D.A., and E. Edwards�. 1967. Estimation of annual growthth dbt bIC ed Cf.I.C .p .It.ppt
Mer 31: 246-264.
Hanking D.G. 5 N, Diamond, M, Mohr ~ and J. Ianelli. Moltincrements p annual xnolting probabilities 5 fecundity and survivalrates of adult female Dungeness crabs in northern California.This Symposium.
Hylandg S.J. 5 B. J. Hill, and C. P. Lee. 1984. Movement within andbetween different habitate by the portunid crab S~clla serrate,Mar. Biol. 80: 57-61.
Mc Koy, J.L. 1983. Movements of rock lobsters 5 Jaeue edwardeii Decapoda: Palinuridae! 5 tagged near Stewart Island, NewZealand. New Zealand J, Mar. Fresh. Res. 17' .357-366.
Poole p R.L. 1967. Prelixninary results of the age and growth study ofth tt bfC * ~ ~t* ' ~ C I f'': tb gg th f C. ~t' Bdd ~ B y. PP 555-557 IN P, gy p.Cruetacea, Mar. Biol. Assoc. India. Part 2.
Pope g J.A. 1975. Manual of xnethode for fish stock assessment.Part IV, Selectivity of fishing gear. FAO Fish. Tech. paperNo. 41.
356

Feeding in relation to morphometricswithin the genus Cancer: Evolutionary
and ecological considerations
Peter l.awton and Robert W. ElnerDepartment of Fisheries and OceansSt. Andrews, New Brunswick
Abstract
The feeding behavior of crabs of the genus Cancer is reviewed,particularly with respect to morphological anc evolutionary patternsassociated with the population dynamics and ecology of commercialCancer spp. Ten northern temperate species are considered: seven~uac fic sp les LC, antenna ius, C. anthon 1, C. btannert. C. g acf!is.C. ma ister, C. ~ne unensis and C. g o uctus and three Atlanticspec es C, borealis, C. irroratus and C. ~eurus!. The genus Cancerhas prevto ally teen c!ass~fin, based o cd special feat r s, 1 to foursubgenera. From an examination of the mechanics and functional mor-phology of the chelae and other body characteristics, together wi thavailable information on feeding behavior, a reclassification, based onecological principles . is presented. Two groups of large adult! Cancercrabs are recognized; the first comprises species C. antennarius,C. ~antho iC, hors,alia, C. ~salus and C. oductus! uhich haverelatively massive and powerful chelipeds. These species, which alsohave low relative to carapace width! leg lengths, typically occupyrocky habitats as juveniles and prey primarily upon sedentary and slowmoving hard-shelled prey forms. In contrast, the second group C,g act!is, C. irroratus a d C. ma iste ! has propu ttonately sm!Te,1 ss pometf !~but aster cTposfng c e tpeds. These featu es. and thecomparatively higher leg lengths of crabs in this latter group, appearassociated with a capacity to feed upon mobile epifaunal prey and theoccupation of sand/mud substrates. Two small species C. branneri andC, orerrone 's a e conside ed to form a third group, ecnlogi allydistinct from the larger crabs. The occurrence, form and significanceof cannibalism in representatives from the two large Cancer groups C.
dC.~t!l 1 tdt pplt'*dy. Tplitions for fisheries management of Cancer crabs deriving from ourecological grouping are suggested.
357

introduction
C rabs of the genus Cancer form a widespread and successful groupsupporting important co r mercial fi sheri es on the N. E. Pacific, N. W. andN.F. Atlantic coasts. Qn the basis of carapace featues, particularlyof the fronta 1 regions Nations 1975 ! recognized four subgener a ofCancer:
Type speciesSubgenus
C. 9! bbosulusC. pagurusT.'. ~magg>~s s eerE. ~051 s
RomaleonCancerFeeaca rctnvsETaar i s
Romal eon is interpreted as the most primitive of the subgenera becauseboo a ly fos 11 co d, 1 ti ly s all *, a d mi stan ofmany characters from which those of other species of Cancer could havebeen derived . The typically large size and unornamen~e c eli peds,SmOOth anterOlateral marginS and prOnOVnted latera! eXpanSivn Of thecarapace of Cancer, sensu stricto, are in strong contrast to thefat f spaces~amoco d sec d d to b. cent N ti one 1975!. I'h tang ber of th ge s is th E ropes diblcrab, C. pagurus, adults of which may reach a carapace width CW! of270 mm an~sve in excess of 25 years Bennett 1974!. Metacarcinuseppes 1 t d ate d lop e t bet ncm 1 a rrg.asubgenera. Nations �975! specvl ated that the ~ig y ornate andtypically small Glebocarcinus species represent an evolutionaryd slop t aygr rmt ai on -N t «1 s - C tre d fincreasing size.
The current geographic. distributions and phylogenetic affinities of allrecent Cancer species are summarized in Table 1. The present -dayabsences cancrid crabs from the coasts of S.E. South America, the S..E. and W. coasts of Australia and the S.W, coast of Africa appears tobe related to temperatur e MacKay 1943 ! and other migrational barriers Nations 1976!,
358
There have been several autecological studies of present-day Cancerspecies Bigford 1979; Lawton 1983; Shelton et al. 1979; Stev~ens e al.1982! but, hitherto, there has been no attemWp Wo classify the genus snterms of functional ecology and thus complement Nations' �975!taxonomic approach. Crabs of the genus Cancer are typically open-coastmarine species and may be distributed over a substantial depth range Table 2!; however, life-history stages of some speci es do occur inareas of lowered salinity Jeffries 1966; Sugarman et a'!. 1983; Wolffand Sandee 1971!. JuvenileS are normally fovnd in sS!avow, nearShOrewaters throughout the year, while adults of some species have beenreported to undergo seasonal inshore-offshore migrations. The timingof these migrations appears to be related to temperature andreproductive conditi on C, ir roratus: Bi gford 1979; Haefner 1976; C.pagurus: Browr! and Bonnet T9 l0; Hennett and Brown 1983!. Jonah crabs,
oeif, cl de k r ~ bs, 1',1 at s, f p f d rockylihttats 1 ~ ih N.E. etl ti � rf 1911; F g ~ rty 1975; Ii g 1992!.Thus, there may be spatial segregation of species and age-classeswithin this broad distributional framework.

Table 1. Geographic distributions and phylogenetic affinities ofrecent species of the genus Cancer adapted from Nations 1975!.
DistributionSubgenusSpecies
Pacific Ocean
C ~hi t 8 thh 1898 North6 E. AsiaNorth8 E.AsiaNorth
Glebocarcrnvs
lebocarcinusCancer oregonensis Rathbun 1898
Canrer antennarius Stimpson 1856
Cancer branneri Rathbun 1926 Nor th
Nor thCancer jordan> Rathbun 19DD
Cancer anthonyi Rathbun 3897 North
Cancer gracilis Dana 1852 North
Cancer ~ma ister Dana 1852 Nort h
Cancer productus Randall 1839 Nor br
Cancer ~frol odon POeppig 1836 south
Cancer edwardsii Bell 1835 South
Cancer plebejvs Poepi 99 1836 South
Cancer porteri Rathbun 1930 Sou t hGu 1 f
orni aAsia
Glebocarcinus Eastern AsiaCanrer tumifrons Yokoya 1933
Cancer gibbosulvs DeHaan 1835!
Cancer nadaensis Sakai 1969
C ~3'« ll t 1893
Rona!eon
Romaleon
Cancer
Eastern Asia
Ecrstern ASia
Eastern Asia
New leal and,TaSmania andAustralia
Atlantic Ocean
Cancer bellianus Johnson 1861
Cancer borealis Stimpson 1859
Metacarcinus iceland to N.W.AfricaEastern NorthAmericaEastern liorthAmericaWestern 4Southern Europe
Met acarcinus
Cancer irroratvs Say 1817 Cancer
CancerCancer ~a urus Linnaeus 1758
359
Rema leon
Rema leon
Romaleon
Metacarcinus
Metacarc'Inus
Metacarcinus
Carrcer
Romaleon
Metacartinut
MetacarCinus
Cancer
Cancer saka» Takeda and Miyake 1972 Giebocarcinus
Cancer novaezea landiae Jacquinot 1853! Netacarcinus
WeSternAmericaWesternAmericaWesternAmericaWesternAmericalaest e rnAmericaWesternAmericaIiesternAmericaWesternAmericaWesternAmericaWeSternAmericaWesternAmericaWesternAmericaWesternAmerica,of CalifEastern

Vl C 4l
IJ5
Vl CIlL CAJ0 ICI
V I 4lCL
IAC.D C 4IIAItD.
Ev CtI CiIIC D
Eljl
4J ~C ~
EV 4092 CAjC 0
R EV «jIlC 0
EL RIlC 0
ECjlL rII
V C 0V
IrtJQICI'lPIIJLPlli
CCIVj
CPCv
VtVlIll'0 O
Ol VlOJIAAlCIl0 aL Vl
VtIt
Vl0 L Vt
IlD Cl
VI0 QC VIV CPVtIA14 a
40C VI VI
OiCD Dg V
IlI0 La Cpfrtfl C0 3
'L0
0 OJ
0 Ct.OJL.
'IOtL
I 4'I 4P
IlO DCVl fll
4l IJe
IA4l0 C
0tll III3 VRQt LRQ
CIV 4l>VCjV Q.g 4t
IAVt
C. 0
Vt I
«A VI0Ol 4t~ p aC ~ P
C 0 Cr 0LVJVlII00 IfO0Vl IAE 'OR aQ
0
0fl-fv 0 0flj 41-
Vt OI0 R C
D L0D VE
I 0I L
C 0Cr 4�Lt 'C 0 RLJ
L 00 VII
4' 0R 4JD Cjl ICR 4lX K
I 0R Ltfv IIOrW E
~ J RV C
RCt AC
4-
C C OtI4IIl.
olol
360
Vt
L.Oj
IO
C 00Al 'I800C
'0IO
OlCjt4t C40IJ C.Il ACL D.Il44
C 0+ Va E
Cl
OtCVl C.II V3 4A'I ag ~OQ
O '0~ CRI0 VlCjlCVI 4lt0 0C
0I/ V~ A 0DERLll Z
C4lI4tOJ VWV LIO 0
Il IlIrl 3 VIIO IlR L V0 Cjt IOVIA0CWaIll a
COJ 4lIOCjl IRVJ Q.0 OlPC IA
RI
C CAC ~ ICIR ICL VI RQO RoVC CRL
Air CPC00 47D
Al vifllvl I�VJ09' r0I 43 VtCVI 0I VJO fv fljCPZZ
0 LRaOl LVtCrCl
CIlCCI
0Cvl Il IE0EElrl
0

Vt 00CJ AJL
c 00 AJ4Jth tdjo04 C
DVI
ld Cl.4ICJO Cldl C0 '4L00 dl AJIC D.dt'0
IOEJJ ddL P4I CDC 0
EI CltI
0
Ehl44 ddL OdtC 0
AfN
4ICCC
'0Ih C4l ht IOI dl VI0 R DVl ClL AJIJ D
CVlOP dtLtd 0+4 thJD 40 tP-th 0
D I-4lVl JJD O
IO4JO
VI'4 4t
Al+IIdl
'4L Ol00R AJ IJDVI th I
dt
0LI
0 OJ4-
C hl
AC
4C 0
VtE
L VI~ -IVlIOIPJ dt
AP0 00 dJ
C IDIJ
VIIJOI
VlIOd.0 A.
IV0 4lR.Vl
CJ I
361
VlLI
I 0
tOIOCJ
CPCtCJC 0
~ JJld vl dlC AJIO ~ lOtll Ldt 4-t~ > Vt0 R Dj ~R
4R L 0IAID
0 LPChtdCP0 0 4I
N AJCO vlCll4I 4PVl
D
i~ PCPPCth rCJI 0OlIZI 2
IO044 j
0A ORlit 0
AJ IIJdl ~Cl '0
E'0 E SRC 'WX 04J 0RJD c dte R
OlC Vl0Vl OCPI PJI
NOt Ol0
IVO ACIJ0 fd
AI ' AtdaEVl Cdtl 00c 0 0 CCPI tlt .
'OCdl td Vllh 4t0 4J dl RIA C LtOL Vltd CO JDPR
EIL CD0 IDOC the 0R ltlI/I IOt th 0CO '08$o~
IDL0
pI R0 dd0CJ J
0U CPI
OJOtCdlVl CC 0R
C.g Cd
CltIOtOtC0
* 0 vlAt dl dtC AC LAJPO4I I/ICd '0 I- Jd
j R � 8
VI
lhD. APCJC 0 4I IDL M II
S A' c
4P0 0thR IOt Clt 4lICI 0 JJI '92J
Ilk
Vl JD
0 Ldt 0IhVl ID AP0 E Ih

This study reviews and compares recent and ongoing studies into thefeeding behaviour and ecology of northern temperate Cancer species:ii Pacific co si. sp Ii. t ari s, C. ~tho i, C.c. gist a d c. il d t T ddt dree tia tic spec rc. bc ~>rara s a d c,~~p th t « ~ tiy pi ~ teo ccm eecyy.T oatagciiic C p i s, C. braaae i a d C, ego
ci d d ' * br aiyses to mBeet. s p ~t g riccomparisons. We examine the mechanics and functional morphology of thechelae and other bndy characteristics, together with availableinformation on feeding and cannibalism, and attempt a reclassificationof the genuS baSed on ecologica1 principleS. We prnpOSe that anunderstanding of such intrageneric patterning may be important inelucidating the population dynamics of Cancer.
Mechanics and Functional Morphology
The hypothesis that the chela acts as the template upon which feedinghabits and prey preferences are determined Elner 1978! has beenverified in a number of autecological studies Roulding 1984; Elner1980; Elner and Campbell 1981; Lawton 1983!. Attempts to define moregeneral e.g. biogeographic! relationships between claw form andpredatory behavior Vermeij 1977! have yielded equivocal results. Thisis partly due to methodological problems Abele et al, 1981! but alsodue to the Chela having additional functionS, SucCC aS reprOduCtivedisplay, which may confound simple correl at i ons wi th feeding habits E1ner and Campbell 1981; Stein 1976!.
Cancer crabs are atypical among moliuscivorous crabs in possessingmonomorphi c chelae, both of which may be used ln active crushi ng rolesduring feeding Lawton 1983; Vermeij 1971!. Chela forms illustrated inFigure I appear similar, although there are differences in grossmorphology, mechanical advantage and occlusive geometry which can becorrelated with feeding habits.
Intrageneric comparisons
As part of an ongoing study into Cancer crab biometrics, we haveexamined the morphometrics of male ancafemale specimens of 10 speciesfrom the N.E. Pacific, N.W, and N,E. Atlantic Oceans Table 3!. Arestricted "preferred" size range was identified �00-130 mm CW! at orabove the size of sexual raaturity in order to reduce potentialartefacts due to allometric growth and sexual dimorphism Bigford 1979;Campbell and Eagles 1983!. For species of smaller adult size C.oregonensis and C. branneri!, the largest available specimens were
Ratios were calculated from measurements of selected body dimensions Figure 2 ! and compared between sexes t-test ! and species analysis ofvariance followed by Duncan's multiple range test to identifyhomogenous subsets among species!:
CPCSHAPE = Relative carapace shape carapace length/CW!
RELLEG = Relative leg length pereiopod 3 length/CW!
CHSI2E = Relative claw size propodus height/CW!
362

363

I/I /U
O «/««/ ole
QJ0 ««/
SI
O. w mLP
'««««/C ««/ &V4J Vl«:0 «7IOEJ /«/~ E
o4l« 2 // � CV!«/
364

- MECHADV = Mechanical advantage lever LI/lever L2!
� CHLENGTH = Relative dactylus length dactylus length/propodus length!
- CHHEIGHT = Relative propodus height propodus height/propodus width!
All claw ratios were based on measurements of the right claw Figure 2!,
B
Figure 2. Carapace and appendage measurements made during morphometricanalysi s of Cancer crabs,
A = maximum width of carapace including anterolateral teeth!; 5 =maximum length of carapace; C = propodus height excluding spines onupper margin!, II = propodus width; E = propodus length; F = closermuscle apodeme plate area in xm of plate dissected from propodusof right cheliped!; G - distance from point of articulation of dactyl uswith propodus to point of insertion of closer muscle apodeme p'late lever LI!; H = dactyl us length lever L2. mechanica1 advantage ofthe cheliped system is given by LI/L2!; I = total length ofpereiopod 3 measured as the sum of individual segment lengths betweenpoints of articulation!; 2 = propodus height, K = propodus width, L =dactylus height and M = dactylus width of pereiopod 3; measurements I-Htaken similarly for pereiopod 5. All measurements except F! taken tonearest 0. I nvv with vernier calipers.
365

Table 3. Cancer material examined for comparison of mechanics andfunction~a morphology.
No. of specimens Source ofmaterialSpecies tocatity
3 ! British Columbia3 I Provincial %scum65 SCUBA diving
C. branneriI.'. ~gC. ~oe onensisT. magister
4Vancouver Island, 7British Columbia, 5Canada 4
3 Purchased from3 live markets3
C. antennariusZ . anno!onyi S. California,l.. ~~ollc s ! U,s,n,
4 SCUPA diving5C. borealis Bay of Fundy, 50. irroratus S.W. Nova Scotia, 6
Canada
3 SCUBA divingNorth Wales, U.K. 3C. Pagun!s
Sexual dimorphism was apparent in certairi ratios for a number ofspecies but showed no consistent intrageneric pattern. Accordingly,the following comparisons Table 4! were based on data obtained formales only.
The relative length of the pereiopods has previously been linked toactivity 1evel and habitat usage in two co-occurring Cancer species, C.borealis and C. irroratus Fogarty 1976; Jeffries 196~r analysisboth confirms and extends these observations. REi LEG was lowest amongthose species typically associated with rocky substrates C. ~aurus,C. productus, C. boreal is and C. antennarius; Table 2!. Species which
Tan ere often an ope» s d d bst at s had ldghe nlLLCGratios Table 4! which may reflect adaptation either to feeding onfaster moving epi faunal prey forms or avoiding predation in exposedhabitats Jeffries 1966!. Cancer graci1 is, C. oregonensis and C.i ra 1 h d th highest ngTCCC a~ ppg 1 s 11aaRTt STzeS than the Other species considerea in this analysis Tdhble2!, again suggesting a relationship with absolute body size.
366
Trends in CPCSHAPE conformed, i n general, with Nations ' �975 !observations on carapaci al features of crabs in the vari ous Cancersubgenera, All Metaca rci nus and Cancer species had signficannt y Tower
ti th c. a~ac.a~eon nsis oe b of annal . dGibe ci,p t ly.C t afs,a!sana~loofg~oa eo, Ead a s g f tly 1 atroat ~ a. bra seri, coops able
tli Ret «i s a d Ca cer crabs. tlati s TL975l h d th t C.antennarius was atypical among Romaleon, being convergent in form to C.
~ y g t !. C ~a a i s is the largest m b ofgtie!ro I oOg p A! y!, s g'gges ging 1st anterolate al e pa siof the carapace may he related to acquisition of a large body sizerather than phylogenetic origin Iver se.

Table 4. Compaii son of body, leg and cheli ped rat i os of male Cancercrabs.
Di fgen s i on orratio measured Low Species codes and parameter values High
BRAH GRAC CPAG CBOR CANT C IRR ANTH PROD CRAG49. 3 75 .8 107 . 7 120 . 2 123. 6 124. 2 131, D 14 1 . D 4. 33. 80 5. 97 13. 66 5. 44 3. 34 1, 79 3. 94 1, 36 17. 764 7 3 5 3 6 3 3 4
Carapacewidth
Spp. OREGHean 33.09 S.E. 4.16n 5
pm!
GRAC ANTH.633 .634
BRAN IDREG.678 .750
PROD CANT CBOR CHAG.595 .620 .620 .622
CPAG CIRR.624 .631
C PCSHRPE
ANTH CIRR CPIAG GRAC OREG BRAN1.118 1.125 1.165 1,247 1.250 1.285
CPAG PROD CBOR CAHT. 982 . 951 . 974 1. 06
RELLEG
BRAN PROD. 238 . 248
CBOR ANTH CANT OREG.282 .286 .332 .390
cHAG cIRR GRAc CPAG.203 .216 .228 .232
CHSIZE
PROD CANT ANTH CBOR. 368 . 378 . 387 . 394
CRAG BRAN BRAC CIRR.268 .306 .322 .330
CPAG OREG. 364 . 365
HECHADV
ANTH CIIAG.486 .492
GRAC CIRR.494 .495
CBOR PROD CANT. 503 . 5D8 . 514
BRAN CPRG OREG.519 .525 .587
CHLENGTH
CHHEIGHT CRAG BRAC BRAN CIRR CPAG PROD ANTH CBDR CANT OREG. 415 . 44Z . 444 . 451 . 474 .477 . 499 . 539 . 548 . 638
Speciea codesc AÃIH C. anthnnyi; BRAN C. Oranneri; CANT C, antennariuS; CBOR = C.uorealis; ~. irroratus; CPDEG=C. magister; CICADA ~pagurus;~. Oregnnenaia; 5070 C. reduatuS.SSneS link hagsegenauSsubsets led~ca e liy Duncan's nuit p e range test P « 0.05!.
367
The observed trends in CHSIZE reinforce the above separation of Cancerinto two main groups; CHSIZE being lower in those speciescharacteristic of soft-bottom substrates. Whilst differences inMECHADV were less distinct than those in CHSIZE indicated byoverlapping subsets in Table 4!, it is pertinent that the lowest ratio�.268!, indicating a capacity for fast but weak closure, was found forthe claw of C. magi ster. Brown et al. I979 ! reported MECHABV values1 th ti anaatter chal e 2 th p t id, c ill t s s pid s~ f 9,293 d 8,232, p tt ly. The chal af C. Soae ~dt h th higl st MscHAllp 1 th t dy t 8. %4. 212 c shet chelaeof male nephropid lobsters, Homarus americanus, examined by Elner andCa pbell i1981! h d M~HOll ~D.. a 1 at o of the s bs tgenerated for the CHLENGTH and CHHEIGHT ratios � and 6, respectively!indicates that the high MECHAIIU of the claws of species such as C.antennarius, C. anthon i and C. borealis has been achieved primarily~og 2 asiag e e le gih ~t» tiy ~ d byCHIIEIGHT! than by ChangeS ln leVer length L2 apprOximated byCHLEIIGTH!.

8rown et al. �97g! categorized the patterns of occlusion of the teethof the cheFiped systems of five diverse species of decapod crustaceansfrom the famil ies Grapsidae, Ocypodidae, Xanthidae, Portunidae andAstacidae . They found that each cheliped possessed a linear array of2-4 distinctive regions, each differing in functional capability.Furthermore, they concluded that single descriptors of claw form suchas MECHADV! seriously underestimate the potential capabilities of theclaws to which they are applied. We are currently analyzing theocclusive geometry of Cancer claws to gauge the range of variation inthese features at an i ntragener ic level� . Preliminary observation sreveal differenCes both in teeth number � in C, roductuS; 7 in C.~ i t ! a d fo si pie d titfo 1 C. agister; comp, iti-c p, d titiom 1 C. t i s! bates spe ~ 1 o fig ~ ~1!, uhl Il pe haps relet ~g a ti ity.
Cancer ore onensis has the largest CHSIZE of the species considered in~tis stv y, an apparently of the genus as a whole Vermeij 1977!.From a standard predation viewpoint, a low CHLENGTH ratio would beexpected for this chela, resulting in a high MECHADV. However, thespecies also has the highest CHLENGTH ratio thus resulting in amechanically weak chela Table 4!. Hence this chela form may haveresulted from selective pressures other than predation. Canceroregonensis has a similar body form including relatively~arge claws !aaaatat p f i t tidal ocky s o g kelp! to th N,E,Atlantic xanthid crab, Pilumnus hirtellus L,!, in which the chelae are
p t t 1 ago isti 4! P ~te splay � bb 1972!.
Ontogenetic consideratinns
Propodus height of male crabs from four spec!es C. borealis, C.i rroratvs, C. pagurus and C. grodvctu s! for whi ch data from a widersize range of ~anima s were avail Te was regressed against CW � n-lnt ransformed data! and compared between species anal ysis ofcovariance!.
There were no significant differences between the slopes P P 0. 05!,but there were significant differences in elevation s P 0. 05 ! of thepropodus Lwight: CW relationships, over similar CW ranges, between C.borealis and the other three species Tab'le 5!. The adjusted meansacs 4 p p d s h ght rm 12.gs C. ' o at ~ !; 12.97 C.
p odu t !; 12 97 C. p gu ! d Eg.gg' m~b lis!. The~epopod s bight liat ea ',: f p 1st as c p hl tthose obtained using CHSI2E and CHHEIGHT ratios based on a narrow sizerange of adult crabs and suggest that the relationships we haveidentified apply equally to juveniles.
Although some studies of decapod claw mechanics have indicated thatclaw features, such as mechanical advantage, do not change appreciablythrough ontogeny El ner and Campbell 1981; Warner and Jones 1976 !,Costello and Lang �979! found that the MECHADV of both chelae of thelobster, HOmaruS americanvS, waS the same during early develapment andth t Ntcm! groa t~ser ci 1 1 i reaped to the y pt tiadult value. Interregional variation in chel a morphology and size mayalso occur Elner and Campbell 1981!, In view of these factors and inCOnSideratiOn Of the Smal 92 Sample SiZeS uSed in the present analysiS,ovr conclusions should be regarded as tentative, attendant uponexamination of more comprehensive rollections of claw material.
368

Table 5. Regression constants for the propodus height T in rpm!
and CW X in mm! relationship ln Y = lna + b inX! for male crabsof four Cancer species. r = correlation coefficient.
CW mmn lb. X.
Regression constantsSpecies
t. irrorat att. ~erat
C, productus
-1.665 1.022 0.929 30 30 119-1. 954 1. 101 0. 998 31 24 118
-2.150 1.149 0.995 24 23 115
-1.922 1. 109 0. 994 29 26 120t. oo
Data sources; A. Campbell and P. Lawton unpublished data!.2P. Lawton unpublished data!.
G. Boulding unpubli shed data!.
Natural Diet
Table 6. Distributional and morphological attri butes of preyorganisms util i zed by Cancer crabs.
Distributionalattributes
Morphological attributesSo t-bodiedHard-s e ed
Epifaunal
mussel s, gastropodscrabs, shrimp
Essentially sedentaryFast-moving
errant polychaetesfish
Infaunal
SuperficialshallowDeep
cockles, scallopsclamsrazor shells
sedentary polychaetes
369
Previous studies into Cancer crab natural diet have adopted varioustaxonomic approaches t~oca egorize prey type. Thus, Gotshall �977!extracted eight major taxa from 40 different identifiable food items inhis study of C. magister stomach contents, while Stevens et al. �982!o pa ~ d titi a~tr 'Oi i ', 't atadea t' aad 'rt~T' igat
studies of C. magister diet, As in our preceding analyses, we have~ terpret d ttt"*t at a eo e roottiooai i i. Prey te e
categorized on the basis of their general distributional andmorphological attributes into one of 10 groups Table 6!. Successfulpredation on each group requires particular foraging strategies andmorphological adaptations, on the part of the predator, which maypreclude or compromise success on other prey groups.

St~dies on C. irroratvs natural diet in the Northumberland Strait,Prince Edward TsSan~carratt and Lowe 1972! and off McNvtts Island,l!ova Scotia S. Lanteigne and R. W. Elner ~ unpublished data!, indicatethat this crab preys primarily on essentially sedentary epifavnal prey,represented by hard-shelled forms, such as chitons and niytil ids, andsoft-bodied forms such as polynoids. Faster moving prey such asdecapod crustaceans were found only at low frequencies of occurrence.Infauna, with the exception of shallow burrowing, soft-bodied types,such as Nereis, were not important prey types in either study. Oatacollectedly . Lantei gne and R. W. Elner unpublished data!,concerning the natural diet of C. borealis at PlcNutts Island, indicatea broad o lap 1 o « i.iTl~oth ay pt i C. 1 o tus 1th t sse ti 1ly s d t ~ y ha d-shelled epifa al p y a ~rpu t tboth rrab species. Partitioning was apparent for only one major preytaxon, namely ophiuroids, which was util ized exclusively by C.borealis. Feeding on infauna by C. borealis was inferred from the highguy f «eofsde't OlestoachsaflagrC.boreali s.
Shel ton et al, �379! examined stomach contents of adult C. pagurusfrom the Toner Sound of Loch Torridon on the N.W. coast oT groan .Host of the dietary intake was derived from infaunal prey, both shallowburrowers such as Nucula and Thracia spp. and deep burrowers such asEnSis spp. Scuba Cf!vers ObSerrve r. pagvrvS at the bOttam Of pitS, up~o.2 m deep, feeding upon Ensis spp. ~ms ar observations werereported by Warner �977!.
Published information Bernard 1979! on the natural diets of C.8 oductus and C. gracilis co pris s obs tio s f 27 d 48spec ue s, respecyiie y. 8ased o conc nt st di s st h
t t f 202 c. ~est* fro the sa e area. 8 nard �979!o 1 d d th t wtiil t C. 1' P t t th C. ~aste, C.
prodvctus fed largely upon epT enthos not utilized by C. mag>ster.!TCh~9 pli t ply pl 1 . -pp i 1 Tt~indicate that C. ma i ster has a much broader diet than either C.p roductus or C. grac s, Partition> ng appears more pronounced between
c is ~ d ~yo ctus tha bet ee C. agiste a d C.oxucns. Soft b8iev -upiya nal for ~tie 7 h t
re at~ve y uncommon in C. prodvctus � spp.! and were utilized more byC. � ci is lg spp.! a d ~uag s e �9 spp.!. hfereas, all thrcralv~se ! on hard-shel led, essen~!a y sedentary epi fauna, C. productvsShOwed SOme degree Of SpeCialiZatiOn On gaStrOpods and heav!er:SS!eITe~bivalves, such as Nyti lvs edulis, whilst the other two crabs preyedprincipally upon ling er-sKeee forms. Mobile epifavnal prey wereconsumed by C. prodvctus, however, fast-moving forms such as shrimp
1 ~ 1 g db hy ~ cabs. Theshrimp, Crangon alaskensis, was frequent in both C. gracilis and C.
gi t xl ts. ~h d-sh 11 d a ft-bod' TTo s swe ~~ps i th di ts of 11 th cab sp i s.
Studies on C. magister diet have been reviewed by Stevens et al.�982!, po oriana ysis, ot th t t t di h d t dthat C. ma ister, particulary during juvenile stages �0-100 mn CW!,has a strong ependence on fast-moving prey types such as shrimp andfish. Adult C, magister �00-160 ran CW! have been shown to prey oninfauna, including deep burrowers such as basket cockles, Clinocardivm
370

nuttalli, in offshore areas Gotshall 1977!. In inshore sandy bay'aahese!ag hs ay ala 1 d o 2 il tl t r h Stevens et al. 1982!.
Cannibalism
Cannibalism, or intra-specific predation is part of the biology of manyspecies, and may influence population structure, Iife-history,competition for resources, and behaviour Fox 1975; Polis 1981!.Crvstaceans, including Cancer crabs, are known to be canni bali stic inlaboratory culture systees Figford 1979; Ebert et al. 1983; KleinBreteler 1975!. Conspecific exoskeletal fragments Wave also beenfound in stomach contents of wi Id� -caught Cancer crabs C, irroratus Scarratt and Lowe 1972; S, Lanteigne and~ Elner, vnpHv�ik~edata!; C. magister Stevens et al. 1982!. Estimates of the occurrenceoi ce nyharria d 1 eq ency i e date! g 1 0 forC. borealis S, Lanteigne and R. W. Elner, unpublished data! to 24.Wro ~sls-60 0 chl c. gisier !st s t 1. 1902!. 1 1~ 1 a ti ital is iro ttts t is di risc 1thoe,e er. d t thepossible ingestion of cast exoskeletal material .
Int ra gene ri c compa ri s on s
Hotsford �984; this Proceedings! and McKelvey this Proceedings!summarize research on the cause s! of the observed cycles in northernCalifornia C. magister landing records. One potential mechanism,inter-age density-dependent recruitment, and more specificallycannibalism, has been debated since originally advanced by Botsford andWickham �978!, In the debate, it has been assumed that cannibalism canbe adequately modelled on a simple encounter rate Botsford and Wickham1978 ! or metabolic rate Botsford 1984 ! basis .
Research into cannibalism in C. pagu rus Lawton 1983! indicates thatboth of these assumptions sho~ld~reappraised. In the laboratory,recently captured edible crabs exhibited a rejection behaviour in theform of an anterolateral extens! on of the cheliped and release of theprey! when initial attempts to capture conspecific prey Ied to therelease of prey body fluids. Such rejection behaviour was not aspronounced in crabs which had been maintained in the laboratory onmolluscan prey only. When the prior dietary experience of predatorycrabs was controlled Table 7!, crabs held on a restricted diet molluscs only! attacked conspeci fics more readily Mann -Whitney IItest, P < .05! and exhibited cannibalism at a lower hunger level Mann-Whitney U test, P < 0.05 ! than crabs whi ch had been maintai ned ondiets including other decapod species. A simi'Iar rejection behaviourhas been noted for C. irroratus P. Lawton, pars. obs.! and experiments
d ayt ~ i~ il ~ cigth*occ race 2cannibalism in this species.
These studies indicate that, dietary factors additional to energeticval ue influence cannibal ism. Clearly, cannibalism is a complexphencmenon which cannot be adequately modelled by the simple functionsused previously.
371

Table 7. Fffect of previous dietary experience �-monthconditioning period! un the exhibition of cannibalism b1 Cancerpagurus �1-91 iiei Cff! after Lawton 1983!.
Dietary experience
Predatory behaviour
Molluscs and decapods ffol 1 uscs onlyTime af ter prese ntati on h! when
predatory behaviour first noted
First presentation
18 0 0 2018 24 19 20
24 24 24 24144 48 not in 93
l44
AttackCanni ha 1 i ze
Second presentation
HP 0 'HP ffP 0 0 0 0not in 193 48 67 20288
AttackCannibalize
HP = A second presentation not carried out due to the lorg timerequired for the first exhibition of cannibalism.
0 = On presentation of prey to predatory crab.
Ontogenetic considerations
A further assumption in early papers on density-dependent recruitmentmechanisms in C. ma i ster was that cannibalism was primarily due toadults preyi ng on new y settled crabs. Stevens et al. 1982 !documented a high incidence of cannibalism amongsT juvenile crabs in astudy of C. ma ister feeding habits in grays Iiarbour, washington. Ifintra-year-c ass and juvenile inter-year-class cannibalism is moreimportant than adult cannibalism then, as 8otsford �984 ! states,it would cause a more stable population or cycles of shorter period ifthere were any."
Cannibalism was more pronounced in the juvenile predator treatments Table 8!. The uniformly low prey survival rate in the experiment wasascribed to the confined conditi ons in which prey and predator weremaintained and tO absence of prey refuges. Recent detailed laboratory
372
Prompted by observations of the low predation success rate of adultcrabs on small mobile decapod prey, Lawton 1983 ! examined ontogeneticaspects of cannibalism in C. pa~ur«s . Recently captured crabs wereassigned to year-classes Eas~e on iinformati on from concurrent studiesof growth rates! and presented with a small number of prey of incoming, '1980! or previous �979! year-classes' collected from a low intertidalhabitat . Predatory behaviour and prey mortality was monitored untileither all prey had died due to injury or cannibalism! or 312 h hadelapsed with no cannibalism. In the latter event, feeding "condition"of the predator was established by presentation of similarly sizeddecapod prey of another species.

studies on the ontogeny of behaviour in C. magister, in particular ofgo st c beha 1 fy oby 1983!, add f tg ppo t to the
conclusion that cannibalism is more frequent mnongst juvenile crabsthan between adults and juveniles,
Table 8. Intra-and inter-year-class cannibalism by Cancer pagurus, after Lawton 1983!.
19 783
88 91
1979late 266 72
Predatory year classAge yr!CW mm!
1980 1979I early 2
29 30 44 52
Time after presentation h! when behaviourfirst noted
P r edator beha vi our
96 24312 69
120312 165
45 96 I45 168 145 168 571 264 70
21 48 2145 120 21
117 312 45
First attackFirst mortalityFirst cannibalismTermination of trial
n of prey~P" "t lit
4 42
I 23 0
3 3 32 3 3I0 0 0
3 4PresentedConsumed by predatorDead due to inj urySurvival
3 40 0
373
Factors such as habitat usage, refuge availabi! ity and moltingfrequency, may also be important in determining the extent and sourceof cannibalism and its significance in the life histories of differentCancer crabs. Juveniles have similar habitat requirements to smallerconspecifics and would thus be expected to have a high encounter ratewith these vulnerable stages. Juvenile C. pagurus occupy rockysubstrates and tend towards cryptic habitat~sunder rocks! when in thevulnerable ~ irmrrediate post-molt stage, thereby reducing predation risk Lawton 1983!. Cannibalism in C. magister has been reported frompop 1 ti s occ pyi g dy sobst ~at s Jacoby 1983; Steve s et 1.1982!. Newly-molted individuals, although buried into the substrate,may be vulnerable to conspecific predators: Butler �954! describes aforaging process in C. magister in which partly opened chelae probesand s bt t s, closi ggggy ver any t red p y. Pool 'sh dgrowth information indicates a faster growth rate and therefore numberof molts! for C. magi ster Botsford 1984! than for C. pagurus Bennettleis; see also 1 ~parti la ly 1 ~ the first yea~fo o 1 gsettlement. Cancer magister may, thus, be vulnerable to cannibalismf ~ g eater p ap ~o ~ ti th C. pag f th s pe 1 d.

Discussion
We have reviewed the general evolutionary and ecological factors whichcharacterize crabs of the genus Cancer. From a ser ies of intrageneri ccomparisons of functional morphology, vm identify two major feeding orlife-history specializations in larger Cancer. Crabs which, injuvenile phases, occupy rocky habitats Veen o have larger, morepowerful chelae on the basis of mechanical advantage! and lowerrelative leg lengths e.g. C. productus, C. borealis!. Crabs which areass ~ tiated with sandy. open harsttats e.g. ~goats is. C. ~ gist n!h pop ti tly 11 dl po rt~hothggarelative leg lengths. Cancer spp. which attain small adult sizes e.g.C . branneri and C. ore one's> s! form a third group, bvt have not been
dti t tdy.
Our review of the natural diets of Cancer crabs indicates a number ofcorrelations with these morphologic~aanalyses. Crabs with powerfulchelae, such as C. productus, C, borealis and C. ~aurvs, utilizeha d-sh lied stye ~ ia e p y, di g s ti llysedentary yet require considerable effort to access prey flesh a long"pursuit" time sensu Hughes 1980!. Crabs, such as C. racil is and C.ma ister, with ~ess powerful but faster closing cheTae anc arac eristic of soft, sandy areas, prey on thinner-shelled orsoft-bodied prey decapods, fish, polychaetes! which may require shortpursuit times, but longer "search" times sensu Hughes 1980!.
Although we have stressed differences between Cancer species in ouranalyses, these crabs are nonetheless remarkabTy similar consideringthe wide range of claw morphology found in brachyuran crabs Brownet al. 1979; Schafer 1954; Warner 1977!. The similarity mrrongst CancerWs possibly due to evolutionary constraints on modes of development, ormay reflect the retention of a functionally efficient appendage form.A number of Cancer crabs are capable of exploiting infavna as adults Boulding an~ay 1984; Gotshall 1977; Peterson 1983; Shelton et al.1979!. In the absence of commercial fishi ng, this is the longestlife-history phase. The monomorphic chelae, characteristic of thegenus may well represent an adaptation to burrowing in the adult stage .Portvnid crabs preying on infauna, have dimorphic chela systems andtend to burrow only svperficially Blundon and Kennedy 1982!. SaneCancer crabs, however, are capable of capturing deep burrowing nmmbersoaf toe infauna Gotshall 1977; Shelton et al. 1979; Warner 1977!, thusgaining access to prey resources largely unavailable to other decapodcompetitors.
Cannibalism has been implicated in the population dynamics of Cancerspecies . Our review indicates that further information will berequired before the process can be adequately modelled as a possibledensity-dependent recruitment mechanism. Dietary factors additional toenergetic cons i derati ons are implicated . Cannibalism may well vary inimportance between Cancer species, depending upon the propensity andcapability of larger conspecifics to cannibalize and the degree ofvulnerability of juveniles a possible function of habitat usage,refuge availability and growth rate!.
Ovr find'!ngs have implications for fisheries management of Cancerspecies. Major fisheries currently exist for two species, ~pagurussdC.~ast . 1 h.g.etl ti t,C.pg hah
374

exploited for at least 2,000 years and currently forms the basis ofimportant commercial fisheries off the coasts of Scotland, N.E. andS.W. England, Norway and Brittany Edwards l978!. Apart, fromfluctuations in landings associated with changing economic factors Edwards 1978!, the productivity of these crab populations appearsremarkably stable. On the west coast of North America there are majorco e cial d spo t fl h es for c. ~inter � hist o a d ilild1983!. Over recent decades, Dungeness crab landings along this coasthave exhibited either dramatic declines from historic levels Dahlstromand Wild 1983! or cyclic fluctuations see papers in this Proceedings!.Differences in morphometrics and feeding between these two speciescould contribute to the observed population responses to exploitation.In the development of fisheries for other Cancer species, an estimateof "expected" response to exploitation mig~tobtained by comparisonwith species exhibiting a similar functional ecology. Based on ourclassification, we propose the following groupings of Cancer crabs forsuch purposes:
Type speci esIncluded species
C. magisterracirr
srrora us
C. ~eurusC. antennarius
nfi nay tT; gooC. productus
Acknowledgements
We are grateful to the following for provision of information on andspecimens of Cancer species . N. Bourne; British Columbia ProvincialNuseum; V. F.~uchi; G. S. Jamieson; S. Kato; D. Parker; R. Tastoand C. Toole.
E. G. Boulding, A. Campbell and 5. Lanteigne made data available frompresently unpublished studies; L. V. Colpitts illustrated the clawforms i ~ Figure 1.
We thank E. A. Pulford, K. E. Ross and K. L, Hoss for technicalassi stance; A. Campbell and G. Pohle for reviewing the manuscript� .
Finally, we wish to express our appreciation to B. R. Xk lteff and thesymposium organizers for providing financial assi stance to enableP. Lawton to participate in the meetings.
375
The two N.W. Atlantic species, C. borealis and C. irroratus are subjectt lon 1 1 e plait tio in ntT ~tc a ada ET ltpg l. E plnlt-tion of both these species in the N.E. United States remains at asimilar low level Bigford 1979; Briggs and lf ushacke 1982!. Small-scale commercial and sport fisheries currently exist for C, antennarius,C. a th yi, C. g ilia and C. E od ct s II hist ~ d lh TIEETI;T. Two, gf. Er. ~oa C. 1 ol ~, pe s, co


Campbell, A., Eagles, M. D. �983!. Size at maturity and fecundity ofrock crabs, Cancer irroratus, from the Bay of Fundy andsouthwestern iuova Scotia. U.S., Dept, of Cormserce, FisheryBul 1 et i n 81; 357-362,
Christiansen, NL E. �<969!. liarine invertebrates of Scandinavia, No.2, Crustacea, Oecapoda, Brachyura. Universitetsforga'let, Oslo:1-143.
Costello, W. J., Lang, F. 1979 ! Development of the dimorphic clawcloser gfpuscles of the lobster Homarus americanus. IV. Changes infuactio al ph fogy du i ~ g gore~ r. ~. Ph . Biol.Lab. Woods Hole 156: 179-195.
Dahl strom, W. A., Wild, P, W. �983!. A history of Dungeness crabfisheries in California, p. 7-23. In P. W. Wild, R. N. Tasto, eds.!. Life history, environment, and mariculture studies of theDungeness crab, Cancer magister, with engphasis on the CentralCalifornia Fisherryresource. State of California, Dept. of Fishand Game. Fish Bull. 172: 352 p.
Ebert, E. E., Hasel tine, A. W., Houk, J. L., Kelly, R, 0. �983!.Laboratory cultivation of the Dungeness crab, Cancer magister, p.259-309. In P, W. Wild, R. N. Tasto, eds!. Uieiistory,environment and mariculture studies of the Dungeness crab, Cancermagi ster, with emphasis on the Central California FisheryB«.Staterftalff .hept.offahadg*, f h,Bull. 172: 352 p.
Edwards, E. �978!. The Edible Crab and its Fishery in British Waters.Fishing News Books Ltd., Surrey, England. 142 p.
Elner, R. W. �978!. The mechanics of predation by the shore crab,Carcinus maenas L.!. Oecologia Berlin! 36; 333-344.
Elner, R, W. �980!. The influence of temperature, sex and chela sizein the foraging strategy of the shore crab, Carcinus maenas L.!.Mar. Behav. Physiol. 7- 15-24.
Elner, R. W. �984!. Crab biology and resource status in the Ir.W.Atlantic, p 1-4. In B. G. Burns, P. J. Ke, eds,!. Oueen crabworkshop �983! on quality enhancement. Fish. and Oceans, Fish.Dev. Br., Scotia-Fundy Region. Project Report 72: I43 p.
Elner, R, W., Campbell, A. �981!. Force, function and nmchanicaladvantage in the chelae of the American lobster Homarusamericanus Decapoda: Crustacea!. J. Zool . 173:~6.
Fogarty, M. J. �976!. Competition and resource partitioning in twospecies of Cancer Crustacea, Brachyura!. M.Sc, Thesis,University oOOode Island, 94 p.
Fox, L. R. 1975!. Cannibalism in natural populations . Ann . Rev .Ecol. Syst. 6: 87-106.
377

Got shall, D. W. 1977 !. Stomach contents of nort hern CaliforniaDungeness crabs, Cancer magi ster . Calif . Fish Game 63: 53-51,
Got shall, D. W. 1978!, Northern California Dungeness crab, Cancermagister, movements as shown by tagging. Calif. Fish Gam~e 67'IIC tW
Haefner, P. A. Jr. �976!. Distribution, reproduction and movlting ofthe rock crab, Cancer irroratus Say, 1917, in the mid-AtlanticBight. J. Nat. aliis. TF 377-%97.
Hart, J, F, L. �982!. Crabs and their Relatives of British Columbia.Provtncial Museum Handbook 4li, 267 p.
l-lughes, R. N. 1980!. Optimal foraging theory in the narine context.Oceanogr . Mar . Bt ol . Ann . Rev . 18; 423-481.
Ingle, R. W. 1980!. British Crabs. Brittsh Museum Natural History !,Oxford University Press, England. 22Z p.
Jacoby, C. A. 1983!. Ontogeny of behavior in the crab instars of theII g h, C ~ ce ~thi 1652. 2. 1' ay h1. 61:1-16.
Jeffries, H. P. �966!. Partitioning of the eStuarine environment bytwo species of Cancer. Ecology 47: 477-481.
Klein Breteler, W. C. H. �975!. Laboratory experiments on theinfluence of environmental factors on the frequency of movltingand the increase in size at moulting of juvenile shore crabs,carcinus maenas. Neth. J. Sea Res, 9: 255-27z,
Lawton, P. �983!. The feeding biology of the edible crab, Cancer~pa urus L. Ph.D. TheSiS, University of WaleS, 223 p,
Lobb, S. M. �972!. Aspects of the social behaviour, ecology andanatomy of the hairy crab, Pilvmnvs hirtellus L.!. Ph.D. Thesis,Unt versity of Reading.
MacKay, D. C. G. �943!. Temperature and the world diStributton ofcrabs of the genus Cancer. Ecology 24: 113-115.
Nations, D. �975!. The genus Cancer Crustacea: Brachyvra!:systematics, biogeography and fossil record. Nat. Hist. Mvs. LosAngeles County Sci. Bull. 23: 1-104.
Peterson, C. H. �983!. Interactions between two infaunal bival ves,Chione undatella Sowerby! and Prothaca staminea Conrad!, and twopatenti~a, C pic Ia ~ 2 5 hycyance ~ th y R thh !. J. 2 p. I aa I . u I . 611: 145-I'll!.
Polis, G. A. 1981!. The evolution and dynamics of intraspecificpredation. Ann . Rev . Ecol . Syst . 12: 225-251.
Rathbun, M. J. �930!. The Car CrOid CrabS of America Of the familiesEuryalidae, Portunidae, Ate'lecyclidae, Cancrtdae and Xanthidae.U.S. Nat, Mus., Bull. 152: 1-609.
378

Scarratt, D. J., Lowe, R. �972!, Bio1ogy of the rock crab Cancerirroratus! in Northumberland Strait. J. Fish. Res. Boar~an. 29:UiVWiM
Schafer, W. �954!. Form und Funktion der Brachyuren-Schere. Abh.Senckenb. Naturforsch. Ges. 489; 1-65.
Shelton, R. G. J., Kinnear, J. A. M., Livingstone, K. 1979!. Apreliminary account of the feed i ng habits of the edible crab,Cancer pagurus L. off N,W. Scotland. I.C.E.S, C.H. 1979/K:35:lF p.
Stein, R. A. �976!. Sexual dimorphism in crayfish chelae: functionalsignificance linked to reproductive activities. Can. J. Zool. 54:220-227.
Stevens, 8. G., Armstrong, D. A., Cusimano, R. 1982!. Feeding habitsof the Dungeness crab Cancer magister as determined by the indexof relative importance, Mar. Biol . 72: 135- 145.
Sugarman, P. C., Pear son, W. H,, Woodruff, D, L. 1983 !. Salinitydetection and associated behavfor in the Dungeness crab, Cancermagister. Estuaries 6: 380-386.
Vermeij, G. J. 1977!. Patterns in crab claw size: the geography ofcrushing. Syst. 2ool. 26: 138-151.
Wang, 0. 1982!. The behavioral ecology of competition among threedecapod species, the American lobster, Homarus americanus, thedo all crab, ca ca b I* . *d th ~.~ at s
* ky h b t t , pP~, fh si , o I sity of ~a e Isbba90 p.
Warner, G. F. �977!. The biology of crabs. Van Nostrand Rheinhold.New York. 202 p.
Warner, G. F., Jones, A. R. 1976!.chelae Crustacea: Brachyura!.
Leverage and muscle type in crab2ool ., Lond . 180: 57-68.
'Wi cksten, M. V. 1984 !. Distributions of some common decapodcrustaceans and a pycnogonid from the continental shelf ofnorthern California. Calif. Fish Game 70: 132-139.
Wolff, W. J., Sandee, A. J. J, 1971!. Distribution and ecology of theDecapoda Reptantia of the estuarine area of the rivers Rhine,Meuse and YcCe H . Neth . J. Sea . Res . 5: 197-226 .
379
Tasto, R. 1983!. Juvenile Dungeness crab, Cancer magister, studies inthe San Francisco Bay area, p 135-154. n , . i , R. N. Tasto, eds, ! . Life history, environment, and mari r u! ture studies of theDungeneSs crab, Cancer ma ister, with emphaSiS On the CentralCalifornia Fisherry resource. tate of California, Dept. of Fishand Game. Fish. Bull. 172: 352 p.


Oceanography of Cook Inlet and itsrelation to Dungeness crab distribution
A. j. PaulUniversity of Alaska, FairbanksSeward, Alaska
Abstract
This paper reviews oceanographic and biological information which mayexplain the distribution of Dungeness crab in Cook Inlet, Alaska.This species exhibits a restricted distribution in Cook Inletoccurring primarily in Kachemak Bay, where standing stocks of 0.04 to0.7 gmz are located. Kachemak Bay is a shallow bay with depths of 30to 40 meters coanmn. The current pattern of Kachemak Bay includes astrong double gyre system which acts to increase the residence time ofwater in the Bay and prevents crab larvae from being carried away.Associated with the double gyres is an increase in water columnstability which results in the early development of a large springphytoplankton bloom that continues throuoh August. During thephytoplankton bloom, primary production may exceed 7 gCm- d-'. Thiscompares to 2 gCm-z d-' typically observed in other Alaskan fjordswhich generally have blooms on'Iy during the March to May period. Thevalues observed in coastal upwelled waters off Peru, one of the mostproduCtive eCOSyStemS, iS On the Order Of 3 to 12 gCm-Z d-I. Thebloom phytoplankton of Kachenmk Bay are dominated by diatoms,especially Thalassiosira. In Kachemak Bay, numbers of T, aestivalis~ s high as !!!co s per lite har b ep ted. Thi petitotal phytoplankton cell counts of 500 to 4,000 cells per liter whichare typically encountered during blooms in other Alaskan fjords. Ithas been demonstrated that Ehaiassiosira can serve to some extent asfood io the ii t i ~ i ~stages ai gnngeness crab. ioopia ttograzers in Kachemak Bay are not abundant and consume only 6.5X of thephytoplankton biomass on a daily basis.
Approximately 60 gCms is produced during the spring and summer seasonand 11% is sedimented to the bottom. This compares with 17 gCm~ ofwhich 6C reaches the bottom in the adjacent central portion of CookInlet. The high carbon input from primary production, augmented with
381

a 1 1ochthonous organic material, directly supports the crabs' preyspecies. Stomach contents indicate that small bivalves, barnacles,amphipods, and polychaetes are the primary benthic prey of Dungenesscrab.
It is suggested that the current gyres, a phytoplankton bloom whichdevelopS early in the spring, the high rates of Thalassiosi raproduction during the larval period, and high flux of carbon to thebenthos in Kachemak Bay create an environment which is ronducive tothe survival of Dungeness larvae and post larvae.
Because there exists a considerable amount of information onoceanography, primary production, carbon flux, and larval crabdistribution for the area, Kachemak 6ay is ideally suited forrecruitment studies of Alaskan Dungeness crab. Concurrently,information could be gathered on most of the other commerc1a llyimportant decapods which co-occur with Dungeness crab in the bay.
Introduction
The Dungeness crab, Cancer ma ister, supports a small but locallyimportant fishery in Yoao In et, laska. The fishery is restr1ctedprimarily to Kachemak Bay. Dungeness crab occur throughout much ofCook Inlet, which is a large body of water, and the northeast Gulf ofAlaska. Currently, it is not understood why comercial quantities ofthis species are restricted to Kachemak Bay within the Cook Inletsystem. As part of the Outer Cont1nental Shelf EnvironmentalAssessment Program, studies on the oceanography, primary production,and faunal distribution and abundance were conducted in the inlet.Much of this material occurs 1n unpublished reports or scatteredpapers 1n a variety of journals. The objective of this paper 1s toreview the existing physical and biological oceanographic informationwhich might explain the concentrated distribution of Dungeness crab inKaCheynak Bay.
Methods
Literature on Cook Inlet currents, primary production, larval andbenthic Dungeness crab distribut1on, and food sources of crab wascollected, Addit1onal related information on oceanography andDungeness crab biology from other areas of the North Pacific was alsoreviewed.
Results and Discussion
Distribution. An extensive trawl survey of Cook Inlet was conducted~ug t years 1976 . 1978 Fade aed Pa ~ 1. 19817. Fa ty-s estations throughout the inlet were sampled at a variety of times Fig,I!. Dungeness crab were encountered primarily in Kachemak Bay,There, Dungeness crab biomass estimates of 0.04 � 0.7 gm wereobserved. Harvest records for Cook Inlet also support the observationthat Dungeness crab occur primarily 1n Kachemak Bay Table I!.I ikew1se, the concurrent meroplankton surveys found the highestconcentrations of Dungeness larvae in Kachemak 8ay English, 1979!.
362

Figure 1. Trawl stations in Cook Inlet Feder and Paul, 1981!.
383

TABLE 1. Sunssary of 1960-1974 Cook Inlet Region Catch Statistics,Data as a Percent of Total Catch data from ADFILG!.
PERCENT OF COOK INLET CATCH
KamishakDistrict
Kachemak Bay6 South Dist.
Barren IslandsDistrict
OuterDistrict
Species
0.0 0.0 0.099,7
0.0 1.00.099.0
7,034.0 58.0 0.0
55.0 18.015.0
TABLE 11. Densities of 2ooplankton, Kachemak Bay, Alaska, April-August, 1976 in Numbers per Meters Cubed Damker, 1977!.
COPEPODA
Pseudocalanus spp.%teat t a eo
553827
1131354
6110948
435374194otto a ~siai is
CHAETOGNATHA
~ta itta ~ele aas 47
C! RR IPEDIA
NaupliiCypridsCrab Larvae
1161010
37200.1
0.1 0,1
0.5
Dungeness
Shrimp
King Crab
Ta nn e r C ra b
AMPHI PODA
EUPHAUS IACEA
Larval Fish
April 6- 13 May 5-9 May 24-30 July 8-15

gcsCOah
Physical oceanographic aspects of Cook Inlet have been treated byGatto 1976!, Burbank 1977!, and Muench et al. 1978!. During springand summer, ocean water entering the inlet from the Gulf of Alaska viaKennedy Entrance in conjunction with the seaward flow of water from'nner Kachemak Bay, creates a double gyre system in Kachemak Bay Fig.2!. These gyres act to increase the residence time of water in outerKachema k Bay and stabilize the water column, Since the major sourceof water for Kachemak Bay originates in the Gulf of Alaska, it doesnot contain the heavy load of suspended particles present in upperCook Inlet water. The clarity of the water allows for an earlythermal stratification of the bay and consequently, springphytoplankton bloom initiates earlier than the rest of the Inlet.
Primar Production
The spring bloom in Kachemak Bay coincides with the hatching ofDungeness crab larvae Larrance and Chester, 1979; Feder and Paul,1981!. During the bloom, diatoms exhibit a sequence of dominancestarting with several species of Thalassiosira which remain
edo inate until du e o 0 ly, h ttley a e s 991 t d byChaetoceros spp. During the bloom, T. aestival is, 20-45 microndiameter � pp, 1943!, reach t *t o s oTMITu t 1 ids cellsper liter in May Larrance and Chester, 1979!. Concurrent with thelarge May bloom in Kachema k Bay, diatom counts, all genera included,in the rest of lower Cook Inlet ranged from 10 to 1,100 cells perliter Larrance and Chester, 1979!. Figure 3 demonstrates therelatively high primary production of Kachemak Bay compared to otherareas of the lower inlet see Fig. 4 for location of stations for Fig.
The two major factors likely to affect the survival of Dungeness crablarvae are food availability and predation. It has been demonstratedthat most decapod Larvae have a "critical period" that occurs whenthey first begin to feed Anger et al,, I980; Paul and Paul, 1980!.Generally, larVae muSt sucCeSSful &y initiate feeding Within the firStthree days after hatching to survive. The natural food of Dungenesscrab larvae is undescribed, but several authors have reared them onbrine Shrimp larvae Reed, 1969; BuChanan et al., 1975!. Hartman andLetterman 1978! determined that unialgaT cuTtu res of Skeletonemacostat Thalassiosi ~ s udo a a allo ed de 1 p * t to tte c i 6~a 0 ou th st g, pectiue y; ". 1 1 tu e of the t o dlato ssupported larvae through the fifth stage. Unfortunately, the latterauthors did not provide information on phytoplankton concentrationswhich allowed survival. Incze and Paul �983! working with firstfeeding Chionoecetes bairdi, another Alaskan crab found in Cook Inlet,determineed te t oeae could obt 1 abaut yt of it esp ratoryrequirement feeding on Gulf of Alaska Thalassiosira at concentrationsf 1,700 cells p liter. In KKKaay, Th 1 ssiosi a
co centratl s a 125 io 6,000 t' g eater th used i tttee 1 gexperiment by Incze and Paul �983!. Thus, it is highly probable ChatDungeness 1ar vae obtain considerably more than 7K of their energy fromingesting diatoms.
385

Figore 2. Spring ard surmer nean flow in Cook Inlet Muench et al., 1978!.
386

Morch 24-26 2
�! I> I! !0
20
2!
150
IOO
50
200
�>
1 00
50
STAT ION
Figure 3. Chlorophyll and carbon assimilation in the euphoticzone of lower Cook Inlet, 1978. Bars = range, Points = mean. Larrance and Chester, 1979!
387
1506,
'IQO
'o 50
0
c>150
�! w 'b 6 4k. 2
0 6c>
s! <

I 5041524 W1544
61o61o
6Q'
59'59'
150'152' W154o
388
Figure 4. Sediment trap and primary production stations inCook Iniet Larrance and Chester, 1979!.
60N

During April in Kachemak Bay, barnacle nauplii are the most commonzooplankton �,4 per liter!, while copepods �. 1 per liter! are nextin abundance Table I II; Damker, 1977!. Read 1969! demonstrated inthe laboratory that barnacle naupli i can support C. ma ister larvaethrough the megalops, It has not been shown that CoMo n et ungenesscrab larvae consume barnacle larvae; however, since they may be themost abundant potential prey Table III!, it is plausib'Je that theyare an important food. Barnacle larvae have been observed in thestomachs of Cook Inlet king crab larvae, which co-occur with Dungenesslarvae.
One of the factors known to regulate success of a year class ofbarnacle larvae is the concentration of preferred diatoms during thenaupliar stages Barnes, 1956!. In Kachemak Bay, the springphytoplankton bloom generally occu rs one to three weeks earlier andexhibits a higher primary production rate than the remainder of CookInlet Larrance and Chester, 1979!. The longer residence time ofwater in Kachemak Bay, due to the current gyres, results in aretention of diatoms so their populations can build to high levels Larrance and Chester, 1979!, High concentrations of diatoms early inthe spring would have a beneficial effect on survival of Dungenesslarvae and their grazing zooplankton prey.
Carbon Flux
Observation of carbon flux in Kachemak Bay during the Nay-Augustseason of 1978, indicated that 60 gCm-z was sedimented to the benthos Chester and Larrance, 1981!. This would equal approximately IIX ofthe estimated water column primary production during the same period.The mechanism responsible for 83K of the downward transport was tracedto zooplankton grazing and subsequent. fecal pellet production,Comparative observations for the central portion of the inlet andKamishak Ba~, where Dungeness crab occur in low numbers, were 17 gCm-and 40 gCm-
Filter feeding bivalves, barnacles and detritivorous amphipods areimportant prey of Kachemak 6ay Dungeness crab. These organisms mustall benefit nutritionally from the high carbon flux to the bottom ofKachemak Bay.
It is suggested that the current gyres, the prolonged phytoplanktonbloom which begins early in the spring, the high rates ofThalassiosira production during the larval period, and high flux ofaaoato t h tho in K cha ah aay cra t a anwirono t wh cil it
conducive to the survival of Dungeness larvae and post larvae. Thisset of oceanographic conditions appears to be unique to Kachemak Baywithin the Cook Inlet system and may explain the restricteddistribution of Dungeness crab within the inlet.
A major problem facing scientists interested in understandingpopulation fluctuations of Dungeness crabs, and other derapods, is theinability to predict recrui tment. There are several reasons whyKachemak 6ay is ideally suited as a site for a recruitment experimentfor several species of Alaskan decapods: I! The Bay is relativelysma 1 1 in size, about 79km x 25km. Thus establishing the position ofsampling stati ons and returning to them repeatedly would be fairlysimple. 2! Dungeness crab, red king crab, Tanner crab, and all thespecies of commercially harvested shrimp co-occur in the bay. 3!
389

There exists a considerable amount of historical information onphysi ca 1 oceanography, primary producti on, as wel 1 as 1 arval andbenthic decapod distribution. In addition, there is limitedinformation on zooplankton and decapod larvae settlement areas. 4!Shore based laboratores occur near the proposed study area. 5!Population surveys of adult. crustaceans are done yearly by AlaskaDepartment of Fish and Game, 6! The work could be accompl1shedyear-round with a relatively small vessel,
I propose that a large scale larval decapod recruitment study bein1tiated with the field work to be accomplished in Kachemak gay. Thefocus for the project should be the recruitment process. The obviousproblem with the proposal is finding a source of funds to support suchforward looking research.
The work discussed in this paper was supported by the NationalOceangraphic and Atmospheric Administrat1on, Department of Commercethrough the Outer Continental Shelf Environmental Assessment Program,and both the University of Alaska Sea Grant College Program and theInsititute of Marine Science, University of Alaska,
390
L Il ERATURE CITED
Anger, K., R. Dawirs, Y. Anger, and J. Costlow. 1981. Effects ofearly starvation periods on zoeal development of brachyuran crabs.Bio. Bull. 161:199-212.
Barnes, H. 1956. Balanus balanoides L! in the Firth of Clyde: thedevelopment and ann~aver~at' th 1 1 pop lett, d thecausative factors. J. Anim. Ecol. 25:72-84.
Bucchanan, D., M. Meyers, and R. Caldwell . 1975. Improved flowingwater apparatus for the culture of brachyuran crab larvae. J, Fish.Res. Bd. Can. 32;1880-1883.
Burbank, D. 1977. Circulation studies in Kachemak Bay and lower CookInlet. Alaska Dept. of Fish and Game, Anchorage, 207pp.
Chester, A., and J, Larrance, 1981. Composition and vertfcaI flux oforganic matter in a large Alaskan estuary. Estuaries 4:42-52.
Damker, D. 1977. Initial zooplankton investigations in PrinceWilliam Sound, Gulf of Alaska and Lower Cook Inlet, pages 137-274.In: Envf ronmental Assessment of the Alaskan Continental Shelf:annual reports of principal investfgators for the year ending March,1977, Volume 10: Receptors-Fish, Littoral, Benthos. RU-425. UnitedStates Dept. of Comm., Boulder, Colorado, USA.
English, T. 1979. Lower Cook Inlet meroplankton. Outer ContinentalShelf Environmental Assessment Program, REF: A79-6, 22pp.
Feder, H. and A.J. Paul. 1981. Distribution and abundance of someepfbenthic invertebrates of Cook Inlet, Alaska. Inst. Mar. Sci.Report No. R80-3, Univ. of Alaska, Fairbanks, 154pp.
Gatto, L, 1976, Circulation and sediment distribution in Cook Inlet,Alaska, pp. 205-227. In: D.W'. Hood and D.C. Burrell eds.!,Assessment of Arctic Marine Environment: Selected Topics. OccasionalPubl. No. 4. Univ. Alaska Fairbanks.
Hartman, M. and G. Letterman. 1978. An evaluation of three speciesof dfatoms as food for Cancer ma ister larvae, pp, 271-276 in NinthAnn. Meeting, World Ma rf~cu ture oc. J. Avault, ed.
Incze, L., and A.J. Paul. 1983. Grazing and predation as related toenergy needs of stage 1 zoeae of the Tanner crab Chionoecetes bairdi Brachyura, Majidae!. Bio. Bull. 165:197-208.
Larrance, J., and A. Chester. 1979. Source, composition, and flux oforganic detritus in lower Cook Inlet. Outer Continental ShelfEnvironmental Assessment Program, Fina 1 Report 60pp.
Muench, R., H. Mofjeld, and R. Charnell. 1978. Oceanographicconditions in lower Cook Inlet: spring and summer 1973. J. Geophys.Res. 83;5090-5D98.
Paul, A.J., and J.M. Paul. 1980. The effect of early starvation onlater feeding success of king crab zoeae. J. 'Exp. Mar. Biol. Ecol,44;247-251.
391


Evidence that a single size-class ofCancer magister has supported the
Yakutat commercial fishery since the1981-1982 season
timothy M. KoenemanAlaska Department of Fish and GamePetersburg, Alaska
Abstract
A brief analysis of rarapace shoulder width, shell condition, and wetrrei ght data indicates that in the Yakutat commercial fishery a majorproportion of Cancer magister harvested during the 198I/82 season wascomprised of a~sing e size-c ass. Continued data series indicate thatsignificant recruitment did not occur during subsequent seasons. Thesize-class which predominated the fishery in 1981/82 continued to in-crease in size, weight, and proportion of' anexuviants through the 1984/85 seasan. One potential al teratian af the exi sting management strategyin this fi shery is di scussed,
Introducti on
Generally accepted concepts utilized as a bass s for management ofDungeness crab, Cancer m~aister, are size, sex, and season, A minimumlegal size for male crab, a prohibition against the harvest of femalecrab, and a closure during the mating season, provide for essentialelements in stock reproduction. In addition, a closure during the maleirolting season and subsequent growth period provides benefits to in-dustry and ultimately the consumer, Inherent in such management isthe concept that. male Dungeness rrab, above an establ r'shed minimum size,are surplus to population reproducticn and other requirements.
Considering such management, estimates of harvest rates utilizingvarious methads are quite high. Based upon tagging studies ln theWashington acean fishery, Cleaver �949! provided estimates of annualexpl oitat ion of . 79 and . 87 for the years 1947 and 1948, and corrsi deredthose rainimal estimates based on the method utilized, Annual exploita-tion rates based on catch per unit of effort CpUE! data expressed ascatch per trap in the northern California fishery for the period 1966/67
393

through 1971/72 ranged between .63 and .87 IGotshall 1978!. Annualexploitation rates based on CPUE data expressed as catch per deliveryranged from,43 to .93 for the period 1951 through 1977 in the northernCalifornia fishery Methot and Botsford 1982!. The findings of Methotand Botsford �982! indicate that during periods of increasing popula-tion abundances very significant escapements occurred and a largeyear-c'lass can contribute to a fishery for several years.
"akutat Fi~sher
The Yakutat Dungeness fishery occurs in waters between Cape Fairweatherand Cape Suckling Figure 1!. Geographic similarities exist betweenthis coastline and others producing significant quantities of Dungenesscrab, Washington based boats have historically harvested Dungenesscrab from the Yakutat waters and, to a degree, the most significanteffort levels and resulting high comme rci a 1 harvests in the Ya kutatfishery have occurred during periods when crab availability in theWashington ocean fishery have been low . Beginning with the 1981 /82season through the 1983/84 season effort levels increased Table 1!.Effort levels during the 1 984/85 season were qui te high compared tohistoric levels, but below those experienced during the 1983/84 season.The commercial ca tc h increased with effort from the 1 981 /BZ seasonthrough the 1 982/83 season and subsequently declined,
Figure 1. Location of the Gulf of Alaska Coastline Utilized in theYakutat Commercial Dungeness Crab Fishery.
While this fishery exhibits many communal ities with other Dungenessfisheries, it, is dissimiLar in at least one respect. The importanceof this fishery relative to other Alaskan fisheries and the remote1 ocati on have detered the development of programs to adequately collectand analyze biological data. However, certain information has beencollected. Data collected from commercial landings since the openingof the 1981/82 season have included carapace width frequency as measured
394

inside the tenth antero-lateral spine termed carapace shoulder width!,shel 1 condition, and average weights. These data are briefly examinedwith respect to size-class representation, and in 'light of findings byMethot and Botsford �982!.
,able 1. Yakutat, Alaska Dungeness Crab Harvest Statistics from theCommercial Fishery since 1960.
"ear orSeason
Catch inpounds
Number ofLandings
Number ofVessels
Considering the Yakutat, Alaska fishery, initia1 inspection of summar-ized carapace shoulder width data from dockside samples Table 2!indicates mean carapace shou'.der width gradually increased from 180.6mm to 193.9 mm from 1981/82 through 1983/84 seasons, then decreasedslightly to 190.6 mm during the 1984/85 season. The slight declinein mean carapace shoulder width during the 1984/85 season is mostprobably due to an increase in recruit-size crab which exhibited amode at approximately 170 rmn Figure 2!.
Figure 2 represents a more detailed view of dockside samples expressedin one millimeter incr ements ~ and presents a visual perception of thesingle size-class passing through the fishery. A gradual increase inthe number of crab larger than 200 mm in carapace shoulder width canalso be identified. Table 3 represents the surmnarized results of wholewet weight dockside samples collected beginning with the 1981/82 seasonand ind>cates an increase in weight as the single size-class movesthrough the fishery during the four seasons under consideration.
395
9601 961i 962' 963; 9641965i 96619671968'I969/701970/111 971/721972/731 97 3/741974/751975/761976/771977/781978/791979/801980/Bl1981/821982/831983/841984/85
543,7621,023,545
937,0511,383,2 98
637,140910,278528,060
2,031,4602,096,1191,20 7,0611,589,9451,250,1182,207,0612,5 32,1181,097,508
628,879542,1261 31 ~ 052
1,875,0881 �7449
881 ~ 6813,300,1585,880 ! 4093,133,531
763,994
1110 8122219
16 8 21319 716335437
'l07889199
2741731292811
1349956
175356493

100
50
100
50
150
100
50
150
100
50
Carapace Shoulder Width uza!
Figure 2 . Width Frequency Distribution from Commercial Landings ofMale Dungeness Crab, Cancer magister, from the Yakutat, Alaska Fishery.
The propo> ti on of anexuviant crab in the docksi de sample data Table2! genera'Ily increased over the four seasons which may indicatethat crab of a single size-class are approaching' nr are a t, max imumsi ze . It should be noted that shel'I condi ti on data is relativelyi mpreci se due to the subjective deci sions required of' i ndzv i dualsamplers, with varyi ng levels of experience .
396

Table 2. Summary of Carapace Shoulder Width Frequency Samples ofNi b gee t b,t cetic,t t iit dtgsit he Ya ku ta t, A 1 a s ka Fi s hery.
NumberLandingsSampl ed
NumberCrab
Measured
MeanWidth mm!
PercentAnexuviantSeason
1981/821982/831983/841984/85
1,2131,6892,47 33,998
11163139
180. 6186. 2193. 9190.6
4.70.57.5
14,3
Table 3. Summary of Whole, Wet Weight Samples of Male Dungeness Crab,Cancer magi ster, from Commercial Landings in the Yakutat, AlaskaF use ry.
NumberLandingsSampled
Total Weight Mean WeightCrab Sampled per Crab
Pounds! Pounds!
Numbe rCrab
Samp/edSeason
1981/821982/831983/841984/85
7193034
6381,9212,3653,463
1,4494,6276,2708,969
2.272.412,652.59
Management Implications
Information presented is far fram complete but is an addition to theknowledge concerning Alaskan Dungeness crab stocks. Periodically,a review of basic management strategies with respect to life historydata is enlightening. In particular, the concept that males abovean established minimum legal size have had sufficient opportunitiesto contribute to stock reproduction and are surplus to the population Mackay 1 942! wi I 1 be briefly considered .
397
These four small pieces of data mean carapace shau1der width increases,carapace shoulder width distribution shift to the right, mean weightincreases, and anexuviant proportion increases! provide evidencethat a single size-class has provided a major portion of the YakutatDungeness crab harvest for the past four seasons, 1981/82 through1984/85. Total harvest for this period exceeded 13 million pounds.These data also support statements by other authors Methot and Botsford1982! re! ative to the occurrances of significant escapements from thefishery, and that a single year-class can prevail in a fishery fora number of s uccess i ve seasons .

Based upon Butler's growth model �961!, and assuming that size at maturityand growth of Alaskan and Canadian Oungeness crab are similar, it wouldappear that the average crab harvested in 1981/82 was 4 to 5 years of age,Assuming that 1981/82 was the first season that this size-class entered thefishery, and considering that the size-c1ass persisted at substantial level sfor the next two seasons �982/83 and 1983/84! and to a lesser degree for anadditional season �984/85!, a significant portion of that single size-classwas 7 to 8 years old. The proportion of that single size-class survivingand growing at age 7 to 8 years is considerably more than initiallyperceived by previous authors Butler 1961; Cleaver 1949!. Conditions pre-dicating such survival or growth are not understood, but intuitively resultfrom a number of natural conditions. It may be prudent to assume that someaspect of Oungeness crab life history or population dynami cs benefits fromperiodic survival of males to an older age and growth to a larger size.Accepting such an assumption would necessi tate modification of the existi ngmanagement strategy to provide opportunities for i nr reased longevity andsize. One method of accomplishing such a modification would be to establishcatch limits based on population trends. From 1909 until 1933 catch Limitswere established i n the Oregon fi s hery Wal dron 1958! and have beensuggested as necessary in the Southeast Alaska fishery Beni tz 1969!Positive or negative results from catch Limits have not been adequatelyaddressed, but mi ght be appropriately considered in the future,
398

AC KNOWi E DGEME NT5
The author wishes to acknowledge the assistance of A. Brogle, A. Kirnker,G, Woods, and K. Iverson who developed a keen interest in the fishery andcollected much of the basic dockside data. Mr. G. Curtiss receives thanksfor his assistance in summarizing the collected data.
REFERENCES
Benitz, E. 1969, Thirty years crab fishing. P.O. Box 106; Petersburg,Alaska 99633. Pers. Co!rn!. to Ak. Dept. Fish. Game. 7 p.
Butler, T.H. 1961. Growth and Age Determination of the Pacific EdibleC b CC « ~i t 8 I J. F h. FI ". Iid. C . !8 8!: 819-889.
Cleaver, F.C. 1949, Preliminary resul ts of the coastal crab Cancerraagister! investigation. Washington State Dept. Fish. BioT. Rep.4': 47-82.
Gotshall, D.W. 1978. Catch-per-unit-of-effort studies of northernCalifornia Dungeness crabs, Cancer magi ster. Calif, Fish Game64: 189-199,
ii ck y. C.C. 1942. Th Pacific dib1 b. C ca ~lent . 8 11. Ffch.Res. 6d. Can, 62; 32 p,
Methot, R.D. Jr., and L.W, Botsford. 1982, Estimated preseason abundancein the California Dungeness crab Cancer magi ster! fisheries. Can. J.Fish. Aquat. Sci. 39: 1077-1083
Wal dr on, K. D. 1 958. The fishery and biology of the Dungeness crab Cancerma ister Dana! in Oregon water' s, Fish. Comm. Ore,, Contr. No. 2~
P ~


The controversial use of the insecticideSevin in Pacific Northwest estuaries: its
effects on Dungeness crab, Pacificoyster, and other species
David V. Buchanan and Daniel L. BottomOregon Department of Fish and WildlifeCorvallis, OregonandDavid A. ArmstrongUniversity of WashingtonSeattle, Washington
Abstract
The use of the insecticide Sevln carbaryl! to tr eat oyster groundshas become a controversial issue in the Pacific Northwest. Oystergrowers maintain that Sevin is needed to kill two types of burrowingshrimp which render Pacific oyster, Craeeoetr ea Oigae, beds soft andsilty, preventlnq oyster culture. Oyster beds have been annuallysprayed with Sevin in Washinqton's Willapa Bay and Grays IVarbor sincethe early 1960's. In 1984, an Environmental Impact Statement wasprepared by the Washington Department of Fisheries and WashingtonDepartment of Ecology to review the treatment proqram and allowpublic conment. In Oregon, the Oreqon Fish and Wildlife Commissionissued a Sevin spraying permit to oyster growers in August 1988.Vowever, the Audubon Society and others protested this permit beforethe Oregon Court of Appeals. In April 1984, the court upheld aprevious rulinq by the Land Use Board of Appeals that the ODFW."oavniss ion violated a state land use regu'lation that protectsestuaries, and that there was a lack of information on the impacts ofSevin on non-target estuarine organisms. In 'this paper, the knowntoxic effects of Sevin on Dungeness crabs, uoweer magi.ecer, arereviewed. Also reviewed are potential impacts of the insecticide on'Dungeness crab and other non-target species not documented in theliterature but that may need study to satisfy the courts and theconcerned public. The authors suqgest negative environmental impactsmay be minimized by a February or March application but that further
esearch is necessary to resolve the controversy.
401

Back round and the Controvers
Oyster culture became widespread in the Pacific Northwest when thePaCif ic oyster, Czvzaeaetzwa gtgae, waS imported frOm Japan in the1930's Oregon Department of Fish and Wildlife, ODFW, 1982!.Washington 's oyster industry is the richest molluscan fishery in thePacific Northwest, and Wil lapa Bay produces over 50% of the state' sannual harvest Nosho et al. 1980!. Most of the oysters in WillapaBay and Grays Harbor, Washington and Tillamaok Bay, Oregon arecultured directly on intertidal substr ate. Oyster cultch, wh i ch isoyster shell bearing spat or juvenile oysters, requires substratethat is sufficiently compact to support the weight of growingoysters. If the substrate is unstable, then heavy mortality resultsfrom sinking and suffocation of the oysters Washington Department ofFisheries, WDF, 1970!,
Twa species of burrowing shrimp that adversely affect oysterculture are indigenous to and very abundant in estuaries of thePacific Northwest . The ghost shrimp, Calli anoaea oaliforniena~s, andthe mud shrimp, I7popehia pugettenega, are infaunal crustaceans thatconstruct extensive burrows on intertidal mud and sand flats duringfeeding. These shrimp occur in the same intertidal zone occupied byoysters and can reach densities in excess of 45 or SO per squaremeter. However at smaller densities, burrowing activity by theshrimp reduces the compaction of the substrate. Consequently,oysters are smothered either by mud that is deposited duringexcavation of the burrows or by sinking inta the altered substrate WDF 1970!. It is the strong contention of the oyster industry thatcontrol and occasional eradication of ghost shri mp is necessar y tosustain the oyster industry at its current level,
To control populations of burrowing shrimp, tideflats have beenannually treated with the insecticide Sevin since the early 1960'sunder the supervision and study of the Washington Department ofFisheries WDF and Washington Department of Ecology, WDOE, 1984!.Following the 1983 El Nina along the Pacific Northwest coast, ghostshrimp populations in Washington's estuaries approached recorddensities and resulted in requests ta treat an extensive area of theestuary in the susTxer of 1984 . Early in 1984, WDF and WDOEdetermined that an Environmental Impact Statement should be preparedon ghost and mud shrimp control, primarily ta review the treatmentprogram and to allow public comnent.
The draft environmental impact statement DE IS! released for agencyand public review in June 1984 became the focus af a controversy overthe affects of Sevin on non-target estuarine organisms such asDungeness crab, cancer map~eter. Citinq results of Buchanan et al.�970!, the draft stated, "it is clear that crabs are fairiyresistant to sprayed Sevin. This resistance is especi ally evidentwhen crabs are exposed ta the actual conditions present whenintertidal areas are treated" WDF and WDOE 1984!. In a veryderagatory agency review of Washington's DE]S, the National MarineFisheries Service NMFS! cited laboratory and field studies to
402

conclude that Sevin sprayed onto tidef1ats causes massive mortalitiesof estuarine animals.
The NNFS also noted that within the DE IS "the references and dataselected for inclusion were not romprehensive and their selectionappears biased. Additional pertinent literature exists incIudingpertinent facts omitted from cited literature! which substantiallyexpands upon or contradicts some of the DFIS' findings". Forexample, "The statement wi thin the DEIS that ... it is clear thatcrabs are fairly resistant to sprayed Sevin is to some extentcontradicted by measureixent of a 96 h ECSO of 0.26 ppm for adultDungeness crabs and 0.25 ppm for late juveniles Buchanan et al.1970!."
The controversy over the use of Sevin in estuaries is not restrictedto the state of Washington. In Oregon the issue has advanced to thecourts. Until recently only two experimental treatments of Sevin inOr egOn'S eStuarieS haVe been apprOved by State agencieS and theSeoccurred prior to 1970. However in August 1982, the Oregon Fish and'Wildlife Commission issued a spraying permit to oyster growers inTillamook Bay, Oregon's third largest estuary. T'his permit wasprotested by the Audubon Society, the Oregon Shores ConservationCoalition, and the Oregon Environmental Council when they petitionedthe Oregon Department of Fish and Wildlife, the Oregon Fish andWildlife Coxmiission, and three Tillamook Bay oyster growers beforethe Oregon Court of Appeals. In April 1984, the Court of Appealsupheld a previous ruling by the Land Use Board of Appeals LUBA! thatthe spraying permit failed to cmply with State Land Use Goal 16 thatprotects estuaries, The Court of Appeals agreed with LUBA that "theCommission could not protect the estuary or assume minimum adverseaffects from the pesticide Sevin! without determining what organismslive in the estuary and whether the pesticide would adversely affectthose organisms."
Oyster culture has become important in British Columbia and has beenintroduced into Southeastern Alaska. As area growers try to maximizeoyster yields, they may consider use of Sevin in other estuariesinhabited by mud or ghost shrimp. Our objectives in this paper areto: I! review the toxic effects of Sevin; 2! list potential effectson some non-target species and make recomnendations to help resolve'the controversy; 3! increase know'edge of Sevin toxicity and; 4!reduce potentially harmful effects to Pacific liorthwest estuaries.
Review of Toxic Effects of Sevin
Laboratory Studies
Sevin is an insecticide which acts as a toxic inhibitor ofcholinesterase and thereby causes paralysis and death of insects Casida 1963! and probably has a similar action in marinearthropods. There has been substantial laboratory work conducted onthe toxicity of both Sevin and its first metabolite, I-naphthol, tofish and invertebrates in seawater bioassays Davis 196I; Stewart et
A Semen-Page OOvnisn etter fram DaLe aVane Oi.uieiOn Chief Of HiVZStO Duane Phinney Chief Of Habitat IVanagernent Oiuieisn VDF.
403

al, 1967; Butler et al, 1968; Buchanan et al. 1970; Armstrong andMillemann 1974b, c!. The target species mud and ghost shrimp! arehighly sucept ib I e to Sevin while Pacific oysters are less So,however, many other non-target species also show sensitivity to Sevin Stewart et al . 1967 ! . A rompari son of three major animal groupsshows that marine crustaceans are 10 to 300 times more sensitive toSevin in seawater than mollusks or fishes Table 1!.
The effects of Sevin on Dungeness crab have been extensively studiedin the laboratory because of the economic importance and abundance ofcrab in nOrthweSt eStuarieS. Of the C. magisaer StageS teSted, theearly larvae are the most sensitive to Sevin Stewart et al. 1967;Buchanan et a I. 1970 ! . The 96-h EC50 effective concentration thatproduces death or irreversible paralysis on 50% of the test animals!for larval first stage zoeae, late juveniles, and adults were 0.01,0.25, and 0.26 mg/liter, respectively. Young juvenile crabs are 5 to9 times more sensitive to Sev in than are older juveniles. The24-h ECSOs for death of second-stage and ninth-stage juveniles were0.076 and 0.35 � 0.70 mg/liter, respectively Buchanan et al. 1970!.Sublethal effects probably occur at much lower concentrations. In acontinuous 25-day exposure of c. magistsr zoeae to Sevin, larvalmelting was delayed at concentrations as low as 0.0001 mg/liter,
Snow and Stewart 1963 ! observed many paralyzed cockleclams, clineaavdium sutta',i, on oyster grounds in Tillamook Bay,Oregon, that had been experimentally treated with Sevin. A day laterthey found a large number of dead Dungeness crabs in the immediatearea. In labor atory experiments Buchanan et al. �970! found thatadult crabs can be killed within 6 h after eating corkle clamspreviously exposed to Sevin. These results suggest that crabs couldbe killed either by direct contact with the insecticide or by feedingon paralyzed clams.
Field Observations
There has been little research on effects of Sevin on naturalestuarine convaunities to ascertain overall impacts of sprayingtideflats. The amount of Sevin in contact with treated ground, itsdispersal, and its effects on organisms in the water column are notthoroughly reported in the literature. Most field studies onlydescribe observations i mnedi ately following treatment. Snow andStewart �963! studied a field treatment of Sevin in Tillamook Bay inearly March 1963. They observed mortality and distress of non-targetspecies including sand shrimp crangos spp. !, juvenile sole probab'iy Pcu ophri/s ustutus!, cockle clams, Dungeness crab, hermitcrab Pagurus spp. !, annelid worms, amphipods, cottids, andblennies. Armstrong and Millemann �974a! found dead shrimp, orangesnigsicauda, and English sole, P. vstutus as far as 15 meters in thedirection of tidal recession from areas treated with Sevin. Theyalso found that numbers of juvenile gaper clams, few.eus eapas, andthe bent-nosed clam, maeema nasuaa, were significantly reduced inplots treated with 2.3 and 4.6 kg � and 10 lbs!/acre of activeSevin. Despite more than two decades of use in Pacific estuaries,rigorous studies on the long-term effects of Sevin, including changes
404

Table 1. Acute toxicity of Sevin in seawater bioassays to adult Ad!juvenile Ju!, or larval Lv! stages of several species of estuarineanimals.
S ecies- life histor sta e
Crustaceans
Mud shrimp-Lv Vpogebia pugettensie! 0.03-0.16 0.03-0.14
Ghost shrimp-Ad CaLLianassa caLiforniensis! 0.13
Ghost shrimp-Lv 0,17-0.47 0.03-0.08
Dungeness crab-Ad Cancer mcgister! 0.49 0.26
0,35-0.70Dungeness crab-9th stage-Ju
Dungeness crab-2nd stage-Ju
Dungeness crab-Lv
Molluscs
Bay mussel-Lv BtytiLus edui,ie!
Pacific oyster-Lv Crassostrea gigas!
0.076 0.057
0.010. 08 D.005
1.4 -2.9
1.5 -2.7
Cockle cl am-Ju CLinocardium nuttaLLi! 7,3 3,75
Fishes
English sole-Ju Parophrgs vetuLus! 3.2-5.0
Shiner perch-Ju C2 matogaster aggregata! 3.8-4.0
405
a This tabLe combines data from SteMart et aL. 2987; Butler et aL.2888; and Buchanan et aL. 2970. ALL esperiments used testsoLutions that were prepared from the stock soLutions bg seriaLdi Lution using fiLtered, steribised sea sxster adjusted to BS%saLinitl with distiLLed svelter.
b The EC6O vaLues are the effective concentration that produces deathor ir reversibLe parcL2!sis on SO% of the test animaLs.

in the structure of benthic invertebrate communites following treat-ment, have not been completed on the initial, cal firzrrrurrra -dominatedcommunity and that which replaces it.
Persistance and Toxicit in the Environment
The net effect of Sevin on natural estuarine communities may dependon water temperature and a complex interplay between decreasinglongevity of the pesticide vs. increasing metabolic activity oforganisms at higher temperatures. In Willapa Bay and Grays Harbor,spraying of Sevin on estuarine mud tlats is allowed during Junethrough August with the understanding that relatively high surmnertersperatures will rapidly hydrolyse Sevin in the water column andreduce the toxicity to non-target organisms WDF and WDOE 1984 !.However, Buchanan et al. 1970 ! found that Sev in showed highertoxicity to adult crabs at 18' than at 11'C Figure 1!. The 24 hEC60's for death or paralysis at 18' and 11'C were 0.32 and 0,49mg/1 i ter, and the 96 h ECS0 ' s were 0 . 18 and 0 . 26 mg/1 iter,respectively. Stewart et al. 1967! found compar able results forburrowing shrimp. The mean 48 hour ECS0's for death on mud shrimplarvae at 20' and 16'C were 0.04 and 0,09 mg/liter, respectively andthe mean 48-h ECr0's for death of ghost shrimp larvae at 20' and 17 Cwere 0.03 and 0.08 mg/liter, respectively. It is not certain thatmore rapid breakdown of Sevin at warm temperatures is more importantthan relative toxicity when selecting a period of tr eatment that wi 1 1minimize toxicity to non-target species.
axe
O.x a
C U oOaI
5 aai
O. I ~
v$ t r 't8 I torxaosrmt rmv r rrovaer
Figure 1. EC60's of Sevin for death or paralysis of adult fernalecrabs at 11' and 18 C from Buchanan et al. 1970!.
406

Karinen et al. �967! found that Sevin will rapidly hydrolyse inseawater ta 1-naphthal which further undergoes degradation by theaction of light to carbon dioxide and several unknown products.After Spraying in estuaries, however, the pesticide would probably berapidly absorbed into bottom sediments, Once Sevin is in the bottommud its decomposition continues at a much slower rate than in water.In a field experiment an tideflats, Karinen et al. �967! found Sevinconcentrations of 0. I to 0.2 ppm in estuarine mud 42 days aftertreatment with 4.6 kg/acr e af active Sevin T able 2!. Unfortunately,they did nat continue their studies after 42 days.
Table 2. Sevin and 1-naphthol concentrations in estuarine mud flatstreated with Sevin at 4.6 kg/acre of active Sevin from Karinen etal. 1967!.
Concentrations of Sevincrn eve a mu
Ima
Days aftertreatment
Total Sevin onlym a m
10.73.84.11.52.10.50.1
0 1
2 4 71642
5.43.35,21.52.2D.3D.l
0.340.460.350.180.540.130.20
0.320.460.270.180.380.100.20
a srrcTudes Serrsrr and I-rraphshoT caTcuTased as sotaT oarTrarpl.
Circumstantial evidence points toward Sevin's continued toxicity tocrustaceans in mud. Sevin concentrations found in treated mud flatsafter 42 days�.1 to 0.2 ppm! are certainly above the concentration�.076 mg/liter! that will kill second-stage juvenile Dungeness crabwhen exposed ta Sevin in seawater bioassays for 24 hours. Armstrongand Mi llemann �974 a! found that Sevin continued to reduce ghostshrimp populations 11 months after application. The mean number ofshrimp holes/m2 were 161 in the control plot, and 32, and 25 in thetreatment plots of 2.3 and 4.6 kg/acre of active Sevin,respectively. These reduced populations could stem from long-termtoxicity of Sevin or failure of the ghost shrimp populations tore-colonize. A1so, estuarine flats treated with Sevin ta controlburrowing shrimp only required retreatment every 3 or 4 years ODFH 1982!. It is reasonable to assume that Sevin may also have along-tenn effect on recruitment of non-target invertebrates intreated tideflats.
407
The persistance of Sevin in bottom sediments and its delayed toxicityto target and non-target estuarine animals has been only cursorilystudied. Adverse impacts have been documented on polychaetes andbivalves Armstrong and lqillemann 1974 a, b!, but effects are unknownfor decapods, amphipads, and other epibenthic crustaceans.

Lamberton and Claeys �970! found that Sevin and 1-naphthol degradeinto a reddish-blue precipitate which may inhibit cholinestarase.This precipitate was twa-thirds as toxic as 1-naphtho1 to bay musselembryos. Lamberton and Claeys speculated that the persistence of theprecipitate may explain an observed lack of recolonization for 18months after treatment with Sevin. It may also explain why Sevinapplied to freshwater mud is still toxic to insect larvae 3 monrhsafter application Mu I 1 a 1960 ! . Clearly, the lang-term toxicity andpersistence of Sevin ~nder natural conditions needs to be morecarefully studied.
Potential Effects on Some Hon-Tar et S ecies
Among the controversial issues regarding the use of Sevin to enhanceoyster production in estuaries is the potential for reducedproduction of other commercial and non-commercial species. Thisconcern is a result of: 1! the toxicity of the insecticide to diverseanimal g~o~ps; and 2! the importance of estuaries as fishing grounds,feeding grounds, and nursery areas for a variety of species crabs,fishes, and birds!, It is important to understand the role of theestuary in the life history and ecology of non-target species inorder to evaluate potenti a'I affects of Sevin or establish guidelinesthat will minimize impacts,
Dungeness Crab
The passible role of estuaries as nurseries for C. rrragr'.sssr and othercrab species has been studied from California through Washington butuntil recently the data have been inconclusive Cleaver 1949;Gotshall 1978; Collier 1983!. Evidence presented by Stevens andArmstrong 1984! and Armstrong and Gunderson this proceeding! forthe Grays Harbor estuary strongly indicates that young-of-the-year YOY = 0+!, li and 2+ crab make extensive use of the estuary fromearly sp~ing to late fall. YOY enter estuaries as megalopae, settleand metamorphose in a variety of habitats. Older juveniles thatapparently over-winter offshore to avoid extreme'Iy low bottom watertemperatures in estuaries, also enter these systems in April-May tareside through the surrmrer. In general, indications are that asignificant portion of 0+ and older juvenile age classes use GraysHarbor estuary and likely others as well! as a nursery area Carr asco et al., this proceeding; Armstrong and Gunderson, thisproceeding!. Maximum numbers of crabs also occur in Tillamoak Bayduring the late spring and sunrrrer months Forsberg et al. 1977!.
Stevens and Armstrong 1984! concluded that the combined recruitmentof Dungeness crab to Grays Harbor and Willapa Bay could support asubstantial portion of the offshore carmnercial fishery. The apparentimportance of the San Francisco estuarine complex ta Dungeness crabwas d i scussed by Tasto 1983! who also provides one of the few otherestimates of population abundance. He concluded that from 38% to 83%of a 0+ year c lass might use the estuary, again underscoring theimportance of such areas as nursery grounds.
408

Distribution and abundance of 0+ juveniles and observations ofbehavioral tendenc i es to burrow and hide, suggest that these smallanimals are dependent on benthic refuge to enhance survival inestuaries and offshore. Reilly �983! reviewed literature regardingpredation on DunqeneSs crab that ShOWS SubStantial preSSure isdirected toward early life history stages which, in and offshore ofSan Fi ancisco Bay, declines once animals exceed 30 xm carapacewidth.
From studies of Iong-term distribution and abundance of 0+ Dungenesscrab it is apparent that early instars rely on epibenthic cover formaximum survivai during the first summer and are not able to surviveon open mud/sand substrate. In the subtidal areas of Grays Harbor,such refuge includes al lochthonous sticks, leaves and grasses, butalso clam and oyster shell, dislodged eelqrass and macroalgae Stevens and Armstrong 1984; Armstrong and Gunderson, thisproceeding!. Whereas trawls on open sand substrate will often catchhundreds of I+ and 2+ crab «iih little else in the net, large catchesof 0+ juveniles are invariably associated with substantial mounts ofepibenthic material. On t' he extensive intertidal flats of GraysHarbor, the hiqhest lonq term densities of YOY are orimarily in shelldebris and secondarily in eelgrass Armstrong and Gunderson, thisproceedings!. Areas where empty htNa arwnmrfa shell accumulatesprovide excellent refuqe for small first through sixth and seventhinstar crab as evidenced by densities of 10 to over 100 per m2. Innorth Grays Harbor, an abandoned oyster reef sampled through thesunxxer of 1983, accounted for densities of juvenile crab comparabletO denSitieS in ivy Shell habitat and higher than in eelgraSS.At virtually no time in 2 years of intertidal sampling �983, 1984!have YOY been found on open, unprotected substrate except for a fewdayS fOllOwing Settlement; thereafter natural mOrtality iS apparently100% in such areas. These results suggest an interesting paradoxregarding the potential effects of Sevin on crab populations.Spraying on open tideflats may cause imnediate mortality of olderjbvenile crabs, particularly if treatrxent occurs during spring andsumner. However, r educed predation or improved survival of YOY crabcould result from improved cover offered by mature oystercomnunities.
Estuarine Fishes
The toxicity of Sevin to crustaceans also raises concern aboutthe effects of spray programs on food chains supporting estuarinefishes. In most estuaries in the Pacific Northwest, crustaceanscomprise the bulk of the diet of pelagic and demersa1 fishes Bottomet al. 1984 !. In T ii lamook Bay, Oregon, arthropod qroups--decapods includinq larvae of ghost or mud shrimp!, copepods, barnacles, othercrustaceans and insects--are amonq the primary food items forjuvenile chinook salmon, starry flounder, English sole, surf smelt,and rockfish spp. Forsberg et al. I977!.
ReSultS Of reSearCh On juvenile ChinOOk SalmOn in eStuarieS prOVide agood illustration of potential effects of spraying on a conxaerciallyimportant fish species . In many estuaries juvenile chinook salmonrear for a few weeks to several months before migrating to sea Reimers 1973; Healey 1980, 1982a!. During a Tillamook Bay survey,
409

juvenile chinook were found in the estuary between June and Novemberwith peak abundance during August and September For sberg et al.1977!. Scale patterns from adult salmon show that most chinooksurvivinq to spawn in the Tiilamook Bay drainaqe system are fish thatreared in the estuary for some portion of their juvenile life histor ybefore they migrated to sea Jay Nicholas, Oregon Department of fishand Wildlife, unpublished data!. The significance of estuarinerearinq on survival is probably related to the size of fish enteringthe ocean, Experiments with hatchery chinook Bilton 1984! and coho Johnson 1982! show a positive correlation between adult survival andjuvenile size at release. Healey �982b! showed evidence that smalljuvenile chum salmon had a higher mortality rate than large juvenilesduring a brief period of early sea life. These results emphasize theimportance of adequate growth rates prior to seaward migration ofjuvenile salmon. Treatment of estuarine tideflats with Sevin couldinfluence salmon production if spraying occurs when young salmon aredependent on estuarine crustaceans to sustain adequate growth ratesfor subsequent survival at sea.
Tube dwelling amphipods of the genus Coroplrivrrr spp. are among themost important prey taxa for juvenile chinook salmon in Oregon'sSixes River Reimers et al. 1979! Coquille River Nicholas and Lorz1984! and Columbia River Bottom et al. 1984! estuaries and arefrequently consumed by salmon in 1 i 1 1 amook Bay Forsberq et a'l. 1977;Bottom and Forsberg 1978!. The~e are two major broodsof corophiwm in Pacific Northwest estuaries Reimers et al. 1979;Wilson 1983!: one in the spring April or May! and a second in latesummer or early fall August or September!. Even if the toxiceffects of Sevin are short lived, the treatment of tideflats duringspring or svrmner could reduce amphipod production throughout most ofthe rearing cycle of chinook, The second brood of C'orophium spp. isnot produced or would not reach a size preferred by youno salmon .0 mm! until most chinook have miqrated from the estuary.
Similar concerns could be raised r egarding predator-preyrelationships for other important fishes in the estuary, l-lowever,food chain effects are always amonq the most difficult to predict.Obviously, many factors will determine whether the effects of Sevinon prey or predator species are significant, such as the size of thearea treated, the concentration and persistence of the insecticide,and a host of environmental factors we do not understand. However,we do know that the risk of negative effects on estuarine food chainsincreases during the spring and surmner months, when the greatestnumber of species depend on the estuary. Figure 2 illustrates thepronounced seasonality in number of fish species and individuals inthe Tillamook Bay estuary Bottom and Forsberq 1978!.
Conclusions and Recorwriendations
The controversy concerning tr eatrxent of estuaries with Sevin reflectsthe diversity of user groups that have an economic or recreationalinterests in these hiqhly productive ecoystems. The controversy isintensified by the general lack of data documenting long termbeneficial and detrimental effects in areas where spraying has beenan accepted practice for more than 20 years. A poor data base leavesthe oyster industry and state regulatory agencies vulnerable ro
410

Z
CI
Figure 2. Iiumber of iTTdividuals and species per seine aTTd trawleffort for each month of a survey of Tillamook gay Hottom andForsberg 1978!.
411
LSS
R 4JM
EKI-V
Z
I-
Z OI�
CP
5$.
20.
15.
'10.
Ms 2 ASs2M0J OMAM1 !A SOHO SMAMS A oH101< 1010 TOTO
M 2JASoNOJrMAMJASom0JSMMJJsNTO1% 1020 T020
10
12
0
5.0
4.0
2.0
T.O
0
VI
O rnCA
VIioi
Z rn
VI
D O IOI
I C Z

complaints and lawsuits regarding unknown but potentially widespreadenvironmental consequences. A variety of viewpoints not all mutallyexclusive! cloud the issue:
The oyster industry views burrowing shrimp as pests that curtailproductio~ and eliminate desirable culture grounds. Ghost shrimpcan and do reach densities that deleteriously impact oysterculture WDF 1970!, Sevin kills burrowing shrimp and enablesoyster culture on treated ground WDF 1970; Snow and Stewart1963!.
Crab fishermen are concerned that the application of Sevin toestuaries hurts their industry by killing juvenile crab.Laboratory tests show comparable susceptibility between mudshrimp, ghost shrimp and Dungeness crab Stewart et al. 1967;Buchanan et al. 1970! and dead Dungeness crabs have been observednear treatment sites Snow and Stewart 1963; Armstrong and14i llemann 1974a!. On the other hand oyster cultch may increaseDungeness crab production by providing protective shell habitat.Crab use of and densities on cottiunaeaa -dominated tideflats islow, but may be extremely high in areas of clam and oyster shellthat afford refuge for small YOY instars Stevens and Armstrong1984; Armstrong and Gunderson, this proceeding!, Short-term harmto crab populations may be offset by long-term habitatimprovement.
In Oregon, bait fishermen are concerned that treatment of oystergrounds in Till amook Bay will have a negative impact on othertideflats where they harvest burrowing shrimp. They citemortalities of shrimp that were harvested in untreated areas soonafter oyster grounds were sprayed as evidence for a negativeimpact on their industry.
State fisheries agencies are responsible for the management ofthree invertebrate fisheries seemingly at odds. They also have ageneral responsibility for the long-term persistence and healthof estuarine communities.
Environmental groups claim that direct and indirect impacts ofSevin on estuaries are poorly studied but cite laboratorytoxicity studies as evidence for potential harm to a variety ofspecies. They are concerned that possible persistence of thepesticide in estuarine mud will have long-lasting effects. Thedata of Lmnberton and Claeys 1970! and Mu11a 1960! support thisconcern. Environmental groups are concerned about thepossibility of widespread harm to estuarine food chains.
Oregon's courts and land use laws mandate that estuarine plansand activities shall protect such ecosystems, including itsnatural biological productivity, habitat, diversity, uniquefeatures, and water quality Oregon Land Dse Goal 16!. TheOregon Court of Appeals and the Land Use Board of Appeals usedthis mandate to reject a spraying permit issued by the OregonFish and Wildlife Conniission.
412

Counting mortalities immediately following spraying and laboratorytoxicity studies have not provided sufficient understandinq toadequately answer the questions raised by opponents of estuarineshrimp control programs. Decision makers need data that wi11 allowthem to weigh the ecological costs and benefits of converting naturaltideflat corrmrunities to oyster conniunities. Among the types ofresearch most needed are the fo'Ilowing;
1. Comparisons of invertebrate cormnunity structure in untreated,recently treated, and established oyster habitats.
2. Test plots and experimental controls to follow successionalstages in benthic cormnunities following treatment with Sevin.
3. Live box studies and test plots to evaluate the persistence ofSevin in estuarine mud and its effects on recolonization.
4. Benthic invertebrate sampling orograms to determine the extent ofbiological impacts, if any, beyond the Irmnediate spray zone.
5. Studies to determine the effects of Sevin on production of adultcrab resulting from initial mortality and long term establishmentof raature oyster habitat.
6. The role of CalIfarrassa, itself a dominate and productivetideflat species, in overall community ecology, materialstransfer between trophic levels, and foodweb interactions.
7. Evaluation of the potential effects of Sevin on estuarine fishesand shore birds based on changes in prey conmrunities followingtreatment of tideflats and subsequent development of matureoyster beds. The final anaysis of impact on fishes and shorebirds will be subjective; nevertheless, additional data areneeded to describe which food chai~s are most likely to beaffected if the amount of oyster habitat is increased and naturaltideflat habitat is decreased.
If spraying is to cO~tinue with or without additional research, thetiming should be adjusted to minimize environmental risks. As aninterim solution, we recormnend a February or March application toreduce adverse impacts on non-target species. In washington sprayingis presently conducted in June through August during low tides.This coincides with the period of migration and increased estuarinepopulations of juvenile Dungeness crab Forsberq et al. 1977; Stevensand Armstrong 1984; Armstronq and Gunderson, this proceedings! andpeak abundance and diversity of fishes in Tillamook Bay Bottom andForsberg 1978!. Application during June through August may have anindirect effect on juvenile chinook salraon and other estuarine fishesby reducing prey populations Reimers et al., 1979; Bottarr et al.,1984!. Although the long days and daylight tides of the summerallows best control of application and monitoring, Sevin has beensuccessfully applied in early March, Snow and Stewart �983! treateda tideflat in early MarCh and fOund 82 tO 94K reduCtian in the shrimppopulation and a general firming of the substrate.
413

We thank Jim Lichatowich, Alan McGie, Jay Nicholas, and Emery Wagnerfor their review of this manuscript. The encouraqement of TimothyM. Koeneman helped initiate our efforts. Partial funding to supportthe review of literature on the interaction of Sevin and crab camefrom Washington Sea Grant to D.A.A. We thank Janice Ehmke for typingthe manuscript.
References
Armstrong, D.A., and R.E. M111emann. 1974a, Effects of theinsecticide carbaryl on clams and some other intertida'I mud flatanimals, J, Fish. Res. Bd. Can. 31:466-469.
Armstrong, D.A., and R . E. Mi 1 lemann. 1974b . Pathology of acutepoisoninq with the insecticide Sevin in the bent-noseclam, Araaaara rraewta. J. Inver t. Path. 24:2O1-212.
Armstrong, D.A,, and R,E. Millemann. 1974c. Effects of theinsecticide Sevin and its first hydrolytic product 1-naphthol onSOme earl y devel opmental StageS Of the bay muSSel, 747tr'.tuaedulte. Mar. Biol . 28:11-15.
Armstrong, D.A., and D.R. Gunderson. 1985. The role of estuaries inDunqeness cr ab early life history, In: Symposium on DungenessCrab 8 iol ogy and Manaqement. Lowel 1 Wakef i el d FisheriesSymposium No. 3. Anchorage, Alaska.
Bilton, H.T. 1984. Returns of chinook salmon in relation tojuvenile size at release. Canadian Technical Report ofFisheries and Aquatic Sciences No. 1245. Department ofFisheries and Oceans, Pacific Biological Station, Nanaimo,British Columbia.
Bottom, D,L., and B.O. Forsberg. 1978. The fishes of TillamookBay. Oregon Department of Fish and Wildlife Final Report.Portland, Oregon. 56 pp.
Bottom, D . L ., K. K . Jones, and M. J. Herring . 1984 . Fishes of theColumbia River Estuary, Final Report on the Fish Work Unit ofthe Columbia River Estuary Data Development Program. ColumbiaRiver Estuary Study T askforce CREST!, Astoria, Oregon.
Buchanan, D.V., R.E. Millemann, and N.E. Stewart. 1970. Effects ofthe insecticide Sevin on various stages of the Dungenesscrab, Cancer margr.strrr. J, Fish. Res. Bd. Can, 27:93-104.
Butler, J.A., R.E. Millemann, and N.E. Stewart, 1968. Effects ofthe insecticide Sevin on survival and growth of the cockleclam, ClfrracanÃum rruttalli,. J. Fish. Res. Bd. Can,?5 8!:1621-1635.
414

Carrasro, K., D.A. Armstrong, and D,R. Gunderson. 1985. Abundanceand growth of Cancer nxzgister young-of-the-year in the nearshoreenvironment and a compar ison with an adjacent estuary. In:Symposium on Dungeness Crab Biology and Management. Low&e 1Wakef ield Fisheries Symposium Ho. 3, Anchorage Alaska� .
Casida, J.E. 1963. Mode of ar.tion of carbamates. Ann. Rev.Entomol.8r39-58.
Cleaver, F,C. 1949. Preliminary results of the coastal crab Cancermagister! investigation. Wash. State Dept. Fish. Biol. Rep.49A:47-82.
Collier, P.C. 1983. Movement and growth of post-larval Dungenesscrab, Cancer rrra�ister, in the San Francisco area. In: Lifehistory, environment, and maricultur'e studies of the Dungenesscrab, Canes~ mrzgister, with emphasis on the central Californiafishery resource, Paul W. Wild and Robert H. Tasto eds,!,Calif, Dept. Fish G Game, Fish Bulletin 172, pp. 127-134.
Davis, H.C. 1961. Effects of some pesticides on eggs and larvae ofoysters Crassostrea rrirgirricaJ and clams Venrrs nrercenariaJ.U.S. Fish and Wildlife Service. Commercial Fisheries Rev.23:8-23,
For sberg, B.O., J.A. Johnson, and S.M. Klug. 1977. Identification,distribution, and notes on food habits of fish and shellfish inTillamook Bay, Oregon. Oregon Department of Fish and Wildlifecompletion report� . Portland, Oregon . 117 pp .
Gotshall, D.W. 1978. Relative abundance studies of Dungenesscrabs, cancer srzrrister, in Horthern California. Calif. Fish fGame 64 1!: 24-37 .
Healey, M.C . 1980 . Utilization of Hanaimo River Estuary by juvenilechinook salmon, Orrcorhlrrrchus tsrrcarirtscfrc. Fisheries Bulletin77.'653-668.
Healey, M.C. 1982a. Juvenile Pacific salmon in estuaries: The lifesupport system, In: Estuarine comparisons, V.S. Kennedy ed !,Academic Press, Hew York, Hew York, pp. 315-341,
Healey, M.C. 1982b, Timing and relative intensity of size-selectivemcrtality Of juVeni le Chum Sa! man Crrccrhrfrrc7rrrs keta! duringearly sea life. Canadian Journal of Fisheries and AquaticScience 39;952-957.
Johnson, S.L. 1982. A review and evaluation of release strategiesfor hatchery reared coho salmon. Oregon Department of Fish andWildlife information Report Humber 82-5. Portland, Oregon.
Karinen, J.F., J.G. Lamberton, H.E. Stewart, and L.C. Terriere.1967. Persistence of carbaryl in the marine estuarineenvironraent. Chemical and biological stability in aquariumsystem, J, Agr. Food Chem. 15r148-156,
415

Lamberton, J.G., and R.R. Claeys. 1970. Degradation of 1-naphtholin sea ~ater. Agr. Food Chen. 18;92-96.
Mulla. M.S. 1960. Longevity of insecticides in soil as testedagainst the eye gnat eiypelaeerr orrllrraor. Mosquito News.20:376-279.
Nicholas, J.W., and H.V. Lorz. 1984. Stomach contents of juvenilewild chinook and juvenile hatchery coho salmon in several Oregonestuar ies . Oregon Department of Fish and Wildlife InformationReport No. 84-2. Portland, Oregon.
Nosho, T ., R. Tomokiyo, and 0. Ward. 1980. Cormnerci al fish landingsin Washington State ports 1971-1979. Sea Grant Tech. Rep. WSG80-4. 21 pp.
Oregon Department of Fish and Wildlife. 1982. Review of applicationfor a permit to use carbaryl insecticide for control of mud andghost shrirmr on certain oyster grounds in Tillamook Bay. StaffReport to the Oregon Fish and Wildlife Cormnission. Portland,Oregon.
Reilly, P.N. 1983. Predation on Dungeness crabs, Carrorrzmagi'.Ster, StudieS in Central CalifOrnia. In: Life hiStery,environment, and mariculture studies o7 the Dungenesscrab, CaruMr rrrrrgsatrrr, with emphasis on the central Californiafishery resource, Paul W. Wild and Robert N. Taste eds.!,Calif. Dept. Fish 6 Game, Fish Bulletin 172, pp, 155-164.
Reimers, P.E. 1973. The length of residence of juvenile fallchinook salmon in Sixes R-iver, Oregon. Fish Corrnrission ofOregon Research Reports. 4�!r1-43.
Reimers, P.E., J.W. Nicholas, D.L. Bottom, T.W. Downey, K.M.MaCiOiek, J.D. ROdgerS, and B.A. Miller. 1979. CoaStal SalmOnEcology Project Annual Progress Report, October 1, 1978 toSeptember 30, 1979. Oregon Department of Fish and Wildlife.
Snow. C.D ., and N. E. Stewart. 1963 . Treatment of Til lamook Bayoyster beds with MGS-90 Sevin!. Fish Cormnission of Oregon. 8PP ~
Stevens, B., and D,A. Armstrong. 1984. Distribution, abundance andgrowth of juvenile Dungeness crab, Crrrraar rrrrrgsstrrz, in GraysHarbor estuary, Washington, Fish. Bull. In press!.
Stewart, N.E,, R.E. Millemann, and W.P. Breese. 1967. Acutetoxicity of the insecticide Sevin and its hydrolytic productI-naphthol to some marine organisms. Trans. Am. Fish. Sac.96:25-30.
416
Tasto, R.H. 1983. Juvenile Dungeness crab, Concer nmpietsr, studiesin the San Francisco area. In: Life history, environment, andmariculture studies of the Dungeness crab, Canosr augistsr withemphasis on the rentral California fi shery resource, Pau 1'Wild and Robert R. Tasto eds.!, Calif. Dept. Fish 8 Game, FishBulletin 172, pp. 135-154.
Washington Department of Fisheries. 1970. Ghost shrimp controlexperiments with Sev in, 1960-1968. W.D .F . Technical Report 1,62 pp,
Washington Department of Fisheries and Washington Department ofEcology, 1984. Use of the insecticide Sevin to control ghostand mud shrimp in oyster beds of Willapa Bay and Grays Harbor.Draft Environmental Impact Statement. Olympia, Washington.
Wilson, S.L. 1983. The life history of Cozephium eatmonis in theColumbia River Estuary. Masters Thesis, Oregon StateUniversity, Corvlllis, Oregon,
417


List of
Attendees


421
David ArmstrongUniversity of' WashingtonSchool of Fisheries, WH-10Seattle, WA 98195
William R. BechtalAlaska Dept. of Fish 6 GameP.O. Box 234Homer, AK 99603
David R. BernardAlaska Dept. of Fish 6 Game333 Raspberry RoadAnchorage, AK 99502
Forrest BlauAlaska Dept. of Fish 8 GameP.O. Box 686Kodiak, AK 99615
Jacky BoothPacific Biologica' StationNanaimo, B.C,CANADA V9T 5K6
Louis W. BotsfordUniversity of CaliforniaDept. of Wildlife 4 FisheriesBiol ogy
Davis, CA 95616
Ken CarrascoUniversity of' WashingtonSchool of fisheries, WH- 10Seattle, WA 98195
Jay C. CarrollTera CorporationMarine Studies GroupP.O. Bax 4DOAvila Beach, CA 93424
John ClarkAlaska Dept. of Fish B GameP.O. Box 3-2000Juneau, AK 99802
Michael R. DeanAlaska Dept. of Fish d GameP.Q. Box 3-2000Juneau, AK 99807
Darrel 1 DemoryOregon Dept. of Fish 6 WildlifeMarine Science Drive, Bldg. No. 3Newport, OR 97365
Braxton l3ewNational Marine Fisheries ServiceP.O. Box 1638Kodiak, AK 99615
Nancy DiamandHumboldt State UniversityArcata, CA 95521
Paul DinnelUniversity of Washingto~School of FisheriesSeattle, WA 98195
Wayne DonaldsonAlaska Dept. of Fish 6 GameP.O. Box 686Kodiak, AK 99615
Dan DunawayAlaska Dept. of Fish 6 GameP.D, Box 308Dutch Harbor, AK 99692
Hartin F. EatonAlaska Dept. of Fish and GareP.O. Box 686Kodlak, AK 99615
Doug EggersAlaska Dept. of Fish 6 GameP.O. Box 3-2000Juneau, AK 99802

422
Don H. EricksonUr iversi ty of Alaska11120 Glacier HighwayJuneau, AK 99801
Dan FoleyIcy Passage Fi shP. O. Box 57Gustavus, AK 99826
Christine ForrestUni vers i ty of Al ask aSchool of Fisheries 6 ScienceJuneau, AK 99801
Lincoln FreeseNational Marine Fisheries ServiceP. O. Box 155Auke Bay, AK 99821
David HankinHumboldt State UniversityDept. of FisheriesArcata, CA 95521
Mike HawkinsAlaska Dept. of Fish iL Game333 Raspberry RoadAnchorage, AK 995D2
Ray HighsmithUniversity of AlaskaInstitute of Marine ScienceSeward Marine CenterSeward, AK 99664
John Hi!singerAlaska Dept. of Fish 6 GameP,D. Box 686Kodiak, AK 99615
Thorn HooperWashington Dept. of Fisheries331 S.R. 12Montesano, WA 98563
David JacksonAlaska Dept. of Fish 6 GameP.O. Box 686Kodiak, AK 99615
Glen JamiesonFisheries and OceansPacific Biological Station'Nanaimo, British ColumbiaCANADA V9R 5K6
Marl e JeffersonLurrrni Indian Fisheries4085 Lummi Sha 1 e RoadBellingham, WA 98225
Al KimkerAlaska Dept. of Fish l! GameP.O. Box 669Cordova, AK 99574
Timothy KoenemanAlaska Dept. of Fish I! GameP.O. Box 667Petersburg, AK 99833
Scott KyleAlaska Dept. of Fish I! GameP.O. Box 234Homer, AK 99603
Peter l.awtonDept. of Fisheries and OceansBiological StationSt. Andrews, New Brunswick,CANADA EQG 2XO
Mike MacKayLummi Indian Fisheries2526 Kwina RoadBel lingham, WA 98225
Bob MarshallAlaska Dept. of Fish S GameUniversity of AlaskaJuneau, AK 99821

423
Scott L. MarshallAlaska Dept. o . I i sh 6 Game333 Raspberry RoadAnchorage, AK 99502
Ole MathisenUniversity of Alaska11120 Glacier HighwayJuneau, AK 99811
Cliarles P. MeachamAlaska Dept. of Fish & Garte333 Raspberry RoadAnchorage, AK 99502
T. Anthony IiecklenburgP.O. Box 307Puke Bay, AK 99821
Peggy Her rittAlaska Dept. of Fish and GameP.O. Box 234Homer, AK 99603
Theodore R. Meye>sLlnive rsaty of AlaskaSchool of Fisheries 8 Science11120 Glacier HighwayJuneau, AK 99801
Phil MundyUniversity of AlaskaSchool of Fisheries 8 Science11120 Glacier Highwayluneau, AK 99801
Bill NippesAlaska Dept, of Fish 8 GameP.D. Box 686Kodiak, AK 99615
Charles O'ClairIiational Marine Fisheries ServiceAuke Bay LabP.O. Box 155Auke Bay, AK 99821
I'en ParkerAlaska Dept. of Fish 8 GameP.O. Box 3-2000Juneau, AK 99801
A. J. PaulLlniversity of AlaskaSeward Marine CenterP.O. Box 617Seward, AK 99664
E'lien PikitchOregon State UniversityMarine Science CenterNewport, OR 97365
Jerry ReeveNational Marine Fisheries Service2725 liontlake Blvd,, EastSeattle, WA 98112
Paul N. Rei'llyCalifornia Dept. of Fish Il Game411 Burgess DriveMenlo Park, CA 94025
Christopher RogersUniversity of WashingtonRm M15, Fisheries Ctr., WH-10Seattle, WA 98195
Dana SchmidtAlaska Dept. of Fish 6 Game2207 Spenard RoadAnchorage, AK 99503
Jonatha~ ShankerOregon State UniversityMarine Science CenterNewport, OR 97365
,leffrey ShieldsUniversity of CaliforniaDept. of Biological ScienceSanta Barbara, CA 93106

Susan M. ShirleyUniversity of A'laskaSchool of Fisheries & Science11120 Glacier HighwayJuneau, AK 99801
Thomas C. ShirleyUniversity of AlaskaSchool of Fisheries & Science11120 Glacier HighwayJuneau, AK 99801
Ai SpalingerAlaska Dept. of Fish & GameP.O. Box 686Kodiak, AK 99615
Bradley StevensNationa'l Marine Fisheries ServiceP.O. Box 1638Kodiak, AK 99615
David M. TaylorFisheries & Oceans, CanadaP.O, Box 5667St. John' s, NewfoundlandCAMADA A1C 5X1
Gregory J. ThomasonAlaska Dept. of Fish & Game230 s. Franklin, «'301Juneau, AK 99801
Ronald W. WarnerCalifornia Dept. of Fish & Game619 2nd St.Eureka, CA 95501
424