Polygeneration microgrids: A viable solution in remote areas for supplying power, potable water and...
11
This article appeared in a journal published by Elsevier. The attached copy is furnished to the author for internal non-commercial research and education use, including for instruction at the authors institution and sharing with colleagues. Other uses, including reproduction and distribution, or selling or licensing copies, or posting to personal, institutional or third party websites are prohibited. In most cases authors are permitted to post their version of the article (e.g. in Word or Tex form) to their personal website or institutional repository. Authors requiring further information regarding Elsevier’s archiving and manuscript policies are encouraged to visit: http://www.elsevier.com/copyright
Transcript of Polygeneration microgrids: A viable solution in remote areas for supplying power, potable water and...

This article appeared in a journal published by Elsevier. The attachedcopy is furnished to the author for internal non-commercial researchand education use, including for instruction at the authors institution
and sharing with colleagues.
Other uses, including reproduction and distribution, or selling orlicensing copies, or posting to personal, institutional or third party
websites are prohibited.
In most cases authors are permitted to post their version of thearticle (e.g. in Word or Tex form) to their personal website orinstitutional repository. Authors requiring further information
regarding Elsevier’s archiving and manuscript policies areencouraged to visit:
http://www.elsevier.com/copyright

Author's personal copy
Polygeneration microgrids: A viable solution in remote areas for supplyingpower, potable water and hydrogen as transportation fuel
George Kyriakarakos a,⇑, Anastasios I. Dounis b, Stelios Rozakis c, Konstantinos G. Arvanitis a,George Papadakis a
a Agricultural University of Athens, Department of Natural Resources and Agricultural Engineering, 75 Iera Odos Street, GR 11855 Athens, Greeceb Technological Educational Institute of Piraeus, Department of Automation, 250, P. Ralli & Thivon Street, Egaleo 122 44, Greecec Agricultural University of Athens, Department of Agricultural Economics and Rural Development, 75 Iera Odos Street, GR 11855 Athens, Greece
a r t i c l e i n f o
Article history:Received 24 March 2011Received in revised form 17 May 2011Accepted 22 May 2011Available online 15 June 2011
Keywords:Autonomous hybrid renewable energysystemsPolygenerationMicrogridsHydrogenDesalinationParticle Swarm Optimization (PSO)TRNSYS
a b s t r a c t
This paper presents the concept and the design of a hybrid renewable energy polygeneration microgridalong with its technical and economical evaluation. The energy of the sun and the wind is harvested byphotovoltaics and a wind turbine. Besides that, the components of the microgrid include a battery bank, aProton Exchange Membrane (PEM) fuel cell, a PEM electrolyzer, a metal hydride tank, a reverse osmosisdesalination unit using energy recovery and a control system. The microgrid covers the electricity, trans-port and water needs and thus its products are power, hydrogen as transportation fuel and potable waterthrough desalination. Hydrogen and the desalinated water also act as medium to long term seasonal stor-age. A design tool based on TRNSYS 16, GenOpt 2.0 and TRNOPT was developed using Particle SwarmOptimization method. The economic evaluation of the concept was based on the discounting cash flowapproach. The Monte Carlo Simulation method was used in order to take uncertainty into account. A tech-nically feasible polygeneration microgrid adapted to a small island is financially profitable with a prob-ability of 90% for the present and 100% at the medium term.
� 2011 Elsevier Ltd. All rights reserved.
1. Introduction
Specific needs should be covered in order a region to achievesustainable growth in an economical and a social manner. Electri-cal energy, potable water and fuel for transportation are three ofthe most important fundamentals for development.
Renewable energy systems consisting of photovoltaics, windturbines and batteries have been used extensively in remote areasfor the last few decades in order to cover electricity needs [1].These systems are modular, they can be custom made to cover spe-cific needs and require only minimal maintenance. A general prob-lem of renewable energy systems is that there is not always aconcurrence between supply and demand. Since long term electric-ity storage is usually expensive – batteries are expensive, have lifespans of about 5 years, and are also delicate to handle afterwardsbecause they contain toxic elements – such systems have highenergy losses in a yearly basis [2,3] . It has also been proposed thatthe use of a backup power source can increase the cost effective-ness of such systems [4].
Potable water shortages are frequent in many areas of the worldas well. Usually places that have scarce potable water sources also
face energy supply difficulties. This happens especially in islandsand remote areas. Reverse Osmosis (RO) desalination systemswhich are powered by photovoltaics and wind turbines have beenconsidered in order to provide potable water. The main advantagesof RO are low energy consumption and modest maintenancerequirements. This approach can also be used in cases of brackishwater as well [5,6].
Hydrogen is an energy carrier that its use has been raising con-stantly throughout the last years [7,8]. It can be used as a fuel fortransportation, as well as a medium to long term energy storage[9]. A hydrogen subsystem usually consists of a water electrolyzer,hydrogen storage, refueling system and a fuel cell. An electrolyzeris a unit which produces hydrogen by means of electrolysis usingelectricity. That hydrogen is stored in either gas tanks or metalhydride tanks. Metal hydride tanks are more expensive, but offerhigh safety against accidents [10]. This is the main reason why theyare preferred in autonomous systems. A refueling system is presentif hydrogen is going to be used as fuel for transportation. A fuel cellis the device which produces electricity from the stored hydrogen.Using a hydrogen subsystem, significant advantages in comparisonwith big battery banks are observed in terms of energy densityand long-term storage [11]. The use of hydrogen subsystemsshow specific technology advantages: low noise level, potentialfor high energy density storage, seasonal energy storage without
0306-2619/$ - see front matter � 2011 Elsevier Ltd. All rights reserved.doi:10.1016/j.apenergy.2011.05.038
⇑ Corresponding author. Tel.: +30 210 5294046; fax: +30 210 5294032.E-mail address: [email protected] (G. Kyriakarakos).
Applied Energy 88 (2011) 4517–4526
Contents lists available at ScienceDirect
Applied Energy
journal homepage: www.elsevier .com/locate /apenergy

Author's personal copy
energy loss over time, ability to handle power fluctuations andtherefore ideal for integration with RES, potential for low andpredictable Operation and Maintenance (O&M) costs and reducedenvironmental impact compared to conventional energy sources[4].
Microgrids are small scale power supply networks. They canwork either autonomously or interconnected with a larger grid[12,13]. In microgrids different energy sources and energy storagedevices can be distributed at any location covered by the grid. Theyoffer higher reliability than compact systems since they can oper-ate at lower power levels if there is a failure of one power sourceinstead of shutting down completely. Microgrids, especially whenthey are used autonomously, demand intelligent managementand efficient design in order to be able to meet the needs of thearea they cover [14].
Nowadays we usually find separate systems that produce elec-tricity, and separate ones for water production [5,15]. Cogenerationand trigeneration systems have been proposed mainly for coveringthe electrical power, heating and cooling need [16,17], whereaspolygeneration approaches have been investigated for diversesystems and products [18–20]. The idea of producing onsite fuelfor transportation is relatively new and in most cases diesel or gas-oline is used for such purposes. By designing and using a polygen-eration system that can generate more than one product we canmanage better the energy flows in the system throughout the year,and thus, achieve a very high use of the available energy of the sys-tem minimizing losses [21].
This paper presents the design of such a system, which is theneconomically evaluated and compared to alternative options forcovering the needs in electricity, water and fuel for two housesin a remote area. A similar system has already been erected atthe Agricultural University of Athens (AUA), Greece and is cur-rently under experimental evaluation [22].
A design tool based on TRNSYS 16, GenOpt 2.0 and TRNOPT wasdeveloped. New routines were written and included in TRNSYS sothat all system components could be simulated. The design processwas based on GenOpt using Particle Swarm Optimization (PSO).The system that was derived through this optimization was subjectto investment appraisal. The economic evaluation of the conceptwas based on the discounting cash flow approach. The Monte CarloSimulation (MCS) method was used in order to take uncertaintyinto account. Since the cost of the electrochemical components,as well as the PV panels show a constant decline two scenarioswere analyzed; one for the year 2011 and one for the year 2015.The results show that a polygeneration microgrid is technicallyfeasible and most likely financially profitable.
2. Materials and methods
2.1. Microgrid configuration
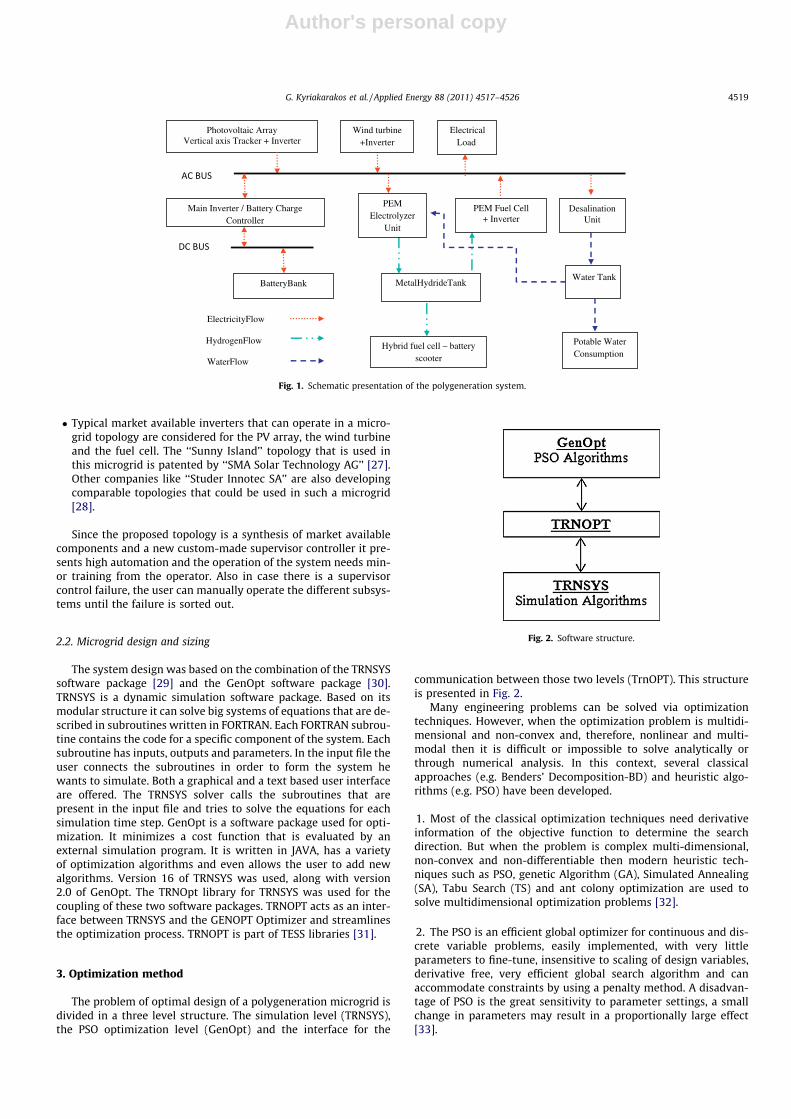
The configuration of the system is presented in Fig. 1. An Alter-nating Current (AC) microgrid topology was chosen because of theadvantages it offers. The most important of them are:
� Ability to use distributed renewable energy sources.� Easier future expansion of the system.� In case the main grid arrives in the future the microgrid can
operate either islanded or in interconnection with the maingrid.� Because of the AC bus use, such a system can be also deployed
in small villages with scattered houses making the use of dis-tributed generation also possible.
The actual components of the system are:
� Photovoltaic (PV) array: A typical monocrystalline silicon photo-voltaic array was considered which is installed on a one-axisvertical tracker which is adjusted continuously. One axis track-ing systems have been on the market for many years now, haveshown to be reliable and their cost is nowadays comparablewith fixed frame systems [23]. Using a tracker the installedPV power can be decreased, having thus a positive impact onsystem costs.� Wind turbine: A Direct Current (DC) generator wind turbine was
considered.� Desalination unit: A custom made sea water desalination unit
was considered in the system, according to a system that hasbeen manufactured and tested extensively at the AgriculturalUniversity in Athens. It is equipped with hydraulic energyrecovery. Its specific energy consumption is 6.25 kW h/m3 [5].� Fuel cell: A typical Proton Exchange Membrane (PEM) fuel cell
was considered.� Electrolyzer: A typical PEM electrolyzer was considered. It is able
to supply hydrogen at high pressure (�15 bar).� Metal Hydride Hydrogen storage tank. A typical metal hydride
storage tank was considered.� Hydrogen vehicle: A hybrid fuel cell-battery scooter was con-
sidered [24]. The hybrid fuel cell – battery scooter is assumedto have an average hydrogen consumption of 2.4 Nm3 of H2/100 km. This scooter is comparable to a 72 cc gasoline scooterwhich presents a fuel consumption of 2.2 l of gasoline/100 km.� Battery bank: A typical deep discharge solar lead acid battery
bank was considered in the system. The DC bus is set at 48 V.� Controller: It is the component that is responsible for the opti-
mal operation of the system [25,26]. It checks constantly theenergy flows in the system and decides which devices to acti-vate and deactivate.
The used controller is an ON/OFF controller based on four par-allel control schemes:
– Double hysteresis control scheme.– Load forecast.– Hierarchy of the consumptions.– Safety support control scheme.
The controller is described in detail in [22].
Nomenclature
CF cost function (€)IMC investment and maintenance cost for a 20 year period
(€)NCF net cash flows (€)NPV net present value (€)OM operation and maintenance costs (€)
Pb battery penalty (€)PH2 hydrogen penalty (€)PS tanks penalty (€)Pw water penalty (€)SOC state of charge (%)
4518 G. Kyriakarakos et al. / Applied Energy 88 (2011) 4517–4526
Author's personal copy
� Typical market available inverters that can operate in a micro-grid topology are considered for the PV array, the wind turbineand the fuel cell. The ‘‘Sunny Island’’ topology that is used inthis microgrid is patented by ‘‘SMA Solar Technology AG’’ [27].Other companies like ‘‘Studer Innotec SA’’ are also developingcomparable topologies that could be used in such a microgrid[28].
Since the proposed topology is a synthesis of market availablecomponents and a new custom-made supervisor controller it pre-sents high automation and the operation of the system needs min-or training from the operator. Also in case there is a supervisorcontrol failure, the user can manually operate the different subsys-tems until the failure is sorted out.
2.2. Microgrid design and sizing
The system design was based on the combination of the TRNSYSsoftware package [29] and the GenOpt software package [30].TRNSYS is a dynamic simulation software package. Based on itsmodular structure it can solve big systems of equations that are de-scribed in subroutines written in FORTRAN. Each FORTRAN subrou-tine contains the code for a specific component of the system. Eachsubroutine has inputs, outputs and parameters. In the input file theuser connects the subroutines in order to form the system hewants to simulate. Both a graphical and a text based user interfaceare offered. The TRNSYS solver calls the subroutines that arepresent in the input file and tries to solve the equations for eachsimulation time step. GenOpt is a software package used for opti-mization. It minimizes a cost function that is evaluated by anexternal simulation program. It is written in JAVA, has a varietyof optimization algorithms and even allows the user to add newalgorithms. Version 16 of TRNSYS was used, along with version2.0 of GenOpt. The TRNOpt library for TRNSYS was used for thecoupling of these two software packages. TRNOPT acts as an inter-face between TRNSYS and the GENOPT Optimizer and streamlinesthe optimization process. TRNOPT is part of TESS libraries [31].
3. Optimization method
The problem of optimal design of a polygeneration microgrid isdivided in a three level structure. The simulation level (TRNSYS),the PSO optimization level (GenOpt) and the interface for the
communication between those two levels (TrnOPT). This structureis presented in Fig. 2.
Many engineering problems can be solved via optimizationtechniques. However, when the optimization problem is multidi-mensional and non-convex and, therefore, nonlinear and multi-modal then it is difficult or impossible to solve analytically orthrough numerical analysis. In this context, several classicalapproaches (e.g. Benders’ Decomposition-BD) and heuristic algo-rithms (e.g. PSO) have been developed.
1. Most of the classical optimization techniques need derivativeinformation of the objective function to determine the searchdirection. But when the problem is complex multi-dimensional,non-convex and non-differentiable then modern heuristic tech-niques such as PSO, genetic Algorithm (GA), Simulated Annealing(SA), Tabu Search (TS) and ant colony optimization are used tosolve multidimensional optimization problems [32].
2. The PSO is an efficient global optimizer for continuous and dis-crete variable problems, easily implemented, with very littleparameters to fine-tune, insensitive to scaling of design variables,derivative free, very efficient global search algorithm and canaccommodate constraints by using a penalty method. A disadvan-tage of PSO is the great sensitivity to parameter settings, a smallchange in parameters may result in a proportionally large effect[33].
Photovoltaic Array Vertical axis Tracker + Inverter
BatteryBank
ElectricalLoad
MetalHydrideTank
DesalinationUnit
Water Tank
Hybrid fuel cell – battery scooter
Potable WaterConsumption
ElectricityFlow
WaterFlow
HydrogenFlow
Wind turbine +Inverter
PEM Fuel Cell + Inverter
Main Inverter / Battery Charge Controller
PEM Electrolyzer
Unit
Fig. 1. Schematic presentation of the polygeneration system.
Fig. 2. Software structure.
G. Kyriakarakos et al. / Applied Energy 88 (2011) 4517–4526 4519

Author's personal copy
3. Using the conventional methods, whole problem is usuallydivided to sub-problems and various methods are utilized for solv-ing each sub-problem. On the contrary, PSO can handle the wholeproblem easily and naturally and it is easy to apply to variousproblems compared with the conventional methods [34].4. Benders’ Decomposition takes more computational effort thanthe PSO [35].5. The size and non-convexity of the problem, which depend onthe system parameters, are critical issues that may cause conver-gence problems in BD algorithm [35].6. An improper selection of the initial condition of the algorithmmay cause a convergence problem when applying conventionaloptimization techniques [36].7. The heuristic algorithms normally take extensive computingtime compared with the conventional optimization methods [34].
The PSO algorithm has been investigated with good results asan optimization method for energy systems [37–40]. Boonbum-roong et al. [41] investigated the optimization of AC-bus coupledautonomous hybrid power systems, such as the one under investi-gation in this paper, using different approaches and concluded thatthe PSO algorithm can yield the best results.
3.1. The simulation components
Routines present in TRNSYS were used to simulate the photo-voltaic array, wind turbine and battery and new ones were writtenfor the hydrogen subsystem, the desalination unit and the control-ler. The new subroutines developed in detail are:
– Controller: A model in TRNSYS was built according to thedesigned controller [22].
– Fuel cell: A typical PEM fuel cell is modeled according to exper-imental test results concerning the efficiency at specific powerlevels.
– Electrolyzer: A typical PEM electrolyzer is modeled according toexperimental test results concerning the efficiency at specificpower levels.
– Metal hydride storage tank: A typical metal hydride hydrogenstorage tank was modeled.
– Desalination subsystem with water storage tank: A typical ROdesalination subsystem equipped with energy recovery ismodeled [5].
3.2. Optimization process
It was decided that the optimal design would be the one withthe lowest investment and operational cost, which at the sametime fulfilled technical constraints. A new type to calculate theinvestment and operational cost was written and added to TRNSYS.Values used in the calculations were in accordance with marketprices. The four technical constraints were set as follows:
– The battery bank should not be deep discharged. This meansthat the fractional State of Charge (SOC) would not drop below20%.
– No water shortage was allowed. The potable tank would neverget empty.
– No hydrogen shortage was allowed. The metal hydride tank forhydrogen storage would never get empty.
– The stored hydrogen and potable water in the end of the yearwould be equal or higher than the stored quantities in thebeginning of the year.
The actual optimization took place using the GenOpt softwarepackage through minimizing a cost function. The PSO algorithm
has been used. This stochastic optimization technique is modeledafter the social behavior of members of bird flocking or fish schoolsand swarming in general [42]. PSO algorithms use a set of potentialsolutions for the optimization procedure. Each such solution iscalled particle and the set in a given iteration step is called apopulation. After the user has defined the search space, the initial-ization of the first population takes place using a random numbergenerator in order to accomplish uniform spreading of the particlesin the defined search space. If k is the generation number and np isthe number of particles in each generation, the position (xi(k)) andvelocity (ui(k)) of the i-th particle in the next generation is given bythe following two equations [30]:
uiðkþ 1Þ ¼ uiðkÞ þ c1q1ðkÞðpl;iðkÞ � xiðkÞÞþ c2q2ðkÞðpg;iðkÞ � xiðkÞÞ ð1Þ
Xiðkþ 1Þ ¼ xiðkÞ þ uiðkþ 1Þ ð2Þ
where pl,i(k) is the location for the i-th particle that yields the lowestcost over all generations, pg,i(k) is the location of the best particle ofall generations, c1 is the cognitive acceleration constant, c2 is the so-cial acceleration constant, q1(k) and q2(k) are uniformly distributedrandom numbers between 0 and 1.
The variables to be optimized in the polygeneration microgridare discrete, due to the fact that the microgrid uses market avail-able components which come at standardized sizes by the manu-facturers. A binary version of the PSO algorithm proposed byKennedy and Eberhart [43] can be used for the optimization ofdiscrete variables. In this algorithm the discrete independentvariables are encoded in a string of binary numbers. For somei e {1 , ... , n} let xi be the component of a discrete independent var-iable, let wi 2 f0;1g
mi be the binary representation of xi obtainedusing Gray encoding [30], and let pl,i and pg,i be the binary repre-sentations of pl,i and pg,i. For i 2 f1 ; ::: ; ng and j 2 f1 ; . . . ; mig,wj
ið0Þ 2 f0;1gis initialized. For each generation [30]:
ujiðkþ 1Þ ¼ uj
iðkÞ þ c1q1ðkÞðpjl;iðkÞ � wj
iðkÞÞ
þ c2q2ðkÞðpjg;iðkÞ � wj
iðkÞÞÞ ð3Þ
ujiðkþ 1Þ ¼ signðuj
iðkþ 1ÞÞminfjujiðkþ 1Þj;umaxg ð4Þ
wjiðkþ 1Þ ¼ 0; qi;jðkÞP sðuj
iðkþ 1ÞÞ1; otherwise
(ð5Þ
where
sðuÞ¼D 11þ e�u
:
4. Economic evaluation of the polygeneration microgrid
After the design of the system was finalized an economic eval-uation took place. In the first step the net present value of the sys-tem was calculated, along with the payback period using thediscounted cash flow method. Discounted cash flow (DCF) analysisuses future cash flow projections and discounts them to arrive at apresent value. The polygeneration microgrid produces electricalenergy, potable water and fuel for transportation. For the valueof potable water and fuel for transportation actual market priceswere used as of February 2011. In order to set the price of an elec-trical kW h a typical diesel-battery system was designed and eval-uated for a 20 year period, a usual technique for satisfyingelectricity needs of a remote area.
Factors used in the calculation of net present value, such as gas-oline and diesel prices, interest rate and the price of the electro-chemical components add uncertainty to various degrees in the
4520 G. Kyriakarakos et al. / Applied Energy 88 (2011) 4517–4526

Author's personal copy
net present value. In order to have a better understanding of theprofitability of a polygeneration microgrid a Monte Carlo Simula-tion (MCS) was carried out, a method readily used for renewableenergy appraisal [44]. The principle of Monte Carlo sampling isbased on the frequency interpretation of probability and requiresa steady stream of random numbers [45]. For continuous distribu-tions random numbers are generated using the inverse transforma-tion method. This method requires a cumulative distributionfunction (CDF) f(x) in closed form and consists of giving to f(x) arandom value and to solve for x.
Data from the simulation can be analyzed using a terminatingsimulation approach. We make n independent replications of themodel using the same initial conditions but running each replica-tion with a different sequence of random numbers. If the measureof performance is represented by the variable X, this approachgives us the estimators X1 , . . . , Xn from the n replications. Theseestimators are used to develop a 100 (1 � a) percent confidenceinterval as in Eq. (1) where tn�1,a/2 is the upper 1 � a/2 critical pointfor a t distribution with n � 1 degrees of freedom.
�XðnÞ � tðn�1;a2Þ
ffiffiffiffiffiffiffiffiffiffiffiS2ðnÞ
n
sð6Þ
where
�XðnÞ ¼
Pni¼1
Xi
nand S2ðnÞ ¼
Pni¼1½Xi � �XðnÞ�2
n� 1
For a fixed value of n, it returns the confidence interval for apopulation mean. In other words after simulation the questionon the probability of a negative NPV can be posed and answered.
The steps proposed by Schade and Wiesenthal [46] werefollowed:
1. The influence of each of the important parameters in the calcu-lation of the NPV is determined.
2. A review in the literature takes place in order to identify uncer-tainty ranges and probability density functions for the impor-tant parameters. Where no information about the probabilitydensity function was available it has been constructed withavailable data.
3. The actual MSC is carried out.
5. Simulation and optimization parameters
5.1. TRNSYS simulation parameters
The microgrid is considered to be installed on a small island inthe Aegean Sea, Greece and typical meteorological data of the areaare used. Two households are considered. The load that is used istypical for houses equipped with energy efficient devices. The peakload is 1.6 kW and the average energy consumption is 10 kW h/day.The two households are assumed to have eight residents and the to-tal daily water consumption to be 1.92 m3. This includes the pota-ble water, kitchen and laundry use, bathing and sanitary use. Thescooter used is assumed to cover 50 km each day on average andits average daily consumption in hydrogen to be 1.2 Nm3 H2. Thesimulation time step is 1 h.
5.2. GenOpt optimization parameters
The optimizations were performed with the PSO with constric-tion coefficient algorithm of GenOpt using the settings proposed byBoonbumroong et al. [41]. These settings are presented in Table 1.
The optimization variables, along with their range of valuesused for the optimization are presented in Table 2 and the penal-ties calculation is presented in Fig. 3.
The cost function (CF) to be minimized for the yearly simulation(8760 h) is presented in Eq. (7).
CF ¼ IMCþX8760
t¼1
PbðtÞ þX8760
t¼1
PH2 ðtÞ þX8760
t¼1
PW ðtÞ þ PS ð7Þ
where IMC is the investment and maintenance cost for a 20 year per-iod, Pb the battery penalty, PH2 the hydrogen penalty, Pw the waterpenalty and PS is the tanks penalty. If the stored water and/or storedhydrogen are less in the end of the year than its beginning another100,000 € are added.
The theoretical minimum of this cost function equals to thelowest IMC of the search space, should that system be able to coverthe needs throughout the year (all penalties are equal to 0 for alltimesteps). The theoretical maximum of this cost function wouldbe equal to the IMC of a system that is unable to meet the demandin all timesteps plus the penalties for all the timesteps. Since anhourly simulation is carried out (8760 h for a total year), themaximum value of all penalties should they occur for every timestep is 26,281 � 105. Consequently, this cost function will identifythe system with the lowest IMC in the search space, which can, atthe same time, cover all the needs of the system for all timesteps(all penalties equal to zero).
6. Results
6.1. Optimization results
The entire search space consisted of 770,96,448 possible systemcombinations. The optimization algorithm converged and thecomputation time for the whole optimization procedure took about20 min on a typical pc (CPU of 3 GHz and 2 GB of ram). For the cho-sen 200 generations of the PSO algorithm 800 simulations tookplace. Each simulation lasted between 1 and 2 s. Thus, the actualcomputation time for the optimization algorithm was only a smallfraction of the total optimization time. Given the complexity of thesystem, the method gives good results in very short time. The effi-ciency of the optimization method based on PSO is satisfactorywithin reasonable computational time. This method requires fewmemories. An important remark is that, there is no optimizationmethod that generally outperforms all others and hence the selec-tion of an optimization algorithm is problem dependent. In generalthe robustness of an optimization algorithm is more important thanthe efficiency [36]. A disadvantage of PSO is the slow convergencein refined search stage, that is, weak local search ability.
The optimization results for the design of the microgrid arepresented in Table 2.
The installed PV power is equal to 4.8 kWp and one 3 kW windturbine is used. The battery bank was sized at 1000 Ah at 48 V. Theempirical rule when designing autonomous hybrid systems is tohave a battery bank adequate to cover the needs for about 3 days.This battery bank could cover the electricity needs for a little morethan 4 days. This happens because of the existence of the hydrogenand desalination subsystems which also consume power. In theproposed topology there are two approaches of storing electricalenergy. The first is to store it in the battery bank and the second
Table 1PSO settings.
Topology Von Neumann
Particles 3Generations 200Seed 0Cognitive acceleration constant 2.8Social acceleration constant 1.3Maximum velocity gain 0.5Constriction gain 0.5
G. Kyriakarakos et al. / Applied Energy 88 (2011) 4517–4526 4521

Author's personal copy
to store it in the form of hydrogen. Since the current market pricesof the hydrogen components are still high, it was expected that asystem with a bigger battery bank would be chosen in comparisonwith one with a smaller battery bank and higher usage of thehydrogen subsystem as electrical energy storage.
The fuel cell is sized at only 300 W. The chosen size is enough toguarantee zero energy deficit throughout the year. The fuel cell isused as a backup energy producer. This can also be seen in Fig. 4where clearly the produced energy of the fuel cell is considerablylower than the rest of the energy producers. The fuel cell operatesfor a total of less than 10 h. From a first glance one could argue thatwith such minimal usage it should be omitted. It has to be taken inconsideration though that if the batteries get deep discharged themain inverter which creates the electrical grid will not be able tocreate it. The PV and wind turbine inverters consequently willnot feed any electricity because they will not find a grid tosynchronize to. The companies that offer these topologies suggestthat an external electricity generator (usually diesel powered) ispresent so that the system can become operational again. The fuel
cell plays that role as well as it is clearly a backup energy source forthe system. Therefore the employment of the fuel cell is consideredas necessary. If the cost of the hydrogen equipment drops in thefuture then the optimal design will use the hydrogen subsystemmore coupled with a smaller battery bank. The electrolyzer onthe other hand is sized at 700 W because it has to produce thehydrogen needed for the vehicle apart from the hydrogen to beused by the fuel cell.
The water tank is sized at 21 m3. Tanks of this size are availablecommercially usually in cylindrical shapes and have approval forpotable water storage. Under the climatic conditions of Greece dur-ing late autumn and early spring it is typical to have some consec-utive days of low solar and wind potential at the same time. Inorder to cover the electricity demand during these days we haveto either have bigger energy storage or size the installed renewablepower higher. Usually it is preferred to opt for a larger installedpower because of the high cost of energy storage solutions andlow operational lifetime. This oversizing leads to high energylosses throughout the year and especially during summer whenhigh wind and solar potential is available at the same time. In thispolygeneration system potable water and hydrogen are used aslong term energy storage. The big potable water tank provides sea-sonal storage of energy especially for late autumn-early winterwhen the sun and wind potential is low. For the same time periodthe metal hydride tank provides hydrogen that was produced ear-lier in the year. This is clearly seen in Figs. 5 and 6 where the storedwater and hydrogen throughout a whole year are presented. As it isvisible in Fig. 5 more water could be produced during the summermonths since the water tank is most of the time full from latespring to autumn. The possibility arises for owners of such a sys-tem to sell the excess water that could be produced during thesummer months. This possibility was not taken in considerationin the following economic calculations. The metal hydride tank issized at 10.5 Nm3 H2. The hydrogen used for covering the mobilityneeds of the vehicle is considered to be constant throughout theyear. In Fig. 6 it is visible that medium to long term storage ofhydrogen also takes place.
Three typical days were chosen to present how the systemoperates in 1 h time steps.
In Fig. 7 operation data from the 1st of August are presented.Solar and wind resources are high and the battery remains almost
Table 2Optimization variables.
Variable Lowest value Highest value Step Optimal value
Typical monocrystalline modules rated at 150 Wp each in series 5 16 1 16Typical monocrystalline modules rated at 150 Wp each in parallel 2 4 1 2Number of typical 3 kW wind turbines used 1 2 1 1Rated power of the fuel cell (W) 300 1000 100 300Rated power of the electrolyzer unit (W) 500 1200 100 700Metal hydride tank storage capacity (Nm3 of H2) 6 12 0.5 10.5Capacity rating of each of the 2 V batteries. Twenty-four are used for a 48 V DC bus (Ah) 400 1200 100 1000Potable water tank volume (m3) 15 25 1 21Rated power of the desalination unit (W) 600 1200 50 700
Fig. 3. Penalties calculation.
Fig. 4. Yearly produced and consumed energy.
4522 G. Kyriakarakos et al. / Applied Energy 88 (2011) 4517–4526

Author's personal copy
fully charged throughout the 24 h. The electrolyzer and desalina-tion units are operating continuously day and night, apart from1 h just before sunrise when the energy balance in the systembecomes negative. After the sunrise the energy balance is positiveagain and both devices remain turned on.
In Fig. 8 the data from October 1st are presented. In the begin-ning of the day the desalination unit was turned on and we can seea constant decline in the SOC. So after some time the desalinationunit was turned off. The wind potential is very low throughout theday. The power produced by the PV array is considerable for thistime of the year and this is also due to the 1 axis tracking. In theafternoon the SOC increases and since there is still power produc-tion from the PV array both the desalination and electrolyzer unitsare turned on. When the sun starts to set the SOC is still high butthe power production drops. The controller has to shut down oneof the two units and priority is given to the desalination unit. After
a few hours before the end of the day SOC drops bellow 65% andthe controller turns off the desalination unit as well. Since therated power of the desalination unit and the electrolyzer unit arethe same, their diagram curves coincide when they are turned onat the same time.
The last day is the 10th of December and its data is presented inFig. 9. The battery SOC was low from the previous day. There is nowind and the sun has not risen yet so the electrical load is drawingpower from the battery bank. When the SOC reaches 25% the con-troller turns on the fuel cell so as to protect the battery from deepdischarge as backup power. When sun rises the pv array starts pro-ducing power and the controller turns off the fuel cell. For thewhole day the SOC stays below 65% and so the controller doesnot turn on the electrolyzer or the desalination units.
7. Economic evaluation of the system
7.1. Deterministic investment appraisal
The avoided cost of potable water is considered to be 5.5 €/m3
and for the unleaded gasoline fuel 1.72 €/l. Both prices are in accor-dance with market prices on Aegean Sea islands in early 2011. Inorder to estimate the avoided cost of the electrical kW h a diesel-battery system was designed and evaluated for a 20 year period.This system comprises of a typical 2 kW diesel genset, a 800 Ahbattery bank at 48 V, a charge controller, an inverter and a dieseltank. The diesel genset has a lifetime of 7500 h and consequentlyneeds to be replaced every 3 years and the battery bank needs tobe changed every 7 years. The interest rate is considered to be6%. The system yearly operation and maintenance costs apart fromthe diesel fuel are estimated to be 200 euros. This also includes thetransportation cost for the diesel fuel from the gasoline station tothe remote area. The price of the diesel genset is considered tobe 1000 €, the battery bank 9600 €, the inverter and charge control-ler 2000 € and the diesel tank 900 €. The investment cost of thepolygeneration microgrid is calculated based on market prices ofits corresponding components. The Net Cash Flows (NCF) are pre-sented in Table 3.
The NPV for the polygeneration microgrid is 21,236 €.
7.2. Stochastic investment appraisal
The first step for the MCS includes the definition of the mostinfluential parameters. A sensitivity analysis was carried in thisscope and the results are presented in Table 4. Most of the systemcomponents’ cost is around 10,000 € and thus their influence in theNPV is similar. PV panels present almost double that cost(19,200 €), so a change in their cost will influence more the NPV.
Fig. 5. Potable water in the water tank.
Fig. 6. Hydrogen in the metal hydride tank.
Fig. 7. Hourly power figures for the 1st of August.
G. Kyriakarakos et al. / Applied Energy 88 (2011) 4517–4526 4523

Author's personal copy
The cost of the potable water tank, the inverters and controller andthe installation costs are considerably lower and so influence lessthe NPV. The cost of the fuel cell is low, but its pricing shows highuncertainty and thus will be taken in consideration for the MCS.Prices of diesel and gasoline fuel, potable water and the interestrate also present high uncertainty and will be taken into consider-ation for the MCS. The cost of the PV panels and the battery bankdo not present major fluctuations in the market at the presenttime, but it is expected that their cost will drop in the years tocome [47]. The electrochemical components cost is also expected
to drop significantly in the near future [48]. Hybrid scooter pricesare also expected to decrease because of the increase in the pro-duction capacities. Because of this it was decided to investigatetwo scenarios with MCS, one for the year 2011 and one for the year2015. The cost of the desalination unit, potable water tank, invert-ers, installation cost, controller and wind turbine are expected tohave comparable pricing in the near future so they will not betaken into account in the MCS.
The fuel prices cannot be predicted with confidence. Alsobecause of the financial crisis the interest rate could fluctuate
Fig. 8. Hourly power figures for the 1st of October.
Fig. 9. Hourly power figures for the 10th of December.
Table 3Net cash flows.
Type of Monetary flow Item Years
0 1–6 7 8–13 14 15–20
Inflows (or avoided costs) Electricity 7081 7081 7081 7081 7081Water 3696 3696 3696 3696 3696Fuel 662.20 662.20 662.20 662.20 662.20
Outflows PV 19,200Windturbine 10,000Fuel cell 1500Electrolyzer unit 10,500Metal hydride tank 10,500Battery bank 12,000 12,000 12,000Scooter 10,000Desalination unit 7000Water tank 2100Main inverter/controller 2000Installation cost 5000OM 0 600 600 600 600 600
NCF �89,800 10839.20 �1160.80 10839.20 �1160.80 10839.20
4524 G. Kyriakarakos et al. / Applied Energy 88 (2011) 4517–4526

Author's personal copy
considerably. Finally the hydrogen components present a steadydecline in their prices. If hydrogen penetration is increased in theautomotive sector the prices for stationery applications will alsodrop. The hybrid scooter is estimated to be considerably cheaperin 2015 because of the expected decreased prices for its hydrogenand battery subsystems.
There are two groups of variables that may be correlated. Thefirst depends on Brent oil price (fossil fuels) and the second onecomprises electrochemical components. For these two groups a tri-angular distribution will be considered for generating a numberbetween 0 and 1 and this number is going to be used in equationsthat calculate the actual price. The mode for this triangular distri-bution for the fuel prices is 0.2 which means that the probability ofthe prices going higher is smaller than remaining stable or movedecreasing. This was decided because the current (February
2011) fuel prices in Greece reached all-time peak. For the electro-chemical equipment the mode is 0.3 because it is expected thathydrogen component prices will follow a price decrease trend[48]. The interest rate, potable water, PV array and battery bankcosts are considered to follow a uniform distribution. For the calcu-lation of 10,000 iterations about 1 min is needed in a typical pc(CPU of 3 GHz and 2 GB of ram). Since the calculation time is min-imal it was decided to carry out 32,000 iterations (which is the toplimit in the MS Excel VBA macro that was created) in the MCS sim-ulation in order to achieve higher accuracy.
Thus a MCS was performed in order to have a clearer view of theprofitability of this investment. The minimum and maximum costof each of the variables for the two scenarios are presented in Table5. NPV cumulative distributions are presented in Fig. 10.
Average NPV for the 2011 scenario is equal to 26,862 € withestimated probability of negative NPV about 10%. For the 2015 sce-nario the average NPV is equal to 55,955 € with zero probability ofnegative NPV.
8. Conclusions
In summary, from a technical and economic standpoint, thefollowing key remarks are brought forward:
� A simulation and design tool for polygeneration microgridsbased on RES was designed and realized through the use ofTRNSYS and GenOpt. The open structure of these softwarepackages allows the user to add new algorithms making thisapproach very flexible and allowing it to be used even in verycomplex systems.� It is technically feasible today to create autonomous renewable
energy sources systems that can offer zero load deficit. A micro-grid based polygeneration system is preferable because it is
Table 4Influence of changes in parameters on NPV.
Change of NPV as percentage parameter Change of output (relative to NPV)
�30% �15% +15% +30%
PV array with inverter 27.1 13.6 �13.6 �27.1Windturbine 14.1 7.1 �7.1 �14.1Fuel cell 2.1 1.1 �1.1 �2.1Electrolyzer unit 14.8 7.4 �7.4 �14.8Metal hydride tank 14.8 7.4 �7.4 �14.8Battery bank 35.7 17.9 �17.9 �35.7Scooter 14.1 7.1 �7.1 �14.1Desalination unit 9.9 4.9 �4.9 �9.9Water tank 3.0 1.5 �1.5 �3.0Gasoline fuel �10.7 �5.4 5.4 10.7Diesel fuel �72.0 �35.7 37.3 73.7Interest rate 84.5 39.8 �35.5 �67.3Potable water �59.9 �29.9 29.9 59.9
Table 5Parameters for MCS for year 2011 and in parenthesis for year 2015.
Parameter Unit Distribution Minimum Mode Maximum
Gasoline fuel €/l Triangular 1.60 (1.40) 1.68 (1.62) 2.00 (2.50)Diesel fuel €/l Triangular 1.35 (1.20) 1.42 (1.36) 1.70 (2.00)Fuel cell €/300 W Triangular 1200 (500) 1440 (800) 2000 (1500)Electrolyzer unit €/700 W Triangular 9000 (5000) 10,200 (6500) 13,000 (10,000)Metal hydride tank €/8.5 Nm3 H2 Triangular 9500 (2500) 10,100 (4750) 11,500 (10,000)Interest rate – Uniform 0.04 (0.04) N/A 0.08 (0.08)Potable water €/m3 Uniform 2 (2) N/A 10 (10)PV array with inverter €/kWp Uniform 3500 (1500) N/A 4200 (2200)Battery bank €/(1000 Ah/48 V) Uniform 11,000 (9000) N/A 12,500 (11,000)Hybrid scooter € Uniform 9000 (3000) N/A 11,000 (6000)
Fig. 10. NPV cumulative distribution curves.
G. Kyriakarakos et al. / Applied Energy 88 (2011) 4517–4526 4525

Author's personal copy
modular, it can be upgraded in the future adding more powersources and because it allows the distribution of power genera-tion sources to be installed at any location covered by themicrogrid. A polygeneration microgrid offers a higher autonomydegree, because it also produces fuel for transportation andpotable water onsite as well.� The risk for investor’s funds to present negative returns is low
for the time being (10%) and it is practically eliminated in themedium term.� One disadvantage of the polygeneration approach could be the
increased complexity of the system. It is however feasible toinstall such a microgrid even today using market availablecomponents.� For future research work it is important to investigate the
design of a hierarchical and intelligent supervisory decision-making system for the energy management of such a polygen-eration microgrid and field test it in the experimental microgridat AUA.
References
[1] Buran B, Butler L, Currano A, Smith E, Tung W, Cleveland K, et al.Environmental benefits of implementing alternative energy technologies indeveloping countries. Appl Energy 2003;76:89–100.
[2] Kaldellis JK, Zafirakis D, Kondili E. Optimum sizing of photovoltaic-energystorage systems for autonomous small islands. Int J Electr Power Energy Syst2010;32:24–36.
[3] Manolakos D, Papadakis G, Papantonis D, Kyritsis S. A stand-alone photovoltaicpower system for remote villages using pumped water energy storage. Energy2004;29:57–69.
[4] Zoulias EI, Glockner R, Lymberopoulos N, Tsoutsos T, Vosseler I, Gavalda O,et al. Integration of hydrogen energy technologies in stand-alone powersystems analysis of the current potential for applications. Renew Sust EnergyRev 2006;10:432–62.
[5] Mohamed ES, Papadakis G. Design, simulation and economic analysis of astand-alone reverse osmosis desalination unit powered by wind turbines andphotovoltaics. Desalination 2004;164:87–97.
[6] Kaldellis JK, Kavadias KA, Kondili E. Renewable energy desalination plants forthe Greek islands–technical and economic considerations. Desalination2004;170:187–203.
[7] Nejat Veziroglu T. The fusion-hydrogen energy system. Appl Energy1994;47:227–49.
[8] Connolly D, Lund H, Mathiesen BV, Leahy M. The first step towards a 100%renewable energy-system for Ireland. Appl Energy 2011;88:502–7.
[9] Dell RM, Bridger NJ. Hydrogen–The ultimate fuel. Appl Energy 1975;1:279–92.[10] Botzung M, Chaudourne S, Gillia O, Perret C, Latroche M, Percheron-Guegan A,
et al. Simulation and experimental validation of a hydrogen storage tank withmetal hydrides. Int J Hydrogen Energy 2008;33:98–104.
[11] Conte M, Prosini PP, Passerini S. Overview of energy/hydrogen storage: state-of-the-art of the technologies and prospects for nanomaterials. Mater Sci Eng B2004;108:2–8.
[12] Llaria A, Curea O, Jiminez J, Camblong H. Survey on microgrids: Unplannedislanding and related inverter control techniques. Renew Energy2011;36:2052–61.
[13] Manfren M, Caputo P, Costa G. Paradigm shift in urban energy systems throughdistributed generation: methods and models. Appl Energy 2011;88:1032–48.
[14] Markvart T. Microgrids: Power systems for the 21st Century? Refocus2006;7:44–8.
[15] Nema P, Nema RK, Rangnekar S. A current and future state of art developmentof hybrid energy system using wind and PV-solar: a review. Renew SustEnergy Rev 2009;13:2096–103.
[16] Chicco G, Mancarella P. Distributed multi-generation: a comprehensive view.Renew Sust Energy Rev 2009;13:535–51.
[17] Bruno JC, Ortega-López V, Coronas A. Integration of absorption cooling systemsinto micro gas turbine trigeneration systems using biogas: case study of asewage treatment plant. Appl Energy 2009;86:837–47.
[18] Song H, Starfelt F, Daianova L, Yan J. Influence of drying process on thebiomass-based polygeneration system of bioethanol, power and heat. ApplEnergy 2011. doi:10.1016/j.apenergy.2011.02.019.
[19] Rubio-Maya C, Uche-Marcuello J, Martínez-Gracia A, Bayod-Rújula AA. Designoptimization of a polygeneration plant fuelled by natural gas and renewableenergy sources. Appl Energy 2011;88:449–57.
[20] Li H, Hong H, Jin H, Cai R. Analysis of a feasible polygeneration system forpower and methanol production taking natural gas and biomass as materials.Appl Energy 2010;87:2846–53.
[21] Kyriakarakos G, Mohamed T, Papadakis G. Polygeneration smartgrids: asolution for the supply of electricity, potable water and hydrogen as fuel fortransportation in remote areas. In: 5th European conference PV-hybrid andmini-grid. Tarragona, Spain; 2010.
[22] Kyriakarakos G, Mohamed E, Papadakis G. A pilot polygeneration microgrid forcovering the needs of remote regions in electricity, potable water and fuel. In:1st Smartgrids and mobility conference. Würzburg, Germany; 2009.
[23] Poulek V, Libra M. A very simple solar tracker for space and terrestrialapplications. Sol Energy Mater Sol Cells 2000;60:99–103.
[24] Lin B. Conceptual design and modeling of a fuel cell scooter for urban Asia. JPow Sources 2000;86:202–13.
[25] Ulleberg Ø. The importance of control strategies in PV-hydrogen systems. SolEnergy 2004;76:323–9.
[26] Zhou K, Ferreira JA, de Haan SWH. Optimal energy management strategy andsystem sizing method for stand-alone photovoltaic-hydrogen systems. Int JHydrogen Energy 2008;33:477–89.
[27] Engler F, Meinhardt M, Rothert M, Wollny M. New generation of V/f-staticscontrolled battery inverter sunny Island – the key component for AC coupledhybrid systems and mini grids. In: 14th International photovoltaic science andengineering conference (PVSEC-14). Bangkok, Thailand; 2004.
[28] Moix Pierre-Olivier, Claude R. Partial AC-coupling in minigrids. In: 5thEuropean conference PV-Hybrid and mini-grid. Tarragona, Spain; 2010.
[29] Solar Energy Laboratory, University of Wisconsin, TRNSYS. c2011 [updated11.01.11; cited 10.02.11] <http://sel.me.wisc.edu/TRNSYS>.
[30] The Regents of the University of California (through Lawrence BerkeleyNational Laboratory), GenOpt. c1998-2010 [updated 26.04.10; cited 10.02.11]http://simulationresearch.lbl.gov/GO/>.
[31] Thermal Energy System Specialists, TESS Libraries. c2008 [cited 10.02.11]<http://www.tess-inc.com/trnsys>.
[32] Hazra J, Sihha AK. Environmental constrained economic dispatch usingbacteria foraging optimization. In: Joint international conference on powersystems technology and IEEE power india conference 2008. New Delhi, India;2008. p. 1–6.
[33] Lovberg M, Krink T. Extending particle swarm optimization with self-organized critically. In: 4th Congress evolutionary computation. Honolulu,Hawaii, USA: IEEE; 2002. p. 1588–93.
[34] Yamin HY. Dynamic optimal power flow using interior point method andbenders decomposition considering active and reactive constraints. ElectricPow Compon Syst 2006;34:1377–93.
[35] Valle Y, Harley RG, Venayagamoorthy GK. Comparison of enhanced-PSO andclassical optimization methods: a case study for STATCOM placement. In: 15thInternational conference on intelligent system applications to power systems.Curitiba, Brazil; 2009. p. 1–7.
[36] Yorino N, El-Araby EE, Sasaki H, Harada S. A new formulation for FACTSallocation for security enhancement against voltage collapse. Pow Eng Rev,IEEE 2002;22:68.
[37] Lee W-S, Chen YT, Wu T-H. Optimization for ice-storage air-conditioningsystem using particle swarm algorithm. Appl Energy 2009;86:1589–95.
[38] Kornelakis A. Multiobjective particle swarm optimization for the optimaldesign of photovoltaic grid-connected systems. Sol Energy 2010;84:2022–33.
[39] El-Zonkoly AM. Optimal placement of multi-distributed generation unitsincluding different load models using particle swarm optimization. SwarmEvolut Comput 2011;1:50–9.
[40] Avril S, Arnaud G, Florentin A, Vinard M. Multi-objective optimization ofbatteries and hydrogen storage technologies for remote photovoltaic systems.Energy 2010;35:5300–8.
[41] Boonbumroong U, Pratinthong N, Thepa S, Jivacate C, Pridasawas W. Particleswarm optimization for AC-coupling stand alone hybrid power systems. SolEnergy 2011;85:560–9.
[42] Eberhart R, Kennedy J. A new optimizer using particle swarm theory. MicroMachine and Human Science; 1995.
[43] Kennedy J, Eberhart RC. A discrete binary version of the particle swarmalgorithm. In: IEEE international conference on systems, man, and cybernetics,1997 ‘computational cybernetics and simulation’, vol. 5; 1997. p. 4104–8.
[44] Yu S, Tao J. Economic, energy and environmental evaluations of biomass-basedfuel ethanol projects based on life cycle assessment and simulation. ApplEnergy 2009;86:S178–88.
[45] Winston WL. Operations research: applications and algorithms. DuxburyPress; 1991.
[46] Schade B, Wiesenthal T. Biofuels: A model based assessment under uncertaintyapplying the Monte Carlo method. J Policy Model 2011;33:92–126.
[47] Hoffmann W. PV solar electricity industry: market growth and perspective. SolEnergy Mater Sol Cells 2006;90:3285–311.
[48] Khan MJ, Iqbal MT. Pre-feasibility study of stand-alone hybrid energy systemsfor applications in Newfoundland. Renew Energy 2005;30:835–54.
4526 G. Kyriakarakos et al. / Applied Energy 88 (2011) 4517–4526