Only connect: Microgrids for Distribution System Restoration
12
70 IEEE power & energy magazine january/february 2014 1540-7977/14/$31.00©2014IEEE Digital Object Identifier 10.1109/MPE.2013.2286317 Date of publication: 17 December 2013 E ELECTRICITY INFRASTRUCTURE IS THE CORNERSTONE OF EVERY INDUS- trialized nation in the world. As the utility grid ages and the demand for electricity grows, the impact of major interruptions of the electricity infrastructure will be more intense. Costly power outages throughout the world caused by natural disasters such as floods and hurricanes have highlighted the importance of reinforcing the electricity infrastructure. A recent study conducted for the U.S. Department of Energy indicated that sustained power interruptions (those lasting more than 5 min) in the United States incur costs of more than US$26 billion dollars annually. Power outages caused by Hurricanes Sandy and Katrina in the United States threw into notice the crucial role of smart grid technology and the need for further investments in more comprehensive data communication and distribution Only Connect By Liang Che, Mohammad Khodayar, and Mohammad Shahidehpour
Transcript of Only connect: Microgrids for Distribution System Restoration

70 ieee power & energy magazine january/february 20141540-7977/14/$31.00©2014IEEE
Digital Object Identifier 10.1109/MPE.2013.2286317
Date of publication: 17 December 2013
EElEctricity infrastructurE is thE cornErstonE of EvEry indus-trialized nation in the world. as the utility grid ages and the demand for electricity grows, the impact of major interruptions of the electricity infrastructure will be more intense. costly power outages throughout the world caused by natural disasters such as floods and hurricanes have highlighted the importance of reinforcing the electricity infrastructure. a recent study conducted for the u.s. department of Energy indicated that sustained power interruptions (those lasting more than 5 min) in the united states incur costs of more than us$26 billion dollars annually. Power outages caused by hurricanes sandy and Katrina in the united states threw into notice the crucial role of smart grid technology and the need for further investments in more comprehensive data communication and distribution
Only Connect
By Liang Che, Mohammad Khodayar, and Mohammad Shahidehpour

january/february 2014 ieee power & energy magazine 71
image licensed by ingram publishing
Microgrids for Distribution System Restoration
management systems, distributed energy resources, energy storage facilities, additional automation, and further migration toward decentralized operations for the largely central-ized power grid.
hurricane sandy left approximately 7.5 million customers without power across 15 states and Washington, d.c., after it hit the eastern shore of the united states. authori-ties announced that restoring the power to the new york city transit system was the biggest challenge to that city. a few days after sandy, there were still nearly 3 million customers in new Jersey and new york without power and 700,000 more customers whose daily lives were distracted by power outages in 11 other states, from Massachu-setts to virginia and as far west as Michigan. as the result of electric power shortages in Manhattan, people walked to coffee shops that still had power to charge their cell phones. the electric supply deficiency in new Jersey disabled gas stations, as the fuel pumps were out of power. Even when fuel was available, many residents lined up for hours to get fuel for home generators. in a similar situation, connecticut residents in 2011 suffered intense power outages from the effects of tropical storm irene followed by an october snowstorm that downed thousands of trees, left several towns without
72 ieee power & energy magazine january/february 2014
power for almost two weeks, and cost towns millions of dollars. the widespread power outages in the wake of hur-ricane sandy cast light on the weakness of a centralized electric power system and highlighted the benefits of dis-tributed control of distribution systems.
it is well understood that the destructive power of storms can spread through the utility grid much quicker, farther, and wider than single faults. the transmission grid in the united states has been continually struck by major outages caused by cascading failures, such as the 2003 blackout that knocked out power to 60 million people in the northeast and most recently the september 2011 blackout in the territory of san diego Gas & Electric, which shut down all of south-ern california around san diego. the transmission grid is designed to prevent these cascading failures, but they seem to happen with a regularity that disproves the expressed assurances about the efficacy of the technological safe-guards already in place.
as the utility grid remains quite vulnerable and exposed to natural disasters, it is understood that there is no way to completely protect citizens and towns against extreme conditions such as flooding, wind gusts, heavy storms and rains, downed trees, and flying debris. rather than protect-ing the system from storms like sandy, the power indus-try has therefore focused on ways of restoring the system quickly after disasters. however, the repair of damaged equipment and a complete system restoration after a major storm can take months, and expert information regarding the operation and maintenance of a power system that spans many square miles could play a major role in identifying trouble spots, repairing critical equipment, and restoring power after such disasters.
Conventional Service Restoration Strategiesthe limited operating margins embedded in centralized power systems have increased the risk of system collapse and power blackouts resulting from natural disasters. after blackouts, restoration processes are initiated to maximize load restoration within a minimum elapsed time, taking into account operating conditions and the need to manage system security. in such cases, the individual characteristics of regional power systems determine the specific restora-tion procedures, which are often developed using heuristic methods that reflect human experiences along with numeri-cal simulations. the procedures usually include step-by-step guidelines for system operators.
in every major disaster, healthy sections of power dis-tribution networks may also be deenergized, which leads to additional customer interruptions. to reduce the chance of deenergizing healthy sections, power utilities resort to switching sequences, alternative resources and substa-tions, and additional pathways to supply electricity to the deenergized healthy sections without violating operat-ing constraints. however, tighter operating constraints in
centralized distribution systems may limit the feasibility of restoration procedures at individual load points.
traditionally, most utilities initiate fault detection and system restoration after receiving calls from customers who experience power outages. the distribution utility sends out a field crew to investigate fault locations and find the most feasible switching scheme to isolate the faults and restore services to affected customers as quickly as possible while repairing faulty feeders. But automation can speed up restoration, especially with large distribu-tion systems. By employing smart grid technologies, some utilities have made the process of fault detection and healing 50% faster. smart meters can send reports automatically to the outage management system, which is quicker than having a person call in and overcomes any possible communication barriers. checking for restored service from central offices via smart meters also creates time and personnel savings. in addition, feeder-switching devices equipped with intelligent electronic devices for protection and control applications have been developed to provide feeder automation. the automated capabilities of these devices include measurement, monitoring, con-trol, and communication, which all facilitate automated fault identification, isolation, and power restoration. for example the intelliteam sG automation restoration system can search for possible power sources so as to maximize the number of restored customers after an outage in the shortest possible time, with due consideration given to the limitations of distributed energy resources (dErs) con-nected to the distribution systems.
feeder automation alters the topological structure of feed-ers by changing the status of switches under contingencies in distribution networks. When the system suffers a sustained fault and the switch located upstream of the fault opens, the feeder automation selectively isolates the fault and restores power to as many loads as possible in order to decrease the interruption indices of the distribution system and customers and reduce the duration and magnitude of power outages dur-ing the fault troubleshooting. With an adequate network com-munication structure, automated fault detection and isolation are relatively unchallenging. But automatic power restora-tion is still a challenging task because of practical issues in identifying a feasible and optimal restoration plan, includ-ing load balancing and operating constraints. in a nutshell, smart grids are about reacting to storms and outages and limiting the amount and severity of power outages. another tool—microgrids—is about stopping power outages from the get-go.
The Emergence of Microgridsthe advent of modern distribution networks with dErs has changed the service restoration paradigm. such distribu-tion networks are equipped with local generation sources that behave like virtual power plants and active loads that provide ancillary services such as frequency and voltage
january/february 2014 ieee power & energy magazine 73
support and service restoration to the utility. under such conditions, the operation of the distribution network neces-sitates enhanced protocols for communication at all levels of the distribution system to assist distribution management system (dMs) operators with real-time decisions.
smart distribution systems establish microgrids and apply smart grid to the establishments for managing 1) dErs and storage technologies, 2) demand-responsive proactive con-sumers, and 3) decentralized control of energy resources and distribution feeders resulting from the formation of microgrids. Microgrids are often connected to distribution feeders and offer load and generation control to provide continuity of supply in the event of utility grid disturbances. such microgrid control has a hierarchical structure for enhancing the security, controllability, and flexibility of dis-tribution network operations. Microgrids can be operated in a grid-connected mode, in which their loads are partially supplied by the distribution system, or in an island mode, in which the local generation supplies the entire microgrid load in case of a major outage at the utility distribution system. a microgrid has its own energy management system for the control of its dErs and for devising demand-response strat-egies. as a result, a microgrid can behave as an active load in a distribution network that can also be isolated from the rest of network. By incorporating available microgrids in load restoration procedures, the distribution utility can improve its load restoration capability and further enhance distribu-tion system reliability.
in a modern distribution system, microgrids are regarded as reliable alternatives to more traditional methods of restor-ing deenergized areas of distribution systems and providing secure energy resources to local entities until the utility grid is restored. a decentralized power grid can use microgrids to isolate a neighborhood in the event of disasters and serve critical systems and buildings like data centers, hospital
communities, and campuses by utilizing local generation and storage facilities.
the technologies incorporated in microgrids are develop-ing, and real-world examples have been deployed in various countries. honeywell’s White oaks project in Maryland is an example of deployed microgrids in the united states; the microgrid supplied power to local systems during a sum-mer storm in 2012. synergetic thinking is a crucial part of improving the economics of microgrids and lowering the cost of energy in general rather than focusing only on elec-tricity. up-front planning for serving customer loads could increase microgrid energy efficiency to more than 75%. depending on its capacity, a microgrid can provide ancillary services such as frequency and voltage support by injecting power into the grid. the sendai 1-MW microgrid at tohoku fukushi university in Japan is an example of a university microgrid. it operated for two days in island mode during the March 2011 earthquake and tsunami while the surround-ing region was without power. their unique characteristics make microgrids suitable candidates for service restoration duty in power distribution networks.
Distribution System Service Restoration Using Microgridscurrent operating practices require dEr units to be promptly disconnected in any disturbances and be recon-nected once the distribution system is energized and rated voltages and frequency have been restored. however, active management strategies in microgrids could lead to distrib-uted control in island mode, which may not require the disconnection of microgrid dErs in a major disturbance. in blackouts, distribution system downtime can be reduced by providing a fast blackstart of local generation resources in island operation. a microgrid that has remained fully functional and lies in the restoration path can be started
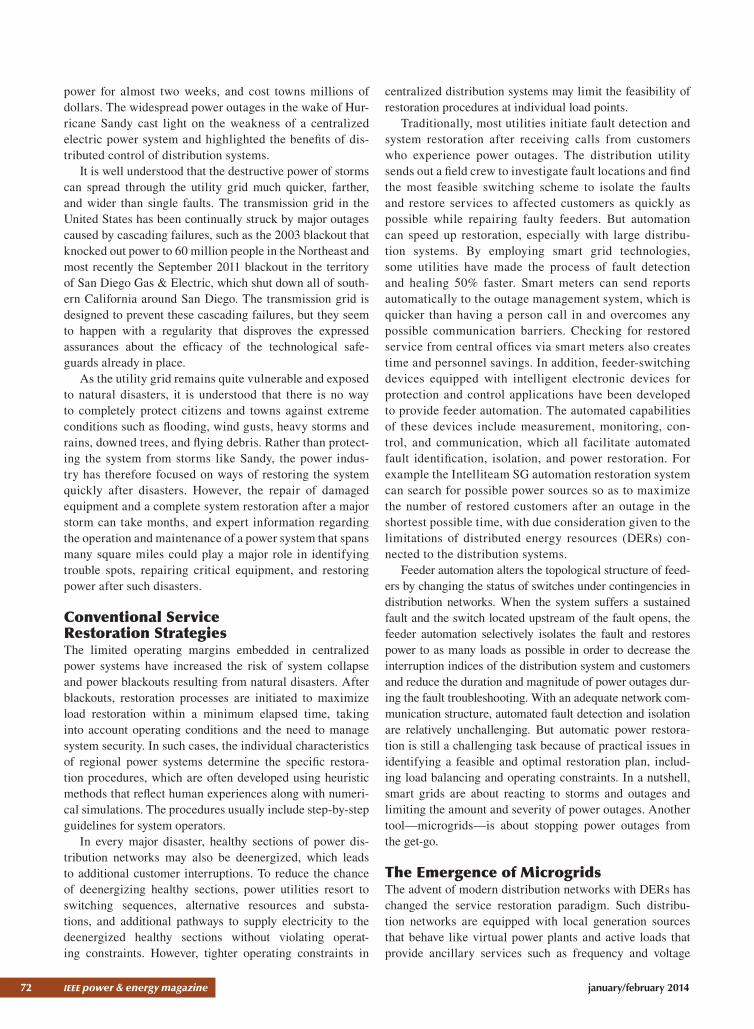
figure 1. Hierarchical control of a distribution system with multimicrogrids.
Utility GridDMS
Microgrid Microgrid Microgrid Microgrid
Tertiary
Secondary
Primary
Tertiary
Secondary
Primary
Tertiary
Secondary
Primary
Tertiary
Secondary
Primary
74 ieee power & energy magazine january/february 2014
in island mode to supply its loads. But if the microgrid has been partly damaged during a natural disaster and has been deenergized along with other distribution system compo-nents in the restoration path, the microgrid master con-troller can quickly assess the damage situation and restore service to critical loads within the microgrid by utilizing local dEr units with black-start capability.
Good coordination between transmission and distribu-tion restoration procedures can enhance system reliability by increasing the amount of restored loads and reducing inter-ruption times. islanded microgrids are capable of providing local self-healing and restoration services in a medium-voltage distribution system. therefore, a conventional (and hopefully timely) strategy can be adopted for transmission system restoration while a quick and concerted service res-toration at the downstream distribution level will allow the restoration of islanded microgrids equipped with local dEr units. in this context, the entire power system restoration can make use of a hierarchical approach that implements a con-ventional top-down procedure starting from the transmission
system as well as a bottom-up strategy starting from the low-voltage distribution system and exploiting the capabilities of microgrids. the two systems (low-voltage microgrids and high-voltage transmission systems) will come together and be synchronized at the medium-voltage distribution level.
in essence, a microgrid can assist distribution system ser-vice restoration processes by providing one or more of the following services:
✔ it can provide islanding from the grid for the local supply of microgrid loads and to reduce the supply provided by the utility grid.
✔ it can help coordinate the reduction of microgrid loads by providing an emergency demand response and curtailing noncritical loads in order to minimize the impact of outages on customers.
✔ it can increase its generation in order to supply local loads and, if possible, provide surplus generation to the utility grid. in order to achieve this, dispatchable dEr units (e.g., diesel generators and microturbines)can increase their dispatch by adjusting generation
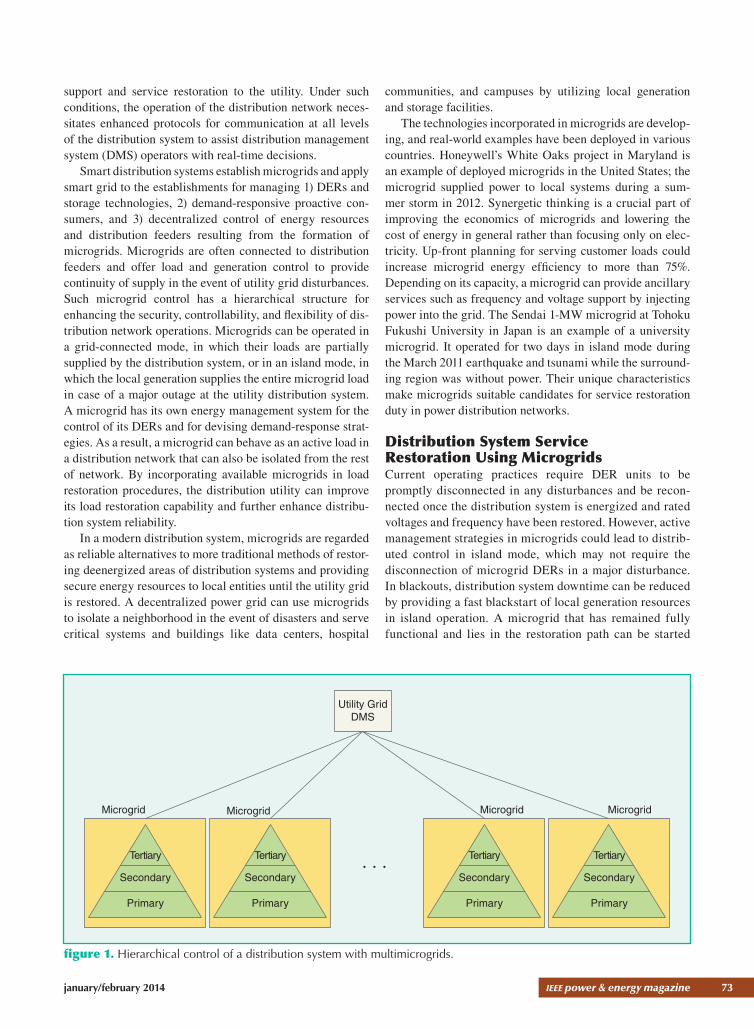
figure 2. Objectives and functions for the operation and control of the IIT microgrid.
IIT Microgrid(Optimal and Reliable Operation)
Economic Operation
Grid Coordination EconomicDemand Response
Secondary Control
Islanding andResynchronization
Self-Healing
Emergency Demand Response
Microgrid Components
Coupling Switchat PCC Building Controllers Gas Turbines Solar PV Primary
Control
Wind TurbineBattery StorageHRDS SwitchesMeters and PMUs
Control MonitoringSet Points
Short-Term Reliability
Tertiary Control
january/february 2014 ieee power & energy magazine 75
set points while nondispatchable dEr units (such as solar panels and wind turbines) can supply local microgrid loads according to the available renewable resource capacity.
a distribution system could consist of a multimicrogrid system made up of several microgrids, each equipped with dEr units connected through power electronic interfaces and storage devices to provide balancing service to a wider area during blackouts. a controllable set of multimicrogrids, as shown in figure 1, would use a hierarchical control scheme for both normal and emergency conditions. the management in multimicrogrids is done by the dMs, and the dMs will receive control signals from medium-voltage networks and individual microgrid master controllers. the dMs will perform optimization and send proper signals to individual microgrids for load sharing and maintaining rated voltages and frequencies in multimicrogrid operations.
Operation and Control of a Microgrid for Service Restoration in the following sections, we discuss the operation and con-trol of a microgrid and present islanding, load restoration, and resynchronization processes in the medium-voltage dis-tribution network at illinois institute of technology (iit).
figure 2 illustrates microgrid functions and the control tasks associated with each function. the iit microgrid is connected to the local utility grid through its north and south substations, which act as the point of common cou-pling (Pcc). the short-term reliability algorithm in fig-ure 2, applied at the microgrid master controller, considers seamless islanding and resynchronization and applying emergency demand response and self-healing in the case of a major outage on either side of the Pcc. the economic opera-tion depicted in figure 2 addresses the optimal generation scheduling of dEr units in both grid-connected and island modes and applies economic demand response to minimize operational cost. functionally, a three-level hierarchical control is applied to the iit microgrid, including primary, secondary, and tertiary control, as shown in figure 2.
conceived of in this way, the three control levels in microgrids include:
✔ primary control, which is based on the droop charac-teristics of dEr units for sharing the microgrid load
✔ secondary control, which performs corrective action to mitigate frequency and voltage errors introduced by droop control
✔ tertiary control, which manages the flow between the microgrid and the utility grid and provides the optimal scheduling of dEr units and demands for both islanded and grid-connected operation of the microgrid and also provides ancillary services to the utility grid, including voltage and frequency regula-tion and restoration services.
Primary control is performed at the dEr level, using the local component information. the master controller
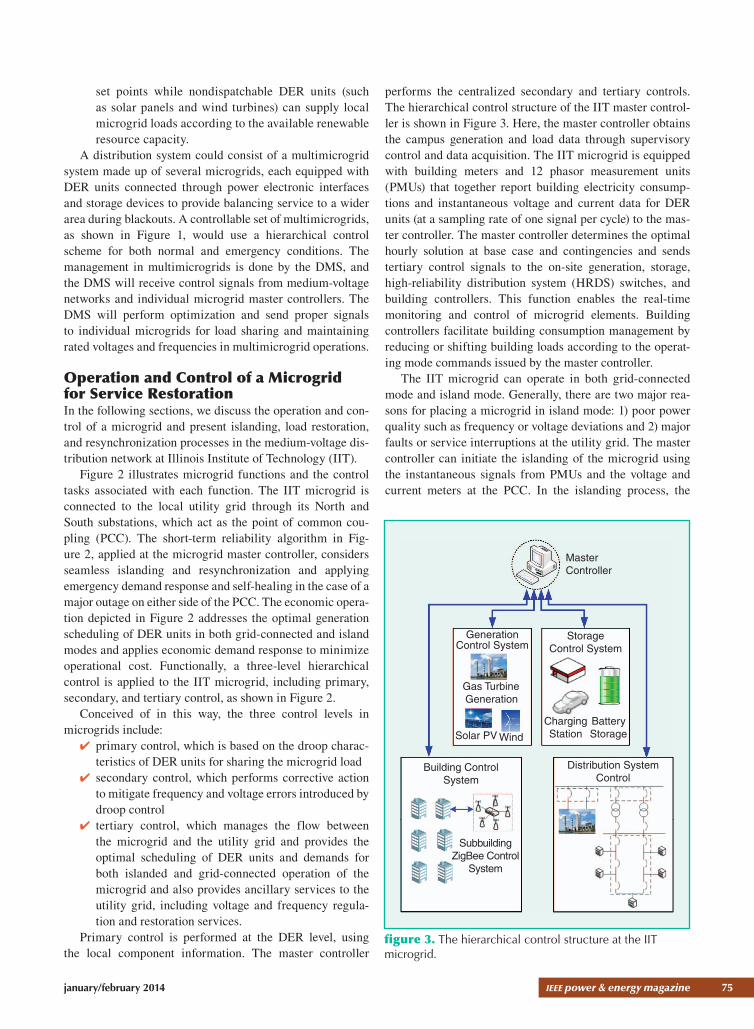
performs the centralized secondary and tertiary controls. the hierarchical control structure of the iit master control-ler is shown in figure 3. here, the master controller obtains the campus generation and load data through supervisory control and data acquisition. the iit microgrid is equipped with building meters and 12 phasor measurement units (PMus) that together report building electricity consump-tions and instantaneous voltage and current data for dEr units (at a sampling rate of one signal per cycle) to the mas-ter controller. the master controller determines the optimal hourly solution at base case and contingencies and sends tertiary control signals to the on-site generation, storage, high-reliability distribution system (hrds) switches, and building controllers. this function enables the real-time monitoring and control of microgrid elements. Building controllers facilitate building consumption management by reducing or shifting building loads according to the operat-ing mode commands issued by the master controller.
the iit microgrid can operate in both grid-connected mode and island mode. Generally, there are two major rea-sons for placing a microgrid in island mode: 1) poor power quality such as frequency or voltage deviations and 2) major faults or service interruptions at the utility grid. the master controller can initiate the islanding of the microgrid using the instantaneous signals from PMus and the voltage and current meters at the Pcc. in the islanding process, the
MasterController
GenerationControl System
StorageControl System
Gas TurbineGeneration
Solar PV Wind
ChargingStation
BatteryStorage
Building ControlSystem
SubbuildingZigBee Control
System
Distribution SystemControl
figure 3. The hierarchical control structure at the IIT microgrid.
76 ieee power & energy magazine january/february 2014
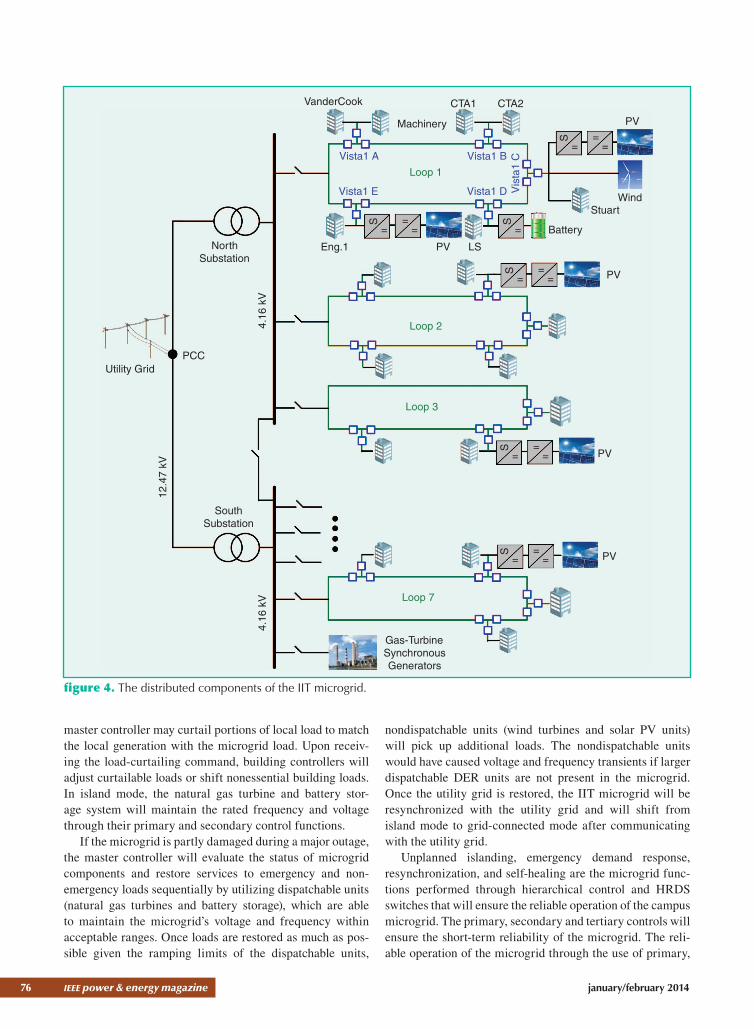
master controller may curtail portions of local load to match the local generation with the microgrid load. upon receiv-ing the load-curtailing command, building controllers will adjust curtailable loads or shift nonessential building loads. in island mode, the natural gas turbine and battery stor-age system will maintain the rated frequency and voltage through their primary and secondary control functions.
if the microgrid is partly damaged during a major outage, the master controller will evaluate the status of microgrid components and restore services to emergency and non-emergency loads sequentially by utilizing dispatchable units (natural gas turbines and battery storage), which are able to maintain the microgrid’s voltage and frequency within acceptable ranges. once loads are restored as much as pos-sible given the ramping limits of the dispatchable units,
nondispatchable units (wind turbines and solar Pv units) will pick up additional loads. the nondispatchable units would have caused voltage and frequency transients if larger dispatchable dEr units are not present in the microgrid. once the utility grid is restored, the iit microgrid will be resynchronized with the utility grid and will shift from island mode to grid-connected mode after communicating with the utility grid.
unplanned islanding, emergency demand response, resynchronization, and self-healing are the microgrid func-tions performed through hierarchical control and hrds switches that will ensure the reliable operation of the campus microgrid. the primary, secondary and tertiary controls will ensure the short-term reliability of the microgrid. the reli-able operation of the microgrid through the use of primary,
VanderCook CTA2CTA1
Machinery
Vista1 A
Vis
ta1
C
Vista1 E
Vista1 B
Vista1 D
Loop 1
Loop 2
Loop 3
Loop 7
PV
WindStuart
Battery
PV LSEng.1NorthSubstation
PCCUtility Grid
SouthSubstation
Gas-TurbineSynchronousGenerators
4.16
kV
12.4
7 kV
4.16
kV
PV
PV
PVS
=
S
=
==
S
==
=
S
==
=
S
==
=
S
==
=
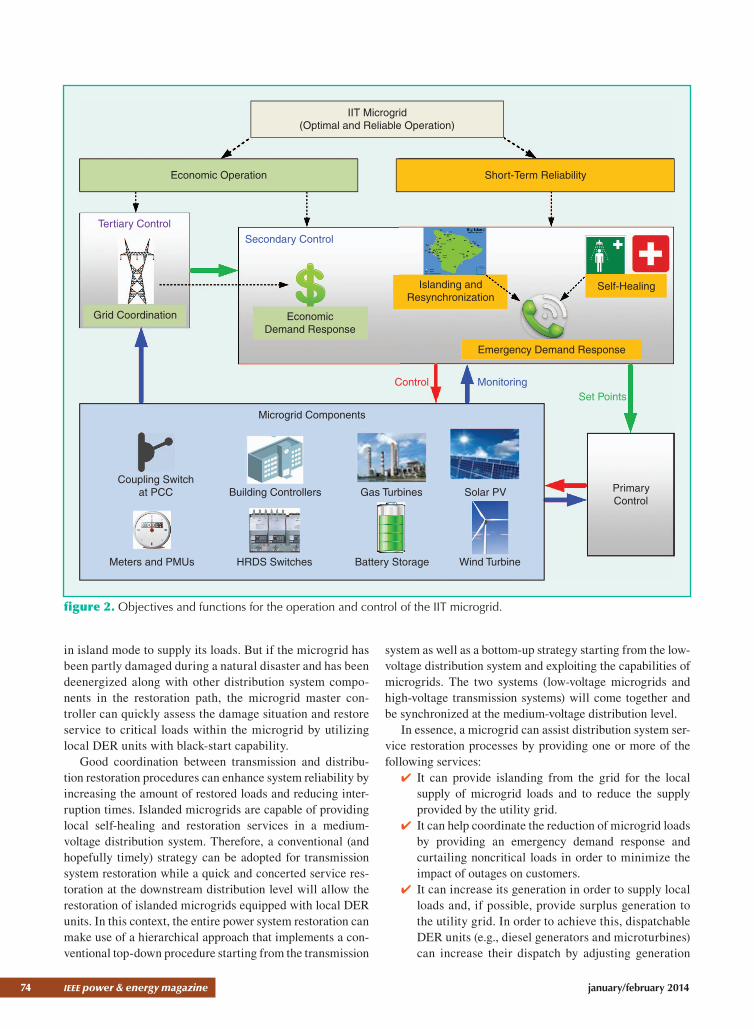
figure 4. The distributed components of the IIT microgrid.
january/february 2014 ieee power & energy magazine 77
secondary and tertiary control signals in a restoration path is described using the following three cases as examples.
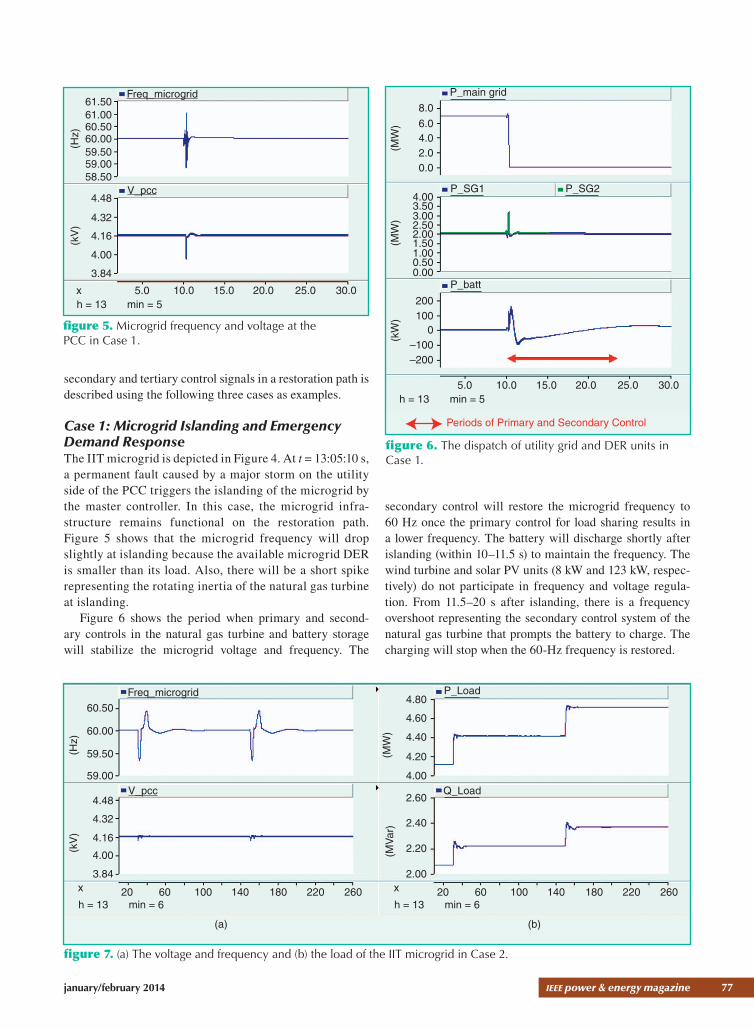
Case 1: Microgrid Islanding and Emergency Demand Responsethe iit microgrid is depicted in figure 4. at t = 13:05:10 s, a permanent fault caused by a major storm on the utility side of the Pcc triggers the islanding of the microgrid by the master controller. in this case, the microgrid infra-structure remains functional on the restoration path. figure 5 shows that the microgrid frequency will drop slightly at islanding because the available microgrid dEr is smaller than its load. also, there will be a short spike representing the rotating inertia of the natural gas turbine at islanding.
figure 6 shows the period when primary and second-ary controls in the natural gas turbine and battery storage will stabilize the microgrid voltage and frequency. the
secondary control will restore the microgrid frequency to 60 hz once the primary control for load sharing results in a lower frequency. the battery will discharge shortly after islanding (within 10–11.5 s) to maintain the frequency. the wind turbine and solar Pv units (8 kW and 123 kW, respec-tively) do not participate in frequency and voltage regula-tion. from 11.5–20 s after islanding, there is a frequency overshoot representing the secondary control system of the natural gas turbine that prompts the battery to charge. the charging will stop when the 60-hz frequency is restored.
Freq_microgrid
V_pcc
61.5061.0060.5060.00
(Hz)
59.50
58.50
4.48
4.32
4.16
4.00
3.84
(kV
)
59.00
x 5.0h = 13 min = 5
10.0 15.0 20.0 25.0 30.0
figure 5. Microgrid frequency and voltage at the PCC in Case 1.
P_main grid
P_SG1 P_SG2
P_batt
8.0
6.04.02.00.0
4.003.50
2.503.00
2.001.50
0.500.00
200100
–100–200
0
1.00
(MW
)(M
W)
(kW
)5.0
h = 13 min = 5
Periods of Primary and Secondary Control
10.0 15.0 20.0 25.0 30.0
figure 6. The dispatch of utility grid and DER units in Case 1.
figure 7. (a) The voltage and frequency and (b) the load of the IIT microgrid in Case 2.
Freq_microgrid
V_pcc
60.50
60.00
(Hz)
59.50
4.48
4.32
4.16
4.00
3.84
(kV
)
59.00
P_Load4.80
4.60
(MW
) 4.40
2.60
2.40
2.20
2.00
(MV
ar)
4.20
4.00
x 20h = 13 min = 6
60 100 140 180 220 260 x 20h = 13 min = 6
60 100 140 180 220 260
Q_Load
(a) (b)
78 ieee power & energy magazine january/february 2014
immediately after islanding, the master controller provides emergency demand response in order to pre-vent a sustained drop of microgrid frequency and volt-age as the natural gas turbine is faced with a ramping limit. the master controller will send load curtailment
signals through tertiary control to building controllers to curtail the campus load from 11.07 MW and 5.54 Mvar to 4.13 MW and 2.07 Mvar (the amount of load supplied by the natural gas turbine and solar Pv and wind unit before islanding).
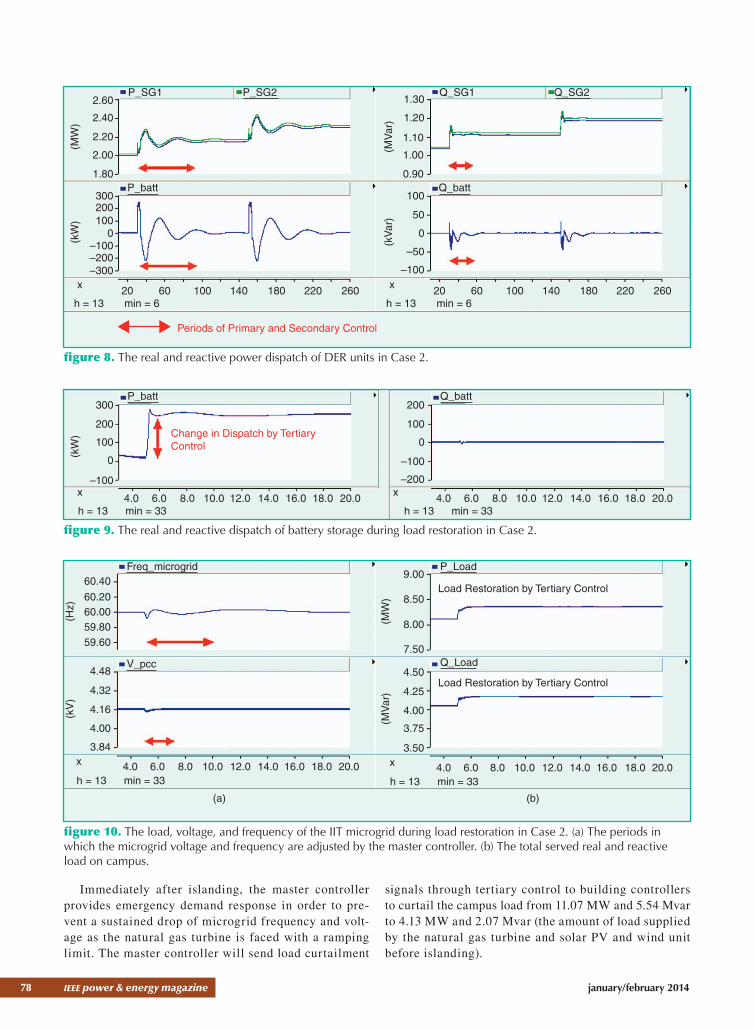
figure 8. The real and reactive power dispatch of DER units in Case 2.
figure 9. The real and reactive dispatch of battery storage during load restoration in Case 2.
figure 10. The load, voltage, and frequency of the IIT microgrid during load restoration in Case 2. (a) The periods in which the microgrid voltage and frequency are adjusted by the master controller. (b) The total served real and reactive load on campus.
P_SG2P_SG12.60
2.40
(MW
)
2.20
300200100
–100–200–300
0
(kW
)
2.00
1.80
1.30
1.20
(MV
ar)
1.10
100
50
0
–50
–100
(kV
ar)
1.00
0.90
x20
h = 13 min = 660 100 140 180 220 260
x20
h = 13 min = 660 100 140 180 220 260
P_batt
Q_SG2Q_SG1
Q_batt
Periods of Primary and Secondary Control
Change in Dispatch by TertiaryControl
300
200
100
–100
0(kW
)
200
100
0
–100
–200
P_batt Q_batt
x4.0
h = 13 min = 336.0 8.0 10.0 12.0 14.0 16.0 18.0 20.0
x4.0
h = 13 min = 336.0 8.0 10.0 12.0 14.0 16.0 18.0 20.0
Freq_microgrid
V_pcc
P_Load
Q_Load
60.40
60.2060.0059.8059.60
4.48
4.32
4.16
4.00
3.84
(Hz)
(kV
)
x 4.0 6.0 8.0 10.0 12.0 14.0 16.0 18.0 20.0h = 13 min = 33
9.00
8.50
8.00
7.50
4.50
4.25
4.00
3.75
3.50
(MW
)(M
Var
)
x 4.0 6.0 8.0 10.0 12.0 14.0 16.0 18.0 20.0h = 13 min = 33
Load Restoration by Tertiary Control
Load Restoration by Tertiary Control
(a) (b)
january/february 2014 ieee power & energy magazine 79
Case 2: Load Restoration in Island Modeonce the rated microgrid frequency and voltage in the res-toration path are stabilized as described above, the master
controller will send signals to building controllers to perform load restoration through tertiary control. figure 7(a) shows that the master controller will send secondary control signals
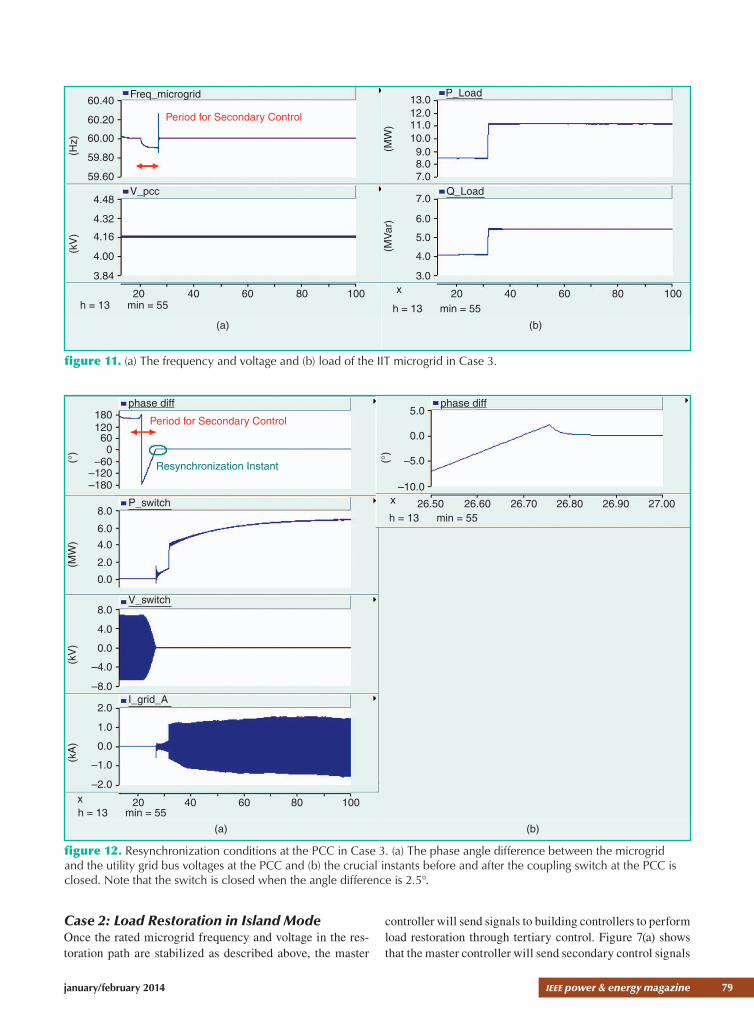
figure 11. (a) The frequency and voltage and (b) load of the IIT microgrid in Case 3.
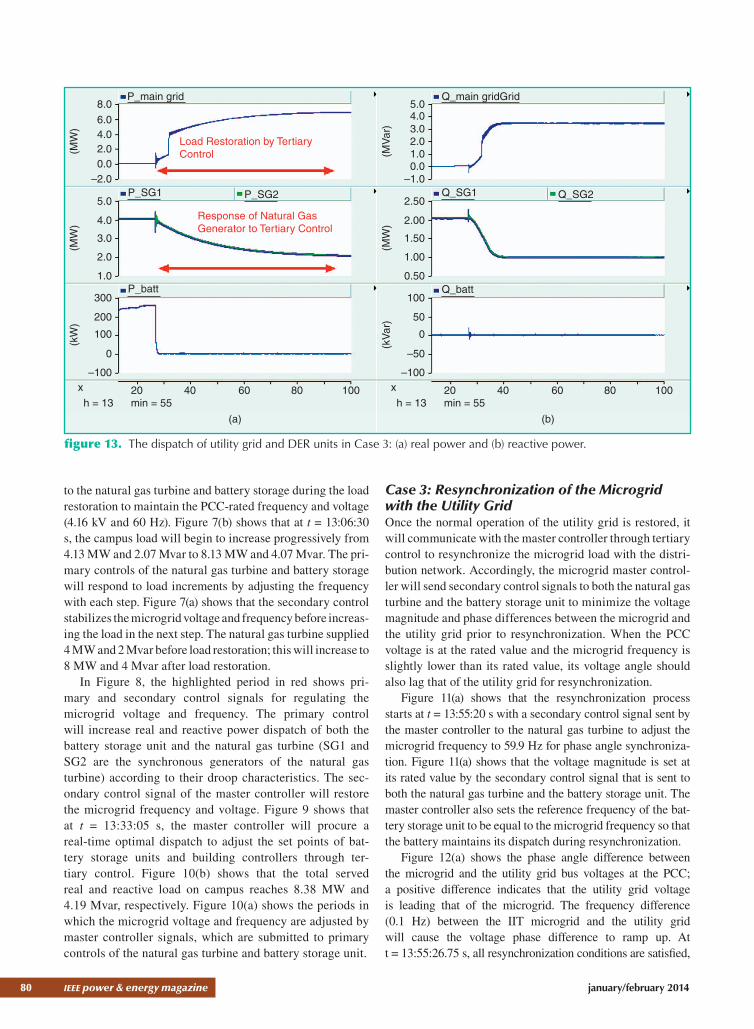
figure 12. Resynchronization conditions at the PCC in Case 3. (a) The phase angle difference between the microgrid and the utility grid bus voltages at the PCC and (b) the crucial instants before and after the coupling switch at the PCC is closed. Note that the switch is closed when the angle difference is 2.5°.
Freq_microgrid
V_pcc
P_Load
Q_Load
60.40
60.20
60.00
59.80
59.60
4.48
4.32
4.16
4.00
3.84
(Hz)
(kV
)
20 40 60 80 100 20 40 60 80 100h = 13 min = 55
13.012.011.010.0
8.09.0
7.0
7.0
6.0
5.0
4.0
3.0
(MW
)(M
Var
)
x
h = 13 min = 55
Period for Secondary Control
(a) (b)
phase diff
P_switch
phase diff
V_switch
I_grid_A
180 5.0
0.0
–5.0
–10.0
Period for Secondary Control
Resynchronization Instant
120600
–60–120–180
8.0
6.0
4.0
2.0
0.0
8.0
4.0
0.0
(kV
)(M
W)
(°)
(°)
–4.0
–8.0
2.0
1.0
0.0
(kA
)
–1.0
–2.0x 20 40 60 80 100
26.50x 26.60 26.70 26.80 26.90 27.00
h = 13 min = 55
h = 13 min = 55
(a) (b)
80 ieee power & energy magazine january/february 2014
to the natural gas turbine and battery storage during the load restoration to maintain the Pcc-rated frequency and voltage (4.16 kv and 60 hz). figure 7(b) shows that at t = 13:06:30 s, the campus load will begin to increase progressively from 4.13 MW and 2.07 Mvar to 8.13 MW and 4.07 Mvar. the pri-mary controls of the natural gas turbine and battery storage will respond to load increments by adjusting the frequency with each step. figure 7(a) shows that the secondary control stabilizes the microgrid voltage and frequency before increas-ing the load in the next step. the natural gas turbine supplied 4 MW and 2 Mvar before load restoration; this will increase to 8 MW and 4 Mvar after load restoration.
in figure 8, the highlighted period in red shows pri-mary and secondary control signals for regulating the microgrid voltage and frequency. the primary control will increase real and reactive power dispatch of both the battery storage unit and the natural gas turbine (sG1 and sG2 are the synchronous generators of the natural gas turbine) according to their droop characteristics. the sec-ondary control signal of the master controller will restore the microgrid frequency and voltage. figure 9 shows that at t = 13:33:05 s, the master controller will procure a real-time optimal dispatch to adjust the set points of bat-tery storage units and building controllers through ter-tiary control. figure 10(b) shows that the total served real and reactive load on campus reaches 8.38 MW and 4.19 Mvar, respectively. figure 10(a) shows the periods in which the microgrid voltage and frequency are adjusted by master controller signals, which are submitted to primary controls of the natural gas turbine and battery storage unit.
Case 3: Resynchronization of the Microgrid with the Utility Gridonce the normal operation of the utility grid is restored, it will communicate with the master controller through tertiary control to resynchronize the microgrid load with the distri-bution network. accordingly, the microgrid master control-ler will send secondary control signals to both the natural gas turbine and the battery storage unit to minimize the voltage magnitude and phase differences between the microgrid and the utility grid prior to resynchronization. When the Pcc voltage is at the rated value and the microgrid frequency is slightly lower than its rated value, its voltage angle should also lag that of the utility grid for resynchronization.
figure 11(a) shows that the resynchronization process starts at t = 13:55:20 s with a secondary control signal sent by the master controller to the natural gas turbine to adjust the microgrid frequency to 59.9 hz for phase angle synchroniza-tion. figure 11(a) shows that the voltage magnitude is set at its rated value by the secondary control signal that is sent to both the natural gas turbine and the battery storage unit. the master controller also sets the reference frequency of the bat-tery storage unit to be equal to the microgrid frequency so that the battery maintains its dispatch during resynchronization.
figure 12(a) shows the phase angle difference between the microgrid and the utility grid bus voltages at the Pcc; a positive difference indicates that the utility grid voltage is leading that of the microgrid. the frequency difference (0.1 hz) between the iit microgrid and the utility grid will cause the voltage phase difference to ramp up. at t = 13:55:26.75 s, all resynchronization conditions are satisfied,
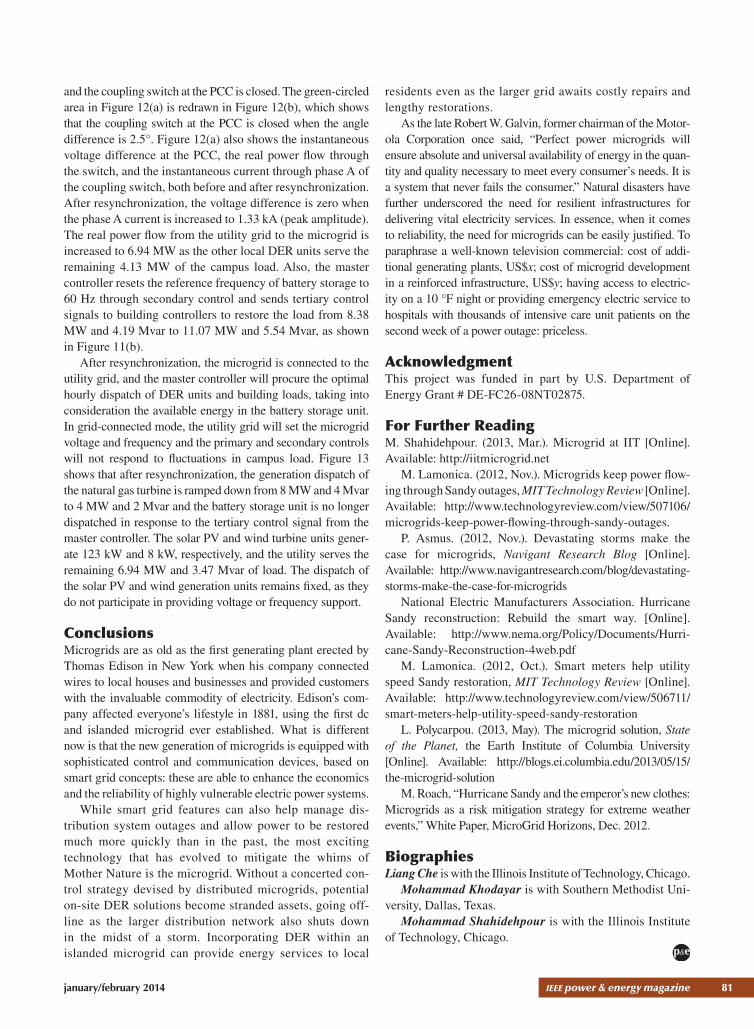
figure 13. The dispatch of utility grid and DER units in Case 3: (a) real power and (b) reactive power.
P_SG1
Q_main gridGrid
P_batt Q_batt
P_SG2 Q_SG1 Q_SG2
P_main grid8.0
6.04.02.0
–2.0
5.0
4.0
3.0
2.0
1.0
300
200
100
0
–100
0.0
5.04.03.02.0
–1.0
2.50
2.00
1.50
1.00
0.50
100
50
0
–50
–100
0.01.0(M
W)
(MW
)(k
W)
(MV
ar)
(MW
)(k
Var
)x 20h = 13 min = 55
40 60 80 100 x 20h = 13 min = 55
40 60 80 100
Load Restoration by TertiaryControl
Response of Natural GasGenerator to Tertiary Control
(a) (b)
january/february 2014 ieee power & energy magazine 81
and the coupling switch at the Pcc is closed. the green-circled area in figure 12(a) is redrawn in figure 12(b), which shows that the coupling switch at the Pcc is closed when the angle difference is 2.5°. figure 12(a) also shows the instantaneous voltage difference at the Pcc, the real power flow through the switch, and the instantaneous current through phase a of the coupling switch, both before and after resynchronization. after resynchronization, the voltage difference is zero when the phase a current is increased to 1.33 ka (peak amplitude). the real power flow from the utility grid to the microgrid is increased to 6.94 MW as the other local dEr units serve the remaining 4.13 MW of the campus load. also, the master controller resets the reference frequency of battery storage to 60 hz through secondary control and sends tertiary control signals to building controllers to restore the load from 8.38 MW and 4.19 Mvar to 11.07 MW and 5.54 Mvar, as shown in figure 11(b).
after resynchronization, the microgrid is connected to the utility grid, and the master controller will procure the optimal hourly dispatch of dEr units and building loads, taking into consideration the available energy in the battery storage unit. in grid-connected mode, the utility grid will set the microgrid voltage and frequency and the primary and secondary controls will not respond to fluctuations in campus load. figure 13 shows that after resynchronization, the generation dispatch of the natural gas turbine is ramped down from 8 MW and 4 Mvar to 4 MW and 2 Mvar and the battery storage unit is no longer dispatched in response to the tertiary control signal from the master controller. the solar Pv and wind turbine units gener-ate 123 kW and 8 kW, respectively, and the utility serves the remaining 6.94 MW and 3.47 Mvar of load. the dispatch of the solar Pv and wind generation units remains fixed, as they do not participate in providing voltage or frequency support.
ConclusionsMicrogrids are as old as the first generating plant erected by thomas Edison in new york when his company connected wires to local houses and businesses and provided customers with the invaluable commodity of electricity. Edison’s com-pany affected everyone’s lifestyle in 1881, using the first dc and islanded microgrid ever established. What is different now is that the new generation of microgrids is equipped with sophisticated control and communication devices, based on smart grid concepts: these are able to enhance the economics and the reliability of highly vulnerable electric power systems.
While smart grid features can also help manage dis-tribution system outages and allow power to be restored much more quickly than in the past, the most exciting technology that has evolved to mitigate the whims of Mother nature is the microgrid. Without a concerted con-trol strategy devised by distributed microgrids, potential on-site dEr solutions become stranded assets, going off-line as the larger distribution network also shuts down in the midst of a storm. incorporating dEr within an islanded microgrid can provide energy services to local
residents even as the larger grid awaits costly repairs and lengthy restorations.
as the late robert W. Galvin, former chairman of the Motor-ola corporation once said, “Perfect power microgrids will ensure absolute and universal availability of energy in the quan-tity and quality necessary to meet every consumer’s needs. it is a system that never fails the consumer.” natural disasters have further underscored the need for resilient infrastructures for delivering vital electricity services. in essence, when it comes to reliability, the need for microgrids can be easily justified. to paraphrase a well-known television commercial: cost of addi-tional generating plants, us$x; cost of microgrid development in a reinforced infrastructure, us$y; having access to electric-ity on a 10 °f night or providing emergency electric service to hospitals with thousands of intensive care unit patients on the second week of a power outage: priceless.
Acknowledgmentthis project was funded in part by u.s. department of Energy Grant # dE-fc26-08nt02875.
For Further Reading M. shahidehpour. (2013, Mar.). Microgrid at iit [online]. available: http://iitmicrogrid.net
M. lamonica. (2012, nov.). Microgrids keep power flow-ing through sandy outages, MIT Technology Review [online]. available: http://www.technologyreview.com/view/507106/microgrids-keep-power-flowing-through-sandy-outages.
P. asmus. (2012, nov.). devastating storms make the case for microgrids, Navigant Research Blog [online]. available: http://www.navigantresearch.com/blog/devastating- storms-make-the-case-for-microgrids
national Electric Manufacturers association. hurricane sandy reconstruction: rebuild the smart way. [online]. available: http://www.nema.org/Policy/documents/hurri-cane-sandy-reconstruction-4web.pdf
M. lamonica. (2012, oct.). smart meters help utility speed sandy restoration, MIT Technology Review [online]. available: http://www.technologyreview.com/view/506711/smart-meters-help-utility-speed-sandy-restoration
l. Polycarpou. (2013, May). the microgrid solution, State of the Planet, the Earth institute of columbia university [online]. available: http://blogs.ei.columbia.edu/2013/05/15/the-microgrid-solution
M. roach, “hurricane sandy and the emperor’s new clothes: Microgrids as a risk mitigation strategy for extreme weather events,” White Paper, MicroGrid horizons, dec. 2012.
BiographiesLiang Che is with the illinois institute of technology, chicago.
Mohammad Khodayar is with southern Methodist uni-versity, dallas, texas.
Mohammad Shahidehpour is with the illinois institute of technology, chicago. p&e