Guadalupe Restoration Project
57
G U A D A L U P E O I L F I E L D Guadalupe Restoration Project Restoration of the C8 Site 2005 Monitoring of Revegetation in accordance with: Coastal Development Permit/Development Plan D890558D V. L. Holland, Ph.D. Professor Emeritus Michael Curto Research Associate Biological Sciences Department Cal Poly State University San Luis Obispo, CA 93407 June 2005
Transcript of Guadalupe Restoration Project
G U A D A L U P E O I L F I E L D
Guadalupe Restoration Project
Restoration of the C8 Site
2005 Monitoring of Revegetation
in accordance with:
Coastal Development Permit/Development Plan D890558D
V. L. Holland, Ph.D. Professor Emeritus
Michael Curto Research Associate
Biological Sciences Department Cal Poly State University
San Luis Obispo, CA 93407
June 2005
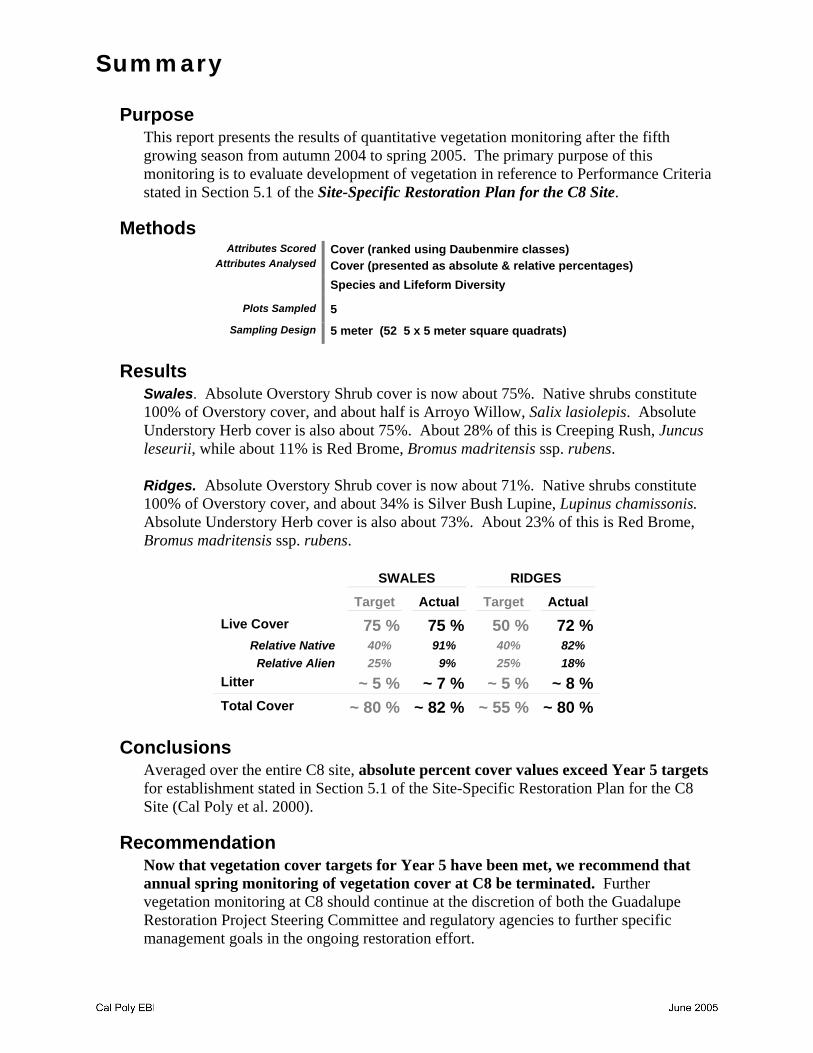
Summary
Purpose This report presents the results of quantitative vegetation monitoring after the fifth growing season from autumn 2004 to spring 2005. The primary purpose of this monitoring is to evaluate development of vegetation in reference to Performance Criteria stated in Section 5.1 of the Site-Specific Restoration Plan for the C8 Site.
Methods Attributes Scored Cover (ranked using Daubenmire classes)
Attributes Analysed Cover (presented as absolute & relative percentages) Species and Lifeform Diversity
Plots Sampled 5 Sampling Design 5 meter (52 5 x 5 meter square quadrats)
Results Swales. Absolute Overstory Shrub cover is now about 75%. Native shrubs constitute 100% of Overstory cover, and about half is Arroyo Willow, Salix lasiolepis. Absolute Understory Herb cover is also about 75%. About 28% of this is Creeping Rush, Juncus leseurii, while about 11% is Red Brome, Bromus madritensis ssp. rubens.
Ridges. Absolute Overstory Shrub cover is now about 71%. Native shrubs constitute 100% of Overstory cover, and about 34% is Silver Bush Lupine, Lupinus chamissonis. Absolute Understory Herb cover is also about 73%. About 23% of this is Red Brome, Bromus madritensis ssp. rubens.
SWALES RIDGES
Target Actual Target Actual Live Cover 75 % 75 % 50 % 72 %
Relative Native 40% 91% 40% 82% Relative Alien 25% 9% 25% 18%
Litter ~ 5 % ~ 7 % ~ 5 % ~ 8 % Total Cover ~ 80 % ~ 82 % ~ 55 % ~ 80 %
Conclusions Averaged over the entire C8 site, absolute percent cover values exceed Year 5 targets for establishment stated in Section 5.1 of the Site-Specific Restoration Plan for the C8 Site (Cal Poly et al. 2000).
Recommendation Now that vegetation cover targets for Year 5 have been met, we recommend that annual spring monitoring of vegetation cover at C8 be terminated. Further vegetation monitoring at C8 should continue at the discretion of both the Guadalupe Restoration Project Steering Committee and regulatory agencies to further specific management goals in the ongoing restoration effort.
Contents
1 Introduction ............................................................................................1
1.1 Purpose ................................................................................................................. 1 1.2 Sampling Design Changes .................................................................................. 1 1.3 Past Monitoring Results ...................................................................................... 2 1.4 Performance Criteria ............................................................................................ 2 1.5 Precipitation During the 2004-2005 Growing Season....................................... 3
2 Methods
2.1 Quadrats ................................................................................................................ 4 2.2 Vegetation Attributes Scored .............................................................................. 6 2.3 Sampling Dates & Personnel .............................................................................. 8 2.4 Sampling Equipment............................................................................................ 9 2.5 Species Nomenclature ......................................................................................... 9 2.6 Analytical Methods............................................................................................... 9 2.7 Data Presentation ................................................................................................. 9
3 Results
3.1 Data Tables ......................................................................................................... 11 3.2 Site Synopsis ...................................................................................................... 10
3.2.1 Site Cover in Swales................................................................................. 12 3.2.2 Site Cover on Ridges................................................................................ 11 3.2.3 Overstory Cover by Origin-Lifeform Group ........................................... 14 3.2.4 Understory Cover by Origin-Lifeform Group ......................................... 14 3.2.5 Overstory Cover by Species .................................................................... 15 3.2.6 Understory Cover by Species.................................................................. 16
3.3 Plot Synopses..................................................................................................... 17 4 Conclusions and Recommendations
4.1 Compliance With Cover Targets ....................................................................... 26 4.2 Other Notable Patterns ...................................................................................... 28
4.2.1 Native Grasses and Graminoids ............................................................. 28 4.2.2 Special-Status Species............................................................................. 28 4.2.3 Naturalized Alien Species ........................................................................ 29
4.3 Recommendations ............................................................................................. 29 5 References ...........................................................................................30 Appendix 1: 5m Site and Plot Data..........................................................31
Appendix 2: Plant Taxa Observed at C8 Site 1999 - 2005.........................44
Appendix 3: 5 m Quadrat Labels and Positions ......................................49

Tables
Table 1-1. Changes in Plant Cover, Bare Ground, and Litter .................................................. 2
Table 1-2. Change in Native and Alien Plant Cover ................................................................... 2
Table 1-3. Year 5 Cover Target Values........................................................................................ 2
Table 1-4. Monthly Precipitation Values Jan 2000 through May 2005 ..................................... 3
Table 2-1. Plot Designations and Sample Sizes for 5 meter Quadrats.................................... 4
Table 2-2. Definition and Calculation of Aerial Cover ............................................................... 7
Table 2-3. Cover Classes Scored Within 5 meter (25m2) Quadrats......................................... 8
Table 3-1. Estimated Overstory Cover in Swales .................................................................... 11
Table 3-2. Estimated Understory Cover in Swales .................................................................. 11
Table 3-3. Estimated Overstory Cover in Ridges..................................................................... 12
Table 3-4. Estimated Understory Cover in Ridges .................................................................. 12
Table 3-5. Site-Wide Estimated Cover by Lifeform Group ...................................................... 14
Table 3-6. Overstory Cover by Species .................................................................................... 15
Table 3-7. Cover For Ten Most-Dominant Understory Herbs ................................................. 16
Table 3-8. HIGH Plot Cover For All Overstory Shrubs ............................................................ 19
Table 3-9. HIGH Plot Cover For Ten Most-Dominant Understory Herbs ............................... 19
Table 3-10. MEDIUM Plot Cover For All Overstory Shrubs..................................................... 20
Table 3-11. MEDIUM Plot Cover For Ten Most-Dominant Understory Herbs........................ 20
Table 3-12. LOW Plot Cover For All Overstory Shrubs ........................................................... 21
Table 3-13. LOW Plot Cover For Ten Most-Dominant Understory Herbs.............................. 21
Table 3-14. CSCRB Plot Cover For All Overstory Shrubs....................................................... 22
Table 3-15. CSCRB Plot Cover For Ten Most-Dominant Understory Herbs ......................... 22
Table 3-16. CNTRL Plot Cover For All Overstory Shrubs ....................................................... 23
Table 3-17. CNTRL Plot Cover For Nine Most-Dominant Understory Herbs......................... 23
Table 4-1. Compliance with Year 5 Target Values ................................................................... 26
Table 4-2. Rare Plant Species From C8 Vicinity Prior to Excavation .................................... 28
Charts
Chart 1-1. Monthly Precipitation Values Jan 2000 through May 2005 .................................... 3
Chart. 2-1. Allocation of 5 meter Quadrats Among Plots.......................................................... 6
Chart 3-1. Site-Wide Estimated Cover by Story ....................................................................... 10
Chart 3-2. Site-Wide Estimated Cover by Topography and Story.......................................... 13
Chart 3-3. Overstory Cover by Origin-Lifeform Group............................................................ 14
Chart 3-4. Site-Wide Estimated Cover by Lifeform Group ...................................................... 15
Chart 3-5. Relative Cover For Six Most-Dominant Overstory Shrubs ................................... 16
Chart 3-6. Relative Cover For Ten Most-Dominant Understory Herbs .................................. 17
Chart 3-7. Proportional Cover Within Plots .............................................................................. 17
Chart 3-8. Absolute Cover Within Plots by Story .................................................................... 18
Chart 3-9. Absolute Cover Within HIGH Plot by Story ............................................................ 19
Chart 3-10. Absolute Cover Within MEDIUM Plot by Story..................................................... 20
Chart 3-11. Absolute Cover Within LOW Plot By Story........................................................... 21
Chart 3-12. Absolute Cover Within CSCRB Plot by Story....................................................... 22
Chart 3-13. Absolute Cover Within CNTRL Plot by Story ....................................................... 23

Photos
Photo 2-1. Quadrat LDC-3 Within the LOW Diversity Plot ....................................................... 7
Photo 3-1. Plot Cover Comparison at 9 and 52 Months .......................................................... 24
Photo 3-2. Plot Cover Comparison at 22 and 52 months........................................................ 25
Photo 4-1. Overstory Cover at 52 Months ................................................................................ 27
Figures & Maps
Figure 2-1. Proportional Percentages of a 5 meter Quadrat..................................................... 8
Figure 4-1. Conceptual View of Aerial Cover of Combined Layers ....................................... 26
Map 2-1. Locations of 5 meter Quadrats..................................................................................... 5
1 Introduction
1.1 Purpose This report presents a summary of the results of the annual quantitative monitoring of developing vegetation at the C8 restoration site within the former Guadalupe Oil Field. Vegetation data after the first five growing seasons (2001 to 2005) since excavation (June 2000) is presented as required by Section 5.2, and Tables 6 and 7, of the Site-Specific Restoration Plan for the C8 Site (Cal Poly et al. 2000). The primary purpose of the C8 monitoring is to evaluate vegetation development in reference to Performance Criteria stated in Section 5.1 of the Restoration Plan. Past monitoring results were discussed by Holland and Curto (2001, 2002, 2003, 2004), and Curto (2004).
1.2 Sampling Design Changes
1.2.1 Plot Designations The number and location of seven transects and 177 one-meter square quadrats used to sample for compliance in 2001, 2002, and 2003 (Holland and Curto 2001, 2002, 2003) were originally devised for initial monitoring conducted during early spring 2001 (Hegarty 2001). The intent was to stratify quadrat placement among ridges and swales within plots to overtly include microsite heterogeneity, thereby enhancing sampling for species diversity within five ecoremediation plots intended to overtly direct within-plot diversity to varying levels from High, to Medium, to Low, along with an early-successional Coastal Dune Scrub plot, and a “Control” plot of pre-existing, late-successional Coastal Dune Scrub to the immediate north and contiguous with the excavated area.
From autumn 2000 until autumn 2003 the plot designations High and Medium were the reverse of what is shown on Map 2-1. As vegetation developed within these plots, sampling data indicated that the former Medium Diversity plot now designated as High Diversity exhibited both the greatest species diversity and the greatest cover values, likely owing to the following factors:
• original plot diversity design was drafted before the road was realigned through C8;
• site hydrology was likely altered by this road realignment with additional rainwater now flowing off of the road into the former Medium Diversity plot providing additional water for plant survival and growth through summer;
• site hydrology was altered by addition of sand over portions of both the former Medium Diversity plot and the former High Diversity plot during the winter of 2000-2001 that buried emerging plants at that time; both plots still show arrested development owing to the sand backfill;
• some immigrant species established from seed without aid, thus increasing both native and alien species diversity locally within the former Medium Diversity plot;
• swales of the former Medium Diversity plot supported nearly twice the number of species (30) than did the former High Diversity plot (17-19).
After review and discussion by project personnel, an adaptive management decision was made in December 2003 to reverse the High Diversity and Medium Diversity plot designations for the purpose of making the actual experimental plots consistent with the experimental goals.

1 Introduction
1.3 Past Monitoring Results During the first four growing seasons at the C8 site, total plant canopy cover increased from 18% in the first year, 2001, to 78% in the fourth year, 2004. At the same time, observable bare ground decreased from 80% in 2001 to 15% in 2004, while observable litter cover increased from 2% the first year to 7% in 2004; see Table 1-1.
Table 1-1. Changes in Plant Cover, Bare Ground, and Litter. YEAR 2001 2002 2003 2004 Total Living Plant Cover 18% 40% 60% 78% Observable Litter 2% 11% 11% 7% Observable Bare Ground 80% 50% 29% 15%
The decrease of litter cover from 11% in 2003 to 7% in 2004 resulted from the increase in canopy cover that is overstory to much of the litter and obscures observation of litter from above. Litter on the soil surface is readily visible over much of the site under living and dead plant canopies; thus, litter values would be much greater if cover were assessed within two or more vegetation strata.
During the first four growing seasons, plant cover by local native species increased from 12% to 76% and alien plant cover decreased from 6% to 2%; see Table 1-2. The very low amount of alien weedy cover is likely attributable to the consistent weed eradication program, and to the proximity of C8 to the ocean shoreline where Veldtgrass (Ehrharta calycina) is not presently a problem.
Table 1-2. Change in Native and Alien Plant Cover. YEAR 2001 2002 2003 2004 Native Plant Cover 12% 36% 57% 76% Alien Plant Cover 6% 4% 3% 2% Total Plant Cover 18% 40% 60% 78%
1.4 Performance Criteria Table 1-3 lists Year 5 cover target values stated in Section 5.1 of the Site-Specific Restoration Plan for the C8 Site (Cal Poly et al. 2000) that serve as the primary measure of compliance with performance criteria established for the C8 restoration project.
Table 1-3. Year 5 Cover Target Values.
SWALES RIDGES
Live Cover 75 % 50 %Relative Native 40% 40% Relative Alien 25% 25%
Litter ~ 5 % ~ 5 %Total Cover ~ 80 % ~ 55 %
1 Introduction
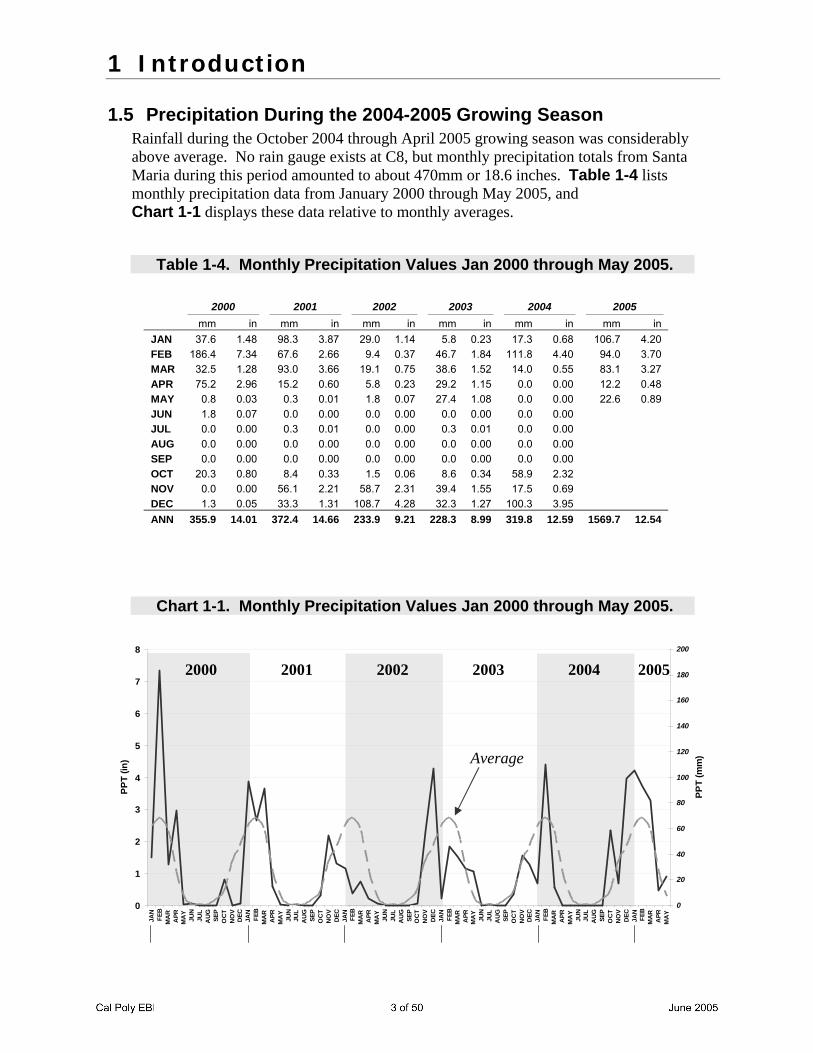
1.5 Precipitation During the 2004-2005 Growing Season Rainfall during the October 2004 through April 2005 growing season was considerably above average. No rain gauge exists at C8, but monthly precipitation totals from Santa Maria during this period amounted to about 470mm or 18.6 inches. Table 1-4 lists monthly precipitation data from January 2000 through May 2005, and Chart 1-1 displays these data relative to monthly averages.
Table 1-4. Monthly Precipitation Values Jan 2000 through May 2005.
2000 2001 2002 2003 2004 2005 mm in mm in mm in mm in mm in mm in JAN 37.6 1.48 98.3 3.87 29.0 1.14 5.8 0.23 17.3 0.68 106.7 4.20 FEB 186.4 7.34 67.6 2.66 9.4 0.37 46.7 1.84 111.8 4.40 94.0 3.70 MAR 32.5 1.28 93.0 3.66 19.1 0.75 38.6 1.52 14.0 0.55 83.1 3.27 APR 75.2 2.96 15.2 0.60 5.8 0.23 29.2 1.15 0.0 0.00 12.2 0.48 MAY 0.8 0.03 0.3 0.01 1.8 0.07 27.4 1.08 0.0 0.00 22.6 0.89 JUN 1.8 0.07 0.0 0.00 0.0 0.00 0.0 0.00 0.0 0.00 JUL 0.0 0.00 0.3 0.01 0.0 0.00 0.3 0.01 0.0 0.00 AUG 0.0 0.00 0.0 0.00 0.0 0.00 0.0 0.00 0.0 0.00 SEP 0.0 0.00 0.0 0.00 0.0 0.00 0.0 0.00 0.0 0.00 OCT 20.3 0.80 8.4 0.33 1.5 0.06 8.6 0.34 58.9 2.32 NOV 0.0 0.00 56.1 2.21 58.7 2.31 39.4 1.55 17.5 0.69 DEC 1.3 0.05 33.3 1.31 108.7 4.28 32.3 1.27 100.3 3.95 ANN 355.9 14.01 372.4 14.66 233.9 9.21 228.3 8.99 319.8 12.59 1569.7 12.54
Chart 1-1. Monthly Precipitation Values Jan 2000 through May 2005.
0
1
2
3
4
5
6
7
8
JAN
FEB
MA
RA
PRM
AY
JUN
JUL
AU
GSE
PO
CT
NO
VD
ECJA
NFE
BM
AR
APR
MA
YJU
NJU
LA
UG
SEP
OC
TN
OV
DEC
JAN
FEB
MA
RA
PRM
AY
JUN
JUL
AU
GSE
PO
CT
NO
VD
ECJA
NFE
BM
AR
APR
MA
YJU
NJU
LA
UG
SEP
OC
TN
OV
DEC
JAN
FEB
MA
RA
PRM
AY
JUN
JUL
AU
GSE
PO
CT
NO
VD
ECJA
NFE
BM
AR
APR
MA
Y
PPT
(in)
0
20
40
60
80
100
120
140
160
180
200
PPT
(mm
)
2000 2001 2002 2003 2004 2005
Average

2 Methods
2.1 Quadrats Since the initial revegetation of the C8 site following excavation, plant species diversity has continued to increase significantly, and trees and shrubs have attained large canopies. As a result, a new sampling protocol was approved in December 2003 and employed during 2004 sampling. The method adopted follows that recommended by The Smithsonian Institution, UNESCO (Dallmeier 1992), and the Ecological Monitoring and Assessment Network (EMAN) of Environment Canada (Roberts-Pichette and Gillespie 1999) for long-term monitoring of species diversity. The EMAN protocol recommends using 5m x 5m square quadrats for sampling shrubs (multi-stemmed woody plants > 1 m tall and < 4 cm diameter at breast height).
Validity of species diversity sampling is dependent upon “sampling effort”, i.e., the more area searched and the more time spent searching yields more species observed. Thus, area sampled must be proportional to plot size if sampling effort is considered comparable. For this reason the number of 5m x 5m quadrats is scaled in proportion to the differing areas of the existing diversity plots at C8. The relationship is semi-logarithmic because area is a square measure. Based on plot size the minimum number of 5 meter quadrats necessary for diversity sampling is 52. During 2004 monitoring, we established fifty-two 5 meter (5m x 5m) square quadrats for sampling shrubs. Table 2-1 lists the number of 5 meter quadrats sampled within each plot. Chart 2-1 shows the allocation of these quadrats among plots.
Table 2-1. Plot Designations and Sample Sizes for 5 meter Quadrats. Plot Area Quadrats
Acres Hectares sq meters 5 m
High 1.67 0.68 6770 14 Med 1.37 0.55 5530 12 Low 1.21 0.49 4910 9 CScrb 1.54 0.62 6240 13 Cntrl 0.55 0.22 2220 4
6.34 2.57 25670 52
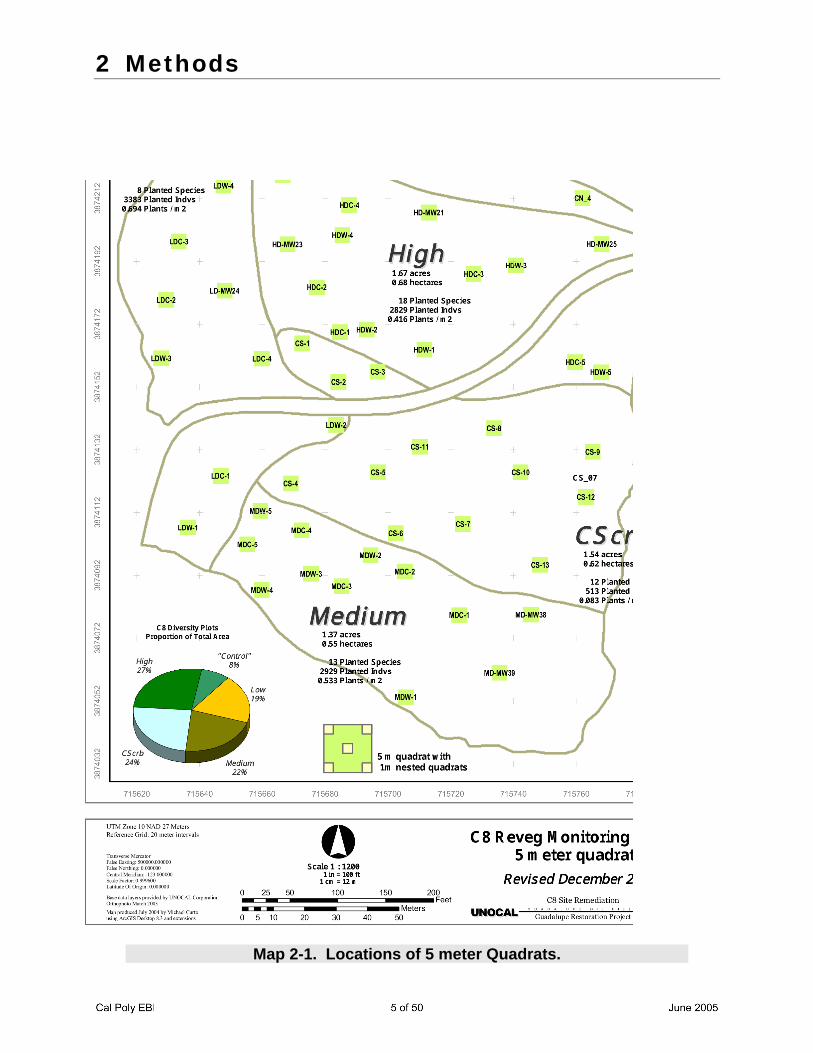
2.1.1 Quadrat Demarcation The location of the 5m x 5m square quadrats is almost entirely correlated with existing surface and capillary fringe soil sampling locations used by BFJ Services for chemical and bacterial population sampling conducted at C8. Therefore, these data are spatially coincident with chemical and bacteria data obtained from these sampling locations. Map 2-1 shows the locations, and Appendix 3 lists coordinates, for these 5 meters quadrats.
2 Methods
Map 2-1. Locations of 5 meter Quadrats.

2 Methods
Chart. 2-1. Allocation of 5 meter Quadrats Among Plots.
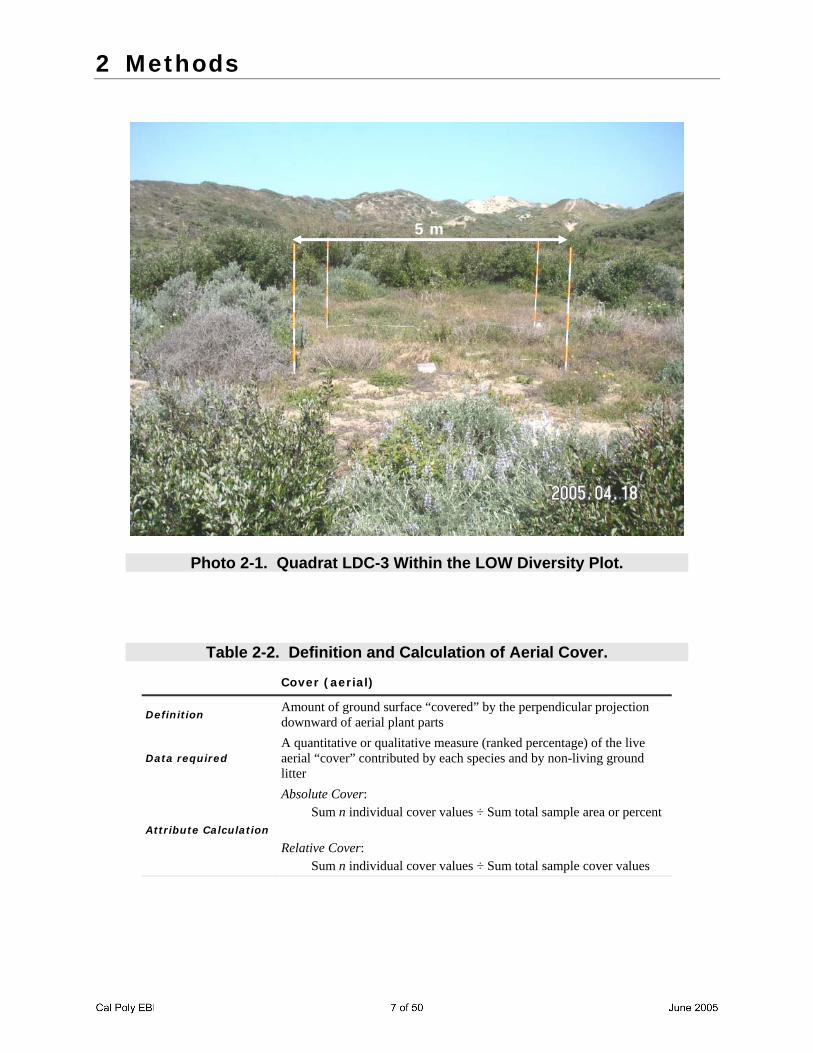
2.1.2 Quadrat Demarcation In the field at C8, 5-meter (25 meters squared) quadrats were temporarily defined using 8-foot aluminum survey range poles to demarcate corners, and metric tapes or two 8-foot range poles combined into a 16 foot (4.88 meters). Photo 2-1 shows this configuration at quadrat LDC-3 within the LOW Diversity plot.
2.2 Vegetation Attributes Scored For each 5 meter quadrat sampled, the identity and ranked aerial cover value were scored for each species present. Aerial cover is the primary measure of compliance with performance goals specified in the Site-Specific Restoration Plan for the C8 Site (Cal Poly et al. 2000). Because revegetation at C8 has proceeded so well over the past five years, the ability to distinguish individual plants ranges from difficult to impossible over much of the site. Thus, counting individuals for calculations of plant density (individuals per unit area) and plant frequency (rooted presence within sampling units) was abandoned during the 2005 sampling effort. Table 2-2 presents the definition, data required, attribute calculation, and attribute expression for the assessment of aerial vegetation cover. Cover can be evaluated through numerous methods (see Bonham 1989 or Interagency Technical Team 1996 for thorough reviews). We opted to use a long-standing method of assigning cover ranks expressed as percentage ranges (Daubenmire 1959).
Minimum Effort Required For Diversity Samplingn = 52 25m2 Quadrats
100
225
300325
350
y = 157.63Ln(x) + 109.07R2 = 0.985
0
1000
2000
3000
4000
5000
6000
7000
8000
Cntrl Low Med CScrb High
PLOT DIVERSITY
QUAD
RAT
SAM
PLIN
G AR
EA m
2
0
50
100
150
200
250
300
350
400PL
OT A
REA
m2
4 9 12 13 14N u m b e r o f 5 m Q u a d r a t s
2 Methods
Photo 2-1. Quadrat LDC-3 Within the LOW Diversity Plot.
Table 2-2. Definition and Calculation of Aerial Cover.
Cover (aerial)
Definition Amount of ground surface “covered” by the perpendicular projection downward of aerial plant parts
Data required A quantitative or qualitative measure (ranked percentage) of the live aerial “cover” contributed by each species and by non-living ground litter
Attribute Calculation
Absolute Cover: Sum n individual cover values ÷ Sum total sample area or percent
Relative Cover: Sum n individual cover values ÷ Sum total sample cover values
5 m
2 Methods
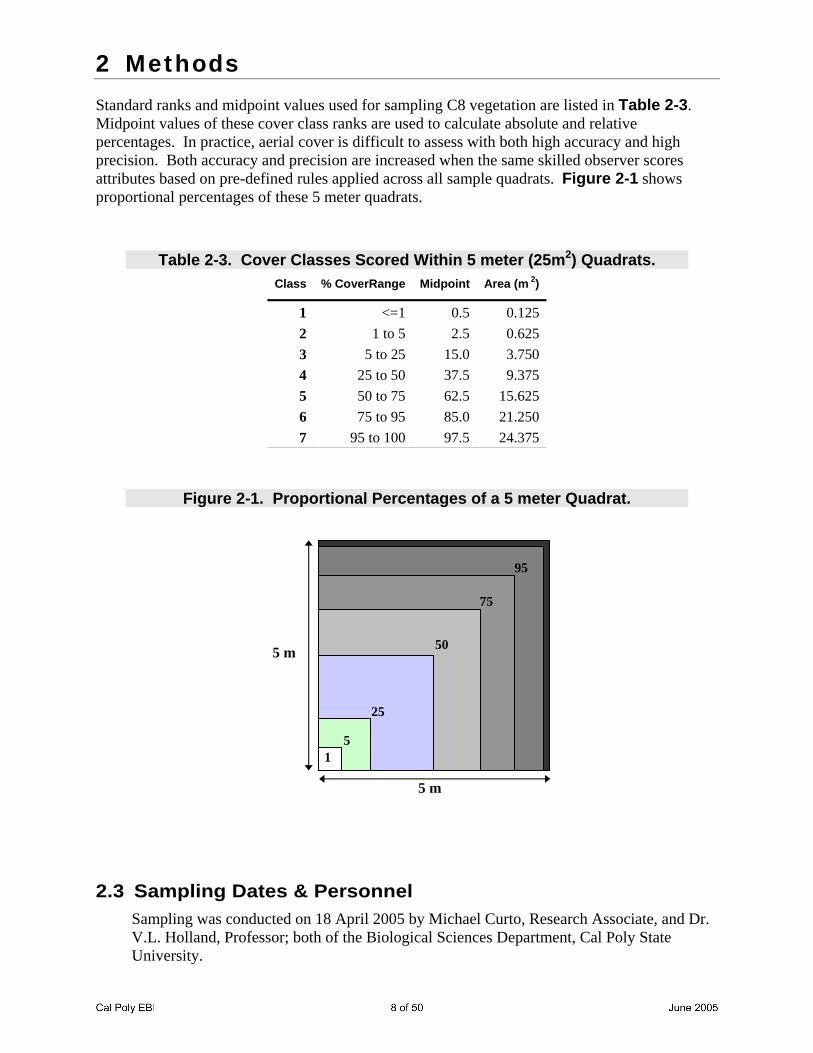
Standard ranks and midpoint values used for sampling C8 vegetation are listed in Table 2-3. Midpoint values of these cover class ranks are used to calculate absolute and relative percentages. In practice, aerial cover is difficult to assess with both high accuracy and high precision. Both accuracy and precision are increased when the same skilled observer scores attributes based on pre-defined rules applied across all sample quadrats. Figure 2-1 shows proportional percentages of these 5 meter quadrats.
Table 2-3. Cover Classes Scored Within 5 meter (25m2) Quadrats. Class % CoverRange Midpoint Area (m 2)
1 <=1 0.5 0.1252 1 to 5 2.5 0.6253 5 to 25 15.0 3.7504 25 to 50 37.5 9.3755 50 to 75 62.5 15.6256 75 to 95 85.0 21.2507 95 to 100 97.5 24.375
Figure 2-1. Proportional Percentages of a 5 meter Quadrat.
2.3 Sampling Dates & Personnel Sampling was conducted on 18 April 2005 by Michael Curto, Research Associate, and Dr. V.L. Holland, Professor; both of the Biological Sciences Department, Cal Poly State University.
5 m
5 m
1 5
25
50
75
95
2 Methods
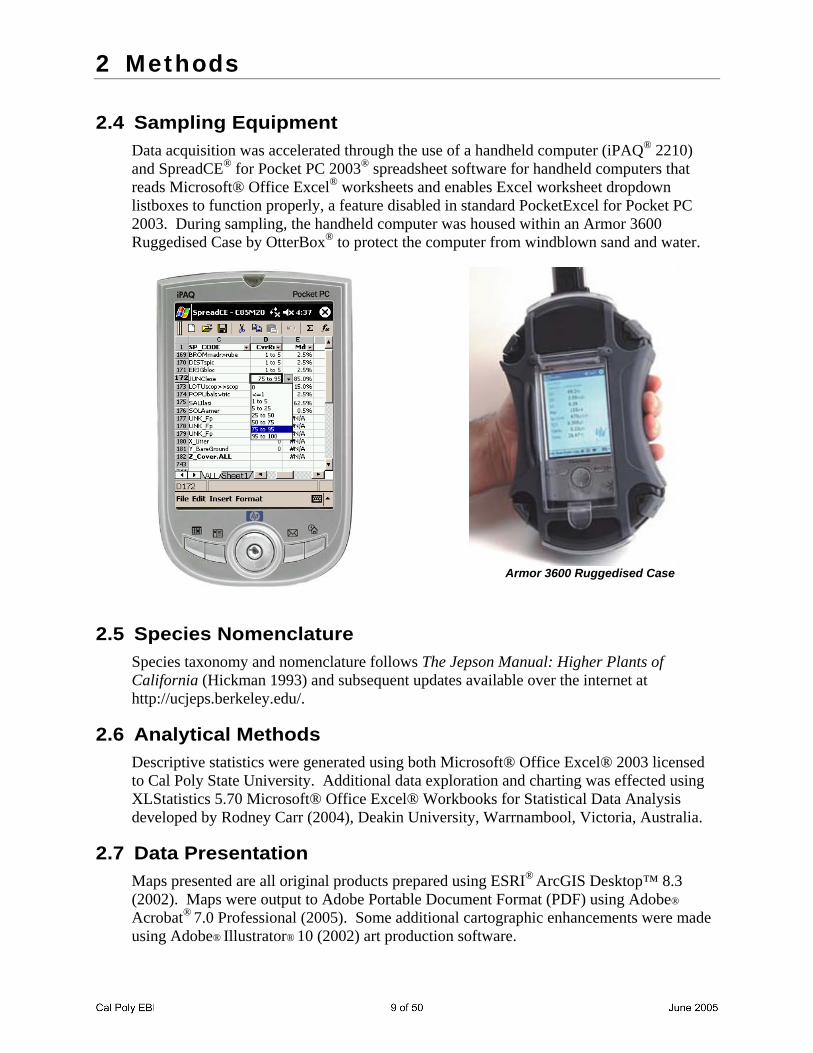
2.4 Sampling Equipment Data acquisition was accelerated through the use of a handheld computer (iPAQ® 2210) and SpreadCE® for Pocket PC 2003® spreadsheet software for handheld computers that reads Microsoft® Office Excel® worksheets and enables Excel worksheet dropdown listboxes to function properly, a feature disabled in standard PocketExcel for Pocket PC 2003. During sampling, the handheld computer was housed within an Armor 3600 Ruggedised Case by OtterBox® to protect the computer from windblown sand and water.
Armor 3600 Ruggedised Case
2.5 Species Nomenclature Species taxonomy and nomenclature follows The Jepson Manual: Higher Plants of California (Hickman 1993) and subsequent updates available over the internet at http://ucjeps.berkeley.edu/.
2.6 Analytical Methods Descriptive statistics were generated using both Microsoft® Office Excel® 2003 licensed to Cal Poly State University. Additional data exploration and charting was effected using XLStatistics 5.70 Microsoft® Office Excel® Workbooks for Statistical Data Analysis developed by Rodney Carr (2004), Deakin University, Warrnambool, Victoria, Australia.
2.7 Data Presentation Maps presented are all original products prepared using ESRI®
ArcGIS Desktop™ 8.3 (2002). Maps were output to Adobe Portable Document Format (PDF) using Adobe®
Acrobat® 7.0 Professional (2005). Some additional cartographic enhancements were made
using Adobe® Illustrator® 10 (2002) art production software.
3 Results
3.1 Data Tables Appendix 1 contains tables of estimated cover data for overstory shrubs and for understory herbs within each plot and over the entire C8 Site. Appendix 2 lists all 111 plant species recorded at the C8 site during previous vegetation sampling (LFR 2000; Hegarty 2001, Holland & Curto 2001, 2002, 2003, 2004), and during sampling conducted for this report. This list includes the 62 species recorded by us as present within at least one quadrat during 2005 sampling, and 49 other species present somewhere in the general area now, or before remediation began. Nomenclature follows The Jepson Manual (Hickman 1993).
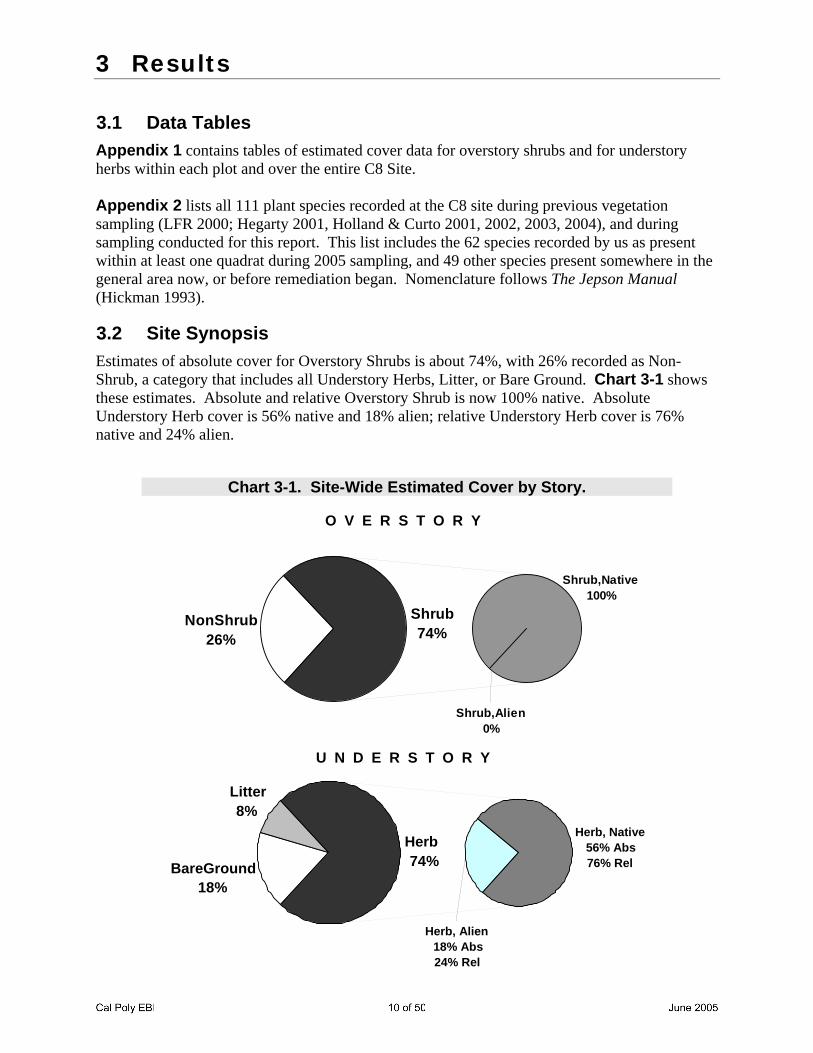
3.2 Site Synopsis Estimates of absolute cover for Overstory Shrubs is about 74%, with 26% recorded as Non-Shrub, a category that includes all Understory Herbs, Litter, or Bare Ground. Chart 3-1 shows these estimates. Absolute and relative Overstory Shrub is now 100% native. Absolute Understory Herb cover is 56% native and 18% alien; relative Understory Herb cover is 76% native and 24% alien.
Chart 3-1. Site-Wide Estimated Cover by Story.
O V E R S T O R Y
NonShrub26%
Shrub,Alien0%
Shrub,Native 100%
Shrub74%
U N D E R S T O R Y
Litter 8%
BareGround18%
Herb, Native 56% Abs 76% Rel
Herb, Alien18% Abs24% Rel
Herb74%

3 Results
3.2.1 Site Cover in Swales Absolute Overstory Shrub cover is now about 75%. Native shrubs constitute 100% of Overstory cover, and about half is Arroyo Willow, Salix lasiolepis. Table 3-1 lists these values. Chart 3-2 shows this ratio. Absolute Understory Herb cover is also about 75%. About 28% of this is Creeping Rush, Juncus leseurii, while about 11% is Red Brome, Bromus madritensis ssp. rubens. Table 3-2 lists these values. Chart 3-2 shows this ratio.
Table 3-1. Estimated Overstory Cover in Swales.
Prov Dur Phys Taxon CommonName CvrAbs CvrRel N P S Salix lasiolepis Benth. Arroyo Willow 37.16% 49.37% N P S Lotus scoparius (Nutt.) Ottley var. scoparius Deerweed 18.02% 23.94% N P Sl Lupinus chamissonis Eschsch. Silver Bush Lupine 13.55% 18.01% N P S Baccharis pilularis DC. Coyote Bush 1.98% 2.63% N P S Populus balsamifera L. ssp. trichocarpa (Torrey & A. Gray) Brayshaw Black Cottonwood 1.95% 2.59% N P S Eriogonum parvifolium Smith Coast Buckwheat 1.12% 1.49% N P S Ericameria ericoides (Less.) Jepson var. ericoides Mock-Heather 0.83% 1.10% N P S Myrica californica Cham. & Schldl. California Wax Myrtle 0.60% 0.80% N P S Ribes divaricatum Dougl. Straggly Gooseberry 0.05% 0.07% N P S Lupinus arboreus Sims. Yellow Tree Lupine 0.00% 0.00% N P S Shrub 75.26% 100.00% Non-Shrub 24.74% 100.00%
Table 3-2. Estimated Understory Cover in Swales.
Prov Dur Phys Taxon CommonName CvrAbs CvrRel N P Gm Juncus leseurii Bol. Creeping Rush 28.45% 37.78% A A Gr Bromus madritensis L. ssp. rubens (L.) Husnot Red Brome 11.22% 14.91% N P Gr Distichlis spicata (L.) E. Greene Saltgrass 7.69% 10.21% N P F Ambrosia chamissonis (Less.) E. Greene Beach Bur 7.09% 9.41% N P Gm Carex praegracilis W. Boott Clustered Field Sedge 4.05% 5.38% N P F Achillea millefolium L. Common Yarrow 3.97% 5.27% N A F Cryptantha leiocarpa (F. & M.) E.L.Greene Coast Cryptantha 1.81% 2.40% N P F Erysimum insulare E. Greene ssp. suffrutescens (Abrams) R. A. Price Suffrutescent Wallflower 1.31% 1.74% N P F Horkelia cuneata Lindley ssp. cuneata Wedgeleaf Horkelia 1.29% 1.72% N P F Artemisia douglasiana Bess. Mugwort 1.03% 1.37% N P F Senecio blochmaniae E. Greene Blochman's Groundsel 1.03% 1.37% N P F Potentilla anserina L. ssp. pacifica (Howell) Rousi Pacific Silverweed 0.88% 1.17% A A Gr Bromus diandrus Roth Ripgut 0.86% 1.14% N P Fl Astragalus nuttallii (Torrey & A. Gray) J. Howell var. nuttallii Nuttall Rattlepod 0.62% 0.82% N P F Erigeron blochmaniae E. Greene Blochman's Leafy Daisy 0.60% 0.80% N P F Camissonia cheiranthifolia (Hornem. ex Sprengel) Raven ssp. cheiranthifolia Beach Evening Primrose 0.57% 0.76% N P F Ambrosia psilostachya DC. Western Ragweed 0.52% 0.69% N P F Solidago californica Nutt. California Goldenrod 0.40% 0.53% A A Fl Melilotus indica (L.) All. Sour-Clover, Annual Sweetclover 0.26% 0.34% A A Gr Vulpia myuros (L.) C. C. Gmelin var. hirsuta (Hackel) Asch. & Graebner Rattail Fescue 0.22% 0.30% N A Fl Lotus strigosus (Nutt.) E.L. Greene Lotus 0.21% 0.27% N P Vw Rubus ursinus Cham. & Schldl. Blackberry 0.19% 0.25% N P Gr Leymus triticoides (Buckley) Pilger Creeping Wildrye 0.19% 0.25% N P F Conyza canadensis (L.) Cronq. Common Horseweed 0.10% 0.14% N P F Solanum americanum Miller Small-Flowered Nightshade 0.10% 0.14% A P SucL Conicosia pugioniformis (L.) N. E. Br. Narrow-Leaved Ice Plant 0.10% 0.14% A P SucL Carpobrotus edulis (L.) N. E. Brown Hottentot Fig 0.10% 0.14% N P F Croton californicus Muell. California Croton 0.09% 0.11% N P Vh Abronia latifolia Eschsch. Yellow Sand Verbena 0.09% 0.11% N P F Gnaphalium californicum DC. California Everlasting 0.05% 0.07% N P Gm Juncus acutus L. Spike Rush 0.05% 0.07% A A F Hypochoeris glabra L. Smooth Cat's Ear 0.02% 0.02% A A F Daucus pusillus Michaux Rattlesnake Weed 0.02% 0.02% N P Vh Abronia umbellata Lam. ssp. umbellata Pink Sand Verbena 0.02% 0.02% N A F Stephanomeria virgata Benth. Wire Lettuce 0.02% 0.02% N P F Gnaphalium ramosissimum Nutt. Pink Everlasting 0.02% 0.02% N P F Stachys ajugoides Benth. Hedge Nettle 0.02% 0.02% A A F Anagallis arvensis L. Scarlet Pimpernel 0.02% 0.02% N A F Plantago major L. Annual Coastal Plantain 0.02% 0.02% x x x UnderstoryLive 75.29% 100.00% x x x Litter 6.88% x x x BareGround 17.84% x x x UnderstoryTotal 100.02%

3 Results
3.2.2 Site Cover in Ridges Absolute Overstory Shrub cover is now about 71%. Native shrubs constitute 100% of Overstory cover, and about 34% is Silver Bush Lupine, Lupinus chamissonis. Table 3-2 lists these values. Chart 3-2 shows this ratio. Absolute Understory Herb cover is also about 73%. About 23% of this is Red Brome, Bromus madritensis ssp. rubens. Table 3-4 lists these values. Chart 3-2 shows this ratio.
Table 3-3. Estimated Overstory Cover in Ridges.
Prov Dur Phys Taxon CommonName CvrAbs CvrRel N P Sl Lupinus chamissonis Eschsch. Silver Bush Lupine 34.35% 48.21% N P Sl Lotus scoparius (Nutt.) Ottley var. scoparius Deerweed 18.91% 26.55% N P S Eriogonum parvifolium Smith Coast Buckwheat 8.61% 12.08% N P S Ericameria ericoides (Less.) Jepson var. ericoides Mock-Heather 4.78% 6.71% N P S Salix lasiolepis Benth. Arroyo Willow 4.57% 6.41% N P S Populus balsamifera L. ssp. trichocarpa (Torrey & A. Gray) Brayshaw Black Cottonwood 0.02% 0.03% N P S Shrub 71.24% 100.00% Non-Shrub 28.76% 100.00%
Table 3-4. Estimated Understory Cover in Ridges.
Prov Dur Phys Taxon CommonName CvrAbs CvrRel A A Gr Bromus madritensis L. ssp. rubens (L.) Husnot Red Brome 23.07% 31.40% N A F Cryptantha leiocarpa (F. & M.) E.L.Greene Coast Cryptantha 15.15% 20.63% N P F Ambrosia chamissonis (Less.) E. Greene Beach Bur 12.17% 16.57% N P F Achillea millefolium L. Common Yarrow 5.22% 7.10% N P Gm Juncus leseurii Bol. Creeping Rush 4.57% 6.21% N P F Erysimum insulare E. Greene ssp. suffrutescens (Abrams) R. A. Price Suffrutescent Wallflower 3.93% 5.36% N P F Camissonia cheiranthifolia (Hornem. ex Sprengel) Raven ssp. cheiranthifolia Beach Evening Primrose 2.24% 3.05% N P F Senecio blochmaniae E. Greene Blochman's Groundsel 1.74% 2.37% A A Gr Bromus diandrus Roth Ripgut 0.96% 1.30% N P F Ambrosia psilostachya DC. Western Ragweed 0.87% 1.18% A P Gm Juncus leseurii Bol. Creeping Rush 0.65% 0.89% N P F Erigeron blochmaniae E. Greene Blochman's Leafy Daisy 0.54% 0.74% A A Gr Schismus arabicus Nees Arabian Grass 0.28% 0.38% N P Fl Astragalus nuttallii (Torrey & A. Gray) J. Howell var. nuttallii Nuttall Rattlepod 0.28% 0.38% N P Vh Abronia latifolia Eschsch. Yellow Sand Verbena 0.24% 0.33% N P F Croton californicus Muell. California Croton 0.22% 0.30% N P Gr Distichlis spicata (L.) E. Greene Saltgrass 0.22% 0.30% A P SucL Conicosia pugioniformis (L.) N. E. Br. Narrow-Leaved Ice Plant 0.20% 0.27% A A Gr Vulpia myuros (L.) C. C. Gmelin var. hirsuta (Hackel) Asch. & Graebner Rattail Fescue 0.20% 0.27% N P F Gnaphalium ramosissimum Nutt. Pink Everlasting 0.13% 0.18% N P F Solanum americanum Miller Small-Flowered Nightshade 0.11% 0.15% N P Gr Leymus triticoides (Buckley) Pilger Creeping Wildrye 0.11% 0.15% A A Fl Melilotus indica (L.) All. Sour-Clover, Annual Sweetclover 0.11% 0.15% A A Gr Lamarckia aurea (L.) Moench. Goldentop 0.09% 0.12% N P F Gnaphalium californicum DC. California Everlasting 0.07% 0.09% N A F Phacelia distans Benth. Common Phacelia 0.02% 0.03% N P Gm Carex praegracilis W. Boott Clustered Field Sedge 0.02% 0.03% A A F Centaurea solsticialis L. Yellow Star Thistle 0.02% 0.03% A A F Stellaria sp. Chickweed 0.02% 0.03% A A F Erodium cicutarium (L.) L'Her. Redstem Filaree 0.02% 0.03% x x x UnderstoryLive 73.46% 100.00% x x x Litter 8.30% x x x BareGround 17.89% x x x UnderstoryTotal 99.33%

3 Results
Chart 3-2. Site-Wide Estimated Cover by Topography and Story.
RIDGES SWALES
Overstory
Non-Shrub25%
Shrub 75%
Non-Shrub29%
Shrub 71%
All Others3%
Coyote Bush3%
Silver Bush Lupine
18%
Deerweed24%
Arroyo Willow49%
Black Cottonwood3%
Arroyo Willow6%
Silver Bush Lupine
48%
Deerweed27%
Coast Buckwheat12%
Mock-Heather7%All Others
0%
Understory
Litter7%
BareGround18%
UnderstoryLive75%
Litter8%
BareGround18% UnderstoryLive
74%
Saltgrass10%
Beach Bur9%
All Others22%
Red Brome15%
Creeping Rush39%
Clustered Field Sedge
5%
Beach Bur17%
Common Yarrow7%
All Others18%
Creeping Rush6%
Red Brome31%
Coast Cryptantha21%

3 Results
3.2.3 Overstory Cover by Origin-Lifeform Group Relative Overstory cover is now about 56% Legume Shrubs and about 44% Non-Legume Shrubs. Chart 3-3 shows this ratio.
Chart 3-3. Overstory Cover by Origin-Lifeform Group.
LegumeShrub56%
Non-LegumeShrub44%
3.2.4 Understory Cover by Origin-Lifeform Group Over the entire site, about 60% of the 74% absolute cover consists of Native Perennial Forbs (22.7%), Native Perennial Graminoids (20.5%), or Alien Annual Grass (17.0%).
Estimates of absolute and relative cover by origin and lifeform are listed in Table 3-5.
Chart 3-4 graphically presents these same data for absolute and relative cover by origin-lifeform group.
Table 3-5. Site-Wide Estimated Cover by Lifeform Group.
Prov Dur Phys CvrAbs CvrRel
N P F 22.7% 30.8%
N P Gm 20.5% 27.8%
A A Gr 17.0% 23.1%
N A F 7.7% 10.5%
N P Gr 4.5% 6.2%
N P Fl 0.5% 0.6%
A P SucL 0.2% 0.3%
A A Fl 0.2% 0.3%
N P Vh 0.2% 0.2%
N A Fl 0.1% 0.2%
N P Vw 0.1% 0.1%
A A F 0.1% 0.1%
73.8% 100.0%
ORIGIN - LIFEFORM
ATTRIBUTES
Provenance
N Native
A Alien
Duration
P Perennial
A Annual
Physiognomic Type
S Shrub
DS Dwarf
Vh Herbaceous
SucL Leaf Succulent
F Forb
Fl Legume Forb
Gr True Grass
Gm Graminoid

3 Results
Chart 3-4. Site-Wide Estimated Cover by Lifeform Group.
30.8%
27.8%
23.1%
10.5%
6.2%
0.6% 0.3% 0.3% 0.2% 0.2% 0.1% 0.1%0%
5%
10%
15%
20%
25%
30%
35%
NPF NPGm AAGr NAF NPGr NPFl APSucL AAFl NPVh NAFl NPVw AAF
Lifeform Groups
Per
cen
t C
over
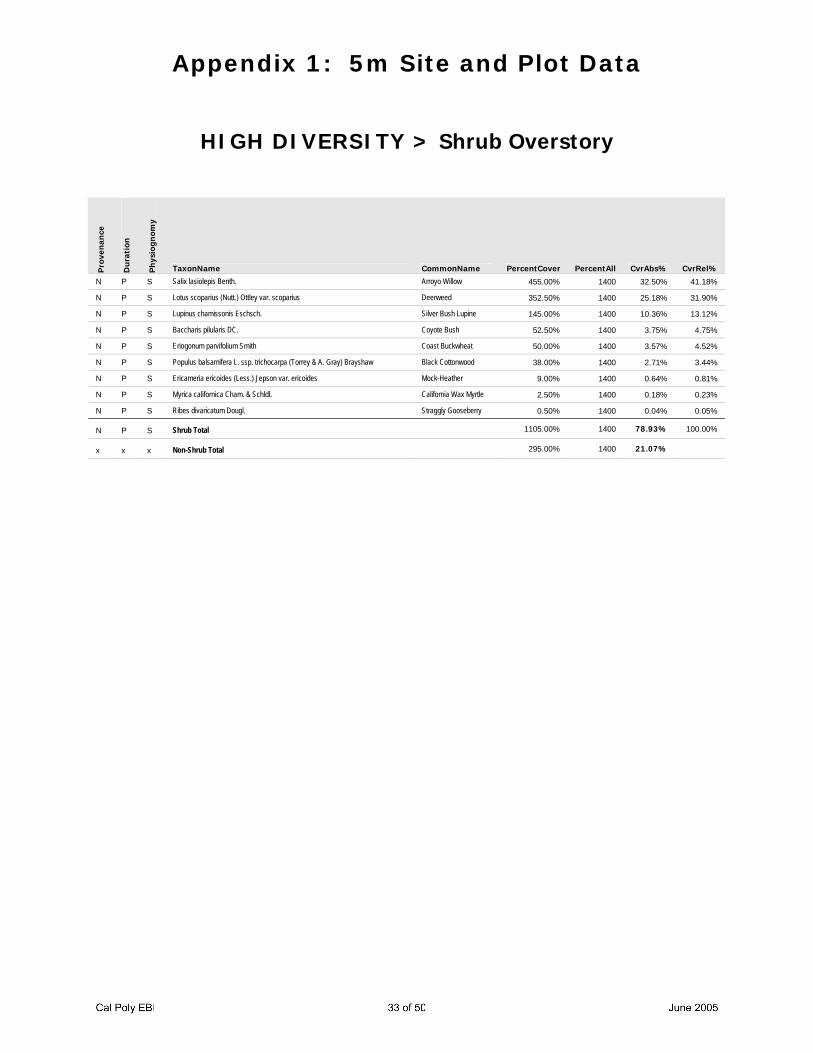
3.2.5 Overstory Cover by Species Overstory Shrub cover continues to be dominated by two legume species (Silver Bush Lupine, Lupinus chamissonis, and Deerweed, Lotus scoparius), and one non-legume species (Arroyo Willow, Salix lasiolepis). Table 3-6 lists absolute and relative cover values for all Overstory Shrub species. Chart 3-5 graphically presents relative cover values for the six most-dominant species.
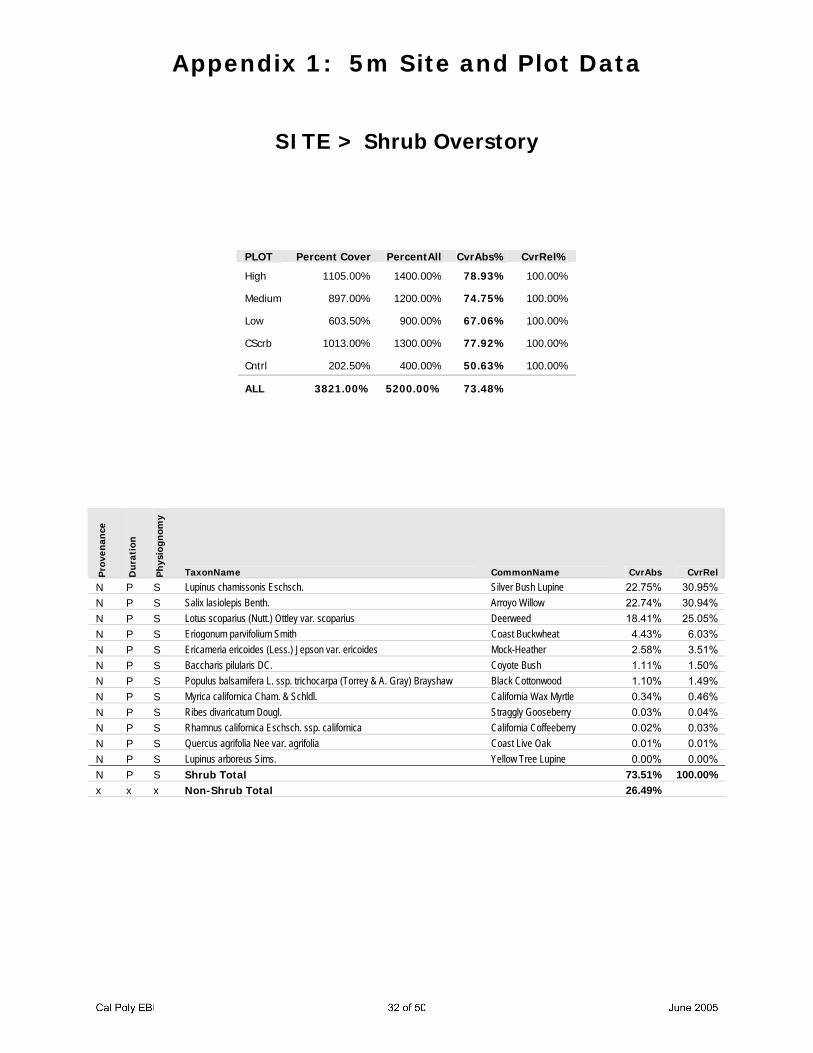
Table 3-6. Overstory Cover by Species. Prov Dur Phys Taxon CommonName CvrAbs CvrRel N P Sl Lupinus chamissonis Eschsch. Silver Bush Lupine 22.75% 30.95% N P S Salix lasiolepis Benth. Arroyo Willow 22.74% 30.94% N P Sl Lotus scoparius (Nutt.) Ottley var. scoparius Deerweed 18.41% 25.05% N P S Eriogonum parvifolium Smith Coast Buckwheat 4.43% 6.03% N P S Ericameria ericoides (Less.) Jepson var. ericoides Mock-Heather 2.58% 3.51% N P S Baccharis pilularis DC. Coyote Bush 1.11% 1.50% N P S Populus balsamifera L. ssp. trichocarpa (Torrey & A. Gray) Brayshaw Black Cottonwood 1.10% 1.49% N P S Myrica californica Cham. & Schldl. California Wax Myrtle 0.34% 0.46% N P S Ribes divaricatum Dougl. Straggly Gooseberry 0.03% 0.04% N P S Rhamnus californica Eschsch. ssp. californica California Coffeeberry 0.02% 0.03% N P S Quercus agrifolia Nee var. agrifolia Coast Live Oak 0.01% 0.01% N P S ShrubTotal 73.51% 100.00% x x x Non-ShrubTotal 26.49%
AAGr23%
NAF10%
NPF31%
Others2%
NPGr6%
NPGm28%
CoverRelativeCoverAbsolute
22.7%
20.5%
17.0%
Relative Cover Provenance
N Native
A Alien
Duration
P Perennial
A Annual
Physiognomic Type
S Shrub
DS Dwarf
Vh Herbaceous
SucL Leaf Succulent
F Forb
Fl Legume Forb
Gr True Grass
Gm Graminoid
3 Results
Chart 3-5. Relative Cover For Six Most-Dominant Overstory Shrubs.
Deerweed26%
Coast Buckwheat6%
Mock-Heather4%
Coyote Bush2%
Arroyo Willow31%
Silver Bush Lupine
31%
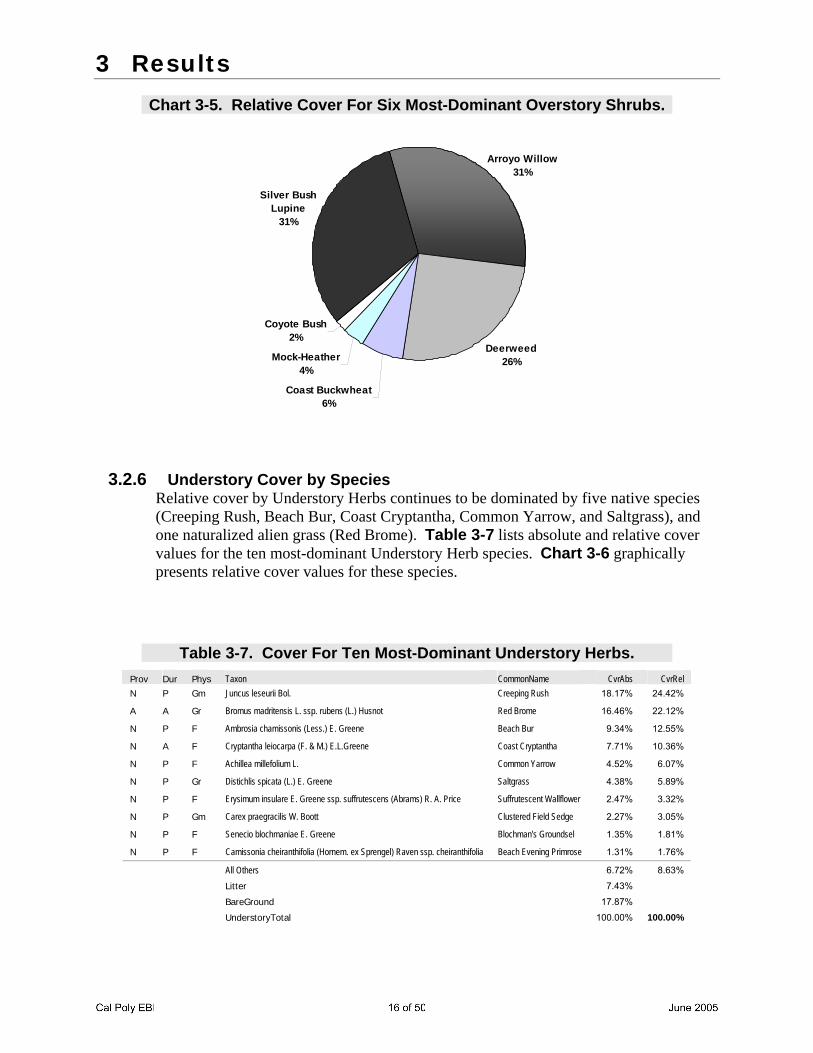
3.2.6 Understory Cover by Species Relative cover by Understory Herbs continues to be dominated by five native species (Creeping Rush, Beach Bur, Coast Cryptantha, Common Yarrow, and Saltgrass), and one naturalized alien grass (Red Brome). Table 3-7 lists absolute and relative cover values for the ten most-dominant Understory Herb species. Chart 3-6 graphically presents relative cover values for these species.
Table 3-7. Cover For Ten Most-Dominant Understory Herbs. Prov Dur Phys Taxon CommonName CvrAbs CvrRel N P Gm Juncus leseurii Bol. Creeping Rush 18.17% 24.42%
A A Gr Bromus madritensis L. ssp. rubens (L.) Husnot Red Brome 16.46% 22.12%
N P F Ambrosia chamissonis (Less.) E. Greene Beach Bur 9.34% 12.55%
N A F Cryptantha leiocarpa (F. & M.) E.L.Greene Coast Cryptantha 7.71% 10.36%
N P F Achillea millefolium L. Common Yarrow 4.52% 6.07%
N P Gr Distichlis spicata (L.) E. Greene Saltgrass 4.38% 5.89%
N P F Erysimum insulare E. Greene ssp. suffrutescens (Abrams) R. A. Price Suffrutescent Wallflower 2.47% 3.32%
N P Gm Carex praegracilis W. Boott Clustered Field Sedge 2.27% 3.05%
N P F Senecio blochmaniae E. Greene Blochman's Groundsel 1.35% 1.81%
N P F Camissonia cheiranthifolia (Hornem. ex Sprengel) Raven ssp. cheiranthifolia Beach Evening Primrose 1.31% 1.76%
All Others 6.72% 8.63%
Litter 7.43%
BareGround 17.87% UnderstoryTotal 100.00% 100.00%
3 Results
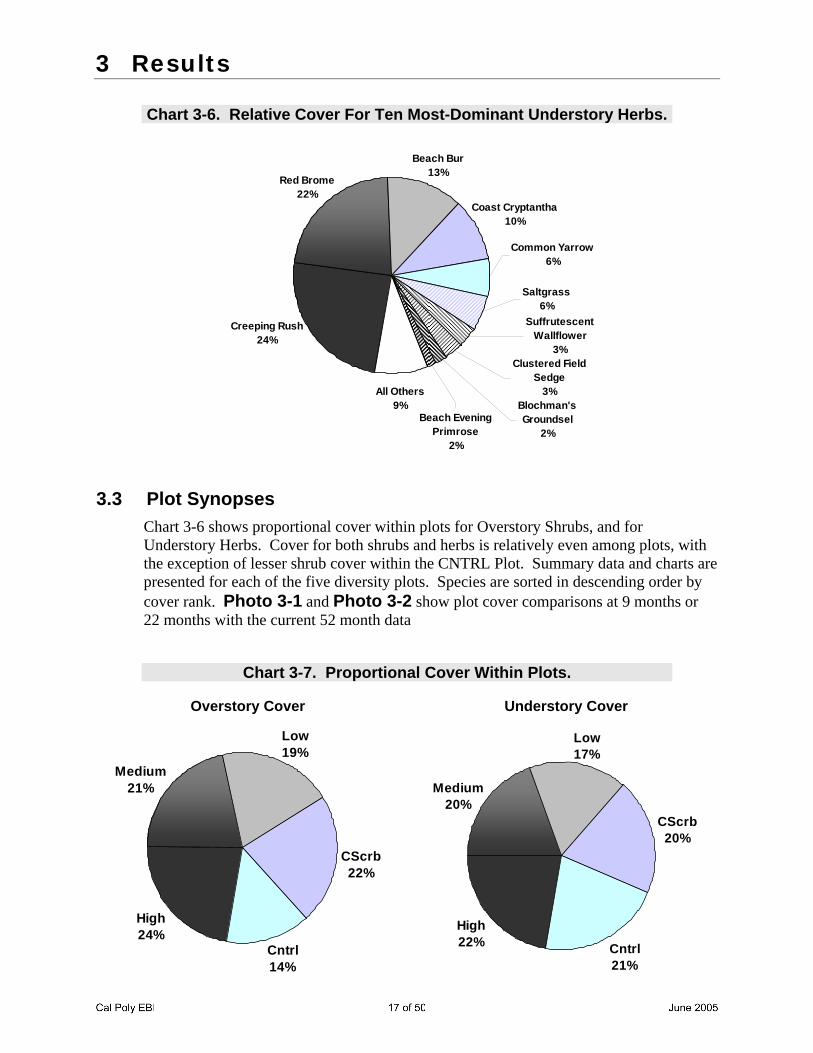
Chart 3-6. Relative Cover For Ten Most-Dominant Understory Herbs.
Blochman's Groundsel
2%
All Others9%
Beach Evening Primrose
2%
Clustered Field Sedge
3%
Suffrutescent Wallflower
3%
Saltgrass6%
Common Yarrow6%
Coast Cryptantha10%
Beach Bur13%
Creeping Rush24%
Red Brome22%
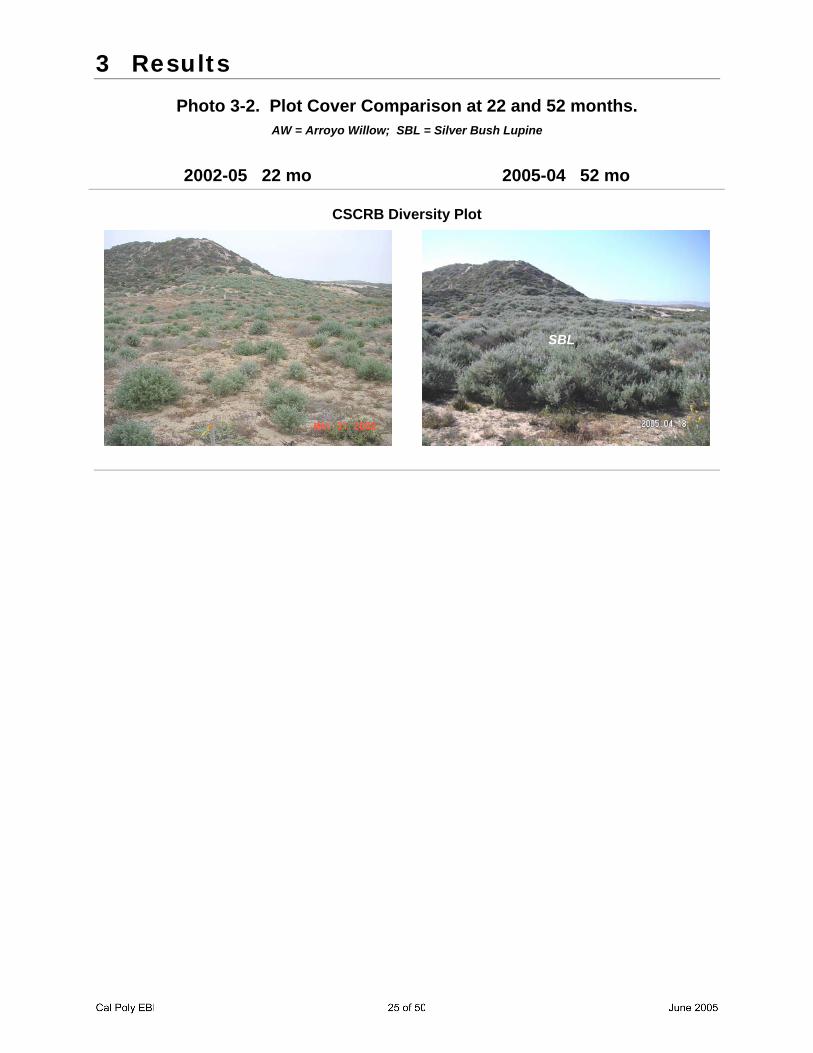
3.3 Plot Synopses Chart 3-6 shows proportional cover within plots for Overstory Shrubs, and for Understory Herbs. Cover for both shrubs and herbs is relatively even among plots, with the exception of lesser shrub cover within the CNTRL Plot. Summary data and charts are presented for each of the five diversity plots. Species are sorted in descending order by cover rank. Photo 3-1 and Photo 3-2 show plot cover comparisons at 9 months or 22 months with the current 52 month data
Chart 3-7. Proportional Cover Within Plots.
Overstory Cover Understory Cover
CScrb22%
Cntrl14%
Low19%
Medium21%
High24%
CScrb20%
High22%
Medium20%
Low17%
Cntrl21%

3 Results
Chart 3-8. Absolute Cover Within Plots by Story.
OVERSTORY UNDERSTORY
HIGH Diversity
Non-Shrub21%
Shrub79%
BareGround7%
UnderstoryLive87%
Litter6%
MEDIUM Diversity
Shrub75%
Non-Shrub25%
BareGround16%
Litter8%
UnderstoryLive76%
Y
LOW Diversity
Non-Shrub33%
Shrub67%
BareGround24%
UnderstoryLive66%
Litter12%
CSCRB Diversity
Shrub78%
Non-Shrub22%
BareGround17%
Litter6%
UnderstoryLive77%
CNTRL Diversity
Non-Shrub49%
Shrub51%
BareGround9% Understory
Live83%
Litter8%

3 Results
3.3.1 HIGH Diversity Plot
Chart 3-9. Absolute Cover Within HIGH Plot by Story.
Overstory Species Understory Species
Silver Bush Lupine13%
Coyote Bush5%
Coast Buckwheat5%
All Others5%
Arroyo Willow40%
Deerweed32%
Red Brome13%
Saltgrass6%
Common Yarrow4%
All Others17%
Beach Bur15%
Creeping Rush45%
Table 3-8. HIGH Plot Cover For All Overstory Shrubs. Prov Dur Phys Taxon CommonName CvrAbs CvrRel
N P S Salix lasiolepis Benth. Arroyo Willow 32.50% 41.18%
N P S Lotus scoparius (Nutt.) Ottley var. scoparius Deerweed 25.18% 31.90%
N P S Lupinus chamissonis Eschsch. Silver Bush Lupine 10.36% 13.12%
N P S Baccharis pilularis DC. Coyote Bush 3.75% 4.75%
N P S Eriogonum parvifolium Smith Coast Buckwheat 3.57% 4.52%
N P S Populus balsamifera L. ssp. trichocarpa (Torrey & A. Gray) Brayshaw Black Cottonwood 2.71% 3.44%
N P S Ericameria ericoides (Less.) Jepson var. ericoides Mock-Heather 0.64% 0.81%
N P S Myrica californica Cham. & Schldl. California Wax Myrtle 0.18% 0.23%
N P S Ribes divaricatum Dougl. Straggly Gooseberry 0.04% 0.05%
Table 3-9. HIGH Plot Cover For Ten Most-Dominant Understory Herbs. Prov Dur Phys Taxon CommonName CvrAbs CvrRel
N P Gm Juncus leseurii Bol. Creeping Rush 38.04% 44.25%
N P F Ambrosia chamissonis (Less.) E. Greene Beach Bur 12.71% 14.79%
A A Gr Bromus madritensis L. ssp. rubens (L.) Husnot Red Brome 11.29% 13.13%
N P Gr Distichlis spicata (L.) E. Greene Saltgrass 5.39% 6.27%
N P F Achillea millefolium L. Common Yarrow 3.75% 4.36%
N P F Camissonia cheiranthifolia (Hornem. ex Sprengel) Raven ssp. cheiranthifolia Beach Evening Primrose 3.07% 3.57%
N A F Cryptantha leiocarpa (F. & M.) E.L.Greene Coast Cryptantha 2.71% 3.16%
N P F Erysimum insulare E. Greene ssp. suffrutescens (Abrams) R. A. Price Suffrutescent Wallflower 2.50% 2.91%
N P F Potentilla anserina L. ssp. pacifica (Howell) Rousi Pacific Silverweed 1.25% 1.45%
N P F Erigeron blochmaniae E. Greene Blochman's Leafy Daisy 0.71% 0.83%

3 Results
3.3.2 MEDIUM Diversity Plot
Chart 3-10. Absolute Cover Within MEDIUM Plot by Story.
Overstory Species Understory Species
All Others2% California Wax
Myrtle2%
Coast Buckwheat3%
Deerweed30%
Arroyo Willow42% Silver Bush Lupine
21%
Beach Bur10%
Coast Cryptantha8%
All Others21%
Clustered Field Sedge
12%
Creeping Rush29%
Red Brome20%
Table 3-10. MEDIUM Plot Cover For All Overstory Shrubs. Prov Dur Phys Taxon CommonName CvrAbs CvrRel
N P S Salix lasiolepis Benth. Arroyo Willow 31.46% 42.08%
N P S Lotus scoparius (Nutt.) Ottley var. scoparius Deerweed 22.50% 30.10%
N P S Lupinus chamissonis Eschsch. Silver Bush Lupine 15.83% 21.18%
N P S Eriogonum parvifolium Smith Coast Buckwheat 2.50% 3.34%
N P S Myrica californica Cham. & Schldl. California Wax Myrtle 1.25% 1.67%
N P S Populus balsamifera L. ssp. trichocarpa (Torrey & A. Gray) Brayshaw Black Cottonwood 0.71% 0.95%
N P S Ericameria ericoides (Less.) Jepson var. ericoides Mock-Heather 0.21% 0.28%
N P S Baccharis pilularis DC. Coyote Bush 0.21% 0.28%
N P S Ribes divaricatum Dougl. Straggly Gooseberry 0.08% 0.11%
Table 3-11. MEDIUM Plot Cover For Ten Most-Dominant Understory Herbs. Prov Dur Phys Taxon CommonName CvrAbs CvrRel
N P Gm Juncus leseurii Bol. Creeping Rush 21.88% 28.93%
A A Gr Bromus madritensis L. ssp. rubens (L.) Husnot Red Brome 15.21% 20.11%
N P Gm Carex praegracilis W. Boott Clustered Field Sedge 9.17% 12.12%
N P F Ambrosia chamissonis (Less.) E. Greene Beach Bur 7.50% 9.92%
N A F Cryptantha leiocarpa (F. & M.) E.L.Greene Coast Cryptantha 6.25% 8.26%
N P F Artemisia douglasiana Bess. Mugwort 2.50% 3.31%
N P F Horkelia cuneata Lindley ssp. cuneata Wedgeleaf Horkelia 2.29% 3.03%
N P Gr Distichlis spicata (L.) E. Greene Saltgrass 1.67% 2.20%
N P Fl Astragalus nuttallii (Torrey & A. Gray) J. Howell var. nuttallii Nuttall Rattlepod 1.50% 1.98%
A A Gr Bromus diandrus Roth Ripgut 1.33% 1.76%
3 Results
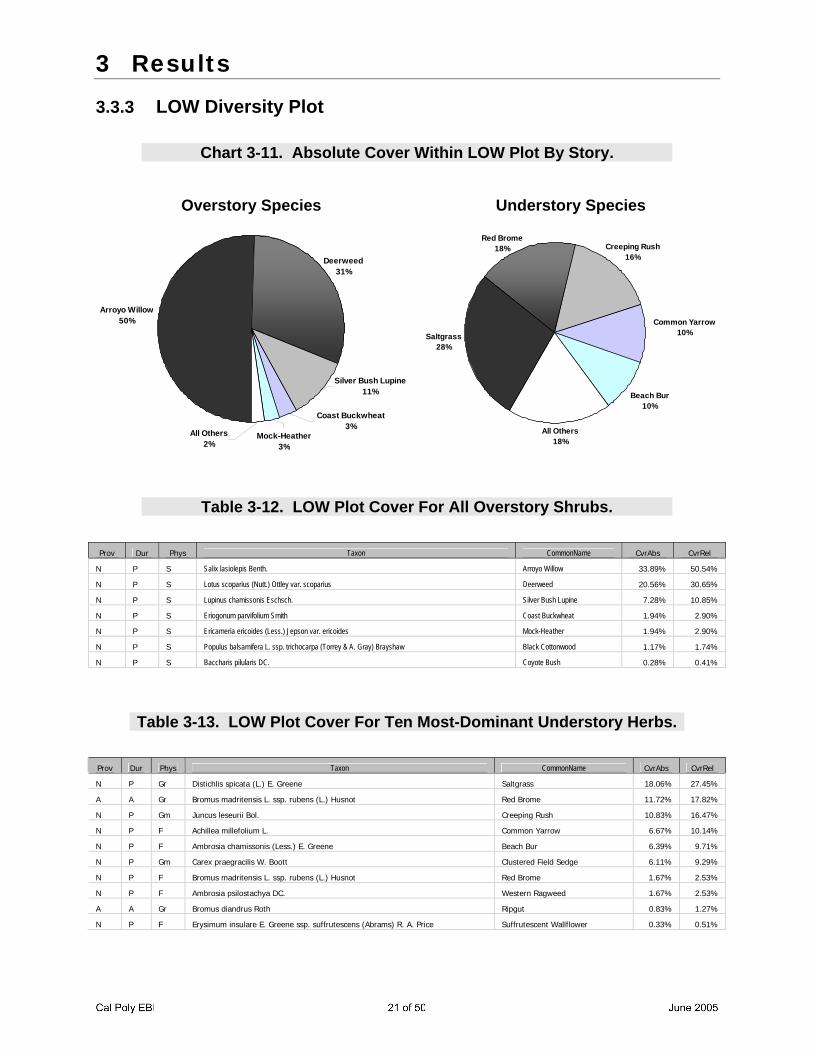
3.3.3 LOW Diversity Plot
Chart 3-11. Absolute Cover Within LOW Plot By Story.
Overstory Species Understory Species
Silver Bush Lupine11%
Arroyo Willow50%
Deerweed31%
Coast Buckwheat3%
Mock-Heather3%
All Others2%
All Others18%
Beach Bur10%
Common Yarrow10%
Red Brome18%
Saltgrass28%
Creeping Rush16%
Table 3-12. LOW Plot Cover For All Overstory Shrubs. Prov Dur Phys Taxon CommonName CvrAbs CvrRel
N P S Salix lasiolepis Benth. Arroyo Willow 33.89% 50.54%
N P S Lotus scoparius (Nutt.) Ottley var. scoparius Deerweed 20.56% 30.65%
N P S Lupinus chamissonis Eschsch. Silver Bush Lupine 7.28% 10.85%
N P S Eriogonum parvifolium Smith Coast Buckwheat 1.94% 2.90%
N P S Ericameria ericoides (Less.) Jepson var. ericoides Mock-Heather 1.94% 2.90%
N P S Populus balsamifera L. ssp. trichocarpa (Torrey & A. Gray) Brayshaw Black Cottonwood 1.17% 1.74%
N P S Baccharis pilularis DC. Coyote Bush 0.28% 0.41%
Table 3-13. LOW Plot Cover For Ten Most-Dominant Understory Herbs. Prov Dur Phys Taxon CommonName CvrAbs CvrRel
N P Gr Distichlis spicata (L.) E. Greene Saltgrass 18.06% 27.45%
A A Gr Bromus madritensis L. ssp. rubens (L.) Husnot Red Brome 11.72% 17.82%
N P Gm Juncus leseurii Bol. Creeping Rush 10.83% 16.47%
N P F Achillea millefolium L. Common Yarrow 6.67% 10.14%
N P F Ambrosia chamissonis (Less.) E. Greene Beach Bur 6.39% 9.71%
N P Gm Carex praegracilis W. Boott Clustered Field Sedge 6.11% 9.29%
N P F Bromus madritensis L. ssp. rubens (L.) Husnot Red Brome 1.67% 2.53%
N P F Ambrosia psilostachya DC. Western Ragweed 1.67% 2.53%
A A Gr Bromus diandrus Roth Ripgut 0.83% 1.27%
N P F Erysimum insulare E. Greene ssp. suffrutescens (Abrams) R. A. Price Suffrutescent Wallflower 0.33% 0.51%
3 Results
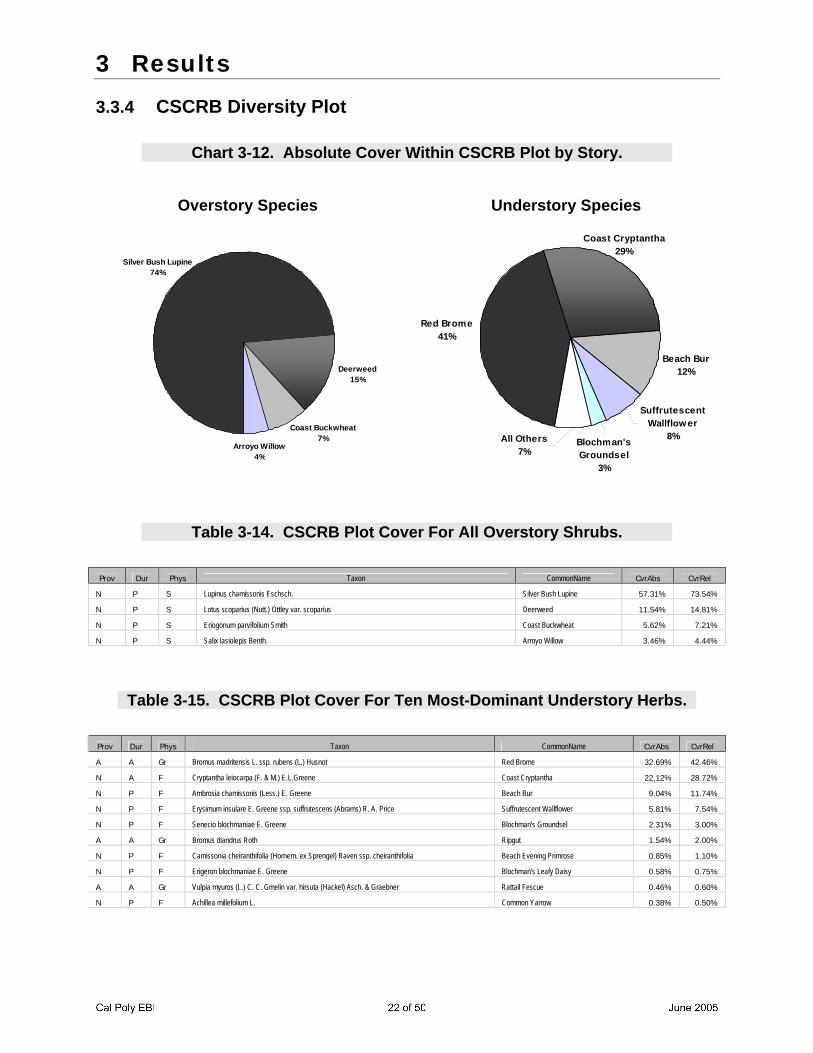
3.3.4 CSCRB Diversity Plot
Chart 3-12. Absolute Cover Within CSCRB Plot by Story.
Overstory Species Understory Species
Arroyo Willow4%
Deerweed15%
Silver Bush Lupine74%
Coast Buckwheat7%
Beach Bur12%
Red Brome41%
Coast Cryptantha29%
Suffrutescent Wallflower
8%Blochman's Groundsel
3%
All Others7%
Table 3-14. CSCRB Plot Cover For All Overstory Shrubs. Prov Dur Phys Taxon CommonName CvrAbs CvrRel
N P S Lupinus chamissonis Eschsch. Silver Bush Lupine 57.31% 73.54%
N P S Lotus scoparius (Nutt.) Ottley var. scoparius Deerweed 11.54% 14.81%
N P S Eriogonum parvifolium Smith Coast Buckwheat 5.62% 7.21%
N P S Salix lasiolepis Benth. Arroyo Willow 3.46% 4.44%
Table 3-15. CSCRB Plot Cover For Ten Most-Dominant Understory Herbs. Prov Dur Phys Taxon CommonName CvrAbs CvrRel
A A Gr Bromus madritensis L. ssp. rubens (L.) Husnot Red Brome 32.69% 42.46%
N A F Cryptantha leiocarpa (F. & M.) E.L.Greene Coast Cryptantha 22.12% 28.72%
N P F Ambrosia chamissonis (Less.) E. Greene Beach Bur 9.04% 11.74%
N P F Erysimum insulare E. Greene ssp. suffrutescens (Abrams) R. A. Price Suffrutescent Wallflower 5.81% 7.54%
N P F Senecio blochmaniae E. Greene Blochman's Groundsel 2.31% 3.00%
A A Gr Bromus diandrus Roth Ripgut 1.54% 2.00%
N P F Camissonia cheiranthifolia (Hornem. ex Sprengel) Raven ssp. cheiranthifolia Beach Evening Primrose 0.85% 1.10%
N P F Erigeron blochmaniae E. Greene Blochman's Leafy Daisy 0.58% 0.75%
A A Gr Vulpia myuros (L.) C. C. Gmelin var. hirsuta (Hackel) Asch. & Graebner Rattail Fescue 0.46% 0.60%
N P F Achillea millefolium L. Common Yarrow 0.38% 0.50%
3 Results
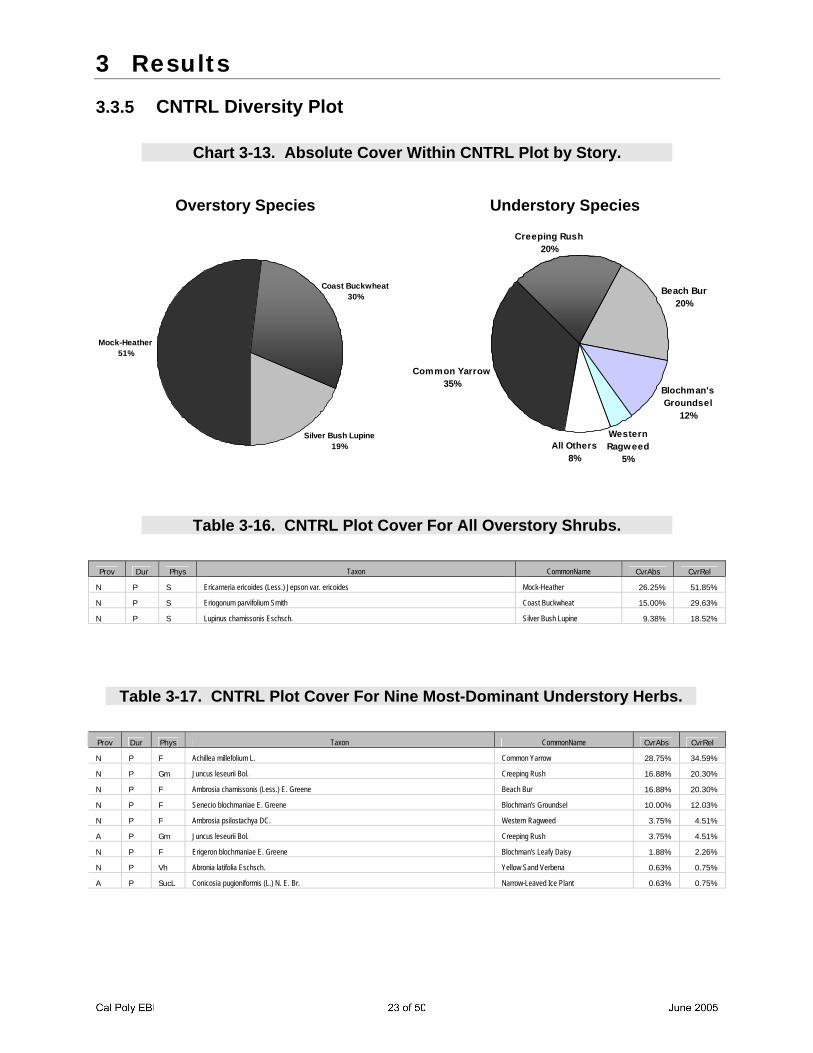
3.3.5 CNTRL Diversity Plot
Chart 3-13. Absolute Cover Within CNTRL Plot by Story.
Overstory Species Understory Species
Silver Bush Lupine19%
Mock-Heather51%
Coast Buckwheat30%
All Others8%
Western Ragweed
5%
Blochman's Groundsel
12%
Creeping Rush20%
Common Yarrow35%
Beach Bur20%
Table 3-16. CNTRL Plot Cover For All Overstory Shrubs. Prov Dur Phys Taxon CommonName CvrAbs CvrRel
N P S Ericameria ericoides (Less.) Jepson var. ericoides Mock-Heather 26.25% 51.85%
N P S Eriogonum parvifolium Smith Coast Buckwheat 15.00% 29.63%
N P S Lupinus chamissonis Eschsch. Silver Bush Lupine 9.38% 18.52%
Table 3-17. CNTRL Plot Cover For Nine Most-Dominant Understory Herbs. Prov Dur Phys Taxon CommonName CvrAbs CvrRel
N P F Achillea millefolium L. Common Yarrow 28.75% 34.59%
N P Gm Juncus leseurii Bol. Creeping Rush 16.88% 20.30%
N P F Ambrosia chamissonis (Less.) E. Greene Beach Bur 16.88% 20.30%
N P F Senecio blochmaniae E. Greene Blochman's Groundsel 10.00% 12.03%
N P F Ambrosia psilostachya DC. Western Ragweed 3.75% 4.51%
A P Gm Juncus leseurii Bol. Creeping Rush 3.75% 4.51%
N P F Erigeron blochmaniae E. Greene Blochman's Leafy Daisy 1.88% 2.26%
N P Vh Abronia latifolia Eschsch. Yellow Sand Verbena 0.63% 0.75%
A P SucL Conicosia pugioniformis (L.) N. E. Br. Narrow-Leaved Ice Plant 0.63% 0.75%

3 Results
Photo 3-1. Plot Cover Comparison at 9 and 52 Months. AW = Arroyo Willow; SBL = Silver Bush Lupine
2001-05 9 mo 2005-04 52 mo
HIGH Diversity Plot
MEDIUM Diversity Plot
SBL
AW
SBL
3 Results
Photo 3-2. Plot Cover Comparison at 22 and 52 months. AW = Arroyo Willow; SBL = Silver Bush Lupine
2002-05 22 mo 2005-04 52 mo
CSCRB Diversity Plot
SBL
4 Conclusions and Recommendations
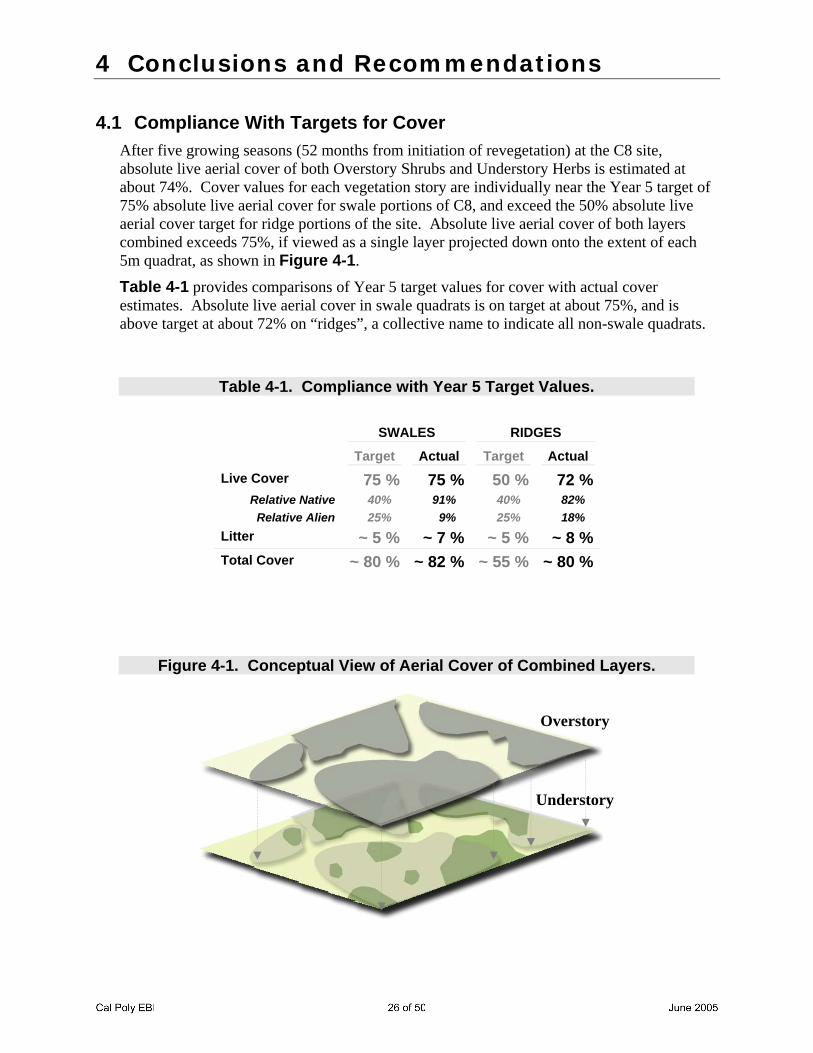
4.1 Compliance With Targets for Cover After five growing seasons (52 months from initiation of revegetation) at the C8 site, absolute live aerial cover of both Overstory Shrubs and Understory Herbs is estimated at about 74%. Cover values for each vegetation story are individually near the Year 5 target of 75% absolute live aerial cover for swale portions of C8, and exceed the 50% absolute live aerial cover target for ridge portions of the site. Absolute live aerial cover of both layers combined exceeds 75%, if viewed as a single layer projected down onto the extent of each 5m quadrat, as shown in Figure 4-1.
Table 4-1 provides comparisons of Year 5 target values for cover with actual cover estimates. Absolute live aerial cover in swale quadrats is on target at about 75%, and is above target at about 72% on “ridges”, a collective name to indicate all non-swale quadrats.
Table 4-1. Compliance with Year 5 Target Values.
SWALES RIDGES
Target Actual Target Actual Live Cover 75 % 75 % 50 % 72 %
Relative Native 40% 91% 40% 82% Relative Alien 25% 9% 25% 18%
Litter ~ 5 % ~ 7 % ~ 5 % ~ 8 % Total Cover ~ 80 % ~ 82 % ~ 55 % ~ 80 %
Figure 4-1. Conceptual View of Aerial Cover of Combined Layers.
Overstory
Understory

4 Conclusions and Recommendations
Absolute live aerial cover in swales within the HIGH and MEDIUM Diversity plots is well above target values, and has exceeded expectations for survival, growth rate, and individual plant size at this stage of revegetation. Photo 4-1 shows shrub cover over the HIGH and MEDIUM Diversity plots at 52 months.
Photo 4-1. Overstory Cover at 52 Months. AW = Arroyo Willow; SBL = Silver Bush Lupine
HIGH Diversity Plot
MEDIUM Diversity Plot
SBL
AW
AW SBL
AW
AW
4 Conclusions and Recommendations
4.2 Other Notable Patterns
4.2.1 Native Grasses and Graminoids. Native, rhizomatous graminoids, Spreading Rush, Juncus leseurii, and Clustered Field Sedge, Carex praegracilis, as well as native, rhizomatous grasses, Creeping Wildrye, Leymus triticoides, and Saltgrass, Distichlis spicata, continue to spread throughout the lower, moister areas of the High, Medium, and Low diversity plots, forming dense carpets over much of these plots.
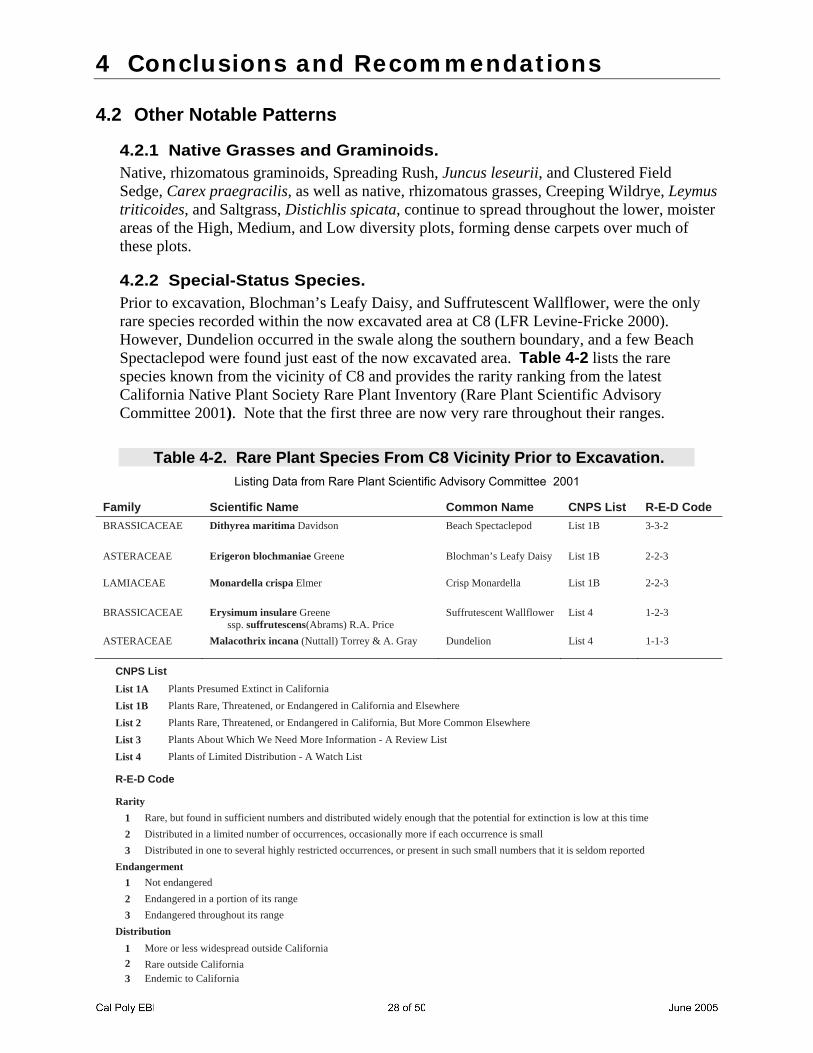
4.2.2 Special-Status Species. Prior to excavation, Blochman’s Leafy Daisy, and Suffrutescent Wallflower, were the only rare species recorded within the now excavated area at C8 (LFR Levine-Fricke 2000). However, Dundelion occurred in the swale along the southern boundary, and a few Beach Spectaclepod were found just east of the now excavated area. Table 4-2 lists the rare species known from the vicinity of C8 and provides the rarity ranking from the latest California Native Plant Society Rare Plant Inventory (Rare Plant Scientific Advisory Committee 2001). Note that the first three are now very rare throughout their ranges.
Table 4-2. Rare Plant Species From C8 Vicinity Prior to Excavation.
Listing Data from Rare Plant Scientific Advisory Committee 2001
Family Scientific Name Common Name CNPS List R-E-D Code BRASSICACEAE Dithyrea maritima Davidson Beach Spectaclepod List 1B 3-3-2
ASTERACEAE Erigeron blochmaniae Greene Blochman’s Leafy Daisy List 1B 2-2-3
LAMIACEAE Monardella crispa Elmer Crisp Monardella List 1B 2-2-3
BRASSICACEAE Erysimum insulare Greene ssp. suffrutescens(Abrams) R.A. Price
Suffrutescent Wallflower List 4 1-2-3
ASTERACEAE Malacothrix incana (Nuttall) Torrey & A. Gray Dundelion List 4 1-1-3
CNPS List List 1A Plants Presumed Extinct in California List 1B Plants Rare, Threatened, or Endangered in California and Elsewhere List 2 Plants Rare, Threatened, or Endangered in California, But More Common Elsewhere List 3 Plants About Which We Need More Information - A Review List List 4 Plants of Limited Distribution - A Watch List
R-E-D Code
Rarity 1 Rare, but found in sufficient numbers and distributed widely enough that the potential for extinction is low at this time 2 Distributed in a limited number of occurrences, occasionally more if each occurrence is small 3 Distributed in one to several highly restricted occurrences, or present in such small numbers that it is seldom reported
Endangerment 1 Not endangered 2 Endangered in a portion of its range 3 Endangered throughout its range
Distribution 1 More or less widespread outside California 2 Rare outside California 3 Endemic to California
4 Conclusions and Recommendations
Suffrutescent Wallflower continues to increase in number and cover at C8, and now constitutes about 5.25% (1.3% in swales, 3.9% on ridges) absolute cover in the Understory. Blochman’s Leafy Daisy is still relatively scarce over C8, and now amounts to about 1.1% (0.4% in swales, 0.7 on ridges) absolute cover in the Understory.
4.2.3 Naturalized Alien Species. The only naturalized alien species with significant presence at C8 is Red Brome, now exhibiting absolute cover values in the Understory of about 11% in swales, and about 23% on ridges. Red Brome has continued to increase throughout much of the site as the soil stabilizes, and as its seedbank increases. Substantial rainfall (59mm, 2.3 in) during October 2004, followed by ample winter rainfall (350mm, 14.75in), promoted both lush growth and plentiful seed production by Red Brome that will likely increase cover and density of Red Brome in years to come. Weed control efforts at C8 have been effective at keeping other naturalized alien species at relatively low levels. Thus far, no Veldtgrass, Ehrharta calycina J.E.Smith, has established within plots at C8.
4.3 Recommendations Now that vegetation cover targets for Year 5 have been met, we recommend that annual spring monitoring of vegetation cover at C8 be terminated. Further vegetation monitoring at C8 should continue at the discretion of both the Guadalupe Restoration Project Steering Committee and regulatory agencies to further specific management goals in the ongoing restoration effort.
5 References
Adobe® Acrobat® Professional. 2003. Cross-
platform electronic and pre-press document production software. Version 6.0 for Microsoft® Windows®. San Jose, CA: Adobe® Systems Incorporated. Licensed to Cal Poly State University, San Luis Obispo.
Adobe® Illustrator®. 2002. Art production software. Version 10 for Microsoft® Windows®. San Jose, CA: Adobe® Systems Incorporated. Licensed to Cal Poly State University, San Luis Obispo.
ArcGIS Desktop™. 2002. Geographic information system software. Version 8.3. Redlands, CA: Environmental Systems Research Institute (ESRI®), Incorporated. Licensed to Cal Poly State University, San Luis Obispo.
Bonham, C.D. 1989. Measurements for Terrestrial Vegetation. New York: John Wiley & Sons.
Cain, S.A.; Castro, G.M. de O. 1959. Manual of Vegetation Analysis. New York: Harper Collins.
Cal Poly State University; Cannon Associates; Industrial Technology Corporation; Jordan Environmental Services. 2000. Site-Specific Restoration Plan for the C8 Site. Guadalupe Remediation and Restoration Projects. Technical report prepared for Unocal Central Coast Group, Guadalupe, California.
Carr, R. 2004. XLStatistics 5.70 Microsoft® Office Excel®Workbooks for Statistical Data Analysis. Shareware computer software. http://www.deakin.edu.au/~rodneyc/xlstats.htm
Curto, M.L. 2004. Revegetation Monitoring at the Guadalupe Restoration Project C8 Site. Master’s Thesis. Cal Poly State University, San Luis Obispo.
Dallmeier, F. 1992. Long-term monitoring of biological diversity in tropical forest areas: methods for establishment and inventory of permanent plots. MAB Digest 11. Paris: UNESCO.
Daubenmire, R. 1959. A canopy-coverage method of vegetational analysis. Northwest Science 33: 43-64.
Harper, J.L. 1977. Population Biology of Plants. London: Academic Press.
Hegarty, P. 2001. Guadalupe Dunes: Permanent Plot Placement and Swale Sampling. Technical report prepared for Cal Poly State University, San Luis Obispo.
Hickman, J.C. (ed.) 1993. The Jepson Manual: Higher Plants of California. Third reprint 1996. Berkeley: University of California Press. [updates at http://ucjeps.herb.berkeley.edu/]
Holland, V.L.; Curto, M.L. 2001. Guadalupe
Remediation and Restoration Projects. Restoration of the C8 Site: 2001 Monitoring of Revegetation. Technical report. Biological Sciences Department, Cal Poly State University, San Luis Obispo.
Holland, V.L.; Curto, M.L. 2002. Guadalupe Remediation and Restoration Projects. Restoration of the C8 Site: 2002 Monitoring of Revegetation. Technical report. Biological Sciences Department, Cal Poly State University, San Luis Obispo.
Holland, V.L.; Curto, M.L. 2003. Guadalupe Remediation and Restoration Projects. Restoration of the C8 Site: 2003 Monitoring of Revegetation. Technical report. Biological Sciences Department, Cal Poly State University, San Luis Obispo.
Holland, V.L.; Curto, M.L. 2004. Guadalupe Remediation and Restoration Projects. Restoration of the C8 Site: 2004 Monitoring of Revegetation. Technical report. Biological Sciences Department, Cal Poly State University, San Luis Obispo.
Interagency Technical Team. 1996. Sampling Vegetation Attributes. Interagency Technical Reference. BLM/RS/ST-96/002+1730.
Kent, M.; and Coker, P. 1992. Vegetation Description and Analysis: A Practical Approach. Boca Raton, FL: CRC Press.
LFR Levine-Fricke. 2000. Results of Vegetation Studies Conducted in November 1999 at the C8 Area of the Former Guadalupe Oil Field, San Luis Obispo, California. Technical report LFR 6607.20-204 prepared for Unocal Central Coast Group, Guadalupe, California.
Microsoft® Office Excel®. 2003. Spreadsheet software. Version 2003. Redmond, WA: Microsoft® Corporation. Licensed to Cal Poly State University, San Luis Obispo.
Muller-Dombois, D.; and Ellenberg, H. 1974. Aims and Methods of Vegetation Ecology. New York: John Wiley & Sons, Inc.
Roberts-Pichette, P., and Gillespie, L. 1999. Terrestrial Vegetation Biodiversity Monitoring Protocols. Ecological Monitoring and Assessment Network Occasional Paper Series, Report No. 9. Burlington, Ontario: Ecological Monitoring Coordinating Office. http://www.eman-rese.ca/eman/ecotools/protocols/terrestrial/ vegetation/.
SpreadCE. 2003. Spreadsheet software. Version 1.19 for PocketPC 2003 (freeware). Bye Design Ltd. http://www.byedesign.freeserve.co.uk.

Appendix 1: 5m Site and Plot Data
Lifeform Attributes
Provenance
N Native
A Alien
Duration
P Perennial
A Annual
Physiognomic Type
S Shrub
DS Dwarf Shrub
Vh Herbaceous Vine
SucL Leaf Succulent
F Forb
Fl Legume Forb
Gr True Grass
Gm Graminoid
FIELD DESCRIPTION CALCULATION
CvrAbs Absolute percent cover Sum Species MidPt % ÷ Number of Samples
CvrRel Relative percent cover (Sum Species MidPt % ÷ All MidPt %) x 100
Appendix 1: 5m Site and Plot Data
SITE > Shrub Overstory
PLOT Percent Cover PercentAll CvrAbs% CvrRel%
High 1105.00% 1400.00% 78.93% 100.00%
Medium 897.00% 1200.00% 74.75% 100.00%
Low 603.50% 900.00% 67.06% 100.00%
CScrb 1013.00% 1300.00% 77.92% 100.00%
Cntrl 202.50% 400.00% 50.63% 100.00%
ALL 3821.00% 5200.00% 73.48%
Pro
ven
ance
Du
rati
on
Ph
ysio
gnom
y
TaxonName CommonName CvrAbs CvrRel
N P S Lupinus chamissonis Eschsch. Silver Bush Lupine 22.75% 30.95% N P S Salix lasiolepis Benth. Arroyo Willow 22.74% 30.94% N P S Lotus scoparius (Nutt.) Ottley var. scoparius Deerweed 18.41% 25.05% N P S Eriogonum parvifolium Smith Coast Buckwheat 4.43% 6.03% N P S Ericameria ericoides (Less.) Jepson var. ericoides Mock-Heather 2.58% 3.51% N P S Baccharis pilularis DC. Coyote Bush 1.11% 1.50% N P S Populus balsamifera L. ssp. trichocarpa (Torrey & A. Gray) Brayshaw Black Cottonwood 1.10% 1.49% N P S Myrica californica Cham. & Schldl. California Wax Myrtle 0.34% 0.46% N P S Ribes divaricatum Dougl. Straggly Gooseberry 0.03% 0.04% N P S Rhamnus californica Eschsch. ssp. californica California Coffeeberry 0.02% 0.03% N P S Quercus agrifolia Nee var. agrifolia Coast Live Oak 0.01% 0.01% N P S Lupinus arboreus Sims. Yellow Tree Lupine 0.00% 0.00% N P S Shrub Total 73.51% 100.00% x x x Non-Shrub Total 26.49%
Appendix 1: 5m Site and Plot Data
HIGH DIVERSITY > Shrub Overstory
Pro
ven
ance
Du
rati
on
Ph
ysio
gnom
y
TaxonName CommonName PercentCover PercentAll CvrAbs% CvrRel%
N P S Salix lasiolepis Benth. Arroyo Willow 455.00% 1400 32.50% 41.18%
N P S Lotus scoparius (Nutt.) Ottley var. scoparius Deerweed 352.50% 1400 25.18% 31.90%
N P S Lupinus chamissonis Eschsch. Silver Bush Lupine 145.00% 1400 10.36% 13.12%
N P S Baccharis pilularis DC. Coyote Bush 52.50% 1400 3.75% 4.75%
N P S Eriogonum parvifolium Smith Coast Buckwheat 50.00% 1400 3.57% 4.52%
N P S Populus balsamifera L. ssp. trichocarpa (Torrey & A. Gray) Brayshaw Black Cottonwood 38.00% 1400 2.71% 3.44%
N P S Ericameria ericoides (Less.) Jepson var. ericoides Mock-Heather 9.00% 1400 0.64% 0.81%
N P S Myrica californica Cham. & Schldl. California Wax Myrtle 2.50% 1400 0.18% 0.23%
N P S Ribes divaricatum Dougl. Straggly Gooseberry 0.50% 1400 0.04% 0.05%
N P S Shrub Total 1105.00% 1400 78.93% 100.00%
x x x Non-Shrub Total 295.00% 1400 21.07%
Appendix 1: 5m Site and Plot Data
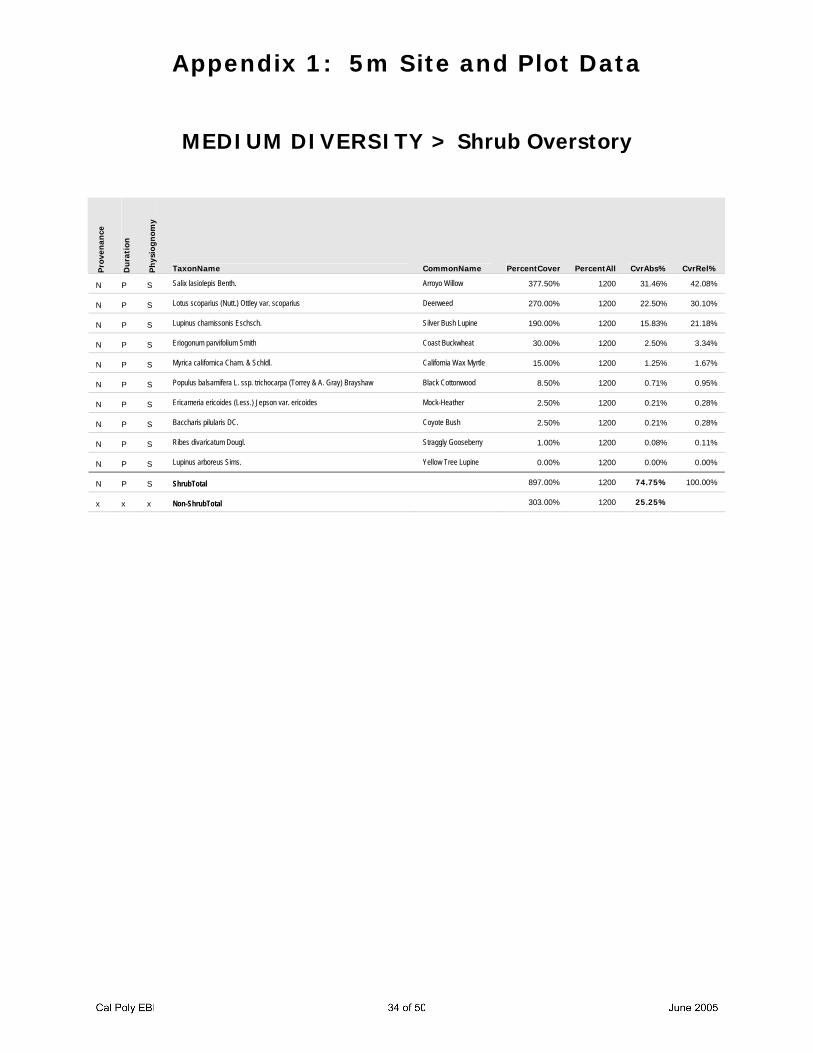
MEDIUM DIVERSITY > Shrub Overstory
Pro
ven
ance
Du
rati
on
Ph
ysio
gnom
y
TaxonName CommonName PercentCover PercentAll CvrAbs% CvrRel%
N P S Salix lasiolepis Benth. Arroyo Willow 377.50% 1200 31.46% 42.08%
N P S Lotus scoparius (Nutt.) Ottley var. scoparius Deerweed 270.00% 1200 22.50% 30.10%
N P S Lupinus chamissonis Eschsch. Silver Bush Lupine 190.00% 1200 15.83% 21.18%
N P S Eriogonum parvifolium Smith Coast Buckwheat 30.00% 1200 2.50% 3.34%
N P S Myrica californica Cham. & Schldl. California Wax Myrtle 15.00% 1200 1.25% 1.67%
N P S Populus balsamifera L. ssp. trichocarpa (Torrey & A. Gray) Brayshaw Black Cottonwood 8.50% 1200 0.71% 0.95%
N P S Ericameria ericoides (Less.) Jepson var. ericoides Mock-Heather 2.50% 1200 0.21% 0.28%
N P S Baccharis pilularis DC. Coyote Bush 2.50% 1200 0.21% 0.28%
N P S Ribes divaricatum Dougl. Straggly Gooseberry 1.00% 1200 0.08% 0.11%
N P S Lupinus arboreus Sims. Yellow Tree Lupine 0.00% 1200 0.00% 0.00%
N P S ShrubTotal 897.00% 1200 74.75% 100.00%
x x x Non-ShrubTotal 303.00% 1200 25.25%

Appendix 1: 5m Site and Plot Data
LOW DIVERSITY > Shrub Overstory
Pro
ven
ance
Du
rati
on
Ph
ysio
gnom
y
TaxonName CommonName PercentCover PercentAll CvrAbs% CvrRel%
N P S Salix lasiolepis Benth. Arroyo Willow 305.00% 900 33.89% 50.54%
N P S Lotus scoparius (Nutt.) Ottley var. scoparius Deerweed 185.00% 900 20.56% 30.65%
N P S Lupinus chamissonis Eschsch. Silver Bush Lupine 65.50% 900 7.28% 10.85%
N P S Eriogonum parvifolium Smith Coast Buckwheat 17.50% 900 1.94% 2.90%
N P S Ericameria ericoides (Less.) Jepson var. ericoides Mock-Heather 17.50% 900 1.94% 2.90%
N P S Populus balsamifera L. ssp. trichocarpa (Torrey & A. Gray) Brayshaw Black Cottonwood 10.50% 900 1.17% 1.74%
N P S Baccharis pilularis DC. Coyote Bush 2.50% 900 0.28% 0.41%
N P S ShrubTotal 603.50% 900 67.06% 100.00%
x x x Non-ShrubTotal 296.50% 900 32.94%

Appendix 1: 5m Site and Plot Data
CSCRB DIVERSITY > Shrub Overstory
Pro
ven
ance
Du
rati
on
Ph
ysio
gnom
y
TaxonName CommonName PercentCover PercentAll CvrAbs% CvrRel%
N P S Lupinus chamissonis Eschsch. Silver Bush Lupine 745.00% 1300 57.31% 73.54%
N P S Lotus scoparius (Nutt.) Ottley var. scoparius Deerweed 150.00% 1300 11.54% 14.81%
N P S Eriogonum parvifolium Smith Coast Buckwheat 73.00% 1300 5.62% 7.21%
N P S Salix lasiolepis Benth. Arroyo Willow 45.00% 1300 3.46% 4.44%
N P S ShrubTotal 1013.00% 1300 77.92% 100.00%
x x x Non-ShrubTotal 287.00% 1300 22.08%

Appendix 1: 5m Site and Plot Data
CNTRL DIVERSITY > Shrub Overstory
Pro
ven
ance
Du
rati
on
Ph
ysio
gnom
y
TaxonName CommonName PercentCover PercentAll CvrAbs% CvrRel%
N P S Ericameria ericoides (Less.) Jepson var. ericoides Mock-Heather 105.00% 400 26.25% 51.85%
N P S Eriogonum parvifolium Smith Coast Buckwheat 60.00% 400 15.00% 29.63%
N P S Lupinus chamissonis Eschsch. Silver Bush Lupine 37.50% 400 9.38% 18.52%
x x x ShrubTotal Non-ShrubTotal 202.50% 400 50.63% 100.00%
N P S Non-ShrubTotal 197.50% 400 49.38%
Appendix 1: 5m Site and Plot Data
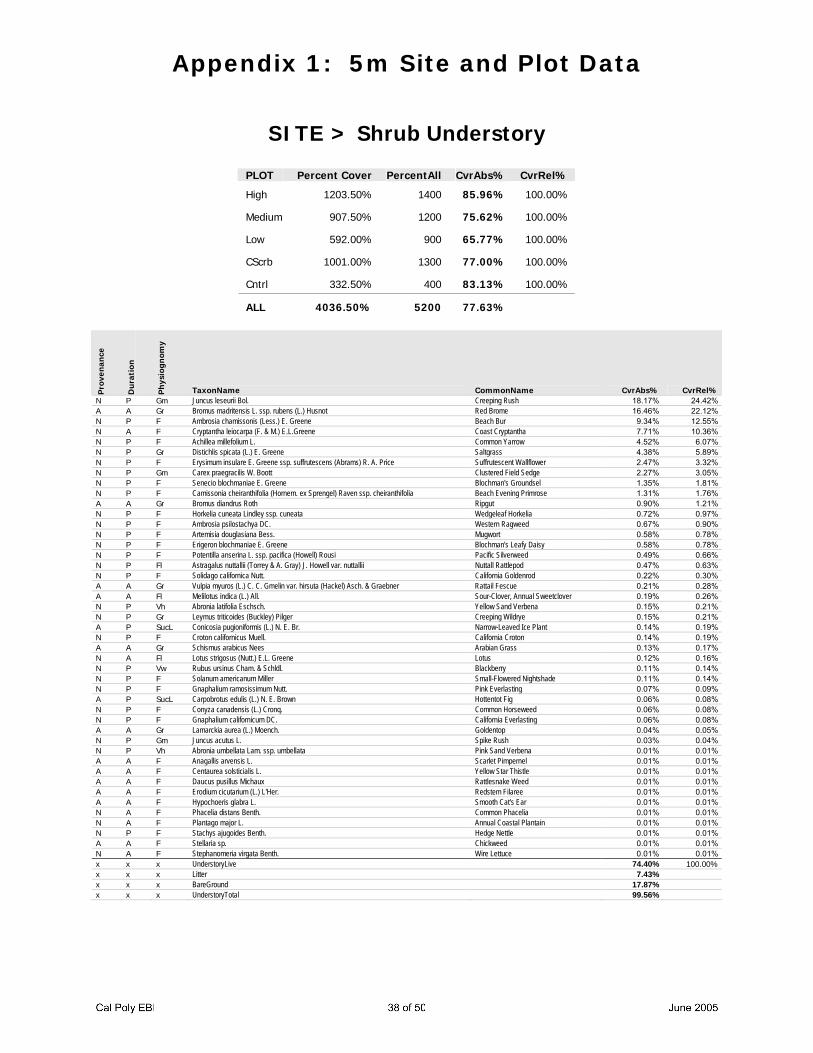
SITE > Shrub Understory
PLOT Percent Cover PercentAll CvrAbs% CvrRel%
High 1203.50% 1400 85.96% 100.00%
Medium 907.50% 1200 75.62% 100.00%
Low 592.00% 900 65.77% 100.00%
CScrb 1001.00% 1300 77.00% 100.00%
Cntrl 332.50% 400 83.13% 100.00%
ALL 4036.50% 5200 77.63%
Pro
ven
ance
Du
rati
on
Ph
ysio
gnom
y
TaxonName CommonName CvrAbs% CvrRel%N P Gm Juncus leseurii Bol. Creeping Rush 18.17% 24.42%A A Gr Bromus madritensis L. ssp. rubens (L.) Husnot Red Brome 16.46% 22.12%N P F Ambrosia chamissonis (Less.) E. Greene Beach Bur 9.34% 12.55%N A F Cryptantha leiocarpa (F. & M.) E.L.Greene Coast Cryptantha 7.71% 10.36%N P F Achillea millefolium L. Common Yarrow 4.52% 6.07%N P Gr Distichlis spicata (L.) E. Greene Saltgrass 4.38% 5.89%N P F Erysimum insulare E. Greene ssp. suffrutescens (Abrams) R. A. Price Suffrutescent Wallflower 2.47% 3.32%N P Gm Carex praegracilis W. Boott Clustered Field Sedge 2.27% 3.05%N P F Senecio blochmaniae E. Greene Blochman's Groundsel 1.35% 1.81%N P F Camissonia cheiranthifolia (Hornem. ex Sprengel) Raven ssp. cheiranthifolia Beach Evening Primrose 1.31% 1.76%A A Gr Bromus diandrus Roth Ripgut 0.90% 1.21%N P F Horkelia cuneata Lindley ssp. cuneata Wedgeleaf Horkelia 0.72% 0.97%N P F Ambrosia psilostachya DC. Western Ragweed 0.67% 0.90%N P F Artemisia douglasiana Bess. Mugwort 0.58% 0.78%N P F Erigeron blochmaniae E. Greene Blochman's Leafy Daisy 0.58% 0.78%N P F Potentilla anserina L. ssp. pacifica (Howell) Rousi Pacific Silverweed 0.49% 0.66%N P Fl Astragalus nuttallii (Torrey & A. Gray) J. Howell var. nuttallii Nuttall Rattlepod 0.47% 0.63%N P F Solidago californica Nutt. California Goldenrod 0.22% 0.30%A A Gr Vulpia myuros (L.) C. C. Gmelin var. hirsuta (Hackel) Asch. & Graebner Rattail Fescue 0.21% 0.28%A A Fl Melilotus indica (L.) All. Sour-Clover, Annual Sweetclover 0.19% 0.26%N P Vh Abronia latifolia Eschsch. Yellow Sand Verbena 0.15% 0.21%N P Gr Leymus triticoides (Buckley) Pilger Creeping Wildrye 0.15% 0.21%A P SucL Conicosia pugioniformis (L.) N. E. Br. Narrow-Leaved Ice Plant 0.14% 0.19%N P F Croton californicus Muell. California Croton 0.14% 0.19%A A Gr Schismus arabicus Nees Arabian Grass 0.13% 0.17%N A Fl Lotus strigosus (Nutt.) E.L. Greene Lotus 0.12% 0.16%N P Vw Rubus ursinus Cham. & Schldl. Blackberry 0.11% 0.14%N P F Solanum americanum Miller Small-Flowered Nightshade 0.11% 0.14%N P F Gnaphalium ramosissimum Nutt. Pink Everlasting 0.07% 0.09%A P SucL Carpobrotus edulis (L.) N. E. Brown Hottentot Fig 0.06% 0.08%N P F Conyza canadensis (L.) Cronq. Common Horseweed 0.06% 0.08%N P F Gnaphalium californicum DC. California Everlasting 0.06% 0.08%A A Gr Lamarckia aurea (L.) Moench. Goldentop 0.04% 0.05%N P Gm Juncus acutus L. Spike Rush 0.03% 0.04%N P Vh Abronia umbellata Lam. ssp. umbellata Pink Sand Verbena 0.01% 0.01%A A F Anagallis arvensis L. Scarlet Pimpernel 0.01% 0.01%A A F Centaurea solsticialis L. Yellow Star Thistle 0.01% 0.01%A A F Daucus pusillus Michaux Rattlesnake Weed 0.01% 0.01%A A F Erodium cicutarium (L.) L'Her. Redstem Filaree 0.01% 0.01%A A F Hypochoeris glabra L. Smooth Cat's Ear 0.01% 0.01%N A F Phacelia distans Benth. Common Phacelia 0.01% 0.01%N A F Plantago major L. Annual Coastal Plantain 0.01% 0.01%N P F Stachys ajugoides Benth. Hedge Nettle 0.01% 0.01%A A F Stellaria sp. Chickweed 0.01% 0.01%N A F Stephanomeria virgata Benth. Wire Lettuce 0.01% 0.01%x x x UnderstoryLive 74.40% 100.00%x x x Litter 7.43% x x x BareGround 17.87% x x x UnderstoryTotal 99.56%
Appendix 1: 5m Site and Plot Data
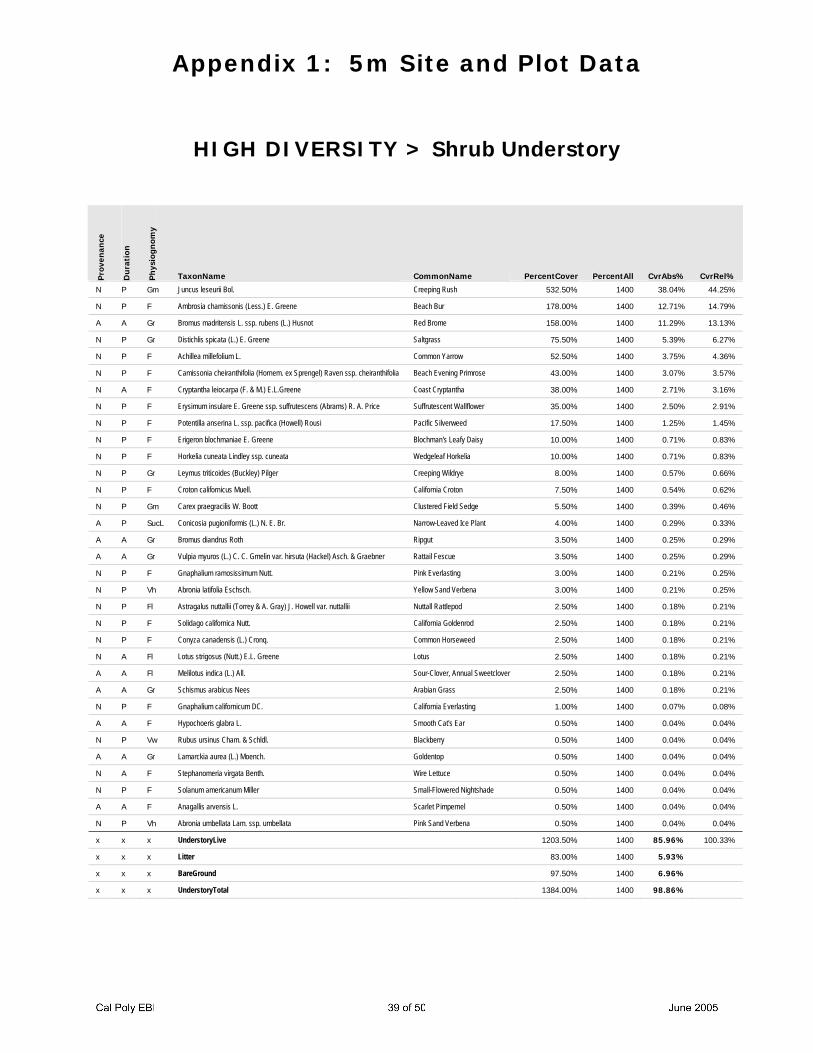
HIGH DIVERSITY > Shrub Understory
Pro
ven
ance
Du
rati
on
Ph
ysio
gnom
y
TaxonName CommonName PercentCover PercentAll CvrAbs% CvrRel%
N P Gm Juncus leseurii Bol. Creeping Rush 532.50% 1400 38.04% 44.25%
N P F Ambrosia chamissonis (Less.) E. Greene Beach Bur 178.00% 1400 12.71% 14.79%
A A Gr Bromus madritensis L. ssp. rubens (L.) Husnot Red Brome 158.00% 1400 11.29% 13.13%
N P Gr Distichlis spicata (L.) E. Greene Saltgrass 75.50% 1400 5.39% 6.27%
N P F Achillea millefolium L. Common Yarrow 52.50% 1400 3.75% 4.36%
N P F Camissonia cheiranthifolia (Hornem. ex Sprengel) Raven ssp. cheiranthifolia Beach Evening Primrose 43.00% 1400 3.07% 3.57%
N A F Cryptantha leiocarpa (F. & M.) E.L.Greene Coast Cryptantha 38.00% 1400 2.71% 3.16%
N P F Erysimum insulare E. Greene ssp. suffrutescens (Abrams) R. A. Price Suffrutescent Wallflower 35.00% 1400 2.50% 2.91%
N P F Potentilla anserina L. ssp. pacifica (Howell) Rousi Pacific Silverweed 17.50% 1400 1.25% 1.45%
N P F Erigeron blochmaniae E. Greene Blochman's Leafy Daisy 10.00% 1400 0.71% 0.83%
N P F Horkelia cuneata Lindley ssp. cuneata Wedgeleaf Horkelia 10.00% 1400 0.71% 0.83%
N P Gr Leymus triticoides (Buckley) Pilger Creeping Wildrye 8.00% 1400 0.57% 0.66%
N P F Croton californicus Muell. California Croton 7.50% 1400 0.54% 0.62%
N P Gm Carex praegracilis W. Boott Clustered Field Sedge 5.50% 1400 0.39% 0.46%
A P SucL Conicosia pugioniformis (L.) N. E. Br. Narrow-Leaved Ice Plant 4.00% 1400 0.29% 0.33%
A A Gr Bromus diandrus Roth Ripgut 3.50% 1400 0.25% 0.29%
A A Gr Vulpia myuros (L.) C. C. Gmelin var. hirsuta (Hackel) Asch. & Graebner Rattail Fescue 3.50% 1400 0.25% 0.29%
N P F Gnaphalium ramosissimum Nutt. Pink Everlasting 3.00% 1400 0.21% 0.25%
N P Vh Abronia latifolia Eschsch. Yellow Sand Verbena 3.00% 1400 0.21% 0.25%
N P Fl Astragalus nuttallii (Torrey & A. Gray) J. Howell var. nuttallii Nuttall Rattlepod 2.50% 1400 0.18% 0.21%
N P F Solidago californica Nutt. California Goldenrod 2.50% 1400 0.18% 0.21%
N P F Conyza canadensis (L.) Cronq. Common Horseweed 2.50% 1400 0.18% 0.21%
N A Fl Lotus strigosus (Nutt.) E.L. Greene Lotus 2.50% 1400 0.18% 0.21%
A A Fl Melilotus indica (L.) All. Sour-Clover, Annual Sweetclover 2.50% 1400 0.18% 0.21%
A A Gr Schismus arabicus Nees Arabian Grass 2.50% 1400 0.18% 0.21%
N P F Gnaphalium californicum DC. California Everlasting 1.00% 1400 0.07% 0.08%
A A F Hypochoeris glabra L. Smooth Cat's Ear 0.50% 1400 0.04% 0.04%
N P Vw Rubus ursinus Cham. & Schldl. Blackberry 0.50% 1400 0.04% 0.04%
A A Gr Lamarckia aurea (L.) Moench. Goldentop 0.50% 1400 0.04% 0.04%
N A F Stephanomeria virgata Benth. Wire Lettuce 0.50% 1400 0.04% 0.04%
N P F Solanum americanum Miller Small-Flowered Nightshade 0.50% 1400 0.04% 0.04%
A A F Anagallis arvensis L. Scarlet Pimpernel 0.50% 1400 0.04% 0.04%
N P Vh Abronia umbellata Lam. ssp. umbellata Pink Sand Verbena 0.50% 1400 0.04% 0.04%
x x x UnderstoryLive 1203.50% 1400 85.96% 100.33%
x x x Litter 83.00% 1400 5.93%
x x x BareGround 97.50% 1400 6.96%
x x x UnderstoryTotal 1384.00% 1400 98.86%

Appendix 1: 5m Site and Plot Data
MEDIUM DIVERSITY > Shrub Understory
Pro
ven
ance
Du
rati
on
Ph
ysio
gnom
y
TaxonName CommonName PercentCover PercentAll CvrAbs% CvrRel%
N P Gm Juncus leseurii Bol. Creeping Rush 262.50% 1200 21.88% 28.93%
A A Gr Bromus madritensis L. ssp. rubens (L.) Husnot Red Brome 182.50% 1200 15.21% 20.11%
N P Gm Carex praegracilis W. Boott Clustered Field Sedge 110.00% 1200 9.17% 12.12%
N P F Ambrosia chamissonis (Less.) E. Greene Beach Bur 90.00% 1200 7.50% 9.92%
N A F Cryptantha leiocarpa (F. & M.) E.L.Greene Coast Cryptantha 75.00% 1200 6.25% 8.26%
N P F Artemisia douglasiana Bess. Mugwort 30.00% 1200 2.50% 3.31%
N P F Horkelia cuneata Lindley ssp. cuneata Wedgeleaf Horkelia 27.50% 1200 2.29% 3.03%
N P Gr Distichlis spicata (L.) E. Greene Saltgrass 20.00% 1200 1.67% 2.20%
N P Fl Astragalus nuttallii (Torrey & A. Gray) J. Howell var. nuttallii Nuttall Rattlepod 18.00% 1200 1.50% 1.98%
A A Gr Bromus diandrus Roth Ripgut 16.00% 1200 1.33% 1.76%
N P F Erysimum insulare E. Greene ssp. suffrutescens (Abrams) R. A. Price Suffrutescent Wallflower 15.00% 1200 1.25% 1.65%
N P F Camissonia cheiranthifolia (Hornem. ex Sprengel) Raven ssp. cheiranthifolia Beach Evening Primrose 12.50% 1200 1.04% 1.38%
N P F Solidago californica Nutt. California Goldenrod 9.00% 1200 0.75% 0.99%
N P F Potentilla anserina L. ssp. pacifica (Howell) Rousi Pacific Silverweed 8.00% 1200 0.67% 0.88%
A A Fl Melilotus indica (L.) All. Sour-Clover, Annual Sweetclover 5.00% 1200 0.42% 0.55%
N P Vw Rubus ursinus Cham. & Schldl. Blackberry 5.00% 1200 0.42% 0.55%
N P F Erigeron blochmaniae E. Greene Blochman's Leafy Daisy 5.00% 1200 0.42% 0.55%
A P SucL Carpobrotus edulis (L.) N. E. Brown Hottentot Fig 2.50% 1200 0.21% 0.28%
N P F Solanum americanum Miller Small-Flowered Nightshade 2.50% 1200 0.21% 0.28%
N P F Achillea millefolium L. Common Yarrow 2.50% 1200 0.21% 0.28%
N A Fl Lotus strigosus (Nutt.) E.L. Greene Lotus 2.50% 1200 0.21% 0.28%
A A Gr Schismus arabicus Nees Arabian Grass 2.50% 1200 0.21% 0.28%
N P Gm Juncus acutus L. Spike Rush 1.50% 1200 0.13% 0.17%
A A Gr Lamarckia aurea (L.) Moench. Goldentop 0.50% 1200 0.04% 0.06%
A A Gr Vulpia myuros (L.) C. C. Gmelin var. hirsuta (Hackel) Asch. & Graebner Rattail Fescue 0.50% 1200 0.04% 0.06%
N P F Stachys ajugoides Benth. Hedge Nettle 0.50% 1200 0.04% 0.06%
N A F Plantago major L. Annual Coastal Plantain 0.50% 1200 0.04% 0.06%
A P SucL Conicosia pugioniformis (L.) N. E. Br. Narrow-Leaved Ice Plant 0.50% 1200 0.04% 0.06%
x x x UnderstoryLive 907.50% 1200 75.63% 100.00%
x x x Litter 92.50% 1200 7.71%
x x x BareGround 187.50% 1200 15.63%
x x x UnderstoryTotal 1187.50% 1200 98.96%
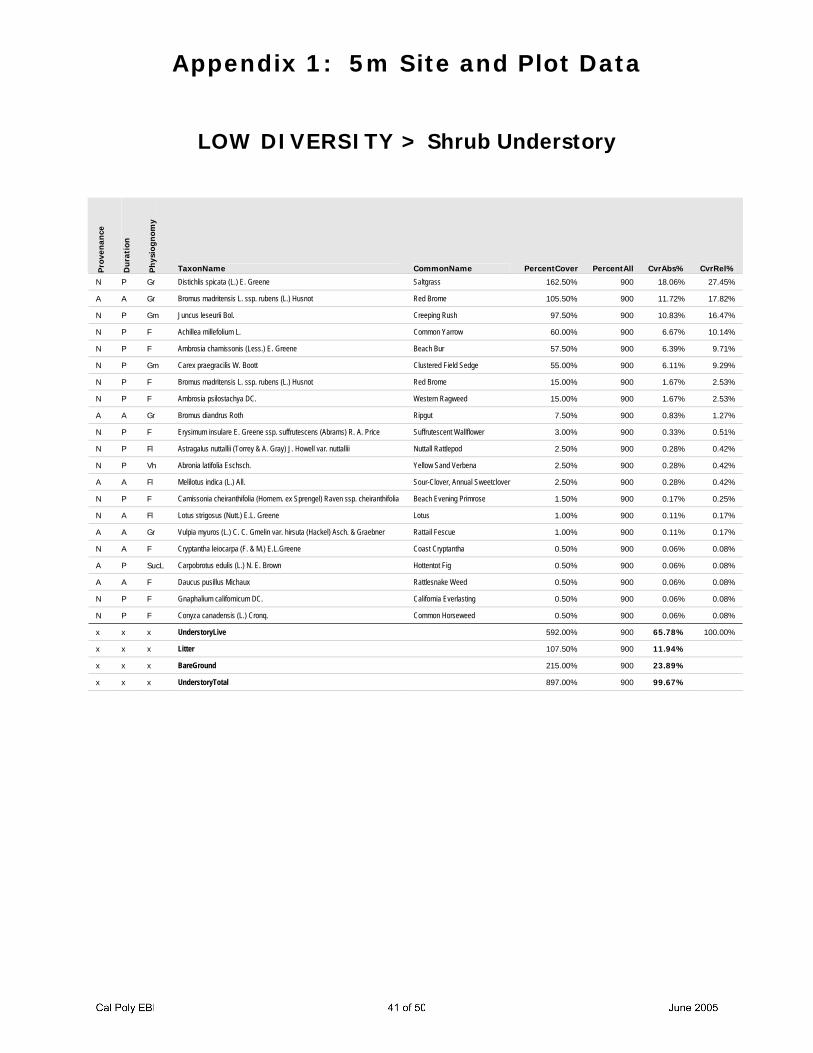
Appendix 1: 5m Site and Plot Data
LOW DIVERSITY > Shrub Understory
Pro
ven
ance
Du
rati
on
Ph
ysio
gnom
y
TaxonName CommonName PercentCover PercentAll CvrAbs% CvrRel%
N P Gr Distichlis spicata (L.) E. Greene Saltgrass 162.50% 900 18.06% 27.45%
A A Gr Bromus madritensis L. ssp. rubens (L.) Husnot Red Brome 105.50% 900 11.72% 17.82%
N P Gm Juncus leseurii Bol. Creeping Rush 97.50% 900 10.83% 16.47%
N P F Achillea millefolium L. Common Yarrow 60.00% 900 6.67% 10.14%
N P F Ambrosia chamissonis (Less.) E. Greene Beach Bur 57.50% 900 6.39% 9.71%
N P Gm Carex praegracilis W. Boott Clustered Field Sedge 55.00% 900 6.11% 9.29%
N P F Bromus madritensis L. ssp. rubens (L.) Husnot Red Brome 15.00% 900 1.67% 2.53%
N P F Ambrosia psilostachya DC. Western Ragweed 15.00% 900 1.67% 2.53%
A A Gr Bromus diandrus Roth Ripgut 7.50% 900 0.83% 1.27%
N P F Erysimum insulare E. Greene ssp. suffrutescens (Abrams) R. A. Price Suffrutescent Wallflower 3.00% 900 0.33% 0.51%
N P Fl Astragalus nuttallii (Torrey & A. Gray) J. Howell var. nuttallii Nuttall Rattlepod 2.50% 900 0.28% 0.42%
N P Vh Abronia latifolia Eschsch. Yellow Sand Verbena 2.50% 900 0.28% 0.42%
A A Fl Melilotus indica (L.) All. Sour-Clover, Annual Sweetclover 2.50% 900 0.28% 0.42%
N P F Camissonia cheiranthifolia (Hornem. ex Sprengel) Raven ssp. cheiranthifolia Beach Evening Primrose 1.50% 900 0.17% 0.25%
N A Fl Lotus strigosus (Nutt.) E.L. Greene Lotus 1.00% 900 0.11% 0.17%
A A Gr Vulpia myuros (L.) C. C. Gmelin var. hirsuta (Hackel) Asch. & Graebner Rattail Fescue 1.00% 900 0.11% 0.17%
N A F Cryptantha leiocarpa (F. & M.) E.L.Greene Coast Cryptantha 0.50% 900 0.06% 0.08%
A P SucL Carpobrotus edulis (L.) N. E. Brown Hottentot Fig 0.50% 900 0.06% 0.08%
A A F Daucus pusillus Michaux Rattlesnake Weed 0.50% 900 0.06% 0.08%
N P F Gnaphalium californicum DC. California Everlasting 0.50% 900 0.06% 0.08%
N P F Conyza canadensis (L.) Cronq. Common Horseweed 0.50% 900 0.06% 0.08%
x x x UnderstoryLive 592.00% 900 65.78% 100.00%
x x x Litter 107.50% 900 11.94%
x x x BareGround 215.00% 900 23.89%
x x x UnderstoryTotal 897.00% 900 99.67%
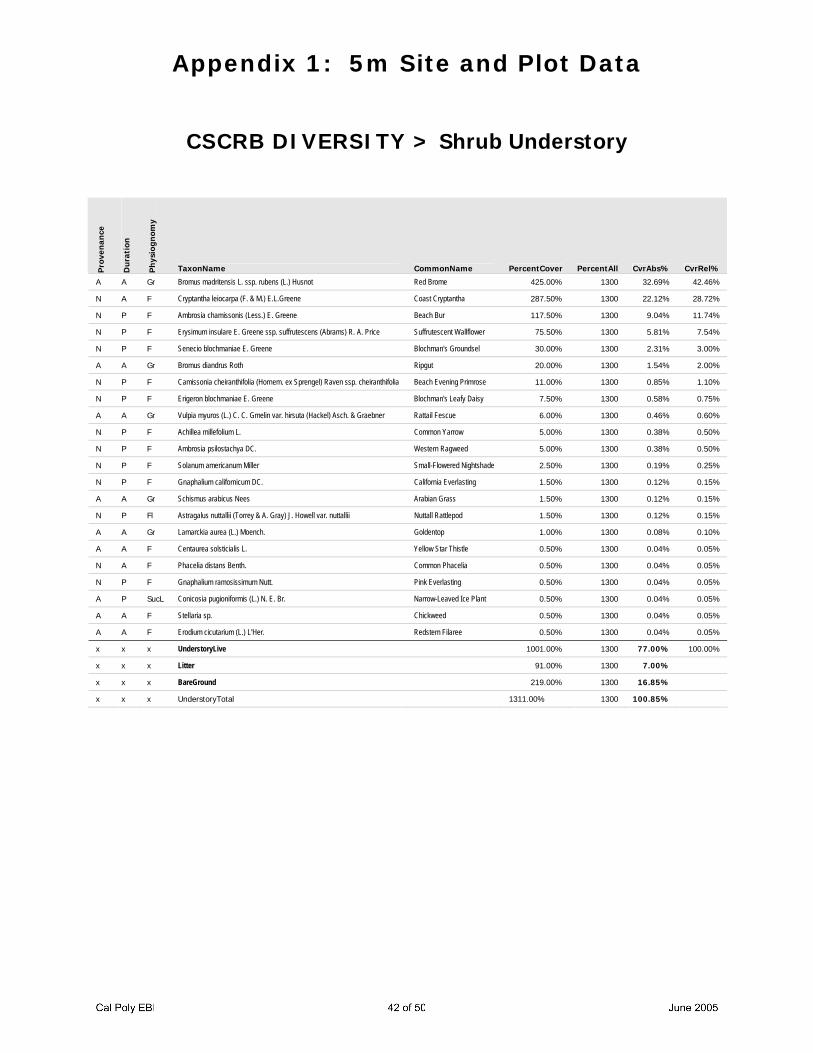
Appendix 1: 5m Site and Plot Data
CSCRB DIVERSITY > Shrub Understory
Pro
ven
ance
Du
rati
on
Ph
ysio
gnom
y
TaxonName CommonName PercentCover PercentAll CvrAbs% CvrRel%
A A Gr Bromus madritensis L. ssp. rubens (L.) Husnot Red Brome 425.00% 1300 32.69% 42.46%
N A F Cryptantha leiocarpa (F. & M.) E.L.Greene Coast Cryptantha 287.50% 1300 22.12% 28.72%
N P F Ambrosia chamissonis (Less.) E. Greene Beach Bur 117.50% 1300 9.04% 11.74%
N P F Erysimum insulare E. Greene ssp. suffrutescens (Abrams) R. A. Price Suffrutescent Wallflower 75.50% 1300 5.81% 7.54%
N P F Senecio blochmaniae E. Greene Blochman's Groundsel 30.00% 1300 2.31% 3.00%
A A Gr Bromus diandrus Roth Ripgut 20.00% 1300 1.54% 2.00%
N P F Camissonia cheiranthifolia (Hornem. ex Sprengel) Raven ssp. cheiranthifolia Beach Evening Primrose 11.00% 1300 0.85% 1.10%
N P F Erigeron blochmaniae E. Greene Blochman's Leafy Daisy 7.50% 1300 0.58% 0.75%
A A Gr Vulpia myuros (L.) C. C. Gmelin var. hirsuta (Hackel) Asch. & Graebner Rattail Fescue 6.00% 1300 0.46% 0.60%
N P F Achillea millefolium L. Common Yarrow 5.00% 1300 0.38% 0.50%
N P F Ambrosia psilostachya DC. Western Ragweed 5.00% 1300 0.38% 0.50%
N P F Solanum americanum Miller Small-Flowered Nightshade 2.50% 1300 0.19% 0.25%
N P F Gnaphalium californicum DC. California Everlasting 1.50% 1300 0.12% 0.15%
A A Gr Schismus arabicus Nees Arabian Grass 1.50% 1300 0.12% 0.15%
N P Fl Astragalus nuttallii (Torrey & A. Gray) J. Howell var. nuttallii Nuttall Rattlepod 1.50% 1300 0.12% 0.15%
A A Gr Lamarckia aurea (L.) Moench. Goldentop 1.00% 1300 0.08% 0.10%
A A F Centaurea solsticialis L. Yellow Star Thistle 0.50% 1300 0.04% 0.05%
N A F Phacelia distans Benth. Common Phacelia 0.50% 1300 0.04% 0.05%
N P F Gnaphalium ramosissimum Nutt. Pink Everlasting 0.50% 1300 0.04% 0.05%
A P SucL Conicosia pugioniformis (L.) N. E. Br. Narrow-Leaved Ice Plant 0.50% 1300 0.04% 0.05%
A A F Stellaria sp. Chickweed 0.50% 1300 0.04% 0.05%
A A F Erodium cicutarium (L.) L'Her. Redstem Filaree 0.50% 1300 0.04% 0.05%
x x x UnderstoryLive 1001.00% 1300 77.00% 100.00%
x x x Litter 91.00% 1300 7.00%
x x x BareGround 219.00% 1300 16.85%
x x x UnderstoryTotal 1311.00% 1300 100.85%

Appendix 1: 5m Site and Plot Data
CNTRL DIVERSITY > Shrub Understory
Pro
ven
ance
Du
rati
on
Ph
ysio
gnom
y
TaxonName CommonName PercentCover PercentAll CvrAbs% CvrRel%
N P F Achillea millefolium L. Common Yarrow 115.00% 400 28.75% 34.59%
N P Gm Juncus leseurii Bol. Creeping Rush 67.50% 400 16.88% 20.30%
N P F Ambrosia chamissonis (Less.) E. Greene Beach Bur 67.50% 400 16.88% 20.30%
N P F Senecio blochmaniae E. Greene Blochman's Groundsel 40.00% 400 10.00% 12.03%
N P F Ambrosia psilostachya DC. Western Ragweed 15.00% 400 3.75% 4.51%
A P Gm Juncus leseurii Bol. Creeping Rush 15.00% 400 3.75% 4.51%
N P F Erigeron blochmaniae E. Greene Blochman's Leafy Daisy 7.50% 400 1.88% 2.26%
N P Vh Abronia latifolia Eschsch. Yellow Sand Verbena 2.50% 400 0.63% 0.75%
A P SucL Conicosia pugioniformis (L.) N. E. Br. Narrow-Leaved Ice Plant 2.50% 400 0.63% 0.75%
x x x UnderstoryLive UnderstoryLive 332.50% 400 83.13% 100.00%
x x x Litter 35.00% 400 8.75%
x x x BareGround 35.00% 400 8.75%
x x x UnderstoryTotal 402.50% 400 99.38%

Appendix 2: Plant Taxa Observed at C8 Site 1999 - 2005
Lifeform Attributes
Provenance
N Native
A Alien
Duration
P Perennial
A Annual
Physiognomic Type
S Shrub
DS Dwarf Shrub
Vh Herbaceous Vine
SucL Leaf Succulent
F Forb
Fl Legume Forb
Gr True Grass
Gm Graminoid
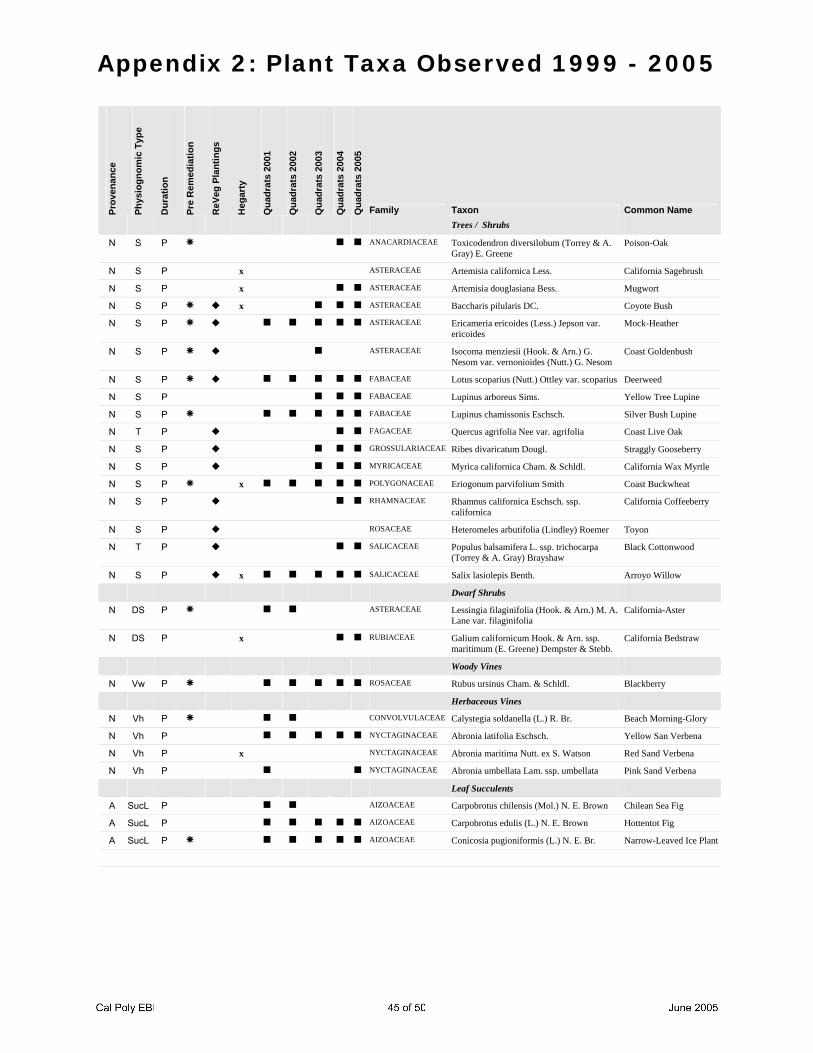
Appendix 2: Plant Taxa Observed 1999 - 2005
Pr
oven
ance
Phys
iogn
omic
Typ
e
Dur
atio
n
Pre
Rem
edia
tion
ReV
eg P
lant
ings
Heg
arty
Qua
drat
s 20
01
Qua
drat
s 20
02
Qua
drat
s 20
03
Qua
drat
s 20
04
Qua
drat
s 20
05
Family Taxon Common Name
Trees / Shrubs
N S P ANACARDIACEAE Toxicodendron diversilobum (Torrey & A. Gray) E. Greene
Poison-Oak
N S P x ASTERACEAE Artemisia californica Less. California Sagebrush
N S P x ASTERACEAE Artemisia douglasiana Bess. Mugwort
N S P x ASTERACEAE Baccharis pilularis DC. Coyote Bush
N S P ASTERACEAE Ericameria ericoides (Less.) Jepson var. ericoides
Mock-Heather
N S P ASTERACEAE Isocoma menziesii (Hook. & Arn.) G. Nesom var. vernonioides (Nutt.) G. Nesom
Coast Goldenbush
N S P FABACEAE Lotus scoparius (Nutt.) Ottley var. scoparius Deerweed
N S P FABACEAE Lupinus arboreus Sims. Yellow Tree Lupine
N S P FABACEAE Lupinus chamissonis Eschsch. Silver Bush Lupine
N T P FAGACEAE Quercus agrifolia Nee var. agrifolia Coast Live Oak
N S P GROSSULARIACEAE Ribes divaricatum Dougl. Straggly Gooseberry
N S P MYRICACEAE Myrica californica Cham. & Schldl. California Wax Myrtle
N S P x POLYGONACEAE Eriogonum parvifolium Smith Coast Buckwheat
N S P RHAMNACEAE Rhamnus californica Eschsch. ssp. californica
California Coffeeberry
N S P ROSACEAE Heteromeles arbutifolia (Lindley) Roemer Toyon
N T P SALICACEAE Populus balsamifera L. ssp. trichocarpa (Torrey & A. Gray) Brayshaw
Black Cottonwood
N S P x SALICACEAE Salix lasiolepis Benth. Arroyo Willow
Dwarf Shrubs
N DS P ASTERACEAE Lessingia filaginifolia (Hook. & Arn.) M. A. Lane var. filaginifolia
California-Aster
N DS P x RUBIACEAE Galium californicum Hook. & Arn. ssp. maritimum (E. Greene) Dempster & Stebb.
California Bedstraw
Woody Vines
N Vw P ROSACEAE Rubus ursinus Cham. & Schldl. Blackberry
Herbaceous Vines
N Vh P CONVOLVULACEAE Calystegia soldanella (L.) R. Br. Beach Morning-Glory
N Vh P NYCTAGINACEAE Abronia latifolia Eschsch. Yellow San Verbena
N Vh P x NYCTAGINACEAE Abronia maritima Nutt. ex S. Watson Red Sand Verbena
N Vh P NYCTAGINACEAE Abronia umbellata Lam. ssp. umbellata Pink Sand Verbena
Leaf Succulents
A SucL P AIZOACEAE Carpobrotus chilensis (Mol.) N. E. Brown Chilean Sea Fig
A SucL P AIZOACEAE Carpobrotus edulis (L.) N. E. Brown Hottentot Fig
A SucL P AIZOACEAE Conicosia pugioniformis (L.) N. E. Br. Narrow-Leaved Ice Plant
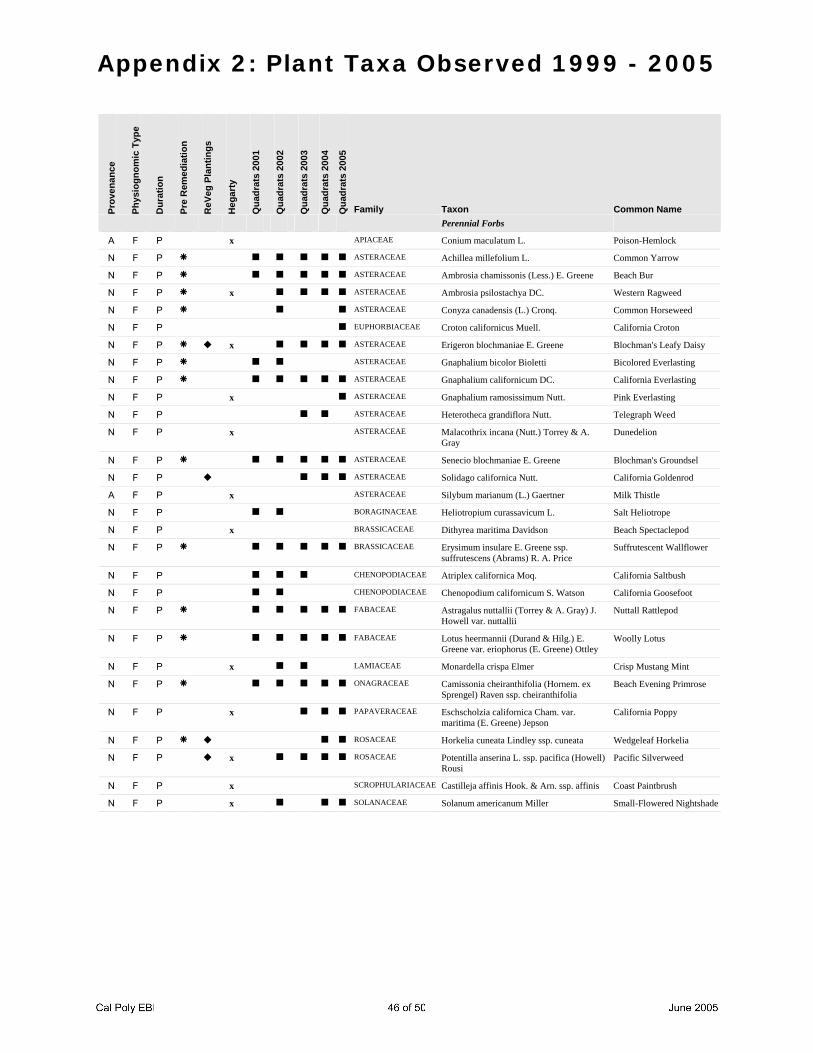
Appendix 2: Plant Taxa Observed 1999 - 2005
Pr
oven
ance
Phys
iogn
omic
Typ
e
Dur
atio
n
Pre
Rem
edia
tion
ReV
eg P
lant
ings
Heg
arty
Qua
drat
s 20
01
Qua
drat
s 20
02
Qua
drat
s 20
03
Qua
drat
s 20
04
Qua
drat
s 20
05
Family Taxon Common Name
Perennial Forbs
A F P x APIACEAE Conium maculatum L. Poison-Hemlock
N F P ASTERACEAE Achillea millefolium L. Common Yarrow
N F P ASTERACEAE Ambrosia chamissonis (Less.) E. Greene Beach Bur
N F P x ASTERACEAE Ambrosia psilostachya DC. Western Ragweed
N F P ASTERACEAE Conyza canadensis (L.) Cronq. Common Horseweed
N F P EUPHORBIACEAE Croton californicus Muell. California Croton
N F P x ASTERACEAE Erigeron blochmaniae E. Greene Blochman's Leafy Daisy
N F P ASTERACEAE Gnaphalium bicolor Bioletti Bicolored Everlasting
N F P ASTERACEAE Gnaphalium californicum DC. California Everlasting
N F P x ASTERACEAE Gnaphalium ramosissimum Nutt. Pink Everlasting
N F P ASTERACEAE Heterotheca grandiflora Nutt. Telegraph Weed
N F P x ASTERACEAE Malacothrix incana (Nutt.) Torrey & A. Gray
Dunedelion
N F P ASTERACEAE Senecio blochmaniae E. Greene Blochman's Groundsel
N F P ASTERACEAE Solidago californica Nutt. California Goldenrod
A F P x ASTERACEAE Silybum marianum (L.) Gaertner Milk Thistle
N F P BORAGINACEAE Heliotropium curassavicum L. Salt Heliotrope
N F P x BRASSICACEAE Dithyrea maritima Davidson Beach Spectaclepod
N F P BRASSICACEAE Erysimum insulare E. Greene ssp. suffrutescens (Abrams) R. A. Price
Suffrutescent Wallflower
N F P CHENOPODIACEAE Atriplex californica Moq. California Saltbush
N F P CHENOPODIACEAE Chenopodium californicum S. Watson California Goosefoot
N F P FABACEAE Astragalus nuttallii (Torrey & A. Gray) J. Howell var. nuttallii
Nuttall Rattlepod
N F P FABACEAE Lotus heermannii (Durand & Hilg.) E. Greene var. eriophorus (E. Greene) Ottley
Woolly Lotus
N F P x LAMIACEAE Monardella crispa Elmer Crisp Mustang Mint
N F P ONAGRACEAE Camissonia cheiranthifolia (Hornem. ex Sprengel) Raven ssp. cheiranthifolia
Beach Evening Primrose
N F P x PAPAVERACEAE Eschscholzia californica Cham. var. maritima (E. Greene) Jepson
California Poppy
N F P ROSACEAE Horkelia cuneata Lindley ssp. cuneata Wedgeleaf Horkelia
N F P x ROSACEAE Potentilla anserina L. ssp. pacifica (Howell) Rousi
Pacific Silverweed
N F P x SCROPHULARIACEAE Castilleja affinis Hook. & Arn. ssp. affinis Coast Paintbrush
N F P x SOLANACEAE Solanum americanum Miller Small-Flowered Nightshade
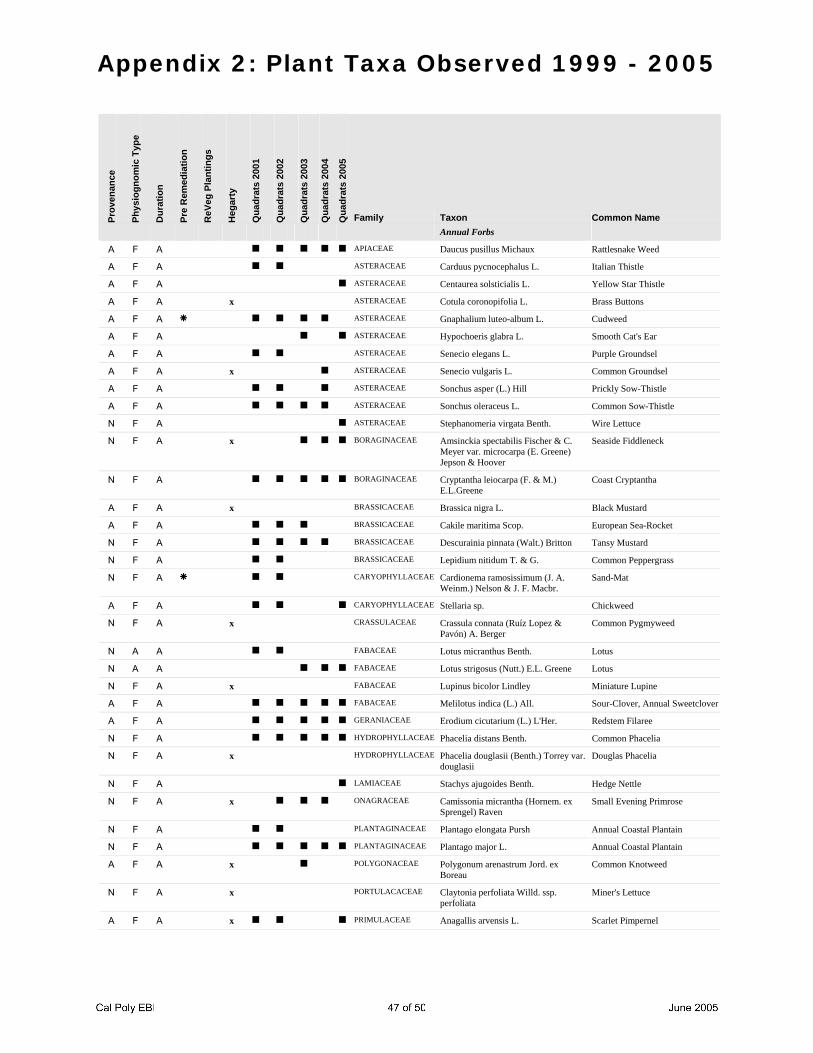
Appendix 2: Plant Taxa Observed 1999 - 2005
Pr
oven
ance
Phys
iogn
omic
Typ
e
Dur
atio
n
Pre
Rem
edia
tion
ReV
eg P
lant
ings
Heg
arty
Qua
drat
s 20
01
Qua
drat
s 20
02
Qua
drat
s 20
03
Qua
drat
s 20
04
Qua
drat
s 20
05
Family Taxon Common Name
Annual Forbs
A F A APIACEAE Daucus pusillus Michaux Rattlesnake Weed
A F A ASTERACEAE Carduus pycnocephalus L. Italian Thistle
A F A ASTERACEAE Centaurea solsticialis L. Yellow Star Thistle
A F A x ASTERACEAE Cotula coronopifolia L. Brass Buttons
A F A ASTERACEAE Gnaphalium luteo-album L. Cudweed
A F A ASTERACEAE Hypochoeris glabra L. Smooth Cat's Ear
A F A ASTERACEAE Senecio elegans L. Purple Groundsel
A F A x ASTERACEAE Senecio vulgaris L. Common Groundsel
A F A ASTERACEAE Sonchus asper (L.) Hill Prickly Sow-Thistle
A F A ASTERACEAE Sonchus oleraceus L. Common Sow-Thistle
N F A ASTERACEAE Stephanomeria virgata Benth. Wire Lettuce
N F A x BORAGINACEAE Amsinckia spectabilis Fischer & C. Meyer var. microcarpa (E. Greene) Jepson & Hoover
Seaside Fiddleneck
N F A BORAGINACEAE Cryptantha leiocarpa (F. & M.) E.L.Greene
Coast Cryptantha
A F A x BRASSICACEAE Brassica nigra L. Black Mustard
A F A BRASSICACEAE Cakile maritima Scop. European Sea-Rocket
N F A BRASSICACEAE Descurainia pinnata (Walt.) Britton Tansy Mustard
N F A BRASSICACEAE Lepidium nitidum T. & G. Common Peppergrass
N F A CARYOPHYLLACEAE Cardionema ramosissimum (J. A. Weinm.) Nelson & J. F. Macbr.
Sand-Mat
A F A CARYOPHYLLACEAE Stellaria sp. Chickweed
N F A x CRASSULACEAE Crassula connata (Ruíz Lopez & Pavón) A. Berger
Common Pygmyweed
N A A FABACEAE Lotus micranthus Benth. Lotus
N A A FABACEAE Lotus strigosus (Nutt.) E.L. Greene Lotus
N F A x FABACEAE Lupinus bicolor Lindley Miniature Lupine
A F A FABACEAE Melilotus indica (L.) All. Sour-Clover, Annual Sweetclover
A F A GERANIACEAE Erodium cicutarium (L.) L'Her. Redstem Filaree
N F A HYDROPHYLLACEAE Phacelia distans Benth. Common Phacelia
N F A x HYDROPHYLLACEAE Phacelia douglasii (Benth.) Torrey var. douglasii
Douglas Phacelia
N F A LAMIACEAE Stachys ajugoides Benth. Hedge Nettle
N F A x ONAGRACEAE Camissonia micrantha (Hornem. ex Sprengel) Raven
Small Evening Primrose
N F A PLANTAGINACEAE Plantago elongata Pursh Annual Coastal Plantain
N F A PLANTAGINACEAE Plantago major L. Annual Coastal Plantain
A F A x POLYGONACEAE Polygonum arenastrum Jord. ex Boreau
Common Knotweed
N F A x PORTULACACEAE Claytonia perfoliata Willd. ssp. perfoliata
Miner's Lettuce
A F A x PRIMULACEAE Anagallis arvensis L. Scarlet Pimpernel

Appendix 2: Plant Taxa Observed 1999 - 2005
Pr
oven
ance
Phys
iogn
omic
Typ
e
Dur
atio
n
Pre
Rem
edia
tion
ReV
eg P
lant
ings
Heg
arty
Qua
drat
s 20
01
Qua
drat
s 20
02
Qua
drat
s 20
03
Qua
drat
s 20
04
Qua
drat
s 20
05
Family Taxon Common Name
Fern Allies
N P P EQUISETACEAE Equisetum hyemale L. ssp. affine (Engelm.) Calder & R. H. Taylor
Common Scouring-Rush
N P P EQUISETACEAE Equisetum laevigatum A. Braun Smooth Scouring Rush
N P P x EQUISETACEAE Equisetum telmateia Ehrh. ssp. braunii (Milde) R. L. Hauke
Giant Horsetail
Perennial Grasses
N Gr P POACEAE Bromus carinatus Hook. & Arnott California Brome
N Gr P POACEAE Distichlis spicata (L.) E. Greene Saltgrass
A Gr P x POACEAE Ehrharta calycina Smith Perennial Veldtgrass
N Gr P POACEAE Leymus triticoides (Buckley) Pilger Creeping Wildrye
Annual Grasses
A Gr A POACEAE Bromus diandrus Roth Ripgut
A Gr A POACEAE Bromus hordeaceus L Soft Chess
A Gr A POACEAE Bromus madritensis L. ssp. rubens (L.) Husnot Red Brome
A Gr A POACEAE Hordeum murinum L. ssp. glaucum (Steudel) Tzevelev
Wall Barley
A Gr A x POACEAE Lamarckia aurea (L.) Moench. Goldentop
A Gr A POACEAE Lolium multiflorum Lam. Annual Ryegrass
A Gr A POACEAE Polypogon monspeliensis (L.) Desf. Rabbitsfoot Grass
A Gr A POACEAE Rostraria cristata Rostraria
A Gr A POACEAE Schismus arabicus Nees Arabian Grass
A Gr A POACEAE Vulpia myuros (L.) C. C. Gmelin var. hirsuta (Hackel) Asch. & Graebner
Rattail Fescue
Graminoids
N Gm P CYPERACEAE Carex praegracilis W. Boott Clustered Field Sedge
N Gm P JUNCACEAE Juncus acutus L. Spiny Rush
N Gm P x JUNCACEAE Juncus leseurii Bol. Creeping Rush
N Gm P JUNCACEAE Juncus patens E. Meyer Spreading Rush
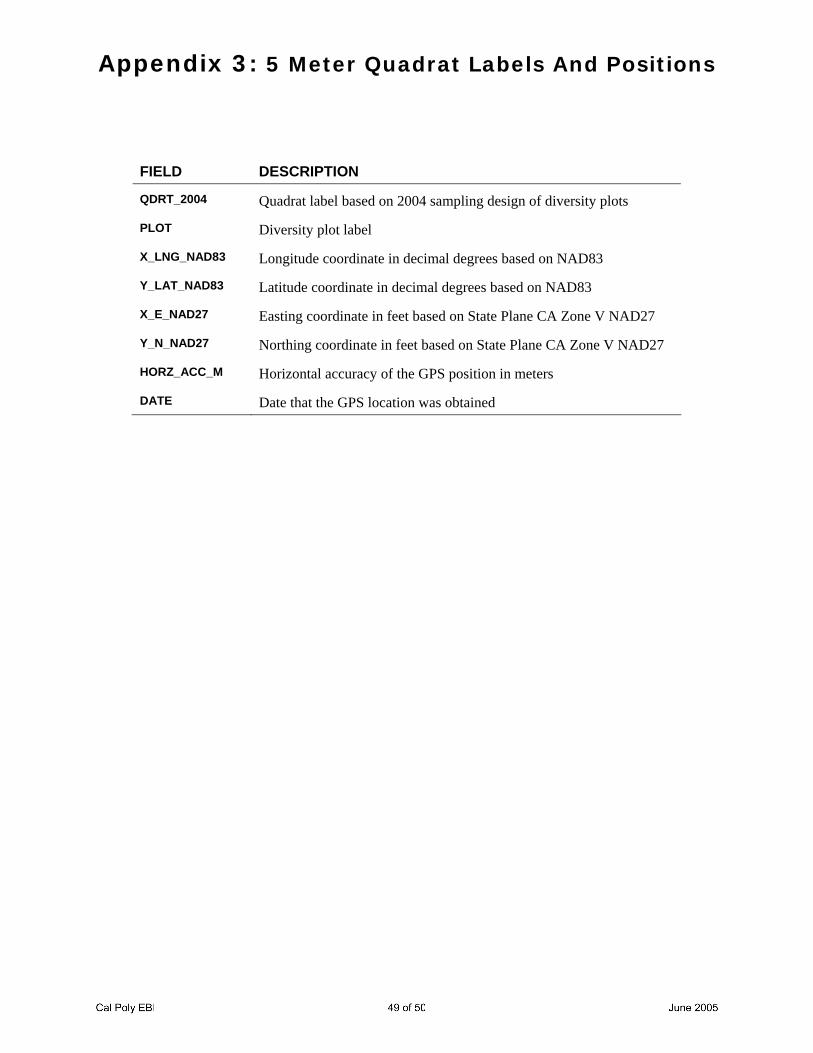
Appendix 3: 5 Meter Quadrat Labels And Positions
FIELD DESCRIPTION
QDRT_2004 Quadrat label based on 2004 sampling design of diversity plots
PLOT Diversity plot label
X_LNG_NAD83 Longitude coordinate in decimal degrees based on NAD83
Y_LAT_NAD83 Latitude coordinate in decimal degrees based on NAD83
X_E_NAD27 Easting coordinate in feet based on State Plane CA Zone V NAD27
Y_N_NAD27 Northing coordinate in feet based on State Plane CA Zone V NAD27
HORZ_ACC_M Horizontal accuracy of the GPS position in meters
DATE Date that the GPS location was obtained

Appendix 3: 5 Meter Quadrat Labels And Positions
QDRT_2004 PLOT X_LNG_NAD83 Y_LAT_NAD83 X_E_SPNAD27 Y_N_SPNAD27 HORZ_ACC_M DATE
C8HDC-1 High -120.63698 34.98893 1210543.26794 552208.95549 not calculated 20040601 C8HDC-2 High -120.63706 34.98906 1210520.55584 552256.88104 not calculated 20040601 C8HDC-3 High -120.63651 34.98909 1210685.51841 552263.47522 not calculated 20040601 C8HDC-4 High -120.63694 34.98930 1210558.77591 552343.25595 not calculated 20040601 C8HDC-5 High -120.63617 34.98883 1210784.83740 552166.21066 not calculated 20040601 C8HDW-1 High -120.63669 34.98888 1210629.62020 552188.48616 not calculated 20040601 C8HDW-2 High -120.63689 34.98894 1210570.31046 552211.88669 not calculated 20040601 C8HDW-3 High -120.63636 34.98911 1210730.62096 552269.57352 not calculated 20040601 C8HDW-4 High -120.63697 34.98921 1210548.93458 552310.74751 not calculated 20040601 C8HDW-5 High -120.63608 34.98880 1210811.49826 552154.58913 not calculated 20040601 C8HD-MW21 High -120.63666 34.98927 1210642.32456 552330.14169 not calculated 20040601 C8HD-MW22 High -120.63717 34.98939 1210490.77058 552377.80702 not calculated 20040601 C8HD-MW23 High -120.63716 34.98919 1210491.85561 552304.96375 not calculated 20040601 C8HD-MW25 High -120.63606 34.98917 1210821.01682 552289.04679 not calculated 20040601 C8MDC-1 Medium -120.63659 34.98811 1210652.21305 551907.55656 not calculated 20040601 C8MDC-2 Medium -120.63678 34.98824 1210596.56495 551956.34611 not calculated 20040601 C8MDC-3 Medium -120.63700 34.98820 1210530.31199 551943.52148 not calculated 20040601 C8MDC-4 Medium -120.63713 34.98836 1210492.91535 552002.75456 not calculated 20040601 C8MDC-5 Medium -120.63732 34.98833 1210435.74034 551993.33267 not calculated 20040601 C8MDW-1 Medium -120.63678 34.98788 1210593.12910 551825.36968 not calculated 20040601 C8MDW-2 Medium -120.63690 34.98829 1210561.11245 551975.47998 not calculated 20040601 C8MDW-3 Medium -120.63710 34.98824 1210500.75235 551958.86005 not calculated 20040601 C8MDW-4 Medium -120.63728 34.98820 1210446.47594 551945.72134 not calculated 20040601 C8MDW-5 Medium -120.63728 34.98842 1210448.57602 552025.76249 not calculated 20040601 C8MD-MW38 Medium -120.63634 34.98811 1210727.06677 551905.59290 not calculated 20040601 C8MD-MW39 Medium -120.63646 34.98794 1210689.51470 551844.68544 not calculated 20040601 C8LDC-1 Low -120.63741 34.98853 1210410.70233 552066.80451 not calculated 20040601 C8LDC-2 Low -120.63759 34.98904 1210361.67688 552253.76885 not calculated 20040601 C8LDC-3 Low -120.63754 34.98920 1210378.17493 552311.58772 not calculated 20040601 C8LDC-4 Low -120.63726 34.98886 1210458.76442 552185.68767 not calculated 20040601 C8LDW-1 Low -120.63753 34.98838 1210373.34073 552013.17391 not calculated 20040601 C8LDW-2 Low -120.63700 34.98867 1210534.79805 552114.51850 not calculated 20040601 C8LDW-3 Low -120.63761 34.98887 1210354.06566 552192.07603 not calculated 20040601 C8LDW-4 Low -120.63738 34.98936 1210427.60805 552368.54227 not calculated 20040601 C8LD-MW24 Low -120.63738 34.98906 1210424.74420 552259.39522 not calculated 20040601 C8CS-1 CScrb -120.63712 34.98890 1210501.06392 552199.14067 not calculated 20040601 C8CS-2 CScrb -120.63699 34.98879 1210538.93756 552158.09876 not calculated 20040601 C8CS-3 CScrb -120.63686 34.98882 1210578.14749 552167.99219 not calculated 20040601 C8CS-4 CScrb -120.63717 34.98850 1210482.27515 552054.00411 not calculated 20040601 C8CS-5 CScrb -120.63686 34.98853 1210575.37964 552062.48337 not calculated 20040601 C8CS-6 CScrb -120.63681 34.98835 1210588.63237 551996.60237 not calculated 20040601 C8CS-7 CScrb -120.63657 34.98837 1210660.68259 552001.99357 not calculated 20040601 C8CS-8 CScrb -120.63645 34.98865 1210699.28425 552102.92157 not calculated 20040601 C8CS-9 CScrb -120.63611 34.98857 1210800.32133 552071.14531 not calculated 20040601 C8CS-10 CScrb -120.63637 34.98852 1210721.99675 552054.99616 not calculated 20040601 C8CS-11 CScrb -120.63671 34.98860 1210620.95971 552086.77269 not calculated 20040601 C8CS-12 CScrb -120.63614 34.98844 1210790.09850 552024.08386 not calculated 20040601 C8CS-13 CScrb -120.63630 34.98825 1210740.37928 551956.21402 not calculated 20040601 C8CN_1 Cntrl -120.63715 34.98954 1210498.19058 552432.22341 not calculated 20040601 C8CN_2 Cntrl -120.63687 34.98945 1210581.16630 552397.27957 not calculated 20040601 C8CN_3 Cntrl -120.63654 34.98940 1210679.49445 552376.49617 not calculated 20040601 C8CN_4 Cntrl -120.63613 34.98930 1210801.29847 552336.89360 not calculated 20040601