Norton Basin/Little Bay Restoration Project: Historical and Environmental Background Report November...
57
Norton Basin/Little Bay Restoration Project: Historical and Environmental Background Report November 2001 John M. Rhoads David J. Yozzo Marco M. Cianciola Barry A. Vittor & Associates, Inc., 656 Aaron Court, Building 6, Willow Park Office Complex, Kingston, NY 12401 And Robert J. Will U.S. Army Corps of Engineers, New York District, CENAN-PL-ES, 26 Federal Plaza, New York, NY 10278 Contract No. DACW-51-91-D0009
-
Upload
independent -
Category
Documents
-
view
2 -
download
0
Transcript of Norton Basin/Little Bay Restoration Project: Historical and Environmental Background Report November...
Norton Basin/Little Bay Restoration Project:Historical and Environmental Background Report
November 2001
John M. RhoadsDavid J. Yozzo
Marco M. CianciolaBarry A. Vittor & Associates, Inc., 656 Aaron Court, Building 6,
Willow Park Office Complex, Kingston, NY 12401
And
Robert J. WillU.S. Army Corps of Engineers, New York District, CENAN-PL-ES,
26 Federal Plaza, New York, NY 10278
Contract No. DACW-51-91-D0009
ii
TABLE OF CONTENTS
1.0 Introduction................................................................................................................11.1 Purpose...................................................................................................................11.2 Objectives...............................................................................................................11.3 Authority ................................................................................................................1
2.0 Geology......................................................................................................................23.0 Historical Background ...............................................................................................2
3.1 Pre-Colonial ...........................................................................................................23.2 Colonial-Post Revolutionary War ..........................................................................43.3 1800’s.....................................................................................................................53.4 1900’s.....................................................................................................................7
4.0 Topographic and Hydrologic Development...............................................................95.0 Changes in Water Quality ........................................................................................18
5.1 Jamaica Bay .........................................................................................................185.2 Jamaica Bay Eutrophication Study ......................................................................205.3 Norton Basin/Little Bay .......................................................................................23
6.0 Changes in Biological Resources.............................................................................266.1 Jamaica Bay .........................................................................................................266.2 Norton Basin/Little Bay .......................................................................................32
7.0 Anthropogenic Impacts ............................................................................................327.1 Edgemere Landfill................................................................................................36
8.0 Additional Borrow Pit Studies .................................................................................418.1 New York /New Jersey Harbor ............................................................................428.2 Boston Harbor ......................................................................................................438.3 Hong Kong Harbor...............................................................................................448.4 USAE-WES CAD Cell Research.........................................................................45
9.0 Summary ..................................................................................................................4510.0 References ................................................................................................................47
iii
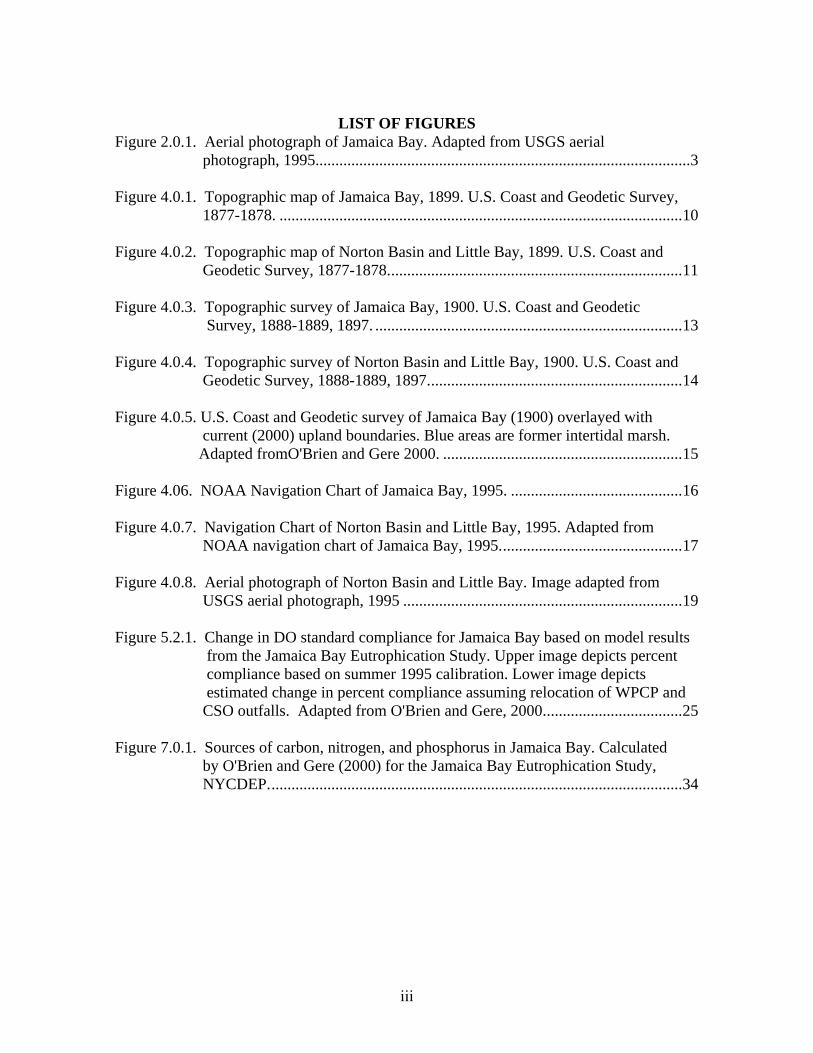
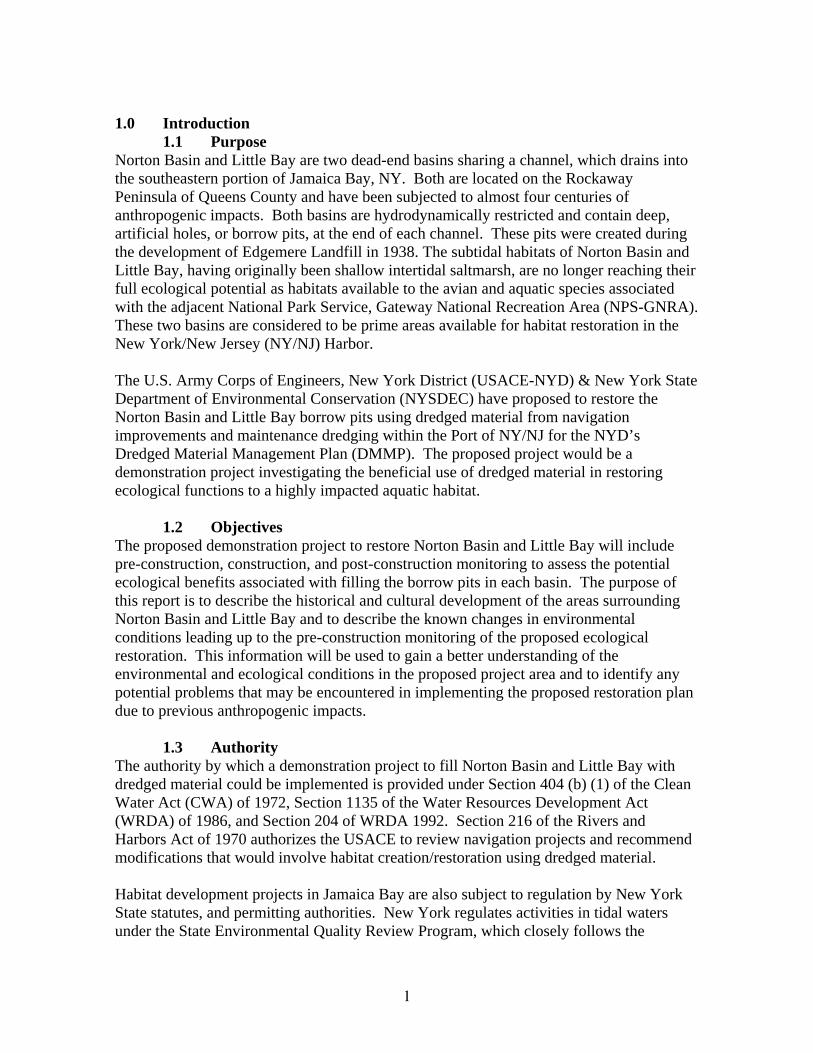
LIST OF FIGURESFigure 2.0.1. Aerial photograph of Jamaica Bay. Adapted from USGS aerial photograph, 1995..............................................................................................3
Figure 4.0.1. Topographic map of Jamaica Bay, 1899. U.S. Coast and Geodetic Survey, 1877-1878. .....................................................................................................10
Figure 4.0.2. Topographic map of Norton Basin and Little Bay, 1899. U.S. Coast and Geodetic Survey, 1877-1878..........................................................................11
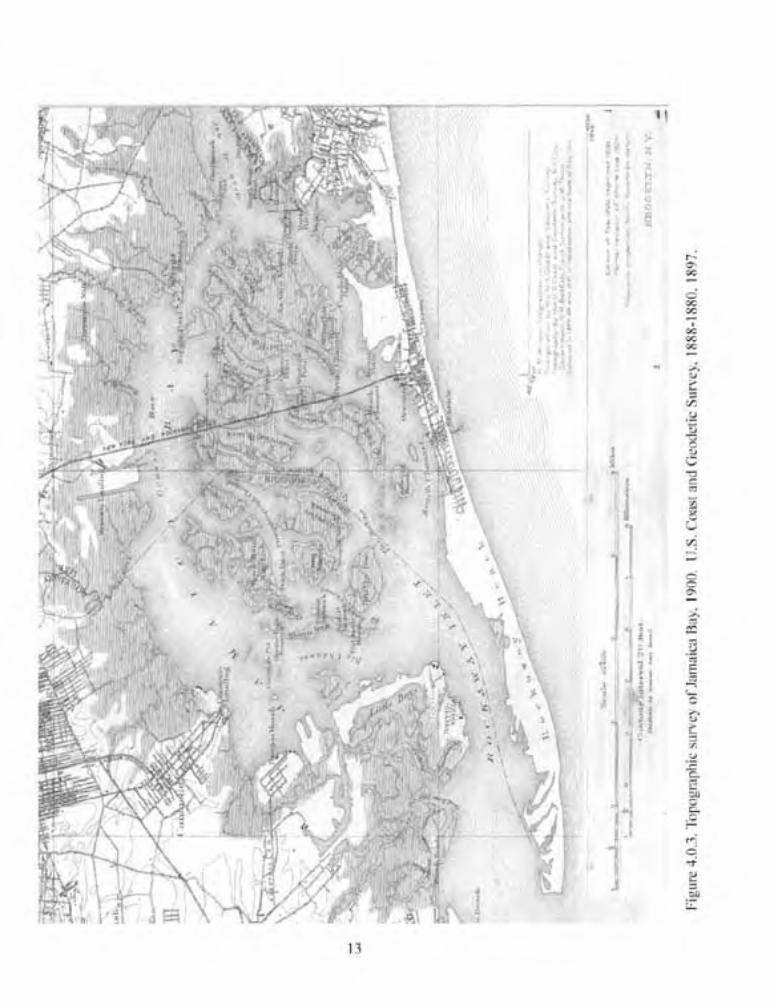
Figure 4.0.3. Topographic survey of Jamaica Bay, 1900. U.S. Coast and Geodetic Survey, 1888-1889, 1897. .............................................................................13
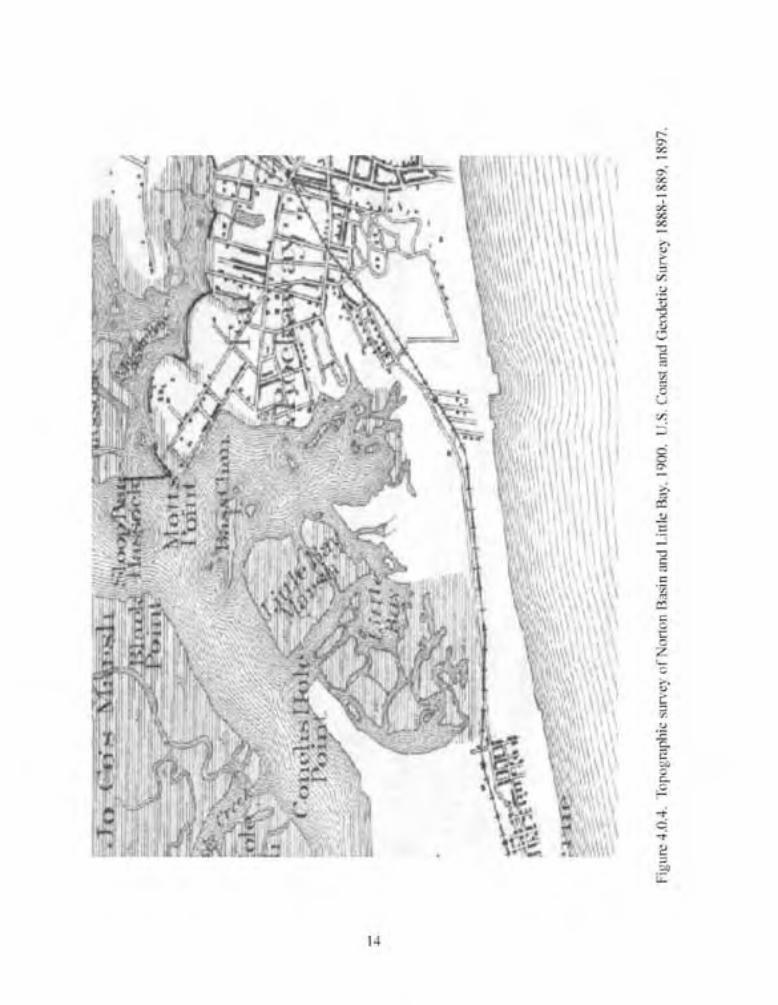
Figure 4.0.4. Topographic survey of Norton Basin and Little Bay, 1900. U.S. Coast and Geodetic Survey, 1888-1889, 1897................................................................14
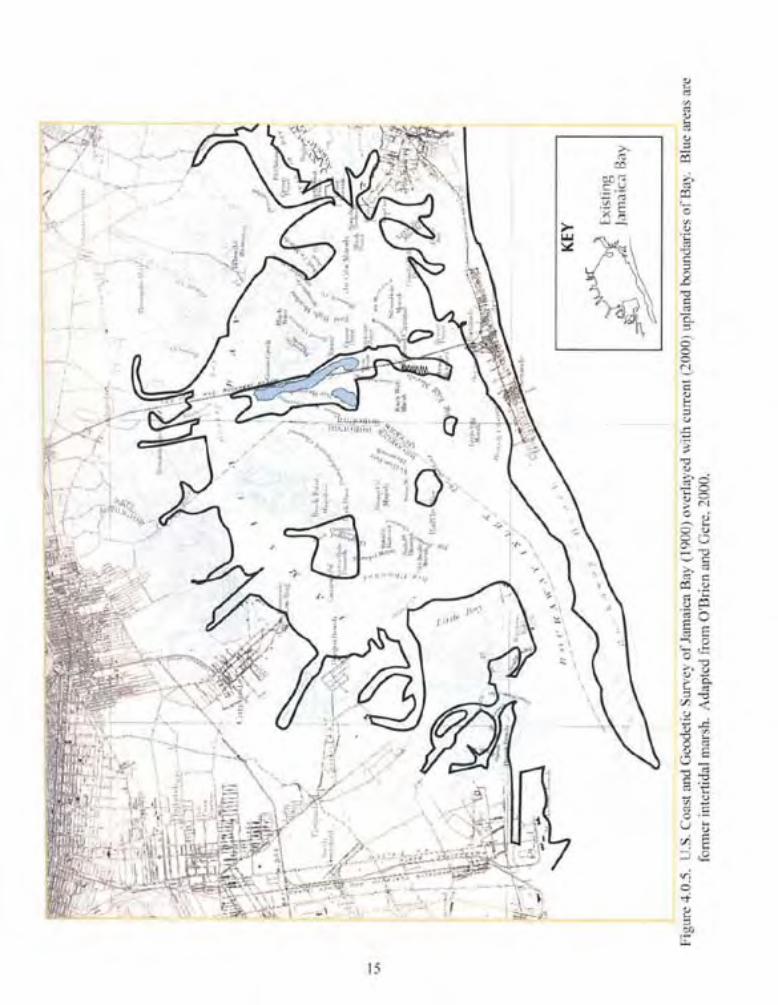
Figure 4.0.5. U.S. Coast and Geodetic survey of Jamaica Bay (1900) overlayed with current (2000) upland boundaries. Blue areas are former intertidal marsh. Adapted fromO'Brien and Gere 2000. ............................................................15
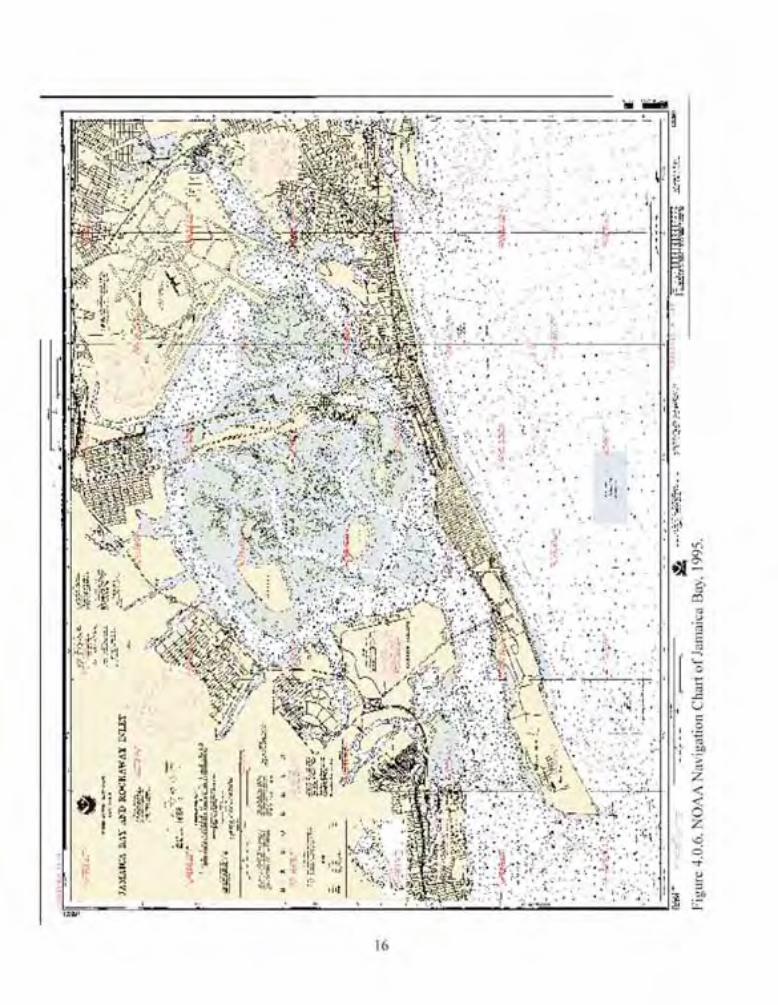
Figure 4.06. NOAA Navigation Chart of Jamaica Bay, 1995. ...........................................16
Figure 4.0.7. Navigation Chart of Norton Basin and Little Bay, 1995. Adapted from NOAA navigation chart of Jamaica Bay, 1995..............................................17
Figure 4.0.8. Aerial photograph of Norton Basin and Little Bay. Image adapted from USGS aerial photograph, 1995 ......................................................................19
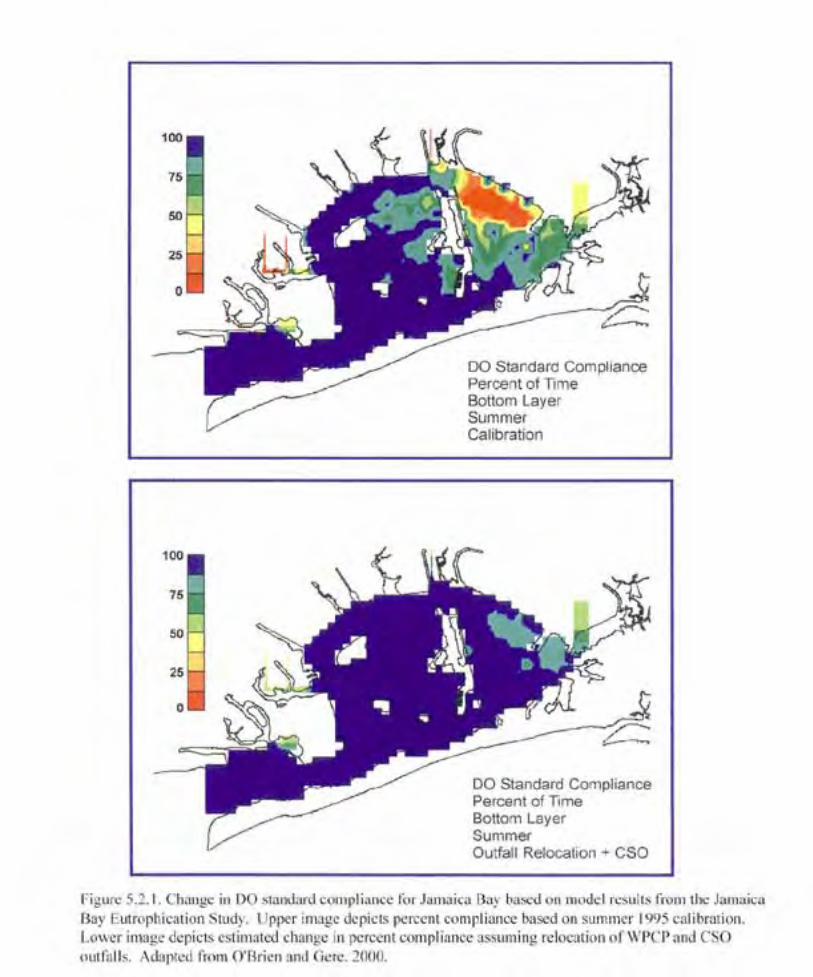
Figure 5.2.1. Change in DO standard compliance for Jamaica Bay based on model results from the Jamaica Bay Eutrophication Study. Upper image depicts percent compliance based on summer 1995 calibration. Lower image depicts estimated change in percent compliance assuming relocation of WPCP and CSO outfalls. Adapted from O'Brien and Gere, 2000...................................25
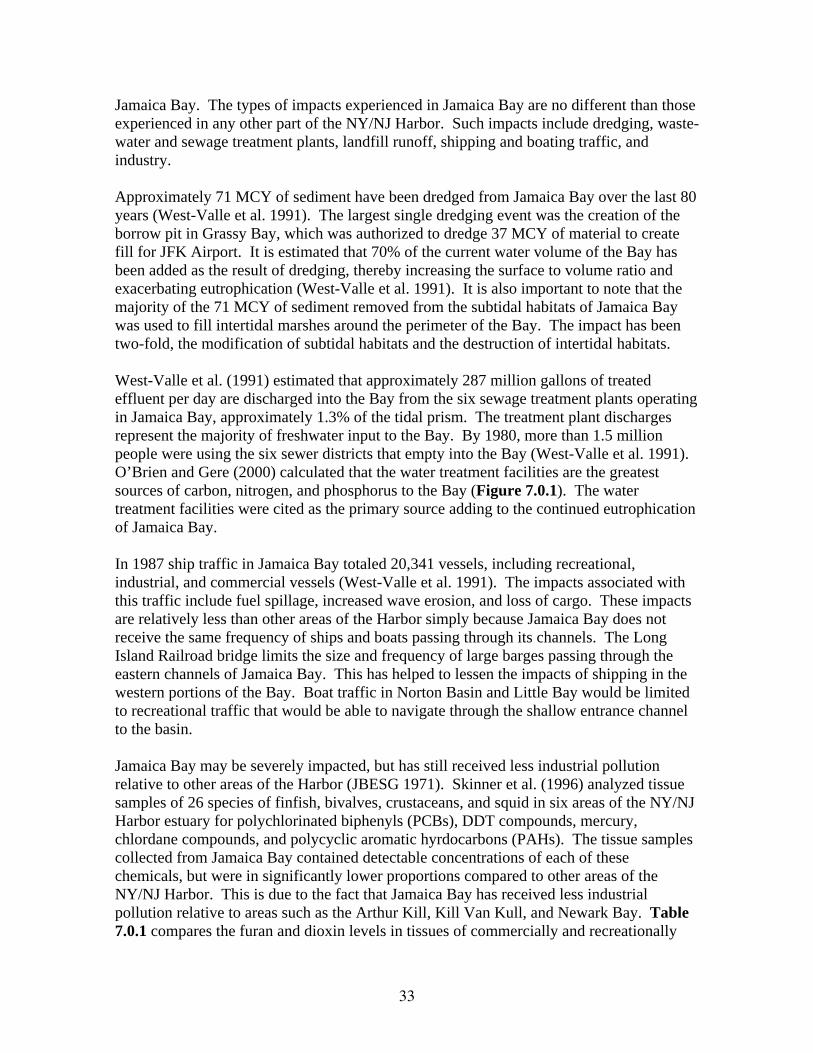
Figure 7.0.1. Sources of carbon, nitrogen, and phosphorus in Jamaica Bay. Calculated by O'Brien and Gere (2000) for the Jamaica Bay Eutrophication Study, NYCDEP........................................................................................................34
iv
LIST OF TABLES
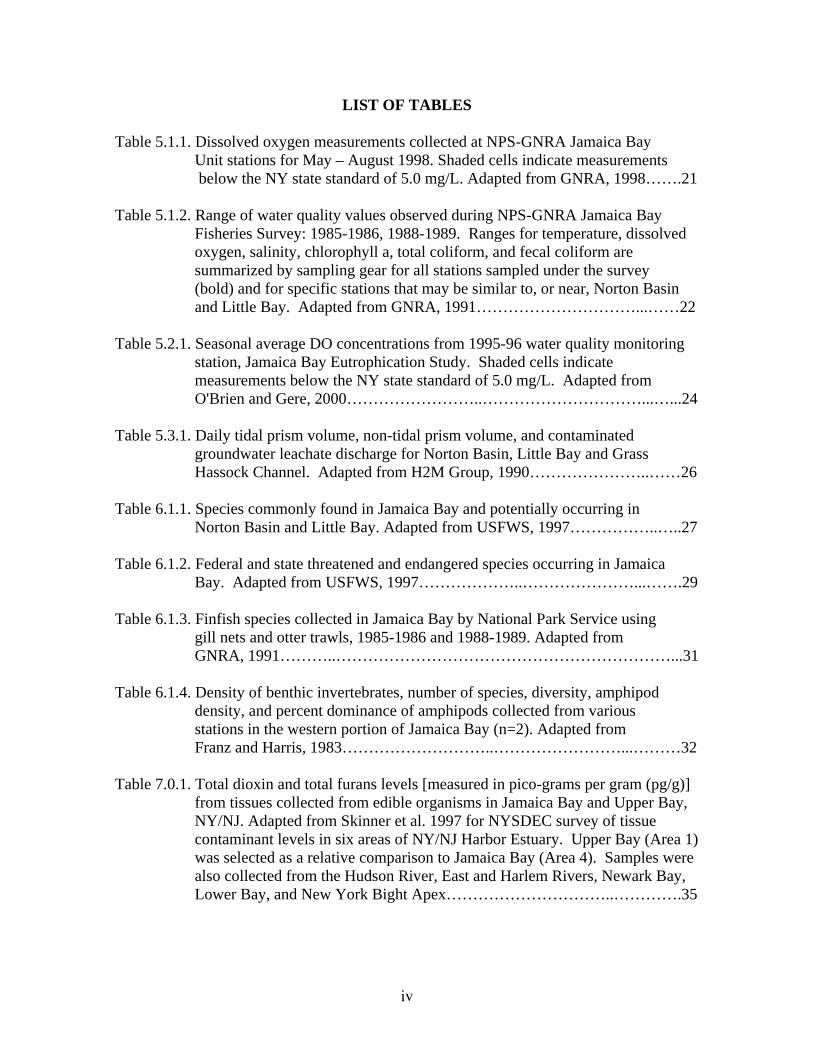
Table 5.1.1. Dissolved oxygen measurements collected at NPS-GNRA Jamaica Bay Unit stations for May – August 1998. Shaded cells indicate measurements below the NY state standard of 5.0 mg/L. Adapted from GNRA, 1998…….21
Table 5.1.2. Range of water quality values observed during NPS-GNRA Jamaica Bay Fisheries Survey: 1985-1986, 1988-1989. Ranges for temperature, dissolved oxygen, salinity, chlorophyll a, total coliform, and fecal coliform are summarized by sampling gear for all stations sampled under the survey (bold) and for specific stations that may be similar to, or near, Norton Basin and Little Bay. Adapted from GNRA, 1991…………………………...……22
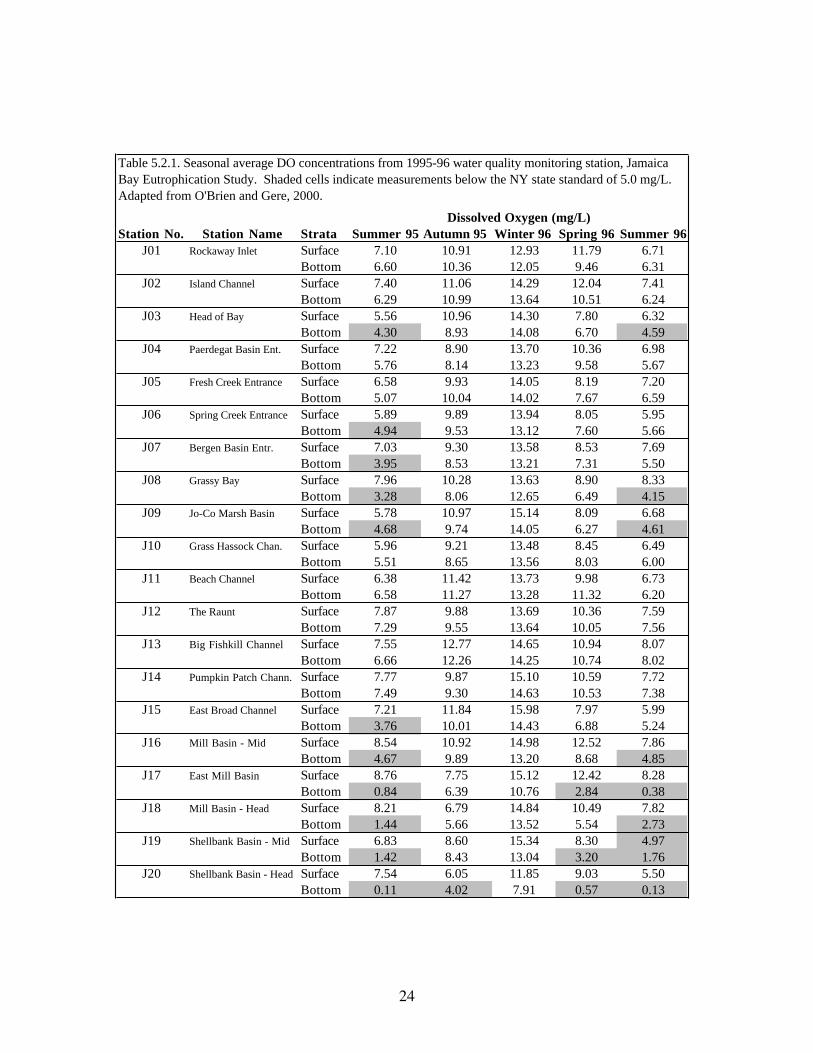
Table 5.2.1. Seasonal average DO concentrations from 1995-96 water quality monitoring station, Jamaica Bay Eutrophication Study. Shaded cells indicate measurements below the NY state standard of 5.0 mg/L. Adapted from O'Brien and Gere, 2000……………………..…………………………...…...24
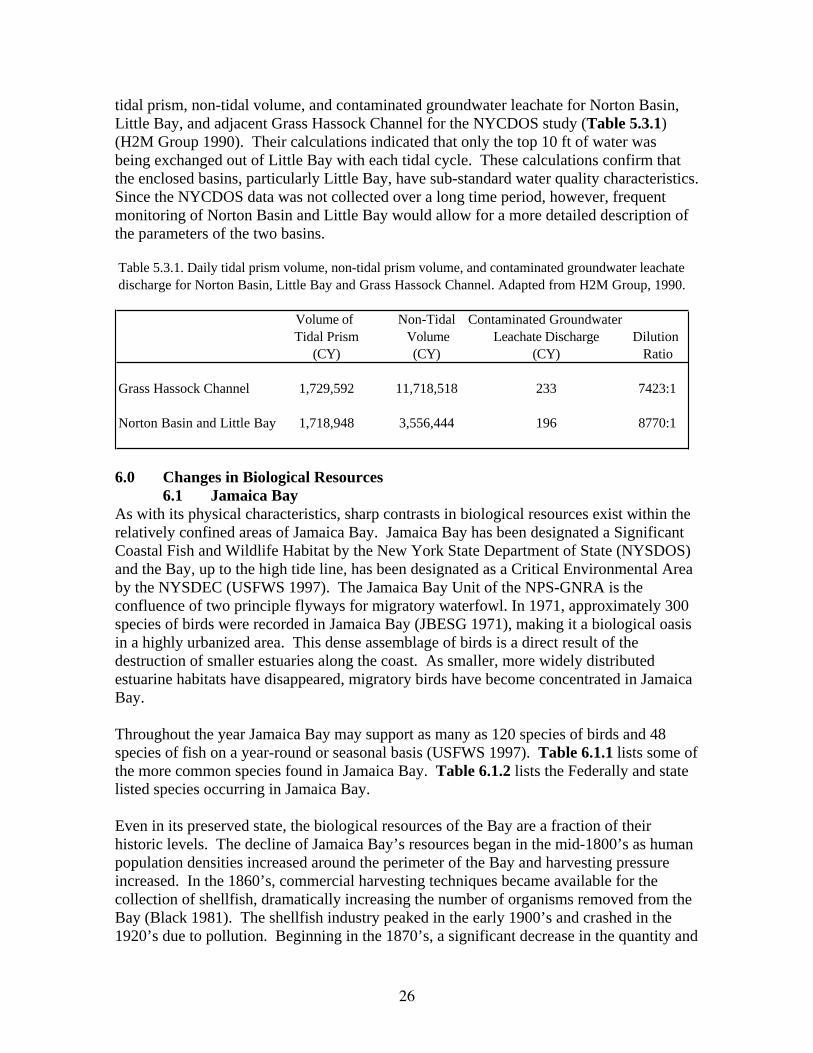
Table 5.3.1. Daily tidal prism volume, non-tidal prism volume, and contaminated groundwater leachate discharge for Norton Basin, Little Bay and Grass Hassock Channel. Adapted from H2M Group, 1990…………………..……26
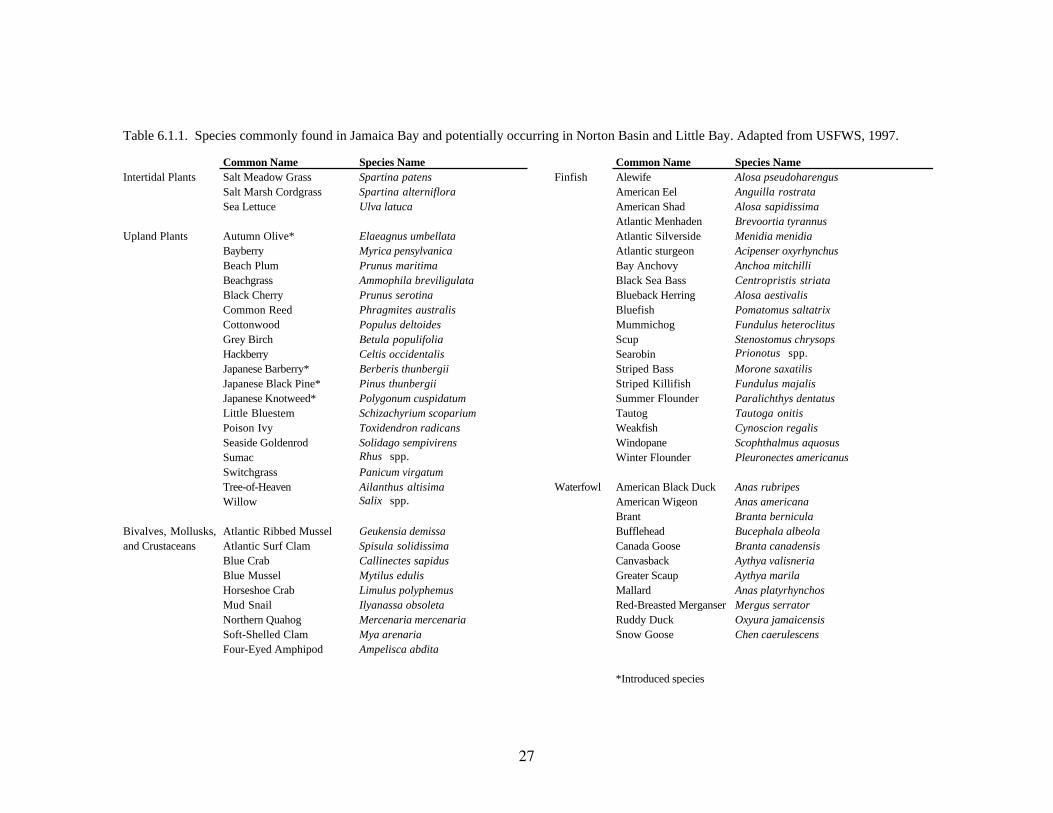
Table 6.1.1. Species commonly found in Jamaica Bay and potentially occurring in Norton Basin and Little Bay. Adapted from USFWS, 1997……………..…..27
Table 6.1.2. Federal and state threatened and endangered species occurring in Jamaica Bay. Adapted from USFWS, 1997………………..…………………...…….29
Table 6.1.3. Finfish species collected in Jamaica Bay by National Park Service using gill nets and otter trawls, 1985-1986 and 1988-1989. Adapted from GNRA, 1991………..………………………………………………………...31
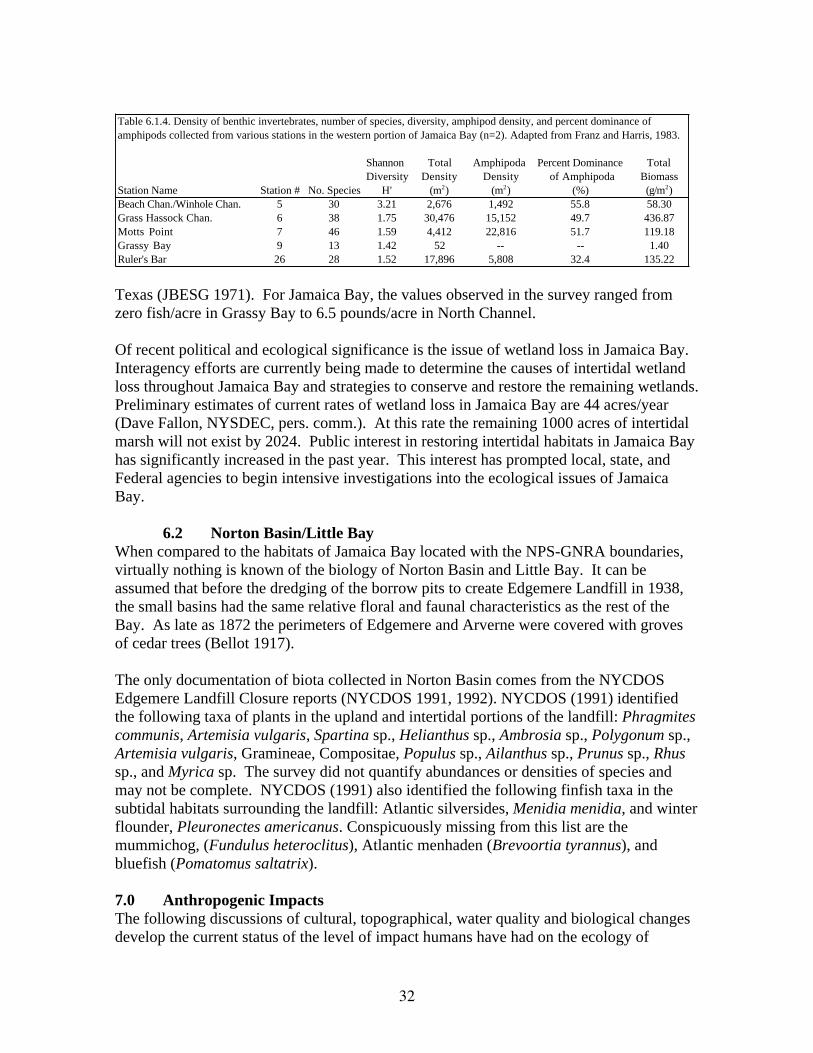
Table 6.1.4. Density of benthic invertebrates, number of species, diversity, amphipod density, and percent dominance of amphipods collected from various stations in the western portion of Jamaica Bay (n=2). Adapted from Franz and Harris, 1983………………………..……………………...………32
Table 7.0.1. Total dioxin and total furans levels [measured in pico-grams per gram (pg/g)] from tissues collected from edible organisms in Jamaica Bay and Upper Bay, NY/NJ. Adapted from Skinner et al. 1997 for NYSDEC survey of tissue contaminant levels in six areas of NY/NJ Harbor Estuary. Upper Bay (Area 1) was selected as a relative comparison to Jamaica Bay (Area 4). Samples were also collected from the Hudson River, East and Harlem Rivers, Newark Bay, Lower Bay, and New York Bight Apex…………………………..………….35
v
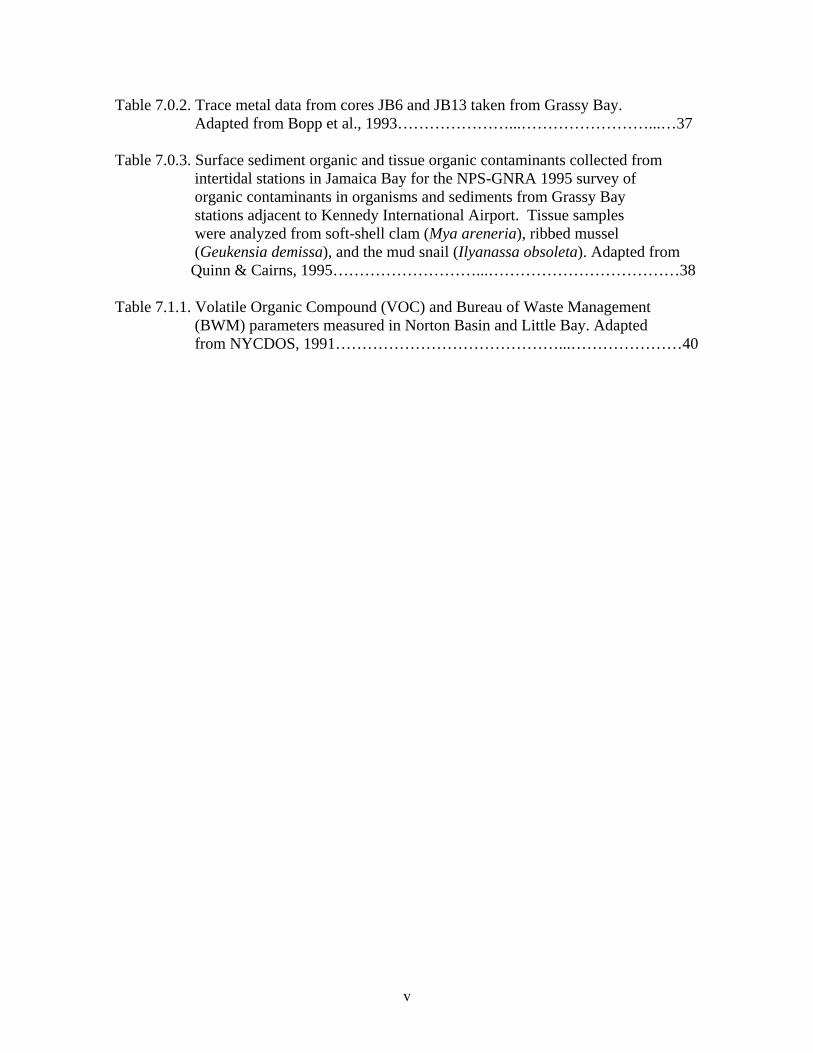
Table 7.0.2. Trace metal data from cores JB6 and JB13 taken from Grassy Bay. Adapted from Bopp et al., 1993…………………...……………………...…37
Table 7.0.3. Surface sediment organic and tissue organic contaminants collected from intertidal stations in Jamaica Bay for the NPS-GNRA 1995 survey of organic contaminants in organisms and sediments from Grassy Bay stations adjacent to Kennedy International Airport. Tissue samples were analyzed from soft-shell clam (Mya areneria), ribbed mussel (Geukensia demissa), and the mud snail (Ilyanassa obsoleta). Adapted from Quinn & Cairns, 1995………………………...………………………………38
Table 7.1.1. Volatile Organic Compound (VOC) and Bureau of Waste Management (BWM) parameters measured in Norton Basin and Little Bay. Adapted from NYCDOS, 1991……………………………………...…………………40
vi
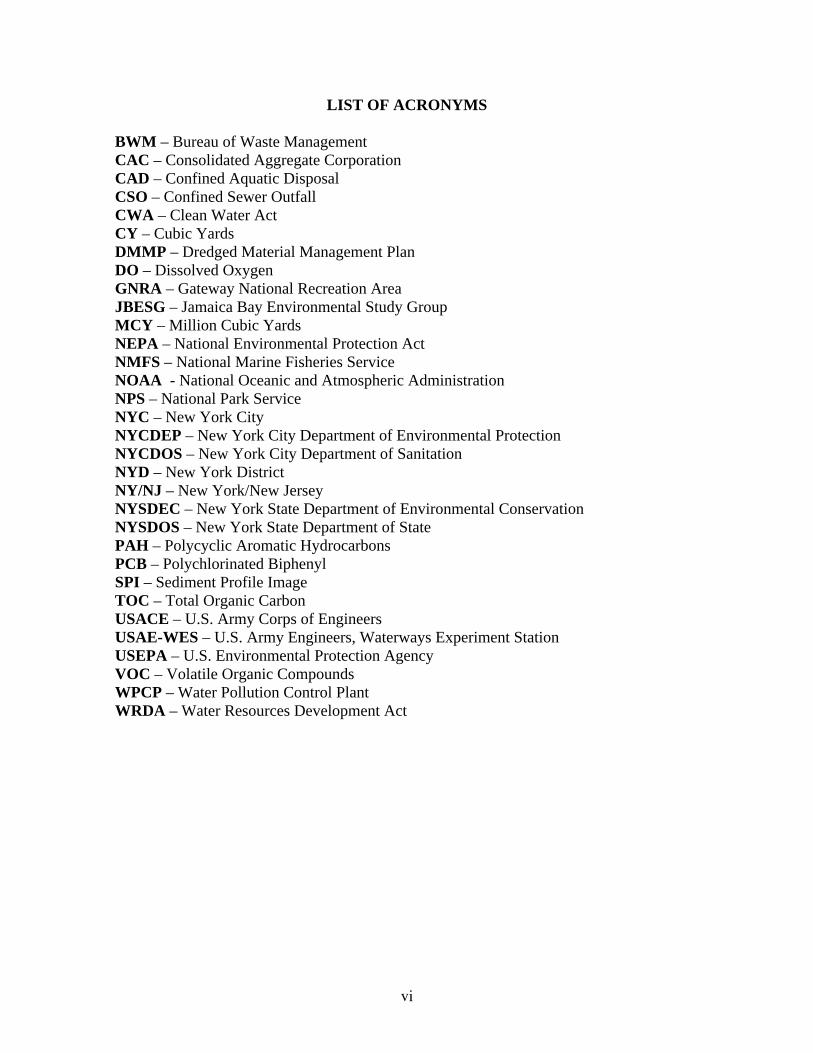
LIST OF ACRONYMS
BWM – Bureau of Waste ManagementCAC – Consolidated Aggregate CorporationCAD – Confined Aquatic DisposalCSO – Confined Sewer OutfallCWA – Clean Water ActCY – Cubic YardsDMMP – Dredged Material Management PlanDO – Dissolved OxygenGNRA – Gateway National Recreation AreaJBESG – Jamaica Bay Environmental Study GroupMCY – Million Cubic YardsNEPA – National Environmental Protection ActNMFS – National Marine Fisheries ServiceNOAA - National Oceanic and Atmospheric AdministrationNPS – National Park ServiceNYC – New York CityNYCDEP – New York City Department of Environmental ProtectionNYCDOS – New York City Department of SanitationNYD – New York DistrictNY/NJ – New York/New JerseyNYSDEC – New York State Department of Environmental ConservationNYSDOS – New York State Department of StatePAH – Polycyclic Aromatic HydrocarbonsPCB – Polychlorinated BiphenylSPI – Sediment Profile ImageTOC – Total Organic CarbonUSACE – U.S. Army Corps of EngineersUSAE-WES – U.S. Army Engineers, Waterways Experiment StationUSEPA – U.S. Environmental Protection AgencyVOC – Volatile Organic CompoundsWPCP – Water Pollution Control PlantWRDA – Water Resources Development Act
vii
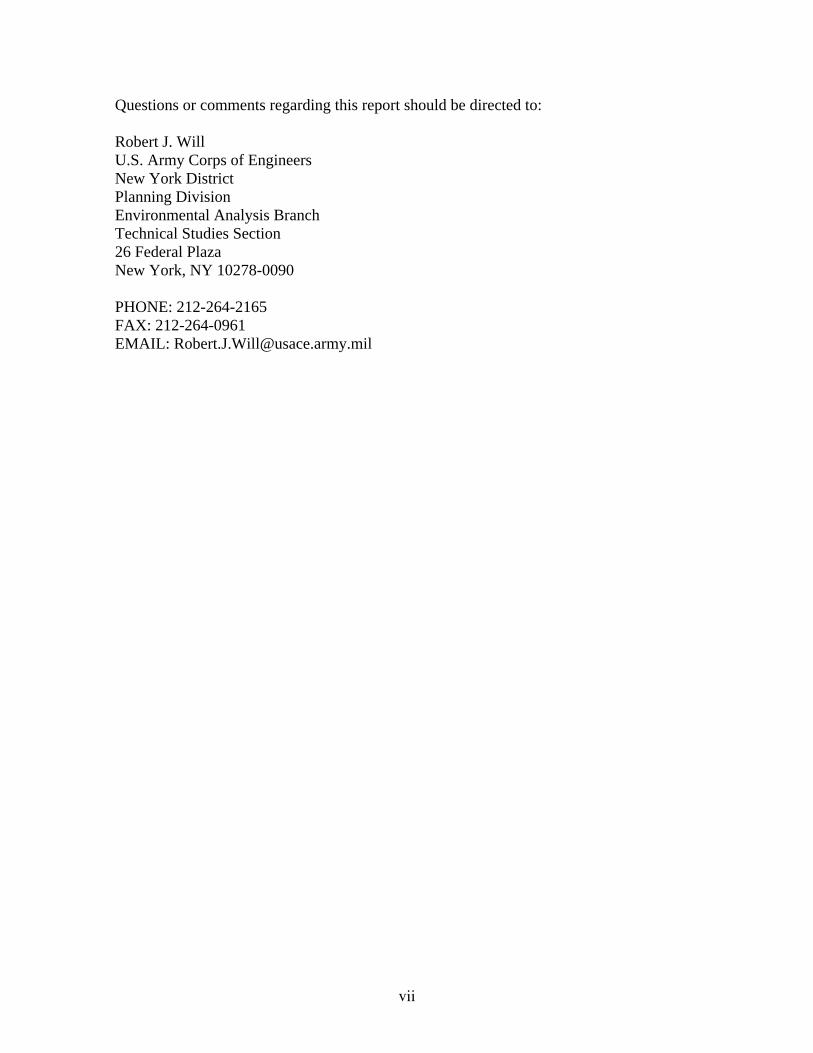
Questions or comments regarding this report should be directed to:
Robert J. WillU.S. Army Corps of EngineersNew York DistrictPlanning DivisionEnvironmental Analysis BranchTechnical Studies Section26 Federal PlazaNew York, NY 10278-0090
PHONE: 212-264-2165FAX: 212-264-0961EMAIL: [email protected]
1
1.0 Introduction1.1 Purpose
Norton Basin and Little Bay are two dead-end basins sharing a channel, which drains intothe southeastern portion of Jamaica Bay, NY. Both are located on the RockawayPeninsula of Queens County and have been subjected to almost four centuries ofanthropogenic impacts. Both basins are hydrodynamically restricted and contain deep,artificial holes, or borrow pits, at the end of each channel. These pits were created duringthe development of Edgemere Landfill in 1938. The subtidal habitats of Norton Basin andLittle Bay, having originally been shallow intertidal saltmarsh, are no longer reaching theirfull ecological potential as habitats available to the avian and aquatic species associatedwith the adjacent National Park Service, Gateway National Recreation Area (NPS-GNRA).These two basins are considered to be prime areas available for habitat restoration in theNew York/New Jersey (NY/NJ) Harbor.
The U.S. Army Corps of Engineers, New York District (USACE-NYD) & New York StateDepartment of Environmental Conservation (NYSDEC) have proposed to restore theNorton Basin and Little Bay borrow pits using dredged material from navigationimprovements and maintenance dredging within the Port of NY/NJ for the NYD’sDredged Material Management Plan (DMMP). The proposed project would be ademonstration project investigating the beneficial use of dredged material in restoringecological functions to a highly impacted aquatic habitat.
1.2 ObjectivesThe proposed demonstration project to restore Norton Basin and Little Bay will includepre-construction, construction, and post-construction monitoring to assess the potentialecological benefits associated with filling the borrow pits in each basin. The purpose ofthis report is to describe the historical and cultural development of the areas surroundingNorton Basin and Little Bay and to describe the known changes in environmentalconditions leading up to the pre-construction monitoring of the proposed ecologicalrestoration. This information will be used to gain a better understanding of theenvironmental and ecological conditions in the proposed project area and to identify anypotential problems that may be encountered in implementing the proposed restoration plandue to previous anthropogenic impacts.
1.3 AuthorityThe authority by which a demonstration project to fill Norton Basin and Little Bay withdredged material could be implemented is provided under Section 404 (b) (1) of the CleanWater Act (CWA) of 1972, Section 1135 of the Water Resources Development Act(WRDA) of 1986, and Section 204 of WRDA 1992. Section 216 of the Rivers andHarbors Act of 1970 authorizes the USACE to review navigation projects and recommendmodifications that would involve habitat creation/restoration using dredged material.
Habitat development projects in Jamaica Bay are also subject to regulation by New YorkState statutes, and permitting authorities. New York regulates activities in tidal watersunder the State Environmental Quality Review Program, which closely follows the
2
provisions of National Environmental Protection Act (NEPA). New York’s SignificantCoastal Fish and Wildlife Habitats Program states that designated coastal fish and wildlifehabitats are to be protected, preserved, and where practical, restored so as to maintain theirviability. Section 307 of the Federal Coastal Zone Management Act requires Federalagency actions to be consistent to the maximum extent practical with the enforceablepolicies of NY state’s Federally approved Coastal Zone Management program. BothFederal and non-Federal activities in state waters require Water Quality Certification underSection 401 of CWA 1972. A water quality certificate is the state’s certification that theproposed activity will not contravene applicable surface water quality standards.
2.0 GeologyNorton Basin and Little Bay are located on the Rockaway Peninsula of Jamaica Bay withinthe NY/NJ Harbor estuary (Figure 2.0.1). Jamaica Bay is a shallow bar-built estuary,approximately eight miles long, four miles wide and 26 square miles in area, located on thesouthwest corner of Long Island, NY. It represents a historic delta of the Hudson River(Grambo & Vega 1984) and drains a watershed of approximately 85,000 acres (USFWS1997).
The Rockaway Peninsula is a low relief barrier peninsula composed of tidal sediments andupper glacial sands, which have accreted from the eastern end of Long Island (Grambo &Vega 1984). Norton Basin and Little Bay represent historic inlets on the RockawayPeninsula, having connected the Atlantic Ocean and Jamaica Bay prior to the 1800’s.Norton Basin and Little Bay, located on the bay side of the peninsula, are characterized bydark gray clayey silt to silty clay sediments typically associated with eutrophic estuaries.The underlying upper glacial sands are Upper Pleistocene deposits (NYCDOS 1991).
3.0 Historical BackgroundJamaica Bay has been subjected to almost 400 years of European impacts, during the lasttwo centuries over half of the original habitat resources in the Bay have been lost. TheBay has evolved from a shallow, unpopulated estuary to a national recreation areacompletely encircled by one of the most densely populated urban areas in the world.Understanding the historical impacts and cultural development of Jamaica Bay and NortonBasin may facilitate the decision making process when initiating ecological restoration inthe Norton Basin/Little Bay complex.
3.1 Pre-ColonialBefore Europeans began colonizing Manhattan, and the surrounding estuary, NativeAmericans of the Mohegan tribes inhabited Jamaica Bay. Thirteen tribes, all part of theAlgonquin nation, occupied different portions of Jamaica Bay (Dolphin 1932). TheCanarsie and Rockaway tribes resided in what would become the Norton Basin area.These tribes lived off of the rich fish and shellfish resources that abounded in the Bay.
4
Evidence of the shellfish harvesting by these tribes could been seen near Norton Basin aslate as 1890’s. Large mounds of discarded oyster shell were located in Inwood, HogIsland, and Bayswater (the Bayswater mounds being the largest) (Bellot 1917). These largevolumes of shell hash were later used to pave several sections of the streets in townsbordering Jamaica Bay and in Manhattan. Finfish were collected using nets and fishbonehooks. Shellfish were collected using dugout canoes and wooden rakes (Black 1981).
The Canarsie tribe, along with the other tribes of the area, were displaced either throughpurchases of parcels of land or direct skirmishes with the Dutch and English settlers.Through displacement and significant population decline from diseases introduced by theEuropeans, Native American tribes were virtually extinct from Jamaica Bay by the mid-1660’s (Black 1981). Because of the level of development that has occurred in JamaicaBay over the last 200 years, the only remnants of these tribes are the names of the townsand features currently associated with Jamaica Bay and Long Island.
It is difficult to assess the level of impact, if any, that the Native Americans had on theecology of Jamaica Bay. It can be assumed that because of the lower concentration ofpeople in the tribes surrounding the Bay, and the manner in which the Native Americansused the resources of the Bay, the impacts they would have had on the ecology of thesystem were not significant. Considering that the Iroquois tribes had resided in theJamaica Bay area for hundreds of years before the arrival of Europeans, the rate at whichthe Jamaica Bay changed appears negligible compared to the changes the area hasexperienced since the extinction of the tribes from the area.
3.2 Colonial-Post Revolutionary WarThe first recorded visit of Europeans to Jamaica Bay was in 1609. Henry Hudsonattempted to enter Jamaica Bay during his exploration of the Hudson River and New YorkHarbor in September of 1609 (Dolphin 1932). Following Hudson’s brief visit, the firstresidents of Jamaica Bay were the Dutch; who, from 1624 to 1664, included the westernportions of Jamaica Bay in their New Netherlands providence near their fort in NewAmsterdam, now Manhattan (Black 1981). The area currently known as Jamaica Bay wascalled “Rustdorp.” The Dutch did not settle the east side of the Bay until the early 1640’s.The Dutch were in the New World primarily for trade purposes and did not have anyinterest in expanding their land holdings outside of New Amsterdam.
The Dutch allowed English settlers to live on land owned by the Dutch as long as theyclaimed allegiance to Amsterdam (Dolphin 1932). The towns of Hempstead, Jamaica, andFlushing were the first areas settled on the east side of Jamaica Bay, each being Englishsettlements under Dutch rule. The English referred to the Bay as “Jamaica” after a smallresident tribe called the Jameco Indians (Black 1981). In 1690, Richard Cornell purchaseda large tract of land in what is now Far Rockaway. Cornell’s home was the first permanentstructure in the area (Bellot 1917). The Cornells, and those who settled with him, clearedthe land for farming and continued to spread out around the perimeter of the Bay. Theyalso used Jamaica Bay as a rich source of fish and shellfish, and used the expansive saltmarshes as a grazing area for livestock.
5
In 1664, the Dutch government in New Amsterdam fell to the British, who renamed thecolony New York (Dolphin 1932). The population of European settlers continued toincrease through the American Revolution. Additional settlements appeared along with anever-evolving set of laws and regulations limiting who could harvest from the waters ofJamaica Bay. By 1720 the towns of Inwood and Bayswater also existed along the edge ofwhat would become Norton Basin and Little Bay (Bellot 1917).
The population surrounding Jamaica Bay, and the area surrounding present day NortonBasin and Little Bay, continued to increase through the American Revolution and the endof the 18th century. Commercial harvesting of fish and shellfish from the Bay becamemore focused as part of the population moved away from agriculture and beganmanufacturing goods for sale and trade. The Native American population disappearedfrom the area and new towns were settled.
Through the end of the 18th century there is little evidence to suggest anthropogenicimpacts to Jamaica Bay. The resident population would have been harvesting theresources of the Bay, but the concentration of people would have been too low for there tobe any perceptible impact to the quantity or quality of resources in the Bay. As early as1763 collection of fish and shellfish required permission and a written license in JamaicaBay (Bellot 1917).
3.3 1800’sBy the beginning of the 19th century, the areas surrounding Norton Basin and Little Baywere developed agricultural lands on the periphery of small towns and villages throughoutthe area. By 1811, the region was already popular with visitors from New York City andferries and stagecoaches regularly made the journey from Manhattan to Far Rockaway(Dolphin 1932). Beginning in the 1830’s, however, the complexion of eastern JamaicaBay began to change dramatically. In 1830, John Norton purchased a large tract of landfrom the Cornell heirs (Bellot 1917). Norton’s plan was to develop the land as a resortarea for nearby New York City residents. In 1833, Norton built a large hotel, known asthe Marine Pavilion, on the edge of what is now Norton basin. The hotel, and its adjoininginfrastructure, was built on marshes filled with material dredged to make channels toaccess the hotel from the water of Jamaica Bay and the ocean. This filling of marsh wasthe beginning of 100 years of dredging and marsh filling which would lead to the uplandformations we are familiar with today. The hotel, and many others like it along theRockaway peninsula and Long Island, was enormously successful. New York Cityresidents came to vacation and visit the resort area and its beaches from the 1830’s throughthe mid-1940’s. Because of its resort status, the Norton Basin area did not undergo theindustrial development seen in the western portions of Jamaica Bay and may have beenspared some of the early anthropogenic impacts experienced by areas such as Mill Basin,Barren Island, and Flatbush (Black 1981).
Some of the last areas developed on the periphery of Jamaica Bay were the towns ofArverne, Edgemere, Seaside, and Rockaway Beach. Until the 1880’s, these portions of thepeninsula were still used as pasture for livestock. The Edgemere area did not havecommercial development plans until 1892 (Bellot 1917).
6
Numerous transportation advancements took place throughout the 19th century in an effortto decrease travel time from Manhattan to the Far Rockaway area. From the early 1860’sto the 1930’s, ferries transported passengers from Manhattan and western Jamaica Bay tothe Rockaway Peninsula (Black 1981). Before a rail-line was available across JamaicaBay, visitors could travel from Manhattan to Canarsie via the Brooklyn and RockawayRailroad, chartered in 1863 (Black 1981). From Canarsie, a ferry was taken to the beachesand resorts of Rockaway. In 1869, Far Rockaway received its first rail-line connecting itto the rest of Long Island and New York City (Bellot 1917). The advancement decreasedtravel time to the resort area and substantially increased visitation and development of theFar Rockaway area. In 1872, the steam railroad was extended from Far Rockaway throughEdgemere and Arverne (Bellot 1917). In 1880, the New York, Woodhaven and RockawayRailroad Company completed the first railroad trestle across the five miles of Jamaica Bay,landing in Seaside, west of what is now Barbadoes Basin (Bellot 1917). This line, as wellas the Rockaway line, was eventually acquired by the Long Island Railroad.
Despite the thousands of residents and millions of visitors to the Far Rockaway area, thetowns surrounding Norton Basin did not have a functioning public water supply until 1885,or a public sewer system until 1897 (Bellot 1917). Prior to the construction of a sewersystem in the town of Far Rockaway, sewage was flushed, untreated, directly into the Baywhere it came in direct contact with the fish, shellfish, and bathers. There is littledocumented evidence prior to the 1870’s concerning restrictions on shellfish or swimmingin the New York Harbor Area (Carriker et al. 1982). It can be assumed that if the effectsof dumping sewage sludge, dredged material, street sweepings, cellar dirt, and ballast werebeing noticed Harbor-wide, the effects of unrestricted dumping were discernible in JamaicaBay as well. There are several reports prior to this time period of the odors and waste thatdrove vacationers from the beaches and shoreline. The numerous sources of sewage inputwould have impacted the local salt marshes and their inhabitants. It is difficult to assess,however, if all these impacts would have necessarily been detrimental to the ecology of theBay and the immediate areas of Norton Basin and Little Bay, due to the ability of intertidalmarsh plants to tolerate large influxes of nutrients and metals (Mitsch and Gosselink1993). This topic will be discussed more in Section V of this report.
In 1898, Jamaica Bay and its surrounding communities were incorporated into the City ofNew York, becoming the Borough of Queens (Bellot 1917). For many residents of theRockaway Peninsula this signaled the beginning of the end. Within the next decade theresort areas of the Rockaways would see a peak and decline in the number of touristsvisiting their beaches. Throughout the 1800’s, the marshes and subtidal areas of NortonBasin and Little Bay were largely ignored. They were considered undeveloped areas thatneeded to be passed through on the way to the resort beaches. Filling of the marshes beganto accelerate through the 1800’s to create upland habitats for the expanding towns andresorts. Fishing and shellfishing continued, but the discharge of raw sewage into thewaterways, along with the transportation developments around the Bay, was beginning toimpact the resources of the Bay.
7
3.4 1900’sStarting in the early 1900’s, the development of the Rockaway Peninsula increaseddramatically. The incorporation of the area into New York City (NYC) transformed thestring of summer tourist towns into a developed urban area. Improvements to water andfuel supplies, transportation, schools, churches, libraries, banks, and shopping centers wereonly a few of the many changes experienced the first decade of the 1900’s (Dolphin 1932).
The number of visitors to the Far Rockaway area peaked in 1902 and steadily declinedthroughout the 20th Century. This decrease in vacationers was attributed to the growingpopulation of Queens, which began to fill the borders of Jamaica Bay. Resorts andvacationing spots turned into residential housing. After having experienced a slump indevelopment during World War I, the average rent in Far Rockaway doubled in the 1920’sas population growth outpaced available housing (Dolphin 1932).
In 1906, the Jamaica Bay Improvement Commission was formed to investigate theproposal to develop Jamaica Bay into an industrial port. Throughout its existence thecommission made many recommendations toward economic development of Jamaica Bay.Many of the alternatives suggested by the Commission were never implemented, such asfilling the center of the Bay with dredged material to make two island ports with shippingchannels around the outside of the Bay; or filling in Rockaway Inlet to create a more directinlet east of what is now Riis Park (Grambo & Vega 1984). Recommendations to createdeeper shipping channels were implemented and have greatly affected the appearance,hydrology, and ecology of the entire Bay.
While the developments examined by the Improvement Commission affected the entireBay, the direct impacts to Norton Basin, Little Bay, and the southeast corner of JamaicaBay were moderate in comparison to industrial areas such as Floyd Bennett Field, BergenBasin, and Mill Creek. In 1920, further plans to develop Jamaica Bay as a commercialport were suspended (JBESG 1971). The Jamaica Bay Improvement Commission, as wellas other organizations, would continue to view the Bay as a potential port to be exploitedwell into the mid-20th Century.
The 1920’s began to see the threshold of the impacts that Jamaica Bay could sustainwithout collapse. In 1921, shellfishing was banned following several decades of typhoidand gastroenteritis outbreaks caused by raw sewage outflows into the Bay (Black 1981).Shellfish contamination and typhoid outbreaks were common throughout NY/NJ Harbor atthis time. In 1931, the City of New York, initiated a plan to treat sewage flowing into thewaters around the city. Prior to this program millions of gallons of raw sewage wereflowing into Jamaica Bay daily (JBESG 1971).
Transportation to and from the Far Rockaway area continued to develop throughout the1920’s and 30’s. In 1923, Cross-Bay Boulevard was constructed parallel to the LongIsland Railroad trestle, shortening the traveling distance between Rockaway and New YorkCity by ten miles (Dolphin 1932). As tourism began its decline, commuter traffic rose.Cross-Bay Boulevard and the Long Island Railroad are still the main throughways fortraffic to and from the Rockaway Peninsula.
8
Prior to 1938, the direct anthropogenic impacts to Norton Basin and Little Bay were fromthe increase in residential population. The southeast corner of Jamaica Bay remainedunderdeveloped other than construction of housing to accommodate rising numbers oftourists and residents. The greatest anthropogenic impact specific to the area was probablythe discharge of raw sewage into the Bay. Ecological conditions in Norton Basin andLittle Bay had probably not changed dramatically since the middle of the 1800’s. In 1938,Edgemere Landfill opened and began to receive municipal waste from the Borough ofQueens. The landfill represents the most significant impact to the current conditions ofNorton Basin and Little Bay, visually as well as ecologically. A more detailed discussionof the impacts of Edgemere Landfill is provided in Section VII.
In September of 1938, a hurricane hit the Harbor and Jamaica Bay. The oystercommunities of Jamaica Bay were reportedly destroyed (Grambo & Vega 1984) and didnot return to the Bay until the mid-1940’s. The hurricane caused widespread flooding andwould have caused raw sewage to flow into the Harbor for several days. Ecologicalimpacts to Jamaica Bay were likely to have been substantial if the oyster populations of theBay were temporarily destroyed. By the time the oysters were able to recover, however,the ecology of the Bay had been altered further, preventing return to historic populationlevels.
While 1938 was a year of significant environmental impacts in Jamaica Bay, a significantconservation effort was made to prevent complete destruction of the marsh systems in theBay. At this time, jurisdiction of Jamaica Bay was transferred to the City Department ofParks to prevent the development of landfills in the center of the Bay (West-Valle et al.1991). In response to this designation, Jamaica Bay was mapped to evaluate the status ofthe resources of the Bay. In 1948, jurisdiction was formally transferred to the NYCDepartment of Parks and Recreation (JBESG 1971) and the Jamaica Bay Wildlife Refugewas established (West-Valle et al. 1991). An important note in this conservation effortwas that only the center islands of Jamaica Bay were designated as City Parks. Theperimeter of the Bay was left out of park designation allowing for the continueddevelopment of landfills and filling of marsh habitats.
In 1941, plans were developed to construct an airport on the Idlewild Golf Course. Thisairfield would eventually become John F. Kennedy International Airport (Grambo & Vega1984). The construction of the airport resulted in yet another significant impact to theecology of the system. In 1962, runway 4-L was extended into the Bay, restricting thecirculation of tidal waters around the perimeter of the Bay.
As in the 1800’s, Jamaica Bay’s water quality problems continued to grow. Bathing wasprohibited in Jamaica Bay from 1954-56 due to contamination from sewer and storm drainoverflows on the south side of the Bay (Grambo & Vega 1984). This overflow would havelikely impacted Norton Basin and Little Bay. In 1963, a Jamaica Bay sewage treatmentplant was forced to shut down for repairs, allowing raw sewage to build up in the Bay(Grambo & Vega 1984).
9
By 1971, the Jamaica Bay Environmental Study Group (JBESG) described the Baycommunities as continuing to grow compared to other New York City Boroughs, but asalso being plagued with problems such as inadequate mass transit, overcrowded schools,inadequate storm drainage, and poor maintenance of public facilities (JBESG 1971). Thereport describes deteriorating housing and urban renewal projects in South Jamaica andArverne. The Rockaway communities were being impacted (and continue to be impacted)by noise pollution from JFK Airport. In 1971, approximately 700,000 people lived inareas of Jamaica Bay that are significantly impacted by noise from airplanes landing andtaking off (JBESG 1971). As of 1980, approximately 43,300 people lived in theimmediate area surrounding Norton Basin and Little Bay (NYCDOS 1991).
In 1972, NPS-GNRA was designated by Congress, transferring jurisdiction of the center ofJamaica Bay from NYC to the Federal government. The Jamaica Bay unit isapproximately 65 km2 (16,000 acres); 75% of this area is water, marsh, and meadowlandand 25% is upland habitats (West-Valle et al. 1991).
The 20th century saw the most dramatic changes and degradation of Jamaica Bay. Thelevel of impacts, however, was curtailed by the preservation of the center of the Bay. Hadthis foresight not been successful, the anthropogenic modification of the Bay would havecontinued throughout the century, leaving Jamaica Bay far more degraded than its currentstate.
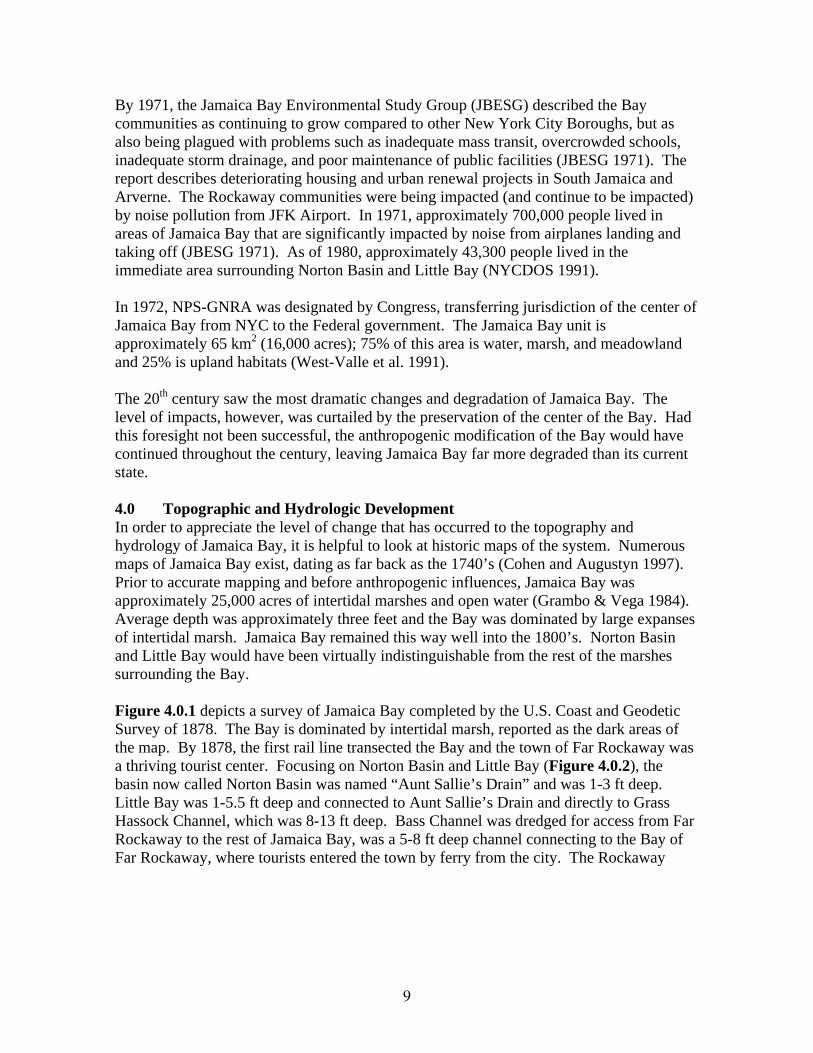
4.0 Topographic and Hydrologic DevelopmentIn order to appreciate the level of change that has occurred to the topography andhydrology of Jamaica Bay, it is helpful to look at historic maps of the system. Numerousmaps of Jamaica Bay exist, dating as far back as the 1740’s (Cohen and Augustyn 1997).Prior to accurate mapping and before anthropogenic influences, Jamaica Bay wasapproximately 25,000 acres of intertidal marshes and open water (Grambo & Vega 1984).Average depth was approximately three feet and the Bay was dominated by large expansesof intertidal marsh. Jamaica Bay remained this way well into the 1800’s. Norton Basinand Little Bay would have been virtually indistinguishable from the rest of the marshessurrounding the Bay.
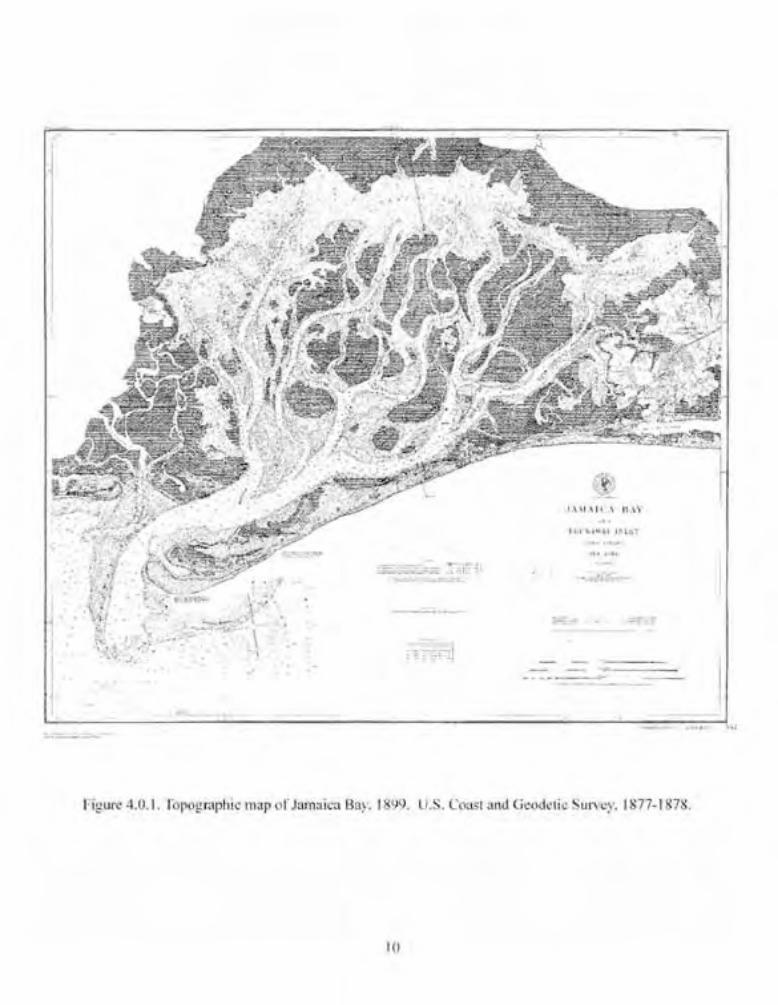
Figure 4.0.1 depicts a survey of Jamaica Bay completed by the U.S. Coast and GeodeticSurvey of 1878. The Bay is dominated by intertidal marsh, reported as the dark areas ofthe map. By 1878, the first rail line transected the Bay and the town of Far Rockaway wasa thriving tourist center. Focusing on Norton Basin and Little Bay (Figure 4.0.2), thebasin now called Norton Basin was named “Aunt Sallie’s Drain” and was 1-3 ft deep.Little Bay was 1-5.5 ft deep and connected to Aunt Sallie’s Drain and directly to GrassHassock Channel, which was 8-13 ft deep. Bass Channel was dredged for access from FarRockaway to the rest of Jamaica Bay, was a 5-8 ft deep channel connecting to the Bay ofFar Rockaway, where tourists entered the town by ferry from the city. The Rockaway
12
Branch of the Long Island Railroad passed through Far Rockaway and out onto thepeninsula. By 1878, the Norton Basin and Little Bay would have already beenexperiencing the impacts of development, both from the railroads and sewage runoff.
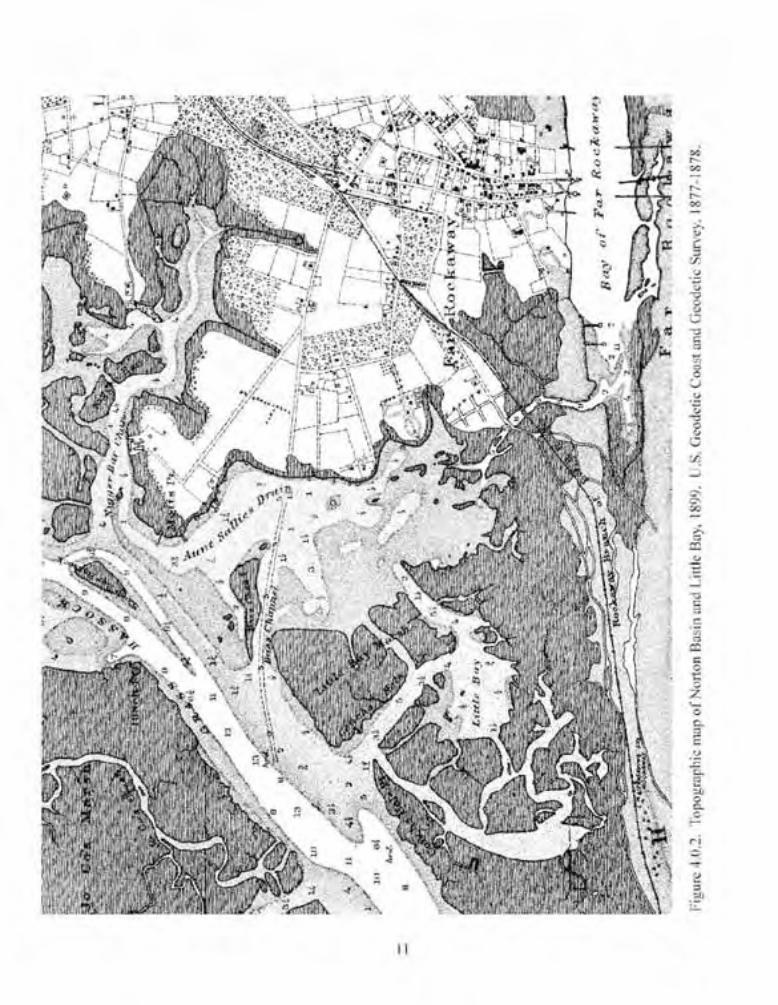
Jamaica Bay was surveyed again by the U.S. Coast and Geodetic Survey in 1897 (Figure4.0.3). On this map considerably more open water and upland areas are depicted in theBay. The filling of the Bay had accelerated and substantial areas of marsh habitat had beenlost. Upon closer inspection of Norton Basin and Little Bay (Figure 4.0.4), the loss ofintertidal marsh to open water and filled upland is dramatic. The Bay of Far Rockaway hadbeen completely filled in and the Town of Arverne was developing. The Wave Crest Inlet,which had connected Norton Basin to the ocean, existed up to 1911 when it was filled tomake way for the Town of Edgemere (Bellot 1917).
Figure 4.0.5 compares the 1897 map to the current topography of the Bay. While thecentral portion has been impacted significantly less, the periphery of the Bay has beenfilled and bulkheaded and only 13,000 acres of the original Bay remain. In 1907, 16,000acres of marsh were present in Jamaica Bay (JBESG 1971); approximately 4,000 acres ofintertidal marsh remain today. It has been estimated that by 1970, 71 million cubic yards(MCY) of sediment had been removed from Jamaica Bay (West-Valle et al. 1991),increasing the residence time of water entering the Bay from 11 days in the early 1900’s toapproximately 35 days (JBESG 1971). According to these calculations, approximately70% of the current volume of water in the Bay can be attributed to dredging. In 1953, theEast and West Ponds were dredged during a subway repair project, leaving one of therelatively few anthropogenic scars in the central portion of the Bay (JBESG 1971).
The National Oceanic and Atmospheric Administration (NOAA) Navigation Chart of 1995(Figure 4.0.6) illustrates the Bay as it currently exists, including JFK International Airport,Edgemere Landfill, Cross-Bay Boulevard, as well as significantly diminished intertidalmarsh and deep navigation channels. These impacts, however, are minimal relative to thechanges that would have occurred had conservation efforts not been implemented. If thecomplete scope of the Jamaica Bay Improvement Plan had been achieved in the 1930’s, allintertidal marshes would have been eliminated, the perimeter of the Bay would have beencompletely bulkheaded, and multiple piers and railroad lines would have been constructed(Black 1981). In the late 1960’s, plans were proposed to extend JFK airport halfwayacross the Bay, eliminating the remainder of the intertidal marshes in the center of the Bay(JBESG 1971). If these plans had been implemented, the changes to Jamaica Bay wouldhave been significantly greater than what exists today.
Figure 4.0.7 focuses on Norton Basin and Little Bay as they are portrayed in the 1995NOAA Navigation Chart. The map shows Edgemere Landfill and the residentialdevelopment around the basins. The borrow pits in each basin have depths of 64 and 51feet. The entrance channel to the basins is 10 feet deep and very narrow. This maprepresents the starting point for the proposed restoration of Norton Basin and Little Bay.


18
Figure 4.0.8 is a USGS aerial photograph of Norton Basin and Edgemere Landfill taken in1995. The image shows the high level of development that has occurred around the basinover the last 150 years. Shallow sandbars are evident in the entrance channel and along thewestern edge of the basin. These sandbars will need to be removed if the proposedrestoration proceeds in order to allow access by barges. Edgemere Landfill has beencapped in this photograph, but remains the dominant feature of the immediate landscape.A small private marina has existed in the southernmost portion of Little Bay for severaldecades. Recent bathymetric investigations in Norton Basin and Little Bay have identifiednumerous boat hulls in the bottom of Little Bay (CR Environmental 2001). These boatsare all less than 40 feet in size and do not immediately suggest any historic significance.
5.0 Changes in Water Quality5.1 Jamaica Bay
A discussion of the water quality of Norton Basin and Little Bay has to be limited to whatis known of the water quality of Jamaica Bay. Very little data has been collected in thebasins themselves, especially with regard to long term monitoring. It could be inferredfrom the restricted hydrodynamics of the basins that water quality parameters, such asdissolved oxygen (DO), nutrient concentration, chlorophyll-a, and total coliforms wouldindicate a system of impaired ecological function. Comprehensive sampling of the twobasins would be required, however, in order to make definitive statements about thecurrent water quality.
The average yearly temperature of Jamaica Bay ranges from 1˚C to 26˚C, salinity rangesfrom 20.5 to 26 parts per thousand (ppt), and pH from 6.8 to 9 (USFWS 1997). Thesystem is characteristic of a temperate, eutrophic estuary. For more than 50, years virtuallyall freshwater input to Jamaica Bay has been from urban runoff or through four sewagetreatment facilities. Sewage treatment facilities contribute 29 million gallons of treatedsewage annually (Tanacredi 1990). Freshwater inputs total approximately one half of onepercent of the Bay’s volume per day (O’Brien and Gere 1990). Two thirds of freshwaterinput are discharged from secondary sewage treatment plants; 10 percent of that volumebeing from confined sewer outfalls (CSOs) (O’Brien and Gere 1990). With eachsemidiurnal cycle, tidal currents exchange approximately one third of the volume ofJamaica Bay. As previously stated, the residence time of freshwater entering the Bay isapproximately 30 days, an effect of the deepening of the Bay through dredging and filling(JBESG 1971).
Inferences can be made to the conditions in Norton Basin and Little Bay from datacollected in other locations around Jamaica Bay. Historical and current water qualityobservations have been made in Jamaica Bay by the NPS-GNRA, U.S. Fish and WildlifeService (USFWS), U.S Environmental Protection Agency (USEPA), New York CityDepartment of Environmental Protection (NYCDEP), NYSDEC, as well as multipleacademic investigations.
The NPS has conducted seasonal water quality monitoring in Jamaica Bay since theinception of the GNRA in 1972. Over the last 30 years, the NPS has observed significantrecovery of the water quality in the Bay through monitoring of DO, temperature, pH,

20
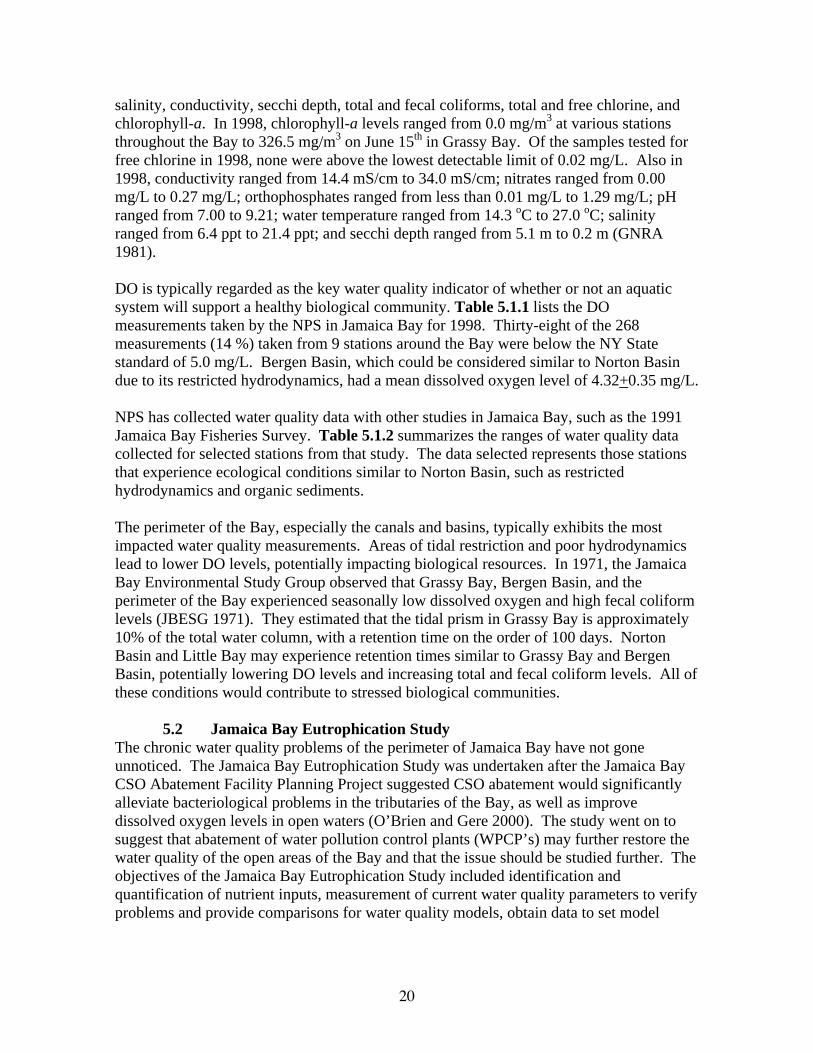
salinity, conductivity, secchi depth, total and fecal coliforms, total and free chlorine, andchlorophyll-a. In 1998, chlorophyll-a levels ranged from 0.0 mg/m3 at various stationsthroughout the Bay to 326.5 mg/m3 on June 15th in Grassy Bay. Of the samples tested forfree chlorine in 1998, none were above the lowest detectable limit of 0.02 mg/L. Also in1998, conductivity ranged from 14.4 mS/cm to 34.0 mS/cm; nitrates ranged from 0.00mg/L to 0.27 mg/L; orthophosphates ranged from less than 0.01 mg/L to 1.29 mg/L; pHranged from 7.00 to 9.21; water temperature ranged from 14.3 oC to 27.0 oC; salinityranged from 6.4 ppt to 21.4 ppt; and secchi depth ranged from 5.1 m to 0.2 m (GNRA1981).
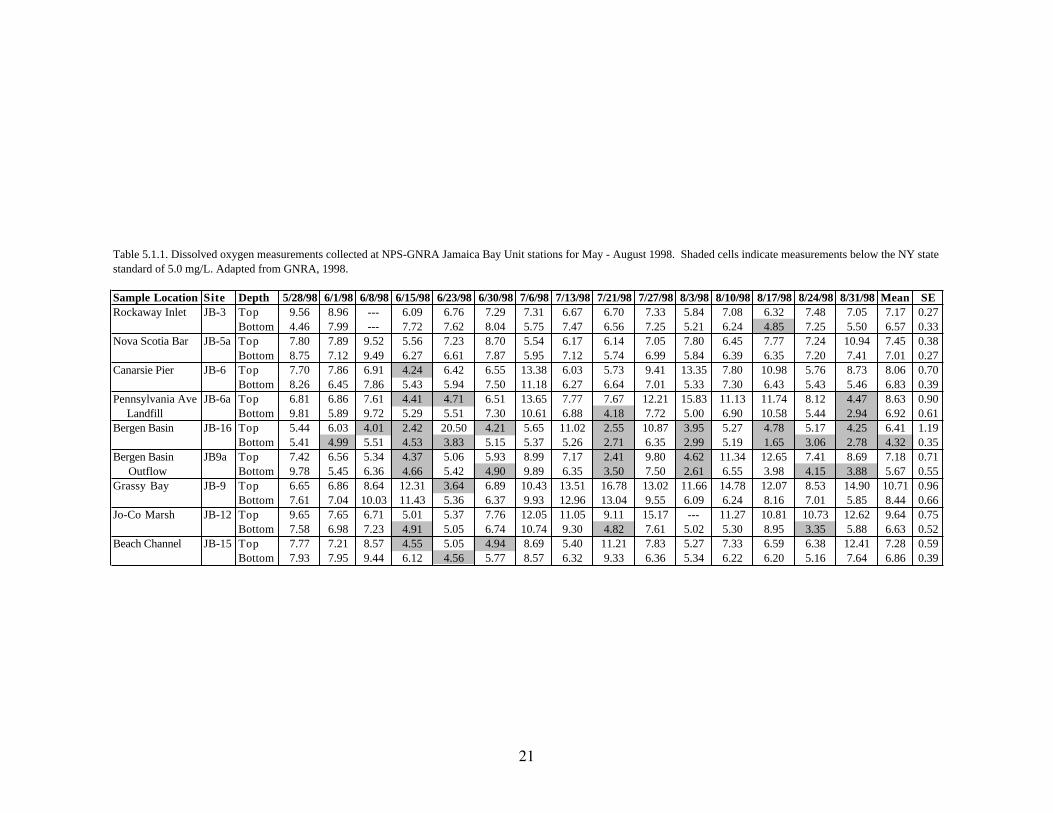
DO is typically regarded as the key water quality indicator of whether or not an aquaticsystem will support a healthy biological community. Table 5.1.1 lists the DOmeasurements taken by the NPS in Jamaica Bay for 1998. Thirty-eight of the 268measurements (14 %) taken from 9 stations around the Bay were below the NY Statestandard of 5.0 mg/L. Bergen Basin, which could be considered similar to Norton Basindue to its restricted hydrodynamics, had a mean dissolved oxygen level of 4.32+0.35 mg/L.
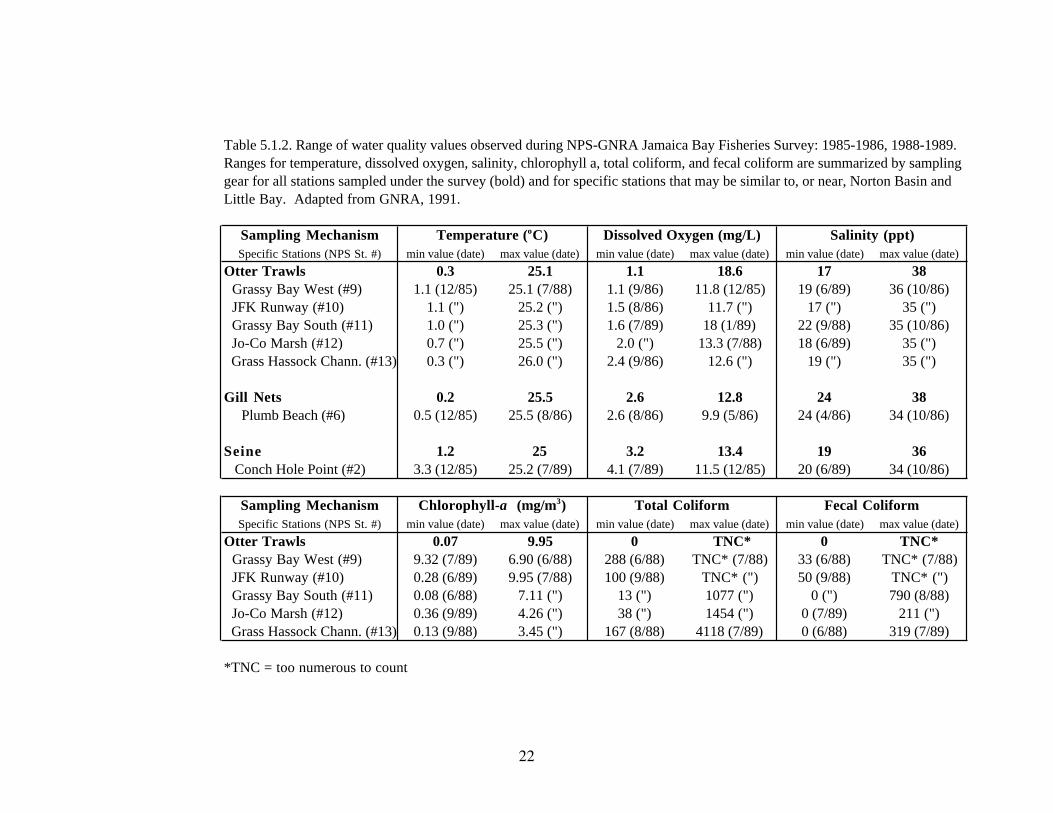
NPS has collected water quality data with other studies in Jamaica Bay, such as the 1991Jamaica Bay Fisheries Survey. Table 5.1.2 summarizes the ranges of water quality datacollected for selected stations from that study. The data selected represents those stationsthat experience ecological conditions similar to Norton Basin, such as restrictedhydrodynamics and organic sediments.
The perimeter of the Bay, especially the canals and basins, typically exhibits the mostimpacted water quality measurements. Areas of tidal restriction and poor hydrodynamicslead to lower DO levels, potentially impacting biological resources. In 1971, the JamaicaBay Environmental Study Group observed that Grassy Bay, Bergen Basin, and theperimeter of the Bay experienced seasonally low dissolved oxygen and high fecal coliformlevels (JBESG 1971). They estimated that the tidal prism in Grassy Bay is approximately10% of the total water column, with a retention time on the order of 100 days. NortonBasin and Little Bay may experience retention times similar to Grassy Bay and BergenBasin, potentially lowering DO levels and increasing total and fecal coliform levels. All ofthese conditions would contribute to stressed biological communities.
5.2 Jamaica Bay Eutrophication StudyThe chronic water quality problems of the perimeter of Jamaica Bay have not goneunnoticed. The Jamaica Bay Eutrophication Study was undertaken after the Jamaica BayCSO Abatement Facility Planning Project suggested CSO abatement would significantlyalleviate bacteriological problems in the tributaries of the Bay, as well as improvedissolved oxygen levels in open waters (O’Brien and Gere 2000). The study went on tosuggest that abatement of water pollution control plants (WPCP’s) may further restore thewater quality of the open areas of the Bay and that the issue should be studied further. Theobjectives of the Jamaica Bay Eutrophication Study included identification andquantification of nutrient inputs, measurement of current water quality parameters to verifyproblems and provide comparisons for water quality models, obtain data to set model
21
Table 5.1.1. Dissolved oxygen measurements collected at NPS-GNRA Jamaica Bay Unit stations for May - August 1998. Shaded cells indicate measurements below the NY state standard of 5.0 mg/L. Adapted from GNRA, 1998.
Sample Location Site Depth 5/28/98 6/1/98 6/8/98 6/15/98 6/23/98 6/30/98 7/6/98 7/13/98 7/21/98 7/27/98 8/3/98 8/10/98 8/17/98 8/24/98 8/31/98 Mean SERockaway Inlet JB-3 Top 9.56 8.96 --- 6.09 6.76 7.29 7.31 6.67 6.70 7.33 5.84 7.08 6.32 7.48 7.05 7.17 0.27
Bottom 4.46 7.99 --- 7.72 7.62 8.04 5.75 7.47 6.56 7.25 5.21 6.24 4.85 7.25 5.50 6.57 0.33Nova Scotia Bar JB-5a Top 7.80 7.89 9.52 5.56 7.23 8.70 5.54 6.17 6.14 7.05 7.80 6.45 7.77 7.24 10.94 7.45 0.38
Bottom 8.75 7.12 9.49 6.27 6.61 7.87 5.95 7.12 5.74 6.99 5.84 6.39 6.35 7.20 7.41 7.01 0.27Canarsie Pier JB-6 Top 7.70 7.86 6.91 4.24 6.42 6.55 13.38 6.03 5.73 9.41 13.35 7.80 10.98 5.76 8.73 8.06 0.70
Bottom 8.26 6.45 7.86 5.43 5.94 7.50 11.18 6.27 6.64 7.01 5.33 7.30 6.43 5.43 5.46 6.83 0.39Pennsylvania Ave JB-6a Top 6.81 6.86 7.61 4.41 4.71 6.51 13.65 7.77 7.67 12.21 15.83 11.13 11.74 8.12 4.47 8.63 0.90 Landfill Bottom 9.81 5.89 9.72 5.29 5.51 7.30 10.61 6.88 4.18 7.72 5.00 6.90 10.58 5.44 2.94 6.92 0.61Bergen Basin JB-16 Top 5.44 6.03 4.01 2.42 20.50 4.21 5.65 11.02 2.55 10.87 3.95 5.27 4.78 5.17 4.25 6.41 1.19
Bottom 5.41 4.99 5.51 4.53 3.83 5.15 5.37 5.26 2.71 6.35 2.99 5.19 1.65 3.06 2.78 4.32 0.35Bergen Basin JB9a Top 7.42 6.56 5.34 4.37 5.06 5.93 8.99 7.17 2.41 9.80 4.62 11.34 12.65 7.41 8.69 7.18 0.71 Outflow Bottom 9.78 5.45 6.36 4.66 5.42 4.90 9.89 6.35 3.50 7.50 2.61 6.55 3.98 4.15 3.88 5.67 0.55Grassy Bay JB-9 Top 6.65 6.86 8.64 12.31 3.64 6.89 10.43 13.51 16.78 13.02 11.66 14.78 12.07 8.53 14.90 10.71 0.96
Bottom 7.61 7.04 10.03 11.43 5.36 6.37 9.93 12.96 13.04 9.55 6.09 6.24 8.16 7.01 5.85 8.44 0.66Jo-Co Marsh JB-12 Top 9.65 7.65 6.71 5.01 5.37 7.76 12.05 11.05 9.11 15.17 --- 11.27 10.81 10.73 12.62 9.64 0.75
Bottom 7.58 6.98 7.23 4.91 5.05 6.74 10.74 9.30 4.82 7.61 5.02 5.30 8.95 3.35 5.88 6.63 0.52Beach Channel JB-15 Top 7.77 7.21 8.57 4.55 5.05 4.94 8.69 5.40 11.21 7.83 5.27 7.33 6.59 6.38 12.41 7.28 0.59
Bottom 7.93 7.95 9.44 6.12 4.56 5.77 8.57 6.32 9.33 6.36 5.34 6.22 6.20 5.16 7.64 6.86 0.39
22
Table 5.1.2. Range of water quality values observed during NPS-GNRA Jamaica Bay Fisheries Survey: 1985-1986, 1988-1989.Ranges for temperature, dissolved oxygen, salinity, chlorophyll a, total coliform, and fecal coliform are summarized by sampling gear for all stations sampled under the survey (bold) and for specific stations that may be similar to, or near, Norton Basin andLittle Bay. Adapted from GNRA, 1991.
Sampling MechanismSpecific Stations (NPS St. #) min value (date) max value (date) min value (date) max value (date) min value (date) max value (date)
Otter Trawls 0.3 25.1 1.1 18.6 17 38 Grassy Bay West (#9) 1.1 (12/85) 25.1 (7/88) 1.1 (9/86) 11.8 (12/85) 19 (6/89) 36 (10/86) JFK Runway (#10) 1.1 (") 25.2 (") 1.5 (8/86) 11.7 (") 17 (") 35 (") Grassy Bay South (#11) 1.0 (") 25.3 (") 1.6 (7/89) 18 (1/89) 22 (9/88) 35 (10/86) Jo-Co Marsh (#12) 0.7 (") 25.5 (") 2.0 (") 13.3 (7/88) 18 (6/89) 35 (") Grass Hassock Chann. (#13) 0.3 (") 26.0 (") 2.4 (9/86) 12.6 (") 19 (") 35 (")
Gill Nets 0.2 25.5 2.6 12.8 24 38 Plumb Beach (#6) 0.5 (12/85) 25.5 (8/86) 2.6 (8/86) 9.9 (5/86) 24 (4/86) 34 (10/86)
Seine 1.2 25 3.2 13.4 19 36 Conch Hole Point (#2) 3.3 (12/85) 25.2 (7/89) 4.1 (7/89) 11.5 (12/85) 20 (6/89) 34 (10/86)
Sampling MechanismSpecific Stations (NPS St. #) min value (date) max value (date) min value (date) max value (date) min value (date) max value (date)
Otter Trawls 0.07 9.95 0 TNC* 0 TNC* Grassy Bay West (#9) 9.32 (7/89) 6.90 (6/88) 288 (6/88) TNC* (7/88) 33 (6/88) TNC* (7/88) JFK Runway (#10) 0.28 (6/89) 9.95 (7/88) 100 (9/88) TNC* (") 50 (9/88) TNC* (") Grassy Bay South (#11) 0.08 (6/88) 7.11 (") 13 (") 1077 (") 0 (") 790 (8/88) Jo-Co Marsh (#12) 0.36 (9/89) 4.26 (") 38 (") 1454 (") 0 (7/89) 211 (") Grass Hassock Chann. (#13) 0.13 (9/88) 3.45 (") 167 (8/88) 4118 (7/89) 0 (6/88) 319 (7/89)
*TNC = too numerous to count
Total Coliform Fecal Coliform
Temperature (oC) Dissolved Oxygen (mg/L) Salinity (ppt)
Chlorophyll-a (mg/m3)
23
inputs and rate components, develop hydrodynamic and eutrophication models specific toJamaica Bay, and use the model to identify effective future management alternatives.
It is important to note that Norton Basin and Little Bay were not included in the samplingand modeling of the Bay. Additional sampling efforts and modeling runs would need to bemade to calibrate the current model to the confined area of Norton Basin. Inferences canbe made, though, about the conditions that may exist in Norton Basin based on conditionsobserved in Jo-Co Marsh, Grassy Bay, Head of Bay, Bergen Basin, and Shellbank Basin.
The report concluded that the four NYC WPCP’s in the Jamaica Bay drainage area werecontributing the majority of the carbon, nitrogen, and phosphorus (81.2%, 94.9%, and94.9% of input sources, respectively), inputs to the Bay (O’Brien and Gere 2000).Landfills, however, contributed only 1.7% of carbon and 1.3% of nitrogen into the JamaicaBay system.
Important results from the model calibration include percent of time for DO standardcompliance for the majority of the Bay. Table 5.2.1 lists DO measurements taken tocalibrate the water quality model for areas throughout the Bay. The 1995-96 datademonstrated that dead-end canals, such as Shellbank Basin and Mill Basin, would havehydrodynamic features similar to Norton Basin and Little Bay and would experienceseasonal hypoxia (O’Brien and Gere 2000). Overall, the model indicated that the northeastsections of the Bay, which experience restricted tidal flow, are chronically belowNYSDEC DO standards (Figure 5.2.1).
5.3 Norton Basin/Little BayThe tidal waters of Norton Basin and Little Bay have been designated Class “I” inaccordance with NYSDEC, Title 6, Chapter X, Parts 700-705 (NYCDOS 1991). Thisdesignation means the water in this area is not considered to be potable and is not requiredto maintain maximum contaminant levels for drinking water standards. Class “I”designation requires a minimum DO level of 4.0 mg/L and notes that best usage of suchwaters can include secondary contact recreation, fishing, and fish propagation and survival.Virtually no long term water quality data exists for Norton Basin and Little Bay. The NewYork City Department of Sanitation (NYCDOS) collected short term monitoring datawhen assessing the potential impacts of closing the Edgemere Landfill in 1991.
Flow analysis of the landfill identified leachate flows into Jamaica Bay directly from thebase of the landfill and indirectly from tidal deposits. (NYCDOS 1991). Three leachateseeps were identified at the eastern base of the landfill. The study estimated that averagenet flow of groundwater from the landfill to the Bay is 146,000 gallons per day (53 milliongallons per year). It was also estimated that average net flow of groundwater from theneck of the landfill to Little Bay and Sommerville Basin is 130,000 gallons per day (47.5million gallons per year).
The NYCDOS study indicated that the bottom of Little Bay in May of 1990 was hypoxicwith a DO level below 1.0 mg/L (NYCDOS 1991). Tidal velocities ranged from less than0.2 feet per second to more than 1.0 foot per second. The H2M Group calculated the daily
24
Table 5.2.1. Seasonal average DO concentrations from 1995-96 water quality monitoring station, Jamaica Bay Eutrophication Study. Shaded cells indicate measurements below the NY state standard of 5.0 mg/L. Adapted from O'Brien and Gere, 2000.
Station No. Station Name Strata Summer 95 Autumn 95 Winter 96 Spring 96 Summer 96J01 Rockaway Inlet Surface 7.10 10.91 12.93 11.79 6.71
Bottom 6.60 10.36 12.05 9.46 6.31J02 Island Channel Surface 7.40 11.06 14.29 12.04 7.41
Bottom 6.29 10.99 13.64 10.51 6.24J03 Head of Bay Surface 5.56 10.96 14.30 7.80 6.32
Bottom 4.30 8.93 14.08 6.70 4.59J04 Paerdegat Basin Ent. Surface 7.22 8.90 13.70 10.36 6.98
Bottom 5.76 8.14 13.23 9.58 5.67J05 Fresh Creek Entrance Surface 6.58 9.93 14.05 8.19 7.20
Bottom 5.07 10.04 14.02 7.67 6.59J06 Spring Creek Entrance Surface 5.89 9.89 13.94 8.05 5.95
Bottom 4.94 9.53 13.12 7.60 5.66J07 Bergen Basin Entr. Surface 7.03 9.30 13.58 8.53 7.69
Bottom 3.95 8.53 13.21 7.31 5.50J08 Grassy Bay Surface 7.96 10.28 13.63 8.90 8.33
Bottom 3.28 8.06 12.65 6.49 4.15J09 Jo-Co Marsh Basin Surface 5.78 10.97 15.14 8.09 6.68
Bottom 4.68 9.74 14.05 6.27 4.61J10 Grass Hassock Chan. Surface 5.96 9.21 13.48 8.45 6.49
Bottom 5.51 8.65 13.56 8.03 6.00J11 Beach Channel Surface 6.38 11.42 13.73 9.98 6.73
Bottom 6.58 11.27 13.28 11.32 6.20J12 The Raunt Surface 7.87 9.88 13.69 10.36 7.59
Bottom 7.29 9.55 13.64 10.05 7.56J13 Big Fishkill Channel Surface 7.55 12.77 14.65 10.94 8.07
Bottom 6.66 12.26 14.25 10.74 8.02J14 Pumpkin Patch Chann. Surface 7.77 9.87 15.10 10.59 7.72
Bottom 7.49 9.30 14.63 10.53 7.38J15 East Broad Channel Surface 7.21 11.84 15.98 7.97 5.99
Bottom 3.76 10.01 14.43 6.88 5.24J16 Mill Basin - Mid Surface 8.54 10.92 14.98 12.52 7.86
Bottom 4.67 9.89 13.20 8.68 4.85J17 East Mill Basin Surface 8.76 7.75 15.12 12.42 8.28
Bottom 0.84 6.39 10.76 2.84 0.38J18 Mill Basin - Head Surface 8.21 6.79 14.84 10.49 7.82
Bottom 1.44 5.66 13.52 5.54 2.73J19 Shellbank Basin - Mid Surface 6.83 8.60 15.34 8.30 4.97
Bottom 1.42 8.43 13.04 3.20 1.76J20 Shellbank Basin - Head Surface 7.54 6.05 11.85 9.03 5.50
Bottom 0.11 4.02 7.91 0.57 0.13
Dissolved Oxygen (mg/L)
26
tidal prism, non-tidal volume, and contaminated groundwater leachate for Norton Basin,Little Bay, and adjacent Grass Hassock Channel for the NYCDOS study (Table 5.3.1)(H2M Group 1990). Their calculations indicated that only the top 10 ft of water wasbeing exchanged out of Little Bay with each tidal cycle. These calculations confirm thatthe enclosed basins, particularly Little Bay, have sub-standard water quality characteristics.Since the NYCDOS data was not collected over a long time period, however, frequentmonitoring of Norton Basin and Little Bay would allow for a more detailed description ofthe parameters of the two basins.
6.0 Changes in Biological Resources6.1 Jamaica Bay
As with its physical characteristics, sharp contrasts in biological resources exist within therelatively confined areas of Jamaica Bay. Jamaica Bay has been designated a SignificantCoastal Fish and Wildlife Habitat by the New York State Department of State (NYSDOS)and the Bay, up to the high tide line, has been designated as a Critical Environmental Areaby the NYSDEC (USFWS 1997). The Jamaica Bay Unit of the NPS-GNRA is theconfluence of two principle flyways for migratory waterfowl. In 1971, approximately 300species of birds were recorded in Jamaica Bay (JBESG 1971), making it a biological oasisin a highly urbanized area. This dense assemblage of birds is a direct result of thedestruction of smaller estuaries along the coast. As smaller, more widely distributedestuarine habitats have disappeared, migratory birds have become concentrated in JamaicaBay.
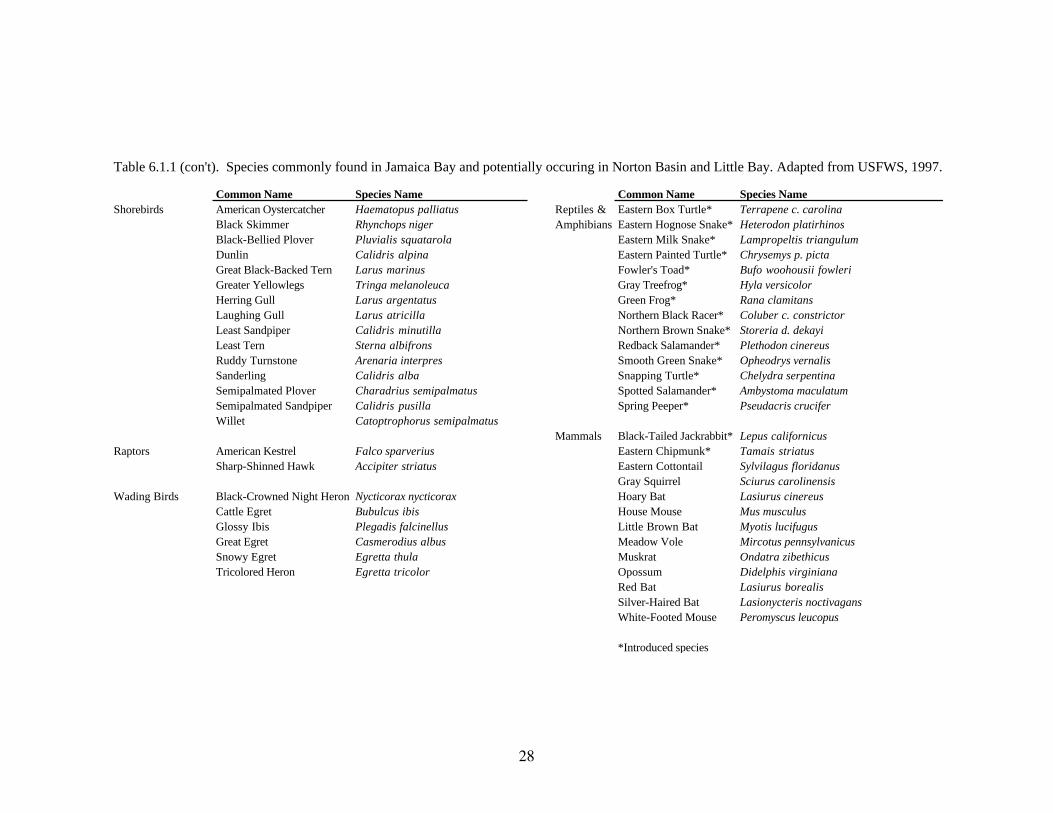
Throughout the year Jamaica Bay may support as many as 120 species of birds and 48species of fish on a year-round or seasonal basis (USFWS 1997). Table 6.1.1 lists some ofthe more common species found in Jamaica Bay. Table 6.1.2 lists the Federally and statelisted species occurring in Jamaica Bay.
Even in its preserved state, the biological resources of the Bay are a fraction of theirhistoric levels. The decline of Jamaica Bay’s resources began in the mid-1800’s as humanpopulation densities increased around the perimeter of the Bay and harvesting pressureincreased. In the 1860’s, commercial harvesting techniques became available for thecollection of shellfish, dramatically increasing the number of organisms removed from theBay (Black 1981). The shellfish industry peaked in the early 1900’s and crashed in the1920’s due to pollution. Beginning in the 1870’s, a significant decrease in the quantity and
Table 5.3.1. Daily tidal prism volume, non-tidal prism volume, and contaminated groundwater leachate discharge for Norton Basin, Little Bay and Grass Hassock Channel. Adapted from H2M Group, 1990.
Volume of Non-Tidal Contaminated Groundwater Tidal Prism Volume Leachate Discharge Dilution
(CY) (CY) (CY) Ratio
Grass Hassock Channel 1,729,592 11,718,518 233 7423:1
Norton Basin and Little Bay 1,718,948 3,556,444 196 8770:1
27
Table 6.1.1. Species commonly found in Jamaica Bay and potentially occurring in Norton Basin and Little Bay. Adapted from USFWS, 1997.
Common Name Species Name Common Name Species NameIntertidal Plants Salt Meadow Grass Spartina patens Finfish Alewife Alosa pseudoharengus
Salt Marsh Cordgrass Spartina alterniflora American Eel Anguilla rostrataSea Lettuce Ulva latuca American Shad Alosa sapidissima
Atlantic Menhaden Brevoortia tyrannusUpland Plants Autumn Olive* Elaeagnus umbellata Atlantic Silverside Menidia menidia
Bayberry Myrica pensylvanica Atlantic sturgeon Acipenser oxyrhynchusBeach Plum Prunus maritima Bay Anchovy Anchoa mitchilliBeachgrass Ammophila breviligulata Black Sea Bass Centropristis striataBlack Cherry Prunus serotina Blueback Herring Alosa aestivalisCommon Reed Phragmites australis Bluefish Pomatomus saltatrixCottonwood Populus deltoides Mummichog Fundulus heteroclitusGrey Birch Betula populifolia Scup Stenostomus chrysopsHackberry Celtis occidentalis Searobin Prionotus spp.Japanese Barberry* Berberis thunbergii Striped Bass Morone saxatilisJapanese Black Pine* Pinus thunbergii Striped Killifish Fundulus majalisJapanese Knotweed* Polygonum cuspidatum Summer Flounder Paralichthys dentatusLittle Bluestem Schizachyrium scoparium Tautog Tautoga onitisPoison Ivy Toxidendron radicans Weakfish Cynoscion regalisSeaside Goldenrod Solidago sempivirens Windopane Scophthalmus aquosusSumac Rhus spp. Winter Flounder Pleuronectes americanusSwitchgrass Panicum virgatumTree-of-Heaven Ailanthus altisima Waterfowl American Black Duck Anas rubripesWillow Salix spp. American Wigeon Anas americana
Brant Branta berniculaBivalves, Mollusks, Atlantic Ribbed Mussel Geukensia demissa Bufflehead Bucephala albeolaand Crustaceans Atlantic Surf Clam Spisula solidissima Canada Goose Branta canadensis
Blue Crab Callinectes sapidus Canvasback Aythya valisneriaBlue Mussel Mytilus edulis Greater Scaup Aythya marilaHorseshoe Crab Limulus polyphemus Mallard Anas platyrhynchosMud Snail Ilyanassa obsoleta Red-Breasted Merganser Mergus serratorNorthern Quahog Mercenaria mercenaria Ruddy Duck Oxyura jamaicensisSoft-Shelled Clam Mya arenaria Snow Goose Chen caerulescensFour-Eyed Amphipod Ampelisca abdita
*Introduced species
28
Table 6.1.1 (con't). Species commonly found in Jamaica Bay and potentially occuring in Norton Basin and Little Bay. Adapted from USFWS, 1997.
Common Name Species Name Common Name Species NameShorebirds American Oystercatcher Haematopus palliatus Reptiles & Eastern Box Turtle* Terrapene c. carolina
Black Skimmer Rhynchops niger Amphibians Eastern Hognose Snake* Heterodon platirhinosBlack-Bellied Plover Pluvialis squatarola Eastern Milk Snake* Lampropeltis triangulumDunlin Calidris alpina Eastern Painted Turtle* Chrysemys p. pictaGreat Black-Backed Tern Larus marinus Fowler's Toad* Bufo woohousii fowleriGreater Yellowlegs Tringa melanoleuca Gray Treefrog* Hyla versicolorHerring Gull Larus argentatus Green Frog* Rana clamitansLaughing Gull Larus atricilla Northern Black Racer* Coluber c. constrictorLeast Sandpiper Calidris minutilla Northern Brown Snake* Storeria d. dekayiLeast Tern Sterna albifrons Redback Salamander* Plethodon cinereusRuddy Turnstone Arenaria interpres Smooth Green Snake* Opheodrys vernalisSanderling Calidris alba Snapping Turtle* Chelydra serpentinaSemipalmated Plover Charadrius semipalmatus Spotted Salamander* Ambystoma maculatumSemipalmated Sandpiper Calidris pusilla Spring Peeper* Pseudacris cruciferWillet Catoptrophorus semipalmatus
Mammals Black-Tailed Jackrabbit* Lepus californicusRaptors American Kestrel Falco sparverius Eastern Chipmunk* Tamais striatus
Sharp-Shinned Hawk Accipiter striatus Eastern Cottontail Sylvilagus floridanusGray Squirrel Sciurus carolinensis
Wading Birds Black-Crowned Night Heron Nycticorax nycticorax Hoary Bat Lasiurus cinereusCattle Egret Bubulcus ibis House Mouse Mus musculusGlossy Ibis Plegadis falcinellus Little Brown Bat Myotis lucifugusGreat Egret Casmerodius albus Meadow Vole Mircotus pennsylvanicusSnowy Egret Egretta thula Muskrat Ondatra zibethicusTricolored Heron Egretta tricolor Opossum Didelphis virginiana
Red Bat Lasiurus borealisSilver-Haired Bat Lasionycteris noctivagansWhite-Footed Mouse Peromyscus leucopus
*Introduced species
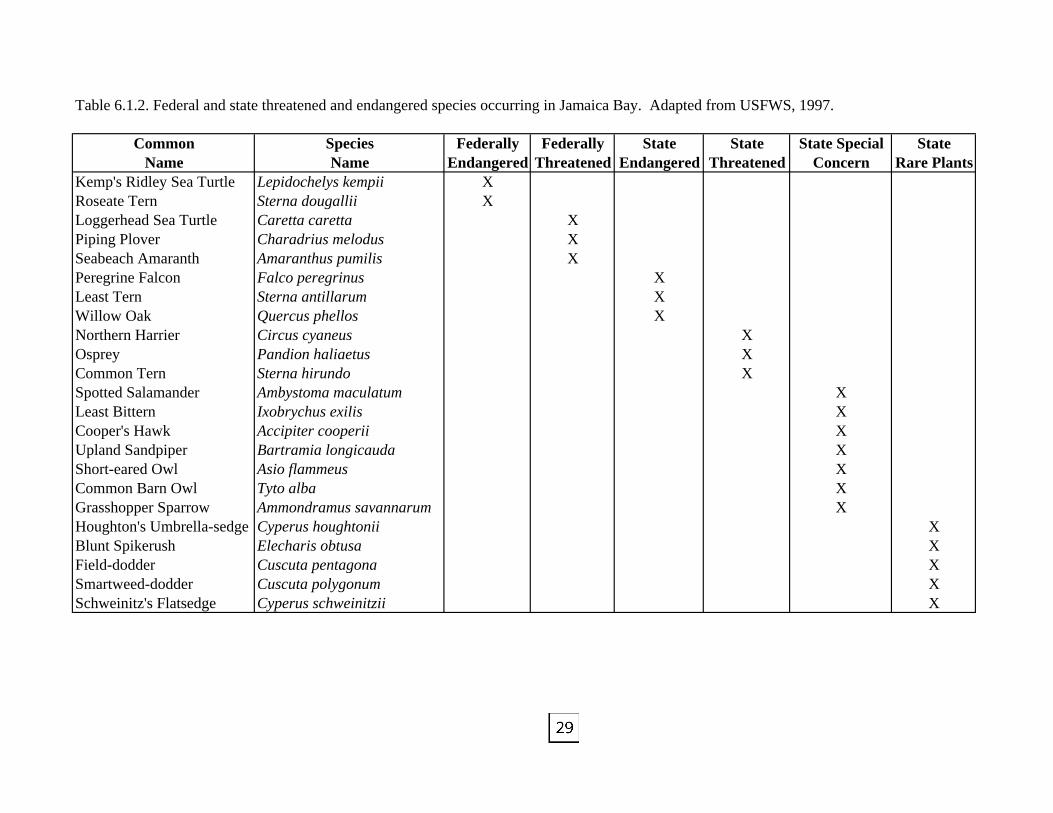
Table 6.1.2. Federal and state threatened and endangered species occurring in Jamaica Bay. Adapted from USFWS, 1997.
Common Species Federally Federally State State State Special StateName Name Endangered Threatened Endangered Threatened Concern Rare Plants
Kemp's Ridley Sea Turtle Lepidochelys kempii XRoseate Tern Sterna dougallii XLoggerhead Sea Turtle Caretta caretta XPiping Plover Charadrius melodus XSeabeach Amaranth Amaranthus pumilis XPeregrine Falcon Falco peregrinus XLeast Tern Sterna antillarum XWillow Oak Quercus phellos XNorthern Harrier Circus cyaneus XOsprey Pandion haliaetus XCommon Tern Sterna hirundo XSpotted Salamander Ambystoma maculatum XLeast Bittern Ixobrychus exilis XCooper's Hawk Accipiter cooperii XUpland Sandpiper Bartramia longicauda XShort-eared Owl Asio flammeus XCommon Barn Owl Tyto alba XGrasshopper Sparrow Ammondramus savannarum XHoughton's Umbrella-sedge Cyperus houghtonii XBlunt Spikerush Elecharis obtusa XField-dodder Cuscuta pentagona XSmartweed-dodder Cuscuta polygonum XSchweinitz's Flatsedge Cyperus schweinitzii X
Patricia Spidahl
29
30
quality of oysters in New York Harbor, including Jamaica Bay, was noticed (Carriker et al.1982). The decline was attributed to the unrestricted waste disposal practices throughoutNY/NJ Harbor.
In 1900, the Oysterman’s Association of Canarsie operated 266 boats on 500 to 600 oysterplots in Jamaica Bay and harvested 10,000 bushels of clams (JBESG 1971). By 1917, themajority of fishermen in Jamaica Bay were recreational and not commercial (Bellot 1917);and starting in 1921 Jamaica Bay was closed to commercial shellfishing due to health risksassociated with typhoid outbreaks (JBESG 1971).
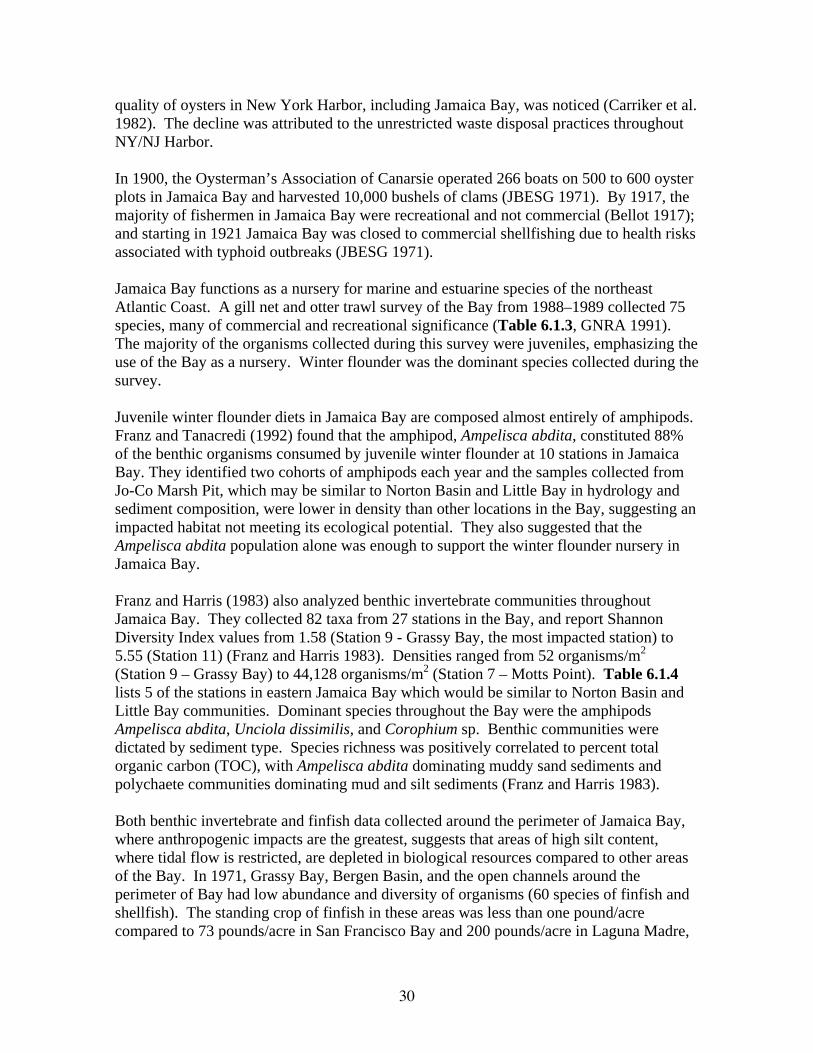
Jamaica Bay functions as a nursery for marine and estuarine species of the northeastAtlantic Coast. A gill net and otter trawl survey of the Bay from 1988–1989 collected 75species, many of commercial and recreational significance (Table 6.1.3, GNRA 1991).The majority of the organisms collected during this survey were juveniles, emphasizing theuse of the Bay as a nursery. Winter flounder was the dominant species collected during thesurvey.
Juvenile winter flounder diets in Jamaica Bay are composed almost entirely of amphipods.Franz and Tanacredi (1992) found that the amphipod, Ampelisca abdita, constituted 88%of the benthic organisms consumed by juvenile winter flounder at 10 stations in JamaicaBay. They identified two cohorts of amphipods each year and the samples collected fromJo-Co Marsh Pit, which may be similar to Norton Basin and Little Bay in hydrology andsediment composition, were lower in density than other locations in the Bay, suggesting animpacted habitat not meeting its ecological potential. They also suggested that theAmpelisca abdita population alone was enough to support the winter flounder nursery inJamaica Bay.
Franz and Harris (1983) also analyzed benthic invertebrate communities throughoutJamaica Bay. They collected 82 taxa from 27 stations in the Bay, and report ShannonDiversity Index values from 1.58 (Station 9 - Grassy Bay, the most impacted station) to5.55 (Station 11) (Franz and Harris 1983). Densities ranged from 52 organisms/m2
(Station 9 – Grassy Bay) to 44,128 organisms/m2 (Station 7 – Motts Point). Table 6.1.4lists 5 of the stations in eastern Jamaica Bay which would be similar to Norton Basin andLittle Bay communities. Dominant species throughout the Bay were the amphipodsAmpelisca abdita, Unciola dissimilis, and Corophium sp. Benthic communities weredictated by sediment type. Species richness was positively correlated to percent totalorganic carbon (TOC), with Ampelisca abdita dominating muddy sand sediments andpolychaete communities dominating mud and silt sediments (Franz and Harris 1983).
Both benthic invertebrate and finfish data collected around the perimeter of Jamaica Bay,where anthropogenic impacts are the greatest, suggests that areas of high silt content,where tidal flow is restricted, are depleted in biological resources compared to other areasof the Bay. In 1971, Grassy Bay, Bergen Basin, and the open channels around theperimeter of Bay had low abundance and diversity of organisms (60 species of finfish andshellfish). The standing crop of finfish in these areas was less than one pound/acrecompared to 73 pounds/acre in San Francisco Bay and 200 pounds/acre in Laguna Madre,
31
Table 6.1.3. Finfish species collected in Jamaica Bay by National Park Service using gill nets and otter trawls, 1985-1986 and 1988-1989. Adapted from GNRA, 1991.
Common Name Scientific Name Common Name Scientific Name
Sand tiger shark Odontaspis taurus Black sea bass Centropristis striataSmooth dogfish Mustelis canis Bigeye Priacanthus arenatusSpiny dogfish Squalus acanthias Short bigeye Pristigenys altaLittle skate Raja erinacea Bluefish Pomatomus saltatrixClearnose skate Raja elanteria Cobia Rachycentron canadumCownose ray Rhinoptera bonasus African pompano Alectis cilarisAtlantic sturgeon Acipenser oxyrhynchus Yellow jack Caranx bartholomaeiAmerican eel Anguilla rostrata Crevalle jack Caranx hipposConger eel Conger oceanicus Bigeyed scad Selar crumenophthalmusBluback herring Alosa aestvalis Lookdown Selene vomerAlewife Alosa pseudoharengus Scup Stenotumus chrysopsAmerican shad Alosa sapidissima Northern kingfish Menticirrhus saxatilisAtlantic menhaden Brevoortia tyrannus Spot Leistomus xanthurusAtlantic herring Clupea harengus Weakfish Cynoscion regalisBay anchovy Anchoa mitchilli Spotfin butterflyfish Chaetodon ocellatusInshore lizardfish Synodus foetens Tautog Tautoga onitisOyster toadfish Opsanus tau Cunner Tautogolabrus adspersusAtlantic cod Gadus morhua Striped mullet Mugil cephalusAtlantic tomcod Microgadus tomcod White mullet Mugil curemaSilver hake Merluccius bilinearis Northern sennett Sphyraena borealisRed hake Urophycis chuss Northern stargazer Astroscopus guttatusSpotted hake Urophycis regia Ocean pout Macrozoarces americanusWhite hake Urophycis tenuis American sand lance Ammodytes hexapterusHalfbeak Hyporhamphus unifasciatus Naked goby Gobiosoma bosciAtlantic needlefish Strongylura marina Seaboard goby Gobiosoma ginsburgiMummichog Fundulus heteroclitus Butterfish Peprilus triacanthusBanded killifish Fundulus diaphanus Northern searobin Prionotus carolinusStriped killifish Fundulus majalis Striped searobin Prionotus evolansSpotfin killifish Fundulus luciae Grubby sculpin Myoxocephalus aeneusInland silverside Menidia beryllina Longhorn sculpin Myoxocephalus octodecimspinosusAtlantic silverside Menidia menidia Summer flounder Paralichthys dentatusBluespotted coronetfish Fistularia tabacaria Fourspot flounder Paralichthys oblongusFourspine stickleback Apeltus quadracus Gulf stream flounder Citharichthys arctifronsThreespine stickleback Gasterosteus aculeatus Smallmouth flounder Etropus microstomusLined seahorse Hippocampus erectus Windowpane Scophthalmus aquosusNorthern pipefish Syngnathus fuscus Winter flounder Pleuronectes americanusWhite perch Morone americana Hogchoker Trinectes maculatusStriped bass Morone saxatilis
32
Texas (JBESG 1971). For Jamaica Bay, the values observed in the survey ranged fromzero fish/acre in Grassy Bay to 6.5 pounds/acre in North Channel.
Of recent political and ecological significance is the issue of wetland loss in Jamaica Bay.Interagency efforts are currently being made to determine the causes of intertidal wetlandloss throughout Jamaica Bay and strategies to conserve and restore the remaining wetlands.Preliminary estimates of current rates of wetland loss in Jamaica Bay are 44 acres/year(Dave Fallon, NYSDEC, pers. comm.). At this rate the remaining 1000 acres of intertidalmarsh will not exist by 2024. Public interest in restoring intertidal habitats in Jamaica Bayhas significantly increased in the past year. This interest has prompted local, state, andFederal agencies to begin intensive investigations into the ecological issues of JamaicaBay.
6.2 Norton Basin/Little BayWhen compared to the habitats of Jamaica Bay located with the NPS-GNRA boundaries,virtually nothing is known of the biology of Norton Basin and Little Bay. It can beassumed that before the dredging of the borrow pits to create Edgemere Landfill in 1938,the small basins had the same relative floral and faunal characteristics as the rest of theBay. As late as 1872 the perimeters of Edgemere and Arverne were covered with grovesof cedar trees (Bellot 1917).
The only documentation of biota collected in Norton Basin comes from the NYCDOSEdgemere Landfill Closure reports (NYCDOS 1991, 1992). NYCDOS (1991) identifiedthe following taxa of plants in the upland and intertidal portions of the landfill: Phragmitescommunis, Artemisia vulgaris, Spartina sp., Helianthus sp., Ambrosia sp., Polygonum sp.,Artemisia vulgaris, Gramineae, Compositae, Populus sp., Ailanthus sp., Prunus sp., Rhussp., and Myrica sp. The survey did not quantify abundances or densities of species andmay not be complete. NYCDOS (1991) also identified the following finfish taxa in thesubtidal habitats surrounding the landfill: Atlantic silversides, Menidia menidia, and winterflounder, Pleuronectes americanus. Conspicuously missing from this list are themummichog, (Fundulus heteroclitus), Atlantic menhaden (Brevoortia tyrannus), andbluefish (Pomatomus saltatrix).
7.0 Anthropogenic ImpactsThe following discussions of cultural, topographical, water quality and biological changesdevelop the current status of the level of impact humans have had on the ecology of
Table 6.1.4. Density of benthic invertebrates, number of species, diversity, amphipod density, and percent dominance of amphipods collected from various stations in the western portion of Jamaica Bay (n=2). Adapted from Franz and Harris, 1983.
Shannon Total Amphipoda Percent Dominance TotalDiversity Density Density of Amphipoda Biomass
Station Name Station # No. Species H' (m2) (m2) (%) (g/m2)Beach Chan./Winhole Chan. 5 30 3.21 2,676 1,492 55.8 58.30Grass Hassock Chan. 6 38 1.75 30,476 15,152 49.7 436.87Motts Point 7 46 1.59 4,412 22,816 51.7 119.18Grassy Bay 9 13 1.42 52 -- -- 1.40Ruler's Bar 26 28 1.52 17,896 5,808 32.4 135.22
33
Jamaica Bay. The types of impacts experienced in Jamaica Bay are no different than thoseexperienced in any other part of the NY/NJ Harbor. Such impacts include dredging, waste-water and sewage treatment plants, landfill runoff, shipping and boating traffic, andindustry.
Approximately 71 MCY of sediment have been dredged from Jamaica Bay over the last 80years (West-Valle et al. 1991). The largest single dredging event was the creation of theborrow pit in Grassy Bay, which was authorized to dredge 37 MCY of material to createfill for JFK Airport. It is estimated that 70% of the current water volume of the Bay hasbeen added as the result of dredging, thereby increasing the surface to volume ratio andexacerbating eutrophication (West-Valle et al. 1991). It is also important to note that themajority of the 71 MCY of sediment removed from the subtidal habitats of Jamaica Baywas used to fill intertidal marshes around the perimeter of the Bay. The impact has beentwo-fold, the modification of subtidal habitats and the destruction of intertidal habitats.
West-Valle et al. (1991) estimated that approximately 287 million gallons of treatedeffluent per day are discharged into the Bay from the six sewage treatment plants operatingin Jamaica Bay, approximately 1.3% of the tidal prism. The treatment plant dischargesrepresent the majority of freshwater input to the Bay. By 1980, more than 1.5 millionpeople were using the six sewer districts that empty into the Bay (West-Valle et al. 1991).O’Brien and Gere (2000) calculated that the water treatment facilities are the greatestsources of carbon, nitrogen, and phosphorus to the Bay (Figure 7.0.1). The watertreatment facilities were cited as the primary source adding to the continued eutrophicationof Jamaica Bay.
In 1987 ship traffic in Jamaica Bay totaled 20,341 vessels, including recreational,industrial, and commercial vessels (West-Valle et al. 1991). The impacts associated withthis traffic include fuel spillage, increased wave erosion, and loss of cargo. These impactsare relatively less than other areas of the Harbor simply because Jamaica Bay does notreceive the same frequency of ships and boats passing through its channels. The LongIsland Railroad bridge limits the size and frequency of large barges passing through theeastern channels of Jamaica Bay. This has helped to lessen the impacts of shipping in thewestern portions of the Bay. Boat traffic in Norton Basin and Little Bay would be limitedto recreational traffic that would be able to navigate through the shallow entrance channelto the basin.
Jamaica Bay may be severely impacted, but has still received less industrial pollutionrelative to other areas of the Harbor (JBESG 1971). Skinner et al. (1996) analyzed tissuesamples of 26 species of finfish, bivalves, crustaceans, and squid in six areas of the NY/NJHarbor estuary for polychlorinated biphenyls (PCBs), DDT compounds, mercury,chlordane compounds, and polycyclic aromatic hyrdocarbons (PAHs). The tissue samplescollected from Jamaica Bay contained detectable concentrations of each of thesechemicals, but were in significantly lower proportions compared to other areas of theNY/NJ Harbor. This is due to the fact that Jamaica Bay has received less industrialpollution relative to areas such as the Arthur Kill, Kill Van Kull, and Newark Bay. Table7.0.1 compares the furan and dioxin levels in tissues of commercially and recreationally
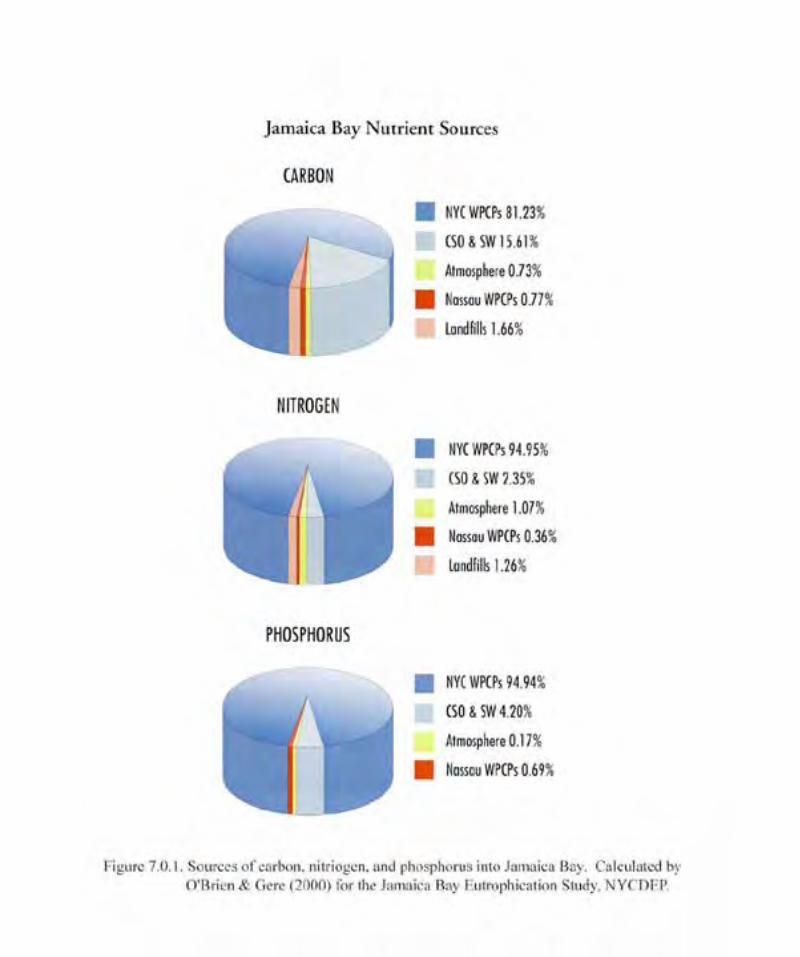
Table 7.0.1. Total dioxin and total furans levels [measured in pico-grams/gram (pg/g)] from tissues collected from edible organisms in Jamaica Bay and Upper Bay, NY/NJ. Adapted from Skinner et al. 1997 for NYSDEC survey of tissue contaminant levels in six areas of NY/NJ Harbor Estuary. Upper Bay (Area 1) was selected as a relative comparison to Jamaica Bay (Area 4). Samples were also collected from the Hudson River, East and Harlem Rivers, Newark Bay, Lower Bay, and New York Bight Apex.
Jamaica Bay (Area 4) Upper Bay (Area 1)
Species Size/Tissue Sample 1* Sample 2* Sample 1* Sample 2* Sample 1* Sample 2* Sample 1* Sample 2*
American Eel 6.19 2.86 2.99 1.64 6.42 7.13 2.30 3.23
Bluefish < 12 inches TL 2.37 3.00 1.82 2.54 4.20 3.85 3.23 2.3912 - 22 inches TL 1.41 5.87 1.57 2.28 na na na na> 22 inches TL 5.34 2.10 5.20 2.47 62.06 36.58 63.94 37.49
Striped Bass 18 - 24 inches TL na na na na 7.13 45.62 8.40 4.5424 - 30 inches TL 5.14 2.93 13.94 10.80 7.40 5.58 44.72 16.85> 30 inches TL 5.40 na 12.54 na 3.52 6.27 3.36 7.35
Tautog 0.85 1.71 0.50 2.21 0.52 4.42 0.34 4.17
White Perch 5.93 8.86 1.16 2.26 5.62 24.58 5.52 23.28
Winter Flounder 2.00 2.37 0.71 2.03 1.44 1.85 0.87 1.57
Blue Crab muscle 2.40 1.80 0.32 0.57 13.98 2.58 3.60 1.00hepatopancreas 13.55 14.30 4.94 5.77 240.40 98.60 566.60 340.00
* Legal edible size organisms were collected by angling and crab pots. Tissue samples were taken to make 25 - 30 gram aliquots for analysis.
Each aliquot was given a NYSDEC identification number. For the purposes of this report, the aliquots are refered to as sample 1 or sample 2.
Total Dioxins Total Furanspg/g (wet weight) pg/g (wet weight)
Total Dioxins Total Furanspg/g (wet weight) pg/g (wet weight)

36
harvested finfish and crustaceans from Jamaica Bay to the Upper Bay. The Upper Bay hadrelatively higher levels of the majority of dioxins and furans but did not contain the highestlevel of tissue concentrations in the study. Areas such as Newark Bay and the East andHarlem Rivers exhibited the highest levels of bioaccumulation of PCBs in the study(Skinner et al. 1997).
Eastern Jamaica Bay has not received the level of industrial impacts experienced by thewestern portion of the Bay. Between 1859 and 1934, twenty eight companies operated onBarren Island alone (West-Valle et al. 1991). These industries included fish processingplants as well as refuse and fertilizer disposal facilities (Black 1981). To date the onlymajor facility to have operated on the shores of Norton Basin and Little Bay is theEdgemere Landfill.
A Master’s Thesis from Hunter College in 1978 investigated PCB bioaccumulation andwas unable to detect significant differences between PCB’s in the sediment and biologicaltissue samples collected from Jamaica Bay (Gelbart 1978). The project collected tissuesamples from the soft-shelled clam, Mya arenaria, and Atlantic menhaden from two siteslocated near Norton Basin and Little Bay.
While the impacts of PCBs and heavy metal contamination of the sediments of JamaicaBay has been significant, a decrease has been observed in relative levels over the last fourdecades. Bopp et al. (1993) examined sediment cores taken from Grassy Bay for historicPCB and heavy metal levels. The study estimated that the sedimentation rate of GrassyBay from mid-1950’s to late-1980’s was 1.4 cm/yr. This material was almost exclusivelyfine grain silt. The sediment core samples revealed that PCB, copper, lead, zinc,chromium, and mercury levels peaked in the late 1960’s and had steadily declined toapproximately half of their highest levels by the late 1980’s (PCB levels were 420 ppb insurface sediments from 1983) (Table 7.0.2).
The NPS-GNRA also conducted an analysis of intertidal sediment and tissue samples fromGrassy Bay (Quinn and Cairns 1995). Their results indicated similar PCB and PAHcongeners between sediment samples and tissue samples from the mud snail (Ilyanassaobsoleta), ribbed mussels (Geukensia demissa), and soft-shell clams (Table 7.0.3). Therelationship between contaminant levels in the sediments and tissues from each station wasnot significant.
7.1 Edgemere LandfillEdgemere Landfill was opened in 1938 to receive the tremendous volumes of trash beingproduced by the Borough of Queens. From 1938 to its closure in June 1991, the landfillreceived over 9 MCY of municipal waste (NYCDOS 1991). The presence of the landfillhas had a profound impact on the ecological characteristics of Norton Basin and Little Bayand was identified as one of the two major contamination sources at Edgemere (the secondbeing the neck of the peninsula leading to the landfill where illegally buried drums werediscovered in 1982).
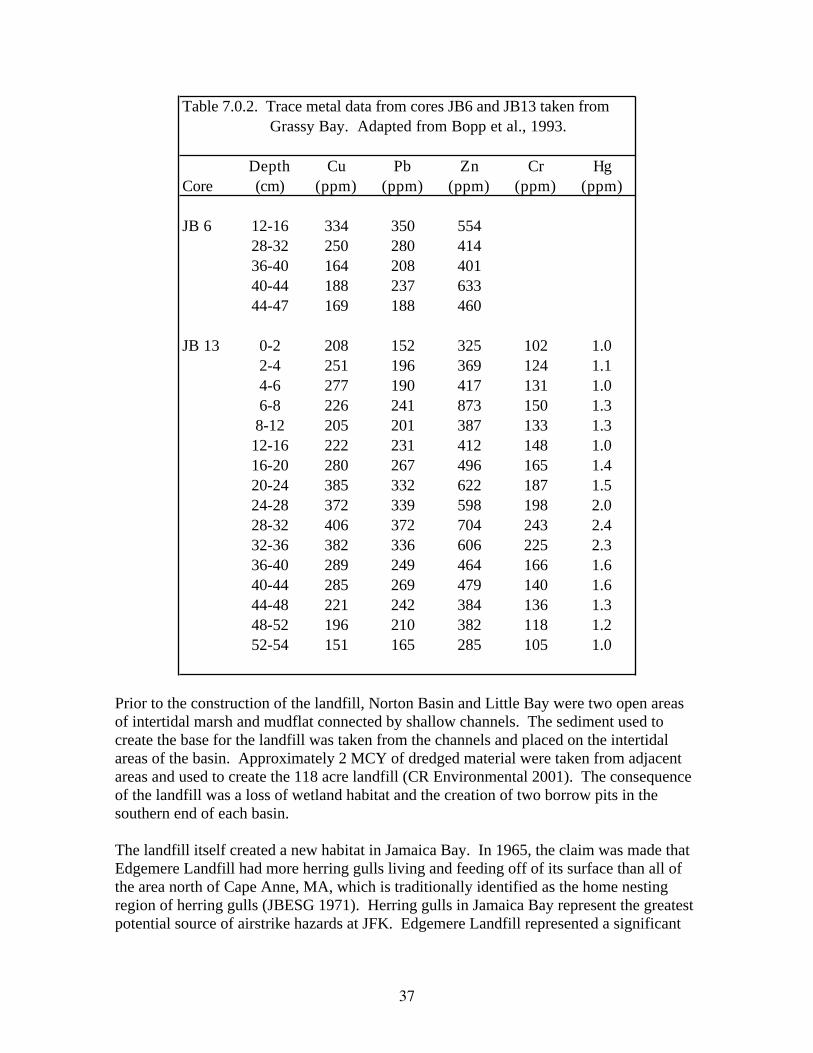
37
Prior to the construction of the landfill, Norton Basin and Little Bay were two open areasof intertidal marsh and mudflat connected by shallow channels. The sediment used tocreate the base for the landfill was taken from the channels and placed on the intertidalareas of the basin. Approximately 2 MCY of dredged material were taken from adjacentareas and used to create the 118 acre landfill (CR Environmental 2001). The consequenceof the landfill was a loss of wetland habitat and the creation of two borrow pits in thesouthern end of each basin.
The landfill itself created a new habitat in Jamaica Bay. In 1965, the claim was made thatEdgemere Landfill had more herring gulls living and feeding off of its surface than all ofthe area north of Cape Anne, MA, which is traditionally identified as the home nestingregion of herring gulls (JBESG 1971). Herring gulls in Jamaica Bay represent the greatestpotential source of airstrike hazards at JFK. Edgemere Landfill represented a significant
Table 7.0.2. Trace metal data from cores JB6 and JB13 taken from Grassy Bay. Adapted from Bopp et al., 1993.
Depth Cu Pb Zn Cr HgCore (cm) (ppm) (ppm) (ppm) (ppm) (ppm)
JB 6 12-16 334 350 55428-32 250 280 41436-40 164 208 40140-44 188 237 63344-47 169 188 460
JB 13 0-2 208 152 325 102 1.02-4 251 196 369 124 1.14-6 277 190 417 131 1.06-8 226 241 873 150 1.3
8-12 205 201 387 133 1.312-16 222 231 412 148 1.016-20 280 267 496 165 1.420-24 385 332 622 187 1.524-28 372 339 598 198 2.028-32 406 372 704 243 2.432-36 382 336 606 225 2.336-40 289 249 464 166 1.640-44 285 269 479 140 1.644-48 221 242 384 136 1.348-52 196 210 382 118 1.252-54 151 165 285 105 1.0

Table 7.0.3. Surface sediment organic and tissue organic contaminants collected from intertidal stations in Jamaica Bay for the NPS-GNRA 1995 survey of organic contaminants in organisms and sediments from Grassy Bay stations adjacent to Kennedy International Airport. Tissue samples were analysed from soft-shell clam (Mya areneria ), ribbed mussel (Geukensia demissa ), and mud snails (Ilyanassa obsoleta ). Adapted from Quinn & Cairns, 1995.
Surface Sediment Organic Contaminants and Organic CarbonStation NPS St. Organic Station NPS St.Name Number Total PCBs Total PAHs Carbon (OC) PCBs/OC PAHs/OC Name Number Total PCBs Total PAHs
(ng/g) (ng/g) (ng/g) (ng/g) (ng/g) (ng/g) (ng/g)CLAMS
JFK Outflow Pipe 1 1 29.6 337.0 2.3 12.9 146.0 JFK Outflow Pipe 1 1 885 3930JFK Outflow Pipe 2 (outside boom) 2a 117.0 3130.0 4.4 26.6 711.0 JFK Outflow Pipe 2 2 490 8040JFK Outflow Pipe 2 (inside boom) 2b 1380.0 11800.0 17.7 77.9 667.0 Grassy Bay NW 3 285 1390JFK Outflow Pipe 2 (outfall) 2c 0.9 101.0 2.3 0.4 43.9 Grassy Bay SW 4 (control) 234 794Grassy Bay NW 3 3.1 13.1 2.4 1.3 5.5Grassy Bay SW (control site) 4 5.5 515.0 4.6 1.2 112.0 MUSSELSGrassy Bay South 6 2.8 49.6 2.8 1.0 17.7 JFK Outflow Pipe 1 1 1218 3540Grassy Bay SE 7 7.0 9440.0 51.0 0.1 185.0 JFK Outflow Pipe 2 3 760 2630East Broad Chan./Cross Bay Blvd. 10 1.2 75.2 2.9 0.4 25.9 Grassy Bay SW 4 (control) 251 772Ruler's Bar 11 3.3 74.4 3.3 1.0 22.6Black Bank Marsh 12 6.0 90.1 4.1 1.5 21.9 MUD SNAILSRockaway Inlet 16 0.2 4.2 1.5 0.1 2.8 JFK Outflow Pipe 1 1 4320 7580
JFK Outflow Pipe 2 2 2960 8120Grassy Bay NW 3 935 1290
Tissues Organic Contaminants
38
39
hazard because it is located directly in the path of runway 4L at JFK airport and wasconcentrating such a great number of gulls.
In 1982, approximately 3,000 illegally disposed 55 gallon drums of industrial waste werefound buried on the Edgemere Landfill property (NYCDOS 1991). The discovery andsubsequent clean-up of these hazardous materials led to the closure of the landfill and aninvestigation by the NYCDOS into the effects Edgemere Landfill was having on adjacentareas. In 1991 and 1992 Remedial and Feasibility Investigations were completed outliningthe closure of the landfill. These reports offer the only direct information concerning thegeological, hydrological, and ecological characteristics of Norton Basin and Little Bay.The Remedial and Feasibility Investigations concluded that of the upper glacial sanddeposits underlying the landfill material at Edgemere effectively contained landfillcontaminants. Contaminant levels in the upper glacial sand were below recommendedcleanup levels and were a fraction of the levels recorded in the landfill material (NYCDOC1991). The report also estimated that approximately 1,128 cubic yards (CY) ofsediment/year were eroding from Edgemere Landfill into adjacent waters (NYCDOS1992). The investigation concluded that the contaminants in these sediments were not adirect threat to the ecological health of the basins.
Even though biological and hydrological impacts were assessed in the NYCDOS reports,chemical levels in sediment and water were the primary focus of the investigations.Volatile organic compounds (VOCs) in surface water samples in Little Bay were observedto be less than 10 ppb, lower than six Jamaica Bay reference stations. Table 7.1.1 lists theranges of VOCs and Bureau of Waste Management (BWM) parameters collected from thesubtidal sediments surrounding the landfill. The report stated that Edgemere Landfillaccounted for less than one percent of contaminants found in Jamaica Bay. Theycommented that contaminant levels do not exceed maximum contaminant levels fordrinking water, but observed that some contaminant levels below the drinking waterstandard do have toxic effects on aquatic organisms.
The NYCDOS also reviewed previous reports investigating the status and health standardcompliance of Edgemere Landfill when completing the remedial investigation andfeasibility study of the landfill closure. The following reports may have relatedinformation on the level of contamination and water quality in the areas surroundingEdgemere Landfill (NYCDOS 1991):
• “Analytical characteristics of landfill waters,” October 1979, New York CityDepartment of Environmental Protection.
• “Study of six Department of Sanitation landfill disposal facilities and their compliancewith the applicable Federal and state laws, rules and requirements,” January 1980,Parsons Brinckerhoff-Cosulich.
• “Preliminary report – hydrogeologic conditions at four (4) landfills in New York City,”March 1982, Leo M. Page.
• “Investigations of indicator pollutant levels at New York City landfills,” June 1982,Parsons Brinckerhoff-Cosulich.
• “Edgemere air monitoring program,” March 1983, Fred C. Hart.
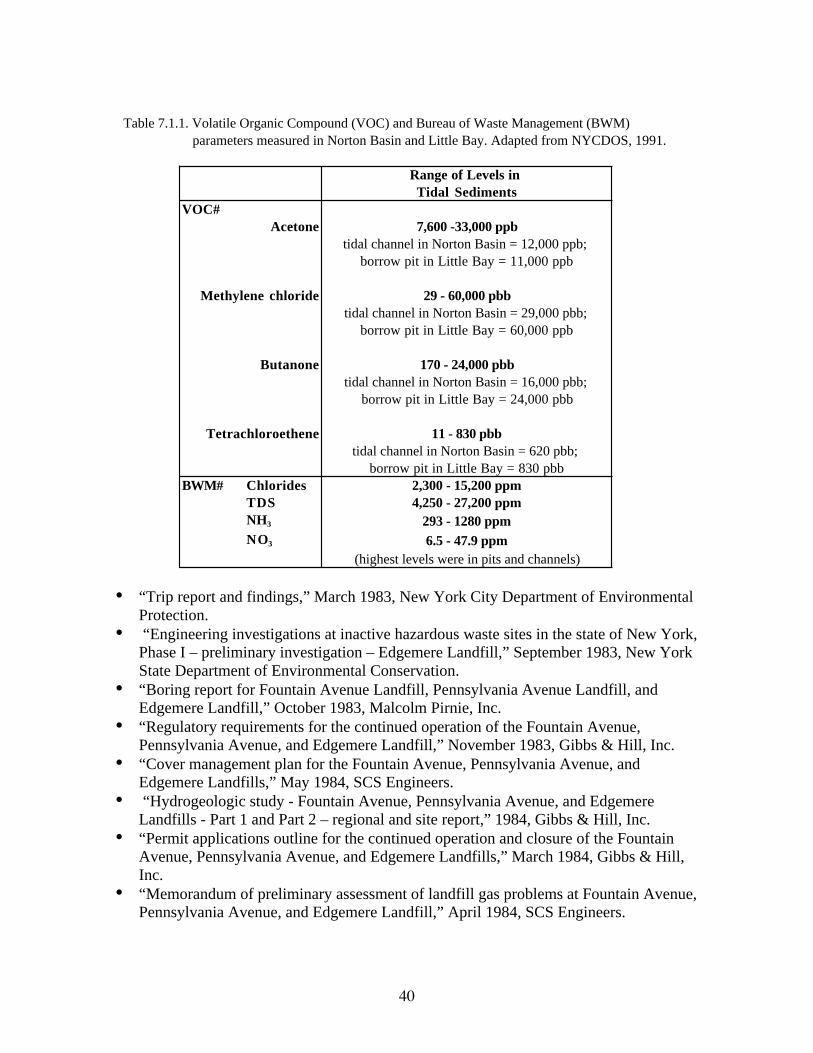
40
• “Trip report and findings,” March 1983, New York City Department of EnvironmentalProtection.
• “Engineering investigations at inactive hazardous waste sites in the state of New York,Phase I – preliminary investigation – Edgemere Landfill,” September 1983, New YorkState Department of Environmental Conservation.
• “Boring report for Fountain Avenue Landfill, Pennsylvania Avenue Landfill, andEdgemere Landfill,” October 1983, Malcolm Pirnie, Inc.
• “Regulatory requirements for the continued operation of the Fountain Avenue,Pennsylvania Avenue, and Edgemere Landfill,” November 1983, Gibbs & Hill, Inc.
• “Cover management plan for the Fountain Avenue, Pennsylvania Avenue, andEdgemere Landfills,” May 1984, SCS Engineers.
• “Hydrogeologic study - Fountain Avenue, Pennsylvania Avenue, and EdgemereLandfills - Part 1 and Part 2 – regional and site report,” 1984, Gibbs & Hill, Inc.
• “Permit applications outline for the continued operation and closure of the FountainAvenue, Pennsylvania Avenue, and Edgemere Landfills,” March 1984, Gibbs & Hill,Inc.
• “Memorandum of preliminary assessment of landfill gas problems at Fountain Avenue,Pennsylvania Avenue, and Edgemere Landfill,” April 1984, SCS Engineers.
Table 7.1.1. Volatile Organic Compound (VOC) and Bureau of Waste Management (BWM) parameters measured in Norton Basin and Little Bay. Adapted from NYCDOS, 1991.
Range of Levels in Tidal Sediments
VOC#Acetone 7,600 -33,000 ppb
tidal channel in Norton Basin = 12,000 ppb; borrow pit in Little Bay = 11,000 ppb
Methylene chloride 29 - 60,000 pbbtidal channel in Norton Basin = 29,000 pbb;
borrow pit in Little Bay = 60,000 ppb
Butanone 170 - 24,000 pbbtidal channel in Norton Basin = 16,000 pbb;
borrow pit in Little Bay = 24,000 pbb
Tetrachloroethene 11 - 830 pbbtidal channel in Norton Basin = 620 pbb;
borrow pit in Little Bay = 830 pbbBWM# Chlorides 2,300 - 15,200 ppm
TDS 4,250 - 27,200 ppmNH3 293 - 1280 ppmNO3 6.5 - 47.9 ppm
(highest levels were in pits and channels)
41
• “Memorandum of additional landfill gas investigation at Fountain Avenue,Pennsylvania Avenue, and Edgemere Landfills,” April 1985, SCS Engineers.
• “Environmental factors report – Edgemere Landfill,” 1985, Gibbs & Hill, Inc.• “Operations plan report – Edgemere Landfill,” 1985, SCS Engineers.• “Long term ground and surface water monitoring program for Fountain Avenue
Landfill, Pennsylvania Avenue Landfill, and Edgemere Landfill,” August 1985, Gibbs& Hill, Inc.
• “Hazard/risk evaluation of buried drum area of Edgemere Landfill,” 1985, Gibbs &Hill, Inc.
• “Landfill design report – Edgemere Landfill,” November 1985, SCS Engineers, Inc.• “Leachate management for the Edgemere Landfill,” November 1985, SCS Engineers,
Inc.• “Scope of work for remediation of buried drum area at Edgemere Landfill,” November
1985, Gibbs & Hill, Inc.• “Final summary test report for the three phase air quality monitoring programs at the
Fountain Avenue, Pennsylvania Avenue, and Edgemere Landfills,” 1985, YorkResearch Corporation.
While these reports may not directly address water quality or ecological issues associatedwith the aquatic habitats of Norton Basin and Little Bay, they could provide insight intopotential sources and levels of contaminants that could be expected in the borrow pits ofthe two basins.
8.0 Additional Borrow Pit StudiesFinding ecologically acceptable solutions to dredged material placement has become a toppriority of virtually all major shipping ports over the last 20 years. Potential solutionsrange from decontamination of the sediment to be used for commercial construction tocreation and enhancement of upland, intertidal, and aquatic habitats. The creation ofconfined aquatic disposal (CAD) cells has become a viable technology for safely disposingof contaminated dredged material in the system it was originally located. This placementalternative, however, is more expensive than the alternative of filling pre-existing borrowpits, which typically exist in an urban harbor from decades of development and dredging.Borrow pits also offer an attractive beneficial use alternative for dredged materialplacement, an advantage not shared by CAD cell technology.
Borrow pit research, however, has produced a wide variety of conflicting information inregards to the ecological significance borrow pits have in marine !!!!!!!!and!!!!!!! freshwater systems.!!Research into the placement and development of CAD cells lends some insight intoaddressing the potential impacts associated with filling a borrow pit with dredged material,but does not assess whether filling the pit constitutes a beneficial use application to thesystem where the pit is located. It is not unusual to find multiple borrow pits in the samesystem, each having different levels of ecological significance to the system, somebeneficial, some detrimental. Thus far, the debate over the ecological function of borrowpits is unresolved. Each borrow pit must be analyzed based on the system in which itexists and a pre-determined definition of what constitutes an ecologically significanthabitat.
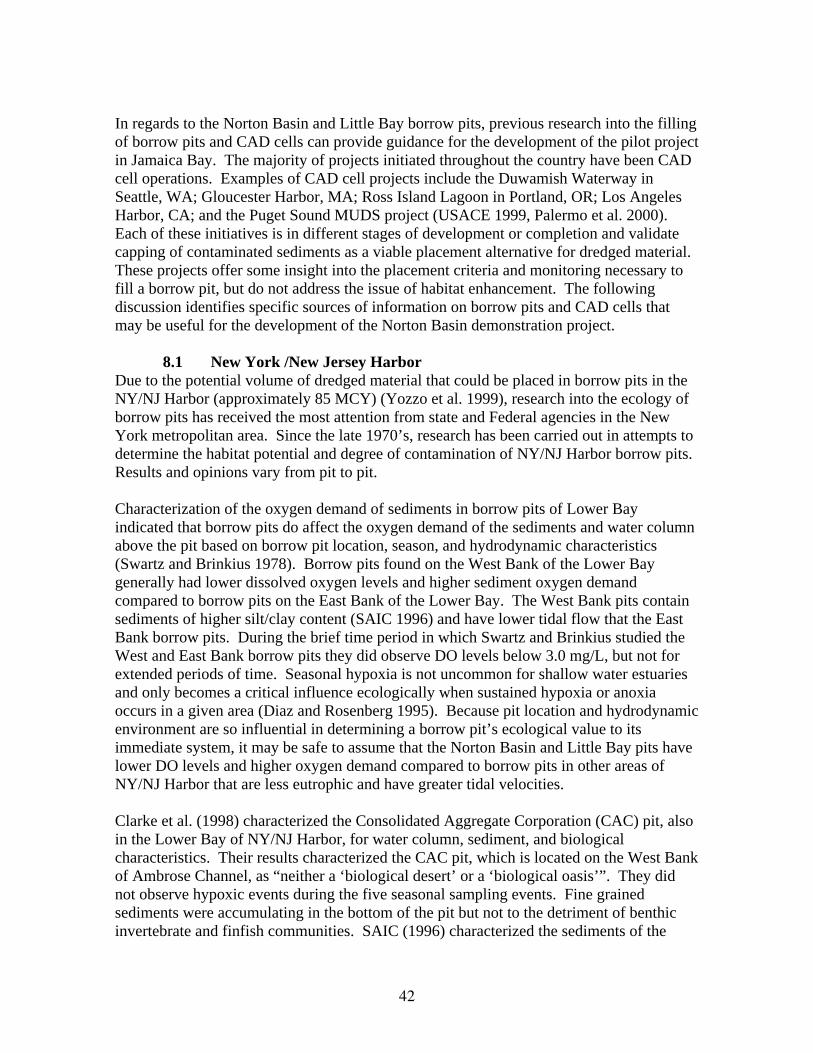
42
In regards to the Norton Basin and Little Bay borrow pits, previous research into the fillingof borrow pits and CAD cells can provide guidance for the development of the pilot projectin Jamaica Bay. The majority of projects initiated throughout the country have been CADcell operations. Examples of CAD cell projects include the Duwamish Waterway inSeattle, WA; Gloucester Harbor, MA; Ross Island Lagoon in Portland, OR; Los AngelesHarbor, CA; and the Puget Sound MUDS project (USACE 1999, Palermo et al. 2000).Each of these initiatives is in different stages of development or completion and validatecapping of contaminated sediments as a viable placement alternative for dredged material.These projects offer some insight into the placement criteria and monitoring necessary tofill a borrow pit, but do not address the issue of habitat enhancement. The followingdiscussion identifies specific sources of information on borrow pits and CAD cells thatmay be useful for the development of the Norton Basin demonstration project.
8.1 New York /New Jersey HarborDue to the potential volume of dredged material that could be placed in borrow pits in theNY/NJ Harbor (approximately 85 MCY) (Yozzo et al. 1999), research into the ecology ofborrow pits has received the most attention from state and Federal agencies in the NewYork metropolitan area. Since the late 1970’s, research has been carried out in attempts todetermine the habitat potential and degree of contamination of NY/NJ Harbor borrow pits.Results and opinions vary from pit to pit.
Characterization of the oxygen demand of sediments in borrow pits of Lower Bayindicated that borrow pits do affect the oxygen demand of the sediments and water columnabove the pit based on borrow pit location, season, and hydrodynamic characteristics(Swartz and Brinkius 1978). Borrow pits found on the West Bank of the Lower Baygenerally had lower dissolved oxygen levels and higher sediment oxygen demandcompared to borrow pits on the East Bank of the Lower Bay. The West Bank pits containsediments of higher silt/clay content (SAIC 1996) and have lower tidal flow that the EastBank borrow pits. During the brief time period in which Swartz and Brinkius studied theWest and East Bank borrow pits they did observe DO levels below 3.0 mg/L, but not forextended periods of time. Seasonal hypoxia is not uncommon for shallow water estuariesand only becomes a critical influence ecologically when sustained hypoxia or anoxiaoccurs in a given area (Diaz and Rosenberg 1995). Because pit location and hydrodynamicenvironment are so influential in determining a borrow pit’s ecological value to itsimmediate system, it may be safe to assume that the Norton Basin and Little Bay pits havelower DO levels and higher oxygen demand compared to borrow pits in other areas ofNY/NJ Harbor that are less eutrophic and have greater tidal velocities.
Clarke et al. (1998) characterized the Consolidated Aggregate Corporation (CAC) pit, alsoin the Lower Bay of NY/NJ Harbor, for water column, sediment, and biologicalcharacteristics. Their results characterized the CAC pit, which is located on the West Bankof Ambrose Channel, as “neither a ‘biological desert’ or a ‘biological oasis’”. They didnot observe hypoxic events during the five seasonal sampling events. Fine grainedsediments were accumulating in the bottom of the pit but not to the detriment of benthicinvertebrate and finfish communities. SAIC (1996) characterized the sediments of the
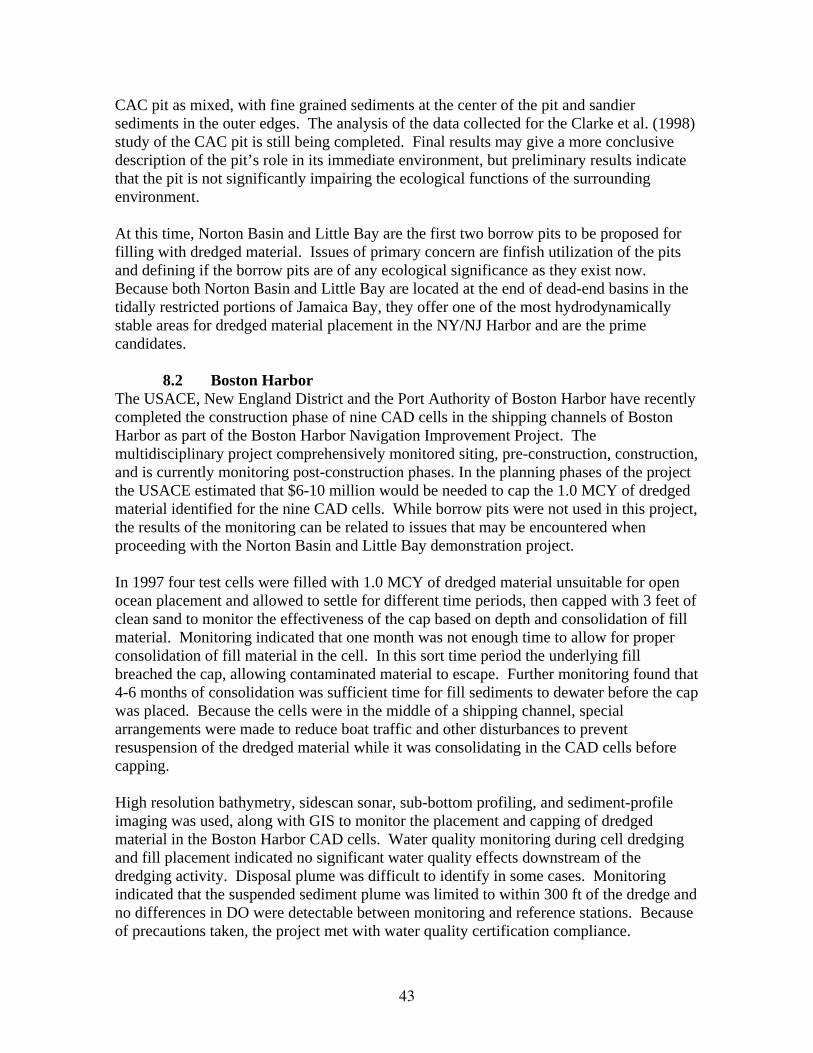
43
CAC pit as mixed, with fine grained sediments at the center of the pit and sandiersediments in the outer edges. The analysis of the data collected for the Clarke et al. (1998)study of the CAC pit is still being completed. Final results may give a more conclusivedescription of the pit’s role in its immediate environment, but preliminary results indicatethat the pit is not significantly impairing the ecological functions of the surroundingenvironment.
At this time, Norton Basin and Little Bay are the first two borrow pits to be proposed forfilling with dredged material. Issues of primary concern are finfish utilization of the pitsand defining if the borrow pits are of any ecological significance as they exist now.Because both Norton Basin and Little Bay are located at the end of dead-end basins in thetidally restricted portions of Jamaica Bay, they offer one of the most hydrodynamicallystable areas for dredged material placement in the NY/NJ Harbor and are the primecandidates.
8.2 Boston HarborThe USACE, New England District and the Port Authority of Boston Harbor have recentlycompleted the construction phase of nine CAD cells in the shipping channels of BostonHarbor as part of the Boston Harbor Navigation Improvement Project. Themultidisciplinary project comprehensively monitored siting, pre-construction, construction,and is currently monitoring post-construction phases. In the planning phases of the projectthe USACE estimated that $6-10 million would be needed to cap the 1.0 MCY of dredgedmaterial identified for the nine CAD cells. While borrow pits were not used in this project,the results of the monitoring can be related to issues that may be encountered whenproceeding with the Norton Basin and Little Bay demonstration project.
In 1997 four test cells were filled with 1.0 MCY of dredged material unsuitable for openocean placement and allowed to settle for different time periods, then capped with 3 feet ofclean sand to monitor the effectiveness of the cap based on depth and consolidation of fillmaterial. Monitoring indicated that one month was not enough time to allow for properconsolidation of fill material in the cell. In this sort time period the underlying fillbreached the cap, allowing contaminated material to escape. Further monitoring found that4-6 months of consolidation was sufficient time for fill sediments to dewater before the capwas placed. Because the cells were in the middle of a shipping channel, specialarrangements were made to reduce boat traffic and other disturbances to preventresuspension of the dredged material while it was consolidating in the CAD cells beforecapping.
High resolution bathymetry, sidescan sonar, sub-bottom profiling, and sediment-profileimaging was used, along with GIS to monitor the placement and capping of dredgedmaterial in the Boston Harbor CAD cells. Water quality monitoring during cell dredgingand fill placement indicated no significant water quality effects downstream of thedredging activity. Disposal plume was difficult to identify in some cases. Monitoringindicated that the suspended sediment plume was limited to within 300 ft of the dredge andno differences in DO were detectable between monitoring and reference stations. Becauseof precautions taken, the project met with water quality certification compliance.
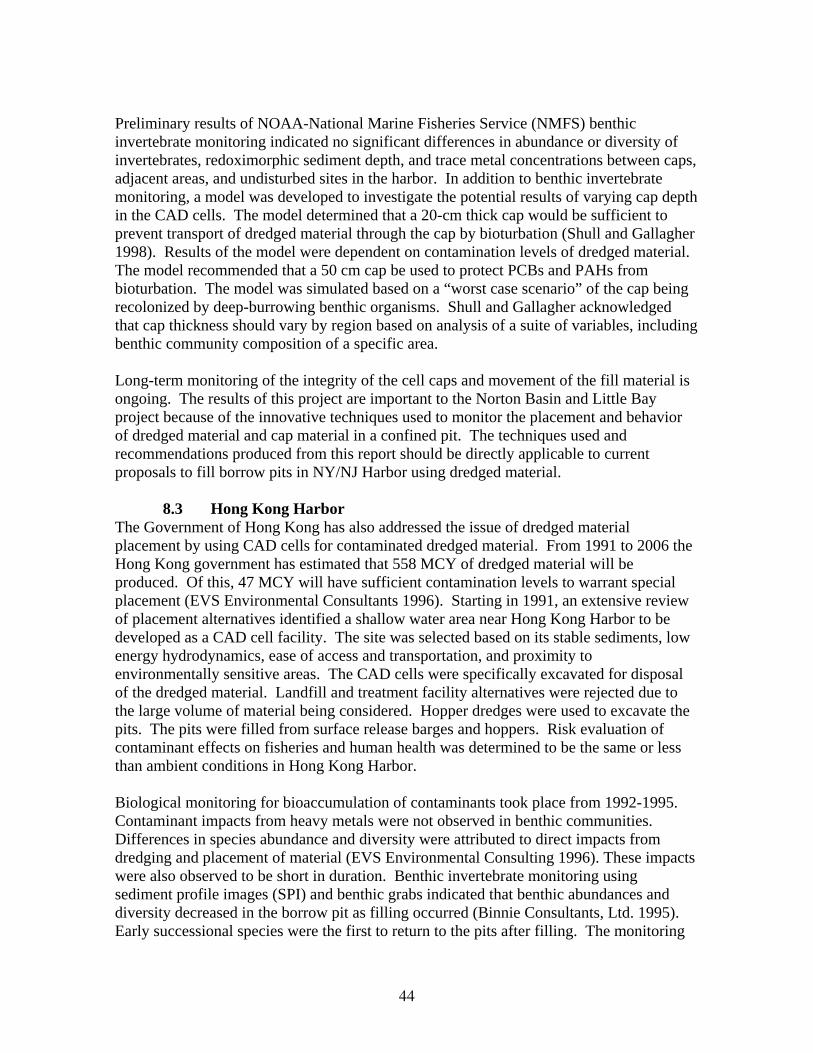
44
Preliminary results of NOAA-National Marine Fisheries Service (NMFS) benthicinvertebrate monitoring indicated no significant differences in abundance or diversity ofinvertebrates, redoximorphic sediment depth, and trace metal concentrations between caps,adjacent areas, and undisturbed sites in the harbor. In addition to benthic invertebratemonitoring, a model was developed to investigate the potential results of varying cap depthin the CAD cells. The model determined that a 20-cm thick cap would be sufficient toprevent transport of dredged material through the cap by bioturbation (Shull and Gallagher1998). Results of the model were dependent on contamination levels of dredged material.The model recommended that a 50 cm cap be used to protect PCBs and PAHs frombioturbation. The model was simulated based on a “worst case scenario” of the cap beingrecolonized by deep-burrowing benthic organisms. Shull and Gallagher acknowledgedthat cap thickness should vary by region based on analysis of a suite of variables, includingbenthic community composition of a specific area.
Long-term monitoring of the integrity of the cell caps and movement of the fill material isongoing. The results of this project are important to the Norton Basin and Little Bayproject because of the innovative techniques used to monitor the placement and behaviorof dredged material and cap material in a confined pit. The techniques used andrecommendations produced from this report should be directly applicable to currentproposals to fill borrow pits in NY/NJ Harbor using dredged material.
8.3 Hong Kong HarborThe Government of Hong Kong has also addressed the issue of dredged materialplacement by using CAD cells for contaminated dredged material. From 1991 to 2006 theHong Kong government has estimated that 558 MCY of dredged material will beproduced. Of this, 47 MCY will have sufficient contamination levels to warrant specialplacement (EVS Environmental Consultants 1996). Starting in 1991, an extensive reviewof placement alternatives identified a shallow water area near Hong Kong Harbor to bedeveloped as a CAD cell facility. The site was selected based on its stable sediments, lowenergy hydrodynamics, ease of access and transportation, and proximity toenvironmentally sensitive areas. The CAD cells were specifically excavated for disposalof the dredged material. Landfill and treatment facility alternatives were rejected due tothe large volume of material being considered. Hopper dredges were used to excavate thepits. The pits were filled from surface release barges and hoppers. Risk evaluation ofcontaminant effects on fisheries and human health was determined to be the same or lessthan ambient conditions in Hong Kong Harbor.
Biological monitoring for bioaccumulation of contaminants took place from 1992-1995.Contaminant impacts from heavy metals were not observed in benthic communities.Differences in species abundance and diversity were attributed to direct impacts fromdredging and placement of material (EVS Environmental Consulting 1996). These impactswere also observed to be short in duration. Benthic invertebrate monitoring usingsediment profile images (SPI) and benthic grabs indicated that benthic abundances anddiversity decreased in the borrow pit as filling occurred (Binnie Consultants, Ltd. 1995).Early successional species were the first to return to the pits after filling. The monitoring
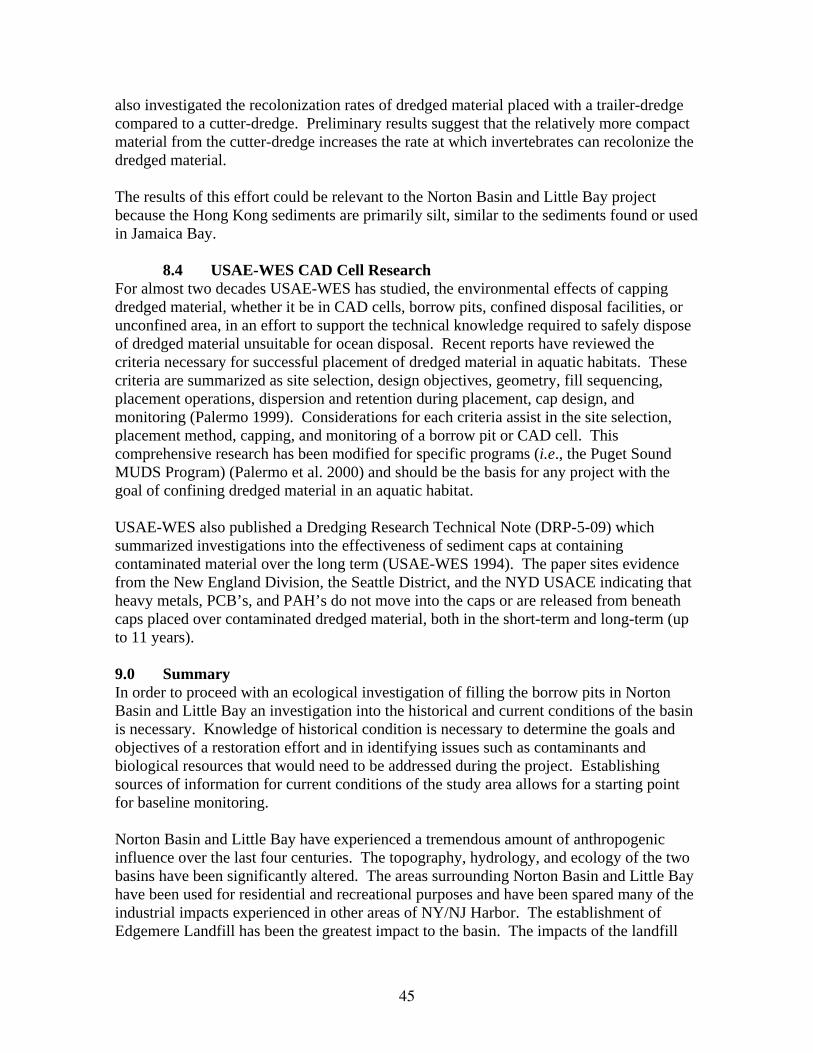
45
also investigated the recolonization rates of dredged material placed with a trailer-dredgecompared to a cutter-dredge. Preliminary results suggest that the relatively more compactmaterial from the cutter-dredge increases the rate at which invertebrates can recolonize thedredged material.
The results of this effort could be relevant to the Norton Basin and Little Bay projectbecause the Hong Kong sediments are primarily silt, similar to the sediments found or usedin Jamaica Bay.
8.4 USAE-WES CAD Cell ResearchFor almost two decades USAE-WES has studied, the environmental effects of cappingdredged material, whether it be in CAD cells, borrow pits, confined disposal facilities, orunconfined area, in an effort to support the technical knowledge required to safely disposeof dredged material unsuitable for ocean disposal. Recent reports have reviewed thecriteria necessary for successful placement of dredged material in aquatic habitats. Thesecriteria are summarized as site selection, design objectives, geometry, fill sequencing,placement operations, dispersion and retention during placement, cap design, andmonitoring (Palermo 1999). Considerations for each criteria assist in the site selection,placement method, capping, and monitoring of a borrow pit or CAD cell. Thiscomprehensive research has been modified for specific programs (i.e., the Puget SoundMUDS Program) (Palermo et al. 2000) and should be the basis for any project with thegoal of confining dredged material in an aquatic habitat.
USAE-WES also published a Dredging Research Technical Note (DRP-5-09) whichsummarized investigations into the effectiveness of sediment caps at containingcontaminated material over the long term (USAE-WES 1994). The paper sites evidencefrom the New England Division, the Seattle District, and the NYD USACE indicating thatheavy metals, PCB’s, and PAH’s do not move into the caps or are released from beneathcaps placed over contaminated dredged material, both in the short-term and long-term (upto 11 years).
9.0 SummaryIn order to proceed with an ecological investigation of filling the borrow pits in NortonBasin and Little Bay an investigation into the historical and current conditions of the basinis necessary. Knowledge of historical condition is necessary to determine the goals andobjectives of a restoration effort and in identifying issues such as contaminants andbiological resources that would need to be addressed during the project. Establishingsources of information for current conditions of the study area allows for a starting pointfor baseline monitoring.
Norton Basin and Little Bay have experienced a tremendous amount of anthropogenicinfluence over the last four centuries. The topography, hydrology, and ecology of the twobasins have been significantly altered. The areas surrounding Norton Basin and Little Bayhave been used for residential and recreational purposes and have been spared many of theindustrial impacts experienced in other areas of NY/NJ Harbor. The establishment ofEdgemere Landfill has been the greatest impact to the basin. The impacts of the landfill
46
appear to have been stabilized, however, with the closure of the landfill in 1991.According to NYCDOS and the Jamaica Bay Eutrophication Study, the impacts of thelandfill to the Bay are negligible compared to other inputs. Monitoring of the landfill hasprovided some information on water quality and sediment contamination in the study area.
Virtually no data has been collected on the current biological resources in the two basins.A detailed baseline study must be completed to demonstrate the degree of ecologicalimpairment within the system. In the NY/NJ area controversy over the biologicalutilization of borrow pits has precipitated the need to quantitatively identify the organismsand habitats associated with each borrow pit. Norton Basin and Little Bay are unique inthe controversy over the ecological significance of borrow pits in that they are located indead-end basins with significant hydrologic restrictions.
The Norton Basin/Little Bay Restoration Project is currently addressing the baselineconditions of the basin. Comprehensive water quality, hydrological, contaminant, andbiological studies are being conducted to assess the ecological status of the study area andto determine if a restoration effort should proceed. If the project is to proceed, severalconsiderations should be taken into account. They include: 1) the limited access to thestudy area due to a sand berm at the entrance to the basin. This berm would restrict accessto the borrow pits by barges and would need to be removed. 2) The transport of dredgedmaterial would also be limited by the bridges over Broad Channel in Jamaica Bay. 3) Thesource of dredged material to fill the borrow pits and the need for a cap covering thedredged material would also need to be considered. 4) Preliminary investigations into theborrow pits have revealed several wrecks at the bottom of Little Bay. The historicalsignificance of these wrecks is being considered to determine if special precautions arenecessary before the project can continue.
Restoring Norton Basin and Little Bay to their historic conditions of intertidal salt marshmay not be feasible and may offer little chance of success. Rehabilitating the currentsubtidal habitat to one of potentially greater ecological value, via bathymetricrecontouring, could benefit the immediate area as well as contribute to the overallecological function of Jamaica Bay system.
47
10.0 References
Baily, W.T. (1880). “Bayswater beach,” Bayswater Beach, NY.
Bellot, A.H. (1917). “History of the Rockaways from the year 1685 to 1917,” Bellot’sHistories, Inc., Far Rockaway, NY.
Binnie Consultants, Ltd. (1995). “Fill management study –phase IV, investigation anddevelopment of marine borrow areas. REMOTS and grab surveys to assess benthicrecolonization following backfilling at East Sha Chau (east) marine borrow pit,” CivilEngineering Department, Geotechnical Engineering Office, Government of Hong Kong.
Black, F.R. (1981). “Jamaica Bay: A history.” Gateway National Recreation Area, NewYork-New Jersey. Cultural Resource Management Study No. 3. Division of CulturalResources, National Parks Service, U.S. Department of Interior, Washington, D.C.
Bopp, R.F., Simpson, H.J., Chillrud, S.N., Robinson, D.W. (1993). “Sediment derivedchronologies of persistent contaminants in Jamaica Bay, New York,” Estuaries 16, 608-616.
Carriker, M.R., Anderson, J.W., Davis, W.P., Franz, D.R., Mayer, G.F., Pearce, J.B.,Sawyer, T.K., Tietjen, J.H., Timoney, J.F., Young, D.R. (1982). “Effects of pollutants onbenthos,” In: Ecological Stress and the New York Bight: Science and Management (G.F.Mayer, editor). Estuarine Research Federation, Columbia, SC. p 3-21.
Clarke, D., Dickerson, C., Reine, K., and Will, R. (1998). “Ecological characteristics of aborrow pit in the Lower Bay of New York Harbor, Interim Report,” U.S. Army Engineers,Waterways Experiment Station, Vicksburg, MS.
Cohen, P.E. and Augustyn, R.T. (1997). “Manhattan in maps: 1527-1995,” RizzoliInternational Publications, Inc., New York, NY.
CR Environmental (2001). “Multibeam and seabed classification surveys: Little Bay,Norton Basin, Grass Hassock Channel, and the Raunt, Jamaica Bay, New York,” U.S.Army Corps of Engineers, New York District, New York, NY.
Diaz, R.J. and Rosenberg, R. (1995). “Marine benthic hypoxia - review of ecologicaleffects and behavioral responses on macrofauna,” Oceanography and Marine Biology,Annual Review. 33, 245-303.
The Dolphin. (1932). “History of the Rockaways,” Written by the Students of FarRockaway High School. Appeared in the Dolphin 1932, Sponsored by the ExchangedClub of Far Rockaway, New York.

48
EVS Environmental Consultants. (1996). “Review of contaminated mud disposal strategyand status report on contaminated mud disposal facility at East Sha Chau,” The CivilEngineering Department, Government of Hong Kong.
Franz., D.R. and Harris, W.H. (1983). “Benthos study, third interim report,” Jamaica BayWildlife Refuge, Gateway National Recreation Area, Brooklyn, NY.
Franz, D.R. and Tanacredi, J.T. (1992). “Secondary production of the amphipod,Ampelisca abdita, Mills, and its importance in the diet of juvenile winter flounder(Pleuronectes americanus) in Jamaica Bay, New York,” Estuaries. 15, 193-203.
Gelbart, F. (1978). “Polychlorinated biphenyls in sediment and biota of Jamaica Bay, NewYork,” Masters Thesis. The City University of New York, Hunter College.
GNRA. (1998). “1998 water quality survey report,” U.S. Department of Interior, NationalParks Service, Gateway National Recreation Area, Division of Natural Resources, StatenIsland, NY.
GNRA. (1991). “Jamaica Bay fisheries survey, 1985-1986, 1988-1989,” Department ofInterior, National Park Service, Gateway National Recreation Area, Division of NaturalResources and Compliance.
Grambo, G. and Vega, C. (1984). “Jamaica Bay: a site study,” U.S. Geologic Survey, LongIsland Division.
H2M Group. (1990). “Tidal hydraulic study vicinity of Edgemere Landfill,” Prepared forthe New York Department of Sanitation, November 1990.
JBESG. (1971). “Jamaica Bay and Kennedy airport: a multidisciplinary environmentalstudy. Volume II,” National Academy of Sciences, National Academy of Engineering,Washington, D.C.
Mitsch, W.J., and Gosselink, J.G. (1993). Wetlands, 2nd Ed. Van Nostrand Reinhold, NewYork.
NYCDOS. (1991). “Edgemere landfill remedial investigation report,” Final Report, May1991, New York City Department of Sanitation, New York, NY.
NYCDOS (1992). “Edgemere landfill feasibility study, final draft report,” March 1992,New York City Department of Sanitation, New York, NY.
O’Brien and Gere Engineers, Inc. (1990). “Jamaica Bay combined sewer overflow facilityplanning project. Draft final facility plan,” New York City Department of EnvironmentalProtection, Division of Combined Sewer Overflow Abatement, New York.
49
O’Brien and Gere Engineers, Inc. (2000). “Jamaica Bay eutrophication study,” Volumes I& II. New York City Department of Environmental Protection, Queens, NY.
Palermo, M.R. (1999). “Subaqueous capping of contaminated sediment,” In: Handbook ofCoastal Engineering (ed. J.B. Herbich), McGraw-Hill Publishing, Inc., New York, NY.
Palermo, M.R. Clausner, J.E., Channell, M.G., and Averett, D.E. (2000). “Multiuserdisposal sites (MUDS) for contaminated sediments from Puget Sound – subaqueouscapping and confined disposal alternative,” ERDC TR-00-3, U.S. Army Engineer Researchand Development Center, Vicksburg, MS.
Quinn, J.G. and Cairns, R.W. (1995). “Organic contaminants in organisms and sedimentsfrom Grassy Bay stations adjacent to Kennedy International Airport,” Gateway NationalRecreation Area, National Parks Service, Floyd Bennett Field, Brooklyn, NY.
SAIC. (1996). “Bathymetric, sediment, and photographic observations from four borrowpits in the Lower Bay of New York Harbor,” SAIC Report No. 340, Report No. 18 of theNew York Mud Dump Site Study, Science Applications International Corporation, NewPort, RI.
Shull, D.H. and Gallagher, E.D. (1998). “Predicting dredged-material cap thickness fromdata on benthic community structure,” MIT Sea Grant Marine Center, Environmental,Coastal, and Ocean Sciences Program, University of Massachusetts Boston, Boston, MA.
Skinner, L.C., Jackling, S.J., Kimber, G., Waldman, J., Shastay, J., Jr., and Newell, A.J.(1996). “Chemical residues in fish, bivalves, crustaceans, and a cephalopod from the NewYork-New Jersey Harbor estuary: PCB, organochlorine pesticides and mercury,” NewYork State Department of Environmental Conservation, Fish, Wildlife and MarineResources, Albany, NY.
Skinner, L.C., Prince, R., Waldman, J., Newell, A.J., and Shastay, J., Jr. (1997).“Chemical residues in fish, bivalves, crustaceans, and a cephalopod from the New York-New Jersey Harbor estuary: dioxins and furans,” New York State Department ofEnvironmental Conservation, Division of Fish, Wildlife, and Marine Resources, Albany,NY.
Swartz, S.M., and Brinkius, B.H. (1978). “The impact of dredged holes on oxygen demandin the Lower Bay, New York Harbor,” Special Report 17, Reference 78-5, Marine ScienceResearch Center, SUNY, Stony Brook, NY.
Tanacredi, J.T. (1990). “Naphthalenes associated with treated wastewater effluents in anurban national wildlife refuge,” Bulletin of Environmental Contamination and Toxicology.44, 246-253.
USACE. (1999). “Puget Sound confined disposal site study, Programmatic environmentalimpact statement,” U.S. Army Corps of Engineers, Portland District, Portland, OR.
50
USAE-WES. (1994). “Sediment chemistry profiles of capped dredged sediment depositstaken 3 to 11 years after capping, dredged research technical notes,” DRP-5-09. U.S. ArmyEngineers Waterways Experiment Station, Vicksburg, MS.
USFWS. (1997). “Significant habitats and habitat complexes of the New York Bightwatershed,” U.S. Fish and Wildlife Service, Southern New England, New York BightCoastal Ecosystems Program, Charlestown, RI.
West-Valle, A.S., Decker, C.J., Swanson, R.L. (1991). “Use impairments of Jamaica Bay,”Waste Management Institute, Marine Sciences Research Center, State University of NewYork, Stony Brook, NY.
Yozzo, D.J., Rhoads, J.M., Wilber, P., Nuckols, W.H. III, Hollen, L.A., and Will, R.J.(1999). “Beneficial uses of dredged material for habitat creation, enhancement, andrestoration in NY/NJ harbor,” Draft report, U.S. Army Corps of Engineers, New YorkDistrict, New York, NY.