Persistence and diversity of Theileria parva in East Coast ...
64
The Nelson Mandela African Institution of Science and Technology http://dspace.nm-aist.ac.tz Life sciences and Bio-engineering Masters Theses and Dissertations [LISBE] 2019-11 Persistence and diversity of Theileria parva in East Coast fever vaccinated and unvaccinated cattle Magulu, Emelesiana Cyprian NM-AIST https://dspace.nm-aist.ac.tz/handle/20.500.12479/1036 Downloaded from Nelson Mandela-AIST's institutional repository
-
Upload
khangminh22 -
Category
Documents
-
view
0 -
download
0
Transcript of Persistence and diversity of Theileria parva in East Coast ...
The Nelson Mandela African Institution of Science and Technology
http://dspace.nm-aist.ac.tz
Life sciences and Bio-engineering Masters Theses and Dissertations [LISBE]
2019-11
Persistence and diversity of Theileria
parva in East Coast fever vaccinated
and unvaccinated cattle
Magulu, Emelesiana Cyprian
NM-AIST
https://dspace.nm-aist.ac.tz/handle/20.500.12479/1036
Downloaded from Nelson Mandela-AIST's institutional repository
PERSISTENCE AND DIVERSITY OF THEILERIA PARVA IN EAST
COAST FEVER VACCINATED AND UNVACCINATED CATTLE
Emelesiana Cyprian Magulu
A dissertation submitted in partial fulfillment of the requirements for the degree of
Master’s in Life Sciences of the Nelson Mandela African Institution of Science and
Technology
Arusha, Tanzania
November, 2019
i
ABSTRACT
Infection and Treatment Method (ITM) has been practiced in Tanzania for over 20 years
now as a prevention method against East Coast Fever (ECF). However, there is less
information regarding the persistence of the Theileria parva parasites after a long-time
lapse after vaccination. Likewise, the implication of the potential exchange of genetic
information is largely unknown as regards ECF vaccination outcomes. A total number of
336 cattle samples were collected from Loiborsoit, Emboret, Esilalei, Manyara ranch,
Mswakini, Tanga Mruazi farm and Tanga Leila farm in March of 2018. Samples were
then screened for Theileria parva using nested PCR and the overall prevalence of carrier
state was 34.5%, with a significant higher prevalence among the vaccinated cattle group
43% (103/239) compared to the unvaccinated group 13.4% (13/97) (p<0.000). Similarly,
higher prevalence emerged among the cattle grazing close to the wildlife 38.2% (107/280)
compared to the ones grazing far from wildlife 16.1% (9/56) p<0.001. The carrier state
persisted up to 132 months post vaccination. Minisatellite 7 (MS 7), microsatellite 2 and 5
(ms 2, ms 5) markers were used to characterize genetic diversity. Whereby parasite diversity
across cattle groups was determined by the mean number of alleles, and expected
heterozygosity. Manyara ranch had the highest parasite diversity with all the markers. This
study concludes that vaccination against ECF and the wildlife interface has an influence on
the diversity of Theileria parva parasites, as the highest number of alleles and parasite
diversity were shown in the vaccinated cattle and the ones in close proximity to wildlife
interface.
Key words: East Coast Fever, Infection and Treatment Method, Northern Tanzania,
Theileria parva

ii
DECLARATION
I, Emelesiana Magulu do hereby declare to the Senate of the Nelson Mandela Institution of
Science and Technology that this dissertation is my own original work and that it has neither
been submitted nor being concurrently submitted for degree award in any other institution.
-------------------------------------------- -------------------------------
Emelesiana Cyprian Magulu Date

iii
COPYRIGHT
This dissertation is copyright material protected under the Berne Convention, the Copyright
Act of 1999 and other International and national enactments, in that behalf, on intellectual
property. It must not be reproduced by any means, in full or in part, except for short
extracts in fair dealing; for researcher private study, critical scholarly review or discourse
with an acknowledgment, without a written permission of the Deputy Vice Chancellor for
Academic, Research and Innovation, on behalf of both the author and the Nelson Mandela
African Institution of Science and Technology.
iv
CERTIFICATION
The undersigned certify that they have read and hereby recommend for acceptance by the
Nelson Mandela African Institution of Science and Technology a dissertation entitled
“Persistence and diversity of Theileria parva in East Coast Fever vaccinated and
unvaccinated cattle in northern Tanzania”, in partial fulfillment of the requirements for
the degree of Master’s in Life Sciences of the Nelson Mandela African Institution of
Science and Technology, Arusha, Tanzania.
-------------------------------------------- --------------------------------
Dr. Gabriel Shirima Date
Supervisor
--------------------------------------------- --------------------------------
Prof. Paul Gwakisa Date
Supervisor

v
ACKNOWLEDGEMENT
I would like to thank my supervisors Dr. Gabriel Shirima (NM-AIST) and Prof. Paul
Gwakisa (SUA) for supervision and guidance that made this work successful. I greatly
acknowledge the African Development Bank (AFDB) through Nelson Mandela African
Institution of Science and Technology (NM-AIST) and the Phase 3 DFG-funded project
‘Molecular epidemiology network for promotion and support of delivery of live vaccines
against Theileria parva and Theileria annulata infection in eastern and northern Africa’
based at Sokoine University of Agriculture (SUA) for funding this research.
I would also like to extend my appreciation to the SUA staffs especially Ms Fatuma
Kindoro, Asteria Butuyuyu and Dr. Elisa Mwega for assistance, support, encouragement
and friendship during this study. Lastly but not least, I thank all my friends and classmates at
NM-AIST for their support and most importantly my parents Jane Mponzi and Cyprian
Magulu for their love, advice, support, encouragement and constant prayers throughout my
study time.
vi
TABLE OF CONTENTS
ABSTRACT ................................................................................................................................ i
DECLARATION ....................................................................................................................... ii
COPYRIGHT ........................................................................................................................... iii
CERTIFICATION .................................................................................................................... iv
ACKNOWLEDGEMENT ......................................................................................................... v
TABLE OF CONTENTS ......................................................................................................... vi
LIST OF TABLES ................................................................................................................. viii
LIST OF FIGURES .................................................................................................................. ix
LIST OF ABREVIATION AND SYMBOLS ............................................................................ x
CHAPTER ONE ........................................................................................................................ 1
INTRODUCTION ..................................................................................................................... 1
1.1 Background information .................................................................................................. 1
1.2 Problem statement ............................................................................................................ 3
1.3 Rationale of the study ....................................................................................................... 4
1.4 Objectives ......................................................................................................................... 5
1.4.1 General objective ....................................................................................................... 5
1.4.2 Specific objectives ..................................................................................................... 5
1.5 Research questions ........................................................................................................... 5
1.6 Significance of the research ............................................................................................. 5
1.7 Delineanation of the study................................................................................................ 6
CHAPTER TWO ....................................................................................................................... 7
LITERATURE REVIEW .......................................................................................................... 7
2.1 Theileria Parva and East Coast Fever (ECF) ................................................................... 7
2.1.1 Morphology of T. parva ............................................................................................ 7
2.2 Life cycle of T. parva ....................................................................................................... 7
2.3 Characterization of T. parva............................................................................................. 8
2.3.1 Characterization of T. parva using mini- and micro-satellite markers ...................... 9
2.3.2 Characterization of T. parva using antigen genes ................................................... 10
2.4 Methods for characterization of T. parva diversity ........................................................ 11
2.4.1 Molecular techniques ............................................................................................... 11
2.5 Control of T. parva ......................................................................................................... 11
2.5.1 Acaricides and use of drugs ..................................................................................... 11
2.5.2 Immunization using the Infection and Treatment Method (ITM) ........................... 12
2.6 Carrier state and persistence of Muguga Cocktail vaccine ............................................ 14
2.7 Genotypic diversity of T. parva ..................................................................................... 16
2.7.1 Influence of wildlife interface areas in T. parva diversity ...................................... 18
vii
CHAPTER THREE ................................................................................................................. 20
MATERIALS AND METHODS ............................................................................................. 20
3.1 Study areas ..................................................................................................................... 20
3.2 Study design ................................................................................................................... 21
3.3 Sample size determination ............................................................................................. 22
3.4 Sampling......................................................................................................................... 22
3.4.1 Blood samples collection ......................................................................................... 23
3.5 Laboratory analysis ........................................................................................................ 23
3.5.1 DNA extraction........................................................................................................ 23
3.5.2 Nested PCR for screening T. parva positive samples using p104 gene .................. 24
3.5.3 PCR amplification and analysis of mini and microsatellite loci ............................. 25
3.5.4 Agarose gel electrophoresis ..................................................................................... 26
3.5.5 Data analysis ............................................................................................................ 26
CHAPTER FOUR .................................................................................................................... 27
RESULTS AND DISCUSSION .............................................................................................. 27
4.1 Results ............................................................................................................................ 27
4.1.1 Screening for T. parva carrier state in cattle by p104 nested PCR .......................... 27
4.1.2 Persistence of carrier state following ECF vaccination ........................................... 28
4.1.3 Detection, prevalence and distribution of mini- and micro-satellite markers in cattle
.......................................................................................................................................... 29
4.1.4 Analysis of genetic diversity of T. parva using 3 VNTR markers .......................... 30
4.1.5 Theileria parva diversity in different cattle groups ................................................. 33
4.1.6 Principal Component Analysis and Analysis of Molecular Variance ..................... 34
4.2 Discussion ...................................................................................................................... 35
CONCLUSION AND RECOMMENDATIONS .................................................................... 40
5.1 Conclusion ...................................................................................................................... 40
5.2 Recommendations .......................................................................................................... 40
REFERENCES ........................................................................................................................ 42
APPENDIX .............................................................................................................................. 51
RESEARCH OUTPUTS .......................................................................................................... 52
Output 1: Paper presentation ................................................................................................ 53
Output 2: Poster Presentation ............................................................................................... 54
viii
LIST OF TABLES
Table 1: Total number of blood samples collected per location .............................................. 23
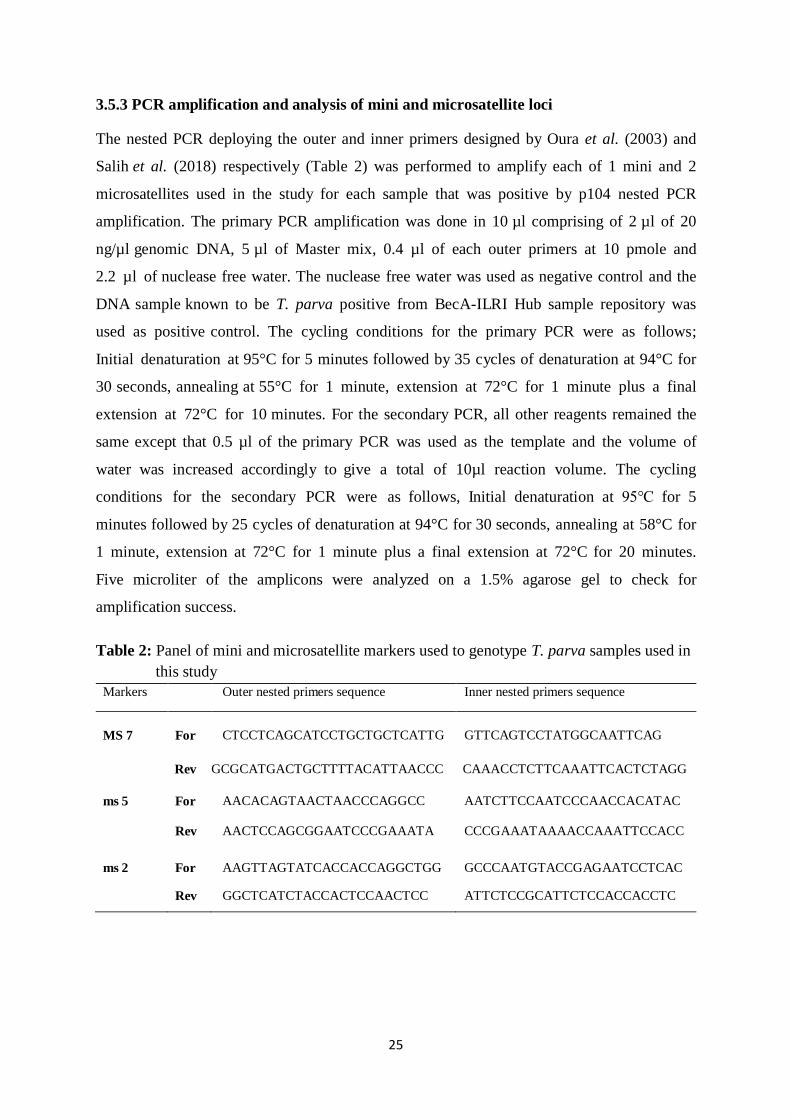
Table 2: Panel of mini and microsatellite markers used to genotype T. parva samples used in
this study ................................................................................................................... 25
Table 3: Proportions of cattle categories based on T. parva carrier status .............................. 27
Table 4: Prevalence of T. parva among the six groups used in this study ............................... 28
Table 5: The number of alleles and percentage polymorphism of vaccine markers ............... 30
Table 6: Private alleles observed in different cattle groups ..................................................... 32
Table 7: The summary of AMOVA table of the cattle groups ................................................ 35
ix
LIST OF FIGURES
Figure 1: Life cycle of T. parva. ................................................................................................ 8
Figure 2: The map of Tanzania showing key sampling sites ................................................... 21
Figure 3: Scatter plot showing the persistence of carrier state over time since ECF vaccination
................................................................................................................................. 29
Figure 4: Agarose gels (1.5%) showing some of PCR products generated using three VNTR
markers and a p104 gene to amplify T. parva ......................................................... 29
Figure 5: The distribution of the three markers in vaccinated and unvaccinated cattle .......... 30
Figure 6a: Distribution of ms 5 alleles across the study locations ........................................... 31
Figure 6b: Distribution of ms 2 alleles across the study ocations…........................................40
Figure 6c: Distribution of MS 7 alleles across the studylocations...........................................40
Figure 7: Distribution of all three vaccine markers across cattle groups ................................ 32
Figure 8a: The mean allelic patterns for MS 7 across the study locations .............................. 33
Figure 8b: The mean allelic patterns for ms 5 across the study ocations.................................42
Figure 8c: The mean allelic patterns for ms 2 across the study ocations.................................43
Figure 9: Principal component analysis (PCoA) of T. parva as generated from 6 populations
.................................................................................................................................44
x
LIST OF ABREVIATION AND SYMBOLS
AMOVA
Bp
CD8+
CTL
°C
%
&
DF
EDTA
et al
gDNA
ITM
ITS
Kbp
LAMP
LSUrRNA
MAbs
Mbp
MC
MHC
ms
MS
nPCR
PIM
Pmole
PCA
qPCR
RFLP
rRNA
SSUrRNA
SS
Analysis of molecular variance
Base pair
Cluster of differentiation
Cytotoxic T Lymphocytes
Degrees centigrade
Percentage
And
Degree of freedom
Ethylene diaminetetra acetic acid
And others
Genomic DNA
Infection and treatment method
Internal transcribed spacer
Kilo base pair
Loop mediated isothermal amplification
Large subunit ribosomal RNA
Monoclonal antibodies
Mega base pairs
Muguga cocktail
Major histocompatibility complex
Microsatellite
Minisatellite
Nested PCR
Polymorphic immunodominant
Picomole
Real time PCR
Principal component analysis
Restriction fragment length polymorphism
Ribosomal ribonucleic acid
Small subunit ribosomal RNA
Sum of squared differences

xi
VNTR
Variable number tandem repeat
1
CHAPTER ONE
INTRODUCTION
1.1 Background information
Theileria parva (T. parva) is a tick-borne protozoan parasite belonging to the phylum
Apicomplexa and causes a severe disease in cattle known as East Coast Fever (ECF)
(Norval, Perry, & Young, 1992). This disease is endemic in eleven countries in eastern and
central Africa where it results into serious economic losses to the livestock industry
(Hayashida et al., 2012). The natural host of T. parva, African buffalo (Syncerus caffer)
does not experience any clinical signs of the disease. Theileria parva is a tick borne
parasite, transmitted by the tick vector, Rhipicephalus appendiculatus, which feeds on the
infected animal and spreads the infection (Olds, Mason, & Scoles, 2018). The high likely
breeds to suffer high morbidity and mortality cattle are (Bos taurus) and their crosses which
are mostly used for milk production (Nene & Morrison, 2016).
The severity of ECF depends on the parasite dose and there are also differences in magnitude
of infection in each cattle (Cunningham et al., 1974; Dolan, 1986; Nene et al., 2016). Poor
small-holder farmers are the ones experiencing great impacts resulted from this disease as
they often do not have enough resources and access to control measures. The mortality
may reach 100%, in exotic cattle however for indigenous cattle (Bos indicus) breeds there
is a development of resistance to the disease right after primary natural infection and
recovery. Cattle that recover from ECF do not get rid of the infection, rather they remain
as carriers of the parasite and a source of infections to ticks (Kariuki et al., 1995). This
event plays a part in endemic stability of the disease in indigenous cattle especially in areas
where there is continual challenges of the parasite (Norval et al., 1992)
Theileria parva infects cattle and the African buffalo (Syncerus caffer), the parasite is
known to progress with the buffalo in eastern Africa (Uilenberg, 1981). Despite this the
infected buffalo do not normally display any clinical signs of the disease, whereas in cattle
the parasite causes a severe fatal lympho proliferative disorder called ECF (Sitt et al.,
2015). Theiler (1912) was the first to recognize Theileria parva as the causative agent of
ECF in South Africa. He differentiated ECF from Red water caused by Babesia specie, and
recognized the principal tick vector that transmits T. parva as Rhipicephalus
appendiculatus (Nene et al., 2016). The disease was associated with cattle imported from
2
East Africa, and caused high levels of morbidity and mortality (Norval et al., 1992).
South Africa eradicated the disease by slaughtering of infected cattle, a control of cattle
movement and fencing to avoid buffalo to game parks (Nene et al., 2016). There are still
occasional outbreaks of buffalo-derived T. parva disease, but appear to be self-limiting in
nature (Mbizeni et al., 2013; Thompson, Oosthuizen, Troskie, & Penzhorn, 2008).
However, in other countries it has not been possible to implement such measures which
resulted to ECF being an endemic acute and lethal disease in 12 countries in eastern, central
and southern Africa, including Burundi, Democratic Republic of Congo, Kenya, Malawi,
Mozambique, Rwanda, South Sudan, Tanzania, Uganda, Zambia and Zimbabwe (Malak et
al., 2012; Norval et al., 1992), and in the Comoro Islands (De Deken et al., 2007).
On a regional basis ECF kills approximately 1 million cattle/year with annual economic
losses of approximately USD300 (Malak et al., 2012; McLeod et al., 1999). The impacts are
likely to increase with time. In Tanzania, the disease accounts for the 43.7% of annual
mortality of livestock and was estimated to have an overall annual cost of 43 million USD
(McLeod & Kristjanson, 1999). East coast fever is responsible for annual mortality rates of
40– 80% in unvaccinated Zebu (Bos indicus) calves (Di Giulio, Lynen, Morzaria, Oura, &
Bishop, 2009; Homewood, Trench, Randall, Lynen, & Bishop 2006). On top of that ECF
accounts for up to 70% of deaths in 6 – 8 months old calves in pastoral herds which renders
serious threats to smallholder dairy farmers for whom the death of a single dairy cow can
cause a measurable economic setback (Kazungu, Mwega, Kimera, & Gwakisa, 2015). East
coast fever contributes to major constraint to improved productivity of cattle.
Initially ECF control relied on intensive application of acaricides (Norval et al., 1992),
however, this practice has been abandoned with time due to several factors mostly
development of resistance by ticks, other factors include financial constraints, disruption of
endemic stability and environmental impact (Di Giulio et al., 2009). An efficient way to
succumb this disease is immunization of cattle by the Infection and Treatment Method (ITM)
(Oura, Bishop, Wampande, Lubega, & Tait, 2004). The method works by the injection of
known strain(s) of T. parva followed by a simultaneous administration of an antibiotic (30%
tetracycline), which leads to an attenuate infection resulting in a long-lasting immune
response (Di Giulio et al., 2009; McKeever, 2009). In order to offer broad protection against
most field isolates the vaccine is made by the combination of different strains (McKeever,
2009; Uilenberg, 1999), like with the trivalent vaccine known as the Muguga Cocktail (MC)
3
comprising of Muguga, Kiambu 5 and Serengeti-transformed stocks (McKeever, 2007;
Ruheta, 1999). Muguga Cocktail is a live vaccine, therefore it requires cold chain system for
its maintainance and eventually establishes a continous carrier status (Di Giulio et al., 2009;
Uilenberg, 1999). There are worries that this may lead to introduction of specific vaccine
parasite strains into the field, this would result in possible genetic recombinations with local
circulating parasite strains (Oura et al., 2007) or the development of the disease in areas
where it never existed before (McKeever, 2007; Uilenberg, 1999). There is therefore a need
to address these concerns especially in Tanzania where ITM has been practiced for over 20
years.
1.2 Problem statement
Control of ECF relying on prevention of tick infestation is not only expensive but difficult to
sustain as it requires continuous application of acaricides. The frequent use of acaricides
presents threats to the environment. Drugs can be used as an alternative but they are only
efficient when animals are treated during early stages of the disease and they are very costful.
Due to the shortcomings of these control measures and the fatal nature of the disease, there is
a demand for effective vaccines to provide a sustainable means of controlling the disease.
Vaccination against ECF is based on an Infection and Treatment Method (ITM) that involves
inoculation of live sporozoite-stage parasites and simultaneous treatment with long-acting
tetracycline (McKeever, 2007). The vaccine, also called the Muguga cocktail, consists of the
three strains of T. parva, Muguga, Serengeti-transformed and Kiambu 5. However, there are
still questions regarding the antigenic composition of the vaccine and its effectiveness in
obtaining strong immunity in different geographical and ecological locations. Importantly,
there are worries that the Muguga cocktail vaccine may introduce parasites with a new
genetic background into local parasite populations. Since ticks do not choose on which cattle
to feed on this may result in into recombination and existence of more diverse strains of T.
parva. In spite of such worries, the infection and treatment method has found wide adoption
in pastoral areas of northern Tanzania in the last 20 years. Infection and Treatment
Method (ITM) has reduced calf mortality from 80 to less than two per cent, this enabled the
cattle herders being able to sell more animals and increase their income. Despite the high
cost of the vaccine up to US$10 per animal (Di Giulio et al., 2009), the ITM remains to be
the most efficient cost-effective ECF control option available to farmers and livestock
keepers in Tanzania (Martins, Di Giulio, Lynen, Peters, & Rushton, 2010).
4
Vaccinated cattle and the ones that recover from natural infection develop immunity to re-
infection with similar strains which contributes to endemic stability of the disease in
indigenous cattle in areas with continuous transmission of the parasites. Apart from being
immune those cattle do not usually eliminate the infection; and they remain as carriers of
the parasite which acts as a source of infections to ticks. A study done in northern Tanzania
by Kazungu, Mwega, Kimera and Gwakisa (2015) on ECF-vaccinated herds demonstrated
that continuous natural tick challenge provides an incremental effect on acquired immunity.
Furthermore, ticks continuously feeding on the carrier animals they transmit infections to
non-infected cattle which deploys some of the vaccine parasites to unvaccinated cattle
leading into high seroprevalence (Kazungu et al., 2015). Although ITM has been shown to
have a significant impact in reducing ECF incidences in pastoral herds, there are still
several questions which require focused research.
1.3 Rationale of the study
East Coast Fever is a significant economic burden for the small-holder pastoral livestock
keepers in Tanzania. Vaccinated and non-vaccinated cattle populations in these areas co-
graze using same pastures and with close proximity to the wildlife interface. Given that
Theileria parasites could recombine between divergent strains during the sexual stage in
ticks, ‘vaccine-derived’ and ‘local’ strains could exchange genetic information, resulting in
parasites with genetic mosaics and diversity. The implication of the potential exchange of
genetic information is largely unknown as regards ECF vaccination outcomes. It is important
therefore to determine the persistence and diversity of the ECF vaccine (Muguga)
components in relation to vaccination status and proximity to wildlife interface areas and
to distinguish cattle potentially responding to the ITM vaccine strains alone, from those
whose immunity is due to natural infection. According to Oura, Bishop, Lubega, and Tait,
(2004) sustained use of live vaccination is likely to modify transmission dynamics and
parasite population genetics. Livestock keepers in northern Tanzania have been vaccinating
their calves now for more than fifteen years. There is therefore a need to understand the
long-term impact of the potential genetic recombination in ticks and interface with wildlife
on outcomes of ECF vaccination in cattle populations vaccinated over different time points
(1-15 years lapse). The long-term impact of this project is to assist poor smallholder and
pastoralist livestock keepers in Tanzania through research that will improve the control of
ECF through vaccination.
5
1.4 Objectives
1.4.1 General objective
To enhance understanding of the long term impact of ITM in vaccinated and unvaccinated
cattle.
1.4.2 Specific objectives
(i) To determine the prevalence of T. parva carrier state in ECF vaccinated and
unvaccinated cattle
(ii) To determine the persistence and diversity of T. parva in vaccinated and unvaccinated
cattle.
1.5 Research questions
(i) What is the prevalence and persistence of the different ECF vaccine (Muguga coctail)
components (Muguga, Kiambu 5 and Serengeti-transformed strains) in relation to
vaccination status, proximity to wildlife interface areas and duration since vaccination
(1-15 years)?
(ii) Are ECF vaccine strains detectable in the unvaccinated co grazing cattle?
(iii) Is diversity of ECF vaccine strains modified due to presence of local T. parva strains?
1.6 Significance of the research
Outputs of this study will help to better understand long term impacts of the infection
and treatment method for ECF control. Key expected outputs include the improvement
of ECF vaccination regimes through, evidence for establishment of the three Muguga
vaccine strains (Muguga, Kiambu 5 and Serengeti-transformed strains) in cattle vaccinated
in the last 1-15 years. Such information will allow improvement of vaccine delivery in
pastoral herds. Since available literature shows that, of the 3 strains present in the Muguga
cocktail, only the Kiambu 5 stock establishes a long-term carrier state (up to 4 years) (Oura
et al., 2007), this study will take advantage of the long term deployment of ECF vaccination
for more than 15 years in Maasai communities of northern Tanzania to provide
evidence on persistence of the three vaccine stocks (Kiambu 5, Muguga and Serengeti-
transformed) under natural field conditions. Proof on the vaccine strains transmission to
unvaccinated co grazing cattle and if the long-term application of ITM contributes to the
diversity of T. parva vaccine strains.
6
1.7 Delineanation of the study
Infection and treatment method has been practiced as a method to control East Coast Fever
disease among pastoral communities for more than 20 years. The method uses the vaccine
known as Muguga Cocktail which consist of three different parasite strains of T. parva
known as Muguga, Kiambu 5 and Serengeti transformed. Previous studies have been done on
the vaccine and its persistence after administration however, the available information is
limited for up to 4 years after vaccination.
This dissertation deals with the persistence of the Muguga Cocktail vaccine after 15 years of
administering it among the pastoral communities in northern Tanzania, this stand out as the
available literature depicts this scenario for only up to four years and in different settings as
the one used in this study. The dissertation looks into the genetic diversity of the parasites
given the common practice of co grazing of vaccinated and unvaccinated cattle also sharing
of pasture with the buffalo which is the main reservoir of the parasites.
7
CHAPTER TWO
LITERATURE REVIEW
2.1 Theileria Parva and East Coast Fever (ECF)
2.1.1 Morphology of T. parva
Theileria parva is a tick-borne parasitic protozoan with a small genome of 10-12 Mbp. The
haploid T. parva nuclear genome is 8.3×10ˆ6 base pairs (Mbp) in length. The species
has four chromosomes and a plastome which contains the genes for the apicoplast,
consists of one extremely A+T-rich region (>97%) about 3kbp in length that maybe the
centromere. The T. parva nuclear genome contains about 4035 protein-encoding genes,
which exhibits higher gene density a greater proportion of genes with introns, and shorter
intergenic regions (Gardner et al., 2005).
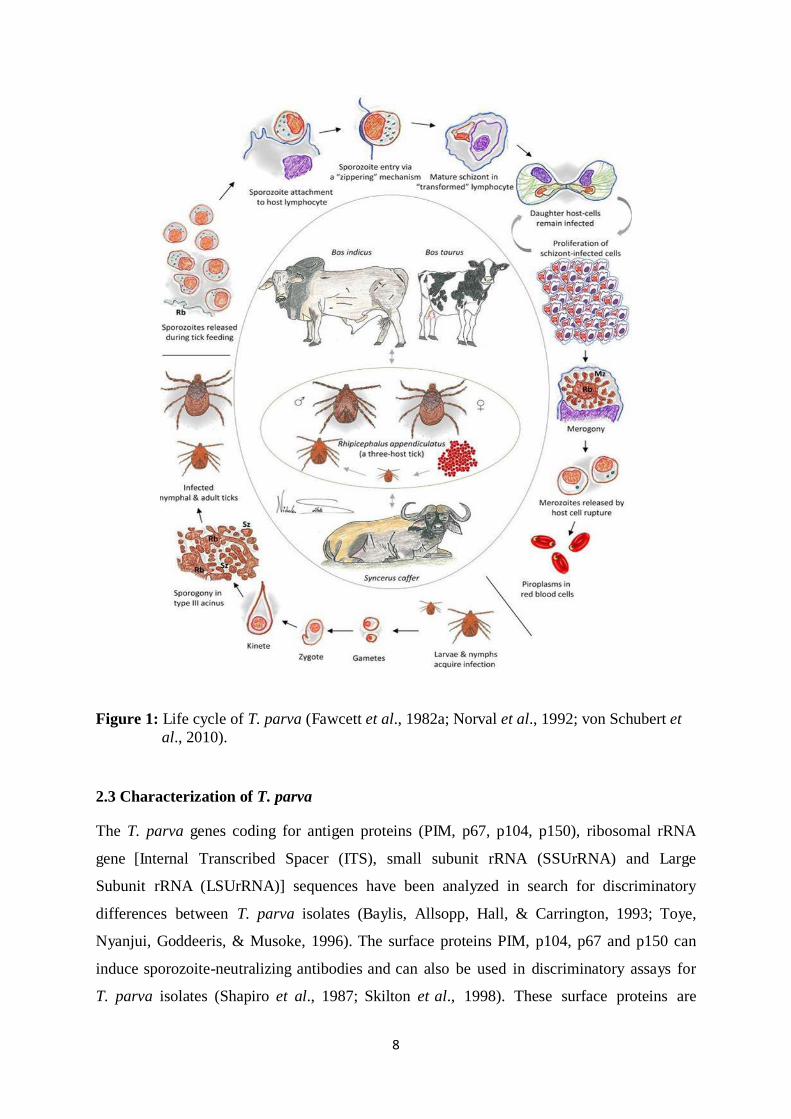
2.2 Life cycle of T. parva
The vector that transmits T. parva known as Rhipicephalus appendiculatus is a three stage
host tick. Sporozoites are produced in the salivary gland of the ticks and when feeding in an
animal are the ones being transmitted, this occurs within 48 to 72 hours of being attached to
the host. The sporozoites once inside the host’s lymphocytes they develop into
macroschizonts and then divide into two cells each containing schizonts, schizonts multiply
and develop into merozoites/ microschizonts which invades the red blood cells and becomes
piroplasms. Ticks ingest the red blood cells with the piroplasm and the sexual stage takes
place inside the tick gut which results into formation of motile stage of T. parva which moves
to the salivary glands of the ticks for the whole cycle to take place again.
8
Figure 1: Life cycle of T. parva (Fawcett et al., 1982a; Norval et al., 1992; von Schubert et
al., 2010).
2.3 Characterization of T. parva
The T. parva genes coding for antigen proteins (PIM, p67, p104, p150), ribosomal rRNA
gene [Internal Transcribed Spacer (ITS), small subunit rRNA (SSUrRNA) and Large
Subunit rRNA (LSUrRNA)] sequences have been analyzed in search for discriminatory
differences between T. parva isolates (Baylis, Allsopp, Hall, & Carrington, 1993; Toye,
Nyanjui, Goddeeris, & Musoke, 1996). The surface proteins PIM, p104, p67 and p150 can
induce sporozoite-neutralizing antibodies and can also be used in discriminatory assays for
T. parva isolates (Shapiro et al., 1987; Skilton et al., 1998). These surface proteins are
9
usually encoded by single copy genes and contain a polymorphic central region of amino
acid sequences flanked by a conserved amino and carboxyl terminus (Skilton et al., 1998;
Toye et al., 1995) whereas PIM and p150 are expressed in both sporozoite and schizont
stages of the parasite, p67 and p104 are only expressed in the sporozoite stage (Katende et
al., 1998; Shapiro et al., 1987).
Size polymorphisms displayed by T. parva antigen genes, PIM, p104, p150 and p67, have
been used to develop several molecular tools for characterization of T. parva stocks,
exploiting the variable regions of these genes (Bishop et al., 2001; Geysen, Bazarusanga,
Brandt, & Dolan, 2004). Polymerase Chain Reaction and Restriction Fragment Length
Polymorphism (PCR-RFLP) analysis using these antigen genes demonstrated polymorphism
in field stocks of T. parva in Kenya, although the majority of field stocks isolated from two
regions of Zambia were relatively homogeneous (Geysen, Bishop, Skilton, Dolan, &
Morzaria, 1999). A semi-nested PCR is preferred for analysis of these genes to increase
sensitivity since they are single copy genes.
2.3.1 Characterization of T. parva using mini- and micro-satellite markers
Minisatellite and microsatellite sequences show high levels of variation and therefore
provide excellent tools for both the genotyping and population genetic analysis of
parasites. Oura et al. (2003) used a panel of microsatellite and minisatellite markers to
characterize field isolates of T. parva. A panel of 11 polymorphic microsatellites and 49
polymorphic minisatellites of the T. parva haemoprotozoan parasite were identified (Oura
et al., 2003). The PCR products were run on high resolution spreadex gels on which the
alleles were identified and sized. The sequences of the mini- and microsatellites were
found to be distributed across the four parasite chromosomes with 16 on chromosome 1, 12
on chromosome 2, 14 on chromosome 3 and 18 on chromosome 4. The primers from the 60
sequences were also proved to be specific for T. parva.
When tissue culture isolates of T. parva isolated from cattle in widely separated African
regions were characterized, the numbers of alleles per locus ranged from three to eight. This
indicates a high level of diversity between these geographically distinct isolates. Analysis
of isolates from cattle on a single farm identified a range of one to four alleles per locus
which indicates a high level of diversity in a single population of T. parva. Cluster
analysis of multilocus genotypes revealed that genetic similarity between isolates was not
obviously related to their geographical origin (Oura et al., 2003). Mini- and microsatellite
10
sequences are frequently located in non coding regions, hence believed to be representative
of population history (Odongo et al., 2006; Oura et al., 2003). Mini and microsatellites have
been successfully used to determine population diversity of T. parva in different studies
(Rukambile et al., 2016). Mini and microsatellite markers were used to characterize the
three strains which are present as components of the Muguga T. parva vaccine cocktail,
to determine the ability of each component to induce carrier state (Oura et al., 2004) and the
possibility of being transmitted from vaccinated animals to other susceptible animals (Oura
et al., 2007). Five mini and microsatellite markers were used to study diversity of the three
stocks which are the components of the Muguga cocktail vaccine whereby 14 different
genotypes were revealed (Patel et al., 2011). Furthermore, 9 minisatellites were used to study
population genetics and substructure of T. parva population in the samples collected from
two districts in Zambia with success (Muleya et al., 2012). However, the use of
microsatellite markers is limited to parasite clones and cannot be directly used to
characterize field samples, which usually contain complex mixtures of multiple T. parva
strains.
2.3.2 Characterization of T. parva using antigen genes
(i) The T. parva p104 antigen gene
To characterize T. parva parasites occurring in buffalo (Syncerus caffer) in South Africa,
the gene coding for the p104 antigen was selected for PCR-RFLP analysis. There is limited
polymorphism in the p104 gene especially amongst cattle-type alleles. This allows
distinction of buffalo-type from cattle-type alleles (Geysen et al., 1999). Skilton, Bishop,
Katende, Mwaura and Morzaria (2002) identified four p104 alleles representing p104 amino
acid sequences obtained from different T. parva stocks of cattle and buffalo in East Africa.
Allele 1 (accession number: M2954) represents the T. parva Muguga p104 amino acid
sequence (Iams et al., 1990); allele 2 (accession number: AY034069) is found in the
Marikebuni and Uganda T. parva stocks and alleles 3 (accession number: AY034070)
and 4 (accession number: AY034071) represent the T. parva Boleni and 7014 p104 amino
acid sequences, respectively. Muguga, Marikebuni, Uganda and Boleni are cattle-derived T.
parva stocks whereas 7014 is a buffalo-derived T. parva stock. The Polymorphic
Immunodominant Molecule (PIM) and p104 profiles from buffalo-derived T. parva stocks
are more polymorphic than those from cattle-derived stocks (Geysen et al., 1999).
11
2.4 Methods for characterization of T. parva diversity
2.4.1 Molecular techniques
(i) Conventional p104 PCR
This is a T. parva species-specific assay based on primers derived from conserved region
of a 104-KDa antigen gene (p104) of T. parva. The assay was validated and showed a
detection threshold (sensitivity) of 2 parasites/µl of infected blood (Skilton, Bishop,
Katende, Mwaura, & Morzaria, 2002). However, just like the Reverse Line Blot technique,
this assay is time-consuming due to the hybridization step.
(ii) Nested PCR for the p104 gene
Nested PCR involves use of two pairs of PCR primers for a single locus. The primers used in
the first round of amplification are either both replaced (nested PCR) or only one is replaced
(semi- nested PCR) for the second and subsequent cycles of amplification. The first pair
amplifies the locus as in any conventional PCR experiment. The second pair of primers
(nested primers) binds within the first PCR product and produces a second PCR product that
is shorter than the first one. This strategy ensures that if the wrong locus were amplified
during the first round PCR, the probability is very low that it would also be amplified a
second time by a second pair of primers. Recent detection of T. parva infections has
employed semi-nested PCR-RFLP assays based on the T. parva p104 and 18S rRNA genes
(Bazarusanga, Vercruysse, Marcotty, & Geysen, 2007; De Deken et al., 2007). However,
since p104 is a single copy gene, semi-nested PCR is less sensitive and not ideal for detection
of T. parva infections in carrier animals. Oura et al. (2004) described a nested p104 PCR for
detection of T. parva DNA in peripheral blood. The assay is based on amplification of a 277
bp internal fragment of the p104 gene which is both T. parva-specific and widely conserved
within T. parva stocks (Bishop, Musoke, Morzaria, Gardner, & Nene, 2004; Skilton et al.,
2002). The test exhibits enhanced sensitivity for detection of low levels of T. parva piroplasm
infections in bovine carrier animals. Interpretation of the PCR result is based on visualization
of a band on agarose gel. This study therefore employed nested PCR for the p104 gene for
detection of T. parva in samples.
2.5 Control of T. parva
2.5.1 Acaricides and use of drugs
The control of T. parva in Tanzania relies on the use of acaricides, commercially available
12
drugs and vaccination using the ITM (Elisa et al., 2015). Treatment with drugs only works
during the early stages of the disease. Of all the available drugs buparvaquone is drug of
choice for the treatment of T. parva (McHardy, Wekesa, Hudson, & Randall, 1985).
Recently most pastoralist communities control ECF by limiting ticks using acaricides (Di
Giulio et al., 2009). However, this method is not of great use due to many drawbacks along
with being the development of resistance by ticks, food-safety concerns, disruption of
endemic stability and environmental contamination due to the toxic residues. In addition, the
use of acaricides involves dipping, and the facilities used for dipping are mostly not
operating as they involve financial resources for the maintenance especially among
pastoralists who can hardly not afford the cost (Di Giulio et al., 2009). The fatal nature of
the disease demands for effective measures to provide a sustainable means of controlling the
disease which is achieved through vaccination by ITM.
2.5.2 Immunization using the Infection and Treatment Method (ITM)
The cattle normally becomes solidly immune to re infection with similar strains after
recovery (Norval et al., 1992). The ITM process involves simultaneous infection of the cattle
with three vaccine strains and treatment with oxytetracycline (30%), which results in an
attenuate infection but in a long-lasting efficient immune response (Di Giulio et al.,
2009; McKeever, 2009). The first attempt to vaccinate cattle against T. parva infection was
done in a year 1911 in South Africa (Theiler, 1912). Whereby they injected the infected cells
obtained from spleen and lymph nodes of sick cattle intravenously to the suscpectible cattle,
which was not successful and resulted to a lot of death among cattle and consequently
vaccination was discontinued (Mbizeni et al., 2013).
The original ITM live vaccine technology was developed about 40 years ago (Nene &
Morrison, 2016). Protection is mediated by parasite-specific major histocompatibility
complex (MHC) class I-restricted cytotoxic T lymphocytes (CTLs), which target the
schizont-infected lymphoblast. Because it does not take effect until the schizont parasitosis is
established, the CTL response does not prevent infection. The CD8+ T lymphocyte is a
response that mediate protection and recently, several parasite antigens recognized by CD8+
T cells have been identified (Pelle et al., 2011). In addition, recovered cattle and those
immunized by infection and treatment are almost invariably long-term carriers of piroplasm
forms. Because piroplasms of T. parva undergo only limited replication the carrier state
probably arises from persistence of small numbers of schizont-infected lymphoblast’s
13
(McKeever, 2009). Protection is partially stock specific and combinations of stocks have
been used to provide broad protection (Oura et al., 2007). The most widely used is the
‘Muguga cocktail’ developed in the 1970s (Radley et al., 1975) as a trivalent formulation of
T. parva strains Muguga, Kiambu 5 and Serengeti-transformed stocks. Over 15 million
doses of MC have reportedly been administered in approximately eleven countries of
eastern and southern Africa (Perry, 2016) including Uganda, Malawi, Tanzania and, Kenya
(Oura et al., 2007). Parasite isolates placed in different cross-immunity groups usually
exhibit 20–30% cross-protection between them (Morzaria, Spooner, Bishop, & Mwaura,
1997). Sequential immunization by ITM with single isolates in different cross-immunity
groups provides additive immunity (Taracha, Goddeeris, Morzaria, & Morrison, 1995). This
suggests that some protective antigens are shared between different parasite isolates, and the
breadth of the immune response can be expanded in response to new infections (Nene et al.,
2016). Novel genotypes can be found in cattle vaccinated with the Muguga cocktail
(Hemmink et al., 2016; Oura et al., 2004). This may help to broaden the spectrum of
immunity to strains of the parasite not present in the cocktail.
The results of two current studies of the Muguga cocktail vaccine, one involving
genomic sequencing of the three component parasites and the other based on high-
throughput sequencing of PCR amplicons of six genes encoding T. parva antigens
(including Tp1 and Tp2), have indicated that the vaccine contains only a small component
of the genetic and antigenic diversity detected in field populations of T. parva (Nene et al.,
2016). Each of the three parasite isolates in the Muguga cocktail showed a very limited
diversity, and two of them (Muguga and Serengeti) exhibited a striking high level of
sequence similarity, but differed significantly from the Kiambu isolate (Nene et al., 2016).
Furthermore, amplicon sequencing and satellite DNA typing indicated that the vaccine
components contained minor genotypic components present at <5% within the vaccine
parasites. If these minor components contribute to the broad protective capacity of the
vaccine, then the possibility that these components might not be present in all vaccine
batches or indeed all vaccine doses is of concern regarding standardization of vaccine
content (Nene et al., 2016).
The greatest impact of the MC appears to have been in Tanzania, in part due to the
commitment of the group championing its use in and around Arusha, and in part due to the
unique demand in the pastoralist communities in northern Tanzania and southern Kenya
14
(Perry, 2016). As the Muguga Cocktail is a live vaccine there has been concerns about the
use of it due to the risk of introducing exotic stocks of T. parva from the vaccine parasite
strains (or specific alleles) into the field which maybe outside the immunological range of
indigenous parasites (Oura et al., 2007) this may result in genetic recombinations with local
parasite populations or introduction of the disease in previously free areas (Martins et al.,
2010).
Moreover vaccination using the Muguga cocktail requires production of three large batches
of T. parva sporozoites by feeding ticks on cattle infected with each parasite isolate, and
each batch needs to be carefully titrated in cattle to determine a dose that will
reproducibly infect and immunize all animals but will not break through the tetracycline
treatment (Nene et al., 2016). This complex protocol coupled with the requirement for a
liquid nitrogen cold chain to distribute the vaccine presents drawbacks for quality control
and marketing. Nevertheless, recent initiatives have led to increased field uptake. This has
included the establishment of a center for vaccine production and systems to facilitate
distribution of the vaccine (Nene et al., 2016). Therefore, development of a subunit
vaccine that is easier to produce and with minimal risks is important. Previous experiments
with other versions of the ITM vaccine have shown that they do not always provide
complete protection under field conditions (Cunningham et al., 1974). A number of cross-
immunity studies have been conducted using different cattle-derived T. parva stabilates,
including locally derived parasites, which have shown mixed results in development of
protective immunity (Latif, Hove, Kanhai, Masaka, & Pegram, 2001).
2.6 Carrier state and persistence of Muguga Cocktail vaccine
The carrier state of T. parva is the ability of an infected and recovered host to carry the
parasites without getting sick but it can infect ticks which are then able to transmit the
parasite to susceptible animals (Norval et al., 1992). The cattle which recover from the
disease can remain infected with no clinical signs and serve as reservoirs for ticks (Olds et
al., 2018). The phenomena of carrier state of T. parva among cattle contributes to continuous
infection of cattle which plays a mojor role in maintenance of cattle immunity (Young,
Leitch, Newson, & Cunningham, 1986). Carrier state is also said to result into endemic
stability, in areas where natural transmission occurs and is described as “a climax
relationship between host, agent, vector and environment in which all coexist with the
virtual absence of clinical disease” Woolhouse et al. (2015). Calves are most susceptible to
15
acute infections under conditions of endemic stability and the developed carrier state may
last for a number of years. Lately the concept of endemic stability for T. parva has been
defined to include the concept that protection may be correlated with closely related
virulent Theileria species which circulates naturally among the cattle population (Olds et
al., 2018). It is therefore very important to understand the contribution to cattle immunity
made by persistent T. parva infections both naturally acquired and artificially induced
through vaccination with live sporozoites given the broade concept of endemic stability
(Olds et al., 2018).
Undisrupted endemic stability helps to reduce the occurrence of acute disease and mortality
(Norval et al., 1992). Movement of naive cattle from non endemic to endemic zones
together with the breakdown of tick control may reduce transmission pressures, as this
may limit the opportunity for early infection of calves and subsequent development of a
broad immune response. Moreover, herd improvement programs that introduce more
productive European cattle breeds which are highly susceptible to infection, or by the
introduction of virulent T. parva strains directly from African buffalo reservoirs at the
interface between domestic cattle and wildlife can also disrupt the endemic stability (Olds et
al., 2018). Epidemiology of theileriosis is determined by the ability of the T. parva carrier
animal to infect ticks during feeding. There are two main ways by which a mammalian
host can become a T. parva carrier: spontaneous recovery from an infection without
treatment or a recovery after treatment. The ITM method against T. parva infections has
been very effective in conferring the cattle immunity but these cattle remain carriers
(Mbizeni et al., 2013).
It is possible for the animal that is infected with Theileria parasite to act as a carrier
only initially, i.e. develop schizont parasitosis and piroplasm parasitaemia which are later
cleared by the immune responses leaving the host immune but with no parasites producing
the state of sterile immunity. Thus an animal can become an intermittently or sporadic
carrier or become a persistent carrier (Norval et al., 1992).
An infected mammalian host, either buffalo or cattle, should be capable of infecting
ticks which then transmit the parasites to a new host this is a crucial stage in Theileria
parva maintenance in cattle populations which results to a continuous circulation of the
parasite between the mammalian host and the vector ticks (Norval et al., 1992; Mbizeni et al.,
2013). The above case can only be achieved if there is constant contact between infected
16
mammalian hosts and susceptible cattle (Mbizeni et al., 2013). Physical separation has been
effective before as it limits contact between known infected cattle or buffalo and susceptible
cattle which may also contribute to inability for buffalo-derived T. parva to establish carrier
state in cattle populations which is not the case in northern Tanzania due to animals co
grazing and pasture sharing at wildlife interface areas which may expose animals to buffalo
derived strains. Moreover, all stages of R. appendiculatus occur throughout the year in
tropical East Africa which makes continuous host-vector T. parva circulation possible
(Mbizeni et al., 2013).
The study done by Oura et al. (2007) revealed the persistence of one of the three strains
known as kiambu 5 to be detected in the majority (70%) of vaccinated calves for up to 4
years, but there was no evidence for the presence of the Muguga or Serengeti component
of the vaccine which suggest that some components in Muguga stock does not cause a long
term carrier state (Skilton et al., 2002). The use of a live vaccine means that vaccinated
animals become “carriers” of the T. parva strains being used in the vaccine, and eventually
they then provide a source of these strains to ticks in the field as a result they have the
potential to infect co-grazing non-vaccinated animals with these strains, this raises many
concerns on the MC vaccine (Hayashida et al., 2012).
The study done by Oura et al. (2007) suggested that the Kiambu 5 stock can be detected in
many but not all vaccinated cattle for up to 4 years and can be transmitted to unvaccinated
cattle which share grazing, and that some of the vaccinated animals become infected with
local genotypes without developing into a disease. This possibility was examined by
collecting of blood samples from 13 unvaccinated adult cattle on the farm (over 2 years
after the previous sampling) including 3 of the animals sampled in 2002. These cattle had
shared grazing for over 4 years with 43 cattle, vaccinated between 2000 and 2003. Blood
samples were genotyped, using the Muguga/Serengeti and Kiambu 5-derived primers that
amplify regions of the PIM gene. Four of the unvaccinated cattle (numbers 3, 8, 10 and 12)
amplified PCR products of the same size and pattern as the Kiambu 5-specific PCR products
from the vaccine stabilates.
2.7 Genotypic diversity of T. parva
Like other parasites protozoan parasites are thought to have evolved in genetic diversity
to survive the immunologically unfavorable environments of their hosts (Nene et al.,
2016). Genetic diversity allows the parasites to escape the immune responses of their hosts
17
due to antigenic variation in parasites (McKeever, 2007). Recombination which takes place
in ticks during sexual reproduction is very crucial in the genetic diversity of Theileria
species (Henson et al., 2012; Katzer, Ngugi, Schnier, Walker, & McKeever, 2007) although
other mechanisms like genetic drift and mutations also accounts for this (Skilton et al.,
1998), Bioinformatics analyses have revealed this to be a possible mechanism generating
genetic diversity in genes such as the polymorphic immunodominant molecule (PIM) of
T. parva (Geysen et al., 2004; Sivakumar, Hayashida, Sugimoto, & Yokoyama, 2014).
Besides genetic recombination and mutations within the epitopes of CD8+ cytotoxic T
lymphocyte (CTL) antigens were found to facilitate immune evasion in T. parva
(Connelley, MacHugh, Pelle, Weir, & Morrison, 2011). Whilst the evolutionary acquisition
of genetic diversity favors the long-term survival of the parasites, it usually makes it difficult
to adopt to efficient control measures against the diseases caused by them. Therefore, this
calls for a deeper knowledge of genetic diversity in T. parva for gaining better
understanding of these harmful parasites (Sivakumar et al., 2014).
Studies influenced by the distribution, density, and type of markers across the genome by
using a number of loci and variable number of tandem repeat (VNTR) markers (mini-
and micro- satellites) derived from the T. parva genome sequence data have been used
as markers to determine parasite diversity (Oura et al., 2003, 2004, 2005, 2011; Patel
et al., 2011) the results indicated that there was no direct relationship between geographical
origin and level of genetic similarity between parasite isolates, such that different parasite
isolates from the same farm demonstrated distinct genotypes. Older cattle revealed larger
number of different parasite genotypes than younger ones, which tended to have a
predominating genotype (Oura, Asiimwe, Weir, Lubega, & Tait, 2005). Some geographical
sites revealed a sub structure in parasite populations, others did not, and some exhibited an
epidemic structure characteristic of recent predominating infections (Oura et al., 2005).
Thus, it has been concluded that cattle movement, their co grazing with buffalo, and
parasite transmission rates play a major role in determining T. parva parasite population
structures (Oura et al., 2003).
Analysis with 12 micro and minisatellites markers revealed 84 multilocus genotypes (MLGs)
in blood samples from three geographical localities in Uganda (Oura et al., 2005), and a
total of 183 alleles were observed at 30 micro and minisatellites loci from 20 Kenyan
tissue culture isolates (Odongo et al., 2006). Some animals can be infected with a couple of
18
T. parva genotypes (Oura et al., 2007). Even so most recent analysis of 14 micro- and
minisatellites markers revealed a low level of genetic diversity in T. parva from cattle
populations in Tanzania (Elisa et al., 2015; Rukambile et al., 2016). Other findings of the
study done in south Sudan using a panel of 11 mini- and three micro-satellite markers
revealed high T. parva diversity in some parts (Salih et al., 2018). These observations are
similar among T. parva populations in countries where ECF is endemic.
2.7.1 Influence of wildlife interface areas in T. parva diversity
Ticks plays a major role in transmission of T. parva parasites among the vaccinated and
unvaccinated animals which co graze and with close proximity to wildlife interface where
there is constant exposure with the buffalo which is the main host of the parasites, in spite
the fact that wildlife harbors a great diversity of parasites in inactive forms they still have a
potential to cause drastic effects on their hosts both directly and indirectly (Wamuyu et al.,
2015). Once the cattle are infected with buffalo-derived strains it develops a Corridor
disease (CD), which is results to low levels of parasitized leukocytes in peripheral lymph
nodes unlike the high parasitosis seen in ECF. Parasites derived from buffalo are more
divergent compared to the ones from cattle this is evidenced by the monoclonal antibody
profiles results and comparison of the sequences of known T. parva antigens (Pelle et al.,
2011). Moreover, previous studies in many parts of Africa, including Zimbabwe (Bishop et
al., 1994), Uganda (Oura, Tait, Asiimwe, Lubega, & Weir, 2011) and South Africa
(Sibeko et al., 2011), reported the same findings. Several genes have been investigated in
search of discriminatory sequence differences between T. parva isolates. Among these are
sporozoite antigen genes, p104, p67 and PIM (Bazarusanga et al., 2007; Iams et al., 1990;
Nene, Musoke, Gobright, & Morzaria, 1996). The heterogeneity seen in T. parva is unclear
whether it exert any advantage during the stages of the parasite lifecycle. Notwithstanding
that, there is evidence that this diversity has an important influence on immunity (Sitt et
al., 2015). Immunity resulting from Muguga cocktail is known to be strain-specific hence
cattle immunized against one strain of the parasite are not necessarily protected against
challenge with heterologous parasite strains in the field (Radley et al., 1975).
The Muguga cocktail vaccine has been used successfully in some regions despite the
evidence that it does not protect all animals against infections from buffalo derived strains
(Radley et al., 1979). Two studies were conducted among vaccinated cattle grazing into
areas where buffalo resides showed no or low levels of protection against disease (Bishop et
19
al., 2015; Sitt et al., 2015). The findings suggests that T. parva parasite populations in
buffalo harbor a greater antigenic diversity than those in cattle (Hemmink et al., 2016).
To support these findings a study of the sequences of two genes (Tp1 and Tp2) which
encode proteins recognized by CD8+T cells from immune cattle, in infected cell lines
isolated primarily from eastern Africa (Pelle et al., 2011). Over 30 allelic variants of each
antigen were identified, majority of the variants were found in isolates obtained from
buffalo and from cattle that had co grazed with the buffalo, whereas only a small amount
of the variants was detected in the isolates obtained from cattle grazed without the buffalo
(Pelle et al., 2011).
Recent studies done by Elisa et al. (2015) to investigate the genetic diversity of T. parva
isolates existing in cattle and African buffalo in the Serengeti and Ngorongoro in Tanzania
and whether T. parva genotypes are shared between buffalo and cattle that are grazing in
same pasture or in close proximity, showed a higher incidence of T. parva and buffalo
derived strains to have been transmitted to Ngorongoro cattle which are co-grazed in close
contact with buffalo as compared to Serengeti cattle.
20
CHAPTER THREE
MATERIALS AND METHODS
3.1 Study areas
The study was carried out in Maasai steppe of northern part and Tanga region in the eastern
part of Tanzania (Fig. 2). The Maasai steppe is made of Simanjiro plains, Tarangire
National Park and Lake Manyara National Park. It stretches over right districts of Arusha
and Manyara regions of Tanzania. It lies between 3°52’ and 4°24’ south and 36°05 and
36°39 east. This area has two rainfall seasons of spatial and temporal variation. It is
comprised of dry season starting from October to December and wet season from February
to May. The average temperature in the area is between 18°C and 30°C. The Maasai
steppe is made up of natural ecosystem consisting of a variety of animal species,
vegetation, conducive temperature variations and rainfall, all of which support a natural
habitat for living organisms including vectors and various parasites. Such an ecosystem
regulates the density of organisms found in the area. The area is semi-arid with the
national parks providing a home for wildlife. The main source of livelihood in Maasai steppe
is Livestock and crop production with cattle production being the major activity. This area
also consists of a wildlife corridor which is bordered by Monduli district and Manyara ranch
located in the north and Tarangire National park on the South-western side. Due to its
proximity to wildlife the area has high interaction of domestic and wildlife which
increases circulation of T. parva making East Coast Fever endemic in the area.
Tanga Region is one of the 31 administrative regions of Tanzania. It is bordered by Kenya
and Kilimanjaro Region to the north; Manyara Region to the west; and Morogoro and Pwani
regions to the south. Its eastern border is formed by the Indian Ocean. It is situated at the
North-East corner of Tanzania between 4◦ and 6◦ degrees below the Equator and 37◦ -39◦
10’ degrees East of the Greenwich Meridian. Tanga's climate is classified as tropical,
with the average temperature of 26 °C. About 1290 mm of precipitation falls annually,
with the greatest amount occurs in May at an average of 294 mm which supports the
parasites survival including ticks Most of the land is used for crop production, livestock
keeping, forestry, mining, and residency. Livestock keeping is the second important sector
of the economy in the region. Over 94% of livestock kept in Tanga constitute
traditional/local breeds which have very low potential in terms of production and
productivity. According to the census of Agriculture survey in 2007-2008 the region has a
21
total of 732 130 cattle in 74 670 households. Most of the households keeps indigenous cattle
(688 114), which accounts for 94% of the total cattle population. With beef cattle
accounting for only 0.3% of the cattle while the remaining households raises a total of 41
639 dairy cattle, which comprises 6% of the cattle population. Unlike the Maasai steppe
the dairy farms in Tanga region are located far from the wildlife interface areas hence
there is no interaction of the domestic animals with the wildlife. Furthermore, in Tanga
region ITM practice has not been practiced for a longer time as compared to the Maasai
steppes.
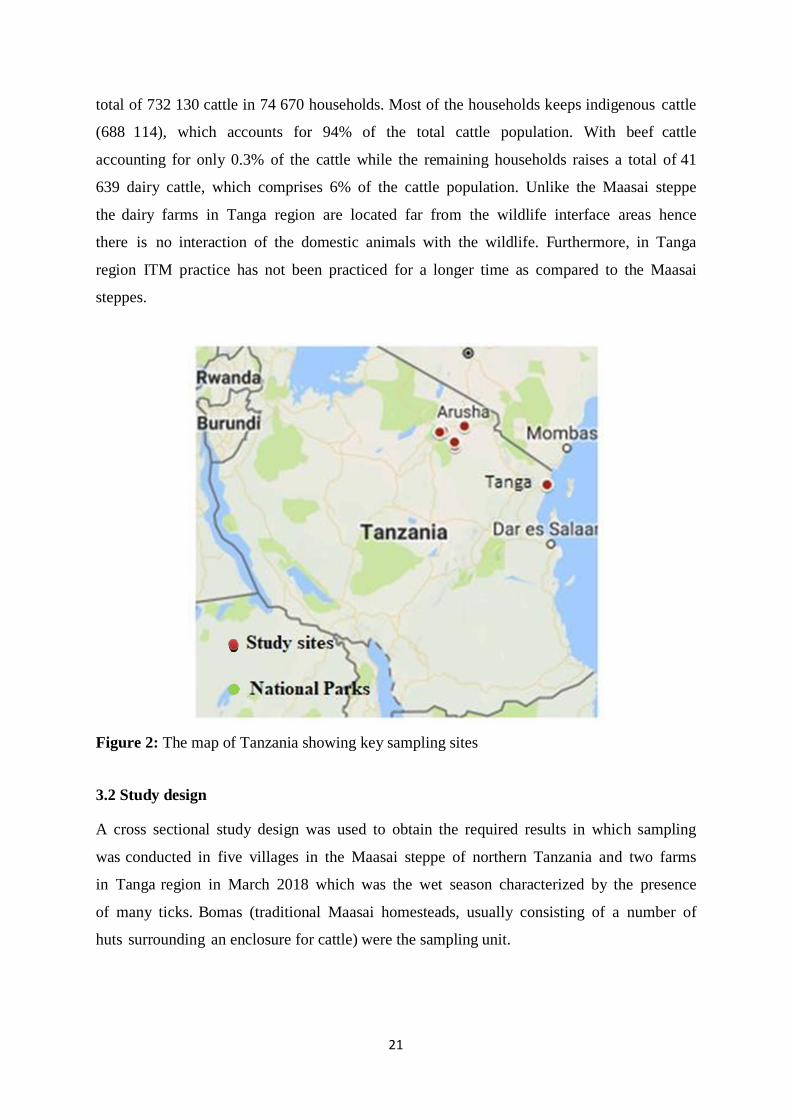
Figure 2: The map of Tanzania showing key sampling sites
3.2 Study design
A cross sectional study design was used to obtain the required results in which sampling
was conducted in five villages in the Maasai steppe of northern Tanzania and two farms
in Tanga region in March 2018 which was the wet season characterized by the presence
of many ticks. Bomas (traditional Maasai homesteads, usually consisting of a number of
huts surrounding an enclosure for cattle) were the sampling unit.
22
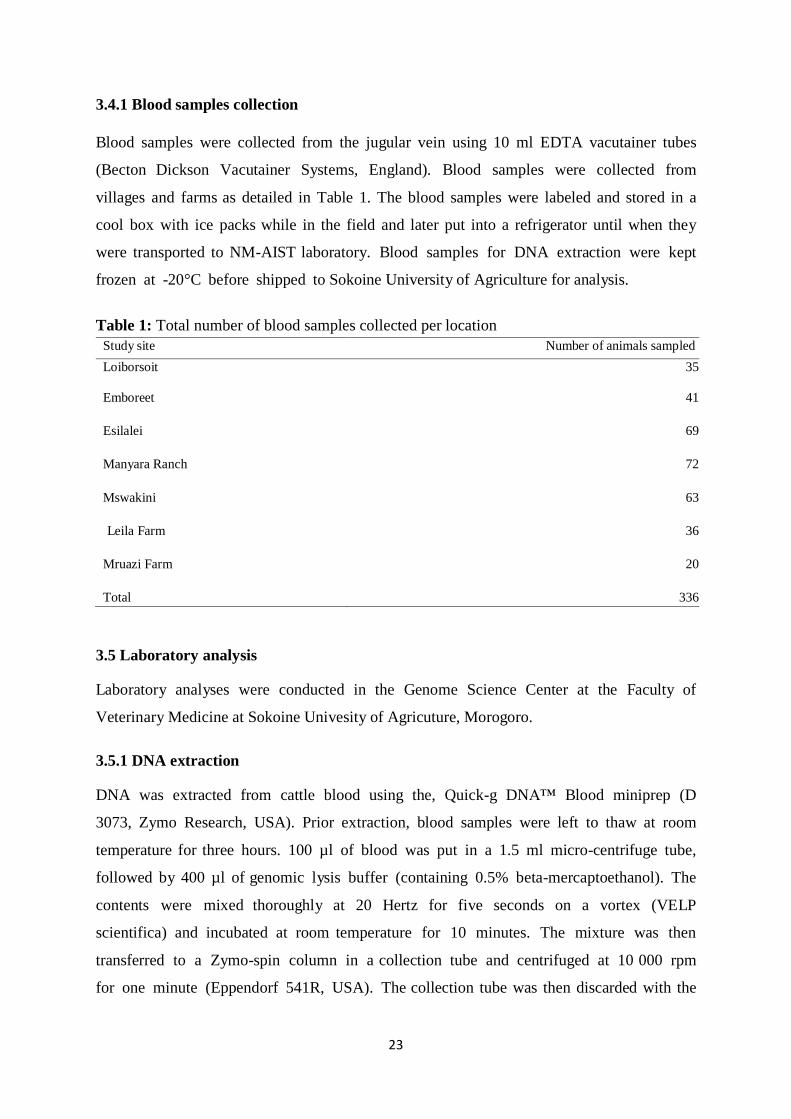
3.3 Sample size determination
Sample size was calculated using the following formula
Where N is the sample size; Zα =1.96 at 95% confidence level; standard error of the mean,
p= 37.1%, the previously reported T. parva prevalence in the area (Kazungu et al., 2015);
q=1-p, d=0.05 at 5% absolute error (design effect).
The calculated sample size was 358
3.4 Sampling
A multistage sampling technique was used from the district level to the bomas which were
the sampling units. Five villages in Maasai steppe and two farms in Tanga were then
selected purposively based on their cattle population size, location with reference to
Tarangire and Manyara National park and whether ECF vaccination is being practiced. In
these locations all of the sub-villages were listed down and 50% of them were selected
randomly. In each of the sub- village the numbers of the bomas were listed down and 3
bomas were selected systematically in each sub village. Cattle were then selected
conveniently in the selected bomas. Vaccinated cattle were easily identified by ear-tag
numbers, which indicated the year of vaccination what was also confirmed by farmers.
Upon receipt of consent from local and village authorities as well as individual farmers,
cattle were randomly selected from seven locations (Loiborsoit, Emboret, Esilalei,
Mswakini, Manyara ranch, Tanga Leila farm and Tanga Mruazi Farm).
Data on their vaccination status and duration since vaccination were retrospectively
collected. Mruazi and Leila farms in Tanga were selected purposively due to their
exclusiveness from the wildlife and the ITM practices. Mruazi farm had never practiced
ITM whereas, Leila farm stopped vaccination in 2015. These farms become good candidates
for comparison of impact of ITM from the Maasai steppe areas where it has been practiced
for over 15 years and close to wildlife. A sample size of 336 cattle was enrolled in order to
determine the carrier state persistence and diversity of T. Parva. Twenty two of the cattle
dropped out during sample collection.
23
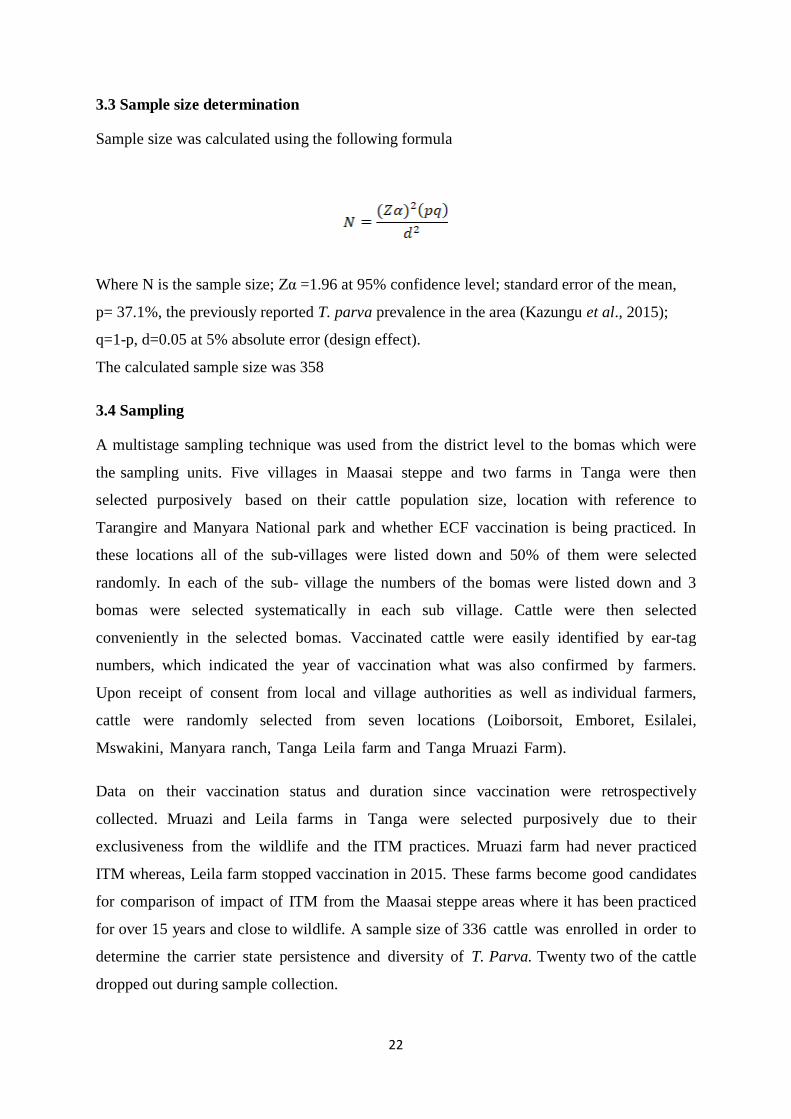
3.4.1 Blood samples collection
Blood samples were collected from the jugular vein using 10 ml EDTA vacutainer tubes
(Becton Dickson Vacutainer Systems, England). Blood samples were collected from
villages and farms as detailed in Table 1. The blood samples were labeled and stored in a
cool box with ice packs while in the field and later put into a refrigerator until when they
were transported to NM-AIST laboratory. Blood samples for DNA extraction were kept
frozen at -20°C before shipped to Sokoine University of Agriculture for analysis.
Table 1: Total number of blood samples collected per location
3.5 Laboratory analysis
Laboratory analyses were conducted in the Genome Science Center at the Faculty of
Veterinary Medicine at Sokoine Univesity of Agricuture, Morogoro.
3.5.1 DNA extraction
DNA was extracted from cattle blood using the, Quick-g DNA™ Blood miniprep (D
3073, Zymo Research, USA). Prior extraction, blood samples were left to thaw at room
temperature for three hours. 100 µl of blood was put in a 1.5 ml micro-centrifuge tube,
followed by 400 µl of genomic lysis buffer (containing 0.5% beta-mercaptoethanol). The
contents were mixed thoroughly at 20 Hertz for five seconds on a vortex (VELP
scientifica) and incubated at room temperature for 10 minutes. The mixture was then
transferred to a Zymo-spin column in a collection tube and centrifuged at 10 000 rpm
for one minute (Eppendorf 541R, USA). The collection tube was then discarded with the
Study site Number of animals sampled
Loiborsoit 35
Emboreet
41
Esilalei
69
Manyara Ranch
72
Mswakini
63
Leila Farm
36
Mruazi Farm
20
Total
336
24
flow- through solution. The Zymo-spin column was then transferred to a new collection
tube and 200 µl of DNA Wash Buffer was added to the spin column and centrifuged at 10
000 rpm for one minute. The spin column was then transferred to a clean and sterile micro-
centrifuge tube where DNA was eluted by adding 50 µl of DNA Elution Buffer and
incubated for five minutes at room temperature. Then the spin column was discarded and
DNA collected in a micro-centrifuge tube. The eluted DNA was then run on gel to see
whether it was successfully extracted.
3.5.2 Nested PCR for screening T. parva positive samples using p104 gene
All samples were screened for T. parva using a nested polymerase chain reaction (PCR)
assay targeting the 104 kDa antigen (p104) gene (Skilton et al., 2002) The assay was run
in two PCR rounds; the primary and secondary PCR; using outer primers for primary PCR
(For1 ‘5-ATTTAA GGA ACC TGA CGT GAC TGC-3’) and (Rev1 ‘5-TAA GAT GCC
GACTAT TAA TGA CACC-3’), and inner primers for secondary (nested) PCR (For2 ‘5-
GGC CAA GGT CTC CTT CAG AAT ACG-3’) and (Rev2 ‘5-TGGGTG TGT TTC
CTC GTC ATC TGC-3’). Primers were designed based on p104 antigenic gene (Gene
bank M29954).
The primary PCR composed of 6.25 µl Master mix, 3.25 µl nuclease free water, 0.25 µl of
each of the primers (For and Rev) and 2.5 µl of gDNA to have a final volume of 12.5 µl. The
reaction was briefly vortexed and then centrifuged for 1 minute at 14 000 rpm to bring all the
droplets down. The nuclease free water was used as negative control and the DNA sample
known to be T. parva positive from BecA-ILRI Hub sample repository was used as positive
control. The amplification conditions for primary PCR were 95℃ for 1 minute followed by
30 cycles of 95℃ for 1 minute, 60℃ for 1 minute, 72℃ for 1 minute with additional 10
minutes at 72℃ as final extension. The components of the secondary PCR remained the
same as for the primary PCR except the template which was primary PCR products
diluted at 1:10. The amplification conditions were the same except the annealing
temperature and the number of cycles was reduced to 55℃ and 30 cycles, respectively.
All amplifications were done using a programmable thermal cycler (MJ Research,
Watertown, MA, USA). The secondary round PCR products were analyzed by
electrophoresis and run at 100 V for 40 minutes in 1.5% agarose gel.
25
3.5.3 PCR amplification and analysis of mini and microsatellite loci
The nested PCR deploying the outer and inner primers designed by Oura et al. (2003) and
Salih et al. (2018) respectively (Table 2) was performed to amplify each of 1 mini and 2
microsatellites used in the study for each sample that was positive by p104 nested PCR
amplification. The primary PCR amplification was done in 10 µl comprising of 2 µl of 20
ng/µl genomic DNA, 5 µl of Master mix, 0.4 µl of each outer primers at 10 pmole and
2.2 µl of nuclease free water. The nuclease free water was used as negative control and the
DNA sample known to be T. parva positive from BecA-ILRI Hub sample repository was
used as positive control. The cycling conditions for the primary PCR were as follows;
Initial denaturation at 95°C for 5 minutes followed by 35 cycles of denaturation at 94°C for
30 seconds, annealing at 55°C for 1 minute, extension at 72°C for 1 minute plus a final
extension at 72°C for 10 minutes. For the secondary PCR, all other reagents remained the
same except that 0.5 µl of the primary PCR was used as the template and the volume of
water was increased accordingly to give a total of 10µl reaction volume. The cycling
conditions for the secondary PCR were as follows, Initial denaturation at 95℃ for 5
minutes followed by 25 cycles of denaturation at 94°C for 30 seconds, annealing at 58°C for
1 minute, extension at 72°C for 1 minute plus a final extension at 72°C for 20 minutes.
Five microliter of the amplicons were analyzed on a 1.5% agarose gel to check for
amplification success.
Table 2: Panel of mini and microsatellite markers used to genotype T. parva samples used in
this study
Markers Outer nested primers sequence Inner nested primers sequence
MS 7
For
CTCCTCAGCATCCTGCTGCTCATTG
GTTCAGTCCTATGGCAATTCAG
Rev GCGCATGACTGCTTTTACATTAACCC CAAACCTCTTCAAATTCACTCTAGG
ms 5
For
AACACAGTAACTAACCCAGGCC
AATCTTCCAATCCCAACCACATAC
Rev
AACTCCAGCGGAATCCCGAAATA
CCCGAAATAAAACCAAATTCCACC
ms 2
For
AAGTTAGTATCACCACCAGGCTGG
GCCCAATGTACCGAGAATCCTCAC
Rev
GGCTCATCTACCACTCCAACTCC
ATTCTCCGCATTCTCCACCACCTC
26
3.5.4 Agarose gel electrophoresis
PCR products were loaded in 1.5% agarose gels prepared in TAE buffer. The products
were separated at 80 volts for 40 minutes before visualization and documentation on Gel Doc
TM (Bio Rad, USA).
3.5.5 Data analysis
Data were entered and cleaned using Microsoft excel 2016. Vision capt software version
15.0 was used for scoring of allele sizes from gel pictures. GenALEX software version 5
was used to calculate genetic diversity parameters for the entire dataset. This included
determining the number of alleles per locus (A), and expected heterozygosity (He). These
parameters were used to assess the level of polymorphism at each locus and determine
diversity overall and within the sub-populations. Expected heterozygosity was calculated
using the formula for ‘unbiased heterozygosity’ also termed haploid genetic diversity, He
= [n/ (n-1)] [1-∑p2] where n is the number of isolates and p the frequency of each
different allele at a locus. Analysis of molecular variance was used to study the T. parva
population in the study locations by giving the percentage variations between and within
the parasite populations. Principal component analysis ( PCA) was used to investigate the
genetic relationships between the T. parva isolates from different geographical locations
used in the study. Descriptive statistics were computed at 95% Confidence Interval (CI).
Chi-square test was used to determine association between outcome variables (T. parva
carrier state) and categorical variable such as vaccination status and grazing close to the
wildlife interface areas. Statistical significance was determined at p< 0.05.
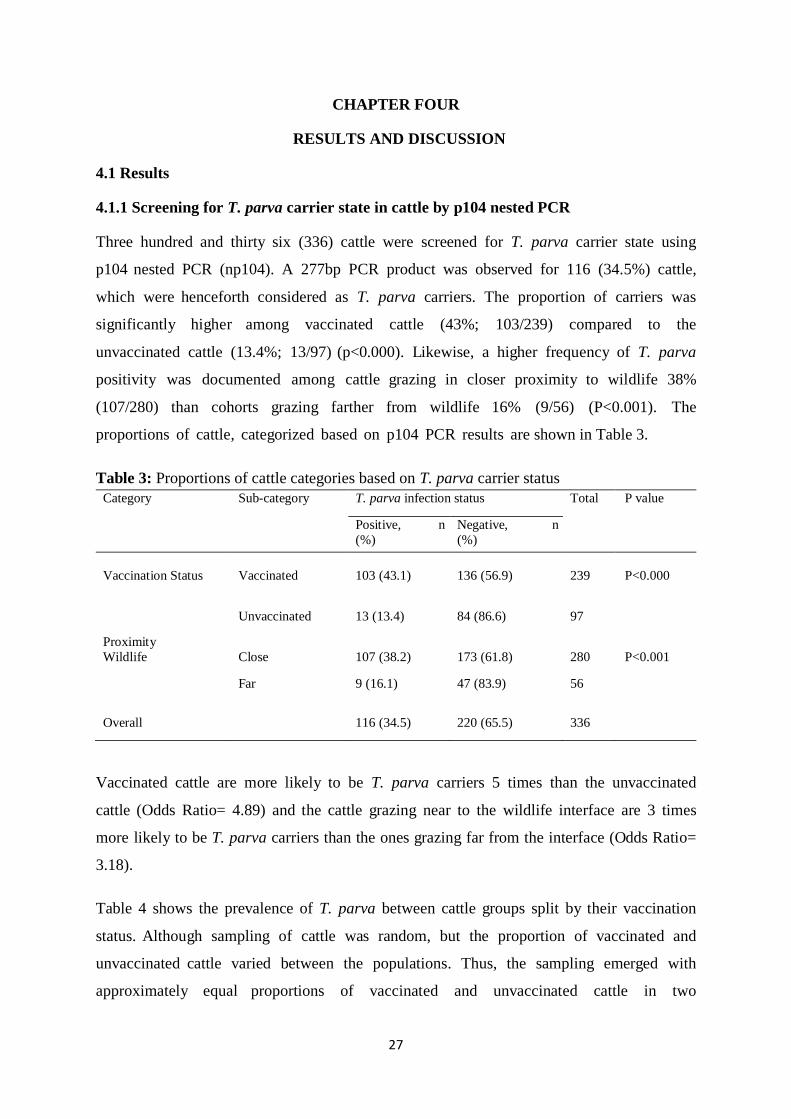
27
CHAPTER FOUR
RESULTS AND DISCUSSION
4.1 Results
4.1.1 Screening for T. parva carrier state in cattle by p104 nested PCR
Three hundred and thirty six (336) cattle were screened for T. parva carrier state using
p104 nested PCR (np104). A 277bp PCR product was observed for 116 (34.5%) cattle,
which were henceforth considered as T. parva carriers. The proportion of carriers was
significantly higher among vaccinated cattle (43%; 103/239) compared to the
unvaccinated cattle (13.4%; 13/97) (p<0.000). Likewise, a higher frequency of T. parva
positivity was documented among cattle grazing in closer proximity to wildlife 38%
(107/280) than cohorts grazing farther from wildlife 16% (9/56) (P<0.001). The
proportions of cattle, categorized based on p104 PCR results are shown in Table 3.
Table 3: Proportions of cattle categories based on T. parva carrier status
Category Sub-category T. parva infection status Total P value
Positive, n
(%)
Negative, n
(%)
Vaccination Status
Vaccinated
103 (43.1)
136 (56.9)
239
P<0.000
Unvaccinated
13 (13.4)
84 (86.6)
97
Proximity
Wildlife
Close
107 (38.2)
173 (61.8)
280
P<0.001
Far 9 (16.1) 47 (83.9) 56
Overall
116 (34.5)
220 (65.5)
336
Vaccinated cattle are more likely to be T. parva carriers 5 times than the unvaccinated
cattle (Odds Ratio= 4.89) and the cattle grazing near to the wildlife interface are 3 times
more likely to be T. parva carriers than the ones grazing far from the interface (Odds Ratio=
3.18).
Table 4 shows the prevalence of T. parva between cattle groups split by their vaccination
status. Although sampling of cattle was random, but the proportion of vaccinated and
unvaccinated cattle varied between the populations. Thus, the sampling emerged with
approximately equal proportions of vaccinated and unvaccinated cattle in two
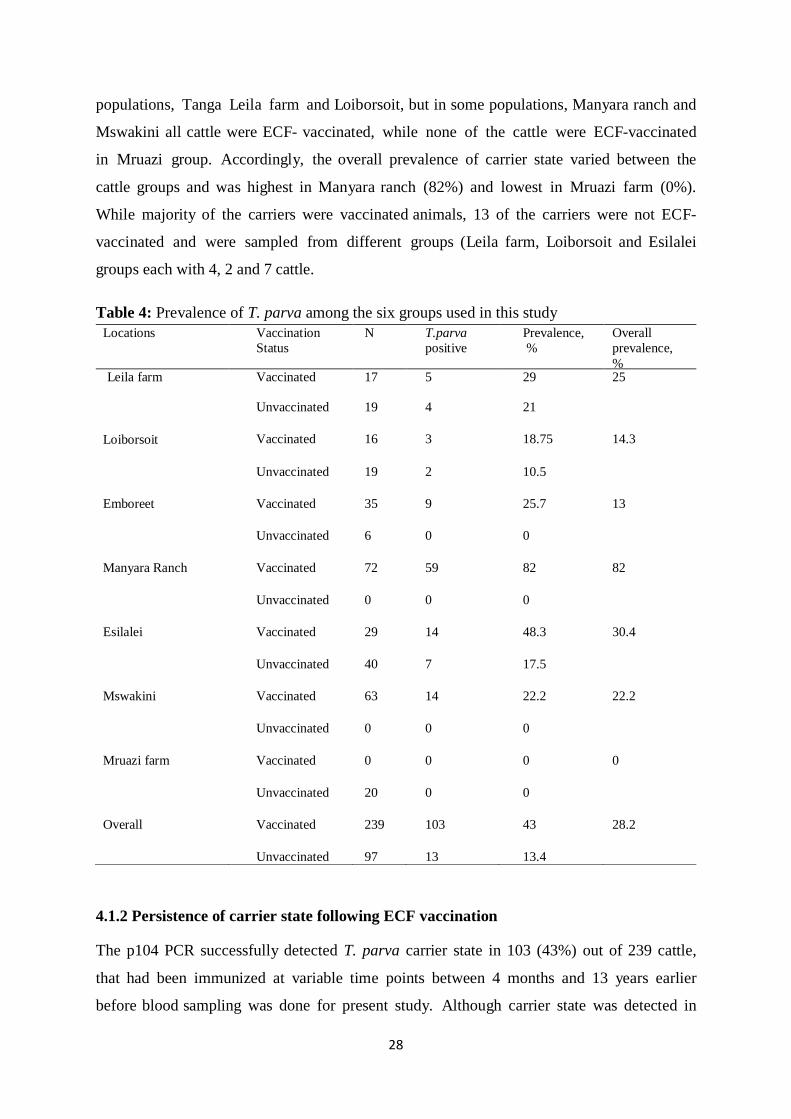
28
populations, Tanga Leila farm and Loiborsoit, but in some populations, Manyara ranch and
Mswakini all cattle were ECF- vaccinated, while none of the cattle were ECF-vaccinated
in Mruazi group. Accordingly, the overall prevalence of carrier state varied between the
cattle groups and was highest in Manyara ranch (82%) and lowest in Mruazi farm (0%).
While majority of the carriers were vaccinated animals, 13 of the carriers were not ECF-
vaccinated and were sampled from different groups (Leila farm, Loiborsoit and Esilalei
groups each with 4, 2 and 7 cattle.
Table 4: Prevalence of T. parva among the six groups used in this study
Locations Vaccination
Status
N T.parva
positive
Prevalence,
%
Overall
prevalence,
% Leila farm Vaccinated 17 5 29 25
Unvaccinated
19
4
21
Loiborsoit
Vaccinated
16
3
18.75
14.3
Unvaccinated
19
2
10.5
Emboreet
Vaccinated
35
9
25.7
13
Unvaccinated
6
0
0
Manyara Ranch
Vaccinated
72
59
82
82
Unvaccinated
0
0
0
Esilalei
Vaccinated
29
14
48.3
30.4
Unvaccinated
40
7
17.5
Mswakini
Vaccinated
63
14
22.2
22.2
Unvaccinated
0
0
0
Mruazi farm
Vaccinated
0
0
0
0
Unvaccinated
20
0
0
Overall
Vaccinated
239
103
43
28.2
Unvaccinated
97
13
13.4
4.1.2 Persistence of carrier state following ECF vaccination
The p104 PCR successfully detected T. parva carrier state in 103 (43%) out of 239 cattle,
that had been immunized at variable time points between 4 months and 13 years earlier
before blood sampling was done for present study. Although carrier state was detected in
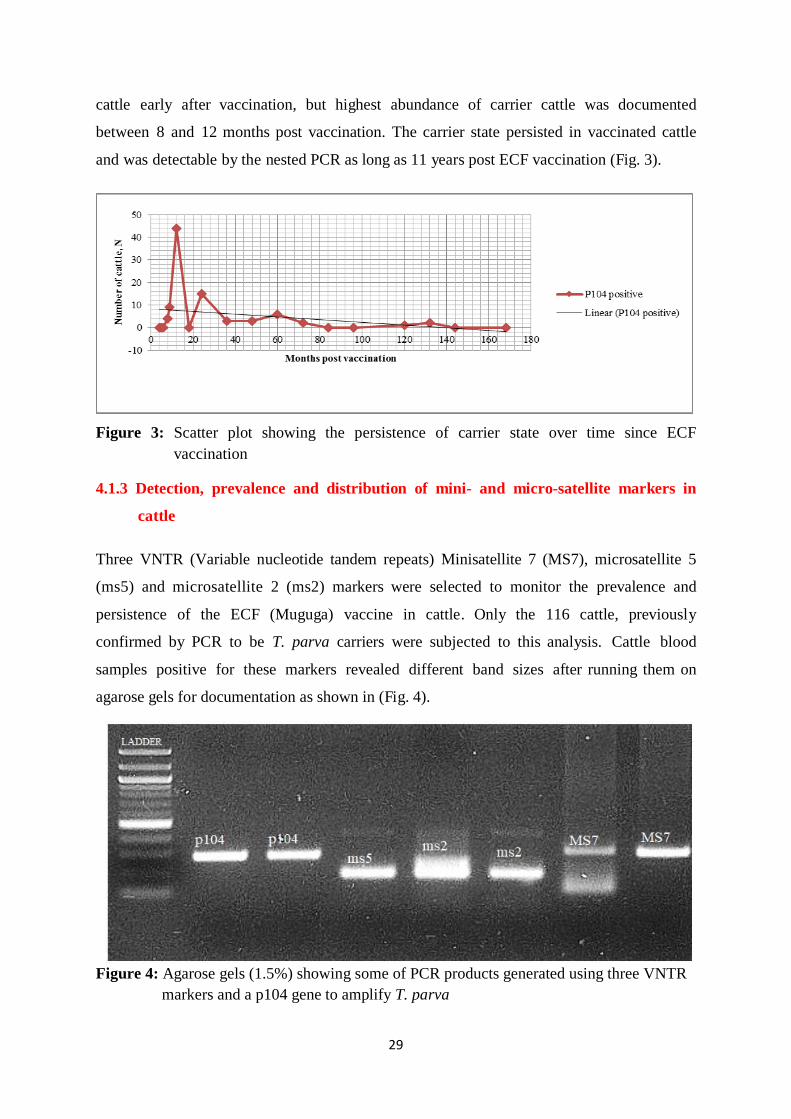
29
cattle early after vaccination, but highest abundance of carrier cattle was documented
between 8 and 12 months post vaccination. The carrier state persisted in vaccinated cattle
and was detectable by the nested PCR as long as 11 years post ECF vaccination (Fig. 3).
Figure 3: Scatter plot showing the persistence of carrier state over time since ECF
vaccination
4.1.3 Detection, prevalence and distribution of mini- and micro-satellite markers in
cattle
Three VNTR (Variable nucleotide tandem repeats) Minisatellite 7 (MS7), microsatellite 5
(ms5) and microsatellite 2 (ms2) markers were selected to monitor the prevalence and
persistence of the ECF (Muguga) vaccine in cattle. Only the 116 cattle, previously
confirmed by PCR to be T. parva carriers were subjected to this analysis. Cattle blood
samples positive for these markers revealed different band sizes after running them on
agarose gels for documentation as shown in (Fig. 4).
Figure 4: Agarose gels (1.5%) showing some of PCR products generated using three VNTR
markers and a p104 gene to amplify T. parva
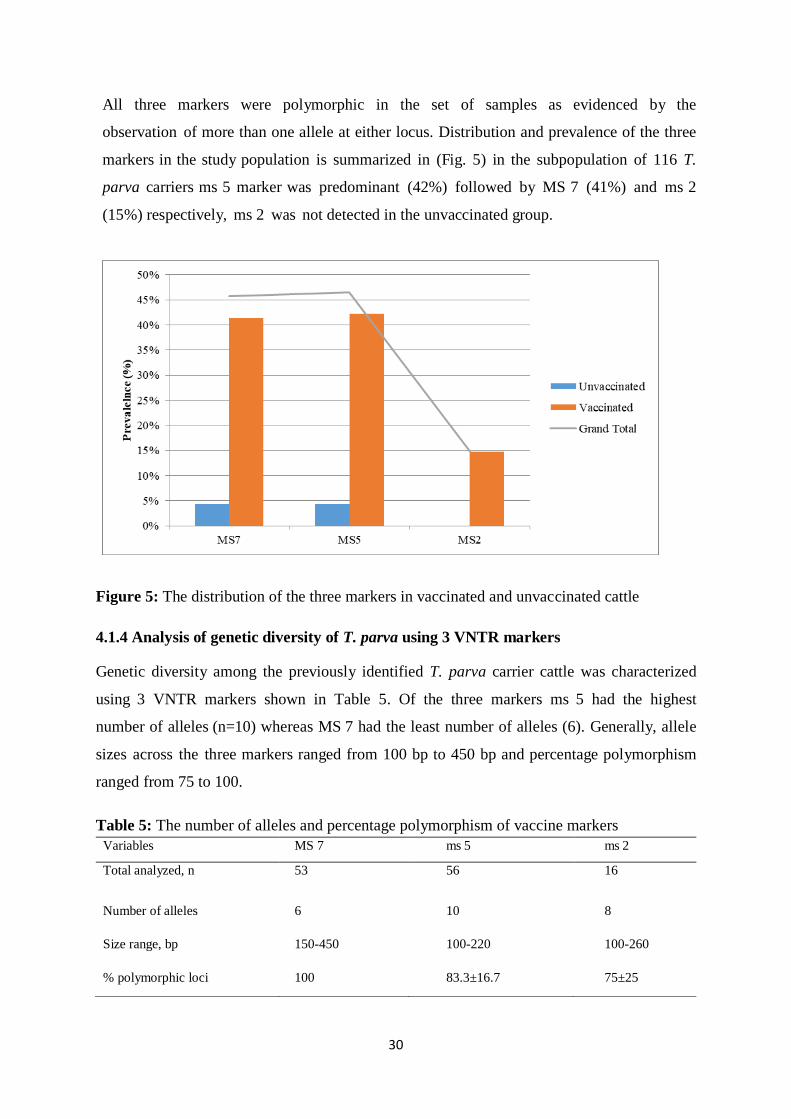
30
All three markers were polymorphic in the set of samples as evidenced by the
observation of more than one allele at either locus. Distribution and prevalence of the three
markers in the study population is summarized in (Fig. 5) in the subpopulation of 116 T.
parva carriers ms 5 marker was predominant (42%) followed by MS 7 (41%) and ms 2
(15%) respectively, ms 2 was not detected in the unvaccinated group.
Figure 5: The distribution of the three markers in vaccinated and unvaccinated cattle
4.1.4 Analysis of genetic diversity of T. parva using 3 VNTR markers
Genetic diversity among the previously identified T. parva carrier cattle was characterized
using 3 VNTR markers shown in Table 5. Of the three markers ms 5 had the highest
number of alleles (n=10) whereas MS 7 had the least number of alleles (6). Generally, allele
sizes across the three markers ranged from 100 bp to 450 bp and percentage polymorphism
ranged from 75 to 100.
Table 5: The number of alleles and percentage polymorphism of vaccine markers
Variables MS 7 ms 5 ms 2
Total analyzed, n 53 56 16
Number of alleles
6
10
8
Size range, bp
150-450
100-220
100-260
% polymorphic loci
100
83.3±16.7
75±25
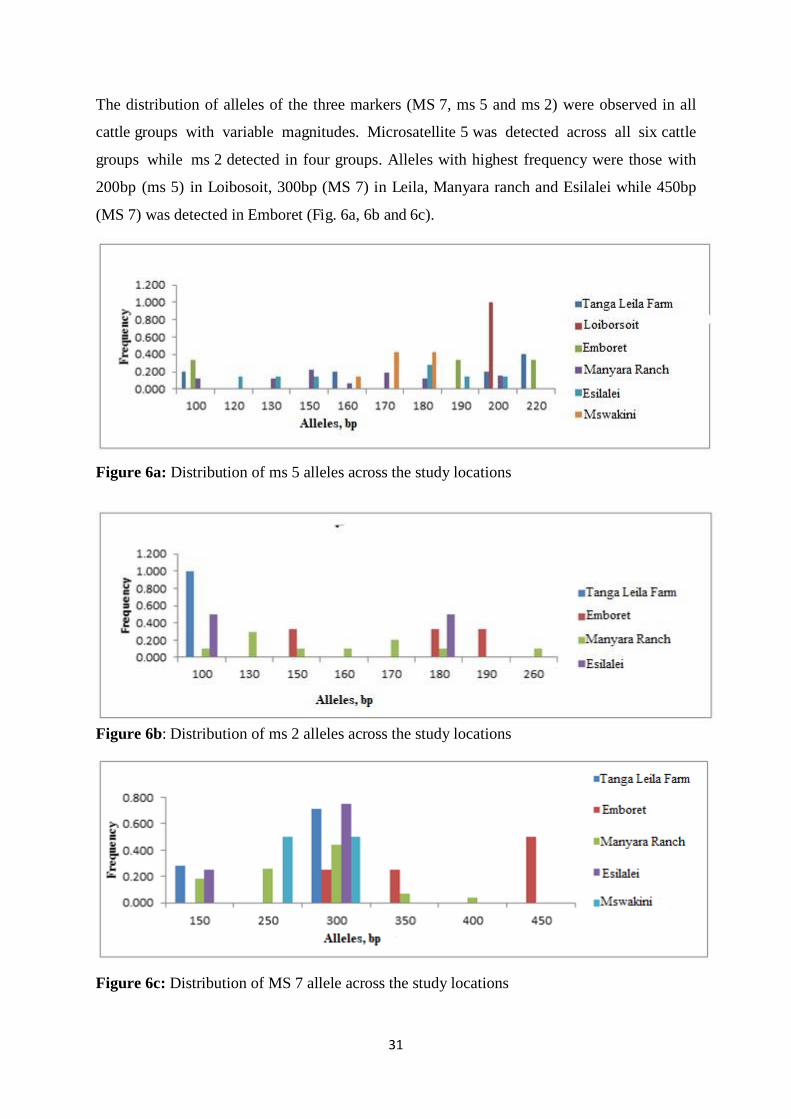
31
The distribution of alleles of the three markers (MS 7, ms 5 and ms 2) were observed in all
cattle groups with variable magnitudes. Microsatellite 5 was detected across all six cattle
groups while ms 2 detected in four groups. Alleles with highest frequency were those with
200bp (ms 5) in Loibosoit, 300bp (MS 7) in Leila, Manyara ranch and Esilalei while 450bp
(MS 7) was detected in Emboret (Fig. 6a, 6b and 6c).
Figure 6a: Distribution of ms 5 alleles across the study locations
Figure 6b: Distribution of ms 2 alleles across the study locations
Figure 6c: Distribution of MS 7 allele across the study locations
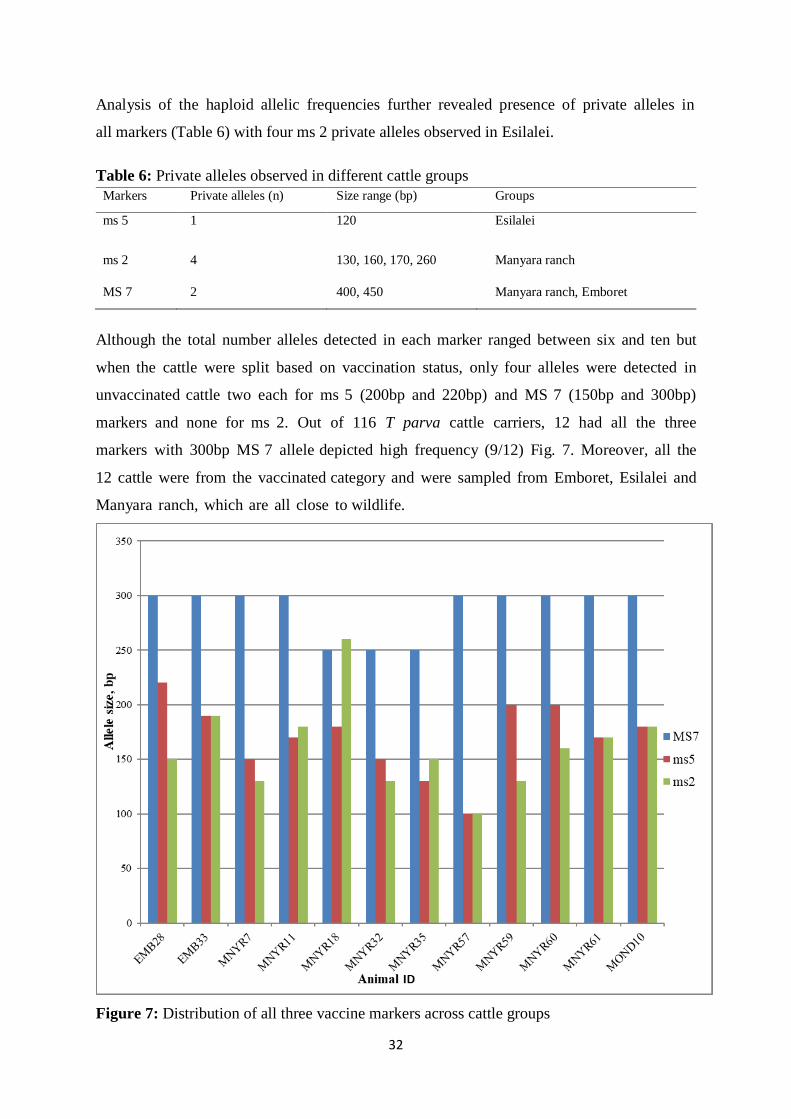
32
Analysis of the haploid allelic frequencies further revealed presence of private alleles in
all markers (Table 6) with four ms 2 private alleles observed in Esilalei.
Table 6: Private alleles observed in different cattle groups
Although the total number alleles detected in each marker ranged between six and ten but
when the cattle were split based on vaccination status, only four alleles were detected in
unvaccinated cattle two each for ms 5 (200bp and 220bp) and MS 7 (150bp and 300bp)
markers and none for ms 2. Out of 116 T parva cattle carriers, 12 had all the three
markers with 300bp MS 7 allele depicted high frequency (9/12) Fig. 7. Moreover, all the
12 cattle were from the vaccinated category and were sampled from Emboret, Esilalei and
Manyara ranch, which are all close to wildlife.
Figure 7: Distribution of all three vaccine markers across cattle groups
Markers Private alleles (n) Size range (bp) Groups
ms 5 1 120 Esilalei
ms 2
4
130, 160, 170, 260
Manyara ranch
MS 7
2
400, 450
Manyara ranch, Emboret
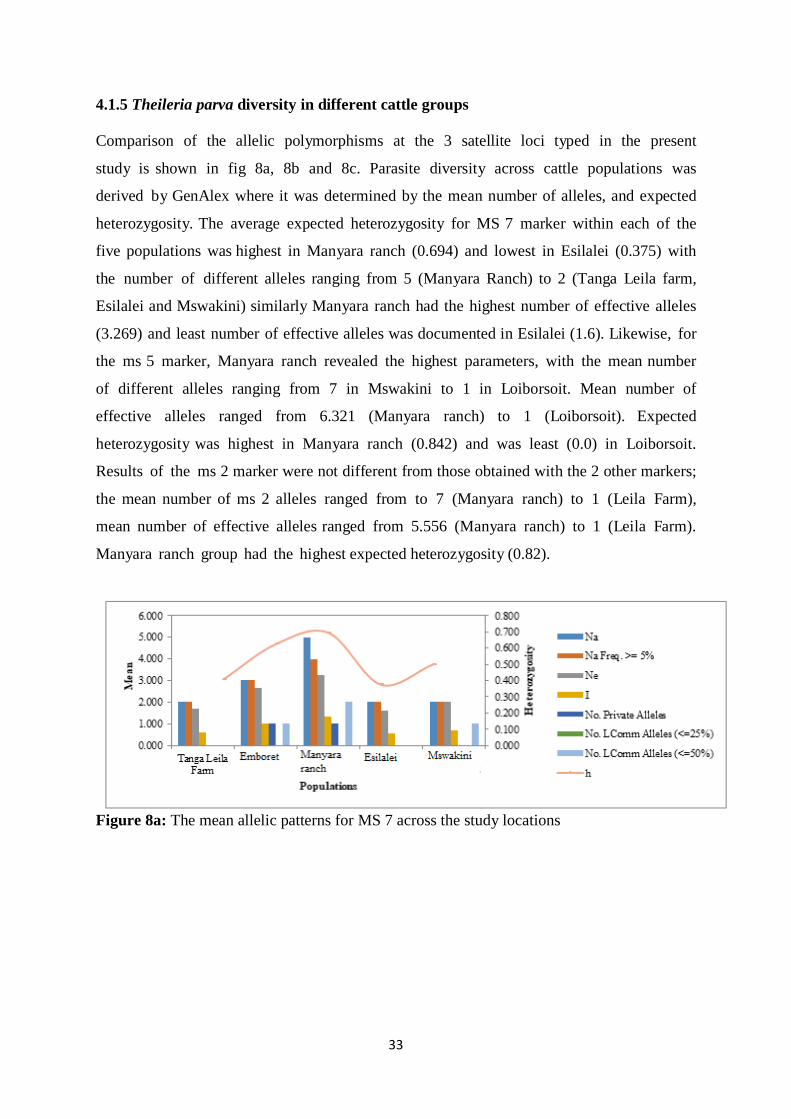
33
4.1.5 Theileria parva diversity in different cattle groups
Comparison of the allelic polymorphisms at the 3 satellite loci typed in the present
study is shown in fig 8a, 8b and 8c. Parasite diversity across cattle populations was
derived by GenAlex where it was determined by the mean number of alleles, and expected
heterozygosity. The average expected heterozygosity for MS 7 marker within each of the
five populations was highest in Manyara ranch (0.694) and lowest in Esilalei (0.375) with
the number of different alleles ranging from 5 (Manyara Ranch) to 2 (Tanga Leila farm,
Esilalei and Mswakini) similarly Manyara ranch had the highest number of effective alleles
(3.269) and least number of effective alleles was documented in Esilalei (1.6). Likewise, for
the ms 5 marker, Manyara ranch revealed the highest parameters, with the mean number
of different alleles ranging from 7 in Mswakini to 1 in Loiborsoit. Mean number of
effective alleles ranged from 6.321 (Manyara ranch) to 1 (Loiborsoit). Expected
heterozygosity was highest in Manyara ranch (0.842) and was least (0.0) in Loiborsoit.
Results of the ms 2 marker were not different from those obtained with the 2 other markers;
the mean number of ms 2 alleles ranged from to 7 (Manyara ranch) to 1 (Leila Farm),
mean number of effective alleles ranged from 5.556 (Manyara ranch) to 1 (Leila Farm).
Manyara ranch group had the highest expected heterozygosity (0.82).
Figure 8a: The mean allelic patterns for MS 7 across the study locations
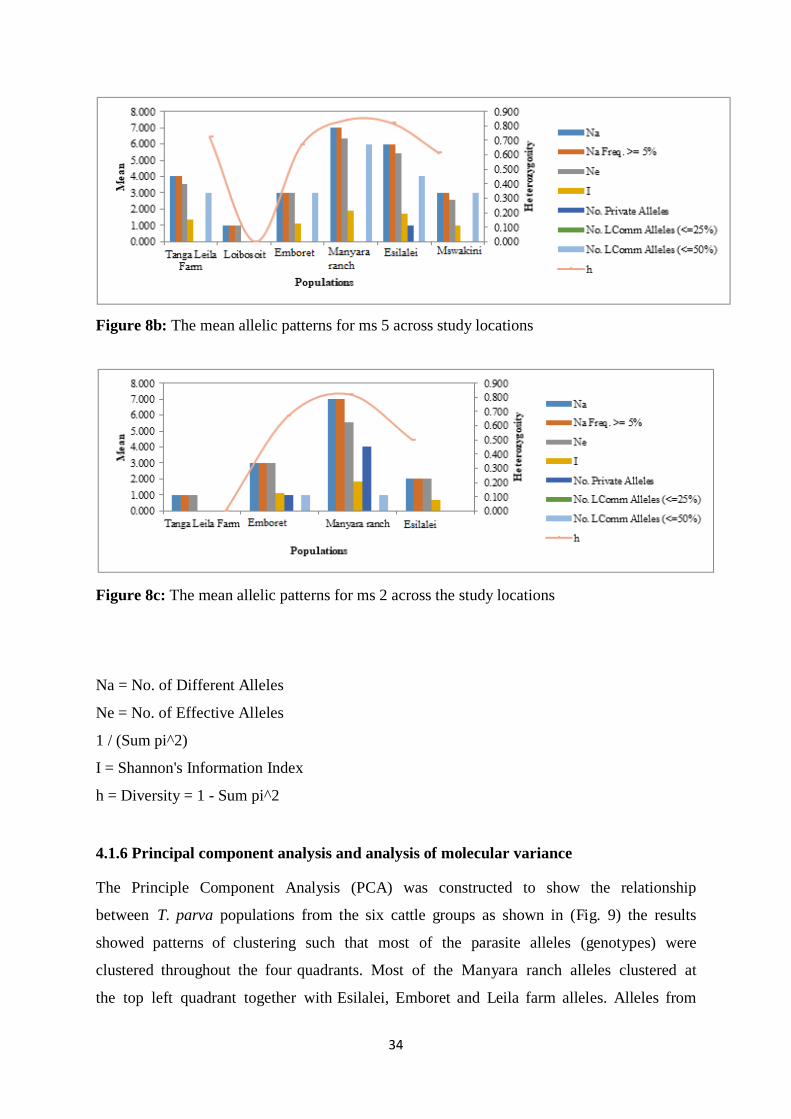
34
Figure 8b: The mean allelic patterns for ms 5 across study locations
Figure 8c: The mean allelic patterns for ms 2 across the study locations
Na = No. of Different Alleles
Ne = No. of Effective Alleles
1 / (Sum pi^2)
I = Shannon's Information Index
h = Diversity = 1 - Sum pi^2
4.1.6 Principal component analysis and analysis of molecular variance
The Principle Component Analysis (PCA) was constructed to show the relationship
between T. parva populations from the six cattle groups as shown in (Fig. 9) the results
showed patterns of clustering such that most of the parasite alleles (genotypes) were
clustered throughout the four quadrants. Most of the Manyara ranch alleles clustered at
the top left quadrant together with Esilalei, Emboret and Leila farm alleles. Alleles from
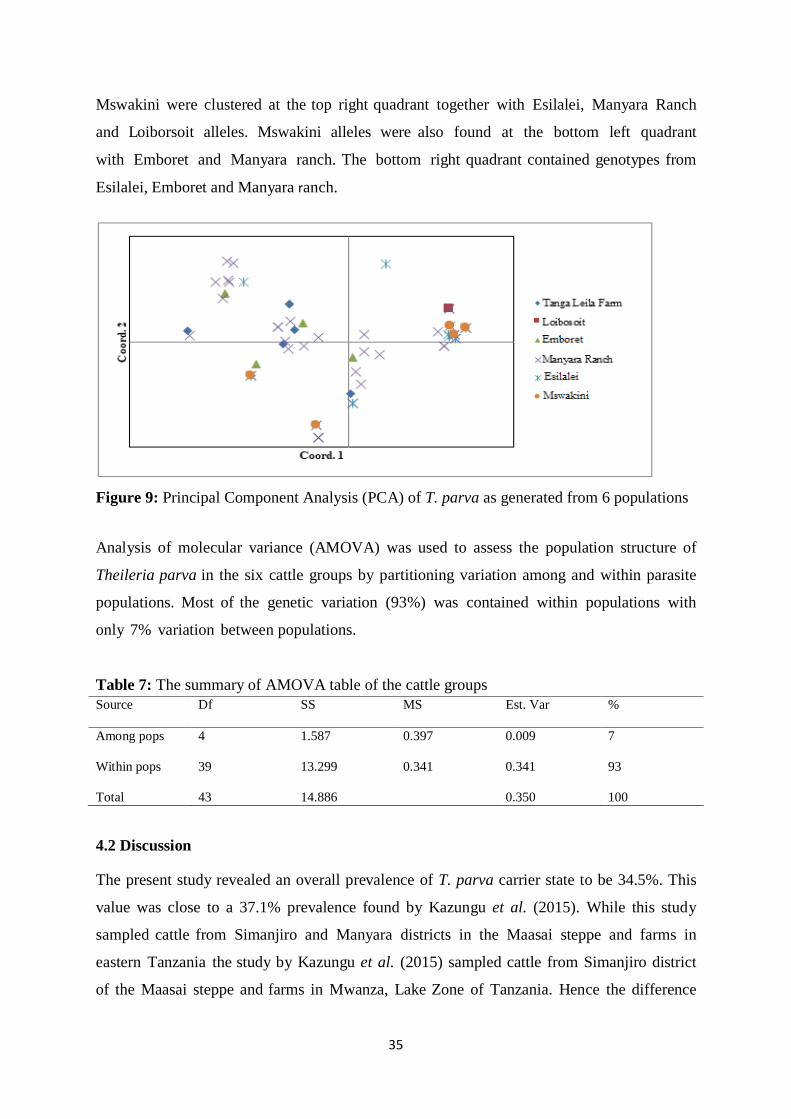
35
Mswakini were clustered at the top right quadrant together with Esilalei, Manyara Ranch
and Loiborsoit alleles. Mswakini alleles were also found at the bottom left quadrant
with Emboret and Manyara ranch. The bottom right quadrant contained genotypes from
Esilalei, Emboret and Manyara ranch.
Figure 9: Principal Component Analysis (PCA) of T. parva as generated from 6 populations
Analysis of molecular variance (AMOVA) was used to assess the population structure of
Theileria parva in the six cattle groups by partitioning variation among and within parasite
populations. Most of the genetic variation (93%) was contained within populations with
only 7% variation between populations.
Table 7: The summary of AMOVA table of the cattle groups
Source Df SS MS Est. Var %
Among pops
4 1.587 0.397 0.009 7
Within pops
39 13.299 0.341 0.341 93
Total 43 14.886 0.350 100
4.2 Discussion
The present study revealed an overall prevalence of T. parva carrier state to be 34.5%. This
value was close to a 37.1% prevalence found by Kazungu et al. (2015). While this study
sampled cattle from Simanjiro and Manyara districts in the Maasai steppe and farms in
eastern Tanzania the study by Kazungu et al. (2015) sampled cattle from Simanjiro district
of the Maasai steppe and farms in Mwanza, Lake Zone of Tanzania. Hence the difference
36
in T. parva prevalence between the two studies is likely due to different tick control regimes
in the different areas. The prevalence of T. parva established in cattle in this study was
higher than a 31.6% prevalence found by Kimaro, Mor, Gwakisa and Toribio (2017) which
was done in Monduli district in the Maasai steppe ecosystem during the dry season. These
differences in prevalence may be explained by the ecological and other associated
conditions which may favor ticks in different areas where cattle were sampled. The study
done by Kimaro et al. (2017) sampled cattle during the dry season which is
characterized with low tick intensity compared to the wet season during which the
present study was conducted. The prevalence values reported in these studies point to a
high possibility that most of the animals sampled were in a T. parva carrier state, which is a
common phenomenon following natural infection or ITM in cattle (Oura et al., 2007; Oura et
al., 2011).
The cattle groups in this study were sampled from divergent ecological conditions and
management regimes for controlling ticks and tick-borne diseases. It was of interest
therefore to compare the cattle groups not only in terms of prevalence of T. parva but also
how the prevalence varies within and between groups, when the cattle are categorized
with respect to whether they were ECF vaccinated or not, longevity of T. parva carrier
state following ECF vaccination and proximity of cattle grazing areas to wildlife interface
areas. Overall a higher T. parva prevalence was clearly shown among cattle that were ECF-
vaccinated (43%) compared to unvaccinated cattle (13.4%). This finding is in full
agreement with the expected norm that ECF vaccination using the live trivalent Muguga
cocktail increases the carrier state of T. parva among cattle. Likewise, a higher T. parva
prevalence was found among cattle which grazed in close proximity to the wildlife
interface. The higher prevalence (38%) of T. parva infection among cattle grazing close to
the wildlife interface areas may be explained by the fact cattle that share grazing areas with
wildlife reservoirs are likely to be under higher exposure to disease vectors and hence
higher T. parva positivity.
In order to get a better understanding of longevity or persistence of carrier state
following ITM under prevailing conditions in the study areas, this study classified all
ECF vaccinated cattle based on their T. parva positivity. All the 43% (103/239) T. parva
positive ECF-vaccinated cattle were further clustered into categories of longevity
(duration) since ECF vaccination. The data showed that carrier state was detected in cattle
37
vaccinated as far as 11 years ago. Comparison of categories of longevity since vaccination
revealed that highest frequency of carriers was at 12 months post vaccination these
results further confirm previous reports by Oura et al. (2007) who detected the carrier state
of T. parva only up to 4 years. The results reported here have taken advantage of
deployment of ITM in the Maasai steppe for at least two decades, and therefore the
availability of older cattle vaccinated up to 14 years earlier has provided a useful resource to
investigate ITM outcomes in ECF endemic areas.
An interesting question arising from this study was whether the carrier state can be
differentiated between ECF vaccinated cattle and those that may have recovered from
natural ECF infection. Three VNTR markers, which are constituent components of the
Muguga cocktail, were used to monitor carrier state in T. parva positive ECF unvaccinated
(n=13) cattle. It emerged that 76.9% of this group carried the Muguga vaccine markers (MS
7 and ms 5) indicating that vaccine strains are transmissible to the unvaccinated cattle. Since
majority of these cattle belonged to one farm (Leila farm) it may likely be that this is a
result of management conditions supporting the transmission of vaccine strains from
vaccinated to unvaccinated cattle. This study showed that two of the three vaccine markers
(MS 7 and ms 5) were detected in unvaccinated cattle. Although the ms 2 marker was not
detected it is uncertain whether this was due to small sample size used in the present work or
rather, this study further supports previous findings by Oura et al. (2007) where he
showed evidence of transmission of some and not all Muguga vaccine components.
The implication of long-term deployment of the ITM, as is the case in northern Tanzania, has not
been investigated. Prior to this study, it was hypothesized that long term application of ITM may
influence parasite biology, alter genetic diversity of local strains and hence impact on disease
dynamics in endemic areas. Although ITM has been employed to protect cattle against ECF in the
Maasai herds since 1990s (Di Giulio et al., 2009) no study has preceded this one to investigate T.
parva genetic diversity in Tanzania. Genotyping of the T. parva positive samples using the three
VNTR markers allowed to unravel the genetic diversity of T. parva in cattle from different
locations. The extent of polymorphism varied between the three markers, whereas ms 5 was most
polymorphic and MS 7 was least.
Higher genetic diversity was observed among ECF vaccinated cattle compared to
unvaccinated cattle. Thus, the 24 alleles across the three markers were all detected with
varying frequencies among vaccinated cattle, but only 4 of these were found in
38
unvaccinated cattle. It is probable that vaccinated cattle would harbor more alleles due to
recombination of the local strains with vaccine strains; another explanation for this
finding may be due to the ability of the carrier cattle acquiring infection with additional
parasite genotypes following tick challenge, thus resulting in carriage of mixed genotypes.
This can be used to support the finding that the Manyara ranch group, found at the
ecological epicenter of the wildlife interface within the Maasai steppe had the highest
mean number of different alleles, effective alleles, expected heterozygosity and private
alleles.
While majority of the alleles were shared by individuals from different groups, this study
found seven private alleles, each of which was found only in one or the other group.
Interestingly all of the private alleles were detected only in vaccinated cattle grazing close to
the wildlife interface. The actual mechanisms supporting existence of private alleles are not
fully understood but these findings may be ascribed to the notion that the Muguga vaccine is
tri-valent, with a multitude of parasite genotypes (Oura et al., 2007; Patel et al., 2011).
In order to gain insight in the population diversity of T. parva circulating in the different
cattle groups the principle component analysis (PCA) was used. Results revealed different
clustering patterns, with most of the alleles clustering together throughout all the four
quadrants. The PCA findings strongly suggest the T. parva parasites homogeneity among
the cattle groups and the absence of a clear association between population genetic
structure and the geographical origin of the isolates. Furthermore, analysis of molecular
variance revealed higher genetic variations within individual isolates (97%) compared to
within T. parva populations (3%). One possible explanation to this finding is the
occurrence of a high rate of crossing between different T. parva isolates and recombination
within the parasite population hence the lower diversity within the T. parva populations.
This was somehow surprising considering that cattle groups sampled from Tanga (eastern
Tanzania) were expected to carry distinct satellite alleles, separate from thosefound in
cattle from the Maasai steppe (northern Tanzania). It is possible that uncontrolled cattle
movements between the different regions in Tanzania may have contributed to the similarity
of the parasite genotypes.
The use of ITM in Tanzania has been increasing gradually since 1998 (Di Giulio et al.,
2009; Martins et al., 2010). This served as one of the motives for the present study
in order to understand implications of the long term deployment of ITM for over 20
39
years in the Maasai areas, Thus the study has brought forth clear findings showing that the
carrier state induced by Muguga cocktail vaccine is effective and it induces a long lasting
immunity detectable up to 11 years post vaccination something which hitherto has not been
reported. Furthermore, results of this study have allowed to deduce the questionable
viewpoint on the spreading of the vaccine strains to the unvaccinated cattle via tick
vectors. In this study, no ticks were investigated, notwithstanding it was clearly
demonstrated that two of the three vaccine markers were detected in several co-grazing
unvaccinated cattle. These findings corroborate previous reports by Olds et al. (2018).
A significant finding emanating from this study is that vaccination against ECF has an
influence on the diversity of T. parva parasites, whereby greater number of alleles were
shown in the vaccinated cattle compared to the unvaccinated cattle. It was speculated that
the enhancement of diversity is a direct outcome of the live vaccination process in the
field, whereby the vaccine strains may potentially recombine with local strains to
generate more genotypes. It may be speculated that wider T. parva diversity plays a
significant role to restrict breakthrough infections in the vaccinated cattle, as was observed
during the conduct of this study, whereby no clinical ECF cases were encountered among
sampled cattle. The study took into consideration separate ecological and geographical
locations from where the samples were collected. Interestingly, analysis of T. parva
populations revealed that geographical separation did not necessarily imply differences in the
genetic structure of T. parva populations.
Summing up, majority of the cattle investigated in this study were sampled from wildlife
interface areas. Such areas support constant interaction between cattle, wildlife reservoirs,
tick vectors and the parasites. Ecological pressure in such an interface presumably drive
the establishment of a carrier state in cattle differently as it would happen in cattle
populations grazed far from wildlife. Therefore, the role of the wildlife interface on the
diversity of T. parva may not be negated, as highest parasite diversity shown in this study
was among ECF vaccinated cattle found in close proximity to wildlife interface.
40
CHAPTER FIVE
CONCLUSION AND RECOMMENDATIONS
5.1 Conclusion
This study was conducted in seven different locations to study the prevalence, persistence
and diversity of T. parva in cattle vaccinated against East Coast Fever using the p104 gene
and three different VNTR markers (Minisatellite 7, microsatellite 2 and 5). The results
suggest that ITM can indeed provide a lifelong immunity since there was vaccine markers
detection in the vaccinated cattle up to 11 years post vaccination. Vaccinated cattle and the
ones grazing close to the wildlife interface had higher prevalence of the carrier state. There
was detection of vaccine markers in the unvaccinated cattle which shows the role of ticks
in transmission of T. parva parasites among the co grazing animals. Vaccination against
ECF has an influence of T. parva diversity as a greater number of alleles was detected in
the vaccinated cattle compared to the co grazing unvaccinated cattle. Wildlife interface areas
and uncontrolled cattle movement increases the T. parva diversity as the highest diversity
was from areas close to the wildlife. Moreover, there was a similarity in the circulating T.
parva strains among the different geographical locations used in this study, as there was
sharing of some alleles among the different cattle populations. The carrier state was
observed in only 43% of the vaccinated cattle and it decreases with time due to clearance of
the parasites by the cattle adaptive immunity. However no breakthrough infections were
observed throughout the study therefore it cannot be concluded whether the ITM vaccination
should be done routinely or just once.
5.2 Recommendations
Basing on the finding that ITM causes a long life immunity detected up to 11 years post
vaccination and evidence of recombination between vaccine strains and local T. parva strains
and the higher parasite diversity established in the cattle grazing close to the wildlife interface
areas and in vaccinate cattle I strongly recommend the following;
(i) Pastoralists to focus more on the use of ITM to prevent ECF due to the protective
nature of the carrier state induced by it and the long-lasting immunity provided.
(ii) Pastoralists should vaccinate all of their cattle not just a portion of them as it is a
common practice among them, this contributed to the lower prevalence of carrier
state in the unvaccinated cattle. The cause of this maybe be due to the costly nature
of the Muguga cocktail vaccine costing from 6 dollars to 10 dollars per animal
41
depending on the animal’s size making it hard for them to afford it. Although
natural infection can also cause the carrier state but it may not be as effective and
long lasting as the one caused by ITM. Vaccination of a larger proportion or all of
their herds would increase the protective effect resulted from the carrier state.
(iii) Co-grazing of the vaccinated and unvaccinated cattle should also be avoided as
this contributes to the diversity of the T. parva strains due to the recombination of the
vaccine derived and local strains. Therefore, pastoralists should separate their
vaccinated cattle from the unvaccinated ones
(iv) Pastoralists should control the cattle movement and avoid grazing of cattle near to
the wildlife interface areas as these areas have shown to increases the diversity of
the T. parva. Therefore, they should avoid the interaction of the cattle with the
buffalos which are the main reservoirs of T. parva harboring more divergent strains of
T. parva.
Further studies should be done on ticks to identify whether the T. parva strains circulating in
them are similar to the ones found in the cattle
42
REFERENCES
Baylis, H. A., Allsopp, B. A., Hall, R., & Carrington, M. (1993). Characterisation of a
glutamine-and proline-rich protein (QP protein) from Theileria parva. Molecular and
Biochemical Parasitology, 61(2), 171–178.
Bazarusanga, T., Vercruysse, J., Marcotty, T., & Geysen, D. (2007). Epidemiological studies
on Theileriosis and the dynamics of Theileria parva infections in Rwanda. Veterinary
Parasitology, 143(3), 214–221.
Bishop, R., Geysen, D., Spooner, P., Skilton, R., Nene, V., Dolan, T., & Morzaria, S. (2001).
Molecular and immunological characterisation of Theileria parva stocks which are
components of the ‘Muguga cocktail’used for vaccination against East Coast Fever in
cattle. Veterinary Parasitology, 94(4), 227–237.
Bishop, R., Musoke, A., Morzaria, S., Gardner, M., & Nene, V. (2004). Theileria:
intracellular protozoan parasites of wild and domestic ruminants transmitted by ixodid
ticks. Parasitology, 129(S1), S271--S283.
Bishop, R. P., Hemmink, J. D., Morrison, W. I., Weir, W., Toye, P. G., Sitt, T., & Odongo,
D.O. (2015). The African buffalo parasite Theileria. sp. (buffalo) can infect and
immortalize cattle leukocytes and encodes divergent orthologues of Theileria parva
antigen genes. International Journal for Parasitology: Parasites and Wildlife, 4(3),
333–342.
Bishop, R. P., Spooner, P. R., Kanhai, G. K., Kiarie, J., Latif, A. A., Hove, T., & Dolan, T. T.
(1994). Molecular characterization of Theileria parasites, application to the
epidemiology of theileriosis in Zimbabwe. Parasitology, 109(5), 573–581.
Connelley, T. K., MacHugh, N. D., Pelle, R., Weir, W., & Morrison, W. I. (2011). Escape
from CD8+ T cell response by natural variants of an immunodominant epitope from
Theileria parva is predominantly due to loss of TCR recognition. The Journal of
Immunology, 1102009.
Cunningham, M. P., Brown, C. G. D., Burridge, M. J., Musoke, A. J., Purnell, R. E., Radley,
D. E., & Sempebwa, C. (1974). East Coast Fever: titration in cattle of suspensions of
Theileria parva derived from ticks. British Veterinary Journal, 130(4), 336–345.
43
De Deken, R., Martin, V., Saido, A., Madder, M., Brandt, J., & Geysen, D. (2007). An
outbreak of East Coast Fever on the Comoros, A consequence of the import of
immunised cattle from Tanzania? Veterinary Parasitology, 143(3), 245–253.
Di Giulio, G., Lynen, G., Morzaria, S., Oura, C., & Bishop, R. (2009). Live immunization
against East Coast Fever--current status. Trends in Parasitology, 25(2), 85–92.
Dolan, T. T. (1986). Chemotherapy of East Coast Fever: the long term weight changes,
carrier state and disease manifestations of parvaquone treated cattle. Journal of
Comparative Pathology, 96(2), 137–146.
Elisa, M., Hasan, S. D., Moses, N., Elpidius, R., Skilton, R., & Gwakisa, P. (2015). Genetic
and antigenic diversity of Theileria parva in cattle in eastern and southern zones of
Tanzania. A study to support control of East Coast Fever. Parasitology, 142(5), 698–
705.
Gardner, M. J., Bishop, R., Shah, T., De Villiers, E. P., Carlton., & J. M., Hall, (2005).
Genome sequence of Theileria parva, a bovine pathogen that transforms lymphocytes.
Science, 309(5731), 134–137.
Georges, K., Loria, G. R., Riili, S., Greco, A., Caracappa, S., Jongejan, F., & Sparagano, O.
(2001). Detection of haemoparasites in cattle by reverse line blot hybridization with a
note on the distribution of ticks in Sicily. Veterinary Parasitology, 99(4), 273–286.
Geysen, D., Bazarusanga, T., Brandt, J., & Dolan, T. T. (2004). An unusual mosaic structure
of the PIM gene of Theileria parva and its relationship to allelic diversity. Molecular
and Biochemical Parasitology, 133(2), 163–173.
Geysen, D., Bishop, R., Skilton, R., Dolan, T. T., & Morzaria, S. (1999). Molecular
epidemiology of Theileria parva in the field. Tropical Medicine & International
Health, 4(9), A21--A27.
Hayashida, K., Hara, Y., Abe, T., Yamasaki, C., Toyoda, A., & Kosuge, T. (2012).
Comparative genome analysis of three eukaryotic parasites with differing abilities to
transform leukocytes reveals key mediators of Theileria-induced leukocyte
transformation. MBio, 3(5), e00204--12.
44
Hemmink, J. D., Weir, W., MacHugh, N. D., Graham, S. P., Patel, E., Paxton, E., & Pelle, R.
(2016). Limited genetic and antigenic diversity within parasite isolates used in a live
vaccine against Theileria parva. International Journal for Parasitology, 46(8), 495–
506.
Henson, S., Bishop, R. P., Morzaria, S., Spooner, P. R., Pelle, R., & Poveda, L. (2012). High-
resolution genotyping and mapping of recombination and gene conversion in the
protozoan Theileria parva using whole genome sequencing. BMC Genomics, 13(1),
503.
Homewood, K., Trench, P., Randall, S., Lynen, G., & Bishop, B. (2006). Livestock health
and socio-economic impacts of a veterinary intervention in Maasai land: infection-and-
treatment vaccine against East Coast Fever. Agricultural Systems, 89(2), 248–271.
Iams, K. P., Young, J. R., Nene, V., Desai, J., Webster, P., & Musoke, A. J. (1990).
Characterisation of the gene encoding a 104-kilodalton micronemerhoptry protein of
Theileria parva. Molecular and Biochemical Parasitology, 39(1), 47–60.
Kariuki, D. P., Young, A. S., Morzaria, S. P., Lesan, A. C., Mining, S. K., Omwoyo, P., &
Molyneux, D. H. (1995). Theileria parva carrier state in naturally infected and
artificially immunised cattle. Tropical Animal Health and Production, 27(1), 15–25.
Katende, J., Morzaria, S., Toye, P., Skilton, R., Nene, V., Nkonge, C., & Musoke, A. (1998).
An enzyme-linked immunosorbent assay for detection of Theileria parva antibodies in
cattle using a recombinant polymorphic immunodominant molecule. Parasitology
Research, 84(5), 408–416.
Katzer, F., Ngugi, D., Schnier, C., Walker, A. R., & McKeever, D. J. (2007). Influence of
host immunity on parasite diversity in Theileria parva. Infection and Immunity, 75(10),
4909– 4916.
Kazungu, Y. E. M., Mwega, E., Kimera, S. I., & Gwakisa, P. (2015). Seroprevalence and
carrier state of Theileria parva in cattle under two tick control regimes in small-holder
farming systems of Tanzania. Livestock Research for Rural Development, 27(6), 2015.
45
Kimaro, E. G., Mor, S. M., Gwakisa, P., & Toribio, J. A. (2017). Seasonal occurrence of
Theileria parva infection and management practices amongst Maasai pastoralist
communities in Monduli District, northern Tanzania. Veterinary Parasitology, 246(2),
43–52.
Latif, A. A., Hove, T., Kanhai, G. K., Masaka, S., & Pegram, R. G. (2001). Epidemiological
observations of Zimbabwean theileriosis: Disease incidence and pathogenicity in
susceptible cattle during Rhipicephalus appendiculatus nymphal and adult seasonal
activities. Onderstepoort Journal of Veterinary Research, 68(3), 187–195.
Malak, A. K., Mpoke, L., Banak, J., Muriuki, S., Skilton, R. A., Odongo, D., & Kiara, H.
(2012). Prevalence of livestock diseases and their impact on livelihoods in Central
Equatoria State, southern Sudan. Preventive Veterinary Medicine, 104(3), 216–223.
Martins, S. B., Di Giulio, G., Lynen, G., Peters, A., & Rushton, J. (2010). Assessing the
impact of East Coast Fever immunisation by the infection and treatment method in
Tanzanian pastoralist systems. Preventive Veterinary Medicine, 97(3), 175–182.
Mbizeni, S., Potgieter, F. T., Troskie, C., Mans, B. J., Penzhorn, B. L., & Latif, A. A. (2013).
Field and laboratory studies on Corridor disease (Theileria parva infection) in cattle
population at the livestock/game interface of uPhongolo-Mkuze area, South Africa.
Ticks and Tick-Borne Diseases. 4(3), 227–234.
McHardy, N., Wekesa, L. S., Hudson, A. T., & Randall, A. W. (1985). Antitheilerial activity
of BW720C (buparvaquone): a comparison with parvaquone. Research in Veterinary
Science, 39(1), 29–33.
McKeever, D. J. (2007). Live immunisation against Theileria parva: containing or spreading
the disease? Trends in Parasitology, 23(12), 565–568.
McKeever, D. J. (2009). Bovine immunity a driver for diversity in Theileria parasites?
Trends in Parasitology, 25(6), 269–276.
McLeod, R., & Kristjanson, P. (1999). Tick cost: economic impact of ticks and TBD to
livestock in Africa, Asia and Australia. International Livestock Research Institute
(ILRI), Nairobi, Kenya.
46
Minami, T., Spooner, P. R., Irvin, A. D., Ocama, J. G., Dobbelaere, D. A., & Fujinaga, T.
(1983). Characterisation of stocks of Theileria parva by monoclonal antibody profiles.
Research in Veterinary Science, 35(3), 334–340.
Morzaria, S. P., Spooner, P., Bishop, R., & Mwaura, S. (1997). The Preparation of a
Composite Stabliate for Immunization against East Coast Fever.
Muleya, W., Namangala, B., Simuunza, M., Nakao, R., Inoue, N., Kimura, T., & Sawa, H.
(2012). Population genetic analysis and sub-structuring of Theileria parva in the
northern and eastern parts of Zambia. Parasites & Vectors, 5(1), 255.
Nene, V., Kiara, H., Lacasta, A., Pelle, R., Svitek, N., & Steinaa, L. (2016). The biology of
Theileria parva and control of East Coast Fever--current status and future trends. Ticks
and Tick-Borne Diseases, 7(4), 549–564.
Nene, V., & Morrison, W. I. (2016). Approaches to vaccination against Theileria parva and
Theileria annulata. Parasite Immunology, 38(12), 724–734.
Nene, V., Musoke, A., Gobright, E., & Morzaria, S. (1996). Conservation of the sporozoite
p67 vaccine antigen in cattle-derived Theileria parva stocks with different cross-
immunity profiles. Infection and Immunity, 64(6), 2056–2061.
Norval, R. A. I., Perry, B. D., & Young, A. S. (1992). The epidemiology of theileriosis in
Africa ILRI (aka ILCA and ILRAD)
Odongo, N. E., AlZahal, O., Lindinger, M. I., Duffield, T. F., Valdes, E. V, Terrell, S. P., &
McBride, B. W. (2006). Effects of mild heat stress and grain challenge on acid-base
balance and rumen tissue histology in lambs. Journal of Animal Science, 84(2), 447–
455.
Olds, C. L., Mason, K. L., & Scoles, G. A. (2018). Rhipicephalus appendiculatus ticks
transmit Theileria parva from persistently infected cattle in the absence of detectable
parasitemia: implications for East Coast Fever epidemiology. Parasites & Vectors,
11(1), 126.
47
Oura, C. A. L., Asiimwe, B. B., Weir, W., Lubega, G. W., & Tait, A. (2005). Population
genetic analysis and sub-structuring of Theileria parva in Uganda. Molecular and
Biochemical Parasitology, 140(2), 229–239.
Oura, C. A. L., Bishop, R., Asiimwe, B. B., Spooner, P., Lubega, G. W., & Tait, A. (2007).
Theileria parva live vaccination: parasite transmission, persistence and heterologous
challenge in the field. Parasitology, 134(9), 1205–1213.
Oura, C. A. L., Bishop, R., Wampande, E. M., Lubega, G. W., & Tait, A. (2004). The
persistence of component Theileria parva stocks in cattle immunized with the ‘Muguga
cocktail’live vaccine against East Coast Fever in Uganda. Parasitology, 129(1), 27–42.
Oura, C. A. L., Odongo, D. O., Lubega, G. W., Spooner, P. R., Tait, A., & Bishop, R. P.
(2003). A panel of microsatellite and minisatellite markers for the characterisation of
field isolates of Theileria parva. International Journal for Parasitology, 33(14), 1641–
1653.
Oura, C. A. L., Tait, A., Asiimwe, B., Lubega, G. W., & Weir, W. (2011). Theileria parva
genetic diversity and haemoparasite prevalence in cattle and wildlife in and around
Lake Mburo National Park in Uganda. Parasitology Research, 108(6), 1365–1374.
Patel, E. H., Lubembe, D. M., Gachanja, J., Mwaura, S., Spooner, P., & Toye, P. (2011)
Molecular characterization of live Theileria parva sporozoite vaccine stabilates reveals
extensive genotypic diversity. Veterinary Parasitology, 179(1–3), 62–68.
Pelle, R., Graham, S. P., Njahira, M. N., Osaso, J., Saya, R. M., & Odongo, D. O. (2011).
Two Theileria parva CD8 T cell antigen genes are more variable in buffalo than cattle
parasites, but differ in pattern of sequence diversity. PLoS One, 6(4), e19015.
Perry, B. D. (2016). The control of East Coast Fever of cattle by live parasite vaccination: A
science-to-impact narrative. One Health, 2, 103–114.
Radley, D. E., Young, A. S., Brown, C. G. D., Burridge, M. J., Cunningham, M. P., Musisi,
F. L., & Purnell, R. E. (1975). East Coast Fever: 2. Cross-immunity trials with a Kenya
strain of Theileria lawrencei. Veterinary Parasitology, 1(1), 43–50.
48
Radley, D. E., Young, A. S., Grootenhuis, J. G., Cunningham, M. P., Dolan, T. T., &
Morzaria, S. P. (1979). Further studies on the immunization of cattle against Theileria
lawrencei by infection and chemoprophylaxis. Veterinary Parasitology, 5(2–3),
117128.
Ruheta, M. R. (1999). Strategic Dipping Post ECF Immunisation by Infection and Treatment
Method in Tanzania. Centre for Tropical Veterinary Medicine, University of
Edinburgh.
Rukambile, E., Machuka, E., Njahira, M., Kyalo, M., Skilton, R., Mwega, E., & Salih, D.
(2016). Population genetic analysis of Theileria parva isolated in cattle and buffaloes in
Tanzania using minisatellite and microsatellite markers. Veterinary Parasitology, 224,
20–26.
Salih, D. A., Mwacharo, J. M., Pelle, R., Njahira, M. N., Odongo, D. O., Mbole., & Kariuki,
M. N. (2018). Genetic diversity and population structure of Theileria parva in South
Sudan. Ticks and Tick-Borne Diseases, 9(4), 806–813.
Sibeko, K. P., Collins, N. E., Oosthuizen, M. C., Troskie, M., Potgieter, F. T., Coetzer, J. A.
W., & Geysen, D. (2011). Analyses of genes encoding Theileria parva p104 and
polymorphic immunodominant molecule (PIM) reveal evidence of the presence of
cattle-type alleles in the South African T. parva population. Veterinary Parasitology,
181(2–4), 120–130.
Sibeko, K. P., Geysen, D., Oosthuizen, M. C., Matthee, C. A., Troskie, M., Potgieter, F. T., &
Collins, N. E. (2010). Four p67 alleles identified in South African Theileria parva field
samples. Veterinary Parasitology, 167(2–4), 244–254.
Sibeko, K. P. (2009). Improved molecular diagnostics and characterization of Theileria
parva isolates from cattle and buffalo in South Africa. University of Pretoria.
Sitt, T., Poole, E. J., Ndambuki, G., Mwaura, S., Njoroge, T., & Omondi, G. P. (2015).
Exposure of vaccinated and naive cattle to natural challenge from buffalo-derived
Theileria parva. International Journal for Parasitology: Parasites and Wildlife, 4(2),
244–251.
49
Sivakumar, T., Hayashida, K., Sugimoto, C., & Yokoyama, N. (2014). Evolution and genetic
diversity of Theileria. Infection, Genetics and Evolution, 27(2), 250–263.
Skilton, R. A., Bishop, R. P., Katende, J. M., Mwaura, S., & Morzaria, S. P. (2002). The
persistence of Theileria parva infection in cattle immunized using two stocks which
differ in their ability to induce a carrier state: analysis using a novel blood spot PCR
assay. Parasitology, 124(3), 265–276.
Skilton, R. A., Bishop, R. P., Wells, C. W., Spooner, P. R., Gobright, E., Nkonge, C., …
Iams, K. P. (1998). Cloning and characterization of a 150 kDa microsphere antigen of
Theileria parva that is immunologically cross-reactive with the polymorphic
immunodominant molecule (PIM). Parasitology, 117(4), 321–330.
Taracha, E. L., Goddeeris, B. M., Morzaria, S. P., & Morrison, W. I. (1995). Parasite strain
specificity of precursor cytotoxic T cells in individual animals correlates with cross-
protection in cattle challenged with Theileria parva. Infection and Immunity, 63(4),
1258– 1262.
Theiler, A. (1912). Gall sickness of imported cattle and the protective inoculation against this
disease. Agricultural Journal of the Union of South Africa, 3(2), 7–46.
Thekisoe, O. M. M., Rambritch, N. E., Nakao, R., Bazie, R. S., Mbati, P., & Namangala, B.
(2010). Loop-mediated isothermal amplification (LAMP) assays for detection of
Theileria parva infections targeting the PIM and p150 genes. International Journal for
Parasitology, 40(1), 55–61.
Thompson, B. E., Latif, A. A., Oosthuizen, M. C., Troskie, M., & Penzhorn, B. L. (2008).
Occurrence of Theileria parva infection in cattle on a farm in the Ladysmith district,
KwaZulu-Natal, South Africa. Journal of the South African Veterinary Association,
79(1), 31–35.
Toye, P. G., Metzelaar, M. J., Wijngaard, P. L., Nene, V., Iams, K., Roose, J., & Clevers, H.
C. (1995). Characterization of the gene encoding the polymorphic immunodominant
molecule, a neutralizing antigen of Theileria parva. The Journal of Immunology,
155(3), 1370–1381.
50
Toye, P., Nyanjui, J., Goddeeris, B., & Musoke, A. J. (1996). Identification of neutralization
and diagnostic epitopes on PIM, the polymorphic immunodominant molecule of
Theileria parva. Infection and Immunity, 64(5), 1832–1838.
Uilenberg, G. (1981). Theilerial species of domestic livestock. In Advances in the Control of
Theileriosis (pp. 4–37). Springer.
Wamuyu, L., Obanda, V., Kariuki, D., Gakuya, F., Makanda, M., Otiende, M., & Mmeh, S.
(2015). Molecular Detection and Characterization of Theileria Infecting Wildebeest
(Connochaetes taurinus) in the Maasai Mara National Reserve, Kenya. Pathogens, 4(3),
626–638.
Woolhouse, M. E. J., Thumbi, S. M., Jennings, A., Chase-Topping, M., Callaby, R., & Kiara,
H. (2015). Co-infections determine patterns of mortality in a population exposed to
parasite infection. Science Advances, 1(2), e1400026.
Young, A. S., Leitch, B. L., Newson, R. M., & Cunningham, M. P. (1986). Maintenance of
Theileria parva infection in an endemic area of Kenya. Parasitology, 93(1), 9–16.
Young, A. S., Maritim, A. C., Kariuki, D. P., Stagg, D. A., Wafula, J. M., Mutugi, J. J., &
Burns, C. (1990). Low-dose oral administration of human interferon alpha can control
the development of Theileria parva infection in cattle. Parasitology. 101(2), 201–209.
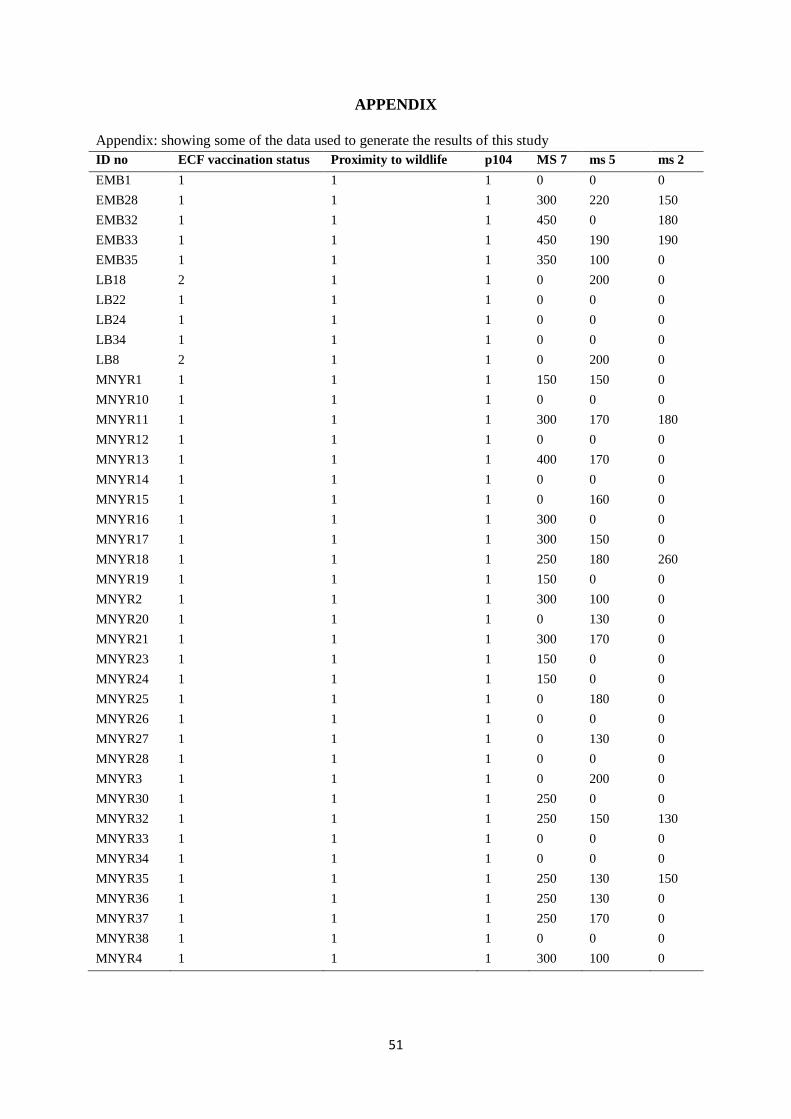
51
APPENDIX
Appendix: showing some of the data used to generate the results of this study
ID no ECF vaccination status Proximity to wildlife p104 MS 7 ms 5 ms 2
EMB1 1 1 1 0 0 0
EMB28 1 1 1 300 220 150
EMB32 1 1 1 450 0 180
EMB33 1 1 1 450 190 190
EMB35 1 1 1 350 100 0
LB18 2 1 1 0 200 0
LB22 1 1 1 0 0 0
LB24 1 1 1 0 0 0
LB34 1 1 1 0 0 0
LB8 2 1 1 0 200 0
MNYR1 1 1 1 150 150 0
MNYR10 1 1 1 0 0 0
MNYR11 1 1 1 300 170 180
MNYR12 1 1 1 0 0 0
MNYR13 1 1 1 400 170 0
MNYR14 1 1 1 0 0 0
MNYR15 1 1 1 0 160 0
MNYR16 1 1 1 300 0 0
MNYR17 1 1 1 300 150 0
MNYR18 1 1 1 250 180 260
MNYR19 1 1 1 150 0 0
MNYR2 1 1 1 300 100 0
MNYR20 1 1 1 0 130 0
MNYR21 1 1 1 300 170 0
MNYR23 1 1 1 150 0 0
MNYR24 1 1 1 150 0 0
MNYR25 1 1 1 0 180 0
MNYR26 1 1 1 0 0 0
MNYR27 1 1 1 0 130 0
MNYR28 1 1 1 0 0 0
MNYR3 1 1 1 0 200 0
MNYR30 1 1 1 250 0 0
MNYR32 1 1 1 250 150 130
MNYR33 1 1 1 0 0 0
MNYR34 1 1 1 0 0 0
MNYR35 1 1 1 250 130 150
MNYR36 1 1 1 250 130 0
MNYR37 1 1 1 250 170 0
MNYR38 1 1 1 0 0 0
MNYR4 1 1 1 300 100 0