Forest Tree Persistence, Elephants, and Stem Scars
17
505 BIOTROPICA 36(4): 505–521 2004 Forest Tree Persistence, Elephants, and Stem Scars 1 Douglas Sheil and Agus Salim Center for International Forestry Research (CIFOR), P.O. Box 6596 JKPWB, Jakarta 10065, Indonesia ABSTRACT Sixteen percent of tree stems 10 cm diameter or greater recorded in seven 1 ha plots in Rabongo Forest, Uganda had stem damage attributable to elephants (Loxodonta africana). We propose four strategies that may help tree species persist under these conditions: repellence, resistance, tolerance and avoidance. We sought and found evidence for each strategy. Large, shade-tolerant Cynometra alexandri dominated basal area (often .50%) and showed severe scarring. Nearly 80 percent of stems were small pioneer species. Scarring frequency and intensity increased with stem size. Stem-size distributions declined steeply, implying a high mortality to growth rate ratio. Tree species with spiny stems or with known toxic bark defenses were unscarred. Epiphytic figs escaped damage while at small sizes. Mid-successional tree species were scarce and appeared sensitive to elephants. Savanna species were seldom scarred. Taking stem size- effects into account by using a per-stem logistic modeling approach, scarring became more probable with slower growth and with increasing species abundance, and also varied with location. Pioneer and shade-bearer guilds showed a deficit of intermediate-sized stems. Evidence that selective elephant damage is responsible for monodominant C. alexandri forests remains equivocal; however, elephants do influence tree diversity, forest structure, and the wider landscape. Key words: African semi-deciduous rain forest; bark damage; Cynometra alexandri; herbivory; Loxodonta africana; monodominant; species richness; succession; tolerance; Uganda. TREE DAMAGE CAUSED BY ELEPHANTS (LOXODONTA AF- RICANA) has been reported in closed canopy forests across Africa (Merz 1981, Short 1981, White et al. 1993, Ho ¨ft & Ho ¨ft 1995). Stems are broken, and bark is stripped and eaten from standing trees (Buechner & Dawkins 1961, Laws et al. 1975, Merz 1981, Short 1981, White et al. 1993, Ho ¨ft & Ho ¨ft 1995). The complete stripping of bark from a stem circumference (ring-barking) generally results in stem death and affects even large stems (Buechner & Dawkins 1961, Laws et al. 1975). Bark damage can lead to infection and stem rot (Laws et al. 1975). Stem damage is known to re- duce mean tree lifetimes (Putz & Milton 1983, Franklin et al. 1987, Hennon 1995, Schoonenberg et al. 2003). How African forests are ultimately af- fected remains unclear, although there have been some suggestions. Natural forest vegetation below 1500 m eleva- tion on deep, well drained soils on the eastern edge of the Albertine Rift Valley, western Uganda, ap- pears to follow a predictable successional sequence from initial forest-tree colonization of grasslands to a monodominant forest of the caesalpinoid legume tree Cynometra alexandri (Harris 1934, Eggeling 1947, Hart et al. 1989, Sheil 2003). This but- tressed, dense-timbered species grows to a large 1 Received 2 January 2004; revision accepted 21 May 2004. size, is long-lived (Sheil et al. 2000), and indicates areas of older forests (Eggeling 1947). Laws et al. (1970, 1975) observed that although elephants damaged many tree species, C. alexandri trees were largely avoided. This led them to suggest that C. alexandri-dominance resulted from elephant pres- sure. Two lines of evidence provided circumstantial support to this proposition. First is that, in Ugan- da, C. alexandri forests coincide with areas of im- portant historical elephant populations (Eggeling 1947, Langdale-Brown et al. 1964, Laws et al. 1975, Lock 1977: 404, Howard 1991). The second line of evidence relates to tree composition changes observed in some long-term tree plots in Budongo Forest that have not been visited by elephants since the 1960s. These plots include a pristine 2 ha plot of C. alexandri forest in which a marked increase in understory stem density and species numbers remains otherwise unexplained (Sheil & Ducey 2002, Sheil 2003); however, doubts remain. Con- nell (1978) suggested an alternative interpretation of Laws et al.’s observations: he proposed that C. alexandri forest develops with or without ele- phants—by feeding on earlier successional trees, el- ephants accelerate but do not direct vegetation change. Further explanation of which trees are damaged by elephants, and of how it affects them, can provide some basis for better evaluating these proposals. Studies addressing impacts of elephants on for-
-
Upload
independent -
Category
Documents
-
view
1 -
download
0
Transcript of Forest Tree Persistence, Elephants, and Stem Scars

505
BIOTROPICA 36(4): 505–521 2004
Forest Tree Persistence, Elephants, and Stem Scars1
Douglas Sheil and Agus Salim
Center for International Forestry Research (CIFOR), P.O. Box 6596 JKPWB, Jakarta 10065, Indonesia
ABSTRACTSixteen percent of tree stems 10 cm diameter or greater recorded in seven 1 ha plots in Rabongo Forest, Uganda hadstem damage attributable to elephants (Loxodonta africana). We propose four strategies that may help tree speciespersist under these conditions: repellence, resistance, tolerance and avoidance. We sought and found evidence for eachstrategy. Large, shade-tolerant Cynometra alexandri dominated basal area (often .50%) and showed severe scarring.Nearly 80 percent of stems were small pioneer species. Scarring frequency and intensity increased with stem size.Stem-size distributions declined steeply, implying a high mortality to growth rate ratio. Tree species with spiny stemsor with known toxic bark defenses were unscarred. Epiphytic figs escaped damage while at small sizes. Mid-successionaltree species were scarce and appeared sensitive to elephants. Savanna species were seldom scarred. Taking stem size-effects into account by using a per-stem logistic modeling approach, scarring became more probable with slowergrowth and with increasing species abundance, and also varied with location. Pioneer and shade-bearer guilds showeda deficit of intermediate-sized stems. Evidence that selective elephant damage is responsible for monodominant C.alexandri forests remains equivocal; however, elephants do influence tree diversity, forest structure, and the widerlandscape.
Key words: African semi-deciduous rain forest; bark damage; Cynometra alexandri; herbivory; Loxodonta africana;monodominant; species richness; succession; tolerance; Uganda.
TREE DAMAGE CAUSED BY ELEPHANTS (LOXODONTA AF-
RICANA) has been reported in closed canopy forestsacross Africa (Merz 1981, Short 1981, White et al.1993, Hoft & Hoft 1995). Stems are broken, andbark is stripped and eaten from standing trees(Buechner & Dawkins 1961, Laws et al. 1975,Merz 1981, Short 1981, White et al. 1993, Hoft& Hoft 1995). The complete stripping of barkfrom a stem circumference (ring-barking) generallyresults in stem death and affects even large stems(Buechner & Dawkins 1961, Laws et al. 1975).Bark damage can lead to infection and stem rot(Laws et al. 1975). Stem damage is known to re-duce mean tree lifetimes (Putz & Milton 1983,Franklin et al. 1987, Hennon 1995, Schoonenberget al. 2003). How African forests are ultimately af-fected remains unclear, although there have beensome suggestions.
Natural forest vegetation below 1500 m eleva-tion on deep, well drained soils on the eastern edgeof the Albertine Rift Valley, western Uganda, ap-pears to follow a predictable successional sequencefrom initial forest-tree colonization of grasslands toa monodominant forest of the caesalpinoid legumetree Cynometra alexandri (Harris 1934, Eggeling1947, Hart et al. 1989, Sheil 2003). This but-tressed, dense-timbered species grows to a large
1 Received 2 January 2004; revision accepted 21 May2004.
size, is long-lived (Sheil et al. 2000), and indicatesareas of older forests (Eggeling 1947). Laws et al.(1970, 1975) observed that although elephantsdamaged many tree species, C. alexandri trees werelargely avoided. This led them to suggest that C.alexandri-dominance resulted from elephant pres-sure. Two lines of evidence provided circumstantialsupport to this proposition. First is that, in Ugan-da, C. alexandri forests coincide with areas of im-portant historical elephant populations (Eggeling1947, Langdale-Brown et al. 1964, Laws et al.1975, Lock 1977: 404, Howard 1991). The secondline of evidence relates to tree composition changesobserved in some long-term tree plots in BudongoForest that have not been visited by elephants sincethe 1960s. These plots include a pristine 2 ha plotof C. alexandri forest in which a marked increasein understory stem density and species numbersremains otherwise unexplained (Sheil & Ducey2002, Sheil 2003); however, doubts remain. Con-nell (1978) suggested an alternative interpretationof Laws et al.’s observations: he proposed that C.alexandri forest develops with or without ele-phants—by feeding on earlier successional trees, el-ephants accelerate but do not direct vegetationchange. Further explanation of which trees aredamaged by elephants, and of how it affects them,can provide some basis for better evaluating theseproposals.
Studies addressing impacts of elephants on for-
506 Sheil and Salim
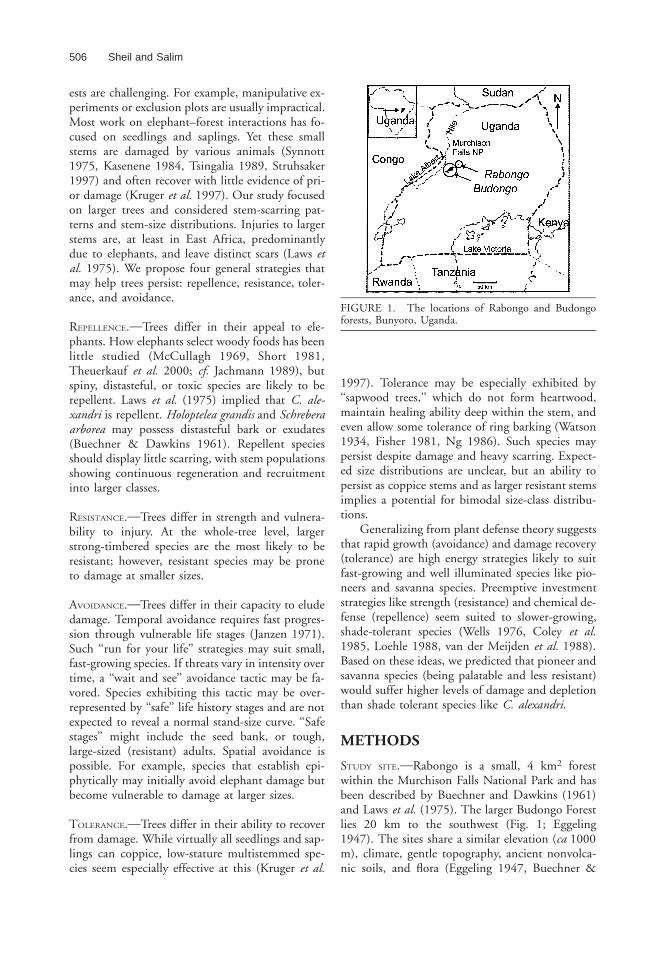
FIGURE 1. The locations of Rabongo and Budongoforests, Bunyoro, Uganda.
ests are challenging. For example, manipulative ex-periments or exclusion plots are usually impractical.Most work on elephant–forest interactions has fo-cused on seedlings and saplings. Yet these smallstems are damaged by various animals (Synnott1975, Kasenene 1984, Tsingalia 1989, Struhsaker1997) and often recover with little evidence of pri-or damage (Kruger et al. 1997). Our study focusedon larger trees and considered stem-scarring pat-terns and stem-size distributions. Injuries to largerstems are, at least in East Africa, predominantlydue to elephants, and leave distinct scars (Laws etal. 1975). We propose four general strategies thatmay help trees persist: repellence, resistance, toler-ance, and avoidance.
REPELLENCE. Trees differ in their appeal to ele-phants. How elephants select woody foods has beenlittle studied (McCullagh 1969, Short 1981,Theuerkauf et al. 2000; cf. Jachmann 1989), butspiny, distasteful, or toxic species are likely to berepellent. Laws et al. (1975) implied that C. ale-xandri is repellent. Holoptelea grandis and Schreberaarborea may possess distasteful bark or exudates(Buechner & Dawkins 1961). Repellent speciesshould display little scarring, with stem populationsshowing continuous regeneration and recruitmentinto larger classes.
RESISTANCE. Trees differ in strength and vulnera-bility to injury. At the whole-tree level, largerstrong-timbered species are the most likely to beresistant; however, resistant species may be proneto damage at smaller sizes.
AVOIDANCE. Trees differ in their capacity to eludedamage. Temporal avoidance requires fast progres-sion through vulnerable life stages (Janzen 1971).Such ‘‘run for your life’’ strategies may suit small,fast-growing species. If threats vary in intensity overtime, a ‘‘wait and see’’ avoidance tactic may be fa-vored. Species exhibiting this tactic may be over-represented by ‘‘safe’’ life history stages and are notexpected to reveal a normal stand-size curve. ‘‘Safestages’’ might include the seed bank, or tough,large-sized (resistant) adults. Spatial avoidance ispossible. For example, species that establish epi-phytically may initially avoid elephant damage butbecome vulnerable to damage at larger sizes.
TOLERANCE. Trees differ in their ability to recoverfrom damage. While virtually all seedlings and sap-lings can coppice, low-stature multistemmed spe-cies seem especially effective at this (Kruger et al.
1997). Tolerance may be especially exhibited by‘‘sapwood trees,’’ which do not form heartwood,maintain healing ability deep within the stem, andeven allow some tolerance of ring barking (Watson1934, Fisher 1981, Ng 1986). Such species maypersist despite damage and heavy scarring. Expect-ed size distributions are unclear, but an ability topersist as coppice stems and as larger resistant stemsimplies a potential for bimodal size-class distribu-tions.
Generalizing from plant defense theory suggeststhat rapid growth (avoidance) and damage recovery(tolerance) are high energy strategies likely to suitfast-growing and well illuminated species like pio-neers and savanna species. Preemptive investmentstrategies like strength (resistance) and chemical de-fense (repellence) seem suited to slower-growing,shade-tolerant species (Wells 1976, Coley et al.1985, Loehle 1988, van der Meijden et al. 1988).Based on these ideas, we predicted that pioneer andsavanna species (being palatable and less resistant)would suffer higher levels of damage and depletionthan shade tolerant species like C. alexandri.
METHODS
STUDY SITE. Rabongo is a small, 4 km2 forestwithin the Murchison Falls National Park and hasbeen described by Buechner and Dawkins (1961)and Laws et al. (1975). The larger Budongo Forestlies 20 km to the southwest (Fig. 1; Eggeling1947). The sites share a similar elevation (ca 1000m), climate, gentle topography, ancient nonvolca-nic soils, and flora (Eggeling 1947, Buechner &
Elephants and Forest Trees 507
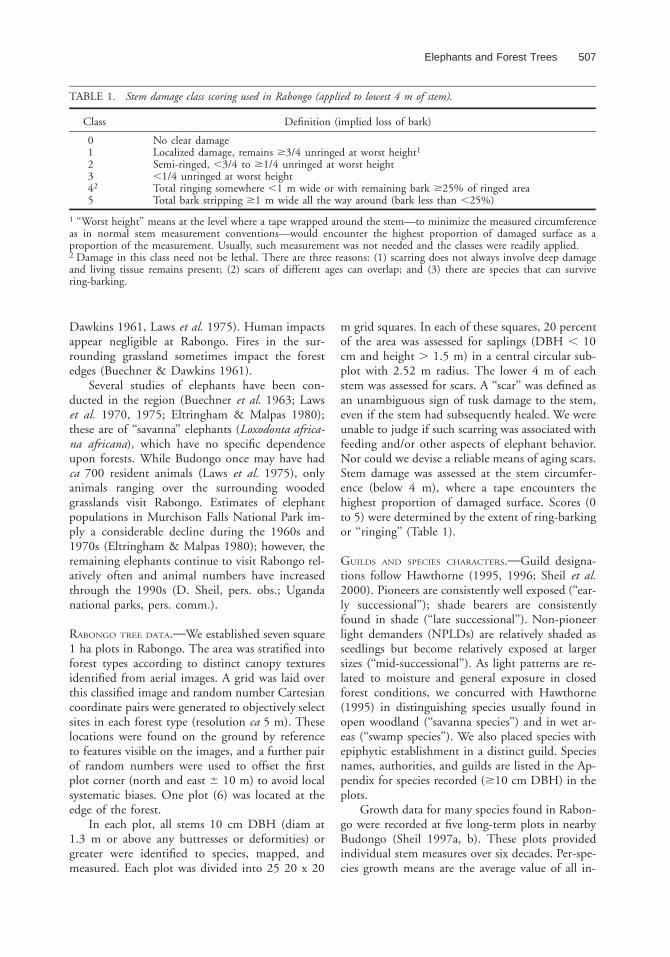
TABLE 1. Stem damage class scoring used in Rabongo (applied to lowest 4 m of stem).
Class Definition (implied loss of bark)
0 No clear damage1 Localized damage, remains $3/4 unringed at worst height1
2 Semi-ringed, ,3/4 to $1/4 unringed at worst height3 ,1/4 unringed at worst height42 Total ringing somewhere ,1 m wide or with remaining bark $25% of ringed area5 Total bark stripping $1 m wide all the way around (bark less than ,25%)
1 ‘‘Worst height’’ means at the level where a tape wrapped around the stem—to minimize the measured circumferenceas in normal stem measurement conventions—would encounter the highest proportion of damaged surface as aproportion of the measurement. Usually, such measurement was not needed and the classes were readily applied.2 Damage in this class need not be lethal. There are three reasons: (1) scarring does not always involve deep damageand living tissue remains present; (2) scars of different ages can overlap; and (3) there are species that can survivering-barking.
Dawkins 1961, Laws et al. 1975). Human impactsappear negligible at Rabongo. Fires in the sur-rounding grassland sometimes impact the forestedges (Buechner & Dawkins 1961).
Several studies of elephants have been con-ducted in the region (Buechner et al. 1963; Lawset al. 1970, 1975; Eltringham & Malpas 1980);these are of ‘‘savanna’’ elephants (Loxodonta africa-na africana), which have no specific dependenceupon forests. While Budongo once may have hadca 700 resident animals (Laws et al. 1975), onlyanimals ranging over the surrounding woodedgrasslands visit Rabongo. Estimates of elephantpopulations in Murchison Falls National Park im-ply a considerable decline during the 1960s and1970s (Eltringham & Malpas 1980); however, theremaining elephants continue to visit Rabongo rel-atively often and animal numbers have increasedthrough the 1990s (D. Sheil, pers. obs.; Ugandanational parks, pers. comm.).
RABONGO TREE DATA. We established seven square1 ha plots in Rabongo. The area was stratified intoforest types according to distinct canopy texturesidentified from aerial images. A grid was laid overthis classified image and random number Cartesiancoordinate pairs were generated to objectively selectsites in each forest type (resolution ca 5 m). Theselocations were found on the ground by referenceto features visible on the images, and a further pairof random numbers were used to offset the firstplot corner (north and east 6 10 m) to avoid localsystematic biases. One plot (6) was located at theedge of the forest.
In each plot, all stems 10 cm DBH (diam at1.3 m or above any buttresses or deformities) orgreater were identified to species, mapped, andmeasured. Each plot was divided into 25 20 x 20
m grid squares. In each of these squares, 20 percentof the area was assessed for saplings (DBH , 10cm and height . 1.5 m) in a central circular sub-plot with 2.52 m radius. The lower 4 m of eachstem was assessed for scars. A ‘‘scar’’ was defined asan unambiguous sign of tusk damage to the stem,even if the stem had subsequently healed. We wereunable to judge if such scarring was associated withfeeding and/or other aspects of elephant behavior.Nor could we devise a reliable means of aging scars.Stem damage was assessed at the stem circumfer-ence (below 4 m), where a tape encounters thehighest proportion of damaged surface. Scores (0to 5) were determined by the extent of ring-barkingor ‘‘ringing’’ (Table 1).
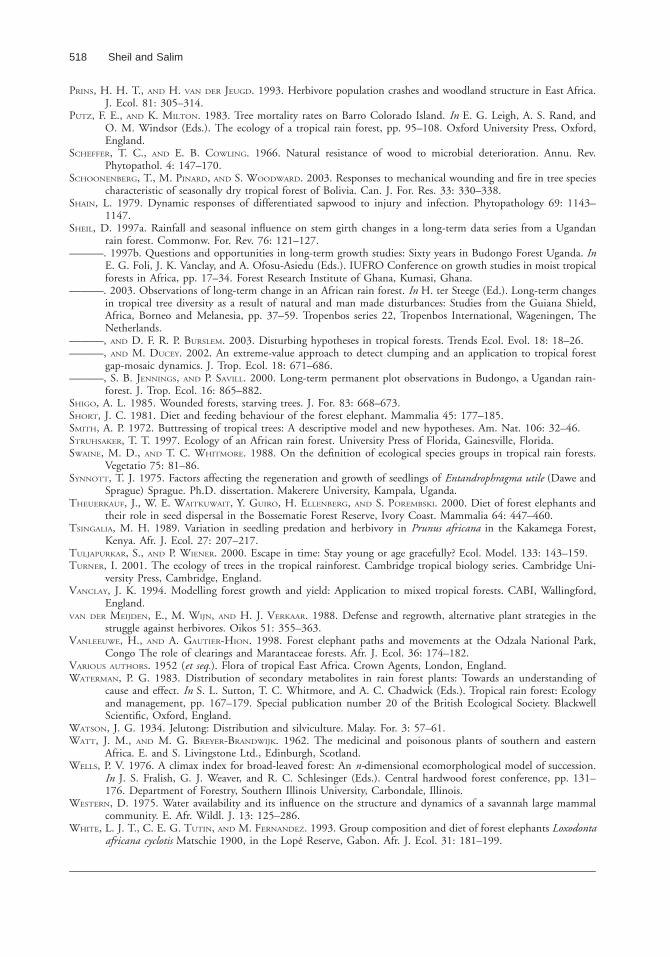
GUILDS AND SPECIES CHARACTERS. Guild designa-tions follow Hawthorne (1995, 1996; Sheil et al.2000). Pioneers are consistently well exposed (‘‘ear-ly successional’’); shade bearers are consistentlyfound in shade (‘‘late successional’’). Non-pioneerlight demanders (NPLDs) are relatively shaded asseedlings but become relatively exposed at largersizes (‘‘mid-successional’’). As light patterns are re-lated to moisture and general exposure in closedforest conditions, we concurred with Hawthorne(1995) in distinguishing species usually found inopen woodland (‘‘savanna species’’) and in wet ar-eas (‘‘swamp species’’). We also placed species withepiphytic establishment in a distinct guild. Speciesnames, authorities, and guilds are listed in the Ap-pendix for species recorded ($10 cm DBH) in theplots.
Growth data for many species found in Rabon-go were recorded at five long-term plots in nearbyBudongo (Sheil 1997a, b). These plots providedindividual stem measures over six decades. Per-spe-cies growth means are the average value of all in-
508 Sheil and Salim
terval records from all (undisturbed) periods for allstems. Four plots had some interventions, and pe-riods of growth immediately following these eventswere excluded. These data summaries provided ourbest available predictions of per-species stemgrowth in Rabongo.
Various additional species characteristics wereconsidered for comparative evaluations. Largespines are common on the stems of Chaetachmearistata, Dicrostachys cinerea, and Oncoba spinosa.Bark toxicity has been little studied (Watt & Bre-yer-Brandwijk 1962, Gartlan et al. 1980, Water-man 1983, Hamilton 1991). But it is known thatAntiaris toxicaria has a toxic latex, and bark of bothStrychnos mitis and Erythrophleum suaveolens con-tains powerful toxic alkaloids (Hamilton 1991).Spines, burrs, epicormic buds, and various barkcharacteristics (Malan & van Wyk 1993) are alllikely to influence the ease of large-scale bark strip-ping and could be investigated further as forms ofrepellence or resistance; however, apart fromspines—which we consider ‘‘repellence’’ (above)—the influence of these characteristics has not beenassessed.
We also considered sapwood species. Whilemany Ugandan forest trees appear to lack distinctheartwood (Eggeling & Dale 1952), species clas-sification currently remains too speculative forcommunity analyses. We are certain of only onespecies, A. toxicaria (R. Plumptre, pers. comm.),which also has toxic latex.
ANALYSES. We investigated if species showed acommon ranking in relative degree of scarringacross plots. Given differing numbers of species perplot and issues of nonindependence, multiple rankcorrelations proved analytically unwieldy to presentand interpret. We developed a single ‘‘all-plots’’ per-mutation-based test based on the null hypothesisof random rankings in each plot. Denoting therank of species i at plot j as r(i,j), then the relativerank is defined as r(i,j) 5 r(i,j)/Nj, where Nj is thenumber of species in plot j. Our measure of con-sistency for species i, d(i), is the interquartile rangeof r(i,j) across plot j, j 5 1, 2 . . . 7. The nulldistribution of our test statistic D, defined as thesum of d(i) across all species, can be estimated witha randomized permutation test (Manly 1991). Ateach plot, we assigned the rank of each species byrandomly selecting a number without replacementfrom the numbers 1, 2 . . . Nj. After performingthese randomizations for all plots, we computedthe relative rank of each species at each plot andproceeded to compute the consistency statistic. By
repeating these randomizations, we estimated thedistribution of D under the null hypothesis. TheP-value was estimated from the proportion of sim-ulated D-values less than the observed value.
We used generalized linear models (GLM;McCullagh & Nelder 1989, Barnett 2004) with alogit link function (logistic regression) to estimatethe probability of a stem being scarred. This frame-work provides statistical power and tractability un-available with conventional selection indices. Wemodeled the odds ratio of a stem being scarred asa function of independent variables using the fol-lowing equation: [P(Y 5 1)]/[1 2 P(Y 5 1)] 5ex9b, where x9b 5 b0 1 b1 variable 2 1 1 b2 var-iable 2 2 . . . . P (Y 5 1) is the probability of beingscarred. Note that given this formulation, eb is theodds ratio of being scarred when a predictor vari-able increases by one unit. We fitted candidatemodels and identified those with the lowest Akaikeinformation criterion (AIC; Akaike 1974).
As with any regression type model, the as-sumption is that error occurs in the response, butnot in the explanatory variables. Two explanatoryvariables, species abundance and the mean growthrate, were estimated at the species rather than atthe stem level. Uncertainties associated with theseestimates were not included in the basic models.One solution would be models in which the indi-vidual values are assumed to contain individualmeasurement errors (Carroll et al. 1995); however,some exploratory simulations of intraspecific vari-ation in mean growth showed that the likely effectof such variation on our results was negligible.
Evaluating stem-size distribution requires con-sideration of multiple processes, and we found nodefensible and analytically tractable a priori models.Exploratory approaches appeared more helpful. Weexamined stem-size distributions of each guildagainst a Weibull distribution. This distribution ischaracterized by two parameters called the scaleand shape parameters, a and b, and gives the num-ber of stems, Nk, in a defined diameter classDBHk21 to DBHk as Nk 5 N(exp[2aDBHk
b] 2exp[2aDBHk21
b]), where N is the total number ofstems. This function is very successful at fitting realstem-size distribution data (Bailey & Dell 1973,Vanclay 1994, Alder 1995) and is popular withmodelers dealing with uneven-age stands (Hyink &Moser 1979, Kamziah et al. 2000, Navar & Corral2000). The scale parameter is approximately equalto the median DBH while the shape parametercontrols the skewness of the distribution. Mostforms of the distribution show either a simple de-cline or a unimodal form. Depending on the shape
Elephants and Forest Trees 509
parameters, the distribution is skewed to the left,symmetrical, or skewed to the right; multiple peaksare not possible. Our assumption was that a stempopulation that is near equilibrium would have asampled DBH distribution that can be closely ap-proximated by a Weibull distribution. If the actualdistribution departs substantially, the nature ofthese differences may be ecologically revealing. Weused the chi-square goodness of fit test (Daniel1990). For each test, the DBH classes were chosensuch that less than 20 percent of the classes hadexpected values below 5.
RESULTS
FOREST VEGETATION AT RABONGO. Forest-widecollections yielded 174 tree species, most occurringat very low densities. The Rabongo tree flora ap-peared to be a subset of Budongo’s, but mid-suc-cessional species (i.e., NPLDs) were much lessabundant. The seven 1 ha plots contained a totalof 2452 stems (all $10 cm DBH) yielding 71 spe-cies (Appendix). Nineteen of these species (27%)were represented by a single stem, and a further 12(17%) had five or less. Plot stem densities ($10cm DBH) varied from 252 to 522 stems/ ha, andspecies richness ranged from 24 to 44 species/ ha.The majority of stems in all plots (77% of thetotal) were pioneer species. Diospyros abyssinica wasthe most common species in all but plot 1, whileC. alexandri dominated basal area in all but theforest edge vegetation recorded in plot 6 (Table 2;.50% in four plots).
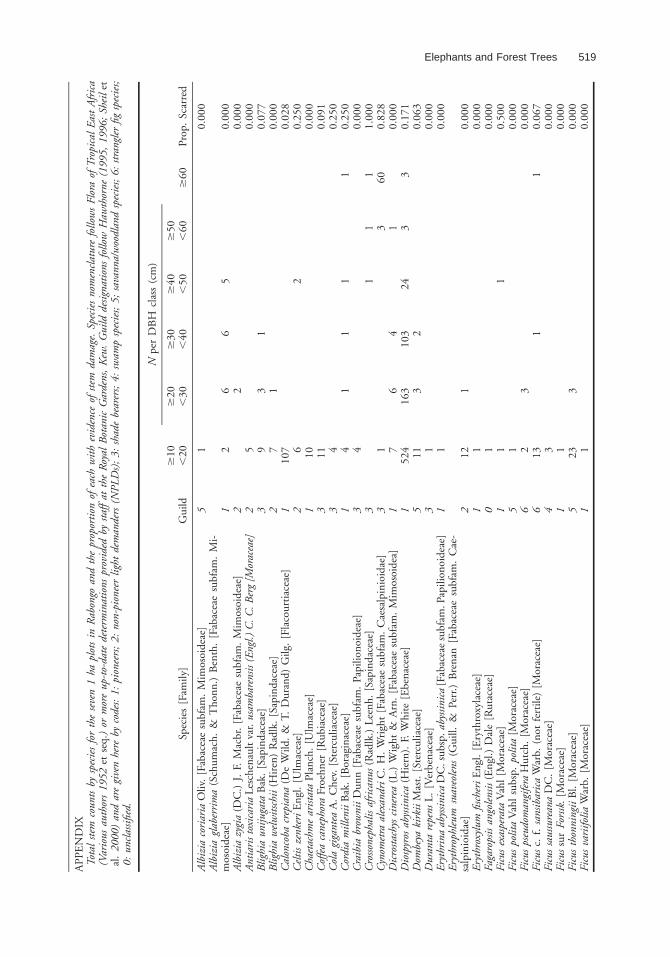
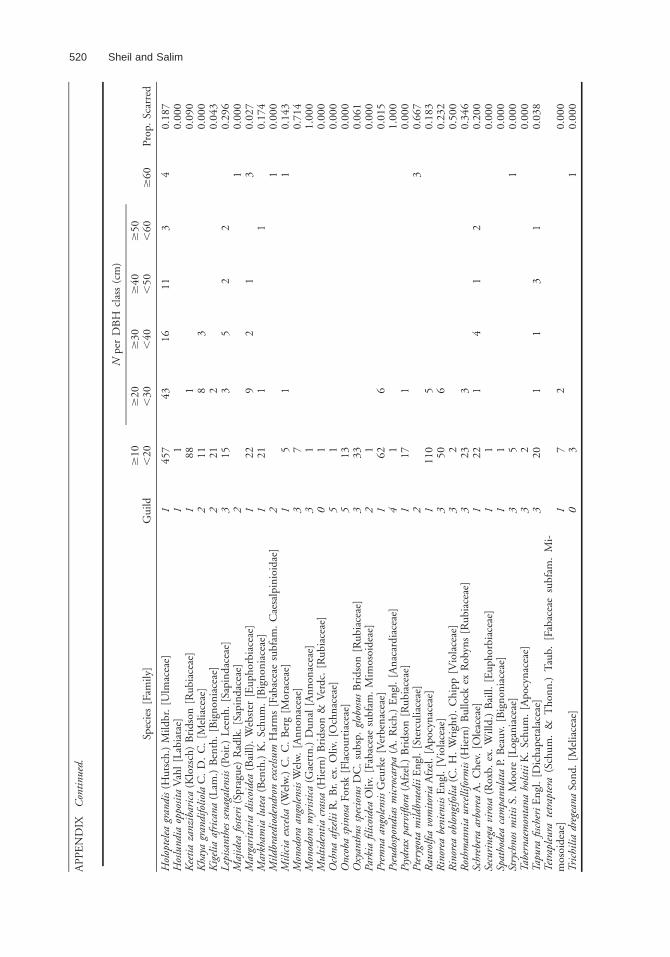
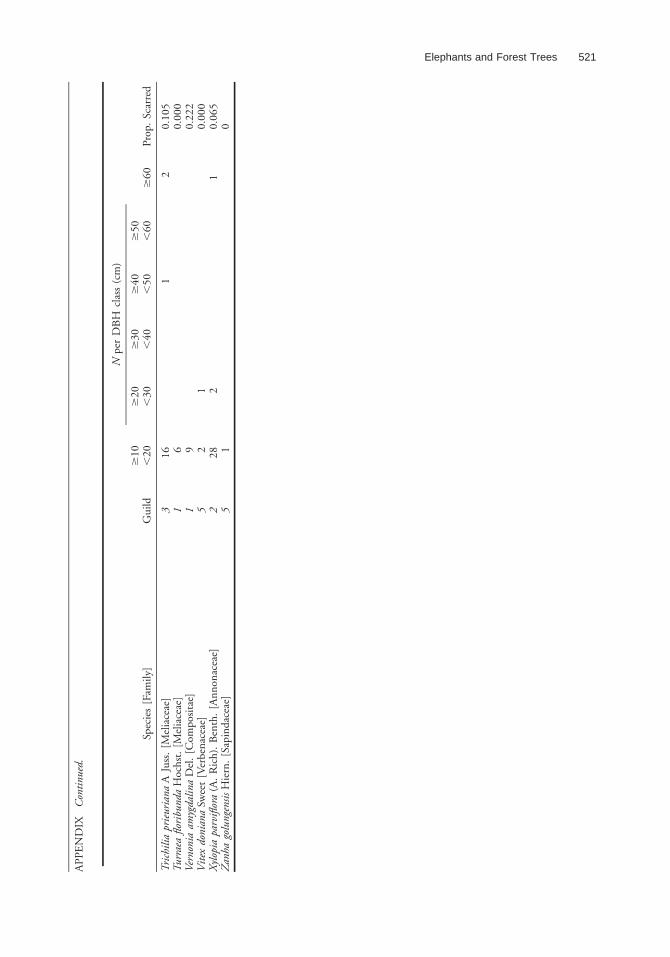
Holoptelea grandis and D. abyssinica had rela-tively continuous stem-size distributions but fewother species were represented at intermediate stemsizes (20–60 cm DBH; Appendix). Thirty-one spe-cies (44%) occurred only in the smallest size class(10–20 cm DBH), and three only in the largest($60 cm). Two species, Trichilia dregeana and S.mitis, had no stems in the 20–60 cm DBH range,despite possessing both smaller and larger stems.Cynometra alexandri was rare at small sizes (,50cm DBH) and did not appear to be regenerating.Small diameter (,10 cm DBH) strangler figs wereabundant (Ficus thonningii, F. pseudomangifera, andF. sansibarica).
SCARRING. Within the seven plots, 401 stems(16% of stems $ 10 cm DBH) had scars attrib-utable to elephants. Damage varied from 29 to 108scarred stems/ha (Table 2). Damage on buttressedand fluted stems was generally confined to the nar-row outer edge of the flange, distant from the body
of the stem. Using a permutation approach to as-sess rank consistency for the 46 species occurringin two or more plots (see Methods), we found thatthese species had a significantly similar ranking inrelative degree of scarring across the seven plots (D5 7.73, P , 0.001; 1000 null model permuta-tions).
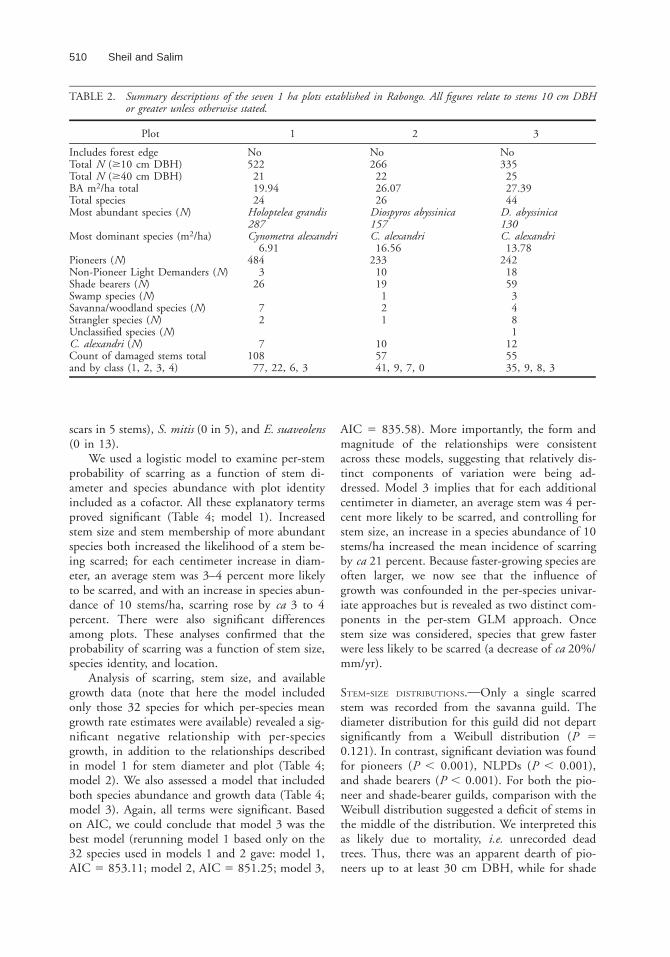
Grouping species records by stem abundancehighlights the fact that species with moderate abun-dance (10 spp. with 10 to 19 stems total) showedthe least amount of damage, whereas both scarceand common species (24 and 4 spp., respectively)showed a higher incidence of damage (Fig. 2).Within the 10–20 cm DBH class, only D. abyssi-nica, H. grandis, Rinorea beniensis, Rothmannia ur-celliformis (all P , 0.05), and Monodora myristica(P , 0.001) had significantly above average scar-ring, while Caloncoba crepiana (P , 0.001), Prem-na angolensis (P , 0.01), Margariteria discoidea (P, 0.05), and the epiphytically established F. thon-ningii (P , 0.05) were below average.
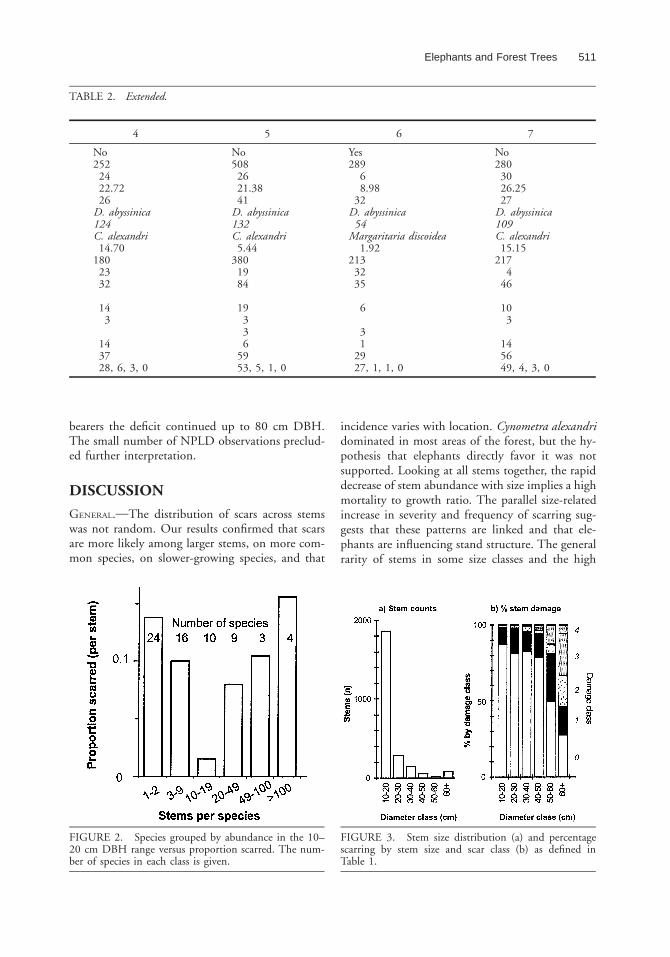
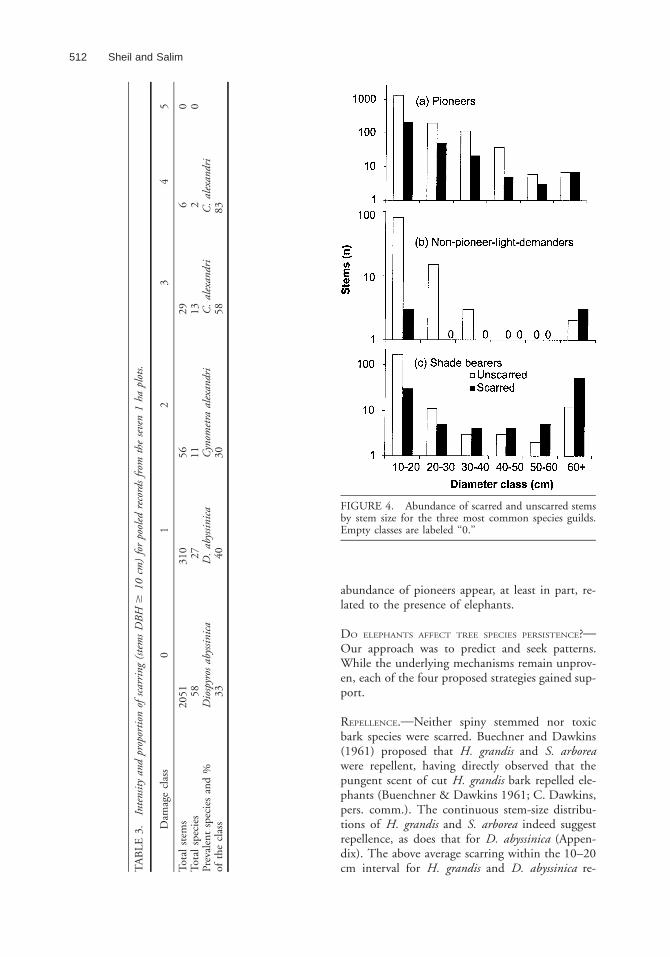
Overall stem abundance decreased rapidly withstem size while scarring increased in frequency andintensity (Fig. 3). The most severe scarring occuredon large C. alexandri stems (Table 3). All guildsshowed increased scarring with size; ultimately,scarring became more common than non-scarringin shade-tolerant as opposed to pioneer species(Fig. 4). The pattern for NPLDs suggested thatdamage was rare at smaller sizes—but there werefew stems over 10 cm DBH.
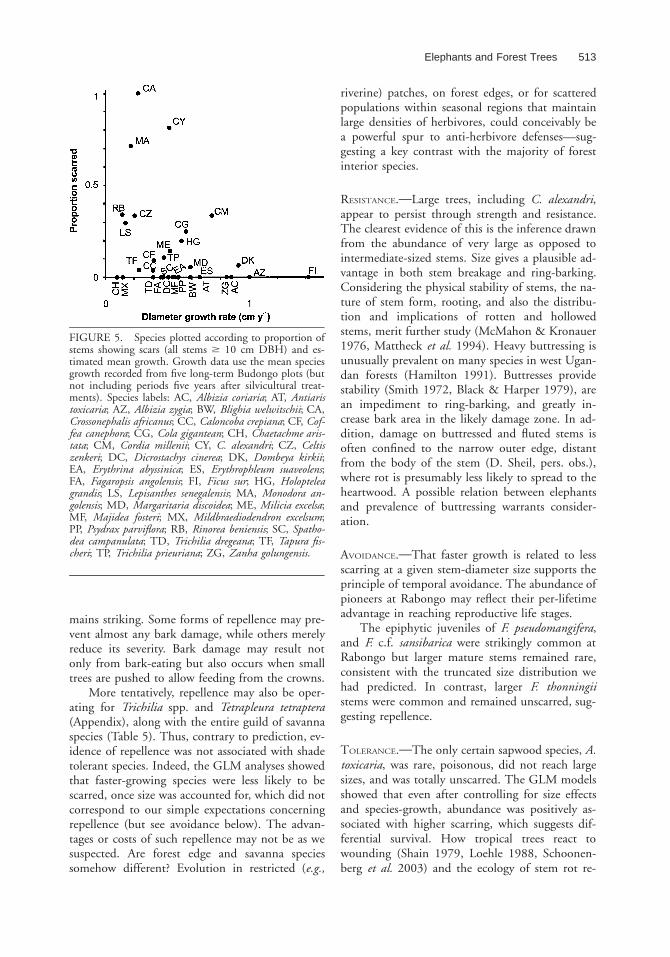
Considering each species separately, larger treeswere more often damaged than smaller stems. For17 of the 27 species with sufficient data (N $ 4in the larger stem size classes), the 10–20 cm DBHclass had less scarring than stems .20 cm, withseven ties recorded (P 5 0.0013, binomial test).The rank of total per-species basal area against pro-portion of stems scarred was also significantly re-lated (t 5 0.304, P 5 0.006, N 5 30). Examinedon a per-species basis for those 32 species withavailable information (see Methods), there was anonsignificant but negative trend in the rank cor-relation between species growth rate and scarringincidence (t 520.230, P 5 0.085 N 5 32; Fig.5). Although a per-stem summary suggested thatscarred stems possesseed a higher estimated meangrowth rate than non-scarred stems (0.456 vs.0.441 cm/yr), this difference was also not signifi-cant (P 5 0.063; Kruskal–Wallis).
Species with spiny stems were not scarred: C.aristata (no scars in 10 stems), D. cinerea (0 in 18),and O. spinosa (0 in 13). Three species known fortoxic alkaloids were also unharmed: A. toxicaria (no
510 Sheil and Salim
TABLE 2. Summary descriptions of the seven 1 ha plots established in Rabongo. All figures relate to stems 10 cm DBHor greater unless otherwise stated.
Plot 1 2 3
Includes forest edge No No NoTotal N ($10 cm DBH) 522 266 335Total N ($40 cm DBH) 21 22 25BA m2/ha total 19.94 26.07 27.39Total species 24 26 44Most abundant species (N) Holoptelea grandis Diospyros abyssinica D. abyssinica
287 157 130Most dominant species (m2/ha) Cynometra alexandri C. alexandri C. alexandri
6.91 16.56 13.78Pioneers (N) 484 233 242Non-Pioneer Light Demanders (N) 3 10 18Shade bearers (N) 26 19 59Swamp species (N) 1 3Savanna/woodland species (N) 7 2 4Strangler species (N) 2 1 8Unclassified species (N) 1C. alexandri (N) 7 10 12Count of damaged stems total 108 57 55and by class (1, 2, 3, 4) 77, 22, 6, 3 41, 9, 7, 0 35, 9, 8, 3
scars in 5 stems), S. mitis (0 in 5), and E. suaveolens(0 in 13).
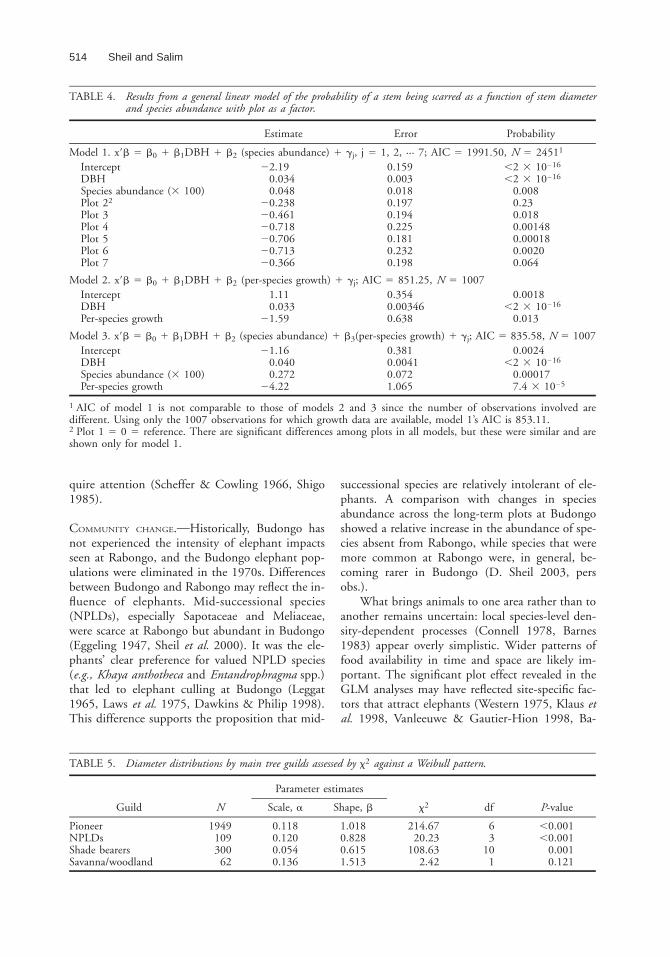
We used a logistic model to examine per-stemprobability of scarring as a function of stem di-ameter and species abundance with plot identityincluded as a cofactor. All these explanatory termsproved significant (Table 4; model 1). Increasedstem size and stem membership of more abundantspecies both increased the likelihood of a stem be-ing scarred; for each centimeter increase in diam-eter, an average stem was 3–4 percent more likelyto be scarred, and with an increase in species abun-dance of 10 stems/ha, scarring rose by ca 3 to 4percent. There were also significant differencesamong plots. These analyses confirmed that theprobability of scarring was a function of stem size,species identity, and location.
Analysis of scarring, stem size, and availablegrowth data (note that here the model includedonly those 32 species for which per-species meangrowth rate estimates were available) revealed a sig-nificant negative relationship with per-speciesgrowth, in addition to the relationships describedin model 1 for stem diameter and plot (Table 4;model 2). We also assessed a model that includedboth species abundance and growth data (Table 4;model 3). Again, all terms were significant. Basedon AIC, we could conclude that model 3 was thebest model (rerunning model 1 based only on the32 species used in models 1 and 2 gave: model 1,AIC 5 853.11; model 2, AIC 5 851.25; model 3,
AIC 5 835.58). More importantly, the form andmagnitude of the relationships were consistentacross these models, suggesting that relatively dis-tinct components of variation were being ad-dressed. Model 3 implies that for each additionalcentimeter in diameter, an average stem was 4 per-cent more likely to be scarred, and controlling forstem size, an increase in a species abundance of 10stems/ha increased the mean incidence of scarringby ca 21 percent. Because faster-growing species areoften larger, we now see that the influence ofgrowth was confounded in the per-species univar-iate approaches but is revealed as two distinct com-ponents in the per-stem GLM approach. Oncestem size was considered, species that grew fasterwere less likely to be scarred (a decrease of ca 20%/mm/yr).
STEM-SIZE DISTRIBUTIONS. Only a single scarredstem was recorded from the savanna guild. Thediameter distribution for this guild did not departsignificantly from a Weibull distribution (P 50.121). In contrast, significant deviation was foundfor pioneers (P , 0.001), NLPDs (P , 0.001),and shade bearers (P , 0.001). For both the pio-neer and shade-bearer guilds, comparison with theWeibull distribution suggested a deficit of stems inthe middle of the distribution. We interpreted thisas likely due to mortality, i.e. unrecorded deadtrees. Thus, there was an apparent dearth of pio-neers up to at least 30 cm DBH, while for shade
Elephants and Forest Trees 511
TABLE 2. Extended.
4 5 6 7
No No Yes No252 508 289 280
24 26 6 3022.72 21.38 8.98 26.2526 41 32 27
D. abyssinica D. abyssinica D. abyssinica D. abyssinica124 132 54 109C. alexandri C. alexandri Margaritaria discoidea C. alexandri
14.70 5.44 1.92 15.15180 380 213 217
23 19 32 432 84 35 46
14 19 6 103 3 3
3 314 6 1 1437 59 29 5628, 6, 3, 0 53, 5, 1, 0 27, 1, 1, 0 49, 4, 3, 0
FIGURE 2. Species grouped by abundance in the 10–20 cm DBH range versus proportion scarred. The num-ber of species in each class is given.
FIGURE 3. Stem size distribution (a) and percentagescarring by stem size and scar class (b) as defined inTable 1.
bearers the deficit continued up to 80 cm DBH.The small number of NPLD observations preclud-ed further interpretation.
DISCUSSION
GENERAL. The distribution of scars across stemswas not random. Our results confirmed that scarsare more likely among larger stems, on more com-mon species, on slower-growing species, and that
incidence varies with location. Cynometra alexandridominated in most areas of the forest, but the hy-pothesis that elephants directly favor it was notsupported. Looking at all stems together, the rapiddecrease of stem abundance with size implies a highmortality to growth ratio. The parallel size-relatedincrease in severity and frequency of scarring sug-gests that these patterns are linked and that ele-phants are influencing stand structure. The generalrarity of stems in some size classes and the high
512 Sheil and Salim
TA
BL
E3.
Inte
nsit
yan
dpr
opor
tion
ofsc
arri
ng(s
tem
sD
BH
$10
cm)
for
pool
edre
cord
sfr
omth
ese
ven
1ha
plot
s.
Dam
age
clas
s0
12
34
5
Tota
lst
ems
2051
310
5629
60
Tota
lsp
ecie
s58
2711
132
0Pr
eval
ent
spec
ies
and
%D
iosp
yros
abys
sinic
aD
.ab
yssin
ica
Cyn
omet
raal
exan
dri
C.
alex
andr
iC
.al
exan
dri
ofth
ecl
ass
3340
3058
83
FIGURE 4. Abundance of scarred and unscarred stemsby stem size for the three most common species guilds.Empty classes are labeled ‘‘0.’’
abundance of pioneers appear, at least in part, re-lated to the presence of elephants.
DO ELEPHANTS AFFECT TREE SPECIES PERSISTENCE?Our approach was to predict and seek patterns.While the underlying mechanisms remain unprov-en, each of the four proposed strategies gained sup-port.
REPELLENCE. Neither spiny stemmed nor toxicbark species were scarred. Buechner and Dawkins(1961) proposed that H. grandis and S. arboreawere repellent, having directly observed that thepungent scent of cut H. grandis bark repelled ele-phants (Buenchner & Dawkins 1961; C. Dawkins,pers. comm.). The continuous stem-size distribu-tions of H. grandis and S. arborea indeed suggestrepellence, as does that for D. abyssinica (Appen-dix). The above average scarring within the 10–20cm interval for H. grandis and D. abyssinica re-
Elephants and Forest Trees 513
FIGURE 5. Species plotted according to proportion ofstems showing scars (all stems $ 10 cm DBH) and es-timated mean growth. Growth data use the mean speciesgrowth recorded from five long-term Budongo plots (butnot including periods five years after silvicultural treat-ments). Species labels: AC, Albizia coriaria; AT, Antiaristoxicaria; AZ, Albizia zygia; BW, Blighia welwitschii; CA,Crossonephalis africanus; CC, Caloncoba crepiana; CF, Cof-fea canephora; CG, Cola gigantean; CH, Chaetachme aris-tata; CM, Cordia millenii; CY, C. alexandri; CZ, Celtiszenkeri; DC, Dicrostachys cinerea; DK, Dombeya kirkii;EA, Erythrina abyssinica; ES, Erythrophleum suaveolens;FA, Fagaropsis angolensis; FI, Ficus sur; HG, Holopteleagrandis; LS, Lepisanthes senegalensis; MA, Monodora an-golensis; MD, Margaritaria discoidea; ME, Milicia excelsa;MF, Majidea fosteri; MX, Mildbraediodendron excelsum;PP, Psydrax parviflora; RB, Rinorea beniensis; SC, Spatho-dea campanulata; TD, Trichilia dregeana; TF, Tapura fis-cheri; TP, Trichilia prieuriana; ZG, Zanha golungensis.
mains striking. Some forms of repellence may pre-vent almost any bark damage, while others merelyreduce its severity. Bark damage may result notonly from bark-eating but also occurs when smalltrees are pushed to allow feeding from the crowns.
More tentatively, repellence may also be oper-ating for Trichilia spp. and Tetrapleura tetraptera(Appendix), along with the entire guild of savannaspecies (Table 5). Thus, contrary to prediction, ev-idence of repellence was not associated with shadetolerant species. Indeed, the GLM analyses showedthat faster-growing species were less likely to bescarred, once size was accounted for, which did notcorrespond to our simple expectations concerningrepellence (but see avoidance below). The advan-tages or costs of such repellence may not be as wesuspected. Are forest edge and savanna speciessomehow different? Evolution in restricted (e.g.,
riverine) patches, on forest edges, or for scatteredpopulations within seasonal regions that maintainlarge densities of herbivores, could conceivably bea powerful spur to anti-herbivore defenses—sug-gesting a key contrast with the majority of forestinterior species.
RESISTANCE. Large trees, including C. alexandri,appear to persist through strength and resistance.The clearest evidence of this is the inference drawnfrom the abundance of very large as opposed tointermediate-sized stems. Size gives a plausible ad-vantage in both stem breakage and ring-barking.Considering the physical stability of stems, the na-ture of stem form, rooting, and also the distribu-tion and implications of rotten and hollowedstems, merit further study (McMahon & Kronauer1976, Mattheck et al. 1994). Heavy buttressing isunusually prevalent on many species in west Ugan-dan forests (Hamilton 1991). Buttresses providestability (Smith 1972, Black & Harper 1979), arean impediment to ring-barking, and greatly in-crease bark area in the likely damage zone. In ad-dition, damage on buttressed and fluted stems isoften confined to the narrow outer edge, distantfrom the body of the stem (D. Sheil, pers. obs.),where rot is presumably less likely to spread to theheartwood. A possible relation between elephantsand prevalence of buttressing warrants consider-ation.
AVOIDANCE. That faster growth is related to lessscarring at a given stem-diameter size supports theprinciple of temporal avoidance. The abundance ofpioneers at Rabongo may reflect their per-lifetimeadvantage in reaching reproductive life stages.
The epiphytic juveniles of F. pseudomangifera,and F. c.f. sansibarica were strikingly common atRabongo but larger mature stems remained rare,consistent with the truncated size distribution wehad predicted. In contrast, larger F. thonningiistems were common and remained unscarred, sug-gesting repellence.
TOLERANCE. The only certain sapwood species, A.toxicaria, was rare, poisonous, did not reach largesizes, and was totally unscarred. The GLM modelsshowed that even after controlling for size effectsand species-growth, abundance was positively as-sociated with higher scarring, which suggests dif-ferential survival. How tropical trees react towounding (Shain 1979, Loehle 1988, Schoonen-berg et al. 2003) and the ecology of stem rot re-
514 Sheil and Salim
TABLE 4. Results from a general linear model of the probability of a stem being scarred as a function of stem diameterand species abundance with plot as a factor.
Estimate Error Probability
Model 1. x9b 5 b0 1 b1DBH 1 b2 (species abundance) 1 gj, j 5 1, 2, ··· 7; AIC 5 1991.50, N 5 24511
Intercept 22.19 0.159 ,2 3 10216
DBH 0.034 0.003 ,2 3 10216
Species abundance (3 100) 0.048 0.018 0.008Plot 22 20.238 0.197 0.23Plot 3 20.461 0.194 0.018Plot 4 20.718 0.225 0.00148Plot 5 20.706 0.181 0.00018Plot 6 20.713 0.232 0.0020Plot 7 20.366 0.198 0.064
Model 2. x9b 5 b0 1 b1DBH 1 b2 (per-species growth) 1 gj; AIC 5 851.25, N 5 1007Intercept 1.11 0.354 0.0018DBH 0.033 0.00346 ,2 3 10216
Per-species growth 21.59 0.638 0.013
Model 3. x9b 5 b0 1 b1DBH 1 b2 (species abundance) 1 b3(per-species growth) 1 gj; AIC 5 835.58, N 5 1007Intercept 21.16 0.381 0.0024DBH 0.040 0.0041 ,2 3 10216
Species abundance (3 100) 0.272 0.072 0.00017Per-species growth 24.22 1.065 7.4 3 1025
1 AIC of model 1 is not comparable to those of models 2 and 3 since the number of observations involved aredifferent. Using only the 1007 observations for which growth data are available, model 1’s AIC is 853.11.2 Plot 1 5 0 5 reference. There are significant differences among plots in all models, but these were similar and areshown only for model 1.
TABLE 5. Diameter distributions by main tree guilds assessed by x2 against a Weibull pattern.
Guild N
Parameter estimates
Scale, a Shape, b x2 df P-value
Pioneer 1949 0.118 1.018 214.67 6 ,0.001NPLDs 109 0.120 0.828 20.23 3 ,0.001Shade bearers 300 0.054 0.615 108.63 10 0.001Savanna/woodland 62 0.136 1.513 2.42 1 0.121
quire attention (Scheffer & Cowling 1966, Shigo1985).
COMMUNITY CHANGE. Historically, Budongo hasnot experienced the intensity of elephant impactsseen at Rabongo, and the Budongo elephant pop-ulations were eliminated in the 1970s. Differencesbetween Budongo and Rabongo may reflect the in-fluence of elephants. Mid-successional species(NPLDs), especially Sapotaceae and Meliaceae,were scarce at Rabongo but abundant in Budongo(Eggeling 1947, Sheil et al. 2000). It was the ele-phants’ clear preference for valued NPLD species(e.g., Khaya anthotheca and Entandrophragma spp.)that led to elephant culling at Budongo (Leggat1965, Laws et al. 1975, Dawkins & Philip 1998).This difference supports the proposition that mid-
successional species are relatively intolerant of ele-phants. A comparison with changes in speciesabundance across the long-term plots at Budongoshowed a relative increase in the abundance of spe-cies absent from Rabongo, while species that weremore common at Rabongo were, in general, be-coming rarer in Budongo (D. Sheil 2003, persobs.).
What brings animals to one area rather than toanother remains uncertain: local species-level den-sity-dependent processes (Connell 1978, Barnes1983) appear overly simplistic. Wider patterns offood availability in time and space are likely im-portant. The significant plot effect revealed in theGLM analyses may have reflected site-specific fac-tors that attract elephants (Western 1975, Klaus etal. 1998, Vanleeuwe & Gautier-Hion 1998, Ba-
Elephants and Forest Trees 515
baasa 2000). Indeed, several deep pools of water inthe vicinity of Rabongo and a ranger post made ita safe haven from poachers. Alternatively, the dif-ferences may have been related to differences invegetation.
Elephants usually prefer to eat pioneer species(Hoft & Hoft 1995; cf. Theuerkauf et al. 2000).Feedback loops may occur; open areas offer morefeeding opportunities for elephants, and the dam-age they cause, in turn, maintains or increasesopenness (Eggeling 1947, Buechner & Dawkins1961, Campbell 1991, Hoft & Hoft 1995). Suchfeedback may influence forest types. In the ShimbaHills, Kenya, Hoft and Hoft (1995) concluded thatelephant activity ‘‘arrested’’ forest succession be-cause the damage promoted regeneration of themost browsed species, the ‘‘early successional’’ andfast-growing Leptonychia usambarensis (Sterculia-ceae). In contrast, less intense elephant pressure atBudongo appears to have allowed, or favored, thedevelopment of late successional C. alexandri for-ests (Laws et al. 1975). Rabongo is intermediate,with an abundance of pioneers and dominance byshade-tolerant species. As long as sufficient ele-phant influences are maintained, our expectation isthat H. grandis and D. abysinnica will persist oreven increase at Rabongo (Buechner & Dawkins1961). At sufficiently high densities, elephants mayselectively purge the forests of mid-successionalspecies, thus leaving either late or early successionalspecies or, as in Rabongo, both. By selecting forspecializations that require high energy availabilityor defensive investments (Janzen 1971, van derMeijden et al. 1988, Fineblum & Rausher 1995,Tuljapurkar & Wiener 2000), browsers may thusaccentuate the evolutionary division between pio-neer and shade-tolerant species (cf. Swaine &Whitmore 1988, Turner 2001).
DOES THE CREATION OF C. ALEXANDRI FOREST DEPEND
ON ELEPHANTS? Large C. alexandri trees were se-verely damaged by elephants and saplings werescarce. Unless juveniles grow and recruit at re-markable rates, such size distribution implies apopulation decline. There is no suggestion of re-pellence in these patterns. We suggest a ‘‘wait andsee’’ avoidance tactic with large-sized, long-livedadults as the resistant life history stage; adult treesdominate the canopy and maintain a seed rain,waiting for and monopolizing rare regeneration op-portunities. Occasional possibilities for recruitmentmay be key—suggesting an intermittent nonequi-librium process similar to that proposed to explainthe persistence of woodland with heavily grazed
grasslands (Prins & van der Jeugd 1993). Such aprocess is distinct from the direct elephant-drivenselection proposed by Laws et al. (1975) at Budon-go; however, Rabongo does appear to have beenunder much higher elephant densities than was Bu-dongo during Laws et al.’s (1975) observations.
THE BIGGER PICTURE. Our analyses imply distinctpatterns involving scarring and stem-size distribu-tions. Spiny and toxic tree species were unscarred.Epiphytic figs also appeared to escape damage, atleast while at small sizes. Stem-size distributions ofmost species declined steeply and 20 percent ofstems possessed clear scarring attributable to ele-phants. In general, larger stems were more fre-quently scarred. Once this effect was accounted for,damage was significantly more common on bothslower-growing and on more abundant species. Sa-vanna species were seldom scarred and possessednear-continuous size distributions. Pioneer andshade-bearer guilds showed a stem deficit at inter-mediate sizes. Contrary to prior suggestions, C. ale-xandri was heavily scarred and was not successfullyregenerating. Although our results do not indicatethat elephants lead directly to domination of theforest by C. alexandri, they do imply selective pro-cesses that can operate more strongly against somespecies than against others. Species like C. alexandrimay dominate not because of continuous pressures,but rather perhaps through durability and longev-ity—and the occasional regeneration opportunitiesthat arise.
The emerging picture implies tree species withdiffering strategies, sensitivities, and responses.Trends in composition will be influenced by ele-phants, and are thus determined in turn by variousprocesses that affect these animals. Relative popu-lation growth of each tree species will likely changeas animal abundances vary, bolstering or indeederoding stand diversity. Depending on densities, el-ephants may accelerate (Connell 1978), modify(Buechner & Dawkins 1961, Laws et al. 1975), oreven halt (Hoft & Hoft 1995) succession.
Whether shade-tolerant C. alexandri or pioneerspecies like H. grandis and D. abysinnica are ulti-mately favored at high elephant densities, elephantscan clearly exert considerable influence on treecommunity dynamics. Animal–vegetation feedbackwill influence ultimate outcomes, but will not workin isolation as successional status also depends onother disturbance processes and animals are them-selves influenced by changes in the larger landscape.Such interactions complicate models that relatesuccessional status with associated species-richness
516 Sheil and Salim
patterns (cf. Eggeling 1947, Connell 1978, Sheil &Burslem 2003).
Abundances of large forest herbivores havechanged globally but we remain ill equipped to an-ticipate the implications. Although our study ishelpful, the deductions are imprecise and in manycases provisional; much remains unclear. For ex-ample, edge effects may be important; in Rabongo,no tree is more than a few hundred meters froman edge. Fire also merits closer appraisal (Buechner& Dawkins 1961). In contrast to Uganda, someAfrican forests have reported sizeable elephant pop-ulations with little evident tree damage (Ghana:Dudley et al. 1992; Congo, Ituri: T. Hart, pers.comm.). In any case, stem damage is not the onlyecological influence on forests. For example, sometree species may be dependent on elephants forseed dispersal and seedling establishment (Haw-thorne & Parren 2000, Theuerkauf et al. 2000,Cochrane 2003). Our study can neither confirm
nor refute the ultimate decline of any tree speciesbased on available information.
ACKNOWLEDGMENTSThe original field study was funded by the Overseas De-velopment Administration (ODA, now DfID) as projectR4737 under the Forestry Research Programme compo-nent of the Renewable Natural Resources Research Strat-egy. DS is grateful to the former director of Uganda na-tional parks, Dr. Edroma, and staff, Mr. Otekat and Mr.Okiriya, for their cooperation in establishing the Rabongoplots; and also to the field crew: Mr. A. Musinguzi, Mr.R. Tolit, Mr. S. Murangira, Ms. G. Abigaba, Mr. Ezwa,Alex, Gagu, and both Francis. Drs. Coe, Douglas-Ham-ilton, Eltringham, and Lock helped with informationabout elephants. Makerere University (Uganda) and RBGKew (UK) provided help with herbarium materials andidentifications (thanks particularly to T. Katende, O. Ma-ganyi, and Drs. K. Vollessen and D. Bridson). J. Moss,D. Newbery, P. Savill, S. Jennings, M. van Heist, B. John-son, R. Nasi, M. Lawes, M. Parren, I. Turner, and R.Whittaker commented on previous drafts and relatedtexts, and S. Wellesley, I. Susilanasari, and M. Wanhelped prepare the manuscript.
LITERATURE CITED
AKAIKE, H. 1974. A new look at the statistical model identification. IEEE Trans. Autom. Control AC-19: 716–723.ALDER, D. 1995. Growth modelling for mixed tropical forests. Tropical forestry paper 30. Oxford Forestry Institute,
Oxford, England.BABAASA, D. 2000. Habitat selection by elephants in Bwindi Impenetrable National Park, south-western Uganda. Afr.
J. Ecol. 38: 116–122.BAILEY, R. L., AND T. R. DELL. 1973. Quantifying diameter distributions with the Weibull function. For. Sci. 19: 97–
104.BARNES, R. F. W. 1983. Effects of elephant browsing on woodlands in a Tanzanian national park: Measurements,
models and management. J. Appl. Ecol. 20: 521–540.BARNETT, V. 2004. Environmental statistics: Methods and applications. John Wiley and Sons, New York, New York.BLACK, H. L., AND K. T. HARPER. 1979. The adaptive value of buttresses to tropical trees: Additional hypotheses.
Biotropica: 11: 240.BUECHNER, H. K., I. O. BUSS, W. M. LONGHURST, AND A. C. BROOKS. 1963. Numbers and migration of elephants.
J. Wildl. Manage. 27: 37.———, AND H. C. DAWKINS. 1961. Vegetation change induced by elephants and fire in Murchison Falls National
Park, Uganda. Ecology 42: 752–766.CAMPBELL, D. G. 1991. Gap formation in tropical forest canopy by elephants, Oveng, Gabon, Central Africa. Bio-
tropica 23: 195–196.CARROLL, R. J., D. RUPPERT, AND L. A. STEFANSKI. 1995. Nonlinear measurement error models. Chapman and Hall,
New York, New York.COCHRANE, E. P. 2003. The need to be eaten: Balanites wilsoniana with and without elephant seed dispersal. J. Trop.
Ecol. 19: 579–589.COLEY, P. D., J. P. BRYANT, AND F. S. CHAPIN. 1985. Resource availability and plant antiherbivore defence. Science
230: 895–899.CONNELL, J. H. 1978. Diversity in tropical rain forests and coral reefs. Science 199: 1302–1310.DANIEL, W. 1990. Applied nonparametric statistics. PWS–Kent Publishing Co., Boston, Massachusetts.DAWKINS, H. C., AND M. S. PHILIP. 1998. Tropical moist forest silviculture and management. A history of success
and failure. CABI, Oxford, England.DUDLEY, J. P., A. Y. MENSAH-NTIAMOAH, AND D. G. KPELLE. 1992. Forest elephants in a rainforest fragment: Preliminary
findings from a wildlife conservation project in southern Ghana. Afr. J. Ecol. 30: 116–126.EGGELING, W. J. 1947. Observations on the ecology of the Budongo rain forest, Uganda. J. Ecol. 34: 20–87.———, AND I. R. DALE. 1952. The indigenous trees of the Uganda Protectorate. Government Printer, Entebbe,
Uganda.ELTRINGHAM, S. K., AND R. C. MALPAS. 1980. The decline in elephant numbers in Rwenzori and Kabalega Falls
National Parks, Uganda. Afr. J. Ecol. 18: 73–86.
Elephants and Forest Trees 517
FINEBLUM, W. L., AND M. D. RAUSHER. 1995. Trade-off between resistance and tolerance to herbivore damage in amorning glory. Nature 377: 517–520.
FISHER, J. B. 1981. Wound healing by exposed secondary xylem in Adansonia (Bombacaceae). IAWA Bull. 2: 193–199.
FRANKLIN, J. F., H. H. SHUGART, AND M. E. HARMON. 1987. Tree death as an ecological process. BioScience, 37: 550–556.
GARTLAN, J. S., D. B. MCKEY, P. G. WATERMAN, C. N. MBI, AND T. T. STRUHSAKER. 1980. A comparative study ofthe phytochemistry of two African rain forests. Biochem. Syst. Ecol. 8: 401–422.
HAMILTON, A. C. 1991. Ugandan forest trees. Makerere University Printer, Kampala, Uganda.HARRIS, C. M. 1934. Provisional working plan report for the Bunyoro Forests, Uganda. Uganda Forest Department,
Kampala, Uganda.HART, T. B., J. A. HART, AND P. G. MURPHY. 1989. Monodominant and species-rich forests of the humid tropics:
Causes for their co-occurrence. Am. Nat. 133: 613–633.HAWTHORNE, W. D. 1995. Ecological profiles of Ghanaian forest trees. Tropical forestry paper 29, Oxford Forestry
Institute, Oxford, England.———. 1996. Holes and the sums of parts in Ghanaian forest: Regeneration, scale and sustainable use. Proc. R. Soc.
Edinb. 104B: 75–176.———, AND M. P. E. PARREN. 2000. How important are forest elephants to the survival of woody plant species in
Upper Guinean forests? J. Trop. Ecol. 16: 133–150.HENNON, P. E. 1995. Are heart rot fungi major factors of disturbance in gap-dynamic forests? NW Sci. 69: 284–293.HOFT, R., AND M. HOFT. 1995. The differential effects of elephants on rain forest communities in the Shimba Hills,
Kenya. Biol. Conserv. 73: 67–79.HOWARD, P. C. 1991. Nature conservation in Uganda’s tropical forest reserves. IUCN Forest Conservation Programme,
publication no.3. IUCN, Gland, Switzerland.HYNK, D. M., AND J. W. MOSER. 1979. Application of diameter distribution for yield projection in uneven-aged
forests. In W. E. Frayer (Ed.). Forest resources inventories, pp. 906–916. Proc. SAF/IUFRO Workshop,Colorado State University, Fort Collins, Colorado.
JACHMANN, H. 1989. Food selection by elephants in the ‘miombo’ biome in relation to leaf chemistry. Biochem. Syst.Ecol. 17: 15–24.
JANZEN, D. H. 1971. Escape of Cassia grandis L. beans from predators in time and space. Ecology 52: 964–979.KAMZIAH A. K., M. I. AHMAD, AND Y. AHMAD ZUHAIDI. 2000. Modelling diameter distribution in even-aged and
uneven-aged forest stands. J. Trop. For. Sci. 12: 669–681.KASENENE, J. M. 1984. The influence of selective logging on rodent populations and the regeneration of selected tree
species in the Kibale Forest, Uganda. Trop. Ecol. 25: 179–195.KLAUS, G., C. KLAUS-HUGI, AND B. SCHMID. 1998. Geophagy by large mammals at natural licks in the rain forest of
the Dzanga National Park, Central African Republic. J. Trop. Ecol. 14: 829–839.KRUGER, L. M., J. J. MIDGLEY, AND R. M. COWLING. 1997. Resprouters vs reseeders in South African forest trees: A
model based on forest canopy height. Funct. Ecol. 11: 101–105.LANGDALE-BROWN, I., H. A. OSMASTON, AND J. G. WILSON. 1964. The vegetation of Uganda and its bearing on land-
use. Government Printer, Entebbe, Uganda.LAWS, R. M, I. S. C. PARKER, AND R. C. B. JOHNSTONE. 1970. Elephants and habitats in North Bunyoro, Uganda.
E. Afr. Wildl. J. 8: 163–180.———, ———, AND ———. 1975. Elephants and their habitats: The ecology of elephants in North Bunyoro,
Uganda. Clarendon Press, Oxford, England.LEGGAT, G. J. 1965. The reconciliation of forestry and game preservation in Western Uganda. E. Afr. Wildl. J. 30:
355–369.LOCK, J. M. 1977. The vegetation of Rwenzori [Queen Elizabeth] National Park, Uganda. Bot. Jahrb. Syst. Pflanzen-
gesch. Plafengeogr. 98: 372–448.LOEHLE, C. 1988. Tree life history strategies: The role of defenses. Can. J. For. Res. 18: 209–222.MALAN, J. W., AND E. VAN WYK. 1993. Bark structure and preferential bark utilisation by the African elephant. IAWA
J. 14: 173–185.MANLY, B. F. J. 1991. Randomization and Monte Carlo methods in biology. Chapman and Hall, London, England.MATTHECK, C., K. BETHGE, AND P. W. WEST. 1994. Breakage of hollow stems. Trees 9: 47–50.MCCULLAGH, K. G. 1969. The growth and nutrition of the African elephant. II. The chemical nature of the diet. E.
Afr. Wildl. J. 7: 91–98.MCCULLAGH, P. AND J. A. NELDER. 1989. Generalized linear models, 2nd edition. Chapman and Hall, London,
England.MCMAHON, T. A., AND R. E. KRONAUER. 1976. Tree structure: Deducing the principle of mechanical design. J. Theor.
Biol. 59: 442–466.MERZ, G. 1981. Recherches sur la biologie de nutrition et les habitats preferes de l’elephant de foret Loxodonta africana
cyclotis Matschie 1900. Mammalia 45: 299–312.NAVAR, J. AND S. CORRAL. 2000. Estimating, predicting and recovering Weibull distribution parameters of mixed and
uneven-aged stands of Durango, Mexico. In Forest ecosystem restoration: Ecological and economical impactsof restoration processes secondary coniferous forests, pp. 187–193. Proceedings of the International Confer-ence, Vienna, Austria, 10–12 April, 2000. IUFRO, Vienna, Austria.
NG, F. S. P. 1986. Tropical sapwood trees. Naturalia Monspeliensia. Colloq. Int. l’Arbre 1986: 61–97.
518 Sheil and Salim
PRINS, H. H. T., AND H. VAN DER JEUGD. 1993. Herbivore population crashes and woodland structure in East Africa.J. Ecol. 81: 305–314.
PUTZ, F. E., AND K. MILTON. 1983. Tree mortality rates on Barro Colorado Island. In E. G. Leigh, A. S. Rand, andO. M. Windsor (Eds.). The ecology of a tropical rain forest, pp. 95–108. Oxford University Press, Oxford,England.
SCHEFFER, T. C., AND E. B. COWLING. 1966. Natural resistance of wood to microbial deterioration. Annu. Rev.Phytopathol. 4: 147–170.
SCHOONENBERG, T., M. PINARD, AND S. WOODWARD. 2003. Responses to mechanical wounding and fire in tree speciescharacteristic of seasonally dry tropical forest of Bolivia. Can. J. For. Res. 33: 330–338.
SHAIN, L. 1979. Dynamic responses of differentiated sapwood to injury and infection. Phytopathology 69: 1143–1147.
SHEIL, D. 1997a. Rainfall and seasonal influence on stem girth changes in a long-term data series from a Ugandanrain forest. Commonw. For. Rev. 76: 121–127.
———. 1997b. Questions and opportunities in long-term growth studies: Sixty years in Budongo Forest Uganda. InE. G. Foli, J. K. Vanclay, and A. Ofosu-Asiedu (Eds.). IUFRO Conference on growth studies in moist tropicalforests in Africa, pp. 17–34. Forest Research Institute of Ghana, Kumasi, Ghana.
———. 2003. Observations of long-term change in an African rain forest. In H. ter Steege (Ed.). Long-term changesin tropical tree diversity as a result of natural and man made disturbances: Studies from the Guiana Shield,Africa, Borneo and Melanesia, pp. 37–59. Tropenbos series 22, Tropenbos International, Wageningen, TheNetherlands.
———, AND D. F. R. P. BURSLEM. 2003. Disturbing hypotheses in tropical forests. Trends Ecol. Evol. 18: 18–26.———, AND M. DUCEY. 2002. An extreme-value approach to detect clumping and an application to tropical forest
gap-mosaic dynamics. J. Trop. Ecol. 18: 671–686.———, S. B. JENNINGS, AND P. SAVILL. 2000. Long-term permanent plot observations in Budongo, a Ugandan rain-
forest. J. Trop. Ecol. 16: 865–882.SHIGO, A. L. 1985. Wounded forests, starving trees. J. For. 83: 668–673.SHORT, J. C. 1981. Diet and feeding behaviour of the forest elephant. Mammalia 45: 177–185.SMITH, A. P. 1972. Buttressing of tropical trees: A descriptive model and new hypotheses. Am. Nat. 106: 32–46.STRUHSAKER, T. T. 1997. Ecology of an African rain forest. University Press of Florida, Gainesville, Florida.SWAINE, M. D., AND T. C. WHITMORE. 1988. On the definition of ecological species groups in tropical rain forests.
Vegetatio 75: 81–86.SYNNOTT, T. J. 1975. Factors affecting the regeneration and growth of seedlings of Entandrophragma utile (Dawe and
Sprague) Sprague. Ph.D. dissertation. Makerere University, Kampala, Uganda.THEUERKAUF, J., W. E. WAITKUWAIT, Y. GUIRO, H. ELLENBERG, AND S. POREMBSKI. 2000. Diet of forest elephants and
their role in seed dispersal in the Bossematie Forest Reserve, Ivory Coast. Mammalia 64: 447–460.TSINGALIA, M. H. 1989. Variation in seedling predation and herbivory in Prunus africana in the Kakamega Forest,
Kenya. Afr. J. Ecol. 27: 207–217.TULJAPURKAR, S., AND P. WIENER. 2000. Escape in time: Stay young or age gracefully? Ecol. Model. 133: 143–159.TURNER, I. 2001. The ecology of trees in the tropical rainforest. Cambridge tropical biology series. Cambridge Uni-
versity Press, Cambridge, England.VANCLAY, J. K. 1994. Modelling forest growth and yield: Application to mixed tropical forests. CABI, Wallingford,
England.VAN DER MEIJDEN, E., M. WIJN, AND H. J. VERKAAR. 1988. Defense and regrowth, alternative plant strategies in the
struggle against herbivores. Oikos 51: 355–363.VANLEEUWE, H., AND A. GAUTIER-HION. 1998. Forest elephant paths and movements at the Odzala National Park,
Congo The role of clearings and Marantaceae forests. Afr. J. Ecol. 36: 174–182.VARIOUS AUTHORS. 1952 (et seq.). Flora of tropical East Africa. Crown Agents, London, England.WATERMAN, P. G. 1983. Distribution of secondary metabolites in rain forest plants: Towards an understanding of
cause and effect. In S. L. Sutton, T. C. Whitmore, and A. C. Chadwick (Eds.). Tropical rain forest: Ecologyand management, pp. 167–179. Special publication number 20 of the British Ecological Society. BlackwellScientific, Oxford, England.
WATSON, J. G. 1934. Jelutong: Distribution and silviculture. Malay. For. 3: 57–61.WATT, J. M., AND M. G. BREYER-BRANDWIJK. 1962. The medicinal and poisonous plants of southern and eastern
Africa. E. and S. Livingstone Ltd., Edinburgh, Scotland.WELLS, P. V. 1976. A climax index for broad-leaved forest: An n-dimensional ecomorphological model of succession.
In J. S. Fralish, G. J. Weaver, and R. C. Schlesinger (Eds.). Central hardwood forest conference, pp. 131–176. Department of Forestry, Southern Illinois University, Carbondale, Illinois.
WESTERN, D. 1975. Water availability and its influence on the structure and dynamics of a savannah large mammalcommunity. E. Afr. Wildl. J. 13: 125–286.
WHITE, L. J. T., C. E. G. TUTIN, AND M. FERNANDEZ. 1993. Group composition and diet of forest elephants Loxodontaafricana cyclotis Matschie 1900, in the Lope Reserve, Gabon. Afr. J. Ecol. 31: 181–199.
Elephants and Forest Trees 519
AP
PEN
DIX
Tota
lste
mco
unts
bysp
ecie
sfo
rth
ese
ven
1ha
plot
sin
Rab
ongo
and
the
prop
orti
onof
each
wit
hev
iden
ceof
stem
dam
age.
Spec
ies
nom
encl
atur
efo
llow
sFl
ora
ofTr
opic
alEa
stA
fric
a(V
ario
usau
thor
s19
52et
seq.
)or
mor
eup
-to-
date
dete
rmin
atio
nspr
ovid
edby
staff
atth
eR
oyal
Bot
anic
Gar
dens
,K
ew.
Gui
ldde
signa
tion
sfo
llow
Haw
thor
ne(1
995,
1996
;Sh
eil
etal
.20
00)
and
are
give
nhe
reby
code
s:1:
pion
eers
;2:
non-
pion
eer
light
dem
ande
rs(N
PLD
s);
3:sh
ade
bear
ers;
4:sw
amp
spec
ies;
5;sa
vann
a/w
oodl
and
spec
ies;
6:str
angl
erfig
spec
ies;
0:un
clas
sified
.
Spec
ies
[Fam
ily]
Gui
ld$
10,
20
Npe
rD
BH
clas
s(c
m)
$20
,30
$30
,40
$40
,50
$50
,60
$60
Prop
.Sc
arre
d
Alb
izia
cori
aria
Oliv
.[F
abac
eae
subf
am.
Mim
osoi
deae
]5
10.
000
Alb
izia
glab
erri
ma
(Sch
umac
h.&
Tho
nn.)
Ben
th.
[Fab
acea
esu
bfam
.M
i-m
osoi
deae
]1
26
65
0.00
0A
lbiz
iazy
gia
(DC
.)J.
F.M
acbr
.[F
abac
eae
subf
am.
Mim
osoi
deae
]2
20.
000
Ant
iari
stox
icar
iaL
esch
enau
ltva
r.us
amba
rens
is(E
ngl.)
C.C
.Ber
g[M
orac
eae]
25
0.00
0B
lighi
aun
ijuga
taB
ak.
[Sap
inda
ceae
]3
93
10.
077
Blig
hia
wel
wit
schi
i(H
iren
)R
adlk
.[S
apin
dace
ae]
27
10.
000
Cal
onco
bacr
epia
na(D
eW
ild.
&T.
Dur
and)
Gilg
.[F
laco
urti
acea
e]1
107
0.02
8C
elti
sze
nker
iE
ngl.
[Ulm
acea
e]2
62
0.25
0C
haet
achm
ear
istat
aPl
anch
.[U
lmac
eae]
110
0.00
0C
offe
aca
neph
ora
Froe
hner
[Rub
iace
ae]
311
0.09
1C
ola
giga
ntea
A.
Che
v.[S
terc
ulia
ceae
]3
40.
250
Cor
dia
mill
enii
Bak
.[B
orag
inac
eae]
14
11
11
0.25
0C
raib
iabr
owni
iD
unn
[Fab
acea
esu
bfam
.Pa
pilio
noid
eae]
34
0.00
0C
rosso
neph
alis
afri
canu
s(R
adlk
.)L
eenh
.[S
apin
dace
ae]
31
11
1.00
0C
ynom
etra
alex
andr
iC
.H
.W
righ
t[F
abac
eae
subf
am.
Cae
salp
inio
idae
]3
13
600.
828
Dic
rosta
chys
cine
rea
(L.)
Wig
ht&
Arn
.[F
abac
eae
subf
am.
Mim
osoi
dea]
17
64
10.
000
Dio
spyr
osab
yssin
ica
(Hie
rn).
F.W
hite
[Ebe
nace
ae]
152
416
310
324
33
0.17
1D
ombe
yaki
rkii
Mas
t.[S
terc
ulia
ceae
]5
113
20.
063
Dur
anta
repe
nsL
.[V
erbe
nace
ae]
31
0.00
0Er
ythr
ina
abys
sinic
aD
C.s
ubsp
.aby
ssini
ca[F
abac
eae
subf
am.P
apili
onoi
deae
]1
10.
000
Eryt
hrop
hleu
msu
aveo
lens
(Gui
ll.&
Perr
.)B
rena
n[F
abac
eae
subf
am.
Cae
-sa
lpin
ioid
ae]
212
10.
000
Eryt
hrox
ylum
fisch
eri
Eng
l.[E
ryth
roxy
lace
ae]
11
0.00
0Fa
garo
psis
ango
lens
is(E
ngl.)
Dal
e[R
utac
eae]
01
0.00
0Fi
cus
exas
pera
taV
ahl
[Mor
acea
e]1
11
0.50
0Fi
cus
polit
aV
ahl
subs
p.po
lita
[Mor
acea
e]5
10.
000
Ficu
sps
eudo
man
gife
raH
utch
.[M
orac
eae]
62
30.
000
Ficu
sc.
f.sa
nsib
aric
aW
arb.
(not
fert
ile)
[Mor
acea
e]6
131
10.
067
Ficu
ssa
ussu
rean
aD
C.
[Mor
acea
e]4
30.
000
Ficu
ssu
rFo
rssk
.[M
orac
eae]
11
0.00
0Fi
cus
thon
ning
iiB
l.[M
orac
eae]
523
30.
000
Ficu
sva
riifo
liaW
arb.
[Mor
acea
e]1
10.
000
520 Sheil and Salim
AP
PEN
DIX
Con
tinu
ed.
Spec
ies
[Fam
ily]
Gui
ld$
10,
20
Npe
rD
BH
clas
s(c
m)
$20
,30
$30
,40
$40
,50
$50
,60
$60
Prop
.Sc
arre
d
Hol
opte
lea
gran
dis
(Hut
sch.
)M
ildbr
.[U
lmac
eae]
145
743
1611
34
0.18
7H
oslu
ndia
oppo
sita
Vah
l[L
abia
tae]
11
0.00
0K
eeti
aza
nzib
aric
a(K
lozs
ch)
Bri
dson
[Rub
iace
ae]
188
10.
090
Kha
yagr
andi
folio
laC
.D
.C
.[M
elia
ceae
]2
118
30.
000
Kig
elia
afri
cana
(Lam
.)B
enth
.[B
igno
niac
eae]
221
20.
043
Lepi
sant
hes
sena
gale
nsis
(Poi
r.)L
eenh
.[S
apin
dace
ae]
315
35
22
0.29
6M
ajid
eafo
steri
(Spr
ague
)R
adlk
.[S
apin
dace
ae]
21
0.00
0M
arga
rita
ria
disc
oide
a(B
aill)
.W
ebst
er[E
upho
rbia
ceae
]1
229
21
30.
027
Mar
kham
ialu
tea
(Ben
th.)
K.
Schu
m.
[Big
noni
acea
e]1
211
10.
174
Mild
brae
diod
endr
onex
celsu
mH
arm
s[F
abac
eae
subf
am.
Cae
salp
inio
idae
]2
10.
000
Mili
cia
exce
lsa(W
elw
.)C
.C
.B
erg
[Mor
acea
e]1
51
10.
143
Mon
odor
aan
gole
nsis
Wel
w.
[Ann
onac
eae]
37
0.71
4M
onod
ora
myr
istic
a(G
aert
n.)
Dun
al[A
nnon
acea
e]3
11.
000
Mul
tide
ntia
cras
sa(H
iern
)B
rids
on&
Ver
dc.
[Rub
iace
ae]
01
0.00
0O
chna
afze
liiR
.B
r.ex
.O
liv.
[Och
nace
ae]
51
0.00
0O
ncob
asp
inos
aFo
rsk
[Fla
cour
tiac
eae]
513
0.00
0O
xyan
thus
spec
iosu
sD
C.
subs
p.gl
obos
usB
rids
on[R
ubia
ceae
]3
330.
061
Park
iafil
icoi
dea
Oliv
.[F
abac
eae
subf
am.
Mim
osoi
deae
]2
10.
000
Prem
naan
gole
nsis
Geu
rke
[Ver
bena
ceae
]1
626
0.01
5Ps
eudo
spon
dias
mic
roca
rpa
(A.
Ric
h.)
Eng
l.[A
naca
rdia
ceae
]4
11.
000
Psyd
rax
parv
iflor
a(A
fzel
.)B
rids
on[R
ubia
ceae
]1
171
0.00
0Pt
eryg
ota
mild
brae
dii
Eng
l.[S
terc
ulia
ceae
]2
30.
667
Rau
volfi
avo
mit
oria
Afz
el.
[Apo
cyna
ceae
]1
110
50.
183
Rin
orea
beni
ensis
Eng
l.[V
iola
ceae
]3
506
0.23
2R
inor
eaob
long
ifolia
(C.
H.
Wri
ght)
.C
hipp
[Vio
lace
ae]
32
0.50
0R
othm
anni
aur
celli
form
is(H
iern
)B
ullo
ckex
Rob
yns
[Rub
iace
ae]
323
30.
346
Schr
eber
aar
bore
aA
.C
hev.
[Ole
acea
e]1
221
41
20.
200
Secu
rine
gavi
rosa
(Rox
b.ex
.W
illd.
)B
aill.
[Eup
horb
iace
ae]
11
0.00
0Sp
atho
dea
cam
panu
lata
P.B
eauv
.[B
igno
niac
eae]
11
0.00
0St
rych
nos
mit
isS.
Moo
re[L
ogan
iace
ae]
35
10.
000
Tabe
rnae
mon
tana
holst
iiK
.Sc
hum
.[A
pocy
nace
ae]
32
0.00
0Ta
pura
fisch
eri
Eng
l.[D
icha
peta
lace
ae]
320
11
31
0.03
8Te
trap
leur
ate
trap
tera
(Sch
um.
&T
honn
.)T
aub.
[Fab
acea
esu
bfam
.M
i-m
osoi
deae
]1
72
0.00
0Tr
ichi
liadr
egea
naSo
nd.
[Mel
iace
ae]
03
10.
000
Elephants and Forest Trees 521
AP
PEN
DIX
Con
tinu
ed.
Spec
ies
[Fam
ily]
Gui
ld$
10,
20
Npe
rD
BH
clas
s(c
m)
$20
,30
$30
,40
$40
,50
$50
,60
$60
Prop
.Sc
arre
d
Tric
hilia
prie
uria
naA
Juss
.[M
elia
ceae
]3
161
20.
105
Turr
aea
flori
bund
aH
ochs
t.[M
elia
ceae
]1
60.
000
Vern
onia
amyg
dalin
aD
el.
[Com
posi
tae]
19
0.22
2V
itex
doni
ana
Swee
t[V
erbe
nace
ae]
52
10.
000
Xyl
opia
parv
iflor
a(A
.R
ich)
.B
enth
.[A
nnon
acea
e]2
282
10.
065
Zan
hago
lung
ensis
Hie
rn.
[Sap
inda
ceae
]5
10