Export activity, persistence and mark-ups
37
For Peer Review Export activity, persistence and mark-ups Journal: Applied Economics Manuscript ID: APE-07-0079.R1 Journal Selection: Applied Economics Date Submitted by the Author: 09-Jul-2007 Complete List of Authors: Moreno, Lourdes; Universidad Complutense de Madrid Rodriguez, Diego; Universidad Complutense de Madrid JEL Code: F12 - Models of Trade with Imperfect Competition and Scale Economies < F1 - Trade < F - International Economics, L13 - Oligopoly and Other Imperfect Markets < L1 - Market Structure, Firm Strategy, and Market Performance < L - Industrial Organization, L60 - General < L6 - Industry Studies: Manufacturing < L - Industrial Organization Keywords: export , margin Editorial Office, Dept of Economics, Warwick University, Coventry CV4 7AL, UK Submitted Manuscript peer-00582222, version 1 - 1 Apr 2011 Author manuscript, published in "Applied Economics 42, 04 (2010) 475-488" DOI : 10.1080/00036840701604529
-
Upload
universidadlagrancolombia -
Category
Documents
-
view
3 -
download
0
Transcript of Export activity, persistence and mark-ups
For Peer Review
Export activity, persistence and mark-ups
Journal: Applied Economics
Manuscript ID: APE-07-0079.R1
Journal Selection: Applied Economics
Date Submitted by the Author:
09-Jul-2007
Complete List of Authors: Moreno, Lourdes; Universidad Complutense de Madrid Rodriguez, Diego; Universidad Complutense de Madrid
JEL Code:
F12 - Models of Trade with Imperfect Competition and Scale Economies < F1 - Trade < F - International Economics, L13 - Oligopoly and Other Imperfect Markets < L1 - Market Structure, Firm Strategy, and Market Performance < L - Industrial Organization, L60 - General < L6 - Industry Studies: Manufacturing < L - Industrial Organization
Keywords: export , margin
Editorial Office, Dept of Economics, Warwick University, Coventry CV4 7AL, UK
Submitted Manuscriptpe
er-0
0582
222,
ver
sion
1 -
1 Ap
r 201
1Author manuscript, published in "Applied Economics 42, 04 (2010) 475-488"
DOI : 10.1080/00036840701604529
For Peer Review
Export activity, persistence and mark-ups*
Lourdes Moreno MartínDiego Rodríguez Rodríguez
Universidad Complutense de Madrid
Abstract
This paper addresses the differences in margins across exporting and non-exporting firms. We
jointly estimate a translog cost function, a variable factor share equation and price-cost margin
equations to analyze the effect of persistence in export activity on margins. Results indicate that
non-exporters have smaller margins than persistent exporters and firms that entered foreign
markets during the nineties. However, larger export ratio is negatively associated with margins
for persistent exporters. It suggests that efficiency advantages for exporters are partially
compensated by higher competitive pressure in international markets. These results are in
accordance with the predictions of Melitz and Ottaviano (2005).
JEL Classification Numbers: F12, L60, L13
Corresponding author:
Lourdes Moreno Martín Departamento de Fundamentos de Análisis Económico I Universidad Complutense de MadridCampus de Somosaguas 28223, Madrid, SpainTel: 34-91-3942408E-mail: [email protected]
* We thank to J.C. Fariñas and F. Velázquez for comments and suggestions. This research has been partially founded by projects SEC2003-00516 and SEC2004-02525.
Page 1 of 36
Editorial Office, Dept of Economics, Warwick University, Coventry CV4 7AL, UK
Submitted Manuscript
123456789101112131415161718192021222324252627282930313233343536373839404142434445464748495051525354555657585960
peer
-005
8222
2, v
ersi
on 1
- 1
Apr 2
011

For Peer Review
1
1. Introduction
A large bulk of work has recently analyzed the effect of export activity on firm
productivity. That research supports a clear conclusion: exporters enjoy efficiency advantages
over non-exporters. This literature found a strong theoretical support in Melitz (2003) paper,
which stimulated an increasing literature about the characteristics of international activity in the
presence of firm heterogeneity. Given this evidence, a further step would be to ask whether such
productivity differences are passed through to profit advantages. However, much less effort has
been devoted to analyze the impact of export activity on margins. Some recent papers have
considered factors that can explain differences in mark-ups across firms related to export
activity. In particular, Melitz and Ottaviano (2005) analyze selection and pro-competition
effects of trade on mark-ups.
Several studies have introduced foreign trade as an explanatory variable of margins. In
the case of imports, results suggest a negative effect on total profitability of domestic firms,
though collusive behavior between domestic and foreign firms could reduce this effect1. Recent
evidence also suggests that outsourcing strategies, since they stimulate an increase in trade of
intermediate goods, may counteract the effect of imports as suggested by the market discipline
hypothesis (Egger and Egger, 2004). With respect to export activity several papers have used
aggregate data, where average margins across industries - approached through an accounting
measure - are explained, among other variables, by an indicator of export behavior. Though
there are several reasons to believe that exports could affect margins, results are far from being
conclusive. In particular, Caves, Porter and Spence (1980), Geroski (1982) and Stalhammar
1 Tybout (2001) surveys the theoretical link between imports and domestic mark-ups and summarizes the empirical .../...
Page 2 of 36
Editorial Office, Dept of Economics, Warwick University, Coventry CV4 7AL, UK
Submitted Manuscript
123456789101112131415161718192021222324252627282930313233343536373839404142434445464748495051525354555657585960
peer
-005
8222
2, v
ersi
on 1
- 1
Apr 2
011
For Peer Review
2
(1991) obtain a negative, positive and a non-significant effect of the export ratio on industry
profitability, respectively.
An alternative empirical approach is used by Bernstein and Mohnen (1991). Instead of
analyzing the determinants of industry profitability, they estimate price-cost margin for domestic
and export markets from a structural econometric model. Studying several Canadian industries,
they find that the degree of oligopoly power differs between domestic and foreign markets.
Following the same methodology, Bughin (1996) analyzes this question for a panel of Belgian
firms. He obtains that monopoly power in export markets is smaller than in domestic markets.
We find similar results for a subsample of persistent Spanish exporters (Moreno and Rodriguez
(2004)). The objective of those papers was to analyze whether market power for export firms
was different between domestic and foreign markets. However, there is scarce empirical
evidence about the differences in margins associated to export activity using firm data. Görg and
Warzynski (2003) have investigated this issue for UK firms. They use the technique proposed
by Roeger (1995) based on the difference between the primal Solow residual (with a production
function) and its price dual (based on a cost function). They find that UK exporters have higher
mark-ups than non-exporters for differentiated goods, while non-significant differences are
found for the case of homogeneous goods for both types of firms. Following a non-parametric
approach, Girma, Görg and Strobl (2004) compare the performance (sales/employees and
profits/employees) of domestic, exporters and multinational Irish firms. They do not find
significant differences between domestic and exporters whereas distributions for multinationals
dominate both kinds of firms.
.../...evidence at firm-level.
Page 3 of 36
Editorial Office, Dept of Economics, Warwick University, Coventry CV4 7AL, UK
Submitted Manuscript
123456789101112131415161718192021222324252627282930313233343536373839404142434445464748495051525354555657585960
peer
-005
8222
2, v
ersi
on 1
- 1
Apr 2
011
For Peer Review
3
The objective of this paper is to analyze whether there are differences in margins for
different groups of firms according to their export activity. We follow the methodology
proposed by Bernstein and Mohnen (1991), based on a structural specification which comprises
a translog cost function, a variable factor share equation and a price-cost margin equation. Firm
margins are parameterised taking into account the degree of persistence of export activity.
Specifically, we distinguish among non-exporters, entrants, exiters, switchers (firms that enter
or exit more than once throughout the period) and persistent exporters.
This theoretical benchmark is applied to a panel of Spanish manufacturing firms for the
period 1990-99. The evolution of the economic cycle and strong changes in the exchange rate
system throughout that period should have affected the competitive position of exporters vs non
exporters. The dataset allows us to analyze not only the differences in margins related to export
and domestic activities, but also to know how market evolution affected both margins. The rest
of the paper is as follows. Section 2 provides some insights about potential effects of export
activity on margins. Section 3 explains the theoretical benchmark, both in a unimarket and
multimarket context. Section 4 describes the data source and provides a descriptive approach in
order to infer the relationship between margin and export activity. Section 5 gives the results of
the estimates and, finally, main conclusions are summarized in Section 6.
2. Export activity and mark-ups
Though since mid-nineties several papers highlighted the relationship between
productivity and export activity, it was not until recent years that the literature has provided a
strong theoretical support. In that sense, Melitz (2003) paper could be considered as a main
Page 4 of 36
Editorial Office, Dept of Economics, Warwick University, Coventry CV4 7AL, UK
Submitted Manuscript
123456789101112131415161718192021222324252627282930313233343536373839404142434445464748495051525354555657585960
peer
-005
8222
2, v
ersi
on 1
- 1
Apr 2
011
For Peer Review
4
contribution. He develops a dynamic model to explain intra-industry reallocations across firms
with heterogeneity in the context of an open economy. The existence of entry costs in export
markets plays a crucial role to explain the connection between trade and productivity: only more
productive firms can cover entry costs in foreign markets. In this model trade affects the
distribution of firms through the domestic factor market. Specifically, exporters and entrants
increase the demand for labour. As consequence, real wage goes up and the least productive
firms have to exit. Finally, less efficient survival firms do not export because they can not cover
export sunk costs and reduce both domestic market share and profits.
The empirical evidence obtains that exporting firms are more efficient than non-
exporters. It mostly supports the self-selection hypothesis, that stresses the idea that export
markets select the most efficient firms due to the presence of higher sunk costs related to entry
in foreign markets. See for example, Aw et al (1997) for Taiwan, Roberts and Tybout (1997) for
Columbia, Bernard and Jensen (1999) for the United States and Delgado et al (2002) for Spain2.
A complementary explanation is based on the learning hypothesis, which suggests that export
activity induces productivity improvements. The main empirical distinction between both
arguments is that while productivity differentials are ex-ante to firm entry in the selection
explanation, the learning hypothesis points out that firms which begin to export should increase
their productivity with respect to other firms after entering export markets. In the last case,
though some papers have found some support (e.g., Girma, Greenaway and Kneller (2004)), the
empirical evidence is not conclusive.
Most papers have focused on the relationship between export and productivity, but there
2 Wagner (2007) provides an extensive survey of microeconomic studies.
Page 5 of 36
Editorial Office, Dept of Economics, Warwick University, Coventry CV4 7AL, UK
Submitted Manuscript
123456789101112131415161718192021222324252627282930313233343536373839404142434445464748495051525354555657585960
peer
-005
8222
2, v
ersi
on 1
- 1
Apr 2
011

For Peer Review
5
is very scarce research about margins. In Melitz (2003) the most productive firms export and
have higher profits, but mark-ups are exogenous. It is due to he assumes monopolistic
competition under CES preferences. This question has been issued by Melitz and Ottaviano
(2005), who incorporate endogenous mark-ups considering a linear demand system with
horizontal product differentiation developed by Ottaviano, Tabuchi and Thisse (2002). In their
model there is an endogenous distribution of mark-ups across firms that respond to the
toughness of market competition, measured by the number and the average productivity of
competing firms. In the equilibrium at firm level, lower cost firms set lower prices and earn
higher revenues and profits that firms with higher costs. However, they also set higher mark-ups
given that they do not pass the entire cost differential to consumer prices. In the free entry
equilibrium competition is tougher in larger markets, where more firms compete and average
prices are lower. As in Melitz (2003), trade increases average productivity by forcing least
productive firms to exit. Nevertheless, it operates now through a different channel: the increased
product market competition3. Firms respond to this tougher competition by setting a lower
mark-up that outweighs the selection effect according to which the most productive firms
survive and set higher mark-ups.
Bernard et al (2003) also develop a model that also predicts endogeneous margins. They
assume a Bertrand competition framework where mark-ups are variable and the differences in
efficiency among firms can be observed throughout differences in productivity4. As in Melitz
3 Factor market competition plays no role in Melitz and Ottaviano (2005) because the supply of labour to the differentiated good sector is perfectly elastic.
4 Productivity (R) is the monetary translation of efficiency (Z), such as i i iR = P Z , where Pi refers to output price.
Additionally, output price is defined as =i ii
wP M
Z, where w is the cost of an input bundle (firms are input price
takers) and Mi is the mark-up. With perfect competition Mi = 1 and iR = w , reflecting that prices change inversely
to efficiency changes. However, if Mi is not equal to 1, differences in productivity can be observed..../...
Page 6 of 36
Editorial Office, Dept of Economics, Warwick University, Coventry CV4 7AL, UK
Submitted Manuscript
123456789101112131415161718192021222324252627282930313233343536373839404142434445464748495051525354555657585960
peer
-005
8222
2, v
ersi
on 1
- 1
Apr 2
011
For Peer Review
6
and Ottaviano (2005), this model suggests that more efficient firms set a higher markup.
However, the analytical results imply, as consequence of the functional forms chosen, some
surprising predictions, as they recognize. Specifically, the distribution of mark-ups is the same
in any destination and does not depend on the level of technology or geographic barriers.
To analyze the relationship between export activity and margins is also suitable to
consider the different conditions of trade in world markets in relation to domestic markets. In a
context of homogeneous products, it is expected that goods sold in foreign markets have closer
substitutes than those sold in domestic markets. It supports the usual assumption that foreign
demand elasticity is bigger than domestic ones, so that non-exporting firms would have larger
price-cost margins than exporters. Additionally, competitive environment influences the
capacity of firms to achieve collusive agreements. That capacity may be larger in domestic
markets, where firms are more protected from international competition, than in foreign
markets. In fact, this is the main argument used to justify the negative impact of import
penetration on domestic margins. Note that if differentiated products are assumed, exporters
could sell to specific fringe demands in foreign markets with price elasticity smaller than the
domestic demand. In this context exporting firms are not price takers in international markets
and enjoy market power abroad. Therefore, margins related to sales in foreign markets could be
higher than in domestic markets.
Two final questions should be considered in order to develop an empirical analysis of
the relationship between export activity and mark-ups. Firstly, export is not always a persistent
activity for firms: entries and exits from foreign markets are usually found. Additionally, it is
.../...
Page 7 of 36
Editorial Office, Dept of Economics, Warwick University, Coventry CV4 7AL, UK
Submitted Manuscript
123456789101112131415161718192021222324252627282930313233343536373839404142434445464748495051525354555657585960
peer
-005
8222
2, v
ersi
on 1
- 1
Apr 2
011
For Peer Review
7
usual to observe firms with erratic behavior in export activity. For these switching firms sunk
costs would not be relevant, and their behavior is probably more related to incidental orders than
to an elaborated strategy of entering in foreign markets. These arguments suggest that it is
advisable to carefully distinguish the groups of firms that are not persistent exporters/non-
exporters.
Secondly, the comparison between exporting vs non-exporting firms does not take into
account that usually exporters also sell in domestic markets. Margins across markets for each
firm could differ due to dissimilarities in demand elasticity and in the competition intensity.
Additionally, differences in marginal costs associated to variable (e.g., transport) or sunk costs
(e.g., costs associated to sales networks) could explain that exporters set different margins
across markets. However, cost externalities from sales in foreign markets to domestic ones (i.e.,
scale economies) should be considered. Efficiency advantages induced by export activity should
benefit firms’ cost structure as a whole, irrespective of the market destination.
In short, there are arguments supporting differences in mark-ups for exporters vs non-
exporters. On the one hand, those related to efficiency advantages suggest larger margins
related to export activity. On the other hand, those related to the degree of market competition
would imply smaller margins related to export activity. Consequently, in order to know what
effect prevails an empirical analysis is required.
Page 8 of 36
Editorial Office, Dept of Economics, Warwick University, Coventry CV4 7AL, UK
Submitted Manuscript
123456789101112131415161718192021222324252627282930313233343536373839404142434445464748495051525354555657585960
peer
-005
8222
2, v
ersi
on 1
- 1
Apr 2
011
For Peer Review
8
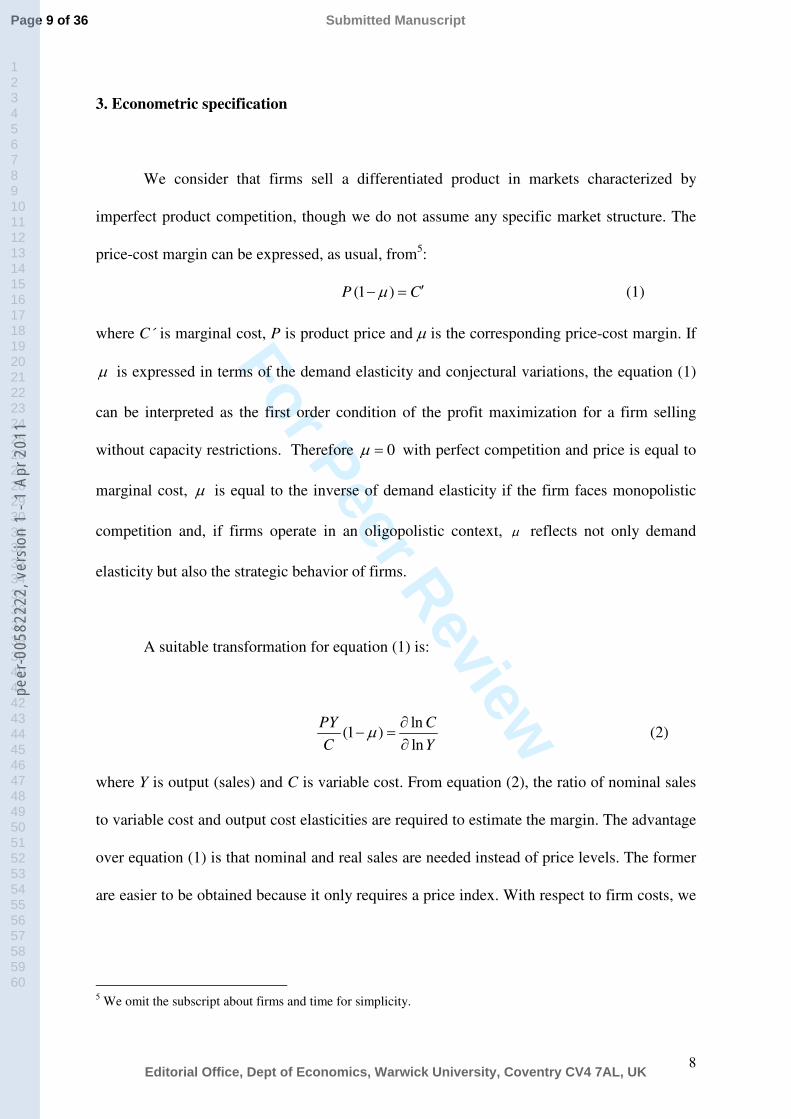
3. Econometric specification
We consider that firms sell a differentiated product in markets characterized by
imperfect product competition, though we do not assume any specific market structure. The
price-cost margin can be expressed, as usual, from5:
(1 )P Cµ ′− = (1)
where C´ is marginal cost, P is product price and µ is the corresponding price-cost margin. If
µ is expressed in terms of the demand elasticity and conjectural variations, the equation (1)
can be interpreted as the first order condition of the profit maximization for a firm selling
without capacity restrictions. Therefore 0µ = with perfect competition and price is equal to
marginal cost, µ is equal to the inverse of demand elasticity if the firm faces monopolistic
competition and, if firms operate in an oligopolistic context, µ reflects not only demand
elasticity but also the strategic behavior of firms.
A suitable transformation for equation (1) is:
ln(1 )
ln
PY C
C Yµ ∂
− =∂
(2)
where Y is output (sales) and C is variable cost. From equation (2), the ratio of nominal sales
to variable cost and output cost elasticities are required to estimate the margin. The advantage
over equation (1) is that nominal and real sales are needed instead of price levels. The former
are easier to be obtained because it only requires a price index. With respect to firm costs, we
5 We omit the subscript about firms and time for simplicity.
Page 9 of 36
Editorial Office, Dept of Economics, Warwick University, Coventry CV4 7AL, UK
Submitted Manuscript
123456789101112131415161718192021222324252627282930313233343536373839404142434445464748495051525354555657585960
peer
-005
8222
2, v
ersi
on 1
- 1
Apr 2
011

For Peer Review
9
assume a short-term context where capital stock is considered as a fixed factor. In this sense,
the variable cost function is defined as follows:
( ), , ,fC C P Y K t= (3)
where Pf is a vector of prices of variable factors (labor (XL) and intermediate inputs (XM)), K
is capital stock and t is a time trend which represents the state of technology. We assume that
variable factor prices are exogenous to firms. The cost function has the usual properties: it is
increasing in variable factor prices and output, and it is also homogeneous of degree one in
factor prices. Following Bernstein and Mohen (1991) and Bughin (1996) a translog cost
function is specified. This function is especially interesting in this case because it is easily
enlarged for the multiproduct (multimarket) context. The empirical specification of the
translog cost function is:
( ) ( ) ( )
*0 1 2 3 5 6
2 2 2
7 8 9 10 11
ln n ln ln ln ln ln ln ln
1 1 1ln ln ln ln ln
2 2 2
M
CC l Y w K Y w Y K
P
w K Y w K t
β β β β β β
β β β β β ε
= = + + + + +
+ + + + + +
(4)
where w is the ratio PL/PM. In the previous specification, the restrictions corresponding to a
degree one homogeneous cost function in variable input prices (PL and PM) have been
imposed. Additionally, a time trend t has been added to measure technical progress6.
Deriving from translog cost function, the equilibrium condition for the product market
(equation (2)) can be rewritten as follows:
6 We omit the parameter β4 to facilitate comparisons with the multiproduct specification forward.
Page 10 of 36
Editorial Office, Dept of Economics, Warwick University, Coventry CV4 7AL, UK
Submitted Manuscript
123456789101112131415161718192021222324252627282930313233343536373839404142434445464748495051525354555657585960
peer
-005
8222
2, v
ersi
on 1
- 1
Apr 2
011
For Peer Review
10
1 5 6 8(1 ) ln ln ln
PY + w + K Y
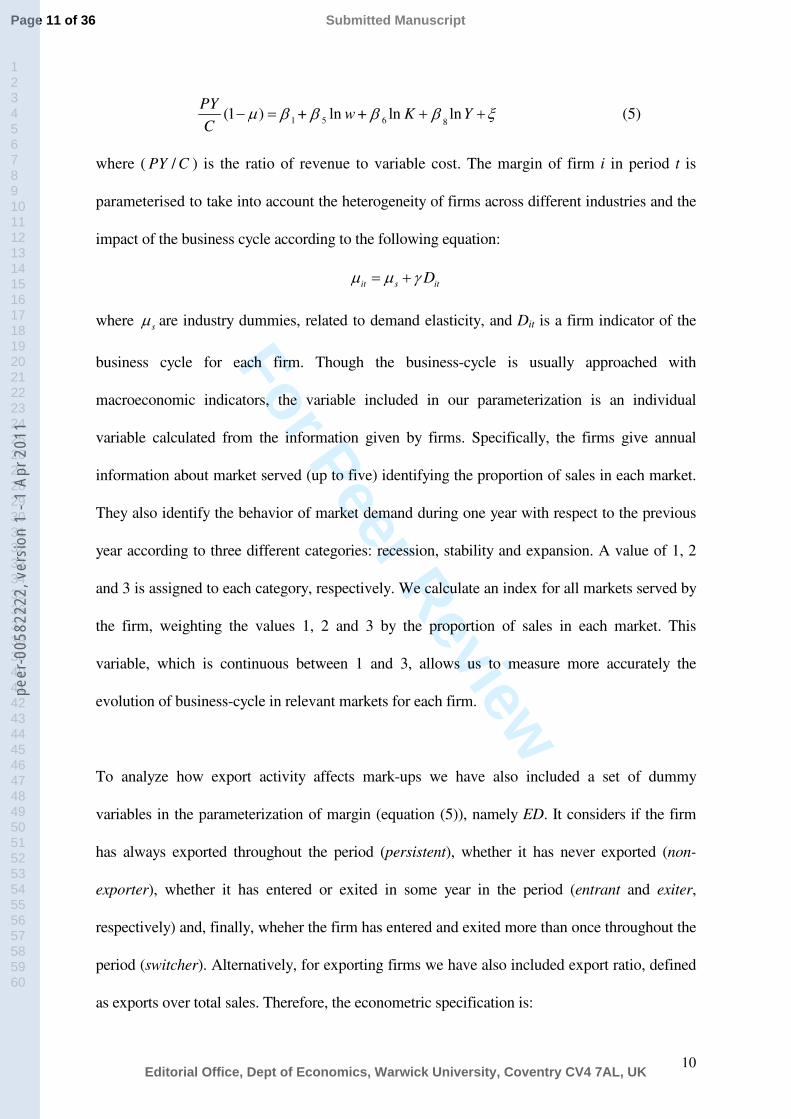
Cµ ξβ β β β− = + + (5)
where ( /PY C ) is the ratio of revenue to variable cost. The margin of firm i in period t is
parameterised to take into account the heterogeneity of firms across different industries and the
impact of the business cycle according to the following equation:
it s itDµ µ γ= +
where sµ are industry dummies, related to demand elasticity, and Dit is a firm indicator of the
business cycle for each firm. Though the business-cycle is usually approached with
macroeconomic indicators, the variable included in our parameterization is an individual
variable calculated from the information given by firms. Specifically, the firms give annual
information about market served (up to five) identifying the proportion of sales in each market.
They also identify the behavior of market demand during one year with respect to the previous
year according to three different categories: recession, stability and expansion. A value of 1, 2
and 3 is assigned to each category, respectively. We calculate an index for all markets served by
the firm, weighting the values 1, 2 and 3 by the proportion of sales in each market. This
variable, which is continuous between 1 and 3, allows us to measure more accurately the
evolution of business-cycle in relevant markets for each firm.
To analyze how export activity affects mark-ups we have also included a set of dummy
variables in the parameterization of margin (equation (5)), namely ED. It considers if the firm
has always exported throughout the period (persistent), whether it has never exported (non-
exporter), whether it has entered or exited in some year in the period (entrant and exiter,
respectively) and, finally, wheher the firm has entered and exited more than once throughout the
period (switcher). Alternatively, for exporting firms we have also included export ratio, defined
as exports over total sales. Therefore, the econometric specification is:
Page 11 of 36
Editorial Office, Dept of Economics, Warwick University, Coventry CV4 7AL, UK
Submitted Manuscript
123456789101112131415161718192021222324252627282930313233343536373839404142434445464748495051525354555657585960
peer
-005
8222
2, v
ersi
on 1
- 1
Apr 2
011

For Peer Review
11
1 5 6 8[1 ( )] ln ln ln s it it
PY D ED + w + K Y
Cµ γ δ ξβ β β β− + + = + + (5b)
Besides, though labor cost share is not necessary to identify the parameters, it is
included in the set of equations for the sake of efficiency. Shephard´s lemma can be used to
derive the equilibrium conditions for input demand:ln
lnff
CS =
P
∂∂
, where f ff
P XS =
C is the
variable cost share of input. Labor cost share is then estimated as7:
ln ln lnL L2 5 7 9
P X = + Y + K + wC
τβ β β β + (6)
The equations system to be estimated is comprised of (4), (5b) and (6). As usual, using
the estimated parameters, the share of labor costs and the intermediate inputs costs allow us to
obtain some additional results such as scale economies, substitution elasticity and the own-price
elasticity of input demand.
To take into account the multimarket character of exporters we have extended the
uniproduct framework to a multiproduct specification. This is the approach used by Bernstein
and Mohnen (1991) and Bughin (1996) to estimate price-cost margin differentiating between
export and domestic markets. Assuming that exporters sell simultaneously in domestic (d) and
foreign (x) markets, the corresponding set of equations to be jointly estimated is now:
7 Since the sum of the two variable inputs shares equals unity, the intermediate inputs share can be treated as a residual.
Page 12 of 36
Editorial Office, Dept of Economics, Warwick University, Coventry CV4 7AL, UK
Submitted Manuscript
123456789101112131415161718192021222324252627282930313233343536373839404142434445464748495051525354555657585960
peer
-005
8222
2, v
ersi
on 1
- 1
Apr 2
011
For Peer Review
12
( )
( ) ( )
*0 1 2 3 4
2
5 6 7 8
2 2
9 10 11
ln ln ln ln ln ln ln
1ln ln ln ln ln ln ln
2
1 1ln ln
2 2
j j d xjM
j j j j j jj j j
CC Y w K Y Y
P
Y w Y K w K Y
w K t
β β β β β
β β β β
β β β ε
= = + + + +
+ + + +
+ + + +
∑
∑ ∑ ∑ (7)
1 4 5 6 8(1 ) ln ln ln ln j d,xj j
j j j jj j j j
P Y + Y + w + K Y
Cµ ξβ β β β β−− = + + = (8a,8b)
ln ln lnL Lj2 5j 7 9
j
P X = + Y + K + w
Cτβ β β β +∑ (9)
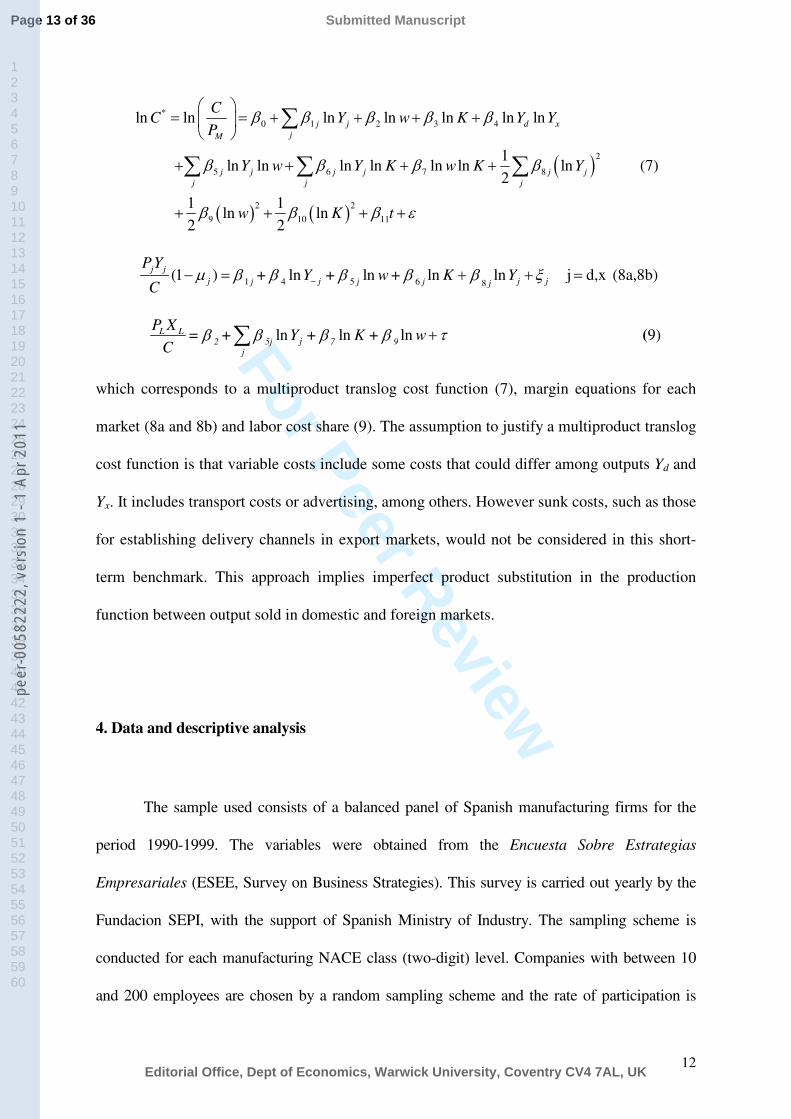
which corresponds to a multiproduct translog cost function (7), margin equations for each
market (8a and 8b) and labor cost share (9). The assumption to justify a multiproduct translog
cost function is that variable costs include some costs that could differ among outputs Yd and
Yx. It includes transport costs or advertising, among others. However sunk costs, such as those
for establishing delivery channels in export markets, would not be considered in this short-
term benchmark. This approach implies imperfect product substitution in the production
function between output sold in domestic and foreign markets.
4. Data and descriptive analysis
The sample used consists of a balanced panel of Spanish manufacturing firms for the
period 1990-1999. The variables were obtained from the Encuesta Sobre Estrategias
Empresariales (ESEE, Survey on Business Strategies). This survey is carried out yearly by the
Fundacion SEPI, with the support of Spanish Ministry of Industry. The sampling scheme is
conducted for each manufacturing NACE class (two-digit) level. Companies with between 10
and 200 employees are chosen by a random sampling scheme and the rate of participation is
Page 13 of 36
Editorial Office, Dept of Economics, Warwick University, Coventry CV4 7AL, UK
Submitted Manuscript
123456789101112131415161718192021222324252627282930313233343536373839404142434445464748495051525354555657585960
peer
-005
8222
2, v
ersi
on 1
- 1
Apr 2
011
For Peer Review
13
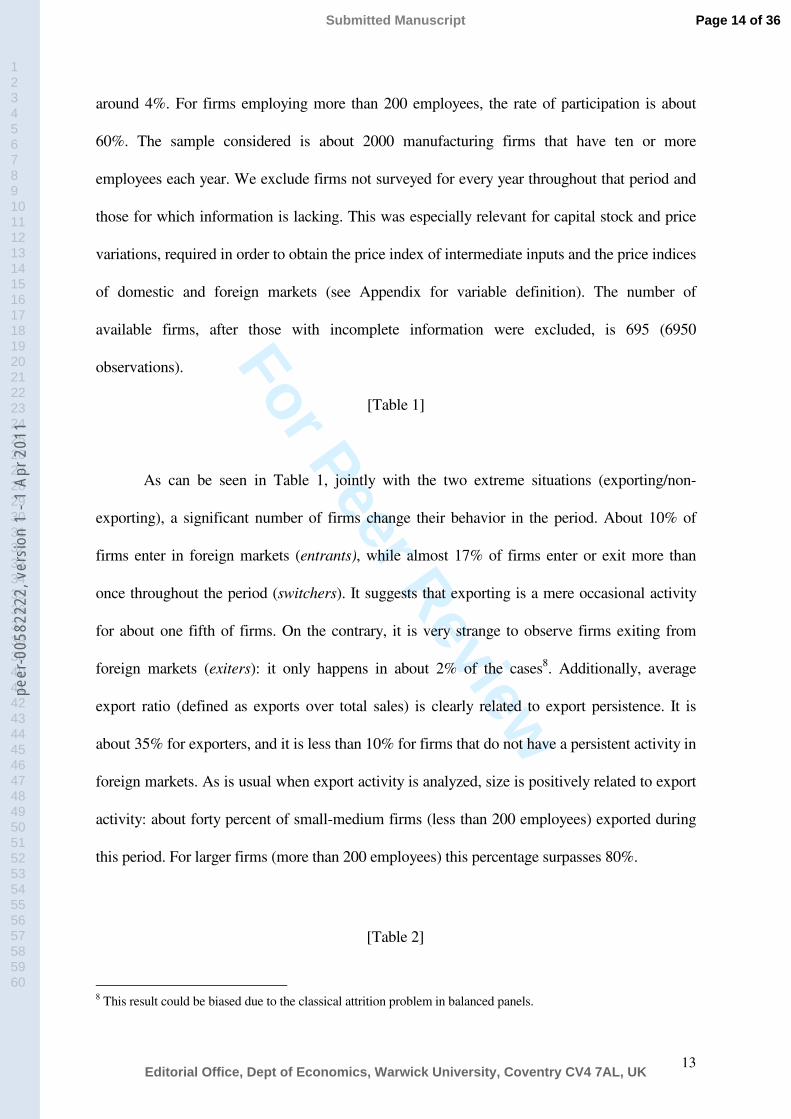
around 4%. For firms employing more than 200 employees, the rate of participation is about
60%. The sample considered is about 2000 manufacturing firms that have ten or more
employees each year. We exclude firms not surveyed for every year throughout that period and
those for which information is lacking. This was especially relevant for capital stock and price
variations, required in order to obtain the price index of intermediate inputs and the price indices
of domestic and foreign markets (see Appendix for variable definition). The number of
available firms, after those with incomplete information were excluded, is 695 (6950
observations).
[Table 1]
As can be seen in Table 1, jointly with the two extreme situations (exporting/non-
exporting), a significant number of firms change their behavior in the period. About 10% of
firms enter in foreign markets (entrants), while almost 17% of firms enter or exit more than
once throughout the period (switchers). It suggests that exporting is a mere occasional activity
for about one fifth of firms. On the contrary, it is very strange to observe firms exiting from
foreign markets (exiters): it only happens in about 2% of the cases8. Additionally, average
export ratio (defined as exports over total sales) is clearly related to export persistence. It is
about 35% for exporters, and it is less than 10% for firms that do not have a persistent activity in
foreign markets. As is usual when export activity is analyzed, size is positively related to export
activity: about forty percent of small-medium firms (less than 200 employees) exported during
this period. For larger firms (more than 200 employees) this percentage surpasses 80%.
[Table 2]
8 This result could be biased due to the classical attrition problem in balanced panels.
Page 14 of 36
Editorial Office, Dept of Economics, Warwick University, Coventry CV4 7AL, UK
Submitted Manuscript
123456789101112131415161718192021222324252627282930313233343536373839404142434445464748495051525354555657585960
peer
-005
8222
2, v
ersi
on 1
- 1
Apr 2
011
For Peer Review
14
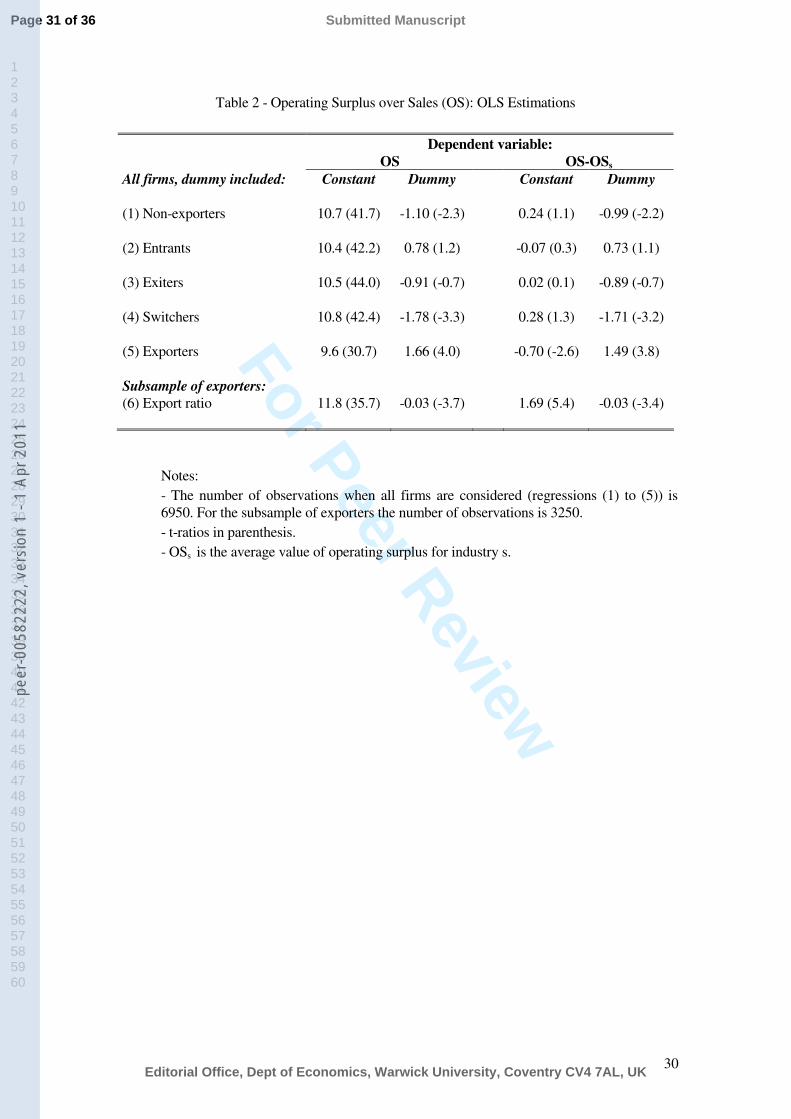
With the aim of obtaining a preliminary picture about differences in margins among
firms, we use a simple approach based on the correlation between an accounting indicator of
firm profits (Operating surplus over sales, OS) and export activity. The latter is measured with a
set of dummy variables that capture the degree of persistence in export activity according to
previously defined categories. The first two columns of Table 2 show the results of five
regressions where the dependent variable is the operating surplus and the explanatory variables
are a constant and the corresponding dummy. As can be seen, persistent exporters show larger
average surplus than the rest of firms, while the opposite result emerges for switchers and non-
exporters. Entrants (exiters) have margins above (below) average, though the differences are
non-significant in both cases.
These results could hide a composition bias: if the probability of being an exporter is
larger in industries with larger margins, then the previous comparison of average values is
reflecting inter-industry differences. To control it, the third and fourth columns of Table 2 show
five alternative estimations where the dependent variable is the deviation of operating surplus
with respect to the industry average. Industries are defined at two-digit level of the European
industrial classification (NACE) and it comprises twenty manufacturing activities. As can be
seen, there are not significant differences with respect to former estimates and, consequently,
the positive correlation between export activity and operating surplus seems to be robust to
inter-industry differences. This result is similar to those obtained by Bernard et al (2003) about
productivity advantages for exporters.
These descriptive results suggest that efficiency advantages for exporters prevail over
international competition effects. However, as was previously suggested, an interesting question
Page 15 of 36
Editorial Office, Dept of Economics, Warwick University, Coventry CV4 7AL, UK
Submitted Manuscript
123456789101112131415161718192021222324252627282930313233343536373839404142434445464748495051525354555657585960
peer
-005
8222
2, v
ersi
on 1
- 1
Apr 2
011
For Peer Review
15
is whether such efficiency effects imply that exporters have higher operating surplus
irrespective of the geographical market or, by the opposite, margins differ among them. The
sixth row in Table 2 shows the results for the subsample of persistent exporters, where a
constant and the export ratio have been included as explanatory variables. In this case a negative
relationship between the intensity of export activity and surplus arise, even when inter-industry
differences are controlled. This result could suggest that foreign margin is lower than domestic
margin for persistent exporter. The analysis in the next section assesses this question more
carefully.
5. Econometric results
In this section the theoretical benchmark explained in Section 3 is applied. We begin
by considering all firms, evaluating whether margins differ among different groups according
to the degree of persistence in export activity: non-exporters, entrants, exiters, switchers and
exporters. It implies to impose the same structure of costs for the entire sample. However,
dummy variables are introduced in the translog cost (equation (4)) and margin equation
(equation (5b)) to control for differences in technical conditions across industries.
Descriptive statistics for all variables and sub-samples are showed in Table A.1 of the
Appendix.
Table 3 shows the joint estimate of the translog cost function, the cost labor share and
the margin equation by the Generalised Method of Moments (GMM)9. We assume that firms
9 The estimations is carried by TSP program. Note that the margin equation is non-linear. This fact is considered in the joint estimation.
Page 16 of 36
Editorial Office, Dept of Economics, Warwick University, Coventry CV4 7AL, UK
Submitted Manuscript
123456789101112131415161718192021222324252627282930313233343536373839404142434445464748495051525354555657585960
peer
-005
8222
2, v
ersi
on 1
- 1
Apr 2
011
For Peer Review
16
are price-takers in variable input markets, so variable input prices are considered exogenous,
while endogeneity in sales is assumed. The estimation is carried out by instrumenting the
endogenous variables with their cross-section lagged values at t-2. The identification of the
parameters depends on whether lagged values of the endogenous variables are valid
instruments. The Sargan test of overidentifying restrictions, a test of instrument validity, is
presented at the bottom of the columns and the validity of instruments is accepted. Two
additional artificial dummies (Mov1 and Mov2) have been also included to control firms that
have experienced mergers or scissions during the period. The time trend in the estimate of the
cost function, whose associated parameter can be seen as technical progress, presents the
expected negative sign and a reasonable value (-1.6)10. Industrial dummies are also jointly
significant.
[Table 3]
With respect to margins, the first column in Table 3 shows the parameter µs,
calculated as the average of a set of 14 industrial dummies. The F-test showed at the bottom
of Table 3 confirms their significance. As we said above, a demand indicator is included to
consider the business cycle. An increase in this variable means an improvement in market
conditions. As can be seen, the parameter for firm indicator of demand evolution (Dit)
presents the expected positive sign, which suggests a procyclical behavior of margins. This
parameter, multiplied by the average value of demand evolution, and added to estimated
parameter µs, allows us to obtain an average margin of 11.2% for all firms in the complete
period.
10 When estimations are run for each group, exporter and non-exporters present values around -2.5, while the .../...
Page 17 of 36
Editorial Office, Dept of Economics, Warwick University, Coventry CV4 7AL, UK
Submitted Manuscript
123456789101112131415161718192021222324252627282930313233343536373839404142434445464748495051525354555657585960
peer
-005
8222
2, v
ersi
on 1
- 1
Apr 2
011
For Peer Review
17
In column 2, the margin is parameterised to take into account differences across firms
according to export behavior. Because we omit the dummy referred to non-exporters, the
coefficients for the other groups reflect the relative differences with respect to those firms that
do not export. The results indicate that entrants and persistent exporters show larger margins
than non-exporters. However, there are non significant differences between this last group
and those firms which exit or enter and exit (switchers) in foreign markets.
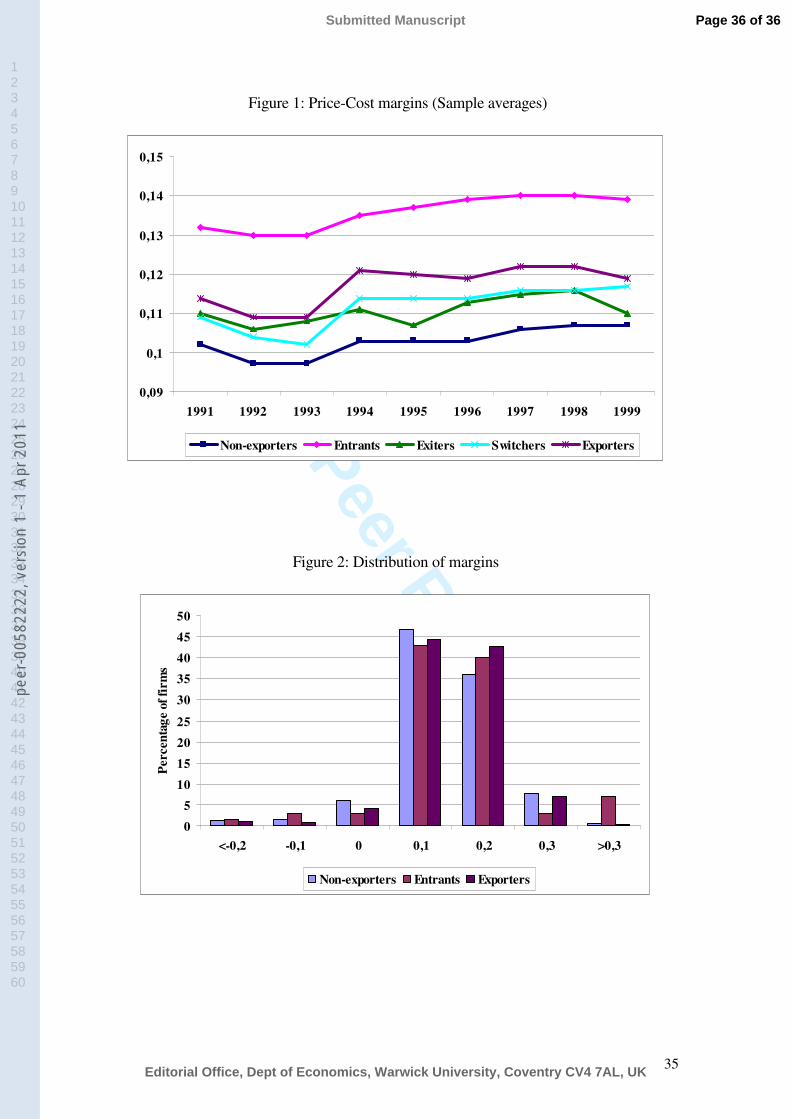
Figure 1 presents the sample average of the margins during the nineties by sub-samples.
In this case the values for demand evolution are specified for each group of firm and for each
year. Deviation from perfect competition is observed in all groups of firms, a result in line with
previous empirical research about firm margins (see Nishimura et al (1999)). In keeping with
the estimated coefficient of the evolution of demand in Table 3, the margins are procyclical and
show the smallest values in 1992-1993. This behavior is consistent with the cycle of the
European economy, which experienced a short recession in those years11.
[Figure 1]
The main result obtained is that persistent export activity seems to be associated with
larger margins. Specifically, while non-exporters have an average margin of around 10.4%, it is
about 12% for persistent exporters. This difference, significant at 99%, suggests that efficiency
advantages of exporters are also reflected in relative margins. From the estimates of Table 3,
and using equation (5b), it is possible to calculate the predicted margin for each firm. Figure 2
shows the distributions of the average margins for the period 1991-1999 for non-exporters,
.../...technical progress is smaller for exiters (-1.6) and switchers (-1.3). 11 Though there are theoretical arguments for both signs, the empirical evidence supports a positive relationship between the economic cycle and the margins. See, for example, Lima and Resendez (2004).
Page 18 of 36
Editorial Office, Dept of Economics, Warwick University, Coventry CV4 7AL, UK
Submitted Manuscript
123456789101112131415161718192021222324252627282930313233343536373839404142434445464748495051525354555657585960
peer
-005
8222
2, v
ersi
on 1
- 1
Apr 2
011
For Peer Review
18
entrants and exporters. All distributions are slightly skewed, with a large proportion of firms
with margins between 0 and 0.2. Comparing across different groups, we observe that there is a
bigger proportion of non-exporting firms with small margins. Entrants show the largest values,
which is related to the existence of a small share of firms with margins bigger than thirty
percent. These firms could be taking advantage of some product innovations which let them to
access to specific fringe of foreign demand. If that would be the case it seems reasonable to
expect that such margins would be reduced when they stay in export market for a longer period.
However, though technological effort is higher for these firms than for non-exporters, we do not
find significant differences between entrants and persistent exporters. We only observe that
entrants firms with small and medium size (less than 200 employees) are younger than
persistent exporters. Nevertheless, the average margin could be conditioned by extreme values,
due to the small number of firms that enter in the export activity.
[Figure 2]
The estimate of the translog cost function also allows us to obtain predictions for
output cost elasticities and the marginal cost for each firm. Using the sample average of the
share of labor cost and intermediate inputs to total variable costs, it is possible to calculate the
Allen-Uzawa partial elasticities of substitution, the own-price elasticities of demand and
returns to scale economies. As expected, price elasticities are negative and the inputs (labor
and intermediate materials) are substitutes. The scale elasticity value is equal to one
suggesting that firms seem to operate under constant returns to scale12.
[Table 4]
12 These results are available upon request.
Page 19 of 36
Editorial Office, Dept of Economics, Warwick University, Coventry CV4 7AL, UK
Submitted Manuscript
123456789101112131415161718192021222324252627282930313233343536373839404142434445464748495051525354555657585960
peer
-005
8222
2, v
ersi
on 1
- 1
Apr 2
011

For Peer Review
19
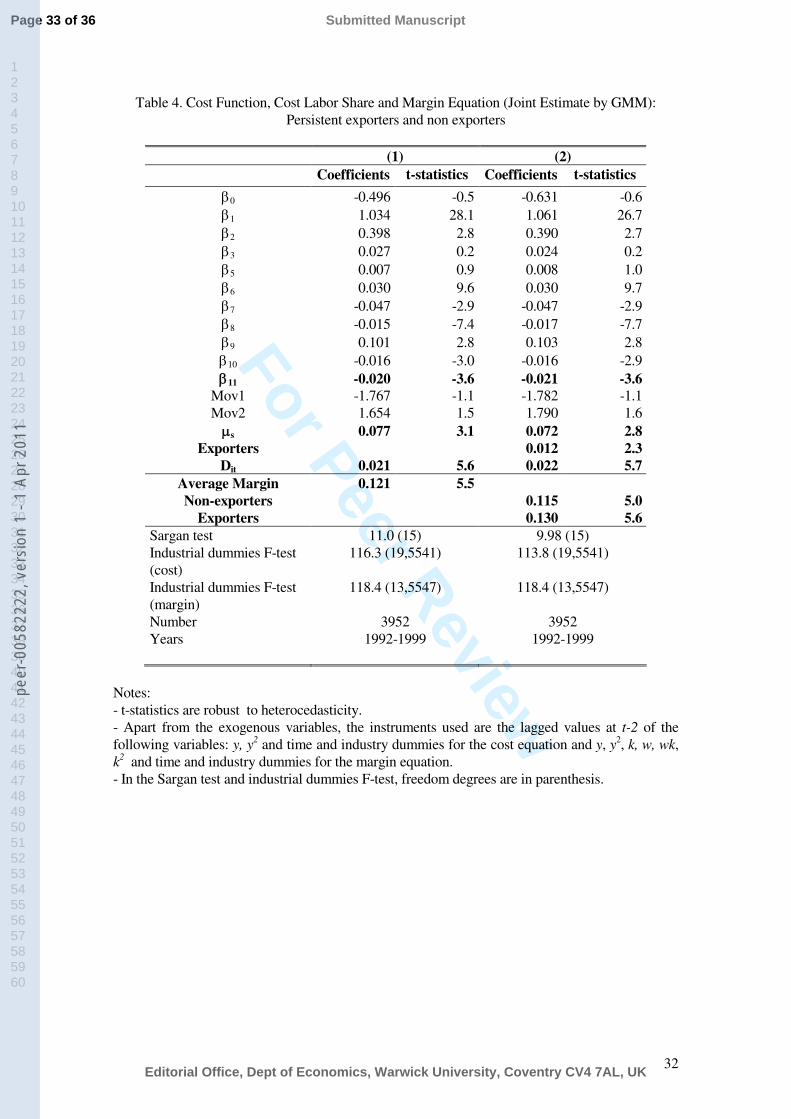
The above results suggest that export activity is positively related to margins.
However, the comparison among groups is affected by the non persistent pattern of groups 2,
3 and 4, which would share characteristics both of exporters and non-exporters. For that
reason a complementary estimate, restricted to groups 1 and 5, is shown in Table 4. The
results again show clear differences between persistent non-exporters and persistent
exporters. Is this a consequence of the kind of firms operating in both markets, or rather the
effect of market characteristics? To answer this question we focus our attention on persistent
exporters and those firms that start to export throughout the period. Because of the
multimarket characteristics of both groups, the use of a multiproduct cost function can
provide useful information. As was explained in Section 3, this approach allows us to
estimate the margin in domestic and foreign markets.
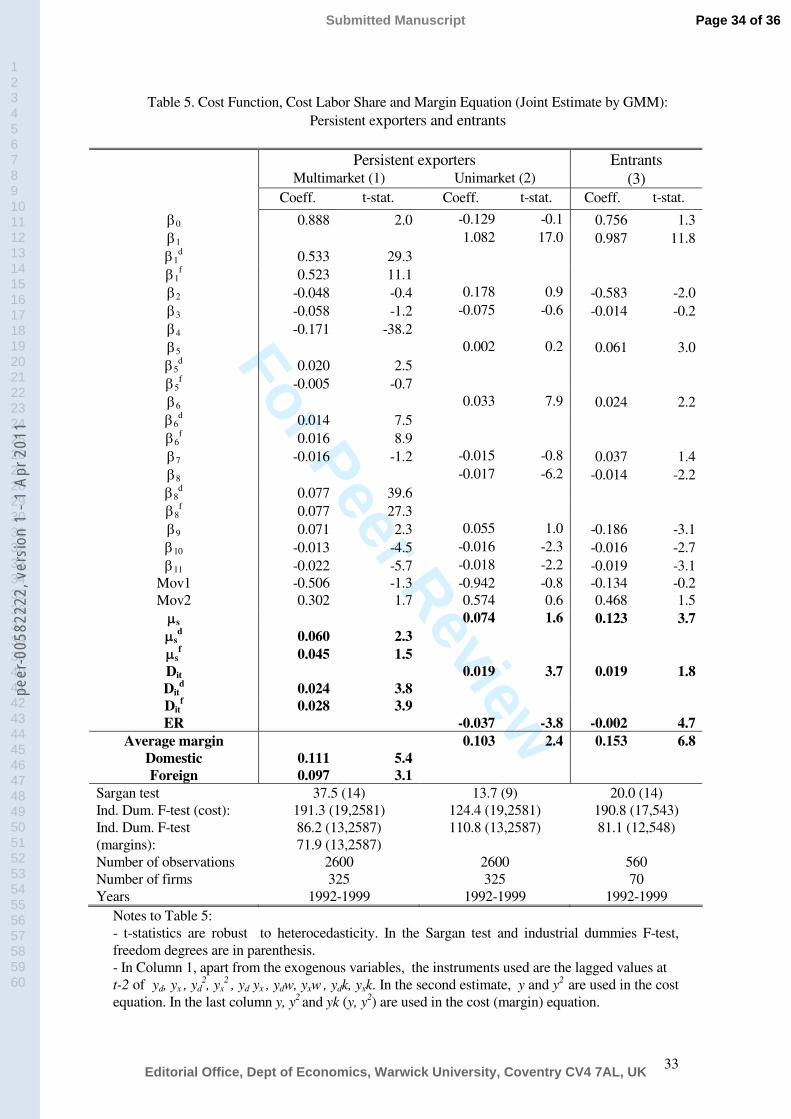
Table 5 presents the estimates for the group of firms that are persistent exporters.
These firms are multimarket by nature, given that all of them sell simultaneously in domestic
and export markets. It allows us to answer whether observed differences in margins among
exporters and non-exporters are due to efficiency advantages of the former or whether they
are the consequence of differences in competitive pressure among foreign and domestic
markets. In particular, the previous result about larger margins of exporters is not only
coherent with efficiency advantages for exporting firms, but also with a smaller competitive
pressure in foreign markets. To contrast this question we follow two different approaches.
Firstly, in column 1 we estimate jointly the translog multiproduct cost function (equation (7)),
the domestic and foreign margin equations (8a and 8b) and the cost labor share (equation (9)).
It lets to obtain margins differentiated across markets. In this case, we also introduce two
business cycle indicators, one for each market. Secondly, in column 2 we follow a unimarket
Page 20 of 36
Editorial Office, Dept of Economics, Warwick University, Coventry CV4 7AL, UK
Submitted Manuscript
123456789101112131415161718192021222324252627282930313233343536373839404142434445464748495051525354555657585960
peer
-005
8222
2, v
ersi
on 1
- 1
Apr 2
011
For Peer Review
20
approach, without distinguishing between domestic and foreign markets, but where the
margin is parameterised taking into account the intensity of export activity, measured as
export ratio (ER).
[Table 5]
As can be seen in column 1, the average price-cost margin in foreign markets is
smaller than margin in domestic destinations. This result is in line with those obtained by
Bernstein and Mohnen (1991), Bughin (1996) and Moreno and Rodríguez (2004).
Additionally, note that the estimated coefficient associated to lnYdlnYx (parameter β4) is
negative and significant, reflecting cost complementarities between both outputs: variable
cost due to one output declines as the other output grows13.
The approach used in column 2 supports the previous result about the effect of export
activity on margins for exporters. The coefficient of export ratio is negative: the bigger the
export intensity, the smaller the margin of exporters. It points out that exporting firms affront
larger competitive pressure in international markets. Given that we had obtained that
exporters have larger margins that non-exporters, we can conclude that efficiency advantages
dominate over competitive pressures for exporters.
With respect to entrants, though they are multimarket firms once they start to export,
there is a problem with zero values before to entering in foreign markets. Several solutions
have been provided when the objective is just to evaluate cost parameters. The most well-
13 The estimation also allows us to obtain predictions for output cost elasticities and marginal costs in each market. The export elasticity was smaller than the domestic: 0.398 and 0.595, respectively. As we expected, the marginal costs for output sold in foreign markets are slightly larger than marginal costs associated to productssold in domestic markets.
.../...
Page 21 of 36
Editorial Office, Dept of Economics, Warwick University, Coventry CV4 7AL, UK
Submitted Manuscript
123456789101112131415161718192021222324252627282930313233343536373839404142434445464748495051525354555657585960
peer
-005
8222
2, v
ersi
on 1
- 1
Apr 2
011
For Peer Review
21
known is the Generalized Multiproduct Cost Function (GMCF) that uses a Box-Cox metric to
transform zero values (Caves, Christensen and Tretheway (1980)). However, given that our
objective is to consider cost function in a joint system to estimate margins, zero values for
exports continues being a problem. Specifically, the left side of equation (8b) will be zero in
those years that entrants do not export. Although we can use the proposed approach to
estimate the cost equation, it is impossible to use it for the joint system.
Therefore, we just present an estimate where export ratio is included in the margin
parameterisation. The results, showed in column 3 of Table 5, are coherent with those
obtained for persistent exporters: export intensity affects negatively to margins. Note that we
are treating homogeneously to all firms, with independence whether they enter at the
beginning or at the end of the period. However, as was previously pointed out, the small
number of available observations for this group makes difficult to capture the dynamic
evolution of the effect of exporting behavior on margins.
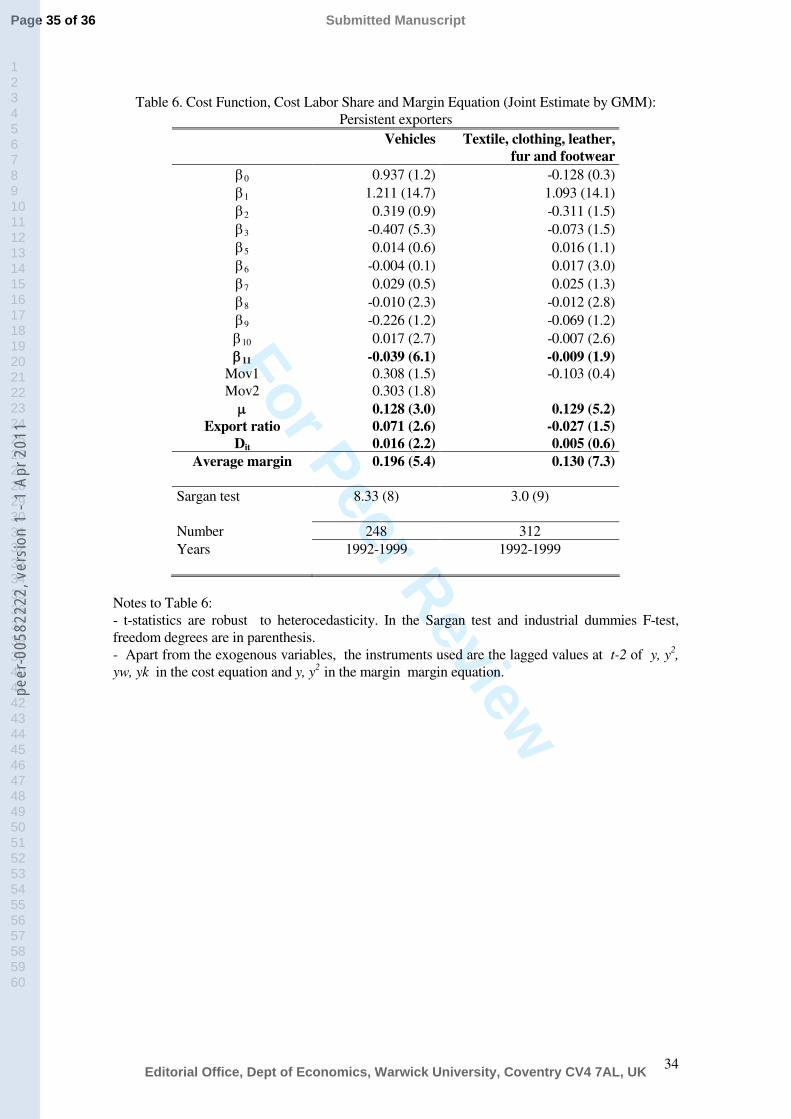
This restriction on data avalaibilty also difficults specific industry analysis to contrast
whether results obtained for persistent exporters can be generalized. Table 6 shows the results
for two of them with enough observations. As usual, inter-industry heterogeneity is
substantial. For the automobile industry, the larger the export ratio the larger is the average
margin. This result can be related to product differentiation, which could justify a bigger
margin whether firms make a profitable use of specific fringes of demand. Additionally, most
firms in this industry are multinationals and, in this sense, it is likely that they have market
power abroad. On the contrary, Textile industries show the same result that the manufacturing
.../...
Page 22 of 36
Editorial Office, Dept of Economics, Warwick University, Coventry CV4 7AL, UK
Submitted Manuscript
123456789101112131415161718192021222324252627282930313233343536373839404142434445464748495051525354555657585960
peer
-005
8222
2, v
ersi
on 1
- 1
Apr 2
011

For Peer Review
22
industry as a whole. This can indicate that firms in this activity behave as price-takers in
international markets. Majority of these firms are domestic-located and have not productive
plants in foreign countries.
[Table 6]
6. Conclusions
The empirical evidence strongly supports that exporters are more productive than non-
exporters. It is in accordance with theoretical predictions, which have emphasized the idea that
only more productive firms enter in export markets because they generate enough revenues to
cover sunk costs associated to this activity. However, there is scarce evidence about the effects
of export activity on firm margins. While most theoretical papers have assumed fixed markups,
more recent research has considered them as endogeneous. In particular, Melitz and Ottaviano
(2005) consider two potential effects in firm margins related to export activity. On the one hand,
more productive firms use efficiency advantages to set larger margins. On the other hand, this
selection effect is outweighted by the pro-competitive effect related to entry in international
markets.
This paper analyzes this issue using a structural approach to identify price-cost margin
among groups of firms. These are defined according to the degree of persistence in export
activity. The results point out that exporting firms, both persistent exporters and entrants, set
larger margins than non-exporters. It suggests that efficiency advantages found in previous
empirical evidence are transmitted to mark-ups. The comparison of some relevant variables
between exporters and non-exporters provides some clues about what exporters do with these
Page 23 of 36
Editorial Office, Dept of Economics, Warwick University, Coventry CV4 7AL, UK
Submitted Manuscript
123456789101112131415161718192021222324252627282930313233343536373839404142434445464748495051525354555657585960
peer
-005
8222
2, v
ersi
on 1
- 1
Apr 2
011

For Peer Review
23
larger margins. Specifically, the relative average wages are 46.7% larger for exporters, which
are also much more technological intensive than non-exporters. For example, while the share of
staff employed in R&D activities (over total employment) is 2.55% for persistent exporters, it is
only 0.51% for non-exporters. This result should be considered carefully because export and
technological activities are surely simultaneous decisions for firms.
Additionally, when the analysis is confined to exporting firms, we obtain that margins in
foreign markets are smaller than those related to domestic markets. It suggests that the pro-
competitive effect is relevant: exporters affront larger competitive pressures in international
markets. However, this negative effect related to the exposure to foreign markets does not
dominate over the positive effect related to efficiency advantages. This result is in line with
Görg and Warzynski (2003) who, using a different approach, found that UK exporters have
higher mark-ups than non-exporters for differentiated goods.
Page 24 of 36
Editorial Office, Dept of Economics, Warwick University, Coventry CV4 7AL, UK
Submitted Manuscript
123456789101112131415161718192021222324252627282930313233343536373839404142434445464748495051525354555657585960
peer
-005
8222
2, v
ersi
on 1
- 1
Apr 2
011
For Peer Review
24
Appendix: Variable definitions and descriptive statistics
OS (Operating surplus): Value of gross output minus variable costs of production divided by
the value of total sales. The gross output value is computed as sales + stock variation + other
revenues, and the variable costs of production as intermediate consumption (raw materials and
services) + labor costs.
ER (Export ratio): Proportion of exports over total sales.
C (Variable costs): The sum of intermediate consumption (raw materials purchases, energy and
fuel costs and other external services) plus labor costs minus the stock variation.
W (Cost per worker relative to price of intermediate inputs): PL/PM, where:
PM (Price index for intermediate inputs): It is calculated as a Paasche index, weighting the price
variations of raw materials, energy and services purchased of surveyed firms.
PL (Cost per worker): Labor cost divided by the average workers of the firm during the year.
Y (Output sold): It is calculated by deflating nominal sales by price (P).
Yx (Output sold on the export market): It is calculated by deflating nominal exports by export
price (Px).
Yd (Output sold on the domestic market): It is calculated by deflating nominal domestic sales by
domestic price (Pd). Domestic sales are the total sales of the firm minus its exports.
P, Pd and Px (Price index for output sold in all markets, in domestic and foreign markets): The
surveyed firms give annual information about markets served (up to five), identifying their
relative importance (in percentage) in total sales of the firm. Additionally, each firm identifies
the geographical area and the variation of price with respect to the previous year. This
information allows us to calculate a price index for all markets and for each market, using the
proportions with respect to total sales as weighting.
K (Capital stock): It is net stock of capital for equipment in real terms. It is calculated by using
Page 25 of 36
Editorial Office, Dept of Economics, Warwick University, Coventry CV4 7AL, UK
Submitted Manuscript
123456789101112131415161718192021222324252627282930313233343536373839404142434445464748495051525354555657585960
peer
-005
8222
2, v
ersi
on 1
- 1
Apr 2
011
For Peer Review
25
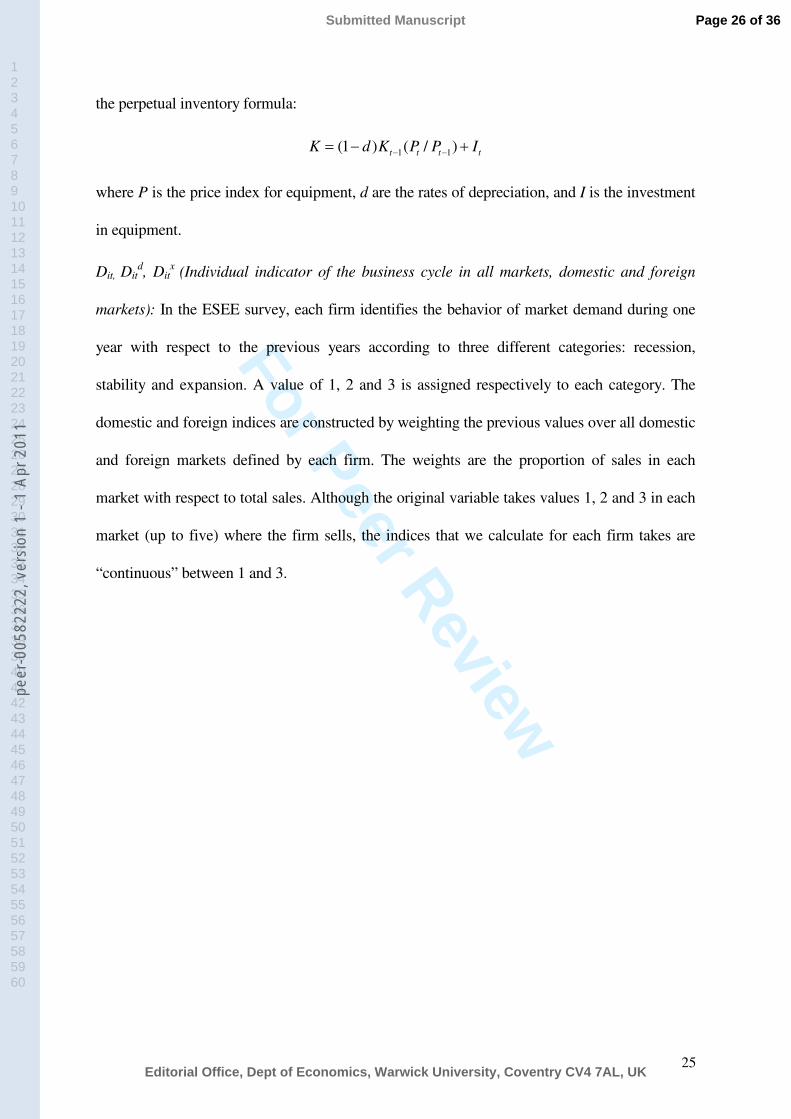
the perpetual inventory formula:
1 1(1 ) ( / )t t t tK d K P P I− −= − +
where P is the price index for equipment, d are the rates of depreciation, and I is the investment
in equipment.
Dit, Ditd, Dit
x (Individual indicator of the business cycle in all markets, domestic and foreign
markets): In the ESEE survey, each firm identifies the behavior of market demand during one
year with respect to the previous years according to three different categories: recession,
stability and expansion. A value of 1, 2 and 3 is assigned respectively to each category. The
domestic and foreign indices are constructed by weighting the previous values over all domestic
and foreign markets defined by each firm. The weights are the proportion of sales in each
market with respect to total sales. Although the original variable takes values 1, 2 and 3 in each
market (up to five) where the firm sells, the indices that we calculate for each firm takes are
“continuous” between 1 and 3.
Page 26 of 36
Editorial Office, Dept of Economics, Warwick University, Coventry CV4 7AL, UK
Submitted Manuscript
123456789101112131415161718192021222324252627282930313233343536373839404142434445464748495051525354555657585960
peer
-005
8222
2, v
ersi
on 1
- 1
Apr 2
011

For Peer Review
26
Table A.1
Variable descriptive firms (logarithmic variations rates, 1991-99)
All firms Non-exporters Entrants Exiters Switchers ExportersOutput (volume terms) 4.2 2.1 5.8 1.7 4.9 4.9
Output (nominal terms) 5.6 3.6 7.4 2.7 6.1 6.3
Cost per worker (PL) 4.9 4.8 4.9 4.5 4.5 5.1
Price index for intermediate inputs 3.3 3.6 3.2 3.3 3.6 3.0
Stock of real capital 8.2 7.2 11.4 7.1 8.9 7.9
Variable cost 5.9 4.1 7.1 2.3 6.3 6.6
Page 27 of 36
Editorial Office, Dept of Economics, Warwick University, Coventry CV4 7AL, UK
Submitted Manuscript
123456789101112131415161718192021222324252627282930313233343536373839404142434445464748495051525354555657585960
peer
-005
8222
2, v
ersi
on 1
- 1
Apr 2
011
For Peer Review
27
References
Aw, B.A., Chen, X. and M.J. Roberts (2001): “Firm-level Evidence on Productivity Differentials and Turnover in Taiwanase Manufacturing”, Journal of Development Economics, 66, pp 51-86.
Bernard, A., Eaton, J. and J. Jensen (1999): “Exceptional exporter performance: cause, effect, or both?”, Journal of International Economics, 473, pp. 1-25.
Bernard, A., Eaton, J., Jensen, J. and S. Kortum (2003): “Plants and Productivity in International Trade”, American Economic Review, 93, pp. 1268-1290.
Bernstein, J. and P. Mohnen (1991): "Price-Cost Margins, Exports and Productivity growth: with an Application to Canadian Industries," Canadian Journal of Economics, 24, pp. 638-659.
Bughin, J. (1996): "Capacity Constraints and Export Performance: Theory and Evidence from Belgian Manufacturing," Journal of Industrial Economics, 44, pp. 187-204.
Caves, D.W., Christensen, L.R. and M.W. Tretheway (1980): "Flexible costs functions for multiproduct firms," Review of Economic and Statistics, 62, pp. 467-481.
Caves, R.E., Porter, M. and A.M. Spence (1980): Competition in the Open Economy: A Model Applied to Canada, Cambridge MA, Harvard University Press.
Delgado, M., Fariñas, J.C. and S. Ruano (2003): “Firm productivity and export markets: a nonparametric approach”, Journal of International Economics, 57, pp. 397-422.
Egger, H. and P. Egger (2004): “On the Relationship Between International Outsourcing and Price-cost Margins in European Industries”, Review of Industrial Organization, 25(1),45-69.
Geroski, P. (1982): “Simultaneous equations models of the structure-performance paradigm,” European Economic Review, 19, pp.145-158.
Girma, S., D. Greenaway and R. Kneller (2004): “Does exporting increase productivity? A Microeconometric Analysis of Matched Firms”, Review of International Economics, 12 (5), pp. 855-866.
Girma, S., H. Görg and E. Strobl (2004): “Exports, international investment, and plant performance: evidence from a non-parametric test”, Economic Letters, 83, pp. 317-324.
Görg, H. and F. Warzynski (2003): “Price Cost Margins and Exporting Behaviour: Evidence from firm level data”, Research Paper Levelhulme Centre 2003/24.
Lima, M. and M. Resendez (2004): “Profit margins and business cycles in the Brazilian industry: a panel data study”, Applied Economics 36, pp. 923–930.
Melitz, M.J. (2003): “The impact of trade on intra-industry reallocations and aggregate industry productivity”, Econometrica, 71, 6, pp. 1695-1725.
Melitz, M. J. and G.I.P. Ottaviano (2005): "Market Size, Trade, and Productivity". NBER Working Paper Series, 11393 (forthcoming in The Review of Economic Studies).
Moreno, L. and D. Rodríguez (2004): “Domestic and Foreign Price-Marginal Cost Margins: An Application to Spanish Manufacturing Firms”, Review of International Economics, 12 (1), pp. 60-80.
Nishimura, K., Ohkusa, Y. and K. Ariga (1999): “Estimating the mark-up over marginal cost: a
Page 28 of 36
Editorial Office, Dept of Economics, Warwick University, Coventry CV4 7AL, UK
Submitted Manuscript
123456789101112131415161718192021222324252627282930313233343536373839404142434445464748495051525354555657585960
peer
-005
8222
2, v
ersi
on 1
- 1
Apr 2
011
For Peer Review
28
panel analysis of Japanese firms 1971-74,” International Journal of Industrial Organization, 17, pp. 1077-1111.
Ottaviano, G.I.P., T. Tabuchi and J.-F. Thisse (2002): “Agglomeration and Trade Revisited”, International Economic Review 43, pp. 409-436.
Roberts, M. and J. Tybout (1997): “The decision to export in Colombia: An Empirical Model of Entry with Sunk Costs”, American Economic Review, 87 (4), pp. 545-564.
Roeger, W. (1995): “Can imperfect Competition Explain the Difference between Primal and Dual Productivity Measures? Estimates for U.S. Manufacturing”, Journal of Political Economy 103, pp. 316-330.
Stalhammar, N. (1991):"Domestic market power and foreign trade: The case of Sweden,” International Journal of Industrial Organization, 9, pp. 407-424.
Tybout, J. (2001): “Plant and firm-level evidence on “New” Trade Theories”, NBER 8418.
Wagner, J. (2007): “Exports and Productivity: A Survey of the Evidence from Firm-level Data”, The World Economy 30 (1), pp.60–82.
Page 29 of 36
Editorial Office, Dept of Economics, Warwick University, Coventry CV4 7AL, UK
Submitted Manuscript
123456789101112131415161718192021222324252627282930313233343536373839404142434445464748495051525354555657585960
peer
-005
8222
2, v
ersi
on 1
- 1
Apr 2
011

For Peer Review
29
Table 1. Descriptive statistics across type of firms
Non-exporters Entrants Exiters Switchers ExportersExport ratio 0 4.5 2.2 5.7 34.6
Export ratio (only exports > 0)
(Observations with export > 0)
0
(0)
8.1
(388)
5.2
(73)
12.1
(540)
34.6
(3250)
Size (number of employees) 40.6 158.1 219.2 144.1 388.7
Total observations 1690 700 170 1140 3250
Page 30 of 36
Editorial Office, Dept of Economics, Warwick University, Coventry CV4 7AL, UK
Submitted Manuscript
123456789101112131415161718192021222324252627282930313233343536373839404142434445464748495051525354555657585960
peer
-005
8222
2, v
ersi
on 1
- 1
Apr 2
011
For Peer Review
30
Table 2 - Operating Surplus over Sales (OS): OLS Estimations
Dependent variable:OS OS-OSs
All firms, dummy included: Constant Dummy Constant Dummy
(1) Non-exporters 10.7 (41.7) -1.10 (-2.3) 0.24 (1.1) -0.99 (-2.2)
(2) Entrants 10.4 (42.2) 0.78 (1.2) -0.07 (0.3) 0.73 (1.1)
(3) Exiters 10.5 (44.0) -0.91 (-0.7) 0.02 (0.1) -0.89 (-0.7)
(4) Switchers 10.8 (42.4) -1.78 (-3.3) 0.28 (1.3) -1.71 (-3.2)
(5) Exporters 9.6 (30.7) 1.66 (4.0) -0.70 (-2.6) 1.49 (3.8)
Subsample of exporters:(6) Export ratio 11.8 (35.7) -0.03 (-3.7) 1.69 (5.4) -0.03 (-3.4)
Notes:- The number of observations when all firms are considered (regressions (1) to (5)) is 6950. For the subsample of exporters the number of observations is 3250.- t-ratios in parenthesis.- OSs is the average value of operating surplus for industry s.
Page 31 of 36
Editorial Office, Dept of Economics, Warwick University, Coventry CV4 7AL, UK
Submitted Manuscript
123456789101112131415161718192021222324252627282930313233343536373839404142434445464748495051525354555657585960
peer
-005
8222
2, v
ersi
on 1
- 1
Apr 2
011

For Peer Review
31
Table 3. Cost Function, Cost Labor Share and Margin Equation (Joint Estimate by GMM).
(1) (2)Coefficients t-statistics Coefficients t-statistics
β0 -0.378 -0.5 -0.453 -0.6β1 1.034 32.2 1.052 31.5β2 0.204 1.5 0.205 1.5β3 -0.024 -0.3 -0.030 -0.4β5 0.010 1.5 0.010 1.4β6 0.027 9.2 0.028 9.5β7 -0.012 -0.7 -0.011 -0.7β8 -0.014 -7.4 -0.015 -7.8β9 -0.001 -0.0 -0.001 -0.0β10 -0.014 -3.8 -0.014 -3.8β11 -0.016 -2.1 -0.016 -2.1
Mov1 -2.496 -1.5 -2.490 -1.5Mov2 1.687 1.6 1.761 1.7µs 0.066 3.0 0.060 2.7
Entrants 0.030 3.8Exiters 0.006 0.7
Switchers 0.007 1.1Exporters 0.011 2.1
Dit 0.022 6.7 0.022 6.6Average Margin 0.112 5.6Non-exporters 0.104 5.2
Entrants 0.136 6.5Exiters 0.111 5.3
Switchers 0.112 5.3Exporters 0.118 5.9
Sargan test 14.9 (13) 13.7 (13) Industrial dummies F-test (cost)
78.6 (19,5541) 77.9 (19,5541)
Industrial dummies F-test (margin)
83.5 (13,5547) 85.8 (13,5547)
Number 5560 5560Years 1992-1999 1992-1999
Notes:- t-statistics are robust to heterocedasticity. - Apart from the exogenous variables, the instruments used are the lagged values at t-2 of the following variables: y, y2 and time and industry dummies for the cost equation and y, y2, k, w and time and industry dummies for the margin equation. - In the Sargan test and industrial dummies F-test, freedom degrees are in parenthesis.
Page 32 of 36
Editorial Office, Dept of Economics, Warwick University, Coventry CV4 7AL, UK
Submitted Manuscript
123456789101112131415161718192021222324252627282930313233343536373839404142434445464748495051525354555657585960
peer
-005
8222
2, v
ersi
on 1
- 1
Apr 2
011
For Peer Review
32
Table 4. Cost Function, Cost Labor Share and Margin Equation (Joint Estimate by GMM):Persistent exporters and non exporters
(1) (2)Coefficients t-statistics Coefficients t-statistics
β0 -0.496 -0.5 -0.631 -0.6β1 1.034 28.1 1.061 26.7β2 0.398 2.8 0.390 2.7β3 0.027 0.2 0.024 0.2β5 0.007 0.9 0.008 1.0β6 0.030 9.6 0.030 9.7β7 -0.047 -2.9 -0.047 -2.9β8 -0.015 -7.4 -0.017 -7.7β9 0.101 2.8 0.103 2.8β10 -0.016 -3.0 -0.016 -2.9β11 -0.020 -3.6 -0.021 -3.6
Mov1 -1.767 -1.1 -1.782 -1.1Mov2 1.654 1.5 1.790 1.6µs 0.077 3.1 0.072 2.8
Exporters 0.012 2.3Dit 0.021 5.6 0.022 5.7
Average Margin 0.121 5.5Non-exporters 0.115 5.0
Exporters 0.130 5.6Sargan test 11.0 (15) 9.98 (15) Industrial dummies F-test (cost)
116.3 (19,5541) 113.8 (19,5541)
Industrial dummies F-test (margin)
118.4 (13,5547) 118.4 (13,5547)
Number 3952 3952Years 1992-1999 1992-1999
Notes:- t-statistics are robust to heterocedasticity. - Apart from the exogenous variables, the instruments used are the lagged values at t-2 of the following variables: y, y2 and time and industry dummies for the cost equation and y, y2, k, w, wk,k2 and time and industry dummies for the margin equation. - In the Sargan test and industrial dummies F-test, freedom degrees are in parenthesis.
Page 33 of 36
Editorial Office, Dept of Economics, Warwick University, Coventry CV4 7AL, UK
Submitted Manuscript
123456789101112131415161718192021222324252627282930313233343536373839404142434445464748495051525354555657585960
peer
-005
8222
2, v
ersi
on 1
- 1
Apr 2
011
For Peer Review
33
Table 5. Cost Function, Cost Labor Share and Margin Equation (Joint Estimate by GMM): Persistent exporters and entrants
Persistent exporters Entrants Multimarket (1) Unimarket (2) (3)
Coeff. t-stat. Coeff. t-stat. Coeff. t-stat.
β0 0.888 2.0 -0.129 -0.1 0.756 1.3 β1 1.082 17.0 0.987 11.8 β1
d 0.533 29.3β1
f 0.523 11.1β2 -0.048 -0.4 0.178 0.9 -0.583 -2.0 β3 -0.058 -1.2 -0.075 -0.6 -0.014 -0.2 β4 -0.171 -38.2β5 0.002 0.2 0.061 3.0 β5
d 0.020 2.5β5
f -0.005 -0.7β6 0.033 7.9 0.024 2.2 β6
d 0.014 7.5β6
f 0.016 8.9β7 -0.016 -1.2 -0.015 -0.8 0.037 1.4 β8 -0.017 -6.2 -0.014 -2.2 β8
d 0.077 39.6β8
f 0.077 27.3β9 0.071 2.3 0.055 1.0 -0.186 -3.1 β10 -0.013 -4.5 -0.016 -2.3 -0.016 -2.7 β11 -0.022 -5.7 -0.018 -2.2 -0.019 -3.1
Mov1 -0.506 -1.3 -0.942 -0.8 -0.134 -0.2 Mov2 0.302 1.7 0.574 0.6 0.468 1.5 µs 0.074 1.6 0.123 3.7µs
d 0.060 2.3µs
f 0.045 1.5Dit 0.019 3.7 0.019 1.8Dit
d 0.024 3.8Dit
f 0.028 3.9ER -0.037 -3.8 -0.002 4.7
Average margin 0.103 2.4 0.153 6.8Domestic Foreign
0.1110.097
5.43.1
Sargan test 37.5 (14) 13.7 (9) 20.0 (14)Ind. Dum. F-test (cost): 191.3 (19,2581) 124.4 (19,2581) 190.8 (17,543)Ind. Dum. F-test (margins):
86.2 (13,2587)71.9 (13,2587)
110.8 (13,2587)
Number of observations 2600 2600
81.1 (12,548)
560Number of firms 325 325 70Years 1992-1999 1992-1999 1992-1999
Notes to Table 5: - t-statistics are robust to heterocedasticity. In the Sargan test and industrial dummies F-test, freedom degrees are in parenthesis.- In Column 1, apart from the exogenous variables, the instruments used are the lagged values at t-2 of yd, yx , yd
2, yx2 , yd yx , ydw, yxw , ydk, yxk. In the second estimate, y and y2 are used in the cost
equation. In the last column y, y2 and yk (y, y2) are used in the cost (margin) equation.
Page 34 of 36
Editorial Office, Dept of Economics, Warwick University, Coventry CV4 7AL, UK
Submitted Manuscript
123456789101112131415161718192021222324252627282930313233343536373839404142434445464748495051525354555657585960
peer
-005
8222
2, v
ersi
on 1
- 1
Apr 2
011
For Peer Review
34
Table 6. Cost Function, Cost Labor Share and Margin Equation (Joint Estimate by GMM):Persistent exporters
Vehicles Textile, clothing, leather, fur and footwear
β0 0.937 (1.2) -0.128 (0.3)β1 1.211 (14.7) 1.093 (14.1)β2 0.319 (0.9) -0.311 (1.5)β3 -0.407 (5.3) -0.073 (1.5)β5 0.014 (0.6) 0.016 (1.1)β6 -0.004 (0.1) 0.017 (3.0)β7 0.029 (0.5) 0.025 (1.3)β8 -0.010 (2.3) -0.012 (2.8)β9 -0.226 (1.2) -0.069 (1.2)β10 0.017 (2.7) -0.007 (2.6)β11 -0.039 (6.1) -0.009 (1.9)
Mov1 0.308 (1.5) -0.103 (0.4)Mov2 0.303 (1.8)µ 0.128 (3.0) 0.129 (5.2)
Export ratio 0.071 (2.6) -0.027 (1.5)Dit 0.016 (2.2) 0.005 (0.6)
Average margin 0.196 (5.4) 0.130 (7.3)
Sargan test 8.33 (8) 3.0 (9)
Number 248 312Years 1992-1999 1992-1999
Notes to Table 6: - t-statistics are robust to heterocedasticity. In the Sargan test and industrial dummies F-test, freedom degrees are in parenthesis.- Apart from the exogenous variables, the instruments used are the lagged values at t-2 of y, y2, yw, yk in the cost equation and y, y2 in the margin margin equation.
Page 35 of 36
Editorial Office, Dept of Economics, Warwick University, Coventry CV4 7AL, UK
Submitted Manuscript
123456789101112131415161718192021222324252627282930313233343536373839404142434445464748495051525354555657585960
peer
-005
8222
2, v
ersi
on 1
- 1
Apr 2
011
For Peer Review
35
Figure 1: Price-Cost margins (Sample averages)
0,09
0,1
0,11
0,12
0,13
0,14
0,15
1991 1992 1993 1994 1995 1996 1997 1998 1999
Non-exporters Entrants Exiters Switchers Exporters
Figure 2: Distribution of margins
0
5
10
15
20
25
30
35
40
45
50
<-0,2 -0,1 0 0,1 0,2 0,3 >0,3
Per
cent
age
of fi
rms
Non-exporters Entrants Exporters
Page 36 of 36
Editorial Office, Dept of Economics, Warwick University, Coventry CV4 7AL, UK
Submitted Manuscript
123456789101112131415161718192021222324252627282930313233343536373839404142434445464748495051525354555657585960
peer
-005
8222
2, v
ersi
on 1
- 1
Apr 2
011