Addressing Persistence of Community College Students to ...
171
ADDRESSING THE USE OF COACHING OF DEVELOPMENTAL EDUCATION STUDENTS TO INCREASE RETENTION RATES by Dientje Francis-Lawrence A dissertation submitted to Johns Hopkins University in conformity with the requirements for the degree of Doctor of Education. Baltimore, Maryland December 2021
-
Upload
khangminh22 -
Category
Documents
-
view
2 -
download
0
Transcript of Addressing Persistence of Community College Students to ...

L
ADDRESSING THE USE OF COACHING OF DEVELOPMENTAL EDUCATION
STUDENTS TO INCREASE RETENTION RATES
by
Dientje Francis-Lawrence
A dissertation submitted to Johns Hopkins University in conformity with the
requirements for the degree of Doctor of Education.
Baltimore, Maryland
December 2021

�����
ii
Abstract
Students selected for developmental education courses achieve lower than average
completion rates within community colleges. Coaching programs that help these students
navigate the college environment can improve student academic performance and
retention. Using data from a coaching program at a mid-sized community college, this
mixed-methods study of developmental education students in the program investigated
the relationship between coaching, academic performance, self-efficacy, and retention.
Student retention, term GPA, attempted versus completed credits, and perceptions of self-
efficacy, goal-setting influence on retention were explored. Results of the Chi Square test
revealed a significant difference between groups, in favor of the treatment group. While
no significant difference was found between attempted versus completed credits or for
GPA, students in the coaching program, overall, had higher GPAs than those who were in
the control group. Students and coaches also held the perception that student self-efficacy
increased, that goal setting was an important part of coaching, and finding students the
right resources, active listening, asking powerful questions, and controlling for bias were
helpful in building the coach-student relationship. New themes emerged that has
implications for future research: (1) coaching influence on academic success markers
such as GPA and credit accumulation; (2) coaching influence on grit, self-efficacy and
self-advocacy and the elements of the coaching relationship that influence these factors;
(3) coach characteristics, motivation and connection to student; (4) influence of coaching
session length and frequency on students outcomes; (5) elements of coach training that
influence outcomes; (6) benefits of the coaching relationship to the coach.
Dissertation Adviser: Dr. Wendy Drexler

�����
iii
Signatures
�����
iv
Acknowledgements
I am so very grateful to the people who cheered me, guided me, consoled me,
problem-solved with me, and most of all never gave up on me during this program.
Before I began this journey, I thought I was a gritty person with the strength to overcome
almost anything in pursuit of my goals. Thank you to each of you for helping me keep the
faith during this journey.
Dr. Wendy Drexler stood by me for more than five years as I struggled to manage
natural disasters, unwell parents, parenting three small children with academic needs of
their own, and a professional career that never let up. She coached and cajoled me
forward at each turn and served as the principal guide for the research questions I
explored. Dr. Camille Bryant showed me the way forward when I hit a wall on
methodology and analysis and calmed me down when I became overwhelmed with the
design of this study. Dr. Mary-Beth Furst helped me find a site that I completed this study
at, after I had lost access to the first two sites I found. Dr. Pape taught me that my writing
and critical thinking could always be improved, and I am truly proud of the writer I have
become.
A huge thank you goes to Eileen Kaplan, Dr. Matthew J. Van Hoose, Christi
Ewing, and the HCC team who approved the site and provided access to the data for this
study. They agreed to help me when I was an absolute stranger and their patience and
kindness in supporting me on this journey will forever have my gratitude and
appreciation. You are truly amazing people.

�����
v
To my colleagues who helped me find funding for tuition, devote time to do my
work and believed in my leadership skills: Laura Cook, Genevieve Schettino, Neil
Allison, Jonathan Chocqueel-Mangan, and Rod Bristow, thank you for your support.
I am indeed blessed to have friends who stood by me, DVNHG�PH�FRQVWDQWO\�³DUH�
\RX�GRQH�\HW"´��DQG�EHOLHYHG�LQ�PH�ZLWKRXW�ZDYHULQJ��0LFKHOOH�+HQGHUVRQ-Delsol,
Kulsum Qasim, Salwa Bahumri, Khaliah Fleming, Denise James, Philip Modest, and
Janis Modest, thank you for your unwavering support. Khaliah and Salwa, we were in the
trenches together as part of the 2015 cohort!
Finally, to my tribe of a family, thank you so much. To my aunts and uncles who
never missed a chance to tell me how proud they were of me; to my parents-in-law who
have always supported me; to my siblings, Nigel, Debra, CJ, and Dennize who are my
biggest fans; to my parents, Clem and Therese Francis, who taught me the value of an
education and of hard work: thank you for supporting me in word and deed these last six
years. To my dear children, Iris, Noah, and Zion, who had a million questions and always
seemed to find just the right moment to interrupt my train of thought; thank you for being
my inspiration, as I tried to be a role model to you even as I helped you navigate your
own academic paths. To my loving husband, Jaworrah, who never let me give up even
though he had to parent alone many nights and weekends as I tried to manage my
coursework and then my dissertation. As we celebrate 15 years next month, I am
reminded how blessed I am to have you as a partner on this journey of life.
I am so eternally grateful to each of you for your help and support. Thank you.

�����
vi
Table of Contents
$EVWUDFW ................................................................................................................ LL
6LJQDWXUHV ............................................................................................................ LLL
$FNQRZOHGJHPHQWV ............................................................................................. LY
([HFXWLYH�6XPPDU\ ..............................................................................................�
&KDSWHU�� ...............................................................................................................�
,QWURGXFWLRQ�RI�WKH�3UREOHP�RI�3UDFWLFH ................................................................�
(IIHFWV�RI�,QHTXDOLW\�LQ�(GXFDWLRQ ........................................................................�
6WXGHQW�&KDUDFWHULVWLFV..........................................................................................�
/LPLWHG�.QRZOHGJH�RI�&ROOHJH�6\VWHPV ........................................................�
/DFN�RI�&ROOHJH�6XFFHVV�6NLOOV ..................................................................... ��
3DUHQW�6XSSRUW�DQG�.QRZOHGJH ..........................................................................��
,QVWUXFWRU�5ROH�DQG�7UDLQLQJ ...............................................................................��
5ROH�RI�+LJK�6FKRRO�DQG�&ROOHJH�&XUULFXOXP ....................................................��
,QVWLWXWLRQDO�$SSURDFK�DQG�5HVRXUFHV ................................................................��
&RQFOXVLRQ ..........................................................................................................��
&KDSWHU�� .............................................................................................................��
1HHGV�$VVHVVPHQW�6WXG\.....................................................................................��
5HVHDUFK�'HVLJQ..................................................................................................��
&RQWH[W�RI�6WXG\ .................................................................................................��
0HWKRG�DQG�3URFHGXUH ........................................................................................��
3DUWLFLSDQWV ....................................................................................................��
0HDVXUHV .......................................................................................................��

�����
vii
3URFHGXUH ......................................................................................................��
Data Collection. .................................................................................................. 33
5HVXOWV .................................................................................................................��
7KH�6WXGHQW�)XQQHO .......................................................................................��
6\VWHP�&KDOOHQJHV ........................................................................................��
Student Support Service Challenges. .................................................................. 39
Clarity of System-Wide Quantifiable Goals and Objectives. ............................. 44
Efficient use of Data. .......................................................................................... 44
&RQFOXVLRQ ..........................................................................................................��
&KDSWHU�� .............................................................................................................��
&RDFKLQJ�%DFNJURXQG�DQG�)UDPHZRUN ..............................................................��
&RDFKLQJ�6XSSRUW�DQG�6WXGHQW�%HKDYLRU ............................................................��
&RDFKLQJ�DQG�*ULW�6NLOOV ...............................................................................��
&RDFKLQJ�DQG�6HOI�(IILFDF\ ..........................................................................��
*RDO�6HWWLQJ�DV�WKH�)RXQGDWLRQ�IRU�&RDFKLQJ .....................................................��
&RDFKLQJ�DQG�5HWHQWLRQ�IRU�$W�5LVN�6WXGHQWV ....................................................��
&KDSWHU�� .............................................................................................................��
,QWHUYHQWLRQ�'HVLJQ��0HWKRG�DQG�3URFHGXUH ......................................................��
&RQWH[W ..........................................................................................................��
5HVHDUFK�4XHVWLRQV .......................................................................................��
5HVHDUFK�'HVLJQ..................................................................................................��
Definition of Fidelity of Implementation............................................................ 73

�����
viii
Indicators of Fidelity of Implementation ............................................................ 73
0HWKRG ................................................................................................................��
3DUWLFLSDQWV ....................................................................................................��
,QVWUXPHQWDWLRQ .............................................................................................��
'DWD�&ROOHFWLRQ .............................................................................................��
'DWD�0DQDJHPHQW .........................................................................................��
'DWD�$QDO\VLV ................................................................................................��
(IIHFW�6L]H .....................................................................................................��
3URFHGXUH ......................................................................................................��
&RQFOXVLRQ�DQG�6XPPDU\�0DWUL[ .......................................................................��
&KDSWHU�� .............................................................................................................��
)LQGLQJV��'LVFXVVLRQ��DQG�,PSOLFDWLRQV�IRU�3UDFWLFH ...........................................��
5HVHDUFK�4XHVWLRQV .......................................................................................��
(IIHFW�RI�&RDFKLQJ�RQ�5HWHQWLRQ��7HUP�*3$�DQG�7HUP�$WWHPSWHG�YHUVXV�
&RPSOHWHG ...........................................................................................................��
&RQWURO�9DULDEOHV...........................................................................................��
5HWHQWLRQ .......................................................................................................��
7HUP�*3$......................................................................................................��
$WWHPSWHG�9HUVXV�&RPSOHWHG�&UHGLWV ...........................................................��
,QWHUYLHZ�5HVXOWV��&RGHERRN ........................................................................��
,QWHUYLHZ�7KHPH��*RDO�6HWWLQJ .....................................................................��
)LGHOLW\�RI�,PSOHPHQWDWLRQ��([SRVXUH�'RVDJH��4XDOLW\ ................................���

�����
ix
([SRVXUH�'RVDJH ........................................................................................���
4XDOLW\.........................................................................................................���
,QWHUYLHZ�7KHPH��&ROOHJH�5HVRXUFHV .........................................................���
,QWHUYLHZ�7KHPH��3RZHUIXO�4XHVWLRQV .......................................................���
,QWHUYLHZ�7KHPH��$FWLYH�/LVWHQLQJ.............................................................���
,QWHUYLHZ�7KHPH��&RQWUROOLQJ�IRU�%LDV .......................................................���
3DUWLFLSDQW�5HVSRQVLYHQHVV .........................................................................���
Self-Efficacy and Grit. ...................................................................................... 107
Interview Theme: Self-Efficacy. ....................................................................... 108
Perceptions of Coaching Influence on Retention ............................................. 110
Interview Theme: Accountability. .................................................................... 110
Interview Theme: Finding the Right Resources. .............................................. 111
Interview Theme: Connection to Coach. .......................................................... 112
'LVFXVVLRQ ......................................................................................................... ���
&RDFKLQJ�DQG�5HWHQWLRQ .............................................................................. ���
&RDFK�7UDLQLQJ�DQG�%HQHILWV ....................................................................... ���
&29,'����3DQGHPLF ........................................................................................���
/LPLWDWLRQV ........................................................................................................���
,PSOLFDWLRQV�IRU�)XWXUH�5HVHDUFK�DQG�3UDFWLFH .................................................���
&RQFOXVLRQ ........................................................................................................���
5HIHUHQFHV .........................................................................................................���
$SSHQGL[�$ .......................................................................................................���

�����
x
7DEOH�RI�&RQVWUXFWV�DQG�,QGLFDWRUV....................................................................���

�����
xi
List of Tables
7DEOH���� ............................................................................................................................ ��
7DEOH���� ............................................................................................................................ ��
7DEOH���� ............................................................................................................................ ��
7DEOH���� ............................................................................................................................ ��
7DEOH���� ............................................................................................................................ ��
7DEOH���� ............................................................................................................................ ��
7DEOH���� ............................................................................................................................ ��
7DEOH���� ............................................................................................................................ ��
7DEOH���� ............................................................................................................................ ��
7DEOH���� .......................................................................................................................... ���
7DEOH���� .......................................................................................................................... ���
7DEOH���� .......................................................................................................................... ���
7DEOH���� .......................................................................................................................... ���

�����
1
Executive Summary
According to the National Center for Education Statistics (2020), approximately
68% of community college students take at least one developmental education course
within six years of initial admittance. Created to help students become college-ready,
these courses in reading, writing, and mathematics provide the foundation for progressing
to college-level coursework. Adelman (2006) notes that based on ACT results only 29%
of students meet the reading and math benchmarks for college. As such, developmental
education courses serve as a key element for getting students college ready. At the same
time, students who take these courses finish their developmental education sequence at an
average of 20% nationally (Complete College America, 2021). According to the Center
tor the Analysis of Postsecondary Readiness (CAPR), only 29% of developmental
education students who start at a community college complete their associates or
EDFKHORU¶V�GHJUHH��&$35���������&RQVHTXHQWO\, more than 60% of students who start out
in developmental education are delayed from or never achieve a college-level credential.
The cost of not completing a degree to students, their families, and their
communities may be difficult to estimate, but several states have assessed their direct cost
of developmental education as surpassing 100 million dollars annually (Gallard &
Albritton, 2010; Kelly & Schneider, 2012; Martorell & McFarlin, 2011). The most recent
national estimate puts the cost at about 1.3 billion dollars (Pretlow & Wathington, 2012).
This admittedly costly problem has fueled much research and remains a significant
problem in higher education. Within current practice, consultants have worked to help
institutions resolve the challenges faced by students in developmental education courses
but have struggled to accurately diagnose the problem because of the broad potential

�����
2
drivers of the issue. Any analysis of the low completion rates for students in
developmental education must consider the entire learning ecosystem.
Student characteristics, parental support, instructor knowledge, institution
approach, and curriculum all play pivotal roles in perpetuating this significant problem.
Through the lens of ecological systems theory, system-related factors within community
colleges should be explored to determine the barriers students face. Investigating the role
of faculty and administration in eliminating these barriers may provide a roadmap to
improving developmental education course pass rates. The lack of a cohesive system of
support for students in developmental education courses combined with their limited
academic skills, low self-efficacy, and lack of parental expertise (Achinstein et al., 2015;
Bahr, 2008; Cox, 2015; Martorell & McFarlin, 2011; Parker et al., 2010; Strayhorn,
2013; 2014) meaningfully contribute to their low completion rates. As an important
FRPSRQHQW�RI�VWXGHQWV¶�PLFURV\VWHP (Bronfenbrenner, 1992; Neal & Neal, 2013),
institutions must provide students help to increase their skills as they navigate the
complexities of their college experience. As such, programs that help students navigate
the college environment serve as a viable solution for improving student degree
completion rates (Bettinger & Baker, 2014; Crisp & Cruz, 2010; Hodges, Payne, & Dietz,
2014; Komarraju & Musulkin, 2010; O'Banion, 2011).
These programs can take many forms, from courses dedicated to teaching students
how to be successful in college (Cho & Mechur Karp, 2013; Poarch, 2015; Wilmer,
2008) to coaching (Bettinger & Baker, 2011; Bland, 2003; Brigman & Campbell, 2003;
Sweeney, 2010). While several solutions show promise, coaching support has been
shown to increase persistence rates in students selected for developmental education

�����
3
courses and provides a viable means for institutions to increase persistence rates for
underprepared students (Gallard & Albritton, 2010; Kolenovic & Linderman, 2013;
Scrivener, Weiss, Ratledge, & Rudd, 2015; Smith-Jaggars et al., 2014; Young & Ley,
2003; Zachry & Schneider, 2010). Students in developmental education courses can
overcome the challenges they face with dedicated support focused on their persistence.
Self-efficacy and grit provide a foundation that students can build on to help them meet
their academic goals. Coaches can facilitate building these skills through goal setting and
active monitoring of progress. By introducing goal-supported coaching to help students
build self-efficacy and grit skills, institutions can help students create a more productive
ecosystem for their academic success.
This study, conducted from March 2021 to April 2021 examined the influence of
the coaching program on student retention and academic success markers for
developmental education students. The study focused on exploring the difference in key
academic markers for these developmental education students who attended a Mid-
Atlantic Community College (MCC) between the fall 2019 to spring 2020 semesters and
compared academic markers between the treatment and comparison groups over these
two consecutive semesters. The analysis included data from 110 developmental education
students who attended MCC in fall 2019; 55 of these students completed the coaching
program and 55 did not.
With over 900 coaches active in academic settings today (Pisarik & Blankenship,
2019), the influence of coaching on retention remains a significant question for educators.
This study found that students who were coached were more likely to progress
academically than students who were not coached. While some studies have explored the

�����
4
relationship between coaching and retention, currently there is a dearth of research about
the influence of coaching on retention for developmental education students. This study
fills a gap in current research and shows that coaching support increases retention for
developmental education students. Beyond coaching influence on retention, it also
suggests potential avenues for future research: (1) coaching influence on academic
success markers such as GPA and credit accumulation; (2) coaching influence on grit,
self-efficacy and self-advocacy and the elements of the coaching relationship that
influence these factors; (3) coach characteristics, motivation and connection to student;
(4) influence of coaching session length and frequency on students outcomes; (5)
elements of coach training that influence outcomes; (6) benefits of the coaching
relationship to the coach. With less than 50% of students completing their college
education on time (NCES, 2021), coaching remains a viable option for practitioners
looking to improve the retention rates for developmental education students in the college
setting.

�����
5
Chapter 1
Introduction of the Problem of Practice
According to the National Center for Education Statistics (2020), approximately
68% of community college students take at least one developmental education course
within six years of initial admittance. Created to help students become college-ready,
these courses in reading, writing, and mathematics provide the foundation for progressing
to college-level coursework. Adelman (2006) notes that based on ACT results only 29%
of students meet the reading and math benchmarks for college. As such, developmental
education courses serve as a key element for getting students college ready. At the same
time, students who take these courses finish their developmental education sequence at an
average of 20% nationally (Complete College America, 2021). According to the Center
tor the Analysis of Postsecondary Readiness (CAPR), only 29% of developmental
education students who start at a community college complete their associates or
EDFKHORU¶V�GHJUHH (CAPR, 2021). Consequently, more than 60% of students who start out
in developmental education are delayed from or never achieve a college-level credential.
The cost of not completing a degree to students, their families, and their
communities may be difficult to estimate, but several states have assessed their direct cost
of developmental education as surpassing 100 million dollars annually (Gallard &
Albritton, 2010; Kelly & Schneider, 2012; Martorell & McFarlin, 2011). The most recent
national estimate puts the cost at about 1.3 billion dollars (Pretlow & Wathington, 2012).
This admittedly costly problem has fueled much research and remains a significant
problem in higher education. Within current practice, consultants have worked to help
institutions resolve the challenges faced by students in developmental education courses

�����
6
but have struggled to accurately diagnose the problem because of the broad potential
drivers of the issue. Any analysis of the low completion rates for students in
developmental education must consider the entire learning ecosystem.
Understanding the factors that have led to these low completion rates requires an
exploration of the interaction of multiple elements that touch the student: schools,
teachers, families, communities, and government policy. %URQIHQEUHQQHU¶V������)
ecological V\VWHPV�WKHRU\�VXJJHVWV�WKDW�WKH�LQGLYLGXDO¶V�LQWHUDFtions with these elements
of her environment shapes her. While Bronfenbrenner (1992) saw the interaction of these
parts of the environment as overlapping circles, Neal and Neal (2013) explore the idea
that these areas of our human context remain more nested than networked. As such, the
individual is at the center of the surrounding concentric circles of the system, and all parts
of the system impact all elements of the LQGLYLGXDO¶V�OLIH��While much research has been
done in the area of developmental education (Bahr, 2008; Parker, 2020; Smith-Jaggers &
Bickerstaff, 2018; Smith-Jaggars et al., 2014; Turk, 2021), most of that research has been
focused on one or two or three aspects. Some researchers point to student-instructor
interaction, others to the self-regulating habits of developmental education students, and
some identify family support. Placing the student in the center and identifying several
aspects that impact her ability to succeed, highlights the underlying causes and a potential
intervention.
A review of current literature reveals that key contributing factors related to this
issue stem from micro and macro level factors. At the micro level, ethnicity, socio-
economic status, and generational status in college impact college readiness (Strayhorn,
2014). Also, significant gaps in student self-beliefs and self-efficacy further exacerbate

�����
7
the issue (Achinstein, Curry, & Ogawa, 2015; Bahr, 2008; Cox, 2015; Martorell &
McFarlin, 2011; Parker, Bustillos, & Behringer, 2010; Strayhorn, 2013; 2014). At the
other end of the spectrum, instructors often lack the required teaching focus and training
to support these students (Fike, 2009). At the macro level colleges lack the student-
focused learning ecosystem needed to support developmental education students and the
instructors who teach them. Beginning with student-level characteristics and building to
explore more system-wide issues, this review of existing literature provides a guide to the
root causes of low developmental education course completion rates.
Low completion rates for developmental courses, especially for low-income, first
generation, African-American and Hispanic students, continues to be a significant issue
facing community colleges today (Brickman, Alfaro, & Weimer, 2013; Jenkins &
Rodriguez, 2013; Mokher & Park-Gaghan, 2020; Terenzini et al., 1996; VanOra, 2019).
Community colleges, instructors, students, and communities have not been able to
resolve this issue successfully. Without successful completion of these courses, students
remain under-prepared for college and unable to advance to complete their degrees and
begin the careers that help provide them a better life.
Effects of Inequality in Education
The impact of inequality in education on the college readiness for specific ethnic
and socio-economic groups remains central to the issue of college readiness. Factors
within the macrosystem, exosystem, mesosystem, and microsystem (Bronfenbrenner,
1992; Neal & Neal, 2013) have contributed to the challenges many groups face as they
navigate their lives. African-American, Hispanic, and American-Indian students
experience bias and inequality in the education system (Bravo, 2020; Downey et al.,

�����
8
2004; Gamoran & Long, 2007), and these unequal inputs have led to unequal outputs.
Downey, et al. (2004), for example, found that, within the school year, African American
students experienced more significant reading gap increases compared to their White
counterparts. Gamoran and Long (2006), writing almost 40 years after the Coleman
report, noted that inequality in education remains a fundamental issue today. Not
surprisingly, first-generation, low socioeconomic status, African-American and Hispanic
students are most frequently categorized as under-prepared for college (Adelman, 2004;
An, 2013; Chen & Carroll, 2005; Crisp & Delgado, 2014; Strayhorn, 2014). These sub-
groups of students are less likely to go to college, and then, once in college, are less likely
to complete their credential (Strayhorn, 2014; Mokher & Park-Gaghan, 2021). The
preponderance of these students in developmental education courses should be noted in
any discussion of the available literature because issues of racism and classism pervade
our society and bleed into our school system. These system-wide challenges contribute to
the over-representation of the main sub-groups in developmental education courses.
Students in these sub-groups are not uniform in their characteristics, and these
characteristics provide insight into the challenges they face in successfully completing
their developmental education sequencing.
Student Characteristics
At the core of the ecosystem, the individual developmental education student
encounters significant barriers to completing their education due to factors in the
microsystem related to family, community and schools (Bronfenbrenner, 1992; Neal &
Neal, 2013).
�����
9
/LPLWHG�.QRZOHGJH�RI�&ROOHJH�6\VWHPV
To navigate the college environment, students need a basic understanding of
higher education. While middle-income families tend to possess this knowledge (Bailey
et al., 2005; Benken et al., 2015; Lareau, 2015;), low-income students often struggle
because of their lack of knowledge in this critical area. In a 20-year study of middle-
income and low-income families, Lareau (2011) found that low-income students often
lack the cultural knowledge to navigate the college environment successfully. Beginning
in 1990, Lareau conducted a multidimensional study that included observations of 31
children in elementary school classrooms and interviews with their parents. She
continued to observe then over the course of 20 years, checking in with them finally in
2014. In an update to her original report Lareau (2015) provides insight into three student
stories: two working-class students (Tara Carroll and Nick Evans) and one middle-class
student (Stacey Marshall). 7DUD�DQG�6WDFH\¶V�VWRULHV�GHPRQVWUDWH�WKH�FKDOOHQJHV�RI�
limited knowledge of college systems most closely. She notes that while Stacey made
several mistakes in her medical college career, under the guidance of her mother,
roadblocks represented opportunities to find new pathways through the system. In the
end, though Stacey did not go to medical school, she eventually earned a Ph.D. in
education (Lareau, 2015). In many ways, Tara had a similar experience to Stacey in her
first year of college. She struggled to keep the 75% average she needed for her nursing
program, but when she missed it by a few points, she accepted the school's decision to
remove her from the program. Unlike Stacey, who just changed her focus from medical
school to education, Tara continued to struggle towards a nursing degree and acquired
significant debt. Tara often noted to the author that she felt uncomfortable and out of

�����
10
place during her time in college. Tara also did not seem aware that she could reach out to
her instructors for help. Like Tara, Nick was from a low-income background, but he
found a mentor during high school who stayed with him through college to help him
navigate through challenges he faced. This mentor helped him identify when he needed
help and advocate for himself during his college career (Lareau, 2015).
Other researchers have arrived at similar findings. Bachman (2013) found that
low-income students were typically uncomfortable asking for help as they viewed
developmental education and sometimes even attending college as something shameful.
Part of the discomfort these students experience likely stems from a college culture that
seems to marginalize them. Urciuoli (2014) found that students who are not considered
the ideal student can often feel marginalized in the university setting. Overall, these
findings suggest that low-income developmental education students may not persist
because of the inability to understand and fully connect with their college experience.
First generation students tend to also be low-income students (Chen & Carroll,
2005; Crisp & Taggart, 2013; Parker, et al., 2014; Strayhorn, 2014). For example, in
Lareau's (2015) study, Stacey's parents were college graduates while Tara's parents had
not completed high school. Moreover, first-generation students do not exhibit the
requisite academic behaviors that engender success (Strayhorn, 2014). Drawing data from
the Education Longitudinal Study (2002), Strayhorn (2014) explored predictors of
college readiness for 15,000 students across 750 high schools. Strayhorn, director of the
Center for Higher Education Enterprise at Ohio State University, identified high school
GPA, 12th grade NAEP standardized mathematics scores, and 12th grade highest
mathematics level as principal measures of college readiness. As seen in much of the

�����
11
research currently available on college readiness (An, 2013; Bailey, 2009; Crisp &
Delgado, 2014), Strayhorn concluded that under-represented students finish high school
less prepared for college than non-minority and high-SES students. Moreover, first-
generation students performed worse than their peers on all tests reviewed. Similar to
Lareau (2015), Strayhorn found that low-SES and minority students expressed that they
felt unprepared for college more than their counterparts. Strayhorn identified this lack of
confidence in their preparation level as a primary challenge for these students.
/DFN�RI�&ROOHJH�6XFFHVV�6NLOOV
Beyond limited confidence, students in developmental education courses also
have gaps in college success skills. Students who lack study skills, college system
expertise, grit, self-efficacy, and self-regulatory behaviors persist at lower rates than
students who possess these skills (Deil-Amen & Rosenbaum, 2002; Di Tommaso, 2010;
Lareau, 2015; Moore, 2007; Strayhorn, 2013; 2014; Terenzini et al., 1996). Drawing on
interviews with 22 students, Barbatis (2010) sought to understand the mindset of
developmental education students who had been included in a learning community at an
urban community college. The sample included six graduates, 12 persisters, and four
dropouts. Barbatis (2010) identified three types of elements that impacted student
performance. Students who entered college with a sense of responsibility, had a sense of
their ethnic self and faith, and were goal-oriented, resourceful, and determined, persisted
at the highest rates.
Arguably, much of the research on student characteristics is qualitative in nature,
and so each study has limited generalizability. At the same time, the findings of these
individual studies closely align, suggesting that they are reflective of overarching trends

�����
12
and patterns. Deil-Amen (2002), Bachman (2013), Abate-Vaughn (2009), and Moss
(2014) for example, all interviewed students to explore their approach to their academic
life, and all came to the conclusion that developmental education students lacked
understanding of how to navigate the physical college environment, were often unaware
of the expectations of their professors, failed to request help from their instructors, and
often failed to recognize the impact of their decisions on their goal of graduation. These
factors suggest that these students lack strong self-efficacy, self-advocacy, and grit. Self-
HIILFDF\�UHIHUV�WR�DQ�LQGLYLGXDO¶V�EHOLHI�WKDW�WKH\�FDQ�LQIOXHQFH�WKHLU�RXWFRPHV�(Bandura,
1977). Self-advocacy refers to an individual's ability to present their viewpoint to
improve their results (Daly-Cano et al., 2015). Grit or perseverance refers to an
LQGLYLGXDO¶V�XUJH�WR�FRQWLQXH�WR�VWULYH�toward goals, despite trying circumstances
(Duckworth et al., 2007). Gaps in these areas serve as significant barriers to success for
students.
Studies completed by Strayhorn (2014), Moore (2007) and Bettinger (2014)
broaden support for the conclusion that developmental education students struggle to
bridge gaps in key skill areas. Findings from these quantitative studies confirmed that
women, African American, Hispanic, Native American, first generation and low-income
students had less self-efficacy and grit when compared to their peers. From a sample of
524 first year developmental students, 68 non-developmental education students, and 29
honors students at the General College at the Twin Cities campus of the University of
Minnesota, Moore (2007) gauged metacognitive skills, resilience, time management
abilities, and self-regulatory skills to determine the elements that could indicate students
require an academic intervention. Moore (2007) used the Motivated Strategies for

�����
13
Learning Questionnaire (MSLQ) and Rotter Scale Questionnaire (RSQ) to determine
whether students possessed the identified skills and found that overall developmental
education students scored lower on all identified measures than their counterparts. Given
that the sample of developmental education students Moore (2007) captured was
considerably larger than the sample of the regularly admitted and honors students, the
findings may be more generalizable for developmental education students as than it is for
regularly admitted or honor students. Still, this study underscores the lack of key college-
success skills in developmental education students.
Using the Collegiate Assessment of Academic Proficiency (CAAP), Terenzini et
al. (1996) reviewed survey results for 3,840 students from the National Study of Student
Learning (NSSL). They analyzed responses to questions related to student background,
college goals, their approach to learning and academic outcomes. The initial survey,
CAAP, FDSWXUHG�UHVSRQVHV�GXULQJ�WKH�ILUVW�VHPHVWHU�RI�WKH�VWXGHQWV¶�FROOHJH�H[SHULHQFH�
and the second, NSSL, captured results one academic year later. Based on a conceptual
model that included elements of triadic reciprocality, where student outcomes are thought
to be the result of the interaction of coursework, environment, pre-college skills, and
classroom experience, Terenzini et al. (1996) attempted to identify how these elements
differ for first generation students. The authors reviewed survey results from the NSSL
and concluded that, when compared to other students, first-generation low-income
students experienced challenges with critical thinking skills, ambitions, family support,
and peer and teacher networks. Further, limited self-efficacy and self-regulatory skills
repress the ability of these students to succeed in their developmental courses and their
college career as a whole.

�����
14
Parent Support and Knowledge
Low self-efficacy does not represent the only challenge these students face. These
VWXGHQWV¶�weak academic success skills may stem from challenges parents/families may
have in providing support and guidance. The microsystem includes interactions with
parents and families (Bronfenbrenner, 1992; Neal & Neal, 2013). Factors such as
relationships with friends and parents play a significant role in student outcomes
(Barbatis, 2010). Parents of first-generation students often lack the level of understanding
of higher education needed to help their children work through the complexities of their
academic path (Lareau, 2015; Mangual-Figueroa, 2011). These students struggle to find
mentorship and guidance from their parents and this lack of support deters their ability to
progress academically (Di Tommaso, 2010). Lareau (2015) provides very convincing
examples of how parents impact the ability of students to effectively manage their college
career. Her most poignant example comes from two students who faced challenges in the
first semester of college. While Stacey's mother intervened and gave her clear direction
that allowed her to re-bound, Tara's mom who had not completed high school could not
provide the same guidance. In addition to a lack of understanding of college and financial
parental support, students also struggle to access academic advice and coaching; this in
turn negatively impacts student ability to persist through challenges in their college
careers (Achinstein et al., 2015; Calcagno et al., 2008; Chen & Carroll, 2005; Di
Tommaso, 2010; G. Li, 2003; Mangual-Figueroa, 2011; Strayhorn, 2014).
Parental first-hand experience and therefore understanding of college provides a
necessary foundation for families to know how to help their students. Without this
knowledge, parents struggle to support their children. Mangual-Figueora (2011)

�����
15
conducted a 23-month study of Mexican families of differing immigration statuses.
Through a close analysis of the homework routines of two undocumented Mexican
households, Mangual Figueroa (2011) found that parents and students alike did not
understand the triggers to improve their success in the education system. For example, in
the first family, the son had poor citizenship (behavioral) grades in school. Neither he nor
his mother could quite tell what this meant. Finally, the young boy stated: "I don't go on
the citizenship line" (Mangual Figueroa, 2011, p. 270). To him, citizenship meant that he
was an outsider wherever he went. In the second family, the mother noted that her son
has several D grades. Despite having the same number of D grades as the last time, her
son insisted that he was improving. His mother insisted he would fail the class, and, like
most undocumented immigrants, he would end up washing toilets. She acknowledged
that without doing his homework he would not achieve his success, but she did not know
how to help him accomplish his homework task. This helplessness in the face of student
FKDOOHQJHV�OHDGV�WR�LQDFWLRQ��HVSHFLDOO\�ZKHQ�WKH�VWXGHQW¶V�FXOWXUDO�EDFNJURXQG�LV�QRW�
taken into consideration.
Achinstein et al. (2015) suggest that parents and students must find a safe place to
learn how to learn the necessary skills for college success. Using data from Urban
College Academy (UCA) as a focused case study, Achinstein et al. (2015) explored the
outcomes of a relabeling program for Latino students at a high school in California. The
practice involves discrediting negative Latino images, affirming Latino culture while
providing tools for navigating majority culture, and encouraging improved academic
behaviors in students. Achinstein (2015) found that while 44% of UCA students did not
persist in their education at UCA, 93% of students in the program graduated and went on

�����
16
to enroll in college. Achinstein et al. (2015) found that the principal complication of this
program lay in tension between the balance of acquiring majority cultural understanding
while maintaining a high Latino cultural identity. A key component of the program
involved educating not just students but parents on the importance of certain academic
behaviors. As parentV¶ knowledge increased, student academic behavior and self-efficacy
improved. Closely linked to improved self-efficacy, student ambition rises, given
appropriate mentorship (Di Tommaso, 2010). Improved parental knowledge should come
with increased ability to mentor and guide students (Achinstein et al., 2015). Without
these factors, students struggle to meet their academic goals.
Instructor Role and Training
Given the lack of core learning competencies among developmental education
students, it stands to reason instructors have a significant gap to overcome in the
classroom. Instructors, as key actors in the microsystem (Bronfenbrenner, 1992; Neal &
Neal, 2013), play a fundamental role in student success. In a study focused on assessing
instructional quality for students in developmental algebra courses, Chingos (2016) found
that student completion varied based on several instructor factors, including education,
full-time status, and experience. Bahr (2008) analyzed data from 190,777 students across
107 Californian community colleges and found that academic intervention by instructors
served to improve student success outcomes for developmental education students. At the
same time, instructors often do not have the requisite training or even focus on helping
students bridge that gap (Fike, 2009; Jenkins & Rodriguez, 2013; Young & Ley, 2003).
In a study of two expert development education teachers in the classroom, Young and
Ley (2003) sought to understand how instructors can support the improvement student
�����
17
self-efficacy skills. The researchers logged 758 classroom interfaces in developmental
mathematics and study skills courses and noted that the mathematics instructors had 62
missed opportunities to encourage student self-efficacy, while study skills instructors had
88 missed opportunities. Young and Ley (2003) defined those opportunities where
students displayed some level of self-efficacy. As such, Young and Ley concluded that
though some reinforcement of self-regulatory behavior occurred, instructors did not
include this as an integral and formal part of their interactions with students. Admittedly,
the small sample size and the qualitative nature of the study demand replication to
understand the generalizability of the findings further. Still, these results suggest that
instructors may not be focused on addressing behaviors of developmental students. Since
developmental education students often have limited metacognitive skills (Noble et al.,
2015; Strayhorn, 2014), teacher interactions should likely include some focus with
guiding students towards building these skills. Without supports to bolster these
weaknesses, student success can be challenged, and persistence rates can falter.
Part of the challenge lies in the role of the college professor in American higher
education. With much of the focus on research rather than teaching in four-year colleges,
instructors are not incentivized to prioritize teaching (Meyer, 2012). This lack of focus on
teaching may explain the lack of motivation for instructors to obtain teaching credentials
and advanced teacher training to support student learning outcomes. Moreover, it remains
unclear whether professors see their role as part coach and advisor (Fike, 2009; Galbraith
& James, 2004). Fike (2009) surveyed interest in pursuing developmental education
degree programs among developmental education instructors in the community college
setting. Though 89% of 614 developmental education teachers surveyed indicated that

�����
18
obtaining a credential in developmental education would help them better support their
students, only 23% indicated interest in receiving a graduate degree in this area. Overall,
only 33% of the 614 instructors surveyed had a master's degree or higher in any
discipline. The lack of graduate education in developmental education coupled with the
limited interest of professors to pursue further training suggests that instructors do not
view skill-building as an essential element of their role. This is especially troubling given
that targeted academic support through customized instruction, tutoring, and academic
advising plays a critical role in developmental education outcomes (Bahr, 2008; Bremer
et al., 2013; Calcagno et al., 2008; Gallard & Albritton, 2010).
More knowledgeable faculty seems directly related to better outcomes for
students. Based on student-specific data from the National Education Longitudinal Study
of 1988 and school-level data from the Integrated Postsecondary Education Data System
(IPEDS), Calcagno et al. (2008) found that institutions that serve large numbers of
minority and disadvantaged students and have a high proportion of part-time faculty also
have lower completion rates for students. The authors, all researchers at the Community
College Research Center at Columbia University, used descriptive statistics to compare
characteristics of institutions and students to determine the institutional factors that
positively and negatively impacted student outcomes. Positive results were defined as any
degree or certificate obtained or transferred to a 4-year college within six years of
admission. Student characteristics such as race, gender, age, and socio-economic status
were assessed for 2,196 students. These factors were then compared to institution
characteristics, including faculty education and resourcing. Student to instructor ratio as
well as instructor level of education significantly impacted student learning outcomes. In
�����
19
the end, community colleges with large numbers of part-time faculty, who were often not
as formally educated as full-time faculty, typically had lower student success rates than
their peers. As such, lack of adequate instructor support represents a critical contributing
factor related to student underperformance.
Role of High School and College Curriculum
Beyond the characteristics of students, the level of parental support, the level of
instructor expertise, and the institutional resources, the content of developmental
education warrants further review. High schools play an important role in preparing
students for college LQ�WKH�VWXGHQWV¶�PLFURV\VWHP�(Bronfenbrenner, 1992; Neal & Neal,
2013). Some researchers highlight the lack of agreement and synergy between what is
considered college-ready in high school and what colleges see as college ready (An,
2013; Cox, 2015; Hoyt & Sorensen, 2001). Drawing on data from the Education
Longitudinal Study (2002), Strayhorn (2014) explored predictors of college readiness for
15,000 students across 750 high schools. Strayhorn, the director of the Center for Higher
Education Enterprise at Ohio State University, identified high school GPA, 12th grade
NAEP standardized math scores, and 12th grade highest math level as principal measures
of college readiness and used independent sample t-tests and ANOVA to complete his
analysis. Strayhorn (2014) found that high schools did not adequately prepare
underrepresented groups in our society. He noted that despite having completed high
school, less than 50% of students met the college readiness standards of their college of
choice. Hoyt and Sorensen (2001) reviewed data from entering freshman at an urban state
college and found that despite having taken and successfully passed college level
mathematics and English in high school, 50% of students were placed into developmental

�����
20
mathematics and 30% were placed into developmental English. The authors captured
academic preparation of 3,765 entering freshmen from two high school districts. Hoyt
and Sorensen (2001) identified students' highest level of English and mathematics and
compared the results of their COMPASS or ACT exams. Using logistic regression
analysis, the authors evaluated several other variables to determine the impact on
placement, including gender and ethnicity. Although results did indicate that students
who took college-level mathematics and English in high school had higher ACT and
COMPASS scores compared to students who did not take these courses; ultimately, half
of these students placed in developmental mathematics and one-third placed in
developmental English. Hoyt and Sorensen (2001) concluded that more collaboration or
synergy between local high schools and colleges in mathematics and English curricula.
Also, they posit that intervention may be most useful in middle school when the
foundation for high school begins, instead of delaying efforts until high school. This lack
of synergy between the level of high school college preparation and the college readiness
standards set by institutions of higher learning decreases student likelihood to achieve
college readiness by their first semester of college.
Hoyt and Sorenson (2001) and Strayhorn (2014) used standardized tests as part of
their core research methodology even though standardized testing has not proven entirely
successful in placing students in developmental education (James, 2006; Pinkerton,
2010). Using binary logistic regression analysis, Pinkerton (2010) sought to identify
student outcomes of those either placed in or out of developmental education by a slim
margin. Drawing from the Standard Error Measurement of the reading portion of the
COMPASS test, Pinkerton analyzed data from one Texas community college and found
�����
21
that students could be grouped into three categories: students who were not placed into
developmental education reading courses, students who completed developmental
education, and students who did not persist in their developmental education course
sequence (three courses were optional). Results indicated that for students who completed
developmental reading courses later continued at higher rates than students who had not
been placed in developmental education or had opted out of completing their reading
developmental education courses. This study suggests that additional research on how
placement tests are administered is required. The single cut-off number does not take into
account the complexity of determining how ready a student is for college work and
remains a flawed predictor of student readiness. Placement of students in the appropriate
developmental sequence directly impacts their willingness and ability to complete their
developmental education sequence on time (Scott-Clayton & Rodriguez, 2014).
Once a student begins developmental education coursework the classes often have
little connection to their program of study and their life overall (Calcagno et al., 2007;
Smith-Jaggars et al., 2014). When more traditional modes of instruction are substituted
with accelerated, applied-learning approaches, student results do improve (Hodara &
Jaggars-Smith, 2014). Smith-Jaggers et al. (2014) reviewed the accelerated programs at
three community colleges and found that the contextualized nature of the curriculum led
to pass rates that were at times 28% above the traditional developmental education
programs. In this study, Smith-Jaggers et al. (2014) observed three accelerated learning
programs: FastStart Mathematics at the Community College of Denver, Reading/Writing
Acceleration at Chabot College, and ALP (accelerated learning) at Community College
of Baltimore County. FastStart combined two of the developmental courses per semester.

�����
22
Students had longer blocks of time for lecture because the courses were still three credits
each. At Chabot, the two developmental education English courses are combined into one
semester and the credits reduced from eight to four. The course focused on helping
students practice the same kinds of assignments they would have in college-level English.
Instead of teaching all aspects of grammar, the course focused on grammar needed to
complete a given college-level exercise. At the Community College of Baltimore County,
students who tested into the highest level of developmental writing were co-enrolled in a
college-level English 101 course and co-enrolled in a particular ALP section of
developmental writing taught by the same instructor. Since the idea is to surround the
ALP students with college-ready writing students as well, the ratio of ALP to English 101
students had to remain small. Only eight ALP students were allowed to enroll in the
English 101 course. Similar to FastTrack, the ALP course focused on providing skills to
ensure success on English 101 assignments. The authors note that it remains unclear if it
was the accelerated curriculum or the applied approach that resulted in better academic
outcomes, although they suggest the applied approach had an impact (Smith-Jaggers et
al., 2014). Still, it is likely that the applied approach impacted the outcomes for these
students.
Using propensity score matching to determine the sole impact of ALP while
accounting for any confounding variables, the authors found that over a 3-year period
FastStart students were 11 percentage points more likely to complete college-level
mathematics than their peers; Chabot students were 17% more likely to complete college-
level English and ALP students were 28% more likely to complete college-level English
(Hodara & Jaggars, 2014). The authors theorize that this is because of the layers of

�����
23
support for faculty and students that were available within the programs. Even when
formal mechanisms did not exist, student services advisors tended to provide additional
guidance to these students. They concluded that accelerated models should be paired with
academic and affective supports to ensure the highest levels of achievement. Moreover,
since students self-selected into these courses based on whether they thought they could
³handle´ the courses, some consideration should be given to the bias of the samples
reviewed. It is hard to explore course content without connecting back to the role of the
instructor. Indeed, it must be noted that both FastTrack and the ALP program provide
faculty professional development. FastTrack students are also assigned a case manager
who advises them on time requirements and monitors them throughout the program.
These programs include elements of constructivist and situated learning theory as a
framework. Students are pushed to lead the learning experience, and their questions are
often mirrored back to them to help them construct their learning experience in the most
applied format possible. As such, any discussion of course content must be linked to the
role of the instructor and level of training (Fike, 2009).
Cox (2015) of Simon Fraser University, set out to understand how teaching and
learning occur in the developmental classroom with the goal of understanding the impact
on student outcomes. Using teacher interviews, curriculum material, and classroom
observations in six classrooms across two urban community colleges, Cox (2015)
explored the inner workings of teaching developmental mathematics. Each college
approached developmental mathematics in a specific manner. At College A, students
were required to pair the developmental mathematics courses with developmental English
or first-year experience course, with either a counselor or peer tutor assigned to each

�����
24
cohort. Students were placed in new lab facilities and instructors were given instruction
on the technology available. The program did not include formal collaboration across
instructors as it related to curriculum re-design and instructors improved their approach
based on experience. College X involved an innovative math curriculum; courses were
taught outside of the college¶s mathematics department and faculty. The two professors
involved collaborated on the design of a mathematics course that included a co-created
guidebook for classroom activities and testing. As with College A, students had to pair
the course with developmental English or a student success course, and instructional
support was provided to the student in the form of advisers focused on the unique
approach to the mathematics course. Ultimately, pass rates for the courses in College X
ranged from 76% to 90% whereas pass rates in College A ranged from 50% to 70%.
Overall, students in College X were more likely to move ahead through developmental
mathematics. The small sample size and the qualitative nature of the study, indicate that
results cannot be generalized to all developmental education students. At the same time,
Cox¶s findings speak to the impact of course content, instructor approach, and structure
on student outcomes.
In addition to the content and structure of developmental education courses,
enrollment pathways and milestones have proven key to student persistence. Many
students fail to complete their developmental courses in the sequence recommended and
often lack a clear understanding of how these courses fit into their career goals (Bahr,
2008; Bailey, 2009; Cho & Mechur Karp, 2013). To determine the impact of postponing
beginning developmental education courses past the first semester, Fike and Fike (2012)
reviewed the grade point averages of 3,476 first time in college (FTIC) students at a

�����
25
private urban southwestern university. Of these students, 25% did not require
developmental mathematics at first enrollment. Of the 75% of students who needed some
level of developmental education, 33% enrolled in the first semester, and 42% deferred
admission to the university. Using multiple regression analysis, the authors were able to
connect fall grade point average and first-semester mathematics status. Students who took
developmental mathematics in their first semester maintained a higher GPA than students
who delayed taking developmental mathematics. This finding suggests that mathematics
skills may serve as an important variable in impacting student progression. According to
the National Center for Education Statistics (2015), many students are still taking their
developmental education courses well into their sixth year of college. This delay
negatively impacts student outcomes in developmental education coursework and may
explain low completion rates for these courses.
Beyond academic skills, underprepared students may struggle with the social and
intellectual challenges associated with managing their college career (Wilson & Lowry,
2016). In a study of one pathways program that involved the collaboration of a two-year
institution and a four-year institution, Wilson and Lowry (2016) found that by providing
a summer bridge program to underprepared students that focused on building academic,
social and intellectual skills, grades and reported self-confidence improved.
Institutional Approach and Resources
Given that institutions control factors like course sequencing and instructor
performance, it is worth considering whether institutions themselves impact completion
rates. Decisions on what courses students are offered are often be made at the
institutional level, and the role of instructors has been molded by the institutions they

�����
26
serve (Meyer & Evans, 2003). As schools focus more on the research element of the
professorship, less investment may be placed on teaching students (Meyer, 2012; Meyer
& Evans, 2003; Raab & Adam, 2005). Though community colleges are less concerned
about research, instructor advancement is often linked to teaching load, longevity, and
professional development, not to student performance (Fugate & Amey, 2016; Jacoby,
2006). At the same time, developmental educatioQ�FRXUVHV�FDQ�LQFUHDVH�D�VWXGHQW¶V�
required credits for graduation by up to 24 credits. It is possible that the incremental
tuition revenue from these courses may serve as a motivator to place students in these
classes and, as such, increase revenue per student. Moreover, in about 15 states, public
funding is tied to the number of enrolled students and not to the number of students who
complete their programs of study (Hillman, 2020). Arguably, institutions are highly
motivated to increase enrollments but may not be as motivated to ensure completions.
Though 35 states have moved to funding community colleges based on the number of
completions, other states focus on enrollments in calculating funding. Despite the
relevant nature of these issues, little research is available on the economic motivators of
colleges as it relates to developmental education. It is even harder to show through
rigorous academic study how these institutional factors impact student completion rates
in developmental education sequences.
What does seem clear is that investment in enabling services serves to improve
student persistence (Bremer et al., 2013). Through an examination of data from three
community colleges in three separate states, Bremer et al., (2013) found two major
institutional factors that played a role in developmental education outcomes: financial aid
and tutoring. Calcagno et al. (2008) found that investing in full-time faculty increased

�����
27
students¶ likelihood of achievement. Also, investment in targeted tutoring served to
increase developmental education student pass rates by 16%, based on findings from one
Florida college (Gallard & Albritton, 2010). Both Bahr (2008) and Bettinger (2013)
found that academic advising and coaching served to improve student results
significantly. Still investment in these areas remains difficult (Gallard & Albritton, 2010),
especially for schools with largest populations of developmental education students
(Calcagno et al., 2008). In some cases, these investments can also take the form of
technology, an area often under-resourced in many community colleges (Martirosyan, et
al., 2016). For example, based on an analysis of survey data from 70 faculty members
across two and four-year colleges in Texas, Martirosyan et al. (2016) found that when
technology could further support the learning in developmental education courses, faculty
were often under-trained, and students were not given the right supports to use the
technology.
In addition to the lack of investment in support services for students, the lack of
robust student success courses prior to beginning developmental education courses may
have a substantial impact on student outcomes in developmental education courses. Cho
and Mechur Karp (2013), from the Community College Research Center at Columbia
University, investigated the influence of student success courses in first-year credit
accrual as well as persistence to the second year. The sample included 14,807 students
who were enrolled in a student success course in the Virginia Community College
System. Of these students, 62% were also enrolled in developmental education courses at
the same time. Logistic regression analyses revealed that students in student success
courses acquired 10% more credits than their counterparts and were 6% more likely to

�����
28
persist to their second year. Moreover, students in developmental mathematics education
courses saw increased likelihood of college credit achievement in their first year of
college. The results of this study indicate that there is a strong need for these types of
courses, especially in high-risk populations such as developmental education students
(Cho & Mechur Karp, 2013). The lack of mandatory student success courses on college
campuses may partially explain lowered persistence rates.
Conclusion
While low developmental education completion continues to challenge higher
education, focusing on central issues may help resolve this socially and economically
costly issue. Student characteristics, parental support, instructor knowledge, institution
approach, and curriculum all play pivotal roles in perpetuating this significant problem.
Through the lens of ecological systems theory (Bronfenbrenner, 1992; Neal & Neal,
2013), system-related factors within community colleges should be explored to determine
the barriers students face. Investigating the role of faculty and administration in
eliminating these barriers may provide a roadmap to improving developmental education
course pass rates.

�����
29
Chapter 2
Needs Assessment Study
The needs assessment study explored the processes and systems at two
community colleges to map the student journey from application to graduation. At each
community college, interviews with admissions, financial aid, student accounts, academic
advising, and faculty revealed the details for each step of the student lifecycle with a
focus on identifying gaps in processes that may lead to student attrition. Last, data from
the customer relationship management system, application system, and student
information system showed the points in the student funnel where attrition was the
highest.
Research Design
Given the explorative nature of the needs assessment and the in-depth nature of
the data required, a qualitative approach using case studies was used to address the
research questions for the study. Two institutions were selected based on availability
within WKH�VWXGHQW�UHVHDUFKHU¶V current practice: both schools were exploring a possible
partnership with at For Profit Organization (FPO) to improve their enrollment and
completion numbers. The case study approach allowed for a full exploration of the
system at each school so that underlying factors could be uncovered.
Context of Study
The study focused on assessing two two-year public institutions for their ability to
support the completion needs of students. As the lead consultant at FPO, the investigator
led the assessment of the completion challenges at each of these institutions. FPO does
not allow for full disclosure of the instruments used in the study, as such, there are

�����
30
limitations to sharing all the questions asked in interviews and focus groups. Information
included in this chapter has been approved for distribution by FPO leadership. No
additional information has been approved at this time.
The first institution was Urban Community College (UCC). UCC provides
technical credentials, general education programs, experiential and cooperative
education, DQG�ZRUNIRUFH�GHYHORSPHQW�WR�VWXGHQWV�LQ�D�PDMRU�FLW\��8&&¶V�VWXGHQW�
population includes approximately 11,000 students, and 83% of the student population
assessed requires developmental education coursework. All entering students take a
placement exam prior to enrollment to determine their level of preparation for college-
level courses in reading, writing, and mathematics. Depending on their scores on the
placement examinations, students may take up to six developmental education courses,
with two required for each category. Community colleges measure on-time graduation as
graduating within three years of starting at the college. The average three-year graduation
rates stand at 28%. UCC is based in a large urban environment and 42% of students do
not identify as Caucasian.
Based in a small rural community, the second community college, Rural
Community College (RCC) enrolls 3,200 students. As with UCC, students are required to
take a placement test prior to enrollment, and the result of this test determines the need
for developmental education courses. RCC also includes reading, writing, and
mathematics courses, with up to two courses in reading and writing, and three courses in
mathematics. Average three-year graduation rate for students stands at 56%. About 11%
RI�5&&¶V�VWXGHQWV�UHTXLUH�developmental education courses.
Method and Procedure

�����
31
This needs analysis provides a guide to the root causes of low developmental
education course completion rates within the college system in the United States, with a
particular focus on two community colleges. Since the learning ecosystem within
colleges plays an intHJUDO�UROH�LQ�WKH�VWXGHQW¶V�SURJUHVVLRQ��WKLV�QHHGV�DVVHVVPHQW�
addresses three primary questions about the college environment:
54���:KDW�V\VWHPV�UHODWHG�IDFWRUV�H[LVW�ZLWKLQ�LQVWLWXWLRQV�WKDW�KLQGHU�VWXGHQW�
VXFFHVV�LQ�GHYHORSPHQWDO�HGXFDWLRQ�FRXUVHV"
54���:KDW�V\VWHPV�UHODWHG�IDFWRUV�H[LVW�ZLWKLQ�LQVWLWXWLRQV�WKDW�VXSSRUW�
VWXGHQW�VXFFHVV�LQ�GHYHORSPHQWDO�HGXFDWLRQ�FRXUVHV"
54���+RZ�GR�IDFXOW\�DQG�DGPLQLVWUDWLRQ�HQJDJH�LQ�VROYLQJ�FKDOOHQJHV�IRU�
GHYHORSPHQWDO�HGXFDWLRQ�VWXGHQWV"
3DUWLFLSDQWV�
To capture the full student lifecycle, participants from both case studies included
representatives across all major functions at each college. Participants were invited by
their school leadership to participate based on their availability. UCC had a staff of
approximately 300, but at the time of the study it was hard to determine the total number
of full-time staff due to on-going labor challenges. Forty faculty and staff participated in
the study. Of these 40 faculty and staff, 25 were women and 15 were men. Of all
participants, eight had achieved their doctoral credential at the time of the study. RCC
staff included 140 full-time administrators and faculty and a varying number of part-time
staff. More than two-thirds of instructors were full-time. Of the 140 staff members, 27
participated in the study; five had a doctoral-level education, and all had at least a
master's degree. Fourteen of the participants were female, and 13 were male.

�����
32
7DEOH����
Characteristics of Participants: RCC (n= 27) and UCC (n=40)
Characteristic RCC
n (%)
UCC n
(%) Gender
Female 14 (51.9%)
25 (62.5%)
Male 13 (48.1%)
15 (37.5%)
Level of Education Doctoral 5
(18.5%) 8
(20.0%) Master 23
(85.1%) 32
(85.1%)
Participants were full-time employees for each function of the individual departments
within the colleges. These units included: human resources, finance, financial aid, student
accounts, veteran's affairs, academic advising, developmental education, distance
learning, dual enrollment, academic faculty, institutional effectiveness, admissions,
marketing, registrar, learning center and information technology.
0HDVXUHV
Focus groups and semi-structured interviews were used to meet the goals and
objectives of the study. Focus groups questions explored the processes and systems-level
support provided by the functions within each college. Follow-up interviews sought to
further investigate major themes raised in the focus groups. An analysis of data on
retention and completion was used to triangulate the results of the focus groups and
interviews. Due to variance in definitions for major constructs across colleges, this study
sought to use standard definitions to allow for comparisons across colleges. Appendix A
includes definitions and sources of data for each of the key variables analyzed. Of note,

�����
33
the terms developmental education and remedial education are used interchangeably in
the research, and among participants. For this study, the term developmental education is
the main term used. Appendix A provides indicators and definitions of the terms used.
3URFHGXUH
The procedure used included three major phases, beginning with initial virtual interviews
with key executives at the institutions, followed by on-campus focus groups and
interviews with support staff and students on campus, and ending with a presentation to
campus stakeholders to gather feedback and validate themes found.
Data Collection. Focus groups and interviews were conducted virtually and face
to face over a two-month period to ascertain key support gaps for students within these
colleges. As such, all departments that impact the student life cycle were included in
these discussions. Both institutions requested these studies as a means of helping them
understand and address the service gaps within their respective institutions.
3KDVH�2QH� Each study began with virtual interviews with senior executives at
each college. Initial discussions focused on five key themes:
x UHYLHZ�RI�WKH�DSSURDFK�DQG�SURFHVVHV�DVVRFLDWHG�ZLWK�WKH�VWXG\�
x NH\�PRWLYDWRUV�IRU�FRPSOHWLQJ�WKH�VWXG\��
x FXUUHQW�RUJDQL]DWLRQDO�VWUXFWXUH�RI�WKH�FROOHJH�
x SDUWLFLSDQWV�IRU�RQ�FDPSXV�IRFXV�JURXS�DQG�LQWHUYLHZV�
x REMHFWLYHV�RI�WKH�QHHGV�DVVHVVPHQW��
In addition to these initial questions, data on the student funnel over three years
separated by developmental and non-developmental education students were requested.
The student funnel may be defined as the data stream that captures the movement of

�����
34
prospective students from interest to graduation. This provides a measure of student
progress from inquiry to graduation and provides a view into the level of student at each
stage. This information included:
x DSSOLFDWLRQV�WR�WKH�LQVWLWXWLRQ��
x QXPEHU�RI�VWXGHQWV�ZKR�WRRN�WKH�SODFHPHQW�H[DP��
x QXPEHU�RI�VWXGHQWV�ZKR�SODFHG�LQ�HDFK�OHYHO�RI�GHYHORSPHQWDO�HGXFDWLRQ��
x QXPEHU�RI�VWXGHQWV�ZKR�GLG�QRW�SODFH�LQWR�GHYHORSPHQWDO�HGXFDWLRQ��
x QXPEHU�RI�VWXGHQWV�ZKR�HQUROOHG�DW�WKH�FROOHJH�DW�HDFK�OHYHO�RI�GHYHORSPHQWDO�
HGXFDWLRQ��
x QXPEHU�RI�VWXGHQWV�ZKR�HQUROOHG�LQ�QRQ�GHYHORSPHQWDO�HGXFDWLRQ�FRXUVHV�
x QXPEHU�RI�VWXGHQWV�ZKR�SHUVLVWHG�IURP�IDOO�WR�VSULQJ�RI�D�JLYHQ�HQUROOPHQW�
SHULRG�E\�OHYHO�LI�GHYHORSPHQWDO�HGXFDWLRQ��
x QXPEHU�RI�VWXGHQWV�UHWDLQHG�IDOO�WR�IDOO�RI�DQ�HQUROOPHQW�SHULRG�E\�OHYHO�RI�
GHYHORSPHQWDO�HGXFDWLRQ��
x QXPEHU�RI�VWXGHQWV�ZKR�JUDGXDWHG�RU�WUDQVIHUUHG�WR�D�IRXU�\HDU�FROOHJH�ZLWKLQ�
WKUHH�\HDUV�RI�LQLWLDO�HQUROOPHQW��
3KDVH�7ZR� The second phase of the study involved an on-campus visit of two or
more days, where interviews and focus groups were conducted with faculty and
administration. On the first day of the on-campus visit, the study process was shared with
all participants, and initial questions were addressed. Once this step was complete, the
on-campus event began with a focus group, which ranged from two to three hours in
length. This focus group included unstructured questions, based on soliciting information
on current processes within the institution. During the focus group, participant

�����
35
information was used to draw a map on a whiteboard. Any unanswered questions were
marked for later review during the interviews. Since FPO has not granted permission to
disclose the full interview protocol, a sampling of the questions included in the focus
groups is provided below:
1. +RZ�GR�SURVSHFWLYH�VWXGHQWV¶�H[SUHVV�LQWHUHVW�LQ�WKH�FROOHJH"�'R�WKH\�XVH�
HPDLO��SKRQH��DQ\�RWKHU�PHWKRGV"
2. 2QFH�WKH�SURVSHFWLYH�VWXGHQW�LQTXLUHV��ZKR�FRPPXQLFDWHV�ZLWK�WKH�VWXGHQW"
3. ,V�WKLV�FRPPXQLFDWLRQ�GRFXPHQWHG�HOHFWURQLFDOO\"�
4. :KR�WUDFNV�WKLV�LQIRUPDWLRQ"�
Once focus group activities concluded, the second step included interviews with human
resources, finance, financial aid, student accounts, veteran's affairs, academic advising,
developmental education, distance learning, dual enrollment, academic faculty,
institutional effectiveness, admissions, marketing, registrar, learning center and
information technology. Though these individuals were included in the focus group, they
were also included in interviews by department to allow for more in-depth discussion. Per
FPO requirements, only some of the questions asked during these interviews are provided
below:
1. +RZ�PDQ\�SHRSOH�PDNH�XS�\RXU�GHSDUWPHQW"
2. +RZ�PDQ\�FRPPXQLFDWH�ZLWK�SURVSHFWLYH�DQG�FXUUHQW�VWXGHQWV"
3. %DVHG�RQ�WKH�GLVFXVVLRQV�LQ�WKH�HDUOLHU�IRFXV�JURXS��\RX�LQGLFDWHG�WKDW�>LQVHUW�
IRFXV�JURXS�ILQGLQJ@��FDQ�\RX�SURYLGH�DGGLWLRQDO�GHWDLO�RQ�WKH�UHDVRQV�IRU�WKLV"
4. �:KDW�V\VWHPV�GR�\RX�XVH�WR�FDSWXUH�VWXGHQW�LQIRUPDWLRQ"

�����
36
3KDVH�7KUHH� At the conclusion of the on-campus event, all data from the student
funnel, focus groups, and interviews were summarized and presented to the institution.
Also, data from the National Center for Education Statistics (NCES), National Survey of
Student Engagement (NSSE), and the Community College Survey of Student
Engagement (CCSEE) were compared to findings from these interviews and focus
groups. Major themes were outlined, and gaps in the processes supporting students were
identified. For this needs assessment, data were coded using Microsoft Word. Notes from
interviews and focus groups were documented in detail: participant feedback was
captured verbatim as much as possible, with summarizing statements included when the
pace of response increased. Where possible, respondents were asked to repeat statements
not clearly heard, especially if multiple participants were speaking. Notes were compiled
and reviewed at the end of each day to determine if follow-up clarification was needed
and were divided into categories by department area: faculty, admissions, registrar,
financial aid, student accounts, developmental education, advising, technology, dual
enrollment, library, and student support services. Since bookstore information was only
available for one of the schools reviewed, bookstore notes were excluded from the final
data set. Once records were compiled, a complete read-through was conducted in an open
coding exercise before identification of any categories. During this time, memos were
taken to explore potential categories and themes. Notes were then placed into a table
format, with one column dedicated to coding all information based on common themes.
After completing the coding exercise, notes were sorted by common themes identified in
the memos. Central themes were highlighted and synthesized.
Results

�����
37
7KH�6WXGHQW�)XQQHO�
8&&¶V current student funnel showed noteworthy losses from inquiry to
graduation. Based on the data gathered there are two substantial fallouts of the student
funnel. The first occurs after the online application is submitted: only 28% of applicants
go on to complete the admission process within the recruitment period. The second
occurs within the developmental education sub-funnel. This sub-funnel captures all
students who completed their placement test, which students were required to take
developmental education courses, and which students enrolled in developmental
education courses in their first year. Table 2.3 captures the funnel data for both UCC and
RCC. Based on the early fall 2010 cohort, full-time students who tested into
developmental education had an overall 3-year graduation rate of 16%, with students
required to take the entire suite of six developmental education courses having three-year
graduation rates as low as 6%. Students who did not take developmental education
courses had a 3-year graduation rate of 41%. At RCC findings were substantially
different. No data existed on the number of student inquiries initiated or on the number of
students who took the placement exam. Of the applicants accepted for a given year, only
46% of admitted applicants enroll in the semester admitted. Though it is unclear to what
extent the placement exam contributed to this decline in the funnel, it may be inferred
that the test itself presented a hurdle to the student. Full-time students had an overall 3-
year graduation rate of 22%, and though 3-year graduation percentages differed for
developmental education versus non-developmental education students, this difference
ZDV�VXEVWDQWLDOO\�VPDOOHU�WKDQ�8&&¶V��$W�5&&��GHYHORSPHQWDO�VWXGHQW��-year graduation
rates stood at 42%, though students in the lowest reading courses complete at 3%. Non-

�����
38
developmental education students have a 3-year completion rate of 58%. Overall,
developmental education student 3-year completion rates remain lower than non-
developmental education students at both schools. This low rate is consistent with results
from the National Center for Education Statistics (NCES) Beginning Postsecondary
Students Longitudinal Studies (BPS) which found that 24.8% of developmental education
students complete attaining their degree in five years (2008).
7DEOH����
Student Funnel Area
Student Funnel Area UCC RCC NCES
Begin Application to Completed Application
65% N/A
Completed Application to Enrolled in Courses
28% 46%
3-year graduation rate (developmental education students)
16% 42%
3-year graduation rate (non-developmental education students)
41% 58% 11.4%
5-year graduation rate (developmental education students)
N/A N/A 24.8%
6\VWHP�&KDOOHQJHV
Based on interviews, focus groups, and observations of administrators, three key
themes emerged during coding: the fragmented nature of student support, lack of clear
goals from administration at the institution, and inadequate use of data in decision-
making by administration at both institutions.
�����
39
Student Support Service Challenges. Based on interviews with the admissions
team, financial aid, student accounts, registrar, and advising from both colleges, strong
informal relationships exist with these closely connected departments. As the Director of
Financial ALG�DW�8&&�VWDWHG�³ZH�JHW�DORQJ�ZHOO�KHUH��:H�DUH�DOZD\V�WDONLQJ�[the Director
of Student AFFRXQWV@�DQG�,´ (Liane1, interview, October 23, 2014). At UCC, the financial
aid and student accounts teams often had to troubleshoot student challenges together and
work to resolve technological challenges that impacted student financial matters. At
RCC, the smaller size of the institution and the proximity in work environments led to a
sense of closeness among the team. ThH�SUHVLGHQW�RI�5&&�QRWHG�LQ�LQWHUYLHZV�³ZH�DUH�D�
WLJKW�NQLW�WHDP´ (Edward, interview, September 15, 2015). At the same time, more formal
means of providing real-time feedback to each other was not available and so they had
not formally documented collaborative processes around prospective and current
students. For example, one member of the academic advising team at UCC reported that
students regularly indicated that they ³GR�not know how much the test will impact them
when they take it´ (Shay, interview, October 23, 2014), so they did not study or prepare.
Despite having to interact with the admissions team as part of the application process,
these students still failed to get this information because the advising team had not
documented the need for the admissions team to share this information early in the
process. At RCC, the academic advising team shared that financial constraints meant that
they had only two full-time academic advisors and one part-time academic advisor to
support 3,200 students. This meant that they could not ensure that all students received
1 All names referenced are pseudonyms

�����
40
much-needed academic advising. 2QH�RI�WKH�DGYLVRUV�DW�5&&�QRWHG�WKDW�³WKH�OLQH�RI�
VWXGHQWV�ZRXOG�EH�DURXQG�WKH�RIILFH�WR�VHH�DQ�DGYLVRU�DW�WKH�EHJLQQLQJ�RI�WKH�VHPHVWHU´�
DQG�³ZH�ZRUN�D�ORW�DIWHU�KRXUV�WR�KHOS�RXU�VWXGHQWV´ (Jackson, interview, September 16,
2015).
At UCC, students who required developmental education sequences when starting
WKHLU�FROOHJH�SURJUDP�ZHUH�ODEHOHG�DV�µSUH-DGPLW¶�VWXGHQWV��ZKHUHDV�VWXGHQWV�ZKR�WHVWHG�
out of developmental eGXFDWLRQ�ZHUH�ODEHOHG�DV�µIXOO-DGPLW¶�VWXGHQWV��:hile the µpre-
admit¶ advisors are trained in intrusive advising and currently support about 80% of the
student population, these µpre-admit¶ advisors only worked with students until they
completed their developmental sequence. µPre-admit¶ advisors were considered supports
only for developmental education students, and, upon completion of their developmental
education sequence, students were placed with a µfull-admit¶ advisor. Students in this
µpre-admit¶ category were limited in the courses they could take, since most college-level
courses required completion of the developmental education sequence they had been
placed into. This meant that students in this status were primarily enrolled in
developmental education courses in their first year.
The Director of Academic Advising at UCC could not provide any data to clarify
how many students are supported by the advising center and how many choose not to use
its resources. There are also no data on how students who use the advising center have
performed versus those who do not. µFull admit¶ advisors may or may not have training
in intrusive advising, which is a framework that requires monitoring of student progress
and proactively initiating contact with the student to provide support. These advisors
were all current faculty members. This group supports 20% of students. As with µpre-

�����
41
admit¶ advisors, very little data exists on how many students are supported, how they are
supported and how processes can be improved. In contrast to UCC, RCC did not separate
their advisors by developmental education versus non-developmental education students.
Students were considered fully admitted at acceptance, despite the level of developmental
education needed. To improve persistence from the first to the second semester, RCC
instituted mandatory advising for incoming freshmen who had a 2.5 or lower GPA. While
this was a new initiative and they only had one year of data, advisors stated that their
results had been positive. They were not able to quantify the level of improvement
because the student information system could not output all incoming freshmen who had
a 2.5 GPA. The admissions team had manually selected the students for advising in the
previous year and no data were added to the student information system as part of this
process. UCC and RCC's differing approach to admitting developmental education
students remain an interesting area of difference. Bachman (2012) found that
developmental education students might feel a sense of stigma associated with the
designation. Several members of the of focus group and individuals in interviews pre-
admit advisors were called µdownstairs advisors¶ while full admit advisors were called
µupstairs advisors.¶ UCC's labels RI�µSUH-DGPLW¶�YHUVXV�µIXOO�DGPLW¶�DQG µGRZQVWDLUV
YHUVXV�µXSVWDLUV¶ the provision of separate academic advising services for these students
may underscore the stigma for these students.
Since about 80% of the students are placed in the µpre-admit¶ category at UCC at
the time of entry, most students must transition from their initial advisor to their
academic division advisor within their major of choice during their tenure at UCC.
Currently, pre-admit advisors inform students of this, but there is no formal hand-off of

�����
42
the student to their full admit advisor. This is further impaired by the fact that while pre-
admit advisors are required to use a customer relationship management system (CRM),
full admit advisors are not obligated to use this system. Both advising teams are part of
the Advising Council which meets during each semester to discuss overarching advising
issues. Still, the difference in how advisors are trained, the limited use of the CRM
amongst the full admit advisors, and the lack of a warm hand-off between advisors could
lead to a very jarring transition for students.
Though RCC did not segment advising groups, departmental silos were evident
across both colleges. Faculty and staff shared on several occasions that the lack of clear
cross-department goals and an inadequate use of data remained the issue. Interestingly,
faculty and staff felt that their processes were student-centered. At the same time, once
their processes were mapped on the whiteboard during focus groups, the team
acknowledged that several processes at both schools ³worked against studentV´ (RCC
team, focus group, September 15, 2015). One strong example of this is evidenced by how
the placement test was administered at both RCC and UCC. There was no comprehensive
cross-department strategy to ensure that applicants were aware of how the test was used,
were provided adequate preparation to take the test, nor was there a process to advise
them proactively after the test. The marketing teams did not minimize test anxiety with
appropriate language on the website, the admissions teams did not employ any specific
measures to guide students toward the placement test boot camp or preparation courses,
and the advising team did not have a calling strategy to ensure students had clear
guidance on the impact of the test on their college career. Though test preparation
practices often have small impact on test scores (Ryan et al., 1998; Briggs, 2012), these

�����
43
small gains can decrease the number of developmental education courses students need to
take. Further, Klem et al. (2004) note that building connections with students early in
their engagement can lead to stronger levels of academic achievement, including
improved test scores.
Challenges with student support service areas within RCC and UCC present a
potential cause for lower completion rates for developmental education students. Data
from the NCES, NSEE, and CCSSE identify the impact of institutional factors on student
outcomes. These studies reveal that enabling services such as financial aid, career
counseling, academic advising and childcare most acutely affect student persistence. Data
from the 2015 CCSSE study reveal that 60% of developmental education students
provide care to a dependent during their time as students with approximately 22%
provide more than 30 hours of care a week (CCSSE, 2015). Fifty percent of
developmental education students also indicated that college-provided childcare remains
relevant to them, with 22% noting it as paramount. More than half indicated that peer or
other tutoring and skills were instrumental to their college experience. Ultimately,
financial aid advising rates stood out as the most important factor overall: 70% of
developmental education students stated it remains fundamental to their success (CCSSE,
2015). This is supported by data from the NSSE (2015), which captured that 60% of
students indicated that they were worried about financial challenges. The student stress
about financial matters showed a high correlation with the degree of education of the
student's parents: students whose parents did not have a bachelor's degree scored three to
nine points higher on the stress scale than students whose parents had completed a
bachelor's degree or greater (NSSE, 2015).

�����
44
Clarity of System-Wide Quantifiable Goals and Objectives. Although both
schools had overarching strategic initiatives and executive leadership presented a stated
enrollment goal for each semester, there are no quantifiable department-level goals that
supported student retention rates. For example, though UCC had been required to provide
a clear completion agenda targeted at developmental education students, one year after its
creation, each department was still unclear as to how they would contribute to the
achievement of this plan. The Dean of Arts and Science at UCC shared that though they
were proud to have come together as a college to build the completion agenda, it had not
been costed or resourced, so they did not know how to execute on it. The Executive Vice
3UHVLGHQW�DW�8&&�WRRN�LW�RQH�VWHS�IXUWKHU�DQG�VKDUHG��ZH�KDYH�D�ORW�RI�JUHDW�LGHDV«EXW�
we are not good at execution here" (Tianna, interview, October 23, 2014). At RCC their
completion strategies were haphazard, with each faculty member pursuing their ideas as
to how to improve student outcomes. For example, some of the developmental
mathematics faculty had started using an alternative developmental mathematics teaching
model, while some of the English instructors were trying a co-requisite model. Other
instructors would send their students to the writing center if they started falling behind.
Though some of these ideas met with improved student completion rates, they were not
adopted outside of these faculty member classrooms because there was no system in
place to measure and share results and apply best practices to other courses. The net
effect is that the path toward accomplishing improved student outcomes for
developmental education students remained haphazard.
Efficient use of Data. In addition to a lack of clear goals, both institutions failed
to leverage data to guide decision-making. This is not to say that both schools did not

�����
45
FROOHFW�GDWD��'XH�WR�WKH�HIIRUWV�RI�8&&¶V�DQG�5&&¶V�,QIRUPDWLRQ�7HFKQRORJ\�7HDP�DQG�
the Research and Institutional Effectiveness departments data surrounding their student
funnels was provided to the lead investigator. The data were divided into each admission
and enrollment step students undertook to determine what steps led to the most
significant student loss. For example, the number of students who applied to the
institution was compared to the number of students who took the placement test, and the
number who took the placement test was compared to the number who started classes.
This review of data informed which elements of the admission and enrollment process
needed further evaluation. During interviews with departments, it became clear that
despite the challenges with enrollment and completion, this scrutiny of the student
pipeline had not been completed before. Most college staff were unaware of what data
existed, how data were being used or even how to verify the accuracy of the data they
were collecting. At UCC, the Director of Financial Aid noted that data is not always
collected before implementing new ideas EHFDXVH�³ZH�GRQ¶W�KDYH�WKH�PRQH\´ (Lianne,
interview, October 23, 2014) This presented a challenge for her when UCC experimented
with a six-term year instead of a four-term year. This change required modifications to
the student information system that had not been enacted due to financial and human
resource constraints. As such, processing financial aid became a challenge for her team.
Since 60% of students use financial aid at UCC, the inability to receive assistance in time
to start school could conceivably prevent a student from beginning or continuing in a
given semester. These challenges with using data to guide decision-making suggest that
both colleges will have difficulty identifying the programs, processes, and policies will
best support students and ensure stronger completion rates.

�����
46
Conclusion
UCC and RCC both demonstrated a systemic lack of cohesive student support
services structures, limited use of data to guide decisions, and a lack of clear goals. The
lack of a cohesive system of support for students in developmental education courses
combined with their limited academic skills, low self-efficacy, and lack of parental
expertise (Achinstein et al., 2015; Bahr, 2008; Cox, 2015; Martorell & McFarlin, 2011;
Parker et al., 2010; Strayhorn, 2013; 2014) meaningfully contribute to their low
FRPSOHWLRQ�UDWHV��$V�DQ�LPSRUWDQW�FRPSRQHQW�RI�VWXGHQWV¶�PLFURV\VWHP (Bronfenbrenner,
1992; Neal & Neal, 2013), institutions must provide students help to increase their skills
as they navigate the complexities of their college experience.

�����
47
Chapter 3
Students placed in developmental education courses begin their college
experience challenged to navigate the college environment due to limited academic
success skills (Pusey-Reid et al., 2021; Strayhorn, 2014; Uretsky et al., 2019; Yadusky et
al., 2020). To progress to their credential of choice, these students may require a
combination of academic advising (Bahr, 2008; Gallard & Albritton, 2010; Jenkins &
Rodriguez, 2013; Groh, 2016; Hatch & Garcia, 2017), embedded tutoring (Bachman,
2013; Perin, 2010; Russ, 2017; Vick & Robles-Piña, 2015), or career pathway mapping
(Bettinger & Baker, 2014; Bremer et al., 2013; Calcagno et al., 2008b; Chung et al.,
2021) to successfully progress to their desired college credential.
Further compounding the problem, these students and their parents often lack the
knowledge of school systems to understand and advocate for their needs (Achinstein et
al., 2015; Figueroa, 2011; Hodara et al., 2018; Lareau, 2003, 2015; Natow et al., 2019;
Park et al., 2017; Yadusky et al., 2020). Moreover, based on the needs assessment results
provided in chapter two, institutions are challenged by inherent issues with providing
cohesive student supports, limited ability to analyze data, and often have unclear goals
related to student completion. These institutional and student factors combined, serve to
limit academic success for developmental education students. Programs that help students
navigate the college environment serve as a viable solution for improving student
completion rates (Armour, 2021; Bettinger & Baker, 2014; Crisp & Cruz, 2010; Cruz et
al., 2021; Dalton & Crosby, 2014; Hodges, Payne, & Dietz, 2014; Pechac & Slantcheva-
Durst, 2021; Warner et al., 2018).
�����
48
These programs can take many forms, from courses dedicated to teaching students
how to be successful in college (Hamann et al., 2021; Hatch & Bohlig, 2015; Hatch-
Tocaimaza et al., 2020; Hesser & Gregory, 2016) to more individualized interventions
where college staff serve as guides and mentors to students in formal coaching programs
(Alzen et al., 2021; Capstick et al., 2019; Grabsch et al., 2020; Groh, 2016; Rodriguez Ott
et al., 2020).
Coaching Background and Framework
In 2019, the Coaching in Higher Education Consortium (CHEC) estimated that
there were about 938 coaching programs in the United States across some 874 colleges
and universities, with the most common nomenclature for these coaches being µacademic
coach¶ or µsuccess coach¶ (Pisarik & Blankenship, 2019). CHEC defined coaching as
EXLOGLQJ�UHODWLRQVKLSV�ZLWK�VWXGHQWV�WR�LQFUHDVH�WKHLU�³DJHQF\��VHOI-understanding, growth,
HIIHFWLYHQHVV��DQG�SHUVLVWHQFH�ZLWKLQ�WKH�UHDOP�RI�HGXFDWLRQ´�(Pisarik & Blankenship,
2019, pp 20). These coaches are different from academic advisor or tutors. Their focus is
the whole student in the context of the academic setting. As such, they act as mentors and
guides to students to help them navigate their college career as they build their ability to
persist.
Over the last decade, the success of mentorship and sponsorship programs in
improving academic outcomes has increased the popularity of coaching programs
(Barnett, 1995; Crisp & Cruz, 2010; Galbraith & James, 2010; Hodges et al., 2014). In an
academic setting, the coaching relationship typically has the goal of improving the
VWXGHQW¶V�DFDGHPLF�RXWFRPHV��EXW�WKH�UHODWLRQVKLS�VHUYHV�WR�KHOS�WKH�VWXGHQW�LQ�DQG�
outside of the school context (Alzen et al., 2021; Capstick et al., 2019; Sepulveda et al.,

�����
49
2019). Coaching can manifest in different ways, but at the core, it ensures students have
consistent contact with someone who provides guidance on how to make progress toward
his or her academic goals. Coaches can serve as role models to guide students toward
attitudes and behaviors that ultimately improve student persistence. To build this
relationship, coaches rely on techniques such as active listening and questioning they
seek to better understand the student and create connection (Lubin, 2013; Weger et al.,
2014). This sense of connection is further facilitated by dialogue that is student-led,
supportive, and judgement-free (Parker et al., 2011).
Coaches also need to have strong knowledge of the college resources available to
students on campus. In a study of 15 community colleges in the mid-west using a
coaching program, Pechac and Slantcheva-Durst (2021) found that the most common
topics discussed in coaching sessions were referrals to campus resources, academic
planning, and goal setting. Based on current research, most coaching programs feature
these elements (Alzen et al., 2021; Armour, 2021; Groh, 2016; Sepulveda et al., 2019).
In terms of length, and frequency of coaching sessions, some new studies have
been done to determine the optimal length and number of coaching sessions for a given
year. Alzen et al. (2021) found a positive but weak correlation between number of
coaching sessions and retention and concluded the six sessions per semester seemed
optimal. Rodriguez Ott, et al. (2020) determined that two sessions a semester were
enough to yield positive results on retention. On the other hand, in perhaps the largest
coaching study to date, Abt Associates (2015) found that coaches typically had 4 to 12
coaching sessions a year and spent 25 to 45 minutes in each session.
Coaching Support and Student Behavior

�����
50
Despite the plethora of coaching programs, empirical research on its influence on
academic outcomes is limited. Much of the research available focuses on student
perceptions of the influence of coaching on their behavior and their lives. Hodges et al.
(2014) reviewed data from two mentoring programs for students in developmental
mathematics at a Texas community college: an on-campus mentoring program and an
eSponsor program for students. Both programs were mentorship programs, with the
modality being the primary difference between the programs: one was on-campus and
other (eSponsor) allowed for virtual mentoring. Students in the eSponsor program were
offered an eSponsor to help them with questions and concerns or serve as a guide in their
college experience. Students were called protégés and matched based on similarities in
characteristics to their eSponsor. Students reported increased confidence in their ability to
navigate their college environment irrespective of modality (Hodges et al., 2014). Central
to their experience was the fact that their mentors helped them advocate for their college
needs and helped them learn to interact more effectively with their professors. For
developmental education students, these were essential elements of mentorship. Programs
that allow students to see role models they can pattern their behaviors after could provide
the needed support for students to build strong self-advocacy skills. While tutors,
academic advisors, and coaches can become mentors to students over time, offering
students the option to have someone outside of their college context to share challenges
and model their behaviors represents an essential component for some developmental
education students. As Lareau (2015), Bachman (2013), and Urciuoli (2014) point out,
academically struggling students have difficulty finding a sense of belonging in school.
Mentorship can help students feel more connected in their college environment, and by so

�����
51
doing, increase their willingness to engage with faculty and staff when they encounter
difficulties.
Hodges HW�DO�¶V��������ILQGLQJV�DOVR�FRQQHFW�WR�'L�7RPDVR¶V��������ZRUN�ZLWK�
developmental students. Drawing on classroom observations and interviews with four
faculty members and 20 students from diverse backgrounds, Di Tommaso (2010), used a
socio-cultural model to explore non-cognitive variables that impact developmental
education student outcomes. Students were asked to explain factors that influenced their
learning journey and built their academic confidence. Elements described by students
could be grouped in categories: situational factors such as financial challenges and
campus facilities and socio-affective factors which included a sense of self-worth and
ambition. Ultimately, students who had role models described the impact based on socio-
affective factors and indicated that they had increased self-confidence and self-direction.
The authors concluded that interventions for at-risk students should include a deeper
understanding of factors that build confidence, such as mentorship. Admittedly,
Di7RPPDVR¶V�VPDOO�VDPSOH�VL]H�DQG�WKH�TXDOLWDWLYH�QDWXUH�RI�WKH�VWXG\�LQGLFDWH�WKDW�
results cannot be generalized to all students in developmental education courses. Still, her
in-depth discussions with these students shine a light on the benefits of role models in
empowering students.
Role models may be especially crucial for low-income first-generation students
since these students often lack the expert parental support to help them navigate their
education (Crisp & Nora, 2009; Lareau, 2015; Strayhorn, 2014). Using data from Urban
College Academy (UCA) as a focused case study, Achinstein et al. (2015) explored the
outcomes to relabeling Latino students and what complications may exist for such

�����
52
programs. Achinstein et al. (2015) selected UCA using snowball sampling based on
location, re-labeling program, and state funding. Relabeling involved re-socializing
students who would not be considered college-destined as college-bound. The practice
involves discrediting negative Latino images, affirming Latino culture while providing
tools for navigating majority culture, weaving Latino culture and family to support
student effort, and developing improved academic behaviors in students. Researchers
conducted interviews, focus groups, and observations of students, parents, and teachers
included in the program. Of the students who completed the program, 93% went on to
enroll in college. It must be noted that 44% of students did not complete the program.
Nonetheless, given that none of these students were considered college-bound, the fact
that more than half went on to college is promising. Interestingly, Achinstein et al. (2015)
found that the principal complication of this program lay in tension between the balance
of acquiring a new cultural understanding while maintaining a high Latino cultural
identity. Lareau (2015) noted a similar challenge. She studied blue-collar and middle-
income families over the course of 20 years and found that when blue-collar students
succeeded, they noted a sense of loss for some of their culture, even as they adopted
white-collar values. Coaches who support underrepresented students should understand
that this tension may arise for students and should remain open to dialogue with students
on this subject.
&RDFKLQJ�DQG�*ULW�6NLOOV
Beyond improvements in advocacy behavior, coaching can also impact grit levels
for students. Grit refers WR�VWXGHQWV¶�DELOLW\�WR�NHHS�ZRUNLQJ�WRZDUGV�WKHLU�JRDOV�GHVSLWH�
the barriers and challenges that present themselves (Duckworth et al., 2007; Duckworth

�����
53
& Quinn, 2009). Sometimes referred to as coping skills, grit skills have been linked to
student ability to persist; students with higher levels of grit persist at higher rates than
those with lower levels of grit (Devonport & Lane, 2006; Duckworth et al., 2007; Klem
& Connell, 2004; Strayhorn, 2013). As such, coaching support should include a focus on
building this ability by helping students overcome barriers. In cases where coaches
reinforce grit behavior, significant persistence gains are often made. While some research
has shown the link between athletic coaching and grit (Braun, 2021; Scharneck, 2017;
Tedesqui & Young, 2019), little research has been done to determine the influence of
coaching on academic grit levels. At the same time, a few studies have served to draw a
direct link between coaching and grit levels in students.
In a randomized experiment where student coaching was applied to the
experimental group (8,049 students) and not applied to the control group (5,506
students), Bettinger and Baker (2014) found that students who had a coach persisted at
higher rates than students who did not. Moreover, even after they no longer had a coach,
students in the experimental group continued to do better than students in the control
group. Bettinger and Baker (2014) studied the work of InsideTrack, a for-profit coaching
service that focused on improving student retention by helping them overcome both
academic and non-academic challenges. Both the treatment and control groups
represented balanced samples, with no significant differences in demographic
characteristics. Student persistence and retention were tracked at six months, 12 months,
18 months, and 24 months. Completion rates for degrees for both groups were also
assessed to determine progress. Retention rates for the treatment groups increased by 9%
to 12%, and this increase held even after students had stopped undergoing coaching. At

�����
54
24 months, retention rates for the treatment group were 15% higher than the control
group. Bettinger and Baker (2014) noted that the key to the success of the InsideTrack
coaching effort was the counseling element that coaches used. Counseling involved
guiding students through barriers related to their academic progress and directing them to
appropriate resources. Providing this guidance to students with lower levels of grit can
help them successfully overcome challenges, and, by so doing, increase their levels of
grit.
Often underprepared students need strong perseverance abilities because their
barriers may be more challenging than their peers (An, 2013; Bailey, 2009; Crisp &
Delgado, 2014). African-American, Hispanic and Native American students are typically
overrepresented in developmental education courses, and these groups experience bias
and inequality in the school system to a greater extent than other groups (Downey et al.,
2004; Gamoran & Long, 2007). Strayhorn (2014) concluded that under-represented
students finish high school less prepared for college than non-minority and high-SES
students. Given these factors, the support provided by coaches can be critical.
InsideTrack¶V FRDFKHV¶�DELOLW\�WR�FRXQWHUDFW�EDUULHUV�E\�FRXQVHOLQJ�VWXGHQWV�WKURXJK�
barriers can be extended to help students build their grit, self-efficacy, and advocacy
skills to overcome these obstacles. While most schools offer some form of student
support, very few opportunities exist for students to have these supports provided as
principal to their college path. Typically, students are provided these supports only if they
reach out proactively for help or are labeled as failing. In the first case, the complexity of
navigating the college structure can be prohibitive when they do seek help. In the second
case, by the time they have be placed on academic probation it is often too late to

�����
55
improve outcomes. Coaches can bridge this gap with active monitoring and specific
feedback points for students.
In a more focused study, Strayhorn (2014) set out to answer two principal
questions: (a) How does grit impact Black male college performance? and (b) After
controlling for specific variables, does grit add predictive validity for student
performance? Drawing on a sample of 140 Black full-time male students at a
predominantly White public institution, Strayhorn measured their grit level using the
Short Grit Scale developed by Duckworth et al. (2009) and had students self-report
grades. To ensure that non-racial variables did not confound the results, Strayhorn
controlled for age, year in school, international status, athlete status, transfer status,
fraternity membership, educational aspirations, American College Test (ACT) score, and
self-reported high school grade point average. Using bivariate correlations, the author
found that Black males with higher levels of grit had higher grades in college, higher
grades in high school and higher ACT scores. This heightened academic achievement
was the case even after accounting for other variables. Most important, Strayhorn (2014)
found that levels of grit were highly responsive to institution efforts; academic advisers
and school counselors focused on training student on the consistency of effort instead of
talent saw improved grit levels in participants. This improvement in grit due to institution
intervention aligns closely with findings by Bettinger and Baker (2011) and Duckworth
(2009): if coaches actively target student grit levels by focusing on consistent effort,
student grit levels will improve.

�����
56
&RDFKLQJ�DQG�6HOI�(IILFDF\
Closely related to grit is the concept of self-efficacy. Self-efficacy refers to how
much an individual believes in her ability to impact outcomes (Bandura, 1977). Bandura
and Cervone (1983) found that setting clear goals and providing ongoing feedback can
increase self-efficacy and Margolis and Maccabe (2016) note that reinforcing goal-
oriented behavior can increase student self-efficacy over time. Self-efficacy has been
linked to student success and several studies have shown that building these skills
improves persistence rates in students (Köseoglu, 2015; Moore, 2007; Ross, 1992;
Scherbaum et al., 2006; Wernersbach, Crowley, Bates, Rosenthal, Carol, 2014).
One example of this FRPHV�IURP�&LW\�8QLYHUVLW\�RI�1HZ�<RUN¶V��&81<��
Accelerated Study in Associate Programs (ASAP), Kolenovic and Linderman (2013)
found that providing students with financial help, embedded tutoring, accelerated
courses, academic advising, and monitoring as part of their developmental sequencing
doubled graduation rates. The ASAP program required students to complete all elements
of the intervention, and they received on-going monitoring to ensure they completed all
necessary activities. Students were held accountable by the program leaders to their goals
and were provided additional support if they experienced difficulty meeting the
requirements of the program. Overall, student credit accrual rate, transfer rate, speed to
graduation, and eventual graduation rate increased significantly. Using regression
analysis, Kolenovic and Linderman (2013) identified academic advising as core to
success, with supporting services likes tutoring and financial help as complements. The
ASAP program allowed students to have an individualized support plan that included
academic and non-academic help (Kolenovic & Linderman, 2013; Scrivener et al., 2015).

�����
57
Academic advisers functioned much like coaches, helping students remain focused on the
actions needed to reach their end goal. Admittedly, Kolenovic and Linderman (2013) did
not measure self-efficacy, but the structure of the program included opportunities to
reinforce behaviors that helped them to achieve goals.
Smith-Jaggers et al. (2014) also LQYHVWLJDWHG�&81<¶V�$6$3�SURJUDP��DORQJ�ZLWK�
two other accelerated learning programs and aligned with Kolenovic and Linderman
(2013) in their findings. Smith-Jaggers et al. (2014) concluded that accelerated models
should be paired with academic and affective supports to ensure the highest levels of
achievement. The two additional accelerated programs mirrored many of the aspects of
&81<¶V�$6$3�SURJUDP��)DVW6WDUW�0DWKHPDWLFV�DW�WKH�&RPPXQLW\�&ROOHJH�RI�'enver,
Reading/Writing Acceleration at Chabot College and ALP (accelerated learning) at
Community College of Baltimore County. As with the ASAP program at CUNY,
FastStart students were also assigned someone who monitored them throughout the
program and advised them on managing their college experience. Results from Smith-
Jaggers et al. (2014) study indicated graduation rates up to 28% higher than students who
were not in the program. Beyond providing wrap-around student supports ASAP, ALP,
and FastStart also modified the manner of instructing students significantly. Operating
from a constructivist (Ertmer & Newby, 2008) approach, instructors were trained to
support student-led learning to build student self-efficacy. Instruction involved student-
led problem-solving, with a primary focus on connecting teaching material to student
backgrounds and building strong instructor and student networks (Booth et al., 2014;
Kolenovic & Linderman, 2013; Smith-Jaggars et al., 2014). These instructional practices
mirrored coaching support that encouraged students to practice their self-efficacy, grit,

�����
58
and self-advocacy skills. By placing the student at the center of the learning and coaching
experience, these programs pushed students to acknowledge their ability to solve the
challenges they faced in their academic and non-academic college experiences.
Moreover, coaching can improve student perception of self (Abdulla, 2017;
Wilson & Lowry, 2016). In a study of 23 students who participated in a pathways
program to improve the academic outcomes of underprepared students, Wilson and
Lowry (2016) found that 97% students who received coaching reported that this was the
most important factor in influencing their outcomes. These students reported increased
understanding of study habits and self-management, better connection to the institution
and their peers, improved understanding of college processes, and increased confidence
in their ability to manage their college career.
Even more compelling, results from the Developmental Education Demonstration
Project (DEDP) reveal that student success skill building remains fundamental to any
effort to improve the outcomes of developmental education students. Texas implemented
the DEDP across all public institutions in that state in an attempt to turn the tide of
declining graduation rates. Using data from 3,594 students across 306 community
colleges in Texas, Booth et al. (2014) found that student performance in these programs
improved due to three themes: redesigned curriculum and instruction, ongoing faculty
and staff professional development and training, and academic and student success skill-
building and school policy changes. Faculty and staff had to be retrained to ensure that
they worked together to solve student challenges. Students were instructed on areas like
study habits and time management, and policies were redesigned to improve student
progression. Students were pushed to work with each other in a problem-based learning

�����
59
environment and were rewarded for taking risks to solve challenges. Administrators and
staff worked to minimize barriers for students, allowing them to achieve small successes
that empowered them to believe in their ability to meet their goals. In one example,
administrators reviewed the data and found that students who did not register early were
15 percent more likely to drop than those who registered early or on time. To support
early registration, administrators within the schools studied changed their registration
deadlines to fall at least ten days before classes starting. These system-wide changes have
begun to improve the outcomes for students. Most promising, some historically
underrepresented groups are completing at 21 percentage points higher than before the
DEDP programs. Coaching programs reinforcing behaviors positively impact student
goal setting behavior can improve self-efficacy for students, and, by extension, improve
student persistence.
Goal Setting as the Foundation for Coaching
Goal setting underpins any effort to improve self-efficacy and grit (Chang, 2016).
Goal setting has been shown to improve performance, processes, and levels of individual
advancement (Bowman et al., 2015; Wolff et al., 2019; Lefdahl-Davis et al., 2018;
Personal et al., 2014). In their seminal work, Bandura and Cervone (1983) found that
combining goal setting with consistent feedback can have a positive impact on self-
efficacy and ultimately goal attainment. Moreover, specific, measurable, attainable,
realistic, and time-based (SMART) goals have been shown to be highly effective over
time (Booth et al., 2014; Davis & Carman, 2010; Jaramillo et al., 2013; Scrivener et al.,
2015). During the implementation of the ASAP, DEDP, ALP, and FastStart programs,
college leadership set retention and persistence goals measured and tracked throughout

�����
60
the course of these programs (Booth et al., 2014; Kolenovic & Linderman, 2013;
Scrivener et al., 2015; Smith-Jaggars et al., 2014). Martin et al. (2014) conducted a
qualitative study at a large state community college using interviews with staff and
former students who had successfully completed college. These students were
interviewed individually and participated in two focus groups on campus. Discussions
focused on what elements impacted their ability to complete their developmental
education courses and finish their degrees. Students identified goal setting as a critical
component to helping achieve their degrees, with these goals most often related to career
or personal achievement (Martin et al., 2014). In addition to assisting them in aligning
their actions with their identified goals, the act of setting these goals served to empower
them. Each completed course became a significant achievement and helped them stay the
course. Setting defined SMART goals (Doran, 1981) can lead to improved outcomes for
students and coaches. Though several studies have captured the impact of goal setting on
behavior, most of it remains in the field of management. Little is available on goal setting
and developmental education.
Goals informed by clear data can provide a powerful means of improving learning
outcomes for these students (Bettinger & Baker, 2014; Crisp & Cruz, 2010; Hodges et al.,
2014; Lefdahl-Davis et al., 2018; Wolff et al., 2019). Coaches can identify risks before
they become significant barriers and work with students to solve challenges early. Using
data from 28 underprepared students with difficulties in reading at Salt Lake Community
College, Capps (2012) found that the use of early alert systems improved VWXGHQWV¶�
persistence. Using detailed interviews, Capps (2012) ascertained the elements that most
impacted student outcomes. Capps (2012) recommended the early identification of

�����
61
student challenges as pivotal in improving student outcomes. Since administration had a
stated goal of improving retention, at the beginning of each semester university
administration sent a formal email communication to faculty requesting that any student
who appeared in personal or academic distress be referred to an adviser for support.
Faculty responded based on the institution¶s goals and shared this data back with
administration consistently. In interviews, students stated that these proactive efforts
served to keep them from dropping out when they faced issues. The net result led to
earlier intervention for students and all 28 students persisted with their degrees. This
approach was similar to ASAP, DEDP, ALP, and FastStart programs which set
institution-wide student level goals and used data to track and intervene to ensure that
students remained on the path to completion.
The use of data to help coaches determine student progress towards goals remains
fundamental to building student self-efficacy and grit in underprepared students. Without
a clear understanding of where the student is academically, coaches cannot provide
insight into the steps students should take to reach their intended goal. Based on the case
studies conducted during the needs assessment, insight into data specific to the student
may often be unavailable to support staff and the students themselves due to technology
limitations or departmental restrictions. For example, the student support team may not
have full access to the student financial and academic data because data may be restricted
by the financial aid office or the registrar. The ability to proactively identify challenges
remains crucial to helping students overcome them. Despite the urgency of this need,
institutions often do not share enough data with students about the fastest path to their
preferred credential. Using data from the Achieving the Dream initiative, Bailey HW�DO�¶V

�����
62
(2010) seminal work on developmental education sequencing showed that fewer than half
of underprepared students complete their sequence of developmental education courses;
20% of those who were referred to math and 40% who were placed into reading complete
one developmental education course during the first three years of after placement.
Bailey et al. (2010) go on to posit that this is primarily due to the difficulty students have
in navigating the required courses to complete a degree. Often students cannot determine
what courses lead to their credential and what courses do not. Moreover, they fail to
connect the material in developmental education courses to their intended credential.
Bailey et al. (2010) imply that using data to determine how they are progressing helps
students create a more streamlined path to graduation.
Pathway creation has long been associated with strong learning outcomes for
developmental education (Alssid et al., 2005; Calcagno et al., 2007; Jenkins & Cho,
2013; O'Banion, 2011). Jenkins and Cho (2013) explored the use of guided pathways in
fast-tracking student academic progress. Noting that students often have several options,
but very little guidance, Jenkins and Cho (2013) point to three elements that bolster
student academic achievement: ensuring that academic programs have clear steps that
show student progress to completion, contextualizing developmental education so that it
contributes to each step of the student's educational journey, and providing advising to
these students that support these steps. Jenkins and Cho (2013) reviewed results from
Florida State University, Arizona State University, Valencia College, and Queensborough
Community College, all of which provided degree major maps or guided pathways to
students. Jenkins and Cho (2013) noted significant improvements in completion rates and
credit accumulation for developmental education students in these institutions. Notably,

�����
63
&81<¶V�$6$3�SURJUDP�DOVR�SURYLGHG�VWXGHQWV�ZLWK�JXLGHG�SDWKZD\V�WR�FRPSOHWLRQ��
which likely contributed to the doubling of their graduation rates (Jenkins & Cho, 2013;
Kolenovic & Linderman, 2013; Scrivener et al., 2015).
In another study of 35,046 students, each first time in college and seeking to
complete a degree, Calcagno at al. (2007) also explored the impact of creating enrollment
pathways on student performance. 7KHVH�SDWKZD\V�ZHUH�FXVWRPL]HG�WR�WKH�VWXGHQW¶V�UHDO-
world needs; including acquiring skills to obtain specific jobs or overcome
developmental education requirements to enter the career program of choice. Along the
way, students were guided to connect each milestone on the pathway in the context of
how that milestone brought them closer to their goal. Using longitudinal data collected
for 17 terms, Calcagno et al. (2007) found that obtaining 20 credits or achieving 50% of
their program increased persistence rates for traditional and non-traditional students.
Coaching and Retention for At Risk Students
While there is currently no published empirical data on the influence of academic
coaching on the academic markers and retention rate for developmental education
students specifically, a few recent studies have explored the link between coaching and
retention for at risk students. Results from these studies have been somewhat mixed.
Pechac and Slantcheva-Durst (2021) looked at data from 5,808 students from 15
FRPPXQLW\�FROOHJHV�HQJDJHG�LQ�D�FRDFKLQJ�SURJUDP�WR�GHWHUPLQH�WKH�SURJUDP¶V�LQIOXHQFH�
on academic success. Using a nonexperimental quantitative design based on descriptive,
correlational, and blocked stepwise regression methods, Pechac and Slantcheva-Durst
(2021) sought to determine the coaching approach used by the program, the relationship
between coaching and credit hour completion; and whether student characteristics, the

�����
64
frequency, topics and modes of contact between student and coach could be used to
predict credit completion. The results of the study indicated that one-on-one in person
contact, discussing time management in the first session and then academic planning, not
needing developmental education, and meeting frequently were among the 28 variables
that had positive relationship with credit hour completion. Of note, the two strongest
positive relationships to credit hour completion were enrollment status and attending
medium sized rural institution. Being African American/Black or Hispanic, attending a
medium or large urban school, and having a low socio-economic status had a strong
negative correlation to credit hour completion. In terms of predicting credit hour
completion, enrollment status and frequency of contact with a coach surfaced as a
positive predictor variables. The negative predictor variables were African-
American/Black, low income, and Hispanic/Latino. Ultimately, the study found that
31.5% of the variance in credit hour completion can be explained by student
demographics, community college characteristics, and coaching factors such as frequency
of coaching sessions, topics discussed, and mode of contact. Student characteristics
explained 24% of the variance, institutional characteristics accounted for 2.7% of the
variance, while coaching explained 4.8% (Pechac and Slantcheva-Durst, 2021).
This result aligns with findings from Sepulveda et al. (2019) who explored the
influence of a coaching intervention on first year students who were considering leaving
during their first four to six weeks of school. Using an experimental design, where the
control group included 45 participants and the treatment group included 46, the study
explored the difference in GPA and retention for the two groups. The study found no
significant difference in retention or GPA between coached and non-coached groups. Of

�����
65
note, the treatment included only three coaching sessions for the year and only 12 (26%)
of the 46 students in the treatment group met with their coaching three or more times for
the year. The low level of fidelity and the limited number of coaching sessions could
explain the study findings in relation to the influence of coaching on GPA and retention.
Other studies found that coaching itself had a material effect on student academic
performance, and ultimately retention. Capstick et al. (2019), Sepulveda et al. (2019),
Rodriquez Ott et al., (2020), and Alzen et al. (2021) explored the influence of coaching
on students on academic probation. Capstick et al. (2019) used ANOVA and multiple
regression analyses to compare results from coached and non-coached groups as it related
to retention, GPA and credit accumulation. The study was conducted at a university
located in a high poverty area, where 40% of the students were African American or
Hispanic. Using a sample of 743 coached and 234 non-coached students with less than a
2.0 GPA, Capstick et al. (2019) found that participation in coaching increased student
retention by 18% and term GPA by 24%. Of note, despite the plethora of factors that can
influence retention (Pratt et al., 2019; Glazier et al., 2019; Hamann et al., 2021; Westrick
et al., 2020), Capstick et al. (2019) determined that socio economic status and age were
also significant predictors of retention in coached and non-coached groups. Overall, the
study demonstrated that providing coaching to at-risk student can improve academic
outcomes and serve to bolster retention rates.
&DSVWLFN�HW�DO�¶V (2019) findings are in line with more recent studies. Using fall
2017 to spring 2019 data from an academic coaching program at a college of liberal arts
within a mid-sized university, Alzen et al. (2021) sought to answer two primary
questions. The first was how coaching influenced student outcomes and the second was

�����
66
to assess how exposure or dosage influenced outcomes. Students were invited to join the
coaching program when their GPA dropped below 2.0. Of the 1,678 students invited to
join the program between fall 2017 and spring 2019, 526 accepted the invitation. Of those
who participated, 275 completed at least three sessions (completers), while 251
completed less than three sessions (participants). After controlling for factors such as
gender, race, income, and first-generation status, shown to have strong correlations with
retention, Alzen et al. (2021) found that students who had participated in or completed
coaching had a higher GPA in their coaching term: participants¶ GPA increased 0.3
points and completers¶�GPA increased by 0.5 points. Results were similar for retention,
with participants being 10% more likely to enroll in the semester after coaching and
completers being 15% more likely to enroll. The study found a that these differences in
GPA and retention were statistically significant. Alzen et al. (2021) also concluded that
while there was a positive correlation between the number of coaching sessions as it
related to both GPA and retention, the correlation was relatively weak (0.21 and 0.15
respectively).
In a follow-up to the to the Bettinger and Baker (2014) study on the Inside Track
coaching program, Rodriguez Ott et al. (2020) also sought to explore the relationship of
coaching and coaching intensity with academic achievement. The study was based on a
quasi-experimental design that explored the influence of coaching on academic
achievement markers, specifically across two institutions supported by Inside Track.
Academic markers selected included total credits in first year of enrollment, average
credits earned per semester, total credits earned by fall 2017, and cumulative GPA. The
treatment group consisted of 699 students who were selected for coaching because they

�����
67
were new students to the degree programs at the two institution that Inside Track had
been contracted to support. The comparison group included 627 students who were new
students at the same institutions who were in degree programs Inside Track did not
support. Using pairwise comparisons across groups, the researchers found that the
treatment group performed better than the comparison group across all academic
achievement markers except credit accumulation in the first year of enrollment.
Interestingly, the study found that students who met with coaches two or more times
during the semester achieved more credits in their first year, more credits in individual
semesters, higher credit accumulation over time, and had higher cumulative GPAs.
Capstick et al. (2019), Alzen et al. (2021), and Rodriguez Ott et al. (2020) all
found that coaching increased the retention rates of students who participated. Coaches in
these programs served as mentors who helped their students overcome barriers, find the
resources they needed, and plan their academic path.
Conclusion
Supporting students in developmental education courses requires a multifaceted
approach. Programs to improve the persistence and retention of these students often focus
on academic elements; courses are restructured, added or removed to help students
progress. Bronfenbrenner (1992) and Neal and Neal (2013) argue that several elements of
each system impact students as they navigate their college careers. Students in
developmental education courses can overcome the challenges they face with dedicated
support focused on their persistence. Self-efficacy and grit provide a foundation that
students can build on to help them meet their academic goals. Coaches can facilitate
building these skills through goal setting and active monitoring of progress. By

�����
68
introducing goal-supported coaching to help students build self-efficacy and grit,
institutions can help students create a more productive ecosystem for their academic
success.

�����
69
Chapter 4
Intervention Design: Method and Procedure
This chapter addresses the use of coaching support in improving retention rates
for students selected for developmental education sequences. Ecological systems theory
suggests that one of the major elements that affect student outcomes relates to the
interaction they have with their community and the interaction of that community with
other elements of the ecosystem (Bronfenbrenner, 1992; Neal & Neal, 2013). One way to
provide support in the college setting is through coaches, sponsors, and mentors.
Coaching supported by goal setting has shown to have a positive impact on student
performance when coaches serve as mentors and guides (Alzen et al., 2021; Armour,
2021; Bettinger & Baker, 2011; Bettinger & Baker, 2014; Capstick et al., 2019; Groh,
2016; Robinson & Gahagan, 2010).
A sequential embedded design approach to evaluate the outcome and processes of
a coaching program was used. Participants in the treatment group were matched to a
comparison group and fall 2019 to spring 2020 retention data on these two groups were
analyzed. Moreover, interviews were conducted with a subset of the coaches and students
from the matched group to explore the elements of the coaching that influenced retention
and to determine the level of fidelity within the program.
&RQWH[W
This study was conducted at a mid-sized community college (MCC)2 in Maryland
that supports more than 14,000 credit-seeking students. About half of these students use
2 All references to the institution were changed to a pseudonym

�����
70
financial aid in some form. M&&¶V�FRDFKLQJ�SURJUDP�KDV�H[LVWHG�IRU����\HDUV�DQG�
currently has about 130 students enrolled. Approximately 70% of students in M&&¶V�
coaching program are developmental education students (MCC, 2021).
Coaches in M&&¶V�SURJUDP�were full-time or part-time employees of MCC who
volunteered to support a student for a given semester. Coaches were required to commit
at least one hour a week to their coaching student. Students and coaches were randomly
matched, though in some cases, specific matches were made when students had
specialized needs. Coaches could not currently be teaching their coaching student.
Training for coaches involved three coaching modules online and one 90 minute
in-person training session provided at the time they signed up to be coaches. Coaches
received training in active listening, controlling for bias asking powerful questions that
stimulate discussion and connection, goal setting and knowledge of college resources
available. Referrals to campus resources are fundamental element of the coaching
relationship (Lehan et al., 2018; Pechac & Slantcheva-Durst, 2021). Similarly, active
listening, questioning, goalsetting, and judgement-free dialogue have been found to
support relationship development in coaching programs (Alzen et al., 2021; Barnett,
1995; Groh, 2016; Jaramillo et al., 2013; Robinson & Gahagan, 2010; Sepulveda et al.,
2019; Tudor, 2018; Weger et al., 2014).
Active listening involves remaining silent when the other person is speaking,
reflecting what was said to the speaker and then following up with clarifying questions
where needed (Weger et al., 2014). Controlling for bias involves being conscious of
implicit bias and focusing on solving the problem while suspending judgement (Groh,
2016). The use of powerful questions involves asking questions that require description

�����
71
and explanation in the answers so that students probe into their own motivations and
behaviors during their responses (Barnett, 1995; Frisby & Martin, 2010; Scull et al.,
2020).
Coaches were encouraged to set SMART goals (Doran, 1981). Goal setting has
been shown to improve student retention (Chang & Lorenzi, 2016; Chung et al., 2021;
Jaramillo et al., 2013). Finally, directing students to the optimal student support resources
for their needs have improved student academic progress and retention (Bachman, 2013;
Bettinger & Long, 2009; Lareau, 2015). The training was meant to provide tools for
coaches as they worked to build connection with their student as they served as guides
towards clearly defined goals. These topics were documented in a binder and provided to
the coach for later reference as well.
Students were required to apply to join the coaching program each semester.
Applicants were encouraged to apply during orientation. The coaching program staff also
visited classrooms in the first semester to increase awareness and encourage students to
apply. During the application process, students were required to include their education
goals. Coaches were trained to review these goals with their student and confirm or
clarify where needed. Coaches were required to log each interaction with their student in
a handwritten coaching log.
In 2018, M&&¶V�UHWHQWLRQ�UDWH�IRU�VWXGHQWV�LQ�GHYHORSPHQWDO�HGXFDWLRQ�FRXUVHV�
ranged from 31% to 47%, depending on the cohort (MCC, 2019).
5HVHDUFK�4XHVWLRQV
The research questions for this study included:

�����
72
RQ1: What is the effect of a coaching intervention on retention for college
students placed in developmental education courses?
RQ2: What is the effect of a coaching intervention on term GPA for college
students selected for developmental education courses?
RQ3: What is the effect of a coaching intervention on term attempted versus
completed credits for college students selected for developmental education
courses?
RQ4: To what extent did frequency of coaching sessions influence student
retention?
RQ5: To what extent does length of coaching session influence student retention?
RQ6: To what extent does goal setting influence student retention?
RQ7: To what extent did coaches support students in line with the coaching
techniques from their training?
RQ8: What are student perceptions of goal setting and its influence on self-
efficacy and grit?
RQ9: What are the perceptions of coaches and students on the influence of the
coaching intervention on student retention?
Research Design
This key research questions in this study focus on how coaching could improve
retention rates for developmental education students. Based on a pragmatist worldview
(Creswell & Clark, 2011) the significance of the problem to the field and the urgency to
develop practical solutions served as the guiding stance for the study. As such, an
embedded design (Creswell & Clark, 2011) mixed method approach was used. The

�����
73
chosen design allowed for the concurrent collection and analysis of quantitative and
qualitative data, with the qualitative data providing supplemental insights into the output
of the quantitative analysis. The primary research questions related to whether coaching
and goal setting influence retention were answered using a quantitative approach.
Questions related to the specific coaching techniques that influence retention required a
qualitative approach. The quantitative data provided answers to research questions related
to measuring the difference in retention, GPA for coached students, and the difference
between attempted and completed credits for coached versus non-coached groups. The
qualitative data supported answers to questions related to exposure to the training and
participant responsiveness to the treatment. The results of the qualitative elements of the
study provided insight into what factors within the coaching intervention influenced
retention. Mixing the quantitative and qualitative data occurred when fidelity of
implementation was explored.
Definition of Fidelity of Implementation. Fidelity of implementation refers to
how well the actual implementation of program or treatment aligned to the intended
implementation (Dusenbury et al., 2003). As indicated in Table 4.1, four of the five tenets
for fidelity of implementation (Dane & Schneider, 1998; Dusenbury et al., 2003; Nelson
et al., 2012) were used to assess the proposed intervention. Determining the boundaries of
high and low fidelity of implementation presents a challenge due to the complexity
involved (Holliday, 2014). Holliday (2014) points out that defining low and high fidelity
should begin with setting a standard against which the implementation can be measured.
High and low standards were set for each fidelity indicator in this study.
Indicators of Fidelity of Implementation

�����
74
As provided in Table 4.1, three indicators for fidelity were used: exposure/dose,
quality, and participant responsiveness. The first indicator was exposure or dosage. This
indicator refers to whether coaches practiced all elements from of their training over the
course of the semester and to how much of each element of coaching was done by
coaches. The source of data for this indicator was the coaching database. Coaching
VHVVLRQV�ZHUH�DOO�GRFXPHQWHG�LQ�HDFK�FRDFK¶V�FRDFKLQJ�ORJ�DQG�ORJ�VXPPDULHV�ZHUH�
compiled in the coaching database. The coaching database included data on student
name, coach assigned, goals the student had set, number of meetings and the total
coaching hours.
The second indicator relates to the quality or how well the coaches implemented
all elements of the training. Last, participant responsiveness refers to how well coaches
and students responded to the coaching, including perceptions of effectiveness. The
source of data for the quality and participant responsiveness was the coach and student
interviews conducted over a four-week period.
7DEOH����
Data Collection Matrix
)LGHOLW\�,QGLFDWRU
'DWD�6RXUFHV 'DWD�&ROOHFWLRQ�7RRO
)UHTXHQF\ 5HVSRQVLELOLW\
([SRVXUH�'RVH &RDFKHV
&RDFKLQJ�'DWDEDVH
(QG�RI�6HPHVWHU
6WXG\�WHDP�PHPEHUV
4XDOLW\ &RDFKHV�DQG�6WXGHQWV
&RDFK�DQG�6WXGHQW�,QWHUYLHZV
(QG�RI�6HPHVWHU
6WXG\�WHDP�PHPEHUV
3DUWLFLSDQW�5HVSRQVLYHQHVV
&RDFKHV�DQG�6WXGHQWV
&RDFK�DQG�6WXGHQW ,QWHUYLHZV
(QG�RI�6HPHVWHU
6WXG\�WHDP�PHPEHUV

�����
75
([SRVXUH�'RVDJH� Exposure in the program was defined at two levels. The first
refers to the number of completed coaching sessions. Based on current coaching models
in use, coaches and students should have connection points between two and six times
per semester (Alzen et al., 2021; Parker et al., 2015; Rodriguez Ott et al., 2020;
Sepulveda et al., 2019). After factoring for the first week of school, fall break, and exam
weeks, there were 12 possible weeks that coaches could meet with students. For
exposure, high coaching fidelity was determined by nine or more documented coaching
sessions with each student per semester, medium fidelity was set at six to eight sessions
per semester and low fidelity was set at five or less sessions per semester.
The second element of exposure of the treatment refers to the length of coaching
sessions that the coaches completed with their assigned student. This was captured in the
coaching database. Coaches were trained to complete one hour of coaching per week with
their students. This was in line with similar coaching programs (Abdulla, 2017; Abt
Associates, 2015; Bettinger & Baker, 2014). As such, in terms of exposure, coaching
sessions that were 45 minutes or longer were considered high-fidelity for exposure,
medium fidelity was set at 30 to 44 minutes and low fidelity was set at less than 30
minutes.
4XDOLW\��As part of their training,�coaches were taught active listening techniques,
ways of controlling for bias, the importance of asking powerful questions that stimulate
discussion and connection, how to set effective goals, and the importance of sharing the
resources available with students (Abt Associates, 2015; Alzen et al., 2021; 2015; Parker
et al., 2011; Pechac & Slantcheva-Durst, 2021). Recruitment focused on obtaining
interviews with 10 coaches and 10 students in the coaching program. Coaches and

�����
76
students were asked to share which of these techniques were used in their coaching
sessions. Of the techniques used, students were then asked to estimate the frequency at
which each technique was used. Estimated use of two or more techniques more than
twice a month was seen as high fidelity in terms of quality; whereas coaching that
included two or less techniques and/or demonstrated these techniques less than twice a
month, were considered low fidelity.
3DUWLFLSDQW�5HVSRQVLYHQHVV� Coaches and students in the program were recruited
for interviews to assess their perceptions of the effectiveness of the coaching techniques
in improving retention. Assessing perceptions of effectiveness provided further insight
into which elements of coaching both coaches and students thought were useful. It also
provided some insight as to why coaches or students applied the program with high or
low fidelity. For example, coaches may adapt their approach from what was provided in
their training if they believe they have found more effective ways to improve their
VWXGHQWV¶�VNLOOV��7KLV�NLQG�RI�DGDSWDWLRQ��ZKLOH�LW�PD\�OHDG�WR�ORZ�ILGHOLW\�RI�
implementation, provides helpful insight into possible gaps in the implementation plan
itself (O'Donnell, 2008) and could present a helpful means of clarifying the most
productive activities of the intervention.
Method
This section provides details on the coaches and students involved in the program and the
procedures to conduct the study.
3DUWLFLSDQWV�
To determine influence of coaching on retention, term credits and GPA, the
population of students in the treatment group included all 149 students who had applied

�����
77
or enrolled in the coaching program in fall of 2019. Of these students, 38 never met with
their coach and 22 dropped out of the program prior to the end of the semester. Of the
remaining 89 students who completed the program, 74 were students who had been
placed in developmental education courses. Data for the 149 students enrolled in
coaching in fall of 2019 and data for 149 randomly selected non-coached students who
were also enrolled in fall of 2019 were downloaded to a Microsoft Excel table and
assigned an ID number from one to 298. The non-coached students were selected using
simple random sampling in the MCC student information system (SIS). All non-
developmental education students were removed from the full data set. Of the students
who had applied or enrolled in the coaching program, all students who had not completed
their coaching program were removed. As such, the treatment group initially included all
74 developmental education students in the coaching program. Using case-control
matching in SPSS for age, gender, race, fulltime versus part-time status and cumulative
GPA as the matching variables, 55 students from the comparison group and 55 students
from the treatment group were matched and comprised the final participants for the study.
To capture results for frequency and length of coaching sessions, as well as
frequency of goal setting conversations between student and coach, 12 randomly selected
coach session summaries from 11 coaches who coached during the fall 2019 semester
were pulled from the coaching database for review.
To determine how closely coaches aligned to the training and to determine
perceptions of coaching influence on self-efficacy, grit, and retention, interviews were
conducted with coaches and students in the treatment group. The coaching program
director sent separate email invitations to students and coaches in the coaching program.

�����
78
Only one reminder was sent to each group. Two students and four coaches responded to
the request and were interviewed within a four-week period.
,QVWUXPHQWDWLRQ�
The primary instruments used during this study were the questionnaires developed
to guide semi-structured interviews with students and coaches to assess the training
provided to coaching and the fidelity of implementation. Student interviews focused
primarily on how they responded to the coaching program, including what factors
influenced their relationship with their coach and how coaching influenced or did not
influence their behavior, academic performance, and decision to remain enrolled
(Appendix C). The coach interviews included data on student exposure to the training,
coach perspective on the effectiveness of the training they received and insight into what
modifications if any they may have made to their coaching approach (Appendix E).
Of note, at the time of data collection, it was not possible to conduct a pre-test for
self-efficacy and grit for coached students as students had already begun their coaching
experience at the time of the study. In addition, interviews were used to assess students
for self-HIILFDF\�XVLQJ�&KHQ�HW�DO�¶V��������1HZ�*HQHUDO�6HOI-Efficacy Scale (NGSE).
Since students from the comparison group were not available for interviews, the scale
was not applied to non-coached students.
'DWD�&ROOHFWLRQ
Most of the data for the study was provided by the MCC student information
system (SIS). The MCC SIS provided anonymized data on developmental education
requirements, retention from fall 2019 to spring 2020, age, gender, race, full-time/part-
time status, term attempted credits, term completed credits, cumulative GPA, cumulative

�����
79
attempted credits, cumulative completed credits, cumulative GPA, and coaching status.
These data addressed the research questions on the influence of the coaching program on
academic outcomes of developmental education students. These data were requested
from the MCC team. The team downloaded the data to Microsoft Excel and sent the data
securely through Vitru to the student researcher. The data were then downloaded to
Apple iCloud and the original file erased from Vitru.
In addition to the SIS, the MCC coaching database held data on coaching logs for
the treatment group. The MCC Program Director downloaded 12 randomly selected log
summaries from the database of coaches and students who completed the coaching
program in fall 2019. Data from coaching logs for 12 randomly selected coaches were
downloaded to Excel and housed on Apple iCloud. To allow for triangulation with the
results of the interviews, these data were not anonymized but instead kept confidential to
the student researcher and the MCC Program Director. Once the interview results were
matched to the coaching log summary, the names of students and coaches were replaced
with pseudonyms to allow for increased anonymity for participants. Of these 12 coaches,
all 12 had students enrolled in fall 2019 and spring 2020. The coaching logs were used to
capture student interactions in relation to three primary areas (i) length of session; (ii)
frequency of sessions; and (iii) frequency of goal discussions between coach and student.
Interviews were 60 minutes long and consisted of 16 possible questions for
students and 10 possible questions for coaches. The interview protocol for the student
interviews is provided in Appendix B and the interview protocol for coaches is provided
Appendix C. Coach and student interview results were captured through note-taking in an
online field journal in Apple iCloud.

�����
80
'DWD�0DQDJHPHQW
Data on the 298 students were downloaded from the MCC SIS into Microsoft
Excel and anonymized by removing student identification numbers and replacing them
with a number from 1 to 298. Data from 12 coaching logs was downloaded into
Microsoft Excel. Data from the coaching logs and from the MCC SIS were encrypted
through Virtru and sent via email link from MCC to the student researcher. The link to
this data was set to expire after four days. All data were downloaded from Virtru to
Apple iCloud Drive. The quantitative data uploaded to SPSS for analysis and the
qualitative data from the coaching logs was entered into Microsoft Word for analysis.
Student and coach interview notes were documented in an online field journal. All
information was housed in Apple iCloud, with access only available to the student
researcher. Once students self-selected to be interviewed, the coaching database summary
was reviewed to determine if interviewee coaching session summaries were included in
the database summary. Interviewees were then matched to data to their coaching logs and
names from interviews and coaching database were replaced with pseudonyms to allow
for increased anonymity for participants.
'DWD�$QDO\VLV
Data analysis consisted of two types of evaluations: outcome and process
evaluation. The analysis for the outcome evaluation focused on data related to whether
coaching influenced fall to spring retention, completed credits, and GPA. The process
evaluation component focused on evaluating the fidelity of implementation in the areas of
exposure/dosage, and participant responsiveness. It included assessment of the coaching
logs and interview results, and retention rates from the SIS.

�����
81
Control case matching was used to develop the treatment and comparison groups.
Age, gender, race, full-time versus part-time status, and cumulative GPA were assigned
as the control variables since research indicates that these factors influence retention rates
in developmental education students (Bettinger & Baker, 2014; Capstick et al., 2019;
McFarland et al., 2019). The use of these controls in this design provided insight into
how much of the difference in retention rates for coach and non-coached groups was due
to the coaching treatment alone and not the control variables. Determining the influence
of these control variables is of particular importance in non-equivalent group
comparisons (Shadish, et a., 2011; Schutt, 2015). Using the available treatment and
comparison group data, a chi-square test was used to compare distributions of treatment
and comparison groups as it relates to retention. The chi-square test was selected because
the goal was to compare the sample to the population, and the retention data were
QRPLQDO��2¶/HDU\���������'DWD�IRU�WHUP�*3$�DQG�DWWHPSWHG�YHUVXV�FRPSOHWHG�FUHGLWV�
yield ratio was assessed to determine whether the distributions were normal by using the
HPSLULFDO�UXOH��2¶/HDU\���������8SRQ�GHWHUPLQLQJ�WKDW�������RI�WKH�GDWD�IHOO�ZLWKLQ�WKUHH�
standard deviations of the mean, an independent samples t-test was used to compare
means between treatment and comparison group as it relates to their term GPA and the
term completed credits for each group. /HYHQH¶V�WHVW�IRU�HTXDOLW\�RI�YDULDQFHV�DFURVV�
groups was used to assess whether the homogeneity of the data across groups.
Data from the coaching database was reviewed and incomplete entries removed.
Of the 12 entries from 11 coaches, one had no data on time spent coaching and one did
not complete the coaching, so these two entries were removed. The final list in the
database included 11 coach entries from 10 coaches. For these 10 entries, the number of

�����
82
sessions per coach and the mean length of these sessions were calculated. The coaching
database data were used to determine how much time coaches spent with students and at
what frequency. While data on coaching database included data on what goals were
discussed over the course of the semester, individual session notes were not available.
To complete the process evaluation element of the study, interviews were
conducted with coaches and students. Moreover, data from the coaching database was
analyzed for frequency and length of sessions.
Interviews were conducted with coaches to determine whether coaches used
techniques provided in the training to build relationships and share resources. Interview
notes were organized by question, coded using Microsoft Word and codes were then
placed into six pre-GHWHUPLQHG�WKHPHV��2¶/HDU\���������7KHVH�SUH-determined themes
corresponded to the five areas of training coaches received: active listening, powerful
questions, monitoring for bias, avoiding judgement, goal setting, and resource-sharing
(Alzen et al., 2021; Barnett, 1995; Groh, 2016; Jaramillo et al., 2013; Lehan et al., 2018;
Pechac & Slantcheva-Durst, 2021; Robinson & Gahagan, 2010; Sepulveda et al., 2019;
Tudor, 2018; Weger et al., 2014). To determine student and coach perceptions of
coaching on retention, self-efficacy and grit, interview notes were reviewed, and
responses were categorized into emergent themes as it related to student self-efficacy
behaviors captured in the New General Self-Efficacy Scale (Chen e. al, 2001). Notes
from the interviews were also assessed to determine student and coach feedback on how
much they thought coaching influenced student retention.
(IIHFW�6L]H
�����
83
Since no pre-test could be conducted for the coaching supports, it was hard to
ascertain whether the change in persistence is the standard level of change that would
have occurred without the treatment; or whether the change was large enough to have
practical significance. The use of a comparison group in the study allowed mitigating this
challenge as it provided the opportunity to compare the results of the treatment group to a
similar group that did not receive the treatment (Shadish et al., 2002). Validity and
generalizability of the results can be further increased by setting a standard from previous
research for effect size and selecting a sample greater than the minimum required to limit
Type I or Type II errors from occurring.
Effect size represents a means of assessing the practical significance of an
outcome based on the target population and stakeholder (Hill et al., 2008; Rossi et al.,
2003; Shadish et al., 2002). Effect benchmarks were taken into consideration in regards
to normative expectations for change in the coaching field, as well as policy-relevant
performance gaps (Hill et al., 2008). In a quasi-experimental study where a comparison
group of non-coached students was compared to treatment groups of coached students,
Bettinger and Baker (2014) assessed the results of providing coaching support to
undergraduate students. The coaching service evaluated, InsideTrack, used a similar
model to the proposed intervention. As with the current program intervention, coaches
supported undergraduate students from the moment of enrollment. Though their target
population was not limited to developmental education students, at the 99% confidence
level (p = .01), they found a medium effect size of .52, which represented an increase in
the retention rate of 12% over the non-coached group (Bettinger & Baker, 2014).
Bettinger and Baker (2014) used the standardized mean difference method to determine
�����
84
the effect size of coaching supports after six months, 12 months, 18 months, 24 months
and at then after the students had completed their degrees.
Since the current study focused on retention from fall to spring, the 6-month
benchmark is most relevant for comparison. Given the effect size of .52, a type I error
rate of .050, and a type II error rate of .20 (power = .80), the total sample size needed was
116, with 58 assigned to the treatment (N1) and 58 assigned to the control group (N0).
This sample size was not possible within the current practice, since the final sample size
for both groups was 110 students (Ntreatment = 55, Ncontrol.= 55) This sample size and effect
size should limit a type I error to less than 5% and a type II error to less than 20% which
aligns with conventional error rates (Rossi et al., 2003) and the effect size and power
statistic used by Bettinger and Baker (2014). Using effect size to evaluate the outcome of
the study helps mitigate the limited number of control variables used in the matching
process.
3URFHGXUH
The population of 149 students who were enrolled in coaching in fall of 2019 and
a randomly selected group of 149 non-coached students who also attended MCC in fall of
2019 were downloaded to Microsoft Excel. Data were anonymized, with student names
replaced with identification numbers. Coaching status in fall 2019 and spring 2020,
developmental education status, retention status from fall 2019 to spring 2020, age,
gender, race and ethnicity, full-time and part-time status, developmental courses needed,
term attempted credits, term completed credits, term GPA, cumulative attempted credits,
cumulative completed credits, and cumulative GPA were included as part of the data set.
The resulting dataset included 110 cases, 55 of which were in the coached group and 55

�����
85
in the non-coached group. This data set was saved in a folder in Apple iCloud that only
the student researcher had access to. The file was uploaded to SPSS and control case
matching was used in the Data menu. Cases were matched for age, gender, full-time or
part-time status, cumulative GPA, and cumulative credits. The matched data were
downloaded to Microsoft Excel saved as a new file. This new file included only the
treatment and matched groups.
The dataset with matched and treatment groups was uploaded to SPSS and a chi-
square test run to compare the difference in distributions in fall to spring retention rates
between the treatment and matched groups. Then, an independent samples t-test was used
to determine the difference between the matched and treatment groups as it relates to
term completed credits and term GPA. The results of both tests were logged by the
student researcher. These quantitative elements of the study provided responses to the
outcomes of the coaching intervention as it related to retention. Since the sample size for
the coached and non-coached groups did not meet the threshold of 58 cases per group,
effect size could not be calculated.
The process evaluation began after the treatment group had been selected. Data
from the coaching database on 10 coaches was used to determine the influence of dosage
of coaching sessions and adherence to goal setting on student retention. The MCC team
sent the coaching database data through securely through Vitru and the data were then
downloaded to Microsoft Excel by the student researcher. In Microsoft Excel, coaches
were organized by number of coaching sessions. Coaches with more than nine sessions
were placed into the high-fidelity category, coaches with six to eight sessions per

�����
86
semester were placed in the medium fidelity category, and coaches with five or less
sessions were placed in the low fidelity category.
To assess exposure or dosage, time spent in coaching sessions was calculated for
each coach and coaches were placed into three fidelity categories as it related to
exposure. The high fidelity group included coaches who had logged a mean time of 45
minutes per session, the medium fidelity group included coaches who had logged 30 to
44 minutes per session and the low fidelity group included coaches who provided less
than 40 minutes of coaching per week.
Once the exposure indicators of fidelity were noted, the quality indicator analysis
began. Given that goal setting was a key element of coaching, the coaching database was
reviewed to assess frequency of goal setting discussion and retention. Students and
coaches included in the coaching database were cross-referenced to students and coaches
that were interviewed.
Coaches and students who were enrolled in the program were recruited via email
by the Program Director over a four-week period. Students in the treatment group and the
coaches who supported them were emailed to request permission for an interview. The
students and coaches who gave their permission received a follow-up calendar invitation
for a one-hour interview via Zoom and a consent form. The interviews took place during
a four-week period. Coaches were not made aware that the interview involved assessing
the adherence to the training provided and situation questions were used to prevent
FRDFKHV�IURP�WU\LQJ�WR�SURYLGH�WKH�µULJKW¶�DQVZHU��1RWHV�IURP�WKH�VWXGHQW�DQG�FRDFK�
interviews were captured in a corresponding Microsoft Word field journal saved in Apple
iCloud and only the student researcher had access to these files. Once the interviews of

�����
87
students and coaches were completed, the results were coded to provide answers to the
research questions related to process and outcome. The field notes were used to
determine how much coaches adhered to the coach training provided using the training
topics as the pre-determined themes: active listening techniques, powerful questions,
monitoring for bias, avoiding judgement techniques, goal setting, and resource sharing.
Responses were highlighted in colors that corresponded to each theme and summarized
for each coach to determine the number of instances and the perceived frequency with
which the coaches practiced these techniques.
The final element of the process analysis included perceptions of students and
coaches of the coaching treatment. Using the field notes captured in Microsoft Word,
coach responses to questions to determine the influence of coaching on retention, self-
efficacy, and grit behavior.
Conclusion and Summary Matrix
This intervention tested the influence of coaching on retention for students in
developmental education courses. The matrix provided in Table 4.2 captures the research
questions for the study and the proximal outcomes, variables, and data sources for each
question.
7DEOH����
Summary Matrix
Research Question Variables Source of Data
Data Analysis

�����
88
RQ1: What is the effect of a coaching intervention on retention for college students selected for developmental education courses?
Fall -to-spring retention rates
MCC student information system
Chi-square test to compare distributions of treatment and comparison group as it relates to retention.
RQ2: What is the effect of a coaching intervention on term and first term GPA for college students selected for developmental education courses?
First Term GPA
MCC student information system
Independent samples t-test to compare means between treatment and comparison group as it relates to their first term GPA in College.
RQ3: What is the effect of a coaching intervention on term completed credits for college students selected for developmental education courses?
Difference between attempted and completed credits
MCC student information system
Independent samples t-test to compare means of treatment and comparison group as it relates to the difference in term completed credits for each group.
RQ4: To what extent did frequency of coaching sessions influence student retention?
Number of coaching sessions Fall-to-spring retention rates
Coaching database MCC student information system
Coaching logs were used to determine low and high fidelity boundaries. A chi-square test was used to determine the differences in retention between groups.
RQ5: To what extent did goal setting influence student retention?
Goal discussion notations in coaching logs Fall-to-spring retention rates
Coaching database MCC student information system
Coaching logs were used to capture the frequency of goal discussions. A chi-square test was used to determine the relationship between frequency of discussion and retention within the treatment group.

�����
89
RQ6: To what extent did length of coaching session influence student retention?
Coaching sessions alignment with coaching training protocol
Coaching database MCC student information system
Coaching logs were used to determine how much time each coach spent with the student each week. A chi-square test was used to determine the differences in retention between groups that received 40 minutes or more (high level of fidelity) and the group who received less than 40 minutes (low level of fidelity).
RQ7: To what extent did coaches support students in line with the coaching techniques from the training?
Coach and student interviews
Interview notes coded into pre-determined theme aligned with training: active listening, powerful questions, monitoring for bias, avoiding judgement, and resource-sharing. Coaches who practiced two or more of these techniques were placed in the high fidelity group and coaches with less than two techniques were considered the low fidelity group.
RQ8: What were student perceptions of goal setting and its impact on self-efficacy and grit?
Coach and student interviews
Used coach and student interview questions to capture common themes of student beliefs on goal setting, self-efficacy and grit.
RQ9: What are the perceptions of coaches and students on the coaching intervention on student retention?
Coach and student interviews
Interview notes were used capture perceptions of effectiveness of coaching as it related to student retention.

�����
90
Chapter 5
Findings, Discussion, and Implications for Practice
This chapter captures the findings of the study conducted from March 2021 to
April 2021 that examined the influence of a coaching program on student retention and
academic success markers for developmental education students. The study explored the
differences in retention rate and key academic success markers between a group of
coached and a group of non-coached developmental education students who attended at a
mid-sized urban community college (MCC) in fall of 2019. The analysis included data
from 110 developmental education students who attended MCC in fall 2019; 55 of these
students completed the coaching program and 55 did not.
Students who did not already have a coach prior to the fall 2019 semester, were
encouraged to apply to the coaching program at the start of fall 2019. All students were
assigned a coach by the end of the first week of fall 2019. Coaches included full-time and
part-time faculty and staff of MCC and received 90-minutes of in-person and three
modules of online training prior to becoming coaches. This training included techniques
for active listening, controlling for bias, goal setting, asking powerful questions and
knowledge of student resources available.
5HVHDUFK�4XHVWLRQV
The results of the study are categorized by research question.
RQ1: What is the effect of a coaching intervention on retention for college
students placed in developmental education courses?
RQ2: What is the effect of a coaching intervention on term GPA for college
students selected for developmental education courses?

�����
91
RQ3: What is the effect of a coaching intervention on term attempted versus
completed credits for college students selected for developmental education
courses?
RQ4: To what extent did frequency of coaching sessions influence student
retention?
RQ5: To what extent does length of coaching session influence student retention?
RQ6: To what extent did goal setting influence student retention?
RQ7: To what extent did coaches support students in line with their training?
RQ8: What are student perceptions of goal setting and its influence on self-
efficacy and grit?
RQ9: What are the perceptions of coaches and students on the influence of the
coaching intervention on student retention?
Effect of Coaching on Retention, Term GPA and Term Attempted versus
Completed
Data from the MCC SIS provided the impetus for the response to the first three
research questions of the study. The coached group included students who had completed
their full coaching commitment for the semester by meeting and staying in contact with
their coach at least once every two weeks through to the end of the semester. Student
retention was measured by whether students completed their fall 2019 and spring 2020
semesters.
&RQWURO�9DULDEOHV
Prior to the analysis of the control variables, equivalence for age, gender, race,
fulltime versus part-time status and cumulative GPA across the treatment and control

�����
92
groups were determined. Prior to control case matching, average age for the control
group (n = 74) was 24 and average age for the comparison group (n=74) was 27. In terms
of gender, 30% of the treatment group was male and 70% was female, while 26% of the
control group was male and 74% was female. Average cumulative GPA stood at 2.76 for
the treatment group and 2.48 for the control group. Forty-seven percent of the treatment
group was studying in a full-time status, while 53% were studying part-time. For the
control group, 50% were studying full-time and 50% was part-time. While the variance
across the control and treatment groups were not very large, case control matching results
were able improve the matching between groups. Table 5.1 shows that after matching,
both groups were equally matched for race, gender, average cumulative GPA, and full-
time versus part-time status. The average after for students in the control group was 26,
while the average age for the treatment group was 25.
7DEOH����
3RVW�&RQWURO�&DVH�0DWFKLQJ�5HVXOWV�IRU�7UHDWPHQW�DQG�&RPSDULVRQ�*URXSV
Needed Developmental Education Treatment Comparison Average Age 25 26 Average Cumulative GPA 2.6 2.6 Male 16 16 Female 39 39 Full-time 28 28 Part-time 27 27 Asian 8 8 Black 32 32 White 3 3 Hispanic 10 10 Two or more races 2 2

�����
93
5HWHQWLRQ��
The first research question, ³What is the effect of a coaching intervention on
retention for college students placed in developmental education courses?´�UHYHDOHG�WKDW�
of the 55 developmental education students in the treatment group, 87% (n = 48) of
students were retained, whereas 71% (n = 39) in the comparison group were retained. A
Chi-Square test was performed on the two groups and results indicated a significant
association between coaching and retention (p=.04). Coaching influenced retention, with
more students in the coaching group being retained than the non-coached group. This
supports the findings of Alzen et al. (2021), Capstick et al. (2019) and Rodriguez Ott et
al. (2020) who found that coaching increased student persistence and academic outcomes.
7DEOH����
Fall 2019 to Spring 2020 Retention for Treatment and Comparison Groups
Fall 2019 to Spring 2020 Not Retained
n
Fall 2019 to Spring
2020 Retained
n
5RZ�7RWDO
3HDUVRQ�&KL�6TXDUH�
7HVW p
Needed Developmental Education Comparison Group 16 39 55 .04 Treatment Group 7 48 55 Total 23 87 110
Of note, 13% (n=7) of coached students were not retained. Of these students who
were coached for the full semester but did not remain at MCC, five had GPAs over 2.0
and of these five, three had a GPA over 3.0. Only one had accumulated more than the 60
credits for graduation. It may be possible that the students with GPAs over 3.0 transferred
and the two students who did not have a GPA over 2.0 dropped out but no further data

�����
94
was available about the students at the time of the study as they could not be contacted or
tracked.
7HUP�*3$
7KH�VHFRQG�UHVHDUFK�TXHVWLRQ��³:KDW�LV�WKH�HIIHFW�RI�D�FRDFKLQJ�LQWHUYHQWLRQ�RQ�
WHUP�*3$�IRU�FROOHJH�VWXGHQWV�VHOHFWHG�IRU�GHYHORSPHQWDO�HGXFDWLRQ�FRXUVHV"´�IRXQG�WKDW�
when term GPA was calculated for fall 2019, students in the treatment group had a higher
mean term GPA than students in the comparison group, and that both groups were
normally distributed with 99.7% of the data falling within three standard deviations of the
mean. /HYHQH¶V�WHVW�IRU�HTXDOLW\�RI�YDULDQFH�ZDV�WKHQ�XVHG�WR�GHWHUPLQH equality of
variances across groups as it related to term GPA. Results of Levene¶V�WHVW�VKRZHG�QR�
significant difference between groups (f = .226, p=.63). Therefore, an independent
samples t-test was conducted to determine the effect of coaching on term GPA. As
opposed to the findings of Alzen et al., (2021), no significant difference was found
between the coached (n = 55, M = 2.43 SD = 1.19) and non-coached (n = 55, M = 2.39,
SD =1.13) groups; t (-0.150), p =0.440.
7DEOH�����
Fall 2019 GPA for Treatment and Comparison Groups
Students n
Mean n
6WG 'HYLDWLRQ
Std. Error Mean
Needed Developmental Education Comparison Group 55 2.39 1.13 .15 Treatment Group 55 2.43 1.19 .16 Total 110
A review of the 55 students from the coached group revealed that almost half
(45%) had a cumulative GPA above a 3.0 as compared to 20% of the students in the non-

�����
95
coached group. Since 3.0 is often the minimum requirement for transfer to a four-year
institution, this difference suggests that more students in the coached group were on a
trajectory to be able to transfer than the non-coached group. This is important because
successful completion of community college is considered graduating with a credential or
transferring on to a four-year college.
$WWHPSWHG�9HUVXV�&RPSOHWHG�&UHGLWV
7KH�WKLUG�UHVHDUFK�TXHVWLRQ��³:KDW�LV�WKH�HIIHFW�RI�D�FRDFKLQJ�LQWHUYHQWLRQ�RQ�WHUP�
attempted versus completed credits for college students selected for developmental
HGXFDWLRQ�FRXUVHV"´�ZDV�DVVHVVHG�E\�GHWHUPLQLQJ�Whe difference between the number of
attempted versus completed credits and calculated by deducting the number of completed
credits in a term from the number of attempted credits in a term for the treatment and
comparison groups. Results showed that the treatment group had a greater difference in
attempted versus completed credits than the comparison group, and that both groups were
normally distributed with 99.7% of the data falling within three standards deviations of
the mean. /HYHQH¶V�WHVW�IRU�HTXDOLW\�RI�YDULDQFH�ZDV�WKHQ�XVHG�WR�GHWHUPLQH�HTXDOLW\�RI�
variances across groups as it related to attempted versus completed credits and no
significant difference was found (f =.001, p=.97). As such, to determine whether there
was a significant difference in cumulative credits for the coached and non-coached
groups, an independent samples t-test was conducted. Results indicated a non-significant
difference in cumulative credits between the treatment (n = 55, M = 1.95 SD = 3.407) and
comparison group (n = 55, M = 1.91, SD =3.545); t (-.055), p =.478. This is similar to the
findings of Pechac and Slantcheva-Durst (2021) who concluded while coaching factors
influenced credit hour completion, factors such as enrollment status, race and ethnicity,

�����
96
and size of the institution were much stronger predictors of completion for at-risk
students.
7DEOH�����
Fall 2019 Attempted Versus Completed Credits for Treatment and Comparison Groups
Students n
Mean n
6WG 'HYLDWLRQ
Std. Error Mean
Needed Developmental Education Comparison Group 55 1.91 3.545 .478 Treatment Group 55 1.95 3.407 .459 Total 110
Coaching Frequency, Length of Sessions, Goal Setting Discussions and Retention
Ten randomly selected coaching logs for students enrolled in coaching between
fall 2019 and spring 2020 were analyzed for frequency of sessions per semester (M & Mo
= 9), length of sessions (M = 45 minutes; Mo = 60 minutes) and number of instances of
goal setting discussions. The student retention variable for each coach was reviewed to
DQVZHU�UHVHDUFK�TXHVWLRQV�IRXU��ILYH�DQG�VL[��³7R�ZKDW�H[WHQW�GLG�IUHTXHQF\�RI�FRDFKLQJ�
sessions influence student retention?,´�³7R�ZKDW�H[WHQW�GLG�OHQJWK�RI�FRDFKLQJ�VHVVLRQ�
influence student retention?,´�DQG�³7R�ZKDW�H[WHQW�GLG�JRDO setting influence retention?.´
After review, findings indicated that all students logged in the coaching databased logged
goals and were retained between fall 2019 and spring 2020. Data was not available on the
13% of students in the coached group who were not retained, and they had left the
institution at the time of the study. As such, no additional quantitative analysis was
conducted to answer research questions four, five and six.

�����
97
,QWHUYLHZ�5HVXOWV��&RGHERRN�
To complete the analysis of the interview notes captured in the four coaching and two
student interviews, the key themes of goal setting, college resources, powerful
questions, active listening, and controlling for bias were broken down into codes. A
summary of the codes and their descriptions is provided below.
7DEOH����
Interview Codebook Summary
Theme Codes Description
Goal setting goal, aim, objective, target Interviewee references setting and/or following up on academic or personal goals as part of their coaching experience��([DPSOH��³ZKLOH�they both talk about goals, RQH«QHHGV�D�VRXQGLQJ�ERDUG.´
College resources
college resources student resources college resources student services financial aid resources student support services
Interviewee references student support services on campus as part of the value of coaching. ([DPSOH��³recognizing when other resources [on campus] were needed.´
Powerful questions
conversation starters, training questions, and powerful questions
Interviewee references asking questions as a way of building relationship between coach and student. Example: ³WKH�WUDLQLQJ�TXHVWLRQV�KHOS�you engage.´
Active Listening
listening, listener, student led/guided conversations sounding board
Interviewee references allowing the student to guide conversations and listening to VXSSRUW��([DPSOH��³OLVWHQHU�QRW�solver.´

�����
98
Controlling for bias
sisterhood, no judgement/non-judgmental, judgement free, supported, empowered, objective
Interviewee references the coaching experience as a supportive one where the student was able to comfortably share without concern of judgement. ([DPSOH��³QR�MXGJHPHQW�± you never know what they have EHHQ�WKURXJK´�
,QWHUYLHZ�7KHPH��*RDO�6HWWLQJ
A comparison of the students and coaches logged in the coaching database and
the participant list for interviews revealed that all interview participants were logged in
the database extract. As seen in Table 5.5, based on the coaching database extract
determining personal/career goals, connecting to campus resources, and becoming more
disciplined and organized were in the top five most frequently noted goals. Getting
support encouragement and feedback, increasing my confidence and independence, and
understanding my personal relationships were also popular among students. Of note, the
most common goal selected by students referred to support, encouragement, and
feedback.
7DEOH����
Distribution of Goals of Coached Students
Goal Number of Times Selected
(n = 10) Support, encouragement, feedback
9
Figure out personal/career goals 7 Connect to campus resources 7 Become more disciplined and organized
4
Understand American culture 3
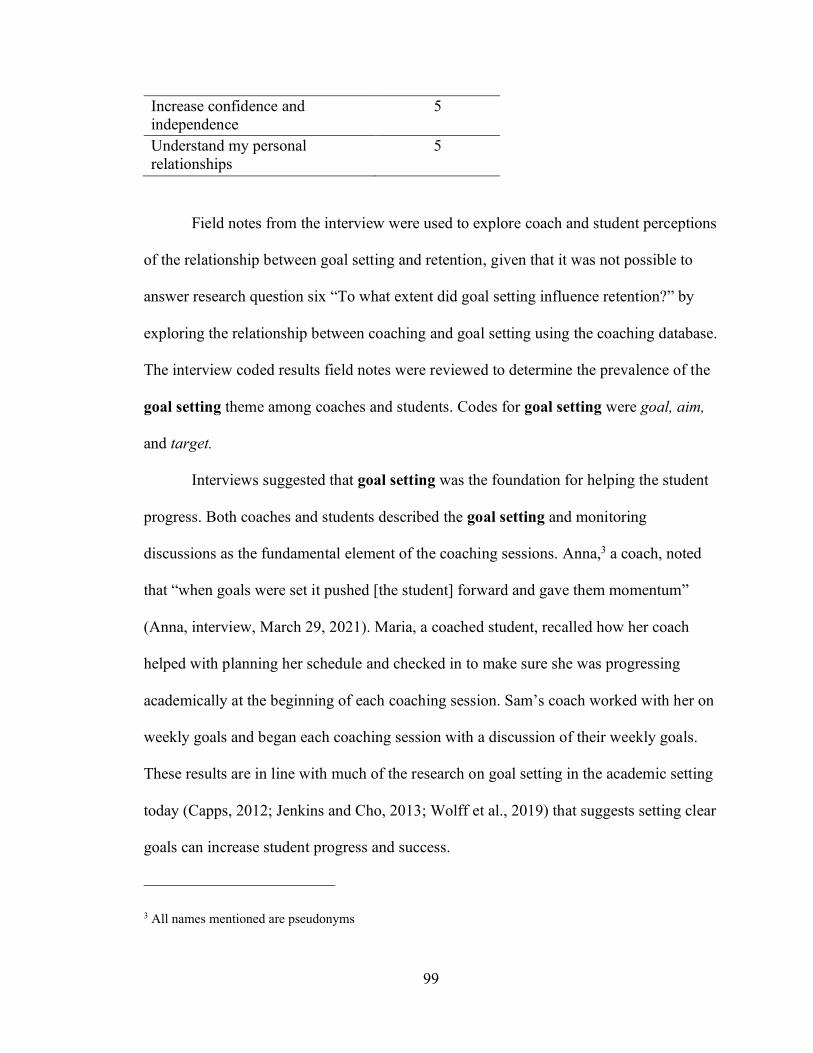
�����
99
Increase confidence and independence
5
Understand my personal relationships
5
Field notes from the interview were used to explore coach and student perceptions
of the relationship between goal setting and retention, given that it was not possible to
answer UHVHDUFK�TXHVWLRQ�VL[�³7R�ZKDW�H[WHQW�GLG�JRDO VHWWLQJ�LQIOXHQFH�UHWHQWLRQ"´�E\�
exploring the relationship between coaching and goal setting using the coaching database.
The interview coded results field notes were reviewed to determine the prevalence of the
goal setting theme among coaches and students. Codes for goal setting were goal, aim,
and target.
Interviews suggested that goal setting was the foundation for helping the student
progress. Both coaches and students described the goal setting and monitoring
discussions as the fundamental element of the coaching sessions. Anna,3 a coach, noted
WKDW�³ZKHQ�JRDOV�ZHUH�VHW�LW�SXVKHG�>WKH�VWXGHQW@�IRUZDUG�DQG�JDYH�WKHP�PRPHQWXP´
(Anna, interview, March 29, 2021). Maria, a coached student, recalled how her coach
helped with planning her schedule and checked in to make sure she was progressing
DFDGHPLFDOO\�DW�WKH�EHJLQQLQJ�RI�HDFK�FRDFKLQJ�VHVVLRQ��6DP¶V�FRDFK�ZRUNHG�ZLWK�KHU�RQ�
weekly goals and began each coaching session with a discussion of their weekly goals.
These results are in line with much of the research on goal setting in the academic setting
today (Capps, 2012; Jenkins and Cho, 2013; Wolff et al., 2019) that suggests setting clear
goals can increase student progress and success.
3 All names mentioned are pseudonyms

�����
100
Interestingly, while students and coaches expressed their common goal of
ensuring academic progress and success, students often pointed to more socio-cultural
JRDOV��-RKQ¶V�VWXGHQW�ZDV�QRW�American and set a goal of increasing his understanding of
American culture. Matthew noted that the student was always allowed to drive the goal
GLVFXVVLRQV��+H�QRWHG�WKDW�³ZKLOH�WKH\�ERWK�WDON�DERXW�JRDOV��RQH�VWXGHQW�NQRZV�ZKDW�KH�
ZDQWV�EXW�QHHGV�D�VRXQGLQJ�ERDUG«WKH�\RXQJHU�VWXdent is unsure and confused on next
VWHSV�DQG�QHHGV�PRUH�JXLGDQFH´�(Matthew, interview, March 30, 2021).
Fidelity of Implementation: Exposure/Dosage & Quality
Data from the coaching logs and interviews were then used to answer research
TXHVWLRQV�VHYHQ��³To what extend did coaches support students in line with their
WUDLQLQJ"´�IRFXVHG�RQ�WKH�H[SRVXUH�GRVDJH and quality. Research questions eight and
nine, respectively, ³:KDW�DUH�WKH�SHUFHSWLRQV�RI�goal setting and its influence of self-
HIILFDF\�DQG�JULW"´�DQG�³:KDW�DUH�WKH�SHUFHSWLRQV�RI�FRDFKHV�DQG�VWXGHQWV�RQ�WKH�
LQIOXHQFH�RI�FRDFKLQJ�RQ�VWXGHQW�UHWHQWLRQ"´�H[SORUHG�participant responsiveness
indicator of fidelity.
([SRVXUH�'RVDJH
Based on examples from other mentorship and coaching programs (Bettinger &
Baker, 2014; Bettinger & Long, 2005), high fidelity as it related to exposure was set at
nine or more sessions per semester, medium fidelity was set at six to eight sessions per
semester, and low fidelity was set at five or less sessions per semester. Coaches were
asked to meet with their student for one hour at least once a week during the semester.
Based on the MCC fall 2019 Academic Calendar, after factoring for the first week of

�����
101
school, exam weeks, and fall break, coaches had 12 weeks during which time they could
meet with their students.
Data from the coaching log database revealed that coaches had formal coaching
sessions every one to two weeks, with a mean meeting time of 46 minutes per session. Of
the 10 coaching logs reviewed, eight coaches met with their student nine times or more
during the semester, one coach met seven times and one coach met five times. Only one
coach documented meeting with their student upwards of 12 times for the semester.
Given that our boundary of high fidelity was set at nine meetings over the course of the
semester, 80% of coaches met the high-fidelity threshold, 10% met the medium fidelity
threshold and 10% met the low fidelity threshold.
Length of coaching sessions was used to denote the fidelity marker for exposure.
The boundary for high fidelity was set at 45 minutes or more, medium fidelity was set at
30 to 44 minutes, and low fidelity was set at less than 30 minutes. The coaching log data
revealed that the length of sessions averaged 46 minutes, with eight coaches spending 45
minutes or more with their student per session. Of the 10 coaching logs reviewed, eight
met or exceeded the high-fidelity mark of 45 minutes, one met the mid-fidelity mark (38
minutes), and one met the low-fidelity mark (11 minutes). Eighty percent of coaches met
the high fidelity threshold for the first part of the exposure indicator of fidelity. Of the
coaches who met nine times or more during the semester, five met with their student for
45 minutes or more. As such, 50% of the coaching sessions documented in the coaching
logs met the threshold for high fidelity as it related to exposure.
Rodriguez 2WW�HW�DO�¶V�(2020) exploration of this area did find that students who
met with coaches two or more times a year had higher credit accumulation than students

�����
102
who did not. While data from this study was insufficient to explore the relationship
between coaching exposure, academic performance and retention Rodriguez 2WW�HW�DO�¶V�
(2020) findings suggest that the relationship between coaching intensity and student
outcomes should be explored further.
4XDOLW\�
Four coaches and two students were interviewed over a four-week period to
provide data on fidelity of implementation. Of the four coaches interviewed, all had been
at MCC for more than five years and had worked at the institution full-time for most of
their tenure there. Coaches worked in administration, as faculty, or in technical roles at
the time of the interviews, and, except for one coach who had coached for more than 14
years, most had coached for five years or less.
7DEOH�����
Background of Interviewed Coaches
Name Area of Work Time at MCC
Time Coaching
1XPEHU�RI�6WXGHQWV�&RDFKHG�
GXULQJ�WHQXUH Anna Administration 15 years 5 years 3 John Technical 6 years 1 year 1 Kimberly Faculty 16 years 14 years 4 Matthew Administration 10 years 3 years 2
The two interviewed students began their education in fall of 2019 and were
working towards completing their degree within the next 18 months. Both students were
non-traditional adult learners who came back to school after more than 10 years of work
experience. Since both students were non-traditional students, their likelihood of

�����
103
retention was higher (NCES, 2019). Both students had been coached for the last two
years.
7DEOH�����
Background of Interviewed Students
Name Area of Work Time at MCC
Time being
coached
$QWLFLSDWHG�*UDGXDWLRQ
Maria Cafeteria Worker
2 years 2 years Fall 2021
Sam Veteran 2 years 2 years 2022
All coaches had been trained in five key areas and were asked to use these tools
during their coaching sessions: asking powerful questions, active listening, controlling
for bias, goal setting, and sharing knowledge of college resources. These five areas
represented the pre-determined themes used to categorize the resulting of field note
coding. The high-fidelity marker for quality was set at referencing two or more themes
and the low-fidelity indicator was set at referencing less than two themes. To assess the
quality indicator, coaches were asked what elements of the training they used. If coaches
could not point to any specific technique, they were then prompted with each of the five
elements of the training and asked to share whether they found themselves using these
consistently. Students were asked to share what factors of their coaching sessions
contributed to the relationship they had with their coach. They were also prompted with
each of the five elements of the training and asked how frequently they felt these
elements were used in their coaching sessions. The most frequently used elements of
training were knowledge of college resources and goal setting.
7DEOH����

�����
104
([SRVXUH�DQG�4XDOLW\�5HVXOWV�IRU�,QWHUYLHZHG�&RDFKHV
Coach Name Number of Meetings Time Per Session Elements of Training Used as
noted in Interviews
John 9 57 College Resources Goal Setting Controlling for Bias
Anna 5 60
College Resources Active Listening Powerful Questions Goal Setting
Matthew Student 1: 11 Student 2: 13
Student 1: 11 Student 2: 14
Active Listening College Resources Goal Setting Controlling for Bias
Kimberly 10 60
Goal Setting Active Listening Controlling for Bias Powerful Questions College Resources
,QWHUYLHZ�7KHPH��&ROOHJH�5HVRXUFHV
When asked about the usefulness of their coach training, all coaches indicated that
the information provided to them on college resources was very useful and that they used
that aspect of their training frequently. The primary codes used for the theme of college
resources were student resources, college resources, student services, and any references
to specific campus services such as financial aid. $QQD�QRWHG�WKDW�³UHFRJQL]LQJ�ZKHQ�
RWKHU�UHVRXUFHV�DUH�QHHGHG«DQG�JLYLQJ�WKHP�WKH�DELOLW\�WR�FRQQHFW�>ZLWK�RWher college
UHVRXUFHV@´�(Anna, interview, March 29, 2021) was essential to her success as a coach.
0DWWKHZ�GHVFULEHV�³FRQWLQXRXVO\�UHIHUHQFLQJ´�(Matthew, interview, March 30, 2021) the
binder for student resources over the course of his coaching tenure. This aligns to current
research on coaching programs. Bettinger and Baker (2014), Capstick et al. (2019) and
Alzen et al. (2021) note that providing students guidance on the college resources

�����
105
available was a fundamental part of coaching programs. Moreover, Pechac and
Slantcheva-Durst (2021) also found that the most often discussed topic in coaching
sessions was college resources.
,QWHUYLHZ�7KHPH��3RZHUIXO�4XHVWLRQV
In addition to college resources, the theme of powerful questions was cited by
three of the four coaches as very helpful in helping begin the relationship with their
student. Primary codes for this these were conversation starters, training questions, and
powerful questions. $QQD�WKRXJKW�WKDW�³WKH�ELJJHVW�>HOHPHQW�RI�WKH training] was the
FRQYHUVDWLRQ�VWDUWHUV«WR�JHW�WKLQJV�JRLQJ�LQ�WKH�UHODWLRQVKLS´��$QQD��LQWHUYLHZ��0DUFK�
�����������-RKQ�QRWHG�WKDW�³ZKHQ�\RX�DUH�>D�QHZ�FRDFK@��LW�LV�LQWLPLGDWLQJ«WKH�WUDLQLQJ�
TXHVWLRQV�KHOS�\RX�HQJDJH�>ZLWK�\RXU�VWXGHQW@´��-RKQ��LQWHUYLHw, March 30, 2021).
Overall, coaches noted that the powerful questions element of the training was heavily
relied on when they are coaching a new student, but noted that as the relationship grew,
they became less and less important. Interestingly, powerful questions have been used to
help students become more aware of their behaviors and motivations so that they
eventually improve their self-management skills (Barnett, 1995; Frisby & Martin, 2010;
Scull et al., 2020). In this case, coaches felt that the use of powerful questions was more
relevant to creating the initial connection between student and coach and less about
LQFUHDVLQJ�WKH�VWXGHQW¶V�VHOI-awareness and management skills.
,QWHUYLHZ�7KHPH��$FWLYH�/LVWHQLQJ
Active listening was another often-used element of the training, with three of the
four coaches indicating that the guidance on active listening was useful. Primary codes
for this theme were listening, student led/guided conversations, and sounding board.
�����
106
Anna noted that she came into coaching ZLWK�DQ�³,�ZDQW�WR�VDYH�\RX�DSSURDFK´ (Anna,
interview, March 29, 2021), but quickly recognized the value of the training that
HQFRXUDJHG�KHU�WR�EH�D�³OLVWHQHU�DQG�QRW�D�VROYHU´��$QQD��LQWHUYLHZ��0DUFK������������
Coaches felt that this helped empower students and build their confidence over time.
Kimberly, who has coached the longest, noted that in her early years of coaching, she did
not IROORZ�WKLV�JXLGDQFH�IURP�WKH�WUDLQLQJ�FORVHO\�DQG�ZRXOG�RIWHQ�IHHO�OLNH�D�³IDLOXUH´
(Kimberly, interview, March 31, 2021). Once she began to follow the training more
FORVHO\��VKH�VDLG�VKH�FRQFOXGHG�WKDW�³LW¶V�QRW�DERXW�P\�YLFWRU\��LW¶V�DERXW�WKHLU�YLFWRU\´�
(Kimberly, interview, March 31, 2021) and that helped her to focus more on listening
than she initially did. While there is research available on the use of active listening to
create a sense of connection and understanding during communication (Wegner et al.,
2014; Groh, 2016), very little research exists on the use of active listening tools to do this
between coaches and students. These data suggest that active listening can serve as a
helpful communication tool within coaching in the academic context as well.
,QWHUYLHZ�7KHPH��&RQWUROOLQJ�IRU�%LDV
Linked to active listening was controlling for bias. The core codes for
controlling for bias were sisterhood, no judgement/non-judgmental, judgement free,
supported, empowered, and objective. This theme came out strongly in the interviews
conducted with coaches and students. Sam described feeling intimidated at first because
KHU�FRDFK�ZDV�D�IDFXOW\�PHPEHU�EXW�QRWHG�WKDW�³WKH�LQWLPLGDWLRQ�IDFWRU�ZHQW�GRZQ�
TXLFNO\´��6DP��LQWHUYLHZ��$SULO����������DQG�WKH\�GHYHORSHG�D�relationship that was very
PXFK�³VLVWHUKRRG-LVK´��6DP��LQWHUYLHZ��$SULO�����������:KHQ�SURPSWHG�ZLWK�WKH�
question, ³Did you feel supported or judged´ both students immediately responded with

�����
107
³supported´ and ³very supported.´ Coaches pointed out that watching for their own
biases allowed them to learn how to be better coaches, and, as Anna noted, this
³HPSRZHUHG�>KHU@�VWXGHQWV´��$QQD��LQWHUYLHZ��0DUFK������������6LPLODUO\��-RKQ�
GHVFULEHG�KLV�FRDFKLQJ�DSSURDFK�DV�DOO�DERXW�³EXLOGLQJ�WKH�UHODWLRQVKLS�± no judgement ±
\RX�QHYHU�NQRZ�ZKDW�WKH\�KDYH�EHHQ�WKURXJK�RU�ZKDW�WKH\�KDYH�GRQH´��-RKQ��LQWHUYLHZ��
March 29, 2021). This approach to mentorship, where students are provided a
³MXGJHPHQW�IUHH´�SHUVRQ�WR�VXSSRUW�WKHLU�SURJUHVV�KDV�EHHQ�XVHG�WR�HPSRZHU�SHRSOH�WR�
achieve their goals (Groh, 2016; Hodges et al., 2014).
3DUWLFLSDQW�5HVSRQVLYHQHVV
Self-Efficacy and Grit. 5HVHDUFK�TXHVWLRQ�HLJKW�³:KDW�DUH�VWXGHQW�SHUFHSWLRQV�RI�JRDO�
setting and its influence on self-HIILFDF\�DQG�JULW"´�ZDV�WKHQ�H[SORUHG��Since goal setting
was a fundamental element of coaching and set the foundation for coaches as they
worked to guide students towards their identified academic outcomes, student self-
efficacy scores were reviewed to determine the influence of goal setting on self-efficacy
and by extension, grit. Grit and self-efficacy have been shown to have a strong positive
correlation relationship (Alhadabi & Karpinski, 2019; Satish & Singh, 2020; Usher et al.,
2018). As such, these improvements in self-efficacy suggest that student grit levels
increased over time as well. Questions from the NGSE are included in within the
interview protocols in Appendices B and C.
As part of the end of each interview, coached students were asked to respond to
the eight questions used in the New General Self-Efficacy Scale (Chen et al., 2001).
Since a pre-test could not be conducted and students in the comparison group were not
made available for interviews, and students in the control group were not available for

�����
108
interviews, the two coached students interviewed were prompted to think back to before
they began coaching and asked how they would have responded to each question prior to
be coached. Then, they were asked to answer what they would respond with today. The
results of these responses are provided in Table 5.9. Responses from both students
showed improvements in self-efficacy when comparing their pre-coached and post-
coached responses. Given that students were asked to think back to assess their state of
mind from two years prior, the fact that they were continuing coaching program students,
and that no pre-test could be conducted, the percentage change in self-efficacy scores
likely does not reflect actual LQIOXHQFH�RI�FRDFKLQJ�RQ�WKHVH�VWXGHQWV¶�JULW�DQG�VHOI-
efficacy. Instead, based on their responses, we may conclude that these students felt that
they improved across all elements of the self-efficacy scale.
7DEOH�����
,QWHUYLHZHG�6WXGHQWV�6HOI�(IILFDF\�6FRUHV
Question Pre-coaching Score
Post Coaching
Score
Maria 21 40 Sam 23 39
Interview Theme: Self-Efficacy. This improvement was also supported earlier in
HDFK�VWXGHQW¶V�LQWHUYLHZ��For the theme of self-efficacy, primary codes were based on the
NGSE and included confidence, overcoming challenges, achieve goals, optimistic about
school, accomplish difficult/hard work. Maria noted that her previous experiences with
school were not positive. She knew she had to go back to school to get a promotion, but
no one had ever encouraged her or told her she could do it. She notes that eventually, it

�����
109
ZDV�KHU�VRQ�ZKR�³ZDONHG�>KHU@�LQWR�FROOHJH�DQG�VKRZHG�WKHP�>her qualifications] 23
years after [she] had completed high school´ (Maria, interview, April 22, 2021). She
points to several times in the semester when she got discouraged, citing how much
younger most of the students were and how challenging it was staying up at night to
complete assignments. Even the technology was at times a challenge. Through all of this,
KHU�FRDFK��ZKR�ZDV�DOVR�³ROGHU�OLNH�>KHU@´��0DULD��LQWHUYLHZ��$pril 22, 2021) helped her
troubleshoot her challenges and now she is on track to finish in 2021. She went on to
point out that she was now ready for that promotion and was on the cusp of achieving her
goals. Sam, who had retired from the United States Air Force, also came to college with
much trepidation. She had attempted college before but had not been able to manage the
work and had failed her courses. She was also struggling with Post Traumatic Stress
Disorder (PTSD) and the stress of college threatened to make it worse. Her coach, who
she describes as a woman who had the ³ULJKW�HQHUJ\�DQG�JUHDW�DWWLWXGH�ZKR�HQFRXUDJHG�
[me] to pursue [my] JRDOV´��6DP��LQWHUYLHZ��0D\����������KHOSHG�KHU�WKURXJK�KHU�
challenges. Same went on to state��³,�DP�RSWLPLVWLF�WKDW�I can do this. I am not worried
DERXW�JRLQJ�EDFN´��6DP��LQWHUYLHZ��0D\����������
In addition to students, coaches were also asked at the end of each interview to
comment on whether they felt that their respective students had improved on each
element of the New General Self-Efficacy Scale (NGSE). All coaches responded that
they had seen improvements in their student over time, though two coaches pointed out
that when it came to item seven of the NGSE which dealt with comparing themselves to
others, growth had been slower than the other areas for their student. In one case, John
noted that his student had language issues and in the second case Kimberly pointed out

�����
110
that her student was on the aXWLVP�VSHFWUXP��.LPEHUO\�VXPPDUL]HG�KHU�VWXGHQW¶V�
progress by notinJ�WKH�FKDQJHV�LQ�KHU�FRDFKHG�VWXGHQW��³VKH�EHFDPH�PRUH�FRQILGHQW�RYHU�
WLPH«VKH�XVHG�WR�TXHVWLRQ�KHUVHOI�D�ORW´��.LPEHUO\��LQWHUYLHZ��0DUFK������������2WKHU�
coaches noted that students became stronger advocates across campus for themselves
and, as Anna descULEHG�LW�GHYHORSHG�³D�VHQVH�RI�DFKLHYHPHQW´��$QQD��LQWHUYLHZ��0DUFK�
30, 2021).
Perceptions of Coaching Influence on Retention
&RDFK�DQG�VWXGHQW�LQWHUYLHZV�ZHUH�XVHG�WR�DQVZHU�UHVHDUFK�TXHVWLRQ�QLQH�³:KDW�
are the perceptions of coaches and students on the influence of the coaching intervention
on student retention?.´�The four coaches interviewed had coached 12 students combined.
Of these 12, nine (75%) had either graduated, transferred to a four-year college, or was
still enrolled at MCC. Field notes were coded for emergent themes and three clear themes
emerged; three clear themes emerged to suggest that coaching influenced retention.
Interview Theme: Accountability. Responses that included the following codes
were categorized into the theme of accountability: accountable, followed up on goals,
accountability partner, and stay on track. -RKQ�GHVFULEHG�WKH�ILUVW�DV�³KROGLQJ�>WKHP@�
DFFRXQWDEOH´��-RKQ��LQWHUYLHZ��0DUFK���, 2021) by following up on agreed upon goals.
-RKQ�SURYLGHG�DQ�H[DPSOH�ZKHUH�KLV�VWXGHQW�³IHOO�VKRUW�RQ�D�JUDGH�>EHFDXVH@�KH�ZDV�
JHWWLQJ�WR�FODVV�ODWH´��-RKQ��LQWHUYLHZ��0DUFK������������+H�IROORZHG�XS�ZLWK�WKH�VWXGHQW�
reminded him of his academic goals and pushed him to reference his schedule more
often. Once the student began attending classes on time, his grade improved. Kimberly,
who had a student on the autism spectrum, found that the student struggled with personal
relationships, which was making it more challenging for her to navigate the college

�����
111
system. At one point, Kimberly QRWHV�WKH�VWXGHQW�³ZDQWHG�WR�ZLWKGUDZ�EHFDXVH�VKH�FRXOG�
QRW�XQGHUVWDQG�KRZ�WR�FRQQHFW�ZLWK�RWKHUV�RQ�LVVXHV´��.LPEHUO\��LQWHUYLHZ��0DUFK�����
2021). Kimberly focused on teaching her boundaries and how to manage impulsivity. At
the time of the interview, her student is in her final semester and on track to transferring
to a four-year college. Students also described their coaches as accountability partners.
Maria noted that due to the late nights required to finish her work, she would miss
deadlines and projects. Sam pointed out that when her PTSD flared up, she almost
withdrew as well. Ultimately, they both credited their coaches for helping them remain
true to their goals of complete their work so that they could continue at MCC.
While much of the research today focuses specifically on goal setting and its
influence on outcomes (Capps, 2012; Martin et al., 2014; Wolff et al., 2019), results from
these interviews suggest that one of the key benefits of goal setting in coaching is that it
allows coaches to leverage goals as a way to hold students accountable for clear academic
and personal outcomes.
Interview Theme: Finding the Right Resources. Responses that included the
following codes were categorized into the theme of finding the right resources:
leverage connections and campus resources. All coaches pointed out that one of their
fundamental roles was helping their students find the right resources needed to help them
SURJUHVV��,Q�-RKQ¶V�FDVH��KLV�VWXGHQW�ZDV�D�QRQ-American and had challenges finding the
funding to pay for their education��³,�KDG�WR�OHYHUDJH�P\�FRQQHFWLRQV�WR�JHW�KLP�
HPSOR\HG�WR�KHOS�KLP�JHW�IXQGHG�DQG�JHW�UHLPEXUVHPHQW´��-RKQ��LQWHUYLHZ��0DUFK�����
2021).

�����
112
Without the financial wherewithal, this student would not have been able to
continue with their education. In Kimberl\¶V�FDVH��KHU�VWXGHQW�ZDV�³EORZLQJ�XS�DOO�WKH�
UHVRXUFHV�RQ�FDPSXV´��.LPEHUO\��LQWHUYLHZ��0DUFK�����������EHFDXVH�WKH�VWXGHQW�KDG�
difficulty identifying types of issues campus resources could address for her. This had
EHJXQ�WR�VWUDLQ�WKH�VWXGHQW¶V�UHODWLRQVhips with key campus resources. In both cases,
coaches stated that neither student would have been able to continue without being able
to find the right resources to support their college career. These findings are in line with
Pechac and Slantcheva-Durst (2021) found that the most often discussed topic in
coaching sessions was college resources.
Interview Theme: Connection to Coach. Responses that included the following
codes were categorized into the theme of connection to coach: on my side, mentor, sense
of connection, guide, sisterhood, cares for, in their corner, can vent to, trust, empower,
and talk to. By far the most cited reason that coaches and students felt that coaching was
helpful in keeping students in college was the connection between coach and student.
$QQD�VWDWHG�WKDW�VWXGHQWV�VWD\�LQ�WKH�SURJUDP�DQG�LQ�FROOHJH�EHFDXVH�³FRDFKLQJ�VXSHU�
useful [because they student knows] someone cares for them and is watching and
VXSSRUWLQJ«VRPHERG\�LV�LQYHVWHG�LQ�WKHP�± not because they have to but because they
ZDQW�WR´��$QQD��LQWHUYLHZ��0DUFK������������-RKQ�VWDWHG�WKDW�WKH�VWXGHQW�³KDYLQJ�
VRPHRQH�LQ�>WKHLU@�FRUQHU�DQG�>WKHLU@�VLGH�KDV�PDGH�D�GLIIHUHQFH´��-RKQ��LQWHUYLHZ��0DUFK�
31, 2021). Kimberly noted that the student now has someone they can trust ± ³VRPHone
WR�YHQW�WR�RQ�KRZ�WKH\�IHHO´��.LPEHUO\��LQWHUYLHZ��0DUFK������������0DWWKHZ�H[SODLQHG�
WKDW�³KDYLQJ�VRPHRQH�WR�WDON�WR�DQG�UHOHDVH�VRPH�RI�WKH�LQWHUQDO�SUHVVXUH�LQFUHDVHV�>WKH�
VWXGHQW¶V@�IRFXV�RQ�ZKDW�WKH\�ZDQW�WR�GR´��0DWWKHZ��LQWHUYLHZ��0DUFK���������). This

�����
113
was also echoed by the two students who were interviewed. Sam described the
³VLVWHUKRRG´��6DP��LQWHUYLHZ��0D\����������EHWZHHQ�KHU�DQG�KHU�FRDFK��DQG�0DULD�WDONHG�
DERXW�WKH�VHQVH�RI�EHORQJLQJ�VKH�IHOW�ZKHQ�VKH�ZDV�ZLWK�KHU�FRDFK�KRZ�WKH\�ZRXOG�³PHHt
DQG�MXVW�WDON�DERXW�OLIH´��0DULD��LQWHUYLHZ��$SULO������������%RWK�VWXGHQWV�GHVFULEHG�
instances where they would have left had it not been for the encouragement of their
coach. These experiences suggested that the relationship between coach and student
iQFUHDVHG�VWXGHQWV¶�VHQVH�RI�FRQQHFWLRQ�WR�WKHLU�FROOHJH�H[SHULHQFH��DQG�XOWLPDWHO\�KHOSHG�
them remain in their college programs. This area of relationship and connection to coach
is not addressed in current literature, so this finding suggests that this in an area of
coaching that should be further investigated in an academic setting.
Discussion
Bronfenbrenner (1992) and Neal and Neal (2013) both argue that teachers,
families, communities, and government policies interact to influence an individual
VWXGHQW¶V�SURJUHVV��7KHVH�VRFLDO�HOHPHQWV�XOWLPDWHO\�LQWHUDFW�ZLWK�WKH�VWXGHQW�LQ�SRVLWLYH�
or negative ways. Coaches can serve as a positive element of the community and can aid
in student academic progress and success (Armour, 2021; Bettinger & Baker, 2011;
Bettinger & Baker, 2014; Bland, 2003; Brigman & Campbell, 2003; Crisp & Cruz, 2010;
Cruz et al., 2021; Hodges et al., 2014; Ross, 1992; Sweeney, 2010; Tommaso, 2010).
The coaching program had the primary purpose of improving retention, transfer
and graduation rates for students required to take developmental education as part of their
academic path. To determine the influence of coaching support on achieving this purpose,
a treatment and a comparison group was selected from students enrolled in 2019 and
retention, term GPA, and the difference between the number of credits attempted and

�����
114
what the student completed was used. In addition to these academic markers, the research
questions focused on the experiences of coaches and students in the program to better
understand the elements of coaching that have the most influence on the student so that
current practice could be improved. Retention was defined as students who enrolled in
fall 2019 who persisted to complete the spring 2020 semester.
&RDFKLQJ�DQG�5HWHQWLRQ��
The study found that there was a significant difference (p = .04) in retention
between coached and non-coached groups, with coaching significantly increasing
retention rates for developmental education students. Eighty-seven percent (n=48) of the
55 students in the coached group were retained, while 71% (n = 39) of the non-coached
group were retained. Of the 13% (n=7) of coached students who were not retained, five
had GPAs over 2.0, and of these five, three had a GPA over 3.0. Only one had
accumulated more than the 60 credits for graduation. It may be possible that some of
these students with GPAs over 3.0 transferred to a four year college, that the two students
who did not have a GPA over 2.0 dropped out, and the one student who had enough
credits for completion graduated, but these conclusions could not be confirmed as
additional data was not available about the students at the time of the study.
Though no significant difference was found between coached and non-coached
groups for attempted versus completed credits and for term GPA, students in the
treatment group did have a higher mean GPA than students in the comparison group and
larger difference between attempted versus completed credits. Importantly more students
in the coached group (45%) met the 3.0 standard for transfer to a four-year institution
than the non-coached group (20%). In short, though coached students on average

�����
115
completed fewer credits than they originally attempted, their GPA tended to be higher.
One reason for this higher GPA could VWHP�IURP�FRDFKHV¶�DELOLW\�WR�FRQQHFW�Vtudents to
resources and supports on campus. Navigating through to the right college resources for
the student was an integral piece of coaching. Coaches found their training on college
resources to be the most referenced during their coaching tenure. Researchers have noted
that many students lack the skills to navigate through the college system (Bailey et al.,
Benken et al., 2015; 2005; Lareau, 2015). Since coaches at MCC served as the single
point of reference and guide their students were able to overcome this gap and persist.
One of the key benefits to students of having parents and role models who
understand the school system lies in the ability of these supports to help the student make
decisions to lead to stronger academic outcomes and the improvement in student self-
advocacy that accompanies this (Hodges et al., 2014; Lareau, 2015). Lareau (2015)
provides one such example where a student, following the guidance of a parent her
changed majors and dropped certain courses to maintain a GPA high enough to gain
admission to graduate school. Coaches and students both noted that coaches often
directed them to student support services. If students were struggling to maintain a
passing grade in a course, academic and peer advisors might have provided guidance to
drop courses with which they were struggling so they could maintain a stronger GPA.
Further research is needed to determine the viability of this hypothesis.
Both students and coaches several times noted the importance of setting goals
with the student because it allowed the coach to hold the student accountable when they
encountered challenges. While the overarching goal of each student and coach was to
complete their college degree of choice, a review of the coaching logs revealed varied

�����
116
non-academic goals as well. The most cited goal of receiving support, encouragement
and feedback suggests that students were most motivated to seek out coaching support to
help them navigate challenges as they arose. Coaches and students both noted that having
a strong supporter remained the keystone of the coaching relationship. Students noted the
importance of having someone on their side ± someone who was empathetic to their
needs, with whom they can be open enough to vent their frustrations in a judgement-free
zone. Tied to this emotional support was the idea of accountability. So, while students
and coaches acknowledged the importance of this judgement-free zone, they also pointed
to importance of having an accountability partner who could push the student to
continuously strive towards stated goals. As such, though students felt a strong sense of
kinship with their coaches, the fact that coaches also held them accountable to
accomplishing their goals pushed these students to become increasingly self-reliant.
Lareau (2015), Bachman (2013) and Urciuoli (2014) all note that students who
struggle academically often lack a sense of belonging in school and this can often lead
them to give up their college careers. Students can often regard college as a foreign
system that they cannot navigate or become part of because of (Cox, 2015; Pichon, 2015;
Urciuoli, 2014). This can often be linked to academic success; students who are
academically challenged cannot see themselves as part of the college because the college
is really centered on the ideal of the academically strong student (Urciuoli, 2014). By
creating a sense of connection between coach and student, the coaching program at MCC,
helped students persist despite their struggles. The relationship between the student and
the coach served as a connection point for students as they navigated their college career.
One student described that her coach was in her age group, which made it easier for her
�����
117
to feel comfortable being an older student. Another student described the sisterhood she
found with her coach, after she left the armed forces and returned to school. The
connection between coach and student serves as a key component in improving retention
among developmental education students.
The connection between student and coach can foster self-confidence and self-
advocacy. Coaches noted that part of the benefit of being a coach was seeing the growth
in their students. Coaches and students called this self-confidence, empowerment, and
becoming independent. Responses from all coaches and students suggested that student
self-efficacy increased over time. When prompted with questions from the NGSE,
students consistently noted improved scores on all points of the scale. This was further
supported by the interviews with coaches where they reported growth in all questions
from the scale as well. This growth in self-efficacy, self-advocacy, and grit provides an
early indicator of academic success for students, as these three factors have been linked
to higher retention rates in students (Alhadabi & Karpinski, 2019; Köseoglu, 2015; Satish
& Singh, 2020; Usher et al., 2018).
&RDFK�7UDLQLQJ�DQG�%HQHILWV
Coaches were initially trained on asking powerful questions, active listening,
controlling for bias, and providing information about college resources. These elements
of the training proved useful to coaches and students. The powerful questions helped
coaches build the initial relationship with their student; active listening and controlling
for bias training helped coaches foster the open, judgement-free zone that students
credited for creating a deeper connection with their coaches; while the ability to guide
students to the right resources was cited consistently as key to helping students progress.

�����
118
This suggests the content provided in coach training was sufficient to build productive
relationships with students. At the same time, interviews suggested three areas where it
may be useful to modify training for coaches in future practice.
The first area refers to knowledge of overcoming cultural barriers. Two coaches
who had non-American students and noted that one of their areas of focus was increasing
WKHLU�VWXGHQW¶V�XQGHUVWDQGLQJ�RI�$PHULFDQ�FXOWXUH� One coach described his challenges
with applying for federal student aid for the student because, based on WKH�VWXGHQW¶V�KRPH�
culture, the student could not ask his parents for the financial information to do this. This
was a surprise to the coach, and, while he was able to accommodate his student by
helping him find a job, he noted that this was a new experience for him. Another coach
described having had three students for whom English was a second language as they had
newly migrated to the U.S. These students struggled with feeling lonely and isolated, a
fact made worse after the COVID-19 pandemic impacted the U.S. in spring of 2020.
Kimberly, who had coached the longest, noted that one of the four students she coached
never showed up because of the cultural stigma with coaching. A second student also had
a cultural barrier with coaching, but they were able to overcome it and move forward
with their relationship. Additional coach training on navigating cultural barriers may be
useful to coaches and increase coach ability to build connection and meet the needs of
their students.
A second potential area of training for coaching relates to dealing with students
with mental or cognitive challenges. One coach had a student who was on the autism
spectrum disorder (ASD) DQG��ODUJHO\�EHFDXVH�RI�WKH�FRDFK¶V�DFDGHPLF�WUDLQLQJ�LQ�
psychology, she was able to support the student by helping create boundaries in their

�����
119
relationship that pushed the student to become more independent over time. This is not to
say that coaches should be trained in identifying these mental or cognitive challenges, but
rather that sharing common signs of these issues will help coaches determine how to best
guide their student.
One final area of review for coach training relates to the time spent with the
student. During training, coaches were encouraged to meet with their student once a week
for 45 minutes or more. High fidelity for exposure was set at nine sessions in a semester
for 45 minutes in each session. Based on the coaching logs reviewed, only 50% of
coaches met the standard for high fidelity. Though coaches varied greatly in the number
and length of coaching sessions, coaches referenced contacting students via phone call or
text between sessions. These connection points, which in some cases were daily, included
words of encouragement, follow-up texts to check in on items discussed in coaching
sessions and determine progress, and just general queries into how the student was
feeling. Coaches stated that this approach developed organically as their relationship with
the student progressed, and that they found these small connection points were highly
effective in keeping students on track. This development suggested that while the length
and frequency of formal coaching remains important, more frequent, shorter, focused
communication points can serve as a substitute for longer, less frequent, formal coaching
sessions.
Aside from themes related to training, one element that came through in every
coach interview was the benefit of coaching to the coach. All coaches described a need to
give back because either someone had helped them when they were struggling, or they
had wanted help that never came when they were struggling personally and academically.

�����
120
-RKQ�QRWHG��³«ZKHQ�,�ZDV�JURZLQJ�XS��,�KDG�D�URXJK�FKLOGKRRG�DQG�SHRSOH�KHOSHG�PH��
VR�,�ZDQWHG�WR�KHOS�RWKHUV´��-RKQ��LQWHUYLHZ��0DUFK������������.Lmberly pointed out:
I remember back in college and had a rocky start and lost my mind in college and
KDG�D�����*3$�DQG�GLGQ¶W�UHDOO\�NQRZ�KRZ�WR�PDQDJH�EHLQJ�LQ�FROOHJH��,W�ZRXOG�
have been helpful to have someone to go to guide me. My parents were not on
bRDUG�ZLWK�JRLQJ�WR�FROOHJH��,�WULHG�VHYHUDO�PDMRUV«FRXOG�QRW�WDON�WR�PRP«�P\�
dad was supportive, but I could not find the level of support I needed. (Kimberly,
interview, March 31, 2021)
Every coach mentioned the word reward or joy when asked why they coached. John
QRWHG�WKDW�WKH\�FRDFK�EHFDXVH�LW�³EULQJV�>WKHP@�MR\«SHRSOH�ZKR�>FRDFK@�DUH�VSHFLDO´�
(John, interview, March 30, 2021). 0DWWKHZ�GHVFULEHG�KDYLQJ�D�³FRDFKLQJ�FRPPXQLW\´�
because coaches were able to learn from each other so that they could better support their
student. The rewarding nature of coaching students as described by the coaches suggests
that both student and coach benefit strongly from coaching experiences.
COVID-19 Pandemic
Since the study took place between fall of 2019 and spring 2020, the influence of
COVID-19 pandemic on was referenced by both students and coaches. Moving all
meetings to the virtual environment during the pandemic lockdown allowed for more
consistency in meeting times as coach and student schedules became more static. In
addition to more consistency in meeting times, meeting virtually allowed them both to
³VHH�D�GLIIHUHQW�VLGH�RI�HDFK�RWKHU´�DV�WKH\�ZHUH�DEOH�WR�VHH�HDFK�RWKHU¶V�KRPHV�DQG�
gained more context for each other (Kimberly, interview, March 31, 2021).

�����
121
In other cases, the pandemic increased student loneliness and fear. Anna pointed
out that for her non-native English speakers, who already struggled with feeling isolated,
the feeling of loneliness grew. Maria described still having a great relationship with her
FRDFK�EXW�PLVVLQJ�³MXVW�KDYLQJ�D�GULQN�ZLWK�KHU´��0DULD��LQWHUYLHZ��$SULO������������Sam
described the challenges of being in online classes which she felt were not ideal for her.
Her daughteU¶V�GD\FDUH�FORVHG�LQ�0DUFK�RI������EHFDXVH�RI�WKH�SDQGHPLF��DQG�VKH�ZDV�
very afraid that she would fail. Though she completed the semester, she remembered
WKLQNLQJ�³,�DP�D�EULFN-and-PRUWDU�VWXGHQW«,�IDLOHG�RQOLQH�FRXUVHV�LQ�WKH�PLOLWDU\´��6DP��
interview, May 5, 2021). Ultimately, she found that she connected with her coach more
frequently than previous semester because of her fears. Though all students were
retained, both students and coaches felt that the pandemic led to an increased sense of
loneliness and isolation for students.
Limitations
There were two key types of limitations to this study. The first stems from data
available. Though the controls used in the study decreased the likelihood that other
factors were affecting the retention rates of developmental education students, there are
other factors that could have increased the efficacy of the study. For example, data on
high school GPA, generation in college status and income serve as indicators of potential
academic success and have strong correlations with retention rates, (Fowler & Boylan,
2010; Moore, 2004; Pruett & Absher, 2015; Wernersbach et al., 2014), but these data
were not available for the current population of students.
In addition, while data in the coaching database included data on what goals were
discussed over the course of the semester, individual session notes were not available.

�����
122
Since the coaching sessions occurred in fall of 2019, the student researcher could not
directly observe coaching sessions. For this reason, individual session notes on the
coaching sessions would have provided the strongest alternative means to determining
the efficacy of the coaching sessions. Unfortunately, since coaching sessions occurred in
fall 2019, the hand-written coaching logs were no longer available for analysis at the time
of the study. So, while data on coaching database included data on what goals were
discussed over the course of the semester, individual session notes were not available.
This fact did not allow for an in-depth exploration of how well coaches adhered to their
training on goal setting. Moreover, since all students included in the coaching log were
retained and the number of logs was limited, it was not possible to analyze whether there
was a relationship between frequency and length of session and retention.
While the interviews served to mitigate this limitation, during the study, despite
reminders, only four coaches and two students responded to the request for interviews
over the four-week period of recruitment. Given that there were 89 coaching students and
about 30 coaches in the program in fall of 2019, the data collected during the interviews
was limited in its ability to reflect the spectrum of perceptions across students and
coaches.
The second type of limitation stems of challenges inherent in the methodology.
The first the research question included in the study required measuring changes in grit
and self-efficacy for coached and non-coached student using the GRIT-S and NGSE
scales. Since students in the coaching program were not given pre-tests for either of these
scales, their indicated scores and the change in these scores cannot be used to determine
the influence of coaching on grit or self-efficacy. Secondly, naturalistic observation of

�����
123
coaching sessions and coach training would have provided clearer indications of the key
techniques taught to coaches and what techniques were used. Since coach training and
coaching sessions began prior to the beginning of the study, this approach was not
possible.
Implications for Future Research and Practice
As implied in the previous section, there are several implications for future
research on coaching developmental education students.
First, there is still some room for future studies to explore the relationship
between coaching term GPA and credit accumulation for students. While there are some
newer studies that explore these relationships, results have been mixed (Alzen et al.,
2021; Capstick et al., 2019; Lehan et al., 2018; Rodriguez Ott et al., 2020; Sepulveda et
al., 2019). Moreover, none of these studies focus specifically on students selected for
developmental education. Data from the treatment and comparison groups in this study
indicated that overall credit accumulation was lower for coached students, but GPA was
higher. Forty-five percent of the students in the coached group had a GPA over a 3.0,
while 20% of the students in the non-coached group had achieved the same standard.
This suggests that more coached students in the study were on a path to graduation or
transfer to a four-year institution. As stated previously, one reason for this could be that
coaches help students make better choices on credit load so that they can safeguard their
GPA, but further research is needed to explore this hypothesis. Since these are two strong
predictors of completion (Capstick et al., 2019; Glazier et al., 2019; Johnson et al., 2021)
additional research in this area could be helpful in guiding how colleges use coaches to
support students.

�����
124
Second, the influence of coaching on self-efficacy, self-advocacy, and grit should
be explored further. Both student and coach interviews indicated that coaching increased
student confidence and empowered them, but this study was limited in its ability to assess
self-efficacy, grit, and self-advocacy. Future research should explore the influence of
coaching on self-efficacy and grit using a pre-post-test approach to increase validity.
Students also pointed out the nature of the relationship was one that was judgement-free
zone, where they were listened to but at the same time held accountable. Future studies
should investigate what elements of the coaching relationship may influence student self-
efficacy and grit.
Thirdly, tied to this exploration of coach connection with the student is the need
for further research about the characteristics that motivate individuals to become coaches.
Three coaches noted that they had a hard time in school growing up, and someone helped
them to overcome challenges. Further, coaches also noted that being a coach brought
them joy. Given that some coaching programs within institutions utilize volunteer
coaches, understanding the characteristics that motivate and bring fulfillment to coaches
may help with recruiting new coaches. In addition, more exploration of how coach
characteristics contribute to building connection with the students could increase the
effectiveness of coaching programs. With the coaching program at MCC, about 20% of
students who were in the coaching program at the start of the fall 2019 semester, did not
remain in coaching that semester. While data on why these students dropped out of the
program is not available, an investigation for what characteristics help coaches build
connection with students may provide insight into why students stay or leave their
coaches.

�����
125
Fourth, more research is needed to determine the optimal structure for coaching
programs. This refers to the content for training coaches and the length and frequency of
coaching sessions. The current study explored research questions related to fidelity of
implementation as it related to coach training and the influence of coaching session
length and frequency on retention. However, due to the limited number of participants
interviewed results were not generalizable. Admittedly, the coaching sessions reviewed in
the coaching database indicated that coaches adhered to the session length and frequency
recommendations from their training. At the same time, the small sample size of coaches
available in the coaching database and the fact that all the students documented in the
database were retained, meant that it was not possible to determine the influence of
length and frequency of coaching sessions on student retention. While some newer
studies have explored the relationship between frequency and length of coaching
sessions, (Alzen et al., 2021; Capstick et al., 2019; Rodriguez Ott et al., 2020) results
have differed and none of these studies specifically focus on students in developmental
education courses.
Fifth, due to the COVID-19 pandemic, coaches and students indicated that their
sessions moved to the virtual environment. Pechac and Slatcheva-Durst (2021) found that
having the first coaching session occur one-on-one in person had a strong positive
correlation with credit hour completion. According to coaches and students, this blurred
the boundaries between school and home for coaches and students. Students were able to
see their coaches in the home environment and this may have brought more context and
richness to the relationship between student and coach. Of note, these students already
had established relationships with their coaches, so that they were not beginning their

�����
126
coaching relationships when they moved into the virtual space. Further research on the
influence of coaching session mode on academic success for developmental education
students is required. If colleges can leverage coaches on a national level to support
students in the virtual environment, this may change the general approach to coaching for
many schools.
Last, coaching appears to benefit both students and coaches. While current
research focuses on the how coaching effects students, none of these studies explore the
benefits of coaching to the coach. Of the coaches interviewed, each expressed that they
found a joy in the work they did with students and pointed to learnings they had gained
along the way. One coach pointed out the satisfaction he felt because he was able to help
someone in much the same way others had helped him growing up. Another coach noted
how much he had learned about the culture his student came from and ultimately how
WKDW�LPSDFWHG�WKH�VWXGHQW¶V�GHFLVLRQV�LQ�DQ�DFDGHPLF�VHWWLQJ��:KLOH�\HW�DQRWKHU�FRDFK�
noted that coaching made her more flexible in her thinking than she was previously. One
coach indicated that she shifted away from trying to save the student to helping the
student save themselves. Further, with COVID, she and her student developed a deeper
understanding of eaFK�RWKHU¶V�OLYHV�DV�WKH\�FRXOG�VHH�LQWR�HDFK�RWKHU¶V�KRPHV��7KLV�
dynamic between student and coach can open the door for reverse mentoring of coaches
as they learn about the cultural context of their students.
Conclusion
With over 900 coaches active in academic settings today (Pisarik & Blankenship,
2019, pp 20) the influence of coaching on retention remains a significant question for
educators. This study found that students who were coached were more likely to progress

�����
127
academically than students who were not coached. While some studies have explored the
relationship between coaching and retention, currently there is a dearth of research about
the influence of coaching on retention for developmental education students. This study
fills a gap in current research and shows that coaching support increases retention for
developmental education students. Beyond coaching influence on retention, it also
suggests potential avenues for future research: (1) coaching influence on academic
success markers such as GPA and credit accumulation; (2) coaching influence on grit,
self-efficacy and self-advocacy and the elements of the coaching relationship that
influence these factors; (3) coach characteristics, motivation and connection to student;
(4) influence of coaching session length and frequency on students outcomes; (5)
elements of coach training that influence outcomes; (6) benefits of the coaching
relationship to the coach. With less than 50% of students completing their college
education on time (NCES, 2021), coaching remains a viable option for practitioners
looking to improve the retention rates for developmental education students in the college
setting.

�����
128
References
$EW�$VVRFLDWHV����������'HJUHHV�RI�FRDFKLQJ��6XFFHVV�%RVWRQ¶V�WUDQVLWLRQ�FRDFKLQJ�PRGHO�
KLJKOLJKWV�EULHI��&DPEULGJH��0$��$XWKRU��5HWULHYHG�IURP�
KWWSV���ZZZ�VXFFHVVERVWRQ�RUJ�a�PHGLD�''&'���(�����)%�������'$$����
����SGI
$FKLQVWHLQ��%���&XUU\��0��:����2JDZD��5��7�����������5H�ODEHOLQJ�VRFLDO�VWDWXV��
3URPLVHV�DQG�WHQVLRQV�LQ�GHYHORSLQJ�D�FROOHJH�JRLQJ�FXOWXUH�IRU�/DWLQD�R�\RXWK�LQ�
DQ�XUEDQ�KLJK�VFKRRO��$PHULFDQ�-RXUQDO�RI�(GXFDWLRQ�������������±�����
KWWS���GRL�RUJ���������������
$GHOPDQ��&����������3ULQFLSDO�LQGLFDWRUV�RI�VWXGHQW�DFDGHPLF�KLVWRULHV�LQ�SRVWVHFRQGDU\�
HGXFDWLRQ������������ 86�'HSDUWPHQW�RI�(GXFDWLRQ�
Adelman, C. (2006). The toolbox revisited: Paths to degree completion from high school
through college. US Department of Education.
Alhadabi, A., & Karpinski, A. C. (2019). Grit, self-efficacy, achievement orientation
goals, and academic performance in university students. International Journal of
Adolescence and Youth, 25(1), 1±18.
https://doi.org/10.1080/02673843.2019.1679202
$OVVLG��-��/���*UXEHU��'���-HQNLQV��.��'���0D]]HR��&���5REHUWV��%����6WDQEDFN�6WURXG��5��
��������(QJDJLQJ�LQVWLWXWLRQV�LQ�ZRUNIRUFH�GHYHORSPHQW��&DUHHU�SDWKZD\V�IRU�
GLVDGYDQWDJHG�DGXOWV��1HZ�'LUHFWLRQV�IRU�,QVWLWXWLRQDO�5HVHDUFK���������������±
����KWWS���GRL�RUJ���������LU����

�����
129
$O]HQ��-��/���%XUNKDUGW��$���'LD]�%LOHOOR��(���(OGHU��(���6HSXOYHGD��$���%ODQNHQKHLP��$���
�%RDUG��/����������$FDGHPLF�FRDFKLQJ�DQG�LWV�UHODWLRQVKLS�WR�VWXGHQW�
SHUIRUPDQFH��UHWHQWLRQ��DQG�FUHGLW�FRPSOHWLRQ��,QQRYDWLYH�+LJKHU�(GXFDWLRQ��
����������±�����KWWSV���GRL�RUJ���������V����������������Z
$Q��%��3����������7KH�LQIOXHQFH�RI�GXDO�HQUROOPHQW�RQ�DFDGHPLF�SHUIRUPDQFH�DQG�FROOHJH�
UHDGLQHVV��'LIIHUHQFHV�E\�VRFLRHFRQRPLF�VWDWXV��5HVHDUFK�LQ�+LJKHU�(GXFDWLRQ��
����������±�����KWWS���GRL�RUJ���������V���������������]
$UPRXU��$����������'LVFRYHULQJ�WKH�µPRGHUQ�PDHVWUR¶��7KH�LPSRUWDQFH�RI�D�SURIHVVLRQDO�
industry pedigree and aspects of coaching and mentoring within the supervision
of music undergraduates. International Journal of Evidence Based Coaching and
Mentoring, S15, 70±83. https://doi.org/10.24384/qjd1-t090
%DKU��3��5����������&RROLQJ�RXW�LQ�WKH�FRPPXQLW\�FROOHJH��:KDW�LV�WKH�HIIHFW�RI�DFDGHPLF�
DGYLVLQJ�RQ�VWXGHQWV¶�FKDQFHV�RI�VXFFHVV"�5HVHDUFK�LQ�+LJKHU�(GXFDWLRQ���������
���±�����KWWS���GRL�RUJ���������V����������������
%DLOH\��7����������&KDOOHQJH�DQG�RSSRUWXQLW\��5HWKLQNLQJ�WKH�UROH�DQG�IXQFWLRQ�RI�
GHYHORSPHQWDO�HGXFDWLRQ�LQ�FRPPXQLW\�FROOHJH��1HZ�'LUHFWLRQV�IRU�&RPPXQLW\�
&ROOHJHV���������������±����KWWS���GRL�RUJ���������FF����
%DLOH\��7��5���-HQNLQV��3��'����/HLQEDFK��'��7����������&RPPXQLW\�FROOHJH�ORZ�LQFRPH�
DQG�PLQRULW\�VWXGHQW�FRPSOHWLRQ�VWXG\��'HVFULSWLYH�VWDWLVWLFV�IURP�WKH������KLJK�
VFKRRO�FRKRUW��&RPPXQLW\�&ROOHJH�5HVHDUFK�&HQWHU��7HDFKHUV�&ROOHJH��&ROXPELD�
8QLYHUVLW\��KWWSV���GRL�RUJ���������'�))�4)�
%DLOH\��7���-HRQJ��'��:����&KR��6��:����������5HIHUUDO��HQUROOPHQW��DQG�FRPSOHWLRQ�LQ�
GHYHORSPHQWDO�HGXFDWLRQ�VHTXHQFHV�LQ�FRPPXQLW\�FROOHJHV��(FRQRPLFV�RI�

�����
130
(GXFDWLRQ�5HYLHZ������������±�����
KWWS���GRL�RUJ���������M�HFRQHGXUHY������������
%DQGXUD��$����������6HOI�HIILFDF\��7RZDUG�D�XQLI\LQJ�WKHRU\�RI�EHKDYLRUDO�FKDQJH��
3V\FKRORJLFDO�5HYLHZ������������±�����KWWS���GRL�RUJ��������������
���;���������
%DUEDWLV��3����������8QGHUSUHSDUHG��HWKQLFDOO\�GLYHUVH�FRPPXQLW\�FROOHJH�VWXGHQWV��
)DFWRUV�FRQWULEXWLQJ�WR�SHUVLVWHQFH��-RXUQDO�RI�GHYHORSPHQWDO�HGXFDWLRQ� �������
���
%HQNHQ��%��0���5DPLUH]��-���/L��;����:HWHQGRUI��6����������'HYHORSPHQWDO�PDWKHPDWLFV�
VXFFHVV��,PSDFW�RI�VWXGHQWV�NQRZOHGJH�DQG�DWWLWXGHV� -RXUQDO�RI�GHYHORSPHQWDO�
HGXFDWLRQ��������
%HWWLQJHU��(����%DNHU��5����������7KH�HIIHFWV�RI�VWXGHQW�FRDFKLQJ�LQ�FROOHJH��DQ�
HYDOXDWLRQ�RI�D�UDQGRPL]HG�H[SHULPHQW�LQ�VWXGHQW�PHQWRULQJ��
KWWS���GRL�RUJ���������Z�����
%HWWLQJHU��(��3����%DNHU��5��%����������7KH�HIIHFWV�RI�VWXGHQW�FRDFKLQJ��$Q�HYDOXDWLRQ�RI�
D�UDQGRPL]HG�H[SHULPHQW�LQ�VWXGHQW�DGYLVLQJ��(GXFDWLRQDO�(YDOXDWLRQ�DQG�3ROLF\�
$QDO\VLV����������±����KWWS���GRL�RUJ�������������������������
%HWWLQJHU��(��3����/RQJ��%��7����������$GGUHVVLQJ�WKH�QHHGV�RI�XQGHUSUHSDUHG�VWXGHQWV�LQ�
KLJKHU�HGXFDWLRQ��'RHV�FROOHJH�UHPHGLDWLRQ�ZRUN"�-RXUQDO�RI�+XPDQ�5HVRXUFHV��
����������±�����KWWS���GRL�RUJ���������MKU���������
%ODQG��6��0����������$GYLVLQJ�DGXOWV��7HOOLQJ�RU�FRDFKLQJ"�$GXOW�/HDUQLQJ�����������
%RRWK��(��$���&DSUDUR��0��0����&DSUDUR��5��0����������,QQRYDWLYH�GHYHORSPHQWDO�
HGXFDWLRQ�SURJUDPV��$�7H[DV�PRGHO��-RXUQDO�RI�(GXFDWLRQDO�'HYHORSPHQW��������

�����
131
%RZPDQ��-���0RJHQVHQ��/���0DUVODQG��(����/DQQLQ��1����������7KH�GHYHORSPHQW��
FRQWHQW�YDOLGLW\�DQG�LQWHU�UDWHU�UHOLDELOLW\�RI�WKH�60$57�*RDO�(YDOXDWLRQ�0HWKRG��
$ VWDQGDUGLVHG�PHWKRG�IRU�HYDOXDWLQJ�FOLQLFDO�JRDOV��$XVWUDOLDQ�2FFXSDWLRQDO�
7KHUDS\�-RXUQDO������������±�����KWWS���GRL�RUJ������������������������
%R\ODQ��+��5����������7KH�KLVWRULFDO�URRWV�RI�GHYHORSPHQWDO�HGXFDWLRQ� 5HVHDUFK�LQ�
'HYHORSPHQWDO�(GXFDWLRQ� �����
%UDXQ��/����������7KH�UHODWLRQVKLS�EHWZHHQ�FRDFKLQJ�VW\OH�DQG�DWKOHWH�JULW��$WKOHWH�DQG�
FRDFK�SHUFHSWLRQV��3XEOLFDWLRQ�1R������������>0DVWHU¶V�WKHVLV��6RXWKHUQ�,OOLQRLV�
8QLYHUVLW\�(GZDUGVYLOOH@��3UR4XHVW�'LVVHUWDWLRQV�3XEOLVKLQJ��
%UDYR��$��-���:HGHOO��(���9LOODURVD�+XUORFNHU��0��&���/RRE\��$���'LFNWHU��&��/���6FKHSLV��7��
6����7HDP��6��1��DQG�3���61$3��6����������3HUFHLYHG�UDFLDO�HWKQLF�GLVFULPLQDWLRQ�
DPRQJ�\RXQJ�DGXOW�FROOHJH�VWXGHQWV��3UHYDOHQFH�UDWHV�DQG�DVVRFLDWLRQV�ZLWK�
PHQWDO�KHDOWK��-RXUQDO�RI�$PHULFDQ�&ROOHJH�+HDOWK���±����
KWWSV���GRL�RUJ������������������������������
%UHPHU��&��'���%$�&HQWHU���2SVDO��&��/����������2XWFRPH�WUDMHFWRULHV�RI�GHYHORSPHQWDO�
VWXGHQWV�LQ�FRPPXQLW\�FROOHJHV��&RPPXQLW\�&ROOHJH�5HYLHZ������������±�����
KWWS���GRL�RUJ�������������������������
%ULFNPDQ��6��-���$OIDUR��(��&���:HLPHU��$��$����:DWW��.��0����������$FDGHPLF�
HQJDJHPHQW��+LVSDQLF�GHYHORSPHQWDO�DQG�QRQGHYHORSPHQWDO�HGXFDWLRQ�
VWXGHQWV� -RXUQDO�RI�'HYHORSPHQWDO�(GXFDWLRQ��������
%ULJPDQ��*����&DPSEHOO��&����������+HOSLQJ�VWXGHQWV�LPSURYH�DFDGHPLF�DFKLHYHPHQW�
DQG�VFKRRO�VXFFHVV�EHKDYLRU� 3URIHVVLRQDO�6FKRRO�&RXQVHOLQJ���������
%URQIHQEUHQQHU��8����������(FRORJLFDO�V\VWHPV�WKHRU\��-HVVLFD�.LQJVOH\�3XEOLVKHUV�

�����
132
&DOFDJQR��-��&���%DLOH\��7���-HQNLQV��.��'���.LHQ]O��*����/HLQEDFK��7����������&RPPXQLW\�
FROOHJH�VWXGHQW�VXFFHVV��:KDW�LQVWLWXWLRQDO�FKDUDFWHULVWLFV�PDNH�D�GLIIHUHQFH"�
(FRQRPLFV�RI�(GXFDWLRQ�5HYLHZ������������±�����
KWWS���GRL�RUJ���������M�HFRQHGXUHY������������
&DOFDJQR��-��&���&URVWD��3���%DLOH\��7����-HQNLQV��.��'����������6WHSSLQJ�VWRQHV�WR�D�
GHJUHH��7KH�LPSDFW�RI�HQUROOPHQW�SDWKZD\V�DQG�PLOHVWRQHV�RQ�FRPPXQLW\�FROOHJH�
VWXGHQW�RXWFRPHV��5HVHDUFK�LQ�+LJKHU�(GXFDWLRQ������������±�����
KWWS���GRL�RUJ���������V����������������
&DSSV��5����������6XSSRUWLQJ�DGXOW�VWXGHQW�SHUVLVWHQFH�LQ�FRPPXQLW\�FROOHJHV��&KDQJH��
7KH�0DJD]LQH�RI�+LJKHU�/HDUQLQJ�����������±����
KWWS���GRL�RUJ�����������������������������
&DSVWLFN��0��.���+DUUHOO�:LOOLDPV��/��0���&RFNUXP��&��'����:HVW��6��/����������
([SORULQJ�WKH�HIIHFWLYHQHVV�RI�DFDGHPLF�FRDFKLQJ�IRU�DFDGHPLFDOO\�DW�ULVN�FROOHJH�
VWXGHQWV��,QQRYDWLYH�+LJKHU�(GXFDWLRQ������������±�����
KWWSV���GRL�RUJ���������V����������������
Center for the Analysis of Postsecondary Readiness. (2021). Developmental Education
FAQs: Facts and Stats on Dev Ed Students.
https://postsecondaryreadiness.org/developmental-education-faqs/
&KDQJ��*��6��<����/RUHQ]L��3����������7KH�HIIHFWV�RI�SDUWLFLSDWLYH�YHUVXV�DVVLJQHG�JRDO�
VHWWLQJ�RQ�LQWULQVLF�PRWLYDWLRQ��-RXUQDO�RI�0DQDJHPHQW����������±����
KWWSV���GRL�RUJ���������������������������

�����
133
&KHQ��;����&DUUROO��&��'����������)LUVW�JHQHUDWLRQ�VWXGHQWV�LQ�SRVWVHFRQGDU\�HGXFDWLRQ��
D�ORRN�DW�WKHLU�FROOHJH�WUDQVFULSWV��3RVWVHFRQGDU\�HGXFDWLRQ�GHVFULSWLYH�DQDO\VLV�
UHSRUW��1&(6�����������1DWLRQDO�&HQWHU�IRU�(GXFDWLRQ�6WDWLVWLFV�
&KR��6��:����0HFKXU�.DUS��0����������6WXGHQW�VXFFHVV�FRXUVHV�LQ�WKH�FRPPXQLW\�
FROOHJH��(DUO\�HQUROOPHQW�DQG�HGXFDWLRQDO�RXWFRPHV��&RPPXQLW\�&ROOHJH�5HYLHZ��
��������±����KWWS���GRL�RUJ�������������������������
&R[��5��'����������³<RX¶YH�JRW�WR�OHDUQ�WKH�UXOHV´�$�FODVVURRP�OHYHO�ORRN�DW�ORZ�SDVV�
UDWHV�LQ�GHYHORSPHQWDO�PDWK��&RPPXQLW\�&ROOHJH�5HYLHZ������������±�����
KWWS���GRL�RUJ�������������������������
Complete College America. (2021). Corequisite Remediation: Spanning the Completion
Divide https://completecollege.org/spanningthedivide/
&UHVZHOO��-��:����&ODUN��9��/��3����������'HVLJQLQJ�DQG�&RQGXFWLQJ�0L[HG�0HWKRGV�
5HVHDUFK��6$*(�
&ULVS��*����&UX]��,����������&RQILUPDWRU\�IDFWRU�DQDO\VLV�RI�D�PHDVXUH�RI�³PHQWRULQJ´�
DPRQJ�XQGHUJUDGXDWH�VWXGHQWV�DWWHQGLQJ�D�+LVSDQLF�VHUYLQJ�LQVWLWXWLRQ��-RXUQDO�RI�
+LVSDQLF�+LJKHU�(GXFDWLRQ�����������±�����
KWWS���GRL�RUJ�������������������������
&ULVS��*����'HOJDGR��&����������7KH�LPSDFW�RI�GHYHORSPHQWDO�HGXFDWLRQ�RQ�FRPPXQLW\�
FROOHJH�SHUVLVWHQFH�DQG�YHUWLFDO�WUDQVIHU��&RPPXQLW\�&ROOHJH�5HYLHZ�����������±
�����KWWS���GRL�RUJ�������������������������
&ULVS��*����1RUD��$����������+LVSDQLF�VWXGHQW�VXFFHVV��IDFWRUV�LQIOXHQFLQJ�WKH�
SHUVLVWHQFH�DQG�WUDQVIHU�GHFLVLRQV�RI�/DWLQR�FRPPXQLW\�FROOHJH�VWXGHQWV�HQUROOHG�

�����
134
LQ�GHYHORSPHQWDO�HGXFDWLRQ��5HVHDUFK�LQ�+LJKHU�(GXFDWLRQ������������±�����
KWWS���GRL�RUJ���������V���������������[
&ULVS��*����7DJJDUW��$����������&RPPXQLW\�FROOHJH�VWXGHQW�VXFFHVV�SURJUDPV��$�
V\QWKHVLV��FULWLTXH��DQG�UHVHDUFK�DJHQGD��&RPPXQLW\�&ROOHJH�-RXUQDO�RI�5HVHDUFK�
DQG�3UDFWLFH������������±�����KWWS���GRL�RUJ��������������������������
Cruz, C., Rajpal, G., Lecocke, M., Martines, I., & Lurie, A. (2021). Peer coaching
program development: A framework of first-year Latina/o student persistence
pursuing stem pathways at a hispanic serving institution. Journal of Hispanic
Higher Education, 20(4), 365±384. https://doi.org/10.1177/1538192719867096
Dalton, J. C., & Crosby, P. C. (2014). The power of personal coaching: Helping first-year
students to connect and commit in college. Journal of College and Character,
15(2), 59±66. https://doi.org/10.1515/jcc-2014-0010
'DO\�&DQR��0���9DFFDUR��$����1HZPDQ��%����������&ROOHJH�VWXGHQW�QDUUDWLYHV�DERXW�
OHDUQLQJ�DQG�XVLQJ�VHOI�DGYRFDF\�VNLOOV��-RXUQDO�RI�3RVWVHFRQGDU\�(GXFDWLRQ��
����������±����
'DQH��$��9����6FKQHLGHU��%��+����������3URJUDP�LQWHJULW\�LQ�SULPDU\�DQG�HDUO\�VHFRQGDU\�
SUHYHQWLRQ��$UH�LPSOHPHQWDWLRQ�HIIHFWV�RXW�RI�FRQWURO"�&OLQLFDO�3V\FKRORJ\�
5HYLHZ�����������±����KWWS���GRL�RUJ���������6��������������������
'DYLV��'����&DUPDQ��(���������$SULO������$FFHOHUDWH�OHDUQLQJ�ZLWK�60$57�JRDOV�IRU�
VWXGHQWV�DQG�VWDII�>&RQIHUHQFH�3UHVHQWDWLRQ@� 1DWLRQDO�&RXQFLO�RI�6XSHUYLVRUV�RI�
0DWK������&RQIHUHQFH��1HZ�<RUN��1<��8QLWHG�6WDWHV��
KWWSV���ILOHV�HULF�HG�JRY�IXOOWH[W�('�������SGI�
�&ROOHJH�%RDUG�

�����
135
'HLO�$PHQ��5����5RVHQEDXP��-��(����������5RVHQEDXP��-��(����������7KH�XQLQWHQGHG�
FRQVHTXHQFHV�RI�VWLJPD�IUHH�UHPHGLDWLRQ� 6RFLRORJ\�RI�(GXFDWLRQ� ����������������
KWWSV���GRL�RUJ����������������
'HYRQSRUW��7��-����/DQH��$��0����������5HODWLRQVKLSV�EHWZHHQ�VHOI�HIILFDF\��FRSLQJ�DQG�
VWXGHQW�UHWHQWLRQ��6RFLDO�%HKDYLRU�DQG�3HUVRQDOLW\��$Q�,QWHUQDWLRQDO�-RXUQDO��
����������±�����KWWS���GRL�RUJ���������VES��������������
'L�7RPPDVR��.����������7KH�FRQQHFWLRQ�EHWZHHQ�UROH�PRGHO�UHODWLRQVKLSV�DQG�VHOI�
GLUHFWLRQ�LQ�GHYHORSPHQWDO�VWXGHQWV��5HVHDUFK�DQG�7HDFKLQJ�LQ�'HYHORSPHQWDO�
(GXFDWLRQ����������±���
'RUDQ��*��7����������7KHUH¶V�D�60$57�ZD\�WR�ZULWH�PDQDJHPHQW¶V�JRDOV�DQG�
REMHFWLYHV� 0DQDJHPHQW�UHYLHZ� ��������������
'RZQH\��'��%���+LSSHO��9RQ��3��7����%URK��%��$����������$UH�VFKRROV�WKH�JUHDW�HTXDOL]HU"�
&RJQLWLYH�LQHTXDOLW\�GXULQJ�WKH�VXPPHU�PRQWKV�DQG�WKH�VFKRRO�\HDU��$PHULFDQ�
6RFLRORJLFDO�5HYLHZ������������±�����
KWWS���GRL�RUJ���������������������������
'XFNZRUWK��$��/����4XLQQ��3��'����������'HYHORSPHQW�DQG�YDOLGDWLRQ�RI�WKH�6KRUW�*ULW�
6FDOH��*5,7±6���-RXUQDO�RI�3HUVRQDOLW\�$VVHVVPHQW������������±����
'XFNZRUWK��$��/���3HWHUVRQ��&����0DWWKHZV��0��'����������*ULW��SHUVHYHUDQFH�DQG�
SDVVLRQ�IRU�ORQJ�WHUP�JRDOV��-RXUQDO�RI�3HUVRQDOLW\�DQG�6RFLDO�3V\FKRORJ\���������
����±�����
'XVHQEXU\��/���%UDQQLJDQ��5���)DOFR��0����+DQVHQ��:��%����������$�UHYLHZ�RI�UHVHDUFK�
RQ�ILGHOLW\�RI�LPSOHPHQWDWLRQ��,PSOLFDWLRQV�IRU�GUXJ�DEXVH�SUHYHQWLRQ�LQ�VFKRRO�

�����
136
VHWWLQJV��+HDOWK�(GXFDWLRQ�5HVHDUFK������������±�����
KWWS���GRL�RUJ���������KHU���������
(UWPHU��3��$����1HZE\��7��-����������%HKDYLRULVP��FRJQLWLYLVP��FRQVWUXFWLYLVP��
&RPSDULQJ�FULWLFDO�IHDWXUHV�IURP�DQ�LQVWUXFWLRQDO�GHVLJQ�SHUVSHFWLYH��3HUIRUPDQFH�
,PSURYHPHQW�4XDUWHUO\����������±����KWWS���GRL�RUJ���������M������
����������WE������[
)LNH��5����������'HYHORSPHQWDO�HGXFDWLRQ�LQ�WKH�FRPPXQLW\�FROOHJH��(GXFDWLQJ�WKH�
HGXFDWRUV��5HVHDUFK�DQG�7HDFKLQJ�LQ�'HYHORSPHQWDO�(GXFDWLRQ����������±����
KWWS���GRL�RUJ�����������������
)RHQ�1J��6���$EGXOODK��0����&RQIHVVRUH��*��-����������*URXS�FRDFKLQJ�LQWHUYHQWLRQV�DQG�
LWV�HIIHFWV�RQ�OHDUQHU�DXWRQRP\� ,QWHUQDWLRQDO�-RXUQDO�RI�0RGHUQ�/DQJXDJHV�DQG�
$SSOLHG�/LQJXLVWLFV��,-0$/�� ������������
Frisby, B. N., & Martin, M. M. (2010). Instructor±student and student±student rapport in
the classroom. Communication Education, 59(2), 146±164.
https://doi.org/10.1080/03634520903564362
)XJDWH��$��/����$PH\��0��-����������&DUHHU�VWDJHV�RI�FRPPXQLW\�FROOHJH�IDFXOW\��$�
TXDOLWDWLYH�DQDO\VLV�RI�WKHLU�FDUHHU�SDWKV��UROHV��DQG�GHYHORSPHQW��&RPPXQLW\�
&ROOHJH�5HYLHZ����������±����KWWS���GRL�RUJ���������������������������
*DOODUG��$��-����$OEULWWRQ��)����������$�FRPSUHKHQVLYH�FRVW�EHQHILW�PRGHO��
'HYHORSPHQWDO�VWXGHQW�VXFFHVV�LPSDFW��-RXUQDO�RI�'HYHORSPHQWDO�(GXFDWLRQ��
���������±���

�����
137
*DPRUDQ��$����/RQJ��'��$����������(TXDOLW\�RI�HGXFDWLRQDO�RSSRUWXQLW\�D����\HDU�
UHWURVSHFWLYH��,Q ,QWHUQDWLRQDO�VWXGLHV�LQ�HGXFDWLRQDO�LQHTXDOLW\��WKHRU\�DQG�
SROLF\ �SS����������6SULQJHU��'RUGUHFKW�
*OD]LHU��5��$���+DPDQQ��.���3ROORFN��3��+����:LOVRQ��%��0����������:KDW�GULYHV�VWXGHQW�
VXFFHVV"�$VVHVVLQJ�WKH�FRPELQHG�HIIHFW�RI�WUDQVIHU�VWXGHQWV�DQG�RQOLQH�FRXUVHV��
7HDFKLQJ�LQ�+LJKHU�(GXFDWLRQ����������±����
KWWSV���GRL�RUJ������������������������������
*UDEVFK��'��.���3HxD��5��$����3DUNV��.��-����������([SHFWDWLRQV�RI�6WXGHQWV�3DUWLFLSDWLQJ�
LQ�9ROXQWDU\�3HHU�$FDGHPLF�&RDFKLQJ��-RXUQDO�RI�&ROOHJH�5HDGLQJ�DQG�/HDUQLQJ��
��������±����KWWSV���GRL�RUJ������������������������������
*URK��-��/����������$FDGHPLF�FRDFKLQJ�WRROV�IRU�LQFUHDVHG�UHWHQWLRQ��(PSRZHULQJ�
HQJLQHHULQJ�VWXGHQWV�LQ�WKHLU�HGXFDWLRQ�������,(((�)URQWLHUV�LQ�(GXFDWLRQ�
&RQIHUHQFH��),(����±���KWWSV���GRL�RUJ���������ILH�������������
+DWFK��'��.����%RKOLJ��(��0����������7KH�VFRSH�DQG�GHVLJQ�RI�VWUXFWXUHG�JURXS�OHDUQLQJ�
H[SHULHQFHV�DW�FRPPXQLW\�FROOHJHV��&RPPXQLW\�&ROOHJH�-RXUQDO�RI�5HVHDUFK�DQG�
3UDFWLFH������������±�����KWWSV���GRL�RUJ�����������������������������
+DWFK��'��.����*DUFLD��&��(����������$FDGHPLF�DGYLVLQJ�DQG�WKH�SHUVLVWHQFH�LQWHQWLRQV�RI�
FRPPXQLW\�FROOHJH�VWXGHQWV�LQ�WKHLU�ILUVW�ZHHNV�LQ�FROOHJH��7KH�5HYLHZ�RI�+LJKHU�
(GXFDWLRQ������������±�����KWWSV���GRL�RUJ���������UKH����������
+DWFK�7RFDLPD]D��'��.���0DUGRFN�8PDQ��1���*DUFLD��&����5RGULJXH]��6����������
&KDUWLQJ�WKH�GHVLJQ�RI�FRPPXQLW\�FROOHJH�VWXGHQW�VXFFHVV�FRXUVHV��8QFRYHULQJ�
WKHLU�HVSRXVHG�DQG�HQDFWHG�FXUULFXOD��&RPPXQLW\�&ROOHJH�-RXUQDO�RI�5HVHDUFK�
DQG�3UDFWLFH�����������±����KWWSV���GRL�RUJ������������������������������

�����
138
+HVVHU��7��/����*UHJRU\��-��/����������,QVWUXFWLRQDO�VXSSRUW�VHVVLRQV�LQ�FKHPLVWU\��
$OWHUQDWLYH�WR�UHPHGLDWLRQ� -RXUQDO�RI�'HYHORSPHQWDO�(GXFDWLRQ��������
+LOO��&��-���%ORRP��+��6����%ODFN��$��5����������(PSLULFDO�EHQFKPDUNV�IRU�LQWHUSUHWLQJ�
HIIHFW�VL]HV�LQ�UHVHDUFK��&KLOG�'HYHORSPHQW��KWWS���GRL�RUJ���������M������
����������������[�IXOO
+RGDUD��0����-DJJDUV��6��6����������$Q�H[DPLQDWLRQ�RI�WKH�LPSDFW�RI�DFFHOHUDWLQJ�
FRPPXQLW\�FROOHJH�VWXGHQWV¶�SURJUHVVLRQ�WKURXJK�GHYHORSPHQWDO�HGXFDWLRQ��7KH�
-RXUQDO�RI�+LJKHU�(GXFDWLRQ������������±�����
KWWS���GRL�RUJ���������MKH����������
+RGJHV��5���3D\QH��(��0����'LHW]��$����������H�6SRQVRU�PHQWRULQJ��6XSSRUW�IRU�VWXGHQWV�
LQ�GHYHORSPHQWDO�HGXFDWLRQ��-RXUQDO�RI�(GXFDWLRQDO�'HYHORSPHQW�����������±���
+ROOLGD\��/��5����������8VLQJ�ORJLF�PRGHO�PDSSLQJ�WR�HYDOXDWH�SURJUDP�ILGHOLW\��6WXGLHV�
LQ�(GXFDWLRQDO�(YDOXDWLRQ���������±�����
KWWS���GRL�RUJ���������M�VWXHGXF������������
+R\W��-��(����6RUHQVHQ��&��7����������+LJK�VFKRRO�SUHSDUDWLRQ��SODFHPHQW�WHVWLQJ��DQG�
FROOHJH�UHPHGLDWLRQ� -RXUQDO�RI�'HYHORSPHQWDO�(GXFDWLRQ� ����������
,ILOO��1���5DGIRUG��$��:���:X��-���&DWDOGL��(��)���:LOVRQ��'����+LOO��-����������3HUVLVWHQFH�
DQG�DWWDLQPHQW�RI���������ILUVW�WLPH�SRVWVHFRQGDU\�VWXGHQWV�DIWHU���\HDUV��)LUVW�
/RRN��1&(6���������� 1DWLRQDO�&HQWHU�IRU�(GXFDWLRQ�6WDWLVWLFV�
-DFRE\��'����������3DUW�WLPH�FRPPXQLW\�FROOHJH�IDFXOW\�DQG�WKH�GHVLUH�IRU�IXOO�WLPH�
WHQXUH�WUDFN�SRVLWLRQV��5HVXOWV�RI�D�VLQJOH�LQVWLWXWLRQ�FDVH�VWXG\��&RPPXQLW\�
&ROOHJH�-RXUQDO�RI�5HVHDUFK�DQG�3UDFWLFH������������±�����
KWWS���GRL�RUJ��������������������������

�����
139
-DPHV��&��/����������$&&83/$&(5��70��RQOLQH��$FFXUDWH�SODFHPHQW�WRRO�IRU�
GHYHORSPHQWDO�SURJUDPV"�-RXUQDO�RI�'HYHORSPHQWDO�(GXFDWLRQ� ���������
-DUDPLOOR��/��0���&DVWULOOyQ�'tD]��/��7����/ySH]�&DUR��/��%�������� 7HDFKLQJ�OHDUQHUV�WR�
VHW�VPDUW�JRDOV�WR�LQFUHDVH�WKHLU�VHOI�HIILFDF\ >0DVWHUV�WKHVLV��8QLYHUVLGDG�GH�/D�
6DEDQD@��KWWS���KGO�KDQGOH�QHW�����������
-HQNLQV��'����&KR��6��:����������*HW�ZLWK�WKH�SURJUDP�DQG�ILQLVK�LW��%XLOGLQJ�JXLGHG�
SDWKZD\V�WR�DFFHOHUDWH�VWXGHQW�FRPSOHWLRQ��1HZ�'LUHFWLRQV�IRU�&RPPXQLW\�
&ROOHJHV��KWWS���GRL�RUJ���������FF������
-HQNLQV��.��'����%UDQVIRUG��-����������6WUDWHJLF�OHDUQLQJ�DQG�GHYHORSPHQWDO�HGXFDWLRQ��
$Q�LQWHUYLHZ�ZLWK�'U��-RKQ�%UDQVIRUG��-RXUQDO�RI�'HYHORSPHQWDO�(GXFDWLRQ��
���������±��±�����KWWS���GRL�RUJ�����������������
-HQNLQV��.��'����5RGULJXH]��2����������$FFHVV�DQG�VXFFHVV�ZLWK�OHVV��,PSURYLQJ�
SURGXFWLYLW\�LQ�EURDG�DFFHVV�SRVWVHFRQGDU\�LQVWLWXWLRQV��7KH�)XWXUH�RI�&KLOGUHQ��
����������±�����KWWS���GRL�RUJ���������IRF����������
-RKQVRQ��5���-RKQVRQ��&��:���9LMD\DQ��6���7DWD��'����9LOOHJDV��5����������'LDJQRVLV��
SUHVFULSWLRQ��LQWHUYHQWLRQ��HYDOXDWLRQ��DGYDQFHG�DFDGHPLF�WUDLQLQJ��DQG�FROOHJH�
VWXGHQW�VXFFHVV��-RXUQDO�RI�&ROOHJH�6WXGHQW�5HWHQWLRQ��5HVHDUFK��7KHRU\��
3UDFWLFH������������±�����KWWSV���GRL�RUJ�������������������������
.HOO\��$��3����6FKQHLGHU��0���(GV����������� *HWWLQJ�WR�JUDGXDWLRQ��7KH�FRPSOHWLRQ�
DJHQGD�LQ�KLJKHU�HGXFDWLRQ��-+8�3UHVV�
.OHP��$��0����&RQQHOO��-��3����������5HODWLRQVKLSV�PDWWHU��/LQNLQJ�WHDFKHU�VXSSRUW�WR�
VWXGHQW�HQJDJHPHQW�DQG�DFKLHYHPHQW��-RXUQDO�RI�6FKRRO�+HDOWK������������±�����
KWWS���GRL�RUJ���������M����������������WE������[

�����
140
.ROHQRYLF��=����/LQGHUPDQ��'����������,PSURYLQJ�VWXGHQW�RXWFRPHV�YLD�FRPSUHKHQVLYH�
VXSSRUWV��7KUHH�\HDU�RXWFRPHV�IURP�&81<V�$FFHOHUDWHG�6WXG\�LQ�$VVRFLDWH�
3URJUDPV��$6$3���&RPPXQLW\�&ROOHJH�5HYLHZ������������±����
.RPDUUDMX��0����0XVXONLQ��6����������5ROH�RI�VWXGHQW±IDFXOW\�LQWHUDFWLRQV�LQ�
GHYHORSLQJ�FROOHJH�VWXGHQWV�DFDGHPLF�VHOI�FRQFHSW��PRWLYDWLRQ��DQG�DFKLHYHPHQW��
-RXUQDO�RI�&ROOHJH�6WXGHQW�'HYHORSPHQW������������±����
.|VHRJOX��<����������6HOI�(IILFDF\�DQG�DFDGHPLF�DFKLHYHPHQW±D�FDVH�IURP�7XUNH\��
-RXUQDO�RI�(GXFDWLRQ�DQG�3UDFWLFe� ���������������
/DUHDX��$����������&XOWXUDO�NQRZOHGJH�DQG�VRFLDO�LQHTXDOLW\��$PHULFDQ�6RFLRORJLFDO�
5HYLHZ����������±����KWWS���GRL�RUJ�������������������������
/L��*����������/LWHUDF\��FXOWXUH��DQG�SROLWLFV�RI�VFKRROLQJ��&RXQWHUQDUUDWLYHV�RI�D�&KLQHVH�
&DQDGLDQ�IDPLO\��$QWKURSRORJ\��(GXFDWLRQ�4XDUWHUO\������������±�����
KWWS���GRL�RUJ���������DHT��������������
/LQGHUPDQ��'����.ROHQRYLF��=����������0RYLQJ�WKH�FRPSOHWLRQ�QHHGOH�DW�FRPPXQLW\�
FROOHJHV��&81<V�DFFHOHUDWHG�VWXG\�LQ�DVVRFLDWH�SURJUDPV��$6$3���&KDQJH��7KH�
0DJD]LQH�RI�+LJKHU�/HDUQLQJ�����������±����
KWWS���GRL�RUJ�����������������������������
/HIGDKO�'DYLV��(��0���+XIIPDQ��/���6WDQFLO��-����$OD\DQ��$��-����������7KH�LPSDFW�RI�OLIH�
FRDFKLQJ�RQ�XQGHUJUDGXDWH�VWXGHQWV��$�PXOWL\HDU�DQDO\VLV�RI�FRDFKLQJ�
RXWFRPHV� ,QWHUQDWLRQDO�-RXUQDO�RI�(YLGHQFH�%DVHG�&RDFKLQJ��
0HQWRULQJ� ���������±����KWWSV���GRL�RUJ����������������
Lubin, M. M. (2013). Coaching the adult learner: A framework for engaging the
principles and processes of andragogy for best practices in coaching [Doctoral

�����
141
dissertation, Virginia Polytechnic Institute and State University]. https://vtech
works.lib.vt.edu/bitstream/handle/10919/22017/Lubin_MM_D_2013.pdf
0DQJXDO�)LJXHURD��$����������&LWL]HQVKLS�DQG�HGXFDWLRQ�LQ�WKH�KRPHZRUN�FRPSOHWLRQ�
URXWLQH��$QWKURSRORJ\��(GXFDWLRQ�4XDUWHUO\������������±�����
KWWS���GRL�RUJ���������M����������������������[
0DUWLQ��.���*DOHQWLQR��5����7RZQVHQG��/����������&RPPXQLW\�FROOHJH�VWXGHQW�VXFFHVV�
WKH�UROH�RI�PRWLYDWLRQ�DQG�VHOI�HPSRZHUPHQW��&RPPXQLW\�&ROOHJH�5HYLHZ� �������
���������KWWS���GRL�RUJ�������������������������
0DUWLURV\DQ��1��0���.HQQRQ��-��/���6D[RQ��'��3���(GPRQVRQ��6��/����6NLGPRUH��6��7��
��������,QVWUXFWLRQDO�WHFKQRORJ\�SUDFWLFHV�LQ�GHYHORSPHQWDO�HGXFDWLRQ�LQ�WH[DV��
-RXUQDO�RI�&ROOHJH�5HDGLQJ�DQG�/HDUQLQJ����������±����
KWWSV���GRL�RUJ������������������������������
0DUWRUHOO��3����0F)DUOLQ��,���-U����������+HOS�RU�KLQGUDQFH"�7KH�HIIHFWV�RI�FROOHJH�
UHPHGLDWLRQ�RQ�DFDGHPLF�DQG�ODERU�PDUNHW�RXWFRPHV��5HYLHZ�RI�(FRQRPLFV�DQG�
6WDWLVWLFV������������±�����KWWS���GRL�RUJ���������5(67BDB�����
0F)DUODQG��-���+XVVDU��%���=KDQJ��-���:DQJ��.���+HLQ��6���'LOLEHUWL��0���&DWDOGL��(��)���
0DQQ��)��%����%DUPHU��$����������7KH�FRQGLWLRQ�RI�HGXFDWLRQ�������7KH�
&RQGLWLRQ�RI�(GXFDWLRQ�������1&(6���������� 1DWLRQDO�&HQWHU�IRU�(GXFDWLRQ�
6WDWLVWLFV�
0HOJXL]R��7���.RVLHZLF]��+���3UDWKHU��*����%RV��-����������+RZ�DUH�FRPPXQLW\�FROOHJH�
VWXGHQWV�DVVHVVHG�DQG�SODFHG�LQ�GHYHORSPHQWDO�PDWK"��*URXQGLQJ�RXU�
XQGHUVWDQGLQJ�LQ�UHDOLW\��7KH�-RXUQDO�RI�+LJKHU�(GXFDWLRQ������������±�����
KWWS���GRL�RUJ���������MKH����������

�����
142
0H\HU��/��+����������1HJRWLDWLQJ�DFDGHPLF�YDOXHV��SURIHVVRULDO�UHVSRQVLELOLWLHV�DQG�
H[SHFWDWLRQV�IRU�DFFRXQWDELOLW\�LQ�WRGD\V�XQLYHUVLW\� +LJKHU�(GXFDWLRQ�
4XDUWHUO\� ���������������
0H\HU��/��+����(YDQV��,��0����������0RWLYDWLQJ�WKH�SURIHVVRULDWH��:K\�VWLFNV�DQG�FDUURWV�
DUH�RQO\�IRU�GRQNH\V� +LJKHU�HGXFDWLRQ�PDQDJHPHQW�DQG�SROLF\� ������������
0RNKHU��&��*���3DUN�*DJKDQ��7��-����+X��6����������$FFHOHUDWLQJ�WR�VXFFHVV��7KH�LPSDFW�
RI�)ORULGD¶V�GHYHORSPHQWDO�HGXFDWLRQ�UHIRUP�RQ�FUHGLW�DFFXPXODWLRQ��7HDFKHUV�
&ROOHJH�5HFRUG��7KH�9RLFH�RI�6FKRODUVKLS�LQ�(GXFDWLRQ������������±����
KWWSV���GRL�RUJ���������������������������
0RRUH��5����������&RXUVH�SHUIRUPDQFH��ORFXV�RI�FRQWURO��DQG�DFDGHPLF�PRWLYDWLRQ�DPRQJ�
GHYHORSPHQWDO�HGXFDWLRQ�VWXGHQWV� 5HVHDUFK�DQG�7HDFKLQJ�LQ�'HYHORSPHQWDO�
(GXFDWLRQ�������
1DWRZ��5��6���5HGG\��9����*UDQW��0����������7HFKQRORJ\�XVH�LQ�GHYHORSPHQWDO�
HGXFDWLRQ��([SHULHQFHV��FKDOOHQJHV��DQG�UDWLRQDOHV��&RPPXQLW\�&ROOHJH�-RXUQDO�RI�
5HVHDUFK�DQG�3UDFWLFH�������±������±����
KWWSV���GRL�RUJ������������������������������
1HDO��-��:����1HDO��=��3����������1HVWHG�RU�QHWZRUNHG"�)XWXUH�GLUHFWLRQV�IRU�HFRORJLFDO�
V\VWHPV�WKHRU\��6RFLDO�'HYHORSPHQW������������±�����
KWWS���GRL�RUJ���������VRGH������
1HOVRQ��0��&���&RUGUD\��'��6���+XOOHPDQ��&��6���'DUURZ��&��/����6RPPHU��(��&����������
$�SURFHGXUH�IRU�DVVHVVLQJ�LQWHUYHQWLRQ�ILGHOLW\�LQ�H[SHULPHQWV�WHVWLQJ�HGXFDWLRQDO�
DQG�EHKDYLRUDO�LQWHUYHQWLRQV��7KH�-RXUQDO�RI�%HKDYLRUDO�+HDOWK�6HUYLFHV��
5HVHDUFK������������±�����KWWS���GRL�RUJ���������V���������������[

�����
143
1REOH��.��*���+RXVWRQ��6��0���%ULWR��1��+���%DUWVFK��+���.DQ��(���.XSHUPDQ��-��0���HW�DO��
��������)DPLO\�LQFRPH��SDUHQWDO�HGXFDWLRQ�DQG�EUDLQ�VWUXFWXUH�LQ�FKLOGUHQ�DQG�
DGROHVFHQWV��1DWXUH�1HXURVFLHQFH������������±�����KWWS���GRL�RUJ���������QQ�����
2%DQLRQ��7����������3DWKZD\V�WR�FRPSOHWLRQ��&RPPXQLW\�&ROOHJH�-RXUQDO�����������±���
2'RQQHOO��&��/����������'HILQLQJ��FRQFHSWXDOL]LQJ��DQG�PHDVXULQJ�ILGHOLW\�RI�
LPSOHPHQWDWLRQ�DQG�LWV�UHODWLRQVKLS�WR�RXWFRPHV�LQ�N����FXUULFXOXP�LQWHUYHQWLRQ�
UHVHDUFK��5HYLHZ�RI�(GXFDWLRQDO�5HVHDUFK�����������±����
KWWS���GRL�RUJ�������������������������
2¶/HDU\��=� (2014). The essential guide to doing your research project. Sage.
5RGULJXH]�2WW��1���6WDNOLV��6����%R\HWWH��-����������7KH�HIIHFWLYHQHVV�RI�VWXGHQW�FRDFKLQJ�
LQ�FRPPXQLW\�FROOHJHV��&RPPXQLW\�&ROOHJH�-RXUQDO�RI�5HVHDUFK�DQG�3UDFWLFH��
��������±����KWWSV���GRL�RUJ������������������������������
Park, T., Woods, C. S., Hu, S., Jones, T. B., & Tandberg, D. (2017). What happens to
underprepared first-time-in-college students when developmental education is
optional? The case of developmental math and intermediate algebra in the first
semester. The Journal of Higher Education, 89(3), 1±23.
https://doi.org/10.1080/00221546.2017.1390970
Parker, D. R., Hoffman, S. F., Sawilowsky, S., & Rolands, L. (2011). An examination of
WKH�HIIHFWV�RI�$'+'�FRDFKLQJ�RQ�XQLYHUVLW\�VWXGHQWV¶�H[HFXWLYH�IXQFWLRQLQJ��
Journal of Postsecondary Education and Disability, 24(2), 115±132.
3DUNHU��7��/���%DUUHWW��0��6����%XVWLOORV��/��7����������$�KLVWRU\�RI�GHYHORSPHQWDO�
HGXFDWLRQ��,Q 7KH�6WDWH�RI�'HYHORSPHQWDO�(GXFDWLRQ �SS����������3DOJUDYH�
0DFPLOODQ��1HZ�<RUN�

�����
144
3DUNHU��7��/���%XVWLOORV��/��7����%HKULQJHU��/��%����������*HWWLQJ�SDVW�JR��5HPHGLDO�DQG�
GHYHORSPHQWDO�HGXFDWLRQ�SROLF\�DW�D�FURVVURDGV��35H3DUH�3ROLF\�5HVHDUFK�RQ�
3UHSDUDWLRQ�$FFHVV�DQG�5HPHGLDO�(GXFDWLRQ��
KWWSV���FLWHVHHU[�LVW�SVX�HGX�YLHZGRF�GRZQORDG"GRL ���������������UHS UHS�W
\SH SGI�
3HFKDF��6����6ODQWFKHYD�'XUVW��6����������&RDFKLQJ�WRZDUG�FRPSOHWLRQ��$FDGHPLF�
FRDFKLQJ�IDFWRUV�LQIOXHQFLQJ�FRPPXQLW\�FROOHJH�VWXGHQW�VXFFHVV��-RXUQDO�RI�
&ROOHJH�6WXGHQW�5HWHQWLRQ��5HVHDUFK��7KHRU\��3UDFWLFH������������±�����
KWWSV���GRL�RUJ�������������������������
3HULQ��'����������5HPHGLDWLRQ�EH\RQG�GHYHORSPHQWDO�HGXFDWLRQ��7KH�XVH�RI�OHDUQLQJ�
DVVLVWDQFH�FHQWHUV�WR�LQFUHDVH�DFDGHPLF�SUHSDUHGQHVV�LQ�FRPPXQLW\�
FROOHJHV� &RPPXQLW\�&ROOHJH�-RXUQDO�RI�5HVHDUFK��3UDFWLFH� ��������������
3HUNLQV��'��������� 6PDUW�VFKRROV��)URP�WUDLQLQJ�PHPRULHV�WR�HGXFDWLQJ�PLQGV��6LPRQ�
DQG�6FKXVWHU�
3HUVRQDO��(���*XHUUHUR��-��,���*DUFLD��$���3HxD��0����/HRQ��&����������.H\�SHUIRUPDQFH�
LQGLFDWRUV��$�XVHIXO�WRRO�WR�DVVHVV�6PDUW�*ULG�JRDOV��(QHUJ\���������±�����
KWWS���GRL�RUJ���������M�HQHUJ\������������
3LFKRQ��+��:����������'HYHORSLQJ�D�VHQVH�RI�EHORQJLQJ�LQ�WKH�FODVVURRP��&RPPXQLW\�
FROOHJH�VWXGHQWV�WDNLQJ�FRXUVHV�RQ�D�IRXU�\HDU�FROOHJH�FDPSXV��&RPPXQLW\�
&ROOHJH�-RXUQDO�RI�5HVHDUFK�DQG�3UDFWLFH�����������±����
KWWSV���GRL�RUJ�����������������������������

�����
145
3LQNHUWRQ��.����������&ROOHJH�SHUVLVWHQFH�RI�UHDGHUV�RQ�WKH�PDUJLQ��$�SRSXODWLRQ�
RYHUORRNHG��5HVHDUFK�DQG�7HDFKLQJ�LQ�'HYHORSPHQWDO�(GXFDWLRQ��
KWWS���GRL�RUJ�����������������
Pisarik, C., & Blankenship M. (2019, August 1-3) Academic coaching: An overview of
the landscape [Conference presentation]. Coaching in Higher Education
Consortium 2019 online conference:
https://www.ou.edu/content/dam/alc/docs/CHEC%20Business%20Meeting.pdf.
3RDUFK��0��-����������$Q�H[DPLQDWLRQ�RI�WKH�UHODWLRQVKLS�EHWZHHQ�VWXGHQW�VXFFHVV�FRXUVHV�
DQG�SHUVLVWHQFH��FUHGHQWLDO�DWWDLQPHQW��DQG�DFDGHPLF�VHOI�HIILFDF\�DPRQJ�
FRPPXQLW\�FROOHJH�VWXGHQWV�>'RFWRUDO�GLVVHUWDWLRQ@��$SSDODFKLDQ�6WDWH�8QLYHUVLW\�
3UDWW��,��6���+DUZRRG��+��%���&DYD]RV��-��7����'LW]IHOG��&��3����������6KRXOG�,�VWD\�RU�
VKRXOG�,�JR"�5HWHQWLRQ�LQ�ILUVW�JHQHUDWLRQ�FROOHJH�VWXGHQWV� -RXUQDO�RI�&ROOHJH�
6WXGHQW�5HWHQWLRQ��5HVHDUFK��7KHRU\��3UDFWLFH� ���������������
Pretlow III, J., & Wathington, H. D. (2012). Cost of Developmental Education: An
Update of Breneman and Haarlow. Journal of Developmental Education, 36(2), 4
Pusey-Reid, E., Gona, C. M., & MacDonald, A. M. (2021). Creating a culture of success:
A framework for addressing at-risk student. Journal of Professional Nursing,
37(3), 598±605. https://doi.org/10.1016/j.profnurs.2021.01.001
5DDE��/����$GDP��$��-����������7KH�XQLYHUVLW\�FROOHJH�PRGHO��$�OHDUQLQJ�FHQWHUHG�
DSSURDFK�WR�UHWHQWLRQ�DQG�UHPHGLDWLRQ��1HZ�'LUHFWLRQV�IRU�,QVWLWXWLRQDO�5HVHDUFK��
�������������±�����KWWS���GRL�RUJ���������LU����

�����
146
5H\QROGV��-��5����%DLUG��&��/����������,V�WKHUH�D�GRZQVLGH�WR�VKRRWLQJ�IRU�WKH�VWDUV"��
8QUHDOL]HG�HGXFDWLRQDO�H[SHFWDWLRQV�DQG�V\PSWRPV�RI�GHSUHVVLRQ��$PHULFDQ�
6RFLRORJLFDO�5HYLHZ������������±�����KWWS���GRL�RUJ�������������������������
5RELQVRQ��&����*DKDJDQ��-����������,Q�SUDFWLFH��&RDFKLQJ�VWXGHQWV�WR�DFDGHPLF�VXFFHVV�
DQG�HQJDJHPHQW�RQ�FDPSXV��$ERXW�&DPSXV�����������±����
KWWSV���GRL�RUJ���������DEF������
5RVV��-��$����������7HDFKHU�HIILFDF\�DQG�WKH�HIIHFWV�RI�FRDFKLQJ�RQ�VWXGHQW�DFKLHYHPHQW��
&DQDGLDQ�-RXUQDO�RI�(GXFDWLRQ���5HYXH�&DQDGLHQQH�'H�/pGXFDWLRQ�������������
KWWS���GRL�RUJ����������������
5RVVL��3��+���/LSVH\��0��:����)UHHPDQ��+��(����������(YDOXDWLRQ��$�V\VWHPLF�DSSURDFK��
6$*(�3XEOLFDWLRQV�
5XVV��9����������7KH�LPSDFW�RI�JURXS�WXWRULQJ�RQ�DW�ULVN�FROOHJH�VWXGHQWV��$PHULFDQ�
,QWHUQDWLRQDO�-RXUQDO�RI�6RFLDO�6FLHQFH����������
Satish, K., & Singh, V. (2020). Correlational study of grit and career decision self-
efficacy among secondary school students. International Journal of Future
Generation Communication and Networking, 13(3), 3448-3456.
6FKHUEDXP��&��$���&RKHQ�&KDUDVK��<����.HUQ��0��-����������0HDVXULQJ�JHQHUDO�VHOI�
HIILFDF\��$�FRPSDULVRQ�RI�WKUHH�PHDVXUHV�XVLQJ�LWHP�UHVSRQVH�WKHRU\��(GXFDWLRQDO�
DQG�3V\FKRORJLFDO�0HDVXUHPHQW�������������±������
KWWS���GRL�RUJ�������������������������
6FULYHQHU��6���:HLVV��0��-���5DWOHGJH��$���5XGG��7���6RPPR��&����)UHVTXHV��+����������
'RXEOLQJ�JUDGXDWLRQ�UDWHV��7KUHH�\HDU�HIIHFWV�RI�&81<V�$FFHOHUDWHG�6WXG\�LQ�
$VVRFLDWH�3URJUDPV��$6$3��IRU�GHYHORSPHQWDO�HGXFDWLRQ�VWXGHQWV� 0DQSRZHU�

�����
147
'HPRQVWUDWLRQ�5HVHDUFK�&RUSRUDWLRQ��
KWWSV���SDSHUV�VVUQ�FRP�VRO��SDSHUV�FIP"DEVWUDFWBLG �������
6KDGLVK��:��5���&RRN��7��'����&DPSEHOO��'��7����������([SHULPHQWDO�DQG�TXDVL�
H[SHULPHQWDO�GHVLJQV�IRU�JHQHUDOL]HG�FDXVDO�LQIHUHQFH��:DGVZRUWK�3XEOLVKLQJ�
&RPSDQ\�
Sepulveda, A., Birnbaum, M., Finley, J. B., & Frye, S. (2019). Coaching college students
who have expressed an interest in leaving: A pilot study. Coaching: An
International Journal of Theory, Research and Practice, 13(1), 1±8.
https://doi.org/10.1080/17521882.2019.1574847
Scull, J., Phillips, M., Sharma, U., & Garnier, K. (2020). Innovations in teacher education
at the time of COVID19: An Australian perspective. Journal of Education for
Teaching, 46(4), 1±10. https://doi.org/10.1080/02607476.2020.1802701
6PLWK�-DJJDUV��6���+RGDUD��0���&KR��6��:����;X��'����������7KUHH�DFFHOHUDWHG�
GHYHORSPHQWDO�HGXFDWLRQ�SURJUDPV��)HDWXUHV��VWXGHQW�RXWFRPHV��DQG�LPSOLFDWLRQV��
&RPPXQLW\�&ROOHJH�5HYLHZ����������±����
KWWS���GRL�RUJ�������������������������
6PLWK�-DJJDUV��6��6����%LFNHUVWDII��6����������'HYHORSPHQWDO�HGXFDWLRQ��7KH�HYROXWLRQ�
RI�UHVHDUFK�DQG�UHIRUP��,Q�0��3DXOVHQ��(G����+LJKHU�HGXFDWLRQ��+DQGERRN�RI�
WKHRU\�DQG�UHVHDUFK���SS����±������6SULQJHU�,QWHUQDWLRQDO�3XVEOLVKLQJ�
KWWSV���GRL�RUJ��������������������������B��
6WUD\KRUQ��7��/����������:KDW�UROH�GRHV�JULW�SOD\�LQ�WKH�DFDGHPLF�VXFFHVV�RI�%ODFN�PDOH�
FROOHJLDQV�DW�SUHGRPLQDQWO\�:KLWH�LQVWLWXWLRQV"�-RXUQDO�RI�$IULFDQ�$PHULFDQ�
6WXGLHV����������±����KWWS���GRL�RUJ���������V����������������

�����
148
6WUD\KRUQ��7��/����������0RGHOLQJ�WKH�GHWHUPLQDQWV�RI�FROOHJH�UHDGLQHVV�IRU�KLVWRULFDOO\�
XQGHUUHSUHVHQWHG�VWXGHQWV�DW���\HDU�FROOHJHV�DQG�XQLYHUVLWLHV��$�QDWLRQDO�
LQYHVWLJDWLRQ��$PHULFDQ�%HKDYLRUDO�6FLHQWLVW������������±�����
KWWS���GRL�RUJ�������������������������
6XOOLYDQ��3����1LHOVHQ��'����������,V�D�ZULWLQJ�VDPSOH�QHFHVVDU\�IRU�DFFXUDWH�
SODFHPHQW" -RXUQDO�RI�GHYHORSPHQWDO�HGXFDWLRQ� ���������
6ZHHQH\��'����������6WXGHQW�FHQWHUHG�FRDFKLQJ��&RUZLQ�3UHVV�
7HUHQ]LQL��3��7���6SULQJHU��/���<DHJHU��3��0���3DVFDUHOOD��(��7����1RUD��$����������)LUVW�
JHQHUDWLRQ�FROOHJH�VWXGHQWV��&KDUDFWHULVWLFV��H[SHULHQFHV��DQG�FRJQLWLYH�
GHYHORSPHQW��5HVHDUFK�LQ�+LJKHU�(GXFDWLRQ����������±����
KWWS���GRL�RUJ���������%)��������
7HGHVTXL��5��$��%����<RXQJ��%��:����������&RPSDULQJ�WKH�FRQWULEXWLRQ�RI�
FRQVFLHQWLRXVQHVV��VHOI�FRQWURO��DQG�JULW�WR�NH\�FULWHULD�RI�VSRUW�H[SHUWLVH�
GHYHORSPHQW��3V\FKRORJ\�RI�6SRUW�DQG�([HUFLVH���������±�����
KWWSV���GRL�RUJ���������M�SV\FKVSRUW������������
7XGRU��7��5����������)XOO\�LQWHJUDWLQJ�DFDGHPLF�DGYLVLQJ�ZLWK�FDUHHU�FRDFKLQJ�WR�LQFUHDVH�
VWXGHQW�UHWHQWLRQ��JUDGXDWLRQ�UDWHV�DQG�IXWXUH�MRE�VDWLVIDFWLRQ��,QGXVWU\�DQG�+LJKHU�
(GXFDWLRQ�����������±����KWWSV���GRL�RUJ�������������������������
7XUN��-��0����3HDUO��$��-����������,PSURYLQJ�GHYHORSPHQWDO�OHDUQLQJ�RXWFRPHV�LQ�
FRPPXQLW\�FROOHJHV�WKURXJK�VHUYLFHဨOHDUQLQJ��1HZ�'LUHFWLRQV�IRU�&RPPXQLW\�
&ROOHJHV���������������±�����KWWSV���GRL�RUJ���������FF������
8UHWVN\��0��&���6KLSH��6��/����+HQQHEHUJHU��$��.����������8SVWUHDP�SUHGLFWRUV�RI�WKH�
QHHG�IRU�GHYHORSPHQWDO�HGXFDWLRQ�DPRQJ�ILUVW�\HDU�FRPPXQLW\�FROOHJH�VWXGHQWV��

�����
149
&RPPXQLW\�&ROOHJH�-RXUQDO�RI�5HVHDUFK�DQG�3UDFWLFH����������±����
KWWSV���GRL�RUJ������������������������������
8VKHU��(��/���/L��&��5���%XW]��$��5����5RMDV��-��3����������3HUVHYHUDQW�JULW�DQG�VHOI�
HIILFDF\��$UH�ERWK�HVVHQWLDO�IRU�FKLOGUHQ¶V�DFDGHPLF�VXFFHVV"�-RXUQDO�RI�
(GXFDWLRQDO�3V\FKRORJ\� �����������
9HQH]LD��$����+XJKHV��.��/����������$FFHOHUDWLRQ�VWUDWHJLHV�LQ�WKH�QHZ�GHYHORSPHQWDO�
HGXFDWLRQ�ODQGVFDSH��1HZ�'LUHFWLRQV�IRU�&RPPXQLW\�&ROOHJHV���������������±����
KWWS���GRL�RUJ���������FF������
VanOra, J. (2019). "It's like one step for me to go forward": A longitudinal study of
community college students' perceptions on the value of developmental
education. Community College Enterprise, 25(1), 59-77.
Vick, N., Robles-Piña, R. A., Martirosyan, N. M., & Kite, V. (2015). The effectiveness of
tutoring on developmental English grades. Community College Enterprise, 21(1),
11-26.
Warner, Z., Neater, W., Clark, L., & Lee, J. (2018). Peer coaching and motivational
interviewing in postsecondary settings: Connecting retention theory with practice.
Journal of College Reading and Learning, 48(3), 1±16.
https://doi.org/10.1080/10790195.2018.1472940
Weger, H., Bell, G. C., Minei, E. M., & Robinson, M. C. (2014). The relative
effectiveness of active listening in initial interactions. International Journal of
Listening, 28(1), 13±31. https://doi.org/10.1080/10904018.2013.813234

�����
150
:HUQHUVEDFK��&URZOH\��%��0���%DWHV��6��/���5RVHQWKDO��6��&���&DURO����������6WXG\�VNLOOV�
FRXUVH�LPSDFW�RQ�DFDGHPLF�VHOI�HIILFDF\��-RXUQDO�RI�'HYHORSPHQWDO�(GXFDWLRQ��
����������
Westrick, P. A., Schmidt, F. L., Le, H., Robbins, S. B., & Radunzel, J. M. R. (2020). The
road to retention passes through first year academic performance: A meta-analytic
path analysis of academic performance and persistence. Educational Assessment,
26(1), 1±17. https://doi.org/10.1080/10627197.2020.1848423
Hillman, N. (2020). Why rich colleges get richer & poor colleges get poorer: The case for
equity-based funding in higher education. Third Way (November, 20).
https://www.thirdway.org/report/why-rich-colleges-get-richer-poor-colleges-get-poorer-
the-case-for-equity-based-funding-in-higher-education
:LOPHU��(����������6WXGHQW�6XSSRUW�6HUYLFHV�IRU�WKH�8QGHUSUHSDUHG�
6WXGHQW� ,QTXLU\� ������������
:ROII��0���6WRMDQ��-���%XFNOHU��6���&UDQIRUG��-���:KLWPDQ��/���*UXSSHQ��/����6DQWHQ��6��
��������&RDFKLQJ�WR�LPSURYH�VHOIဨGLUHFWHG�OHDUQLQJ� 7KH�FOLQLFDO�WHDFKHU� �������
��������
<DGXVN\��.���.KHDQJ��6����+RJJDQ��&����������+HOSLQJ�XQGHUSUHSDUHG�VWXGHQWV�VXFFHHG��
0LQLPL]LQJ�WKUHDWV�WR�LGHQWLW\��&RPPXQLW\�&ROOHJH�-RXUQDO�RI�5HVHDUFK�DQG�
3UDFWLFH����������±����KWWSV���GRL�RUJ������������������������������
<RXQJ��'��%����/H\��.����������6HOI�UHJXODWLRQ�VXSSRUW�RIIHUHG�E\�GHYHORSPHQWDO�
HGXFDWRUV� -RXUQDO�RI�'HYHORSPHQWDO�(GXFDWLRQ� ���������

�����
151
=DFKU\��(��0����6FKQHLGHU��(����������%XLOGLQJ�IRXQGDWLRQV�IRU�VWXGHQW�UHDGLQHVV��$�
UHYLHZ�RI�ULJRURXV�UHVHDUFK�DQG�SURPLVLQJ�WUHQGV�LQ�GHYHORSPHQWDO�HGXFDWLRQ��
,Q $QQXDO�0HHWLQJ�RI�WKH�1DWLRQDO�&HQWHU�3RVWVHFRQGDU\�5HVHDUFK��1HZ�<RUN�

�����
152
Appendix A
Table of Constructs and Indicators
&RQVWUXFW�DQG�,QGLFDWRU 'HILQLWLRQ 6RXUFH�RI�'DWD Remedial Student/Developmental Student/Under-prepared student/Pre-admit students Indicator Enrolled in at least one remedial course 3ODFHG�EHORZ�WKH�FROOHJH�OHYHO�PLQLPXP�RQ�FROOHJH�HQWUDQFH�WHVW
6WXGHQWV�UHTXLUHG�WR�WDNH�DW�OHDVW�RQH�SUH�FROOHJH�OHYHO�FRXUVH�WR�EH�FRQVLGHUHG�SUHSDUHG�IRU�FROOHJH�OHYHO�FRXUVHV��-HRQJ��������&ULVS��'HOJDGR��������-DPHV��������6XOOLYDQ��1LHOVRQ���������
National Center for Education Statistics National Survey of Student Engagement Community College Survey of Student Engagement
Remedial (Developmental) Education Indicator Gatekeeper courses Boot-camp courses 3UH�UHTXLVLWHV�IRU�&ROOHJH�(QJOLVK��6WDWLVWLFV�RU�$OJHEUD
3UH�FROOHJH�OHYHO�FRXUVHV�LQ�PDWKHPDWLFV�DQG�(QJOLVK�RIIHUHG�WR�FROOHJH�VWXGHQWV�DVVHVVHG�DV�QRW�SUHSDUHG�WR�WDNH�FROOHJH�OHYHO�FRXUVHV��-HRQJ��������&ULVS��'HOJDGR��������-DPHV��������6XOOLYDQ��1LHOVRQ��������
National Center for Education Statistics National Survey of Student Engagement Community College Survey of Student Engagement 2EVHUYDWLRQ�&DVH�6WXGLHV
Placement Indicator Writing assessments ACCUPLACER/COMPASS required 3UH�DGPLW�WHVWLQJ
5HIHUV�WR�WKH�SURFHVV�ZKHUH�VWXGHQWV�DUH�DVVHVVHG�IRU�FROOHJH�UHDGLQHVV�LQ�PDWKHPDWLFV��UHDGLQJ�RU�ZULWLQJ�DQG�DVNHG�WR�FRPSOHWH�SUH�FROOHJH�FRXUVHZRUN��-HRQJ���&KR��������&ULVS��'HOJDGR��������-DPHV��������
National Center for Education Statistics National Survey of Student Engagement &RPPXQLW\�&ROOHJH�6XUYH\�RI�6WXGHQW�(QJDJHPHQW�
Retention Indicator Term over term enrollment On-time graduation rates Transfer rates 7LPH�WR�'HJUHH
3HUWDLQV�WR�DQ\�VWXGHQW�ZKR�UHPDLQV�DW�WKH�VDPH�LQVWLWXWLRQ�IURP�WHUP�WR�WHUP��XOWLPDWHO\�OHDGLQJ�WR�WKH�FRPSOHWLRQ�RI�WKHLU�FKRVHQ�FUHGHQWLDO��%DLOH\��-HRQJ���&KR��������&ULVS��'HOJDGR��������-DPHV��������
National Center for Education Statistics National Survey of Student Engagement Community College Survey of Student Engagement

�����
153
Persistence Indicator Term over term enrollment On-time graduation rates Transfer rates 7LPH�WR�'HJUHH
5HIHUHQFHV�VWXGHQWV�ZKR�UHPDLQ�DW�DQ\�FROOHJH��WKH\�PD\�FKDQJH�FROOHJHV�GXULQJ�WKLV�WLPH���XOWLPDWHO\�OHDGLQJ�WR�WKH�FRPSOHWLRQ�RI�WKHLU�FKRVHQ�FUHGHQWLDO��%DLOH\��-HRQJ���&KR��������&ULVS��'HOJDGR��������-DPHV��������
National Center for Education Statistics National Survey of Student Engagement &RPPXQLW\�&ROOHJH�6XUYH\�RI�6WXGHQW�(QJDJHPHQW�
Progression Indicator Term over term enrollment On-time graduation rates Transfer rates 7LPH�WR�'HJUHH
5HIHUV�WR�ZKHWKHU�VWXGHQWV�FRPSOHWH�WKHLU�UHPHGLDO�FRXUVH�VHTXHQFH�DQG�PRYH�RQ�WR�FROOHJH�OHYHO�FRXUVHV��%DLOH\��-HRQJ���&KR��������
National Center for Education Statistics National Survey of Student Engagement Community College Survey of Student Engagement
Low-income Indicator Pell-grant eligible Below poverty line for household income %HORZ�DYHUDJH�LQFRPH�RI�86�SRSXODWLRQ
5HIHUV�WR�VWXGHQWV�ZKR�DUH�HFRQRPLFDOO\�GLVDGYDQWDJHG��6WUD\KRUQ��������������
National Center for Education Statistics National Survey of Student Engagement &RPPXQLW\�&ROOHJH�6XUYH\�RI�6WXGHQW�(QJDJHPHQW�
College-ready [defined by the college, not the high school] Indicator Above minimum scores on college placement exams/entry exams 1R�UHPHGLDO�FRXUVHV�UHTXLUHG
7HUP�XVHG�WR�FDSWXUH�WKH�OHYHO�RI�DFDGHPLF�SUHSDUDWLRQ�WKDW�DOORZV�VWXGHQWV�WR�PDWULFXODWH�LQWR�FROOHJH�OHYHO�FRXUVHV�ZLWK�QR�UHPHGLDWLRQ�UHTXLUHG��%HWWLQJHU��/RQJ��������&ULVS��'HOJDGR��������-DPHV��������6XOOLYDQ��1LHOVRQ����������
National Center for Education Statistics National Survey of Student Engagement Community College Survey of Student Engagement National Survey of Student Engagement

�����
154
Grit (as it relates to student) Indicator Help-seeking behavior Study skills Goal planning Self-esteem levels $FDGHPLF�SHUIRUPDQFH
7KH�OHYHO�RI�UHVLOLHQFH�RI�D�VWXGHQW�WR�RYHUFRPH�FKDOOHQJHV�DQG�SHUVLVW�LQ�WKHLU�SURJUHVV�WRZDUGV�WKHLU�GHJUHH��5H\QROGV��%DLUG��������6WUD\KRUQ��������������
Community College Survey of Student Engagement
Self-Efficacy (as it relates to student) Indicator Help-seeking behavior Study skills Goal planning Self-esteem levels Academic performance Communication level of instructors Communication level of college central services 4XHVWLRQLQJ�EHKDYLRU
6WXGHQW�EHOLHI�LQ�WKHLU�DELOLW\�WR�LPSDFW�WKHLU�DFDGHPLF�SHUIRUPDQFH��%DQGXUD��������0RRUH��������<RXQJ��/H\��������
National Center for Education Statistics National Survey of Student Engagement Community College Survey of Student Engagement
College navigation skills Indicator Level of education of parents Level of education of siblings Help-seeking behavior Communication level of instructors Communication level of college central services 4XHVWLRQLQJ�EHKDYLRU
7KH�DELOLW\�RI�VWXGHQWV�WR�XVH�DYDLODEOH�FROOHJH�UHVRXUFHV�WR�VXSSRUW�WKHLU�DFDGHPLF�SHUIRUPDQFH��/DUHDX��������6WUD\KRUQ���������
National Center for Education Statistics National Survey of Student Engagement Community College Survey of Student Engagement
First generation in college Indicator Level of education of parents Level of education of siblings Income
5HIHUV�WR�VWXGHQWV�ZKR�DUH�WKH�ILUVW�LQ�D�JHQHUDWLRQ�WR�JR�WR�FROOHJH��/DUHDX��������6WUD\KRUQ��������7HUHQ]LQL�HW�DO��������
National Center for Education Statistics National Survey of Student Engagement Community College Survey of Student Engagement

�����
155
Dependence on financial aid Minority-status Student funnel Indicator 1XPEHU�RI�VWXGHQWV�ZKR�LQTXLUH��DSSO\��HQUROO�DQG�FRPSOHWH
5HIHUHQFHV�WKH�GDWD�VWUHDP�WKDW�FDSWXUHV�WKH�PRYHPHQW�RI�SURVSHFWLYH�VWXGHQWV�IURP�LQWHUHVW�LQ�D�SURJUDP�WR�FRPSOHWLQJ�WKH�SURJUDP���
1�$

���
Appendix B
Sample Student Interview Questions
1. :K\�GLG�\RX�MRLQ�WKH�FRDFKLQJ�SURJUDP"
2. 'LG�WKH�FRDFKLQJ�SURJUDP�PHHW�\RXU�H[SHFWDWLRQV"�:K\�RU�ZK\�QRW"
3. ,Q�\RXU�FRDFKLQJ�VHVVLRQV��GLG�\RXU�FRDFK�DVN�\RX�TXHVWLRQV�WR�FODULI\�ZKDW�\RX�
ZHUH�VD\LQJ"�:HUH�WKHVH�TXHVWLRQV�KHOSIXO"�
4. 'LG�WKH�FRDFK�DVN�\RX�TXHVWLRQV�WKDW�KHOSHG�\RX�PDNH�EHWWHU�GHFLVLRQV"�
5. 'LG�\RX�IHHO�VXSSRUWHG�RU�MXGJHG"
6. �:DV�\RXU�FRDFK�DEOH�WR�SURYLGH�\RX�FRQWDFWV�WR�KHOS�ZLWK�VRPH�RI�\RXU�
FKDOOHQJHV"
7. 'R�\RX�PLQG�VKDULQJ�KRZ�\RX�GLG�WKLV�VHPHVWHU"�&DQ�\RX�WKLQN�RI�ZKDW�ZHUH�WKH�
PRVW�KHOSIXO�DFWLYLWLHV�DORQJ�WKH�ZD\"�
8. +RZ�GLG�\RXU�FRDFK�LQIOXHQFH�\RXU�SURJUHVV�WKLV�VHPHVWHU��LI�DW�DOO�"
9. 'LG�\RX�VHW�JRDOV�ZLWK�\RXU�FRDFK"�
10. 2YHU�WKH�FRXUVH�RI�WKH�VHPHVWHU��GLG�\RX�UHPDLQ�IRFXVHG�RQ�\RXU�JRDOV"
11. 'LG�\RXU�FRDFK�KHOS�\RX�UHDFK�WKRVH�JRDOV"�:K\�RU�GR�\RX�RU�GRQ¶W�\RX�WKLQN�VR"
12. :HUH�\RX�HYHU�GLVFRXUDJHG�GXULQJ�WKH�VHPHVWHU"�'LG�\RX�KDYH�DQ\�VHWEDFNV"�&DQ�
\RX�VKDUH�ZKDW�WKDW�H[SHULHQFH�ZDV�OLNH"�+RZ�GLG�\RX�PRYH�IRUZDUG"
13. +RZ�GR�\RX�IHHO�DERXW�SRVVLEOH�IXWXUH�FKDOOHQJHV"
14. ,�DP�JRLQJ�WR�DVN�\RX�D�VHULHV�RI�TXHVWLRQV��&DQ�\RX�UHIOHFW�EDFN�WR�WKH�VWDUW�RI�WKH�
VHPHVWHU"�%DVHG�RQ�KRZ�\RX�IHOW�EDFN�WKHQ��FDQ�\RX�UHVSRQG�WR�WKH�IROORZLQJ�
VWDWHPHQWV�ZLWK�RQH�RI�WKHVH������VWURQJO\�GLVDJUHH�����GLVDJUHH�����QHLWKHU�DJUHH�
QRU�GLVDJUHH�����DJUHH�����VWURQJO\�DJUHH��

�����
157
a. ,�ZLOO�EH�DEOH�WR�DFKLHYH�PRVW�RI�WKH�JRDOV�WKDW�,�VHW�IRU�P\VHOI�
b. :KHQ�IDFLQJ�GLIILFXOW�WDVNV��,�DP�FHUWDLQ�WKDW�,�ZLOO�DFFRPSOLVK�WKHP�
c. ,Q�JHQHUDO��,�WKLQN�WKDW�,�FDQ�REWDLQ�RXWFRPHV�WKDW�DUH�LPSRUWDQW�WR�PH�
d. ,�EHOLHYH�,�FDQ�VXFFHHG�DW�PRVW�DQ\�HQGHDYRU�WR�ZKLFK�,�VHW�P\�PLQG�
e. ,�ZLOO�EH�DEOH�WR�VXFFHVVIXOO\�RYHUFRPH�PDQ\�FKDOOHQJHV�
f. ,�DP�FRQILGHQW�WKDW�,�FDQ�SHUIRUP�HIIHFWLYHO\�RQ�PDQ\�GLIIHUHQW�WDVNV�
g. &RPSDUHG�WR�RWKHU�SHRSOH��,�FDQ�GR�PRVW�WDVNV�YHU\�ZHOO�
h. (YHQ�ZKHQ�WKLQJV�DUH�WRXJK��,�FDQ�SHUIRUP�TXLWH�ZHOO�
Reflect on who you are today and respond to the same statements based on how you feel
today.
15. 'R�\RX�WKLQN�WKH�FRDFKLQJ�\RX�UHFHLYH�LPSDFWHG�\RXU�UHVSRQVHV�WRGD\"�+RZ"�
16. ,V�WKHUH�DQ\WKLQJ�,�KDYH�QRW�DVNHG�WKDW�\RX�ZRXOG�OLNH�WR�VKDUH�ZLWK�PH"

�����
158
Appendix C
Sample Coach Interview Questions
1. :K\�GLG�\RX�GHFLGH�WR�FRDFK"�
2. 'LG�WKH�FRDFKLQJ�PHHW�ZLWK�\RXU�H[SHFWDWLRQV"
3. +RZ�ZHOO�GLG�\RX�WKLQN�WKH�FRDFK�WUDLQLQJ�SUHSDUHG�\RX�IRU�VXSSRUWLQJ�\RXU�
VWXGHQW�V�"�:KDW�HOHPHQWV�RI�WKH�WUDLQLQJ�GLG�\RX�XVH"�:KDW�GLG�\RX�QRW�ILQG�XVHIXO"
4. 'LG�\RX�VHW�JRDOV�ZLWK�\RXU�VWXGHQW�V��DW�WKH�VWDUW�RI�WKH�VHPHVWHU"�+RZ�GLG�\RX�
VXSSRUW�\RXU�VWXGHQW�V��LQ�DFKLHYLQJ�JRDOV"
5. 'LG�\RX�REVHUYH�DQ\�FKDQJHV�LQ�WKH�VWXGHQWV�\RX�FRDFKHG"�&DQ�\RX�VKDUH�VRPH�
H[DPSOHV"
6. 'LG�\RX�KHOS�VWXGHQWV�RYHUFRPH�DQ\�FKDOOHQJHV"�&DQ�\RX�VKDUH�KRZ"
7. +RZ�XVHIXO�GR�\RX�WKLQN�FRDFKLQJ�LV�LQ�KHOSLQJ�VWXGHQWV�VWD\�RQ�WUDFN�DFDGHPLFDOO\"�
:K\"
8. 'LG�\RX�QRWLFH�DQ\�FKDQJH�LQ�WKH�IROORZLQJ�EHKDYLRUV�IRU�\RXU�VWXGHQW"�&DQ�\RX�
VKDUH�VRPH�H[DPSOHV"
9. �&RPSDUHG�WR�WKH�EHJLQQLQJ�RI�WKH�VHPHVWHU��GR�\RX�WKLQN�WKH\�DUH�QRZ�PRUH�RU�OHVV�
OLNHO\�WR�EHOLHYH�WKDW�
a. 7KH\�FDQ�DFKLHYH�WKH�JRDOV�WKH\�VHW�IRU�WKHPVHOYHV
b. 7KH\�FDQ�DFFRPSOLVK�GLIILFXOW�WDVNV
c. 7KH\�FDQ�REWDLQ�RXWFRPHV�WKDW�DUH�LPSRUWDQW�WR�WKHP
d. 7KH\�FDQ�VXFFHHG�DW�PRVW�DQ\�HQGHDYRU�WR�ZKLFK�WKH\�VHW�P\�PLQG�
e. 7KH\�ZLOO�EH�DEOH�WR�VXFFHVVIXOO\�RYHUFRPH�PDQ\�FKDOOHQJHV
f. 7KH\�FDQ�SHUIRUP�HIIHFWLYHO\�RQ�PDQ\�GLIIHUHQW�WDVNV

�����
159
g. &RPSDUHG�WR�RWKHU�SHRSOH��WKH\�FDQ�GR�PRVW�WDVNV�YHU\�ZHOO�
h. (YHQ�ZKHQ�WKLQJV�DUH�WRXJK��WKH\�FDQ�SHUIRUP�TXLWH�ZHOO�
10. ,V�WKHUH�DQ\WKLQJ�,�KDYH�QRW�DVNHG�WKDW�\RX�ZRXOG�OLNH�WR�VKDUH�ZLWK�PH"

�����
160
Appendix D
Logic Model