Illegal killing for ivory drives global decline in African elephants
13
Illegal killing for ivory drives global decline in African elephants George Wittemyer a,b,c,1 , Joseph M. Northrup a , Julian Blanc d , Iain Douglas-Hamilton b,e , Patrick Omondi f , and Kenneth P. Burnham a a Department of Fish, Wildlife, and Conservation Biology and c Graduate Degree Program in Ecology, Colorado State University, Ft. Collins, CO 80523-1474; b Save the Elephants, Nairobi, Kenya 00200; d Monitoring the Illegal Killing of Elephants, Secretariat of the Convention on International Trade in Endangered Species of Wild Fauna and Flora, Nairobi, Kenya 00100; e Department of Zoology, University of Oxford, Oxford OX1 3PS, United Kingdom; and f Kenya Wildlife Service, Nairobi, Kenya 00200 Edited by Peter M. Kareiva, The Nature Conservancy, Seattle, WA, and approved July 22, 2014 (received for review March 3, 2014) Illegal wildlife trade has reached alarming levels globally, extir- pating populations of commercially valuable species. As a driver of biodiversity loss, quantifying illegal harvest is essential for conser- vation and sociopolitical affairs but notoriously difficult. Here we combine field-based carcass monitoring with fine-scale demographic data from an intensively studied wild African elephant population in Samburu, Kenya, to partition mortality into natural and illegal causes. We then expand our analytical framework to model illegal killing rates and population trends of elephants at regional and continental scales using carcass data collected by a Convention on International Trade in Endangered Species program. At the in- tensively monitored site, illegal killing increased markedly after 2008 and was correlated strongly with the local black market ivory price and increased seizures of ivory destined for China. More broadly, results from application to continental data indicated illegal killing levels were unsustainable for the species between 2010 and 2012, peaking to ∼8% in 2011 which extrapolates to ∼40,000 elephants illegally killed and a probable species reduction of ∼3% that year. Preliminary data from 2013 indicate overhar- vesting continued. In contrast to the rest of Africa, our analysis corroborates that Central African forest elephants experienced de- cline throughout the last decade. These results provide the most comprehensive assessment of illegal ivory harvest to date and con- firm that current ivory consumption is not sustainable. Further, our approach provides a powerful basis to determine cryptic mortality and gain understanding of the demography of at-risk species. poaching | overharvest | population estimation | extinction | endangered species consumption O verharvest of wildlife for human consumption is currently the second leading driver of global biodiversity decline and local extinction of species (1–3). Overharvesting diminishes species occurrence and density and affects food webs and ecological pro- cesses extensively (4, 5). The repercussions of this harvest when driven by illegal commercial trade are not only ecological in na- ture, but raise human health (6) and socioeconomic concerns (2, 7) with broad implications for national and international policy and security (8). Recently, overharvest driven by illegal commercial trade has received renewed focus due to the extirpation of pop- ulations of commercially valuable species including rhinoceros, tigers, and elephants (9–12), but information on overharvest rates and resulting population trends for these species and others are lacking. Information on the levels and drivers of illegal harvest is broadly needed to facilitate conservation and management actions. Despite the importance of assessing the magnitude of illegal trade and its impacts on local populations of commercially and ecologically valuable species (13, 14), it is cryptic and therefore notoriously difficult to quantify (15). Few approaches provide robust delineation of mortality drivers, such as natural mortality versus illegal offtake rates, although this information is critical for diagnosing population trends and risks and formulating regulatory frameworks (16, 17). In 2002, an elephant monitoring system [Monitoring the Illegal Killing of Elephants (MIKE)] was instituted by the Convention on International Trade in Endangered Species (CITES) in 45 sites across Africa to ascertain the impact of legal ivory trade on the species (18). The cause of death and date of all elephant carcasses found during regular patrolling (by foot, vehicle, or air) were recorded. This monitoring system provides powerful data regarding the site-specific relative causes of mortality [i.e., the proportion of illegally killed elephants (PIKE)] (18) that has served to indicate regional levels of illegal harvest (19). Here we develop an approach using carcass surveys to assess trends in relative causes of elephant deaths (PIKE) and pop- ulation performance, an approach broadly applicable to other species with similar data. Initially, we used carcass survey data to partition the causes (illegal killing or natural) of known mortality among individually monitored elephants inhabiting the Samburu National Reserves complex (20). Although offering robust metrics for a local, intensively studied population, it was critical to expand our approach to estimate illegal killing levels at the country, re- gional, and species scales to assess the species’ status. Therefore, we modified our approach to infer trends on the broader carcass data collected through the CITES MIKE program (19). At this continental scale, we applied and compared results from two parallel approaches representing alternative monitoring struc- tures and related assumptions: (i ) intense monitoring of a few sites versus (ii ) coarse monitoring across many sites. Significance Illegal harvest for commercial trade has recently surged to become a major threat to some of the world’s most endan- gered and charismatic species. Unfortunately, the cryptic na- ture of illegal killing makes estimation of rates and impacts difficult. Applying a model based on field census of car- casses, to our knowledge we provide the first detailed as- sessment of African elephant illegal killing rates at population, regional, and continental scales. Illegal harvest for commercial trade in ivory has recently surged, coinciding with increases in illegal ivory seizures and black market ivory prices. As a result, the species declined over the past 4 y, during which tens of thousands of elephants have been killed annually across the continent. Solutions to this crisis require global action. Author contributions: G.W., J.B., I.D.-H., P.O., and K.P.B. designed research; G.W., J.M.N., J.B., and I.D.-H. performed research; G.W., J.B., P.O., and K.P.B. contributed new reagents/ analytic tools; G.W., J.M.N., J.B., and K.P.B. analyzed data; and G.W. wrote the paper. The authors declare no conflict of interest. This article is a PNAS Direct Submission. Freely available online through the PNAS open access option. 1 To whom correspondence should be addressed. Email: [email protected]. This article contains supporting information online at www.pnas.org/lookup/suppl/doi:10. 1073/pnas.1403984111/-/DCSupplemental. www.pnas.org/cgi/doi/10.1073/pnas.1403984111 PNAS | September 9, 2014 | vol. 111 | no. 36 | 13117–13121 ECOLOGY SUSTAINABILITY SCIENCE
-
Upload
independent -
Category
Documents
-
view
0 -
download
0
Transcript of Illegal killing for ivory drives global decline in African elephants

Illegal killing for ivory drives global decline inAfrican elephantsGeorge Wittemyera,b,c,1, Joseph M. Northrupa, Julian Blancd, Iain Douglas-Hamiltonb,e, Patrick Omondif,and Kenneth P. Burnhama
aDepartment of Fish, Wildlife, and Conservation Biology and cGraduate Degree Program in Ecology, Colorado State University, Ft. Collins, CO 80523-1474;bSave the Elephants, Nairobi, Kenya 00200; dMonitoring the Illegal Killing of Elephants, Secretariat of the Convention on International Trade in EndangeredSpecies of Wild Fauna and Flora, Nairobi, Kenya 00100; eDepartment of Zoology, University of Oxford, Oxford OX1 3PS, United Kingdom; and fKenya WildlifeService, Nairobi, Kenya 00200
Edited by Peter M. Kareiva, The Nature Conservancy, Seattle, WA, and approved July 22, 2014 (received for review March 3, 2014)
Illegal wildlife trade has reached alarming levels globally, extir-pating populations of commercially valuable species. As a driver ofbiodiversity loss, quantifying illegal harvest is essential for conser-vation and sociopolitical affairs but notoriously difficult. Here wecombine field-based carcass monitoring with fine-scale demographicdata from an intensively studied wild African elephant populationin Samburu, Kenya, to partition mortality into natural and illegalcauses. We then expand our analytical framework to model illegalkilling rates and population trends of elephants at regional andcontinental scales using carcass data collected by a Convention onInternational Trade in Endangered Species program. At the in-tensively monitored site, illegal killing increased markedly after2008 and was correlated strongly with the local black market ivoryprice and increased seizures of ivory destined for China. Morebroadly, results from application to continental data indicatedillegal killing levels were unsustainable for the species between2010 and 2012, peaking to ∼8% in 2011 which extrapolates to∼40,000 elephants illegally killed and a probable species reductionof ∼3% that year. Preliminary data from 2013 indicate overhar-vesting continued. In contrast to the rest of Africa, our analysiscorroborates that Central African forest elephants experienced de-cline throughout the last decade. These results provide the mostcomprehensive assessment of illegal ivory harvest to date and con-firm that current ivory consumption is not sustainable. Further, ourapproach provides a powerful basis to determine cryptic mortalityand gain understanding of the demography of at-risk species.
poaching | overharvest | population estimation | extinction |endangered species consumption
Overharvest of wildlife for human consumption is currentlythe second leading driver of global biodiversity decline and
local extinction of species (1–3). Overharvesting diminishes speciesoccurrence and density and affects food webs and ecological pro-cesses extensively (4, 5). The repercussions of this harvest whendriven by illegal commercial trade are not only ecological in na-ture, but raise human health (6) and socioeconomic concerns (2, 7)with broad implications for national and international policy andsecurity (8). Recently, overharvest driven by illegal commercialtrade has received renewed focus due to the extirpation of pop-ulations of commercially valuable species including rhinoceros,tigers, and elephants (9–12), but information on overharvest ratesand resulting population trends for these species and others arelacking. Information on the levels and drivers of illegal harvest isbroadly needed to facilitate conservation and management actions.Despite the importance of assessing the magnitude of illegal
trade and its impacts on local populations of commercially andecologically valuable species (13, 14), it is cryptic and thereforenotoriously difficult to quantify (15). Few approaches providerobust delineation of mortality drivers, such as natural mortalityversus illegal offtake rates, although this information is criticalfor diagnosing population trends and risks and formulatingregulatory frameworks (16, 17). In 2002, an elephant monitoring
system [Monitoring the Illegal Killing of Elephants (MIKE)] wasinstituted by the Convention on International Trade in EndangeredSpecies (CITES) in 45 sites across Africa to ascertain the impact oflegal ivory trade on the species (18). The cause of death and dateof all elephant carcasses found during regular patrolling (by foot,vehicle, or air) were recorded. This monitoring system providespowerful data regarding the site-specific relative causes of mortality[i.e., the proportion of illegally killed elephants (PIKE)] (18) thathas served to indicate regional levels of illegal harvest (19).Here we develop an approach using carcass surveys to assess
trends in relative causes of elephant deaths (PIKE) and pop-ulation performance, an approach broadly applicable to otherspecies with similar data. Initially, we used carcass survey data topartition the causes (illegal killing or natural) of known mortalityamong individually monitored elephants inhabiting the SamburuNational Reserves complex (20). Although offering robust metricsfor a local, intensively studied population, it was critical to expandour approach to estimate illegal killing levels at the country, re-gional, and species scales to assess the species’ status. Therefore,we modified our approach to infer trends on the broader carcassdata collected through the CITES MIKE program (19). At thiscontinental scale, we applied and compared results from twoparallel approaches representing alternative monitoring struc-tures and related assumptions: (i) intense monitoring of a fewsites versus (ii) coarse monitoring across many sites.
Significance
Illegal harvest for commercial trade has recently surged tobecome a major threat to some of the world’s most endan-gered and charismatic species. Unfortunately, the cryptic na-ture of illegal killing makes estimation of rates and impactsdifficult. Applying a model based on field census of car-casses, to our knowledge we provide the first detailed as-sessment of African elephant illegal killing rates at population,regional, and continental scales. Illegal harvest for commercialtrade in ivory has recently surged, coinciding with increases inillegal ivory seizures and black market ivory prices. As a result,the species declined over the past 4 y, during which tens ofthousands of elephants have been killed annually across thecontinent. Solutions to this crisis require global action.
Author contributions: G.W., J.B., I.D.-H., P.O., and K.P.B. designed research; G.W., J.M.N.,J.B., and I.D.-H. performed research; G.W., J.B., P.O., and K.P.B. contributed new reagents/analytic tools; G.W., J.M.N., J.B., and K.P.B. analyzed data; and G.W. wrote the paper.
The authors declare no conflict of interest.
This article is a PNAS Direct Submission.
Freely available online through the PNAS open access option.1To whom correspondence should be addressed. Email: [email protected].
This article contains supporting information online at www.pnas.org/lookup/suppl/doi:10.1073/pnas.1403984111/-/DCSupplemental.
www.pnas.org/cgi/doi/10.1073/pnas.1403984111 PNAS | September 9, 2014 | vol. 111 | no. 36 | 13117–13121
ECOLO
GY
SUST
AINABILITY
SCIENCE

ResultsWe partitioned known mortality in the intensively monitoredSamburu elephant population (20) between natural and illegalsources using our analytical framework based on carcass surveydata. The population was subjected to unsustainable rates of il-legal killing between 2009 and 2012, escalating from a mean of0.6% (SD = 0.4%) between 1998 and 2008 to a high of 8% in2011 (Fig. 1). Annual illegal killing of elephants in the Samburupopulation during 2009 to 2012 exceeded those of all previousyears of monitoring (1998–2008) with an estimated aggregate of20.8% of the known elephants illegally killed during that 4-yperiod. Preliminary numbers from 2013 indicated the annual rateof illegal offtake remained concerning at around 3.7%, althoughbelow the peak levels experienced in 2011. Illegal killing rateswere strongly correlated with black market ivory prices in theSamburu ecosystem (Pearson’s r = 0.85, P = 0.015; Fig. 1A) andmirrored increases in raw ivory seizures in or from Kenya (21)and modeled continental seizure rates (22), both of whichdemonstrate increased trafficking to China (Fig. 1B). As a resultof this illegal killing, the population currently suffers from fewprime-aged males, strongly skewed sex ratios, and social dis-ruption in the form of some collapsed families and increasednumbers of orphans (immature elephants without a parent) (23).
We implemented two approaches representing alternative mon-itoring frameworks to model illegal killing and population trendsat broader scales. The first approach (hereafter referred to as theempirical approach) analyzed carcass data from the 12 MIKEsite populations with carcass samples allowing robust inference(averaging ≥20 carcasses annually; see SI Materials and Methodsfor details of sensitivity analyses used to define this threshold).The second approach (hereafter referred to as the model ap-proach) used a quasibinomial predictive model (18, 19) based onsite, region, and global predictors to estimate site-specific PIKEand the variance around these estimates for 306 elephant pop-ulations across the continent (see SI Materials and Methodsfor model details; the populations of West Africa, representing∼2% of the species, were excluded). Site-specific annual PIKE(empirical and modeled) were fed into a demographic model,assuming an average annual population increase of 4.2% in theabsence of illegal killing, to estimate trends (Materials andMethods) which were compiled into regional and continentalestimates (note: 5 East, 4 Southern, and 3 Central Africansites comprised the 12 used in the empirical model). In aggre-gate, results demonstrated an overharvest-driven decline inAfrican elephants likely began in 2010 (Table 1). Illegal killingrates were estimated to average ∼6.8% between 2010 and 2012,equating to an average of ∼33,630 elephants killed per y basedon current estimates of the species total (24) (Table 1). The threeregions of Africa (Central, East, and Southern) demonstrateddifferent trends that were captured by both approaches. Illegalkilling was most pervasive in the populations of Central Africa(Figs. 2 and 3), where results supported probable annual declineseach year since at least 2007 (Fig. 2A), with the empirical ap-proach estimating a 63.7% decline between 2002 and 2012 on parwith the 62% estimated from dung surveys over a similar period(12). Our results suggest savanna populations in East (Fig. 2B)and Southern Africa (Fig. 2C) were relatively stable or growingbetween 2002 and 2009, after which they started declining.Results for Southern Africa varied between approaches, withempirical results suggesting decline during all 3 y, and mod-eled results suggesting stability in 2010 and decline in 2011–2012(Table 1). At the site level, 42% of the 12 populations analyzedempirically and 60% of the 306 populations modeled were proj-ected to have declined over the 10-y period (Fig. 2D). Themajority of declines occurred in the last few years, with 75% and77% of sites respectively estimated to have declined after 2009(Fig. 3), although site-specific results differed between the twomethods. Preliminary data from 2013 suggests regional andcontinental offtake levels were slightly lower to those reportedfor 2012, but still unsustainable.As a verification exercise, we directly compared our PIKE
model to intersurvey mean estimates of population change in 19sites (39 survey periods) for which repeated, population surveys(aerial counts, spoor surveys, or individual-based monitoring)were conducted during the MIKE program period (Fig. 4).Survey and PIKE-based modeling estimates of annual pop-ulation trends were correlated (empirical results: Pearson’s r =0.675, P < 0.001; model results: Pearson’s r = 0.372, P = 0.024),with the empirical-based result averaging 0.33% slower growth(SI Materials and Methods). Simulated confidence intervals ofour model relating PIKE to mean population change largelycontained calculated trends (Fig. 4).
DiscussionOur analysis demonstrates the heavy toll illegal ivory trade istaking on African elephants, and suggests current offtake exceedsthe intrinsic growth capacity of the species. It is important torecognize that the number of elephants being illegally killedannually is based on current species estimates, which are un-certain (24). Should fewer elephants be on the continent thanestimated, the numbers illegally killed would be less than that
Fig. 1. (A) Estimated natural (gray line) and illegal killing (red line) rates(with 95% confidence interval) contrasted with local prices of ivory (blackline) to the poachers in the Laikipia/Samburu ecosystem. (B) Mass of annualivory seizures in Kenya (no data in 2005–2006) and the proportion of sei-zures destined for China (including Hong Kong). Data is represented by ablack or gray “×.”
13118 | www.pnas.org/cgi/doi/10.1073/pnas.1403984111 Wittemyer et al.
reported (although undoubtedly still in the tens of thousandsper y). As such, we emphasize estimates of the illegal killing rateand resulting trend in elephant numbers, rather than the num-bers themselves (Fig. 3).Application of carcass monitoring to estimate population
change provides a powerful framework but relies on a number ofassumptions regardless of whether the analyses relied on theempirical or model approach (18), most substantively that mor-tality events and the detection probability of carcasses were
independent of the cause of death. Although a pilot study onfour MIKE sites found these assumptions were met and PIKEaccurately represented mortality patterns in well-monitored sites(25), assessments across all MIKE sites were not possible. Assuch, unidentifiable bias in the underlying data could skew results(see SI Text for discussion). Our implementation of the PIKE-based estimates of illegal killing rates was likely conservativeon account of (i) relying on the best sampled populations and,therefore, those experiencing relatively intensive patrolling
Table 1. Regional and total estimates of population change, illegal killing rates, and number of elephants poachedfor 2010–2012
Empirical method, 12 sites Model-based method, 306 sites
Region 2010 2011 2012 2010 2011 2012
AfricaPopulation growth rate 0.978 0.976 0.977 1.001 0.971 0.979Poaching rate 0.063 0.083 0.065 0.045 0.077 0.077No. poached 29,124 41,044 31,616 21,477 39,692 38,828
Central AfricaPopulation growth rate 0.979 0.795 0.790 0.969 0.926 0.932Poaching rate 0.142 0.248 0.235 0.100 0.160 0.177No. poached 11,228 21,148 16,148 7,871 13,649 13,607
East AfricaPopulation growth rate 0.988 0.988 0.983 0.994 0.960 0.979Poaching rate 0.054 0.054 0.059 0.042 0.074 0.059No. poached 7,187 7,763 8,695 5,645 10,631 8,515
Southern AfricaPopulation growth rate 0.978 0.974 0.980 1.019 0.996 0.996Poaching rate 0.064 0.068 0.062 0.023 0.046 0.048No. poached 15,800 18,176 16,583 5,740 12,285 13,303
The variations around these estimates are presented in SI Materials and Methods.
Fig. 2. Modeled trends in annual population changes between 2002 and 2012 for 306 elephant populations across Africa presented by region: (A) Central,(B) East, and (C) Southern Africa regions and (D) all combined. Gray lines represent the site-specific annual population changes, where the thickness rep-resents relative population size. Black lines represent the aggregate trends. Dashed lines represent the 95% confidence interval of aggregate trends.
Wittemyer et al. PNAS | September 9, 2014 | vol. 111 | no. 36 | 13119
ECOLO
GY
SUST
AINABILITY
SCIENCE
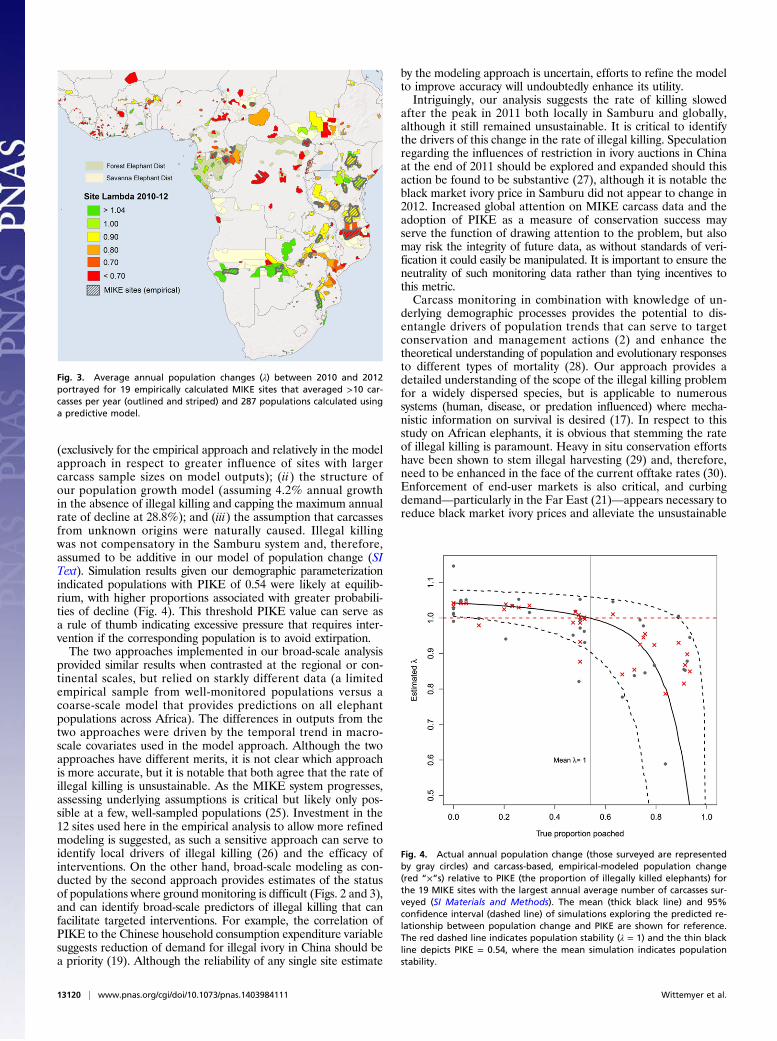
(exclusively for the empirical approach and relatively in the modelapproach in respect to greater influence of sites with largercarcass sample sizes on model outputs); (ii) the structure ofour population growth model (assuming 4.2% annual growthin the absence of illegal killing and capping the maximum annualrate of decline at 28.8%); and (iii) the assumption that carcassesfrom unknown origins were naturally caused. Illegal killingwas not compensatory in the Samburu system and, therefore,assumed to be additive in our model of population change (SIText). Simulation results given our demographic parameterizationindicated populations with PIKE of 0.54 were likely at equilib-rium, with higher proportions associated with greater probabili-ties of decline (Fig. 4). This threshold PIKE value can serve asa rule of thumb indicating excessive pressure that requires inter-vention if the corresponding population is to avoid extirpation.The two approaches implemented in our broad-scale analysis
provided similar results when contrasted at the regional or con-tinental scales, but relied on starkly different data (a limitedempirical sample from well-monitored populations versus acoarse-scale model that provides predictions on all elephantpopulations across Africa). The differences in outputs from thetwo approaches were driven by the temporal trend in macro-scale covariates used in the model approach. Although the twoapproaches have different merits, it is not clear which approachis more accurate, but it is notable that both agree that the rate ofillegal killing is unsustainable. As the MIKE system progresses,assessing underlying assumptions is critical but likely only pos-sible at a few, well-sampled populations (25). Investment in the12 sites used here in the empirical analysis to allow more refinedmodeling is suggested, as such a sensitive approach can serve toidentify local drivers of illegal killing (26) and the efficacy ofinterventions. On the other hand, broad-scale modeling as con-ducted by the second approach provides estimates of the statusof populations where ground monitoring is difficult (Figs. 2 and 3),and can identify broad-scale predictors of illegal killing that canfacilitate targeted interventions. For example, the correlation ofPIKE to the Chinese household consumption expenditure variablesuggests reduction of demand for illegal ivory in China should bea priority (19). Although the reliability of any single site estimate
by the modeling approach is uncertain, efforts to refine the modelto improve accuracy will undoubtedly enhance its utility.Intriguingly, our analysis suggests the rate of killing slowed
after the peak in 2011 both locally in Samburu and globally,although it still remained unsustainable. It is critical to identifythe drivers of this change in the rate of illegal killing. Speculationregarding the influences of restriction in ivory auctions in Chinaat the end of 2011 should be explored and expanded should thisaction be found to be substantive (27), although it is notable theblack market ivory price in Samburu did not appear to change in2012. Increased global attention on MIKE carcass data and theadoption of PIKE as a measure of conservation success mayserve the function of drawing attention to the problem, but alsomay risk the integrity of future data, as without standards of veri-fication it could easily be manipulated. It is important to ensure theneutrality of such monitoring data rather than tying incentives tothis metric.Carcass monitoring in combination with knowledge of un-
derlying demographic processes provides the potential to dis-entangle drivers of population trends that can serve to targetconservation and management actions (2) and enhance thetheoretical understanding of population and evolutionary responsesto different types of mortality (28). Our approach provides adetailed understanding of the scope of the illegal killing problemfor a widely dispersed species, but is applicable to numeroussystems (human, disease, or predation influenced) where mecha-nistic information on survival is desired (17). In respect to thisstudy on African elephants, it is obvious that stemming the rateof illegal killing is paramount. Heavy in situ conservation effortshave been shown to stem illegal harvesting (29) and, therefore,need to be enhanced in the face of the current offtake rates (30).Enforcement of end-user markets is also critical, and curbingdemand—particularly in the Far East (21)—appears necessary toreduce black market ivory prices and alleviate the unsustainable
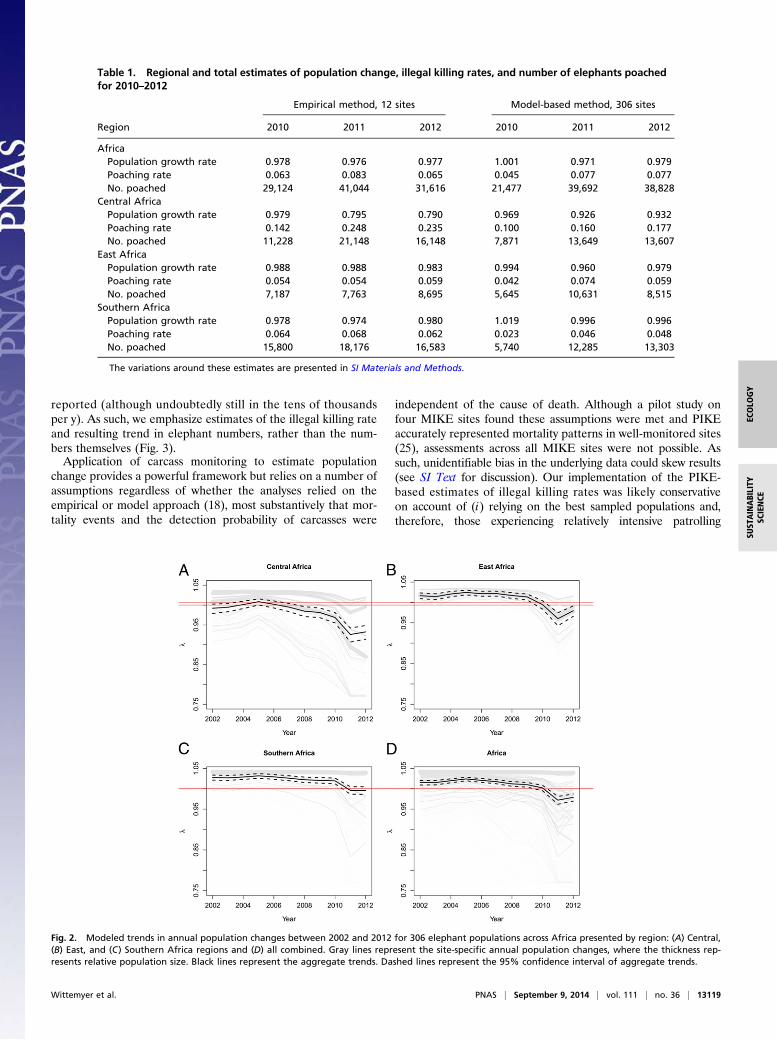
Fig. 3. Average annual population changes (λ) between 2010 and 2012portrayed for 19 empirically calculated MIKE sites that averaged >10 car-casses per year (outlined and striped) and 287 populations calculated usinga predictive model.
Fig. 4. Actual annual population change (those surveyed are representedby gray circles) and carcass-based, empirical-modeled population change(red “×”s) relative to PIKE (the proportion of illegally killed elephants) forthe 19 MIKE sites with the largest annual average number of carcasses sur-veyed (SI Materials and Methods). The mean (thick black line) and 95%confidence interval (dashed line) of simulations exploring the predicted re-lationship between population change and PIKE are shown for reference.The red dashed line indicates population stability (λ = 1) and the thin blackline depicts PIKE = 0.54, where the mean simulation indicates populationstability.
13120 | www.pnas.org/cgi/doi/10.1073/pnas.1403984111 Wittemyer et al.

pressure from illegal killing on wild populations (31). Ultimately,interventions are needed to tackle all levels of the supply chain(32) and the underlying factors contributing to increasing levelsof illegal offtake (33).
Materials and MethodsWhereas total annual mortality rates (mt) (and number of elephants thatdied) for the intensively studied Samburu population were known (20), allcarcasses were not found, so the illegal killing (mp) and natural mortality(mn) rates were not known. Monte Carlo simulation was used to adjustannual mt by the binomial sample proportion (pp = cp=ct) and variance(varp = ½ppð1−ppÞ=ct �) of carcasses illegally killed (cp), where ct is the annualtotal number of carcasses found, to estimate annual illegal killing rates asmp =mtpp (see details in SI Materials and Methods). Further, uncertaintyintroduced by carcasses for which the cause of demise was unknown wasintegrated into this estimate (see SI Materials and Methods for formalmodel structure).
Building on this approach to offer insight at broader scales, we combinedPIKE data (empirical or model derived) with a compilation of publishednatural mortality rates to estimate illegal killing rates and population trends(20). Specifically, we calculated a distribution for illegal killing rates (mp) persite as a function of the natural mortality rate (mn): mp = ½pp=ð1−ppÞ�mn,where pp (PIKE) was calculated empirically from carcass survey data at MIKEsites for the empirical approach or derived from model outputs for themodel approach. The distribution of plausible annual natural mortality (mn)was compiled from published metrics (SI Materials and Methods). Annualintrinsic population growth rates and associated variance were then mod-eled for each MIKE site as λ= 1−mp −mn +R, using a Monte Carlo simulationframework where the distribution of natality (R) was compiled from
published metrics (SI Materials and Methods). Population size and numberof illegally killed elephants were then estimated through forward or back-ward calculation using the most recent population estimate, and amal-gamated to obtain regional and continental metrics (see SI Materials andMethods for formal model structure and description).
We used simulations to assess the performance of the above methods forestimating the poaching rate under different levels of poaching and carcasssamples (detailed in SI Materials and Methods) and to estimate thresholdlevels where pp indicates population decline (Fig. 4). Simulation resultssuggested sites with fewer than 20 carcasses surveyed per year providedrelatively weak precision on estimates of pp, undermining the efficacy of ourapproach to estimate illegal killing rates. This was used as the cutoff forsite inclusion in the empirical approach. We also assessed the sensitivity ofmetrics derived empirically in relation to this cutoff, finding estimates ofillegal killing rate and population decline increased when increasing thenumber of sites in the empirical approach by using 10 carcasses per year asthe cutoff (SI Materials and Methods), results of which are portrayed in Fig. 3.Further assessment and discussion of assumptions are provided in SI Materialsand Methods.
ACKNOWLEDGMENTS. We thank the African Elephant Specialist Group forelephant population data; the Convention on International Trade in Endan-gered Species (CITES) Monitoring the Illegal Killing of Elephants (MIKE) pro-gram for the geographic boundaries of the MIKE sites; and the range states,site managers, rangers, and researchers who collected and shared their datathrough the MIKE program. This work was supported by Save the Elephants(G.W. and I.D.-H.), the Liz Claiborne and Art Ortenberg Foundation (G.W. andI.D.-H.), the European Union through the CITES MIKE program (K.P.B. and J.B.),and Colorado State University.
1. Fa JE, Peres CA, Meeuwig J (2002) Bushmeat exploitation in tropical forests: An in-tercontinental comparison. Conserv Biol 16(1):232–237.
2. Milner-Gulland EJ, Bennett EL (2003) Wild meat: The bigger picture. Trends Ecol Evol18(7):351–357.
3. Vié J-C, Hilton-Taylor C, Stuart SN, eds (2009) Wildlife in a Changing World–AnAnalysis of the 2008 IUCN Red List of Threatened Species (International Union forConservation of Nature, Gland, Switzerland).
4. Effiom EO, Nunez-Iturri G, Smith HG, Ottosson U, Olsson O (2013) Bushmeat huntingchanges regeneration of African rainforests. Proc Royal Soc B-Biol Sci 280(1759):20130246.
5. Estes JA, et al. (2011) Trophic downgrading of planet Earth. Science 333(6040):301–306.
6. Karesh WB, Cook RA, Bennett EL, Newcomb J (2005) Wildlife trade and global diseaseemergence. Emerg Infect Dis 11(7):1000–1002.
7. Gavin MC, Solomon JN, Blank SG (2010) Measuring and monitoring illegal use ofnatural resources. Conserv Biol 24(1):89–100.
8. Wyler LS, Sheikh PA (2008) International Illegal Trade in Wildlife: Threats and U.S.Policy (Congressional Research Service, Damascus, MD), Congressional Research Ser-vice Report for Congress Order Code RL34395.
9. Bouché P, et al. (2011) Will elephants soon disappear from West African savannahs?PLoS ONE 6(6):e20619.
10. Dinerstein E, et al. (2007) The fate of wild tigers. Bioscience 57(6):508–514.11. Ferreira SM, Botha JM, Emmett MC (2012) Anthropogenic influences on conservation
values of white rhinoceros. PLoS ONE 7(9):e45989.12. Maisels F, et al. (2013) Devastating decline of forest elephants in central Africa. PLoS
ONE 8(3):e59469.13. Walston J, et al. (2010) Bringing the tiger back from the brink-the six percent solution.
PLoS Biol 8(9):e1000485.14. Poudyal M, Rothley K, Knowler D (2009) Ecological and economic analysis of poaching
of the greater one-horned rhinoceros (Rhinoceros unicornis) in Nepal. Ecol Appl 19(7):1693–1707.
15. Liberg O, et al. (2012) Shoot, shovel and shut up: Cryptic poaching slows restorationof a large carnivore in Europe. Proc Royal Soc B-Biol Sci 279(1730):910–915.
16. Weinbaum KZ, Brashares JS, Golden CD, Getz WM (2013) Searching for sustainability:Are assessments of wildlife harvests behind the times? Ecol Lett 16(1):99–111.
17. Milner-Gulland EJ, Akcakaya HR (2001) Sustainability indices for exploited pop-ulations. Trends Ecol Evol 16(12):686–692.
18. Burn RW, Underwood FM, Blanc J (2011) Global trends and factors associated with theillegal killing of elephants: A hierarchical bayesian analysis of carcass encounter data.PLoS ONE 6(9):e24165.
19. Convention on International Trade in Endangered Species (2013) Monitoring the il-
legal killing of elephants: A report to the standing committee of CITES. 16th Meeting
of the Conference of the Parties Bangkok (Thailand). CoP Doc 53.1. Available at www.
cites.org/eng/cop/16/doc/E-CoP16-53-01.pdf. Accessed March 1, 2014.20. Wittemyer G, Daballen D, Douglas-Hamilton I (2013) Comparative demography of an
at-risk African elephant population. PLoS ONE 8(1):e53726.21. Milliken T, Emslie RH, Talukdar B (2009) African and Asian rhinoceroses—status,
conservation and trade: A report from the IUCN Species Survival Commission African
and Asian Rhino Specialist Groups and TRAFFIC to the CITES Secretariat pursuant to
Resolution Conf 9.14 (Rev CoP14) and Decision 14.89, CoP 15 Doc 45.1 (Rev1) Annex.
Available at www.cites.org/eng/cop/15/doc/E15-45-01A.pdf. Accessed March 1, 2014.22. Underwood FM, Burn RW, Milliken T (2013) Dissecting the illegal ivory trade: An
analysis of ivory seizures data. PLoS ONE 8(10):e76539.23. Wittemyer G, Daballen D, Douglas-Hamilton I (2011) Poaching policy: Rising ivory
prices threaten elephants. Nature 476(7360):282–283.24. Blanc JJ, et al. (2007) African Elephant Status Report 2007: An Update from the
African Elephant Database (International Union for Conservation of Nature, Gland,
Switzerland).25. Jachmann H (2012) Pilot study to validate PIKE-based inferences at site level. Pachy-
derm (52):72–87.26. Wittemyer G (2011) Effects of economic downturns on mortality of wild African el-
ephants. Conserv Biol 25(5):1002–1009.27. Gao Y (2014) Policy Process of International Ivory Trade, Fieldwork in Kenya, Tanzania,
Botswana, Hong Kong, Mainland China, and United States. MSc thesis (Yale University,
New Haven, Connecticut).28. Milner JM, Nilsen EB, Andreassen HP (2007) Demographic side effects of selective
hunting in ungulates and carnivores. Conserv Biol 21(1):36–47.29. Hilborn R, et al. (2006) Effective enforcement in a conservation area. Science
314(5803):1266.30. Bennett EL (2011) Another inconvenient truth: The failure of enforcement systems to
save charismatic species. Oryx 45(4):476–479.31. Rosen GE, Smith KF (2010) Summarizing the evidence on the international trade in
illegal wildlife. EcoHealth 7(1):24–32.32. Keane A, Jones JPG, Edwards-Jones G, Milner-Gulland EJ (2008) The sleeping police-
man: Understanding issues of enforcement and compliance in conservation. Anim
Conserv 11(2):75–82.33. Challender DWS, MacMillan DC (2014) Poaching is more than an enforcement
problem. Conserv Lett, 10.1111/conl.12082.
Wittemyer et al. PNAS | September 9, 2014 | vol. 111 | no. 36 | 13121
ECOLO
GY
SUST
AINABILITY
SCIENCE

Supporting InformationWittemyer et al. 10.1073/pnas.1403984111SI Materials and MethodsIndividual-Based Monitoring Data and Calculation of Mortality inSamburu. Individually based demographic data on the Samburuelephant population were collected through an individual iden-tification study of ∼1,000 elephants inhabiting the semiarid,220-km2 Samburu and Buffalo Springs National Reserves complexin northern Kenya (0.3–0.8°N, 37–38°E) (1, 2). Annual mortalityand natality data used in this analysis were collected duringweekly travel along five established transects (each of which was∼20 km long) from January 1998 through December 2012 fromresident (3) elephants in the national reserves (4). Outside theprotected areas, the elephants are at risk for illegal killing (5), andwounded animals enter the reserves and die (poaching in the parkwas rare, occurring for the first time in 2011 during the 15-y study).Carcasses found during daily monitoring within the reserves and viainvestigation of reports of dead elephants in the wider ecosystemwere used in analyses of the impact of poaching on the knownelephant population. For carcasses found outside the reserves,only those of known individuals were used in analysis (1).
Inferring Natural and Illegally Caused Mortality from Carcass Counts.During years when no illegally killed carcasses or carcasses fromunknown fates (e.g., those that were decomposed beyond rec-ognition) were observed in the Samburu study area, the pro-portion and variance of illegal killing were assumed to equal zero.During years when illegally killed carcasses were found, we as-sumed the number of poached elephants found was a binomialrandom variable (the number of illegally killed elephants arisesfrom an underlying probability of being illegally killed, givena certain number of dead elephants). As such, for years whenillegally killed carcasses were found and the cause of death of allcarcasses could be determined (i.e., illegally killed or naturalmortality), the estimated proportion illegally killed and corre-sponding variance (varp) was calculated as the binomial sampleproportion and variance from the observed carcasses (as statedin Materials and Methods):
pp =cpct
and varp =pp�1− pp
�
ct: [S1]
Where carcasses originated from unknown causes of mortality,uncertainty in the proportion illegally killed and its varianceare inflated. We accounted for this uncertainty by using MonteCarlo simulation to integrate across the uncertainty of the fateof the unknown carcasses. We assumed the probability of an an-imal being illegally killed when its cause of death is unknown isgiven by the true proportion and variance in the population, i.e., itis binomially distributed with parameters cu(the total number ofcarcasses of unknown fate) and p= pestp(the underlying probabil-ity of being illegally killed); where pestp was drawn from a betadistribution with shape parameters calculated via momentmatching using the sample proportion and variance from theidentifiable carcasses. The estimation procedure is as follows:
pp =cp + cpunk
ct
cpunk∼Binomial�cu; pestp
�
pestp∼Betaðα; βÞ
α=μ2 − μ3 − μσ2
σ2
β=μ− 2μ2 + μ3 − σ2 + μσ2
σ2
μ=cp
ctknown
σ2 =μð1− μÞctknown
[S2]
where cpunk is the estimated number of carcasses of unknown fatethat were illegally killed, and ctknown is the total number of car-casses for which the cause of death could be definitively deter-mined as poaching or natural mortality.The above method accounts for uncertainty in the underlying
probability of being poached that gives rise to the observedproportion of identifiable carcasses that were illegally killed (asthe binomial in Eq. S1), and for uncertainty arising from theunidentifiable carcasses, although still allowing the identifiablecarcasses to inform the unidentifiable carcasses (via momentmatching of the beta distribution). We repeated this process10,000 times to derive the mean and variance of the proportionof animals illegally killed. Expanding the model to account forage structure among carcasses would introduce uncertainty and,therefore, was not attempted.
Modeling Continental Levels of Mortality. The Monte Carlosimulation approach outlined for partitioning known mortalityinto illegal or natural rates was adjusted to model mortalityrates in populations for which carcass data were being col-lected as part of the Monitoring the Illegal Killing of Elephants(MIKE) program (MIKE sites) or non-MIKE populations forwhich the proportion of illegally killed elephants (PIKE) wasestimated using a predictive model (6, 7). For each MIKE site,the proportion of illegally killed carcasses and variance wasestimated using carcass counts, as described in Inferring Naturaland Illegally Caused Mortality from Carcass Counts. For non-MIKE sites, this proportion and variance were derived directlyfrom the predictive model output. Because all unknown car-casses were assigned as natural in MIKE sites, the correctionfor unknown carcasses was not implemented (potential deflationof PIKE as a result is discussed below).To estimate the illegal killing rate, for each iteration of the
Monte Carlo simulation the known (i.e., the empirical ap-proach) or modeled (i.e., the model approach) proportion ofillegally killed carcasses at each site was multiplied by a singlerandom draw from a moment matched beta distribution rep-resenting an annual natural mortality of 3.2% (variance =0.015%) derived from the seven published metrics on thespecies (1) (Table S1). The deterministic intrinsic growth rate(λ) was estimated by combining derived mortality with natalitydrawn from a beta distribution representing the published, 4-yaverage natality of the species (7.4%, SD = 1.4%; where the 4-yaverage spans the average intercalf interval for the species andmitigates the high degree of stochasticity in annual rates of thisparameter) (8):
Wittemyer et al. www.pnas.org/cgi/content/short/1403984111 1 of 8

λ= 1−mp −mn +R
mp=pp
1− pp×mn
mn∼Betaðαn; βnÞ
αn=μ2n − μ3n − μnσ
2n
σ2n
βn=μn − 2μ2n + μ3n − σ2n + μnσ
2n
σ2n
R∼BetaðαR; βRÞ
αR=μ2R − μ3R − μRσ
2R
σ2R
βR=μR − 2μ2R + μ3R − σ2R + μRσ
2R
σ2R: [S3]
where μn and σ2n are the sample proportion and variance ofnatural mortalities, pp is the proportion of illegally killed ele-phants (PIKE, where the mean and variance is calculated foreach site using carcass counts as described in Inferring Naturaland Illegally Caused Mortality from Carcass Counts or pulled froma site base model of PIKE) and R is the 4-y running average ofrecruitment with μR and σ2R representing the mean and varianceof biologically plausible natality. Values of lambda were esti-mated using Monte Carlo simulation over 30,000 iterations, fromwhich the median and interquartile ranges for the annual pop-ulation growth rate were derived. Runs for which PIKE exceeded0.9, the combined mortality from natural causes and poaching (mp +mn) equaled or exceeded 1, or where λ < 0, were discarded andvalues were discarded to ensure the biological integrity of thesimulation (see discussion of assumptions in SI Text). The distri-bution of lambda then was used to estimate the median andinterquartile population size and number of elephants illegallykilled for each year, using the latest population count for eachpopulation (African Elephant Specialist Group 2013) and ex-trapolating forward or backward. In this procedure the popula-tion estimate was assumed to have been collected at the end ofthe year coinciding with the carcass figure totals for that year(i.e., Nt+1 =Nt × λt+1). In the absence of illegal killing (i.e., 0 ille-gally killed carcasses found), our model estimated an averagepopulation increase of 4.2% per y.
Assessment of Methods Using Simulated Data. The outlined meth-ods are potentially sensitive to the sample size of carcasses found(sampled) and to the different underlying levels of poaching.Assuming a theoretical sample of 1,000 dead elephants, we ex-amined the sensitivity of our estimated poaching rate to (i) thetotal number of simulated carcasses found and (ii) the pro-portion of simulated carcasses poached.To assess the sensitivity to the sample size of carcasses found,
we randomly assigned each of the 1,000 elephants as poached ornaturally dead with a probability of 0.5. We set the naturalmortality rate of 0.032 (thus the poaching rate was also 0.032),and simulated finding different numbers of carcasses (350, 300,250, 200, 150, 100, 90, 80, 70, 60, 50, 40, 30, 20, 10, and 5 carcasses;these values represent the full range of annual values for carcassesfound at MIKE sites across the continent throughout the studyperiod). We used the Monte Carlo simulation procedure de-
scribed above with no unknowns to estimate the proportion ofpoached elephants. We repeated this process 10,000 times andexamined the mean and 95% quantiles of the resulting estimatesof the proportion of animals poached relative to the number ofcarcasses sampled. The variation in the estimated poaching ratedeclines as the number of carcasses increases, with the most rapiddecrease occurring around 20 carcasses (Fig. S1).To examine the sensitivity of our model to the underlying
poaching rate, we varied the probability of a carcass being poachedbetween 0 and 1, keeping the natural mortality rate fixed at 0.032(thus the poaching rate varied with the proportion of poachedanimals in the overall population). We then randomly sampled 20carcasses (our cutoff for inclusion in the empirical model), andestimated the poaching rate using the Monte Carlo simulationdescribed above. We repeated this process 10,000 times, andexamined the mean and 95% quantiles of the resulting estimatesof the proportion of animals poached relative to the true un-derlying proportion of poached animals (Fig. S2). Our modelclosely reflected the true poaching rate.Lastly, because our empirical results were based on the esti-
mation of lambda, we examined the influence of the proportionof illegally killed elephants in the carcass sample on lambda.We again simulated a population of 1,000 carcasses and set thenumber of found carcasses at 20. We varied the true underlyingproportion of poached elephants in the sample of 1,000 carcassesfrom 0 to 1 and estimated lambda as for the empirical analysisabove. We calculated the mean and 95% quantiles of lambdafollowing the described Monte Carlo simulation and examinedwhere these values equaled 0 change in the population. Based onour model, populations for which PIKE > 0.54 (i.e., 5.4 of 10carcasses found were poached) are likely declining (Fig. 4). Dueto the high degree of variability in natural mortality and natality,we were 95% confident that populations with PIKE < 0.08 wereincreasing and populations with PIKE > 0.88 were decreasing.
Estimating Population and Illegal Killing Trends Across MIKE Sites.MIKE data have been collected across 50 sites in Africa (45officially recognized). However, the reported simulation resultsindicated that the number of carcasses surveyed at most of thesesites precluded robust inference at the site level (i.e., most had lessthan 20 carcasses found per y). As a result, we compared twoapproaches tomodel population status based on the proportion ofmortality caused by illegal killing as described in the Results andMaterials and Methods. The first simply restricted sites used inanalyses to those with adequate carcass samples for robust site-level inference (i.e., the empirical approach). The second usedall carcass monitoring data to model PIKE across the continentusing site, regional, and global covariates that predicted PIKEamong known sites (i.e., the model approach) (7). For theempirical approach, results were calculated for populationsaveraging 20 or more carcasses per y during the monitoringperiod (n = 12; Table S2), the cutoff indicating the major re-duction in variance introduced by sampling defined throughsimulations (Fig. S1). For the model approach, we applied thepublished quasibinomial generalized linear model (7) to derivepredictions of PIKE (and their variances) for 306 surveyed sitesin Africa using covariates available for all sites of infant mortalityrate (9), farming (10), site area (log transformed), TransparencyInternational Corruption Perception Index (11), World Bank’sChina household consumption expenditure index (12), and the3-y running average mass of large ivory seizures (7). Model se-lection was used to derive the best predictive model as detailedelsewhere (6, 7).As a result of our population estimation procedure (i.e.,
poaching rates calculated as a function of relative cause of deathfrom sampled carcasses and natural rates), years with illegallykilled carcass proportions >0.968 resulted in estimates of totalpopulation extermination on account of the assumption that
Wittemyer et al. www.pnas.org/cgi/content/short/1403984111 2 of 8

natural mortality averaged 3.2% per y (maximum PIKE underthis assumption can only reach 0.968). The proportion of ille-gally killed elephant values >0.968 were predominantly foundin forested populations and likely result from biases in carcasssampling in high-density vegetative areas (see discussion in SIText). As a result, excessively high PIKE values were truncatedas mentioned previously, where Monte Carlo runs for whichPIKE values >0.9 were discarded and redrawn. This effectivelycapped maximum annual mortality at 28.8% for each population.Among the 12 sites used in the empirical approach, truncationwas applied almost exclusively to forested sites in central Africa,with 13% of the total site years being over this threshold amongthis sample. Across all 50 sites used in the model approach, 23%of site years were truncated.The poaching rate and lambda could not be estimated for years
in which no carcasses were reported. Among the 12 sites thataveraged 20 or greater carcasses per y, three (Niassa, Mozambique;Odzala, Republic of Congo; and Selous, Tanzania) lacked carcassdata during 1 or 2 successive years (7). During years that lackedcarcass data, we assumed no population change (i.e., λ = 1).Population growth rates (λ) and illegal killing rates were
amalgamated to derive regional (Central, East, and SouthernAfrica) and continental rates. For the empirical approach, changesacross the sum of the estimated annual site population sizes perregion were used to derive regional growth rates, where outputsfrom each Monte Carlo run were combined to derive the ratedistributions. Similarly, the illegal killing rates were amalgam-ated across the 12 sites by summing the estimated number ofpoached elephants (illegal killing rate multiplied by estimatedpopulation size) across each region and dividing by corre-sponding regional population sizes. Regional rates were similarlyadjusted to estimate continental rates. As such, the empirical-based regional and continental trends are only representativeof those populations for which adequate, unbiased data wereavailable. For the model-based analysis, the rates of changes forthe regions and continent were calculated directly using themodel output for 306 sites for which estimates of the elephantpopulation were available. Because West Africa was not repre-sented in the empirical approach (due to small carcass sam-ples), we present estimates for the combined Central, East, andSouthern Africa regions which contain ∼98% of extant elephants(Table 1 and Table S3).We also derived estimates of regional and continental poaching
rates, population trends, and numbers of elephants killed using 19populations for which ≥10 carcasses were found on average per y(22 total sites met this criteria, but 3 were deemed unreliable andexcluded on account of having PIKE = 1 in ≥50% of surveyedyears). This provides the advantage of increasing the number ofsites used for regional estimates, but comes at the cost of re-duced precision in estimates (Fig. S1). Illegal killing rates de-rived from these 19 sites exceeded those from the other twoapproaches, indicating greater population declines than thosereported in Results (Table S4).
Comparing Carcass-Modeled to Census-Estimated Population Change.Of the 22 sites that averaged 10 or more carcasses per y, 19 weresubject to population surveys (aerial-, dung-, or individual-basedcensus) at least twice over the 11-y period during which MIKEdata were collected (13). This allowed direct comparison be-tween survey-based and our PIKE-based modeled estimates ofpopulation change. Although variation in population estimatescan be large depending on the census approach, we focused onchanges in mean estimates between consecutive censuses. An-nual population changes experienced between successive countswere calculated and compared with those estimated during thesame period by our Monte Carlo simulation approach (Fig. 4). Itis notable that 95% confidence envelopes of estimated lambdaencapsulated nearly all census-based calculations of mean an-
nual population changes, indicating our underlying model gen-erally captures the variation manifested in natural populations.Including all 19 populations (comprising 39 estimates of populationchange between censuses), modeled and surveyed estimates ofannual changes in population sizes were significantly correlated(Spearman’s ρ = 0.685, P < 0.001), with the PIKE-based methodestimating an average rate of growth 0.33% slower than thatcalculated from sequential surveys (Fig. S3).
SI TextIt is critical to summarize the assumptions underlying the presentedresults and discuss the approaches used to assess or minimize theirinfluence where possible. We first summarize the assumptions re-garding the demographic parameterization of our model:
i) The baseline mortality and natality rates derived from thepublished literature (1) that were used in our models representconditions in relatively well protected savanna populations.All but one of the seven populations from which parameterswere derived are recovering or expanding populations (mostlikely experiencing density-independent conditions), in con-trast to populations demonstrating compensatory reductionsin growth related to age structure or density (1). Therefore,the assumed average annual growth rate of 4.2% in theabsence of poaching, which likely reflects healthy growthfor this species. Published rates did not differ between re-gion (Southern versus East Africa), as such we simply usedthe average across all studies (Table S1). Unfortunately, nodemographic parameters have been published for forest el-ephants, but it is known that reproductive rates are muchslower in the Dzanga forest system than those used in ourmodel (14). As such, this rate of growth is likely overesti-mated for forest systems that are subject to the highest PIKEamong MIKE sites (potentially resulting in greater declinesthan those estimated here).
ii) We did not incorporate the potential effect of density de-pendence in our model. This was both practical, as there isno logical way to determine carrying capacity for the myriadof sites in different ecosystems represented in our analysis,and ensured our model provided a conservative scenario forpopulation decline.
iii) We also did not adjust underlying demographic data to ac-count for possible influences of illegal killing (e.g., compen-satory influences reducing natural mortality or reductions infecundity). No evidence for a compensatory relationship be-tween natural mortality and illegal killing rates was found inthe Samburu study system, with a positive correlation be-tween annual rates of these two types of mortality (rs =0.581, P = 0.023; Fig. S4).
In addition to these demographic assumptions, our model isdependent on the accuracy of the underlying carcass data. Wehave attempted to limit the influence of stochastic variation in-duced by (i) small sample size and (ii) annual variability innatural mortality rates on the empirical approach by excludingsites averaging less than 20 carcasses per y and smoothing carcasscounts (averaging PIKE) through amalgamation over a 3-y pe-riod. The latter effectively mitigates against stochastic variation innatural mortality (years with very little natural death) that caninduce exceptionally high PIKE (as discussed previously in re-lation to truncation). For our model-based approach, we in-corporate uncertainty due to small carcass samples in thequasibinomial generalized linear model in the response vari-able. Other potential sources of bias that may affect our re-sults include the following:
i) Where carcasses were found primarily through acousticidentification of gunshots (e.g., gunshots heard and investi-gated leading to discovery of a poached carcass) or following
Wittemyer et al. www.pnas.org/cgi/content/short/1403984111 3 of 8

poacher trails, lower detection of natural (independent ofhuman sign) carcasses will result in biasing PIKE estimateshigh. This is particularly a concern in forested sites wheresampling is notoriously difficult (15). Unfortunately, we lackany information on patrolling and carcass sampling. To ame-liorate the most egregious and likely inaccurate PIKE esti-mates, we excluded high PIKE values ≥0.9 (see previousdiscussion regarding actual number of site years truncatedper analysis). While it is possible to get high PIKE values,particularly in years with low natural mortality, truncationensured population decrease as estimated in our modelcould not exceed ∼25% during any given year.
ii) Spatial bias in patrolling relative to elephant distribution ormortality can result in misrepresentative carcass data. Un-fortunately, detailed patrol data were not available for anyMIKE sites.
iii) The model presented was not age structured because thereliability of age estimates from carcass data was not known,although it is known that survivorship is age dependent(1, 16). Using a population average mortality, as donehere, was assumed to be representative of mortality acrossthe age classes represented in the carcasses surveyed.
iv) There are factors that may lead to bias in assessment ofcarcass causes of death. Mortalities of dependents resultingfrom the illegal killing of adults (1) may not have been foundor assigned as natural (i.e., carcasses without human inducedwounds are assumed to be from natural causes), when in fact
they are a function of the illegal killing. Similarly, poisoningof elephants may be difficult to diagnose from carcassencounters. Should poisoned elephants have their tusks atthe time of detection, the carcass will likely be assignednatural causes. Elephants killed by gunshots that die lyingon the side of the gunshot wound may also be misclassifiedas resulting from natural causes. In contrast, natural deathsfrom which ivory was harvested before detection may beerroneously assigned as caused by poaching. In the MIKEsite carcass data analyzed here, carcasses assigned unknowncause of death were assumed to be from natural causes giventhat no evidence of illegal killing was found. This is the mostconservative assessment, but potentially leads to underesti-mation of true illegal killing rates.
Although we have attempted to explicitly state and control forthe assumptions and potential sources of bias influencing thisanalysis, the results presented in this paper represent our bestestimate of the levels and trends in poaching and resultingpopulation changes. Unfortunately, we could not assess the prob-ability of any of these sources of bias in the data compiled by theMIKE program (7), a function of the large scale of this monitoringprogram and the importance of its implementation in areas withlittle research or forensic capacity. Our comparison between mod-eled and survey-derived trends provides some validation (Fig. 4).Future efforts should expand metadata related to each carcass re-cord, to allow for more detailed inspection of these assumptions.
1. Wittemyer G, Daballen D, Douglas-Hamilton I (2013) Comparative demography of an
at-risk African elephant population. PLoS ONE 8(1):e53726.2. Wittemyer G, Daballen DK, Rasmussen HB, Kahindi O, Douglas-Hamilton I (2005)
Demographic Status of elephants in the Samburu and Buffalo Springs National
Reserves, Kenya. Afr J Ecol 43(1):44–47.3. Wittemyer G (2001) The elephant population of Samburu and Buffalo Springs
National Reserves, Kenya. Afr J Ecol 39(4):357–365.4. Wittemyer G, Douglas-Hamilton I, Getz WM (2005) The socioecology of elephants:
Analysis of the processes creating multitiered social structures. Anim Behav 69(6):
1357–1371.5. Kahindi O, et al. (2010) Employing participatory surveys to monitor the illegal killing
of elephants across diverse land uses in Laikipia-Samburu, Kenya. Afr J Ecol 48(4):
972–983.6. Burn RW, Underwood FM, Blanc J (2011) Global trends and factors associated with the
illegal killing of elephants: A hierarchical bayesian analysis of carcass encounter data.
PLoS ONE 6(9):e24165.7. Convention on International Trade in Endangered Species (2013) Monitoring the il-
legal killing of elephants: A report to the standing comittee of CITES. 16th Meeting of
the Conference of the Parties Bangkok (Thailand). CoP Doc. 53.1. Available at www.
cites.org/eng/cop/16/doc/E-CoP16-53-01.pdf. Accessed March 1, 2014.
8. Wittemyer G, Rasmussen HB, Douglas-Hamilton I (2007) Breeding phenology inrelation to NDVI variability in free-ranging African elephant. Ecography 30(1):42–50.
9. Center for International Earth Science Information Network (2005) Poverty MappingProject: Global Subnational Infant Mortality Rates (National Aeronautics and SpaceAdministration Socioeconomic Data and Applications Center, Palisades, NY).
10. Food and Agriculture Organization of the United Nations GeoNetwork (2013)Occurrence of Cropland (FGGD). Available at www.fao.org/geonetwork/srv/en/metadata.show?id=14067. Accessed March 1, 2014.
11. International T (2012) Corruption Perceptions Index. Available at www.transparency.org. Accessed March 1, 2014.
12. World Bank (2013) Household Final Consumption Expenditure (World Bank, Wash-ington, D.C.).
13. Blanc JJ, et al. (2007) African Elephant Status Report 2007: An Update from theAfrican Elephant Database (International Union for Conservation of Nature, Gland,Switzerland).
14. Turkalo AK, Wrege PH, Wittemyer G (2013) Long-term monitoring of Dzanga Baiforest elephants: Forest clearing use patterns. PLoS ONE 8(12):e85154.
15. Maisels F, et al. (2013) Devastating decline of forest elephants in central Africa. PLoSONE 8(3):e59469.
16. Moss CJ, Croze H, Lee PC (2011) The Amboseli Elephants: A Long-Term Perspective ona Long-Lived Mammal (Univ of Chicago Press, Chicago).
Wittemyer et al. www.pnas.org/cgi/content/short/1403984111 4 of 8

Fig. S1. Simulation results portraying the mean (dash-dot line) and 2.5% and 97.5% quantiles (dashed lines) with respect to the carcass sample size, where theproportion of carcasses poached was set at 0.5 and the poaching rate set at 0.032 (red line). Labeled vertical lines cross the mean and quantile lines in relationto sample sizes of 20 and 10 carcasses.
Fig. S2. The proportion illegally killed (x axis) is translated into an estimated illegal killing rate (y axis) using the presented model. Simulation results comparedthe actual poaching rate (red solid line) with the modeled poaching rate (black line) when 20 carcasses were sampled.
Wittemyer et al. www.pnas.org/cgi/content/short/1403984111 5 of 8

Fig. S3. PIKE-based modeled and surveyed estimates of annual changes in population sizes from 19 MIKE sites were positively correlated, although PIKE-basedestimates were lower on the high end and higher on the low end of survey-based estimates due to the parameterization that bounded the population changebetween 0.75 and 1.042.
Fig. S4. Annual natural and illegal killing mortality did not demonstrate a compensatory relationship, with a positive correlation between the two in theSamburu study site over a 15 y period.
Table S1. Summary of published elephant demographic parameters on which estimates of poaching rates andpopulation changes were based
Population Mean mortality Variance mortality Mean natality Variance natality, 4 y Ref(s).
Addo National Park, South Africa 0.0157 0.00016 0.0665 0.00008 (1)Amboseli National Park, Kenya 0.0415 0.0614 (2, 3)Etosha National Park, Namibia 0.0500 0.0500 (4)Kruger National Park, South Africa 0.0320 0.0980 (5)Lake Manyara National Park, Tanzania 0.0350 0.0720 (6)Samburu National Reserve, Kenya 0.0310 0.00010 0.0724 0.00014 (7)Tarangire National Park, Tanzania 0.0186 0.00018 0.0996 0.00037 (8)
Average 0.032 0.00015 0.0743 0.00020
1. Gough KF, Kerley GIH (2006) Demography and population dynamics in the elephants Loxodonta africana of Addo Elephant National Park, South Africa: Is there evidence of densitydependent regulation? Oryx 40(4):434–441.
2. Moss CJ (2001) The demography of an African elephant (Loxodonta africana) population in Amboseli, Kenya. J Zool 255(2):145–156.3. Moss CJ, Croze H, Lee PC (2011) The Amboseli Elephants: A long-term perspective on a long-lived mammal (Univ of Chicago Press, Chicago).4. Lindeque M (1988) Population Dynamics of Elephants in Etosha National Park, Namibia (University of Stellenbosch, Stellenbosch, South Africa).5. Whyte IJ (2001) Conservation management of the Kruger National Park elephant population. PhD thesis (University of Pretoria, Pretoria, South Africa).6. Douglas-Hamilton I (1972) On the ecology and behaviour of the African elephant: Elephants of Lake Manyara. DPhil thesis (Oxford University, Oxford).7. Wittemyer G, Daballen D, Douglas-Hamilton I (2013) Comparative demography of an at-risk African elephant population. PLoS ONE 8(1):e53726.8. Foley CAH, Faust LJ (2010) Rapid population growth in an elephant Loxodonta africana population recovering from poaching in Tarangire National Park, Tanzania. Oryx 44(2):205–212.
Wittemyer et al. www.pnas.org/cgi/content/short/1403984111 6 of 8

Table S2. Carcass information and estimated demographic rates and number of elephants poached for 2010–2012 for the 12 sites withthe largest carcass samples used in the empirical approach
Region ofAfrica Country Site
Average annualcarcasses
Years ofdata
Estimated averageannual λ 2010–12
Estimated averageannual mp 2010–12
Estimated no.poached 2010–12
Central Chad Zakouma 50.2 10 0.92 0.10 163Central Odzala Congo 37.7 9 0.79 0.25 5,942Central DRC Garamba 53.2 9 0.85 0.20 1,439East Kenya Meru 46.1 7 0.98 0.06 130East Kenya Samburu/Laikipia 189.8 11 1.00 0.05 882East Kenya Tsavo 120.3 10 1.01 0.04 1,294East Tanzania Ruaha 21.4 10 0.96 0.08 5,616East Tanzania Selous Mikumi 111.0 9 1.00 0.04 4,931Southern Botswana Chobe 116.0 10 1.04 >0.01 353Southern Mozambique Niassa 52.0 6 0.81 0.23 10,279Southern South Africa Kruger 21.2 11 1.04 >0.01 29Southern Zimbabwe Chewore 23.3 11 0.99 0.05 794
Table S3. Regional and total estimates, illegal killing rates, and number of elephants poachedwith inter-quartile ranges for 2010–2012
Region 2010 2011 2012
Empirical methodAfricaPopulation growth rate 0.978 (0.962–0.991) 0.976 (0.961–0.989) 0.977 (0.966–0.988)Poaching rate 0.063 (0.053–0.077) 0.083 (0.072–0.095) 0.065 (0.057–0.073)No. poached 29,124 (24,310–35,234) 41,044 (35,843–47,200) 31,616 (28,055–35,364)
Central AfricaPopulation growth rate 0.979 (0.965–0.989) 0.795 (0.727–0.853) 0.790 (0.719–0.850)Poaching rate 0.142 (0.104–0.193) 0.248 (0.196–0.308) 0.235 (0.175–0.306)No. poached 11,228 (8,207–15,266) 21,148 (16,751–26,272) 16,148 (12,851–19,412)
East AfricaPopulation growth rate 0.988 (0.970–1.003) 0.988 (0.973–1.002) 0.983 (0.967–0.997)Poaching rate 0.054 (0.044–0.067) 0.054 (0.046–0.063) 0.059 (0.051–0.070)No. poached 7,187 (5,832–8,884) 7,763 (6,603–9,093) 8,695 (7,462–10,071)
Southern AfricaPopulation growth rate 0.978 (0.950–0.999) 0.974 (0.946–0.995) 0.980 (0.961–0.996)Poaching rate 0.064 (0.046–0.088) 0.068 (0.050–0.093) 0.062 (0.049–0.077)No. poached 15,800 (11,459–21,913) 18,176 (13,336–24,875) 16,583 (13,318–20,197)
Model-based methodAfricaPopulation growth rate 1.001 (0.994–1.006) 0.971 (0.961–0.980) 0.979 (0.969–0.987)Poaching rate 0.045 (0.029–0.069) 0.077 (0.052–0.111) 0.077 (0.051–0.114)No. poached 21,477 (13,633–32,850) 39,692 (26,757–56,861) 38,828 (26,277–55,265)
Central AfricaPopulation growth rate 0.969 (0.955–0.981) 0.926 (0.907–0.942) 0.932 (0.914–0.949)Poaching rate 0.100 (0.057–0.179) 0.160 (0.101–0.256) 0.177 (0.108–0.289)No. poached 7,871 (4,499–14,170) 13,649 (8,637–21,824) 13,607 (8,919–19,686)
East AfricaPopulation growth rate 0.994 (0.983–1.004) 0.960 (0.943–0.975) 0.979 (0.966–0.991)Poaching rate 0.044 (0.026–0.069) 0.074 (0.045–0.123) 0.060 (0.035–0.104)No. poached 5,645 (3,523–9,182) 10,630 (6,484–17,733) 8,515 (5,196–14,104)
Southern AfricaPopulation growth rate 1.019 (1.012–1.026) 0.996 (0.986–1.004) 0.996 (0.986–1.005)Poaching rate 0.024 (0.018–0.032) 0.047 (0.034–0.066) 0.031 (0.021–0.045)No. poached 5,740 (3,636–8,995) 12,285 (7,940–18,497) 13,303 (8,582–20,192)
The data presented is calculated using 12 sites in the empirical approach or from 306 sites using the modelingapproach. Interquartile ranges of population change are shown in parentheses.
Wittemyer et al. www.pnas.org/cgi/content/short/1403984111 7 of 8

Table S4. Regional and total estimates, illegal killing rates, and number of elephants poachedfor 2010–2012
Region 2010 2011 2012
AfricaPopulation growth rate 0.964 (0.949–0.976) 0.951 (0.936–0.963) 0.974 (0.963–0.984)Poaching rate 0.080 (0.052–0.133) 0.092 (0.065–0.139) 0.069 (0.050–0.096)No. poached 36,765 (23,917–61,185) 45,955 (32,296–69,292) 33,570 (24,841–44,311)
Central AfricaPopulation growth rate 0.921 (0.882–0.951) 0.809 (0.758–0.853) 0.906 (0.862–0.941)Poaching rate 0.179 (0.080–0.377) 0.233 (0.133–0.382) 0.136 (0.067–0.279)No. poached 14,108 (6,294–29,798) 19,871 (11,336–32,608) 9,583 (5337–15,759)
East AfricaPopulation growth rate 0.978 (0.961–0.993) 0.982 (0.968–0.995) 0.978 (0.964–0.992)Poaching rate 0.066 (0.040–0.114) 0.062 (0.041–0.093) 0.066 (0.043–0.099)No. poached 8,758 (5,273–15,197) 8,931 (5,844–13,357) 9,571 (6,338–13,831)
Southern AfricaPopulation growth rate 0.976 (0.952–0.995) 0.979 (0.954–0.998) 0.985 (0.969–0.999)Poaching rate 0.060 (0.024–0.027) 0.063 (0.027–0.160) 0.057 (0.029–0.102)No. poached 14,861 (6,052–39,713) 16,754 (7,141–42,740) 15,247 (8,044–24,666)
The data presented is calculated using the empirical approach on the 19 sites averaging ≥10 carcasses.Interquartile ranges of population change are shown in parentheses.
Wittemyer et al. www.pnas.org/cgi/content/short/1403984111 8 of 8