Leaving the Ivory Tower
297
Organised by: Co-organised by: Wrocław University of Technology Warsaw University of Technology Poznan University of Technology Lublin University of Technology Bialystok University of Technology Cracow University of Technology Honory Patronage by: Scientific Society of Gdańsk Silesian University of Technology University of Warmia and Mazury Pomeranian University in Słupsk Lodz University of Technology 8 th Eastern European Young Water Professionals Conference 11-14 May 2016 Gdańsk, Poland http://iwa-ywp.eu/ Leaving the Ivory Tower Bridging the Gap between Academia, Industry, Services and Public Sector BOOK OF ABSTRACTS
-
Upload
khangminh22 -
Category
Documents
-
view
1 -
download
0
Transcript of Leaving the Ivory Tower

Organised by: Co-organised by:
Wrocław University of Technology
Warsaw University of Technology
Poznan University of Technology
Lublin University of Technology
Bialystok University of Technology
Cracow University of Technology
Honory Patronage by: Scientific Society of Gdańsk
Silesian University of Technology
University of Warmia and Mazury
Pomeranian University in Słupsk
Lodz University of Technology
8th Eastern European Young Water Professionals Conference
11-14 May 2016 Gdańsk, Poland http://iwa-ywp.eu/
Leaving the Ivory Tower Bridging the Gap between Academia, Industry, Services and Public Sector
BOOK OF ABSTRACTS

8th Eastern European Young Water Professionals Conference
Leaving the Ivory Tower Bridging the Gap between Academia, Industry,
Services and Public Sector
11–14 May 2016, Gdańsk, Poland
BOOK OF ABSTRACTS
Oficyna Wydawnicza Politechniki Wrocławskiej
Wrocław 2016

Editors:
Maryna Feierabend Jakub Drewnowski Patryk Wójtowicz
Typesetting:
Olha Novytska, Maja Djogo
Cover design:
Maryna Feierabend, Patryk Wójtowicz Printed in the camera ready form All rights reserved. No part of this book may be reproduced, stored in a retrieval system, or transmitted in any form or by any means, without the prior permission in writing of the Publisher. © Copyright by Oficyna Wydawnicza Politechniki Wrocławskiej, Wrocław 2016
OFICYNA WYDAWNICZA POLITECHNIKI WROCŁAWSKIEJ wyb. Stanisława Wyspiańskiego 27, 50-370 Wrocław http://www.oficyna.pwr.edu.pl e-mail: [email protected]
ISBN 978-83-7493-936-2

GOLD SPONSORS
SPONSOR

International Programme Committee Chair: Prof. Makinia J. (Gdańsk University of Technology) Co-Chair: Dr. Iliescu F. (IWA, Romania) Prof. Wanner J. (Institute of Chemical Technology, Czech Republic) Prof. Brdjanovic D. (UNESCO-IHE, The Netherlands) Mr. Foerster G. (BCH, Hong Kong) Dr. Stojanovic Z. ("Jaroslav Cerni", Serbia) Prof. Pupyrev E. (MosvodokanalNIIProekt, Russia) Dr. Bumbac C. (ECOIND, Romania) Prof. van Loosdrecht M. (TU-Delft, The Netherlands) Prof. Fernandez Morales F. J. (UCLM, Spain) Dr. Babko R. (Schmalhausen Institute of Zoology NAS, Ukraine) Prof. Seco A. (University of Valencia, Spain) Dr. Vasyukova E. (WTE, Germany) Prof. Mamais D. (NTUA, Greece) Prof. Jobbágy A. (Budapest Univ. of Techn. & Economic, Hungary) Prof. Fatone F. (University of Verona, Italy) Prof. Vlaeminck S. (University of Gent, Belgium) Dr. Vakuliuk P. (NaUKMA, Ukraine) Local Programme Committee Dr. Szlachta M. (Wrocław University of Science and Technology, Poland) Prof. Traczewska T. (Wrocław University of Technology, Poland) Prof. Ciesielski S. (University of Warmia and Mazury, Poland) Prof. Surmacz-Górska J. (Silesian University of Technology, Poland) Prof. Dzienis L. (Białystok University of Technology, Poland) Prof. Sozański M. (Poznan University of Technology, Poland) Dr. Dymaczewski Z. (Poznan University of Technology, Poland) Dr. Żubrowska-Sudoł M. (Warsaw University of Technology, Poland) Dr. Rybicki S. (Cracow University of Technology, Poland) Prof. Osadowski Z. (Pomeranian University, Poland) Prof. Montusiewicz A. (Lublin University of Technology, Poland) Dr. Gajewska M. (Gdańsk University of Technology, Poland) Dr. Borowski S. (Lodz University of Technology, Poland)
International Organising Committee Chair: Dr. Feierabend M. (IWA YWP, Belgium) Co-Chair: Dr. Drewnowski J. (Gdańsk University of Technology, Poland) Ibrahimllari A. (IWA YWP Program, Albania) Rudic Z. (Institute for the Development of Water Resources "Jaroslav Cerni", Serbia) Dr. Tiron O. (ECOIND, Romania) Heinrichmeier J. (WTE Wassertechnik GmbH, Germany) Dr. Novytska O. (The National University of Water and Environmental Engineering, Ukraine) Bakos V. (Budapest Univ. of Technology & Economics, Hungary) Allerdings D. (WTE Wassertechnik GmbH, Russia) Dr. Loderer C. (Kompetenzzentrum Wasser Berlin, Germany) Tsanov E. (University of Architecture, Civil Engineering & Geodesy, Bulgaria) Dr. Djogo M. (University of Novi Sad, Serbia) Dejus S. (Riga Technical University, Latvia) Lavrnic S. (University of Cadiz, Spain/Serbia) Local Organising Committee Dr. Wójtowicz P. (Wrocław University of Science and Technology, Poland) Dr. Bogacki J. (Warsaw University of Technology, Poland) Dr. Kutyłowska M. (Wrocław University of Science and Technology, Poland) Kilian E. (Silesian University of Technology, Poland) Wolf M. (Wrocław University of Science and Technology, Poland) Dr. Łagód G. (Lublin University of Technology, Poland) Dr. Cema G. (Silesian University of Technology, Poland) Dr. Cimochowicz-Rybicka M. (Cracow University of Technology) Dr. Janiak K. (Wrocław University of Science and Technology, Poland) Dr. Tuszyńska A. (Gdańsk University of Technology, Poland) Dr. Orłowska-Szostak M. (Gdańsk University of Technology, Poland) Dr. Czerwionka K. (Gdańsk University of Technology, Poland) Dr. Łuczkiewicz A. (Gdańsk University of Technology, Poland) Dr. Wojciechowska E. (Gdańsk University of Technology, Poland)

CONTENTS
WATER MANAGEMENT
Antonov I., Shishkin A. Algorithm and Software Based on GIS to Adapt the Basin SAI to the SAD of Water Users
19
Asatryan V., Barseghyan N., Dallakyan M.R., Vardanyan T. The Assessment Approach for the Potential of Rivers in the South-West Part of Lake Sevan as Spawning Areas for Sevan Trout
21
Borge A. 30 Years of Water Reuse in Spain. Looking Back to Tackle the Future
23
Çelebi A., Özdemir S., Nuhoğlu N.N., Canseven N., Uzun H. Buffering and Management of Traffic Origin Pollutants in the Important Lakes
25
Çelebi A., Özdemir S., Uçkun T. Metal Concentration, Pollution Loads and Effects in Highway Storm Water Runoff for Drinking Water Source
27
Davybida L., Tymkiv M. The Regional GIS Modelling for Groundwater Resources Monitoring and Management
29
Duong V.H.T., Nestmann F., Van T.C., Oberle P., Geiger H. Geographical Impact of Dyke Measurement for Land Use on Flood Water in the Mekong Delta
31
Gabrielyan A., Shahnazaryan G., Minasyan S. Distribution of Heavy Metals in the Environmental Samples of the Voghji River Basin Impacted by Mining Activities
33
Hakiel J., Szydłowski M., Gąsiorowski D. Coupled Urban Areas Inundation Model with Interaction between Storm Water System and Surface Flow – Case Study of Sea Level Impact on Seaside Areas Flooding
35
Halych O. Taking into Account Energy Losses under Calculation the Free-Surface Profile of Undular Jump
37
Hovhannisyan A., Shahnazaryan G. Artificial Fluctuation of Water-Level and Associated Effect on Water Quality of the High-Mountain Lake Sevan
39

8
Jurasz J. , Mikulik J., Piasecki A. Wind Generation Powered Pumped-storage Hydroelectricity as a Fully Dispatchable Power Unit - Case Study Pomerania and West Pomerania Provinces - Poland
41
Kokojka S. Need to Provide Safety Water in River Basin in Korca City
43
Laaksonlaita J., Loisa O., Leskinen P. 10 years of Real-Time Cyanobacteria Monitoring in Lake Littoistenjärvi
45
Mamyan A., Gevorgyan G., Stepanyan L., Hambaryan L. Investigation of Phytoplankton Community in “Yerevanyan Lich” Reservoir and the Hrazdan River in the Conditions of Algal Bloom
47
Nurminen H., Leskinen P., Loisa O. The Impact of Construction Activities on Watershed Water Quality and Total Loading
49
Olak-Kucharczyk M., Foszpańczyk M., Ledakowicz S., Gmurek M. Decomposition of Xenobiotics During Visible Light Irradiation in the Presence of Immobilized Photosensitizers - Kinetics Study
51
Pyrchla J., Kowalewski M., Kijewska M., Kasyk L., Leyk-Wesołowska M., Pyrchla K. Study of the Flow Dynamics of Surface Water Masses in the Area of Coastal Gulf of Gdansk
53
Rets E., Kireeva M., Frolova N., Loshakova N. Water Resources and Hydrological Hazards in North Caucasus Under the Impact of Recent Climate Change
55
Roško V., Červeňanská P., Patschová A., Siska M. Monitoring of Pesticides Residue and Their Metabolites in Groundwater of Slovakia
57
Rudic Z., Bozic M., Milosev D., Nikolic G., Radanovic J. Large Scale Irrigation Planning for Rational Use of Water Resources: Velika Plana as a Case Study (Serbia)
59
Shishkin A., Epifanov A., Epifanova M. Methodical Bases of an Assessment of Impact of Dredging Works on the Water Area
61
Stroganova M., Shishkin A., Kushnerov A., Ivanova I.,Vasyukova E. Calculation of Integrated Indicators for Water Quality Assessment
63

9
Thanh N.T., Meon G. Projected Changes of Discharge for Far-Future (2071-2100) over Coastal Region, Vietnam: a case study of Thi Vai Catchment
65
Zackiewicz J., Kalka J. Genotoxicity of Selected Pharmaceuticals
67
WATER SUPPLY AND WATER TREATMENT
Bylka J., Szuster-Janiaczyk A. The Effect of the Mixing of Water from Different Sources in the Water Supply System on Tap Water Quality - A Full-Scale Technical Investigation Case Study
69
Çelebi A., İkizoğlu Z.R., Aydın S. Toxicological Approach and Contributions to Water Quality Management
71
Dejus S., Rusenieks R., Nescerecka A., Nazarovs S., Juhna T. Long Term Drinking Water Quality Monitoring in Drinking Water Supply Systems by On-Line Sensors
73
Didebulidze K., Giorgadze A. , Glurjidze T., Kobaladze A., Lomidze I., Maludze S., Metreveli Z., Patashuri A., Sakevarashvili A., Vakuliuk P., Tarabara V., Yatseiko O. Evaluating Feasibility of Ultrafiltration as a Treatment Option for Surface Waters of Mtkvari and Aragvi Rivers
75
Eller M., Hedrich M. Sustainability Risk Controlling for Urban Water Systems: Multidimensional Risk Identification and System Analysis
77
Gevorkov L., Mikhelashvili I. Simulink Based Model of the Flow Control of Centrifugal Pumps
79
Gromov G., Bychkov D. Calculation of Real Water Losses in Large Russian City
81
Al Heboos S., Licskó I. Investigating and Modelling the Kinetic of Bulk Chlorine Decay in Water Distribution System
83
Kalashnyk A., Vakuliuk P., Furtat I. Surface Modification of Polymeric Membranes for Minimizing (Bio)Colloidal Fouling in Water Treatment Processes
85
Kilian E. An Analysis of the Intensity of Ground Vibrations Caused by Mining Tremors in Places where Water Distribution Systems Have Failed
87

Klapcsik K., Hős Cs.J. Optimal Pressure Measurement Layout Planning in Real-Life Water Distribution Systems
89
Kovalenko O., Kormosh K., Vasyliv O. Quality of the Water Received from Air by Means of Conditioners
91
Kutyłowska M. Prediction of Failure Rate of Water Pipes Using K-Nearest Neighbours Method
93
Manouseli D., Kayaga S.M., Kalawsky R. Evaluation of Water Efficiency Programs in Single Family Households in the UK- a Case Study
95
Migowska A., Bjerkelund V.A. Degradation of DEET and DEP by Ozonation using pCBA as a Hydroxyl Radicals Probe Compound
97
Miller P. The „Protected Colloids” Phenomenon and its Significance for Water Treatment
99
Mrowiec M., Kuliński E., Herczyk T. The Joint Influence of Meteorological Factors and Pressure Control on the Water-pipe Network Failure Rate on the Example of the Experience of PWiK O.Cz. S.A. in Czestochowa
101
Nedeljković A., Sekulić A., Branisavljević N. Water Distribution Network Rehabilitation Optimistion based on Sociological Criteria and Hydraulic Limitation
103
Odud L. Improvement of the Clarifier with Suspended Sediment Layer Construction in Lime-Soda Water Softening Technological Schemes
105
Orłowska-Szostak M., Wróbel A. The Computer Modeling of Flows in the Exemplary Water Supply System; the Problem of the Oversized Water-Pipe Network – Case Study
107
Pervov A., Andrianov A., Danilycheva M. Preliminary Evaluation of New Green Antiscalants for Reverse Osmosis Water Desalination
109
Secula M.S., Hagiu-Zaleschi L., Cagnon B., Stan C., Carja G. Magnetic Activated Carbon Composites Used as Fenton Like Catalyst for Degrading Pharmaceutical Agents
111
Siekanowicz-Grochowina K. Spatial Analyses of Water Supply Interruptions – Wroclaw’s Case Study
113
10

Strikalenko T., Liapin A., Liapina E. Concept of “Risk Management” and Optimization of Water Supply in Transport
115
Suárez-Varela M., García-Valiñas M. de los Á., González-Gómez F., Picazo-Tadeo A.J. Ownership and Performance in Water Services Revisited: Does Private Management Really Outperform Public?
117
Szerzyna S., Mołczan M., Wolska M., Adamski W., Wiśniewski J. Pilot Investigation as a Case of Science and Industry Cooperation
119
Tkachuk O., Novytska O. Water Networks’ Improvement of Settlements in Ukraine
121
Trinh N.D., FrechenF.-B. Long-term Hydraulic Performance of Low TMP Dead-end Ultrafiltration with Extremely Simple Operation and Maintenance
123
Trinh N.D., FrechenF.-B. Sustainable Decentralized Membrane-based UF Drinking Water Treatment Plant for Rural Areas in Developing Countries
125
Varga R., Hős Cs. Using Community Structure Concept for Partitioning Hydraulic Systems
127
Wolf M., Traczewska T.M. Monitoring of Bacterial Biofilm Growth by Impedance Spectroscopy - Preliminary Research
129
SEWAGE MANAGEMENT AND WASTEWATER TREATMENT
Aicher A., Burkhardt P.D., Engel P., Londong J. Greywater Treatment in a Living Wall System (LWS)
131
Aslan S., Sozudogru O. Single and Combined Effects of Copper and Nickel on Nitrification Organisms in Batch Units
133
Bakos V. Upgrading Biological Nitrogen Removal and Sculpturing Activated Sludge Flocs in Industrial Wastewater Treatment
135
Banach A., L. van Niftrik, Mesman R., Ziembińska-Buczyńska A. Anammox Bacteria Ultrastructure, Composition, and Biodiversity Changes in a SBR Pilot – Scale Bioreactor
137
11
Beier M., Schneider Y., Lorek C., Voss E., Schmitz B. Full-Scale Experience for Management of Phosphorus Removal and Recovery at a WWTP with EBPR
139
Bilińska L., Gmurek M., Ledakowicz S. Oxidation and Mineralization by Ozone Based Aops of Simulated Textile Wastewater Containing Reactive Yellow 145, Reactive Red 195 and Reactive Blue 221
141
Bumbac C., Ionescu I.A., Tiron O. Aerobic Granular Sludge Reactor Start-up: Focusing on Microbial Diversity and Granule Morphology
143
Carboneras B., Villaseñor J., Fernandez-Morales F.J. Aerobic Biodegradation of 2,4-dichlorophenoxyacetic Acid Pesticide
145
Chromíková J., Thomas J., Malíková P., Heviánková S. Mine Water Treatment Technology– Application of Electrodialysis: Laboratory and Pilot experiments
147
Chwialkowska J., Jankowska E., Stodolny M., Oleskowicz-Popiel P. Product Formation During Mixed Culture Fermentation of Different Carbon Sources
149
Ciepliński J., Rybicki S.M. Comparison of Designed and Real Electric Energy Consumption by an SBR Reactor
151
D’Antoni B.M., Stefani L., Parelli E., Fatone F. ENERWATER: An Innovative Energy Audit Methodology in Wastewater Treatment Plants. Focusing on Italian Scenario
153
Djogo M., Mihajlovic I., Brboric M., Pap S., Bezanovic V., Ubavin D. Application of Commercial Adsorbents for Landfill Leachate Treatment on Sanitary Landfill in Developing Country
155
Drewnowski J. One vs. Two-Step Hydrolysis Process of Slowly Biodegradable Organic Compounds in Activated Sludge Systems – Experimental Investigation and Mathematical Modelling
157
Drewnowski J., Banaszek P., Zmarzły M. The Analysis of the NH4 Virtualization Sensors by Computer Simulation in the Control of Aeration Systems at WWTP
159
Drewnowski J., Zaborowska E., Hernandez De Vega C. Computer Simulation in Predicting Biochemical Processes and Energy Balance at WWTPs
161
12

Emir G., Yavuz Y. Effect of Current Density on Suspended Solid Removal from Ceramic Industry Wastewater for Electrocoagulation with Iron Electrodes
163
Frison N., Cruthik D., Tayà C., Fatone F. Selection of PHA Storing Biomass inder Aerobic Feast and Anoxic Famine Regime for Nitrogen Removal Via-Nitrite from Anaerobic Supernatant
165
Górka J., Cimochowicz-Rybicka M. Water and Sewage Sludge Co-digestion: Process Characteristics and Application Possibilities
167
Gusiatin Z.M., Kasinski S.W., Kowal P. Ash from Gasification of Poultry Feathers to Remove Cd, Cu and Zn from Aqueous Solutions
169
Gutwiński P., Cema G., Surmacz-Górska J. Lead (Pb) Inhibition of Anammox Biomass After Short-Term Exposure – Batch Experiments
171
Guz Ł., Drewnowski J., Łagód G., Piotrowicz A., Suchorab Z., Jaromin-Gleń K. Using On-line Measurement by Electronic Nose and Computer Simulations for Real-time Control at WWTP
173
Heinrichmeier J., Shatunova D. Interplay of Laboratory Analyses and Full Scale Operation Data using the Example of Trouble Shooting of Sludge Digestion Behavior
175
Hlihor R.M., Figueiredo H., Rosca M., Tavares T., Gavrilescu M. The ability of Arthrobacter viscosus in the Removal of Pb(II) from Aqueous Solutions
177
Hürter H., Schmitt T.G., Schütze M., Alex J., Riechel M., Stapf M., Uwe Thamsen P., Gerlach S., Mitchell R.-L., Waschnewski J., Gunkel M., Pawlowski-Reusing E. Effect Analysis of Adaptation Measures in a Metropolitan Wastewater System to Deal with Future Challenges
179
Hussin F., Aroua M.K., Szlachta M. Removal of Lead from Simulated Wastewater Using Combination of Electrocoagulation and Adsorption Technique
181
Janiak K., Miodoński M., Muszyński-Huhajło M. Aeration in Side Stream Nitrification - Different Process Rate, Different Aeration Efficiency
183
13

Janiak K., Miodoński M., Muszyński-Huhajło M. Side-stream Deammonification Process Failure – Risk of WWTP Effluent Quality Violation
185
Janiak K., Miodoński M., Muszyński-Huhajło M. Stable and Efficient Side-Stream Nitrifiers Production –Key Element for Effective Mainstream Bioaugmentation
187
Jaroszysnki L.W., Jaroszynski T. Algae Growth Characteristics Treating Anammox Effluent
189
Jaroszysnki L.W., Jaroszynski T. Pilot Scale Study on Reject Water Treatment in Partial Nitritation/Anammox Process at Poznan Wastewater Treatment Plant
191
Jaszczyszyn K., Góra W., Góra P. Application of Natural Bentonite for Nonionic Surfactant Removal in Industrial Wastewater
193
Jendrzejewska N., Karwowska E. The Influence of Selected Antibiotics on the Wastewater Treatment Process and the Development of Antibiotic Resistant Bacteria
195
Johanidesová I., Bindzar J., Lama S., Słabuszewska M., Čiháková P., Wanner J. Use of Chlorine Compounds for Wastewater Disinfection
197
Johanidesová I., Fuka T., Růžičková I., Pečenka M., Vejmelková D., Studničková M., Wanner J. Sludge Age: How to Get More Phosphorus in WWTP Effluent for Its Recovery?
199
Joka M., Poskrobko S. Emissivity of Combustion of Sewage Sludge
201
Kalaitzidou K., Zouboulis A., Mitrakas M. Thermodynamic Study of Phosphate Adsorption onto Iron Oxy-Hydroxides
203
Kırım G., Karahan Özgün Ö. Model Based Evaluation of a Full-Scale Industrial Wastewater Treatment Plant with Limited Monitoring Data
205
Kocerba-Soroka W., Fiałkowska E., Pajdak-Stós A., Sobczyk M., Starzycka J., Fyda J. Introduction of Lecane Tenuiseta Rotifers into SBR-Model System Improves Sludge Settle Ability at Low Temperature
207
Kopec L. The Application of Monod Equation to Description of Denitrification Kinetics in Moving Bed Biofilm Reactor
209
14

Kowalska K., Felis E. Influence of Selected Corrosion Inhibitors on Biological Wastewater Treatment
211
Kozlovets O., Voyevoda D., Golub N. Technology of Anaerobic-Aerobic Treatment Wastewaters from Nitrogen Compounds after Biogas Production
213
Król D., Gałko G. The Sewage Sludge Transformation with the Use of Thermal Processes – Gasification
215
Lavrnić S., Cristino S., Mancini B., Mancini M.L. Performance of Pilot Wastewater Treatment Plant Based on Constructed Wetlands
217
Loderer C. PowerStep – a Real Paradigm Shift in Wastewater Treatment Processes
219
Lóka M., Lóránt B., Tardy G.M. Carbon-Dioxide Neutral Electricity Production in Microbial Fuel Cells from Wastewater
221
Łomińska D., Anielak A.M. Płaszów WWTP as a Source of Humic Acids
223
Majtacz J., Al-Hazmi H. Treatment of Reject Water from Anaerobic Digestion of Sludge by the Nitrification-Denitrification Reactor SBR
225
Mateo S., Rodrigo M.A., Cañizares P., Fernandez-Morales F.J. Effect of Solid Retention Time on the Exerted Current of Air-breathing Microbial Fuel Cells
227
Mikeska M., Beier M., Rosenwinkel K.-H. Evaluation of Inhibitory Effects on Nitritation Process by Vapour Condensates from Sewage Sludge Drying
229
Miłobędzka A., Muszyński A. Can DNA Sequencing Show Differences Between Microbial Communities in Polish and Danish Wastewater Treatment Plants?
231
Mlakar M., Levstek M., Stražar M. Physico-Сhemical Treatment of Liquid Waste on an Industrial Plant for Electrocoagulation
233
Mook W.T., Aroua M.K., Szlachta M., Lee C.S. Optimization of Reactive Black 5 Dye Removal by Electrocoagulation Process Using Response Surface Methodology
235
15

Novaković M., Pap S., Bežanović V., Mihajlović I., Đogo M., Radonić J., Turk-Sekulić M. Efficacy Evaluation of Biosorption of Anti-Epileptic Drug – Carbamazepine onto Low - Cost Adsorbent Prepared from Apricot Stones
237
Nowakowska M., Wartalska K., Kaźmierczak B. Urban Catchment Pilot Study Criteria Selection for Hydrology and Hydraulic Parameters Research
239
Nowrotek M., Sochacki A., Felis E., Miksch K. Elimination of Selected Pharmaceuticals from Municipal Wastewater in Vertical Flow Constructed Wetlands: the Effect of Operation Mode and Vegetation
241
Nuić I., Trgo M., Vukojević Medvidović N., Ugrina M. Removal of Cd(II) and Zn(II) from Binary Aqueous Solutions onto Natural Zeolite by the Column Process
243
Pelivanoski B., Pirke K., Vasyukova E., Dohmann M., Sekoulov I. Methodological Approach for Designing a Pilot Plant for Innovative Wastewater Treatment Process Based on Biofilm Technology Invention
245
Remiszewska-Skwarek A., Drewnowski J., Fudala-Ksiazek S., Luczkiewicz A. Determination of COD Fractionation as a Key Factor for Appropriate Modelling and Monitoring of Activated Sludge Processes
247
Rossinskyi V.M., Sablii L.A. Effect of Surfactants on Denitrification in Biological Municipal Wastewater Treatment
249
Rubio J., Romero L., Garcia Morales J., Drewnowski J., Fernandez-Morales F.J. The Role of Biodegradable Particulate Organic Substrates in Anaerobic Digestion Systems
251
Šabić M., Vuković Domanovac M., Meštrović E. Evaluation of Various Samples of Activated Sludge for a Start-Up of Pharmaceutical Wastewater Treatment Plant
253
Sander S., Wagner M. Energy Efficiency of Coarse- and Fine-Bubble Aeration Systems in the MBBR IFAS Process
255
Schewerda J., Buinauskaitė A., Vasyukova E. Optimization of Nitrogen Removal by Changing Aeration Control in Larnaca Wastewater Treatment Plant (Cyprus)
257
16
Sebestyén E.Z. Experiences of Full-Scale Deammonification of Dewatering Sidestream from Thermophilic Anaerobic Digestion Process at Budapest CWWTP
259
Shevchuk O., Tkachuk O. Estimation of Main Analysis Parameters of Infiltration Areas
261
Sobczyk M., Pajdak-Stós A., Fiałkowska E., Kocerba-Soroka W., Starzycka J., Fyda J. The Comparison of Sludge Investigation Methods Accuracy
263
Spennati F., Rossi S., Mori G., Munz G. Modelling the Hydrogen Sulphide Removal in a New Rotating Bed Biofilm Reactor
265
Starzycka J., Fiałkowska, E. Walczyńska A., Kocerba-Soroka W., Sobczyk M., Fyda J. , Pajdak-Stós A. Effect of Food and Temperature on the Growth Rate of Lecane inermis Originating from Two Geographically Distant Populations
267
Sytek-Szmeichel K., Podedworna J., Augustyniak P. Start-up Strategy for Nutrient Removal in Moving Bed Sequencing Batch Biofilm Reactor
269
Szaja A., Drewnowski J., Łagód G., Aguilar J.A. The COD Fractionation of Municipal Wastewater by Respirometric Method in Control and Modeling Activated Sludge Systems
271
Szlachta M., Wójtowicz P., Włodarczyk P., Pasanen A., Backnäs S. International Cooperation for Sustainable Treatment and Management of Waters from Gold Mines
273
Tiron O., Bumbac C., Cristea I.N. Applications of the White-Rot Fungal Laccases in Dyes Decolorization Processes
275
Tomaszewski M., Cema G., Ziembińska-Buczyńska A. Temperature and pH Influence on Anammox Activity: a Batch Test Study
277
Turp S.M. Comparing the Removal of Nickel Ni(II) by Zeolite in Aqueous Solutions with Artificial Neural Network and Multiple Linear Regression
279
Ugrina M., Vukojević Medvidović N., Trgo M., Nuić I. Effect of pH on Efficiency of Sorption/Desorption of Heavy Metals on Natural and Iron-modified Zeolite
281
17

Vogel B., Beier M., Rosenwinkel K.-H. Influence and Time Dependence of Nitrite on the Nitrous Oxide Accumulation during Denitrification
283
Walczak J., Zubrowska-Sudol M., Garlicka A. COD Fractions and the Activity of Aerobic Microorganisms in the Process of Hydrodynamic Disintegration of Activated Sludge
285
Weinpel T. Utilization of Dairy Wastewater as Carbon Source in a Domestic Activated Sludge Treatment Plant
287
Wielgat P., Zima P. Tracer Study of Dispersion in Full-Scale Activated Sludge System
289
Wilk B. Ultrafiltration Membranes Formed from Polyaniline, Ionic Liquid and Cellulose - Transport Properties and Energy Efficiency
291
Zaragoza P.I., Chávez A.C., Barrera C.E. Photocatalytic Degradation of Methyl Orange in Presence of TiO2 Nanotubes Synthesized by Anodic Oxidation
293
Zydorczyk S., Schmuck S., Mietzel T. Analysis of Growth Rates of The Micro Algae Chlorella Vulgaris in Different Culture Media and Waste Water
295
18
WATER MANAGEMENT 19
Algorithm and Software Based on GIS to Adapt the Basin SAI to the SAD of Water Users I. Antonov* and A. Shishkin*
* The higher school of technology and power of the St. Petersburg State University of industrial technologies and design, Saint-Petersburg, Russia (E-mails: [email protected], [email protected])
INTRODUCTION At present, the development of environmental legislation in the Russian Federation is based on the regulation of pollutants discharges from the enterprises on the basis of the basin-wide norms of permissible impact (NPI). After establishment of the basin-wide NPI, the individual norms of permissible discharge of enterprises (NPD) should be determined by quoting loads within the NPI. The basin-wide norms define the safe amount of pollutants that can be assimilated by the ecosystem of the water body and will not lead to its degradation, and the NDP define a safe weight of discharge of a particular enterprise (Vylegzhanina, 2008). The methodology and algorithm of distribution of load quotas between the water using enterprises within the basin-wide NPI do not have clear consistency and cannot be implemented. METHODOLOGY & RESEARCH This paper proposes a methodology of rationing of permissible discharges, based on information and analytical database that provides the possibility of improving the system of rationing of negative impact on the environment in accordance with the new legislation of the Ministry of Environment Protection and Natural Resources (MEPNR) of the Russian Federation. The principal feature of this approach is the joint use of environmental and technological criteria of rationing in the modern information and analytical, information and technological and regulatory framework, the advantage of which can be evaluated in papers (Kimmo, 2009; Pokhrel, 2011). Rationing in the frames of natural-technical complexes (NTC) is the most important tool of environmental management at the regional-basin level and provides support for making management decisions taking into account socio-economic factors. The main stages of discharges rationing within the basin-wide approach taking into account the level of environmental properties of the technologies of water using enterprises are offered as follows (Popp, 2011; Yutao Wang, 2011; Shishkin, 2012; Shishkin, 2011):
1) Definition of the parameters of the water body, appropriate given the hydrological regime. 2) Identification of the main sources of impact on the water pool to means of ranking. 3) Determination of the list of targets. 4) Zoning of the basin of the water body and the definition of the boundaries of settlement areas
and the relevant classes of water quality. 5) Determination of background characteristics on the general sanitary and targets. 6) Validation of the model for the prediction of water quality in the water body and the
construction of the settlement scheme. 7) NTC simulation on the basis of GIS to support the discharge parameters based on specified
criteria.
WATER MANAGEMENT 20
8) Optimization of water protection measures for water user groups on the basis of ecological and technological criteria.
More focus on the distribution of quotas between companies, water users NTC. RESULTS The value of the EL obtained by summing the indicators (ki) weighted according to the their significance of normalized parameters by the following expression:
,kELn
1iii
1n
1ii ∑∑
=
−
=
α⎟⎠
⎞⎜⎝
⎛α= (1)
where n – number of considered indicators; αi – the boost factor of the summing parameter considered parameters. Coefficient significance parameters for each branch of production is assigned based on expert analysis and put into the algorithm of information and analytical base. When determining the EP, one should use the following indicators for assignment of technologies to the best available ones (ki):
1. Technological standards - specific standards of education pollutants, consumption of resources and energy (Best Available Techniques (BAT), 2013).
2. Design parameters of environmental equipment operation: output values of the rationed indicators of the waste water quality.
3. Specific norms for water consumption and water discharge. 4. The coefficient of water recycling (crc). 5. Water reuse factor (cru). 6. The ratio of consumption and loss of fresh water (ccon). 7. The utilization of the water diverted from the source (cut).
The implementation of the proposed algorithm and the methodology of distribution of quotas between water using enterprises within the basin-based approach will take into account the technological condition of the enterprises and gear the BAT to the environmental regulations. REFERENCES Kimmo, Silvo, Timo, Jouttijärvi, Matti, Melanen. (2009). Implications of regulation based on the IPPC directive –
A review on the Finnish pulp and paper industry. Journal of Cleaner Production, 17, 713-723. Pokhrel, D., Viraraghavan, T., (2004). Treatment of pulp and paper mill wastewater—a review. Science of The Total
Environment, 333, 37-58. Popp, D., Hafner, T., Johnstone, N. (2011). Environmental policy vs. public pressure: Innovation and diffusion of
alternative bleaching technologies in the pulp industry. Research Policy, 40, 1253-1268. Shishkin, A.I., Antonov, I.V., Epifanov, A.V. (2012). Rationing of dump of wastewater by manufacture of pulp and
products of its processing with application GIS of technologies. Cellulose. Paper. Cardboard, 1, 66-74. Shishkin, A.I., Antonov, I.V., Epifanov, A.V. (2011). Geoinformation modeling system of rationing of admissible
dumpings for pulp-and-paper complexes. The Water Management of Russia, 1, 66-80. Vylegzhanina, E.E., Savelyeva, L.V. (2008). Water resources management of Russia: international legal and legislative
mechanisms. MGIMO p 200. Antonov, I., Shishkin, A., Chusov A. (2014) Methodology of rationing of admissible dumps on the basis of
geoinformation modeling system. Construction of Unique Buildings and Structures. 3 (18), 25-37. Epifanov, A., Shishkin, A., Antonov, I., Alekseev, V., Kurakina, N., Zheltov, E. (2009). System of calculation of
standards of admissible impact on water objects in the environment of GIS/ ArcReview, 4, 10-11. Best Available Techniques (BAT) Reference Document for the Production of Pulp, Paper and Board. July 2013, p. 899.
WATER MANAGEMENT 21
The Assessment Approach for the Potential of Rivers in the South-West Part of Lake Sevan as Spawning Areas for Sevan Trout V. Asatryan, N. Barseghyan, M.R. Dallakyan and T. Vardanyan* * Institute of Hydroecology and Ichthyology of SCZHE of National Academy of Sciences of The Republic of Armenia, 7 P. Sevak str., 0014, Yerevan, Armenia (E-mails: [email protected]; [email protected]; [email protected]; [email protected])
INTRODUCTION As it is known, Sevan trout endemic fish species, registered in the Red book of IUCN, is one of the most valuable fish of Armenian ichthyofauna. However, it’s endangered nowadays, due to the mismanagement of Lake Sevan water and bio-resources, as well as the anthropogenic impact on the rivers inflowing into the lake. Currently only 2 races of Sevan trout: summer ishkhan or summer bakhtak (Salmo ischchan aestivalis, Fortunatov) and gegharquni (Salmo ischchan gegarkuni, Kessler), which spawn in Lake Sevan basin rivers, have survived, but have become rare. One of the mechanisms to preserve this unique fish species is to study the current state of its spawning areas and reveal the areas most appropriate for their natural reproduction, as well as to find out natural and artificial constraints for their spawning migration in the rivers. Thus, aimed at assessing the rivers’ potential to support natural reproduction of Sevan trout, the pilot project has been carried out in South-West part of Lake Sevan. Present study is the first step in the series of similar studies to be carried out in the other tributaries of Lake Sevan during the period of 2016-2020. Rivers Lichq, Bakhtak and Tsakqar have been chosen based on the results of the most recent study of Sevan trout reproduction ecology implemented in the 1980’s (Smoley, 1987). MATERIAL AND METHOD
Eight complex field trips to the rivers Lichq, Bakhtak and Tsakqar were carried out in May-June and October-November of 2015, which coincided with the spawning seasons of summer ishkhan and gegarquni respectively. During these expeditions the following hydrophysical, hydrochemical parameters vital for the assessment of rivers’ appropriateness as spawning areas for sevan trout have been investigated: ground type, temperature regime, hydrologic peculiarities, and pH and oxygen regime, as well as the presence of fish lurking for fries, obstacles for fish migration. Measurements of pH and dissolved oxygen have been done by Hanna HI9813-5N pH/EC/TDS and Hanna HI9147-10 DO meters respectively. The benthic macroinvertebrates composition in different parts of the rivers has also been studied as the food base for fries, as well as for the assessment of water quality. Water quality has been assessed according to BMWP index (Semenchenko, Razluckiy, 2010). Additionally, the average annual and monthly hydrologic and hydrophysical data for Lake Sevan basin rivers have been used for comparison with current measurements (Ecology of Lake Sevan, 2010). The spatial analysis of the collected data for the assessment of rivers’ potential has been done by ArcGIS 10.1 software. RESULTS AND DISCUSSION Summarizing the results of studies, a qualitative classification of rivers’ potential as spawning areas has been done. As shown in the map below (Figure 1), the suitability of rivers to support natural reproduction of Sevan trout has been divided into 5 classes. First two (Inappropriate by natural or by artificial reasons) classes mainly refer to the parts of the rivers with unsuited ground types, like

WATER MANAGEMENT 22
sand and mud (L1) or temperature regimes (B6, and other parts of the rivers above 2,500 m a.s.l.), as well as to the parts after insurmountable obstacles (T2) or the territories of settlements where the fishery is not regulated and the use of forbidden devices for catch is uncontrolled (B4, B5, L4). There can be also some additional factors like unsuitability of hydrophysical or hydrochemical parameters, as well as grounds (L4).
Figure 1. Assessment of studied rivers’ potential as spawning areas for Sevan trout The parts called “low potential or unwanted” refer to the places after hard surmountable obstacles (L3) and with open access for dwellers and livestock in spawning seasons (T1, B2, B3). Some specific parameters like water level (T1), ground types (B2) have also had impact on the assessment. The other parts (B1, BT2, and L2) have quite appropriate conditions to support natural reproduction of Sevan trout and further growth of fries in that areas, but there is no place ideally suitable for this fish nowadays. Even the parts assessed as appropriate need some improvement of several parameters, like cleaning of river beds from the accumulated waste (BT2), improvement of the water quality (B1, L2) by the treatment of wastewater, regulation of marginal poaching (L2) etc. ACKNOWLEDGEMNT All materials have been gathered by the financial support of Rufford Foundation under “The study of reproduction ecology of endangered endemic fish species Sevan Trout” project. REFERENCES Ecology of Lake Sevan during the period of water level rise. (2010). Pub. “Nauka DNC”, Makhachkala, 19-30
(in Russian). Smoley, A.I. (1987). Some aspects of current state of Lake Sevan ichthyofauna and its preservation. Proceedings of the
conference “Nature, city, human”, Yerevan, 147-149 (in Russian). Semenchenko, V.P., Razluckiy, V.I. (2010). Ecological quality of surface water, Publishing “Belarusskaya Navuka”,
Minsk, 329 (in Russian).

WATER MANAGEMENT 23
30 Years of Water Reuse in Spain. Looking Back to Tackle the Future A. Borge* * Department of Technical Studies, Spanish Association of Water Supply and Sanitation (AEAS), Sor Ángela de la Cruz 2, 13D 28020, Madrid, Spain (E-mail: [email protected])
WATER REUSE IN SPAIN. SOLUTION OR NEED? Spain is a country with heterogeneous rainfall regimes, both in space and in time. Average annual values fall below 200 mm per year in the southeast (MARM, 2010), similar to those that exist, for instance in the 80 % of Jordan (RLE, 1987). Projections of climate change’s studies predict a worsening of the water scarcity situation. Some studies estimate rainfall reductions between 10 and 20 % (MET, 2011) with values up to 50 % in the southeast (EUWI-MED, 2007). Although Spain is already one of the European countries with the highest water stress (PWC, 2014), this scenario of Climate Change shows the need to provide for adaptation to this new situation. Progress towards compliance with the European Directive 91/271 represents a substantial increment of the wastewater reuse potential. The volume of treated wastewater has risen from 51 % in 2002 (AEAS, 2002) to the current 86 % compliance with the Article 4 (EC, 2016; Torres, 2014). The widespread of water reuse in some areas of the country would be an important step forward in their adaptation to the climate change scenario. Along with demand management, desalination, savings and other strategies, wastewater reuse represent a very important additional potential capacity to balance the water resources. Although the goals have not been achieved, the progress in technology and regulation keep Spain today as a world leading country in wastewater reuse. DEVELOPMENT OF THE LEGISLATIVE FRAMEWORK (1985-2015) In 1985, the Water Act provided for the first time in the Spanish legislation the reuse of treated wastewater. The conditions for its implementation would depend on "the purification processes, quality and intended use". The use for human consumption was prohibited except "catastrophic and emergency situations" and always appropriate health checks. However, RD 11/1995 that transposed Directive 91/271 into Spanish law made no mention of reuse despite its Article 12. On the other hand, the Water Framework Directive (WFD) considers wastewater reuse as a possible measure of water status improvement along with others such as desalination or aquifer recharge. The reuse of wastewater has being a topic of maximum interest in Spain in the last years. In 1995 the National Sanitation and Wastewater Treatment Plan was approved. At regional level, Murcia’s Region developed its Law 3/2000 and Madrid’s Region its Wastewater Treatment Plan. In addition, Law 10/2001 and Law 11/2005 on the National Hydrological Plan agreed on the need to "foster obtaining alternative sources such as desalination (...) wastewater reuse and rainwater runoff". Although a RD draft for wastewater reuse already existed in 1994, was not be embodied until 2007. RD1620/2007 definitively established a legal framework in Spain for the reuse of treated wastewater. Although there are certain improvable aspects (Estevez, 2010; Olcina et al., 2010), it presents the basic requirements for wastewater reuse. The quality criteria established, like other European countries, were based on values of acceptable risk similar to those of WHO (Iglesias et al., 2010).

WATER MANAGEMENT 24
Between 2007 and 2015, many papers have been published about the technology and planning of wastewater reuse systems. In Spain, the National Plan for Water Quality (2007) and the draft of the National Wastewater Reuse Plan (2010) are highlighted. In Europe, recent year publications expose the need to adopt a more proactive position. Some relevant examples are the EUWI-MED (2007), and the communications and reports published and financed by the European Commission. SOME DATA ABOUT WATER REUSE IN SPAIN The uses of treated wastewater in Spain are mainly agricultural (74.3 %), environmental (10.2 %), recreational (8.9 %) and urban (6.2 %) (Iglesias et al., 2010). The environmental uses include aquifer recharge, recovery of wetlands, increment of river flows and saline barriers. By areas, reused water is mainly used in the Mediterranean coast, the south and the Canary and Balearic Islands. The first reuse projects in Spain date back to the early 90s. Results can be obtained from applications and studies in Madrid, Girona, Canary Islands, Murcia or Vitoria. Spanish reuse studies are well known in Europe. Annex B of EUWI-MED (2007) and EC (2015) exposes some of the flagship projects. The goal of reused volumes in Spain has remained far from being achieved. However, the National Reuse Plan established in 2010 a more accurate goal: 1.130 Hm3/year for 2021, with an associated investment of 1,000 M€. To achieve it, in addition to the corresponding investment, it will be also necessary to assess the weaknesses of previous plans and projects as well as a reflection of the importance of water price in the development of wastewater reuse projects. Currently, a volume close to 400 Hm3/year is reused, which corresponds to 9 to 13% of the total volume of wastewater treated. The main challenges identified to wastewater reuse expansion in Spain are economic and regulatory. Social barriers are overcome and the environmental benefits are clearly identifiable. CONCLUSIONS The wastewater reuse projects carried out in Spain over the past 30 years are a landmark in Europe. However, although RD1290/2007 definitively established a legal framework for the reuse of treated wastewater, in the last 10 years the volume has not significantly increased. Currently, the European Commission, with the collaboration of AEAS among others, is working on the draft of the future European wastewater reuse guide, widely demanded by southern countries since many years ago. This guide can be an opportunity to update national legislation and achieve the goals set in the past. In addition, after 7 years since its publication, updating the Spanish reuse database seems necessary. REFERENCES AEAS (2002). VII National survey of water supply and wastewater in Spain. Estévez, F. (2010) A proposal to modify the RD 1620/2007 of wastewater. XXX Technical Congress of AEAS. EC (2015). Optimising water reuse in the EU. Final report – Part I– DG ENV. European Commission. EC (2016). Eighth Report on the Implementation Status and the Programmes for Implementation (as req. by Art. 17) of
Council Directive 91/271/EEC concerning urban waste water treatment. EUWI-MED (2007). Mediterranean Wastewater Reuse Report. Produced by the Mediterranean Wastewater Reuse Working Group (MED WWR WG).
Iglesias, R., Ortega, E., Batanero, G., and Quintas, L. (2010). Water reuse in Spain: Data overview and costs estimation of suitable treatment trains. Desalination, 263 1-10.
MARM (2010). National Wastewater Reuse Plan. Ministry of Agriculture and Environment. Preliminary version. MET (2011). Climate: observations, projections and impacts (Spain). Developed by the Met Office at the request of the
Department of Energy and Climate Change of UK’s Government. Olcina, J. and Moltó, E. (2010). Unconventional water resources in Spain: State of the art. Investigaciones Geográficas,
51, 131 - 163. PWC (2014). Water management in Spain. Analysis of the current water sector situation and future challenges. RLE (1987). The economic development of Jordan. Edited by Bichara Khader and Adman Badran. RLE (Routledge
library editions) editions: The economy of the Middle East. Torres, G. (2014). European Funds Program in wastewater treatment. Spanish National Environmental Congress.

WATER MANAGEMENT 25
Buffering and Management of Traffic Origin Pollutants in the Important Lakes A. Çelebi, S.Özdemir, N.N. Nuhoğlu, N. Canseven and H. Uzun* * Department of Environmental Engineering, Sakarya University, 54187, Sakarya, Turkey (E-mails: [email protected]; [email protected]; [email protected]; [email protected]; [email protected])
INTRODUCTION The substance spectrum in traffic areas runoff water includes organic parameters such as polycyclic aromatic hydrocarbons, total petroleum hydrocarbons, total organic carbon, and heavy metals such as Pb, Zn, Cu and materials from de-icing salts such as chloride. Metal partitioning especially their dissolved forms are important for designing appropriate storm water treatment strategies. Buffers can help attenuate sediments and pollutants, screen against human disturbances (such as noise), serve as a habitat transition zones, and contribute to the protection of the given area (e.g., by maintaining microclimate conditions or limiting the spread of invasive species). The main objectives of the present study is to assess, attract of contamination runoff water from road areas for important drinking water source and to be shown of buffering contribution to the best management practices. WATER SUPPLY FROM SURFACE WATER NEAR THE ROADS Surface waters (Lake, river, ponds, etc.) are used urban water supply system and usually need treatment before it is delivered to the all user since they could be contaminated by organic or inorganic pollutants. Traffic source pollutants (Figure 1) could be carcinogen or many other risk for ecosystem or human health.
Figure 1. Study area with highways (D100 and E80)

WATER MANAGEMENT 26
Study area: near the Lake Sapanca which is one of the biggest lakes in the province of Adapazari on the northwest of Turkey. The surface area of the lake varies between 44 and 52 km2 and the elevation varies between about 31 and 33 m. The lake has been used as a source of drinking and process water to the city of Adapazari and some important industries for decades. Today, it is faced with pollution. Two highways pass through land to the south and north areas of the lake. Sampling and analyses: traffic area roads runoff was collected immediately after rain events. Samplers in plastic containers transported to the laboratory, where they were stored at low temperature (4-7 °C) in a dark room. Metals were analysed with ICP-OES, Thermo TM, according to EPA 200.7 by using mix standard solutions. BUFFERING EFFECTS AND ITS IMPORTANT FOR THE RUNOFF CONTAMINATION MANAGEMENT Buffering is defined very generally, as the capacity to resist change. Applied to the question of the transfer of water, contaminants, and sediment in catchment areas, the buffering characterizes the response of a landscape structure to the incoming flows of a given material. Buffering effect being indicated by a reduction of the pollutant load or an attenuation of the emission beyond the buffer zone. Eeffectiveness of the buffer depends on many factors such as the time of interaction of flow within filter strip. Buffer zones benefits with its widths for many case (Figure 2).
Figure 2. Aquatic Buffer benefits (Modified from Spano 2007) Consequently, surface waters especially lake and river which is usable for drinking water sources should be managed carefully. Buffering is very important and necessary way of the water resource protection. REFERENCES Çelebi, A., Özdemir, S. (2014). Mining Wastewater Management and Its Effects to Groundwater and Ecosystem, Water
Science and Technology, 70.9, DOI: 10.2166/wst.2014, 393. Spano, A.J. (2007). Westchester County Aquatic Buffer Guidance.

WATER MANAGEMENT 27
Metal Concentration, Pollution Loads and Effects in Highway Storm Water Runoff for Drinking Water Source A. Çelebi, S.Özdemir and T. Uçkun * * Department of Environmental Engineering, Sakarya University, 54187, Sakarya, Turkey (E-mails: [email protected]; [email protected]; [email protected])
INTRODUCTION Traffic source pollutant not only has potential contamination of air but also could be serious source of contamination for drinking water source. The main risk of traffic area runoff are related to traffic, surrounding land use area, atmospheric contamination, and other climatic, meteorological and environmental conditions. Metals are important pollutants. In general, runoff waters from Parking Lot area and roads contain higher levels of the heavy metals than other types of runoff in drainage systems such as conventional roof runoff. Some heavy metals can have acute or chronic impacts as a result of their accumulation in receiving waters in terms of aquatic habitats, drinking water resources and/or recreational uses. For potential toxic effects, the partitioning dissolved heavy metals is essential because the dissolved fractions are directly biologically available for human body (Çelebi, 2015). The toxicity of heavy metals is a function of several factors such as metal speciation and physical characteristics of receiving waters so as to metal partitioning is important for designing appropriate storm water treatment strategies. The purpose of the present study is to assess of dissolved metals contamination size which runoff water from highway area for important drinking water source (Çelebi & Özdemir, 2014). MATERIAL AND METHOD Study area was chosen as Lake Sapanca is one of the biggest lakes which is located on the northwest of Turkey. The lake is elliptical in shape with axis extending 16 km and has a surface area of about 44.7 km2 and a volume of about 1120 × 106 m3. The surface area of it varies between 44 and 52 km2 and the elevation varies between about 31 and 33 m as seasonal. The lake is comparatively shallow and swampy at both edges; the centre is approximately 53 m deep and average lake depth is 25.8 m (Arman et al., 2009). Study term rainfall amount is shown in Figure 1.
Figure 1. Study term rainfall amount in the area

WATER MANAGEMENT 28
The lake has been used as a source of drinking and process water to a big city and some important industries for many years. It has been faced with pollution, two bigger highways pass through land to the south and north of the lake and traffic source pollution is very important. Sampling and analyses; Road runoff was collected during or immediately after rain events. Primary samplers were plastic containers from which samples were dispensed to glass bottles prior to their transport to the laboratory, where they were stored at low temperature (4-7 °C) in a dark room. Metal analyses were determined according to EPA 200.7 and ISO 11885. Dissolved metals were determined using inductively coupled plasma (ICP) analysis with OES. Detected higher concentrated metals Show in table with comparing other studies. RESULT AND DISCUSSION Detected or higher than threshold concentrated metals are shown in Table 1 with comparing other studies. Chromium, copper, iron, aluminum, lead and zinc metals were detected higher the lake and drinking water standards. Table 1. Over concentrated dissolved metals from runoff storm waters in different regions (Modified from Huber and Helmreich, 2016)
Study Location Vehicles per day High Concentration Dissolved Metals
Prestes et al. (2006) Brazil 9000 Cd, Cu, Pb Xanthopoulos and Hahn
(1995) Germany 3200 Cd, Cu, Ni, Pb, Zn
MacKay et al. (2011) USA 3000 Cu, Pb, Zn Davis and Birch (2010) AUS 2000 Cu, Pb, Zn Maniquiz-Redillas and
Kim (2014) Korea -
Cd, Cr, Cu, Fe, Ni, Pb, Zn
SEH (2010) DEU 12,800 Cd , Cu , Pb, Zn Rutz (2009) CHE 12000 Cd, Cr, Cu, Pb, Zn
Westerlund et al. (2003) SWE 7400 Cd, Cu, Ni, Pb, Zn Hilliges et al. (2013) DEU 57000 Cu, Pb, Zn Klimaszewska et al.
(2007) POLAND 59000 Cd, Pb, Zn
Chang et al. (2009) CHİNA 30000 Cu, Pb, Zn (2016) present study TURKEY 10000 Cr, Cu, Fe, Al, Pb, Zn
As conclusion; several heavy metals still are detected high concentration likewise many region in the world last decades. This metals are risky for ecosystem and human health need to be studied more and treatment must be efficiently. REFERENCES Arman, H., Ileri, R., Dogan E,, Eren, B. (2009). Investigation of Lake Sapanca water pollution, Adapazari, Turkey.
International Journal of Environmental Studies, 66 (5), 547-61. DOI 10.1080/00207230902842776. Çelebi, A. (2015). Trace metal surface water inflow and retention in different terms of the wetland. Desalination and
Water Treatment, DOI:10.1080/19443994.2015.1094417. Çelebi, A., Özdemir, S. (2014). Mining Wastewater Management and Its Effects to Groundwater and Ecosystem. Water
Science and Technology, DOI: 10.2166/wst.2014, 393. Huber, M., Welker, A. and Helmreich, B. (2016). Critical review of heavy metal pollution of traffic area runoff:
Occurrence, influencing factors, and partitioning. Science of the Total Environment, 541, 895-919.

WATER MANAGEMENT 29
The Regional GIS Modelling for Groundwater Resources Monitoring and Management L. I. Davybida* and M. M. Tymkiv* * Department of Geotechnogenic safety and Geoinformatics, Ivano-Frankivsk National Technical University of Oil and Gas, 15 Karpatska, Ivano-Frankivsk, Ukraine (E-mails: [email protected]; [email protected])
INTRODUCTION Groundwater is the strategic source of water probability for Ukraine. Regional groundwater level monitoring is very actual and provides important information for all groundwater studies and groundwater resources management (Taylor, 2001; Zektser, 2010; Yangxiao, 2013). The purpose of the research is regional modelling of natural hydrodynamic regime using GIS approach and a universal prediction algorithm for exogenous processes (Кузьменко, 2007). MATERIALS AND METHODS
The studied areas are Zhytomyr and Dnipropetrovsk regions, wich have different hydrogeologic conditions. Observations of hydrogeological wells, hydrological and meteorological posts of these areas were considered. Analysis of time series of long-term monitoring data was carried out using seasonal decomposition and Fourier spectral method. An effective tool for the study of spatial characteristics of the hydrogeological mode is GIS (Figure 1).
Figure 1. Flowchart of design and using of GIS database for monitoring and management groundwater resources
WATER MANAGEMENT 30
RESULTS AND DISCUSSION It was established that the main role in the formation of water exchange in the system of aquifers and groundwater resources processes played by vertical relations of aquifers. The mode of groundwater is a complex function of influence of metrological, hydrological, geological and others factors. The methodology of long-time regional forecasting natural regime of groundwater on a geoinformation approach basis has been developed. For the investigated areas of Zhytomyr and Dnipropetrovsk regions the territories with the homogeneous mode of levels were allocated using GIS-technology of the information and spatial analysis, given the location of analogical wells and hydrogeological zoning of the territory of Ukraine. The results of research are the series of probability of groundwater levels, presented as a series of maps according to the selected areas. For years with the maximum water content for the forecast period the geoinformation models of groundwater levels were created the relevant cartogram of the absolute depth for studied territories. Additionally regional cartographic models of the prognostic probability of levels were constructed as maps with charts allowing visualizing the spatial distribution of target probability of groundwater levels and its variability over a certain time interval. The results of research are the base for the construction of the geographic information system for prediction of the mode of groundwater levels and its adaptation for other areas when the proposed research methodology would be saved. CONCLUSION
The results of the hydrogeological monitoring are the input data for GIS modelling and prediction of spatial and temporal trends of underground hydrosphere, which is demonstrated by the long-term forecast of regional variability of groundwater levels for the Zhytomyr and Dnipropetrovsk regions of Ukraine. The research results are the basis for building a geoinformation system to forecast modes of groundwater, and its application to other areas, based on the proposed research methodology. REFERENCES Кузьменко, Э.Д. (2007). Универсальный алгоритм прогнозирования экзогенных геологических процессов. Матеріали VІІІ Міжнар. наук. конф.“Моніторинг небезпечних геологічних процесів та екологічного стану середовища”. КНУ ім. Т. Шевченка, 16-17 (Kyiv, Ukraine).
Taylor, Charles J. (2001). Groundwater-level monitoring and the importance of long-term water-level data / by Charles J. Taylor, William M. Alley. (U.S. Geological Survey circular 1217) (Denver, Colorado).
Yangxiao, Zh., Dianwei, D., Jiurong, L., Wenpeng, Li. (2013). Upgrading a regional groundwater level monitoring network for Beijing Plain, China. Geoscience Frontiers, 4, 127-138.
Zektser, I. (2010). Modern state of fresh groundwater regional researches. Aquamundi, 1, 29-36.
WATER MANAGEMENT 31
Geographical Impact of Dyke Measurement for Land Use on Flood Water in the Mekong Delta V.H.T. Duong *, F. Nestmann *, T.C. Van**, P. Oberle* and H. Geiger *** * Karlsruhe Institute of Technology, Kaiserstraße 12, 76131, Karlsruhe, Germany (E-mails: [email protected]; [email protected]; [email protected]) ** Mekong Water Technology Innovation Institute, HCMC, Vietnam (E-mail: [email protected]) *** Katholischer Akademischer Ausländer-Dienst, Bonn, Germany (E-mail: [email protected])
INTRODUCTION The Mekong River Delta has an area of 3.9 million hectares, and is home of 18 million inhabitants. It is one of the largest river deltas in the world which originates at the Tibetan plateau and crosses China, Myanmar, Laos, Thailand, and Cambodia before entering the territory of Vietnam. With an area of about 5 % of the Mekong River basin and low-lying topography (mostly below +2 m a.s.l.), the delta is annually impacted by flooding from upstream. Due to the strategy for intensive rice-based production issued by the Government of Vietnam (Benedikter, 2013), a multitude of compartments enclosed by semi-dykes (to protect rice fields from flood water until middle August) and full-dykes (to protect the rice fields fully from flood water) have been built rapidly in the flooded areas in recent years. Consequently, they cause impacts on the flood situation in the Mekong delta. To explore comprehensively these influences, 1D hydrological model was used to analyse the impacts of several full-dyke compartments on the flood water along the main rivers based upon a Geographical Impact Factor (GIF). MATERIAL AND METHOD Base on the maximum flood extent on 30.10.2000 (Duong et al., 2014), the delta is divided into 22 compartments; in which each of them is bounded by main canals and rivers (Figure 1, left). MIKE11 hydrodynamic module (HD) is applied for simulation the river network in the Mekong delta (Dung et al., 2011). The hydraulic network was very well calibrated for the high flood (2011), then it was validated for medium flood (2013) and small flood (2012). The simulation works were carried out for the three types of floods with 72 scenarios including (i) no-dyke system in 22 compartments (03 scenarios); (ii) one compartment with full-dykes while other 21 compartments with no-dykes (66 scenarios), and (iii) the whole 22 ones with full-dyke system (03 scenarios). The authors define a new parameter called Geographical Impact Factor (GIF) used to quantify the impact of full-dyke measurement for rice practices at each compartment. It is defined as follows:
( )( ) ibaselinetotal
baselineii A
1ZZZZ
GIF−
−= , (1)
where GIFi – the geographical impact factor at compartment i; Zbaseline – the water level at a considered point on Mekong rivers with no-dyke systems at 22 compartments (cm); Zi – water level at a considered point with full-dyke system at compartment i (cm); Ztotal – water level at a considered point due to full-dyke systems at 22 ones (cm); Ai – the area of compartment i (ha).
WATER MANAGEMENT 32
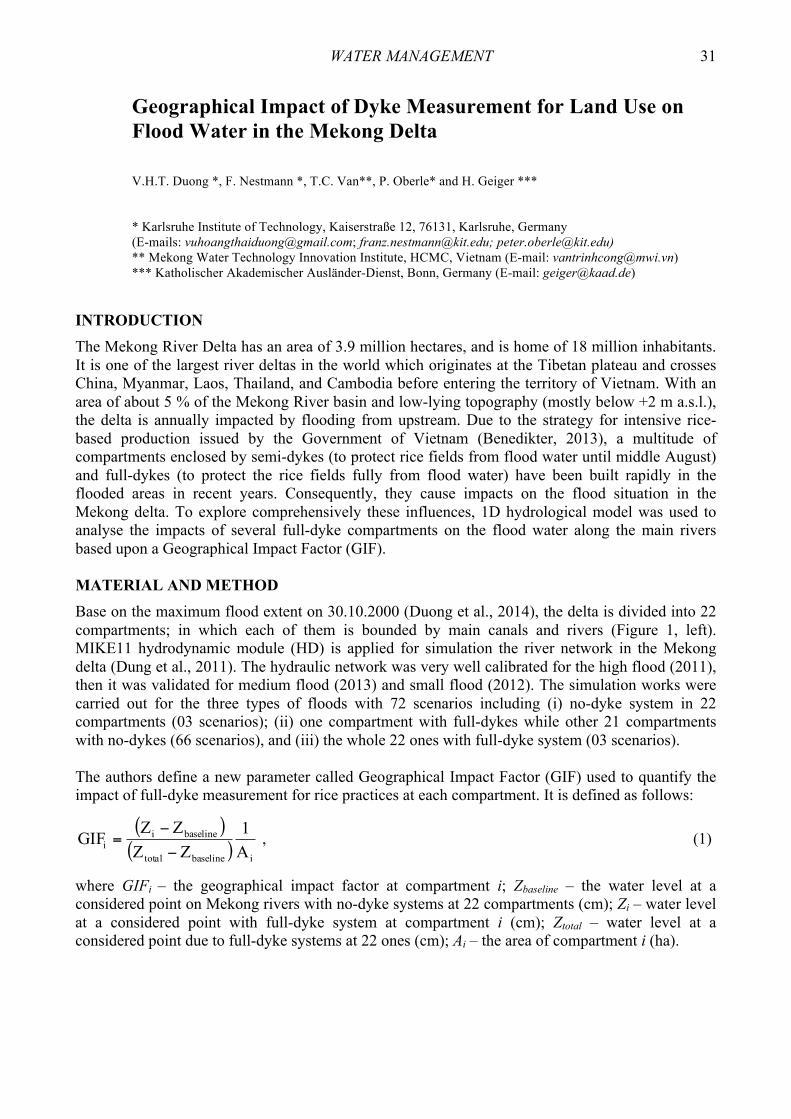
RESULTS AND DISCUSSIONS In general, full-dyke measurements for land use purposes cause relatively minor impacts on the water level in Mekong and Bassac rivers. However, the full-dyke measurements at compartments of A10, A11, A12 indicate higher impacts on water levels along the main rivers.
Figure 1. Mekong delta with 22 compartments (left), and the GIF10 along Mekong river (right) For instance, the full-dyke construction in the A10 compartment is very sensitive to the change of water level on Mekong river, these changes depend on the magnitude of floods (Figure 1, right). This compartment is the first area of the delta that receives flood water from upstream Mekong river, therefore the full-dyke system prevents the flood water delivering from Mekong river to Bassac river. As a result, although the compartment increases the water level at Tan Chau (P1), a decrease in the river stage at Chau Doc (P6) is found. The same pattern of the water level changes is also identified at Vam Nao (P2) but this no longer exists after Cao Lanh (P3). Regarding the magnitude of floods, the GIF10 indicates a strong impact of the A10 on water level along the Mekong river in the small flood. However, this tendency is reduced with medium and high floods. CONCLUSIONS The Geographical Impact Factor (GIF) might be used as an expression of the influence of dyke measurements on flood water level along the main rivers. The authors found that different geographical compartments caused different rates of influences on the flood water levels along the Mekong and Bassac rivers. The GIF is established to help scientists and planners in various aspects. It could anticipate a possible impact of the full-dyke measurement on the water level along the main rivers. Besides, it will be a scientific base to develop an interpolation tool for flood water level prediction in the Mekong delta. Agricultural production plans could be optimized according to accepted flood water level along the rivers. In other words, the smaller the GIF identified for any full-dyke compartment is, the better for rice cultivated in that compartment will be. REFERENCES Benedikter. (2013). The Vietnamese Hydrocracy and the Mekong Delta. ISBN 9793643904379. Dung N.V. et al. (2011). Multi-objective automatic calibration of hydrodynamic models utilizing inundation maps and
gauge data. Hydrol. Earth Syst. Sci., 15, 1339-1354. Duong et al. (2014). Land use based flood hazards analysis for Mekong delta. 19th IAHR Asian and Pacific Regional
Division 2014, Hanoi, Vietnam, Sept. 21-24, ISBN: 978-6048213831.
WATER MANAGEMENT 33
Distribution of Heavy Metals in the Environmental Samples of the Voghji River Basin Impacted by Mining Activities A.V. Gabrielyan*, G.A. Shahnazaryan* and S.H Minasyan** * Environmental Impact Monitoring Center, 29 Komitas Str., 0012 Yerevan, Republic of Armenia (E-mails: [email protected]; [email protected]) ** Institute of Chemical Physics NAS RA, 0014Yerevan, 5/2, P. Sevak str., Republic of Armenia (Е-mail: [email protected])
INTRODUCTION This paper intends to analyse the distribution of heavy metals (Mn, Co, Ni, Cu, Zn, As, Mo, Cd, Pb, Ti) and their impact on the water quality of the Voghji River Basin. There are two big mining areas in the Voghji River basin. One of them (Zangezur copper-molybdenum combine) is located in the upper part of the Voghji River in the Kajaran City, in the southeast corner of Armenia. The second mining area is located in the down part of the Voghji River, 1.5 kilometres east of the town of Kapan (Dundee precious metals), in the southeastern corner of Armenia. These mining activities have led to the severe degradation of the local environment in the Voghji River basin due to the lack of adequate management and planning, as well as poor operating experience and waste management (Kurkjian, 2000; Vardumyan et al., 2011; Belyaeva, 2012). RESULTS AND DISSCUSION Stream water and sediment samples were collected 8 different sampling sites of the Voghji River basin at the period 2014-2015. Sampling sites were selected with the aim to cover the whole stream from its source to its confluence with two mining area (Table 1). Table 1. Location of sampling points, Voghji River basin
Points Location 1 Voghji River, before confluence with ZCMC, upstream of the Qajaran city 2 Voghji River, after confluence with ZCMC, downstream of the Qajaran city 3 Voghji River, after runoff Geghi river, upstream of the Kapan city 4 Voghji River, after confluence with wastewater from Kapan mining area 5 Artsvanik River, upstream of the Arcvanik tailing dam 6 Artsvanik River, mouth, downstream of the Artsvanik tailing dam 7 Geghi river, source 8 Geghi river, mouth
Collection and handling of water and sediment samples were conducted in accordance with standard methodology. Sediment samples were dried at 20oC temperature until stable weights. Then dried sediments samples were placed into the digestion vessel with 12 mL of HNO3/HF (3:1 v/v) and digested in a microwave digestion system speed wave MWS-3+. Heavy metal concentrations in the samples were determined by inductively coupled plasma-mass spectrometry method using ICP-MS ELAN 9000. The results of heavy metals analysis of the water (WS) and sediment (SS) samples are shown in Table 2.

WATER MANAGEMENT 34
Table 2. Heavy metal contents in the water (in µg/L) and sediments (in mg/kg) in the Voghji River basin mean for 2014-2015
Sampling sites Ti Mn Co Ni Cu Zn As Mo Cd Pb
1-WS 1.81 4.37 0.094 0.924 3.68 3.60 1.07 7.57 0.053 0.072 1-SS 840 450 5.34 11.3 119 41.4 6.93 24.0 0.324 11.5 2-WS 5.94 17.8 0.222 1.25 10.4 5.27 1.41 77.9 0.215 0.377 2 -SS 2037 239 8.12 14.8 620 99.6 9.41 109 0.44 30.1 3-WS 3.08 8.01 0.192 0.961 6.60 2.20 2.05 40.0 0.124 0.194 3-SS 4203 245 13.8 17.0 494 54.4 29.7 80.0 0.329 40.5 4-WS 3.93 167 2.29 2.03 99.2 97.1 1.81 108 1.28 0.469 4-SS 1499 75.4 4.36 3.22 137 67.2 11.8 25.4 0.966 18.4 5-WS 4.34 3.37 0.233 1.29 1.60 3.36 0.830 15.2 0.078 0.118 6-WS 4.61 168 0.784 2.24 15.1 103.8 3.32 427 2.21 0.507 7-WS 3.11 9.52 0.184 0.719 1.73 1.55 0.407 6.32 0.030 0.185 8-WS 0.278 1.05 0.016 0.081 0.340 0.213 0.114 1.22 0.004 0.018
The results were shown that after the influence of ZCMC the content of Ti, Mn, Mo, Cd and Pb were increased. Elevated concentration of those metals was related to the discharge of wastewater and, diffuses drainage water flows through the influx of water into the river Voghji. After the influence of Kapan mining activity, the content of Mn, Co, Cu, Zn and Cd was sharply increased. The high content of Mn, Zn, Cd and Pb after Kapan city was related to runoff of discharged wastewater of Arcvanik tailing dam. The content of Co and Cu might be related to runoff of discharged wastewater of Geghanush tailing dam. In the sediments of the Voghji River, the content of heavy metals was increased not so much as in the stream water. Slightly increase of Ti, Cu, Mo and Pb was observed in downstream of the city Qajaran. It was found the correlation between the ratio of heavy metals in water and sediment. In the upper part of the Voghji River, the ratio of Cu/Zn in the water samples was nearly 1. The same value was in the source of Geghi River. Then, after ZCMC the ratio of Cu/Zn was 2-3 and after the city of Kapan, the ratio was again 1 despite sharp growth of Cu and Zn. In the sediment samples of upper part of the Voghji River, the ratio of Cu/Zn was 3. After ZCMC, the ratio was increased to the same extent and was 6-9. CONCLUSION Mining industry impact is significant along by Voghji River. The waters of Voghji River were highly polluted by Mn, Co, Cu, Zn, Mo, Cd and Pb. The relation of metals content was highly changed due to anthropogenic impact disturbing the geochemical balance of the Voghji River. REFERENCES Kurkjian, R. (2000). Metal Contamination in the Republic of Armenia. Environmental management, 25(5), 477-483. Vardumyan, L., Vardumyan, E., Pirumyan, G., Minasyan, S. (2011). Water quality assessment of southern river basin in
the Republic of Armenia by using principal component analysis method. Proceedings of Engineering Academy of Armenia, 8(1), 196-202.
Belyaeva, O. (2012). Impact of mining enterprises of the city of Kapan on adjacent agroecosystems. Electronic Journal of Natural Sciences, 2(19), 26-30.

WATER MANAGEMENT 35
Coupled Urban Areas Inundation Model with Interaction between Storm Water System and Surface Flow – Case Study of Sea Level Impact on Seaside Areas Flooding J. Hakiel, M. Szydłowski and D. Gąsiorowski* * Department of Hydraulic Engineering, Faculty of Civil and Environmental Engineering, Gdańsk University of Technology, G. Narutowicza 11/12, 80-233 Gdańsk, Poland (E-mail: [email protected])
INTRODUCTION Inundations are becoming more frequent than ever. What is connected with increasing area of impervious surface in cities. This makes predicting urban flooding and its scale especially important. At the seaside we observe additional conditions such as sea level that makes accurate numerical modelling of issue even harder. With complex approach to the matter which is simultaneous calculation of storm water conduit flow and overland flow we can improve obtained results. In this paper, we will try to evaluate how water level at output of drainage system which stands for sea level impact calculation. This will be tested on 1D numerical model of pipe flow, surface flow and interaction between those. NUMERICAL MODEL Model of Storm Water Pipe Flow In sewer pipes we usually observe free surface flow which can be described using the Saint-Venant equations. To correctly reproduce the steep water surface fronts which can occur during high surface water runoffs conservative form of equations were used (Cunge et al., 1980), which can be written as (Szymkiewicz, 2010).
SxF
tU
=∂
∂+
∂
∂ , (1)
where the vectors U, F and S are given as
⎟⎟⎠
⎞⎜⎜⎝
⎛=QA
U , ⎟⎟⎠
⎞⎜⎜⎝
⎛
+=
IA/QQ
F 2, ⎟⎟
⎠
⎞⎜⎜⎝
⎛
−=
)SS(gA0
Sf0
, (2)
where x stands for distance; t – time, A – the cross-sectional wetted area; Q – the flow discharge and g – the gravitational acceleration; I = gAhc, where hc – the distance between the free surface and centroid of flow cross-sectional area. S0 and Sf – the bottom and friction slopes. To simulate characteristic flow in storm water conduits the “Preissmann slot” concept was applied, which allow calculation of transient flow (Szydłowski, 2012). Pipe flow model was solved by applying improved McCormack scheme (Tseng, 2003) of finite differences method (FDM) Model of Overland Water Flow The one dimensional (1D) overland flow was described using nonlinear diffusive wave equation
WATER MANAGEMENT 36
0xHK
xtH
=⎟⎠
⎞⎜⎝
⎛∂∂
∂∂
−∂∂ , (3)
where x – distance; t – time; H – the water surface elevation above the assumed datum and K – coefficient of diffusion. The K is defined as
2/13/5
xHh
n1K
−
∂∂
= , (4)
where n – Manning roughness coefficient and h=H-Z which is the flow depth. Above equation was solved using modified Galerkin finite elements method (FEM) (Gąsiorowski, 2013). Interaction between models To evaluate flow exchange between storm water conduit and surface interaction formulas were implemented into numerical model. There are three formulas used according to actual conditions (Chen et al., 2007), which are the direction of exchange (dependant on water elevations in manhole and on surface) and ratio of the manhole area to the overland flow depth. One of the equations for free weir linkage of sewer and surface can be written as
[ ] ( ) 2/3crestUwd2mh zhg2wchhsignQ −−= , (5)
where Q – discharge of interaction; hmh, h2d and zcrest – respectively water elevation at manhole, water elevation on surface and crest elevation; cw – weir discharge coefficient; w – weir crest width and hU – the upstream water depth which means hU=max{hmh,h2d}. Basic formulas does not take into consideration overland water flow velocity. To evaluate how it impacts the actual interaction, laboratory tests were held. As a results difference between calculated (without velocity) and actual inflow into manhole was obtained. Experiments led to empirical implementation of overland water flow velocity into weir discharge coefficient (cw). CASE STUDY Described model was used to evaluate the impact of sea level on urban areas inundation for Gdańsk seaside area. Calculations were made for single street with storm water pipe underneath it. The manholes were implemented as flow exchange points. The results of calculations are presented in papers. REFERENCES Chen, A., Djordjević, S., Leandro, J., Savić, D. (2007). The urban inundation model with bidirectional flow interaction
between 2D overland surface and 1D sewer networks. Novatech 2007, GRAIE, Lyon, France. Cunge, J.A., Holly, F.M., Verwey, A. (1980). Practical Aspects of Computational River Hydraulics. London: Pitman
Publ. Ltd. Gąsiorowski, D. (2013). Analysis of Floodplain Inundation Using 2D Nonlinear Diffusive Wave Equation Solved with
Splitting Technique. Acta Geophysica, 61, 668-689. Szydłowski, M., Machalińska-Murawska, J. (2012). Numerical Simulation of Transient Flow in Storm Sewers Using
Standard and Improved McCormack Scheme. Task Quarterly, 16(1), 53-74. Szymkiwicz, R. (2010). Numerical Modeling in Open Channel Hydraulics. Springer, London. Tseng, M.H. (2003). The Improved Surface Gradient Method for Flows Simulation in Variable Bed Topography
Channel Using TVD-MacCormack Scheme. Int. J. Numer. Meth. Fluids, 43, 71-91.
WATER MANAGEMENT 37
Taking into Account Energy Losses under Calculation the Free-Surface Profile of Undular Jump O. Halych* * Department of Hydropower, Heatpower Engineering and Hydraulic Machines, National University of Water and Environmental Engineering, Soborna St., 11, Rivne, Ukraine (E-mail: [email protected])
CHARACTERISTIC OF UNDULAR JUMP When the rapid change in the depth of flow is from a low stage to a high stage, the result is usually an abrupt rise of water surface. This local phenomenon is known as the hydraulic jump. If the jump is low, that is, if the change in depth is small, the water will not rise obviously and abruptly but will pass from the low to the high stage through a series of undulations gradually diminishing in size. Such a low jump is called an undular jump (Chow, 1959). The undular hydraulic jump may occur in irrigation and water supply channels, flow under the vertical sluice gate, in estuaries during some period of the tides, and in narrow or shallow straights subjected to strong currents (Chanson, 1995). Also this phenomenon often occurs at the downstream of low drop structures or in a transitional region from steep to mild sloping channels (Gotoh, 2005). When the undular jump takes place in a channel, waves of large amplitudes develop and propagate downstream of the jump. The propagation of the downstream free-surface waves must be taken into account for the design of canals and for the maintenance of natural channels. The wave height is an important design parameter that determines the required height of the canal sidewalls. In natural channels the embankment height must be higher that the crest of the free-surface undulations to prevent overtopping and the subsequent erosion leading ultimately to the destruction of the banks. Further the propagation of free-surface waves might impose additional impact load, perturbations and vibrations on downstream canal structures: e.g., gate, lock, weir (Chanson, 1995). The undular jump is characterized by Froude number (Fr). It is a dimensionless number that states the characteristics of flow which can be obtained by the equation 1. The undular jump formed by supercritical flow at the upstream that has a low value of Fr from 1 to 1.7 (Chow, 1959).
gLVFr = or
3gh
qFr = , (1)
where V – the mean velocity of flow; g – the acceleration of gravity; L – a characteristic length; q – specific discharge; h – flow depth in a consider cross-section. CALCULATION THE FREE-SURFACE PROFILE OF UNDULAR JUMP As was showed earlier, it is necessary to calculate main characteristics and free-surface profile of undular jump. There are many different methods of calculation it, but some of them can be used when Fr1 < 1.4 in initial cross-section. When Fr1>1.4, these methods are not effective (Riabenko, 2015) because they don’t take into account energy losses in undular jump (Eq.2):
⎟⎟
⎠
⎞
⎜⎜
⎝
⎛⎟⎟⎠
⎞⎜⎜⎝
⎛
η
α−+η−β= 2
2
22
211
w 12Fr
hh 1 , (2)
where hw – energy losses; β1 – a coefficient which depends on the non-hydrostatics coefficient s1

WATER MANAGEMENT 38
and can be found as β1 = (1+2s1)/3; α2 is Coriolis coefficient; η2 – the ratio of second conjugated depth h2 with the first conjugated depth h1. The specific energy can be found
2Fr
hE 2
11
1 1+β= . (3)
The maximum depth of undular jump can be obtained by formula:
⎥⎥
⎦
⎤
⎢⎢
⎣
⎡
⎟⎟⎠
⎞⎜⎜⎝
⎛−+−⎟⎟
⎠
⎞⎜⎜⎝
⎛−+⎟⎟
⎠
⎞⎜⎜⎝
⎛−= 1Fr
hE23
hh
hE
4hh
hE
h32h 2
1
12
1
w
1
1
1
w
1
11cr 1
. (4)
To calculate the free-surface profile of undular jump, it can be considered as combination of solitary wave and cnoidal waves, they can be calculated by equation:
( ) ⎟⎠
⎞⎜⎝
⎛Δ
−+= k,x
cnhhhh 21cr1cr (5)
where Δ – a parameter of cnoidal waves; k – a module of cnoidal waves. Hydraulic modelling of undular jump was made for comparison of experimental data with theoretical one (Riabenko, 2015). Figure 1 shows the results’ comparison of undular jump’s free-surface profile calculated by suggested method and method of VNIIG (Gunko, 1974).
Figure 1. Free-surface profile of undular jump (q = 0.042 m2/s, h1 =0.048 m, Fr1=1.65) CONCLUSION Figure 1 shows, that the free-surface profile of undular jump built by VNIIG method is higher comparatively to experimental data, because this method does not take into account energy losses. The free-surface profile of undular jump built on the basis of the suggested method is within the same range as experimental data. Main characteristics provide a good convergence of the results and are confirmed by principal accurateness of the method, which takes into account energy losses. REFERENCES Chanson, H. (1995). Flow characteristics of undular hydraulic jumps. Comparison with near-critical flows. Report CH
45/95. The University of Queensland, Australia, 202. Chow, W.T. (1959). Open channel hydraulics. McGraw-Hill, New York, 680. Gotoh, H., Yasuda, Y., Ohtsu, I. (2005). Effect of channel slope on flow characteristics of undular hydraulic jumps.
WIT Trans. Ecology Envir., 83, 33-43. Gunko, F.G. (1974). Hydraulic calculations of structures, control of turbulence flow. Recommendations for designing.
Leningrad. Energia, 110 (in Russian). Riabenko, O.A., Halych, O.O., Poplavskiy, D.M. (2015). Experimental investigation of near-critical flows’ free-surface.
Visnyk NUWEE. Rivne, 3(71), 94-99 (in Ukrainian).

WATER MANAGEMENT 39
Artificial Fluctuation of Water-Level and Associated Effect on Water Quality of the High-Mountain Lake Sevan A. Hovhannisyan and G. Shahnazaryan* * Environmental Impact Monitoring Center, 29 Komitas Str., 0012 Yerevan, Republic of Armenia (E-mails: [email protected]; [email protected])
INTRODUCTION Lake Sevan is the greatest lake in the Caucasus region and one of the greatest freshwater high-mountain lakes of Eurasia. The lake consists of two morphometrically different basins - the deeper Minor and the relatively shallow Major Sevan (Parparov et al., 1996). It is a very important source of drinking water for Armenia and its adjoining countries. The importance of Lake Sevan in the economy of Armenia can scarcely be exaggerated: it is the main source of irrigation water and provides cheap electricity, fish, recreation, and tourism. Between 1933 and 1960s, the lake level had been lowered by 20 m below the original level by increasing the lake outflow intermittently for irrigation and electricity generation. Before the increased artificial outflow the surface of Lake Sevan was at an altitude of 1916.2 m asl with a surface area of 1416 km2 and volume of 58.5 km3. This evidently had ecological and economical consequences on the lake ecosystem (Heblinski et al., 2011; Wilkinson et al., 2010). A number of measures were undertaken to arrest further deterioration of the lake. More water was brought to the lake from other catchments through several tunnels, which resulted in an increase of 1.5 m in the lake water level. There had been a general increase in the water level from 2001 to 2015 raising water level up to 1900.24 m asl. This paper intends to analyse the changes of water quality of the lake Sevan in relation to the water-level fluctuation during the period 1977-2015. RESULTS AND DISSCUSION Comparative analysis of water quality was done for the periods 1977-1983, 1984-1989, 1990-2000 and 2005-2015. Water quality of the Lake Sevan has been systematically monitored since 1977 and for this reason, the period 1933-1977 was not included in this research. There are periods when water quality monitoring was not carried out. It is important to note that the frequency of water quality monitoring differed between observed periods. The following water quality parameters were included in this analyses: pH, dissolved oxygen (DO), phosphate (PO4), nitrate (NO3), ammonia (NH4), biochemical oxygen 5-day demand (BOD5), chemical oxygen demand (COD-Cr), calcium (Ca), magnesium (Mg) and total dissolved solids (TDS) in this analysis. For each period mean values were calculated. The results are presented in Table 1. According to the data the period of 1984-1989 the water quality of the lake Sevan was in the most balanced condition. During the period 1977-1983, concentrations of nitrate, ammonium and phosphate ions were higher than in the other three periods.

WATER MANAGEMENT 40
Table 1. Physicochemical parameters in Lake Sevan during the 1977-2015
Parameter 1977-1983 1984-1989 1990-1999 2005-2015
pH 8.74 8.52 8.37 8.57
DO [mg/L] 8.91 9.57 9.09 8.57
PO4-P [mg/L] 0.043 0.011 0.011 0.016
NO3-N [mg/L] 0.518 0.019 0.051 0.081
NH4-N [mg/L] 0.472 0.156 0.089 0.221
BOD5 [mg/L] 2.19 1.95 1.71 2.44
COD-Cr [mg/L] 14.2 16.9 16.1 26.3
TDS [mg/L] 645.0 633.4 632.6 467.8
Ca [mg/L] 27.3 20.5 20.1 27.3
Mg [mg/L] 54.2 56.0 55.0 50.2
During the period 2005-2015 concentrations of nitrate, ammonium and phosphate ions, BOD5 and COD-Cr were increased compared to values for the period 1984-1989 4.4, 1.4, 1.5, 1.3 and 1.6 times, respectively. This increase is mainly due to solution of nitrates, phosphates and organic substances from the flooded of vegetative covered area. Concentrations of total dissolved solids and calcium/magnesium ratio has decreased 1.4 and 1.3 times, respectively. For the period 1984-1989 nitrogen/phosphorus ratio was about 20. After 2005 nitrogen/phosphorus ratio was increased sharply due to leaving shoreline vegetative covered area under the water. CONCLUSION The lake is still in unbalanced condition. The content of organic matter is increasing. It is great concern that lake will be changed from oligotrophic condition to mesotrophic. REFERENCES Heblinski, J., Schmieder, K., Heege, T., Agyemang, K., Sayadyan, H., Vardanyan, L. (2011). High-resolution satellite
remote sensing of littoral vegetation of Lake Sevan (Armenia) as a basis for monitoring and assessment. Hidrobiologia, 661, 97-111.
Parparov, A., Hambright, D. (1996). A Proposed Framework for the Management of Water Quality in Arid-Region Lakes. Int. Revue ges. Hydrobiol., 81(3,) 435-454.
Wilkinson, I., Gulakyan, S. (2010). Holocene to Recent Ostracoda of Lake Sevan, Armenia: biodiversity and ecological controls. Stratigraphy, 7(4), 301-315.

WATER MANAGEMENT 41
Wind Generation Powered Pumped-storage Hydroelectricity as a Fully Dispatchable Power Unit - Case Study Pomerania and West Pomerania Provinces - Poland J. Jurasz*, J. Mikulik* and A. Piasecki** * AGH University, Faculty of Management, Department of Engineering Management, Aleja Mickiewicza 30, Kraków 30-059, PL (E-mails: [email protected]; [email protected]) ** AGH University, Faculty of Management, Department of Economics, Finance, and Environmental Management, Aleja Mickiewicza 30, Kraków 30-059, PL (E-mail: [email protected])
INTRODUCTION Renewable energy sources (RES) are generally perceived as a viable solution against dwindling reserves of conventional fuels, increasing pollution and dependence on international exchange of fuels and energy. However, they usually come with greater capital costs and picking demand on energy storage. This is due to their intermittent nature and non-dispatchability resulting from dependence on weather conditions. In consequence the operation of conventional power plants has to be adjusted in order to introduce wind derived electrical energy into the grid. So far, hybrid wind-solar-energy storage power sources have been proposed as an adequate solution for remote communities or far-flung islands (Ma et. al., 2014). Nonetheless, prospects of further decline in green energy costs and increasing efficiency of RES will without doubt lead to their greater market share. By the end of the year 2015 Poland had installed over 5.1 GW of wind power (EWEA, 2016).Within a single day of the year 2015 the biggest difference between maximal and minimal power output from wind generation was equal to 3.6 GW. On average it was slightly greater than 1.1 GW (PSE). According to Polish Power Grid Company over the same year, the mean daily variability in power demand amounted to 6.58 GW and maximal to 9.8 GW (PSE). In short, currently market operators are facing not only a varying energy demand but also predictable to a limited (Lange 2005) extent wind generation. This entails additional forecasts uncertainties and therefore a need for additional spinning reserve. This paper explores the concept presented by (Qian et. al., 2011), which focused on combining pumped-storage hydroelectricity with wind park. The main assumption is that energy from wind generation is always used to pump water into an upper reservoir which is then used, when needed, to generate electricity. This is possible by assuming simultaneous operation of pumps and turbines. DATA AND METHODS
The analysis of mentioned concept was done for two provinces of Northern Poland, namely Pomerania and West Pomerania. As on 2015 following arguments underlie this choice: 27.5 % of polish wind power is installed in West Pomerania, next 11 % is in Pomerania (URE); in 2014, 35 % of total energy generated in West Pomerania came from RES, in Pomerania it is even more 41.3 % additionally they jointly generate 23.4% polish green energy (GUS BDL); both provinces have no access to the identified hard and brown coal resources (PIG, 2012); terrain of both provinces is post-glacial with numerous lakes (152 above 100 ha) and upland moraines which makes it suitable for PSH projects development; their northern frontiers are determined by Baltic Sea which enables development of off-shore wind parks. Data for research was obtained from (IMGW, SODA and PSE) and encompassed: wind speed, terrain elevation, water resources, lakes water level fluctuations and energy demand. Research focused on finding potential sites for new PSH projects

WATER MANAGEMENT 42
and estimating their storage capabilities. Additionally a mathematical model simulating the operation of such fleet of PSH and wind parks located in Pomerania and West Pomerania was developed. The goal was to estimate theoretical storage potential of new PSHs and the best way of utilizing such PSH-wind park power unit in the reality of energy market. Research question was: based on current energy demand, wind conditions, and potential of new PSH in Pomerania and West Pomerania is it better to operate PSH-wind park power units as a baseload or peak load plant? Potential sites for new PSH projects were determined based on: LIDAR data, topographic maps, orthophotomaps, numerical terrain model (DTED 2) and digital borders of protected areas in Poland. First of all, only lakes with surface greater than 100 hectares and with appropriate depth and water resources were selected for further investigation. Lakes and their surroundings (3 kilometers radius from the shoreline) were checked in terms of significant height difference. It was assumed that maximal volume of upper reservoir is constrained by available volume of water from lower reservoir. Here a 0.5 and 2 meters water level fluctuations in lower reservoir/lake have been considered. Described analysis was then conducted by means of Geographic Information System (GIS) in ArcGiS 9.3 software. RESULTS A total of 37 potential sites for new PSH projects have been retrieved based on above describe approach. The average height difference between lower and upper reservoir was estimated to be 44 meters, maximal 80 meters and minimal 21 meters. In case when 2 meters water level fluctuations (which is not uncommon) are considered the total volume of energy which can be stored in upper reservoirs amounted to 52.8 GWh. However, of those 37 potential sites, 16 are situated within landscape parks, so the probability of their launching is relatively small. Considering remaining sites, their energy storage potential is equal to 32 GWh (assuming 90 % efficiency of water turbines). Conducted simulations has shown that currently installed capacity in wind parks and estimated energy storage potential of new PSH projects is not sufficient to establish long term energy self-sufficiency of both provinces based exclusively on PSH-wind power units. In order to do so, the installed capacity of PSH generation should be equal to maximal power demand, whereas pumping capacity should be able to utilize whole electric power from wind turbines. Nonetheless, the concept of PSH powered exclusively by wind turbines seems to be fully dispatchable power source with capability to ensure energy security of Pomerania and West Pomerania provinces. REFERENCES GUS BDL Central Statistical Office, Local Data Bank www.stat.gov.pl/bdl/ 05.02.2016 (in Polish). IMGW Institute for Meteorology and Water Management (in Polish). EWEA. The European Wind Energy Association, http://www.ewea.org/ 10.02.2016. Lange, M. (2005). On the uncertainty of wind power predictions - Analysis of the forecast accuracy and statistical
distribution of errors. Journal of Solar Energy Engineering, 127 (2), 177-184. Ma, T., Yang, H., Lu, L. (2014). Feasibility study and economic analysis of pumped hydro storage and battery storage
for a renewable energy powered island. Energy Conversion and Management, 79, 387-397. PIG Państwowy Instytut Geologiczny (2012). Bilans zasobów złóż kopalin w Polsce wg stanu na dzień 31.12.2011 r.,
Warszawa 2012 (in Polish). PSE Polish Power Grid Company, http://www.pse.pl/ 10.02.2016 (in Polish). SODA Solar Data http://www.soda-pro.com/ 02.02.2016. URE Energy Regulatory Office http://www.ure.gov.pl/ 10.02.2016. Qian, K., Jiang, Y., & Li, Z. (2011). Improve wind energy penetration in an isolated power system by a stand-alone
wind pumped storage hydropower plant. In Remote Sensing, Environment and Transportation Engineering (RSETE), 406-411.
WATER MANAGEMENT 43
Need to Provide Safety Water in River Basin in Korca City S. Kokojka* * Chemical Engineer, Korca Join Stock Company, Korca, Albania (E-mail: [email protected])
INTRODUCTION The paper presents the importance and the necessity to increase the efficiency of cleaning process of the residual waters from several villages close by one the most touristic regions of Albania. A case study is undertaken to discuss the implementation of the European Union Directive on the Albanian legislation for the treatment of waste waters discharged into the river of Dunavec and Devoll in the Korca region .As a result of the discharged raw waters from the surrounding areas, pollution caused in those rivers is quite significant. Currently the city of Korca there is already constructed a wastewater treatment facility but it only treats the collected wastewater from the Municipality area of Korca city and not the new five administrative units which are added to this city with the implementation of the Administrative Reform of the new territorial. In this situation an immediate solution should be given to the pollution caused by these new 5 other units. It is, therefore, necessary to know in detail the surface water quality in order to estimate the possible consequences of a new civil activity settle in this territory. Discharge urban liquid waste, agricultural and industrial without preliminary treatment are the main source of pollution of surface taking into account the pollution that comes in these areas as a result of fertilizers and inorganic who infiltrate the layers of the earth .Iit is known that most of their surface used for agricultural cultivation and part of the population in to exploit the use of septic tanks for personal use then the infiltration of the soil and the contribution of its pollution load must viewed with a critical eye. So ,investigating methodologies , data analysis procedures and water quality management tools need to be well defined. Management programs require a multidisciplinary approach based on a systematic monitoring of key physical and chemical, biological parameters such as ph, conductivity, temperature and chemical parameters such as Chemical Oxygen Demand (COD), Biochemical Oxygen Demand (BOD5), Total Suspended Solids (TSS), Total Nitrogen (N), Total Phosphorus (P) as well as microbiological tests on rivers where water is discharged these as Total Coliform, Fecal Coliform and Fecal Streptococc. The pollution load of these administrative units is shown in Table 1 in which significantly noted that none of the parameters does not meet the norms of discharge wastewater in non-sensitive environment. Table 1 shows the loads of the waste water generated by population.

WATER MANAGEMENT 44
Table 1. Loads of the waste water generated by population
No. Administrative unit
Flow COD load BOD5 load TSS load [m3/d] [kg/day] [kg/day] [kg/day]
1 Bulgarec 2300 1685 843 982
2 Drenove 1800 1323 661 771
3 Mollaj 1400 1056 528 616
4 Voskop 1000 744 372 434
5 Voskopoje 88 62 31 36
6 Lekas 65 47 24 28
7 Vithkuq 250 183 92 106
Additionally one of the factors was taken into consideration during the analysis is the average flow of the river many years Dunavec and Devoll, this highly important parameter which affects the values of the parameters above. This result obtained allowed us to define the chemical, physical and biological water quality of Dunavec and Devoll rivers. CONCLUSIONS Wastewater administrative units that have been added to the borough of the city of Korca, are subject to pre-treatment waste water before discharge into rivers concerned so as not to harm their route and environmental cleanliness. Enable increased either the capacity WWTP of Korca city or pretreatment mini plants. Their pre-treatment enables a lower microbiological contamination which takes high value and exceeds the standard, especially during the summer months where we have a 10-fold reduction of the flow of these rivers REFERENCES European Union legislation on Waste Water Treatment and nutrients removal. National Strategy Intersectorial, Decentralization and Local Government (2014-2020). Water Resources and Irrigation Project (WRIP) IBRD Loan No.1211 “Preparation of National Irrigation and Drainage
Strategy” Contract No. MAFCP/CS/01 0a (International Consultant) and MAFCP/CS/01 0b (National Consultant). CELEX number: 32000L0060, Official Journal of the European Union, Series L, no. 327, 12.22.2000, 1-73. Wastewater Treatment in a Small Village - options for upgrading, 1999.
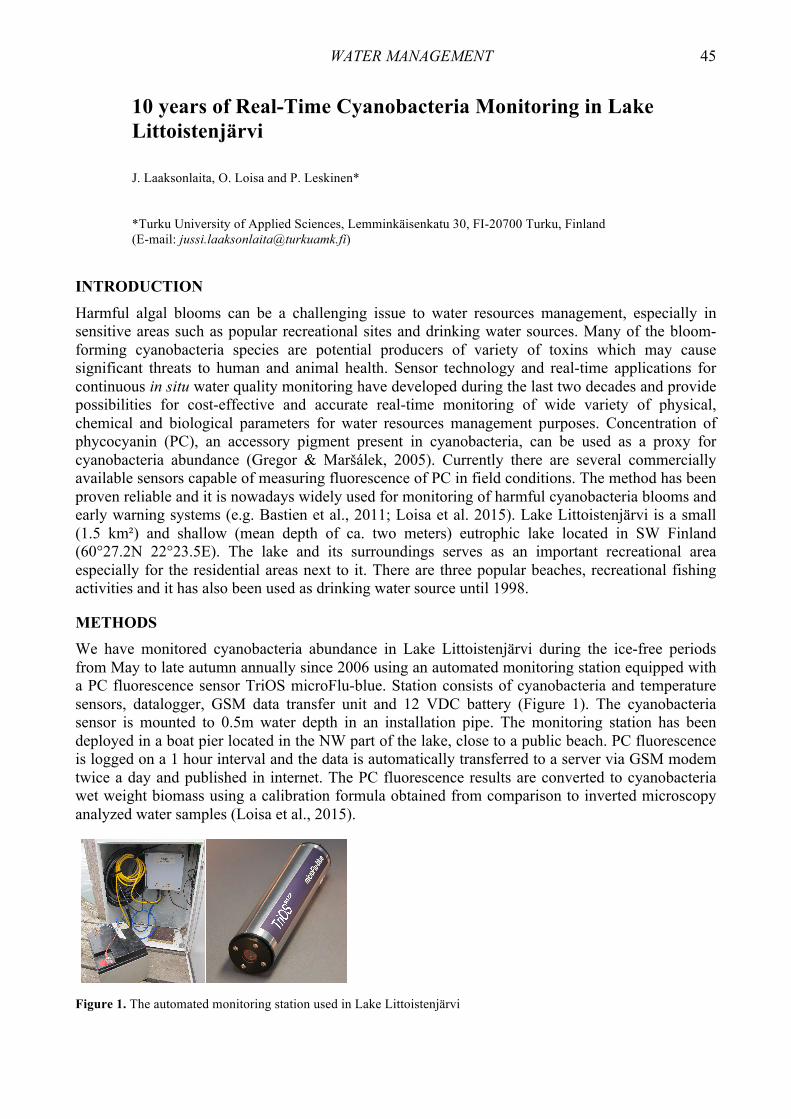
WATER MANAGEMENT 45
10 years of Real-Time Cyanobacteria Monitoring in Lake Littoistenjärvi J. Laaksonlaita, O. Loisa and P. Leskinen* *Turku University of Applied Sciences, Lemminkäisenkatu 30, FI-20700 Turku, Finland (E-mail: [email protected])
INTRODUCTION Harmful algal blooms can be a challenging issue to water resources management, especially in sensitive areas such as popular recreational sites and drinking water sources. Many of the bloom-forming cyanobacteria species are potential producers of variety of toxins which may cause significant threats to human and animal health. Sensor technology and real-time applications for continuous in situ water quality monitoring have developed during the last two decades and provide possibilities for cost-effective and accurate real-time monitoring of wide variety of physical, chemical and biological parameters for water resources management purposes. Concentration of phycocyanin (PC), an accessory pigment present in cyanobacteria, can be used as a proxy for cyanobacteria abundance (Gregor & Maršálek, 2005). Currently there are several commercially available sensors capable of measuring fluorescence of PC in field conditions. The method has been proven reliable and it is nowadays widely used for monitoring of harmful cyanobacteria blooms and early warning systems (e.g. Bastien et al., 2011; Loisa et al. 2015). Lake Littoistenjärvi is a small (1.5 km²) and shallow (mean depth of ca. two meters) eutrophic lake located in SW Finland (60°27.2N 22°23.5E). The lake and its surroundings serves as an important recreational area especially for the residential areas next to it. There are three popular beaches, recreational fishing activities and it has also been used as drinking water source until 1998.
METHODS We have monitored cyanobacteria abundance in Lake Littoistenjärvi during the ice-free periods from May to late autumn annually since 2006 using an automated monitoring station equipped with a PC fluorescence sensor TriOS microFlu-blue. Station consists of cyanobacteria and temperature sensors, datalogger, GSM data transfer unit and 12 VDC battery (Figure 1). The cyanobacteria sensor is mounted to 0.5m water depth in an installation pipe. The monitoring station has been deployed in a boat pier located in the NW part of the lake, close to a public beach. PC fluorescence is logged on a 1 hour interval and the data is automatically transferred to a server via GSM modem twice a day and published in internet. The PC fluorescence results are converted to cyanobacteria wet weight biomass using a calibration formula obtained from comparison to inverted microscopy analyzed water samples (Loisa et al., 2015).
Figure 1. The automated monitoring station used in Lake Littoistenjärvi

WATER MANAGEMENT 46
RESULTS AND DISCUSSION Cyanobacteria blooms have been common during the monitoring period 2006-2015 and have often prevented the recreational use of the lake. Highest cyanobacteria concentrations typically occur late in the summer (July to September) and regularly exceed 10 mg L-1 of wet weight biomass. There is high variability in cyanobacteria abundance between the seasons (Figure 2). This is caused by the changes in levels of available nutrients in the lake and also the complex dynamics in primary production between phytoplankton and non-indigenous macrophyte vegetation (Elodea canadensis and Ceratophyllum demersum). Clear trends in cyanobacteria abundance during this monitoring period cannot be detected, but the long term water quality monitoring, started in 1980s, indicates increased nutrient concentrations (Sarvala, 2005; Sarvala, 2011) so the mass bloom events are expected to become even more common in the future. The responsible management authorities of the lake have benefited from the real-time monitoring and thus secured its funding on long term. It allows rapid response to minimize the negative impacts when cyanobacteria concentration rises to a possibly harmful level. The cyanobacteria toxin risk is also published in webpages nearly real-time for the general public, with understandable thresholds. This serves the recreational use of the lake and helps to prevent the possible health risks caused by the potentially toxic algae blooms.
Figure 2. Cyanobacteria wet weight biomass in Lake Littoistenjärvi real-time monitoring station during the 10 year period For the public dissemination purpose, the data is provided nearly real-time in the internet, with understandable thresholds for recreational use. Biomass over 10 mg L-1 is indicated as a high risk level and e.g. swimming is not recommended. REFERENCES Bastien, C., Cardin, R., Veilleux, É., Deblois, C., Warren, A., & Laurion, I. (2011). Performance evaluation of
phycocyanin probes for the monitoring of cyanobacteria. Journal of Environmental Monitoring, 13(1), 110-118. Loisa, O., Kääriä, J., Laaksonlaita, J., Niemi, J., Sarvala, J., & Saario, J. (2015). From phycocyanin fluorescence to
absolute cyanobacteria biomass: An application using in-situ fluorometer probes in the monitoring of potentially harmful cyanobacteria blooms. Water Practice and Technology, 10(4), 695-698.
Sarvala, J. (2005). Littoistenjärven ekologisen tilan kehitys ja hoitovaihtoehdot (in Finnish). University of Turku. Sarvala, J. (2011). Littoistenjärven tila ja kunnostusvaihtoehdot 2012 (in Finnish). University of Turku. Gregor, J., & Maršálek, B. (2005). A simple in vivo fluorescence method for the selective detection and quantification
of freshwater cyanobacteria and eukaryotic algae. Acta hydrochimica et hydrobiologica, 33(2), 142-148.
WATER MANAGEMENT 47
Investigation of Phytoplankton Community in “Yerevanyan Lich” Reservoir and the Hrazdan River in the Conditions of Algal Bloom A. Mamyan, G. Gevorgyan, L. Stepanyan and L. Hambaryan* * Institute of Hydroecology and Ichthyology of the Scientific Center of Zoology and Hydroecology of NAS RA, 7 Paruyr Sevak st., 0014, Yerevan, Armenia (E-mails: [email protected]; [email protected]; [email protected]; [email protected])
INTRODUCTION The Hrazdan river, which originates from Lake Sevan, is the longest tributary (141 km) of the transboundary Araks river. This river ecosystem and “Yerevanyan lich” reservoir, which was constructed in the Hrazdan river canyon in Yerevan city, Armenia have high importance for the development of Armenian economy. In “Yerevanyan lich” reservoir, algal bloom occurs every year in Summer period which is probably conditioned by an increase in the water temperature in the conditions of the sufficient concentration of nutrients. The aim of the present study was to investigate the growth rate of phytoplankton community in “Yerevanyan lich” reservoir and the Hrazdan river in the conditions of algal bloom. MATERIALS AND METHODS The quantitative and qualitative parameters of phytoplankton community in “Yerevanyan lich” reservoir and the Hrazdan river were investigated. Phytoplankton studies in the aquatic ecosystems were performed in the 3 monitoring sites: reservoir site located near the dam (№1) and 2 river sites located in the downstream from the reservoir (№2 and 3). Water samples for phytoplankton study were taken once a month in April and June-August, 2015. Phytoplankton analyses were carried out by the standard methods accepted in hydrobiology. RESULTS AND DISCUSSION Phytoplankton community in “Yerevanyan lich” reservoir was represented by 6 groups: Bacillariophyta (diatom algae), Chlorophyta (green algae), Cyanophyta (blue-green algae), Xanthophyta (yellow-green algae), Euglenophyta and Dinophyta. During the investigation in April, the representatives of diatom algae prevailed quantitatively in “Yerevanyan lich” reservoir, nevertheless, a significant change in the phytoplankton community in June occurred: due to green algae bloom in the reservoir, green algae became a quantitatively dominant group in the phytoplankton community, and the quantitative parameters of phytoplankton increased significantly. Green algae bloom in the reservoir was on account of the increased growth of such green algae species as Chlorella vulgaris, Monoraphidium contortum and M. griffithii. However, significant changes in the quantitative parameters of phytoplankton groups also occurred during July-August, and the quantitatively dominant group in the phytoplankton community was shifted as follows: green algae-diatom algae-blue-green algae. Rapid increase in the quantitative parameters of diatom and blue-green algae in the reservoir was mainly on account of the increased growth of the organic pollution indicator species Fragilaria crotonensis (diatom algae), Anabaena flos-aquae and Aphanazimenon flos-aquae (blue-green algae) and may have been conditioned by increased organic matter level resulted from green algae bloom.
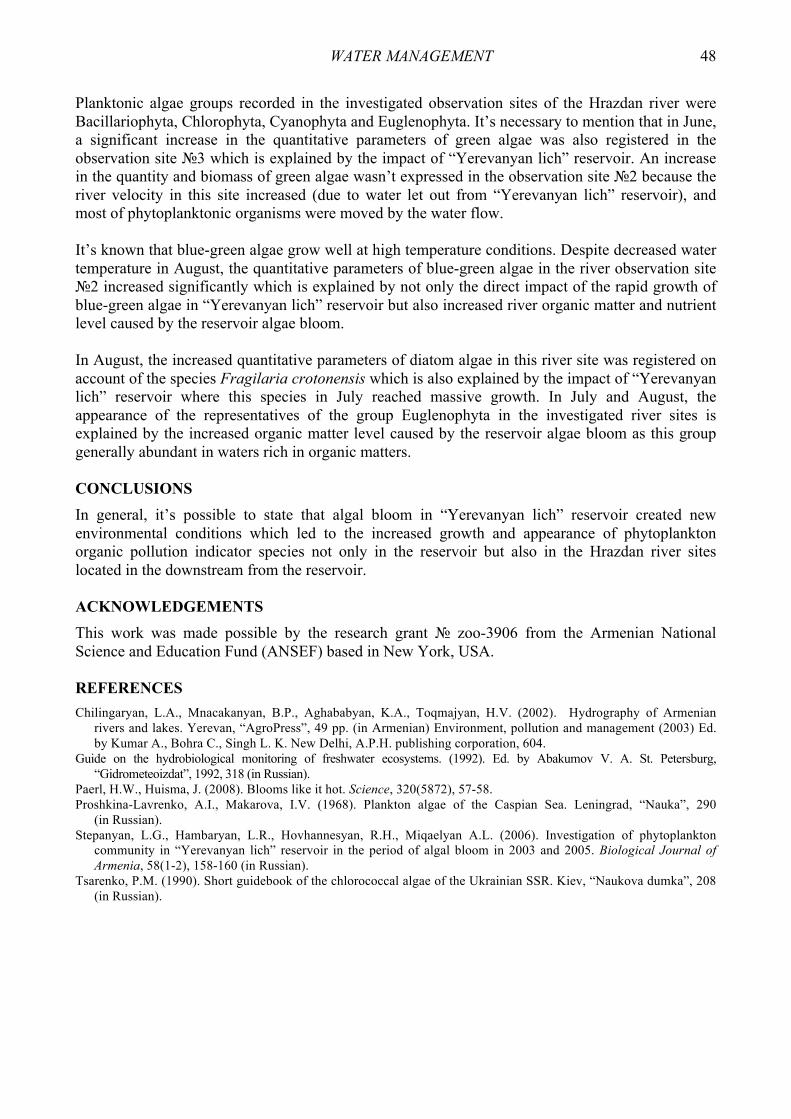
WATER MANAGEMENT 48
Planktonic algae groups recorded in the investigated observation sites of the Hrazdan river were Bacillariophyta, Chlorophyta, Cyanophyta and Euglenophyta. It’s necessary to mention that in June, a significant increase in the quantitative parameters of green algae was also registered in the observation site №3 which is explained by the impact of “Yerevanyan lich” reservoir. An increase in the quantity and biomass of green algae wasn’t expressed in the observation site №2 because the river velocity in this site increased (due to water let out from “Yerevanyan lich” reservoir), and most of phytoplanktonic organisms were moved by the water flow. It’s known that blue-green algae grow well at high temperature conditions. Despite decreased water temperature in August, the quantitative parameters of blue-green algae in the river observation site №2 increased significantly which is explained by not only the direct impact of the rapid growth of blue-green algae in “Yerevanyan lich” reservoir but also increased river organic matter and nutrient level caused by the reservoir algae bloom. In August, the increased quantitative parameters of diatom algae in this river site was registered on account of the species Fragilaria crotonensis which is also explained by the impact of “Yerevanyan lich” reservoir where this species in July reached massive growth. In July and August, the appearance of the representatives of the group Euglenophyta in the investigated river sites is explained by the increased organic matter level caused by the reservoir algae bloom as this group generally abundant in waters rich in organic matters. CONCLUSIONS In general, it’s possible to state that algal bloom in “Yerevanyan lich” reservoir created new environmental conditions which led to the increased growth and appearance of phytoplankton organic pollution indicator species not only in the reservoir but also in the Hrazdan river sites located in the downstream from the reservoir. ACKNOWLEDGEMENTS This work was made possible by the research grant № zoo-3906 from the Armenian National Science and Education Fund (ANSEF) based in New York, USA.
REFERENCES Chilingaryan, L.A., Mnacakanyan, B.P., Aghababyan, K.A., Toqmajyan, H.V. (2002). Hydrography of Armenian
rivers and lakes. Yerevan, “AgroPress”, 49 pp. (in Armenian) Environment, pollution and management (2003) Ed. by Kumar A., Bohra C., Singh L. K. New Delhi, A.P.H. publishing corporation, 604.
Guide on the hydrobiological monitoring of freshwater ecosystems. (1992). Ed. by Abakumov V. A. St. Petersburg, “Gidrometeoizdat”, 1992, 318 (in Russian).
Paerl, H.W., Huisma, J. (2008). Blooms like it hot. Science, 320(5872), 57-58. Proshkina-Lavrenko, A.I., Makarova, I.V. (1968). Plankton algae of the Caspian Sea. Leningrad, “Nauka”, 290
(in Russian). Stepanyan, L.G., Hambaryan, L.R., Hovhannesyan, R.H., Miqaelyan A.L. (2006). Investigation of phytoplankton
community in “Yerevanyan lich” reservoir in the period of algal bloom in 2003 and 2005. Biological Journal of Armenia, 58(1-2), 158-160 (in Russian).
Tsarenko, P.M. (1990). Short guidebook of the chlorococcal algae of the Ukrainian SSR. Kiev, “Naukova dumka”, 208 (in Russian).
WATER MANAGEMENT 49
The Impact of Construction Activities on Watershed Water Quality and Total Loading H. Nurminen, P. Leskinen and O. Loisa*
* Turku University of Applied Sciences, Lemminkäisenkatu 30, FI-20520 Turku, Finland (E-mail: [email protected])
INTRODUCTION Modern stormwater management aims at minimizing the harmful effects of both excessive quantity of water and poor quality of runoff. Systems for stormwater quality management are usually planned and dimensioned according to the characteristics of the developed area in its final state. In many cases, the impacts caused by the construction activities are considered of minor importance and no measures are taken to minimize them. However, the amount of loading from the construction activities can be significant and even a short period of construction activities may have long term effects on the receiving waters (Burton & Pitt, 2002). Sediment loads from construction sites can reach up to 10-20 times greater compared to the load from agricultural lands and even 1,000-2,000 greater than from forest lands (US Environmental Protection Agency, 2000). Primary measures for maintaining good runoff water quality from construction sites is to prevent soil erosion and to catch eroded particles before they reach the receiving watershed. It can be achieved by minimizing the direct runoff and by maintaining pervious surfaces and vegetation in the area (US Environmental Protection Agency, 2007). The aim of our study is to investigate the impacts of construction activities on the downstream water system in a developing residential area located in Kaarina city, SW Finland. In addition, our aim is to monitor the functionality of filtrating dams constructed for retention of solids and nutrient load from the area under construction. METHODS The study site is former agricultural land which is currently being developed into a residential area. Stormwaters from the construction area flow into a ditch which discharges into a protected brook system. The stormwater quality from the construction site is continuously monitored at half hour interval with field-deployed multiparameter sonde and additional water samples. The flow rates are monitored using a water level sensor and a 120º v-notch weir. The monitoring of the water quality and discharge was started four months before the construction activities started and it will continue until the residential area is fully built. RESULTS AND DISCUSSION Results from the first year of study show notable changes in the water quality due to the construction activities. According to the monitoring results from November 2014 to December 2015, the construction activities caused increased water turbidity levels, reaching frequently over 300 NTU. Before the construction activities the observed natural background turbidity was generally lower and high levels of over 200 NTU were observed only occasionally (Figure 1). The annual export rates of total phosphorus and suspended solids were significantly higher than loads observed from similar low-density residential areas in Finland (Sillanpää, 2013). Average concentrations of total suspended solids was approximately 250 mg L-1 before the construction

WATER MANAGEMENT 50
started and 750 mg L-1 during the construction activities. For total phosphorus, the average concentrations were 400 µg L-1 before and 1,000 µg L-1 during the construction.
Figure 1. Water turbidity (NTU) and total discharge (L s-1) before and during the construction work at the study site Filtrating dams were built in August 2015, ca. five months after the start of the construction activities, in order to minimize the sediment transport to the brook downstream. However, they were clogged up rapidly as a result of high yields of suspended solids from the construction site. The runoff bypassed the clogged dams, which increased the soil erosion from the dam structures. Consequently, the filtering dams did not have the anticipated effect on the water quality. Rather, the concentration of solids increased downstream of the dams according to the water quality measurements. Further investigations showed that the construction of the filtrating dams had not been done according to the original plans. The contracting company had not understood the importance of using construction materials of correct and homogenous grain size and had placed fine soil in the inner part of the dam and easily erodible coarse sand on the top of the dam. These results show that careful planning of the construction site schedules and quality assurance of realized structures are crucial in minimizing the harmful effects of construction activities on the downstream waterbodies. Structures for retention of solids and nutrient loading must be constructed before starting the other infrastructure works in the area. REFERENCES Burton, A., Pitt R. (2002). Stormwater effects handbook. Lewis Publishers, 911, 31. Sillanpää, N. (2013). Effects of suburban development on runoff generation and water quality. Aalto University
publication series, 226. US Environmental Protection Agency (2007). Developing your stormwater pollution prevention plan, a guide for
construction sites. US EPA, 40(5), 17-23. US Environmental Protection Agency (2000). Stormwater Phase II Final Rule: Construction Site Runoff Control
minimum control measure. US EPA, 4, 1.

WATER MANAGEMENT 51
Decomposition of Xenobiotics During Visible Light Irradiation in the Presence of Immobilized Photosensitizers - Kinetics Study M. Olak-Kucharczyk, M. Foszpańczyk, S. Ledakowicz and M. Gmurek* * Lodz University of Technology, Faculty of Process and Environmental Engineering, Department of Bioprocess Engineering, ul. Wolczanska 213, 90-924 Lodz, Poland (E-mail: [email protected])
BACKGROUND
The aquatic wildlife is exposed to xenobiotics including natural and synthetic endocrine disrupting compounds (EDCs), which cause adverse effects in living organisms. The objects of this research were compounds with proven hormonal activity such as 2,4dichlorophenol (2,4DCP) and benzylparaben (BeP). 2,4DCP is used as a pesticide and as a substrate in production of other compounds e.g. triclosan, a commonly used antibacterial and antifungal agent (Czaplicka, 2006). Benzylparaben is used as a preservative in cosmetics, pharmaceuticals and industrial products. Generally, it is used in mixtures with other parabens, which leads to extended preservative spectrum (Cashman & Warshaw, 2005). The main reactant formed during photosensitized oxidation is very reactive species - molecular singlet oxygen. This process requires only molecular oxygen (3O2), light of an appropriate wavelength, and a photosensitizer capable of light absorbing and using that energy to excite oxygen to its singlet state. Photosensitized oxidation may occur in homogeneous and heterogeneous systems. The immobilization of photosensitizers and their application (heterogeneous system) allows them to be easily removed from the reaction system and reuse. Zanjanchi et al. investigated the photodegradation of 2,4DCP by using anion sulpho-cobalt phthalocyanine immobilized onto Mobil Composition of Matter No. 41 (MCM-41) in the presence of H2O2 (Zanjanchi et al., 2010). The application for this process visible light within 3 h resulted in about 60 % reduction of initial 2,4DCP concentration (Zanjanchi et al., 2010). METHODS The experiments were carried out in heterogeneous system in photoreactor with external sources of light. Simulated sunlight (xenon lamp) were used to excite the photosensitizers. Experiments were performed in buffered water solutions as well as Milli-Q water. The reaction mixture was mixed and aerated by air bubbling. The chitosan carrier was prepared in the form of beads. Immobilization of photosensitizer by adsorption were done. Zinc phthalocyanine tetrasulfonate (ZnPcS4), Al (III) Phthalocyanine Chloride Tetrasulfonic Acid (AlPcS4) were used as a photosensitizers. RESULTS The objective of this work was to study the photosensitized oxidation of xenobiotics: benzylparaben and 2,4dichlorophenol in aqueous solutions using photosensitizers immobilized onto chitosan carrier particles. The influence of temperature on degradation BeP and 2,4DCP rates were examined. The investigations were focused on kinetics (pseudo first order and Langmuir-Hinshelwood models) as well as activation energy determination.
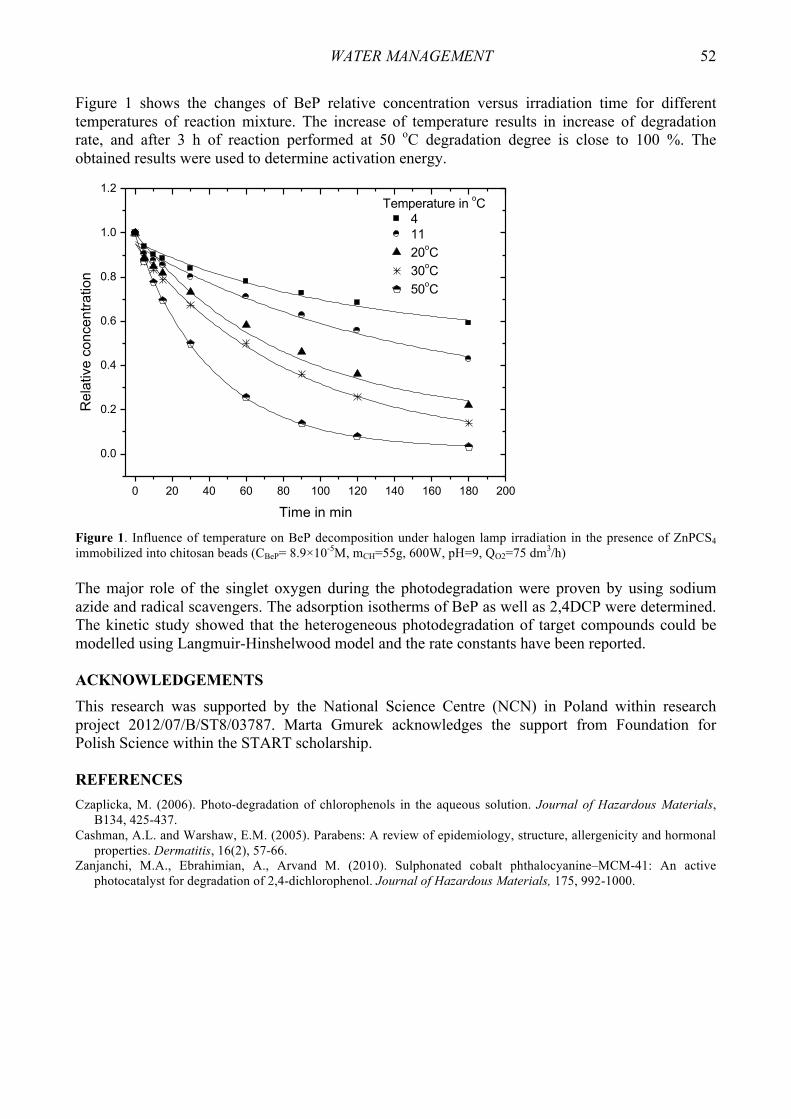
WATER MANAGEMENT 52
Figure 1 shows the changes of BeP relative concentration versus irradiation time for different temperatures of reaction mixture. The increase of temperature results in increase of degradation rate, and after 3 h of reaction performed at 50 oC degradation degree is close to 100 %. The obtained results were used to determine activation energy.
0 20 40 60 80 100 120 140 160 180 200
0.0
0.2
0.4
0.6
0.8
1.0
1.2
Temperature in oC41120oC30oC 50oC
Rel
ativ
e co
ncen
tratio
n
Time in min Figure 1. Influence of temperature on BeP decomposition under halogen lamp irradiation in the presence of ZnPCS4 immobilized into chitosan beads (CBeP= 8.9×10⁻⁵M, mCH=55g, 600W, pH=9, QO2=75 dm3/h) The major role of the singlet oxygen during the photodegradation were proven by using sodium azide and radical scavengers. The adsorption isotherms of BeP as well as 2,4DCP were determined. The kinetic study showed that the heterogeneous photodegradation of target compounds could be modelled using Langmuir-Hinshelwood model and the rate constants have been reported. ACKNOWLEDGEMENTS This research was supported by the National Science Centre (NCN) in Poland within research project 2012/07/B/ST8/03787. Marta Gmurek acknowledges the support from Foundation for Polish Science within the START scholarship. REFERENCES Czaplicka, M. (2006). Photo-degradation of chlorophenols in the aqueous solution. Journal of Hazardous Materials,
B134, 425-437. Cashman, A.L. and Warshaw, E.M. (2005). Parabens: A review of epidemiology, structure, allergenicity and hormonal
properties. Dermatitis, 16(2), 57-66. Zanjanchi, M.A., Ebrahimian, A., Arvand M. (2010). Sulphonated cobalt phthalocyanine–MCM-41: An active
photocatalyst for degradation of 2,4-dichlorophenol. Journal of Hazardous Materials, 175, 992-1000.

WATER MANAGEMENT 53
Study of the Flow Dynamics of Surface Water Masses in the Area of Coastal Gulf of Gdansk J. Pyrchla*, M. Kowalewski**, M. Kijewska***, L. Kasyk***, M. Leyk-Wesołowska*** and K. Pyrchla****
* Faculty of Civil and Environmental Engineering, Gdańsk University of Technology, St. G. Narutowicza 11/12 ,80-233 Gdańsk, Poland (E-mail: [email protected]) ** Institute of Oceanonlogy, Polish Academy of Science, Powstańców Warszawy 55, 81-712 Sopot, Poland & Faculty of Oceanography and Geography, University of Gdańsk, St. Al. Marszałka Piłsudskiego 46, 81-378 Gdynia, Poland (E-mail: [email protected]) *** Faculty of Navigation, Maritime University, St. Wały Chrobrego 1-2,70-500 Szczecin, Poland (E-mails: [email protected]; [email protected]; [email protected]) **** Faculty of Technical Physics and Applied Mathematics, Gdańsk University of Technology, St. G. Narutowicza 11/12,80-233 Gdańsk, Poland (E-mail: [email protected])
INTRODUCTION Coastal areas has specific hydromorphologic conditions because of fact that this is in the border of two sphere: land and the sea. The movement of water masses are close connected with weather conditions. Specific branches of industry has also influent on this environment eg. tourism, transport, mining industry. This area is also expose to external hazards like a split of oil from the ship. All of this have impact on quality of water. It is very difficult for the water to meet the requirements set forth in the European Water Framework Directive (2000/60/EC, 2000) to achieve a ‘Good Ecological Status’ (GES) (Directive, 2003, 2006). One of the elements of the hydromorphologic quality for the GES classification system of coastal basins is the size and flow dynamics of surface water. Researches on dynamic of water masses can give us a tool to protect environment and human live as well. This paper presents two methods of simulations dynamics of surface water on the coastal zone of sea. HYBRID MAP OF GULF OF GDAŃSK The results of studies was made in the framework of the research project No. O R00 0105 11 financed by the Polish National Centre for Research and Development. In this project was made hybrid map which content geodatabase with structure adapted to dialog between data describes atmosphere and hydrosphere. To meet these requirement hybrid map consist of: Geographical Information System, data from Electric Navigational Chart, data from atmospheric and hydrodynamic models (eg. hydrodynamic model M3D) and from another applications, terrestrial data (eg. orthophotograph, topographic map). For analyses was conducted special experiment in the summer of 2012. In a short distance from the coast near the port of Gdynia on the Gulf of Gdansk placed in the sea drifter recorded changes of its position. Drifter, buoy provided with drift anchor, is constructed to moves mainly under the influence of the current. SIMULATIONS BY HYDRODYNAMIC MODEL M3D Three-dimensional hydrodynamic model M3D was built in 1995-1997 in the IO UG as a modified version of the Princeton Ocean Model (POM). For this project the Gulf of Gdansk launched a special version of the model with a resolution of 3 nautical miles (5.5 km) for the Baltic Sea with nested area the Gulf of Gdansk with grid resolution of 0.5 nautical mile (about 0.9 km), and in the western part - 0.1 nautical mile (about 185 m).
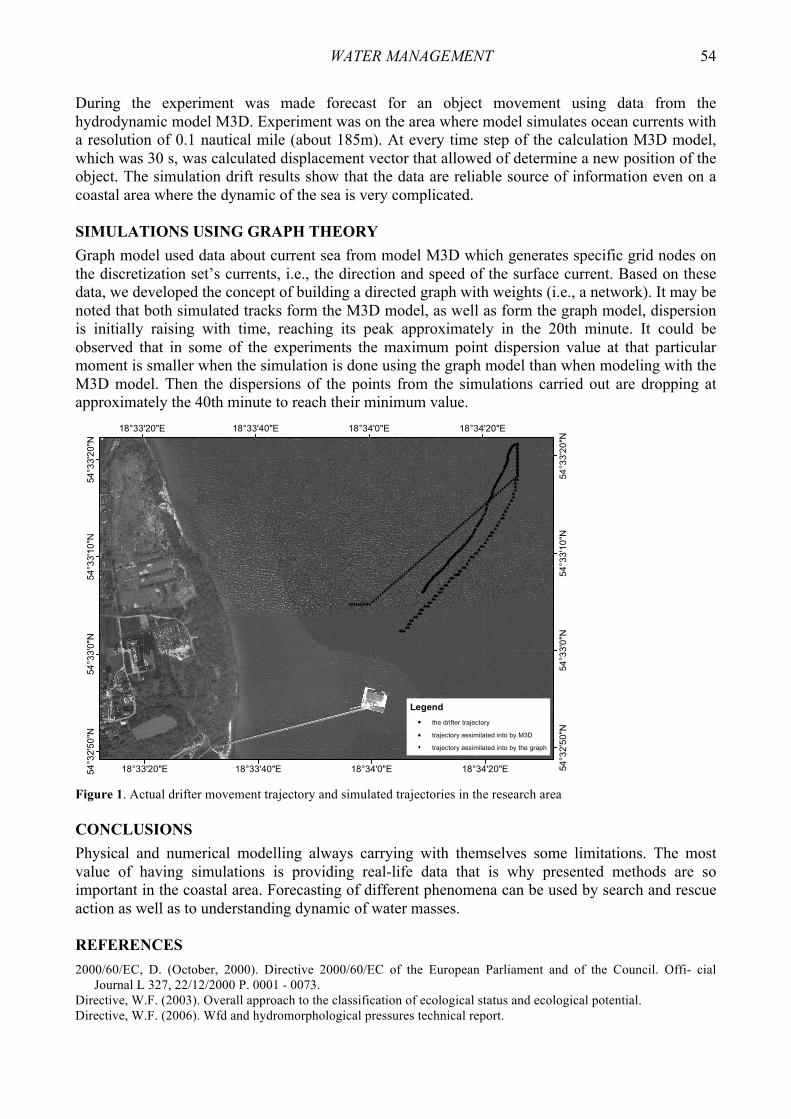
WATER MANAGEMENT 54
During the experiment was made forecast for an object movement using data from the hydrodynamic model M3D. Experiment was on the area where model simulates ocean currents with a resolution of 0.1 nautical mile (about 185m). At every time step of the calculation M3D model, which was 30 s, was calculated displacement vector that allowed of determine a new position of the object. The simulation drift results show that the data are reliable source of information even on a coastal area where the dynamic of the sea is very complicated. SIMULATIONS USING GRAPH THEORY Graph model used data about current sea from model M3D which generates specific grid nodes on the discretization set’s currents, i.e., the direction and speed of the surface current. Based on these data, we developed the concept of building a directed graph with weights (i.e., a network). It may be noted that both simulated tracks form the M3D model, as well as form the graph model, dispersion is initially raising with time, reaching its peak approximately in the 20th minute. It could be observed that in some of the experiments the maximum point dispersion value at that particular moment is smaller when the simulation is done using the graph model than when modeling with the M3D model. Then the dispersions of the points from the simulations carried out are dropping at approximately the 40th minute to reach their minimum value.
bbbbbbbbbbbbbbbbbbbbbbbbbbbbbbbbbbbbbbbbbbbbbbbbbbbbbbbbbbbbbbbbbbbbbbbbbbbbbbbbbbbbbbbbbbbbbbb
################################
########
#####
####
#######
#####
######
####
####
#####
####
########
###
!!!!!!!!!!!!!!!!!!
!!!
!!!!
!!!!!!!!!
!!!!!!!!!!
!!!!!!
!!!!!
!!!!!!!!!!!!!!!!!!!!!!!!!!!!!!!!!!!!!!!!
18°34'20"E
18°34'20"E
18°34'0"E
18°34'0"E
18°33'40"E
18°33'40"E
18°33'20"E
18°33'20"E
54°3
3'20
"N
54°3
3'20
"N
54°3
3'10
"N
54°3
3'10
"N
54°3
3'0"
N
54°3
3'0"
N
54°3
2'50
"N
54°3
2'50
"N
Legend! the drifter trajectory
# trajectory assimilated into by M3D
b trajectory assimilated into by the graph
Figure 1. Actual drifter movement trajectory and simulated trajectories in the research area CONCLUSIONS Physical and numerical modelling always carrying with themselves some limitations. The most value of having simulations is providing real-life data that is why presented methods are so important in the coastal area. Forecasting of different phenomena can be used by search and rescue action as well as to understanding dynamic of water masses. REFERENCES 2000/60/EC, D. (October, 2000). Directive 2000/60/EC of the European Parliament and of the Council. Offi- cial
Journal L 327, 22/12/2000 P. 0001 - 0073. Directive, W.F. (2003). Overall approach to the classification of ecological status and ecological potential. Directive, W.F. (2006). Wfd and hydromorphological pressures technical report.

WATER MANAGEMENT 55
Water Resources and Hydrological Hazards in North Caucasus Under the Impact of Recent Climate Change
E. Rets*, M. Kireeva**, N. Frolova** and N. Loshakova** * Water Problems Institute, Russian Academy o f Sciences, ul. Gubkina 3, Moscow, 119333, Russia (E-mail: [email protected]) ** Lomonosov Moscow State University, Moscow, Russia. 119991, Russian Federation, Moscow, GSP-1, Leninskie gory, Faculty of Geography
RECENT CLIMATE CHANGE AND HYDROLOGICAL HAZARDS IN NORTH CAUCASUS Due to specific climatic conditions, contrasts in relief, high density of population North Caucasus is one of the most dangerous parts of Russia in terms of hydrological risks. Mean annual damage caused by river flooding in North Caucasus amounts to 700 mln USD (Grishenko et al., 2003). North Caucasus is also leading in terms of dangerous floods occurrence (from 1 to 20 a year) (Semenov, Korshunov, 2008). In the beginning of the 21th century frequency and intensity of dangerous hydrological processes in North Caucasus was substantially higher then during the previous years that is usually associated with recent climate change (Semenov & Korshunov, 2008; Rets & Kireeva, 2010). On the one hand a rise in mean annual temperature provokes an increase in glaciers melt rate, hence a drawdown in long-term ice reserve and rise in overall water flow in region. On the other hand an increase in precipitation sum contributes to the process through more frequent rain flooding. CHANGES IN SURFACE AND SUB-SURFACE WATER RESOURCES IN NORTH CAUCASUS The last thorough and generalized study of water resources in North Caucasus dates back to the 70s. Consequently, it is of current interest to reassess river water resources in North Caucasus for the modern period. Data from 70 hydrological stations was used in the analysis. Methods of mathematical statistics were adopted to reveal statistically significant changes in the mean and dispersion of the annual, minimum river runoff and sub-surface runoff. Series of maps were drawn. An overall abundance in water resources in the study area decreases with from Southwest to Northeast a decrease in elevation, and from West to East with an increase in aridity. The most evident changes in annual runoff during last 3 decades occurred in the plain territories: it has increased by 30-70 %. In the mountainous part only a slight tendency of rising is observed. A dramatic rise in minimum monthly discharges (both for winter and summer) and consequently in sub-surface water resources is characteristic for the study area (Figure 1). The peculiarities of modern climate bring about an increase in amount, duration and extent of thaws and general reduction in annual duration of cold periods in the region (Kireeva et al, 2015). A respective increase in winter minimum monthly discharge is most intensive in the North of study are (>100 %). Within the foothills it amounts to 50-100 Increase in summer minimum monthly discharge is raised by increase in liquid precipitation in the area. The rate of the increase regularly grows from central foothill part of Northern Caucasus (30-50 %) to the Western plain territory (70-100 %). The features of spatial distribution and temporal variation of mean annual ground water discharge generally coincides with corresponding regularities described for winter minimum
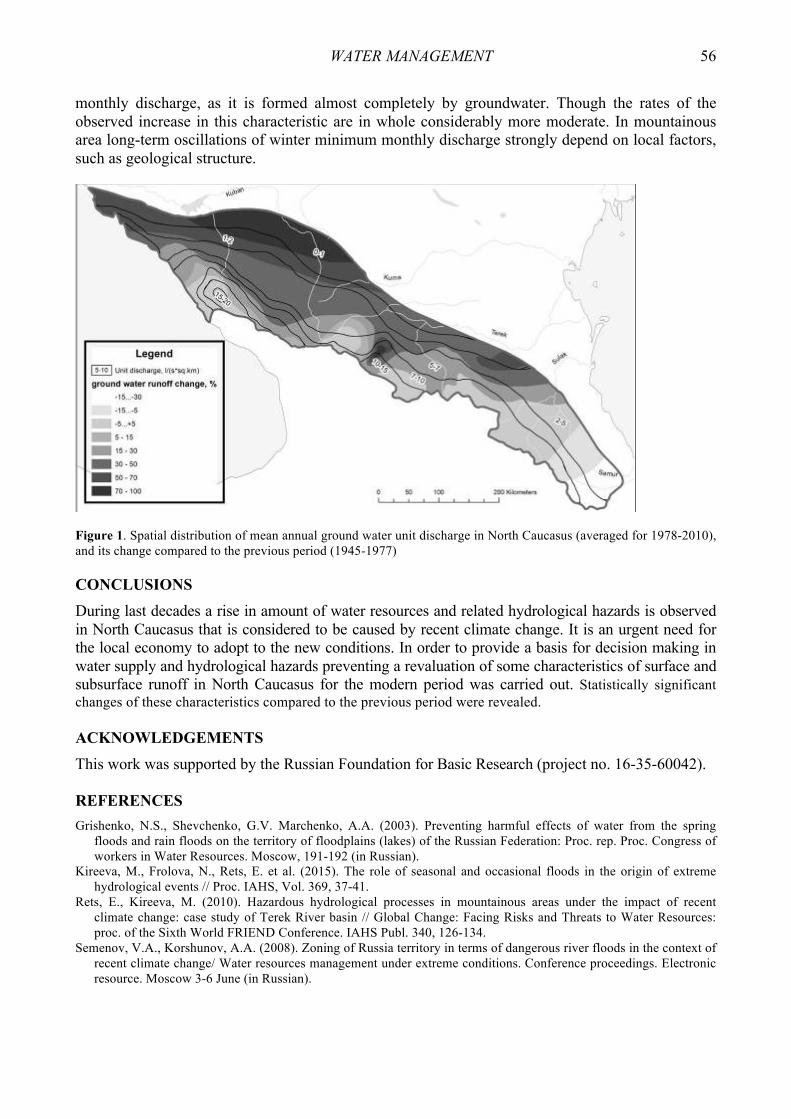
WATER MANAGEMENT 56
monthly discharge, as it is formed almost completely by groundwater. Though the rates of the observed increase in this characteristic are in whole considerably more moderate. In mountainous area long-term oscillations of winter minimum monthly discharge strongly depend on local factors, such as geological structure.
Figure 1. Spatial distribution of mean annual ground water unit discharge in North Caucasus (averaged for 1978-2010), and its change compared to the previous period (1945-1977) CONCLUSIONS During last decades a rise in amount of water resources and related hydrological hazards is observed in North Caucasus that is considered to be caused by recent climate change. It is an urgent need for the local economy to adopt to the new conditions. In order to provide a basis for decision making in water supply and hydrological hazards preventing a revaluation of some characteristics of surface and subsurface runoff in North Caucasus for the modern period was carried out. Statistically significant changes of these characteristics compared to the previous period were revealed. ACKNOWLEDGEMENTS This work was supported by the Russian Foundation for Basic Research (project no. 16-35-60042). REFERENCES Grishenko, N.S., Shevchenko, G.V. Marchenko, A.A. (2003). Preventing harmful effects of water from the spring
floods and rain floods on the territory of floodplains (lakes) of the Russian Federation: Proc. rep. Proc. Congress of workers in Water Resources. Moscow, 191-192 (in Russian).
Kireeva, M., Frolova, N., Rets, E. et al. (2015). The role of seasonal and occasional floods in the origin of extreme hydrological events // Proc. IAHS, Vol. 369, 37-41.
Rets, E., Kireeva, M. (2010). Hazardous hydrological processes in mountainous areas under the impact of recent climate change: case study of Terek River basin // Global Change: Facing Risks and Threats to Water Resources: proc. of the Sixth World FRIEND Conference. IAHS Publ. 340, 126-134.
Semenov, V.A., Korshunov, A.A. (2008). Zoning of Russia territory in terms of dangerous river floods in the context of recent climate change/ Water resources management under extreme conditions. Conference proceedings. Electronic resource. Moscow 3-6 June (in Russian).

WATER MANAGEMENT 57
Monitoring of Pesticides Residue and Their Metabolites in Groundwater of Slovakia V. Roško, P. Červeňanská, A. Patschová and M. Siska* * Water Research Institute, Nábrežie armádneho generála Ludvíka Svobodu 4297/5, Bratislava 811 02, Slovakia (E-mail: [email protected])
INTRODUCTION The application of plant protection products in agricultural production, which contain the active ingredient - pesticides (pesticidal substance) directly threaten the quality of groundwater. Penetration of pesticides into groundwater is done indirectly, mainly by infiltration of precipitation and drainage and irrigation systems, or to a lesser extent due to point pollution (warehouses, old dumps pesticides, etc.). Consumption of pesticides in various districts of Slovakia in the years 2005-2014 In assessing long-term condition in the consumption of pesticides in districts of the Slovakia in the years 2005 - 2014, we recorded the highest average consumption of pesticides in the districts of Nitra, Hlohovec, Piešany and Šaľa with average fuel consumption in the range of 1.3 to 1.07 kg ha-1 of total agricultural and forest land. MONITORING OF PESTICIDES IN UNDERGROUND WATERS IN SLOVAKIA Basic monitoring of pesticides substances in groundwater is carried out in accordance with the approved program of water monitoring. The most commonly used method of sampling for pesticide is a point sampling - a sample is taken at a particular time and a particular place, where the choice should be representative of the sampled area as a whole. The sampling method was also applied in the prior monitoring of pesticides in groundwater. In such a method of sampling is problematic interpretation of the concentration of pesticides that have different sorption and degradation characteristics. To the results from individual donations , when the data obtained from samples in one place at one time used for characterization and evaluation of the concentration of pesticide in the relevant area donations , when the data obtained from samples in one place at one time used for characterization and evaluation of the concentration of pesticide in the relevant area . Penetrace pesticides to groundwater The most important factors that determine the potential penetration (liquor) for pesticides in groundwater are chemical characteristics of pesticides, soil properties, depth of groundwater level and the method and time of application. Combination of these factors can be identified region which is most vulnerable and the most conducive to groundwater contamination due to the effects of pesticide use.
Statistical evaluation of the results of monitoring of pesticides in Slovakia (2005 - 2014) Until 2009 in the monitoring of pesticide was used only conventional method of sampling - sampling point, since then VUVH collection points as well as passive sampling. Subscriptions are carried out twice a year (spring and autumn). Average concentration of selected pesticides in groundwater in Slovakia for each year of the reference period (2005-2014) is shown in Figure 1 yearly. You may be observed mainly upward trend in the concentration of atrazine until 2009. After
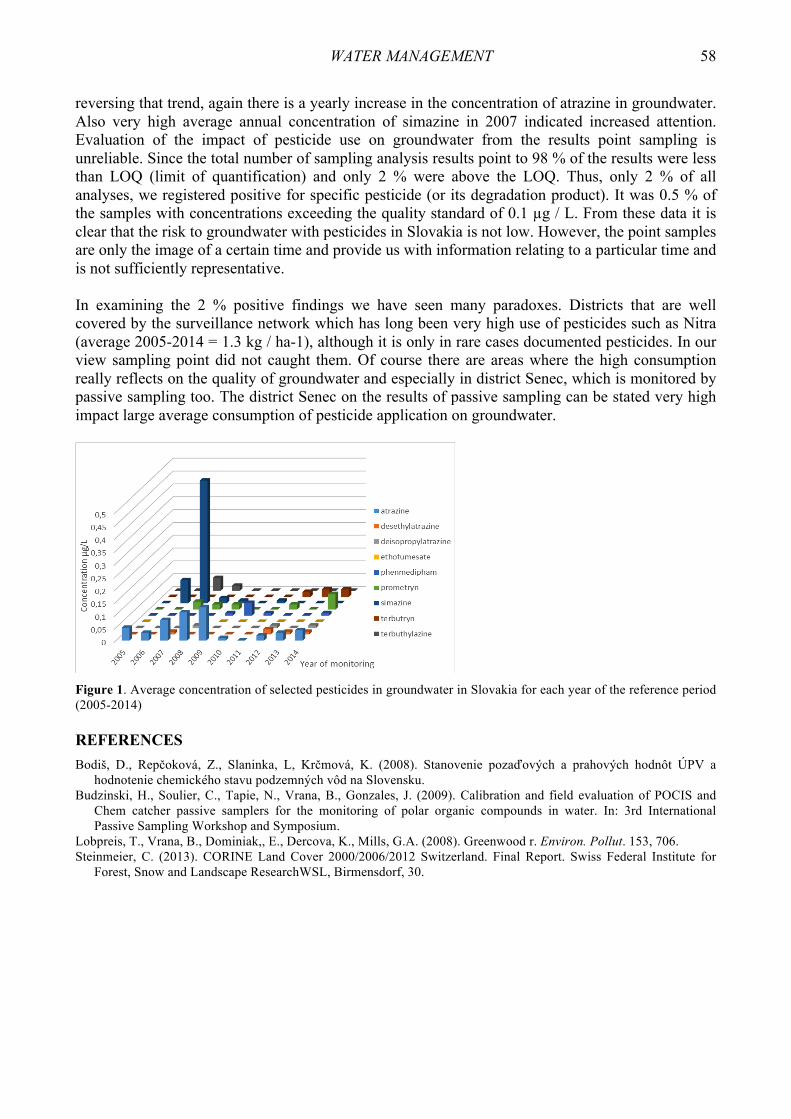
WATER MANAGEMENT 58
reversing that trend, again there is a yearly increase in the concentration of atrazine in groundwater. Also very high average annual concentration of simazine in 2007 indicated increased attention. Evaluation of the impact of pesticide use on groundwater from the results point sampling is unreliable. Since the total number of sampling analysis results point to 98 % of the results were less than LOQ (limit of quantification) and only 2 % were above the LOQ. Thus, only 2 % of all analyses, we registered positive for specific pesticide (or its degradation product). It was 0.5 % of the samples with concentrations exceeding the quality standard of 0.1 µg / L. From these data it is clear that the risk to groundwater with pesticides in Slovakia is not low. However, the point samples are only the image of a certain time and provide us with information relating to a particular time and is not sufficiently representative. In examining the 2 % positive findings we have seen many paradoxes. Districts that are well covered by the surveillance network which has long been very high use of pesticides such as Nitra (average 2005-2014 = 1.3 kg / ha-1), although it is only in rare cases documented pesticides. In our view sampling point did not caught them. Of course there are areas where the high consumption really reflects on the quality of groundwater and especially in district Senec, which is monitored by passive sampling too. The district Senec on the results of passive sampling can be stated very high impact large average consumption of pesticide application on groundwater.
Figure 1. Average concentration of selected pesticides in groundwater in Slovakia for each year of the reference period (2005-2014) REFERENCES Bodiš, D., Repčoková, Z., Slaninka, L, Krčmová, K. (2008). Stanovenie pozaďových a prahových hodnôt ÚPV a
hodnotenie chemického stavu podzemných vôd na Slovensku. Budzinski, H., Soulier, C., Tapie, N., Vrana, B., Gonzales, J. (2009). Calibration and field evaluation of POCIS and
Chem catcher passive samplers for the monitoring of polar organic compounds in water. In: 3rd International Passive Sampling Workshop and Symposium.
Lobpreis, T., Vrana, B., Dominiak,, E., Dercova, K., Mills, G.A. (2008). Greenwood r. Environ. Pollut. 153, 706. Steinmeier, C. (2013). CORINE Land Cover 2000/2006/2012 Switzerland. Final Report. Swiss Federal Institute for
Forest, Snow and Landscape ResearchWSL, Birmensdorf, 30.

WATER MANAGEMENT 59
Large Scale Irrigation Planning for Rational Use of Water Resources: Velika Plana as a Case Study (Serbia) Z. Rudic, M. Bozic, D. Milosev, G. Nikolic and J. Radanovic* * Institute for the Development of Water Resources „Jaroslav Cerni“, Jaroslava Cernog 80, 11226 Belgrade, Serbia (E-mails: [email protected]; [email protected]; [email protected]; [email protected]; [email protected])
INTRODUCTION Agriculture is a significant user of water resources in Europe, accounting for around 30% of total water use (IEEP, 2000). Irrigation has contributed significantly to poverty alleviation, food security and improving the quality of life for rural population (FAO, 1997). However, the sustainability of irrigated agriculture is being questioned both economically and environmentally (FAO, 1997). Environmental impact arising from irrigation appear to be water pollution from nutrients and pesticides, damage to habitats and aquifer exhaustion by abstraction of irrigation water and consequently indirect impact on ecosystems, increased erosion of cultivated soils on slopes, salinization, or contamination of groundwater sources (IEEP, 2000). The important form of impact is exhaustion of water resources, which reflects in change in flow regime of rivers or groundwater depletion (Dougherty and Hall, 1995). The aim of this paper is to point out the necessity of irrigation planning in favour of rational use of water resources, especially when considering systematic irrigation in large areas. Velika Plana is a typical rural municipality with almost 80% of agricultural land, located in central Serbia. The main characteristics of the Velika Plana’s territory are moderate climate, fertile soil, majority of agricultural land and great potential for organic agriculture. The territory is vertically divided in two parts: hilly western zone (with elevations 100-297 MASL) and eastern lowland along the Velika Morava River (80-100 MASL). In addition, each zone is divided into southern and northern part, by natural flow of river Jasenica. The first impression is that there is abundance of water available for irrigation and other purposes, which was subjected to a thorough analysis. WATER REQUIREMENTS Due to differences in topography and soil types, two crop patterns are anticipated. Crop pattern with dominating vegetables, field, industrial and forage crops is typical for the lowland. The other crop pattern with more than 50 % of area under orchards and vineyards is typical for hilly zone. Water requirements, which are relatively low, slightly differ per each zone (Table 1). Table 1. Water requirements (WR)
APR MAY JUN JUL AUG SEP Veg. season Lowland WR80% [mm] 5.41 17.18 23.60 63.70 51.87 3.49 165 WR80% [mm/day] 0.18 0.55 0.79 2.05 1.67 0.12 – Hilly land WR80% [mm] 12.24 26.70 38.75 67.81 55.46 5.72 207 WR80% [mm/day] 0.41 0.86 1.29 2.19 1.79 0.19 –
WATER MANAGEMENT 60
WATER AVAILABILITY AND FEASIBLE SOLUTION Total agricultural land amounts 219.86 km2, of which 114.92 km2 belongs to lowland, and 104.94 km2 belongs to hilly zone. It is necessary to provide 8.79 m3/s in peak month (July). Even the most “reliable” source of water in the area, the Velika Morava River, cannot provide such big quantities of water. During August, which is the most critical month from hydrological aspect, around 7.4 m3/s of water is available, but for the whole drainage basin of Velika Morava. Only the part of this quantity could be taken for the needs of Municipality of Velika Plana. It is clear that the size of irrigated land depends primarily on the availability of water for irrigation. Therefore, the potential of groundwater, Velika Morava River and new impoundments as irrigation water sources were analysed. We analyzed the basic hydrological characteristics necessary for understanding the total available quantity of surface water, their spatial and time-wise distribution. The half of total available water (difference between 80 and 95 % of low-flow frequency) is allocated for irrigation, due to the uncertainty, which is primarily reflected in unknown future demand for water. By construction of four compensating reservoirs on local peaks at hilly zone, it is possible to increase the irrigated area, since the available water from V. Morava is limited (Table 2). For the assessment of small ungauged catchments, mapping of regional parameters was done. Capture of precipitation and surface runoff in four small impoundments makes a relatively small storage for irrigation, although they usually have a purpose to protect against adverse effects of water (flooding). When considering groundwater, the alluvion at municipality’s far north has largest productivity (Stojadinović & Nikić, 2008), therefore is the difference in water availability. Table 2. Available water quantities
Q [m3/s] F [km2] Zone
Groundwater 0.60 11.1 Lowland – south 1.00 19.5 Lowland – north
Inner water (impoundments) 25.0 Hilly zone – south Velika Morava River* 1.10-2.50* 34.0 Hilly zone – north and south
*available water should be uniquely split by consumers on both river shores CONCLUSION Construction of the entire water supply system for irrigation purposes requires significant investments. Each subsystem that supplies with water from V. Morava (with compensating reservoir) or from impoundments requires significant financial resources and isn’t a profitable investment if the system does not have more users. On the other hand, impoundments, i.e. dams have even bigger purposes, as protection from floods. It is clear that the most cost-effective alternatives are these that provide water for large agricultural complexes, where modern agricultural production is feasible. REFERENCES FAO (1997). Irrigation potential in Africa: A basin approach. Land and Water Bulletin 4. FAO, Rome. IEEP (2000). The Environmental Impact of Irrigation in the European Union, a report to the Environment Directorate of
the European Commission. Institute for European Environmental Policy, London, in association with Politechnical University of Madrid and University of Athens.
Dougherty, T.C. and Hall, A.W. (1995). Environmental impact assessment of irrigation and drainage projects. Irrigation and Drainage Paper 53. FAO, Rome.
Stojadinović, D. and Nikić, Z. (2008). Hidrogeološke karakteristike aluviona Velike Morave sa aspekta korišćenja podzemnih voda. Voda i sanitarna tehnika, 1, 25-40 (in Serbian).

WATER MANAGEMENT 61
Methodical Bases of an Assessment of Impact of Dredging Works on the Water Area
A. Shishkin, A. Epifanov and M. Epifanova* * Higher School of Technology and Energy, St. Petersburg State University of Industrial Technology and Design, the Russian Federation, St. Petersburg,, Ivana Chernyh, 4 (E-mail: [email protected])
INTRODUCTION Production of dredging works is necessary when performing a wide range of engineering tasks, including deepening of waterways, construction of ports and terminals, restoration of a natural river drain, etc. Dredging works have large-scale negative impact on the water area of water object that leads to pollution of waters and as a result of death of bio-resources. First of all it is connected with high concentration of the weighed substances and loss of places of spawning due to loss of a layer of a sediment. It is necessary to apply adequate techniques, and also mathematical models to a correct assessment of negative influence on water body the describing hydrodynamic processes and processes of transfer of the polluting substances. Key stage at an assessment of impact on water bio-resources is modeling of the arising turbidity fields. By results of modeling determine the following sizes: volumes of the polluted water with various concentrations of the weighed substances, time of existence of fields of a turbidity, a layer of precipitations during works, total volumes of the polluted water, etc. THEORETICAL REVIEW The solution of the tasks stated above possibly on the basis of hydrodynamic and hydrochemical modeling. At the first stage fields of currents models have to be constructed, at the second stage transfer of the weighed substances in the water area is calculated. Hydrodynamics engineers considered questions of modeling by the following scientists: V. B. Shtokman, N. S. Lineykin, A.I. Felzenbaum, Brian K., Pacanowski A. and others. For water bodies of small depth, if the wind currents are modeling, it is possible to use the equation of "small water".
,HGV
aVlx
HgtV xx
zx ⋅
⋅−ρ
τ=⋅−
∂
ξ∂⋅⋅+
∂
∂
,HGV
aVly
HgtV yy
xz ⋅
⋅−ρ
τ=⋅−
∂
ξ∂⋅⋅+
∂
∂
,0y
V
xV
tyx =
∂
∂+
∂
∂+
∂
ζ∂ (1)
where x, y – axes of coordinates; t – time; V - current speeds; р – water density; l – Coriolis's parameter; g – gravity; τ - the tangential tension of a wind; ξ - indignation of a free surface.
Models to calculation of the hydrodynamic processes happening in large water bodies including at the ocean applying the following model are applied (Marchuka & Sargsyan, 1980):

WATER MANAGEMENT 62
,yu
kyx
uk
xzu
kzx
P1vl
zu
wyu
vxu
utu
yxzw
⎟⎟⎠
⎞⎜⎜⎝
⎛
∂
∂
∂
∂+⎟⎠
⎞⎜⎝
⎛∂
∂
∂
∂+⎟⎠
⎞⎜⎝
⎛∂
∂
∂
∂+
∂
∂⋅
ρ−=⋅−
∂
∂+
∂
∂+
∂
∂+
∂
∂
,yu
kyx
uk
xzu
kzx
P1ul
zv
wyv
vxv
utv
yxzw
⎟⎟⎠
⎞⎜⎜⎝
⎛
∂
∂
∂
∂+⎟⎠
⎞⎜⎝
⎛∂
∂
∂
∂+⎟⎠
⎞⎜⎝
⎛∂
∂
∂
∂+
∂
∂⋅
ρ−=⋅−
∂
∂+
∂
∂+
∂
∂+
∂
∂
,gzP
ρ−=∂
∂
,0zw
yv
xu
=∂
∂+
∂
∂+
∂
∂ (2)
where V = (u (x, at, z, t), v (x, at, z, t), w (x, at, z, t)) - a vector of speed of a current of water; P (x, at, z, t) - pressure; pw - average density of water; kх (x, at, z, t), kу (x, at, z, t), kz (x, at, z, t), - coefficients of turbulent viscosity; vx (x, at, z, t), vy (x, at, z, t), vz (x, at, z, t) - coefficients of turbulent diffusion. After receiving fields of currents it is necessary to calculate transfer of the polluting substances.
,yC
xC
DyC
VxC
VtC
2
2
2
2
yx ⎟⎟⎠
⎞⎜⎜⎝
⎛
∂
∂+
∂
∂⋅=
∂
∂+
∂
∂+
∂
∂ (3)
where c – instant value of concentration; x, y – coordinates on the corresponding axes; t - time parameter; Vx,y – the average speed of a current in the direction of the main stream; Dy - coefficient of turbulent transfer or diffusion. The models given above, as a rule, are solved by method of final differences with use of the modern software. RESULTS By results of the solution of the offered models build turbidity fields with iso-lines of concentration of the weighed substances and fields of the dropped-out sediment. The damage to water bioresources decides as function of the lost areas of spawning areas and volumes of the polluted water with the dangerous concentrations of the weighed substances to water bio-resources. The algorithm offered above passed approbation at an assessment of negative impact of hydrotechnical works in the Finland Gulf of the Baltic Sea and the Kerch Strait. REFERENCES Marchuk, G. (1982). Mathematical modeling in an environment problem, Moscow.: Science, 320. Mikhaylov, S. (2000). Diffusion pollution of water ecosystems. Methods of an assessment and mathematical models:
Analytical review, Siberian Branch of the Russian Academy of Science, State Public Scientific Technical Library, Institute of Water and Environmental Problems, Barnaul: Day, 130.
Klevanny, K., Shavykin, A. (2008). Modeling of distribution and sedimentation of the weighed substances in when laying the underwater gas pipeline of the Shtokman field in the Barents Sea,.Environment Protection in an Oil and Gas Complex, 6, 20-28.
The order of Russian fishery of 25.11.2011 N 1166 "About the statement of the Technique of calculation of the extent of the harm done to water biological resources".

WATER MANAGEMENT 63
Calculation of Integrated Indicators for Water Quality Assessment M. Stroganova *, A. Shishkin*, A. Kushnerov*, I. Ivanova* and E. Vasyukova ** * The higher school of technology and power of St. Petersburg State University of Industrial Technologies and Design, Saint-Petersburg, Russia (E-mails: [email protected]; [email protected]) ** Technische Universität Dresden, Chair of Water Supply Engineering, 01062 Dresden, Germany. Currently at: WTE Wassertechnik GmbH, Ruhrallee 185, 45136 Essen, Germany (E-mail: [email protected])
INTRODUCTION According to current activities of the Helsinki commission or HELKOM aim at protecting the marine environment of the Baltic Sea against all sources of pollution and are realized within an intergovernmental cooperation in the European community between Germany, Denmark, Latvia, Lithuania, Poland, Finland, Sweden, Estonia and Russia (The convention on protection of the marine environment of the region of the Baltic Sea, 1974). On the Russian territory of the Gulf of Finland a large number of household, agricultural and industrial sources of pollution is concentrated. The Gulf of Finland is part of the Baltic Sea, so pollution of the Baltic Sea waters occurs by dispersion. In this scientific article a method of calculation of integrated indicators on the example of water bodies belonging to the basin of the Gulf of Finland of the Baltic and Ladoga region in the Russian Federation is shown. Based on the index of water pollution (IWP) calculations and index of a trophical state water body (ITS), as well as hydrobiological indexes an ecological condition of the considered water bodies was defined (Frurman, et.al, 2002). IWP was considered on the basis of hydrochemical measurements. IWP was calculated strictly on six indicators having the greatest values of the given concentration irrespective this was an exceeded maximum concentration limit or not. Two of them were obligatory parameters - the dissolved oxygen and biochemical oxygen demand in five days (BOD5, Russian requirements). The other four indicators were obtained by their content in water and the concentration was higher than the threshold limit or close to it (Tsvetkova et al., 2007). As a result, this index allows defining which class of water it is - from very pure to extremely dirty. According to the calculation of ITS, two major hydrochemical indicators used for water quality assessment were considered: pH and dissolved oxygen. Trophic conditions of a water body could be also defined on the basis of hydrobiological indexes, which were calculated using zooplankton organisms in water samples. Upon the received results, following indexes were calculated: IWP, ITS, Shannon trophic index, Pantle-Bouck index, Gudnayta-Uotley's index, as well as Vudivvis's index (Tsvetkova et al., 2007). METODOLOGY The hydrochemical index IWP was determined by the formula (1):
,TLC
n1IWP
i
in
1i∑=
⋅= (1)
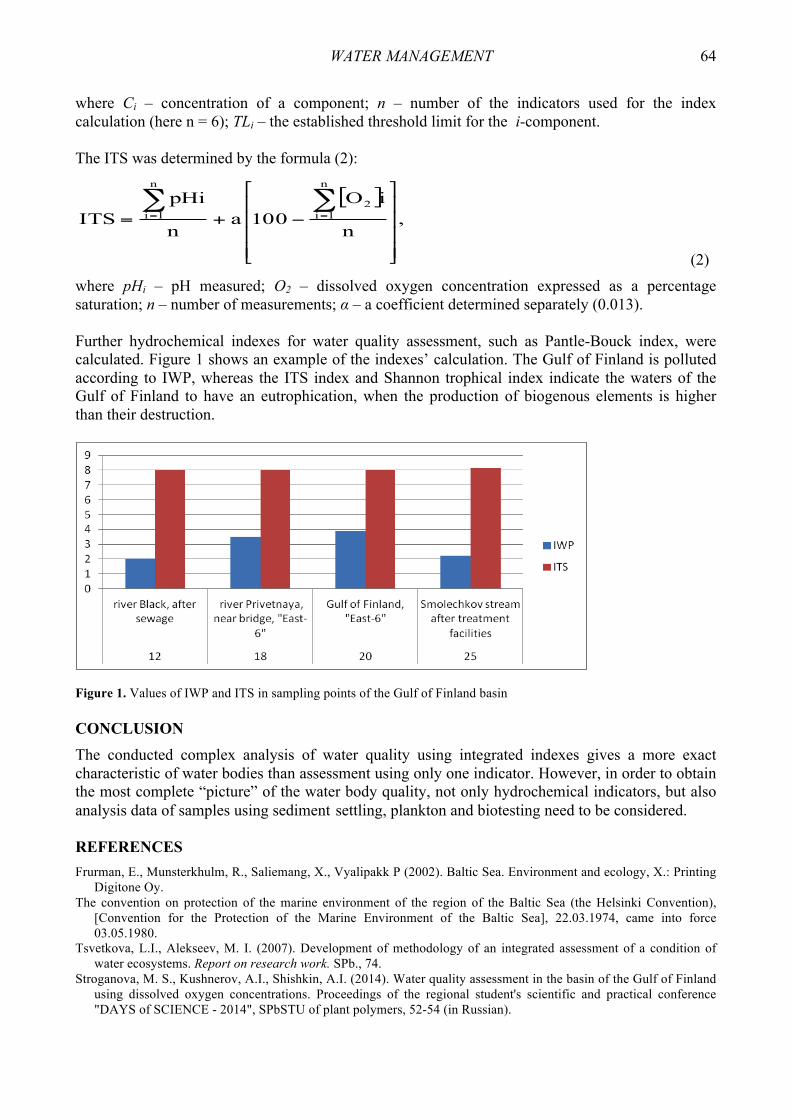
WATER MANAGEMENT 64
where Ci – concentration of a component; n – number of the indicators used for the index calculation (here n = 6); TLi – the established threshold limit for the i-component. The ITS was determined by the formula (2):
[ ]
,n
iO100a
n
pHiITS
n
1i2
n
1i
⎥⎥⎥⎥
⎦
⎤
⎢⎢⎢⎢
⎣
⎡
−+=∑∑==
(2) where pHi – pH measured; O2 – dissolved oxygen concentration expressed as a percentage saturation; n – number of measurements; α – a coefficient determined separately (0.013). Further hydrochemical indexes for water quality assessment, such as Pantle-Bouck index, were calculated. Figure 1 shows an example of the indexes’ calculation. The Gulf of Finland is polluted according to IWP, whereas the ITS index and Shannon trophical index indicate the waters of the Gulf of Finland to have an eutrophication, when the production of biogenous elements is higher than their destruction.
Figure 1. Values of IWP and ITS in sampling points of the Gulf of Finland basin CONCLUSION The conducted complex analysis of water quality using integrated indexes gives a more exact characteristic of water bodies than assessment using only one indicator. However, in order to obtain the most complete “picture” of the water body quality, not only hydrochemical indicators, but also analysis data of samples using sediment settling, plankton and biotesting need to be considered. REFERENCES Frurman, E., Munsterkhulm, R., Saliemang, X., Vyalipakk P (2002). Baltic Sea. Environment and ecology, X.: Printing
Digitone Oy. The convention on protection of the marine environment of the region of the Baltic Sea (the Helsinki Convention),
[Convention for the Protection of the Marine Environment of the Baltic Sea], 22.03.1974, came into force 03.05.1980.
Tsvetkova, L.I., Alekseev, M. I. (2007). Development of methodology of an integrated assessment of a condition of water ecosystems. Report on research work. SPb., 74.
Stroganova, M. S., Kushnerov, A.I., Shishkin, A.I. (2014). Water quality assessment in the basin of the Gulf of Finland using dissolved oxygen concentrations. Proceedings of the regional student's scientific and practical conference "DAYS of SCIENCE - 2014", SPbSTU of plant polymers, 52-54 (in Russian).
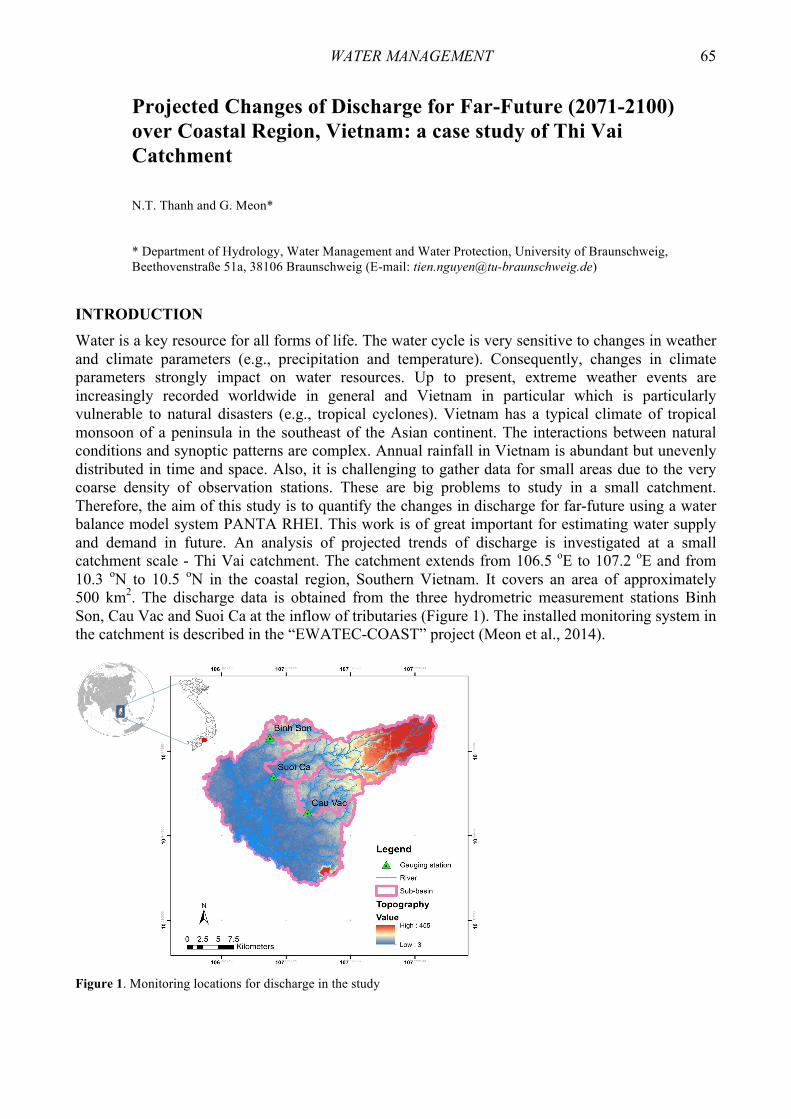
WATER MANAGEMENT 65
Projected Changes of Discharge for Far-Future (2071-2100) over Coastal Region, Vietnam: a case study of Thi Vai Catchment N.T. Thanh and G. Meon* * Department of Hydrology, Water Management and Water Protection, University of Braunschweig, Beethovenstraße 51a, 38106 Braunschweig (E-mail: [email protected])
INTRODUCTION Water is a key resource for all forms of life. The water cycle is very sensitive to changes in weather and climate parameters (e.g., precipitation and temperature). Consequently, changes in climate parameters strongly impact on water resources. Up to present, extreme weather events are increasingly recorded worldwide in general and Vietnam in particular which is particularly vulnerable to natural disasters (e.g., tropical cyclones). Vietnam has a typical climate of tropical monsoon of a peninsula in the southeast of the Asian continent. The interactions between natural conditions and synoptic patterns are complex. Annual rainfall in Vietnam is abundant but unevenly distributed in time and space. Also, it is challenging to gather data for small areas due to the very coarse density of observation stations. These are big problems to study in a small catchment. Therefore, the aim of this study is to quantify the changes in discharge for far-future using a water balance model system PANTA RHEI. This work is of great important for estimating water supply and demand in future. An analysis of projected trends of discharge is investigated at a small catchment scale - Thi Vai catchment. The catchment extends from 106.5 oE to 107.2 oE and from 10.3 oN to 10.5 oN in the coastal region, Southern Vietnam. It covers an area of approximately 500 km2. The discharge data is obtained from the three hydrometric measurement stations Binh Son, Cau Vac and Suoi Ca at the inflow of tributaries (Figure 1). The installed monitoring system in the catchment is described in the “EWATEC-COAST” project (Meon et al., 2014).
Figure 1. Monitoring locations for discharge in the study

WATER MANAGEMENT 66
METHODOLOGY A water balance system PANTA RHEI is applied to calculate the changes in discharge under a global warming. The hydrological model system PANTA RHEI has been developed and applied since 2006 in collaboration with the Institute for Water Management IfW GmbH, Braunschweig. It has been written in C++. PANTA RHEI is a deterministic, semi-distributed, hydrologic model with a vector based GIS-interface (Riedel et al., 2011). Further developments and applications of PANTA RHEI can be found in Förster et al. (2014) and Kreye (2015). The outputs (i.e., precipitation and temperature) of a dynamic-statistical downscaling model are used as an input data for the model. The downscaled climate data is adopted from Thanh and Meon (2015) for the periods of baseline (1961-1990) and future (2071-2100) at high resolution (10 km x 10 km) under the SRES A1B scenario. Possible trends of hydrological projections are performed at different significance levels with the Mann-Kendall (Mann, 1945; Kendall, 1948) test for a 30-year period. RESULTS
The performance of PANTA RHEI is validated at three hydrometric measurement stations. In general, calibrated discharge fits well the measured data. Possible trends of hydrological projections are performed at different significance levels with the Mann-Kendall test for a 30-year period. For a 30-year period in future (2071-2100) the projected discharge changes are quantified over Thi Vai catchment. The spring precipitation is projected to decrease by just 0.5 %, whereas discharge in spring is projected to decrease by around 5 %. Although projected changes in discharge is negligible, the detections for future reveal that significant increasing and decreasing trends of projected discharge are pointed out at hydrological measurement stations. This is especially important for planning strategies in agriculture and water resources fields to adapt the changes of surface and ground water balance in future. REFERENCES Förster, K., Meon, G., Marke, T., & Strasser, U. (2014). Effect of meteorological forcing and snow model complexity
on hydrological simulations in the Sieber catchment (Harz Mountains, Germany). Hydrol. Earth Syst. Sci., 18, 4703-4720.
Kendall, M.G. (1948). Rank correlation methods. Kreye, P. (2015). Mesoskalige Bodenwasserhaushaltsmodellierung mit Nutzung von Grundwassermessungen und
satellitenbasierten Bodenfeuchtedaten. Dissertation. Abteilung Hydrologie, Wasserwirtschaft und Gewässerschutz am Leichtweiß-Institut für Wasserbau, Technische Universität Braunschweig.
Mann, H. B. (1945). Nonparametric tests against trend. Econometrica. Journal of the Econometric Society, 245-259. Meon G., Pätsch M., Phuoc N.V., Quan N.H. (eds.) (2014). EWATEC-COAST: Technologies for Environmental and
Water Protection of Coastal Zones in Vietnam. Contributions to 4th International Conference for Environment and Natural Resources, ICENR 2014. Cuvillier, Göttingen, Germany.
Riedel, G., Meon, G., Förster, K., Lange, S., Liechtenberg, T., & Anhalt, M. (2011). Panta Rhei - Hydrologisches Modellsystem für Forschung und Praxis in Niedersachsen. Hydrolo-gie und Wasserwirtschaft - von der Theorie zur Praxis Beiträge zum Tag der Hydro-logie am 24/25.
Thanh, N.T & Meon, G. (2015). Integrated approaches to analyze the temperature and precipitation variation under climate change: A case study of the Thi Vai river catchment. The 7th International Conference on Climate Change: Impacts and Responses 2015, Canada (abstract).

WATER MANAGEMENT 67
Genotoxicity of Selected Pharmaceuticals J. Zackiewicz and J. Kalka*
* Environmental Biotechnology Department, Faculty of Energy and Environmental Engineering, Silesian University of Technology, Akademicka 2A, 44-100 Gliwice, Poland (E-mail: [email protected])
INTRODUCTION Presence of pharmaceuticals in surface water, groundwater, soils, sediments and even in drinking water has been confirmed by many researchers (Conley et al., 2008; Kinney et al., 2006; Kolpin et al., 2002; Ternes et al., 2001). Information about acute toxicity of selected pharmaceuticals suggest that at low concentration (detected in surface water) these compounds are not toxic for model organisms, but this does not exclude chronic and genotoxic impact on beneficial organisms. The maximal concentration of diclofenac detected in surface water was 18.74 µg/l and for sulfamethoxazole – 11.92 µg/l (Huges et al., 2013). It can be expected that substances like diclofenac or sulfamethoxazole can have adverse impact on living organisms. The range of the acute toxicity of diclofenac and sulfamethoxazole is wide. There are a lot of studies about acute test on aquatic model organisms, but they are not present in environmentally realistic concentrations. The potential impact of exposure to low doses of pharmaceuticals on aquatic organisms may experience subtle, chronic life-cycle and even multi-generational effects (Conley et al., 2008). It is therefore important to widen our knowledge on the possible effects that may occur as a result of unintended exposition. Broad bean Vicia faba is frequently used for detection and analysis of compounds present in water and soil (Fatima et al., 2005; Ferrari et al., 2003). As a good bioindicator this test organism is sensitive to harmful substances and it is commonly present in the environment. Vicia faba micronucleus test and chromosomal aberrations analysis (according to ISO 29200:2013) are useful tools for screening of chemicals present in water. The micronuclei, visible in the cytosol, are formed as a results of chromosome break or dysfunction of the mitotic spindle. The increased number of micronuclei present in cells can be attributed to the exposition on genotoxic factor. MATERIALS & METHODS The main goal of the research was to define genotoxicity of two popularly used pharmaceuticals towards Vicia faba. The maximal concentration detected in surface water of diclofenac was 18.74 µg/l and sulfamethoxazole 11.92 µg/l. Test were performed in following concentrations: 1 mg/l, 0.5 mg/l, 0.25 mg/l, 0.125 mg/l, 0.0625 mg/l, 0.0313 mg/l, 0.0156 mg/l and 0.0078 mg/l in order to verify that the levels found in the environment can cause genotoxicity. The influence of diclofenac and sulfamethoxazole on secondary roots cells by micronucleus test and chromosomal aberrations observations was studied. RESULTS & CONCLUSIONS Obtained results show that mitotic index has changed for secondary roots of Vicia faba cells incubated for 48 hours in water contaminated with selected pharmaceuticals. Diclofenac and sulfamethoxazole can be genotoxic to Vicia faba even at low concentration detected in surface water. Impact of diclofenac and sulfamethoxazole on mitotic index of Vicia faba cells was presented in Figure 1.

WATER MANAGEMENT 68
Figure 1. Changes of mitotic index depending on the testing concentration. ACKNOWLEDGEMENTS The research was financially supported by project BKM/565/RIE8/15. REFERENCES Conley, J.M., Symes, S.J., Kindelberger, S.A., Richards, S.M. (2008). Rapid liquid chromatograhy-tandem mass
spectrometry method for the determination of a broad mixture of pharmaceuticals in surface water. Journal of Chromatography A, 1185, 206-215.
Fatima, R., Ahmad, M. (2005). Certain antioxidant enzymes of Allium cepa as biomarkers for the detection of toxic heavy metals in wastewater. Science of the Total Environment, 346, 256-237.
Ferrari, B., Paxéus, N., Lo Giudice, R., Pollio, A., Garric, J. (2003). Ecotoxicological impact of pharmaceuticals found in treated wastewaters: study of carbamazepine, clofibric acid, and diclofenac. Ecotoxicology and Environmental Safety, 55, 359-370.
Huges, S.R., Kay, P., Brown, L.E. (2013). Global Synthesis and Critical Evaluation of Pharmaceuticals Data Sets Collected from River System. Environmental Science & Technology, 47, 661-677.
Kinney, Ch.A., Furlong, E.T., Werner, S.L., Cahill, J.D. (2006). Presence and distribution of waste water-derived pharmaceuticals in soil irrigated with reclaimed water. Environmental Toxicology and Chemistry, 2, 317-326.
Kolpin, D., Furlong, E., Meyer, M., Thurman, E.M., Zaugg, S. (2002). Pharmaceuticals, Hormones, and Other Organic Wastewater Contaminants in U.S. Streams, 1999 – 2000: A National Reconnaissance. Environmental Science & Technology, 36, 1202-1211.
Ternes, T., Bonerz, M., Schmidt, T. (2001). Determination of neutral pharmaceuticals in wastewater and rivers by liquid chromatography-electrospray tandem mass spectrometry. Journal of Chromatography A, 938, 175-185.

WATER SUPPLY AND WATER TREATMENT 69
The Effect of the Mixing of Water from Different Sources in the Water Supply System on Tap Water Quality - A Full-Scale Technical Investigation Case Study J. Bylka and A. Szuster-Janiaczyk* * Faculty of Civil and Environmental Engineering, Poznan University of Technology, 60-965 Poznań, ul. Piotrowo 3a (E-mails: [email protected]; [email protected])
INTRODUCTION Chemical and biological stability of water and its corrosive properties are the three major indicators which significantly influence the quality of water during its distribution in water supply systems. Other factors which may cause substantial destabilization of water quality parameters in the network include: mixing of water from different sources in the water supply system, changing the source of water or a change in the quality of treated water, for example as a result of modernization of a water treatment plant. The aim of this study is to show the effect of the mixing of water from different sources on its quality in terms of hydraulic parameters (age of water, pressure and velocity gradients and the flow velocity). RESEARCH OBJECTIVES The study described herein was carried out on a technical scale on a water supply system serving approximately 350 thousand inhabitants. The source waters which enter the network are surface water coming from three water intakes, treated in two different water treatment plants (ZUW I and ZUW II). The studied area is supplied with water from water mains through 18 network nodes – points of purchase. The total length of the network operated by the water company in the area under investigation is approximately 1 105 km. The network is composed of many types of materials which differ in terms of age structure. The water company uses hydraulic network models of the operated network and an extensive system of monitoring the hydraulic parameters of the water supply system. Methodology The paper presents an analysis of the quality of water supplied to the network based on data from three water treatment plants covering a period of 5 years. In total, 336 samples were subjected to physicochemical analyses and 187 samples to microbiological analyses in the range of 38 water quality parameters. Additionally, 5,407 water samples from monitoring of the water quality in the supply network were analyzed. The study was conducted over a period of 8 years at varying time intervals (depending on the current operation of the network and the water treatment plant) in the range of 21 water quality parameters. The source water supplied to the investigated water distribution system was evaluated in terms of its corrosive properties and chemical and biological ability and assessed in accordance with the German guideline DVGW (W216). The results of the water quality examinations were processed using the STATISTICA and Excel software. The hydraulic model of the water supply network has been prepared using the Epanet application.

WATER SUPPLY AND WATER TREATMENT 70
RESULTS In the course of the study, the quality of water pumped into the network and sampled from monitoring points located on the network was examined in detail. A difference in the quality of water sampled from two different sources has been demonstrated (Table 1), as well as the impact of mixing of the two waters in the water distribution system on tap water quality. A mathematical model was used to identify the zones of water mixing and the areas of unfavorable hydraulic conditions (low flow rates and long retention times). The results of the water quality analysis have then been related to hydraulic network settings. Table 1. The results of analyses of water from the water supply network in areas where waters from two different sources mix together and in isolated areas
Parameter Denomination
Source of water supply Medium / min-max
ZUW I ZUW II Water mixing area ZUW I+ ZUW II
Turbidity NTU 0.76/0÷12 0.72/0÷5.6 0.86/0÷7.25 Colour mgPt/l 4.27/0÷47 3.97/0÷15 4.72/0÷20 pH pH 7.17/6.6÷8.78 7.27/6.54÷8.09 7.20/6.6÷7.98 Conductivity µS/cm 204/101÷317 202/101÷343 200/101÷292 Alkalinity mmolH+/l 1.24/0.52÷2.61 1.45/0.7÷2.2 1.38/0.73÷2.4 Hardness mgCaCO3 100.5/50÷199 102.8/55÷261 104.8/56÷207 Dissolved oxygen mgO2/l 5.2/0÷11.6 6.9/0.5÷13 7.0/0÷13.9 Ammonium ion mgNH4/l 0.07/0.00÷0.41 0.06/0.00÷0.26 0.06/0.00÷0.40 Iron mgFe/l 0.11/0.01÷1.35 0.08/0.01÷0.35 0.12/0.00÷1.32 Manganese mgMn/l 0.02/0.00÷0.13 0.02/0.00÷0.20 0.02/0.00÷0.23 Free chlorine mgCl2/l 0.01/0÷0.4 0.00/0÷0.06 0.03/0÷0.20 Orthophosphate dissolved
mgPO4/l 0.12/0.00÷1.27 0.18/0.00÷2.52 0.13/0.00÷4.25
Phosphorus total mgP/l 0.06/0.0÷0.41 0.08/0.00÷0.36 0.07/0.00÷1.10
DISCUSSION AND CONCLUSION The analysis of the impact of the presence of mixing zones, where waters from different sources blend, on the quality of water shows that certain sections of the investigated water distribution system are conducive to the occurrence of water quality destabilization. The average analysis results of mixed water from ZUW-I and ZUW-II were unfavorable for nearly all analyzed water quality parameters versus the average results obtained in the case of water from the isolated areas. Additionally, taking into consideration the fact that the operating conditions in water mixing areas (a higher mean flow velocity and lower retention times) are more favourable from the point of view of water quality maintenance, the adverse effect of the mixing of water from various sources on stability related water quality parameters in the analysed water supply system is visibly confirmed. REFERENCES Advance Water Distribution Modeling and Managment, First Edition, by Haestad Methods, Inc, 2003-2004, Waterbury,
USA DVGW (2004) No W 216 Versorgung mit unterschiedlichen Trinkwassern. Guidlines for Drinking-water Quality (2011). Fourth edition, World Health Organization. Szuster-Janiaczyk (2011). Methodology and selected results of use phosphate corrosion inhibitors in complex water
distribution systems, PhD dissertation, Poznan University of Technology, Poznan.

WATER SUPPLY AND WATER TREATMENT 71
Toxicological Approach and Contributions to Water Quality Management A. Çelebi, Z. R. İkizoğlu and S. Aydın* * Department of Environmental Engineering, Sakarya University, 54187, Sakarya, Turkey (E-mails: [email protected]; [email protected]; [email protected])
INTRODUCTION First water quality index (WQI) in the world was developed in 1965 through selecting and weighting the water quality parameters and applying an aggregation function. The Unites States National Sanitation Foundation (NSF) then revised the WQI by the Delphi technique and introduced the NSFWQI, and since then it has been widely used for describing the source water quality all over the world (Abtahi et al., 2015). Health-based water quality guideline values (GV) are defined as concentrations of chemicals in drinking water that do not pose an appreciable risk to health over a lifetime of exposure. GV are based on acceptable daily intake (ADI, also called reference dose RfD, or tolerable daily intake TDI). Regulatory-toxicological expertise gained since 1993 with “old” analytes in drinking-water (resources) and its extrapolation by analogy on new analytes with patchy human toxicological database allows to provisionally assess their presence in drinking-water (Escher et al., 2015; Dieter, 2014). The risk of cancer can be estimated quantitatively, whereas the non-cancer risk is determined taking into account uncertainty by using safety factors. This separation derives from the assumption that cancer risks can be estimated using models that are linear through zero dose, whereas non-cancer effects are subject to a threshold (Çelebi et al., 2013). The main purpose of the present study is to assess, attract of trending toxicology studies and possible future policies of water quality along with best management practices in local and worldwide scale. DRINKING WATER SUPPLY, MANAGEMENT PRACTICES and RISKS İllustration of screening and monitoring water pollutants in order to safe water supply with support of toxicology are shown in Figure 1.
Figure 1. Framework for the application of bioanalytical tools in water quality monitoring (C = concentration, GV = guideline value, EBT = effect based trigger value, Escher et al., 2015)
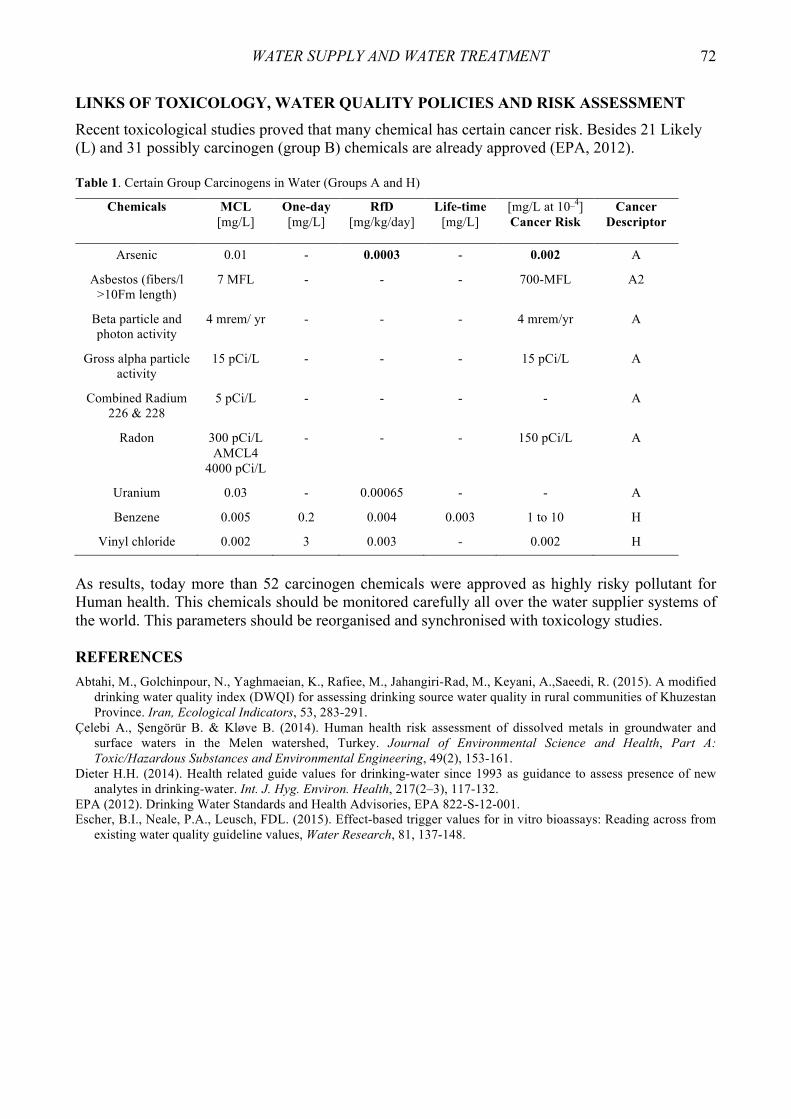
WATER SUPPLY AND WATER TREATMENT 72
LINKS OF TOXICOLOGY, WATER QUALITY POLICIES AND RISK ASSESSMENT Recent toxicological studies proved that many chemical has certain cancer risk. Besides 21 Likely (L) and 31 possibly carcinogen (group B) chemicals are already approved (EPA, 2012). Table 1. Certain Group Carcinogens in Water (Groups A and H)
Chemicals MCL [mg/L]
One-day [mg/L]
RfD [mg/kg/day]
Life-time [mg/L]
[mg/L at 10_4] Cancer Risk
Cancer Descriptor
Arsenic 0.01 - 0.0003 - 0.002 A
Asbestos (fibers/l >10Fm length)
7 MFL - - - 700-MFL A2
Beta particle and photon activity
4 mrem/ yr - - - 4 mrem/yr A
Gross alpha particle activity
15 pCi/L - - - 15 pCi/L A
Combined Radium 226 & 228
5 pCi/L - - - - A
Radon 300 pCi/L AMCL4
4000 pCi/L
- - - 150 pCi/L A
Uranium 0.03 - 0.00065 - - A
Benzene 0.005 0.2 0.004 0.003 1 to 10 H
Vinyl chloride 0.002 3 0.003 - 0.002 H
As results, today more than 52 carcinogen chemicals were approved as highly risky pollutant for Human health. This chemicals should be monitored carefully all over the water supplier systems of the world. This parameters should be reorganised and synchronised with toxicology studies. REFERENCES Abtahi, M., Golchinpour, N., Yaghmaeian, K., Rafiee, M., Jahangiri-Rad, M., Keyani, A.,Saeedi, R. (2015). A modified
drinking water quality index (DWQI) for assessing drinking source water quality in rural communities of Khuzestan Province. Iran, Ecological Indicators, 53, 283-291.
Çelebi A., Şengörür B. & Kløve B. (2014). Human health risk assessment of dissolved metals in groundwater and surface waters in the Melen watershed, Turkey. Journal of Environmental Science and Health, Part A: Toxic/Hazardous Substances and Environmental Engineering, 49(2), 153-161.
Dieter H.H. (2014). Health related guide values for drinking-water since 1993 as guidance to assess presence of new analytes in drinking-water. Int. J. Hyg. Environ. Health, 217(2–3), 117-132.
EPA (2012). Drinking Water Standards and Health Advisories, EPA 822-S-12-001. Escher, B.I., Neale, P.A., Leusch, FDL. (2015). Effect-based trigger values for in vitro bioassays: Reading across from
existing water quality guideline values, Water Research, 81, 137-148.

WATER SUPPLY AND WATER TREATMENT 73
Long Term Drinking Water Quality Monitoring in Drinking Water Supply Systems by On-Line Sensors S. Dejus, R. Rusenieks, A. Nescerecka, S. Nazarovs and T. Juhna* * Department of Water Engineering and Technology, Riga Technical University, 16 Azenes Street, Riga, LV-1048, Latvia, (E-mails: [email protected]; [email protected]; [email protected]; [email protected]; [email protected])
INTRODUCTION
Urbanization during last centuries has led to growth of the cities worldwide and centralized drinking water supply system (DWSS) is vital to ensure healthy and evolving society. The aim of DWSS is to supply clean and safe drinking water to every point of the DWSS. The drinking water must satisfy chemical, biological and aesthetic requirements included in legislation of every state or country. In most of the cases drinking water quality meets the requirements straight after the treatment. However there are numerous cases when consumers have got sick by using poor quality drinking water. Pipe breaks, bacterial regrowth, maintenance and construction works of DWSS, corrosion of pipelines, sewerage cross connections, failure of water purification plant, deliberate drinking water contamination might cause water quality deterioration at the consumption point (Lee et al., 2012). Although the legislation in modern countries says that random “grab” samples must be taken to monitor the drinking water quality, the continuous monitoring of drinking water quality is essential to deliver safe water to consumer. Moreover, conventional microbiology testing methods can take several hours or days, which would lead to long response time of water authorities in case of contamination. That is the reason why the on-line monitoring of drinking water gets more popular in most developed countries. The use of on-line monitoring can reduce response time to several minutes or even seconds. The aim of this study was to investigate the ability of on-line sensors to detect the daily fluctuations of drinking water quality and impact of extended internal water network on drinking water quality. Pilot scale drinking water quality monitoring A pilot scale DWSS was constructed to accomplish the study. The DWSS consists of 200 m piping with two drinking water quality monitoring points – after 100 and 200 meters and 5 hydraulic monitoring points – at 0 m, 50 m, 100m, 150 m and 200 m, where pressure and flow is monitored continuously. Pipeline parameters: material – PVC, inner diameter – 2.5 mm, total length – 200 m, total volume – 98.2 liters, water velocity maintained in the system – 0.1 m/s, water resistance time – 16.7 and 33.3 min (respectively at each quality monitoring point). Inlet water is taken from the public drinking water supply network and outlet water is collected in the 12 m3 underground tank and afterwards discharged in public wastewater system. On-line sensors for temperature, electrical conductivity, total organic carbon (TOC), chlorine, oxidation-reduction potential (ORP) and pH were set at each monitoring point to monitor the drinking water quality. The flow and pressure were also monitored continuously. Selection of the parameters to be monitored is described in previous studies (Dejus et.al., 2015), where the main criteria were to keep low capital investments, low maintenance requirements and good response to most possible contamination types, e.g. Escherichia coli, pesticides and arsenic (Hou et.al., 2014; Che et.al., 2014). The data from the sensors are processed and stored directly with the personal computer (PC), data collection frequency is 1 reading every 5 min, to keep reasonable data amount for a long term monitoring.

WATER SUPPLY AND WATER TREATMENT 74
To establish the daily variation of drinking water quality the prolonged experiment was done and on-line monitoring was done for 1 week. The results showed that there are significant hourly water quality variations during the day. It can be explained by the location of the pilot scale drinking water supply system because it is installed inside the university complex and water retention time in terms of that varies due to consumption during the daytime. Most of the water quality parameters fluctuations might be explained regarding to the retention time variations. E.g. water temperature variation in terms of one day might reach 2֠C what can affect its microbial stability. The correlation between temperature variations and ORP has been found (example of the correlation is in Figure 1).
Figure 1. Temperature and ORP variations in time. The impact of extended internal drinking water distribution network and increased water retention time, respectively, was found significant regarding water quality parameters as the variations between monitoring points (100 meter distance) were reaching 20 % of total value for temperature and 5 % for ORP. CONCLUSIONS The studies in the pilot scale DWSS are ongoing in order to produce a large set of the data, thus ensuring reliable results. Additionally, the experiments will be carried on for a longer time periods and additional microbiological parameters as adenosine triphosphate (ATP) measurements and flow cytometric (FCM) methods will be included in the experimental design. Also the on-line monitoring system response to high risk contamination must be studied. ACKNOWLEDGEMENT This work is supported by the Latvian National research program SOPHIS under grant agreement Nr.10-4/VPP-4/11 REFERENCES Che, H., Liu, S. (2014). Contaminant detection using multiple conventional water quality sensors in an early warning
system, Procedia Engineering, 89, 479-487. Dejus S., Nescerecka A., Nazarovs S., Juhna T. Review on Existing and Emerging Biological Contamination Detection
Tools for Drinking Water Distribution Systems (DWDS) Online Monitoring, Proceedings of the 7th IWA Eastern European Water Professionals Conference for young and senior water professionals, Belgrade, 2015, 320-332.
Hou, D., Liu, S., Zhang, J., Chen, F., Huang, P., Zhang, G. (2014). Online monitoring of water-quality anomaly in water distribution systems based on probabilistic principal component analysis by UV-vis absorption spectroscopy, Journal of Spectroscopy, art. no. 150636.
Lee, A., Francisque, A., Najjaran, H., Rodriguez, M.J., Hoorfar, M., Imran, S.A., Sadiq, R. (2012). Online monitoring of drinking water quality in a distribution network: a selection procedure for suitable water quality parameters and sensor devices, International Journal of System Assurance Engineering and Management, 3(4), 323-337.

WATER SUPPLY AND WATER TREATMENT 75
Evaluating Feasibility of Ultrafiltration as a Treatment Option for Surface Waters of Mtkvari and Aragvi Rivers
K. Didebulidze*, A. Giorgadze*, T. Glurjidze*, A. Kobaladze**, I. Lomidze**, S. Maludze**, Z. Metreveli*, A. Patashuri*, A. Sakevarashvili**, P. Vakuliuk***, V. Tarabara**** and O. Yatseiko***
* Agricultural University of Georgia, Tbilisi, Republic of Georgia ** Free University of Tbilisi, Tbilisi, Republic of Georgia *** National University of “Kyiv-Mohyla Academy”. Kyiv, Ukraine, (E-mail: [email protected]) **** Michigan State University, East Lansing, Michigan, USA
INTRODUCTION The goal of this research was to evaluate filterability of the Mtkvari River water in an ultrafiltration (UF) process. In Summer 2015, water samples were taken at four different locations including three sampling locations upstream of Tbilisi:
1. Mtskheta: Mtkvari River upstream of the confluence with its tributary, Aragvi River. 2. Aragvi: Aragvi River upstream of the confluence with the Mtkvari River. 3. Zahesi: Mtkvari River downstream of the confluence with Aragvi River, near Zahesi
and one sampling location downstream of Tbilisi. 4. Ponichala: Mtkvari River near Ponichala.
The novelty and importance of the work lies in the fact that our study is the first to evaluate membranes as a technology option for portable water treatment in Georgia. While results are very preliminary, the study established a precedent an paves the way for future research and development efforts. MATERIALS AND METHODS The filterability of the water was evaluated in constant pressure dead-end filtration tests with 100 kDa membranes. The membranes were first compacted by filtering 200 mL deionized water at 14.6 psi (~ 105 Pa). Prior to UF tests, river water was pre-filtered through a 0.22 um pore size cartridge filter. As expected based on water quality data, the largest flux decline was observed for Ponichala water. Transient behavior of the flux in tests with this water was markedly different – a rapid decline of ~75 % in flux was followed by the second stage where flux declined much slower. In contrast, for other water sources the initial flux decline was significantly smaller (20 % to 40 %). RESULTS AND DISCUSSION Water quality analysis (Table 1) showed a consistent increase in biological oxygen demand (BOD) from Mtskheta to Zahesi to Ponichala pointing to the role of anthropogenic pollution from the town of Mskheta, smaller settlements and industries along the river, and the capital city of Tbilisi in deteriorating water quality. The lowest BOD was measured in the water from Aragvi River, which is a tributary of Mtkvari and has origins in mountains. Atomic absorption analysis was used to determine concentrations of select heavy metals: As, Cd, Cu, Pb, and Hg. Concentrations of Pb in Mtkvari exceeded MCLs both upstream and downstream of Tbilisi, while Hg content was higher in MCL in both of these location and in Aragvi. The reason for significant Hg pollution of Aragvi is not clear. Microbiological analysis showed substantial pollution downstream of Tbilisi but not in other sampled locations. Results are shown in Figure 1.

WATER SUPPLY AND WATER TREATMENT 76
Table 1. Water quality characteristics. Red color is used to mark values exceeding maximum contaminant levels as set by the National Food Agency of Georgia (Water Quality Standards)
Sampling Location
General properties Heavy metal contents [µg/L]
Microbiological contamination*
pH T oC BOD, mg/L
As Cd Cu Pb Hg E. coli, CPU
Total coliforms,
CPU*
Salmonela spp**
Aragvi 5.6 19.7 6.2 0.11 0/2 20 5.6 23.65 0 0 - Mtskheta 7.8 21.1 6.9 7.13 n/d* 10 0.4 1.48 0 19 - Zahesi 7.5 22.6 7.8 2.19 0.2 20 13.2 33.65 56 80 - Poninchala 7.1 23.6 8.5 5.19 0.2 30 39.2 16.48 356 470 + MCL+ n/a 10 3 2000 10 6 100 0
# Not detected ┼ Maximum contaminant level * Colony forming units ** For Salmonella spp, “-“ and “+” signify absence and presence, respectively.
Figure1. Transient behavior permeate flux (left) and application of blocking laws to the permeate flux data (right)
The above analysis suggests that: 1) UF may be a feasible treatment choice for Aragvi River water. For other water types,
coagulation-flocculation pretreatment should be explored as an approach to reducing fouling.
2) Different types of fouling by the different waters call for different choices of the membrane cleaning strategy. Intrapore fouling due to complete, standard or intermediate blockingcan beeffectively addressed by backflushing and chemical cleaning. To reduce membrane cake formation (Zahesi, Mskheta and, especially Ponichala) a hydraulic flush is likely a more cost-effective cleaning method.
REFERENCES Water Quality Standards. National Food Agency of Georgia (in Georgian) http://goo.gl/apLplW.
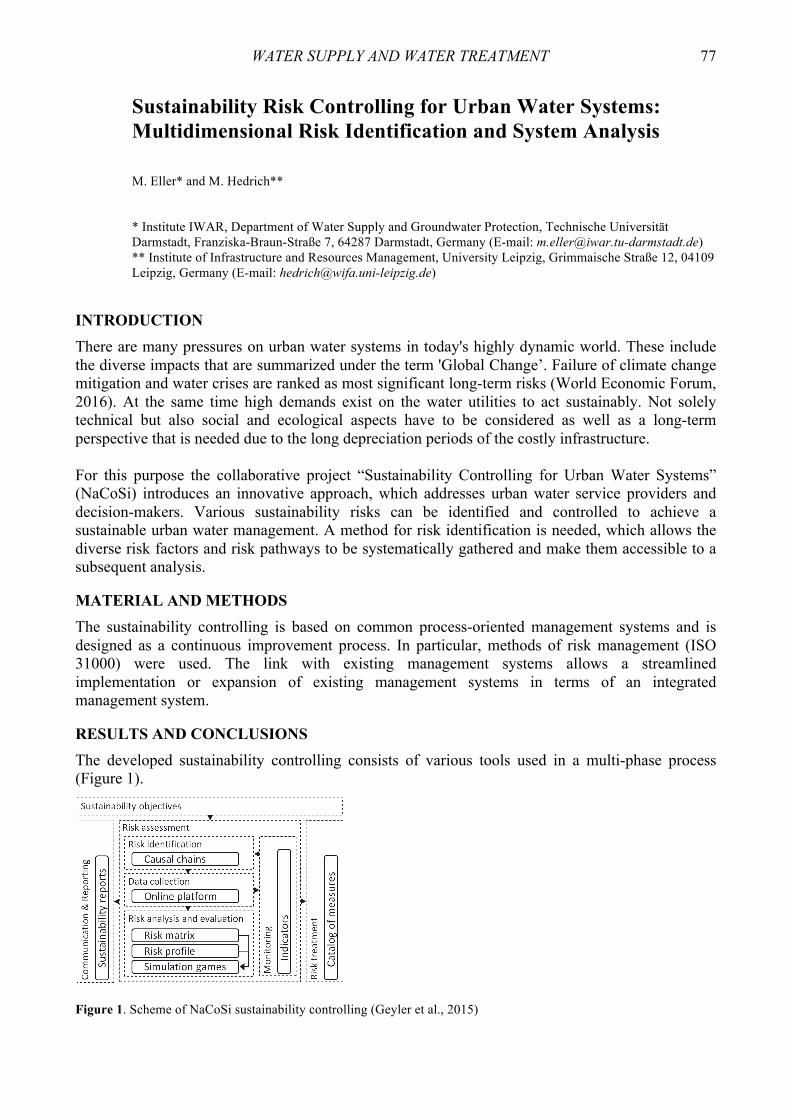
WATER SUPPLY AND WATER TREATMENT 77
Sustainability Risk Controlling for Urban Water Systems: Multidimensional Risk Identification and System Analysis M. Eller* and M. Hedrich** * Institute IWAR, Department of Water Supply and Groundwater Protection, Technische Universität Darmstadt, Franziska-Braun-Straße 7, 64287 Darmstadt, Germany (E-mail: [email protected]) ** Institute of Infrastructure and Resources Management, University Leipzig, Grimmaische Straße 12, 04109 Leipzig, Germany (E-mail: [email protected])
INTRODUCTION There are many pressures on urban water systems in today's highly dynamic world. These include the diverse impacts that are summarized under the term 'Global Change’. Failure of climate change mitigation and water crises are ranked as most significant long-term risks (World Economic Forum, 2016). At the same time high demands exist on the water utilities to act sustainably. Not solely technical but also social and ecological aspects have to be considered as well as a long-term perspective that is needed due to the long depreciation periods of the costly infrastructure. For this purpose the collaborative project “Sustainability Controlling for Urban Water Systems” (NaCoSi) introduces an innovative approach, which addresses urban water service providers and decision-makers. Various sustainability risks can be identified and controlled to achieve a sustainable urban water management. A method for risk identification is needed, which allows the diverse risk factors and risk pathways to be systematically gathered and make them accessible to a subsequent analysis. MATERIAL AND METHODS The sustainability controlling is based on common process-oriented management systems and is designed as a continuous improvement process. In particular, methods of risk management (ISO 31000) were used. The link with existing management systems allows a streamlined implementation or expansion of existing management systems in terms of an integrated management system. RESULTS AND CONCLUSIONS The developed sustainability controlling consists of various tools used in a multi-phase process (Figure 1).
Figure 1. Scheme of NaCoSi sustainability controlling (Geyler et al., 2015)
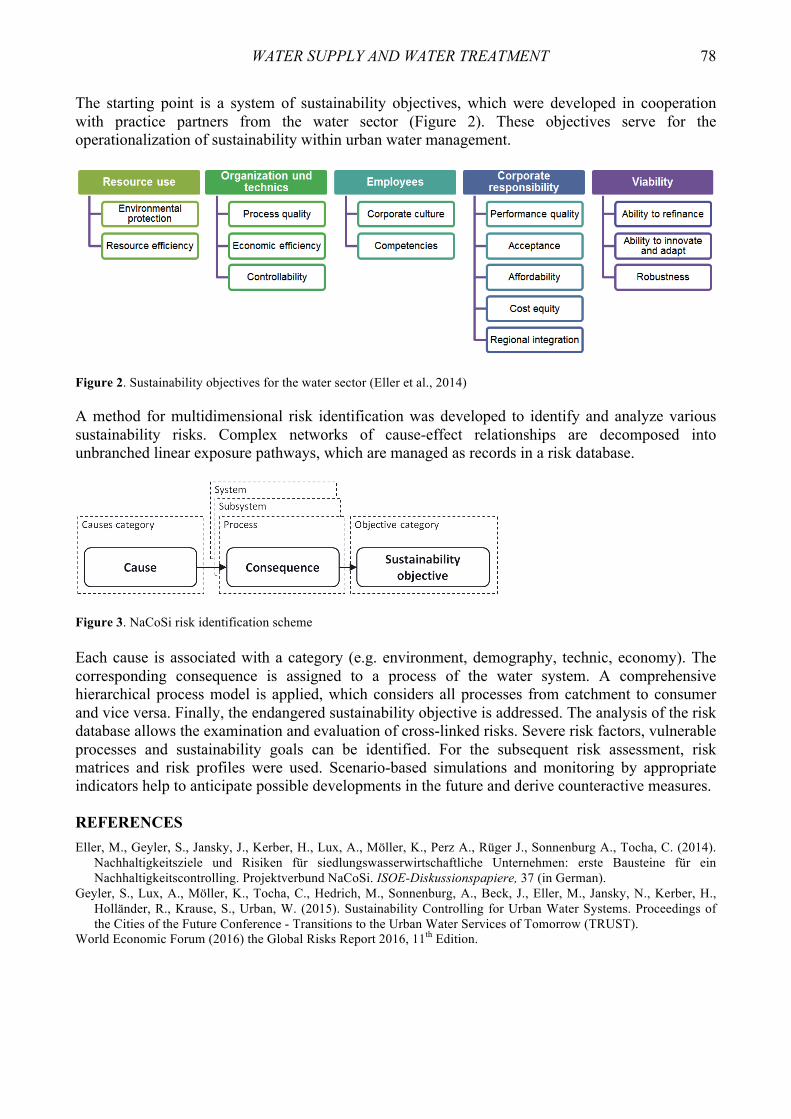
WATER SUPPLY AND WATER TREATMENT 78
The starting point is a system of sustainability objectives, which were developed in cooperation with practice partners from the water sector (Figure 2). These objectives serve for the operationalization of sustainability within urban water management.
Figure 2. Sustainability objectives for the water sector (Eller et al., 2014) A method for multidimensional risk identification was developed to identify and analyze various sustainability risks. Complex networks of cause-effect relationships are decomposed into unbranched linear exposure pathways, which are managed as records in a risk database.
Figure 3. NaCoSi risk identification scheme
Each cause is associated with a category (e.g. environment, demography, technic, economy). The corresponding consequence is assigned to a process of the water system. A comprehensive hierarchical process model is applied, which considers all processes from catchment to consumer and vice versa. Finally, the endangered sustainability objective is addressed. The analysis of the risk database allows the examination and evaluation of cross-linked risks. Severe risk factors, vulnerable processes and sustainability goals can be identified. For the subsequent risk assessment, risk matrices and risk profiles were used. Scenario-based simulations and monitoring by appropriate indicators help to anticipate possible developments in the future and derive counteractive measures. REFERENCES Eller, M., Geyler, S., Jansky, J., Kerber, H., Lux, A., Möller, K., Perz A., Rüger J., Sonnenburg A., Tocha, C. (2014).
Nachhaltigkeitsziele und Risiken für siedlungswasserwirtschaftliche Unternehmen: erste Bausteine für ein Nachhaltigkeitscontrolling. Projektverbund NaCoSi. ISOE-Diskussionspapiere, 37 (in German).
Geyler, S., Lux, A., Möller, K., Tocha, C., Hedrich, M., Sonnenburg, A., Beck, J., Eller, M., Jansky, N., Kerber, H., Holländer, R., Krause, S., Urban, W. (2015). Sustainability Controlling for Urban Water Systems. Proceedings of the Cities of the Future Conference - Transitions to the Urban Water Services of Tomorrow (TRUST).
World Economic Forum (2016) the Global Risks Report 2016, 11th Edition.
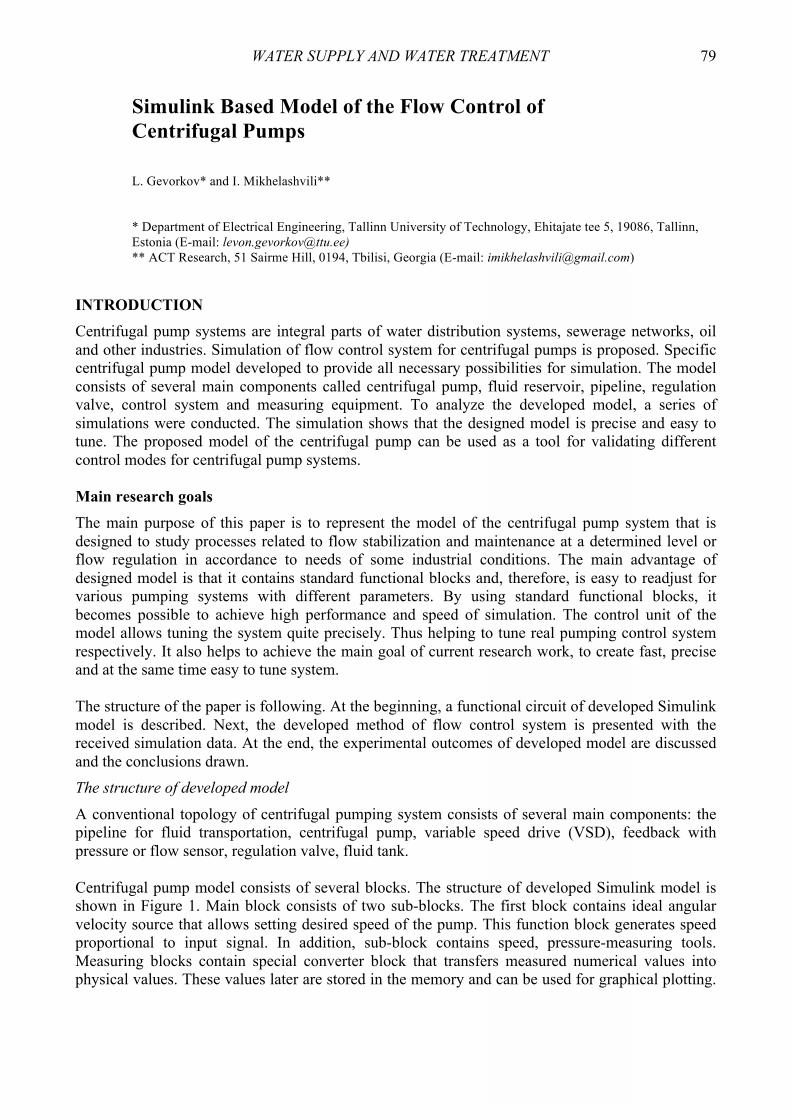
WATER SUPPLY AND WATER TREATMENT 79
Simulink Based Model of the Flow Control of Centrifugal Pumps L. Gevorkov* and I. Mikhelashvili** * Department of Electrical Engineering, Tallinn University of Technology, Ehitajate tee 5, 19086, Tallinn, Estonia (E-mail: [email protected]) ** ACT Research, 51 Sairme Hill, 0194, Tbilisi, Georgia (E-mail: [email protected])
INTRODUCTION Centrifugal pump systems are integral parts of water distribution systems, sewerage networks, oil and other industries. Simulation of flow control system for centrifugal pumps is proposed. Specific centrifugal pump model developed to provide all necessary possibilities for simulation. The model consists of several main components called centrifugal pump, fluid reservoir, pipeline, regulation valve, control system and measuring equipment. To analyze the developed model, a series of simulations were conducted. The simulation shows that the designed model is precise and easy to tune. The proposed model of the centrifugal pump can be used as a tool for validating different control modes for centrifugal pump systems. Main research goals The main purpose of this paper is to represent the model of the centrifugal pump system that is designed to study processes related to flow stabilization and maintenance at a determined level or flow regulation in accordance to needs of some industrial conditions. The main advantage of designed model is that it contains standard functional blocks and, therefore, is easy to readjust for various pumping systems with different parameters. By using standard functional blocks, it becomes possible to achieve high performance and speed of simulation. The control unit of the model allows tuning the system quite precisely. Thus helping to tune real pumping control system respectively. It also helps to achieve the main goal of current research work, to create fast, precise and at the same time easy to tune system. The structure of the paper is following. At the beginning, a functional circuit of developed Simulink model is described. Next, the developed method of flow control system is presented with the received simulation data. At the end, the experimental outcomes of developed model are discussed and the conclusions drawn. The structure of developed model A conventional topology of centrifugal pumping system consists of several main components: the pipeline for fluid transportation, centrifugal pump, variable speed drive (VSD), feedback with pressure or flow sensor, regulation valve, fluid tank. Centrifugal pump model consists of several blocks. The structure of developed Simulink model is shown in Figure 1. Main block consists of two sub-blocks. The first block contains ideal angular velocity source that allows setting desired speed of the pump. This function block generates speed proportional to input signal. In addition, sub-block contains speed, pressure-measuring tools. Measuring blocks contain special converter block that transfers measured numerical values into physical values. These values later are stored in the memory and can be used for graphical plotting.
WATER SUPPLY AND WATER TREATMENT 80
First sub block plays the role of control system. The control signal from PI regulator is connected to In1. The output signal of ideal angular velocity source is connected to centrifugal pump. It is located in the second sub block. Thus this block helps to operate the pumping system and regulate the flow in accordance to reference signal. Second block contains centrifugal pump, reservoir, regulation valve, pressure and flow sensors, and plays the role of main part of pumping system. Control part consists of amplification block, integral function block and saturation block. The system has outer loop flow control. The input signal for this block is a difference between a reference signal and feedback. The classical proportional-integral (PI) controller is applied to control the output value of flow. Parameters of the regulator are tuned during simulation to obtain a better control result. The output of this PI controller serves as an input for speed loop (In1).
Figure 1. Structure of developed model To evaluate the model some tests were conducted. At first so-called system curves were estimated for different rotational speeds: 100 %, 90 %, 80 %, 65 %, 36 % of nominal rotational speed. The accuracy of designed model varies from 0.3 % to 4 %. That shows high precision of the model. CONCLUSION
The developed model of centrifugal pump and related simulation approach are proposed in the paper. Simulations show that designed model is quite flexible and easy to tune. High accuracy of the model during dynamic and static modes, allows using this model for flow control system testing of real centrifugal pumps. REFERENCES De Almeida, AT., Ferreira, F.J.T.E. and Fong, J.A.C. (2011). Standards for Efficiency of Electric Motors. Industry
Applications Maazine, IEEE, 17 (1), 12-19. Ferreira, F.J.T.E., Fong, J.A.C. and De Almeida, A.T. (2011). Ecoanalysis of Variable-Speed Drives for Flow
Regulation in Pumping Systems. Industrial Electronics, IEEE Transactions on, 58 (6), 2117-2125. G. I. Krivchenko (1994). Hydraulic machines: Turbines and Pumps. Lewis Publishers, 414. X. Qiu, L. Chen, and W. Jiang (2010). Simulation of the Flow Control of Radial Piston Pump Based on Simulink.
Information Engineering and Computer Science (ICIECS), 2nd International Conference on, 1-3 Dec. 2010.

WATER SUPPLY AND WATER TREATMENT 81
Calculation of Real Water Losses in Large Russian City G. Gromov* and D. Bychkov**
* Moscow State Civil Engineering University, Chair of Water Supply and “MosvodokanalNIIproject” JSC, Department for Water and Wastewater Treatment Facilities Design, 22 Pleteshkovsky Pereulok, 105005, Moscow, Russia (E-mail: [email protected]) ** Tyumen Vodokanal, 30 Let Pobedy St., 625007, Tyumen, Russia (E-mail: [email protected])
INTRODUCTION According to the Federal Service for National Statistics, the yearly volume of water leakages and unrecorded water consumption in the Russian Federation amounts to 3.2 billion m3. On an average, for Russian cities, the percentage of leakages and unrecorded water consumption amounts to some 18–27 % of the total water consumption. In some regions of the country, this index exceeds 40 %, for example: the Rostov Region: – 42.3 %, the Karachayevo-Cherkessian Republic – 50.8 %, the Chechen Republic – 47.2 % and the Sakhalin Region – 47.3 %. It should be noted that according to paragraph 27 of the Resolution of the Government of the Russian Federation N 406 of May 13, 2013 “Concerning the Governmental Regulation of Tariffs in the Field of Water Supply and Wastewater Disposal”, the determination of the required gross income of a Vodokanal (a Water Supply and Wastewater Disposal Municipal Company) for the calculation of water supply tariffs, should take into account the expenses for water-loss recovery. That means that the water losses are paid for by the end water-consumers. Whereupon, taking into account that the average drinking water tariff in the Russian Federation amounts to 23.64 rubles/m3 (according to the Federal Service for National Statistics for the period of December, 2015), the Russian water consumers nationwide overpay totally 75.6 billion rubles for water supply. All factors, which was mentioned above, means that water losses is serious problem for Russia water sector and this problem should be solved. METHODS The value of real losses was calculated for the Tyumen city based on principals of “Minimum Night Flow” method. The leakage rate formula was also used to simulate losses during 24 hours for whole city (Lambert, 2001):
,Hkq β⋅= (1)
where q – leak rate; β⋅⋅= g2bCk d ; Cd – discharge coefficient; b – width of the slot; g – gravitational acceleration; H – pressure head. To calculate leakage exponent β the following formula was used (Thornton & Lambert, 2005):
,100p)
ILI65.01(5.1 ⋅−−=β (2)
where p – the percentage of rigid pipes in network; ILI – infrastructure leakage index.

WATER SUPPLY AND WATER TREATMENT 82
Infrastructure leakage index is calculated according to the following equation:
,UARL/CARLILI = (3)
where CARL – Current Annual Volume of Real Losses, m3/year; UARL – Unavoidable Annual Real Losses, m3/year. The value of CARL is calculated through the subtraction of the volume of annual apparent water losses from the total volume of annual water losses. The volume of annual apparent water losses is determined using the assumed world average percentage of the total amount of water entering the system. The value of URAL is calculated according to the following equation:
,P)L25N8.0L18(UARL pcm ⋅++= (4)
where Lm – the length of the mains in the system, km; Nc – the number of connections to buildings; Lp – the total length of connections to buildings before the point where the instrument is installed, km; P – the average free head in the system, w.c.m. The leak rate was found by subtracting the legitimate night consumption from minimum night flow. It was chosen the pressure measuring point for calculations, which meets a requirement the following conditions: • The values of free head at particular measuring point should match the average value of free head in the water supply system. • Changes of free head at particular measuring point should match averages values of the free head changes in the water supply system. The principles of average values were deliberately used in order to simplify the calculation and to make method algorithm applicable for projects of water supply schemes bearing in mind the lack of data. CONCLUSIONS
For example of the city of Tyumen the authors derived the interrelation between the real water losses in a water supply system and the pressure in this system. For that purpose foreign calculation methods and their adaptation to the conditions of a specific Russian town were used. In order to check-up the relevance of the assumed equation, the calculations were made for a one-year period. The analysis of obtained results revealed a sufficient convergence of the equation assumed for calculations. Any more accurate definition of the value of the real water loss flow rate requires additional studies. Further activity of “Tyumen Vodokanal” JSC aimed at the assessment and reduction of leakages should comprise a more accurate definition of the initially obtained equation defining the relation between the actual water losses and the head observed in the system with the help of constant measurements of nighttime water consumption by industrial enterprises, the free head measurements at the highest and remotest point and the application of water loss reduction measurements. REFERENCES Lambert, A. (2001). What do we know about pressure: leakage relationships in distribution systems? In: Proceedings of
IWA Conference “System Approach to leakage control and water distribution system management”. Brno, Czech Republic.
Thornton, J. and Lambert, A. (2005). Progress in practical prediction of pressure: leakage, pressure: burst frequency and pressure: consumption relationships. In: Leakage 2005 Conference Proceedings, Halifax, Canada.
Puusta R., Kapelanb Z., Savicb D. A., Koppel T. (2010). A review of methods for leakage management in pipe networks. Urban Water Journal, 7(1), 25-45.

WATER SUPPLY AND WATER TREATMENT 83
Investigating and Modelling the Kinetic of Bulk Chlorine Decay in Water Distribution System S. Al Heboos and I. Licskó* * Department of Sanitary and Environmental Engineering, Budapest University of Technology and Economics, 1111, Budapest, Műegyetem rakpart 3, Hungary (E-mails: [email protected]; [email protected]; [email protected])
INTRODUCTION Many different rate expressions have been proposed and evaluated to model chlorine decay in source waters, finished drinking water, and wastewater effluents (Clark & Sivaganesan, 2002; Rossman et al., 1994; Powell et al., 2000b). In this study, finished water samples from water treatment plant were subjected to series of experiments to estimate the bulk chlorine decay. Analysing of water utility data indicated increasing in THM concentrations in the studied system. These reasons led to investigate the impacts of the initial chlorine concentrations and the organic content on bulk chlorine decay. The applied kinetic model showed a significant dependence of bulk decay coefficients on the initial chlorine concentration (Co) and chemical oxygen demand (COD) of water. By running multiple regression analysis, mathematical equations relating these parameters (Co, COD) and bulk chlorine decay constants, were derived. MATERIALS AND METHODS The water samples were collected from outlet of an operating water treatment plant, Where, the new treatment process in this plant had been applied since 4 years ago e. Several bottle tests were conducted on sub-samples to estimate the effect of the initial chlorine concentration (Co) and the organic content on chlorine decay rate. The organic content influence was studied by dilution the water samples to vary COD concentrations, while the applied concentrations of initial chlorine ranged between 1.0-2.5 mg/l. Modelling of Chlorine Residual In this work, the second -order model which developed by Clark. 1998 had been examined to modelling bulk chlorine degradation. He investigated a two-component model which accounts for both disinfectant and a fictitious reactant. The analytical solution for this model was as follow (1) and (2):
))],ut((eK1/[())K1(AoC()t(A)C( −⋅−−= ↑↓↓
(1)
,CbaC
KAo
Bo= (2)
where CA(t) – the chlorine concentration in mg/l at time t , h; K – dimensionless constant; u – rate constant, 1/h; CAo and CBo – the initial concentrations of chlorine and reactive component, mg/l, respectively, at a certain time t. The value for the rate constant u can be rewritten as follow (3):

WATER SUPPLY AND WATER TREATMENT 84
),K1(Nu −= ,aCbK
N AoA= N > 0, (3)
where kA – the decay rate of chlorine, 1/time; a, b – stoichiometric coefficients and N, 1/h, must be estimated. Parameters for the second-order model were estimated by using nonlinear regression to minimizing the square of the residuals between the measured and predicted chlorine concentrations. RESULTS AND DISCUSSION The results showed significant effect of the initial chlorine concentration (Co) and COD on decay coefficients. It was observed an inverse correlation between K, N and Co, and a proportional relationship between K, N and COD. Empirical equations were developed relating Co and COD with constants of second order model (K, N). The model validation appeared good agreement between the observed and modeled chlorine concentrations with high correlation (R2 = 0.89), Figure 1.
Figure 1. Fitting between the predicted and observed bulk chlorine concentrations for second order model
REFERENCES Clark, R. (1998). Chlorine Demand and TTHM Formation Kinetics: A Second-Order Model. J. Environ. Eng., 124(1),
16-24. Clark, R.M., and Sivaganesan, M. (2002). Predicting chlorine residualsin drinking water: Second order model. J. Water
Resour. Plann. Man-age., 128 (2), 152-161. Powell, J.C., West, J.R., Hallam, N.B., Forster, C.F., and Simms, J. (2000b). Performance of various kinetic models for
chlorine decay. J. Water Resour. Plann. Manage., 126(1), 13-20. Rossman, L.A., Clark, R.M., and Grayman, W.M. (1994). Modeling chlorine residuals in drinking-water distribution-
systems. J. Environ.Eng., 120n (4) , 803-820.
WATER SUPPLY AND WATER TREATMENT 85
Surface Modification of Polymeric Membranes for Minimizing (Bio)Colloidal Fouling in Water Treatment Processes A. Kalashnyk, P. Vakuliuk and I. Furtat* * Membrane Research Centre, National University of Kiev-Mohyla Academy, 2 Skovorody St., Kiev, Ukraine, 04655 (E-mail: [email protected])
INTRODUCTION Currently the polymeric membranes are widely used in water treatment, biotechnology, the food industry, medicine and other fields (Baker, 2004). However, one of the main problems arising upon the operation of the polymeric membrane units is the membrane fouling, which seriously hampers the application of membrane technologies (Scot & Hughes, 1996). Membrane fouling with biocolloids is usually known as biofouling (Flemming et al., 1997). Biofouling is a dynamic process of microbial colonization and growth, which results in the formation of microbial biofilms on the membrane surface. Microorganisms have a tendency to grow on most surfaces that are immersed in waters which do not contain biocides. Currently has already been created a number of methodological approaches for removing biofilms and cleaning the membrane surface, but after such procedures the operating time (service life) of the membrane is reduced each time. Therefore, the development and implementation of membranes with antibacterial properties that are more resistant to biological pollution is of great importance for drinking, industrial and waste water treatment technologies. The novelty and importance of the work lies in the fact that in our study we modificated surface of PAN membrane and create the model of water waste solution. Than we study the formation of biofirm on the membrane surface and the changing of membrane productivity. MATERIALS AND METHODS In our research the membranes prepared from polyacrylonitrile (PAN) by phase inversion method were used, as well as modified membranes with immobilized antibacterial agents. For modification was used glycidyl methacrylate (GMA) (Aldrich, Germany). For antibacterial membranes producing was used synthetic antibacterial agents nalidixic acid, GC and copper, the schematic reaction of immobilization of nalidixic acid to the pre-glycidyl grafted layer membrane surface. Feed water with different nutrient levels was tested: an electrolyte solution supplemented with low concentration of nutrient and a synthetic wastewater with rich nutrient. The composition of the feed water is shown in Table 1. Table 1.Composition of the model wastewater solution
NaCl [mol/l]
CaCl2 [mol/l]
Trisodium citrate [mol/l]
KH2PO4 [mol/l]
NH4Cl [mol/l]
Nutrient broth [v/v]
4,9·10-3 0.5·10-3 1.16·10-3 0.5·10-3 0.94·10-3 10/1000 High concentration of trisodium citrate was used as carbon and energy source in the high nutrient water (Cong et al., 2012). The model of waterwastet solution was created with adding Pseudomonas

WATER SUPPLY AND WATER TREATMENT 86
fluorescens as one of the representatives of microbiological contamination of water with high level of adhesion. To study the transport properties a standard unflowing type of cylindrical cell Amicon 8200 (manufactured by Millipore Corporation, USA). The adhesive's ability for membrane surfaces was studied on Gram-negative and Gram-positive test-cultures (Baker, 2004). RESULTS AND DISCUSSION Functional monomers grafting initiated by UV-polymerization to the hydrophobic membrane surfaces allows, on one hand, hydrophilize this surfaces (including pore surfaces), and on the other - to give membrane additional separation characteristics due to the formation of certain functional groups on their surfaces. In this regard, considerable interest vinyl monomers due to the presence of reactive double bonds and functional groups guanidine group into a molecule GC. In the case of the membrane without modification, the permeate flux after 1 h filtration declined by 40 %. The productivity of the membrane with modification surface also decrease but just by 20 %, moreover, after it normalized and to the end of experiments (6 h) full down by 34 %. But in case of unmodified membrane declining was during whole experiment and in the end the productivity was lower on 85 % (Figure 1).
Figure 1. Productivity of PAN membranes with the model wastewater solution CONCLUSIONS In the present investigation the transport functional and antibacterial property of the modified polyacrylonitrile membranes obtained by immobilizing on their surface anti-microbial synthetic agents. r. The effect of membrane modification on the biofilm formation on the surface was studied. It has been shown that surface modification reduces the adhesion of the studied bacteria strains at the membrane and simplifies its regeneration during prolonged use. Unfortunately the antifouling properties of modified membrane were evaluated mainly with model monosolutions of macromolecular flocculants, or bacterial suspensions, in short-time laboratory tests (Potvorova et al., 2013). There is a lack of studies on the estimation of antifouling properties of surface-modified membranes with real polycomponent feed streams, especially for their long-term applications. REFERENCES Baker, R.W. (2004). Membrane technology and applications. NY: JohnWiley&Sons. Scot, K., Hughes, R. (1996). Industrial membrane separation technology. London: Blackie Academics & Professional. Flemming, H.C., Schaule, G., Griebe, T., Schmitt, J., Tamachkiarowa, A. (1997). Biofouling – the Achille's heel of membrane
processes. Desalination, 113, 215-225. Potvorova, N.,Vakuliuk, P., Furtat, I., Burban, А. (2013). Composite polyacrylonitrile membranes with antibacterial properties,
Petroleum Chemistry, 3(7), 514-520. Cong, Yu., Jinjian, Wu., Alison, E.(2012). Contreras: Control of Nanofiltration Membrane Biofouling by Pseudomonas
aeruginosa Using D-Tyrosine, Journal of Membrane Science, 423-424.

WATER SUPPLY AND WATER TREATMENT 87
An Analysis of the Intensity of Ground Vibrations Caused by Mining Tremors in Places where Water Distribution Systems Have Failed E. Kilian* * Department of Energy and Environmental Engineering, Institute of Water and Wastewater Engineering, Silesian University of Technology, ul. Akademicka 2A, 44-100 Gliwice, Poland (E-mail: [email protected])
INTRODUCTION Water supply systems have a key role in the functioning of the economy and society. An indispensable part of the operation of water supply systems is the failure of pipelines which are the main reason for water loss. In order to ensure an adequate level of reliability of the water distribution systems, it is necessary to identify all the hazardous factors and take action to minimize or eliminate them. Mining operations are often conducted in heavily urbanized areas, densely armed with underground line technical infrastructure: water, sewage, gas, heating and telecommunication. This creates numerous risks for both the surface enclosed structures and the underground network utilities. We can find a lot of publications (ALA, 2001) which outline the procedures for estimating seismic damage of water supply pipelines after an earthquake with specific parameters. However, given the significant differences between earthquakes and mining tremors (Mutke, 2011), it can be difficult to implement this procedure on areas with mining tremors and it requires appropriate analysis. THE AIM AND THE OBJECT OF THE RESEARCH The object of the research is the water distribution system located in an area influenced by dynamic stresses caused by mining tremors. The aim of the research was to identify the value of the parameters of the ground vibrations caused by mining tremors in places with damaged water pipelines. The determined values of the ground vibrations were used to describe the impact of tremors occurring on the underground line facilities in accordance with the Intensity scale of seismic mining events GSIGZW2012 (Mutke, 2008) METHODOLOGY OF THE RESEARCH To identify the influence of mining tremors on the water network it is necessary to build the seismic wave propagation models (attenuation relations). The models define the relationship between the selected vibration parameter and the determining factors for its size. To classify the intensity of the tremors in accordance with the scale GSIGZW2012, knowledge of the following parameters is required: the maximum amplitude of the horizontal components of ground vibration velocity PGVHmax, the duration of the horizontal components of ground vibration velocity TPGVHmax, the maximum amplitude of the horizontal components of ground acceleration in the frequency range up to 10Hz PGAH10 and the duration component of vertical ground acceleration TPGAH10. The factors affecting the size of these parameters are: energy, distance from the epicenter and local geological conditions. To determine the local attenuation relationships, the Si-Midorikawa model has been used (Si-Midorikawa, 2000):

WATER SUPPLY AND WATER TREATMENT 88
kR)Rlog(b)Alog( −−= , (1)
where A – seismic parameter; k – 0.002 for acceleration and 0.003 for velocity; b – regression parameter; R – distance from the epicenter R= ; d – distance from the hypocenter; h – pseudo depth determined by regression which provides non-linearity of the relationship for a small distance from the source. Each parameter of the attenuation relations has been determined by multiple regression analysis based on empirical data. In the research 116 mining tremors were analyzed with energy ≥ 106J as well as 1567 failures of the water supply system, occurring in 2011-2014 in the same municipality (Figure 1). Mining tremors were recorded for 5 measuring stations (accelerometers). Classification of land that included measuring stations was made (using geological documentation) in accordance with the European standard Eurocode 8 (EN 1998-1, 2004). The study assumed that a tremor may cause pipe damage up to 30 days after the tremor.
5574000
5576000
5578000
5580000
5582000
5584000
5586000
5588000
6554
000
6556
000
6558
000
6560
000
6562
000
6564
000
6566
000
6568
000
6570
000
Y,m
X,m
pipefailure miningtremor
Figure 1. The spatial distribution of mining tremors (of E > 106) and failure of the water supply network in 2011-2014 CONCLUSIONS The study allowed the identification of local attenuation relations (PGVHmax, TPGVHmax, PGAH10, TPGAH10) for the area with the analyzed water distribution system. The relationship between the parameters of mining tremors and the water supply network was identified. The results of the research can be used as verification for the GSIGZW2012 scale as an application for underground line facilities. REFERENCES American Lifelines Alliance, ALA (2001). Seismic Fragility Formulations for Water Systems, American Society of
Civil Engineers (ASCE) and Federal Emergency Management Agency (FEMA). www.americanlifelinesalliance.org. EN 1998-1 (2004). Eurocode 8: Design of structures for earthquake resistance – Part 1: General rules, seismic actions
and rules for buildings. Mutke, G., Dubiński, J., Baranski, A., Lurka, A. (2008). Intensity scale of mining seismic events – GSIGZW
Conference: Near Surface The 14th European Meeting of Environmental and Engineering Geophysicists. Mutke, G, Dubiński, J. (2011). Selected relations between earthquakes and mining seismic events recorded in Polish
coal mines Conference. Proceedings of 22nd World Mining Congress Istambul-2011. Editor Dr Sinasi Eskikaya., Istambul, Volume I, 350-357.
Si H., Midorikava S. (2000). New attenuation relations for peak ground acceleration and velocity considering effects of faulty type and site condition, 12th World Conference on Earthquake Engineering.
WATER SUPPLY AND WATER TREATMENT 89
Optimal Pressure Measurement Layout Planning in Real-Life Water Distribution Systems K. Klapcsik and Cs. J. Hős* * Department of Hydrodynamic Systems, Budapest University of Technology and Economics, 3 Műegyetem rkp. Budapest, Hungary 1521, HU (E-mails: [email protected]; [email protected])
PROBLEM FORMULATION Pressure data collection in a water distribution system (WDS) is essential for proper management of the system. The knowledge of pressure values generally drives the operational actions, including leakage, infiltration and demand control (Ridolfi et al., 2014). An urban water system usually contains hundreds (if not thousands) of nodes and pipes, but the limited resources do not allow to deploy pressure gauges in all nodes. Hence, one has to decide at which locations to deploy the limited number of pressure gauges, out of the vast number of potential locations. The measurement layout should be such that it gives the most possible information about the actual state of the network. The problem of optimal sampling design has been investigated by many researchers and several approaches exist, see Kapelen et al. (2003) for a review of the existing methodologies. Walski (1983) suggested to monitor the pressure at nodes with high base demand and on the perimeter of the skeletonised network. Yu and Powell (1994) described the problem as a multi-objective optimization, where the main goal was to maximize the accuracy and minimize the sampling cost. A usual way is to rank the nodes according to their overall sensitivities with respect to a parameter (Ferreri et al., 1994; Morosini et al., 2014) e.g. pipe roughness, diameter, and nodal demand. De Schaetzen et al. (2000) suggested two algorithms based on the shortest path and one more based on the maximization of Shannon’s entropy. Most of these studies approach the problem from the need of hydraulic model calibration, whereas the present work focuses on determining the optimal set of sensor locations for efficient maintenance. In the present paper we formulated the problem as a multi-objective optimization based on the sensitivity analysis with respect to pipe diameters and nodal demands, and the maximization of the Shannon’s entropy. The method was tested on the water system of a Hungarian middle-size city (Sopron). METHODOLOGY The starting point of our analysis is computing the sensitivities with respect to pipe diameters and nodal demands. Each element of a sensitivity matrix represents a variation in nodal pressure versus the variation of a given parameter. The first objective function to identify nodes with the highest sensitivity is defined as (De Schaetzen, 2000):
j
i
xijN
1j jk1p
maxa,a)x(Fk ξ∂
∂==
∈=∑ , (1)
where ξ – the parameter (diameter or demand), N equals to m (number of pipes) or n (number of nodes) and xk – the set of the measurement locations. The second objective function is Shannon’s entropy function:
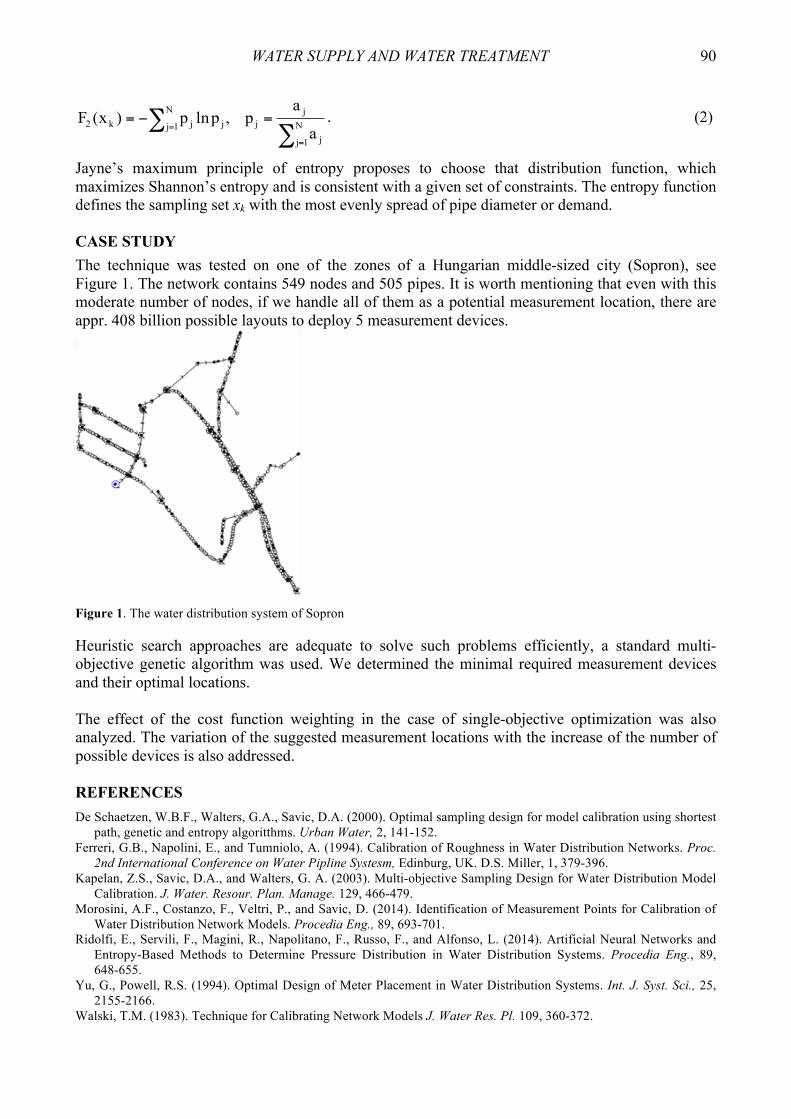
WATER SUPPLY AND WATER TREATMENT 90
∑∑
=
==−= N
1j j
jjj
N
1j jk2a
ap,plnp)x(F . (2)
Jayne’s maximum principle of entropy proposes to choose that distribution function, which maximizes Shannon’s entropy and is consistent with a given set of constraints. The entropy function defines the sampling set xk with the most evenly spread of pipe diameter or demand. CASE STUDY The technique was tested on one of the zones of a Hungarian middle-sized city (Sopron), see Figure 1. The network contains 549 nodes and 505 pipes. It is worth mentioning that even with this moderate number of nodes, if we handle all of them as a potential measurement location, there are appr. 408 billion possible layouts to deploy 5 measurement devices.
Figure 1. The water distribution system of Sopron Heuristic search approaches are adequate to solve such problems efficiently, a standard multi-objective genetic algorithm was used. We determined the minimal required measurement devices and their optimal locations. The effect of the cost function weighting in the case of single-objective optimization was also analyzed. The variation of the suggested measurement locations with the increase of the number of possible devices is also addressed. REFERENCES De Schaetzen, W.B.F., Walters, G.A., Savic, D.A. (2000). Optimal sampling design for model calibration using shortest
path, genetic and entropy algoritthms. Urban Water, 2, 141-152. Ferreri, G.B., Napolini, E., and Tumniolo, A. (1994). Calibration of Roughness in Water Distribution Networks. Proc.
2nd International Conference on Water Pipline Systesm, Edinburg, UK. D.S. Miller, 1, 379-396. Kapelan, Z.S., Savic, D.A., and Walters, G. A. (2003). Multi-objective Sampling Design for Water Distribution Model
Calibration. J. Water. Resour. Plan. Manage. 129, 466-479. Morosini, A.F., Costanzo, F., Veltri, P., and Savic, D. (2014). Identification of Measurement Points for Calibration of
Water Distribution Network Models. Procedia Eng., 89, 693-701. Ridolfi, E., Servili, F., Magini, R., Napolitano, F., Russo, F., and Alfonso, L. (2014). Artificial Neural Networks and
Entropy-Based Methods to Determine Pressure Distribution in Water Distribution Systems. Procedia Eng., 89, 648-655.
Yu, G., Powell, R.S. (1994). Optimal Design of Meter Placement in Water Distribution Systems. Int. J. Syst. Sci., 25, 2155-2166.
Walski, T.M. (1983). Technique for Calibrating Network Models J. Water Res. Pl. 109, 360-372.
WATER SUPPLY AND WATER TREATMENT 91
Quality of the Water Received from Air by Means of Conditioners O. Kovalenko, K. Kormosh and O. Vasyliv* * Odessa National Academy of Food Technologies, Kanatnaya St., 112, Odesa, Ukraine (E-mails: [email protected]; [email protected]; [email protected])
INTRODUCTION Deficiency of fresh water exists in many countries of the world. Therefore, search of additional sources of drinking water is actual. It is especially actual for regions where the centralized water supply is absent. In addition, quality of water is unsatisfactory in underground or superficial sources, available to use, and demands complex and expensive technology of water treatment. These include a number of districts of Odessa region of Ukraine. The recreation centre and sanatoria located lengthways coasts of the Black Sea, estuaries and lakes have deficiency of sweet water. One of possible ways of the partial solution of this problem is use of the water received from free air (Titlov, 2015; Osadchuk & Titlov, 2013). Receiving water from free air possibly by its cooling up to the temperature of "dew-point". This process happens in conditioners, which widely apply, to cooling of air in premises of sanatoria and recreation centre during resort season. In the course of their work, water is formed, which is a secondary product. In most cases it does not gather and is not used in no way, though its volumes considerable (Kovalenko & Kormosh, 2015). Of course, the use of the condensate from the air conditioner without treatment for drinking needs is impossible. Because the quality is dependent on many factors, in particular from contamination and humidity, structure, operating conditions and arrangement of the air conditioning space, and other factors. Therefore, the first step in work aimed at the development of water treatment technology, derived from the air, was the analysis of indicators of the quality of such water samples, depending on the conditions of its receiving. RESULTS OF RESEARCH Water samples from air were received by means of conditioners of the SenSey FTI-51MR model. These conditioners are used in a recreation centre, located on the Black Sea near Odessa. Investigated indicators of quality of samples of water of two types. The first samples are received from conditioners, which in use did not subject long time to sanitary processing. The second are received from conditioners which working surfaces regularly processed special washing solution. In samples of water defined sanitary and chemical indicators and indicators of epidemic safety. For this purpose used the standardized techniques and the modern equipment. Values of indicators of quality of the water received from air compared to requirements of the State health regulations and norms of drinking water (DSanPiN 2.2.4.171.10 Ukraine, 2010). The analysis of results of pilot study of indicators of quality of samples of water from conditioners, which for a long time not been subjected to sanitary treatment allows to draw the following conclusions:
• Quality of water on indicators of epidemic safety is low. It does not conform to normative requirements for the following microbiological indicators: the total microbic number, total coli

WATER SUPPLY AND WATER TREATMENT 92
form, E.coli. It is established that at these samples of water there are saprophytes of the sort Micrococcus, Staphylococcus, there is conditionally pathogenic and pathogenic flora of Enterobacteriaceae, Pseudomonadaceae and Micrococcaceae families. Besides, availability and quantitative ratio in samples of water of mold mushrooms is established: Penicillium, Cladosporium and Aspergillus, and also their associations. In particular, it is established that mushrooms of the sort Cladosporium and Penicillium in associations were dominating.
• Pilot studies of sanitary and chemical indicators of safety and quality of samples of water have shown discrepancy of number of organoleptic indicators (namely smell, turbidity, chromaticity), physical and chemical (eg pH, total iron, solid residue) and sanitary and toxicological indicators (nitrites, ammonium, the general organic carbon, boron) to the existing normative requirements. The greatest aberration is observed on such indicators as chromaticity, turbidity, the general organic carbon and the content of ammonium. The content of heavy metals and radiation indicators of quality of samples of water do not exceed normative values.
• The analysis of results of pilot study of indicators of quality of the water received from conditioners which sanitary processing constantly was carried out has shown that its quality is better, both on sanitary and chemical indicators, and on indicators of epidemic safety. At the same time, the content of ammonium still significantly exceeds norm and there are deviations on some microbiological indicators. It is also necessary to note, very low content of salts of calcium, magnesium, sodium and potassium, and also iodine and fluorides in both types of samples of water. That is, from the point of view of physiological usefulness of mineral composition of water it needs in additional conditioning before using it for drinking (Kormosh, Kovalenko, 2015). Thus, the executed pilot studies of quality of samples of the water received by means of conditioners from free air have shown that it does not conform to the existing requirements of drinking water. To use the received condensate as drinking water, it is necessary to develop technology of improvement of its quality. This is the next task of our research. REFERENCES Derzhavni sanitarni pravyla i normy «Gigijenichni vymogy do vody pytnoi', pryznachenoi' dlja spozhyvannja
ljudynoju»: DSanPiN 2.2.4.171.10. , 48 (Ministerstvo zdravoohorony Ukrai'ny). Kormosh K.Ju., Kovalenko O.O. (2015). Eksperymental'ni doslidzhennja jakosti vody, otrymanoi' iz povitrjanogo
seredovyshha /Mat. VI Vseukr. nauk-prakt. konf. molod.uch., asp. ta stud. «Voda v harchovij promyslovosti – Odesa: ONAHT, 33. - rezhym dostupu: www.aqua-technolog.od.ua/nauka/konferentsiya-voda-v-pishchevoj-promyshlennosti.
Kovalenko O., Kormosh K. Tehnologija al'ternatyvnogo vodopostachannja baz vidpochynku i kurortiv Odes'kogo region, Mat. Mizhn. nauk-prakt.konf. «Perspektyvy majbutn'ogo ta realii' s'ogodennja v tehnologijah vodopidgotovky», m.Kyi'v, 18-19 lystopada 2015, «Centr uchbovoi' literatury», 184-185.
Osadchuk E.A. (2014). Poisk e'nergeticheski e'ffektivnyx rezhimov raboty absorbcionnoj vodoammiachnoj xolodil'noj mashiny v sistemax polucheniya vody iz atmosfernogo vozduxa / E.A.Osadchuk, A.S.Titlov, O.B.Vasyliv, S.Yu.Mazurenko, Naukovі pracі ONAXT, 45, 65-69.
Titlov, A. S., Osadchuk, E.A (2015). The search of the water-ammonia absorption refrigeration machines’ energy efficient modes. IX Minsk Intern. Seminar “Heat Pipes, Heat Pumps, Refrigerators, Power Sources”, Minsk, Belarus, 309-314.

WATER SUPPLY AND WATER TREATMENT 93
Prediction of Failure Rate of Water Pipes Using K-Nearest Neighbours Method M. Kutyłowska* * Faculty of Environmental Engineering, Wrocław University of Technology, Wybrzeze Wyspianskiego 27, 50-370 Wrocław, Poland (E-mail: [email protected])
INTRODUCTION Water-pipe networks are one of the most important part of the whole water supply system and belong to the critical infrastructure. The technical condition of the water conduits should be maintained at the proper level concerning suitable management and failure analysis. Research devoted to the determination of the water conduit failure intensity indicator and other factors having a bearing on the proper functioning of municipal water networks has been conducted in Poland and in the world for many years (Hotloś, 2007; Dell’Orfano et al., 2014). Failure rate of water pipes (λ) should be estimated not only on the basis of operational data, but also using the best available mathematical techniques and models (Kleiner and Rajani, 2001; Kutyłowska, 2015). On the other hand, failure analysis could be established using models based on the artificial intelligence or other statistical methods. The main aim of this paper is to check if non-parametric regression algorithm called K-nearest neighbours could be useful for λ prediction of water conduits (water mains, distribution pipes and house connections). MATERIALS AND METHODS K-nearest neighbours (KNN) algorithm is the relatively simple one among other learning methodologies. The prototype idea is employed during the forecasting process. It is assumed that similar data are grouped to the same class. The prediction is based on the comparison if forecasted values belong to the exemplary set or not (Statistica Electronic Manual). In the regression problems continuous dependent variable (failure rate of: water mains – λm, distribution pipes – λr and house connections – λp) is predicted on the base of independent variables (number of installed house connections, total length and number of damages of water mains, distribution pipes and house connections). The choice of the number of K-nearest neighbours has significant meaning. This parameter is the most important concerning the prediction quality. The smallest K, the bigger prediction variance. The result is obtained on the base of the K-nearest neighbours of new point. Following this assumption, it is needed to have some kind of measurement of the distance between examples. There are four types of distance metric: Euclidean (E), quadratic Euclidean (E2), Manhattan (M) and Czebyszew (C) (Statistica Electronic Manual). The calculations were performed in the programme Statistica 12.0. Operating data from the time span 1999-2014 (received from Water Utility) in one Polish water-pipe network were used for prediction purposes. The whole data set for years 1999-2013 (individually for water mains, distribution pipes and house connections) was divided into two groups (learning – 75 % and testing – 25 %). Besides data from year 2014 were used for verifying the model. The verification data were not shown to the model previously. RESULTS AND DISCUSSION The experimental failure rates were compared with the values predicted by KNN algorithm. The forecasting results (relating to the testing sample) are shown in Table 1. All types of distance metrics were checked (E, E2, M and C). The results of prediction using E and E2 distance metrics are the same.

WATER SUPPLY AND WATER TREATMENT 94
Table 1. Experimental and predicted failure rates (testing)
λm, [fail./(km·a)] λp, [fail./(km·a)] Experimental KNN-E and E2 KNN-M KNN-C Experimental KNN-E and E2 KNN-M KNN-C
0.32 0.32 0.27 0.22 0.76 0.75 0.70 0.65 0.14 0.18 0.14 0.13 0.53 0.47 0.43 0.35 0.14 0.13 0.14 0.13 0.36 0.35 0.43 0.35 0.17 0.13 0.13 0.13 0.64 0.35 0.57 0.35
λr, [fail./(km·a)] 0.26 0.38 0.38 0.36 0.35 0.35 0.34 0.33 0.24 0.33 0.34 0.33 0.42 0.33 0.29 0.33
The results of the verification of proposed KNN models are shown in Figure 1.
0.230.28
0.91
0.10
0.28
0.68
0.13
0.29
0.57
0.23
0.38
0.86
0.00
0.10
0.20
0.30
0.40
0.50
0.60
0.70
0.80
0.90
1.00
Water mains Distribution pipes House connections
λ, fa
il./(k
m·a
)
Experimental KNN-E and E2 KNN-M KNN-C
Figure 1. Experimental and predicted failure rates (verifying) CONCLUSIONS The K-nearest neighbours algorithm could be used for prediction of failure rate of water pipes. Analysis of the results obtained in the testing step shows that Euclidean and quadratic Euclidean distance metric seem to be the most appropriate for failure rate prediction for all types of pipelines. On the other hand, in the verification step Czebyszew distance metric was the most suitable for failure rate forecasting of water mains and house connections. REFERENCES Dell’Orfano, F., Esposito, V., Gualtieri, P., Pulci Doria, G. (2014). Mean values of water pipe breakage rates around the
world and in geographical areas. Water Science and Technology, Water Supply, 14 (5), 766-777. Hotloś, H. (2007). Quantitative assessment of the effect of some factors on the parameters and operating costs of water-
pipe networks. Wrocław University of Technology Publishing House, Wrocław (in Polish). Kleiner, Y., Rajani, B. (2001). Comprehensive review of structural deterioration of water mains: statistical models.
Urban Water, 3 (3), 131-150. Kutyłowska, M. (2015). Modelling of failure rate of water-pipe networks. Periodica Polytechnica Civil Engineering,
59 (1), 37-43. Statistica 12.0, Electronic Manual.
WATER SUPPLY AND WATER TREATMENT 95
Evaluation of Water Efficiency Programs in Single Family Households in the UK- a Case Study D. Manouseli*, S.M. Kayaga* and R. Kalawsky** * Department of Civil & Building Engineering, Loughborough University, Epinal Way, Loughborough, Leicestershire, UK, LE11 3TU (E-mails: [email protected]; [email protected]) ** Department of Electronic, Electrical and Systems Engineering, Loughborough University, Epinal Way, Loughborough, Leicestershire, UK, LE11 3TU (E-mail: [email protected])
CHALLENGES FOR THE WATER INDUSTRY Current water supply worldwide is facing growing pressure as a result of climate change and increasing water demand due to growing population and lifestyle changes. The traditional way of fulfilling the growing demand – supply gap by seeking new water supply options such as exploiting new fresh water resources and investing in the expansion of infrastructures is no longer considered environmentally or economically sustainable. The new path the water industry should follow in a global-scale is the management of water demand through innovative methods, tools and procedures that promote water conservation (Turner et al., 2010). A diverse portfolio of water efficiency measures is now a requirement for the majority of water companies in the UK. Ofwat, the water industry economic regulator for England and Wales, has set minimum water efficiency goals for the water industry, equivalent to decreasing water use by 1 litre per property daily (Waterwise, 2010). Although important efforts have been made towards decreasing household water consumption, the assessment of the effectiveness of such initiatives is still limited and the need for establishing a robust evaluation framework is imperative (Turner et al., 2007, Syme et al., 2010). This study further contributes to the existing literature because disseminating knowledge obtained through implemented water efficiency programs internationally is crucial for the establishment of a robust framework that will move existing evaluation practices forward. SCOPE OF RESEARCH This paper presents results from statistical analysis of a unique water efficiency program case study. Specifically, the study evaluates the effectiveness of installing water saving devices in single family households in areas where a major UK water supply company operates. It further demonstrates a framework for program efficiency evaluation for water companies which experience data deficiency. Finally, the paper examines the factors that influence water consumption of the households in these areas, defining the relationship among daily water consumption per capita, weather and household-specific demographic variables. This study can be a valuable asset to water companies as it provides a thorough review of program evaluation procedures and their limitations and most importantly is attempting to draw the attention to the common data limitation problems that most companies are experiencing, by suggesting possible ways to overcome them. DATA AND METHODOLOGY Monthly water consumption data for 66 households that participated in a water conservation devices installation program were analyzed in parallel with weather related data, information on household demographics and the dates of the devices installation in each household. In addition, monthly water consumption data for 246 households from the same geographical area which did not take part in the program were used in the analysis, enabling useful comparisons of the changes in water consumption between participating households and non-participating ones over a period of
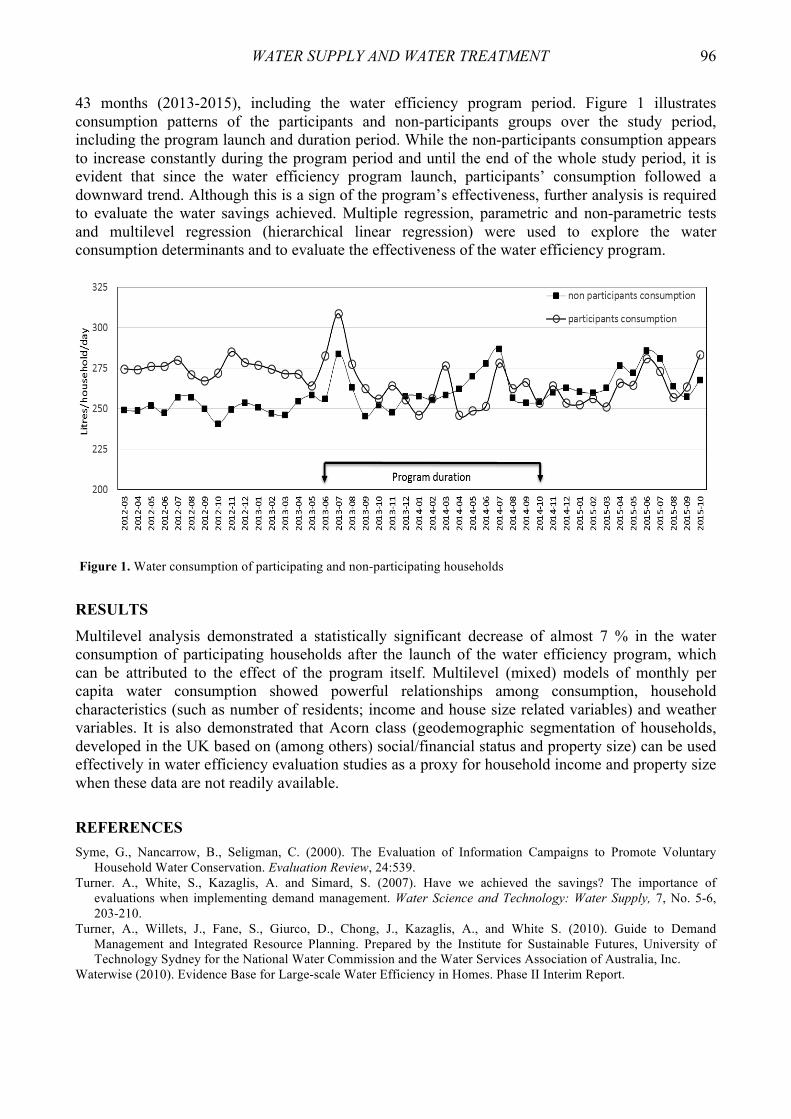
WATER SUPPLY AND WATER TREATMENT 96
43 months (2013-2015), including the water efficiency program period. Figure 1 illustrates consumption patterns of the participants and non-participants groups over the study period, including the program launch and duration period. While the non-participants consumption appears to increase constantly during the program period and until the end of the whole study period, it is evident that since the water efficiency program launch, participants’ consumption followed a downward trend. Although this is a sign of the program’s effectiveness, further analysis is required to evaluate the water savings achieved. Multiple regression, parametric and non-parametric tests and multilevel regression (hierarchical linear regression) were used to explore the water consumption determinants and to evaluate the effectiveness of the water efficiency program.
Figure 1. Water consumption of participating and non-participating households RESULTS Multilevel analysis demonstrated a statistically significant decrease of almost 7 % in the water consumption of participating households after the launch of the water efficiency program, which can be attributed to the effect of the program itself. Multilevel (mixed) models of monthly per capita water consumption showed powerful relationships among consumption, household characteristics (such as number of residents; income and house size related variables) and weather variables. It is also demonstrated that Acorn class (geodemographic segmentation of households, developed in the UK based on (among others) social/financial status and property size) can be used effectively in water efficiency evaluation studies as a proxy for household income and property size when these data are not readily available. REFERENCES Syme, G., Nancarrow, B., Seligman, C. (2000). The Evaluation of Information Campaigns to Promote Voluntary
Household Water Conservation. Evaluation Review, 24:539. Turner. A., White, S., Kazaglis, A. and Simard, S. (2007). Have we achieved the savings? The importance of
evaluations when implementing demand management. Water Science and Technology: Water Supply, 7, No. 5-6, 203-210.
Turner, A., Willets, J., Fane, S., Giurco, D., Chong, J., Kazaglis, A., and White S. (2010). Guide to Demand Management and Integrated Resource Planning. Prepared by the Institute for Sustainable Futures, University of Technology Sydney for the National Water Commission and the Water Services Association of Australia, Inc.
Waterwise (2010). Evidence Base for Large-scale Water Efficiency in Homes. Phase II Interim Report.

WATER SUPPLY AND WATER TREATMENT 97
Degradation of DEET and DEP by Ozonation using pCBA as a Hydroxyl Radicals Probe Compound A. Migowska* and V. A. Bjerkelund** * Gdańsk University of Technology, Faculty of Civil and Environmental Engineering, Wyzolenia 5, 83-115 Swarożyn, Poland (E-mail: [email protected]) ** Department of Hydraulic and Environmental Engineering, Norwegian University of Science and Technology (NTNU), Trondheim, N-7491, Norway
AIM AND OBJECTIVES The main aim of this master thesis was to examine the process of ozonation of two chosen micopollutants present in grey water. These micropollutants are: n,n-diethyl-m-toluamide (DEET) and diethyl phthalate (DEP). In order to assess the fraction of the compound removed by hydroxyl radicals, degradation of one more compound was studied. This compound was para-chlorobenzoic acid (pCBA) which is known for its specific way of reacting with ozone. Namely, pCBA is removed only by hydroxyl radicals, therefore, is commonly applied as a probe compound in order to measure hydroxyl radicals formation. EXPERIMETS The ozonation process was studied in two types of water, which varied in pH, alkalinity and TOC. Each compound and water type was studied with three ozone doses (5 mg/L, 7.5 mg/L, 10 mg/L). Method Full experiment consisted of three steps. The first one was the generation of an ozone stock solution which lasted about three hours and needed to be done at most few hours before carrying out the batch experiment. The second one was the batch experiment, which is the ozonation of micropollutants in a mixing “reactor” which was a 500-mL beaker. During the batch experiment, samples were taken out at certain time. The last step is reading and evaluating the data. The samples of ozone concentration and micropollutants concentration needed to be measured. Ozone concentration was measured using an indigo method and the micropollutants – in the HPLC.
Figure 1. Experimental set-up KINETICS STUDIES The kinetics studies were based on the Rct concept basing on reference studies. This method allows to find easily the ratio between OH• radicals and ozone exposures and calculate the fraction

WATER SUPPLY AND WATER TREATMENT 98
removed by OH• radicals. This ratio is described as Rct value. Following equation is given:
,dtOkR]pCBA[]pCBA[ln 2pCBA,OHcto
∫⋅⋅−=⎟⎟⎠
⎞⎜⎜⎝
⎛ (1)
According to (Michael S. Elovitz, 2008), By plotting ⎟⎟⎠
⎞⎜⎜⎝
⎛
o]pCBA[]pCBA[
ln versus ,dtO2∫ the Rct value
can be found by dividing the slope of the plot by pCBA,OHk . It can be easily derived by transforming the formula into linear equation, with constant a determining the slope. For known slope value and pCBA,OHk , the only unknown is Rct which can be easily calculated. The reaction rate constant of OH• radicals with pCBA is given in the literature as 5·109. All the Rct values (for each type of water and each dose of ozone), were found basing on this method, the following example presents the method, all the other plots allowed to calculate all values. Figure 2 is the plot described above, which allows calculate Rct value for one of the studied case.
Figure 2. First-order kinetic plot of the ozone decomposition (water type: GFT, ozone dose: 5mgO3/L)
The value of the slope read from the graph enables calculating Rct value. The values for each water type and for all ozone doses are presented in the table below. According to expectations, for the water with the lower alkalinity and TOC the Rct values are higher, which means the greater OH• radicals exposure due to scavenging characteristics. CONCLUSIONS The collected data confirmed that success in removal by ozonation depends on many factors, such as water composition, ozone dose, micropollutant type, temperature, pH. DEET and pCBA removal efficiency was very similar and relatively high . These compound have almost the same reaction rate constants with both, ozone and OH• radicals. The results showed that the close to the entire removal of both DEET and DEP was done by OH• radicals, which means that these compounds mostly are oxidized via the indirect ozonation pathway. The collected data showed that bicarbonate was scavenging of hydroxyl radicals, therefore, lower removal efficiency of micropollutants was observed in the greywater with highest alkalinity. The removal efficiency of micropollutants in the greywater type with highest alkalinity and TOC was compared to greywater with lower values. REFERENCES Yunzheng, Pi, J. S. (2006, August 18). The Use of para-Chlorobenzoic Acid (pCBA) as an Ozone/Hydroxyl Radical
Probe Compound. Ozone: Science & Engineering: The Journal of the International Ozone Association. Daims, H., Purkhold, U., Bjerrum, L., Arnold, E., Wilderer, P. and Wagner, M. (2001) Nitrification in sequencing biofilm batch reactor: lessons from molecular approaches. Water Science and Technology, 43(3), 9-18.
Michael, S. Elovitz, U. v. (2008). Hydroxyl Radical/Ozone Ratios During Ozonation Processes. The Rct Concept. Ozone: Science & Engineering: The Journal of the International Ozone Association, 239-260.
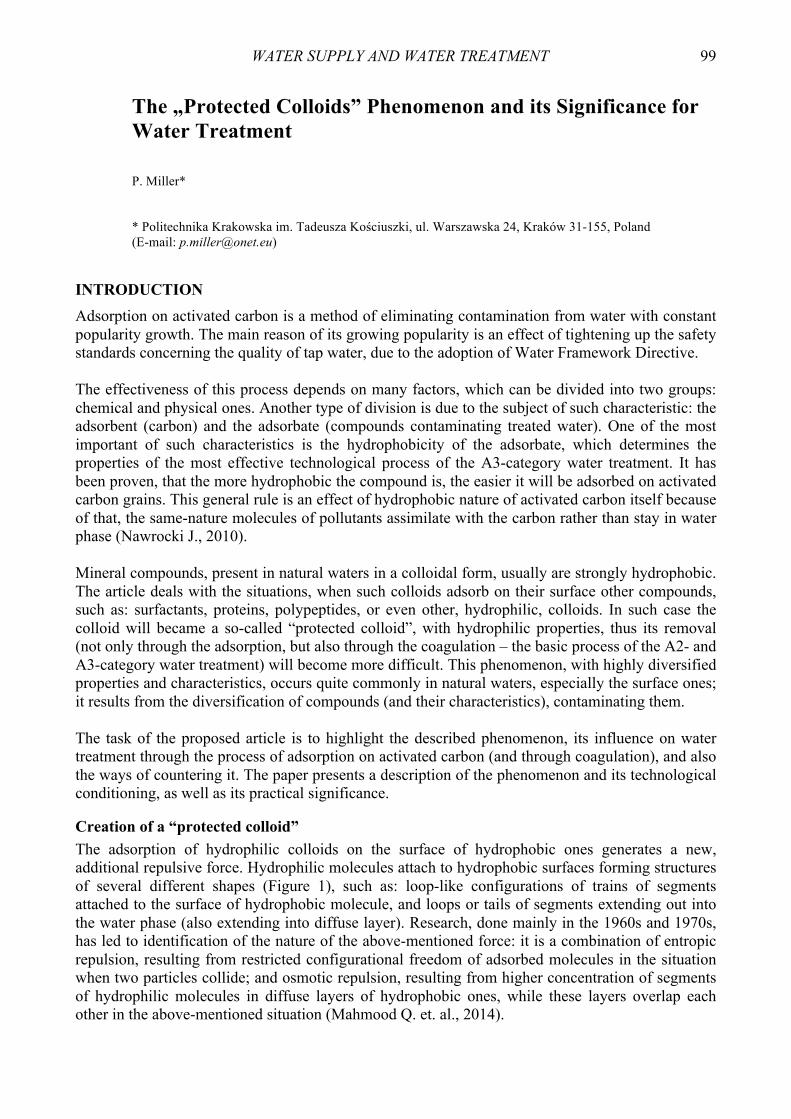
WATER SUPPLY AND WATER TREATMENT 99
The „Protected Colloids” Phenomenon and its Significance for Water Treatment P. Miller* * Politechnika Krakowska im. Tadeusza Kościuszki, ul. Warszawska 24, Kraków 31-155, Poland (E-mail: [email protected])
INTRODUCTION Adsorption on activated carbon is a method of eliminating contamination from water with constant popularity growth. The main reason of its growing popularity is an effect of tightening up the safety standards concerning the quality of tap water, due to the adoption of Water Framework Directive. The effectiveness of this process depends on many factors, which can be divided into two groups: chemical and physical ones. Another type of division is due to the subject of such characteristic: the adsorbent (carbon) and the adsorbate (compounds contaminating treated water). One of the most important of such characteristics is the hydrophobicity of the adsorbate, which determines the properties of the most effective technological process of the A3-category water treatment. It has been proven, that the more hydrophobic the compound is, the easier it will be adsorbed on activated carbon grains. This general rule is an effect of hydrophobic nature of activated carbon itself because of that, the same-nature molecules of pollutants assimilate with the carbon rather than stay in water phase (Nawrocki J., 2010). Mineral compounds, present in natural waters in a colloidal form, usually are strongly hydrophobic. The article deals with the situations, when such colloids adsorb on their surface other compounds, such as: surfactants, proteins, polypeptides, or even other, hydrophilic, colloids. In such case the colloid will became a so-called “protected colloid”, with hydrophilic properties, thus its removal (not only through the adsorption, but also through the coagulation – the basic process of the A2- and A3-category water treatment) will become more difficult. This phenomenon, with highly diversified properties and characteristics, occurs quite commonly in natural waters, especially the surface ones; it results from the diversification of compounds (and their characteristics), contaminating them. The task of the proposed article is to highlight the described phenomenon, its influence on water treatment through the process of adsorption on activated carbon (and through coagulation), and also the ways of countering it. The paper presents a description of the phenomenon and its technological conditioning, as well as its practical significance. Creation of a “protected colloid” The adsorption of hydrophilic colloids on the surface of hydrophobic ones generates a new, additional repulsive force. Hydrophilic molecules attach to hydrophobic surfaces forming structures of several different shapes (Figure 1), such as: loop-like configurations of trains of segments attached to the surface of hydrophobic molecule, and loops or tails of segments extending out into the water phase (also extending into diffuse layer). Research, done mainly in the 1960s and 1970s, has led to identification of the nature of the above-mentioned force: it is a combination of entropic repulsion, resulting from restricted configurational freedom of adsorbed molecules in the situation when two particles collide; and osmotic repulsion, resulting from higher concentration of segments of hydrophilic molecules in diffuse layers of hydrophobic ones, while these layers overlap each other in the above-mentioned situation (Mahmood Q. et. al., 2014).
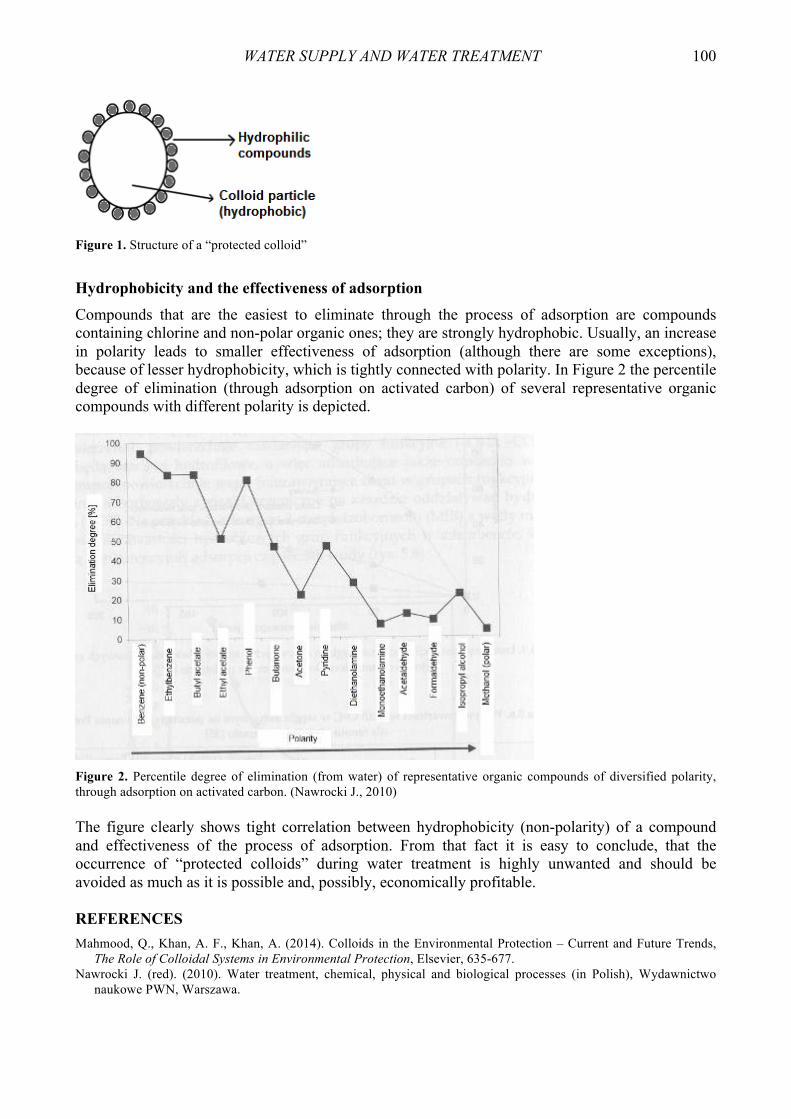
WATER SUPPLY AND WATER TREATMENT 100
Figure 1. Structure of a “protected colloid”
Hydrophobicity and the effectiveness of adsorption Compounds that are the easiest to eliminate through the process of adsorption are compounds containing chlorine and non-polar organic ones; they are strongly hydrophobic. Usually, an increase in polarity leads to smaller effectiveness of adsorption (although there are some exceptions), because of lesser hydrophobicity, which is tightly connected with polarity. In Figure 2 the percentile degree of elimination (through adsorption on activated carbon) of several representative organic compounds with different polarity is depicted.
Figure 2. Percentile degree of elimination (from water) of representative organic compounds of diversified polarity, through adsorption on activated carbon. (Nawrocki J., 2010) The figure clearly shows tight correlation between hydrophobicity (non-polarity) of a compound and effectiveness of the process of adsorption. From that fact it is easy to conclude, that the occurrence of “protected colloids” during water treatment is highly unwanted and should be avoided as much as it is possible and, possibly, economically profitable. REFERENCES Mahmood, Q., Khan, A. F., Khan, A. (2014). Colloids in the Environmental Protection – Current and Future Trends,
The Role of Colloidal Systems in Environmental Protection, Elsevier, 635-677. Nawrocki J. (red). (2010). Water treatment, chemical, physical and biological processes (in Polish), Wydawnictwo
naukowe PWN, Warszawa.
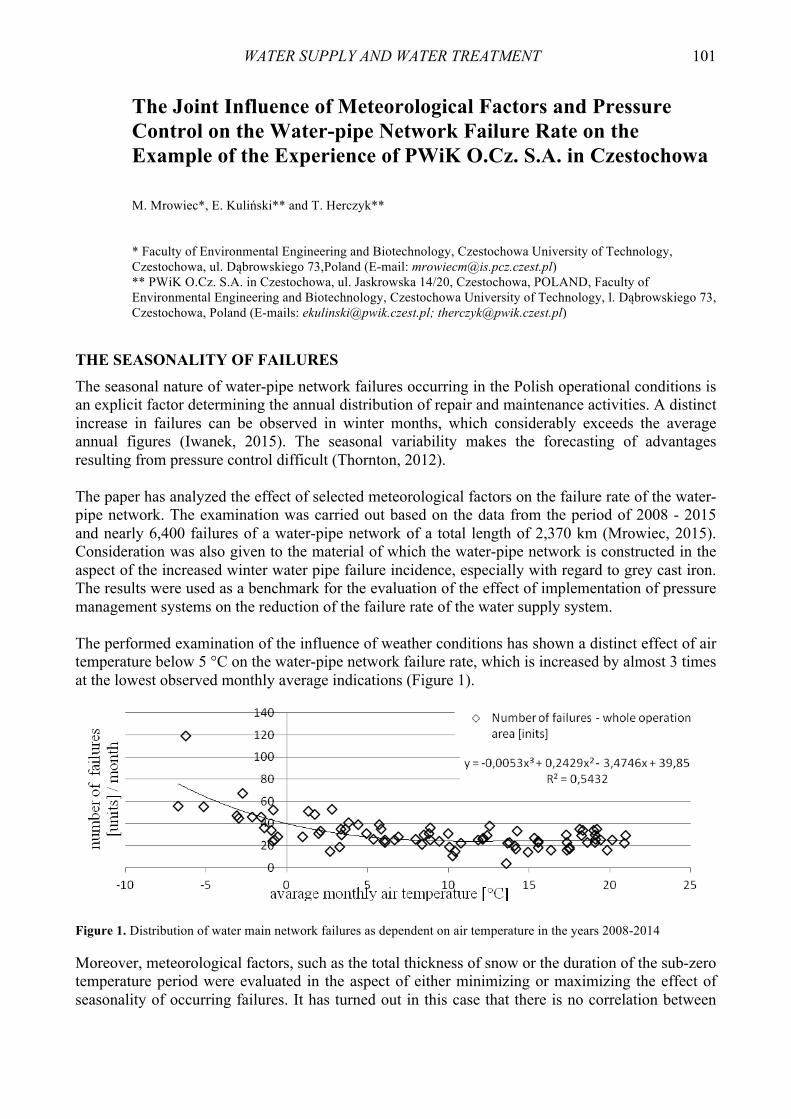
WATER SUPPLY AND WATER TREATMENT 101
The Joint Influence of Meteorological Factors and Pressure Control on the Water-pipe Network Failure Rate on the Example of the Experience of PWiK O.Cz. S.A. in Czestochowa M. Mrowiec*, E. Kuliński** and T. Herczyk** * Faculty of Environmental Engineering and Biotechnology, Czestochowa University of Technology, Czestochowa, ul. Dąbrowskiego 73,Poland (E-mail: [email protected]) ** PWiK O.Cz. S.A. in Czestochowa, ul. Jaskrowska 14/20, Czestochowa, POLAND, Faculty of Environmental Engineering and Biotechnology, Czestochowa University of Technology, l. Dąbrowskiego 73, Czestochowa, Poland (E-mails: [email protected]; [email protected])
THE SEASONALITY OF FAILURES The seasonal nature of water-pipe network failures occurring in the Polish operational conditions is an explicit factor determining the annual distribution of repair and maintenance activities. A distinct increase in failures can be observed in winter months, which considerably exceeds the average annual figures (Iwanek, 2015). The seasonal variability makes the forecasting of advantages resulting from pressure control difficult (Thornton, 2012). The paper has analyzed the effect of selected meteorological factors on the failure rate of the water-pipe network. The examination was carried out based on the data from the period of 2008 - 2015 and nearly 6,400 failures of a water-pipe network of a total length of 2,370 km (Mrowiec, 2015). Consideration was also given to the material of which the water-pipe network is constructed in the aspect of the increased winter water pipe failure incidence, especially with regard to grey cast iron. The results were used as a benchmark for the evaluation of the effect of implementation of pressure management systems on the reduction of the failure rate of the water supply system. The performed examination of the influence of weather conditions has shown a distinct effect of air temperature below 5 °C on the water-pipe network failure rate, which is increased by almost 3 times at the lowest observed monthly average indications (Figure 1).
Figure 1. Distribution of water main network failures as dependent on air temperature in the years 2008-2014 Moreover, meteorological factors, such as the total thickness of snow or the duration of the sub-zero temperature period were evaluated in the aspect of either minimizing or maximizing the effect of seasonality of occurring failures. It has turned out in this case that there is no correlation between
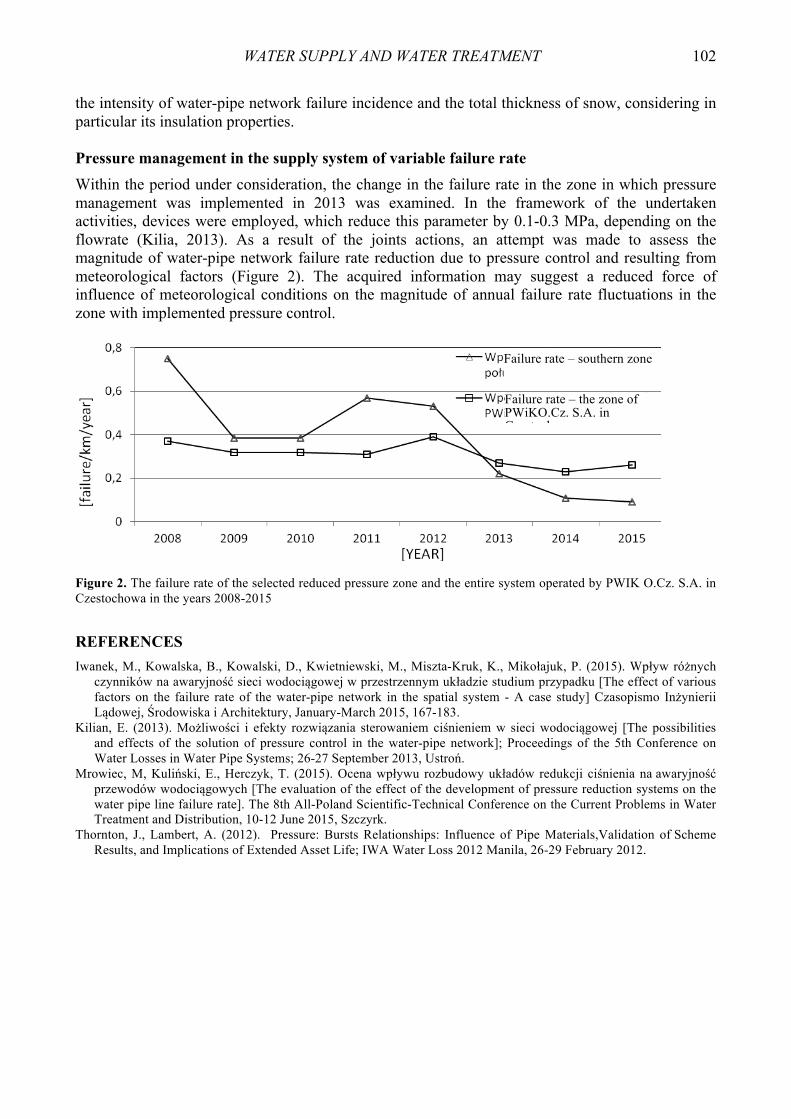
WATER SUPPLY AND WATER TREATMENT 102
the intensity of water-pipe network failure incidence and the total thickness of snow, considering in particular its insulation properties. Pressure management in the supply system of variable failure rate Within the period under consideration, the change in the failure rate in the zone in which pressure management was implemented in 2013 was examined. In the framework of the undertaken activities, devices were employed, which reduce this parameter by 0.1-0.3 MPa, depending on the flowrate (Kilia, 2013). As a result of the joints actions, an attempt was made to assess the magnitude of water-pipe network failure rate reduction due to pressure control and resulting from meteorological factors (Figure 2). The acquired information may suggest a reduced force of influence of meteorological conditions on the magnitude of annual failure rate fluctuations in the zone with implemented pressure control.
Figure 2. The failure rate of the selected reduced pressure zone and the entire system operated by PWIK O.Cz. S.A. in Czestochowa in the years 2008-2015 REFERENCES Iwanek, M., Kowalska, B., Kowalski, D., Kwietniewski, M., Miszta-Kruk, K., Mikołajuk, P. (2015). Wpływ różnych
czynników na awaryjność sieci wodociągowej w przestrzennym układzie studium przypadku [The effect of various factors on the failure rate of the water-pipe network in the spatial system - A case study] Czasopismo Inżynierii Lądowej, Środowiska i Architektury, January-March 2015, 167-183.
Kilian, E. (2013). Możliwości i efekty rozwiązania sterowaniem ciśnieniem w sieci wodociągowej [The possibilities and effects of the solution of pressure control in the water-pipe network]; Proceedings of the 5th Conference on Water Losses in Water Pipe Systems; 26-27 September 2013, Ustroń.
Mrowiec, M, Kuliński, E., Herczyk, T. (2015). Ocena wpływu rozbudowy układów redukcji ciśnienia na awaryjność przewodów wodociągowych [The evaluation of the effect of the development of pressure reduction systems on the water pipe line failure rate]. The 8th All-Poland Scientific-Technical Conference on the Current Problems in Water Treatment and Distribution, 10-12 June 2015, Szczyrk.
Thornton, J., Lambert, A. (2012). Pressure: Bursts Relationships: Influence of Pipe Materials,Validation of Scheme Results, and Implications of Extended Asset Life; IWA Water Loss 2012 Manila, 26-29 February 2012.
Failure rate – the zone of PWiKO.Cz. S.A. in Czestochowa
Failure rate – southern zone

WATER SUPPLY AND WATER TREATMENT 103
Water Distribution Network Rehabilitation Optimistion based on Sociological Criteria and Hydraulic Limitation A. Nedeljković, A. Sekulić and N. Branisavljević* * Faculty of Civil Engineering, University of Belgrade, Belgrade 11000, Serbia (E-mails: [email protected]; [email protected]; [email protected])
INTRODUCTION Water Distribution Network System (WDNS) is one of the vital parts of urban infrastructure and therefore it is required to have a high level of reliability in both time and space (Tabesh & Saber, 2012). The backbone of every WDNS is the network of pipes and because of that it is essential that Waterworks Utility Company, which runs WDN, conducts regular and planned network rehabilitation. Higher water demand, change in the quality of water and existing environmental conditions are just some of the factors that affect the WDNS and cause deterioration of WDNS performance (Jayarama & Srinivasan, 2008). Replacement of the water pipes is traditionally done using the open trench method, which includes excavation, laying of the pipes and after that, trench backfilling (Moeslhi et al., 2009). Sometimes the roads have to be closed with the consequence that people have difficulties reaching their homes and perform everyday activities. In those situations, the traffic is rerouted to the nearby streets, which for effect has traffic jams, longer traveling time and increased travelling costs. Also, by closing the part of the network, the pressure in the pipes may be significantly reduced, which may jeopardize water supply of remaining parts of the network. The aim of this paper is to present the methodology for rehabilitation of WDNS optimization, in order to minimize the negative sociological effects, reflected through increased travelling time due to closed streets and hydraulic effects reflected in decreased pressure in the remaining parts of the network. METHODOLOGY Assuming that the WDNS should be divided in certain sectors that should be rehabilitated simultaneously, the aim of the study is to find the optimal order of the pipe sectors that will be rehabilitated, following three criterions:
1. The total length of pipes in one sector should be maximized. 2. The number of inhabitants which will be effected by the rehabilitation process should be
minimized. 3. The length of rerouting for local population to reach their homes should be minimized.
Methodology of WDNS rehabilitation process presented in this paper is consisted of three steps:
1. Determination all possible combinations of pipe sectors for rehabilitation. 2. Elimination of combinations that do not fulfil minimum pressure criteria. 3. Determine the optimal order of pipe sectors for rehabilitation using above mentioned
criterions The graph theory is used to determine the combination of pipes that can be rehabilitated in one water network sector and to determine the effect that disconnected sector has on the network. The WDNS is presented with the not oriented graph in a way that hydraulic nodes represent the vertices and pipes represent the edges of the graph. It is assumed that every pipe has valves on each end, so

WATER SUPPLY AND WATER TREATMENT 104
that each pipe can be easily disconnected from the network. The sub-graphs were determined by disconnecting the pipes from the network (breaking the edges) and performing the Breath-First-Search (BFS) analysis, with the condition that newly formed sub-graph remains connected. The code for utilization of BFS analysis, for this research, was developed using the MatLAB software. The limitation that minimum pressure of 2 bar, in the network, must be fulfilled during the rehabilitation, was selected in order to ensure uninterrupted water supply for the rest of the population. The hydraulic analysis was done by using EPANET software. For every pipe sector, road network’s segments, which will be closed for traffic, in the process of the sector rehabilitation were isolated. The criterion for minimizing the length of rerouting is expressed through maximizing ratio of the sums of traveling time between every pair of nodes of the isolated segments before and during the rehabilitation. Routes are calculated using pgRouting (library for PostgreSQL) function pgr_dijkstra which is based on dijkstra algorithm. Ranks of above mentioned three criteria are determined for every pipe sector. Rank one represents the best solution and every higher rank represents the inferior solution than the previous one. Combination with minimal sum of ranks represents optimal solution of the optimization problem. CASE STUDY The Water Distribution Network, analysed in this paper, is hypothetical one, developed using the real street network and population density of one town in Serbia. The network consists of one reservoir (water source), 11 nodes and 15 pipes. If the random search method would be used, the number of pipe combinations (sectors) for the network of 15 pipes would be over 32,000. Using the BFS of graph, the number of combinations is reduced to over 16,000. Even further, by introducing the hydraulic limitation (minimum pressure in the network) the number of combinations is further reduced to 349, and only these pipe combinations (sectors) were further analysed. The optimal order of pipe sectors for rehabilitation was selected using the criteria for size of the single sector, number of inhabitants that will be disconnected from the network, and the length of rerouted path. CONCLUSION The sociological effect that rehabilitation actions have on inhabitants may not be the most important criteria for selecting the parts of network for rehabilitation. However, once the part of the network has been selected for rehabilitation, analysis of sociological effects should be considered in order to provide more comprehensive insight of the rehabilitation influence to the local population.The tool presented in this paper can help Decision Makers on how to conduct the rehabilitation process. The optimal solution, based on criteria that seem opposite to each other, can be obtained by using the graph theory, hydraulic modelling and tools for rerouting. REFERENCES Tabesh, M. and Saber, H. (2012). A Prioritization Model for Rehabilitation of Water Distribution Networks Using GIS,
225–241. Jayaram, N. and Srinivasan, K. (2008). Performance-based optimal design and rehabilitation of water distribution
networks using life cycle costing, Vol. 44, 1-15. Moselhi, O., Zayed, T. and Salman A. (2009). Selection Method for Rehabilitation of Water Distribution Networks.
International Conference on Pipelines and Trenchless Technology, 1390-1402.

WATER SUPPLY AND WATER TREATMENT 105
Improvement of the Clarifier with Suspended Sediment Layer Construction in Lime-Soda Water Softening Technological Schemes L. Odud* * Water Supply, Sewerage and Drilling Department, The National University of Water and Environmental Engineering, Rivne, Ukraine (E-mail: [email protected])
INTRODUCTION Use of water with a high calcium and magnesium content can lead to reduced equipment performance or its damage and even to dangerous accidents. Quality improvement can be achieved by the following methods: thermal, reagent, ion exchange, dialysis, etc (Nikoladze G. I., 1987). Lime-soda method is one of the most often used among reagent water softening methods. One of the main facilities of the scheme is clarifier, which is a device where chemical reactions, associated with the supply of reagents, and also physical processes of sediment (sludge) formation, which was formed in the water bulk of clarifier, and filtering water through this layer, occur simultaneously (Kopylov A. S. et al., 2006). MATERIALS, METHODS AND RESEARCH DATA In this paper we propose to use expanded polysterene filling in the clarifiers with suspended sediment layer for reduction water hardness. We conducted softening process in laboratory conditions. The plant operation procedure is the following. Running water through pipeline runs to the flowing tank, which provides constant pressure and thus constant water flow to the plant. Mixing of water with lime and soda solutions is held in contact camera funnel. Water with reagents comes from contact camera to the bottom of the filtration column, where firstly passes the suspended sediment layer and filtration filling (expanded polysterene), and then purified water is collected in the tank for washing, from where is removed to the consumer through pipeline. During research we hourly controlled filtration rate, pressure loss in the column and analytical parameters in initial water and filtrate: pH; total and calcium hardness; alkalinity (Figure 1). As reagents there were used packed soda ash and lime slaked quicklime.
Figure 1. The change of total hardness during the period of filtering cycle (19 hours) with filtration rate V=3.5 m/h: 1 - total hardness value in filtrate, mmol/dm3; 2 - pH value in filtrate; 3 - required minimum pH value – 9.0

WATER SUPPLY AND WATER TREATMENT 106
Maximum decrease of initial water hardness was from 6.35 mmol/dm3 to 0.5 mmol/dm3. Due to research data we made a calculation of the size of clarifier with suspended sediment layer which is applied in water treatment system of one Ukrainian chemical enterprise. RECONSTRUSTED CLARIFIER WITH SUSPENDED SEDIMENT LAYER As the existing scheme of clarifier with suspended sediment layer is rather complicated, thus we offer to simplify it by removing switchgear, air separator, horizontal perforated partition, sludge thickener, sludge receiving windows. Instead of that to arrange in the frame a layer of expanded polystyrene with holding grate (Figure 2).
Figure 2. Schematic diagram of clarifier after reconstruction: 1 – clarifier frame; 2 – pipe for initial water supply; 3 – pipe for lime solution supply; 4 – pipe for soda ash solution supply; 5 – pipe for softened water removal; 6 – pipe for scourage removal; 7 – zone of initial water and reagents mixing; 8 – suspended sediment layer; 9 – expanded polystyrene layer; 10 – holding grate; 11 – softened water zone; 12 - pipe for removal coarse particles. Initial water enters the bottom of the clarifier outer cone - water and reagents mixer. Here also above water supply input on one side the lime solution is supplied, on the other - soda ash solution. It is necessary to maintain pH in the clarifier mixing zone within 9.0 – 10.5. To create suspended sediment layer it should be started with lower flow rates and gradually increase the reagents quantity. Filter material of clarifier is polystyrene (expanded granules). Holding grate is placed over a filtering layer for maintain expanded granules and prevents their breakthrough to purified water. Initial water, passed through suspended sediment layer and expanded polystyrene layer is relieved from hardness, and also from suspended solids. Softened and filtered water after clarifier is collected in over filter space, from where by removal pipeline enters reservoir. During washing of filtering expanded polystyrene layer we must keep an eye on to avoid sludge removal. CONCLUSIONS Use of expanded polystyrene for reconstruction of clarifier will intensify water softening process through simplifying the technological scheme by reducing it instead of three buildings - vortex reactor, clarifier with suspended sediment layer and clarifying quick filter, to one, in which will be mixing, softening and filtering held; increase the efficiency of removing hardness cations from water; reduce the resource costs. The suggested construction of clarifiers with suspended sediment layer can be used in preparation of water at enterprises, in which technological schemes steam-power property equipment is used, requiring water of the proper quality. REFERENCES Kopylov, A. S., Lavygin, V. M., Ochkov, V. F. (2006). Water Treatment in Power Engineering: Textbook for colleges.
– 2-nd edition, stereotype, Publishing house MEI. Moscow, 309. Nikoladze, G.I. (1987). Natural-Water Purification Technology: Textbook for colleges, Vysshaya Shkola. Moscow,
479.

WATER SUPPLY AND WATER TREATMENT 107
The Computer Modeling of Flows in the Exemplary Water Supply System; the Problem of the Oversized Water-Pipe Network – Case Study M. Orłowska-Szostak* and A. Wróbel** * Faculty of Civil and Environmental Engineering, Gdansk University of Technology, ul. G. Narutowicza 11/12, 80-233 Gdansk, Poland (E-mail: [email protected]) ** Faculty of Civil and Environmental Engineering, Gdansk University of Technology, ul. G. Narutowicza 11/12, 80-233 Gdansk, Poland (E-mail: [email protected])
INFORMATION ON ANALYZED EXEMPLARY WATER SUPPLY SYSTEM The subject of the analysis is the water transport and distribution system in the exemplary city located in Warmian-Masurian region of Poland. The calibrated computer model created with the EPANET 2.0 software was used. The essential analyzed feature of this given water supply system is its oversizing, i.e. it has definitely too large pipes’ diameters towards current needs. This however is typical for many water supply systems, because actual water consumption is smaller than in the past. This oversizing is the reason of the very significant deterioration of the flow velocity in the pipelines, which contributes to well-known operational problems. Distribution of velocities in network is shown in figure 1 on the chart of the cumulative flow velocities values in the hour of maximal water consumption.
Figure 1. Chart of the cumulative flow velocities values in the hour of maximal water consumption for the analyzed oversized water distribution system (19.05.2015 – Tuesday, 20:00)
The paper discusses both the water distribution system and the process of data collection for computer model. Data collection of the current state of the water supply system and flow control rules has been conducted with the maximum accuracy and thoroughness. Among others a lot of attention was also paid for occurring water consumption (Sarnowski, 2015; The materials used and the source documentation, 2015). The process of data collection was limited by the range and accuracy of the data provided by the water company. Under this conditions an effort was made to maximize the use of the gathered information in order to provide indispensable credibility of the conducted simulations (Wróbel, 2015; The materials used and the source documentation, 2015).
WATER SUPPLY AND WATER TREATMENT 108
MODEL CALIBRATION The paper addresses the issue of model calibration using, among others, (1) carefully processed water consumption data, (2) the benefits of the time-spatial simulation (Rossman, 2000) and (3) measurement data necessary for calibration, provided by the water company (The materials used and the source documentation, 2015). The initial (for calibration) values of the pipeline roughness and values of annual increases in roughness were assumed on the basis of the water company data obtained from the outcrops. Class of the tap water and lifetime of pipelines were also taken into the account. After a series of adjustments of the pipeline roughness values in the consecutive simulations the simulation result was in line with the measurement results. Crucial for the calibration process was setting accurate initial pipeline roughness values, because it provided stability and very good convergence of the process. Significant impediment to calibration process are extremely low, close to zero, flow velocities in the oversized water supply system. This is due to the fact that the pressures, which measurements are the most common basis for calibration, are not very sensitive for occurring flows. In spite of this the degree of compliance for measured pressure values with those simulated (i.e. the average ratio between lower and greater absolute value among them) was 99 %, while maximum absolute difference between measured and simulated value was lower than 0.38 m. RESEARCH AND CONCLUSION ON THE SYSTEM OVERSIZING PROBLEM Comprehensive analysis of the system performance conducted using the developed computer model were also discussed. They include system performance under normal conditions, in case of fire and under circumstances of various failures. Not only pressures and flow velocity was simulated and researched, but also the water age. In the next part of the paper, we described simulation of three hypothetical solutions of the same water supply system in not oversized versions. This allowed for assessment of the characteristics and scale of oversizing for the analyzed system. Conducted simulations covering both the performance of actual system and mentioned hypothetical variants, contributed to formulation of the certain general remarks about the possibility of reducing the effect of oversizing the diameter of the existing water supply systems through an appropriate expansion or modernization of the system. REFERENCES Rossman, L. (2000). Epanet 2.0 Users Manual, Cincinnati. Sarnowski, D. (2015). Struktura zuїycia wody w 2014r, Dziaіdowo (in Polish). Wrуbel, A. (2015). Kompleksowa analiza pracy sieci wodociągowej, na przykładzie miasta Działdowo, przy
wykorzystaniu komputerowego modelu sieci stworzonego w programie EPANET 2.0. MSc. Thesis, Faculty of Civil and Environmental Engineering, Gdansk University of Technology (in Polish).
The materials used and the source documentation (2015): geodesic map of the area with the specified water supply infrastructure acquired from the Municipal Department of Geodesy; details of the water supply network, data on water consumption in selected time periods and pressures measurements data acquired from the water company; name of the city known to the authors.
WATER SUPPLY AND WATER TREATMENT 109
Preliminary Evaluation of New Green Antiscalants for Reverse Osmosis Water Desalination A. Pervov, A. Andrianov and M. Danilycheva* * National Research University “Moscow State University of Civil Engineering”, 26 Yaroslavskoye shosse, Moscow, Russian Federation, 129337 (E-mail: [email protected])
INTRODUCTION
Supplying fresh water has become an important environmental and economic issue. Desalination with reverse osmosis represents an effective solution to meet the challenges of demands of clean brackish water and seawater for drinking and industrial purposes. The principle problem of RO plants operation is precipitation of low soluble salts (scaling). There are some well-known techniques to reduce scaling and one of the most widespread is antiscalant dosing. At the same time environmental problem connected with eutrophication of water bodies appears with discharging of RO plant concentrates into surface reservoirs. It forces a scale-inhibitor chemistry to move toward “green” antiscalants that do not contain phosphates and other nutrients as well as biodegradable in natural environment. The application of these inhibitors should be economically attractive for implementation in water treatment. A wide number of polymers and co-polymers used for water pretreatment before desalination by RO. The most popular and promising green inhibitors that do not contain nitrogen and phosphorus and biodegradable are based on polyaspartic acid (Husson et al., 2011; Thombre et al., 2005; Ali et al., 2015), polyepoxysuccinic acid (Lei et al., 2015), maleic acid (Amjad et al., 2014) and polysaccharide-based polycarboxylates (Chaussemier et al., 2015). In Russia the prototypes of new green chemicals are developed by ZAO “EKOS-1”. The objective of our studies was to select the best prototypes for different types of feed water: tap water, well water, seawater. Scaling experiments was conducted in the Water treatment laboratory of Department of Water Supply, National Research Moscow State University of Civil Engineering. EXPERIMENTAL There were tested 10 samples of new prototype chemicals based on co-polymers of acrylic and methacrylic acids, polyaspartic acid, maleic anhydride, polyhexamethyleneguanidine and different cross-linking agents, polyaspartate and a mixture of polyaspartate and nitrilotrimethyl phosphonic acid (PA+NTP). The reference antiscalants were NTP, OEDP, Aminat-K (a mixture of sodium salts of nitrilotrimethyl-phosphonic and methyliminobis-methylenephosphonic acids) and several commercial antiscalants based on acrylic and methacrylic acids, polyaspartic acid, polyepoxysuccinic acid, maleic anhydride and other compounds. Membrane scaling tests were carried out using the commercial 4040 spiral wound membrane modules with RO membranes and a laboratory membrane unit. Scaling experiments were conducted by series for new antiscalants and selected reference scale inhibitors with typical doses as indicated below: 0 mg/L (without antiscalant), 3 mg/L, 5 mg/L and 10 mg/L. All scaling tests are conducted in circulation mode whereby reject flow (concentrate) is returned to the feed water tank and permeate is collected in separate tank. The transmembrane pressure is maintained at 7 bar for fresh water and 16 bar for seawater (the Black Sea water model solution with TDS 17500 ppm). The amount of scales of

WATER SUPPLY AND WATER TREATMENT 110
CaCO3 and CaSO4 accumulated in membrane module calculated as difference between initial amount of calcium in feed solution and sum of amount of calcium in concentrate (circulating solution) and permeate (Pervov, 1991). This difference calculated for concentration ratio 2; 3 and 5. Antiscalant efficiency as a calcium carbonate and calcium sulphate inhibitor was calculated by using the following equation:
100MMM
(%)E blankCa
tantiscalanCa
blankCa ⋅
−= , (1)
where blankCaM and tantiscalan
CaM – mass of calcium accumulated in membrane module in the absence of antiscalant and with antiscalant dosing respectively, meq. RESULTS
Preliminary, the best results on tap water and water with high hardness was achieved with co-polymer of methacrylic acid and maleic anhydride (E = 62 – 72 %), co-polymer of methacrylic acid (E = 57 %), co-polymer of maleic and acrylic acid (E = 63 – 73 %) and polyaspartate (E = 71 %). The inhibition efficiency was also high with mixture of polyaspartat and nitrotrimethyl phosphonic acid (E = 72 %). High antiscalant efficiency was achieved at the lower dose (3 mg/L) for co-polymer of methacrylic acid and maleic anhydride. For seawater the best results was demonstrated by polyaspartic acid (E = 50 %), polyepoxysuccinic acid (E = 55 %) and mixture of polyaspartat and nitrotrimethyl phosphonic acid (E = 52 %). CONCLUSIONS The last trend in RO pretreatment is development of “green” antiscalants: low phosphorus and biodegradable. The most promising compounds for synthesis of new inhibitors are polyaspartic, methacrylic, polyepoxysuccinic, polymaleic and maleic acids as well as polysaccharide-based polycarboxylates. Ten samples of pilot inhibitors based on these compounds was prepared and tested to prevent calcium carbonate and calcium sulfate in comparison with reference antiscalants. Several synthesized green inhibitors showed quite good inhibitory capacity, some of them were efficient at low doses and are quite competitive compared with traditional antiscalants. Based on this research, we can distinguish the most efficient inhibitors for the future detailed studies. REFERENCES Ali, S.A., Kazi, I.W. & Rahman, F. (2015). Synthesis and evaluation of phosphate-free antiscalants to control
CaSO4·2H2O scale formation in reverse osmosis desalination plants. Desalination, 357, 36-44. Amjad, Z. & Koutsoukos, P.G. (2014). Evaluation of maleic acid based polymers as scale inhibitors and dispersants for
industrial water applications. Desalination, 335, 55-63. Chaussemier, M. et al. (2015). State of art of natural inhibitors of calcium carbonate scaling. A review article.
Desalination, 356, 47-55. Gauthier, G. et al. (2012). Application of the fast controlled precipitation method to assess the scale-forming ability of
raw river waters. Desalination, 299, 89-95. Hasson, D., Shemer, H. & Sher, A. (2011). State of the art of friendly “green” scale control inhibitors. Industrial &
Engineering Chemistry Research, 50, 7601-7607. Lei Wu, Shi Wenyan, and Chen Gang. (2015). The Scale Inhibition Performance and Mechanism of Polyepoxysuccinic
Acid for Calcium Phosphate. International Journal of Chemical Engineering and Applications, 6 (3), 184 - 189. Liu, D., Dong, W., Li, F., Hui, F. & Lédion, J. (2012). Comparative performance of polyepoxysuccinic acid and
polyaspartic acid on scaling inhibition by static and rapid controlled precipitation methods. Desalination, 304, 1-10. Pervov, A.G. (1991). Scale formation prognosis and cleaning procedure schedules in RO systems operation.
Desalination, 83, 77-118. Thombre, S.M. & Sarwade, B.D. (2005). Synthesis and biodegradability of polyaspartic acid: a critical review. Journal
of Macromolecular Science, Part A, 42(9), 1299-1315.
WATER SUPPLY AND WATER TREATMENT 111
Magnetic Activated Carbon Composites Used as Fenton Like Catalyst for Degrading Pharmaceutical Agents M. S. Secula*, L. Hagiu-Zaleschi*, B. Cagnon**, C. Stan* and G. Carja*
* Department of Chemical Engineering Faculty of Chemical Engineering and Environmental Protection, Gheorghe Asachi Technical University of Iasi, Bvd. Prof. Dr. docent Dimitrie Mangeron 73, 700050, Iasi, Romania (E-mails: [email protected]; [email protected]; [email protected]; [email protected]) ** ICMN, CNRS-Universite d'Orleans, 1B, Rue de la Ferollerie, 45071 Orleans, France (E-mail: [email protected])
INTRODUCTION In the recent years, there has been a growing concern about the presence of pharmaceuticals in different types of water. These compounds are included within the class of emerging pollutants. Their presence in water can be explained in terms of both their common use in medicine and the inefficiency of water treatment systems (Motoc, 2013). Up to present there are no well-established water treatment processes designed to remove pharmaceuticals, such as ibuprofen. Ibuprofen is a nonsteroidal anti-inflammatory drug and has a wide usage. Despite current research in ibuprofen removal, it has been reported too few studies on the methods effectiveness. Scope, materials and methods The purpose of this study was to investigate the removal of ibuprofen from aqueous solutions by photo-Fenton process. Three different granular activated carbon materials (GAC) were selected based on their chemical surface properties to prepare magnetic composites. Their efficiency as Fenton like catalysts towards Ibuprofen removal from aqueous solution is investigated. Materials. Activated Carbon materials were obtained from CECA-Jacobi (France). Three ACs, L27, S21 and X17, were employed in this study in order to establish the influence of surface pHPZC onto the performance of Fenton-like catalysts. The ACs were washed with bidistilled water to remove residual acidity of basicity, and dried at 75 °C for 24 h. FeSO4·7H2O (>99 %), FeCl3 anhydrous (≥98 %) and Fe(NO3)3·9H2O (≥98 %) were purchased from Sigma Aldrich. Ibuprofen sodium salt, analytical standard (>98%) was purchased from Sigma Aldrich. Methods. Magnetic composites were prepared by co-precipitation method. Each of the considered ACs was dried at 75 °C for 24 h. The ACs were used as such and in parallel, each one of the considered ACs was oxidized with concentrated HNO3 in ultrasonic bath for 60 min, washed with bidistilled water and dried. A solution of Fe2+ and Fe3+ was prepared in 1:2 ratio. The unmodified and oxidized ACs respectively were suspended in Fe2+ and Fe3+ solution. This mixture was sonicated for 15 min. 8 M NH4OH solution was added dropwise to adjust the pH to 12 in order to co-precipitate Fe3O4. This reaction was conducted for 1 h at 50 °C under mechanical stirring. Two types of composites, magnetic composites (M-L27, M-S21 and M-X17), and pre-oxidized magnetic composites (M-L27/HNO3, M-S21/HNO3 and M-X17/HNO3) were obtained after washing and drying at 55 °C (Bayazit and Kerkez, 2014). Thermogravimetric analysis (TG/DTG), Fourier transform infrared (FTIR), X-ray diffraction (XRD), and scanning electron microscopy (SEM) were used to investigate the structural, textural,

WATER SUPPLY AND WATER TREATMENT 112
and micromorphology of the catalysts. Total iron content in the obtained composites and iron leakage were determined by spectrophotometric method using phenantroline. The tests were carried in batch mode. In each run, 810 mL of 100 mg/L Ibuprofen were placed in the photoreactor (UV Laboratory Reactor System). The mixture was stirred in dark for 2h to establish the adsorption–desorption equilibrium between the pollutant model and the catalyst surface. Then UV irradiation was performed for 2h using a Pen-Ray-Power Supply lamp (UVP Products, TQ 718, and 700 W) at room temperature. 4 mL of reaction mixture were systematically sampled, separated by centrifugation and then 1mL was diluted and analyzed by means of UV–Vis Jasco spectrophotometer following the absorbance at 219 nm (Ibuprofen). After the analysis, the undiluted solution was added back into the photocatalytic reactor to minimize the loss in total volume and maintain the solid/liquid ratio. Results and discussions Light irradiation tests were carried out to determine the performance of the prepared Iron-impregnated composites towards the removal and degradation respectively of Ibuprofen from aqueous solution. Figure1a shows the photodegradation performance of the six magnetic composites used as Fenton-like catalysts in the presence of H2O2. These tests were conducted after the adsorption equilibrium was reached. Figure 1b presents comparatively the removal efficiency in relation to Ibuprofen after 1h of light irradiation.
a) b) Figure 1. Ibuprofen degradation during photo-Fenton process using magnetic GACs in terms of (a) normalized concentration and (b) removal efficiency after 1h of light irradiation Matrices oxidation with HNO3 results in significantly lower performance towards Ibuprofen degradation. Both, the acid and basic surfaced matrices, L27 and X17, lead to high values of removal efficiency around 80 %. On the contrary, the composites prepared with neutral surfaced matrix S21 resulted in the lowest efficiency. REFERENCES American Public Health Association, American Water Works Association and Water Environment Federation. (1999).
Standard Methods for the Examination of Water and Wastewater - 3500-Fe B. Phenanthroline Method. Bayazit, Ş.S., Kerkez, Ö. (2014). Hexavalent chromium adsorption on superparamagnetic multi-wall carbon nanotubes
and activated carbon composites, Chemical Engineering Research and Design, 92(11), 2725-2733. Motoc, S., Remes, A., Pop, A., Manea, F., Joop Schoonman, J. (2013). Electrochemical detection and degradation of
ibuprofen from water on multi-walled carbon nanotubes-epoxy composite electrode. Journal of Environmental Sciences, 25(4), 838-847.

WATER SUPPLY AND WATER TREATMENT 113
Spatial Analyses of Water Supply Interruptions – Wroclaw’s Case Study K. Siekanowicz-Grochowina*,** * Municipal Water and Sewage Company, New Technologies Center, Na Grobli 14/16, 50-421 Wrocław, Poland (E-mail: [email protected]) ** Faculty of Environmental Engineering, Wroclaw University of Technology, Wybrzeże Wyspiańskiego 27, 50-370 Wrocław, Poland (E-mail: [email protected])
GOAL The continuity in water supply is one of the key objectives for Wrocław waterworks. However, the interruptions may occur because of planned maintenance works or water system failures. The main purpose of the research was to analyse water supply interruptions connected with bursts and service events on Wroclaw water system. The recognition of spatial distribution of those events is an effective tool for planning maintenance and renovation works on water network. The study also shows the total time of water supply interruptions and the scale of inconvenience for customers resulting from the lack of the water. METHODS AND RESULTS The data used in the analysis have been collected within GIS module - dedicated for failure and maintenance events. The events from 2012 to 2015 were analysed separately for each year. The analyses were conducted for grid structures - raster analysis in different spatial resolution and for each DMA (District Metered Area, see: European Commission (2015), Morrison et al. (2007) All analyses were performed using ArcGIS for Desktop from Esri. The results of raster analysis for number and total time of water supply interruptions in 2015 are presented in Figures 1 and 2.
Figure 1. Number of bursts in Wroclaw water network in 2015 - raster analysis (grid: 250 x 250 m)
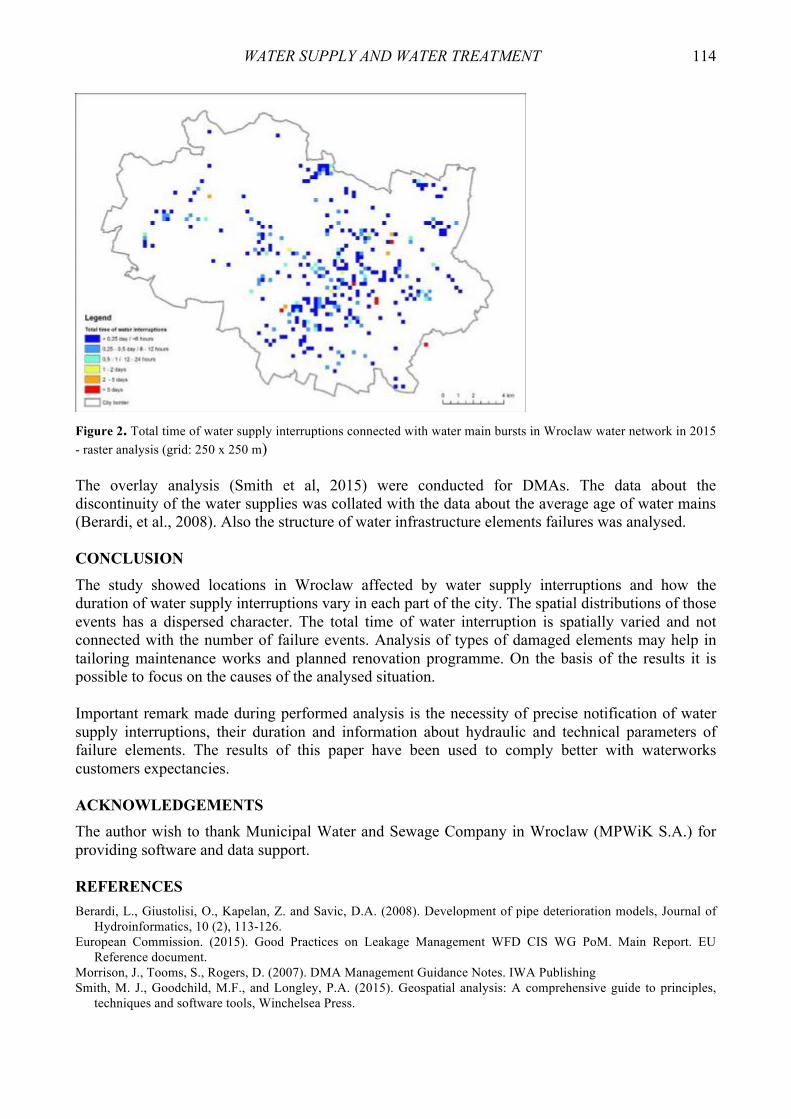
WATER SUPPLY AND WATER TREATMENT 114
Figure 2. Total time of water supply interruptions connected with water main bursts in Wroclaw water network in 2015 - raster analysis (grid: 250 x 250 m)
The overlay analysis (Smith et al, 2015) were conducted for DMAs. The data about the discontinuity of the water supplies was collated with the data about the average age of water mains (Berardi, et al., 2008). Also the structure of water infrastructure elements failures was analysed. CONCLUSION The study showed locations in Wroclaw affected by water supply interruptions and how the duration of water supply interruptions vary in each part of the city. The spatial distributions of those events has a dispersed character. The total time of water interruption is spatially varied and not connected with the number of failure events. Analysis of types of damaged elements may help in tailoring maintenance works and planned renovation programme. On the basis of the results it is possible to focus on the causes of the analysed situation. Important remark made during performed analysis is the necessity of precise notification of water supply interruptions, their duration and information about hydraulic and technical parameters of failure elements. The results of this paper have been used to comply better with waterworks customers expectancies. ACKNOWLEDGEMENTS The author wish to thank Municipal Water and Sewage Company in Wroclaw (MPWiK S.A.) for providing software and data support. REFERENCES Berardi, L., Giustolisi, O., Kapelan, Z. and Savic, D.A. (2008). Development of pipe deterioration models, Journal of
Hydroinformatics, 10 (2), 113-126. European Commission. (2015). Good Practices on Leakage Management WFD CIS WG PoM. Main Report. EU
Reference document. Morrison, J., Tooms, S., Rogers, D. (2007). DMA Management Guidance Notes. IWA Publishing Smith, M. J., Goodchild, M.F., and Longley, P.A. (2015). Geospatial analysis: A comprehensive guide to principles,
techniques and software tools, Winchelsea Press.

WATER SUPPLY AND WATER TREATMENT 115
Concept of “Risk Management” and Optimization of Water Supply in Transport T. Strikalenko*, A. Liapin** and E. Liapina* * Odessa National Academy of Food Technology, Odessa, Ukraine (E-mail: [email protected]) ** Academia Morska w Gdyni,.Widzial Nawigacji, Gdynya, Poland (E-mail: [email protected])
INTRODUCTION The concept “risk management” there is the basis of preventive medicine as it is necessary to manage the factors which raise probability of health infringements, including diseases. The increase of freight turnover and tourist flows is accompanied by increase of morbidity rate among the workers and passengers of transport objects all over the world and is direct consequence of their delayed diagnostics and insufficient registration. The researches which were executed in previous years with our participation included the analysis of ecologic and economic conditions of water supply of some objects of transport in the region, sanitary-and-engineering condition of water supply systems and the used methods’ of water processing on the sea ships and in the ports. The material obtained allow to count that ‘the human factor’, which actions may provide or not due water supply of transport objects is the major risk factor at an estimation of drinking water quality for the workers and passengers of transport. Components of this factor are (a) owners of objects of transport and services of their supply, (b) experts on the objects of transport and (c) staff of sanitary-and-epidemiologic supervision on transport. The last have the leading role in realization of the concept of “risk management” for the professionally own toolkit for identification and an estimation of risks, development of “line of behavior” and an estimation of efficiency of the undertaken actions. This «the human factor», unfortunately, is also an important obstacle in introduction of new technologies of processing and water disinfection on transport. The problem of maintenance of epidemic safety and chemical harmlessness of the water used for a long time by the crews during voyages is on the top priority. The factors promoting outbreaks of different diseases on board the sea ships include the polluted reservoirs for storage of the water, its inadequate disinfection, use of sea water for washing and drawbacks in the design of rubber pipes for connection and water tanks. The aim of the work presented is to test high efficiency biocide polymer “Aquaton-10” for the processing of water on board the sea ships in natural and experimental conditions. “Aquaton-10” is a serious alternative to oxidizing reagents (widely used in water treatment oxidizing reagents such as chlorine, ozone, hypochlorites, chlorine dioxide e. a.), which lead to education of toxic disinfection by-products, corrosion, and require special measures of safety at plants, storage and transportation. Also, this reagent are high efficiency biocide, low corrosive activity and low environmental impact. The working hypothesis - «the human factor» is an important obstacle for application of new technologies of processing and water disinfecting on transport. MATERIAL AND METHODS The researches have been performed in natural conditions and conditions of the experimental laboratory of our institute. We used microbiological and sanitary-and-chemical analysis of the water long kept on board the sea ships, and the water prepared from the sea.
WATER SUPPLY AND WATER TREATMENT 116
In experimental conditions the water and walls of tanks for its storage were infected with Escherichia coli O157, P. aeruginosa, and Staphylococcus aureus. The total mutagenic activity of the water (before and after its processing by a solution of “Aquatone-10”) have been studied in Aime’s test. We have investigated the efficacy of the named solution for the processing of water, reservoirs for its storage and transportation, rubber pipes for connection, pipelines. Disinfection of tanks has been performed either by “filling” or by “an irrigation of internal surfaces” methods. The solution of biocide in concentration 5.0 – 10.0 mg/l (charge norm is 0.9 – 1.0 L/m2, exposition – 1 hour) is efficient and sufficient. Disinfection of rubber pipes for connection, pipelines and hoses has been performed by a method of “filling” with the same concentration and exposition. RESULTS & DISCUSSION The basic results of the carried out laboratory researches consist in the following: (1) at processing by a solution of the reagent “Aquaton-10” of walls of the modelling tanks, which was infected Escherichia coli O157, P. aeruginosa, and Staphylococcus aureus, water did not contain the above-named microorganisms (investigated in 1 hour after tank filling), (2) results of experiences did not depend on the used method of processing of modelling tanks (3) washouts from an internal surface of hoses through which filled tanks on board the sea ships with tap water, after processing by a solution of the reagent “Aquaton-10” did not contain microorganisms (4) by-products of disinfection in water are not found out (5) Residual concentration of the reagent in water from tanks (modelling, on board the sea ships) was minimum, below admissible (6) After processing of the water with biocides, concentration of aqueous mutagen reduces, whereas the minimal titer of water with toxic effect raises. CONCLUSIONS Application in technology of water-treatment of the reagent “Aquaton-10” instead of chlorine, are accompanied by optimisation of organoleptical, sanitary-chemical and epidemiological parameters of the safe of the water. Real possibility of improvement of quality of water on board the sea ships at use of a reagent “Aquaton-10” is not realised because of «the human factor», fear to apply new technologies. That is, «the human factor» should be considered as the greatest brake in realisation of the concept of “risk management” (water safety plan - WHO) in optimisation of maintenance of sea ships (seamen and passengers) of the qualitative water REFERENCES Михайловский, Н.Я. (1984). Токсикологическая характеристика качества воды, формирующегося при ее обработке на водопроводных сооружениях. Профилактическая токсикология, М.:ЮНЕП-МРПТХВ. Т.2, ч.2, 47-55.
Стрикаленко, Т., Лобенко А. (2005) Анализ проблемы оптимизации водоснабжения обьектов транспорта с позиций концепции «управления рисками». Вісник морської медицини, 3 (30), 30-34.
Safety of Water Disinfection: Balancing Chemical & Microbial Risks. (1993). Ed. By Gunther, F. Craun, Washington: ILSI Press.
Nizhnik, V. (2009). Physical chemistry of polymers. К. : Phytosociocentre. Nizhnik, Т, Pryimak Z. (2012). First Commercial Implementation of New Non-Oxidizing Polymeric Reagent on
Municipal Water Treatment Plant. Publications of the IWA 4th Eastern European Young and Senior Water Professionals Conference. Part 1, English papers, 229-236.
Sus, M., Mitchenko, T. (2011). Use of different kind biocides in water treatment. Water and Water Purification Technologies. Scientific and Ttechnical News, №3(5), 39-48.
WATER SUPPLY AND WATER TREATMENT 117
Ownership and Performance in Water Services Revisited: Does Private Management Really Outperform Public? M. Suárez-Varela*, M. de los Á. García-Valiñas**, F. González-Gómez*** and A. J Picazo-Tadeo* * Avenida de los Naranjos s/n, Valencia, Spain. PC: 46022. (E-mail: [email protected]) ** Universidad de Oviedo, Spain (E-mail: [email protected]) *** Universidad de Granada, Spain (E-mail: [email protected]) **** Universidad de Valencia, Spain (E-mail: [email protected])
INTRODUCTION In the last decades, there is a growing interest in developing and implementing accurate performance measures for the water sector in order to provide useful information to a number of relevant stakeholders, thus enabling them to make more informed decisions on which practices favour the industry. Moreover, the issue of the relationship between ownership and performance has also long stood at the core of the debate in the water industry. Following the wave of deregulation of economic activity that started in Anglo-Saxon economies in the late 1970s, some industrialised countries changed their laws to encourage the privatisation of water services as a way of promoting managerial efficiency. However, after three decades of privatisations, there is not any conclusive evidence as to the superiority of private management of urban water services over public one. OBJECTIVES AND CONTRIBUTION In this paper, we revisit the relationship between ownership and performance in water management using a fresh methodological approach based on directional distance functions, metafrontiers and Data Envelopment Analysis (DEA) techniques. Our contribution to existing literature in this field of research is twofold. On the one hand, we assess performance at the level of the management of specific production factors; on the other hand, and more interestingly, we discuss whether differences of performance between private and public management units are due to either different capabilities of managers (managerial efficiency) or different technological restrictions faced by both types of management (program or ownership efficiency). DATA, VARIABLES AND METHODOLOGY Data, sample and variables In this paper we use data relating to the provision of the service of urban water delivery in 70 Spanish municipalities of under 50,000 inhabitants. In 37 of these municipalities either the city council itself or a public utility manages water delivery (public management units), while in the other 33 cases the service is privately managed by either a contractual public private partnership (PPP) or an institutionalised PPP (private management units). Methodological issues Our methodological approach is based on Sáez-Fernandez et al. (2012), which uses directional distance functions to extend the metafrontier approach by O’Donnell et al. (2008) to the measurement of technological differences in the management of specific inputs. In essence, this approach provides a suitable decomposition of technical efficiency assessed with respect to the metafrontier (representing the existing state of knowledge), into the product of technical efficiency

WATER SUPPLY AND WATER TREATMENT 118
measured with respect to the frontier of group h (that represents the state of knowledge and also physical, regulatory and other restrictions faced by units in that group) and the metatechnology ratio for group h (which measures how close the technology of this group is to the joint technology). Figure 1 provides a graphical illustration of our methodology. Let us assume that we observe a set of four private management units represented by dots, and another set of six public management units identified by crosses. The short-run metatechnology or joint technology is represented by the lower envelopment of all these observations regardless of their private or public character, i.e., the isoquant represented by the continuous line. Similarly, the technologies of private and public units are represented by the dotted and dashed isoquants, respectively. Projecting the inefficient public unit, i.e., that located in the interior of the input requirement set, onto the metatechnology with a direction that reduces both labour and operational costs simultaneously yields point A; furthermore, projection onto the technology of the group of public units would yield point B. Accordingly, the segment BA measures the distance that separates the technology of public units from the metatechnology evaluated at this projection, i.e., the metatechnology ratio. Similarly, the segment DC measures the distance that separates the public technology from the metatechnology, assessed in a direction that reduces input labour whilst operational costs are maintained.
Figure 1. Metatechnology, group technologies and metatechnology ratios MAIN RESULTS AND CONCLUSION The main results achieved are the following. First, when we use a conventional approach based on assessing how management units in our sample could proportionally reduce all the variable inputs they use, we find no differences of performance between public and private management. However, in second place, when the analysis is carried out at the level of the management of specific production factors, the picture is rather different. Private management is more efficient in the use of labour input, mainly because of technological restrictions, i.e., legal and institutional restrictions, faced by public management units; conversely, private management appears to be less efficient in the management of operational costs input. It is our opinion that the methodological approach proposed in this paper and the findings of our empirical analysis could shed some light on the ongoing debate about the best choice for the management of urban water services. REFERENCES Saez et al. (2012). Do labour societies perform differently to cooperatives? Evidence from the Spanish building
industry’ Annals of Public and Cooperative Economics, 83(1), 61-81. O’Donnell et al. (2008). Metafrontier frameworks for the study of firm-level efficiencies and technology ratios,
Empirical Economics, 34(2), 231-255.

WATER SUPPLY AND WATER TREATMENT 119
Pilot Investigation as a Case of Science and Industry Cooperation S. Szerzyna, M. Mołczan, M. Wolska, W. Adamski and J. Wiśniewski* * Faculty of Environmental Engineering, Worcław University of Technology, 27 Wybrzeże Wyspiańskiego Street, 50-370 Wrocław, Poland (E-mails: [email protected]; [email protected]; [email protected]; [email protected]; jacek.wisniewski.pwr.edu.pl)
INTRODUCTION Water is a necessary substance for the life of every human being. In its composition may contain the necessary or harmful ingredients to human health. Increasing demands on the quality of water intended for human consumption involve a more effective purification. Makes it necessary to modernize existing water treatment plant and placing in them modern technology. Their choice should be preceded by tests that will give confidence that the chosen technology is the best possible and ensures increasing the efficiency of water purification while maintaining reasonable costs. It is now common practice to incorporate permanent pilot plant facilities into the design of new or upgraded treatment plants (Elder & Budd, 2011). Then new alternative technologies are often verified in practice. Knowledge and experience can meet during pilot investigation to the advantage of both academic and industrial parties. WATER TREATMENT PILOT PLANT That was the idea which inspired us to construct the multistage water treatment pilot plant (Figure 1) for testing promising changes in the surface water treatment trains of Wrocław Water Treatment Plant (WWTP). The project "Research on effectiveness of new water treatment technology as a step towards a shift in thinking about water utility sector” is being pursued in cooperation of Wrocław Municipal Waterworks and Drainage Company and Wrocław University of Technology and co-financed by The National Center for Research and Development.
Figure 1. General view of the research station site

WATER SUPPLY AND WATER TREATMENT 120
RESEARCH AND RESULTS The article presents research station scheme consisting of two independent modular production lines (reference and research) and capacity of 3 m3/h each. Reference line is a classic representation of the water purification system, which is mostly used in Poland for the treatment of surface water. Reference string is a regard for research in the research line, which will use the same technology modules as the reference sequence. It is possible to change the configuration of the research line by replacement of traditional solutions with modern technology of prospective importance for the water industry: membrane techniques, anion exchange on the magnetic resin and physical disinfection. Diagram of potential technological systems was shown on Figure 2. Coagulation, sedimentation and rapid sand filtration process parameters values were established. The hydraulic load, mixer blade area and geometry in the flocculation chamber, mixer rotation direction and intensity, water jet mixing effect and the ways the process devices were connected were taken into account. Sedimentation time and the hydraulic load were characterized settlers operating. Rapid sand filtration cycle was controlled by treated water turbidity and filtration head loss. To ensure a final turbidity allowable for drinking water (1 NTU), it was found to be necessary that between the flushing cycles the turbidity remained below 0.8 NTU.
Figure 2. Possible configurations of technological lines CONCLUSIONS The first research performed under the auspices of the WODTECH project has confirmed the significantly greater complexity of conducting technological process research in pilot conditions as compared to laboratory conditions. The great utility of on-line measurements (of both hydraulic and water quality parameters) in controlling water treatment processes was also found. However, even identical process parameter settings did not ensure a satisfactorily high consistency in process effects obtained in both water treatment lines. REFERENCES Elder, D. & Budd, G. C. (2011). Overview of water treatment processes. In: J. K. Edzwald (Ed.), Water Quality and
Treatment: A Handbook on Drinking Water (6th Edition). McGraw-Hill.
WATER SUPPLY AND WATER TREATMENT 121
Water Networks’ Improvement of Settlements in Ukraine O. Tkachuk* and O. Novytska** * Department of Civil Engineering, The National University of Water and Environmental Engineering, Soborna St., 11, Rivne, Ukraine (E-mail: [email protected]) ** Department of Heat, Gas Supply, Ventilation and Sanitary Engineering, The National University of Water and Environmental Engineering, Soborna St., 11, Rivne, Ukraine (E-mail: [email protected])
BASIC FEATURES OF OPERATING WATER NETWORKS The present imperfections in water network operation are caused not only by unsatisfactory state of the buildings (wear-out and accidence of water networks, water losses and other) but also by their parameters’ and structural layouts’ mismatch due to new operating conditions. It results the unsatisfactory providing users by water, the increase of construction cost of water networks and operating costs on its maintenance, excessive consumption of electric power on water supply. The present state of water networks requires its improvement and complete renovation of pipelines and equipment. The very important issue is a change of design conditions, its modernization taking into account the present problems and progress trends, change of basic parameters during operation, and also resource-saving. IMPROVEMENT OF WATER NETWORKS The diagnostics, adjusting and modernization works are fulfilled on operating water networks in complex, in a certain sequence and provide such measures: • Analysis of water networks’ state (expert evaluation of information about the water networks’ parameters and its verification at the pumping stations, pressure regulating buildings, water mains, water networks and units on it, water balance and consumption analysis, detection of the design defects in scheme and water networks’ operation and etc.); • Water networks’ research (manometric survey, determination of actual characteristics of pumps and pipelines, reasons’ detection of its changing with age, examination of water consumption modes); • Networks’ modelling and its hydraulic computation to define the most rational ways of water network’s improvement and to increase the reliability and efficiency of its operation; • Water networks’ adjusting and (or) modernization (removal of detected “bottlenecks”, re-equipment of the pumping stations; stage-by-stage water networks’ reconstruction; pipelines’ sanation, renovation and etc.). Water networks’ modernization works provide the definition of the most rational variant of improvement of their scheme, parameters and operation modes taking into account normative engineering constraints, efficiency and reliability conditions. Such models are provided for improvement of water networks of settlements in Ukraine (Tkachuk, 2008; Novytska, 2013; Tkachuk & Novytska, 2014):
• The analytical equations for determination of its economic pipe diameters. • The application of water networks’ zoning and boundary conditions. • The analytical function of integral flow rates’ distribution is determined on the basis of
statistical analysis of water distribution. It allows defining adequate relationships of water distribution probability on variation factor taking into account the dominant local factors.

WATER SUPPLY AND WATER TREATMENT 122
• The values of readiness coefficients, supply levels of daily and hour water discharges are offered for the estimation of influence of accident rate and technical state of water networks on reliability and compliance of its construction schemes with design water supply levels.
• The analytical relationships of water flow rates on free pressure values which allow estimating water losses and non-productive water flow rates in the water network.
The mathematical model of technical and economic calculations of water networks is developed on the basis of minimization of discount expenses on construction and operation for optimization of its parameters. It is described by optimization criterion of water network as discounted value of total finance expenses on construction, maintenance of the networks and confunctioned buildings. This criterion defines the most rational variant of water networks’ improvement if networks’ parameters meet normative engineering constraints and reliability conditions (Tkachuk O., 2008)
min)e1(BКВ
T
0tttopt
n →+
+=∑
=
, (1)
where Kt – the cost of construction works of t year; Вop t – operation costs in t year; T – a term of project realization, year; e – a discount coefficient. The search of optimal parameters of the network or its layout comes to finding of minimum values Вn discounted to the beginning of project realization. That is why all values in equation (1) are considered as mathematical dependences and studying of their general expression (goal functions) on extremum is conducted. On the basis of this method the analytical expressions are determined for defining the economical pipelines’ diameters of the network, pumping stations parameters feeding the water network, booster pump stations and etc. CONCLUSIONS Application of the offered calculation methods at the stage of designing allows to take into account the changes of water networks’ parameters during operation and to determine compliance of water network schemes with normative reliability and water demand indexes. It creates the proper conditions of water-supply stabilizing and of resource-saving during optimization of water networks. On the basis of the conducted researches and application of the offered methods during optimization and improvement of water networks (for more than 30 cities) allowed to stabilize water-supply, reduce the electric power consumption and water losses, that is confirmed by calculations and actual results on operating water networks. REFERENCES Tkachuk, О.А. (2008). Improvement of water transmission and distribution systems of the settlements. Monograph.
Rivne: NUWM, 301 (in Ukrainian). Tkachuk, О.А., Kosinov, V.P., Novytska, О.S. (2011). Water transmission and distribution systems of settlements.
Rivne: NUWM, 273 (in Ukrainian). Novytska, O. (2013). Taking into account actual conditions during hydraulic computations of water networks. Water
Supply and Sanitary Engineering, Moscow, 10, 30-35 (in Russian). О. Novytska, Tkachuk, О.А. (2014). Excess water pressure influence on total water consumption by population. Water
Supply and Sanitary Engineering, Moscow, 12, 22-27 (in Russian).
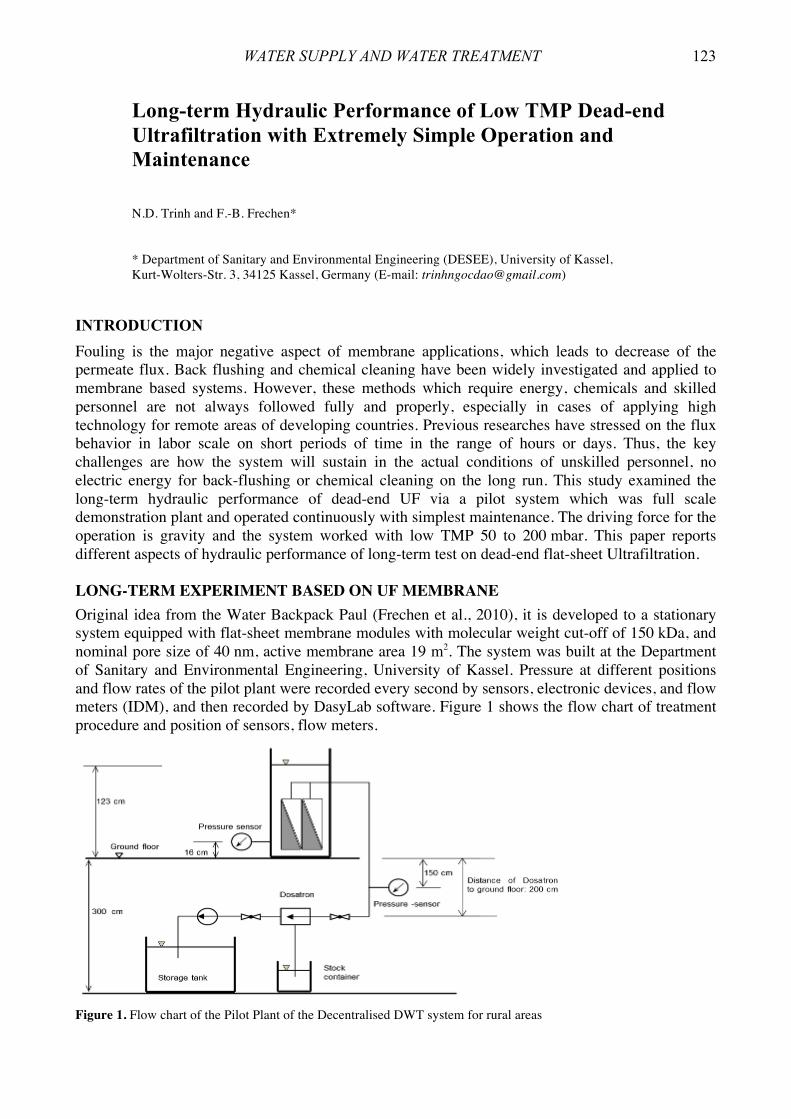
WATER SUPPLY AND WATER TREATMENT 123
Long-term Hydraulic Performance of Low TMP Dead-end Ultrafiltration with Extremely Simple Operation and Maintenance
N.D. Trinh and F.-B. Frechen*
* Department of Sanitary and Environmental Engineering (DESEE), University of Kassel, Kurt-Wolters-Str. 3, 34125 Kassel, Germany (E-mail: [email protected])
INTRODUCTION Fouling is the major negative aspect of membrane applications, which leads to decrease of the permeate flux. Back flushing and chemical cleaning have been widely investigated and applied to membrane based systems. However, these methods which require energy, chemicals and skilled personnel are not always followed fully and properly, especially in cases of applying high technology for remote areas of developing countries. Previous researches have stressed on the flux behavior in labor scale on short periods of time in the range of hours or days. Thus, the key challenges are how the system will sustain in the actual conditions of unskilled personnel, no electric energy for back-flushing or chemical cleaning on the long run. This study examined the long-term hydraulic performance of dead-end UF via a pilot system which was full scale demonstration plant and operated continuously with simplest maintenance. The driving force for the operation is gravity and the system worked with low TMP 50 to 200 mbar. This paper reports different aspects of hydraulic performance of long-term test on dead-end flat-sheet Ultrafiltration. LONG-TERM EXPERIMENT BASED ON UF MEMBRANE Original idea from the Water Backpack Paul (Frechen et al., 2010), it is developed to a stationary system equipped with flat-sheet membrane modules with molecular weight cut-off of 150 kDa, and nominal pore size of 40 nm, active membrane area 19 m2. The system was built at the Department of Sanitary and Environmental Engineering, University of Kassel. Pressure at different positions and flow rates of the pilot plant were recorded every second by sensors, electronic devices, and flow meters (IDM), and then recorded by DasyLab software. Figure 1 shows the flow chart of treatment procedure and position of sensors, flow meters.
Figure 1. Flow chart of the Pilot Plant of the Decentralised DWT system for rural areas
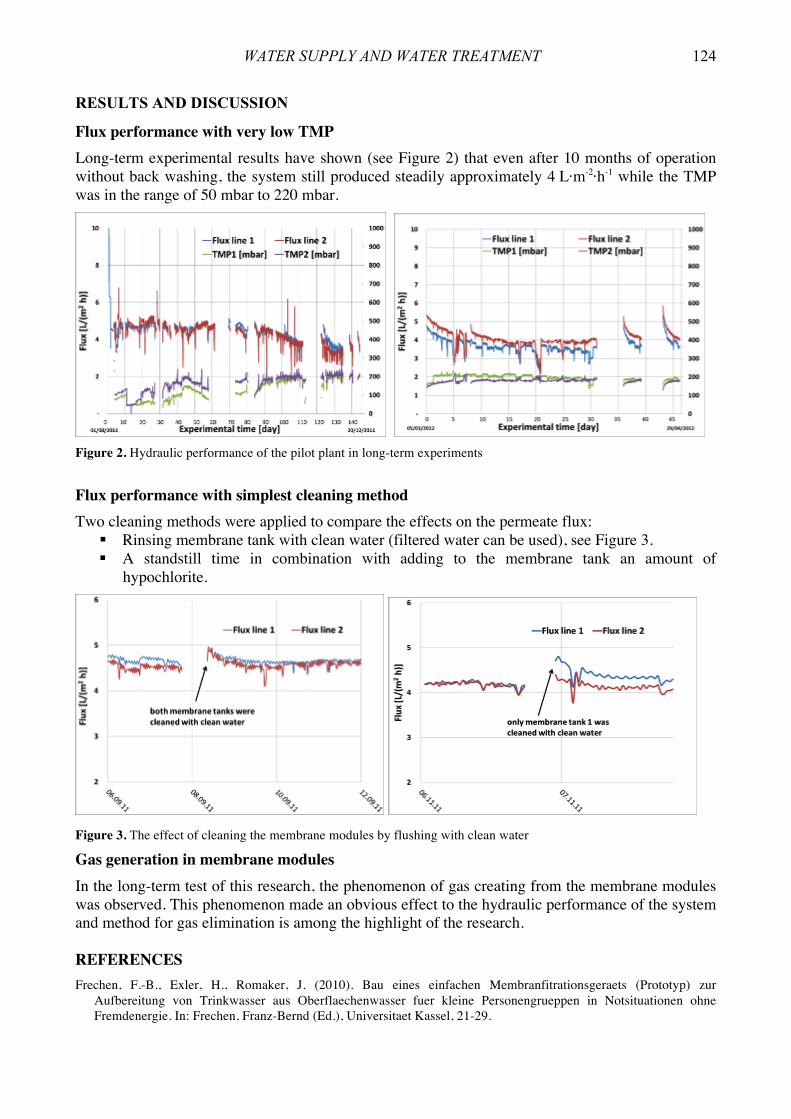
WATER SUPPLY AND WATER TREATMENT 124
RESULTS AND DISCUSSION
Flux performance with very low TMP Long-term experimental results have shown (see Figure 2) that even after 10 months of operation without back washing, the system still produced steadily approximately 4 L·m-2·h-1 while the TMP was in the range of 50 mbar to 220 mbar.
Figure 2. Hydraulic performance of the pilot plant in long-term experiments
Flux performance with simplest cleaning method Two cleaning methods were applied to compare the effects on the permeate flux:
§ Rinsing membrane tank with clean water (filtered water can be used), see Figure 3. § A standstill time in combination with adding to the membrane tank an amount of
hypochlorite.
Figure 3. The effect of cleaning the membrane modules by flushing with clean water
Gas generation in membrane modules In the long-term test of this research, the phenomenon of gas creating from the membrane modules was observed. This phenomenon made an obvious effect to the hydraulic performance of the system and method for gas elimination is among the highlight of the research. REFERENCES Frechen, F.-B., Exler, H., Romaker, J. (2010). Bau eines einfachen Membranfitrationsgeraets (Prototyp) zur
Aufbereitung von Trinkwasser aus Oberflaechenwasser fuer kleine Personengrueppen in Notsituationen ohne Fremdenergie. In: Frechen, Franz-Bernd (Ed.), Universitaet Kassel, 21-29.
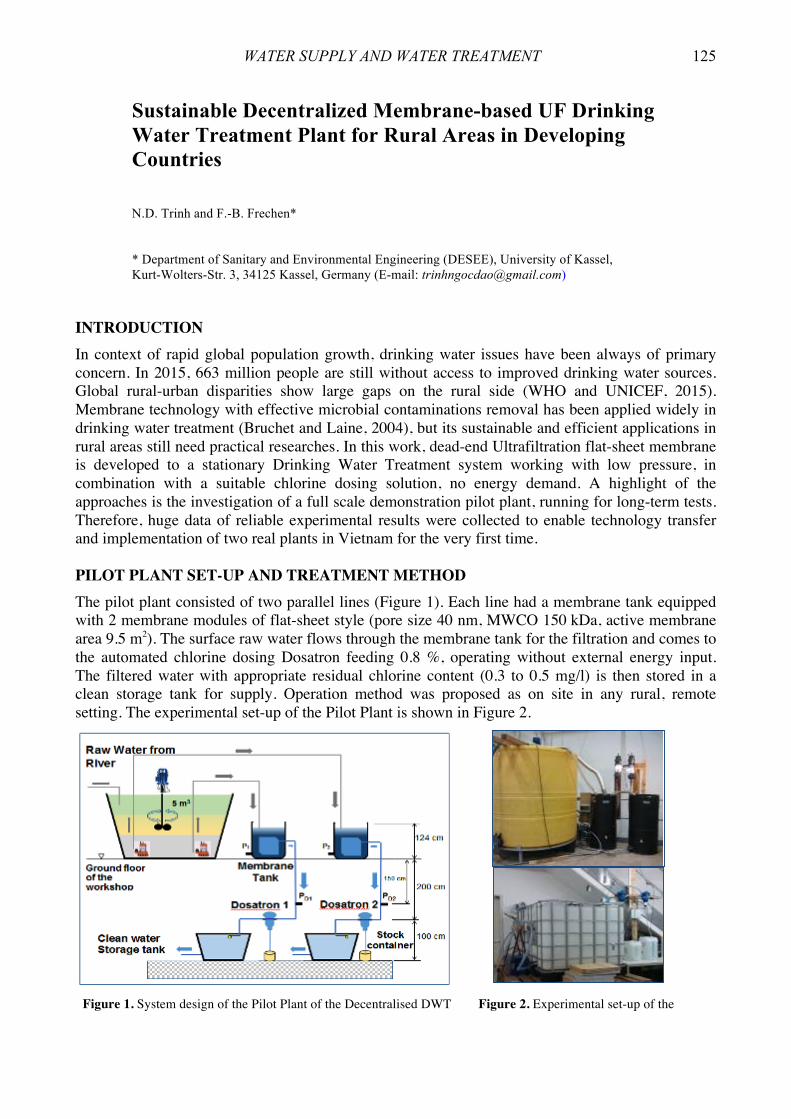
WATER SUPPLY AND WATER TREATMENT 125
Sustainable Decentralized Membrane-based UF Drinking Water Treatment Plant for Rural Areas in Developing Countries
N.D. Trinh and F.-B. Frechen*
* Department of Sanitary and Environmental Engineering (DESEE), University of Kassel, Kurt-Wolters-Str. 3, 34125 Kassel, Germany (E-mail: [email protected])
INTRODUCTION In context of rapid global population growth, drinking water issues have been always of primary concern. In 2015, 663 million people are still without access to improved drinking water sources. Global rural-urban disparities show large gaps on the rural side (WHO and UNICEF, 2015). Membrane technology with effective microbial contaminations removal has been applied widely in drinking water treatment (Bruchet and Laine, 2004), but its sustainable and efficient applications in rural areas still need practical researches. In this work, dead-end Ultrafiltration flat-sheet membrane is developed to a stationary Drinking Water Treatment system working with low pressure, in combination with a suitable chlorine dosing solution, no energy demand. A highlight of the approaches is the investigation of a full scale demonstration pilot plant, running for long-term tests. Therefore, huge data of reliable experimental results were collected to enable technology transfer and implementation of two real plants in Vietnam for the very first time. PILOT PLANT SET-UP AND TREATMENT METHOD The pilot plant consisted of two parallel lines (Figure 1). Each line had a membrane tank equipped with 2 membrane modules of flat-sheet style (pore size 40 nm, MWCO 150 kDa, active membrane area 9.5 m2). The surface raw water flows through the membrane tank for the filtration and comes to the automated chlorine dosing Dosatron feeding 0.8 %, operating without external energy input. The filtered water with appropriate residual chlorine content (0.3 to 0.5 mg/l) is then stored in a clean storage tank for supply. Operation method was proposed as on site in any rural, remote setting. The experimental set-up of the Pilot Plant is shown in Figure 2.
Figure 1. System design of the Pilot Plant of the Decentralised DWT Figure 2. Experimental set-up of the
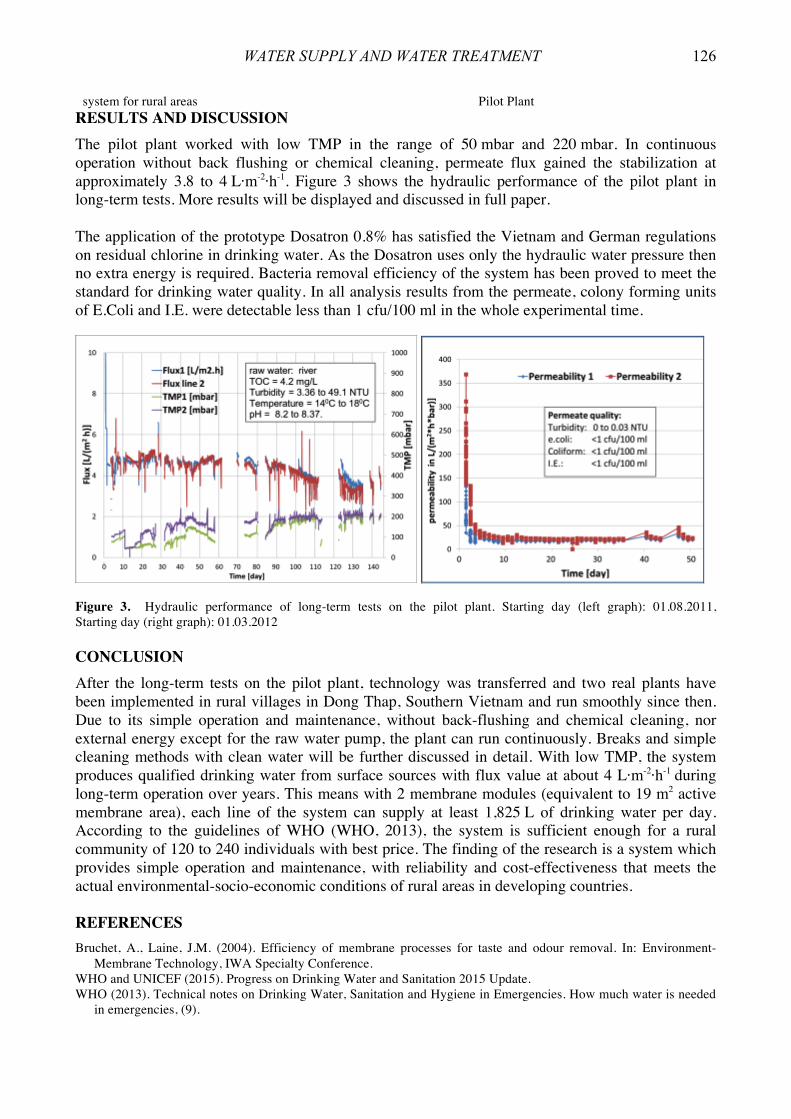
WATER SUPPLY AND WATER TREATMENT 126
system for rural areas Pilot Plant RESULTS AND DISCUSSION The pilot plant worked with low TMP in the range of 50 mbar and 220 mbar. In continuous operation without back flushing or chemical cleaning, permeate flux gained the stabilization at approximately 3.8 to 4 L·m-2·h-1. Figure 3 shows the hydraulic performance of the pilot plant in long-term tests. More results will be displayed and discussed in full paper. The application of the prototype Dosatron 0.8% has satisfied the Vietnam and German regulations on residual chlorine in drinking water. As the Dosatron uses only the hydraulic water pressure then no extra energy is required. Bacteria removal efficiency of the system has been proved to meet the standard for drinking water quality. In all analysis results from the permeate, colony forming units of E.Coli and I.E. were detectable less than 1 cfu/100 ml in the whole experimental time.
Figure 3. Hydraulic performance of long-term tests on the pilot plant. Starting day (left graph): 01.08.2011, Starting day (right graph): 01.03.2012 CONCLUSION After the long-term tests on the pilot plant, technology was transferred and two real plants have been implemented in rural villages in Dong Thap, Southern Vietnam and run smoothly since then. Due to its simple operation and maintenance, without back-flushing and chemical cleaning, nor external energy except for the raw water pump, the plant can run continuously. Breaks and simple cleaning methods with clean water will be further discussed in detail. With low TMP, the system produces qualified drinking water from surface sources with flux value at about 4 L·m-2·h-1 during long-term operation over years. This means with 2 membrane modules (equivalent to 19 m2 active membrane area), each line of the system can supply at least 1,825 L of drinking water per day. According to the guidelines of WHO (WHO, 2013), the system is sufficient enough for a rural community of 120 to 240 individuals with best price. The finding of the research is a system which provides simple operation and maintenance, with reliability and cost-effectiveness that meets the actual environmental-socio-economic conditions of rural areas in developing countries. REFERENCES Bruchet, A., Laine, J.M. (2004). Efficiency of membrane processes for taste and odour removal. In: Environment-
Membrane Technology, IWA Specialty Conference. WHO and UNICEF (2015). Progress on Drinking Water and Sanitation 2015 Update. WHO (2013). Technical notes on Drinking Water, Sanitation and Hygiene in Emergencies. How much water is needed
in emergencies, (9).

WATER SUPPLY AND WATER TREATMENT 127
Using Community Structure Concept for Partitioning Hydraulic Systems R. Varga and Cs. Hős* * Department of Hydraulic Systems, Budapest University of Technology and Economics, Faculty of Mechanical Engineering, 1111, Budapest, Műegyetem rkp. 3. D building, 3rd floor, Hungary (E-mails: [email protected]; [email protected])
INTRODUCTION The monitoring of large-scale hydraulic systems and their measurement planning are challenging tasks due to the size of the real-life systems and the limited number of measurement devices. One of the solutions could be to reduce the size of the system, or define disjoint regions of it, in which one or two measurement places would be enough to ‘extract’ the desired information of the whole region. In this paper an algorithm is presented to give a subdivision of the system based only on its structure, which can be viewed as an undirected graph.
METHODS The system defined as a graph
To employ the algorithm the definition of the graph representing the hydraulic system is needed. For this, the nodes of the graph are the nodes (the measure points) of the system, and two nodes in the graph are connected only when in the system they are connected with a pipe. The usual way to handle graphs in numerical methods is to define their adjacency matrix , whom elements are
(1) The basic idea of the algorithm Our algorithm is based on the community structure detection of large networks introduced by Newman (Newman, 2006). The basic idea behind the algorithm is to define communities which form dense networks by themselves (they contain many edges), and the communities form a sparse network (they are connected only with a few edges). With this a so called modularity of the division can be defined, which describes the goodness of the division with only one number. The modularity is denoted by and can be formulated in the following way:
,m2kk
Am21Q cicj
ij
jiij δ⋅⎥
⎦
⎤⎢⎣
⎡−⋅= ∑ (2)
where – the number of edges connected to node , – the total number of edges in the system, and – the Kronecker delta, it is 1 if node i and node j are in the same community, and 0 otherwise. The aim of the algorithm is to find the division of the network which maximizes the modularity. Since this problem is known to be an NP-hard problem, the best division cannot be found in polynomial time for every system. But our purpose is not to find the best division, it is enough to find a good one that helps the engineers to divide the whole system into regions, which then can be

WATER SUPPLY AND WATER TREATMENT 128
viewed as smaller systems. In our paper we describe the algorithm in more detail and show several types of real hydraulic systems divided by the algorithm. RESULTS AND CONCLUSION To test our algorithm we used several hydraulic maps of the town Sopron in Hungary. The results of two example computations are shown in Figures 1 and 2.
Figure 1. The division of a network into four communities with Q=0.7325
Figure 2. The division of a network with Q=0.4979
The important benefit of the presented algorithm is that it is independent of the hydraulic conditions of the system. It gives the same results for the peak periods and for the underloaded night times of the operating systems. REFERENCES Newman, M.E.J.. (2004). Modularity and community structures in networks. Proc. Natl. Sci. U.S.A., 103(23),
8577-8582. Sun, Y., Danila, B., Josić, K., & Bassler, K. E. (2009). Improved community structure detection using a modified fine-
tuning strategy. Europhysics Letters, 86(2), 28004. Xu, J., Fischbeck, P. S., Small, M. J., VanBriesen, J. M., & Casman, E. (2008). Identifying sets of key nodes for placing
sensors in dynamic water distribution networks. Journal of Water Resources Planning and Management, 134(4), 378-385.

WATER SUPPLY AND WATER TREATMENT 129
Monitoring of Bacterial Biofilm Growth by Impedance Spectroscopy - Preliminary Research M. Wolf and T.M. Traczewska* * Wroclaw University of Technology, Faculty of Environmental Engineering, 27 Wybrzeze Wyspianskiego, 50-370 Wroclaw (E-mail: [email protected]; [email protected])
INTRODUCTION The biological membrane is attached to the surface microorganisms microcolony which are surrounded by extracellular polymers. Depending on the environmental conditions may be a monolayer or three-dimensional cell structure with many channels. Structure formation of biological membrane has many advantages, such as resistance to damaging external factors (disinfectants or antibiotics) and allows for horizontal genes movement. It is also one of the way for easy access nutrients (Simoes et al., 2007; Davey & O’Tolle, 2000). Water which will be taken to water supply system might contain pathogenic organisms in its composition that will not be removed during treatment. Bacterial biofilm is one of the most common causes of customers infection associated with microorganisms deposition on the inner surface of the pipes (Traczewska T.). Biofilm colonization in the water supply system is also a sanitary threat to the water consumers, increases microbiological corrosion and might be causing hydraulic losses due to increased roughness of the water pipes surface (Kołwzan B., 2011). The occurrence of biofilms in the water supply system poses a threat of epidemics, particularly in places where are people with reduced immunity, such as hospitals and nursing homes (Grabińska-łoniewska A., 2011). In the standard water assessment is determined the amount of heterotrophic bacteria. Such result does not give complete information about the number of microorganisms on the network, because it ignores microcolony which are forming biofilm. Test of biological film is relatively limited because of the absence of direct access and the difficulty in collecting samples (Boe-Hansen R., 2003). It is important to quick detection and bacteria identification in their natural environment. Traditional microbiological methods may include cultures on solid and liquid state (differentiation based on biochemical properties) as well as microscopic observations (demonstrate the presence and numbers of bacteria and their morphology) (Jankiewicz M., 2003). An alternative to traditional testing methods are impedance methods. Impedance spectroscopy is considered to be an appropriate method for measuring the adhesion of bacterial biofilm, giving immediate answer (result) in real time. Their advantages may include relatively low cost, real-time response and a large number of measurements. Impedance measurements are associated with the change of the medium in which the microorganisms are suspended. Adhesion of bacteria and biological film formation hinder the exchange of electrons, which increases appropriate value of resistance. Detection of biological membrane is associated with long-term monitoring (Radke S., 2004; Radke S., 2005; Paredes J. et al., 2013).

WATER SUPPLY AND WATER TREATMENT 130
MATERIALS AND METHODS
In this article is presented the characterization of methodology as a detection and monitoring development of bacterial biofilm. This is possible through the use of bacterial adhesion to the sensor’s surface and measure their concentration by electric methods. Impedance measurement electrodes in the appropriate range of frequency allow to define the relationship in the tested culture. The measurements were carried out in low range of frequency (10 Hz, 100 Hz, 1,000 Hz, 10,000 Hz, 100,000 Hz) . In the studies was used measuring equipment SIGNAL RECOVERY 7280 DSP LOCK-IN APLIFIER which was recording the changes in time at different frequencies. RESULTS The measurement conditions provide a constant temperature and a lack of evaporation from the system. The mean value magnitude of impedance was measured during 48h for selected frequencies (Table 1). Inoculum was obtained by filtering 3 dm3 tap water through a Whatman filter with a diameter of 0.2 µm, then the filter was placed in a phosphate buffer and inserted into ultrasonic bath for 1 minute to release the microorganisms. Table 1. Relative response (%) for inoculums filtered from tap water
f, Hz 0h 24h 48h 10 5.62 5.8 6.02
100 4.89 4.87 4.90 1,000 4.69 4.69 4.75
10,000 4.78 4.78 4.94 100,000 10.27 10.32 10.42
Small changes in such a short time (screening tests) suggest a need for further analyses (continuously). The use of biosensors can cause rapid assessment of biological water parameters as well as modernize the measuring equipment in the water supply industry. REFERENCES Boe-Hansen, R. (2003).Monitoring biofilm formation and activity in drinking water distribution networks under
oligotrophic conditions. Water Science and Technology, 47, 91-97. Davey, M., O’Tolle, G. (2000). Microbial Biofilms: from Ecology to Molecular Genetics. Microbiology and Molecular
Biology Reviews, 64, 847-867. Grabińska-Łoniewska, A., Siński, E. (2011). Mikroorganizmy chorobotwórcze i potencjalnie chorobotwórcze w
ekosystemach wodnych i sieciach wodociągowych, PZIiTS (in Polish). Jankiewicz, M. (2003). Metody pomiarów i kontroli jakości w przemyśle spożywczym i biotechnologii, (nr ISBN 83-
7160-317-7), Wydawnictwo AR-Poznań, 501-548 (in Polish). Kołwzan, B. (2011). Analiza zjawiska biofilmu - warunki jego powstawania i funkcjonowania. Ochrona Środowiska ,
33 (4), 3-14 (in Polish). Paredes, J., Beccero, S., Arizti, F., Aguinaga, A., Del Pozo, J.L., Arana, S. (2013). Interdigitated microelectrode
biosensor for bacteria biofilm growth monitoring by impedance spectroscopy technique in 96-well microtiter plates. Sensors and Actuators B., 178 , 663-70.
Radke, S. (2005). A high density microelelectrode array biosensor for detection of E. coli O157:H7. Biosensors and Bioelectronics, 20, 1662-1667.
Radke, S. (2004). Design and Fabrication of a Microimpedance Biosensor for Bacteria Detection, Biosensors and Bioelectronics, 4, 434-440.
Simoes, L., Simoes, M., Vieria, M. (2007). Biofilm interactions between district bacterial isolated from drinking water. Applied and Environmental Microbiology, 73, 6192-6200.
Traczewska, T., Sitarska, M., Biedroń, I. (2014). Ekologiczne i Techniczne aspekty powstawania biofilmu w wodzie. Oficyna Wydawnicza Politechniki Wrocławskiej-mogografia (in Polish).
SEWAGE MANAGEMENT AND WASTEWATER TREATMENT 131
Greywater Treatment in a Living Wall System (LWS)
A. Aicher, P.D. Burkhardt, P. Engel and J. Londong* * Bauhaus Institute for Infrastructure Solutions, chair of Urban Water Management and Sanitation, Bauhaus Universität Weimar (E-mails: [email protected]; [email protected]; [email protected]; [email protected])
MOTIVATION A high level of urbanisation challenges the communities in various ways. Amongst others the phenomena of Urban Heat Islands (UHI), which bother more and more inner cities, will increase with advanced urban densification and simultaneous site development of green space inside the urban area. The effects of global warming are aggravating this problem. Another upcoming challenge will be the approach of resource orientated sanitation systems and the accompanying recovery, treatment or discharge of the separated wastewater streams. A special treatment and reuse of the separated greywater on the spot could help to counteract both problems. A NEW DESIGN FOR GREYWATER TREATMENT Basic idea behind this design is a necessary treatment of greywater combined with the positive effects of a nearby Living Wall System (LWS) on the microclimate. Based on a preliminary literature research for design and dimensioning parameters, a prototype was developed as a synthesis of a bio filter, a trickling filter and the requirements of the chosen plants and built and tested at bench-scale under laboratory conditions. The Prototype Design The prototype module, scaled for one Population Equivalent (PE) or 45 l/p·d of slightly polluted greywater, is a waterproof inlayed timber frame construction with the inner dimensions 1800x500x250 mm. The filter material, customary stone wool in cubic shape (50 mm), is implemented in three layers of 330 mm height each. Aeration slits of 70 mm in between ensure entirely aerobic conditions. The effective reactor volume sums up to 0.124 m3. Besides filtering greywater, the rock wool also functions as hydroponic substrate for the plants. The hardy plants, chosen by means of fitting in a moist to permanently wet habitat, are representatives of succulents, grasses, herbs and shrubs. The Start-Up and Operating Phase The greywater used for the prototype testing was collected from bathroom sink, shower/bath and washing machine of a local four-person household. According to the German guidelines for trickling filters (influent BOD < 150 mg O2/l) and the preceding characterisation of the used greywater, the inlet was diluted in a ratio 1:1 (ATV-DVWK-A 281, 2001). The prototype was charged with 90 litres substrate per day equally spread over 24 hours. A start-up phase of three weeks was followed by an operational phase of another three weeks. The physicochemical composition (BOD, pH) of the prototype influent and effluent was monitored daily during the whole project. A survey on the parameters total phosphorus (TP), orthophosphates, total bound nitrogen (TNb), ammonia, nitrite and nitrate was executed four times during the operational phase.
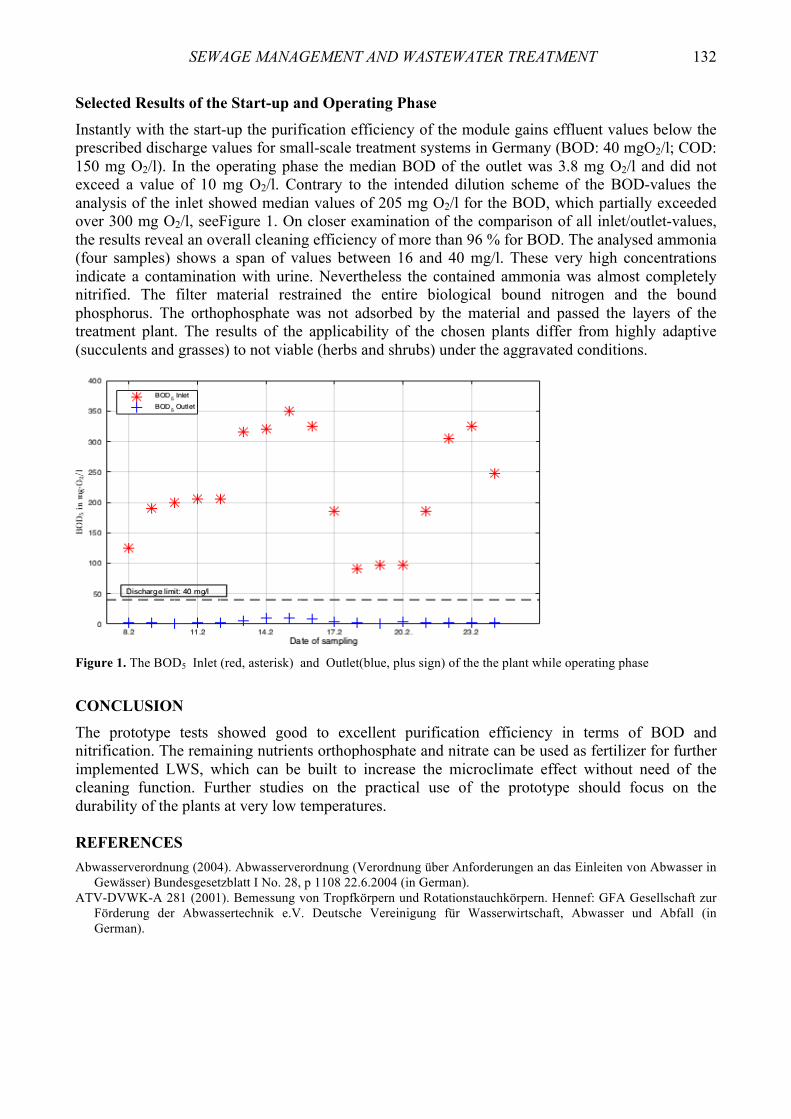
SEWAGE MANAGEMENT AND WASTEWATER TREATMENT 132
Selected Results of the Start-up and Operating Phase Instantly with the start-up the purification efficiency of the module gains effluent values below the prescribed discharge values for small-scale treatment systems in Germany (BOD: 40 mgO2/l; COD: 150 mg O2/l). In the operating phase the median BOD of the outlet was 3.8 mg O2/l and did not exceed a value of 10 mg O2/l. Contrary to the intended dilution scheme of the BOD-values the analysis of the inlet showed median values of 205 mg O2/l for the BOD, which partially exceeded over 300 mg O2/l, seeFigure 1. On closer examination of the comparison of all inlet/outlet-values, the results reveal an overall cleaning efficiency of more than 96 % for BOD. The analysed ammonia (four samples) shows a span of values between 16 and 40 mg/l. These very high concentrations indicate a contamination with urine. Nevertheless the contained ammonia was almost completely nitrified. The filter material restrained the entire biological bound nitrogen and the bound phosphorus. The orthophosphate was not adsorbed by the material and passed the layers of the treatment plant. The results of the applicability of the chosen plants differ from highly adaptive (succulents and grasses) to not viable (herbs and shrubs) under the aggravated conditions.
Figure 1. The BOD5 Inlet (red, asterisk) and Outlet(blue, plus sign) of the the plant while operating phase
CONCLUSION The prototype tests showed good to excellent purification efficiency in terms of BOD and nitrification. The remaining nutrients orthophosphate and nitrate can be used as fertilizer for further implemented LWS, which can be built to increase the microclimate effect without need of the cleaning function. Further studies on the practical use of the prototype should focus on the durability of the plants at very low temperatures. REFERENCES Abwasserverordnung (2004). Abwasserverordnung (Verordnung über Anforderungen an das Einleiten von Abwasser in
Gewässer) Bundesgesetzblatt I No. 28, p 1108 22.6.2004 (in German). ATV-DVWK-A 281 (2001). Bemessung von Tropfkörpern und Rotationstauchkörpern. Hennef: GFA Gesellschaft zur
Förderung der Abwassertechnik e.V. Deutsche Vereinigung für Wasserwirtschaft, Abwasser und Abfall (in German).
SEWAGE MANAGEMENT AND WASTEWATER TREATMENT 133
Single and Combined Effects of Copper and Nickel on Nitrification Organisms in Batch Units S. Aslan and O. Sozudogru* * Department of Environmental Engineering Department, Cumhuriyet University, 58140, Sivas, Turkey (E-mail: [email protected])
INTRODUCTION The presence of heavy metals in the wastewater affects the microorganism activities. Nickel and copper are widely encountered in an industrial wastewater. Biological treatment of industrial wastewater presents some difficulties due to its composition. Difficulties are usually overcome by adopting microorganism (Bagby & Sherrard, 1981; Yetis et al., 1999) applying various reactor types (Carucci et al., 1999), low pollutants loads, and physical-chemical units with an increase in treatment costs (Farabegoli et al., 2004). Although trace concentrations of copper and nickel have been identified as micronutrients for microorganisms and stimulate the microbial activity, they are both growth inhibitors at high concentrations. The purpose of this experimental study was to evaluate single and combined effects of copper and nickel on the nitrification organism activities. MATERIALS AND METHODS The synthetic wastewater contained micro and macronutrients were used throughout the experimental studies. The dissolved oxygen concentrations and pH of mixed liquor were kept constant at 2.0 mg/L and 7.5, respectively. Experimental studies were carried out by varying the concentrations of Cu2+ (in the range of 0.005−2.0 mg/L) and Ni2+ (in the range of 0.005−2.0 mg/L) in three batch units for each concentration. Combined effects were investigated at various initial concentration ratios of Ni2+/ Cu2+ (I: 0.01/0.2, II: 1.0/1.0, III: 0.5/1.5, IV: 2.0/2.0, and V: 3.0/3.0, VI: Blank, 0.00/0.00 mg/L). RESULTS AND DISCUSSION Effects of Copper Concentrations Effects of copper concentrations on the ammonium removal rates (ARRs) are presented in Figure 1. Trace amounts of Cu2+ stimulate the activity of nitrifiers and ARRs increased from 0.225 to about 0.5 mg NH4-N/mg MLVSS.day on a first day by elevating Cu2+ concentrations from zero to 0.05 mg/L, respectively. Considerable ARR difference between 0.005 and 0.05 mg Cu2+/L were not observed. Up to the initial concentration of 0.05 mg/L, nitrification reaction was complete in five days. Further increase the concentrations of Cu2+ from 0.05 mg/L to 2.0 mg/L, the ARR steadily decreased and the nitrification reaction was complete in seven days. Due to the residue concentration of NH4-N in the solution decreases, the ARRs value decreased. Nitrification inhibition was not observed during the experimental studies for the studied Cu2+ concentrations. The lowest ARRs value was observed at the concentration of 2.0 mg Cu2+/L on the first day of reaction. Effects of Nickel Concentrations As can be seen in Figure 2 that, the NH4-N oxidation steadily decreased significantly as the applied Ni2+ concentration to the nitrifying biomass increased. The AARs of the nitrification organisms was also found to have decreased by about 16 to 21 fold upon addition of Ni2+. Oxidation of NH4-N was

SEWAGE MANAGEMENT AND WASTEWATER TREATMENT 134
not detected for the studied concentrations of Ni2+ while ARR was 0.16 mg NH4-N/mg MLVSS.day for the blank sample on the second day of operations. Additions of Ni2+ negatively affect the ammonium oxidation and reaction was not detected during the operations of third days. The ARR values for the studied initial Ni2+ concentrations were lower than the blank sample. The highest ARR of 0.02 mg NH4-N/mg MLVSS.day was observed when the nitrification culture was exposed with 2.0 mg Ni2+/L. However, the highest ARR value of 0.45 mg NH4-N/mg MLVSS.day was determined with the baseline condition without Ni2+. Effects of Ni2+−Cu2+ mixture on the nitrification
Batch experiments were carried out with various combinations of Ni2+−Cu2+ for the initial MLSS concentrations of 100 and 200 ± 10 mg MLSS/L. The simultaneous presences of Ni2+−Cu2+ negatively affect the activity of nitrification organisms. In order to achieve the same ammonium oxidation level as compared with the blank sample, it needs more reaction times. Although no significant difference was found between the removal efficiency of blank and 0.2−0.01 mg Ni2+− Cu2+/L mixtures, NH4-N removal efficiency was decreased with increasing of Ni2+−Cu2+ concentrations. Results indicated that the inhibition level of heavy metal mixture was strongly dependent on the MLSS concentrations. Figure 1. Effects of Cu2+ on the ARRs Figure 2. Effects of Ni2+ on the ARRs CONCLUSION The experimental results indicated that it is possible to treat industrial wastewater Ni2+ and Cu2+ with individually or together. Cu2+ is less toxic than Ni2+ at relatively high concentrations. The toxicity of heavy metal could be minimized by increasing the microorganisms in the biological reactor. REFERENCES Bagby, M. M. and Sherrard, J. H. (1981). Combined effects of cadmium and nickel on the activated sludge process.
Journal Water Pollution Control Federation, 53, 11, 1609-1619. Carucci, A., Chiavola, A., Majone, M., Rolle, E. (1999). Treatment of tannery wastewater in a sequencing batch reactor.
Water Science and Technology, 40, 253–259. Farabegoli, G., Carucci, A., Majone, M., and Rolle, E. (2004). Biological treatment of tannery wastewater in the
presence of chromium. Journal of Environmental Management, 71, 345-349. Yetis, U., Demirer, G.N., Gokcay, C.F. (1999). Effect of chromium (VI) on the biomass yield of activated sludge.
Enzyme Microbial Technology, 25, 48-54.
0
0,1
0,2
0,3
0,4
0,5
0,6
0 2 4 6
NH4-N removal rate
(mg NH4-N/mg MLSS.day)
reaction times (days)
Blank 0.05 0.1 0.2 0.5 1 1,5 2.0 mg/L
00,050,1
0,150,2
0,250,3
0,350,4
0,450,5
0 2 4 6
NH4-N removal rate
(mg NH4-N/MLVSS.day)
reaction times (days)
blank 0.05 0.2 0.5 1.0 1,5 2.0 (mg/L)

SEWAGE MANAGEMENT AND WASTEWATER TREATMENT 135
Upgrading Biological Nitrogen Removal and Sculpturing Activated Sludge Flocs in Industrial Wastewater Treatment V. Bakos* * Budapest University of Technology and Economics, Department of Applied Biotechnology and Food Science, H-1111 Budapest, Szent Gellért tér 4. (E-mail: [email protected])
INTRODUCTION Influents of Hungarian domestic wastewater treatment plants (WWTPs) are generally poor in readily biodegradable organic carbon source, however, remarkable differences can be measured from site to site (Makinia, 2010, Tardy et al., 2012). Although low dissolved oxygen (DO) environment may be favourable for cost-effective removal of nitrogen, it may lead to performance deterioration and may cause enhanced N2O emission (Kampschreur et al., 2009). Additionally, low substrate (S) and/or low DO conditions may also increase the risk of excessive growth of filaments (Wanner and Jobbágy, 2014). Case study of a full-scale low DO municipal WWTP receiving high carbon content wastewater of soft drink industry seasonally (DOM&IND-WWTP, hydraulic capacity: 1100 m3 d-1) aimed to upgrade biological nitrogen removal and to decrease the risk of filamentous bulking as well. Moreover, the paper presents a pilot-scale study carried out at a pharmaceutical WWTP (PHARMA-WWTP, hydraulic capacity: 6000 m3 d-1) which proved that non-aerated bioreactors may easily be converted into low DO basins resulting in bulking sludge. RESULTS AND DISCUSSION At DOM&IND-WWTP huge differences have been found regarding the quality of diverse incoming wastewater streams (1.3 < dissolved COD/dissolved TN ratio < 11.6). A new method was developed for inlet wastewater characterization including both on-site concentration profile measurements and application of ASM (Activated Sludge Model) modelling (see Figure1). Finally, a flexible, staged bioreactor arrangement containing separated anoxic and aerated basins was proposed instead of the former fully aerated, un-staged low DO system.
Figure 1. Measured (black dots) and calculated (curves) effluent nitrate concentrations at diverse inlet loads of DOM&IND-WWTP referring to different amounts of possible additional industrial discharge entering the municipal sewer network
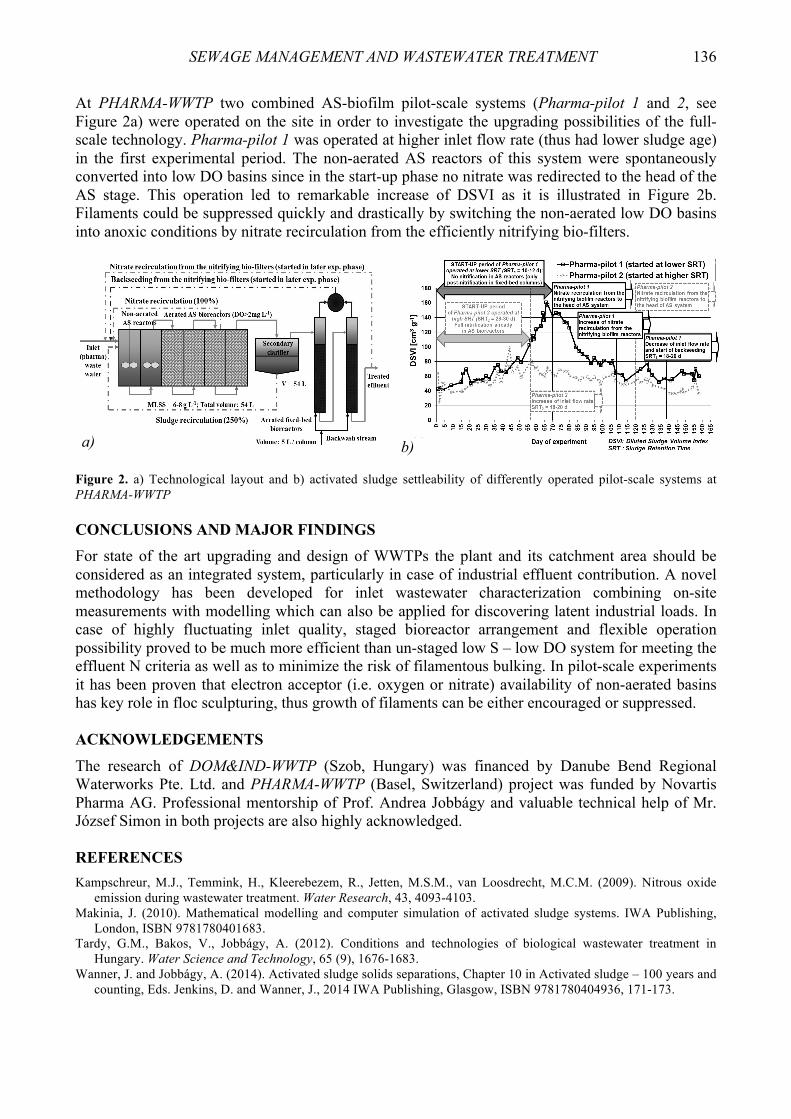
SEWAGE MANAGEMENT AND WASTEWATER TREATMENT 136
At PHARMA-WWTP two combined AS-biofilm pilot-scale systems (Pharma-pilot 1 and 2, see Figure 2a) were operated on the site in order to investigate the upgrading possibilities of the full-scale technology. Pharma-pilot 1 was operated at higher inlet flow rate (thus had lower sludge age) in the first experimental period. The non-aerated AS reactors of this system were spontaneously converted into low DO basins since in the start-up phase no nitrate was redirected to the head of the AS stage. This operation led to remarkable increase of DSVI as it is illustrated in Figure 2b. Filaments could be suppressed quickly and drastically by switching the non-aerated low DO basins into anoxic conditions by nitrate recirculation from the efficiently nitrifying bio-filters.
Figure 2. a) Technological layout and b) activated sludge settleability of differently operated pilot-scale systems at PHARMA-WWTP CONCLUSIONS AND MAJOR FINDINGS For state of the art upgrading and design of WWTPs the plant and its catchment area should be considered as an integrated system, particularly in case of industrial effluent contribution. A novel methodology has been developed for inlet wastewater characterization combining on-site measurements with modelling which can also be applied for discovering latent industrial loads. In case of highly fluctuating inlet quality, staged bioreactor arrangement and flexible operation possibility proved to be much more efficient than un-staged low S – low DO system for meeting the effluent N criteria as well as to minimize the risk of filamentous bulking. In pilot-scale experiments it has been proven that electron acceptor (i.e. oxygen or nitrate) availability of non-aerated basins has key role in floc sculpturing, thus growth of filaments can be either encouraged or suppressed. ACKNOWLEDGEMENTS The research of DOM&IND-WWTP (Szob, Hungary) was financed by Danube Bend Regional Waterworks Pte. Ltd. and PHARMA-WWTP (Basel, Switzerland) project was funded by Novartis Pharma AG. Professional mentorship of Prof. Andrea Jobbágy and valuable technical help of Mr. József Simon in both projects are also highly acknowledged. REFERENCES Kampschreur, M.J., Temmink, H., Kleerebezem, R., Jetten, M.S.M., van Loosdrecht, M.C.M. (2009). Nitrous oxide
emission during wastewater treatment. Water Research, 43, 4093-4103. Makinia, J. (2010). Mathematical modelling and computer simulation of activated sludge systems. IWA Publishing,
London, ISBN 9781780401683. Tardy, G.M., Bakos, V., Jobbágy, A. (2012). Conditions and technologies of biological wastewater treatment in
Hungary. Water Science and Technology, 65 (9), 1676-1683. Wanner, J. and Jobbágy, A. (2014). Activated sludge solids separations, Chapter 10 in Activated sludge – 100 years and
counting, Eds. Jenkins, D. and Wanner, J., 2014 IWA Publishing, Glasgow, ISBN 9781780404936, 171-173.
a) b)

SEWAGE MANAGEMENT AND WASTEWATER TREATMENT 137
Anammox Bacteria Ultrastructure, Composition, and Biodiversity Changes in a SBR Pilot – Scale Bioreactor A. Banach*, L. van Niftrik**, R. Mesman** and A. Ziembińska-Buczyńska* * The Silesian University of Technology, Faculty of Power and Environmental Engineering, Environmental Biotechnology Department, Akademicka 2, 44-100 Gliwice, Poland (E-mail: [email protected]) ** Radboud University, Faculty of Science, Department of Microbiology Heyendaalseweg 135, 6525 J Nijmegen, the Netherlands
INTRODUCTION Biological anaerobic ammonium oxidation (anammox) is a process of nitrite and ammonium conversion into dinitrogen gas. Process is catalysed by anammox bacteria belonging to the phylum Planctomycetes. Since anammox bacteria discovery nearly 20 years ago, they have been applied in this cost-effective and sustainable process of ammonium removal in many wastewater treatment plants worldwide. Anammox process consume less oxygen, has lower biomass yields and involve no usage of external organic carbon in comparison to traditional denitrification – nitrification process (Park et al., 2015). The characteristic of microorganisms involved in anammox process and knowledge about their variability and biodiversity are required for better understanding of bioreactor functioning. Due to a fact that until this time pure culture of anammox bacteria has not been obtained, molecular biology methods application is needed to analyse both biocenosis composition and biodiversity of these microorganisms. In this study anammox bacteria biodiversity and genotypic structure change was monitored in SBR pilot scale bioreactor using PCR – DGGE (Polymerase Chain Reaction – Denaturing Gradient Gel Electrophoresis) method. In turn, application of Transmission Electron Microscopy (TEM) allowed for insight into the ultrastructure of anammox bacteria, which morphology is still not completely revealed. Analysis of bacterial biocenosis composition during anammox process was made possible by using Fluorescence in Situ Hybridization (FISH). MATERIALS AND METHODS Anammox bacteria biodiversity PCR – DGGE method was used for monitored changes in bacteria biodiversity and genotypic structure during anammox process in SBR pilot scale bioreactor. For analysis anammox bacteria biodiversityPla46f-GC/518r PCR primers were used. On the basis of the obtained DGGE fingerprints, densitometric analysis with Quanitity One 1D Software (Biorad) was performed, then Species Richness, Shannon and Simpson biodiversity indexes were calculated according to Hedrick et al. (2000). Biocenosis composition and ultrastructure of anammox bacteria Samples preparation for TEM. Samples were high pressure – freezed, freeze substituted, and gradually infiltrated with Epon resin, then samples were sectioned and post stained with uranyl –acetate. Fluorescent in Situ Hybridization. Biomass samples were fixed in 4 % paraformaldehyde solution, resuspended in a 1:1 mixture of phosphate-buffered saline (1×PBS) and absolute ethanol, and stored at -20 oC. Selected probes which hybridize with the 16S rRNA have been used to collect data of anammox bacteria in samples collected from bioreactor.
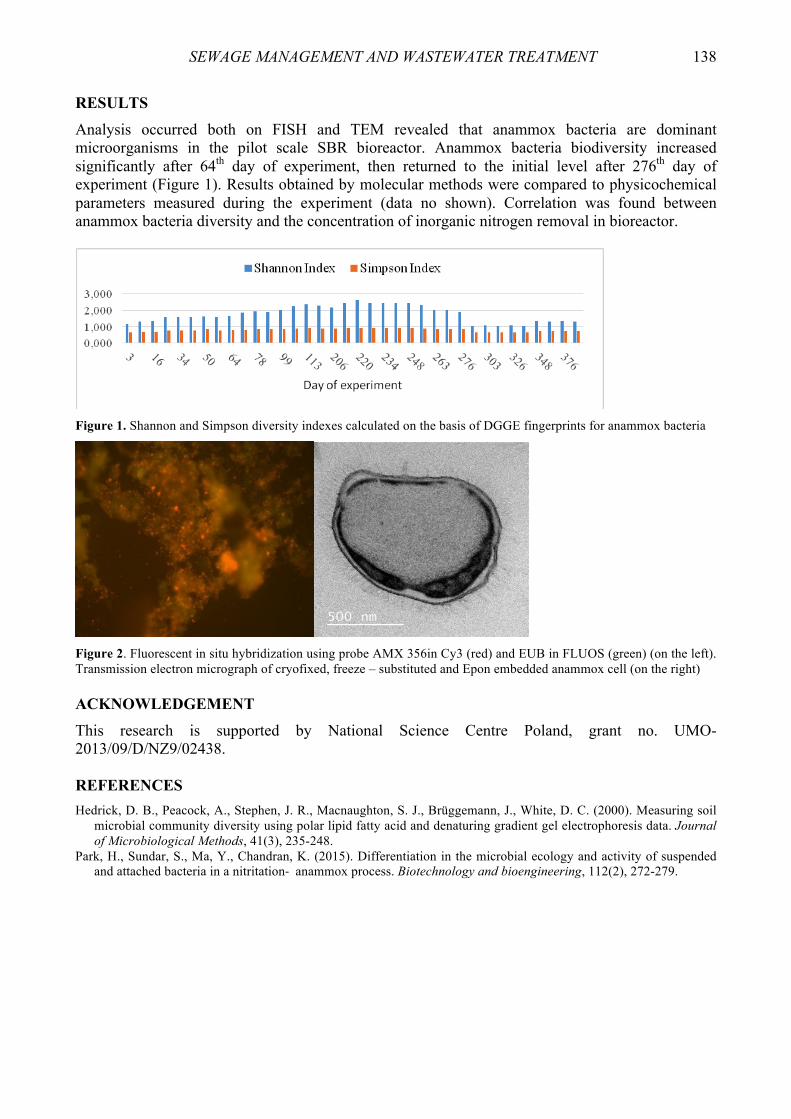
SEWAGE MANAGEMENT AND WASTEWATER TREATMENT 138
RESULTS Analysis occurred both on FISH and TEM revealed that anammox bacteria are dominant microorganisms in the pilot scale SBR bioreactor. Anammox bacteria biodiversity increased significantly after 64th day of experiment, then returned to the initial level after 276th day of experiment (Figure 1). Results obtained by molecular methods were compared to physicochemical parameters measured during the experiment (data no shown). Correlation was found between anammox bacteria diversity and the concentration of inorganic nitrogen removal in bioreactor.
Figure 1. Shannon and Simpson diversity indexes calculated on the basis of DGGE fingerprints for anammox bacteria
Figure 2. Fluorescent in situ hybridization using probe AMX 356in Cy3 (red) and EUB in FLUOS (green) (on the left). Transmission electron micrograph of cryofixed, freeze – substituted and Epon embedded anammox cell (on the right) ACKNOWLEDGEMENT
This research is supported by National Science Centre Poland, grant no. UMO-2013/09/D/NZ9/02438. REFERENCES Hedrick, D. B., Peacock, A., Stephen, J. R., Macnaughton, S. J., Brüggemann, J., White, D. C. (2000). Measuring soil
microbial community diversity using polar lipid fatty acid and denaturing gradient gel electrophoresis data. Journal of Microbiological Methods, 41(3), 235-248.
Park, H., Sundar, S., Ma, Y., Chandran, K. (2015). Differentiation in the microbial ecology and activity of suspended and attached bacteria in a nitritation- anammox process. Biotechnology and bioengineering, 112(2), 272-279.

SEWAGE MANAGEMENT AND WASTEWATER TREATMENT 139
Full-Scale Experience for Management of Phosphorus Removal and Recovery at a WWTP with EBPR M. Beier*, Y. Schneider*, C. Lorek*, E. Voss** and B. Schmitz** * Institute for Sanitary Engineering and Waste Management (ISAH), Leibniz Universität Hannover, Welfengarten 1, 30167 Hannover, GER. (E-mail: [email protected]) ** Stadtentwässerung Hildesheim (SEHi), Kanalstraße 50, 31137 Hildesheim, Germany (E-mail: [email protected])
BACKGROUND AND SIGNIFICANCE Phosphorus is a key element for agricultural food production and industrial production processes. Due to limitations of natural phosphorus resources, many industrialized countries have adopted a policy of phosphorus recycling. Wastewater and solid organic waste contain high loads of phosphorus and thus provide high potential for phosphorus recovery. In Germany for example, the phosphorus contained in municipal wastewater (about 75.000 t) could substitute about 60 % of the imported phosphorus that is used for mineral fertilisers (about 120.000 t) (LAGA, 2010). Commonly, phosphorus is removed from wastewater by fixation in sewage sludge and subsequent sludge separation. For this purpose, either chemical precipitation by addition of metal salts (Fe, Al) or enhanced biological phosphorus removal (EBPR) are applied. In contrast to precipitation with metals that leads to strong, non-soluble inorganic bonding, the phosphorus fixed by EBPR can be released during anaerobic digestion. This effect causes operational challenges (magnesium-ammonium-phosphate (MAP) precipitations, phosphorus return load), but also offers a high potential for phosphorus recovery. This submission presents results from the cooperation of Institute for Sanitary Engineering and Waste Management (ISAH), Leibniz Universitaet Hannover with the municipal WWTP Hildesheim (Lower Saxony, Germany) where different concepts for phosphorus removal and recovery have been developed and tested in pilot- and full-scale. INVESTIGATIONS
The municipal WWTP Hildesheim (Lower Saxony, Germany) is perfectly suited for exemplary data acquisition and evaluation of different processes for phosphorus recovery at Bio-P plants due to its process layout (complete biological phosphorus removal, no phosphorus precipitation, sludge digestion, disintegration and agricultural sludge utilization). The objective of the German joint research project PROPHOS (funded by the Federal Ministry of Research, BMBF) was to investigate phosphorus recovery in municipal waste water treatment plants. The research focus of ISAH was on th technical optimization of phosphorus recovery from the liquid phase, an economical evaluation and identification of possible application for EBPR plants (Beier et. al., 2010). Since 2010, a continuous increase of PO4
3- concentration in the digester of WWTP Hildesheim has been observed. With more than 200 mg P/L there was a high risk of MAP precipitation in the pipes and aggregates of the sludge treatment. Further build-up of the phosphorus concentration due to recycling of phosphorus to the mainstream with the reject water had to be prevented. Therefore, the efficiency of the already established MAP precipitation (increase of pH by stripping of CO2) in the thickener behind digestion was improved by additional dosing of Mg. However, the phosphate concentration in the digester could not be reduced on the long term and remained at an unacceptable high level. To ensure operational stability of the digester, the first full-scale application of calcium-
SEWAGE MANAGEMENT AND WASTEWATER TREATMENT 140
silicate-hydrate (CSH) dosing directly into the digester (basic principle by IWAR, University Darmstadt) was implemented and scientifically accompanied by ISAH over 1.5 years. Finally, a magnetic-inductive protection system has been implemented, to avoid uncontrolled precipitation in pipes and digester (Figure 1) and enable controlled MAP precipitation in the thickener.
Figure 1. Timeline of investigated concepts for phosphorus management at WWTP Hildesheim RESULTS AND OUTLOOK Dosing of CSH resulted in significant reduction of phosphate concentration in the digester effluent and noticeable reduction of MAP precipitates in pipes and centrifuges. Evidently, CSH addition enabled fixation of phosphorus as CaP within the digested sludge. To date, agricultural utilization of the stabilized sewage sludge has been possible for WWTP Hildesheim, such that all phosphorus contained in the dewatered sludge was directly recycled. Therefore, the combination of Bio-P, precipitation and agricultural sludge application provides an integrated concept of phosphorus removal and recovery with low relatively low costs and low additional effort compared to chemical phosphorus removal followed by recovery from sludge ashes. However, Germany is about to implement stricter regulations for agricultural utilization of sewage sludge and at the same time legally enforce phosphorus recovery. The currently discussed legislation will limit the potential for direct phosphorus recycling as fertiliser and thus will require separation of phosphorus from the sewage sludge. Still, for EBPR plants, precipitation of dissolved phosphorus with subsequent separation directly at the WWTP sludge seems to be much more efficient than phosphorus recovery from ashes after sludge incineration. Different suitable concepts have already been proven, e.g. MAP precipitation from return sludge or sludge hydrolysis with subsequent precipitation prior to digestion. Alternatively, CSH could be applied in form of a filter bed or rotary disks that can easily be removed upon achievement of maximum phosphorus loading; these options will be subject of further research at ISAH. REFERENCES Beier, M., Pikula, R. and Rosenwinkel, K.-H. (2010). BMBF Verbundprojekt ProPhos - Rückgewinnung von Phosphor
aus Abwasser, Klärschlamm und Rückständen thermischer Klärschlammbehandlung, Teilstudie A, Teilprojekt 1 (TP A1) Rückgewinnung von Phosphor aus der wässrigen Phase – Erhöhung der P-Konzentration in der Wasserphase und MAP-Fällung (Förderkennzeichen 02 WA 0784). Schlussbericht, Hannover (in German).
LAGA (2010). Bewertung von Handlungsoptionen zur nachhaltigen Nutzung sekundärer Phosphorreserven. Report prepared by Bund/Länder-Arbeitsgemeinschaft Abfall (LAGA) on behalf of the German Conference of Environment Ministers (in German).
Petzet, S. and Cornel, P. Prevention of struvite scaling in digesters combined with phosphorus removal and recovery-the FIX-Phos process. Water Environmental Research, 84(3), 220-226.
SEWAGE MANAGEMENT AND WASTEWATER TREATMENT 141
Oxidation and Mineralization by Ozone Based Aops of Simulated Textile Wastewater Containing Reactive Yellow 145, Reactive Red 195 and Reactive Blue 221 L. Bilińska*, **, M. Gmurek* and S. Ledakowicz* * Faculty of Process & Environmental Engineering, Lodz University of Technology, Wólczańska 213, 90-924 Łódź, Poland (E-mail: [email protected]; [email protected]) ** Textile Company Biliński, Mickiewicza 29, 95-050 Konstantynów Łódzki (E-mail: [email protected])
INTRODUCTION Nowadays in industrial production processes the sustainable development is a major issue. Modern textile industry is the one, where water management is particularly important. The amount of generated textile wastewater can reach even more than 300 L per kg of the product (Kallia &Talvenmaa, 2000). According to IPPC Directive, BAT (Best Available Techniques) implementation could be a good solution for textile wastewater treatment. One of the BAT given by Reference Document on BAT for the Textiles Industry is “wastewater stream management”. Allocating highly contaminated wastewater, exclusion of wastewater which can cause malfunction of biological treatment and finally, treating non-biodegradable waste streams by appropriate techniques before, or instead of biological treatment, that are the main points of the issue (EU Commission, 2003). This idea was the basis of the study. The most contaminated textile wastewater stream, dyeing discharge, was selected to dedicated treatment by AOPs. Simulated mixture, based on industrial recipe, where Reactive Yellow145 (RY145), Reactive Red 195 (RR195), Reactive Blue 221 (RB221) were acting together was investigated. Hydrogen peroxide and UV role during O3/H2O2, O3/UV and O3/UV/H2O2 was determined. Influence of textile auxiliaries on AOPs was checked. The mineralization obtained during AOPs was studied. EXPERIMENTAL Materials
Synozol Yellow KHL (Reactive Yellow145), Synozol RedK3BS (Reactive Red 195), Synozol BlueKBR (Reactive Blue 221) were purchased from KISCO (Turkey) as industrial dyes. Industrial dyeing assistant – Perigen LDR (SAA – surface active agent) purchased from Textilchemie Dr. Petry Co. (Germany). The buffer basis: NaOH and Na2HPO4 were A.R., as well as NaCl and Na2CO3. Table 1. Simulated wastewater content based on industrial dyeing recipe
Simulated wastewater content RY145 + RR195 + RB221 0.125 g/L Perigen LDR (SAA) 1.5 g/L NaCl 38 g/L Na2CO3 5.0 g/L NaOH 50 % (a.s.) 1.0 g/L

SEWAGE MANAGEMENT AND WASTEWATER TREATMENT 142
Methods
The semi batch glass reactor (heterogeneous gas-liquid system) with capacity of 1 dm3 was used. Ozone was produced by Ozonek Ozone Generator (Poland) fed with oxygen from the compressed gas cylinder (O2 purity 99.5 %). O3 concentration was measured with BMT 963 Vent ozone analyser. Optionally UVC low-pressure mercury lamp (Herraus 15W) was added to the experimental set. Colour was determined by measurement of UV-Vis spectrums (spectrophotometer Helios Thermo) and recalculating them into integrals. COD (Chemical Oxygen Demand) was measured with HACH LCK 514 test. TOC (Total Organic Carbon) was measured in HACH IL 550TOC-TN apparatus. Data was calculated using the Origin® 9.1 version Pro software. RESULTS AND DISCUSSION After 10 minutes of the AOPs and application 0.28 g/L of ozone in alkaline medium (pH = 12), what corresponds with industrial dye bath pH, colour removal for dyes aqueous mixture was calculated. It could be observed that the highest colour reduction (near 90 %) was achieved for process with ozone only. In case of simultaneous O3, H2O2, UV use (O3/H2O2, O3/UV and O3/UV/H2O2 processes) the results were worse. The higher H2O2 concentration was the smaller colour reduction was observed. Based on the study performed by Azbar et. al, 2004 and Chung & Kim, 2011, the synergic effect should be occurred, but in case of our investigation this effect is has not been observed. The hydrogen peroxide presence in alkaline reaction medium caused scavenging of ●OH radicals. However, during O3/H2O2 and O3/UV/H2O2 processes scavenging effect occurred, the mineralization after 60 minutes of these AOPs (ozone dose: 1.69g/L) was greater than for the ozonation. In case of using O3 only COD/COD0 was 0.35, while for O3/0.005M H2O2 process it was 0.0.33. The TOC/TOC0 value for ozonation was 0.94, and for O3/0.005M H2O2 process 0.76. The influence of the textile auxiliaries on AOPs was also checked. In this purpose the dyes acting together in the same aqueous solution and simulated industrial wastewater (composition according to Table 1) have undergone ozone treatment. There was no visible influence of the textile auxiliaries on process. SUMMARY Based on the study it can be concluded that the use of ozone or ozone with very low concentration of H2O2 may be recommended to textile industry. When greater mineralization is considered, e. g. before biological treatment using O3/H2O2 (O3/UV and O3/UV/H2O2 cost could be too high) seems to give good results. When we want to reuse the dying discharge as a brine and only colour reduction is important ozonation is the best option within AOPs. ACKNOWLEDGEMENTS This research was supported by the National Centre of Research and Development (NCBiR) in Poland within research project PBS2/A9/22/2013. REFERENCES Azbar, N., Yonar, T., Kestioglu, K. (2004). Comparison of various advanced oxidation processes and chemical
treatment methods for COD and color removal from a polyester and acetate fiber dyeing effluent, Chemosphere, 55, 35-43.
Chung, J., Kim, J.O. (2011). Application of advanced oxidation processes to remove refractory compounds from dye wastewater, Desalination and Water Treatment, 25, 233-240.
European Commission (2003). Integrated Pollution Prevention and Control (IPPC) Reference Document on Best Available Techniques for the Textiles Industry – BREF code: TXT.
Kallia, E., Talvenmaa, P. (2000). Environmental profile of textile wet processing in Finland, Journal of Cleaner Production, 8, 143-154.
SEWAGE MANAGEMENT AND WASTEWATER TREATMENT 143
Aerobic Granular Sludge Reactor Start-up: Focusing on Microbial Diversity and Granule Morphology C. Bumbac, I.A. Ionescu and O. Tiron* * Department of Environmental Technologies and Technology Transfer, National Research and Development Institute for Industrial Ecology, 71-73 Drumul Podul Dambovitei Street, 060652, Bucharest, Romania (E-mail: [email protected])
INTRODUCTION The development of wastewater treatment process in systems with aerobic granular sludge and transferring the research findings to pilot/industrial plant requires in-depth knowledge on the physico-chemical, microbiological and morpho-functional particularities of the granules. Advanced research using modern methods of analysis offers the means of understanding fundamental processes of biochemistry and technology/engineering involved in this field. MATERIALS AND METHOD Reactor set-up. The experiments were performed in an 8 L column type sequential batch reactor controlled automatically. Molecular biology. Microbial diversity and dynamics was evaluated by usual molecular biology applications: DNA extraction (purelink Genomic DNA Kit), polymerase chain reaction (PCR) amplification (using Applied Biosystems ProFlex), quantitative PCR (using Applied Biosystems QuantStudio7). Universal (bacteria) and gene specific sets of primers were used to assess the presence of nitrifying, denitrifying and phosphate accumulating bacteria. Microscopic investigations. The evolution of sludge into granules was evaluated also by microscopic investigations: brightfield, differential interference contrast, confocal laser scanning microscopy (using Leica DM6 TCS SPE II) and scanning electron microscopy (using FEI Quanta FEG 250). RESULTS Applying molecular biology and advanced microscopy techniques allowed rapid and accurate monitoring granules formation, assessing their morphological evolution and microbial diversity and dynamics (Figure 1 and 2). Monitoring allowed phylogenetic identification, determination of diversity and dynamics thus elucidating the functions and activities of microbial communities of granules.
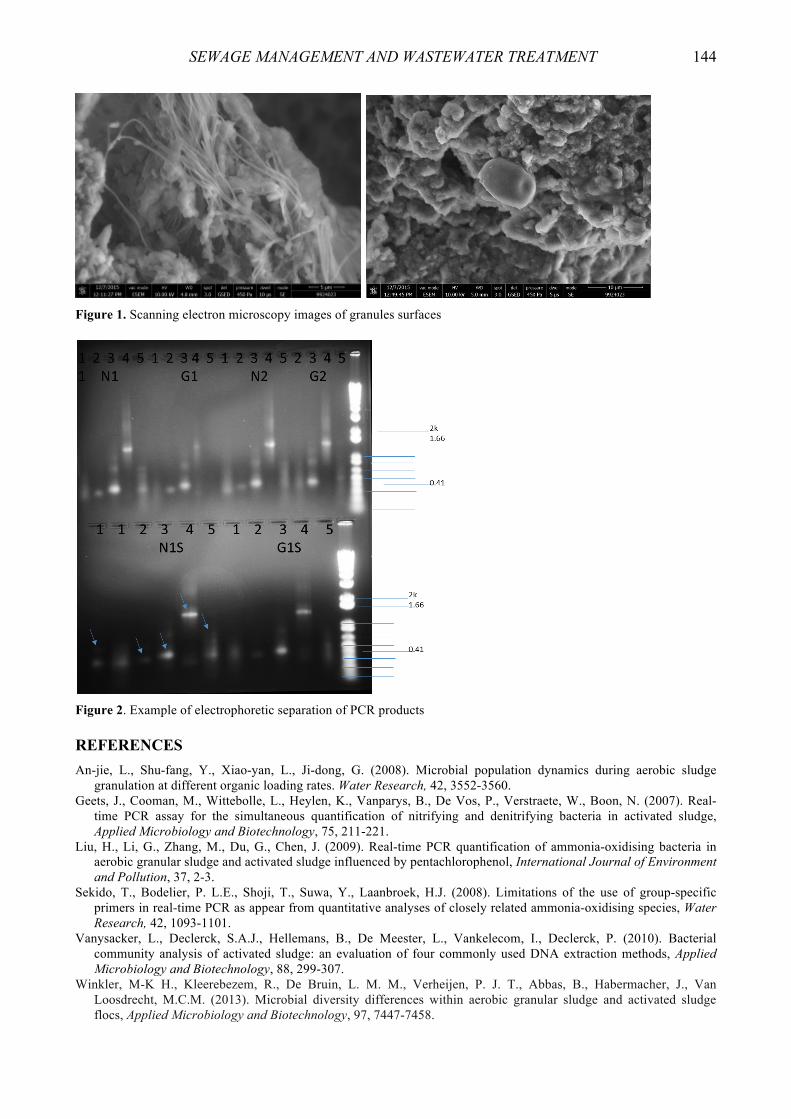
SEWAGE MANAGEMENT AND WASTEWATER TREATMENT 144
Figure 1. Scanning electron microscopy images of granules surfaces
Figure 2. Example of electrophoretic separation of PCR products REFERENCES An-jie, L., Shu-fang, Y., Xiao-yan, L., Ji-dong, G. (2008). Microbial population dynamics during aerobic sludge
granulation at different organic loading rates. Water Research, 42, 3552-3560. Geets, J., Cooman, M., Wittebolle, L., Heylen, K., Vanparys, B., De Vos, P., Verstraete, W., Boon, N. (2007). Real-
time PCR assay for the simultaneous quantification of nitrifying and denitrifying bacteria in activated sludge, Applied Microbiology and Biotechnology, 75, 211-221.
Liu, H., Li, G., Zhang, M., Du, G., Chen, J. (2009). Real-time PCR quantification of ammonia-oxidising bacteria in aerobic granular sludge and activated sludge influenced by pentachlorophenol, International Journal of Environment and Pollution, 37, 2-3.
Sekido, T., Bodelier, P. L.E., Shoji, T., Suwa, Y., Laanbroek, H.J. (2008). Limitations of the use of group-specific primers in real-time PCR as appear from quantitative analyses of closely related ammonia-oxidising species, Water Research, 42, 1093-1101.
Vanysacker, L., Declerck, S.A.J., Hellemans, B., De Meester, L., Vankelecom, I., Declerck, P. (2010). Bacterial community analysis of activated sludge: an evaluation of four commonly used DNA extraction methods, Applied Microbiology and Biotechnology, 88, 299-307.
Winkler, M-K H., Kleerebezem, R., De Bruin, L. M. M., Verheijen, P. J. T., Abbas, B., Habermacher, J., Van Loosdrecht, M.C.M. (2013). Microbial diversity differences within aerobic granular sludge and activated sludge flocs, Applied Microbiology and Biotechnology, 97, 7447-7458.
SEWAGE MANAGEMENT AND WASTEWATER TREATMENT 145
Aerobic Biodegradation of 2,4-dichlorophenoxyacetic Acid Pesticide B. Carboneras, J. Villaseñor and F.J. Fernandez-Morales* * University of Castilla-La Mancha, ITQUIMA, Chemical Engineering Department, Avenida Camilo José Cela S/N. 13071 Ciudad Real, Spain. (E-mail: [email protected])
INTRODUCTION Nowadays pesticides are essential for the correct development of crops. These chemical are a group of inorganic and organic compounds used to remove, control the number of, or attract various kinds of pests destroying plant products and weeds. The use of pesticides started to increase during the green revolution. This revolution caused many environmental problems such as increased soil fertility loss, soil acidification, nitrate leaching, increased weed species resistance and loss of biodiversity. Pesticides can generate problems in living organisms, including humans. Pesticides are very dangerous because of their mobility and facility to be accumulated in the environment. Because of the problems described, it is important to develop techniques in order to minimize the effect of pesticides. Traditionally, physical and chemical treatments methods have been used to eliminate pesticides from water and soils. In the last years new effective and cheaper methods have been developed. These new methods consist of taking advantage of the ability of microorganisms to remove pollutants, this is known as bioremediation (Verma et al., 2014). Effective microorganisms must be used to degrade complex organic compounds into simple inorganic chemicals. This degradation involves enzymatic breakdown of this toxic compounds and can carry out by some different ways as biotransformation, biomineralization, biodegradation, bioaccumulation and cometabolisms (Verma et al., 2014). MATERIAL AND METHODS The experimental system used in this work consists on batch reactors. The reactors have a continuous shaking and operated at a constant temperature. The volume of each reactor is 500 ml and they are open to the atmosphere in order to allow the oxygen transfer from the atmosphere to the liquid bulk. These factors make the process aerobic. Different concentrations of the pesticide, ranging from 10 to 100 ppm, were introduced into the reactor. Furthermore, a microbial inoculum from the sewage treatment plant of Ciudad Real, described elsewhere (Rodríguez Mayor et al. 2004), were added. Samples were drawn periodically, to study the possible degradation of the pesticides and the growth of the biomass. Both measures were analysed in a spectrophotometer. The aim of this experiment was to study the influence of the concentration of pesticide on its biodegradability. In order to ensure the availability of trace minerals, a nutrient solution was added to the experiments. The composition of the mineral solution is presented in Table 1. Table1. Trace mineral solution composition
Component Concentration [mg/L] Component Concentration [mg/L]
(NH4)2SO4 741,5 MgSO4 x 7H2O 502,9
KH2PO4 445,7 CaCl2 300,4
NaHCO3 1152 (NH4)2Fe(SO4)2 31,3
SEWAGE MANAGEMENT AND WASTEWATER TREATMENT 146
RESULTS AND DISCUSSION The evolution of the pesticide as well as the concentration of the biomass were analyzed along all the tests performed. As example, Figure 1 shows the evolution observed when working at 63 ppm of pesticide.
Figure 1. Evolution of the pesticide and biomass concentration during a biodegradation test As can be seen on Figure 1, a lag phase of about 25 d was observed. After the lag phase, the biomass growth was closely related to the pesticide biodegradation. The maximum biodegradation rate was determined, being its value about 0.25 g pesticide/(d·gVSS). This parameter was determined for all the tests. The results obtained are presented in Table 2. Table 2. Maximum biodegradation rate
Pesticide concentration [ppm]
Máximum biodegradation rate [g pesticide / d · g SSV]
11 0.49 30 0.31 63 0.25 87 0.25
100 0.20
As can be seen, the maximum biodegradation rate decreased when increased the concentration of the pesticide, indicating an inhibitory effect of the pesticide over the activated sludge. CONCLUSIONS It is possible to biodegrade the pesticide 2,4-D by using non-acclimatized activated sludge. However, an inhibitory effect is clearly obtained when the concentration increases. ACKNOWLEDGEMENTS Authors thanks the Spanish Government for the financial support thorough the Project CTM2013-45612-R. REFERENCES Rodríguez Mayor, L., Villaseñor Camacho, J. and Fernández Morales, F.J. (2004). Operational optimisation of pilot
scale biological nutrient removal at the Ciudad Real (Spain) domestic wastewater treatment plant. Water, Air, and Soil Pollution, 152(1-4), 279-296.
Verma, J.P., Jaiswal, D.K. and Sagar, R. (2014). Pesticide relevance and their microbial degradation: a-state-of-art. Reviews in Environmental Science and Biotechnology, 13(4), 429-66.
SEWAGE MANAGEMENT AND WASTEWATER TREATMENT 147
Mine Water Treatment Technology– Application of Electrodialysis: Laboratory and Pilot experiments J. Chromíková*, J. Thomas*, P. Malíková* and S. Heviánková** * Institute of Clean Technologies for Mining and Utilization of Raw Materials for Energy Use, Faculty of Mining and Geology ,VŠB – Technical university of Ostrava, 17. listopadu 15, Ostrava Poruba, Czech Republic (E-mails: [email protected]; [email protected]; [email protected]) ** Institute of Environmental Engineering, Faculty of Mining and Geology, VŠB – Technical University of Ostrava, 17. listopadu 15, Ostrava Poruba, Czech Republic (E-mail: [email protected])
MEMBRANE TECHNOLOGIES FOR MINE WATER TRETAMENT The purpose of this article is the application of membrane process (electrodialysis) for mine water treatment and its validation in the field of brown coal mining area. Membrane processes offer many advantages over conventional water treatment technologies. In fact the process could produce high quality water with substantially lower quantities of chemical agent. Other benefits are high selectivity and low energy demands. The development of membrane technologies is influenced by the current increased demand for quality discharged wastewater as well as the need for quality technological water. The application of membrane technologies is limited by the quality of feed water. The most hazardous for electrodialysis (ED) are hardness salts; especially calcium salts (Pilat, 2001). The performance of the own membrane process may be limited by concentration changes in the vicinity of the membrane (concentration polarization) or fouling of the membrane material surface. For waters with a relatively low salt concentration (below 5 g/L); electrodialysis is the most economic process in comparison to reverse osmosis. However, the desalination of waters with higher concentrations of dissolved solids (30 g/L) can successfully be performed through ED (Banasiak, 2007). Jeremenko shaft in Ostrava Vítkovice This study focuses on the issue of mine water in black coal mining in the conditions of the Ostrava-Karviná District (OKR). One closure option for underground mines in OKR is their hydraulic flushing. Such amounts of mine water are discharged from the water-logged mines in order to prevent exceeding the set ground water level. This maximum level is determined with regard to preventing an uncontrolled influence on the active mines within the Karviná partial coal basin. The major impact of mine water pumping is indisputably contamination of surface water, especially by long-impact pollutants (sulphates, iron and chlorides). On a long term basis, the current contents of the substances are increased in the surface hydrosystem of the locality, also probably due to the character of an industrial region (Table 1). Among the basic observed qualitative parameters of mine water in the locality there is total mineralization and the contents of SO4
2-, Cl-, Fe2+ and Fe3+ ions (Mašková, 2003). Laboratory experiments. The identified mine water quality implies the necessity to adjust the mine water treatment technology focusing on the pretreatment step in order to eliminate the effects of selected quality indicators on the membrane technologies (corresponding with standard limits). In particular, it is the case of removal of Ca2+, Mg2+, HCO3
- and SO42- ions. The first phase of
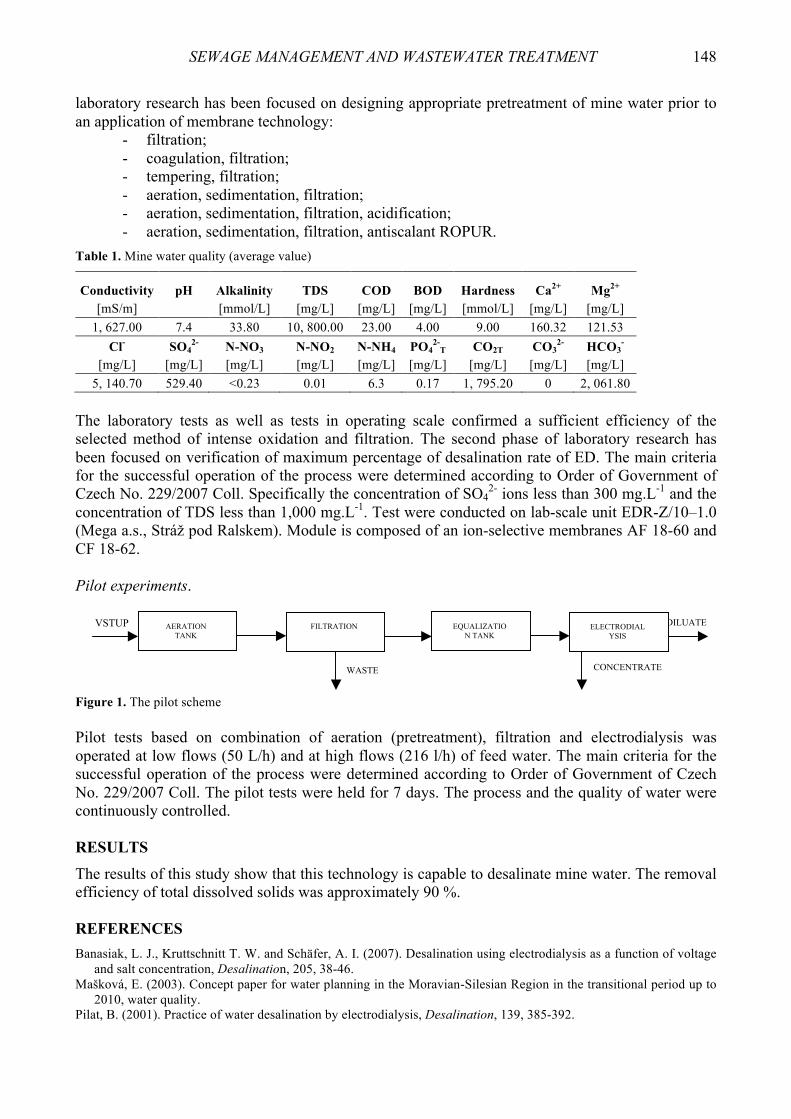
SEWAGE MANAGEMENT AND WASTEWATER TREATMENT 148
laboratory research has been focused on designing appropriate pretreatment of mine water prior to an application of membrane technology:
- filtration; - coagulation, filtration; - tempering, filtration; - aeration, sedimentation, filtration; - aeration, sedimentation, filtration, acidification; - aeration, sedimentation, filtration, antiscalant ROPUR.
Table 1. Mine water quality (average value)
Conductivity pH Alkalinity TDS COD BOD Hardness Ca2+ Mg2+ [mS/m] [mmol/L] [mg/L] [mg/L] [mg/L] [mmol/L] [mg/L] [mg/L]
1, 627.00 7.4 33.80 10, 800.00 23.00 4.00 9.00 160.32 121.53 Cl- SO4
2- N-NO3 N-NO2 N-NH4 PO42-
T CO2T CO32- HCO3
- [mg/L] [mg/L] [mg/L] [mg/L] [mg/L] [mg/L] [mg/L] [mg/L] [mg/L]
5, 140.70 529.40 <0.23 0.01 6.3 0.17 1, 795.20 0 2, 061.80 The laboratory tests as well as tests in operating scale confirmed a sufficient efficiency of the selected method of intense oxidation and filtration. The second phase of laboratory research has been focused on verification of maximum percentage of desalination rate of ED. The main criteria for the successful operation of the process were determined according to Order of Government of Czech No. 229/2007 Coll. Specifically the concentration of SO4
2- ions less than 300 mg.L-1 and the concentration of TDS less than 1,000 mg.L-1. Test were conducted on lab-scale unit EDR-Z/10–1.0 (Mega a.s., Stráž pod Ralskem). Module is composed of an ion-selective membranes AF 18-60 and CF 18-62. Pilot experiments.
Figure 1. The pilot scheme Pilot tests based on combination of aeration (pretreatment), filtration and electrodialysis was operated at low flows (50 L/h) and at high flows (216 l/h) of feed water. The main criteria for the successful operation of the process were determined according to Order of Government of Czech No. 229/2007 Coll. The pilot tests were held for 7 days. The process and the quality of water were continuously controlled. RESULTS The results of this study show that this technology is capable to desalinate mine water. The removal efficiency of total dissolved solids was approximately 90 %. REFERENCES Banasiak, L. J., Kruttschnitt T. W. and Schäfer, A. I. (2007). Desalination using electrodialysis as a function of voltage
and salt concentration, Desalination, 205, 38-46. Mašková, E. (2003). Concept paper for water planning in the Moravian-Silesian Region in the transitional period up to
2010, water quality. Pilat, B. (2001). Practice of water desalination by electrodialysis, Desalination, 139, 385-392.
DILUATE
CONCENTRATE
ELECTRODIALYSIS
EQUALIZATION TANK
WASTE
VSTUP AERATION TANK
FILTRATION
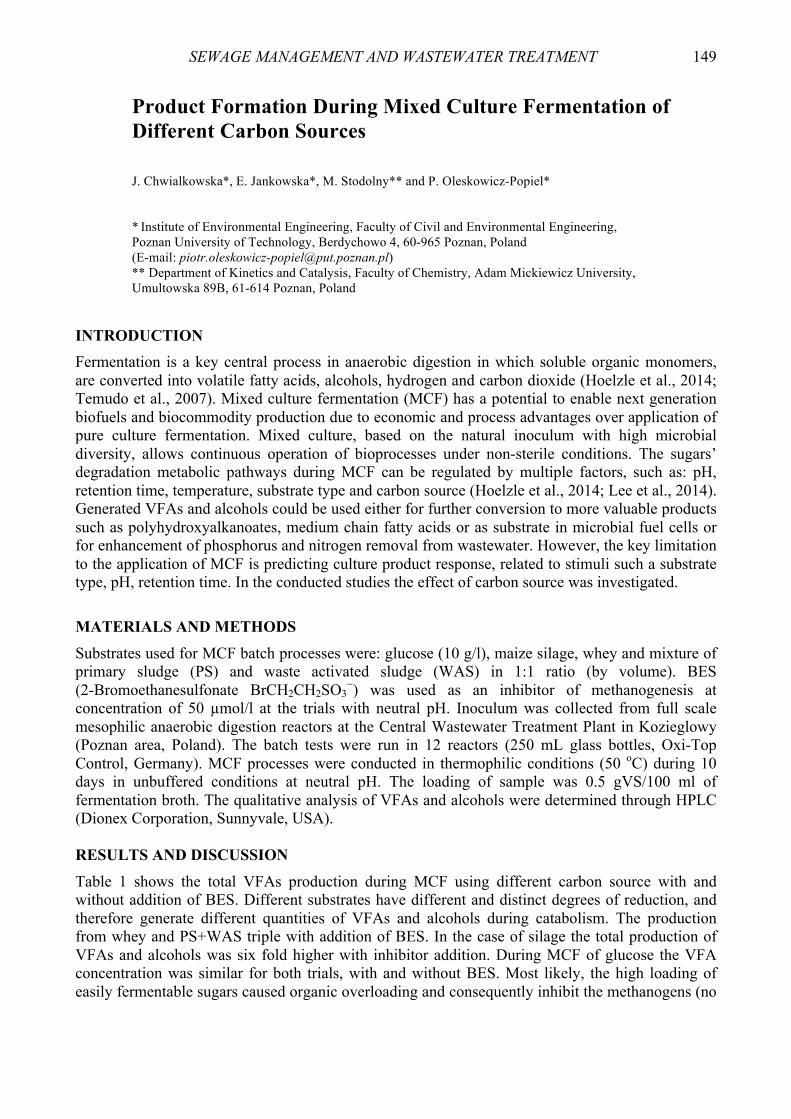
SEWAGE MANAGEMENT AND WASTEWATER TREATMENT 149
Product Formation During Mixed Culture Fermentation of Different Carbon Sources J. Chwialkowska*, E. Jankowska*, M. Stodolny** and P. Oleskowicz-Popiel* * Institute of Environmental Engineering, Faculty of Civil and Environmental Engineering, Poznan University of Technology, Berdychowo 4, 60-965 Poznan, Poland (E-mail: [email protected]) ** Department of Kinetics and Catalysis, Faculty of Chemistry, Adam Mickiewicz University, Umultowska 89B, 61-614 Poznan, Poland
INTRODUCTION Fermentation is a key central process in anaerobic digestion in which soluble organic monomers, are converted into volatile fatty acids, alcohols, hydrogen and carbon dioxide (Hoelzle et al., 2014; Temudo et al., 2007). Mixed culture fermentation (MCF) has a potential to enable next generation biofuels and biocommodity production due to economic and process advantages over application of pure culture fermentation. Mixed culture, based on the natural inoculum with high microbial diversity, allows continuous operation of bioprocesses under non-sterile conditions. The sugars’ degradation metabolic pathways during MCF can be regulated by multiple factors, such as: pH, retention time, temperature, substrate type and carbon source (Hoelzle et al., 2014; Lee et al., 2014). Generated VFAs and alcohols could be used either for further conversion to more valuable products such as polyhydroxyalkanoates, medium chain fatty acids or as substrate in microbial fuel cells or for enhancement of phosphorus and nitrogen removal from wastewater. However, the key limitation to the application of MCF is predicting culture product response, related to stimuli such a substrate type, pH, retention time. In the conducted studies the effect of carbon source was investigated.
MATERIALS AND METHODS Substrates used for MCF batch processes were: glucose (10 g/l), maize silage, whey and mixture of primary sludge (PS) and waste activated sludge (WAS) in 1:1 ratio (by volume). BES (2-Bromoethanesulfonate BrCH2CH2SO3
−) was used as an inhibitor of methanogenesis at concentration of 50 µmol/l at the trials with neutral pH. Inoculum was collected from full scale mesophilic anaerobic digestion reactors at the Central Wastewater Treatment Plant in Kozieglowy (Poznan area, Poland). The batch tests were run in 12 reactors (250 mL glass bottles, Oxi-Top Control, Germany). MCF processes were conducted in thermophilic conditions (50 oC) during 10 days in unbuffered conditions at neutral pH. The loading of sample was 0.5 gVS/100 ml of fermentation broth. The qualitative analysis of VFAs and alcohols were determined through HPLC (Dionex Corporation, Sunnyvale, USA). RESULTS AND DISCUSSION Table 1 shows the total VFAs production during MCF using different carbon source with and without addition of BES. Different substrates have different and distinct degrees of reduction, and therefore generate different quantities of VFAs and alcohols during catabolism. The production from whey and PS+WAS triple with addition of BES. In the case of silage the total production of VFAs and alcohols was six fold higher with inhibitor addition. During MCF of glucose the VFA concentration was similar for both trials, with and without BES. Most likely, the high loading of easily fermentable sugars caused organic overloading and consequently inhibit the methanogens (no
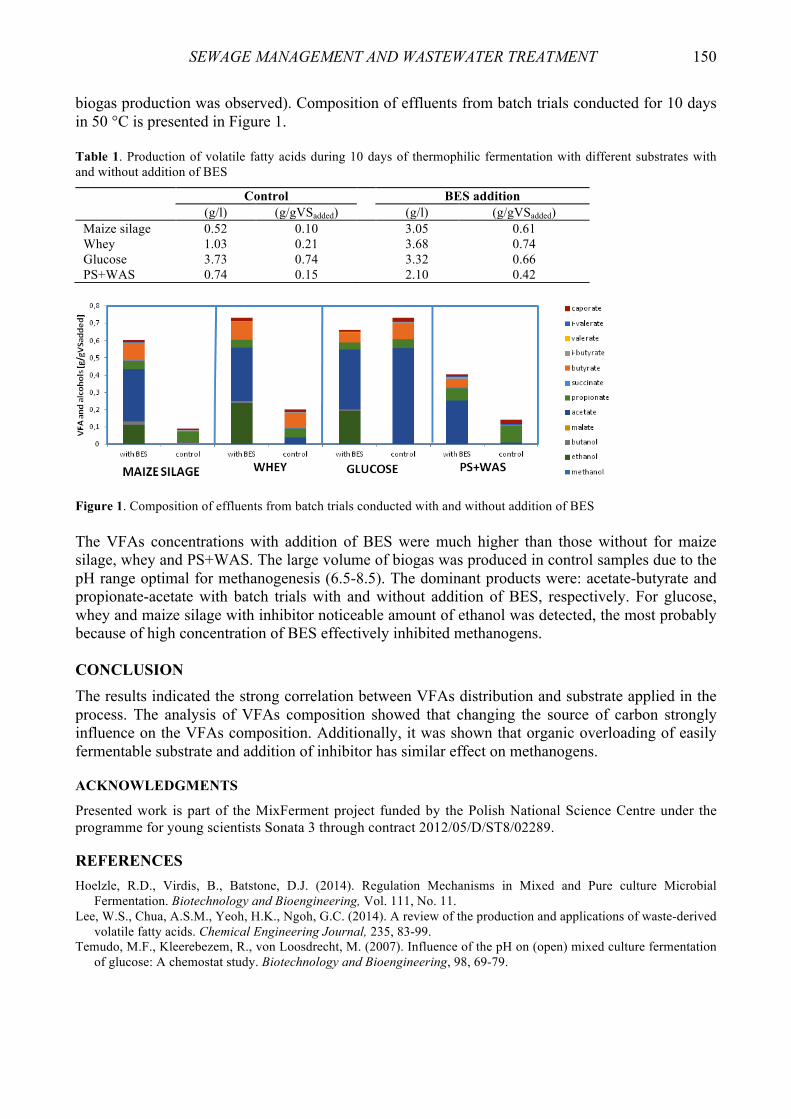
SEWAGE MANAGEMENT AND WASTEWATER TREATMENT 150
biogas production was observed). Composition of effluents from batch trials conducted for 10 days in 50 °C is presented in Figure 1. Table 1. Production of volatile fatty acids during 10 days of thermophilic fermentation with different substrates with and without addition of BES
Control BES addition (g/l) (g/gVSadded) (g/l) (g/gVSadded) Maize silage 0.52 0.10 3.05 0.61 Whey 1.03 0.21 3.68 0.74 Glucose 3.73 0.74 3.32 0.66 PS+WAS 0.74 0.15 2.10 0.42
Figure 1. Composition of effluents from batch trials conducted with and without addition of BES The VFAs concentrations with addition of BES were much higher than those without for maize silage, whey and PS+WAS. The large volume of biogas was produced in control samples due to the pH range optimal for methanogenesis (6.5-8.5). The dominant products were: acetate-butyrate and propionate-acetate with batch trials with and without addition of BES, respectively. For glucose, whey and maize silage with inhibitor noticeable amount of ethanol was detected, the most probably because of high concentration of BES effectively inhibited methanogens. CONCLUSION The results indicated the strong correlation between VFAs distribution and substrate applied in the process. The analysis of VFAs composition showed that changing the source of carbon strongly influence on the VFAs composition. Additionally, it was shown that organic overloading of easily fermentable substrate and addition of inhibitor has similar effect on methanogens. ACKNOWLEDGMENTS
Presented work is part of the MixFerment project funded by the Polish National Science Centre under the programme for young scientists Sonata 3 through contract 2012/05/D/ST8/02289.
REFERENCES Hoelzle, R.D., Virdis, B., Batstone, D.J. (2014). Regulation Mechanisms in Mixed and Pure culture Microbial
Fermentation. Biotechnology and Bioengineering, Vol. 111, No. 11. Lee, W.S., Chua, A.S.M., Yeoh, H.K., Ngoh, G.C. (2014). A review of the production and applications of waste-derived
volatile fatty acids. Chemical Engineering Journal, 235, 83-99. Temudo, M.F., Kleerebezem, R., von Loosdrecht, M. (2007). Influence of the pH on (open) mixed culture fermentation
of glucose: A chemostat study. Biotechnology and Bioengineering, 98, 69-79.

SEWAGE MANAGEMENT AND WASTEWATER TREATMENT 151
Comparison of Designed and Real Electric Energy Consumption by an SBR Reactor J. Ciepliński and S.M. Rybicki* * Instytut Zaopatrzenia w Wodę i Ochrony Środowiska, Wydział Inżynierii Środowiska, Politechnika Krakowska, ul. Warszawska 24, 31-155, Kraków, Poland (E-mails: [email protected]; [email protected])
INTRODUCTION The paper describes first stage of the experiment designed to determine distribution of electrical energy consumption by a medium-size municipal wastewater treatment plant. The experiment is addressed towards minimization of electrical energy consumption and thus reduction of an ecological ‘footprint’ of contemporary wastewater treatment plant. The main subject is to check whether minimization of this consumption can be achieved by re-arrangement of energy supply subsystem. The plant was designed at the capacity of 1,250 m3/d (p.e. equals to 14,950). Real operating conditions are in fact lower as follows flow is approx. 500 m3/d with approx. 4,000 p.e. The research has focused mainly on energy consumption by the biological treatment stage (SBRs) and sludge stabilization. During the first stage of measuring grid`s construction following devices were covered: SBRs no3 and 4 blowers: D4, D5, D6, SBR no4 internal turbine: Tr4 and SBR no4 sludge pump: P11. Paper will be focused on comparison of theoretical and real energy consumption of blowers D5, D6 equipped with Variable-frequency drives (VFDs) and sludge pump P11 powered directly (without VFD). MEASURMENTS AND CALCULATIONS Each energy consuming treatment unit/equipment has been equipped with a measuring device, which measures and stores data concerning device’s total energy consumption with 5 minutes time step. Based on that energy usage during given time period was calculated (column “M” in Tables 1, 2). All blowers’ motors nominal power is 30 kW, pump motor is 5.5 kW. Table 1.Measured and estimated energy consumption in November 2015
Date Time P11 5.5 [kW] D5 30 [kW] D6 30 [kW] E1 [kWh] M [kWh] E1 [kWh] E2 [kWh] M [kWh] E1 [kWh] E2 [kWh] M [kWh]
2-11 15:45 - - - - - - - - 3-11 13:45 0,37 0,28 372,00 137,64 126,79 0.00 0.00 0,48 4-11 14:10 0,73 0,53 473,50 175,20 162,48 0.00 0.00 0,52 5-11 13:15 0,73 0,54 423,00 156,51 138,79 0.00 0.00 0,50 6-11 13:35 0,73 0,57 452,00 167,24 150,68 0.00 0.00 0,53 9-11 14:05 1,38 1,00 990,50 366,49 322,08 0.00 0.00 1,58
10-11 14:00 2,11 1,67 405,50 150,04 138,33 0.00 0.00 0,51 12-11 13:45 1,93 1,37 803,00 297,11 263,24 0.00 0.00 1,01 13-11 14:05 0,37 0,26 487,00 180,19 163,60 0.00 0.00 0,51 16-11 14:00 1,47 1,09 982,50 363,53 323,13 0.00 0.00 1,55 19-11 13:25 2,02 1,53 991,00 366,67 335,20 26,50 9,81 11,34 20-11 13:55 1,38 1,01 361,50 133,76 121,21 457,50 169,28 161,17 23-11 14:00 1,47 1,10 800,00 296,00 269,92 913,50 338,00 303,46 24-11 14:00 2,38 1,79 257,50 95,28 93,31 406,50 150,41 141,21 25-11 13:50 0,73 0,75 271,00 100,27 97,36 396,00 146,52 132,14 26-11 14:00 1,19 0,71 255,00 94,35 83,18 447,50 165,58 151,53 27-11 13:30 0,83 0,67 186,00 68,82 67,78 370,50 137,09 126,13 30-11 13:35 1,47 1,12 732,50 271,03 246,61 916,50 339,11 296,10

SEWAGE MANAGEMENT AND WASTEWATER TREATMENT 152
Table 2. Measured and estimated energy consumption in December
Date Time P11 5.5 [kW] D5 30 [kW] D6 30 [kW] E1 [kWh] M [kWh] E1 [kWh] E2 [kWh] M [kWh] E1[kWh] E2 [kWh] M [kWh]
1-12 15:45 0,73 0,53 217,00 80,29 79,92 443,50 164,10 158,12 2-12 13:45 0,73 0,41 395,00 146,15 125,18 427,50 158,18 145,29 3-12 14:10 0,92 0,69 211,50 78,26 77,61 387,50 143,38 132,36 4-12 13:15 1,19 0,85 198,50 73,45 73,57 483,00 178,71 171,19 7-12 13:35 1,10 0,79 869,50 321,72 274,67 1349,00 499,13 450,10 9-12 14:05 1,93 1,36 606,50 224,41 214,47 997,50 369,08 344,01
10-12 14:00 0,73 0,48 252,00 93,24 92,56 553,50 204,80 192,55 11-12 13:45 0,37 0,25 393,00 145,41 129,33 568,00 210,16 200,13 14-12 14:05 1,10 0,82 816,00 301,92 274,54 1420,50 525,59 466,16 15-12 14:00 0,73 0,54 324,50 120,07 116,26 580,50 214,79 199,73 16-12 13:25 1,01 0,75 349,50 129,32 124,83 19,00 7,03 6,19 17-12 13:55 0,73 0,50 416,50 154,11 139,85 0,00 0.00 0,54 18-12 14:00 0,73 0,54 379,50 140,42 131,01 0,00 0.00 0,54 21-12 14:00 1,10 0,78 1120,50 414,59 366,30 0,00 0.00 1,62 23-12 13:50 1,83 1,30 676,50 250,31 243,24 0,00 0.00 1,08 28-12 14:00 2,11 1,62 1482,50 548,53 483,26 0,00 0.00 2,67 29-12 13:30 1,01 0,71 304,00 112,48 103,36 0,00 0.00 0,56
One of the methods used to estimate the energy consumption is simple equation:
,tMPE ⋅= (1)
where E – estimated energy consumption; MP – Motor Power, kW; t – time of operation, h. With equation (1) estimated energy consumption was calculated (E1), work-time of the devices was archived by the plant’s operator. Unfortunately work-time of the devices was archived with irregular time step, although it had no negative effect on the calculations results. As expected E1 estimation results were similar to measured values for P11, but were far greater than the measured energy consumption for D5 and D6. Such disproportion is a result of powering blowers by VFDs. The main purpose for using VFDs is to keep working parameters of a device but with lower energy consumption (ABB, 2011). To improve accuracy of estimation individual VFD’s settings are needed. In this case all three VFDs were set to achieve real motor power = 37 % of nominal power. To calculate second set of estimated power consumption (E2) equation (1) was enhanced with power reduction factor:
,tMPE ε⋅⋅= (2)
where ε – power reduction factor. Estimations made with equation (2) gave results a little bit higher than the measured values but the difference is acceptable. In terms of energy demand small overestimation is better than underestimation. Worth noting is fact that VFDs work independently from motor it supply therefore even when blower was turned off small amounts of energy were used to maintain VFDs in stand-by. Similar analyzes and estimations were conducted for the rest of the monitored devices. REFERENCES ABB (2011). Technical guide No. 4 Guide to variable speed drives, ABB digital library (2016),
http://www.abb.com/abblibrary/downloadcenter/.

SEWAGE MANAGEMENT AND WASTEWATER TREATMENT 153
ENERWATER: An Innovative Energy Audit Methodology in Wastewater Treatment Plants. Focusing on Italian Scenario B.M. D’Antoni*, L. Stefani**, E. Parelli** and F. Fatone*
* Department of Biotechnology, University of Verona, Strada le graze 15, Verona, IT (E-mails: [email protected]; [email protected]) ** ETRA S.p.A, Progetti Innovativi Ricerca e Sviluppo, via del Telarolo 9, Cittadella, Padova, IT (E-mails: [email protected]; [email protected])
INTRODUCTION The total electricity consumption in wastewater treatment plants (WWTPs) corresponds to about 1% of the total electricity consumption per year of a country (Cao, 2011). Data from show that electricity demand account for about 1% of total production of the country Italy (Foladori, 2010). In Spain the electricity demand for WWTPs responds to 2-3% of total energy consumption (Fundación OPTI, 2012). In the United States, it has been estimated that roughly 4% of the electricity demand is employed in distribution/collection and potabilization/treatment of water and wastewater, by public and private stakeholders (Goldstein, 2002). Energy consumption represents a significant part of the operative cost of WWTPs but, with a correct design and a careful management model, there are important possibilities for its limitations (Panepinto, 2016). In this regard, the ENERWATER project is developed in order to validate and disseminate an innovative standard methodology for continuously assessing, labelling and improving the overall performance of WWTPs. METHODS
A review of WWTP energy-use performance and the benchmarking systems was carried out. A total of 369 plant aggregated energy consumption and a total of 64 disaggregated data sets were collected. Through the literature review, the energy consumption for each equipment and process was managed and linked in function of the size and the main treatment of the WWTPs. Starting from this classification the ENERWATER energy-audit methodology tool has been developed in order to estimate and compare the energy consumption with the ENERWATER benchmark in 15 Italian WWTPs managed by the water-utility ETRA S.p.A. In this methodology, the facilities, implemented in WWTPs, were organized in 7 treatment stages as following:
- Stage 1: Preliminary treatment (Influent pumping, screening, grit removal, etc.); - Stage 2: Primary treatment (Primary clarification); - Stage 3: Secondary treatment (Biological reactors, Secondary clarification, etc.); - Stage 4: Tertiary and advanced treatment (Sand Filters, UV disinfection, reed-beds, etc.); - Stage 5: Sludge treatment (thickeners, sludge stabilisation, belt presses, dewatering, etc.); - Stage 6: Return liquors treatment (reject water, Anammox, struvite precipitation, etc.); - Stage 7: Odour treatment (chemical scrubbers, incinerators, bio filters, etc.).
In order to carry out the energy audit by using the ENERWATER tool, a pre-audit survey has been conducted. The data regarding the electro-mechanic devices (i.e. power, power factor, working time, etc.) were collected in order to calculate its energy consumption. RESULTS AND DISCUSSION Figure 1 shows an example of energy audit results for the WWTP of Cadoneghe (50,000 PE, 10,796 m3/d). The energy consumption in (kWh/y) for all equipment was reported and compared with the ENERWATER benchmark. Key Performance Indicators (KPIs) have been proposed in

SEWAGE MANAGEMENT AND WASTEWATER TREATMENT 154
WWTPs but not much details were given about energy consumption in the single stage of WWTPs (Gordon and McCann, 2015). In ENERWATER methodology, in the different stage of the WWTPs, different KPIs are considered for example (kWh/m3, kWh/BOD5removed, kWh/CODremoved, kWh/TNremoved, kWh/kgTPremoved, kWh/NH4removed, kWh/TSremoved). The KPIs, showed in Table 1, were calculated from the data of influent/effluent characteristics and considering literature efficiency removal values.
Figure 1. Equipment energy consumption comparison between energy audit and benchmark in WWTP of Cadoneghe Table 1. Key performance parameters in the stages present in the WWTP of Cadoneghe
Stage treatment KPIs Unit Value
Stage 1: Preliminary treatment [kWh/m3] 0.148
Stage 3: Secondary treatment [kWh/kg COD removed] 0.39 [kWh/kg NH4 removed] 3.41 [kWh/kg TN removed] 4.2 [kWh/kg TP removed] 5.96
Stage 4: Tertiary and advanced treatment [kWh/kg TSS removed] 3.79 [kWh/log reduction] 0.73
Stage 5: Sludge treatment [kWh/kg TS processed] 0.24
In all WWTPs, pre-audit survey and application of energy audit tool were conducted. In the next future, energy meter and power analyser will be installed and a sampling campaign will be done in each stage in order to calculate the KPIs referred to the real efficiency removal. REFERENCES Cao, Y.S. (2011). Mass flow and energy efficiency of municipal wastewater treatment plants. IWA Publishing, London,
UK. ISBN 9781843393825. Foladori, P., Vaccari, M., Vitali, F. (2015). Energy audit in small wastewater treatment plants: methodology, energy
consumption indicators, and lessons learned. Water Science & Technology 72 (6), 1007-1015. Fundación OPTI (2012). Estudio de Prospectiva. Consumo energético en el sector del agua. Goldstein, R., Smith, W. (2002). US electricity consumption for water supply & treatment-the next half century.
Electric Power Research Institute. Water & sustainability, volume 4. Gordon, G.T., McCann, B.P. (2015). Basis for the development of sustainable optimisation indicators for active sludge
wastewater plants in the Republic of Ireland. Water Science and Technology, 71(1), 131-138. Panepinto, D., Fiore, S., Zappone, M., Genon, G., Meucci, L. (2016). Evaluation oft he energy efficiency of a large
wastewater treatment plant in Italy. Applied Energy 161, 404-411.

SEWAGE MANAGEMENT AND WASTEWATER TREATMENT 155
Application of Commercial Adsorbents for Landfill Leachate Treatment on Sanitary Landfill in Developing Country M. Djogo, I. Mihajlovic, M. Brboric, S. Pap, V. Bezanovic and D. Ubavin* * University of Novi Sad,Faculty of Technical Sciences, Department of Environmental Engineering, Trg Dositeja Obradovica 6, 21000 Novi Sad (E-mail: [email protected])
INTRODUCTION Over 90 % of total municipal solid waste collected worldwide is disposed on landfill sites. Deposited waste passes through physico-chemical and biological changes that in combination with percolating rainwater lead to the generation of a leachate (Kurniawan et al., 2005). The development of leachate treatment technologies is not completed since the composition of this type of water varies significantly and depends on the age of landfill as well as on the waste composition (Matosic et al., 2008). Earlier studies has shown that is not advised to treat the leachate together with municipal wastewater because it contain the hazardous compounds which can be accumulated in the activated sludge so it could not be used in further agriculture activities (Vilar et al., 2010; Halim et al., 2010; Aloui et al., 2009, Wiszniowski et al., 2006). Reverse osmosis as a membrane technology is often used to remove the pollutants from leachates but concentrate stream fate presents a problem that should be considered. Serbia as country in transition still does not have properly designed landfill where leachate is collected and properly treated so the conducted investigation is very significant in this stage in order to investigate alternatives for leachate treatment that are effective and economically feasible. The aim of this study was to evaluate the application of selected commercial adsorbents for landfill leachate treatment on sanitary landfill with emphasis on phosphate ions, ammonia and COD as the specific pollution indicators of leachates. MATERIALS AND METHODS Leachate samples were collected after the secondary treatment of purification, before of reverse osmosis treatment and the initial concentrations of phosphate ions, ammonia and organic load were 15.48, 718 and 850 mg L-1, respectively. The new commercial adsorbents such as activated carbons Norit SA2, Hydrodarco C and zeolite ZSM-5 were applied on collected leachate samples in order to investigate the efficiency of phosphate and ammonia ions remove and the organic load reducing. The influence of pH and concentrations of adsorbent dosage were studied. RESULTS AND DISCUSSION Adsorption capacity, q, achieved the highest values of 159.2 and 166.0 mg/g in acidic media, for both adsorbents (Figure 1). Organic matter removal on zeolite ZSM – 5 ranged from 5 % to 30 %, which indicates that ZSM – 5 cannot be applied for the reduction of organic matter from this type of aqueous solutions. Maximum adsorption capacity of phosphate ions was 3.4 mg/g for Hydrodarco C, and 2.1 mg/g for zeolite (Figure 2).
SEWAGE MANAGEMENT AND WASTEWATER TREATMENT 156
Figure 1. Effect of pH on adsorption capacity of organic matter
Figure 2. Effect of pH on adsorption capacity of phosphate anions
Figure 3. Effect of activated carbons Norit SA 2 and Hydrodarco C dosage on removal efficiency of organic matter
Figure 4. Effect of zeolite ZSM-5 and activated carbon Hydrodarco C dosage on removal efficiency of phosphate anions
The effect of adsorbent dosage on the organic matter removal efficiency by activated carbons from landfill leachate was investigated in the range of 0.02 to 0.3 g and as shown, the adsorption yield increased from 22.1 to 76.3% with increases in the activated carbon dosage (Figure 3). The effect of adsorbent dosage was also studied for phosphate ions removal (Figure 4). Removal efficiency increased from 37.9 to 95.3 % for activated carbon dosage range from 0.02 to 0.3 g. CONCLUSIONS Activated carbon Hydrodarco C could be used as efficient adsorbent for removal of organic matter and phosphate ions. Low level of separation of organic matter on the zeolite ZSM-5 indicates that mentioned adsorbent should not be applied for this purpose at all. The removal effectiveness for ammonia obtained using all three adsorbents were very low which indicates that they should not be taken in account for removing of ammonia in this stage of treatment. REFERENCES Aloui, F., Fki, F., Loukil, S. and Savadi, S. (2009). Application of combined membrane biological reactor and electro-
oxidation processes for the treatment of landfill leachates. Water Science & Technology, 60 (3), 605-614. Halim, A., Aziz, H., Johari, M. and Ariffin, K. (2010). Comparison study of ammonia and COD adsorption on zeolite,
activated carbon and composite materials in landfill leachate treatment. Desalination, 262, 31-35. Knežević, N., Vukić, Lj. and Knežević, D. (2015). Variation impact leachate from landfills Brijesnica on quality of
surface and ground water. Archives for Technical Sciences, 12 (1), 73-80. Kurniawan, D., Lo, W. and Chan, G. (2005). Physico-chemical treatments for removal of recalcitrant contaminants
from landfill leachate. Journal of Hazardous Materials, B129, 80-100. Matosic, M., Terzic, S., Korajlija Jakopovic, H., Mijatovic I. and Ahel, M. (2008). Treatment of a landfill leachate
containing compounds of pharmaceutical origin. Water Science & Technology, 58 (3), 597-602. Vilar, A., Eiroa A., Kennes, C. and Veiga, M. (2010). The SHARON process in the treatment of landfill leachate. Water
Science & Technology, 61 (1), 47-52.

SEWAGE MANAGEMENT AND WASTEWATER TREATMENT 157
One vs. Two-Step Hydrolysis Process of Slowly Biodegradable Organic Compounds in Activated Sludge Systems – Experimental Investigation and Mathematical Modelling
J. Drewnowski* * Gdansk University of Technology, Faculty of Civil and Environmental Engineering, Narutowicza 11/12, 80-233 Gdansk, Poland (E-mail: [email protected])
INTRODUCTION
The essential study was divided into two parts: experimental investigation and mathematical modelling using software to computer simulations. In the first part of research an innovative measurement procedure for an indirect determination of the effect of biodegradable particulate and colloidal slowly biodegradable (XS) substrate was developed and implemented (Drewnowski & Makinia, 2014). The results of laboratory tests were used further to verify the mechanism of the hydrolysis process using an existing IWA model ASM2d. Based on the concept “dual hydrolysis model” presented by Orhon et al. (1998) a new mathematical model in the combined N-P activated sludge systems was developed as the modified version of ASM2d during the study at “Wschod” WWTP in Gdansk (Poland) and presented in detail elsewhere (Drewnowski & Makinia, 2013). This paper contains further results obtained at a recently upgraded “Debogorze” WWTP in Gdynia under transient conditions (fall and spring sessions). The aim of this study was verified and compared one vs. two-step (newly developed) hydrolysis model of XS called "modified ASM2d" at second large BNR plant in northern Poland. MATERIAL AND METHODS
Extracting experimental data. For the laboratory experiments, the process mixed liquor and SWW from the average daily time-proportional samples, were collected at the “Debogorze” WWTP during two study periods (fall and spring) between September, 2009 and May, 2010 and reviewed in detail elsewhere (Drewnowski & Makinia, 2014). According to the developed novel procedure, the laboratory experiments were conducted in parallel batch reactors: 4 types of one- and two-phase laboratory batch tests (such as the conventional nitrate utilization rate (NUR), phosphate release (PRR) and anoxic/aerobic phosphate uptake (PUR), oxygen uptake rate (OUR) measurements) were carried out with the SWW without pretreatment (R1-reactor 1) and pretreated with coagulation-flocculation (C-F) method (R2-reactor 2). A latter sample, containing only a soluble organic fraction, was prepared according to rapid physical-chemical method of Mamais et al. (1993). Organization of the modeling study. The ASM2d was calibrated and validated based on results of the batch tests (summer study period) and the 96-hour measurement campaign at “Wschod” WWTP presented in detail (Drewnowski & Makinia, 2013). The same sets of model parameters were evaluated further using steady state and dynamic simulations at “Debogorze” WWTP in order to estimate input data of the ASM2d biomass components necessary to start the batch tests modeling study. Then the results of the batch tests with the SWW without pretreatment and after C-F were used with the original and modified ASM2d to compare predictions of both models in terms of NH4-N, NO3-N, PO4-P and OUR behavior at “Debogorze” WWTP. The new model incorporates one new component, a rapidly hydrolysable substrate (XSH), and three new processes, including anaerobic, anoxic and aerobic hydrolysis of XSH (Figure 1a). Computer simulations were carried out with the GPS-X ver. 5.02 modeling platform (Hydromantis, Canada) (Figure 1b).
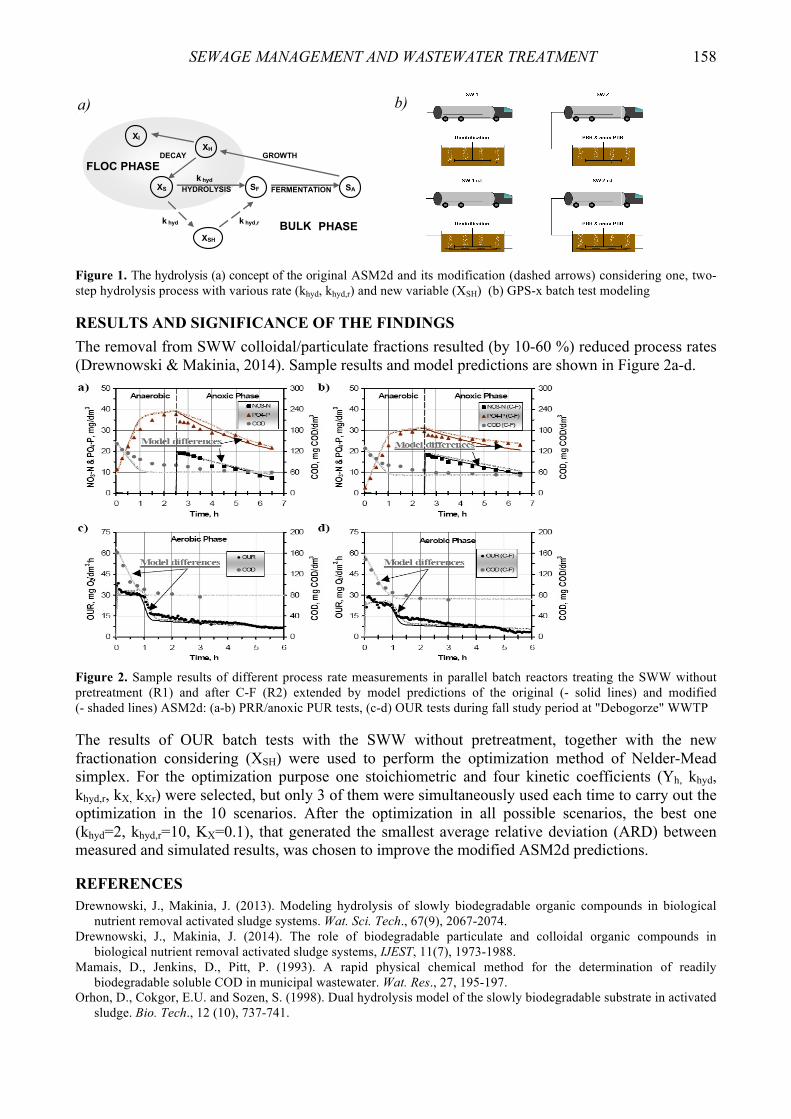
SEWAGE MANAGEMENT AND WASTEWATER TREATMENT 158
a) b)
X I
X S
X SH
GROWTH
S A SF
DECAY
HYDR OL YSIS
FLOC PHASE
BULK PHASE k hyd
k hyd
k hyd,r
FERMENTATION
XH
Figure 1. The hydrolysis (a) concept of the original ASM2d and its modification (dashed arrows) considering one, two-step hydrolysis process with various rate (khyd, khyd,r) and new variable (XSH) (b) GPS-x batch test modeling RESULTS AND SIGNIFICANCE OF THE FINDINGS The removal from SWW colloidal/particulate fractions resulted (by 10-60 %) reduced process rates (Drewnowski & Makinia, 2014). Sample results and model predictions are shown in Figure 2a-d.
Figure 2. Sample results of different process rate measurements in parallel batch reactors treating the SWW without pretreatment (R1) and after C-F (R2) extended by model predictions of the original (- solid lines) and modified (- shaded lines) ASM2d: (a-b) PRR/anoxic PUR tests, (c-d) OUR tests during fall study period at "Debogorze" WWTP The results of OUR batch tests with the SWW without pretreatment, together with the new fractionation considering (XSH) were used to perform the optimization method of Nelder-Mead simplex. For the optimization purpose one stoichiometric and four kinetic coefficients (Yh, khyd, khyd,r, kX, kXr) were selected, but only 3 of them were simultaneously used each time to carry out the optimization in the 10 scenarios. After the optimization in all possible scenarios, the best one (khyd=2, khyd,r=10, KX=0.1), that generated the smallest average relative deviation (ARD) between measured and simulated results, was chosen to improve the modified ASM2d predictions. REFERENCES Drewnowski, J., Makinia, J. (2013). Modeling hydrolysis of slowly biodegradable organic compounds in biological
nutrient removal activated sludge systems. Wat. Sci. Tech., 67(9), 2067-2074. Drewnowski, J., Makinia, J. (2014). The role of biodegradable particulate and colloidal organic compounds in
biological nutrient removal activated sludge systems, IJEST, 11(7), 1973-1988. Mamais, D., Jenkins, D., Pitt, P. (1993). A rapid physical chemical method for the determination of readily
biodegradable soluble COD in municipal wastewater. Wat. Res., 27, 195-197. Orhon, D., Cokgor, E.U. and Sozen, S. (1998). Dual hydrolysis model of the slowly biodegradable substrate in activated
sludge. Bio. Tech., 12 (10), 737-741.
a) b)

SEWAGE MANAGEMENT AND WASTEWATER TREATMENT 159
The Analysis of the NH4 Virtualization Sensors by Computer Simulation in the Control of Aeration Systems at WWTP
J. Drewnowski*, P. Banaszek** and M. Zmarzły***
* Gdansk University of Technology, Faculty of Civil and Environmental Engineering, ul. Narutowicza 11/12, 80-233 Gdansk, Poland (E-mails: [email protected]; [email protected]) ** Chorzowsko Świętochłowickie Water and Sewage Management Utility Ltd., ul Skіadowa 1, 41-500 Chorzów, Poland (E-mail: [email protected]) *** ZAPSOFT Ltd. , ul. Al. Kasztanowa 3A, 51-125 Wrocіaw, Poland (E-mail: [email protected])
INTRODUCTION Computer simulation has become a helpful tool in analysis of each part of wastewater treatment systems performance and effectiveness. Using advanced software (WEST, GPS-X etc.) to create a model of a real wastewater treatment plant (WWTP) it is possible to run a simulations and subsequently interpret results under various conclusions. The laboratory tests, on-line measurements and additional calculations should be carried out in order to better integrate computer model to the conditions prevailing in the local parameters of each individual parts of WWTP (Gujer, 2006). In addition, the development of a computer models require a detailed analysis of the whole technological system and taking into account the specific variables to each modeled device/object. The proper estimation of these parameters in model has strong influence on the results of mathematical modeling and computer simulation in controlling biochemical processes of WWTP - especially a biological part (e.g. nitrification zone/aeration system) where the costs of operation could be extremely high. The aim of this study was to evaluate an innovative concept of the possible use analysis of the NH4 virtualization sensors by computer simulation in the control of aeration systems at WWTP. MATERIAL AND METHODS The experimental part was carried out in order to present the process of model calibration according to laboratory study and on-line measurements in order to better integrate computer model to the conditions prevailing in the local parameters of individual biological part of bioreactor for aeration system at "Klimzowiec" WWTP. Moreover in this study was used the system called PreviSys device and appropriate software for communicating with SCADA, which allows to supply mathematical model in the current operating parameters of controlled object. The PreviSys is communication system with the monitored (and controlled) of process technology. This system also includes an industrial PC with the appropriate software for advanced process control by implemented a mathematical model of WWTP created by using the computer program WEST. In the modeling study was used ASM2d (Activated Sludge Model No.2d) with extension ModTemp. The results of the simulation model are then sent to the SCADA system which allows properly control the individual devices (blowers, pumps). In order to control the aeration blower by using the model to calculate the NH4 concentration at the outlet of bioreactor, it was assumed that every 15 minutes are collected current data, and then are added to the set of input data and processed in mathematical model in order to generate the results of NH4 virtualization. The actual result of computer simulation is sent back to the SCADA system which is responsible for the adequately control of aeration system in WWTP.
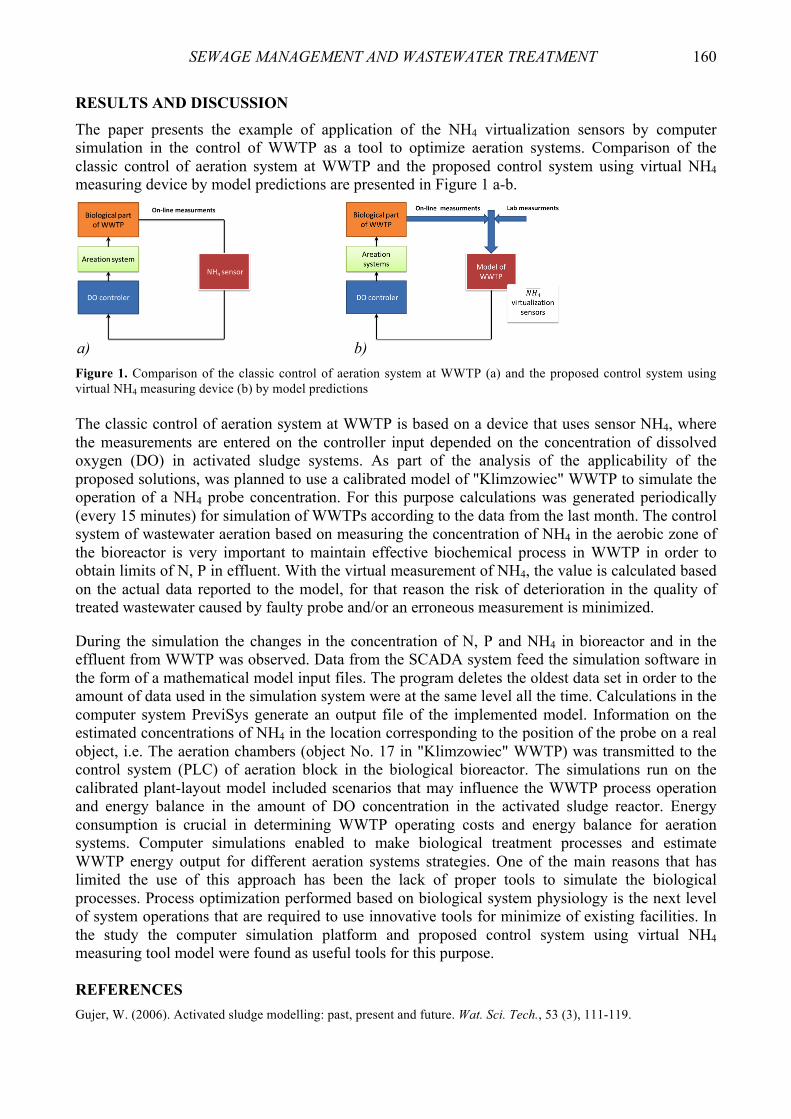
SEWAGE MANAGEMENT AND WASTEWATER TREATMENT 160
RESULTS AND DISCUSSION The paper presents the example of application of the NH4 virtualization sensors by computer simulation in the control of WWTP as a tool to optimize aeration systems. Comparison of the classic control of aeration system at WWTP and the proposed control system using virtual NH4 measuring device by model predictions are presented in Figure 1 a-b.
Figure 1. Comparison of the classic control of aeration system at WWTP (a) and the proposed control system using virtual NH4 measuring device (b) by model predictions The classic control of aeration system at WWTP is based on a device that uses sensor NH4, where the measurements are entered on the controller input depended on the concentration of dissolved oxygen (DO) in activated sludge systems. As part of the analysis of the applicability of the proposed solutions, was planned to use a calibrated model of "Klimzowiec" WWTP to simulate the operation of a NH4 probe concentration. For this purpose calculations was generated periodically (every 15 minutes) for simulation of WWTPs according to the data from the last month. The control system of wastewater aeration based on measuring the concentration of NH4 in the aerobic zone of the bioreactor is very important to maintain effective biochemical process in WWTP in order to obtain limits of N, P in effluent. With the virtual measurement of NH4, the value is calculated based on the actual data reported to the model, for that reason the risk of deterioration in the quality of treated wastewater caused by faulty probe and/or an erroneous measurement is minimized. During the simulation the changes in the concentration of N, P and NH4 in bioreactor and in the effluent from WWTP was observed. Data from the SCADA system feed the simulation software in the form of a mathematical model input files. The program deletes the oldest data set in order to the amount of data used in the simulation system were at the same level all the time. Calculations in the computer system PreviSys generate an output file of the implemented model. Information on the estimated concentrations of NH4 in the location corresponding to the position of the probe on a real object, i.e. The aeration chambers (object No. 17 in "Klimzowiec" WWTP) was transmitted to the control system (PLC) of aeration block in the biological bioreactor. The simulations run on the calibrated plant-layout model included scenarios that may influence the WWTP process operation and energy balance in the amount of DO concentration in the activated sludge reactor. Energy consumption is crucial in determining WWTP operating costs and energy balance for aeration systems. Computer simulations enabled to make biological treatment processes and estimate WWTP energy output for different aeration systems strategies. One of the main reasons that has limited the use of this approach has been the lack of proper tools to simulate the biological processes. Process optimization performed based on biological system physiology is the next level of system operations that are required to use innovative tools for minimize of existing facilities. In the study the computer simulation platform and proposed control system using virtual NH4 measuring tool model were found as useful tools for this purpose. REFERENCES Gujer, W. (2006). Activated sludge modelling: past, present and future. Wat. Sci. Tech., 53 (3), 111-119.
b) a)

SEWAGE MANAGEMENT AND WASTEWATER TREATMENT 161
Computer Simulation in Predicting Biochemical Processes and Energy Balance at WWTPs
J. Drewnowski*, E. Zaborowska* and C. Hernandez De Vega**
* Gdansk University of Technology, Faculty of Civil and Environmental Engineering, Narutowicza 11/12, 80-233 Gdansk, POLAND (E-mails: [email protected]; [email protected]) ** Polytechnic University of Valencia, School of Civil Engineering, Dept. of Hydraulic Engineering and Environment, Camino de Vera, s/n 46-022 Valencia, SPAIN (E-mail: [email protected])
INTRODUCTION Mathematical modeling becomes an integral part of the design and operation of water treatment systems, especially with activated sludge (AS) systems (Gujer, 2006). The use of mathematical models and computer simulation allow analysis of many different technological solutions in a short time and at low financial budget in order to simulate the scenario under typical conditions for the real system (Henze et al., 2002). The biochemical mathematical models called Activated Sludge Model (ASM) describe the conversion of organic compounds, phosphorous and nitrogen. More complex models (such as Mantis2) developed in last years integrate ASM with anaerobic digestion processes, precipitation and/or anammox. Computer simulation has become a helpful tool in analysis of wastewater treatment systems performance and effectiveness. Using advanced program it is possible to create a model of a real wastewater treatment plant (WWTP), run a simulation and subsequently interpret results under various conclusions. The laboratory tests and additional measurements/calculations should be carried out in order to better integrate computer model to the conditions prevailing in the local parameters of each individual parts of WWTP. In addition, the development of a computer models require a detailed analysis of the whole technological system and taking into account the specific variables to each modeled device/object. The proper estimation of these parameters in model has strong influence on the results of mathematical modeling and computer simulation. The aim of this study was to evaluate different concepts of the biochemical processes and energy balance modeling using a comprehensive models Mantis2. For this purpose, the sample layout of a WWTP was modeled in a computer program GPS-X 6.4 (Hydromantis, Canada). MATERIAL AND METHODS Extracting experimental data. The experimental part was carried out in order to present the process of model calibration and validation. Laboratory batch experiments with the process biomass and settled wastewater were carried out in a specially designed and constructed experimental set-up consisting of two parallel batch reactors (max. volume of 4.0 dm3), control system and computer. Batch test results obtained by Drewnowski and Makinia (2014) at a large (600,000 PE) BNR WWTP in Gdansk (Poland) provided the experimental database for comparison of the model predictions and additional 96-hour measurement campaign in the full-scale MUCT bioreactor at this plant presented earlier by Swinarski et al. (2012) was integrated to calibration/validation process. Organization of the modeling study procedure. The comprehensive model Mantis2 incorporates the most commonly observed biological, physical, and chemical processes in WWTPs. The model integrates carbon, nitrogen and phosphorus removal with anaerobic digestion process. The basic structure of the model is based among others ASM2d and UCTADM1 models. The computer simulations were carried out with the GPS-X ver. 6.4 simulation platform (Hydromantis, Canada).
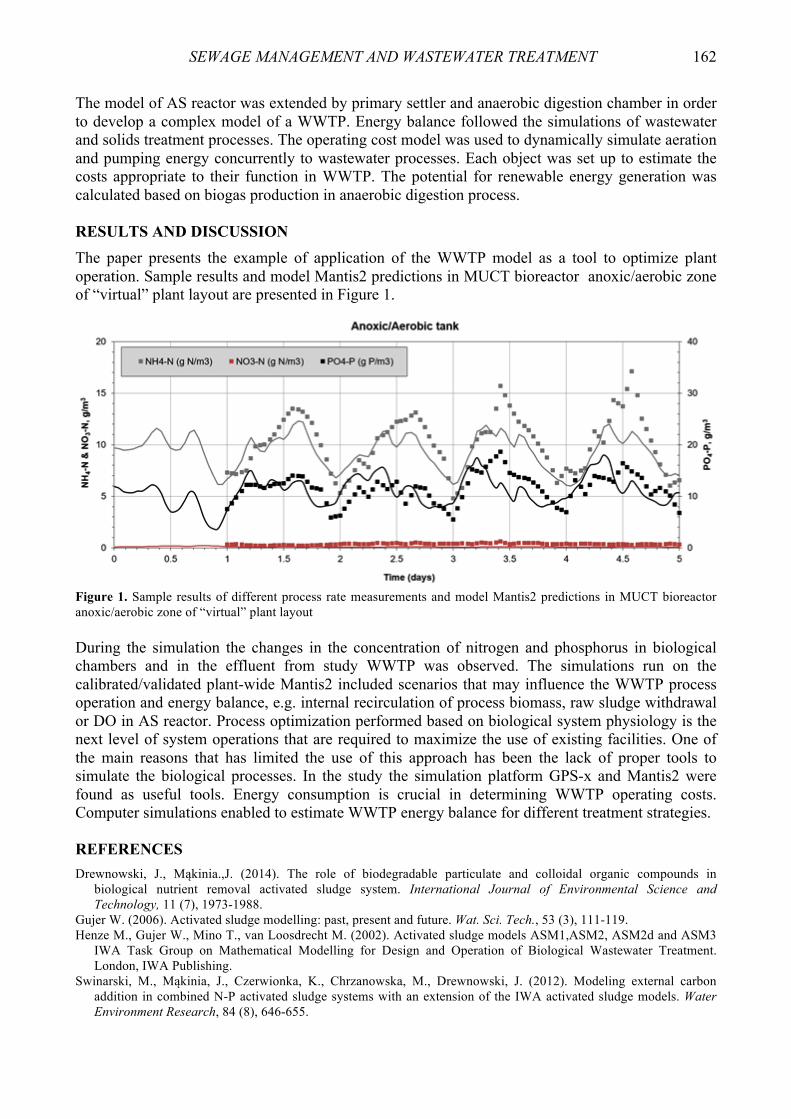
SEWAGE MANAGEMENT AND WASTEWATER TREATMENT 162
The model of AS reactor was extended by primary settler and anaerobic digestion chamber in order to develop a complex model of a WWTP. Energy balance followed the simulations of wastewater and solids treatment processes. The operating cost model was used to dynamically simulate aeration and pumping energy concurrently to wastewater processes. Each object was set up to estimate the costs appropriate to their function in WWTP. The potential for renewable energy generation was calculated based on biogas production in anaerobic digestion process. RESULTS AND DISCUSSION The paper presents the example of application of the WWTP model as a tool to optimize plant operation. Sample results and model Mantis2 predictions in MUCT bioreactor anoxic/aerobic zone of “virtual” plant layout are presented in Figure 1.
Figure 1. Sample results of different process rate measurements and model Mantis2 predictions in MUCT bioreactor anoxic/aerobic zone of “virtual” plant layout During the simulation the changes in the concentration of nitrogen and phosphorus in biological chambers and in the effluent from study WWTP was observed. The simulations run on the calibrated/validated plant-wide Mantis2 included scenarios that may influence the WWTP process operation and energy balance, e.g. internal recirculation of process biomass, raw sludge withdrawal or DO in AS reactor. Process optimization performed based on biological system physiology is the next level of system operations that are required to maximize the use of existing facilities. One of the main reasons that has limited the use of this approach has been the lack of proper tools to simulate the biological processes. In the study the simulation platform GPS-x and Mantis2 were found as useful tools. Energy consumption is crucial in determining WWTP operating costs. Computer simulations enabled to estimate WWTP energy balance for different treatment strategies. REFERENCES Drewnowski, J., Mąkinia.,J. (2014). The role of biodegradable particulate and colloidal organic compounds in
biological nutrient removal activated sludge system. International Journal of Environmental Science and Technology, 11 (7), 1973-1988.
Gujer W. (2006). Activated sludge modelling: past, present and future. Wat. Sci. Tech., 53 (3), 111-119. Henze M., Gujer W., Mino T., van Loosdrecht M. (2002). Activated sludge models ASM1,ASM2, ASM2d and ASM3
IWA Task Group on Mathematical Modelling for Design and Operation of Biological Wastewater Treatment. London, IWA Publishing.
Swinarski, M., Mąkinia, J., Czerwionka, K., Chrzanowska, M., Drewnowski, J. (2012). Modeling external carbon addition in combined N-P activated sludge systems with an extension of the IWA activated sludge models. Water Environment Research, 84 (8), 646-655.

SEWAGE MANAGEMENT AND WASTEWATER TREATMENT 163
Effect of Current Density on Suspended Solid Removal from Ceramic Industry Wastewater for Electrocoagulation with Iron Electrodes G. Emir and Y. Yavuz* * Department of Environmental Engineering, Anadolu University, 26555 Eskişehir, Türkiye (E-mails: [email protected]; [email protected])
INTRODUCTION Ceramic industry is an important industrial branch in Turkey. Large amount of wastewater generated during the production in ceramic industry. Ceramic industry wastewater (CIW) has substantial amount of solid matter as pollutant. Electrocoagulation is an advanced treatment method, which uses metal hydroxides for the wastewater treatment. In electrocoagulation method, metal hydroxides are occurred by the transition of electrical current on electrode material. These metal hydroxides decreases zeta potential in aquatic medium, and this situation increases the removal efficiency of colloidal and particular pollutants. There are satisfying practises for the electrocoagulation method on various wastewaters such as restaurant, textile, marble processing, tannery, semiconductor, etc. (Chen et al., 2000; Kobya et al., 2003; Solak et al., 2009; Feng et al., 2007; Hu et al., 2005). Generally iron and aluminum electrodes are used for the electrocoagulation method due to their cheapness, abundance and accessibility. MATERIALS AND METHODS In this work, wastewater taken from a ceramic factory, located in Bilecik province of Turkey, was treated by electrocoagulation in a monopolar-batch reactor with iron electrodes. 1, 2, 3, 4, 5, 10, 15, 20, 25, 30, 35, 40 mA/cm2 current densities were applied on electrodes that submerged in CIW for 2.5, 5 and 10 minutes. After electrocoagulation, settling operations for samples were performed for 1 hour. Suspended solid matter was analysed using gravimetric method according to SM 2540 D. Additionally, zeta potential was measured using Malvern Zetasizer Nano ZS instrument. RESULTS The results of suspended solids removal rate are illustrated in Figure 1. The obtained removal rates for the suspended solids parameter were between 96.4 - 99.9 %. Figure 2 gives the zeta potential value changes according to current density. All of the effluent wastewaters were in unstable zone as shown in Figure 2. Hence, there was no remarkable change between removal rates by varying current density. CONCLUSION According to the results obtained, electrocoagulation is very efficient for the treatment of CIW. More than 95 % suspended solid removal was reached for all current density values. As another conclusion, the effluent wastewater was appropriate for discharging to receiving water bodies according to Turkish Water Pollution Control Regulation.

SEWAGE MANAGEMENT AND WASTEWATER TREATMENT 164
Figure 1. Effect of current density on the suspended solid removal with reaction time 2.5, 5 and 10 minutes
Figure 2. Effect of current density on the zeta potential values REFERENCES Chen, X., Chen, G. and Yue, P.L. (2000). Separation of pollutants from restaurant wastewater by electrocoagulation.
Separation and Purification Technology, 19, 65-76. Feng, J., Sun. Y., Zheng, Z., Zhang, J., Li, S. and Tian, Y. (2007). Treatment of tannery wastewater by
electrocoagulation. Journal of Environmental Sciences, 19, 1409-1415. Hu, C.Y., Lo, S.L., Kuan W.H. and Lee, Y.D. (2005). Removal of fluoride from semiconductor wastewater by
electrocoagulation–flotation. Water Research, 39, 895-901. Kobya, M., Can, O.T. and Bayramoğlu, M. (2003). Treatment of textile wastewaters by electrocoagulation using iron
and aluminum electrodes. Journal of Hazardous Materials, B100, 163-178. Solak, M., Kılıç, M.,Yazıcı, H. and Şencan, A. (2009). Removal of suspended solids and turbidity from marble
processing wastewaters by electrocoagulation: Comparison of electrode materials and electrode connection systems. Journal of Hazardous Materials, 172, 345-352.
SEWAGE MANAGEMENT AND WASTEWATER TREATMENT 165
Selection of PHA Storing Biomass inder Aerobic Feast and Anoxic Famine Regime for Nitrogen Removal Via-Nitrite from Anaerobic Supernatant
N. Frison*, D. Cruthik*, C. Tayà** and F. Fatone*
* Department of Biotechnology, University of Verona, Strada Le Grazie 15, 37134, Verona, Italy (E-mail: [email protected]) ** BETA Tech. Center. University of Vic-Central University of Catalonia. Carrer de la Laura 13, 08500 Vic, Spain
INTRODUCTION Biopolymers as polyhydroxyalkanoates (PHAs) from waste activated sludge (WAS) are synthetized by a wide range of bacteria, which are part of the variety that exists in the wastewater treatment plants (WWTP). PHAs are the most versatile fully biodegradable polymers with properties similar to conventional plastics (Steinbüchel & Fuchtenbusch, 1998). In most cases, they are produced and accumulated under stressed conditions such as nitrogen, phosphorous or oxygen limitation with excess of carbon sources, accumulating the PHA in their cytoplasm as source of next available carbon. Nowadays, understanding how it could be the best integration of the PHA production in existing WWTP is the man challenge. Morgan-Sagastume et al. (2014) integrated the stage for PHA storing biomass selection with the biological treatment of the municipal wastewater, followed by a batch PHA accumulation obtaining up to 34 % gPHA/gVSS, using acetate as external carbon source. The goal of this work was to study the evolution of the microbial population that were selected for PHA production under aerobic-feast and anoxic-famine conditions. The scheme integrates the nitrogen removal via nitrite with the PHA biomass selection processes. The carbon source consisted of the sewage sludge liquid fermentation with Volatile Fatty Acids (VFA) and while sludge reject water as nitrogen and phosphorus nutrient source (Frison et al., 2015). RESEARCH & RESULTS The nitrogen removal via nitrite and the selection of PHA storing biomass downstream from the anaerobic digester were carried out by two alternative strategies (Table 1). The 1st strategy consisted on nitrogen removal via nit rite and the PHA selection in a single stage process occurred in a SBR (26 liters working volume) by applying a feast and famine regime. In the 2nd strategy, the nitritation occurred in a dedicated SBR while aerobic feast and anoxic famine occurred to accomplish denitritation driven by the stored PHA. In the selection reactor, the right COD/N ratio was adjusted by feeding the anaerobic supernatant as main source of nutrients (nitrogen and phosphorus). The operating conditions for each period of the selection reactor are reported in Figure 1. The 2nd strategy is advantageous compared to the 1st strategy, since it enhanced the nitrogen treatment capacity up to a vNLR of 0.53 ± 0.11 kgN/m3d and increased the YPHA/VFA from 0.31 ± 0.05 (Period 1 and 2) to 0.42 ± 0.04 gCODPHA/gCODVFA (Period 3). Table 1. Performance of configuration 1 & 2 for PHA biomass enrichment
Performance 1st Strategy 2nd Strategy Period 1 and Period 2* Period 3
-qVFA(mgCOD/gXa h) 122 ± 30 188 ± 14 qPHA(mgCOD/gXa h) 44 ± 5 89 ± 7
YPHA/VFA(gCODPHA/gCODVFA) 0.31± 0.05 0.42 ± 0.04 *Average between the periods 1 and 2;–qVFA: VFA uptake rate; qPHA: PHA accumulation rate; YPHA/VFA: storage PHA yield based on the VFA uptaken

SEWAGE MANAGEMENT AND WASTEWATER TREATMENT 166
Figure 1. Operating conditions for the ‘selection’ SBR that was applied for the examined configurations According with the results from the DGGE, FISH analyses were done in order to quantify the microorganisms of the main bacteria detected. Table 2 were reported the microbial distributions during the two configurations that were applied to enrich biomass able to accumulate PHA together with nitrogen removal. DGGE and FISH analyses pointed out the presence of a dominant and restricted bacterial population involves in the production of PHA and nitrite denitrification (Ottowia thioxidans, Azoarcus sp, Decholoromonas denitrificans). During configuration I and II the microorganisms which, can accumulate PHA, were enriched founding Thauera sp. the most abundant specie (52.4 % ± 15.6) followed by Azoarcus (15.6 % ± 7.8) and Paracoccus (6.7 % ± 3.2) in middle of configuration II. These results are in accordance with the DGGE results showing at the middle of configuration II around of 75 % of PHA well-known accumulating bacteria. Table 2. Taxonomic characterisation of the major bands cloned and sequenced from the DGGE profiles
Phylogenetic group Taxon Identity Metabolism involved Betaproteobacteria Azoarcus sp. 100% Anaerobic, N
2O-producing bacteria; PHB producer
Bacteroidetes - Flexibacteriaceae
Leadbetterella byssophila
96% Aerobic, PHA producing bacterium
Betaproteobacteria Dechloromonas denitrificans
98% Anaerobic, N2O-producing, PHA producing bacterium
Betaproteobacteria Ottowia thiooxidans 98% Facultative anaerobic, N2O-producing, PHA producing
bacterium Bacteroidetes - Sphingobacteria
Niabella sp. 95% Aerobic, PHA producing bacterium
Bacteroidetes - Flexibacteriaceae
Leadbetterella sp. 96% Aerobic, PHA producing bacterium
Firmicutes Planococcus sp. 99% Facultative anaerobic; Denitrifying, PHA producing bacterium
Betaproteobacteria Thauera terpenica 99% Anaerobic, Denitrifying, PHA producing bacterium Alphaproteobacteria Paracoccus
denitrificans 100% Facultative anaerobic Denitrifying, PHA producing
bacterium Betaproteobacteria Dechloromonas sp. 98% Anaerobic, PHA producing bacterium Betaproteobacteria Zoogloea sp. 99% Nitrogen-fixing, PHA producing bacterium
REFERENCES Frison, N, Katsou, E, Malamis, S, Oehmen, A, Fatone, F. (2015). Development of a Novel Process Integrating the
Treatment of Sludge Reject Water and the Production of Polyhydroxyalkanoates (PHAs). Env Sci Tech, 49(18), 10877-85.
Morgan-Sagastume, F., Valentino, F., Hjort, M., Cirne, D., Karabegovic, L., Gerardin, F., Johansson, P., Karlsson, A., Magnusson, P., Alexandersson, T., Bengtsson, S, Majone, M., Werker, A. (2014). Polyhydroxyalkanoate (PHA) production from sludge and municipal wastewater treatment. Water Science and Technology, 69, 177-184.
Steinbüchel, A, Fuchtenbusch, B. (1998). Bacteria and other biological systems for polyester production. TIBTECH, 16, 419-427.

SEWAGE MANAGEMENT AND WASTEWATER TREATMENT 167
Water and Sewage Sludge Co-digestion: Process Characteristics and Application Possibilities J. Górka and M. Cimochowicz-Rybicka* * Department of Environmental Engineering, University of Technology, 24 Warszawska, Cracow 31-155, Poland (E-mails: [email protected]; [email protected])
INTRODUCTION The anaerobic stabilisation of sewage sludge is established method of sewage sludge processing for medium and large wastewater treatment plants. However, the long fermentation time and low degree of digestion caused that in recent years, the researches focused on intensification of this process (Grosser et al., 2013; Cao, Pawłowski, 2012). Optimisation of fermentation process can obtain by disintegration and co-fermentation of sewage sludge with different wastes containing organic material. The aim of the researches was to determine the possibilities of using water sludge from water treatment plant as a co-substrate which increases the methanogenic potential of sewage sludge. Water sludge originates from the Dobczyce Water Treatment Plant and it is a product of the coagulation, ozonation and rinsing of filters on anthracite deposits. The chemical composition of the water sludge shows the advantage of ingredients such as: SiO2, Al2O3, Fe3O3, CaO, MgO and organic compounds. This sludge was stored on the sludge plot on September 2015 (Figures 1, 2). Then it was used in respirometric tests. Studies have shown that dry matter of material has about 33 % of the organic compounds, which may attest to the usefulness of this sludge to increase the biogas production.
Figure 1. Plot sludge in the water treatment plant Figure 2. The sludge structure MATERIALS AND METHODS The basis for energy researches have been a respirometric tests, which allow an analysis of the quantity and quality of fermentation gas (Cimochowicz-Rybicka, 2013). A respirometer can be used
SEWAGE MANAGEMENT AND WASTEWATER TREATMENT 168
for anaerobic processes to describe of biodegrability or activity by measuring a biogas production. The fermentation process of sludge was carried out in laboratory conditions on test bench, comprising:
• respirometer for anaerobic/aerobic tests (type AER-208, Challenge System); • water bath; • PC for automatic data collection; • heating and cooling device.
Assumed that the main parameter used to describe the influence of external conditions on the ability of sludge to producing fermentation gas will be the value of methanogenic activity. Methanogenic activity is determined by measuring of gas production from test samples with relation to volatile suspended solid (VSS) per time unit and expressed in g CODCH4/g VSS·d-1. Results for tested sludge (digested sludge) before and after the fermentation process is shown in Table 1. Table 1. Results for tested sludge (digested sludge) before and after the fermentation process
Before After Dry mass [gdm·dm-3] 9.02 Dry mass [gdm·dm-3] 7.03 VSS [gVSS·dm-3] 5.54 VSS [gVSS·dm-3] 4.11 pH [-] 7.48 pH [-] 7.40 Alkalaine [mgCaCO3· dm-3] 575 Alkalaine [mgCaCO3· dm-3] 925 COD [mgO2· dm-3] 3,111 COD [mgO2· dm-3] 1,067 CODfiltrate [mgO2· dm-3] 178 CODfiltrate [mgO2· dm-3] 54 CST [s] 343 CST [s] 463
RESULTS Performed preliminary studies the methanogenic co-fermentation. The table above contains an exemplary combination of results for the digested sludge before and after anaerobic process. Examined the digested and water sludge in the proportions: 2g VSS/1g VSS (2:1) and 1g VSS/1g VSS (1:1). Noticed that the capillary suction time for mixed sludge is lower than for digested sludge. After 22 days the methanogenic potential of 2:1 sample is at the level of 0.07 m3/kg VSSincoming and for the load of removed organic matter obtained 0.44 m3/kg VSSremoved. In turn, analyzing of 1:1 sample achieved 0.05 m3/kg VSSincoming and 0.34 m3/kg VSSremoved of biogas. Comparing the results with sample of digested sludge (0.05 m3/kg VSSincoming and 0.19 m3/kg VSSremoved) observed the increase of efficiency process. CONCLUSION The results showed that co-digestion of sewage sludge and water sludge increased a biogas production and thereby increased the energy potential of this poorly degradable sludge. According to Bień et al. (2010) the positive effect can be related to improvement of nutrients balance, increasing of the macro- and micronutrients compounds, improving the C/N quotient, increasing the level of biodegradable fraction, dilution of toxic compounds and increasing the buffer capacity of fermented sludge. REFERENCES Bień, J.B., Grosser, A., Neczaj, E. Worwąg, M., Celary, P. (2010). Co-digestion of sewage sludge and different organic
waste – review. Monogr. Pol. J. Environ. Stud., 2, 24-30. Cao, Y., Pawłowski A. (2012). Sewage sludge to energy approaches based on anaerobic digestion and pyrolysis: Brief
overview and energy efficiency assessment. Renewable and sustainable energy reviews, 16 (3), 1657-1665. Cimochowicz-Rybicka, M. (2013). Aktywność metanogenna osadów ściekowych poddanych beztlenowej stabilizacji z
zastosowaniem dezintegracji ultradźwiękowej, University of Technology in Cracow. Grosser, A., Worwąg, M., Neczaj, E., Grobelak, A. (2013). Półciągła kofermentacja osadów ściekowych i odpadów
tłuszczowych pochodzenia roślinnego. Annual Set The Environment Protection, 15, 2108-2125.

SEWAGE MANAGEMENT AND WASTEWATER TREATMENT 169
Ash from Gasification of Poultry Feathers to Remove Cd, Cu and Zn from Aqueous Solutions Z. M. Gusiatin*, S. W. Kasinski* and P. Kowal** * Faculty of Environmental Sciences, Department of Environmental Biotechnology, University of Warmia and Mazury in Olsztyn, Sloneczna St. 45G, 10-719 Olsztyn, Poland, (E-mail: [email protected]; [email protected]) ** Faculty of Civil and Environmental Engineering, Department of Civil Engineering, Gdansk University of Technology, Narutowicza St. 11/12, 80-233 Gdansk, Poland (E-mail: [email protected])
INTRODUCTION Cadmium, copper, and zinc are common pollutants found in industrial wastewaters and pose environmental problem due to their toxicity, persistence and non-biodegradability. The need for metal elimination from wastewater results from technological and legal aspects. Metals reduce the potential for biological wastewater treatment, as well as disrupt the biochemical stabilization of sewage sludge. In addition, tightening criteria of industrial waters and municipal wastewater quality require their treatment before their discharging into surface waters. Therefore, in recent years more and more high-efficient technologies are implemented to eliminate heavy metals from wastewater. High utility exhibits sorption process used prior to biological treatment of wastewater. Due to high efficiency, low cost and simplicity, sorption is more attractive than precipitation, coagulation, solvent extraction or reverse osmosis. Until now, a variety of sorbents have been tested for metal adsorption, such as activated carbon, zeolites, carbonates, phosphate rocks, and fly ashes from coal combustion (Sukpreabprom et al., 2015).
Recently, there is interest in management of poultry feathers due to their large quantities as a result of intensive development of poultry industry. The annual production of poultry feathers in Poland comes to 70 thousand tons (Kardaś et al., 2015). Although feathers belong to hard-to-utilise waste, they have energy potential. During gasification of feathers, syngas is the main product, whereas ash is by-product removed periodically. Annually from gasified 12,000 tons of turkey feathers there is produced about 1,000 tonnes of ash which requires disposal. Ash from gasified feathers could potentially replace activated carbons as a low cost adsorbent for contaminants. MATERIALS AND METHODS In this study, the possibility of using ash from gasification of turkey feathers to remove Cd, Cu, and Zn from aqueous solutions was investigated. The ash came from a real industry-scale plant located in Olsztyn, Poland, where feathers were gasified at 1,000-1,200 °C. The amount of feathers dispensed to gasifier was 1200 kg/h. The ash was ground in a RETSCH SM-100 cutting mill (0.5 mm). The sorption experiments were performed under batch conditions for single metals and their mixture. The initial metal concentrations were in range of 415-465 mg/L. Metal removal was investigated depending on ash dosage (0.3-33.3 g/L), agitation speed (50-200 rpm) and sorption time (0-120 min). Total metal concentrations were measured with a flame atomic absorption spectrometer (FAAS) (Varian, AA28OFS). Fourier transform infrared (FT-IR) spectroscopy was used to detect the presence of the functional groups in ash. The sample was scanned in the range from 3600 to 600 cm-1 using a FTIR spectroscope (Nicolet 6700, Thermo Scientific) equipped with Smart Multi-Bounce HATR™. Elemental composition of ash was analyzed using energy dispersive X-ray spectrometer (EDX) Quantax 200 with XFlash 4010 detector coupled with Scanning electron microscopy (SEM) (Zeiss, Leo 1430 VP).

SEWAGE MANAGEMENT AND WASTEWATER TREATMENT 170
RESULTS According to the SEM/EDX analysis (Figure 1), ash was mainly composed of Ca (41.6 %), P (7.7 %), Si (3.7 %) and S (3.3 %). Na, Mg, Al, K and Fe showed smaller quantities (0.8-1.5 %). The FTIR spectra of ash showed a strong peak at 1052 cm-1 indicating the presence of Si-O-Si bonds. The optimum dosage of ash to remove Cd, Cu and Zn from aqueous solutions containing single metal or their mixture was 6.7 g/L. Cd as single metal was effectively removed at ash dosage of 2 g/L, whereas at 6.7 g/L from metal mixture. Cu and Zn were effectively removed at dosage of 6.7 g/L. The lowest ash dosage (0.3 g/L) was ineffective, because the efficiency of single metal removal was on average 21.3 %, and 50.4 % for metal mixture. The agitation speed had no impact on the sorption of single metals and Cu in mixture. For Cd and Zn in mixture, metal removal should be performed at agitation speed higher than 50 rpm. At this speed, the efficiency of metal removal was below 10 %. The adsorption kinetics of all the three metals was rapid attaining the equilibrium within 10 min. The adsorption capacity at equilibrium (qe) was higher when metal occurred in aqueous solution as single elements than in mixture. The highest qe value was obtained for single Cd (40.6 mg/g) and the lowest for Cd and Zn in mixture (4.3 and 5.1 mg/g, respectively). Despite differences in qe, the process proceeded with comparable adsorption rate constant (Table 1).
2 4 6 8 10 12keV
0
5
10
15
20
25
30
35
40
45 cps/eV
O Si P C Mg S S
Ca Ca
Na Al K
K
Fe Fe
Figure 1. Elemental composition of ash by EDX
Table 1. Kinetic parameters of pseudo-second-order model for metal adsorbed onto ash
Kinetic parameter Cd Cu Zn
single mixture single mixture single mixture
Adsorption capacity (qe) [mg/g]
40.6 4.3 28.8 16.1 27.3 5.1
Adsorption rate constant (k) [g/mg·min]
0.06 0.05 0.05 0.06 0.06 0.06
REFERENCES Kardaś, D., Kluska, J., Szuszkiewicz, J., Szumowski, M. (2015). Experimental study of thermal pyrolysis of turkey
feathers. Technical Sciences, 18 (2), 115-124. Sukpreabprom, H., Arqueropanyo, O., Naksata, W., Sooksamiti, P., Janhom, S. (2015). Single and binary adsorption of
Cd (II) and Zn (II) ions from aqueous solutions onto bottom ash. Korean Journal of Chemical Engineering, 32 (5), 896-902.
SEWAGE MANAGEMENT AND WASTEWATER TREATMENT 171
Lead (Pb) Inhibition of Anammox Biomass After Short-Term Exposure – Batch Experiments P. Gutwiński, G. Cema and J. Surmacz-Górska* * Silesian University of Technology in Gliwice, Environmental Biotechnology Department, Akademicka 2, 44-100 Gliwice, Poland (E-mail: [email protected])
INTRODUCTION Anaerobic ammonium oxidising process is a novel tool for nitrogen-rich wastewater streams. Nevertheless, that it was proved that high concentration of heavy metals may develop and adverse effects in biological treatment, only few researchers focused on influence of these inhibitors on the Anammox process (Lotti et al., 2012; Yang et al., 2012; Bi et al., 2014; Zhang et al., 2016). Several studies showed that heavy metals can improve Anammox bacteria activity as well as cause a negative deterioration in Anammox reaction efficiency. For example, Chen et al. (2014) showed that SAA (specific anammox activity) was enhanced by 41% when the concentration of copper was below 1 mg L-1 while it was improved by almost 64% at Ni2+ concentration below 1.74 mg L-1. Bi et al. (2014) calculated IC50 for Cd, Ag, Hg as follows: 11.16, 11.52 and 60.35 mg L-1. They also showed that Pb cause only 7.19 % decrease of nitrogen removal at a dose of 40 mg L-1. Many wastewaters especially from industries such as municipal landfill leachates, digested piggery, production of fertilizers, medical wastewaters, metal-plating facilities, and mining factories have been found reach in heavy metals (Karri et al., 2006; Altas, 2009). However, several papers have focused on the influence of certain heavy metals on the Anammox process, the general knowledge about this influence is still very poor. This study investigated the inhibitory effect of lead (Pb) on Anammox biomass in batch test experiments. The IC50 was not reached. Lead at concentration of 10 mg L-1 because only 16.2 % drop of anammox activity. MATERIALS AND METHODS The Anammox sludge originated from a lab-scale partial nitrification/Anammox SBR working on Waste Water Treatment Plant in Gliwice where the Anammox organisms presence where confirmed by FISH analysis. The reactor was feeded with real reject water. Batch test procedure
These tests were performed to determine the effect of different concentrations of lead on SAA (specific anammox activity) of Anammox bacteria. The tests were carried out in 1 L hermetic bioreactors containing 998 mL of biomass, feeding medium (solution of NO2-N), and Pb solution in different concentrations. The pH was in all test adjusted to the same value 7.2. As inhibitor PbCl2 was used. The heave metal concentration range was in range of 0-10 mg L-1. Reactors with sludge were tightly sealed and degassed with pure N2 to remove oxygen. Then NO2-N and Pb solution were added. Reactors were placed on magnetic stirrer. Experiments were carried out in thermostatic cabinet in 28 ºC to eliminate the influence of the temperature.

SEWAGE MANAGEMENT AND WASTEWATER TREATMENT 172
Evaluation of kinetic parameters The values of SAA was calculated from the equation:
,VSSh24
V)СС()dkg
gN(SAA TNeff.TNin
VSS ⋅
⋅−= (1)
where CTNin and CTNeff – the total nitrogen concentration, mg L-1; V – the volume of the reactor. The kinetic parameters were evaluated using linear transformation of Michaelis-Menten equation as follows:
,ST1
S1
STK
ST1
maxmax
+= (2)
where K – the inhibition constant; ST – a toxicity level in respect of control sample and S – substrate concentration.
RESULTS The test did not show serious inhibitory effect (Figure 1a). The maximum ST was 16 % at Pb concentration of 10 mgL-1. At that concentration SAA dropped downy by 48.5 gN/kgsmo·d. At doses lower that 5 mgL-1 the ST was very close to each other at the range of 3.43-8.5 %. Since the inhibitory effect was generally less than 50 % and IC50 values could not be obtain. The kinetic parameters were calculated according to linear model for of Michaelis-Menten equation (Figure 1b). Despite the experimental results are quite different than theoretically calculated values of STmax the theoretical STmax may be expected at value 11.8 % and the K is expected at the value 1.36.
Figure 1. Inhibitory concentrations and kinetic parameters according to linear model for of Michaelis-Menten Eq. REFERENCES Altas, L. (2009). Inhibitory effect of heavy metals on methane-producing anaerobic granular sludge. J. Hazard. Mater.,
162, 1551-1556. Bi, Z., Qiao, S., Zhou, J., Tang, X., Cheng, Y. (2014). Inhibition and recovery of Anammox biomass subjected to short-
term exposure of Cd, Ag, Hg and Pb. Chemical Engineering Journal, 244, 89-96. Chen, H., Yu, J., Jia, X., Jin, R., (2014). Enhancement of anammox performance by Cu (II), Ni(II) and Fe(III)
supplementation. Chemosphere, 117, 610-616. Karri, S., Sierra-Alvarez, R., Field, J.A., (2006). Toxicity of copper to acetoclastic and hydrogenotrophic activities of
methanogens and sulfate reducers in anaerobic sludge. Chemosphere, 62, 121-127. Lotti, T., Cordola, M., Kleerebezem, R., Caffaz, S., Lubello, C., van Loosdrecht, M.C. (2012). Inhibition effect of swine
wastewater heavy metals and antibiotics on Anammox activity. Water Science and Technology, 66, 1519-1526. Yang, G.F., Jin, R.C. (2012). The joint inhibitory effects of phenol, copper(II), oxytetracycline (OTC) and sulfide on
Anammox activity. Bioresource Technology, 26, 187-192. Zhang, Z., Zhang, Q., Xu, J., Deg, R., Ji, Z., Wu, Y., Jin, R. (2016). Evaluation of the inhibitory effects of heavy metals
on anammox activity: A batch test study. Bioresource Technology, 200, 208-216.
a) b)
SEWAGE MANAGEMENT AND WASTEWATER TREATMENT 173
Using On-line Measurement by Electronic Nose and Computer Simulations for Real-time Control at WWTP
Ł. Guz*, J. Drewnowski**, G. Łagód*, A. Piotrowicz*, Z. Suchorab* and K. Jaromin-Gleń***
* Lublin University of Technology, Faculty of Environmental Engineering, Nadbystrzycka Str. 40B, Lublin 20-618, Poland (E-mail: [email protected]) ** Gdansk University of Technology, Faculty of Civil and Environmental Engineering, Narutowicza Str. 11/12, 80-233 Gdansk, Poland (E-mail: [email protected]) *** Institute of Agrophysics, Polish Academy of Sciences, Doswiadczalna Str. 4., Lublin 20-290, Poland (E-mail: [email protected])
INTRODUCTION Parameters of raw wastewater entering into WWTP can vary depending on the time of the day, season of year and as a result of accidental or deliberate discharge of hazardous chemicals to sewerage system. It requires the follow-up adjustment of the operational mode of facilities at WWTP and proper modification of the treatment process, especially in the biological part. Heretofore, there are known manners and instruments for investigation of wastewater quality and for the control of treatment process that operate on the basis of the direct measurement of wastewater parameters such as chemical oxygen demand (COD), biochemical oxygen demand (BOD), total organic carbon (TOC), total suspended solids (TSS), oxygen uptake rate (OUR), level of phosphorus and nitrogen compounds. However one of the major inconveniences of the most of the methods and measuring devices used so far is either the lack of option of on-line measurement or a high cost of such measurements. Additional challenge can be the aggressive character of wastewater against the submerged sensors. The aim of this study was to evaluate concepts of on-line measurement by electronic nose and computer simulations for real-time control biological treatment processes at WWTP. The e-nose test results and additional COD, N, P, TSS measurements obtained at SBR bioreactor in laboratory condition presented earlier by Guz et al. (2015a) and BNR plant (65 000 m3/d) in Lublin (Poland), provided the experimental database for comparison of the wastewater characteristics and model predictions at large WWTPs. MATERIAL AND METHODS Extracting experimental data and modeling study. E-nose device applied within the experiment constitutes the array of semiconductor resistance gas sensors, MOS type which were successfully applied in wastewater parameters evaluation (Capelli et al., 2008; Guz et al., 2015a,). Analysis of the results and the estimation of wastewater parameters can be done by the principal component analysis (PCA) method and the application of artificial neural networks (ANN) (Fu et al., 2012; Srivastava, 2003). The analysis results were treated as input data for mathematical modeling and computer simulations. The modeling study was carried out with the GPS-X simulation platform (Hydromantis, Canada). Analytical methods. Total and volatile suspended solids were measured by the gravimetric method according to the Polish Standards (PN-72/C-04559). The total or soluble COD, PO4-P, NO3-N and NH4-N were analyzed using a HACH DR2800 spectrophotometer (Hach-Lange GmbH, Germany). Analysis was based on the methodology developed by HACH-Lange appearing with cuvette and tip tests.
SEWAGE MANAGEMENT AND WASTEWATER TREATMENT 174
RESULTS AND DISCUSSION Continuous investigation of wastewater quality can be carried out by a device called an e-nose. One important feature of the proposed real-time control system for WWTP is that using on-line measurements by e-nose together (Figure 1) with technological sets picked on this basis by means of computer models, it is possible to change treatment process parameters, depending on the current quality of wastewater. It can be used for the measurements of wastewater headspace air in the measuring chamber. As the studies showed (Guz et al., 2015a), it can be possible to apply the method mentioned to estimate with high accuracy the values of wastewater parameters. The best correlation and narrow confidence interval was obtained for COD. Also good correlation was achieved for measurement of TSS, turbidity, and nitrogen compounds. Nonetheless, due to the fact that these parameters cannot be measured by e-nose directly, it should be treated as an additional measuring instrument for rapid on-line estimation of wastewater parameters as well as the device enabling early detection of non-standard states. In this case, both widely varying concentration of typical pollutants and the appearance of potentially deleterious substances that can trigger the breakdown of biological wastewater treatment (e.g. petroleum derivatives, pesticides, etc.) can be considered. Wastewater parameters estimation algorithm by means of e-nose should be also re-calibrated by cyclically carried out standard measurements of wastewater quality parameters (Guz et al., 2015b).
Figure 1. Projection of e-nose panel with dismounted front cover Figure 1 presents the front cover of the applied e-nose that consists of sensors array and the LCD display with touch panel. The proposed system enables continuous and relatively low cost monitoring of the quality of treated wastewater in many points of WWTP and can generate alarm signals in the event of considerable variations in wastewater quality caused for example by the inflow of toxic chemicals dangerous for the course of the process or the occurrence of treatment disturbances. Wastewater parameters measured on-line in strategic key points of plant can be used for modeling and computer simulations of WWTP for the given optimal operational conditions. Moreover, gas sensors placed above upper surface of wastewater are not submerged in aggressive environment, so that, it can be assumed that the proposed system should be more durable in comparison with the application of the submerged sensors. REFERENCES Capelli, L., Sironi, S., Centola, P., Rosso, R.D., Grande, M.I. (2008). Electronic Noses for the Continuous Monitoring
of Odours from a Wastewater Treatment Plant at Specific Receptors: Focus on Training Methods. Sensors and Actuators, B 131 (3): 53–62. DOI:10.1016/j.snb.2007.12.004.
Guz, Ł., Łagód, G., Jaromin-Gleń, K., Suchorab, Z., Sobczuk, H., Bieganowski, A. (2015a). Application of gas sensor arrays in assessment of wastewater purification effects. Sensors, 15, 1 - 21. DOI: 10.3390/s150100001.
Guz, Ł., Połednik, B., Łagód, G. (2015b). Patent application of Polish Patent Office No. P.414273 “Method and system of wastewater treatment process control”.
Guz, Ł., Łagód, G., Jaromin-Glen, K., Guz, E., Sobczuk, H. (2016). Assessment of batch bioreactor odour nuisance using an e-nose. Desalination and Water Treatment, 57, 1327-1335.
Jun, F., Huang, C., Xing, J., Zheng, J. (2012). Pattern classification using an olfactory model with PCA feature selection in electronic noses: study and application. Sensors, 12 (3), 2818-30.
Srivastava, A.K. (2003). Detection of volatile organic compounds (VOCs) using SnO2 gas-sensor array and artificial neural network. Sensors and Actuators, B 96 (1-2), 24-37.

SEWAGE MANAGEMENT AND WASTEWATER TREATMENT 175
Interplay of Laboratory Analyses and Full Scale Operation Data using the Example of Trouble Shooting of Sludge Digestion Behavior J. Heinrichmeier* and D. Shatunova** * WTE Wassertechnik GmbH, Ruhrallee 185, 45136 Essen, Germany (E-mail: [email protected]) ** WTE-Emek Consortium, Yeni Lefkosa Atiksu Aritma Tesisi, TR 99010, Haspolat-Lefkosa (E-mail: [email protected])
INTRODUCTION While the start-up procedure of new build wastewater treatment plants or their process steps the stakeholders are consistently faced with previously not existing and unknown mass flows quantities and qualities. The available bibliographical references are usually based on full scale experience under non-critical and therefore comparable surrounding conditions. The source of worse operation results can either originate from the new plant equipment or abnormal mass flows. PROBLEM Using the example of an anaerobic sludge stabilisation plant (2 x 3,050 m³ digestion volume) the sourcing of the comparatively low organic degradation rate <30% was done and its influence on the subsequent plant equipment for sludge dewatering and gas utilisation was reproduced. The usability of the full scale plant implementation has to be clarified. For this purpose, relevant laboratory analyses must be modified to be similar to full scale conditions. PROCEDURES A first detailed operation data evaluation of temperature- and organic substrate fluctuations or other indicators of capacity overload like volatile fatty acids and methane concentration did not indicate negative effects on the operation. The homogeneity of the digester was tested. On the basis of DIN 38-414 (1985) the specific gas production was used to estimate the mixing and retention time behaviour of the digesters. The test was modified by using directly the digested sludge as well as the seed-to-feed ration of the full scale plant. In the following test the internal seed sludge was replaced with a normal-behaving material and variations in the seed-to-feed ratio where evaluated. The tests were completed by additional tests on different feed pre-treatment methods to upgrade the biogas production rate. These methods to pre-treat the excess sludge of the full scale wastewater treatment plant were thermal hydrolyses, enzymatic addition and ultra-sonic disintegration. To characterize the dewaterability of the digested sludge thermogravimetric analyses (TGA) were performed on basis of the method of Kopp (2001). RESULTS Under the idealised laboratory conditions (batch-tests, homogeneous substrate) the full scale rates of substrate degradation and gas production were confirmed. Different seed sources as well as the variations in the seed-to-feed ratio showed that the origin of the abnormal low volatile solids degradation is within the feed substrate. Only the test settings with thermal hydrolysed feed pre-treatment showed a gas development close to the expected reactions of first order kinetics. The addition of a higher sludge feed amount did not result in a higher gas production. These results can

SEWAGE MANAGEMENT AND WASTEWATER TREATMENT 176
be used to interpret the full scale behaviour of ongoing gas production even if feeding is stopped longer 5 days. Also the constant operation results in case of different temperature levels or digester operation in parallel or serial mode can be explanted by these laboratory findings. Additional steps to upgrade the excess sludge feed substrate quality showed economical inefficiency. The operation results of the dewatering centrifuges were inside the forecasted range of the TGA analyses. The full scale dewatered sludge solids concentration is at the possible limit. CONCLUTIONS The interplay of laboratory investigations and operation data help identifying the cause of atypical operation results. For this purpose modified test measurements as well as data evaluation can be necessary. In the presented example the feed material itself was identified as the resource of the atypical low volatile solids and COD degradation rate, gas production and dewatered sludge solids concentration. The additional substrate treatment was shown not to be sufficient to overcome the observed difficulties. To improve the full scale operation efficiency, the origin of the feed sludge have to be addressed to identify the possible resource of the low biogas production. REFERENCES DIN 38-414. (1985). Teil 8 - Schlamm und Sedimente - Bestimmung des Faulverhaltens. Berlin: Deutsches Institut für
Normung. Kopp, D.-I. J. (2001). Wasseranteile in Klärschlammsuspensionen - Messmethode und Praxisrelevanz. Braunschweig:
Technische Universität Braunschweig.

SEWAGE MANAGEMENT AND WASTEWATER TREATMENT 177
The ability of Arthrobacter viscosus in the Removal of Pb(II) from Aqueous Solutions R.M. Hlihor*, H. Figueiredo**, M. Rosca*, T. Tavares** and M. Gavrilescu*, *** * “Gheorghe Asachi” Technical University of Iasi, Faculty of Chemical Engineering and Environmental Protection, Department of Environmental Engineering and Management, 73 D. Mangeron Street, 700050, Iasi, Romania (E-mails: [email protected]; [email protected]; [email protected]) ** IBB-Institute for Biotechnology and Bioengineering, Centre of Biological Engineering, University of Minho, Campus de Gualtar, 4710-057 Braga, Portugal *** Academy of Romanian Scientists, 54 Splaiul Independentei, RO-050094 Bucharest, Romania
INTRODUCTION The adverse effects of heavy metals discharge in wastewaters due to rapid industrialization are not only known for the potential human health hazards, but also for potential environmental hazards. Although the lead pollution from mining activities presents a relatively localized problem, its magnitude is significant, and particularly on the water pollution because it is compounded by the occurrence of other heavy metals (Hlihor et al., 2014, 2015). Hence, the objective of this study was to investigate the ability of dead bacterial cells of Arthrobacter viscosus under different conditions in order to assess the effect of some factors on Pb(II) removal from aqueous solutions, such as: pH of the initial solution, 3-7; biomass dosage, 1-8 g/L; contact time, up to 24 h; initial concentration of metal in solution, 25 - 500 mg/L Pb(II); temperature, 26-50 oC. The biosorption data were analyzed through kinetic and isotherm modeling. Moreover, FT-IR spectral analysis was also employed, in order to understand the mechanism of Pb(II)-bacterial biomass interaction. MATERIALS AND METHODS The Arthrobacter viscosus bacterium strain (CECT 908) was obtained from the Spanish Type Culture Collection of the University of Valência. For the growth of the microorganism, a medium as indicated by Quintelas et al. (2009) was used; the pH of the medium was adjusted to 7 with conc. NaOH, sterilized at 120 ºC for 20 min., inoculated with bacteria and kept at 28 ºC and 150 rpm for 72 h. A. viscosus was deactivated by drying in an oven at 55 oC for 72 h. The dried biomass of A. viscosus was crushed and sieved to 125-250 µm particle size and stored in a desiccator. The removal of Pb(II) by dead biomass of A. viscosus was examined by measuring the concentration of heavy metal in a batch system at selected pH values (3-7), for various contact times (up to 24 h) or initial concentrations (25 - 500 mg/L) and biomass dosages (1 to 8 g/L). Erlenmeyer flasks of 250 mL were used for batch experiments, with 100 mL of working volume containing Pb(II) solution of known concentrations together with biomass. The flasks were agitated in an orbital incubator at 150 rpm. RESULTS AND DISCUSSION Effect of contact time on Pb(II) removal Figure 1 shows the effect of contact time on the biosorption of Pb(II) ions by dead biomass of A. viscosus. The initial stage of biosorption is very rapid, lead(II) uptake increases with rise in contact time up to 10 - 20 min. The equilibrium is reached after this first stage and is kept almost constant until 120 min. Lead(II) samples were also taken in the time interval 120 min up to 1440 min, but because the data followed the same behavior were not shown on the graph. Maximum uptake capacity was attained as: 9.62 mg/g for 25 mg/L Pb(II), 21.9 mg/g for 50 mg/L Pb(II), and

SEWAGE MANAGEMENT AND WASTEWATER TREATMENT 178
47.6 mg/g for 100 mg/L Pb(II), with a biosorption efficiency of 100 % for 25 mg/L and 50 mg/L Pb(II) and 97% for 100 mg/L Pb(II).
0 10 20 30 40 50 60 70 80 90 100 110 120 1300
5
10
15
20
25
30
35
40
45
50
q e(mg/
g)
Time (min)
25 mg/L 50 mg/L 100 mg/L
Figure 1. Effect of contact time on Pb(II) biosorption by dead A. viscosus for various concentrations (pH 4; biomass concentration: 2 g/L; temperature: 26 oC; contact time: 2 h) Sorption kinetics In order to clarify the adsorption kinetics of Pb(II) removal by dead A. viscosus biomass, kinetic models were applied to the experimental data. The pseudo-second-order kinetic model Type 1 (Ho model) with high values of correlation coefficient (R2 > 0.99) showed good agreement with the experimental values at all studied concentrations. CONCLUSIONS Dead A. viscosus biomass employed in batch experiments proved to be a promising biosorbent for the removal of Pb(II) from aqueous solutions. We have selected optimum working conditions at pH 4.2 g/L biomass dosage, contact time, 24 h and 26 °C. The maximum Pb(II) biosorption occurred at 26 °C and decreased with an increase in temperature up to 50 °C, suggesting the exothermic nature of Pb(II) biosorption process. The maximum biosorption capacity of dead A. viscosus resulted from Langmuir model was found to be 124.68 mg/g for Pb(II) ion. Our results demonstrated that A. viscosus biomass is an attractive option for Pb(II) removal from aqueous solutions. ACKNOWLEDGEMENTS This paper was elaborated with the support of BRAIN project Doctoral scholarships as an investment in intelligence - ID 6681, financed by the European Social Found and Romanian Government and with the support of a grant of the Romanian National Authority for Scientific Research, CNCS – UEFISCDI, project number PN-II-ID-PCE-2011-3-0559”, Contract 265/2011. H. Figueiredo is thankful to “FCT – Fundação para a Ciência e Tecnologia” for the financial support through the concession of PhD grant SFRH/BD/28201/2006. REFERENCES Hlihor, R.M., Bulgariu, L., Sobariu, D.L., Diaconu, M., Tavares, T., Gavrilescu, M. (2014). Recent advances in
biosorption of heavy metals: Support tools for biosorption equilibrium, kinetics and mechanism. Rev. Roum. Chim., 59, 527-538.
Hlihor, R.M., Diaconu, M., Leon, F., Curteanu, S., Tavares, T., Gavrilescu, M. (2015). Experimental analysis and mathematical prediction of Cd(II) removal by biosorption using support vector machines and genetic algorithms. New Biotech., 32, 358-368.
Quintelas, C., Fonseca, B., Silva, B., Figueiredo, H., Tavares, T. (2009). Treatment of chromium(VI) solutions in a pilot-scale bioreactor through a biofilm of Arthrobacter viscosus supported on GAC. Bioresour. Technol., 100, 220-226.

SEWAGE MANAGEMENT AND WASTEWATER TREATMENT 179
Effect Analysis of Adaptation Measures in a Metropolitan Wastewater System to Deal with Future Challenges H. Hürter*, T.G. Schmitt*, M. Schütze**, J. Alex**, M. Riechel***, M. Stapf***, P. Uwe Thamsen****, S. Gerlach****, R. Louisa Mitchell****, J. Waschnewski*****, M. Gunkel***** and E. Pawlowski-Reusing***** * Institute of Urban Water Management, University of Kaiserslautern, Paul-Ehrlich-Str. 14, D-67663 Kaiserslautern, Germany (E-mail: [email protected]) ** Department Water and Energy, Werner-Heisenberg-Str. 1, D-39106 Magdeburg, Germany *** Kompetenzzentrum Wasser Berlin, Cicerostr. 24, 10709 Berlin, Germany **** Technische Universität Berlin, Straße des 17. Juni 135, 10623 Berlin, Germany ***** Berliner Wasserbetriebe, Neue Jüdenstraße 1, 10179 Berlin, Germany
INTRODUCTION Future challenges, such as, population developments, increasing space requirement and climate change lead to a need for adaptations in all parts of the wastewater system (surface, sewer system, pumping system, WWTP). The required system adaptation has to be performed by the implementation of various single measures to deal with negative conditions during heavy rainfall and extended dry weather periods (e.g. flooding, CSO, sewer deposits, pump clogging). An integral adaptation strategy consists of an intelligent combination of individual measures to maximize positive effects and prevent negative mutual interactions. The focus of this paper is the pre-analysis of single measure effects as a preparation for the measure combination. The study area is a large urban catchment in the city of Berlin. MATERIAL AND METHODS Study Area The study area is the CSS catchment of the pumping station “Wilmersdorf”, draining the stormwater of a connected area of 1,542 ha and the wastewater of about 265,000 Berlin residents. A high resolution 1D-sewage-system model (InfoWorks CS) and a high resolution digital terrain model (DTM) are available. The WWTP “Ruhleben” (population equivalent of 1,200,000 inhabitants), to which the catchment “Wilmersdorf” is connected, has been modelled in SIMBA#. Methodical approach The methodical approach consists of (1) a scenario generation (2) a specification of evaluation indicators (3) a weak-point analysis under different future scenarios and (4) the modelling, the simulation and the evaluation of single adaptation measures. After the determination of feasibility, effects and mutual influences of the individual measures, effect-oriented measure combinations will be derived, modelled and evaluated. Scenario generation To take consideration of actual and future challenges, four scenarios have been generated to indicate the actual and three possible future situations concerning rainfall patterns, population (number, distribution, specific water consumption) and the urban land use.

SEWAGE MANAGEMENT AND WASTEWATER TREATMENT 180
Specification of evaluation indicators To quantify future scenario impacts and measure effects, indicators have been specified to evaluate effects concerning ambient water quality, sewer deposits, flooding and the operational reliability. Weak-point analysis A weak-point analysis has been carried out to localize focal areas concerning flooding, CSO, sewer deposits etc. as a basis for measure conception. Adaptation measures About 30 measures in the different system parts are investigated within the study. The investigation consists of an estimation of the implementation potential, the modelling and simulation of the measure and the evaluation of the effects of the measure compared to the status quo results. A selection of measures is shown in Figure 1.
Figure 1. Overview of adaptation measures RESULTS AND DISCUSSION The scenario generation and simulation as well as the specification of evaluation indicators have been completed. A high number of individual measures have been investigated as well. First results show for example a reduction of simulated CSO-volume by 9% when applying the roof-greening scenario on status quo. The measure “swale infiltration” causes a reduction by 36% while the combination of both measures lead to a 41 % reduction. The paper will present the specified evaluation indicators and the results of the scenario and the weak-point analysis. As it is the focus of this paper, the results of the single measure analysis will be shown in detail. Additionally a prospect on the methodology of the combination of measures will be given. REFERENCES Borris, M., Viklander, M., Gustafsson, A., Marsalek, J. (2013). Simulating future trends in urban stormwater quality for
changing climate, urban land use and environmental controls. 8th International Conference Novatech, 23-27 June 2013, Lyon, France.
Hürter, H., Riechel, M., Schütze, M., Waschnewski, J., Schmitt, T.G., Stapf, M., Philippon, V., Pawlowsky, E. (2015). Integrated modelling and evaluation of adaptation measures in a metropolitan wastewater system. Proceedings of the 10th Urban Drainage Modelling Conference, 21.-23 September 2015, Quebec, Canada.
SEWAGE MANAGEMENT AND WASTEWATER TREATMENT 181
Removal of Lead from Simulated Wastewater Using Combination of Electrocoagulation and Adsorption Technique F. Hussin*, M.K. Aroua* and M. Szlachta** * Department of Chemical Engineering, University of Malaya, 50603 Kuala Lumpur, Malaysia (E-mails: [email protected]; [email protected]) ** Faculty of Environmental Engineering, Wrocław University of Technology, Wyb. S. Wyspiańskiego 27, 50-370 Wrocław, Poland (E-mail: [email protected])
INTRODUCTION The excessive discharge of lead into the water might have a severe impact on all aquatic organisms and thus, it is a great environmental concern. A combined electrocoagulation and adsorption process was applied to remove lead from simulated wastewater, because these methods are recognized as efficient, simple and cost-effective. To compare the efficiency of electrocoagulation, adsorption and the combination of these two methods, experiments were carried out with initial concentration, current density, adsorbent dose and contact time fixed at 30 mg/L, 8.3 mA/cm2, 2.0 g and 60 minutes, respectively. The results showed that combined electrocoagulation-adsorption process was highly effective in removing lead from aqueous solution (removal up to 98 %) compared to other methods. In the second stage of the study, the electrocoagulation-adsorption process was applied to remove lead from aqueous solution and the effect of initial concentration, current density, treatment time, adsorbent dose and the energy consumption on the process efficiency was examined. The optimal conditions were achieved at 5 mg/L, current density of 16.6 mA/cm2, 4.0 g adsorbent dose and 15 minutes of treatment time. The highest removal efficiency was 99.5 % using the combined method. Lead (Pb) is one of the most toxic heavy metals. Based on statistics published by the Agency for Toxic Substances and Disease Registry (ATSDR), lead is ranked as the second substance on the list of prioritised hazardous substances (ATSDR, 2014). In this study, a special attention was given to the electrocoagulation process, as it is highly energy effective and cost-effective as well as can be easily combined with other technologies without addition of other chemical reagents. Additionally, adsorption process was investigated due to its known high efficiency, low costs and the absence of unwanted by-products. Malaysia is currently the world’s second largest crude palm oil producer after Indonesia. About 4.6 million tons of oil palm shells are produced annually and it is expected that around 5 million hectares of palm oil trees will be planted in Malaysia by year 2020 (Yew, 2014). As a consequence, a large amount of palm oil waste is generated. Therefore, the focus of this work was to evaluate the performance of the combined electrocoagulation-adsorption method in lead removal from aqueous solution using the oil palm shell activated carbon (OPSAC). The influence of various operating parameters on the process efficiency was also examined. MATERIALS AND METHODS Adsorption (AD) experiment was carried out for 60 minutes using 2.0 g - 4.0 g of granular oil palm shell activated carbon (OPSAC) as adsorbent. Electrocoagulation experiment (EC) was conducted using perforated zinc electrode cut into dimensions of 10 cm x 10 cm x 1.5 cm with 0.5 cm holes diameter. The electrodes were arranged according to bipolar system with 0.5 cm distance between them. Constant current was maintained by connecting the electrode materials to the positive and negative poles of the programmable direct current (DC) stabilised power supply (GPR16H50D).
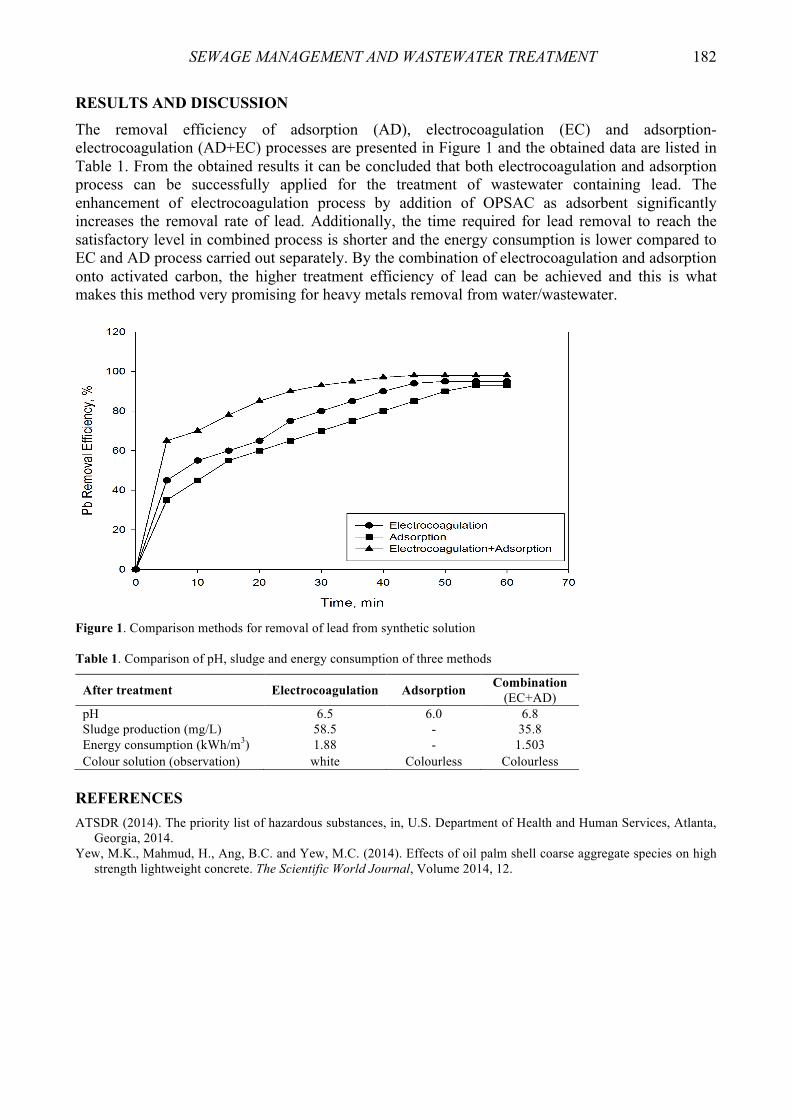
SEWAGE MANAGEMENT AND WASTEWATER TREATMENT 182
RESULTS AND DISCUSSION
The removal efficiency of adsorption (AD), electrocoagulation (EC) and adsorption-electrocoagulation (AD+EC) processes are presented in Figure 1 and the obtained data are listed in Table 1. From the obtained results it can be concluded that both electrocoagulation and adsorption process can be successfully applied for the treatment of wastewater containing lead. The enhancement of electrocoagulation process by addition of OPSAC as adsorbent significantly increases the removal rate of lead. Additionally, the time required for lead removal to reach the satisfactory level in combined process is shorter and the energy consumption is lower compared to EC and AD process carried out separately. By the combination of electrocoagulation and adsorption onto activated carbon, the higher treatment efficiency of lead can be achieved and this is what makes this method very promising for heavy metals removal from water/wastewater.
Figure 1. Comparison methods for removal of lead from synthetic solution Table 1. Comparison of pH, sludge and energy consumption of three methods
After treatment Electrocoagulation Adsorption Combination (EC+AD)
pH 6.5 6.0 6.8 Sludge production (mg/L) 58.5 - 35.8 Energy consumption (kWh/m3) 1.88 - 1.503 Colour solution (observation) white Colourless Colourless
REFERENCES ATSDR (2014). The priority list of hazardous substances, in, U.S. Department of Health and Human Services, Atlanta,
Georgia, 2014. Yew, M.K., Mahmud, H., Ang, B.C. and Yew, M.C. (2014). Effects of oil palm shell coarse aggregate species on high
strength lightweight concrete. The Scientific World Journal, Volume 2014, 12.
SEWAGE MANAGEMENT AND WASTEWATER TREATMENT 183
Aeration in Side Stream Nitrification - Different Process Rate, Different Aeration Efficiency K. Janiak, M. Miodoński and M. Muszyński-Huhajło*
* Faculty of Environmental Engineering, Wroclaw University of Technology, (E-mails: [email protected]; [email protected]; [email protected])
INTRODUCTION Aeration cost is main component of operation costs of nitrogen removal from digester supernatant in deammonification processes. Its efficiency depends on the raw wastewater quality (salt content, surfactants etc.), as well as other factors such as:
• diffuser submergence; • air flow rate per diffuser; • density of bottom coverage with diffusers etc (Mueller, 2002).
Full or partial side-stream nitrification is an efficient process used to oxidize ammonium nitrogen for bioaugmentation (BABE process) (Hommel, 2006) shortcut denitrification or ANAMMOX (i.e. CANON, OLAND, DEMON technologies) (Bowden, 2015). Thanks to high ammonium concentration and temperature, superior process rates (much higher than in traditional activated sludge processes) can be achieved. According to that, very high volumetric air input (m3N/m3
reactor h) is required to maintain these rates, which forces to design deeper reactors and/or to reduce their base surface. Diffuser submergence and air flow rate per diffuser are connected with ammonium oxidation process rate. For given ammonium load [kg N/d], the higher oxidation process rate {kg N/m3
reactor d}, the lower volume of reactor, which reflects with lower reactor area with assumed submergence. With very high process rates (> 2.5 – 3,0 kg N/m3
reactor d), reactor must be either shallow with adequate area (to provide surface for adequate number of diffusers but low aeration efficiency) or deep with small area (providing adequate oxygen transfer efficiency but with low number of diffusers working in unfavourable conditions). Despite constructor choice, both situations will lead to low standard aeration efficiency {SAE, kgO2/kW}. STANDARD AERATION EFFICIENCY Specific aeration efficiency is defined according to equation 1.
SAE = POD (1)
where OD – oxygen demand, kgO2/h, P – blower energy consumption, kWh/h. Oxygen demand depends on reactor nitrogen load. Energy consumption depends mainly on the air flow rate and pressure loss. For specific aeration efficiency {kgO2/kWh} calculations, at the beginning equatations for required air flow rate in different reactor configurations and nitrogen removal rates were derived. These equations include influence of alpha and beta factors, dissolved oxygen concentration in reactor, diffuser submergence, air flow per diffuser, diffuser density and nitrogen removal rates.

SEWAGE MANAGEMENT AND WASTEWATER TREATMENT 184
To calculate specific aeration efficiency calculations were made based on following data:
• nitrogen load: 700 kg N/d; • alpha factor: 0.9; • diffuser type: Nopon PRK 300 membrane diffuser; • blower type: Aertzen GM50L.
Figure 1 presents calculated specific aeration efficiency values for two different diffusers submergences and different nitritation rates. For all nitrogen oxidation rates, higher specific aeration efficiency is achieved with higher diffuser submergences: influence of longer contact time of air bubble with wastewater overcomes lower diffusers number and higher energy consumption due to higher required blower working pressure. Air flow rate through single diffuser rise as nitrogen oxidation rate gets higher. Simultaneously, standard oxygen transfer rate (SOTE) and SAE gets lower. With output assumption for aeration efficiency at nitrification rate equal to 1 kg N/m3
reactor d, increase of nitrification efficiency above 2 kg N/m3
reactor d leads to higher energy consumption by about 20 %, regardless of the reactor depth. Comparing the extreme values that are: 1 kg N/m3
reactor d with 7 m reactor depth and N oxidation efficiency above 3 kg N/m3
reactor d with 3m reactor depth, the difference in energetic efficiency has increased to almost to 27 %.
Figure 1.Specific aeration efficiency (SAE) in function of nitrogen oxidation rate CONCLUSIONS Exploitation of a high-efficient nitrogen oxidation reactor may lead to an issue with energetic aeration efficiency. At design stage of side-stream reactors used for reject water treatment, properly designed aeration system and reactor configuration play an important role for overall benefits from implementation of such process. Decrease of energetic efficiency due to higher nitrification rate for analyzed situation may result with increase of annual aeration costs by 6,200-7,500 € for 3 m reactor depth and 4,600-5,800 € for 7m reactor depth. In the extreme version comparing depth (7 m) reactor with 1 kg N/m3
reactor d nitrification efficiency and shallow (3 m) with < 3 kg N/m3reactor d
aeration costs will by higher by more than 9,700 €. REFERENCES Hommel B., Zandt E. van der., Berends D., Claessen V. (2006). First application of the BABE process at S-
Hertogenbosch WWTP, Weftec conference. Bowden, G., Stensel, H. D., Tsuchihashi, R. (2015). Technologies for Sidestream nitrogen removal. WERF. Mueller, J. A., Boyl,e W. C., Popel, H. J. (2002). Aeration: Practice and principles. CRC Press.
SEWAGE MANAGEMENT AND WASTEWATER TREATMENT 185
Side-stream Deammonification Process Failure – Risk of WWTP Effluent Quality Violation K. Janiak, M. Miodoński and M. Muszyński-Huhajło* * Faculty of Environmental Engineering, Wroclaw University of Technology, Poland (E-mails: [email protected]; [email protected]; [email protected])
INTRODUCTION Stable and high nitrogen removal is a one of main goals of wastewater treatment. Implementation of deammonification process on dewatering liquor stream may enhance overall plant performance but it also have important drawback. As important part (even 30 %) of nitrogen load to activated sludge is removed in deammonification process, mass of nitrifiers in reactors is considerably lower and activated sludge is substantially more sensitive to nitrogen load increase. Main idea of this paper is to prove that deammonification implementation may lead to effluent quality violation in case of deammonification failure especially in case when plant operator exploits lower nitrogen load by lowering sludge retention time. This paper presents simulation studies of deammonification failure consequences on nitrogen removal performance in case of typical WWTP (100,000 PE). Simulation studies are based on calibrated ASM1 model of real WWTP, real data and fictional scenario of deammonification implementation and then failure. Discovery of anammox bacteria in late 90ties led to development of new technologies for nitrogen removal (deammonification) from dewatering liquor (patented CANON, OLAND, DEMON and many not patented). In 2014, more than 100 deammonification reactors were in operation and many more were planned or in building phase all over the world (Lackner et al., 2014). Thanks to lower oxygen demand, no carbon consumption and high process rates number of new deammonification reactors will rise. Deammonification process have also drawbacks. It requires stable inhibition of NOB which is hard to achieve, as well as stable composition (N-NH4/N-NO2 in 1:1 proportion) of partial nitrified dewatering liquor load to anammox step. Another drawback is high sensibility of anammox bacteria to different inhibitors (free ammonia, nitrous acid, oxygen etc.) and its very low growth rate (Laureni et al., 2015; Jaroszyński et al., 2012). These drawbacks may cause too frequent failures of deammonification process. In case of its failure, nitrogen load to activated sludge increases instantly (by 20-30 %) which may have dramatic effect on plant nitrogen removal performance if low mass of nitrifiers (due to lower nitrogen load) in activated sludge can’t nitrify increased load. PLANT DESCRIPTION Simulation studies were based on calibrated ASM1 model of typical medium size Polish WWTP (115 000 PE). Plant is composed of two parallel A2O reactors. Nitrogen load from sludge dewatering comprises of 20 % of nitrogen load to plant. Total nitrogen limit in effluent is 10 g N/m3 without ammonia limit. DEAMMONIFICATION IMPLEMENTATION SCENARIO Before implementation of deammonification, plant had problems with nitrogen removal (Figure 1). Average nitrogen concentration in effluent was 9,8 g N/m3 and was close to effluent limit. This fact led to decision of deammonification implementation on dewatering liquor stream which caused important decrease in nitrogen concentration (to 7,3 g N/m3), lower overall oxygen consumption and lower nitrifiers mass (by 23 %) in reactors. Low nitrogen concentration created possibility of
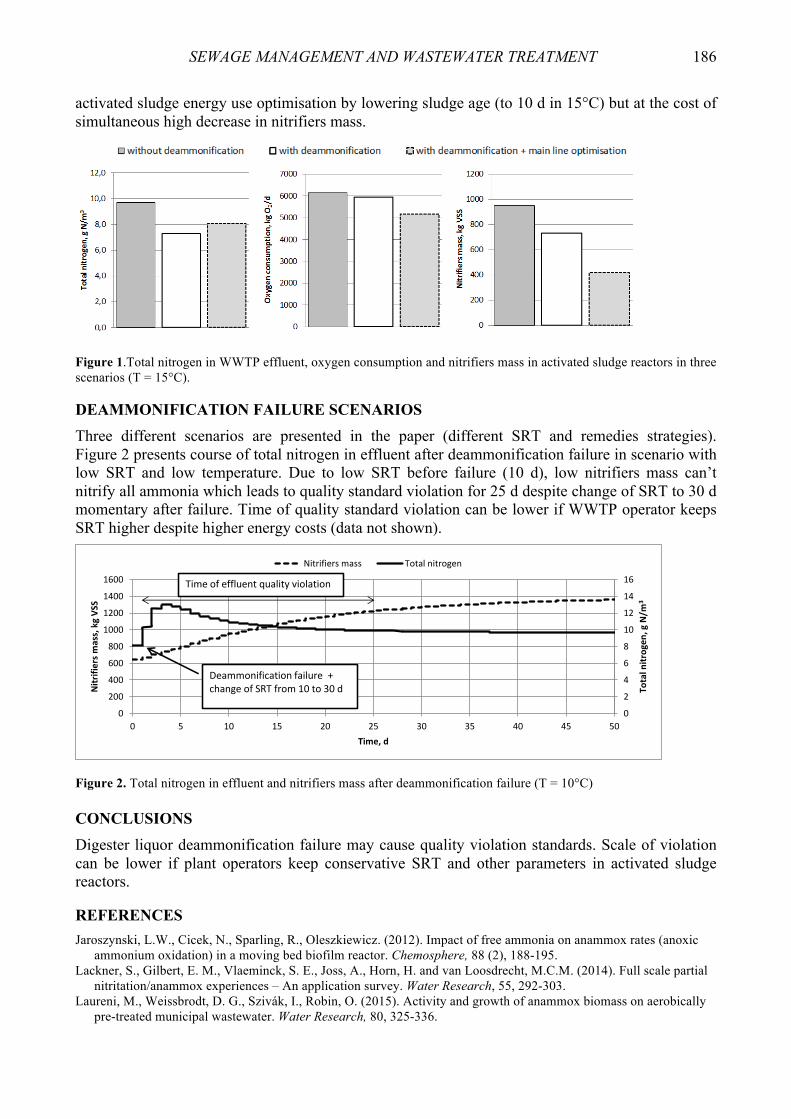
SEWAGE MANAGEMENT AND WASTEWATER TREATMENT 186
activated sludge energy use optimisation by lowering sludge age (to 10 d in 15°C) but at the cost of simultaneous high decrease in nitrifiers mass.
Figure 1.Total nitrogen in WWTP effluent, oxygen consumption and nitrifiers mass in activated sludge reactors in three scenarios (T = 15°C). DEAMMONIFICATION FAILURE SCENARIOS Three different scenarios are presented in the paper (different SRT and remedies strategies). Figure 2 presents course of total nitrogen in effluent after deammonification failure in scenario with low SRT and low temperature. Due to low SRT before failure (10 d), low nitrifiers mass can’t nitrify all ammonia which leads to quality standard violation for 25 d despite change of SRT to 30 d momentary after failure. Time of quality standard violation can be lower if WWTP operator keeps SRT higher despite higher energy costs (data not shown).
0
2
4
6
8
10
12
14
16
0
200
400
600
800
1000
1200
1400
1600
0 5 10 15 20 25 30 35 40 45 50
Totalnitrogen
,gN/m
3
Nitrifiersm
ass,kgVSS
Time,d
Nitrifiersmass Totalnitrogen
Deammonification failure+changeofSRTfrom10to30d
Timeofeffluentqualityviolation
Figure 2. Total nitrogen in effluent and nitrifiers mass after deammonification failure (T = 10°C) CONCLUSIONS Digester liquor deammonification failure may cause quality violation standards. Scale of violation can be lower if plant operators keep conservative SRT and other parameters in activated sludge reactors. REFERENCES Jaroszynski, L.W., Cicek, N., Sparling, R., Oleszkiewicz. (2012). Impact of free ammonia on anammox rates (anoxic
ammonium oxidation) in a moving bed biofilm reactor. Chemosphere, 88 (2), 188-195. Lackner, S., Gilbert, E. M., Vlaeminck, S. E., Joss, A., Horn, H. and van Loosdrecht, M.C.M. (2014). Full scale partial
nitritation/anammox experiences – An application survey. Water Research, 55, 292-303. Laureni, M., Weissbrodt, D. G., Szivák, I., Robin, O. (2015). Activity and growth of anammox biomass on aerobically
pre-treated municipal wastewater. Water Research, 80, 325-336.
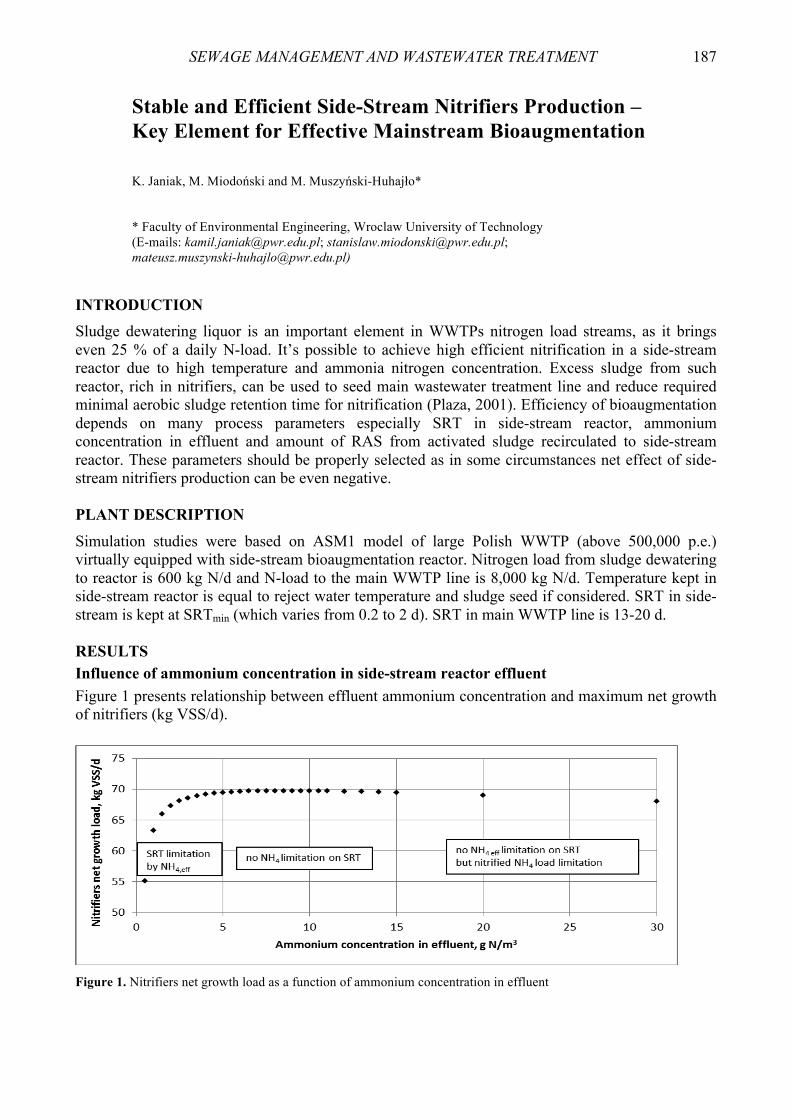
SEWAGE MANAGEMENT AND WASTEWATER TREATMENT 187
Stable and Efficient Side-Stream Nitrifiers Production – Key Element for Effective Mainstream Bioaugmentation K. Janiak, M. Miodoński and M. Muszyński-Huhajło*
* Faculty of Environmental Engineering, Wroclaw University of Technology (E-mails: [email protected]; [email protected]; [email protected])
INTRODUCTION Sludge dewatering liquor is an important element in WWTPs nitrogen load streams, as it brings even 25 % of a daily N-load. It’s possible to achieve high efficient nitrification in a side-stream reactor due to high temperature and ammonia nitrogen concentration. Excess sludge from such reactor, rich in nitrifiers, can be used to seed main wastewater treatment line and reduce required minimal aerobic sludge retention time for nitrification (Plaza, 2001). Efficiency of bioaugmentation depends on many process parameters especially SRT in side-stream reactor, ammonium concentration in effluent and amount of RAS from activated sludge recirculated to side-stream reactor. These parameters should be properly selected as in some circumstances net effect of side-stream nitrifiers production can be even negative. PLANT DESCRIPTION Simulation studies were based on ASM1 model of large Polish WWTP (above 500,000 p.e.) virtually equipped with side-stream bioaugmentation reactor. Nitrogen load from sludge dewatering to reactor is 600 kg N/d and N-load to the main WWTP line is 8,000 kg N/d. Temperature kept in side-stream reactor is equal to reject water temperature and sludge seed if considered. SRT in side-stream is kept at SRTmin (which varies from 0.2 to 2 d). SRT in main WWTP line is 13-20 d. RESULTS Influence of ammonium concentration in side-stream reactor effluent Figure 1 presents relationship between effluent ammonium concentration and maximum net growth of nitrifiers (kg VSS/d).
Figure 1. Nitrifiers net growth load as a function of ammonium concentration in effluent

SEWAGE MANAGEMENT AND WASTEWATER TREATMENT 188
Three distinct regions can be distinguished. In first region (NH4,eff < 5 g N/m3), SRTmin is limited by NH4 concentration (NH4 limits specific growth of nitrifiers and hence SRT) and must be kept higher to prevent washout of nitrifying bacteria. High SRTmin limits amount of nitrifiers in excess sludge. Second region (NH4,eff between 5 and 15 g N/m3), growth of nitrifiers and SRTmin are not limited by NH4 and mass of produced nitrifiers is maximum. Third region, with NH4 effluent concentration above 15 g N/m3 also ensure no SRTmin limitation but due to unnecessarily high NH4 concentration, nitrified ammonium load starts to limit nitrifiers production. The exact values of NH4 depends mainly on saturation coefficient for NH4 and may be different but general relationship is proper for all kinetic parameters configurations.
Amount of RAS sludge seed to side-stream reactor Figure 2 presents influence of RAS stream recirculated to side-stream reactor on nitrifiers net growth load. As RAS stream (which includes some load of nitrifiers) seeded to side-stream reactor increases, net growth of nitrifiers linearly decreases. This phenomenon occurs despite simultaneous decrease in SRT in reactor which is kept at SRTmin (ideal conditions). At higher RAS streams (>6%), net growth is negative which means that amount of nitrifiers in excess sludge from side-stream reactor is lower than its amount in RAS. The exact values of net growth depend mainly on yield coefficient, decay coefficient as well as nitrifiers load in RAS and may be different but general relationship is proper for all parameters configurations.
Figure 2. Nitrifiers net growth load from side stream reactor as a function of RAS stream to reactor CONSLUSIONS Stable and efficient bioaugmentation of nitrifiers from side stream reactor can be used as a tool to ensure full nitrification at lower temperatures or SRTs in WWTP main line. Effect of bioaugmentation depends on nitrogen load to side stream reactor as well as its operational parameters. In order to maximize nitrifiers production: • ammonium in side-stream reactor should be kept at level which ensures no substrate limitation
but not to exceed this parameter. Exact values depend on saturation coefficient for NH4. • SRT in reactor should be relatively close to the SRTmin. SRTmin value depends on specific growth
and decay coefficients rate values. • RAS seeded to side-stream reactor should be at level which ensures proper floc forming and
domination of nitrifiers genres from activated sludge but not higher. Exact values can’t be calculated and should be designated experimentally.
REFERENCES Plaza, E., Trela, J., Hultman, B. (2001). Impact of seeding with nitrifying bacteria on nitrification process efficiency.
Water Science and Technology, Vol. 43(1), 155-164.

SEWAGE MANAGEMENT AND WASTEWATER TREATMENT 189
Algae Growth Characteristics Treating Anammox Effluent L.W. Jaroszysnki and T. Jaroszynski* * Poznan University of Technology, Department of Civil Engineering, ul. Berdychowo 4, 61-131 Poznan, Poland (E-mail: [email protected])
INTRODUCTION Anaerobic digestion process is commonly used for sludge stabilization but also for energy generation from biosolids (i.e. primary and secondary sludge). On the other hand, bio-solids processing causes additional nutrients load to the mainstream bioreactors in form of rich in ammonia and orthophosphates reject waters. Anammox process is suitable treatment method and cost effective, however, in anammox process not all inorganic nitrogen is removed where phosphorous removal is low. One of the method for nutrients removal could be algae process where remaining nitrogen and phosphorous after anammox process could be removed efficiently (Wang et al., 2014). In this study, algae growth yield and doubling time were investigated. Algae biomass was cultivated on treated reject waters in anammox process. MATERIALS AND METHODS Algae biomass for kinetic tests was harvested from the pilot scale algae reactor treating anammox effluent. Sodium high pressure lamp (PHILIPS SON T PIA 600 W) was used as a source of light and it was illuminating reactors for 24 h. The pH was controlled by adding carbon dioxide (pH 7.0). Test reactors were placed in the water bath with temperature control device (Figure 1). Tests were performed at different temperatures (20, 25 and 35 oC) and different nitrogen species (R1 – 50 mg NO2-N/L; R2 - 50 mg NH4-N/L; R3 - 50 mg NO3-N/L and R4 - 50 mg NO2-N/L + 50 mg NH4-N/L + 50 mg NO3-N/L).
Figure 1. Experimental set-up for algae batch testing. RESULTS AND DISCUSSION Algae biomass was cultivated under different nitrogen forms (ammonium, nitrite, nitrate and mix of all forms) and different temperatures. Results suggests that growth yield may be substrate and

SEWAGE MANAGEMENT AND WASTEWATER TREATMENT 190
temperature depended (Figure 2 and Table 1). The highest growth yield was observed for 20 oC and ammonium nitrogen, where the lowest yield was observed for mix of different nitrogen forms regardless the temperature (such as anammox effluent composition). The lowest growth yield for combined nitrogen species can be related with too high overall nitrogen concentration which was 150 mg N/L. Temperature coefficient was determined in temperature range between 20 °C and 35 °C. For different nitrogen forms (such as anammox effluent) temperature coefficient was found to be 0.94.
Figure 2. Algae biomass growth yield at different nitrogen forms and temperatures
Table 1. Algae doubling time at different nitrogen forms and temperatures
Doubling time [1/d] R1 R2 R3 R4
Temperature [oC] NO2 NH4 NO3 N 35 0,64 0,98 0,56 0,57 25 0,55 0,72 0,48 0,31 20 0,52 0,5 0,37 0,24
CONCLUSIONS Conducted research demonstrated that algae biomass can be effectively used for nitrogen polishing purposes after anammox process and for extra biomass production for anaerobic digestion process. However, too high nitrogen concentration may hinder algae biomass growth yield. Findings of this research bring closer the idea of future sustainable wastewater treatment plant operation. ACKNOWLEDGEMENTS The project BARITECH (Integrated technology for improved energy balance and reduced greenhouse gas emissions at WWTPs) is financed through support from Norway Grants in the Polish-Norwegian Research Programme (Core Call) operated by the National Centre for Research and Development, grant No pol-nor/197025/37/2013. REFERENCES Wang, M., Kuo-Dahab, W.C., Dolan, S., Park, C. (2014). Kinetics of nutrient removal and expression of extracellular
polymeric substrates of the microalgae, Chlorella sp. and Micractinium sp., in wastewater treatment. Bioresour. Technol., 154, 131-137.
SEWAGE MANAGEMENT AND WASTEWATER TREATMENT 191
Pilot Scale Study on Reject Water Treatment in Partial Nitritation/Anammox Process at Poznan Wastewater Treatment Plant L.W. Jaroszysnki and T. Jaroszynski* * Poznan University of Technology, Department of Civil Engineering, ul. Berdychowo 4, 61-131 Poznan, Poland (E-mail: [email protected])
INTRODUCTION Partial nitritation – anammox process also termed deammonification becomes widely applied technology for nitrogen removal, especially for rich in ammonia wastewaters such as anaerobic digestion reject waters (Lackner et al., 2014). No need for organic carbon and short-cut in nitrogen pathway significantly improves wastewater treatment plant energy balance when combined with anaerobic digestion process for energy recovery (Morales et al., 2015). Additionally, side stream treatment in anammox based process is considered beneficial in terms of entire plant energy balance (Bozkurt et al., 2016) although some environmental trade-offs such as increase in N2O emissions exists (Hauck et al., 2016). Many full-scale applications of anammox process is documented in literature (Ali & Okabe, 2015; Lackner et al., 2014), therefore increase in process operation experience allows for further anammox process development and optimization (Morales et al., 2015). In this study, the general experience with pilot-scale two reactor configuration for partial nitritation – anammox is presented. Process stability during start-ups, temperature variations, and variable loading rates is discussed. Additionally, nitrifying biomass activity and settling properties changes during starvation period is shown. MATERIALS AND METHODS Partial nitritation reactor (PN reactor) had a working volume of 200L – custom made reactor. Reactor had two compartments, one for reaction (120L) and one as an attached clarifier for solids/liquid separation (variable volume). The anammox reactor, AR reactor, fluidized bed reactor, had a working volume of 25 L and total height of 4,5 m – custom made reactor. PN reactor was stared-up at different temperatures using main-steam biomass and AR reactor was started-up once. Biomass activity, partial nitritation rate (PNR) and/or nitrogen removal rate (NRR) in anammox reactor, was tested at different temperatures (35 °C, 25 °C, 20° C and 15 °C), dissolved oxygen (DO) concentrations and ammonium concentrations. PNR and NRR was tested on reject water. Nitrifies decay rate was determined for biomass stored under aerated and non-aerated conditions without feeding at 35 °C. Pilot-scale reactors were tested for short-term overloading stress by increasing the flow rate. RESULTS AND DISCUSSION Study found that the higher temperature the faster start-up period for partial nitritation reactor but also nitrite oxidizing bacteria washout was faster along with increasing temperature. Start-up period for 35 °C, 25 °C and 20 °C was 4 days, 9 days and 12 days, respectively. Additionally, mainstream biomass was found to be the excellent source of seed where ammonium oxidizing bacteria did not need much time to acclimate to reject water and nitrite oxidizing bacteria were easy to washout.
SEWAGE MANAGEMENT AND WASTEWATER TREATMENT 192
Monod model was found to be applicable to partial nitritation and anammox. Ammonia oxidizing bacteria (AOB) activity in partial nitritation reactor could be predicted base on dissolved oxygen concentration, ammonium concentration and temperature. Half saturation constants for dissolved oxygen and ammonium were found to be 2.1 mg O2/L and 76 mg N/L, and temperature coefficient was 1.095. Very high biomass activity (specific nitrite production rate) was found reaching 5 g NO2-N/g VSS d in batch tests and 7.1 NO2-N/g VSS d during short term test in the partial nitritation reactor at about 4 mg O2/L and 35 oC. Typically DO during reactor operation was about 1 mg O2/L which is below Ks value determined in this study. Operating reactor at DO below Ks value allows for simple and fast response to kinetic deterioration in case of temperature variations or in case of nitrogen loading increase where increase in nitrite production rate is needed. Biomass dickey rate was tested under aerated and non-aerated condition. Aerated condition caused much faster biomass activity deterioration than it was observed under non-aerated condition and they were 0.28 1/d and 0.06 1/d, respectively. Anammox reactor was started-up in much longer period than nitritation reactor and it took 25 days. The start-up time was within the typical range for granular up-flow type reactor with an average doubling time of 12.5 days at 35 °C. It was found that nitrite up to 50 mg NO2-N/L did not destabilized the reactor during start-up period. Anammox activity in anammox reactor could be predicted based on ammonium concentration, nitrite concentration and temperature. Half saturation constants for nitrite and ammonium were found to be 10.5 mg N/L and 20.5 mg N/L, and temperature coefficient was 1.099. It was found that very high biomass accumulation and plug flow mode in the reactor allowed for achieving very robust anammox process. Overall, nitrogen removal rate was 2.83 ± 0.14 g/Ld including total reactors’ volumes for both processes. In this reactors configuration, it was possible to achieve good inorganic nitrogen (NH4 + NO2 + NO3) removal efficiency of 80.4 ± 2.6 % (ammonium removal efficiency was 91 %). Nitrogen removal efficiency is comparable to one-reactor configurations, however, overall nitrogen removal rate is higher which suggests, that higher investment costs related with more tanks can be mitigated by smaller overall volume of reactors in some cases. Currently, one-reactor systems are favoured over two-reactor systems (Bozkurt et al., 2016; Lackner et al., 2014). CONCLUSIONS Partial nitritation/anammox process was researched in the pilot scale reactors operated in the continuous flow mode. Study found that very robust and stable nitritation can be achieved without sophisticated control strategy. Reactor can be started-up with main-stream biomass within short time. High nitritation rates can be managed by relatively simple dissolved oxygen concentration manipulation and biomass solids balance. High biomass accumulation and plug flow mode in the reactor allowed for achieving very robust anammox process. REFERENCES Bozkurt, H., van Loosdrecht, M.C.M., Gernaey, K.V., Sin, G. (2016). Optimal WWTP process selection for treatment
of domestic wastewater – A realistic full-scale retrofitting study. Chemical Engineering Journal, 286, 447-458. Hauck, M., Maalcke-Luesken, F.A., Jettent, M.S.M., Huijbregts, M.A.J. (2016). Removing nitrogen from wastewater
with side stream anammox: What are the trade-offs between environmental impacts?. Resources, Conservation and Recycling, 107, 212-219.
Lackner, S., Gilbert, E.M., Vlaeminck, S.E., Joss, A., Horn, H., van Loosdrecht, M.C.M. (2014). Full-scale partial nitritation/anammox experiences – An application survey. Water Research, 55, 292-303.
Morales, N., Val del Río, A., Vázquez-Padín, J.R., Méndez, R., Mosquera-Corral, A., Campos, J.L. (2015). Integration of the Anammox process to the rejection water and main stream lines of WWTPs. Chemosphere, 140, 99-105.

SEWAGE MANAGEMENT AND WASTEWATER TREATMENT 193
Application of Natural Bentonite for Nonionic Surfactant Removal in Industrial Wastewater K. Jaszczyszyn*, W. Góra* and P. Góra** * Institute of Environmental Engineering, Poznan University of Technology, 4 Berdychowo, 60-965 Poznan, Poland (E-mail: [email protected]; [email protected]) ** Inter-Aqua Ltd., 14 Krańcowa, 61-022 Poznan, Poland (E-mail: [email protected])
INTRODUCTION The removal of nonionic surfactants from actual industrial wastewater was studied. A preselected natural bentonite and - for comparison - classical coagulation using ferrous sulfate were applied. A series of batch experiments in the laboratory jar tests were performed to determine efficiency for nonionic surfactants and COD removal. As a result, significantly higher efficiencies of nonionic surfactants removal by natural bentonite than by iron sulfate were obtained (93 % versus 35 %, average). Besides, better reduction of COD with the use of natural bentonite than iron sulfate was achieved. The specific properties of surfactants makes them attractive for a range of applications as detergents, emulsifiers, dispersants both in manufacturing processes (e.g. in cosmetics industry) and in Clean-In-Place systems (Włodarczyk-Makuła et al., 2013). However, increasing of surfactants concentration in wastewater may cause negative impact on biological wastewater treatment processes and on the environment (Wyrwas, 2011). Therefore, many technologies applied to surfactant removal such as: coagulation, photodegradation, advanced oxidation processes, sorption, ionic-exchange, membrane processes and biodegradation have been studied (Włodarczyk-Makuła, 2013). The application of natural adsorbents to remove surfactants from aqueous solutions is one of the recent research interests (Zhang et al., 2012; Amirianshoja et al., 2013; Harutyunyan et al., 2015). In the paper efficiency of industrial wastewaters purification from nonionic surfactant by natural bentonite sorption and common iron sulphate coagulation was compared. MATERIALS AND METHODS The preselected bentonite sample used for the experiments was obtained from Hekobentonity Ltd., Poland. Specific surface area of bentonite was determined by the nitrogen adsorption–desorption method at 77K on ASAP 2420 analyser (BET surface = 58,511 m2/g). The iron sulphate coagulant was obtained from Kemipol Ltd., Poland. Averaged wastewater samples were taken from three different industrial plants: two samples from an electromechanical industry (IP1, IP2) and the third sample - from a cosmetics industry (IP3). Batch experiments of nonionic surfactants removal from industrial wastewater samples were performed in the laboratory jar tests. The optimum pH, mixing time and coagulant dose were determined. Tests were carried out at room temperature. Efficiency of nonionic surfactant and COD removal was determined (prepared with Standards Methods).

SEWAGE MANAGEMENT AND WASTEWATER TREATMENT 194
Experimental results Efficiency of nonionic detergents removal using natural bentonite in three samples (IP1, IP2, IP3) was 87 %, 96 % and 97 %, respectively. For comparison, the efficiency of removal of nonionic detergents using classic ferrous sulfate coagulation was 42 %, 18 % and 46 %, respectively. The application of bentonite also allowed achieve lower COD than in the samples with ferrous sulfate.
Figure 1. Nonionic surfactants (NS) removal efficiency and the reduction of COD by the use of natural bentonite and iron sulphate for the samples IP1, IP2, IP3 (CODin – initial COD, NSin – initial nonionic surfactants concentration) CONCLUSIONS For all three various industrial wastewater samples, significantly higher efficiencies of nonionic surfactants removal by natural bentonite than by iron sulfate were obtained (93 % versus 35 %, average). Compared to the classical coagulation, the application of bentonite improved simultaneously COD reduction range from about 10 % to 20 %. The results show that the application of natural bentonite for nonionic surfactant removal can be a noticeable alternative in industrial wastewater technology. REFERENCES Amirianshoja, T., Junin, R., Idris, A. K., Rahmani, O. (2013). A comparative study of surfactant adsorption by clay
minerals. Journal of Petroleum Science and Engineering, 101, 21-27. Harutyunyan, L. R., Pirumyan, G. P. (2015). Purification of waters from anionic and cationic surfactants by natural
zeolites. Chemistry and Biology, 1, 21-28. Włodarczyk-Makuła, M. (2013). Wybrane mikrozanieczyszczenia organiczne w wodach i glebach. Wydawnictwo
Politechniki Częstochowskiej. Wyrwas, B., Kruszelnicka, I., Ginter-Kramarczyk, D. (2011). Effects of selected anionic and nonionic surfactants on the
operation on activated sludge. Przemysł Chemiczny, 90 (4), 613-619. Zhang, Y., Zhao, Y., Zhu, Y., Wu, H., Wang, H., Lu, W. (2012). Adsorption of mixed cationic-nonionic surfactant and
its effect on bentonite structure. Journal of Environmental Sciences, 24 (8), 1525-1532.
SEWAGE MANAGEMENT AND WASTEWATER TREATMENT 195
The Influence of Selected Antibiotics on the Wastewater Treatment Process and the Development of Antibiotic Resistant Bacteria N. Jendrzejewska and E. Karwowska* * Faculty of Building Services, Hydro and Environmental Engineering, Warsaw University of Technology, Nowowiejska 20, 00-653 Warsaw, Poland (E-mails: [email protected]; [email protected])
INTRODUCTION Antibiotics are one of the most popular groups of pharmaceuticals used in veterinary, medicine and farming (Baquero et al., 2008; Bergeron et al., 2015). Therefore, they can appear as contaminants in wastewater, soil, surface water, ground water, municipal sewage, influents and effluents of wastewater treatment plants (Kümmere, 2009). The aim of this research was to investigate the impact of antibiotics on the wastewater treatment by activated sludge method as well as the occurrence of antibiotic-resistant bacteria in activated sludge. EXPERIMENTAL The process was carried out in a laboratory scale activated sludge bioreactor (4,8 L). The synthetic wastewater (imitating domestic wastewater) with the addition of mixture of antibiotics (doxycycline, gentamicin, penicillin, nitrofurantoin, rifampicin) was used. The total antibiotic concentration in wastewater increased from 0 µg/L to 300 µg/L. Control parameters of the process covered: chemical oxygen demand (COD), total nitrogen and phosphorus content, dry matter concentration in bioreactor, microscope analysis of activated sludge biocenosis and microbiological analysis of the bioreactor content. Microbiological analysis included the determination of total number of bacteria in activated sludge, as well as the numbers of bacteria resistant to individual antibiotics. The isolated predominating strains of antibiotic-resistant bacteria were additionally tested for the resistance to a broad spectrum of commonly used antibiotics. The occurrence of some enzymes involved in antibiotic resistance was determined using the double-disc method. RESULTS AND CONCLUSIONS The presence of antibiotics in the wastewater did not visibly influence the organic matter degradation as well as N and P concentration in activated sludge. However, the significant increase in the number of antibiotic resistant bacteria (depending on the type of pharmaceutical) was observed during the process. Predominating antibiotic-resistant strains appeared as multi-resistant. In case of one of them the presence of enzymes directly involved in β-lactam antibiotics, i.e. metallo- β-lactamase and carbapenamase was identified. The antibiotic resistance in bacteria isolated from activated sludge in bioreactor is shown in Table 1 and changes in numbers of antibiotic-resistant bacteria – in Figure 1.
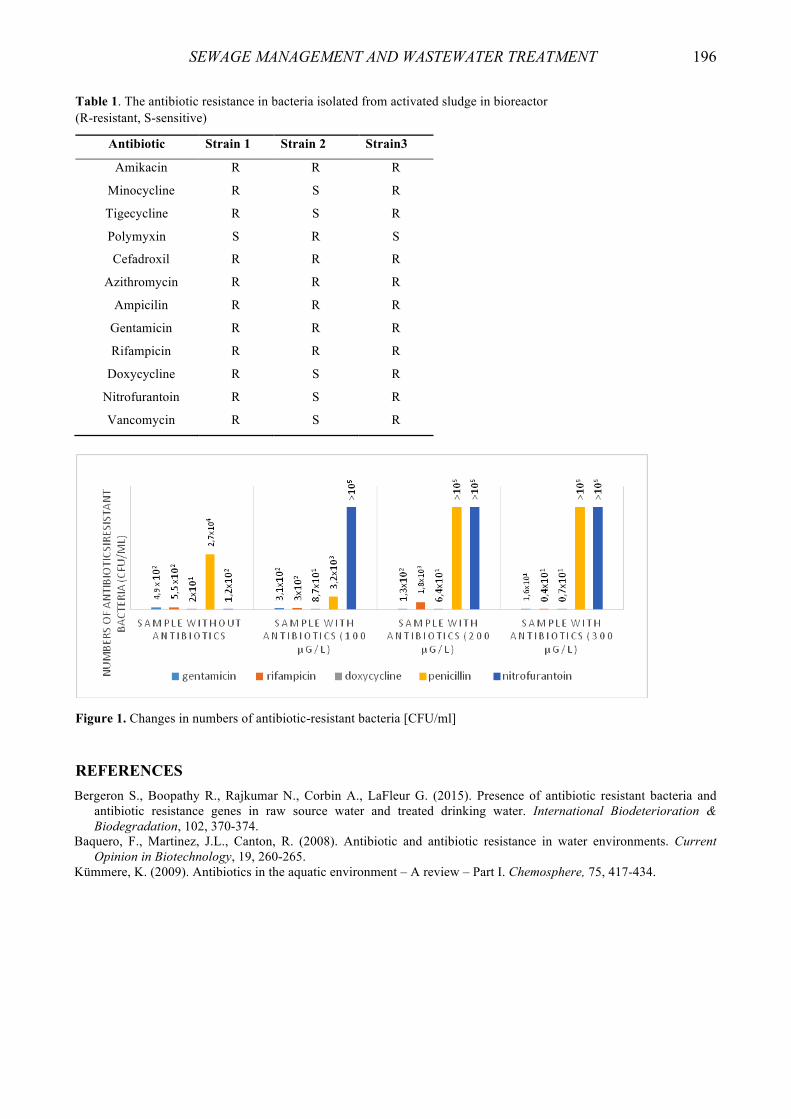
SEWAGE MANAGEMENT AND WASTEWATER TREATMENT 196
Table 1. The antibiotic resistance in bacteria isolated from activated sludge in bioreactor (R-resistant, S-sensitive)
Antibiotic Strain 1 Strain 2 Strain3
Amikacin R R R
Minocycline R S R
Tigecycline R S R
Polymyxin S R S
Cefadroxil R R R
Azithromycin R R R
Ampicilin R R R
Gentamicin R R R
Rifampicin R R R
Doxycycline R S R
Nitrofurantoin R S R
Vancomycin R S R
Figure 1. Changes in numbers of antibiotic-resistant bacteria [CFU/ml]
REFERENCES Bergeron S., Boopathy R., Rajkumar N., Corbin A., LaFleur G. (2015). Presence of antibiotic resistant bacteria and
antibiotic resistance genes in raw source water and treated drinking water. International Biodeterioration & Biodegradation, 102, 370-374.
Baquero, F., Martinez, J.L., Canton, R. (2008). Antibiotic and antibiotic resistance in water environments. Current Opinion in Biotechnology, 19, 260-265.
Kümmere, K. (2009). Antibiotics in the aquatic environment – A review – Part I. Chemosphere, 75, 417-434.
SEWAGE MANAGEMENT AND WASTEWATER TREATMENT 197
Use of Chlorine Compounds for Wastewater Disinfection I. Johanidesová, J. Bindzar, S. Lama, M. Słabuszewska, P. Čiháková and J. Wanner* * Department of Water Technology and Environmental Engineering, University of Chemistry and Technology Prague, Technická 5, 166 28 Praha 6 – Dejvice, Czech Republic (E-mail: [email protected])
INTRODUCTION Currently, wastewater disinfection is a topical theme. Disinfection should be implemented in those wastewater treatment plants (WWTPs) the effluent of which goes to the recipient where it is to be used for swimming or as a source of drinking water. UV light, chlorination or ozonation are common methods applied to remove or inactivate microorganisms in water. The former method is implemented most frequently because there is almost no risk of disinfection by-products (DBPs) formation during its progress. However, dangerous DBPs are formed during chlorination. The amount of formed DBPs is influenced by organic pre-cursors presence, free chlorine dose, contact time, temperature, pH value etc. On the other hand, one of the biggest advantages of chlorination is its cost. MATERIALS AND METHODS The water for experiments was taken from the effluent of WWTP (100,000 PE) with biological treatment of nitrogen and chemical treatment of phosphorus. All samples were analysed for coliform bacteria, Escherichia coli, intestinal enterococci, Clostridium perfringens and culturable microorganisms at 22 °C and 36 °C. Concentration of AOX was analysed for a comparison of DBPs formation. Influence of contact time In our laboratory, the WWTP effluent was disinfected with NaClO [c (Clfree) = 3.3 mg/l] at 25 °C for various contact time.
Disinfection efficiency was expressed as log removal which was calculated according to equation 1:
,CС
logremovallogin
out−= (1)
where cin – the concentration at the beginning and cout – the concentration at the end of the treatment system.
Influence of tertiary treatment processes used The WWTP effluent was treated with one of the following configurations of tertiary treatment processes:
• Sand filtration (SF) • Coagulation + sand filtration (C+SF) • Coagulation + sedimentation + sand filtration (C+S+SF)
Chlorination was then used to disinfect both the treated samples and untreated ones.

SEWAGE MANAGEMENT AND WASTEWATER TREATMENT 198
Sand filtration
The lab scale of sand filtration consisted of polypropylene tube where two filtration materials were used, sand (the grain size of 0.5-1.0 mm) and gravel (the grain size of 0.4-0.7 cm). The height of gravel was 5 cm from the bottom of the tube, the height of sand was 16.5 cm above the gravel layer and the water level was maintained at 12.5 cm above the sand layer. The initial filtration rate was set at 2.6-2.9 m3/ (m2.h). The sample was collected after 60 minutes from the beginning of filtration. Coagulation and sedimentation
For coagulation 0.5 ml of Fe2 (SO4)3 [c (Fe) = 3.4 mg/l] was added to water. Then a constant fast mixing was applied. When coagulation was coupled with sedimentation, the same coagulation solution of the same quality was added to water. First the fast mixing was set for 30 seconds and then slow mixing was set for 3 minutes. After this mixing was stop and the sample was standing for 45 minutes to promote sedimentation. RESULTS AND DISCUSSION Influence of contact time
The influence of increasing contact time is different for each group of microorganisms. For example, the greatest difference of disinfection efficiency between time 15 minutes and 45 minutes was calculated for intestinal enterococci. While the log removal of 15 minutes contact time was 0.97, the log removal value of 45 minutes contact time was 2.23, i.e. it was 1.26 higher. Generally, for all tested microorganisms the log removal increased as contact time increased, while concentration of AOX for 15 minutes contact time was the same like for 45 minutes contact time.
Influence of tertiary treatment processes used For culturable microorganisms at 22 °C the greatest difference of the chlorination efficiency was measured when C+S+SF were used. On the other hand for coliform bacteria and Escherichia coli the greatest difference of inactivation efficiency was calculated when C+SF were used. All used combinations of tertiary treatment processes reduced the amount of AOX formatted during chlorination. For example when C+S+SF were used, AOX concentration increased 28 µg/l, while in the case of untreated water AOX concentration increased 39 µg/l. CONCLUSION
These experiments will help to better understanding of wastewater disinfection with chlorine. Due to that the cheapest disinfection method, chlorination, could be implemented in WWTPs with no or less risk of DBPs formation. REFERENCES Asano, T., Burton, F.L., Leverenz, H.L., Tsuchihashi, R., Tchobanoglous, G. (2007). Water reuse: Issues, technologies,
and applications, Metcalf & Eddy, New York. Kos, M. (2013). Dezinfekce vyčištěných odpadních vod, SOVAK, 22(4), 14-15 (in Czech). Novotny, V., Ahern, J., Brown, P. (2010). Water centric sustainable communities: Planning, retrofitting, and building
the next urban environment, John Wiley & Sons, New Jersey. Říhová Ambrožová, J. (2008). Mikrobiologie v technologii vod, textbook, 2nd edition, University of Chemistry and
Technology Prague, Czech Republic (in Czech). Wanner, J. (2011). Důvody pro a možnosti opětovného využívání vyčištěných odpadních vod, Proceedings of
conference Voda, 19-21.10.2011, Poděbrady, Czech Republic, 33-41 (in Czech).

SEWAGE MANAGEMENT AND WASTEWATER TREATMENT 199
Sludge Age: How to Get More Phosphorus in WWTP Effluent for Its Recovery? I. Johanidesová, T. Fuka, I. Růžičková, M. Pečenka, D. Vejmelková, M. Studničková and J. Wanner* * Department of Water Technology and Environmental Engineering, University of Chemistry and Technology Prague, Technická 5, 166 28 Praha 6 – Dejvice, Czech Republic (E-mail: [email protected])
INTRODUCTION Phosphorus is a nutrient important for life. Huge amounts of phosphorus are used in fertilizers. Its demand is increasing because of increasing population in the world. However, its sources in nature are decreasing. Therefore, new sources have to be found. One of these alternatives is wastewater. During treatment in wastewater treatment plant (WWTP), phosphorus is divided into two streams which can be used for phosphorus recovery – an excess sludge and a WWTP effluent. For our project the WWTP effluent was chosen. For that reason we were searching how to get as less as possible phosphorus in the excess sludge. MATERIALS AND METHODS On the lab scales systems with activated sludge of 5, 15 and 30 days age were tested. The SBR models of volume of 9 l were aerated and mixed (Figure 1). Synthetic wastewater was used. WWTP where no phosphorus removal was implemented was chosen for inoculation of our reactors.
Figure 1. Lab scales used for testing influence of sludge age on phosphorus concentration in the effluent The pH value was after dosing synthetic wastewater, which was carried out every 24 hours, always adjusted to a range between 6.0 and 8.5. Periodically oxygen concentration, suspended solids and sludge index were also measured. Water samples were taken before and after synthetic wastewater dosing. Concentration of P-PO4
3-, Ptotal and CODCr was analyzed in all the samples. Concentration of Namon, N-NO2
- and N-NO3- was analyzed in chosen samples as a control of nitrification. Ptotal
concentration was analyzed also in dried samples of activated sludge.
SEWAGE MANAGEMENT AND WASTEWATER TREATMENT 200
RESULTS AND DISCUSSION
Between 33rd and 80th day of the operation of the reactors sludge concentration slowed growth. From the 80th day until the end of the model operation sludge concentration stagnated and fluctuated around levels for R1 from 1.5 to 1.6 g/l, R2 from 3.5 to 3.6 g/l, and R3 4.3 to 4.4 g/l. Sludge during the entire test showed a gradual improvement in the sedimentation properties, the only exception was reactor R1 in which occurred at the end of the experiment to a gradual degradation of activated sludge flocs. In Table 1, there are results of analyses and counting of Ptotal amount in the excess sludge based on the measurements on 39th day of the experiment. It can be seen that Ptotal amount in the excess sludge is increasing as the sludge age is decreasing. In our experiment system with sludge age of 30 days can bring 60 % phosphorus in the excess sludge comparing with 5 days sludge age. Table 1. Phosphorus amount in excess sludge on 39th day of the experiment
Parameter Unit R1 R2 R3 Sludge age day 5 15 30 Sludge concentration g/l 1.2 2.9 4.1 Ptotal in sludge % 1.92 1.84 2.01 Excess sludge volume ml/day 1.8 0.6 0.3
Ptotal in excess sludge g/week 0.249 0.192 0.148 Regular monitoring of the operation of reactors R1 – R3 was also carried out for evaluating microscopic image of the activated sludge and its sedimentation properties in relation to different sludge age. Three samples of the activated sludge were taken and analyzed: inoculum from WWTP Dublovice and samples of R1 – R3 on 34th and 84th day of operation. The reactor R1 having the lowest sludge age (5 days) showed the least favorable microscopic image - flakes were current in comparison with other samples of larger sizes and the sludge contained a lower proportion of small, hardly separable fragments biomass, however the structure of the flakes were inadequate (diffused) and the total rate of filamentous microorganisms reached the highest grade. Reactors R2 and R3 were comparable with one another while microscopically activated sludge showed striking differences, however, in terms of overall character flakes (especially small fragments of biomass) and the occurrence of filamentous microorganisms was evaluated as favorable microscopic picture of the reactor R3. In either model reactors prevent development of microorganisms associated with increased biological removal of phosphorus. Assuming that at a higher sludge age required phosphorus purposes for the synthesis are lower and relative to the previous point, it was for the purpose of follow-up experiments recommended to use sludge age of approximately 25 days, which corresponds to the results of chemical analysis. CONCLUSION According to the results it can be said that as less as possible phosphorus in activated sludge can be reached using systems with activated sludge of high age. For that reason sludge age of 30 days is more suitable for phosphorus recovery from a WWTP effluent. REFERENCES Cordell, D., Drangert, J.O., White, S. (2009). The story of phosphorus: Global food security and food for thought.
Global Environmental Change, 19(2), 292-305. Prieto, F.O., Martínez, S.S. (2010). Innovative technologies for urban wastewater treatment plant Vol. VI., Novedar
consolider Spain. Sýkorová, E. (2014). Odstraňování fosforu z odpadních vod a jeho opětovné získávání ve formě struvitu, PhD thesis,
University of Chemistry and Technology (in Czech).
SEWAGE MANAGEMENT AND WASTEWATER TREATMENT 201
Emissivity of Combustion of Sewage Sludge M. Joka and S. Poskrobko* * Department of Civil and Environmental Engineering, Bialystok Technical University, ul. Wiejska 45A, Białystok, Poland (E-mails: [email protected]; [email protected])
AIM OF THE RESEARCH The aim of the study is to present a preliminary verification of a co-firing technology (disposal) of dried sewage sludge with coal. Tests performed on a laboratory set – a grate boiler with a capacity of 25 kW combined with an installation of continuous monitoring combustion gaseous products. It refers to a method of combustion the sewage sludge with various additives of coal where technological data sought, ie. at which participation of conventional calorific fuel utilization, ie. the combustion of sewage sludge is a continuous and low emissions process. Interesting research of sewage sludge incineration is presented in (Werther, 1999) (Leckner, 2004) (Zhao, 2013). However, in these studies the authors did not recognize the spherical form of dry sludge. This form of the precipitate in the combustion process is characterized by a number of procedural difficulties referred in this work. PROPERTIES OF USED FUELS Fuel properties of sewage sludge and coal type "eco pea coal" are shown in Table 1. Table 1. Fuel pproperties of sewage sludge and cool a dry weight basis and elemental composition of flammable substance expressed on a dry ash-free basis
Reparation Moisture content
[%]
Flammable parts [%dm]
Non-flammable parts [%dm]
LHV [kJ/kgdm]
C [%]
H [%]
N [%]
S [%]
Cl [%]
O [%]
Sewage sludge 7.2 69.9 30.1 11 969 33 4.4 4.9 1.7 0.1 55.9
Coal - 91< <9 25 000 - - - 0,45 - -
For the study of low-carbon combustion the following mixture of sewage sludge and coal were prepared: fuel 1 – 10 % coal, 90% of sewage sludge, fuel 2 – 15 % coal, 85 % of sewage sludge, fuel 3 – 20 % coal, 80 % of sewage sludge. METHODS The experiment was conducted at a laboratory scale grate boiler with a maximum power of 25 kW (Figure 1). The study consisted of burning fuel blends of sewage sludge and carbon. (Fuel 1 Fuel 2 Fuel 3) weighing 10 kg per sample. For each case of combustion with the use of an adjustable controller were selected optimum process conditions - the stream of combustion air and the stream of furnace fed fuel. Exhaust gas online analysis were performed on an analyzer MCA10 giving the percentages or (mg·m-3) of combustion gaseous products: CO, CO2, H2O, HCl, NO2, NO, NH3 and O2. Temperatures were measured in the furnace of the boiler and in the flue gas outlet.

SEWAGE MANAGEMENT AND WASTEWATER TREATMENT 202
Figure 1. Laboratory stand RESULTS AND CONCLUSIONS Figure 2 shows the emission in the combustion process for 10, 15, 20 and 100 % of the carbon in the fuel mixture sawage sludge/carbon. In the case of 10 % and 15 % (low emissions of HCl and SO2), the process is characterized by the low temperatures of the exhaust gas in the flue 165 °C and 100 °C, which greatly hinder the stable operation of efficient heat exchange in the heat exchanger of the boiler. The low temperature in the furnace (Figure 3) resulted in NH3 emissions contained in the sawage sludge. Ammonia, due to low temperature firing does not oxidize to the form of NOx and H2O. The stability of the combustion process was obtained for the fuel 3 of which the share of coal was 20 %. Under these conditions, the process was characterized by high emissions of SO2 and above the normative issue of HCl. In order to achieve low emission of gaseous product is used a fuel additive as lime sorbents (Poskrobko, 2012) (Philippek, 1996). Despite the high calorific value of sludge 11,969 kJ·m-3 sludge without the addition of 20 % coal does not burn efficiently in an automatic way. The dried sludge pellets spherical surface tan rich, leaving unburned carbon in the ash and residue grille, which significantly reduces boiler efficiency. Research has shown that drying with simultaneous pelletising worsen spherical pellet combustion process in the grate boiler. Such fuel can be efficiently burned in a two-stage technology ie. the Io gasification and combustion of the syngas in the IIo (Poskrobko, 2012).
REFERENCES Leckner B., Amand L.-E., Lucke K., Werther J. (2004). Gaseous emissions from co-combustion of sewage sludge and
coal/wood in a fluidized bed. Fuel, 83, 477-486. Philippek C. (1996). Sewage sludge incineration in the circulating fluidised bed. Ph.D. Dissertation, Technical
University of Hamburg, Hamburg, Germany. Poskrobko S., Król D., Łach J. (2012). Hydrogen chloride bonding with calcium hydroxide in combustion and two-
stage combustion of fuels from waste. Energy&Fuels, 26, 842-853. Werther J., Ogada T. (1999). Sewage sludge combustion. Progress in energy and combustion science, 25, 55-116. Zhao P., Chen H., Ge S., Yoshikawa K. (2013). Effect of the hydrothermal pretreatment for the reduction of NO
emission from sewafe sludge combustion. Applied Energy, 111, 199-205.
Figure 2. Amount of SO2 and HCl in exhaust gas depending on the coal content in the fuel mixture
Figure 3. Amount of HCl, SO2, CO and NH3 in exhaust gas depending on the boiler outlet temperature

SEWAGE MANAGEMENT AND WASTEWATER TREATMENT 203
Thermodynamic Study of Phosphate Adsorption onto Iron Oxy-Hydroxides K. Kalaitzidou*, A. Zouboulis** and M. Mitrakas* * Department of Chemical Engineering, Aristotle University of Thessaloniki, 54124, Thessaloniki, Greece (E-mails: [email protected]; [email protected]) ** Department of Chemistry, Aristotle University of Thessaloniki, 54124, Thessaloniki, Greece (E-mail: [email protected])
INDRODUCTION Phosphorus is an essential nutrient for plant growth and all living organism. So, human activities decrease phosphate’s rock reserves due to fertilizer production, which in turn results in phosphorus accumulation on aquatic environment causing eutrophication. Various chemical and biological methods are being examined for phosphorus removal. Adsorption is a very promising technique since it achieves near zero residual concentrations and has low operation cost (You et al., 2016). The synthesis and application of iron oxy-hydroxides (FeOOH) to water and wastewater treatment for the removal of phosphorus have attracted considerable attention in recent years (Kunaschk et al., 2015). Their advantages are the commercial availability and considerable low cost, as well the fact that they can be regenerated. The aim of this study was to examine the effect of temperature on FeOOH adsorption efficiency. MATERIALS AND METHODS The thermodynamic parameters were evaluated to the commercially available FeOOH GFH and Bayoxide, which nominally consist of akaganeite and goethite respectively, the binary iron / manganese oxy-hydroxide (Fe-MnOOH) AquAsZero, nominally consisting of Mn(IV)-feroxyhyte (Tresintsi et al., 2013), as well as two laboratory synthesized FeOOH, consisting mainly of schwertmannite and lepidocrocite (Tresintsi et al., 2012). The main physicochemical parameters of adsorbents studied are shown in Table 1. Batch adsorption experiments were carried out in order to record the respective isotherms for the evaluation of adsorbents’ efficiency. An amount of 15-70 mg of fine powdered samples was dispersed in 200 mL of phosphate-containing solutions at pH 7 in 300 mL conical flasks. The flasks were placed in an orbital shaker and stirred for 24 h at 20o C. Table 1. Main physicochemical characteristics of iron oxy-hydroxides studied
Oxy-hydroxide Fe, wt.% Mn, wt.% BET [m2/g] IEP ZPC mmol [OH-]/g GFH (akaganeite) 54±1 - 237 7.2 5.2 0.9
Bayoxide (goethite) 52±1 - 135 7.4 7.8 0.3 Schwertmannite 45±1 - 53 7.2 2.9 3.2
Lepidocrocite 50±1 - 155 7.3 4.2 1.6 Mn(IV) feroxyhyte 38±1 11.8±0.5 205 7.2 3.2 2.6
RESULTS The study of temperature effect on phosphate adsorption onto iron oxy-hydroxides resulted in calculation of thermodynamic parameters, such as Gibbs free energy (ΔG°), enthalpy (ΔH°), and entropy (ΔS°), which in turn illustrates the strength of adsorption bond. The evaluation of temperature effect took place in aqueous phosphate solutions in distilled and NSF water matrix.

SEWAGE MANAGEMENT AND WASTEWATER TREATMENT 204
Table 2. Summary of the thermodynamic parameters for the adsorbents examined
Adsorbent ΔHo
[kJ/mole] ΔSo
[J/mole K] - ΔGo [kJ/mol] Q3, at 293K
283 K 293 K 308 K mg P/g
Distilled water GFH 31 225 33 34 38 30.1
Bayoxide -12 79 34 35 36 19.4 Schwertmannite 35 243 34 37 40 79.9 Lepidocrocite -8 91 33 34 35 40.8
Mn(IV) feroxyhyte 7 141 33 34 36 42.3 NSF water
GFH 13 150 29 30 33 33.4 Bayoxide (goethite) - 17 52 32 32 33 24.2
Schwertmannite 3 115 29 30 32 45.7 Lepidocrocite 8 132 30 31 33 52.1
Mn(IV) feroxyhyte 3 114 30 31 32 54.8
The negative values of ΔGo at the temperature range commonly encountered in environmental samples (283–308 K) indicate the spontaneous nature of phosphate adsorption for samples tested, while the positive value of ΔSo suggests the increased randomness at the solid/solution interface during the adsorption of phosphate (Table 2). However, the results considering ΔHo values as well as the adsorption capacity at equilibrium concentration 3 mg PO4
3-/L (Q3 value) (i.e. 1 mg P/L) are contradictable. In all cases ΔHo values decreased at NSF water matrix most probably due to the presence of calcium ions, which in contrast favour adsorption as concluded from Q3 values. The reverse behaviour of schwertmannite should be attributed to high sulphate (16 wt.%) content (Tresintsi et al., 2012) which attracts calcium interfering thus phosphate adsorption. GFH and schwertmannite showed ΔHo value greater than 30 kJ/mole at distilled water matrix, indicating a weak chemisorption. ΔHo values of all samples indicate physisorption at NSF water matrix, pH 7 and equilibrium concentration range 0.3 to 3 mg PO4
3-/L practiced in this study, i.e. under conditions commonly met in the environment. CONCLUSIONS The thermodynamic parameters indicate that the matrix of natural water affects significantly phosphate’s adsorption process. The low values of ΔΗο indicate physisorption, while the negative values of ΔGo illustrate the spontaneous nature of phosphate adsorption. The ions of natural water favor adsorption of phosphate through calcium bridging, however, with weaker bonds. REFERENCES Kunaschk, M., Schmalz, V., Dietrich, N., Dittmar, T., and Worch, E. (2015). Novel regeneration method for phosphate
loaded granular ferric(hydroxide) – A contribution to phosphorus recycling. Water Research, 71, 219-226. Tresintsi, S., Simeonidis, K., Estradé, S., Martinez-Boubeta, C., Vourlias, G., Pinakidou, F., Katsikini, M., Paloura, E.,
Stavropoulos, G. and Mitrakas, M. (2013). Tetravalent manganese feroxyhyte: a novel nano-adsorbent equally selective for As(III) and As(V) removal from drinking water. Environmental Science Technology, 47, 9699-9705.
Tresintsi, S., Simeonidis, K., Vourlias, G., Stavropoulos, G. and Mitrakas, M. (2012). Kilogram-scale synthesis of iron oxy-hydroxides with improved arsenic removal capacity: Study of Fe(II) oxidation-precipitation parameters, Water Research, 46(16), 5255-5267.
You, X., Farran, A., Guaya, D., Valderrama, C., Soldatov V. and Cortina, J. (2016). Phosphate removal from aqueous solutions using a hybrid fibrous exchanger containing hydrated ferric oxide nanoparticles. Journal of Environmental Chemical Engineering, 4(1), 388-397.

SEWAGE MANAGEMENT AND WASTEWATER TREATMENT 205
Model Based Evaluation of a Full-Scale Industrial Wastewater Treatment Plant with Limited Monitoring Data G. Kırım* and Ö. Karahan Özgün** * io Environmental Solutions Research and Development Co., ITU Ayazağa Kampüsü, Teknokent Arı-1, No:11, 34469 Maslak, İstanbul, Turkey (E-mail: [email protected]) ** Department of Environmental Engineering, İstanbul Technical University, ITU Ayazağa Kampüsü, 34469 Maslak, İstanbul, Turkey (E-mail: [email protected])
INTRODUCTION WWTP modelling and dynamic simulation became an important tool for the scientific studies and general wastewater treatment practice (Langergraber, et al., 2004). The advantage of having to simultaneously ensure effluent requirements, process safety, investment and operation costs make modelling a useful tool for designers (Rivas, et al., 2008). This study presents the results of a modelling study carried out in an industrial WWTP. It is aimed to improve treatment performance in terms of nitrogen removal and energy optimization via modelling. The WWTP in Ergene region which is one of the highly polluted water basins in Turkey. It is a large scale textile dyeing and printing plant. The WWTP has 4,500 m3/day treatment capacity. It is designed and operated as an extended aeration activated sludge system for organic matter removal and nitrification only. Current discharge criteria for textile industry are just for COD and TKN in Turkey. MATERIALS AND METHODOLOGY GPS-X simulator is used as modelling platform and ASM1 activated sludge model is used to represent biochemical process. Specifications of each treatment units, monitoring data of influent for the period of 2010-2012 and effluent for 2010-2014 could be provided (for COD and NH4-N only). A measurement campaign was carried out to fill the gap in existing plant data. Additional parameters monitored in influent, biological reactor and effluent for 5 days. Fractions of organic material, nitrogen and total suspended solids were specified. Monitoring results are also used to set up and run the model. Model is calibrated by using 5 days-monitoring results. First, the model run without changing any default parameters in the model to reach steady state condition by using average of 5 days influent pollution concentrations. Then, dynamic simulation according to monitoring results for COD, NH4-N, TKN, TSS and VSS was done. Electricity consumption of the plant is also considered in calibration procedure. Manual calibration is done by changing kinetic and stoichiometric model parameters until get a harmony in model results and analyze results for effluent. Literature values are considered for calibration (Table 1). Calibrated model is verified with recorded plant monitoring data. Verification is done for the time period 2010-2012 since wastewater characterization analyses exist both for influent and effluent in this period.
Figure 1. Model calibration graphs for effluent in terms of COD, NH4-N and energy respectively
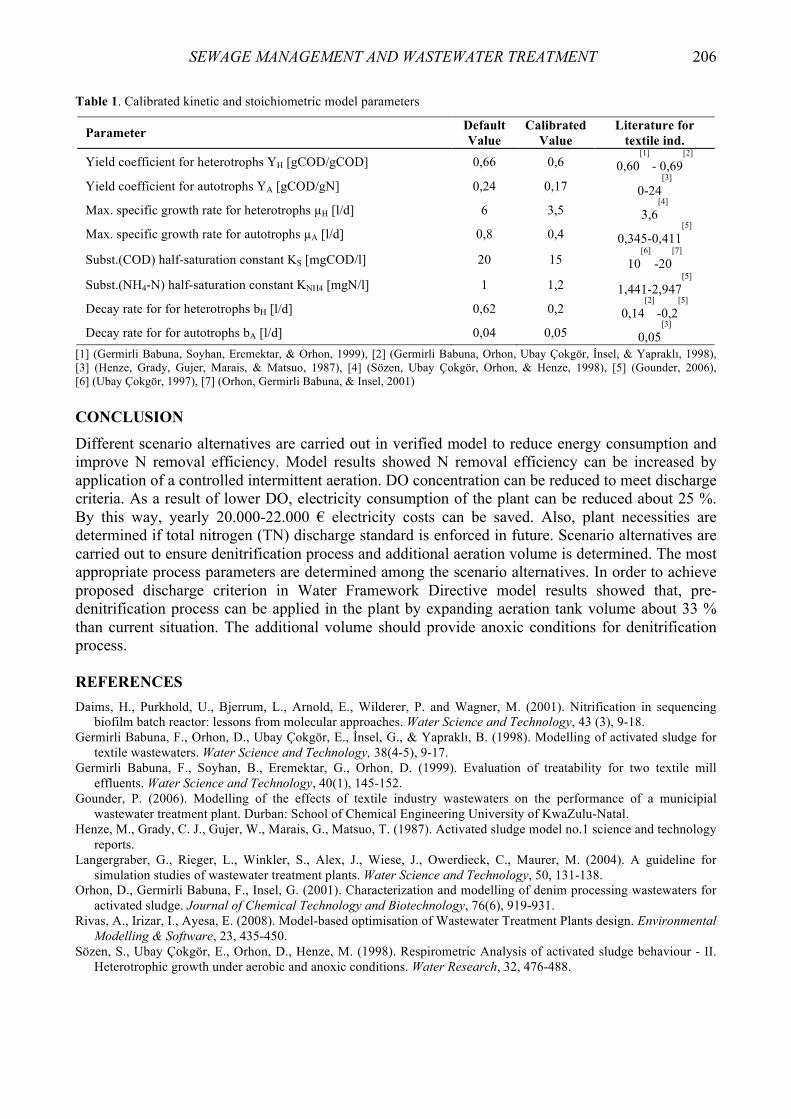
SEWAGE MANAGEMENT AND WASTEWATER TREATMENT 206
Table 1. Calibrated kinetic and stoichiometric model parameters
Parameter Default Value
Calibrated Value
Literature for textile ind.
Yield coefficient for heterotrophs YH [gCOD/gCOD] 0,66 0,6 0,60[1]
- 0,69[2]
Yield coefficient for autotrophs YA [gCOD/gN] 0,24 0,17 0-24
[3]
Max. specific growth rate for heterotrophs µH [l/d] 6 3,5 3,6
[4]
Max. specific growth rate for autotrophs µA [l/d] 0,8 0,4 0,345-0,411
[5]
Subst.(COD) half-saturation constant KS [mgCOD/l] 20 15 10
[6]
-20[7]
Subst.(NH4-N) half-saturation constant KNH4 [mgN/l] 1 1,2 1,441-2,947
[5]
Decay rate for for heterotrophs bH [l/d] 0,62 0,2 0,14
[2]
-0,2[5]
Decay rate for for autotrophs bA [l/d] 0,04 0,05 0,05
[3]
[1] (Germirli Babuna, Soyhan, Eremektar, & Orhon, 1999), [2] (Germirli Babuna, Orhon, Ubay Çokgör, İnsel, & Yapraklı, 1998), [3] (Henze, Grady, Gujer, Marais, & Matsuo, 1987), [4] (Sözen, Ubay Çokgör, Orhon, & Henze, 1998), [5] (Gounder, 2006), [6] (Ubay Çokgör, 1997), [7] (Orhon, Germirli Babuna, & Insel, 2001) CONCLUSION Different scenario alternatives are carried out in verified model to reduce energy consumption and improve N removal efficiency. Model results showed N removal efficiency can be increased by application of a controlled intermittent aeration. DO concentration can be reduced to meet discharge criteria. As a result of lower DO, electricity consumption of the plant can be reduced about 25 %. By this way, yearly 20.000-22.000 € electricity costs can be saved. Also, plant necessities are determined if total nitrogen (TN) discharge standard is enforced in future. Scenario alternatives are carried out to ensure denitrification process and additional aeration volume is determined. The most appropriate process parameters are determined among the scenario alternatives. In order to achieve proposed discharge criterion in Water Framework Directive model results showed that, pre-denitrification process can be applied in the plant by expanding aeration tank volume about 33 % than current situation. The additional volume should provide anoxic conditions for denitrification process. REFERENCES Daims, H., Purkhold, U., Bjerrum, L., Arnold, E., Wilderer, P. and Wagner, M. (2001). Nitrification in sequencing
biofilm batch reactor: lessons from molecular approaches. Water Science and Technology, 43 (3), 9-18. Germirli Babuna, F., Orhon, D., Ubay Çokgör, E., İnsel, G., & Yapraklı, B. (1998). Modelling of activated sludge for
textile wastewaters. Water Science and Technology, 38(4-5), 9-17. Germirli Babuna, F., Soyhan, B., Eremektar, G., Orhon, D. (1999). Evaluation of treatability for two textile mill
effluents. Water Science and Technology, 40(1), 145-152. Gounder, P. (2006). Modelling of the effects of textile industry wastewaters on the performance of a municipial
wastewater treatment plant. Durban: School of Chemical Engineering University of KwaZulu-Natal. Henze, M., Grady, C. J., Gujer, W., Marais, G., Matsuo, T. (1987). Activated sludge model no.1 science and technology
reports. Langergraber, G., Rieger, L., Winkler, S., Alex, J., Wiese, J., Owerdieck, C., Maurer, M. (2004). A guideline for
simulation studies of wastewater treatment plants. Water Science and Technology, 50, 131-138. Orhon, D., Germirli Babuna, F., Insel, G. (2001). Characterization and modelling of denim processing wastewaters for
activated sludge. Journal of Chemical Technology and Biotechnology, 76(6), 919-931. Rivas, A., Irizar, I., Ayesa, E. (2008). Model-based optimisation of Wastewater Treatment Plants design. Environmental
Modelling & Software, 23, 435-450. Sözen, S., Ubay Çokgör, E., Orhon, D., Henze, M. (1998). Respirometric Analysis of activated sludge behaviour - II.
Heterotrophic growth under aerobic and anoxic conditions. Water Research, 32, 476-488.
SEWAGE MANAGEMENT AND WASTEWATER TREATMENT 207
Introduction of Lecane Tenuiseta Rotifers into SBR-Model System Improves Sludge Settle Ability at Low Temperature W. Kocerba-Soroka, E. Fiałkowska, A. Pajdak-Stós, M. Sobczyk, J. Starzycka and J. Fyda* * Institute of Environmental Sciences, Jagiellonian University, Gronostajowa 7, 30-387 Kraków, Poland, (E-mail: [email protected])
INTRODUCTION Recently proposed method of using rotifers to prevent bulking in wastewater treatment plants (WWTPs) seems to be the most universal because the rotifers feed on different types of filamentous bacteria. The method is also safe due to the fact that no negative effect was observed in the activated sludge biocenosis and effluent. It has been shown that several species of Lecane rotifers are able to ingest filaments and control their overproliferation. Nevertheless, the question of proper conditions to achieve the density at the level preventing activated sludge bulking is still open. It seems that some of rotifers species may complement or even replace each other according to the seasonal temperature fluctuations. Lecane tenuiseta rotifers are clearly better adapted to lower temperatures in comparison to Lecane inermis. Both species are effective consumers of filamentous bacteria from activated sludge. The main aim of this work was to examine if rotifers Lecane tenuiseta are able to proliferate or at least maintain the initial, earlier determined density after being artificially implemented into the model sequencing batch reactors which simulate the wastewater treatment process at 13 °C at which the rotifers of Lecane inermis species has limited chance to survive. Then we checked if the maintained density of L.tenuiseta is sufficient to prevent bulking and reduce sludge volume index (SVI). We also determined whether artificial introduction of this species affect chemical parameters of the effluent. MATERIALS AND METHODS The experiment was conducted in five laboratory-scale bioreactors (New Brunswick Scientific), which simulated the process in Sequencing Batch Reactors (SBRs). During the process three 8-hours phases worked in the same pattern: 2 h agitation (including feeding), 5h aeration and agitation, 1h sedimentation and treated sewage removal. The physical parameters were operated automatically as follows: 70 rpm agitation, 13°C, 10% dissolved oxygen (1mgO2/L). The pH value at the level of 7 was maintained by software controlled addition of 2.5% NaOH solution. Activated sludge used in experiment was derived from municipal wastewater treatment plant. According to Eikelboom’s analysis (Eikelboom, 2000) the Filament Index in this sludge was at the level of 2.5 (0-5 scale) with Microthix parvicella as a dominant bacterium. The plant from which activated sludge was taken has been earlier investigated in the framework of the project concerning the usage of Lecane inermis rotifers to prevent bulking of activated sludge. Several weeks before the experiment L. inermis rotifers were artificially implemented into aeration reactor. However, the rotifers were not detected in samples taken two and three weeks after the implementation. Most probably low temperature (below 10 °C) limited the reproduction of the rotifers as their optimal temperature for growth is 28 °C. Therefore, we decided to check another species of Lecane which is also known as a consumer of filamentous bacteria and is better adapted to lower temperature.

SEWAGE MANAGEMENT AND WASTEWATER TREATMENT 208
Lecane tenuiseta clone were isolated from wastewater treatment plant and has been cultured under laboratory conditions. The culture was constantly kept in Petri dishes in climate chamber at 15 °C in darkness. As a medium Żywiec brand spring water with dried nutrition powder was used. One litter of activated sludge was poured into each of five bioreactors. Then the vessels were divided into two groups: into three of them the culture of Lecane tenuiseta was added, and two other were treated as control. The density of L.tenuiseta at the start of experiment was 200 ind/mL. The experiment lasted two weeks. At the end of experiment SVI, Density Factor of filaments, suspended solids (SS) and chemical parameters such as COD, N-NH4, Ntotal, P-PO4 were measured. RESULTS The wastewater treatment process maintained in laboratory scale bioreactors was highly effective. The reduction of chemical parameters such as COD, N-NH4 and P-PO4 at the end of experiment were very high and reached above 97 % in each vessel. Very low values of N-NH4 and P-PO4 indicate that the processes of nitrification, denitrification and dephosphatation were highly efficient. There were no differences in these parameters between treatment and control vessels. The differences are noticeable in sludge volume after 30 minutes of sedimentation and in SVI. These parameters were lower in treatment vessels (390 mL) in comparison to control group (490 mL). The values of Sludge Volume Index are also reflected in density of filaments but only in one control vessel. When we compare mean value of DF from three treatment bioreactors and two controls this value was 1.2 times lower in treatment. The number of L. tenuiseta in each treatment bioreactor remained at the level of ca. 200 ind/mL, except for one of the treatment bioreactor in which density on 7th day reached 266 ind/mL. DISCUSSION Maintaining the sewage treatment process under laboratory condition is very complicated due to the possibility of fast proliferation of some species which are too rare to be noticed in samples from real scale plant. In the more stable conditions in the laboratory, under higher temperature or less harmful sewage such a species can achieve high density and change the biocenosis composition. Artificial introduction of Lecane rotifers into activated sludge is intended to prevent overproliferation of filamentous bacteria and reduce the problem with bulking of activated sludge. Our previous research shown that several species from Lecane genus are able to feed on filaments (Pajdak-Stós et al. submitted) and that Lecane inermis does not affect the effluent quality (Kocerba-Soroka et al., 2013). Similar effect was observed in our experiment with Lecane tenuiseta. High density of these rotifers improves the sedimentation properties and does not have negative side-effects. Rotifers introduction did not affect the chemical parameters of the effluent.. The differences in SVI values between treatment and control groups would have been more pronounced but for the presence of Lecane inermis in one of the control vessel. This species has been earlier introduced to treatment plant but we did not observed any individuals in subsamples of activated sludge before experiment. Probably laboratory conditions with higher temperature than that in the plant allowed their proliferation. If compare only one control vessel where the rotifers were absent with the treatment group SVI is higher in control. This experiment also proved that Lecane tenuiseta in the density of ca. 200 ind/mL does not negatively affect chemical parameters of the effluent and can be used as complementary filaments grazer in WWTPs in a low temperature for example in winter season. REFERENCES Eikelboom, D. H. (2000). Process control of activated sludge plants by microscopic investigation. London IWA
publishing 2000, 85-102. Kocerba-Soroka, W., Fiałkowska, E., Pajdak-Stós, A., Sobczyk, M., Pławecka, M., & Fyda, J. (2013). Effect of the
rotifer Lecane inermis, a potential sludge bulking control agent, on process parameters in a laboratory-scale SBR system. Water Science & Technology, 68(9), 2012-2018.
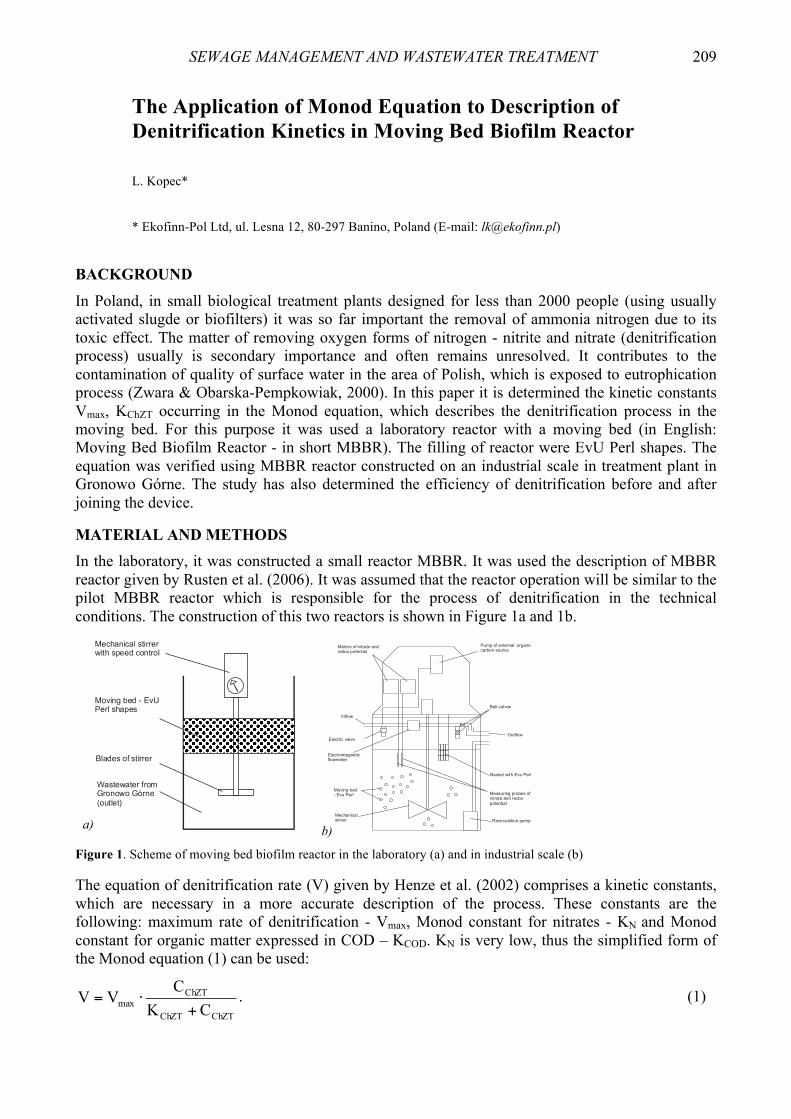
SEWAGE MANAGEMENT AND WASTEWATER TREATMENT 209
The Application of Monod Equation to Description of Denitrification Kinetics in Moving Bed Biofilm Reactor L. Kopec* * Ekofinn-Pol Ltd, ul. Lesna 12, 80-297 Banino, Poland (E-mail: [email protected])
BACKGROUND In Poland, in small biological treatment plants designed for less than 2000 people (using usually activated slugde or biofilters) it was so far important the removal of ammonia nitrogen due to its toxic effect. The matter of removing oxygen forms of nitrogen - nitrite and nitrate (denitrification process) usually is secondary importance and often remains unresolved. It contributes to the contamination of quality of surface water in the area of Polish, which is exposed to eutrophication process (Zwara & Obarska-Pempkowiak, 2000). In this paper it is determined the kinetic constants Vmax, KChZT occurring in the Monod equation, which describes the denitrification process in the moving bed. For this purpose it was used a laboratory reactor with a moving bed (in English: Moving Bed Biofilm Reactor - in short MBBR). The filling of reactor were EvU Perl shapes. The equation was verified using MBBR reactor constructed on an industrial scale in treatment plant in Gronowo Górne. The study has also determined the efficiency of denitrification before and after joining the device. MATERIAL AND METHODS In the laboratory, it was constructed a small reactor MBBR. It was used the description of MBBR reactor given by Rusten et al. (2006). It was assumed that the reactor operation will be similar to the pilot MBBR reactor which is responsible for the process of denitrification in the technical conditions. The construction of this two reactors is shown in Figure 1a and 1b.
Mechanical stirrer with speed control
Moving bed - EvU Perl shapes
Blades of stirrer
Wastewater from Gronowo Górne (outlet)
Moving bed - Evu Perl
Basket with Evu Perl
Outflow
Ball valves
Inflow
Electric valve
Mechanical stirrer
Meters of nitrate and redox potential
Electromagnetic flowmeter
Recirculation pump
Measuring probes of nitrate and redox potential
Pump of external organic carbon source
Figure 1. Scheme of moving bed biofilm reactor in the laboratory (a) and in industrial scale (b) The equation of denitrification rate (V) given by Henze et al. (2002) comprises a kinetic constants, which are necessary in a more accurate description of the process. These constants are the following: maximum rate of denitrification - Vmax, Monod constant for nitrates - KN and Monod constant for organic matter expressed in COD – KCOD. KN is very low, thus the simplified form of the Monod equation (1) can be used:
ChZTChZT
ChZTmax CK
CVV
+⋅= . (1)
a) b)
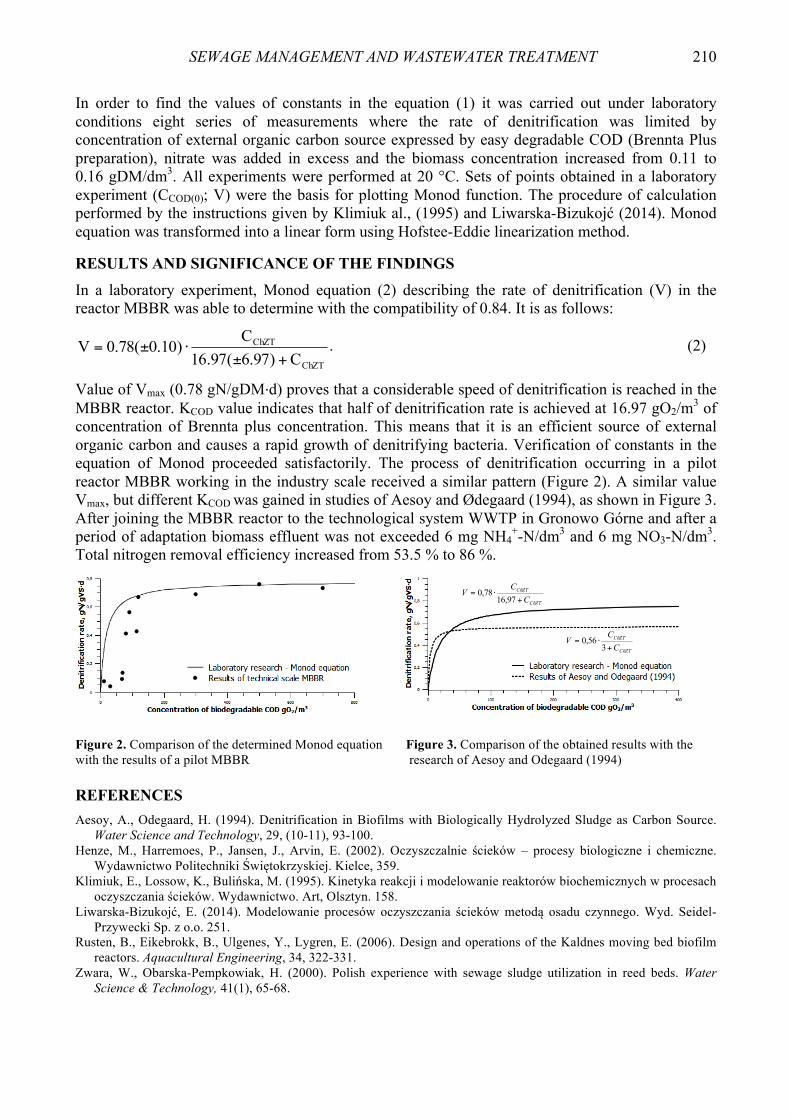
SEWAGE MANAGEMENT AND WASTEWATER TREATMENT 210
In order to find the values of constants in the equation (1) it was carried out under laboratory conditions eight series of measurements where the rate of denitrification was limited by concentration of external organic carbon source expressed by easy degradable COD (Brennta Plus preparation), nitrate was added in excess and the biomass concentration increased from 0.11 to 0.16 gDM/dm3. All experiments were performed at 20 °C. Sets of points obtained in a laboratory experiment (CCOD(0); V) were the basis for plotting Monod function. The procedure of calculation performed by the instructions given by Klimiuk al., (1995) and Liwarska-Bizukojć (2014). Monod equation was transformed into a linear form using Hofstee-Eddie linearization method. RESULTS AND SIGNIFICANCE OF THE FINDINGS In a laboratory experiment, Monod equation (2) describing the rate of denitrification (V) in the reactor MBBR was able to determine with the compatibility of 0.84. It is as follows:
ChZT
ChZT
C)97.6(97.16C
)10.0(78.0V+±
⋅±= . (2)
Value of Vmax (0.78 gN/gDM·d) proves that a considerable speed of denitrification is reached in the MBBR reactor. KCOD value indicates that half of denitrification rate is achieved at 16.97 gO2/m3 of concentration of Brennta plus concentration. This means that it is an efficient source of external organic carbon and causes a rapid growth of denitrifying bacteria. Verification of constants in the equation of Monod proceeded satisfactorily. The process of denitrification occurring in a pilot reactor MBBR working in the industry scale received a similar pattern (Figure 2). A similar value Vmax, but different KCOD was gained in studies of Aesoy and Ødegaard (1994), as shown in Figure 3. After joining the MBBR reactor to the technological system WWTP in Gronowo Górne and after a period of adaptation biomass effluent was not exceeded 6 mg NH4
+-N/dm3 and 6 mg NO3-N/dm3. Total nitrogen removal efficiency increased from 53.5 % to 86 %.
Figure 2. Comparison of the determined Monod equation Figure 3. Comparison of the obtained results with the with the results of a pilot MBBR research of Aesoy and Odegaard (1994) REFERENCES Aesoy, A., Odegaard, H. (1994). Denitrification in Biofilms with Biologically Hydrolyzed Sludge as Carbon Source.
Water Science and Technology, 29, (10-11), 93-100. Henze, M., Harremoes, P., Jansen, J., Arvin, E. (2002). Oczyszczalnie ścieków – procesy biologiczne i chemiczne.
Wydawnictwo Politechniki Świętokrzyskiej. Kielce, 359. Klimiuk, E., Lossow, K., Bulińska, M. (1995). Kinetyka reakcji i modelowanie reaktorów biochemicznych w procesach
oczyszczania ścieków. Wydawnictwo. Art, Olsztyn. 158. Liwarska-Bizukojć, E. (2014). Modelowanie procesów oczyszczania ścieków metodą osadu czynnego. Wyd. Seidel-
Przywecki Sp. z o.o. 251. Rusten, B., Eikebrokk, B., Ulgenes, Y., Lygren, E. (2006). Design and operations of the Kaldnes moving bed biofilm
reactors. Aquacultural Engineering, 34, 322-331. Zwara, W., Obarska-Pempkowiak, H. (2000). Polish experience with sewage sludge utilization in reed beds. Water
Science & Technology, 41(1), 65-68.
ChZT
ChZT
CC
V+
⋅=97,16
78,0
ChZT
ChZT
CC
V+
⋅=3
56,0
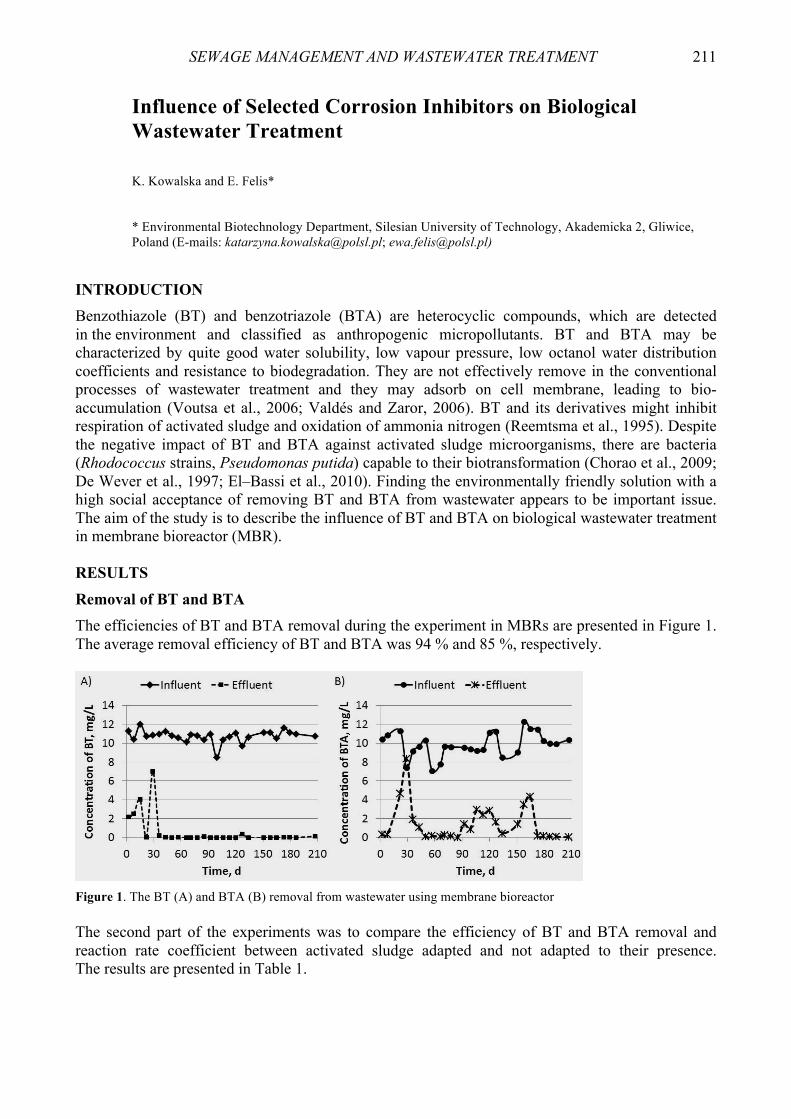
SEWAGE MANAGEMENT AND WASTEWATER TREATMENT 211
Influence of Selected Corrosion Inhibitors on Biological Wastewater Treatment K. Kowalska and E. Felis* * Environmental Biotechnology Department, Silesian University of Technology, Akademicka 2, Gliwice, Poland (E-mails: [email protected]; [email protected])
INTRODUCTION Benzothiazole (BT) and benzotriazole (BTA) are heterocyclic compounds, which are detected in the environment and classified as anthropogenic micropollutants. BT and BTA may be characterized by quite good water solubility, low vapour pressure, low octanol water distribution coefficients and resistance to biodegradation. They are not effectively remove in the conventional processes of wastewater treatment and they may adsorb on cell membrane, leading to bio-accumulation (Voutsa et al., 2006; Valdés and Zaror, 2006). BT and its derivatives might inhibit respiration of activated sludge and oxidation of ammonia nitrogen (Reemtsma et al., 1995). Despite the negative impact of BT and BTA against activated sludge microorganisms, there are bacteria (Rhodococcus strains, Pseudomonas putida) capable to their biotransformation (Chorao et al., 2009; De Wever et al., 1997; El–Bassi et al., 2010). Finding the environmentally friendly solution with a high social acceptance of removing BT and BTA from wastewater appears to be important issue. The aim of the study is to describe the influence of BT and BTA on biological wastewater treatment in membrane bioreactor (MBR). RESULTS Removal of BT and BTA The efficiencies of BT and BTA removal during the experiment in MBRs are presented in Figure 1. The average removal efficiency of BT and BTA was 94 % and 85 %, respectively.
Figure 1. The BT (A) and BTA (B) removal from wastewater using membrane bioreactor The second part of the experiments was to compare the efficiency of BT and BTA removal and reaction rate coefficient between activated sludge adapted and not adapted to their presence. The results are presented in Table 1.

SEWAGE MANAGEMENT AND WASTEWATER TREATMENT 212
Table 1. Results of BT and BTA removal from synthetic domestic wastewater using batch tests
Activated sludge
Adapted to BT Not adapted to BT Adapted to BTA Not adapted to BTA Reaction rate coefficient, [mg/(L·h] 0.3058 0.0197 0.2890 0.0034
Removal efficiency [%] 100 67 100 15 The adaptation of activated sludge to the occurrence of studied substances caused that the transformation process was about 16 and 85 times faster accordingly for BT and BTA as it was observed in the case of the not adapted sludge. Influence of BT and BTA on nitrification The results of nitrification inhibition test according to ISO 9509:2006 (Water quality - Toxicity test for assessing the inhibition of nitrification of activated sludge microorganisms) are presented in Table 2. Table 2. Results of nitrification inhibition test according to ISO 9509:2006 including inhibition of nitrate formation and ammonium transformation
Benzothiazole Benzotriazole EC50 [mg/L] R2 EC50 [mg/L] R2 Inhibition of nitrate formation 10.23 0.9471 5.50 0.9774 Inhibition of ammonium transformation 17.78 0.9631 10.00 0.9501
Influence of BT and BTA on organic compounds removal Due to non-normal distribution of COD removal variables, the influence of BT and BTA on organic compounds removal was analysed using Kruskal–Wallis one-way analysis at P < 0.05 (Statistica Software, version 10.0, StatSoft Inc., USA). The results of statistical test did not show the statistically significant differences of COD removal variance between control reactor (without BT and BTA addition) and two other MBRs fed by wastewater containing of 10 mg/L BT and BTA standards, respectively (H(2, N = 126 = 4.558 p = 0.1024). It means that the occurrence of these compounds in the wastewater did not influence on the efficiency of COD removal. CONCLUSIONS After an adaptation of activated sludge to BT and BTA (10 mg/L), studied substances may be efficiently removed from the synthetic wastewater. The removal efficiencies of BT/BTA and the reaction rate coefficient are depended on adaptation activated sludge microorganisms to presence of tested compounds. BT and BTA may inhibit nitrification, but BTA have higher negative impact on ammonium transformation and nitrate formation than BT. The studied substances did not show the statistically significant influence on organic substances removal. REFERENCES Chorao, C., Charmantray, F., Besse-Hoggan, P., Sancelme, M., Cincilei, A., Traïkia, M., Mailhot, G. and Delort, A.M.
(2009). 2-Aminobenzothiazole degradation by free and Ca-alginate immobilized cells of Rhodococcus rhodochrous. Chemosphere, 75(1), 121-128.
De Wever, H., Van Den Neste, S. and Verachtert, H. (1997). Inhibitory effects of 2-Mercaptobenzothiazole on microbial growth in a variety of trophic conditions. Environmental Toxicology& Chemistry, 16 (5), 843-848.
El – Bassi, L., Iwasaki, H., Oku, H., Shinzato, N. and Matsui, T. (2010). Biotransformation of benzothiazole derivatives by the Pseudomonas putida strain HKT554. Chemosphere, 81(1), 109-113.
Reemtsma, T., Fiehn, O., Kalnowski, G.andJekel, M. (1995). Microbial transformations and biological effects of fungicide-derived Benzothiazoles determined in industrial wastewater. Environ. Science& Tech., 29 (2), 478-485.
Valdés, H. and Zaror, C.A. (2006). Ozonation of benzothiazole saturated-activated carbons: Influence of carbon chemical surface properties. Journals of Hazardous Materials, 137(2), 1042 - 1048.
Voutsa, D., Hartmann, P., Schaffner, C. and Giger W. (2006). Benzotriazoles, alkylphenols and bisphenol A in municipal wastewaters and in the Glatt River, Switzerland. Environ. Science and Pollution Res., 13(5), 333-341.
SEWAGE MANAGEMENT AND WASTEWATER TREATMENT 213
Technology of Anaerobic-Aerobic Treatment Wastewaters from Nitrogen Compounds after Biogas Production O. Kozlovets*, D. Voyevoda** and N. Golub** *Envitec LLC, V.LobanovskogoAvenue 6а, office 153, Kyiv 03037, Ukraine (E-mail: [email protected]) **National Technical University of Ukraine «Kyiv Polytechnic Institute», Peremogy Avenue. 37, Kyiv 03056, Ukraine (E-mails: [email protected],[email protected])
THE THEORETICAL SUBSTANTIATION OF TECHNOLOGY During the process of anaerobic fermentation of farmyard manure, especially from poultry farms, there is a problem with utilization of wastewaters that contains a lot amount of nitrogen compounds (particularly NH4
+). In the most cases, such wastewaters from separator are discharged to special lakes, resulting in the big negative environmental effects. Different types of method modifications are used for wastewater treatment from nitrogen compounds: consecutive or with the recycling of wastewater to the anaerobic-aerobic and anoxide processes, which are ineffective because in fact the reduction of NH4
+-concentration is caused by the microorganism biomass growth, and not by the process of N2 formation, which is released into the atmosphere. Moreover, the high concentration of NH4
+-ions can cause microorganism death or inhibit their life processes. One of the quite new methods is the implementation of anammox-bacteria. Such technology with the usage of special carriers for microorganism immobilization allows to treat wastewater by NH4
+-N-content with the efficiency up to 97%. By the research results, during the process of wastewater treatment with the initial concentration of NH4
+ in 20-50 mg/L, the concentration of NH4
+in 2 mg/L was reached in the final stage of the technology. The object of the research is to develop the technology of treatment of wastewater from methane tanks from nitrogen compounds. We propose the biotechnology in which the appropriate amount of wastewaters from separator is supplied to the aerotank there the nitrification process is taking place with the formation of oxidation nitrogen compounds NO2: NH4
+ → NH2OH → (NOH) → NO2- (1)
The rest part is supplied to the reactor in which under anaerobic condition the methane fermentation and decreasing of the concentration of organic substances are taking place. Effluent is supplied to the anaerobic reactor after aeration, there the denitrification process is carried out resulting in releasing of molecular N2(Lengeler, 2005). NH4
+ + NO2-→N2 + 2Н2О (2)
In addition to the molecular nitrogen, in the anaerobic reactor (denitrificator) of the second stage of digestion, the methane fermentation products are also formed (СН4, Н2S, Н2, СО2). However, as opposed to biogas formed in methanetank, this biogas has a low caloricity and high N2-N content (noncombustible component) and can be used for substrate aeration in the reactor.

SEWAGE MANAGEMENT AND WASTEWATER TREATMENT 214
THE PROPOSED TECHNOLOGY Fermented residues from methane tank 1 goes to the separator 6, where the liquid fractione is separated from the solid one. The solid fraction is stored (in the landfills),there it undergoes the process of natural drying that make it suitable for usage as nitrogen-rich biofertilizer. One part of liquid fraction arrives to the aerotank 7, there NO3
-,NO2- are formed in the nitrification process. The
other NH4+-rich part is supplied from the methane tank (1) by the pump 8 directly the denitrificator
11, there the biogas production process is taking place. Denitrificatoris equipped with a special submersible mixer for intensifying the process of N2- formation; also, for speeding up the process reactor 11 is equipped with special carriers with immobilized microorganisms and other aquatic organisms (2). After treatment from nitrogen compounds, water returns to the methane tank (1) for recycling in methane fermentation. The gas formed in the denitrification reactor 11 via compressor 10 goes to the methane tank 1 for mixing the substrate by bubbling. Nextly, the biogas used as barbotage gas enters the gasholder at the top of reactor 1. Biogas from the gasholder goes to a special filter 2 there it is being purified from H2S and excessive moisture. After purification biogas is supplied to the gasholder 3 and then to the cogenerator 5 via compressor 4.
Figure 1. Closedcircuitofwastewaterusageinthetechnologyofmethanefermentation of poultry manures: 1 – methanetank, 2 – filter for biogas treatment, 3 – gasholder (purified gas), 4 – pump for supplying of purified biogas to the cogenerator, 5 – cogenerator, 6 – separator, 7 – aerotank, 8 – pump for supplying of wastewater for denitrification, 9 – pump for supplying wastewater after nitrification to the denitrification, 10 – compressor(supplying of biogas to the methane tank for barbotage), 11 – reactor-denitrificator, 12 – pump of supplying of purified water to the methane tank RESULTS Such technology allows water recycling during the process of biogas production, that is very important in fermentation of poultry manure as this manure has a lower moisture content than other farmyard manures. Furthermore, the described above technologycan reduce the nitrogen concentration in the wastewater, which in turn will decrease the anthropogenic impact on the environment. It was determined the parameters of the process of methane production during the co-digestion of organic wastes, the parameters of nitrification and denitrification. Additionally to the positive environmental effect, implementation of such technology allows also to produce biofertilizers that contains all necessary components for plant growth. REFERENCES Lengeler, J., Drews, G., Schlegel, G. (2005). The modern microbiology. Prokaryotes., 1, 314-317.

SEWAGE MANAGEMENT AND WASTEWATER TREATMENT 215
The Sewage Sludge Transformation with the Use of Thermal Processes – Gasification D. Król* and G. Gałko**
* Silesian University of Technology, Faculty of Energy and Environmental Engineering, Department of Technologies and Installations for Waste Management, Konarskiego 18, 44-100 Gliwice, Poland (E-mail: [email protected]) ** Silesian University of Technology, Faculty of Energy and Environmental Engineering, Department of Technologies and Installations for Waste Management, Konarskiego 18, 44-100 Gliwice, Poland (E-mail: [email protected])
INTRODUCTION One of the main issues related to technologies of municipal and industrial wastewater treatment are sewage sludge’s. They are formed in each wastewater treatment plant, and have to be dispose due to physical and chemical parameters. The conversion of sewage sludge’s to substances that will be neutral for the environment in view of small emission of gases and leachates and using concluded chemical energy in them should ensure the dispose with thermal processes. The analysis of sewage sludge gasification with using municipal wastewater treatment plant was the aim of this paper. Many process issues like destabilisation of combustion on the grid, can justify the attempt of sewage sludge gasification. The using of additional high calorific fuel like bituminous coal is required to stabilisation in that case. SEWAGE SLUDGE GASIFICATION The thermochemical conversion process of carbon contained in fuel like sewage sludge with using gasification agent is called gasification process. The obtaining various types of gases products, that have different calorific value and composition is possible in according to process conditions and, the applied gasification agent that is participating in gasification process. Combustible gas formation with the highest value of LHV is the purpose of sewage sludge gasification. The chemical reactions leading to obtaining highest content of combustible gases in syngas as: CO, H2, CH4 and CnHm depends on conditions and organize of gasification process. The air-fuel ratio (λ), is the one of the parameters having an impact on the course of fuel changes. To obtain the syngas from sewage sludge gasification, with share of combustible gases in the range from 20 to 32 % in mass of fuel may be preferred to use sewage sludge with the range of 80 to 90 % dry content mass, and using air as the gasification agent with in the quantity of air ratio (λ) from 0.28 to 0.35 (Judex, 2012). The conversion of chemical elements in the range 70 % carbon and 95 % hydrogen contained in sewage sludge allows to obtain syngas s with contents of 24 % combustible gases in where 14 % is hydrogen (H2) (Jian-guo Zhu, 2015). The syngas calorific value depends on its composition. The sewage sludge gasification in the range of temperature from 770 to 850 ºC with using air-steam mixture as the gasification agent allows to obtain the syngas with LHV value 5.49 MJ/Nm3 (Gil-Lalanguna, 2014). The volatile matter content in sewage sludge causes increases of combustible gases content in syngas, what was proved by gasification, with the air-ratio (λ) in the range of value from 0.12 to 0.16 (Werle, 2015).
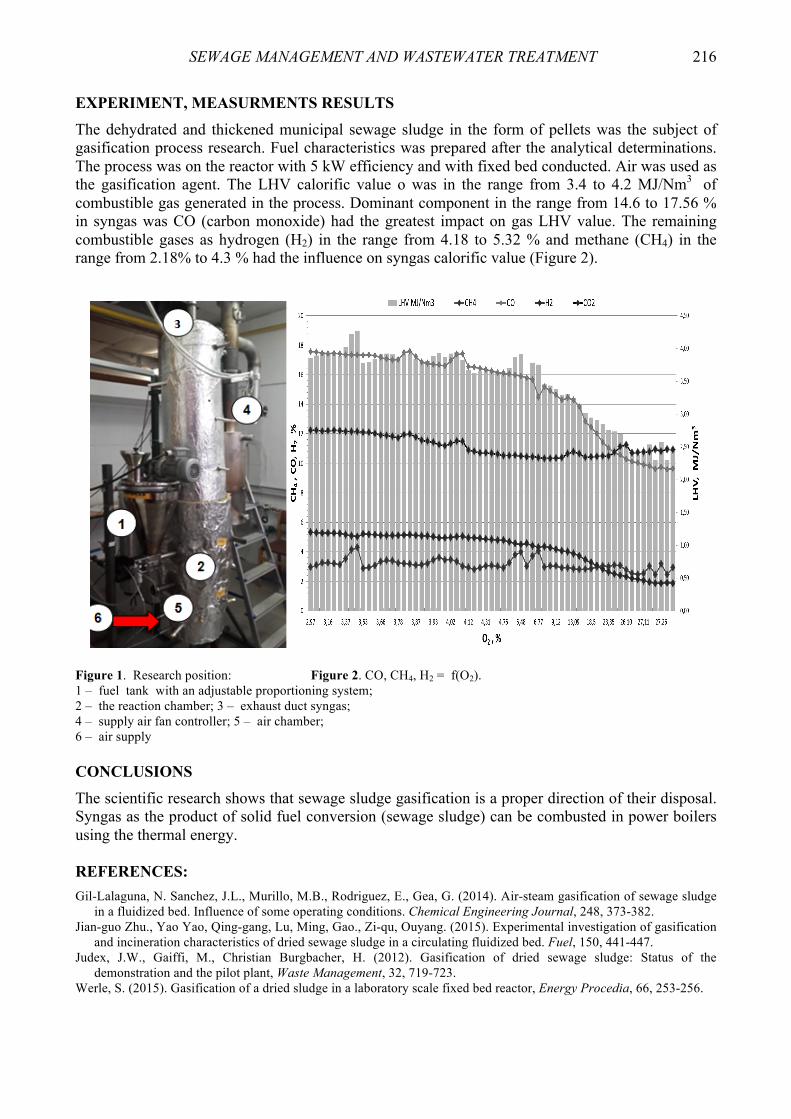
SEWAGE MANAGEMENT AND WASTEWATER TREATMENT 216
EXPERIMENT, MEASURMENTS RESULTS The dehydrated and thickened municipal sewage sludge in the form of pellets was the subject of gasification process research. Fuel characteristics was prepared after the analytical determinations. The process was on the reactor with 5 kW efficiency and with fixed bed conducted. Air was used as the gasification agent. The LHV calorific value o was in the range from 3.4 to 4.2 MJ/Nm3
of combustible gas generated in the process. Dominant component in the range from 14.6 to 17.56 % in syngas was CO (carbon monoxide) had the greatest impact on gas LHV value. The remaining combustible gases as hydrogen (H2) in the range from 4.18 to 5.32 % and methane (CH4) in the range from 2.18% to 4.3 % had the influence on syngas calorific value (Figure 2).
Figure 1. Research position: Figure 2. CO, CH4, H2 = f(O2). 1 – fuel tank with an adjustable proportioning system; 2 – the reaction chamber; 3 – exhaust duct syngas; 4 – supply air fan controller; 5 – air chamber; 6 – air supply CONCLUSIONS The scientific research shows that sewage sludge gasification is a proper direction of their disposal. Syngas as the product of solid fuel conversion (sewage sludge) can be combusted in power boilers using the thermal energy. REFERENCES: Gil-Lalaguna, N. Sanchez, J.L., Murillo, M.B., Rodriguez, E., Gea, G. (2014). Air-steam gasification of sewage sludge
in a fluidized bed. Influence of some operating conditions. Chemical Engineering Journal, 248, 373-382. Jian-guo Zhu., Yao Yao, Qing-gang, Lu, Ming, Gao., Zi-qu, Ouyang. (2015). Experimental investigation of gasification
and incineration characteristics of dried sewage sludge in a circulating fluidized bed. Fuel, 150, 441-447. Judex, J.W., Gaiffi, M., Christian Burgbacher, H. (2012). Gasification of dried sewage sludge: Status of the
demonstration and the pilot plant, Waste Management, 32, 719-723. Werle, S. (2015). Gasification of a dried sludge in a laboratory scale fixed bed reactor, Energy Procedia, 66, 253-256.
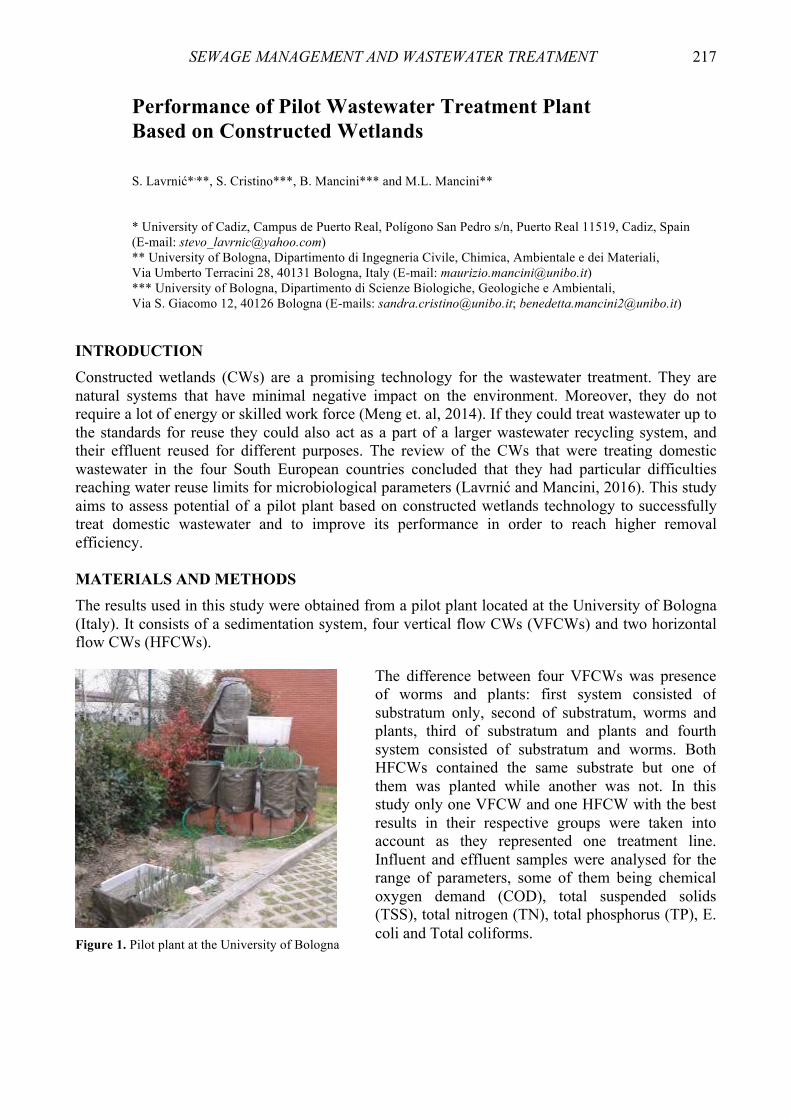
SEWAGE MANAGEMENT AND WASTEWATER TREATMENT 217
Performance of Pilot Wastewater Treatment Plant Based on Constructed Wetlands S. Lavrnić*,**, S. Cristino***, B. Mancini*** and M.L. Mancini** * University of Cadiz, Campus de Puerto Real, Polígono San Pedro s/n, Puerto Real 11519, Cadiz, Spain (E-mail: [email protected]) ** University of Bologna, Dipartimento di Ingegneria Civile, Chimica, Ambientale e dei Materiali, Via Umberto Terracini 28, 40131 Bologna, Italy (E-mail: [email protected]) *** University of Bologna, Dipartimento di Scienze Biologiche, Geologiche e Ambientali, Via S. Giacomo 12, 40126 Bologna (E-mails: [email protected]; [email protected])
INTRODUCTION Constructed wetlands (CWs) are a promising technology for the wastewater treatment. They are natural systems that have minimal negative impact on the environment. Moreover, they do not require a lot of energy or skilled work force (Meng et. al, 2014). If they could treat wastewater up to the standards for reuse they could also act as a part of a larger wastewater recycling system, and their effluent reused for different purposes. The review of the CWs that were treating domestic wastewater in the four South European countries concluded that they had particular difficulties reaching water reuse limits for microbiological parameters (Lavrnić and Mancini, 2016). This study aims to assess potential of a pilot plant based on constructed wetlands technology to successfully treat domestic wastewater and to improve its performance in order to reach higher removal efficiency. MATERIALS AND METHODS The results used in this study were obtained from a pilot plant located at the University of Bologna (Italy). It consists of a sedimentation system, four vertical flow CWs (VFCWs) and two horizontal flow CWs (HFCWs).
Figure 1. Pilot plant at the University of Bologna
The difference between four VFCWs was presence of worms and plants: first system consisted of substratum only, second of substratum, worms and plants, third of substratum and plants and fourth system consisted of substratum and worms. Both HFCWs contained the same substrate but one of them was planted while another was not. In this study only one VFCW and one HFCW with the best results in their respective groups were taken into account as they represented one treatment line. Influent and effluent samples were analysed for the range of parameters, some of them being chemical oxygen demand (COD), total suspended solids (TSS), total nitrogen (TN), total phosphorus (TP), E. coli and Total coliforms.

SEWAGE MANAGEMENT AND WASTEWATER TREATMENT 218
RESULTS AND DISCUSSION The majority of organic matter and pathogens present in the influent was removed in the first stage – VFCW. That percentage varied from 90 % for TSS to 61 % for COD (Table 1). TN removal mostly occurred in the second stage – HFCW. It was expected because VFCW was intended rather for nitrification than denitrification processes. TP reduction in the CWs is mostly dependent on filter medium properties (Zapater-Pereyra et. al., 2014), and there was not a big difference in TP removal between VFCW and HFCW - both stages removed around 50 % of it. As for the microbiological parameters, it can be seen that the VFCW effluent contained around 5 % of E. coli and 10 % of the Total coliforms influent concentrations respectively. Treatment by the second stage helped to further polish wastewater and bring it closer to the limits required in order to be reused. Table 1. Influent and effluent concentrations of the pilot plant
COD [mg L-1]
TSS [mg L-1]
TN [mg L-1]
TP [mg L-1]
E. coli [ufc 100mL-1]
Total coliforms [ufc 100mL-1]
Influent 1,085 1,099 87 18 69,000 30,000
VFCW effluent 419 164 63 9 3,000 3,000
HFCW effluent 134 9 6 0.5 172 172
Italian standard 100 10 35 10 100 -
If compared to the Italian standard for wastewater reuse (DM, 2006), it can be seen that the final pilot plant effluent did not reach limits for COD and E. coli, but, on the other hand, it satisfied the thresholds regarding other parameters considered in this study (Table 1). However, it should be noted that the wastewater used during the experimental period was high-strength. Therefore, it can be assumed that the pilot plant would have produced effluent of a better quality if influent wastewater was less polluted. Trial results presented in the Table 1 show that this particular pilot plant can be considered as a potentially successful wastewater treatment option. However, in order to reach the standards for reuse, it should be expanded with another step that would further remove microbiological parameters and ensure its safe reuse. REFERENCES DM (Ministerial Decree) (2006) Number GAB/DEC/93/06. Ministry of the Environment and Protection of Land, Italy
(In Italian). Lavrnić S. and Mancini M.L. (in press) Can constructed wetlands treat wastewater for reuse in agriculture? Review of
guidelines and examples in South Europe. Water Science and Technology. Meng, P., Pei, H., Hu, W., Shao, Y. and Li, Z. (2014). How to increase microbial degradation in constructed wetlands:
Influencing factors and improvement measures. Bioresource Technology, 157, 316-326. Zapater-Pereyra, M., Malloci, E., van Bruggen, J.J.A. and Lens, P.N.L. (2014). Use of marine and engineered materials
for the removal of phosphorus from secondary effluent. Ecological Engineering, 73, 635-642.
SEWAGE MANAGEMENT AND WASTEWATER TREATMENT 219
PowerStep – a Real Paradigm Shift in Wastewater Treatment Processes C. Loderer* * Kompetenzzentrum Wasser Berlin gGmbH, Cicerostraße 24, 10709 Berlin, Germany (E-mail: [email protected])
INTRODUCTION The project POWERSTEP is built to achieve a real paradigm shift in wastewater treatment processes: the overarching goal is to convert sewage treatment plants (STEPs) in power production facilities (POWER) while still achieving a high effluent quality for the treated wastewater. Municipal wastewater treatment in Europe currently requires a significant amount of energy to eliminate organic matter and nutrients such as nitrogen and phosphorus from the sewage prior to its discharge to receiving waters. Under the assumption of an average electricity demand of 32 kWh per capita and year for large wastewater treatment plants (WWTP) as current benchmark (DWA, 2013) the municipal wastewater sector within the European Union (EU) consumes at least 16,000 Gigawatthours (GWh) per year for its service, which is equivalent to the annual power generation of two large (1,000 Megawatt) power plants. On the other hand, the organic matter contained in municipal wastewater has an internal chemical energy content of 14.4 MJ or 4 kWh per kg of chemical oxygen demand (COD) (Heidrich et al., 2010). Based on an organic matter load of 120 g COD per capita (PE) and year (ATV, 2000), the theoretical energy potential in municipal wastewater amounts to 175 kWh/(PE·a) or 87,500 GWh per year for the entire EU25+3, which is equivalent to the electricity produced by 12 large power plants (Figure 1). If this chemical energy potential is compared to the current benchmark of energy demand for wastewater treatment stated above, it is obvious that municipal wastewater contains significantly more energy in its organic matter than is required for its treatment. Thus, an energy-neutral or even substantially energy-positive wastewater treatment process is theoretically possible by converting this chemical energy into usable types of “renewable” energy.
Figure 1. Energy potential of Wastewater treatment plants and the PowerStep targets

SEWAGE MANAGEMENT AND WASTEWATER TREATMENT 220
MATERIAL AND METHODS The six full-scale references in POWERSTEP represent the core element of the planned work within the consortium. Acting as show-cases for process viability and market potential, the case studies are located at operating WWTP sites of different sizes (up to 350,000 pe) and involving various and representative state-of-the-art treatment processes (Table 1), which underlines both the realistic nature of testing conditions and also the interest of associated partners and utilities in the innovative potential of the investigated technologies and concepts. Table 1. Case study matrix of full-scale references
Case study Size of WWTP
[pe]
WP1: Carbon
extraction for energy recovery
WP2: Nitrogen removal in main stream
WP3: Biogas
valorisation + energy manage-
ment
WP4: Nitrogen manage-ment in
side stream
WP5: Integration assessment and market replication
Site owner / operator /
utility
1 Westewitz WWTP (GER)
2,000 X X + X X OEWA Döbeln-Jahnatal
2 Sjölunda WWTP (SE) 550,000 X X X VASyd
3 Avedøre WWTP (DEN)
350,000 X X BIOFOS
4 Braunschweig WWTP (GER)
325,000 X + X X X SE|BS AVB
5 Kirchbichl WWTP (AT) 100,000 X X X
AWV Wörgl-Kirchbichl
6 Altenrhein WWTP (CH) 120,000 X X AVA
Altenrhein RESULTS AND CONCLUSIONS Within the next three years the following goals should be achieved: 1. Breakthough innovation: the WWTP will be net energy producer! Wastewater as the last
forgotten source of biomass for renewable energy. 2. No additional needs for power infrastructure, as WWTPs are already well connected in energy
supply network and close to power demand (big cities). 3. First coordinated European project demonstrating energy positive WWTPs as cost effective
combination of technological solutions. 4. Demonstration with first large-scale references: Best practices for next generation WWTPs
integrated with global assessment. 5. Outstanding market and environment impact: Global yearly market value of up $30 Billion,
energy cost savings for WWTP operators in Europe of at least €1.7 Billion per year and 5.9 Million tCO2 reduction per year.
REFERENCES DWA (2013). 25th Benchmarking of German wastewater treatment plants. Heidrich, E.S. et al. (2010). Determination of the Internal Chemical Energy of Wastewater. EST, 45(2), 827-832. ATV (2000). A131 Bemessung von einstufigen Belebungsanlagen (A131: Dimensioning of single stage activated
sludge plants).
SEWAGE MANAGEMENT AND WASTEWATER TREATMENT 221
Carbon-Dioxide Neutral Electricity Production in Microbial Fuel Cells from Wastewater M. Lóka, B. Lóránt and G.M. Tardy* * Budapest University of Technology and Economics, Department of Applied Biotechnology and Food Science, H-1111 Budapest, Műegyetem rkp. 3 (E-mail: [email protected])
INTRODUCTION An MFC (Microbial Fuel Cell) is a special type of bioreactor that is able to convert the chemical energy stored in organic substrates directly into electricity. This special property facilitates to produce electricity from the biodegradable organic content of wastewaters in MFCs. Heterotrophic microorganisms oxidise organic compounds to gain energy. The electrons obtained from the oxidation of the organic matter are eventually transferred to the so-called terminal electron acceptor (TEA). TEA can be inorganic ions (sulphate, nitrate, etc.), but the most common is oxygen which is reduced to water. Special microorganisms, the so-called exoelectrogens, however, are capable of transporting the electrons obtained from the biodegradation of organic compounds directly to a solid conductive surface (i.e.: iron-oxide, manganese-oxide). This special electron transfer capability can be utilised in MFCs, where the exoelectrogens transport the electrons to the anode of the cell. From the anode electrons flows through a circuit, to reach the cathode (where eventually reduce oxygen), thus current and power is generated on a resistor. Application of MFCs has a great potential in utilization of the dissolved biodegradable organic pollutants as well as in raising the energy efficiency of the current wastewater treatment technologies. Specific measurements suggest that wastewater contains 9.3 times as much energy in the form of biodegradable organic matter as it is used to treat it (Logan, 2008). Besides the produced electricity, with the application of MFCs in wastewater treatment significant cost savings can be reached in aeration and sludge handling: an appropriately designed MFC needs no aeration at all, and the biomass yield of the exoelectrogenic biomass is an order of magnitude lower than that of the activated sludge (Rabaey & Verstraete, 2005). Investigation of biodegradation kinetics as well as the energy recovery efficiency in a H-type MFC has been carried out in this study, highlighting particular design and operational parameters for the future application of this technology in wastewater treatment. RESULTS AND DISCUSSION Two chambered, H-type MFC has been constructed in a previous study with graphite electrodes, aiming to create an appropriate MFC design to investigate the rate of biodegradation (Lóránt et al., 2015). The cell’s anode compartment was supplemented with a buffer tank (Figure 1). Using the developed cell biodegradation kinetics of two different substrates (acetate and peptone) have been studied with Pt-catalyst coated carbon cloth electrodes, and uncoated ones. Produced voltage was investigated as a function of dissolved organic carbon (DOC) concentration in the anode compartment. The obtained curves are Monod-like (for peptone see Figure 2), with half saturation constants (0.11-0.79 mg DOC/l) more than two orders of magnitude lower to that of those in previous studies.
SEWAGE MANAGEMENT AND WASTEWATER TREATMENT 222
Figure 1. Schematics of an MFC Figure 2. The obtained curve for peptone This means that the rate of biodegradation does not fall back, unless the concentration of substrates are very low in the anode compartment. As a result it has been concluded and MFC based technologies could be able to effectively reduce the concentration of dissolved biodegradable organics to below the strictest COD (Chemical Oxigen Demand) threshold limits in Hungary. The total amount of dissolved organic carbon content consumed by the exoelectrogenic biofilm covering 1 m2 of anode surface in an hour has been calculated. The obtained values are between 42.82 g DOC h-1 m-2 and 52.32 DOC h-1 m-2 in the investigated fuel cells. As anodic processes can be rate limiting steps, in the future this kind of specific substrate consumption rate could be an important factor for the design of an MFC based wastewater treatment technology. Coulombic efficiency of an MFC represents the efficiency of power generation and calculated by dividing the amount of electrons that flow through the circuit by the amount of total obtainable electrons from the eliminated substrates. The measured and calculated 14.2-19.8% coulombic efficiency values of the MFCs developed and operated well represents the typical values described in the literature. Based on the obtained coulombic efficiencies, an estimate is given on the market value of the wastewater of Budapest as an energy source. The estimate is based on the amount of wastewater produced every day, its average COD content and calorimetric measurements showing the amount of energy produced by the total oxidation of 1 g COD (Shizas & Bagely, 2004). The value of Budapest’s wastewater is 2.3 billion Forints, approximately 7.3 million € per year. Currently an MFC based wastewater treatment technology is yet uneconomical due to the high cost of materials required, but in the upcoming years the price of the necessary materials will decrease, also the obtainable power from microbial fuel cells are on increase. REFERENCES Logan Bruce, E. (2008). Microbial fuel cells, Wiley & sons, New Jersey, Rabaey, K., Verstraete, W. (2005). Microbial fuel cells: novel biotechnology for energy generation. Trends in
Biotechnology, 23(6), 291-298. Lóránt, B., Lóka M., Tardy, G.M., (2015). Substrate Concentration Dependency of Electricity Production in Microbial
Fuel Cells. IEEE Xplore, IYCE 2015, 1-7. Shizas, I., Bagley, D. M. (2004). Experimental Determination of Energy Content of Unknown Organics in Municipal
Wastewater Streams. Journal of Energy Engineering, 130(2), 45-53.
Buffer tank
Pump Anode
Cathode
SEWAGE MANAGEMENT AND WASTEWATER TREATMENT 223
Płaszów WWTP as a Source of Humic Acids D. Łomińska and A.M. Anielak* * Department of Environmental Engineering, Cracow University of Technology, 24 Warszawska, 31-155 Cracow, Poland (E-mails: [email protected]; [email protected])
INTRODUCTION Following a rapid industrial growth, an increase of both wastewater volumes as well as their concentrations and types of pollutants have been observed. As a result of the wastewater treatment process some pollutants are transformed into new substances, which may pass to the plant effluent. They include humic substances commonly found in natural water, soil, sediments, etc. These materials are formed by humification, i.e. a microbiological decomposition of plant and animal residues. Municipal wastewater has a significant amount of organic compounds of both natural and anthropogenic origin that undergo biochemical changes during biological treatment and form new substances; some of them can pass to the receiving water e.g. humic substances. Therefore, the authors decided to analyze the effluent from the Płaszów Wastewater Treatment Plant (WWTP) in Krakow for the content of humic substances (HS). THE PŁASZÓW WASTEWATER TREATMENT PLANT The Płaszów WWTP is located in the north-eastern part of Kraków in the district Podgórze, on the Kosiarzy street no.3 and covers the area of 123,5 acres. The plant works as a 3-phase Bardenpho system and has five identical biological reactors. The treatment process comprises: predenitrification, dephosphatation, denitrification and nitrification. The average wastewater flow is 165 m3 per day while a capacity of a biological stage is 320 thousand m3 per day. Raw sewage undergoes a mechanical treatment in bar screens, aerated chamber and primary settling tanks. From the primary settling tanks wastewater flows to the biological reactors with separate anaerobic, anoxic and aerobic compartments and an internal recirculation. The concentration of activated sludge changes in the range of 3.5-5.5 kg of sludge solids per m3. Excess sludge together with primary sludge after thickening to 95 % are pumped into the anaerobic dipesters. The effluent from the above technological train was analysed for a content of humic substances. METHODOLOGY OF RESEARCH SH were extracted from the effluent in the process of ion exchange in an hydrophobic ion exchanger and next subjected to detailed chemical analysis for trace elements and elemental composition of the acids. In the research an elemental analyzer Flash EA Thermo WD - XRF spectrometer S8 model Tiger Bruker was used. The tests were run in a certified laboratory EkotechLAB in Gdansk. The research have shown that there are high concentration of fulvic acids in the effluent. They pass to the surface water and act as precursors of by-products generated during oxidation and disinfection at water treatment plants. RESULTS The characteristics of the effluent discharged from the Płaszów WWTP is shown in Table 1. HA were extracted from a colorless effluent, which complied with the quality requirements for large wastewater treatment plants. It had relatively small concentrations of organic substances e.g.

SEWAGE MANAGEMENT AND WASTEWATER TREATMENT 224
COD = 22.1 mg O2/L, BOD 5 = 3.5 mg O2/L, as well as and nitrogen and phosphorus. The wastewater samples had a volume of 339 L. The tests showed that the HA content in the effluent was 5.2 g/m3. The acids isolated at a concentration of 5.51 g/L had a dark brown color. They were contaminated with inorganic substances (Cl, Si, Na, Ca, K, P, Mg, and Fe, Br, Ti, Zn). The ash content in the acid was 9.74 %, which indicated a large amount of inorganic impurities.
The results of a thermogravimetric analysis are shown in Figure 1.
Figure 1. Mass reduction as a function of temperature
Looking at the curve it can be seen that the sample mass decreases rapidly along with a temperature rise. At the ash content of 9.74 % the sample weight remained unchanged, despite the temperature rise up to 700 °C. The mass remained constant at a temperature of approx. 580 °C, which was slightly higher than the temperature specified in the applicable standards (550 °C). Table 1. Characteristic of the effluent with extracted HA
Parameter Płaszów WWTP
COD [mg O2/L]
BOD5 [mg O2/L]
Ntot [mg N/L]
Ptot [mg P/L]
22.1
3.5
8.7
0.4
REFERENCES Anielak, A. (2015). Wysokoefektywne metody oczyszczania wody. PWN, Warszawa, 28-32 (in Polish). Anielak, A., Polus, M., Łomińska D., Żaba T. (2016), Biodegradacja kwasów fulwowych z wykorzystaniem osadu
czynnego wzbogaconego archeanami. Przemysł Chemiczny, 95(1), 110-113 (in Polish). Anielak, A., Żaba, T., Polus, M., Beńko, P., Bochnia, T., Łuszczek, B. (2016). Efektywność oczyszczania ścieków
komunalnych w systemie SBR i Bardenpho. Przemysł Chemiczny, 95(2), 314-319 (in Polish). Pempkowiak, J., Obarska-Pempkowiak, H., Gajewska, M., Ruta, D. (2008). Oczyszczone ścieki źródłem kwasów
humusowych w wodach powierzchniowych. Przemysł Chemiczny, 87(5), 542-545 (in Polish). Świderska, R., Anielak, A. (2004). The significance of electrokinetic potential in the adsorption process of humic
substances. Rocznik Ochrona Środowiska, 6, 31-49.

SEWAGE MANAGEMENT AND WASTEWATER TREATMENT 225
Treatment of Reject Water from Anaerobic Digestion of Sludge by the Nitrification-Denitrification Reactor SBR J. Majtacz and H. Al-Hazmi* * Gdansk University of Technology, Faculty of Civil and Environmental Engineering, Gdansk, Poland (E-mail: [email protected])
INTRODUCTION With side stream systems for reject water treatment, up to 90 % on the ammonium nitrogen load can potentially be removed. One of the effective methods of ammonium nitrogen removal is the conventional nitrification-denitrification process in a sequencing biological reactor (SBR). Intensification of the denitrification process may be obtained in particular by dosing an external organic carbon source to the anoxic phase. There are several available and effective commercial products, such as: methanol, ethanol, acetic acid, sodium acetate and glucose. These compounds can be termed the conventional carbon sources. Their main problem is a relatively high cost of their use. That problem can be easily solved by using alternative carbon sources such as fusel oil, which is a waste product from the alcohol production process. The main objective of this study was to investigate the process kinetics of nitrogen removal from reject water in the conventional nitrification-denitrification process. Furthermore, the acclimation time of microorganisms to reject water and specify external carbon sources was investigated in the form of fusel oil. MATERIALS AND METHODS Determination of kinetics of nitrogen removal from the reject water nitrification - denitrification and of adaptation to the reject water and the external carbon source was carried out in two reactors. The first reactor SBR with volume 6 m3 situated on wastewater treatment plant (WWTP) in Słupsk and the second reactor is WWTP in Gdynia with the volume 1m3. There are equipped with electrodes for continuous monitoring of pH, temperature and dissolved oxygen (DO) and electrodes for continuous monitoring NH4-N and NO3-N. The reactor WWTP Słupsk in was operated for 42 days, the second reactor WWTP Słupsk in was operated for 15 days. There are work 2 cycles 12 h, which followed in succession nitrification phase (5-6 hours) the denitrification (5-6 h) sedimentation (1 h). The oxygen concentration in the nitrification phase was 2 gO2/m3. In addition reject water was increased 5 % of volume of the reactor in the first days of tests to 7.5 % in the last days of the study. In the denitrification phase added to the reactor external source of carbon in the form of fusel oil in an amount of 6:1 g COD/g N adaptation to the reject water was carried out gradually. Fusel oil is characterized by a high COD concentration (1 700 000 g/m3) and high COD/N ratio. The main identified component is 2-methyl-1-butanol which is a dominating component (almost 40 % by weight). RESULTS AND SIGNIFICANCE OF THE FINDINGS Figure 1 shows the influence of nitrogen load with reject water, nitrogen removal efficiency and an increase in the rate of denitrification during treatment reject water in WWTP of Słupsk. In recent days to determine the effectiveness of the removal of NH4-N, NO3-N and TN was very high and amounted to 98 %, 95 % and 81 % respectively. During the tests in WWTP in Słupsk showed that the observed NUR, were increasing from 2.0 to 17.4 mg N/(g VSS·h) on day 42 (Figure 1c), for

SEWAGE MANAGEMENT AND WASTEWATER TREATMENT 226
comparison, the WWTP in Gdynia NUR denitrification rate increased from 2.2 to 7.3 mg N/(g VSS·h) within 15 days of adaptation. The observed AUR in WWTP Słupsk was in the range at 1.9 to 3.8 mg N/(g VSS·h). The results rate of nitrification and denitrification received during research in the reject water WWTP in Słupsk are similar to the results obtained in a series of laboratory. In the course of adaptation to the reject water and fusel oil in a series of laboratory received NUR maximum speed of 15.6 mg N/(gVSS·h) after 36 days of adaptation at 25 °C.
Figure 1. The rate of denitrification NUR during 42 days of research in SBR reactor situated on the wastewater treatment plant in Słupsk REFERENCES Constantine, T., Shea, T. i Johnson, B. (2005). Newer approaches for treating return liquors from anaerobic digestion;
IWA Specialized Conference Nutrient Management in Wastewater treatment Processes and Recycle Streams, Kraków, Poland, 19–21 Wrzesień, 455-464.
Fux, C., Velten, S., Carozzi, V., Solley, D. and Keller, J. (2006). Efficient and stable nitritation and denitritation of ammonium-rich sludge dewatering liquor using an SBR with continuous loading. Water Research, 40, 2765-2775.
a)
c)
b)

SEWAGE MANAGEMENT AND WASTEWATER TREATMENT 227
Effect of Solid Retention Time on the Exerted Current of Air-breathing Microbial Fuel Cells S. Mateo, M.A. Rodrigo, P. Cañizares, F.J. Fernandez-Morales* * University of Castilla-La Mancha, ITQUIMA, Chemical Engineering Department, Avenida Camilo José Cela S/N. 13071 Ciudad Real, Spain (E-mail: [email protected])
INTRODUCTION During the last years, research focused on alternative technologies for the wastewater treatment with coupled energy generation gained great interest. One of the potential technologies available to reach this objective are the Microbial Fuel Cells (MFC) (Chen et al. 2013). When dealing with the exerted current density of these devices it is very important to evaluate the influence of the culture type: pure or mixed. About the mixed microbial communities, a selective parameter is the Solid Retention Time (SRT). This is because this parameter controls the microorganism growing in the system. Microorganisms unable to grow in the defined retention time are washed, prevailing the fast growing microorganisms. In this context, the aim of this work was to study the performance of a MFC operating under different SRT, ranging from 1.4 until 10 d. MATERIAL AND METHODS The experimental micro-scale set-up used in this work consisted of a two-chambered micro-scale MFC, more information can be found in literature (Mateo et al., 2015). The anodic and cathodic electrodes were based on Toray carbon papers TGPH-120 (E-TEK, USA). Both chambers were built on a graphite plate and separated by a Sterion® membrane. An air breathing cathode was used. In the cathode, a catalytic layer with 0.5 mg Pt/cm2 loading was deposited onto a microporous layer. active area of the anodic chamber was 4.65 cm2, and its volume was 0.95 cm3. The active area of the cathodic chamber was 2.85 cm2, and its volume was 0.50 cm3. The MFC was operated as a sequenced batch reactor. A peristaltic pump was used for recycling the wastewater from the wastewater reservoir, 100 mL volume, to the anodic chamber of the MFC at a flow rate of 0.5 mL/min. The MFC was fed with synthetic wastewater containing acetate as the sole carbon source (10,000 ppm of COD) supplemented with trace minerals according to literature (Infantes et al., 2012). RESULTS AND DISCUSSION As can be seen in Figure 1, there is a trend showing that current density increases with the SRT Taking into account that the organic matter, 4000 ppm COD, was almost completely removed, 10,000 ppm COD were fed in order to ensure enough organic matter for the electrogenic microorganisms. After that, all the series showed similar trends in the electrical current generation. Only the system operating at 5 d SRT showed a slightly different trend. About the lag phase before the increase in the exerted current density, it can be observed that the shortest period was that corresponding to the 10 d. This can be explained by a faster development of the electrogenic microorganisms which, on these conditions, outcompete the non electrogenic microorganisms. After the lag phase it was observed that electrogenic microorganisms were able to adapt to the new conditions and grow. Regarding to the electricity generated in the steady-state, the systems with the highest SRT exerted the highest current. The output current values were 0.0316, 0.0609, 0.0645, 0.0688 and 0.1534 A m-2 for the SRTs 1.4, 2.5, 5, 7.4 and 10 d, respectively. This could be

SEWAGE MANAGEMENT AND WASTEWATER TREATMENT 228
explained because of the biomass washed from the fed-batch reservoir of the anodic compartment, which limited the growth of slow growing electrogenic microorganisms.
0
0.05
0.1
0.15
0.2
0.25
0 5 10 15 20 25 30 35
Cur
rent
den
sity
/ A m
-2
Time / days
1.4 days2.5 days5 days7.4 days10 days
4000 ppm COD 10000 ppm COD
Figure 1. Exerted current density vs solid retention time Regarding to the Coulombic efficiency of the systems, it was observed that the higher values were obatined by the systems operating at the higher SRT. This can be explained because these systems were enriched in electrogenic microroganisms, being lower the metabolic activities related to conventional anaerobic transformations. Because of that, the systems with the higher SRT not only exerted higher currents but also were more efficient in therm of COD conversion into electricity. CONCLUSIONS MFCs with the same conditions and characteristics operating with different SRT showed that higher values of current density generated by the system are achieved at the higher SRT. This behavior could be explained due to the preferent growth of electrogenic microorganisms. Working with high SRT significantly increased the electricity exerted by the air-breathing MFC. ACKNOWLEDGEMENTS Authors thanks the Spanish Government for the financial support thorough the Project CTQ2013-49748-EXP. REFERENCES Chen, G., Zhang, F., Logan, B.E. and Hickner, M.A. (2013). Poly(vinyl alcohol) separators improve the coulombic
efficiency of activated carbon cathodes in microbial fuel cells. Electrochemistry Communications, 34, 150-152. Infantes, D., González del Campo, A., Villaseñor, J. and Fernández, F.J. (2012). Kinetic model and study of the
influence of pH, temperature and undissociated acids on acidogenic fermentation. Biochemical Engineering Journal, 66, 66-72.
Mateo, S., Rodrigo, M., Fonseca, L.P., Cañizares, P. and Fernandez-Morales, F.J. (2015). Oxygen availability effect on the performance of air-breathing cathode microbial fuel cell. Biotechnology Progress.
SEWAGE MANAGEMENT AND WASTEWATER TREATMENT 229
Evaluation of Inhibitory Effects on Nitritation Process by Vapour Condensates from Sewage Sludge Drying M. Mikeska, M. Beier and Rosenwinkel K. * Institute for Sanitary Engineering and Waste Management, Leibniz University Hannover, Welfengarten 1, 30167 Hannover, Germany (E-mail: [email protected])
INTRODUCTION During the last decades, several strategies have been developed to reduce energy and operation costs for biological nitrogen removal in WWTP. In particular the Deammonifikation process – a combination of Nitritation and Anaerobic Ammonium Oxidation (Anammox) – has gained high interest. While inhibition effects on AOB and NOB by pH, ammonia and nitrous acid are well studied (Anthonisen, 1976). Other inhibitory influences related to wastewater specific substances e.g. from thermal sludge treatment processes are less established. In regard to an overall energy optimized treatment concept the combination of extensive carbon utilization by anaerobic digestion, thermal disintegration and/or sewage sludge incineration with the energy minimized nitrogen removal process Deammonification is studied in the scope of the BMBF project E-KLÄR. The focus of the following paper is to show possible inhibition effects on nitritation processes related to specific condensate characteristics investigated by means of the oxygen uptake rate measurement. MATERIAL AND METHODS Batch-Set-Up. Batch tests were conducted in 2 L lab-scale reactors at aerobic condition (T = 20 °C). Dissolved oxygen is continuously measured and controlled by computer program, Oxygen-Uptake-Rate (OUR) is calculated. To identify wastewater related inhibition factors OUR for each vapour condensate (VC) is determined by 2 dilution ratios. Furthermore a potential COD respiration by heterotrophic biomass is separated by the addition of Allylthiourea (ATU; 86 µM) to inhibit AOB respiration. The 4 batch reactors (A-D) are fed in the following order: A – 100 % vapour condensate // B – 50 % VC + 50% tap water // C – 100 % Synthetic with equivalent NH4-N // D – 100 % VC + ATH. Inoculum. The Nitritation Sludge, used for the batch experiments, originates from an intermittent aerated high loaded full-scale Nitritation reactor for sludge liquor treatment of a municipal WWTP. Characteristics Nitritation: TSS=5 g/L; VSS=2.7g/L; >80 %AOB; SLR=0.05 kgNH4-N/kgTSS. Vapour condensate. Inhibitory effects of several vapour condensates from different plants will be investigated and compared. The results discussed within this abstract are from an incineration plant (GER), were sludge is dewatered in centrifuges and dried in thin layer dryers at T = 110-140 °C. Vapour condensate characteristics: 250 mg/L NH4-N; 340 mg/L COD, ANC 18 mmol/L; pH 8.6. RESULTS AND DISCUSSION If the wastewater has no effect on nitritation process the SOURs for reactor A-C should show similar values. A substrate inhibition can be identified comparing A and C, in combination with setting B (1:2 dilution) possible effects on the inhibition by dilution can also be evaluated. For control meanings the OUR in D shows OUR related to heterotrophic oxygen consumption. Accordingly to the used inoculum and substrate either a small or no OUR in D is expected. Figure 1 shows a general, uninhibited OUR from synthetic wastewater and Nitritation sludge. In the first

SEWAGE MANAGEMENT AND WASTEWATER TREATMENT 230
hours you find the sludge/wastewater characteristic SOUR, followed by a constant increase up to a maximum value of 43.7 mg O2/L·h (SOURmax=19.3 mg O2/(L·h·gVSS). This increase can arise from a combined adaption process and biomass growth of AOB in the reactor. The end of the degradation process starts with a weak decrease which directly merges into a high slope decrease down to the minimum value of 3.1 mg O2/L·h. The tight decrease of the OUR is related to the reduced ammonia concentration. By integration of the shaded area the total oxygen-uptake (OU) of 441.4 mgO2/L can be calculated. The relation of consumed ammonia (138 NH4-N mg/L) and consumed oxygen is explained by the factor of 3.18 mgO2 per mgNH4-N oxidised to NO2-N. That means the calculated OU (438.8 mgO2/L) is nearly similar to the measured OU, which is conform to the constant NO3-N values in reactor (no further oxidation). This confirms that batch tests are suitable to indicate inhibition effects for high loaded wastewater.
Figure 1. OUR from synthetic wastewater Figure 2. SOUR reactor A-D // Vapour Condensate C1 Figure 2 shows results for the condensate C1. It can be seen, that SOUR for each reactor differs in shape, maximum/minimum values, duration and slopes. The comparison of A and B shows that the undiluted run has a reduced respiration rate of 26 %. The SOURA
reaches a maximum rate of 22 mgO2/(L·h·gVSS), which is resulting in a longer respiration time. So this process is inhibited by a substance from the undiluted vapour condensate. Complementary the consumed oxygen load (integral under the curve) proves a complete conversion also for the inhibited run A. Because of adaption the SOURC shows a constant increase in the first 4.5 hours up to the maximum rate of 29.7 mgO2/(L·h·gVSS). Therefore only the rear part of the curve was taken into account. The maximum rate of B and C gives a similar maximum rate of 29.7 mgO2/(L·h·gVSS), which reveals that 1:2 dilution leads to an uninhibited process. Surprising is the shape of SOURB (and alleviated also in SOURA) with the noticeable weak slope decrease compared to SOURC. This could be explained by the consumption of acidic capacity by respiration process and the drop of the pH down to 6.7 in B and 6.9 in A. Finally SOURD shows only in the beginning of the experiments a heterotrophic related OUR. This could be the explanation for the short peak in the SOURB.
Further approaches. The gained results from this paper shall give a plain overview about the reduced nitrifying activity and resulting capability to treat these high loaded waters. Furthermore within the E-Klär Project more detailed perspectives like the correlations between different thermal sludge treatment processes and inhibition factor and the look for procedural answers to enhance the part stream nitrification process will be done in the next year. REFERENCES Anthonisen, A.C., Loehr; R.C., Prakasam, T.B.S. and Srinatz, E.G. (1976). Inhibition of nitrification by ammonia and
nitrous acid. Journal Water Pollution Control Federation, 52(11), 2747-2754.

SEWAGE MANAGEMENT AND WASTEWATER TREATMENT 231
Can DNA Sequencing Show Differences Between Microbial Communities in Polish and Danish Wastewater Treatment Plants? A. Miłobędzka* and A. Muszyński** * Faculty of Building Services, Hydro and Environmental Engineering, Department of Biology, Warsaw University of Technology; Department of Molecular Phylogenetics and Evolution, Institute of Botany, University of Warsaw, Warsaw, Poland (E-mail: [email protected]) ** Faculty of Building Services, Hydro and Environmental Engineering, Department of Biology, Warsaw University of Technology, Warsaw, Poland
AIMS Microbial populations in activated sludge of two Polish wastewater treatment plants (WWTPs) were studied using DNA sequencing. Bacterial communities were analysed over a two-year-period to investigate their dynamics over time and to compare them to Danish WWTPs. MATERIALS AND METHODS Activated sludge samples were collected twice a year – after winter (at the beginning of March) and after summer (at the end of September). DNA sequencing (accomplished by DNAsense ApS (Aalborg, Denmark)) was used to count the number of fingerprints from each bacteria in the sample, which served as an estimate of the abundance of the bacterial species. DNA isolation was achieved with PowerSoil® DNA Isolation Kit. 16S rRNA amplicon library preparation procedures targeting the V1-3 variable regions were performed according to Caporaso et al. (2012), using primers adapted from the Human Gut Consortium (Ward et al., 2012); PCR reactions, DNA sequencing and 16S rRNA amplicon bioinformatic processing were ran as by Albertsen et al. (2015). Standard statistical analyses, parametric correlation analyses and principal component analysis (PCA) were carried out using R Statistical Software (Foundation for Statistical Computing, Vienna, Austria). RESULTS Microbial communities in tested samples were rather similar and relatively stable over whole period of the study, the specific genera found in the studied WWTPs are also common in Danish plants (Table 1). However, three of the most dominant genera in Danish WWTPs, i.e. Tetrasphaera (engaged in biological phosphorus removal), Trichococcus (heterotrophic bacteria) and Microthrix (filamentous heterotrophic bacteria) were only found in very low abundance in the examined WWTPs. On the other hand, in Polish WWTPs Proteobacteria (involved in COD and nitrogen removal) were very abundant, as well as genera of the phylum Bacteroidetes, which in general are not observed on such level in Danish WWTPs. PCA indicated differences among Danish household, industrial and mixed WWTPs, whereas microbial communities in Polish WWTPs were similar to each other (results not shown). This similarity was confirmed by correlation analyses (r=0,69). First of the Polish WWTPs was alike Danish household WWTPs (r=0,59), the second one did not show strong correlations. PCA showed that microbial communities in the tested samples were distinguished by a sampling period (even with up to three years gap between the samples). This is a larger effect of sampling than was normally observed in Danish plants. Temporal variations can be clearly seen in significant changes in abundance of 30 dominant genera (listed in Table 1).

SEWAGE MANAGEMENT AND WASTEWATER TREATMENT 232
Table 1. The function, identity and abundance of the 30 most abundant bacteria
Proteobacteria; Rhodoferax 2.5 1.5 0.4 12.7 5.3 18.4 3.6 17.7 4.5 19.2 8.8 1 8.6 1.8 6.5Bacteroidetes; Flavobacterium 0.5 0.2 0.9 3.8 5.1 3.8 0.6 4.4 2.8 7.5 12 0.6 7.3 0.9 4.8Bacteroidetes; QEDR3BF09 1.3 1.2 0.1 2.1 4.1 1.6 3.6 2.1 1.8 1.4 2 4.5 1.1 7.5 5.6Bacteroidetes; PHOS−HE28 0.8 0.9 0.7 2.1 3 2.8 1.2 3 1.3 1.9 2.6 2.2 4.9 1 4.4Bacteroidetes; CYCU−0281 0.9 0.9 0.5 1.8 2.1 1.4 2.9 0.9 2.2 1.4 2.4 2.2 2.6 1.7 1.6Bacteroidetes; Candidatus Epiflobacter 0.9 0.8 0.1 1.9 1.8 2.1 4.7 0.9 1.3 0.5 4.3 0.8 1.4 1.3 1.4Bacteroidetes; PHOS−HE31 0.8 0.6 0.3 2.4 1 3.6 1.4 4 1.2 1.9 1.6 1.5 0.6 0.6 0.6Proteobacteria; Dechloromonas 1.5 0.4 0.1 1.5 1.8 2.6 1.6 0.3 1.8 1.4 1.6 1.2 3.1 0.7 2.5Proteobacteria; Sulfuritalea 0.5 0.5 0.1 2.2 1.1 0.6 1.8 3.3 3.3 1.7 1.4 0.7 0.9 1.7 0.9Proteobacteria; 188up 0.5 0.3 0 1.6 1.3 1.8 2.5 1.6 1.1 1.2 2.8 1.7 0.9 0.4 0.7Bacteroidetes; OTU_306 0 0.1 0.1 0.8 2.1 0.4 0.6 1.8 0.3 0.7 2.6 0.6 2.7 0.5 4.4Chloroflexi; SBR1029 0.8 1 0.2 1.6 1.3 0.8 1.8 0.3 5 0.3 0.9 2.2 0.5 1.6 1.1Proteobacteria; Candidatus Accumulibacter 0.2 0.2 0.3 1.6 1.2 0.7 1.5 1.3 2 2.6 0.8 1.7 0.7 1.9 0.9Proteobacteria; Arcobacter 0.2 0.1 0.1 2 0.8 1.6 0.8 3.1 1.6 2.8 1.2 0.2 1.4 0.4 0.9Bacteroidetes; OTU_371 0 0 0 1.3 1.3 1.7 0.5 2.9 0.2 1.4 1.4 0.1 3.3 0 1.6Proteobacteria; Ferribacterium 0.4 0.7 0.1 1.3 1.3 1.1 2.1 0.1 2.7 0.5 0.3 2 2.1 0.2 2.1Proteobacteria; OM27 clade 0.3 0.2 0.1 1 1.6 0.3 1.2 0.2 2.8 0.5 0.5 1.1 1.4 2.6 2.4Proteobacteria; Aquabacterium 0.2 0.1 0.1 1.2 1.4 1.1 1 0.9 0.9 1.9 0.7 0.4 0.8 3.9 1.1Bacteroidetes; Ferruginibacter 0.9 0.7 0.3 0.6 1.9 0.8 0.6 0.5 0.5 0.4 1.7 2.3 1.3 1.9 2.1Bacteroidetes; MK04 0.7 0.9 0.1 2.1 0.3 5.4 2.1 1 1.2 0.5 0.8 0 0.1 0.1 0.5Proteobacteria; OTU_34 0.3 0.3 0.1 0.9 1.4 0.7 0.5 0.5 1.4 1.5 1 1 1.6 1.3 2Bacteroidetes; OTU_423 0.1 0.1 0 0.7 1.2 0.7 0.3 1.2 0.9 0.5 1.7 2.1 0.8 0.8 0.5Proteobacteria; Zoogloea 0.3 0.7 0.5 0.6 1.2 1.1 0.3 0.3 0.8 0.5 0.6 2 1.6 0.5 1.1Nitrospirae; Nitrospira 0.8 0.7 0.3 1 0.7 0 3.6 0.5 0.8 0 2 0.5 0.1 0.4 0.5Proteobacteria; Leptothrix 0.6 0.6 0.2 0.6 1 0.4 0.4 0.5 0.5 1.1 0.4 2.6 0.4 1.3 0.5Proteobacteria; OTU_35 0.2 0.2 0.1 0.5 1.1 0.2 0.4 0.7 0.7 0.2 1.8 1 1.2 0.7 0.8Proteobacteria; Simplicispira 0.6 0.6 0.1 1.3 0.2 1.4 1.1 1.5 0.7 1.5 0.2 0 0.6 0 0.1Proteobacteria; Rhodobacter 2.3 2 0.8 0.8 0.6 1.3 0.4 1.3 0.4 0.9 0.9 0.2 0.9 0.3 0.7Proteobacteria; Candidatus Nitrotoga 0.2 0.1 0.1 0.8 0.6 1.3 0.2 1.6 0.1 0.7 0 0 1.9 0 1.1Proteobacteria; Nitrosomonas 0.4 0.4 0.3 0.6 0.7 0.1 0.6 0.8 1 0.4 0.8 0.2 0.4 0.7 1.5
Tested positive in published research papersCan be both positive and negative
Tested negative in published research papersNo published research available
AOB: Ammonium oxidizing bacteria. involved in nitrogen removal. NOB: Nitrite oxidizing bacteria. involved in nitrogen removal. PAO: Polyphosphate accumulating bacteria. involved in biological phosphorus removal. GAO: Glycogen accumulating bacteria. can have a negative effect on biological phosphor removal. HET: Heterotrophic bacteria. generally involved in COD removal. DN: Denitrifying bacteria. involved in nitrogen removal. FIL: Filamentous bacteria.
mix
ed
indu
stria
l
I II
Abundance of bacteria in Polish WWTPs over timeDanish Polish
sequencing (% of pair of reads)
I II
FIL
AO
BN
OB
PAO
GA
OH
ET DN
hous
ehol
d
Mean abundance in WWTP
CONCLUSIONS Bacterial communities in Polish and Danish WWTPs are similar to each other. Nevertheless Polish WWTPs show higher abundance of bacteria involved in nitrogen and COD removal (Proteobacteria and Bacteroidetes), while PAOs are the dominant bacterial group in Danish plants. Microbial community structure in the examined Polish WWTPs were relatively similar to each other and showed strong seasonal variations which is not normally observed in Danish WWTPs. ACKNOWLEDGEMENT The study was financially supported by the Faculty of Building Services, Hydro and Environmental Engineering of Warsaw University of Technology, (grant number 540M/1110/0022/000). We would like to thank DNASense for magnificent report and sharing data about Danish WWTPs; Foundation for Polish Science for supporting inspiring internship at Department of Chemistry and Bioscience - Section for Biotechnology (Aalborg University). REFERENCES Albertsen, M., Karst, S.M., Ziegler, A.S., Kirkegaard, R.H., and Nielsen, P.H. (2015). Back to Basics – The Influence
of DNA Extraction and Primer Choice on Phylogenetic Analysis of Activated Sludge Communities. PLOS ONE 10: e0132783.
Caporaso, J.G., Lauber, C.L., Walters, W. a, Berg-Lyons, D., Huntley, J., Fierer, N., et al. (2012). Ultra-high-throughput microbial community analysis on the Illumina HiSeq and MiSeq platforms. The ISME J , 6, 1621–4.
Ward, D.V., Gevers, D., Giannoukos, G., Earl, A.M., Methé, B.A., Sodergren, E., et al. (2012). Evaluation of 16s rDNA-based community profiling for human microbiome research. PLoS ONE 7: 39315.

SEWAGE MANAGEMENT AND WASTEWATER TREATMENT 233
Physico-Сhemical Treatment of Liquid Waste on an Industrial Plant for Electrocoagulation M. Mlakar, M. Levstek and M. Stražar* * JP CČN Domžale Kamnik d.o.o., Domžale, Slovenia (E-mail: [email protected])
INTRODUCTION In Slovenia, industrial liquid waste is disposed of mostly by burning since the parameter limit values are exceeded, making it inappropriate for discharge into the sewer network. The price of the burning process itself is high as the waste is of liquid form. One of the possible ecological and economically affordable treatments of liquid hazardous and non-hazardous waste is the pre-treatment of the waste by means of physico-chemical treatment with electrocoagulation and flotation (Chen, 2004; Kuokkanen et al., 2013). This process helps liquid waste dispose of impurities, leaving the treated water appropriate for a discharge into the sewer network and ready for the final cleaning in the biological treatment process (Lampelj et al., 2014). After trials performed on a laboratory pilot plant for electrocoagulation with the volume of 600 mL, it was decided at the Domžale-Kamnik waste wastewater treatment plant to install an industrial version of the plant with the flow rate at 2 m3/h. Treatment of different types of liquid waste, as are wastewater from washing, oil separators, wastewater from metal processing industries as well as detergent industries, was tested at both laboratory and industrial level. In the laboratory pilot stage but also the industrial level, the effect of implementing the electrocoagulation and flotation processes respectively was analyzed and included the duration of the electrocoagulation implementation, voltage, number of electrodes, chemical addition, as well as pH effect and conductivity. The tests were performed not only on various types of liquid waste, but also different mixtures of liquid waste. Electrocoagulation is similar to electrolysis of water. It consists of an electrolytic cell with the anode and cathode electrodes. During the electrolysis, the metal anode electrode dissolves, thereby supplying coagulant to the treated wastewater. In the wastewater, ions and colloidal (organic and inorganic) particles are in stable suspension because of the energy barrier caused by the electrostatic forces of repulsion. The EC causes the destabilization of the electric charge in wastewater which promotes aggregation of colloidal particles which stick to each other in flocks to form aggregates and are thus eliminated from the aqueous phase (Liu, 2010; Harif, 2012). MATERIALS AND METHODS EC unit has the total capacity of up to 2 m3/h of cleaning liquid waste. Liquid waste is pumped through the receiving station with fine screen with openings of 4 mm into two tanks with a total capacity of 30 m3. The pH of the treated water is regulated by sulphuric acid or sodium hydroxide. The waste liquid is then pumped into the EC cell, powered by a DC rectifier. It has iron electrodes in mono-polar position with 2-cm spacing. The ratio between the working volume and active surface area of the electrodes is 12 m2/m3. Next step is flocculation where the pH is adjusted and the flocculant added. The waste liquid is then decanted into DAF (dissolved air flotation) which separates the sludge from water. The clean water goes into the effluent and the slurry in the sludge reservoir. The entire process is operated automatically.

SEWAGE MANAGEMENT AND WASTEWATER TREATMENT 234
RESULTS AND DISCUSSION The laboratory analyses of the samples before and after electrocoagulation have shown an effective reduction not only in organic loads in accordance with the COD (chemical oxygen demand) parameter, but also in mineral oil content, heavy metal concentration, and surfactants. The COD in liquid waste from detergent industries has reduced by 73 % and the content of surfactants by 64 %. In liquid waste from metal processing industries, the COD plummeted by up to 95%, while the content of heavy metals dropped from 59 to 99 %. Similar was shown in liquid waste from oil separators, where the COD reduced to 33 % and the concentration of mineral oils by 99%. Some of the liquid waste was mixed together in ratio 1:1, thus allowing the testing of the operation of electrocoagulation technology in heterogeneous liquid waste, where the final result too proved to be effective cleaning. As evident, all analytical results indicate the appropriate level of pre-treatment provided by the EC process, however, considering that it was difficult to achieve full optimization of the cleaning process due to the changing composition of the liquid waste, there is still room for further improvement in final results. As regards the benefits of EC against chemical coagulation, these are primarily economic. An EC has higher efficiency at a lower cost, requires a smaller amount of coagulant and less sludge is generated (Kuokkanen, 2013). CONCLUSION For the implementation of the process of pre-treating liquid hazardous and non-hazardous waste, the Domžale-Kamnik wastewater treatment plant acquired the appropriate environmental permits and approvals, thus becoming the first municipal wastewater treatment plant in Slovenia to offer besides treating municipal and industrial wastewater, the treating of liquid waste as well. For these reasons, the system of processing liquid waste has proven to be an effective and complex process which we upgraded to its optimum with the help of the equipment manufacturer. The article before you presents the approach used, and includes the method implemented in laboratory and industrial tests and analyses. REFERENCES Chen, G. (2004). Electrochemical technologies in wastewater treatment, Separation and Purification Technology, 38(1),
11-41. Kuokkanen, V., Kuokkanen, T.; Rämö, J., Lassi, U. (2013). Recent Application of Electrocoagulation in Treatment of
Water and Wastewater – A Review, Green and Sustainable Chemistry, 3(2), 89-121. Lampelj, E., Levstek, M., Stražar, M., Žgajnar Gotvajn, A. (2014). Fizikalno-kemijska obdelava tekočih odpadkov,
Slovenski kemijski dnevi, Poster 38, 1-17. Harif, T., Khai, M., Adin, A. (2012). Electrocoagulation versus chemical coagulation: Coagulation/flocculation
mechanisms and resulting floc characteristics, Water Research, 46, 3177-3188. Liu, H., Zhao, X., Qu, J. (2010). Electrocoagulation in water treatment (Ch. 10), Electrochemistry for the environment,
Springer Science+Business Media. New York. LLC; 245–262.

SEWAGE MANAGEMENT AND WASTEWATER TREATMENT 235
Optimization of Reactive Black 5 Dye Removal by Electrocoagulation Process Using Response Surface Methodology W.T. Mook*, M.K. Aroua*, M. Szlachta** and C.S. Lee* * Department of Chemical Engineering, University of Malaya, 50603 Kuala Lumpur, Malaysia. (E-mail: [email protected]; [email protected]; [email protected]) ** Faculty of Environmental Engineering, Wrocław University of Technology, Wyb. S. Wyspiańskiego 27, 50-370 Wrocław, Poland. (E-mail: [email protected])
INTRODUCTION Reactive dyes are widely used in the textile industry because of their vivid colors and easily attach to the textile fibers. However, approximate 15 % of unutilized dyes found in the dyebath effluent as low fixation of reactive dyes on fibers during the dyeing process. This amount is substantially dangerous for human beings, aquatic life as well as the environment. Reactive Black 5 dye (RB5) is popular used in textile industries for dyeing purposes and it contributes to 50% of the total world demand for reactive dyes (Schumacher, 2012). Electrocoagulation is one of the popular technique used for the treatment of textile dyeing wastewater (Nandi & Patel, 2013). It involves the coagulant produced in situ through electro-oxidation of sacrificial anode. This method produces low sludge, easy flocs separation and no secondary pollution as no external added coagulant (Mollah et al., 2001). The one-factor-at-a-time (OFAT) is typically applied in multifactor experiments, it is varying one parameter while others are fixed. This approach is slow, requiring large numbers of experiments and difficult to estimate the optimum parameters condition. In this work, Response surface methodology (RSM) was used to generate a regression model that describes the interactions between parameters. This analysis tool is an efficient statistical and time saving for developing a statistical model due to relatively few amounts of sets of experiment that needs to be conducted. MATERIALS AND METHODS The experiments were carried out using a Plexiglas cylinder with 9.5 cm inner diameter. The anode surface was 29.87 cm2 and kept the inter-electrode spacing with the cathode (round iron plate) at 2 cm. The reactor was connected to a programmable DC power supply. The pH of the Reactive Black 5 (RB5) was adjusted by either 0.1M of sulphuric acid or sodium hydroxide solution as per requirement. Response Surface Methodology (RSM) was used to optimize the three vital parameters, namely pH, current and treatment time. The total number of experiments designed by RSM was 17 runs, including three repeated experimental runs at the central point to eliminate errors and curvature. RESULTS AND DISCUSSION The parameters and RB5 removal were examined using Central Composite Design (CCD) to establish a correlation between them. The analysis suggested a quadratic model for the response function. The regression model was achieved according to Eq. (1), where where Yact represents RB5 removal efficiency and X1, X2 and X3 are initial pH, current and treatment time respectively after excluding insignificant terms.

SEWAGE MANAGEMENT AND WASTEWATER TREATMENT 236
Yact = -161.738 + 32.791X1 + 2280.528X2 + 0.176X3 – 2.365X12 – 15692.183X2
2 – 0.0249X1X3 + 12.612X2X3 (1) Figure 1 (a) and (b) shows the interactions between three variables in a three-dimensional surface plot for RB5 removal according to Eq. (1). Figure 1 (a) shows the interaction of the initial pH solution and treatment time on RB5 removal at a constant current of 0.07A. The plot depicts that the higher RB5 removal was found in neutral condition as this is close to the optimal pH for Fe(OH)3 solid formation to remove RB5 through adsorption and precipitation (Şengil & Özacar, 2009). When initial pH is higher than 9, the monomeric anion, Fe(OH)4
- is the predominant species and formed via dissolving Fe(OH)3 (Kobya, 2006); hence anodic generation of Fe2+ was negatively affected. An increase in treatment time improves the RB5 removal efficiency, which is attributable to the sufficient reaction time for iron hydroxide and dye compounds. Figure 1 (b) depicts the relationship of current and treatment time on dye removal at a constant pH 7. The plot shows that a high current seems to be advantageous for the electrocoagulation of RB5 solution. Higher current increases the formation of Fe(OH)3 from Fe2+, which, according to the Faraday’s law that the amount of Fe2+ formation is directly proportional to the current (Mollah et al., 2004). However, lower high current and longer treatment time, changes in RB5 removal were insignificant even though there was sufficient reaction time. In order to achieve high RB5 removal, the optimum conditions suggested by RSM which were initial pH of 7.57, current of 0.08A and treatment time of 53.5 min. The predicted RB5 removal was 84.1 %, which the percentage error between experimental and predicted results was only 3-5 %. This proves that the proposed model can be sufficient used to predict the RB5 removal.
a) b) Figure 1. Response surface plot of RB5 removal efficiency (i) interaction between pH and treatment time, (ii) interaction between current and treatment time REFERENCES Kobya, M., Demirbas, E., Can, O.T. and Bayramoglu, M. (2006). Treatment of levafix orange textile dye solution by
electrocoagulation. Journal of Hazardous Materials, 132, 183-188. Mollah, M.Y.A., Schennach, R., Parga, J.R. and Cocke, D.L. (2001). Electrocoagulation (EC) — science and
applications. Journal of Hazardous materials, 84, 29-41. Mollah, M.Y.A., Pathak, S.R., Patil, P.K., Vayuvegula, M., Agrawal, T.S., Gomes, J.A.G., Kesmez, M. And Cocke,
D.L. (2004). Treatment of orange II azo-dye by electrocoagulation (EC) technique in a continuous flow cell using sacrificial iron electrodes. Journal of Hazardous Materials, 109, 165-171.
Nandi, B.K. and Patel, S. (2013) Effects of operational parameters on the removal of brilliant green dye from aqueous solutions by electrocoagulation. Arabian Journal of Chemistry, (in press).
Schumacher, C. (2012). More Challenges in the Greenpeace Detox Campaign, (http://blog.stepchange-innovations.com/2012/11/more-challenges-in-the-greenpeace-detox-campaign/). Accessed 26-1-2016.
Şengil, İ.A. and Özacar, M. (2009). The decolorization of C.I. Reactive Black 5 in aqueous solution by electrocoagulation using sacrificial iron electrodes. Journal of Hazardous Materials, 161, 1369-1376.

SEWAGE MANAGEMENT AND WASTEWATER TREATMENT 237
Efficacy Evaluation of Biosorption of Anti-Epileptic Drug – Carbamazepine onto Low - Cost Adsorbent Prepared from Apricot Stones M. Novaković, S. Pap, V. Bežanović, I. Mihajlović, M. Đogo, J. Radonić and M. Turk-Sekulić* * Department of Environmental Engineering and Occupational Safety and Health, Faculty of Technical Sciences, University of Novi Sad, Trg Dositelja Obradovića 6 (E-mails: [email protected]; [email protected]; [email protected]; [email protected]; [email protected]; [email protected]; [email protected])
INTRODUCTION In recent decades, increased use of pharmaceutical active compounds across the world, has educed their presence in aquatic matrices coming from sewage system. Pharmaceutical residues represent emerging micropollutants, continuously inputted into environmental matrices, especially water media, which lead to their pseudo-persistency, even they are present in trace levels (ranging from few ng/L to several µg/L) (Avila, 2015). Due to their different and mostly unknown physico-chemical properties, their removal from wastewater is a major challenge, since it is less than 50 % for many pharmaceuticals in wastewater treatment plants (WWTP). Carbamazepine (CBZ) is an anticonvulsant used for treatment of epilepsy. Recent studies have shown that removal efficiency of CBZ using conventional active sludge treatment in WWTP was less than 30 %, so insufficient removal efficiency of carbamazepine and its metabolites causes their occurrence in aquatic ecosystems (Mohapatra, 2014). According to previous research, 72 % of CBZ oral used, is absorbed, while 28 % remains unchanged and it is excreted via urine and faeces. Hence, CBZ can be defined as a potential indicator of anthropogenic pollution. Previous studies have demonstrated that CBZ is not subject to biodegradation and its partition coefficient between water and sludge (Kd) is small, which indicates that the majority of carbamazepine discharged from sewage systems remain in an aqueous matrix. Biosorption is a physiochemical phenomenon of linkage pollutants (pharmaceuticals, metal ions, dyes etc.) on the surface of biomass by the presence of characteristic chemical functional groups (e.g., carboxylic, hydroxyl, amino, carbonyl etc.). Besides biological treatment processes, biosorption has become an effective and promising alternative for methods which are used today in the removal of pharmaceuticals from wastewater. Biosorption as a very complex phenomenon depends on many factors such as temperature, pH, sorbent mass or concentration, initial adsorbate concentration and time of the process. MATERIAL AND METHODS Preparation of low – cost adsorbent Adsorption with activated carbon (AC) is one of the most used technologies in the treatment of water. Although AC is a preferred adsorbent in practice, its widespread use is restricted due to its high cost of raw materials and the production cost. In order to decrease the cost of production, attempts have been made to find low cost alternative adsorbents from different lignocellulosic biomass materials (fruit stones, nuts shells, woods etc.). These materials have low cost on the market, high carbon contents and low inorganic compound levels, therefore have a better yield during the carbonization processes. Generally, two different procedures are used for the preparation

SEWAGE MANAGEMENT AND WASTEWATER TREATMENT 238
of biosorbents: chemical and physical activation. Within our research, apricot stones were prepared with chemical activation and used for the CBZ removal in laboratory conditions. Preparation of biosorbent included the following steps: apricot stones were crushed in a mill and impregnated with 50 % H3PO4. Subsequently, impregnated samples were air dried at room temperature. The samples were placed in a furnace and heated (10 °C/min) to the final carbonization temperature of 500 °C for 2 h. After cooling, the adsorbent was washed with distilled water. Analytical method The CBZ concentrations were measured using high performance liquid chromatography with diode array detector (Agilent 1260). Optimal conditions were studied and they include: effect of pH values (3, 5, 6, 7, 8, 10), the mass of adsorbent (1, 2, 3, 4, 5, 6 mg), contact time (5, 10, 15, 20, 30, 40 min) and initial concentration of solution (2, 4, 5, 6, 8, 10 mg/l). CBZ standard solutions were prepared in range from 1,5 to 10 mg/l used for construction of calibration curve. Correlation coefficient was r2 = 0,9999. Figure 1 shows effect of pH on CBZ biosorption.
Figure 1. Effect of pH on CBZ biosorption RESULTS AND DISCUSSION
Figure 1. shows that pH barely affects on removal efficiency of CBZ. Carbamazepine acts like neutral component, so it is stable in testing pH range. Percentage of removal is between 86 % and 95 %. For further research, pH 7 was used as a fixed value. The results obtained in this study showed that the apricot stone is a potential biosorbent, with a high biosorption capacity, for the efficient removal of CBZ from water media. REFERENCES Avila, C., Garcia, J. (2015). Pharmaceuticals and personal care products (PPCPs) in the environment and their removal
from wastewater through constructed wetland. Comprehensive Analytical Chemistry, 67, 195-244. Mohaptara, D.P., Brar, S.K., Tyagi, R.D, Picard, P., Suramapalli, R.Y. (2014). Analysis and advanced oxidation
treatment of a persistent pharmaceutical compound in wastewater and wastewater sludge-carbamazepine. Science of The Total Environment, (470 – 471), 58-75.

SEWAGE MANAGEMENT AND WASTEWATER TREATMENT 239
Urban Catchment Pilot Study Criteria Selection for Hydrology and Hydraulic Parameters Research M. Nowakowska, K. Wartalska and B. Kaźmierczak* * Wrocław University of Technology, Faculty of Environmental Engineering, Department of Water Supply and Sewerage Systems, 50-377 Wrocław, Pl. Grunwaldzki 9, Poland (E-mails: [email protected]; [email protected]; [email protected])
INTRODUCTION Drainage areas systems operating reliability (storm water or combined sewage system) is not fully achievable, both now and in the future, due to the random and non-stationary in time characteristic of rainfall – caused by climate change among others. Therefore it is important to seek the secure dimensioning solution that guarantees the achievement of modern drainage in urban areas standard, according to the PN-EN 752: 2008 and ATV A118-2006 recommendation - also in the future. Nowadays, it is recommended to verify the hydraulic capacity of dimensioned channels and facilities, especially in large rain catchments (over 2 km2 area) using hydrodynamic simulation, e.g. using SWMM software (Storm Water Management Model). Hydrodynamic calculations requires different catchment load scenarios considering variable in time and space, stationary and non-stationary rainfall events (Cambez et al., 2008, Nowakowska et al., 2012, Kotowski, 2015). In Poland modeling of sewer systems operating is rarely used. RESEARCH METHODS AND AREA
Wrocław covers an area of nearly 293 km2 and has a mixed sewerage system (distributive and combined), with a length of the channel to 1,700 km. From 2012 wastewater stream were monitored using measuring network of 8 flowmeters (on the main sewer collectors) and 6 automatic weighing rain gauges. Preliminary studies for the Wrocław sewerage system hydrodynamic modelling purposes were provided - for pilot study urban catchment, with an area of up to 4 km2. Singh (2002) simulation research results have shown that rain moving in the direction opposite to the direction of sewage flow, causes the lower runoff peak than if the rain moves in the same direction as flow. Wind direction and velocity data were collected and analyzed in order to recognize a local phenomenon of precipitation movement over the area of Wroclaw (Figure 1). Winds form the W – E directions were dominant in Wrocław.
Figure 1. Compass rose for Wroclaw: a) wind direction in %; b) average wind velocity in m·s-1
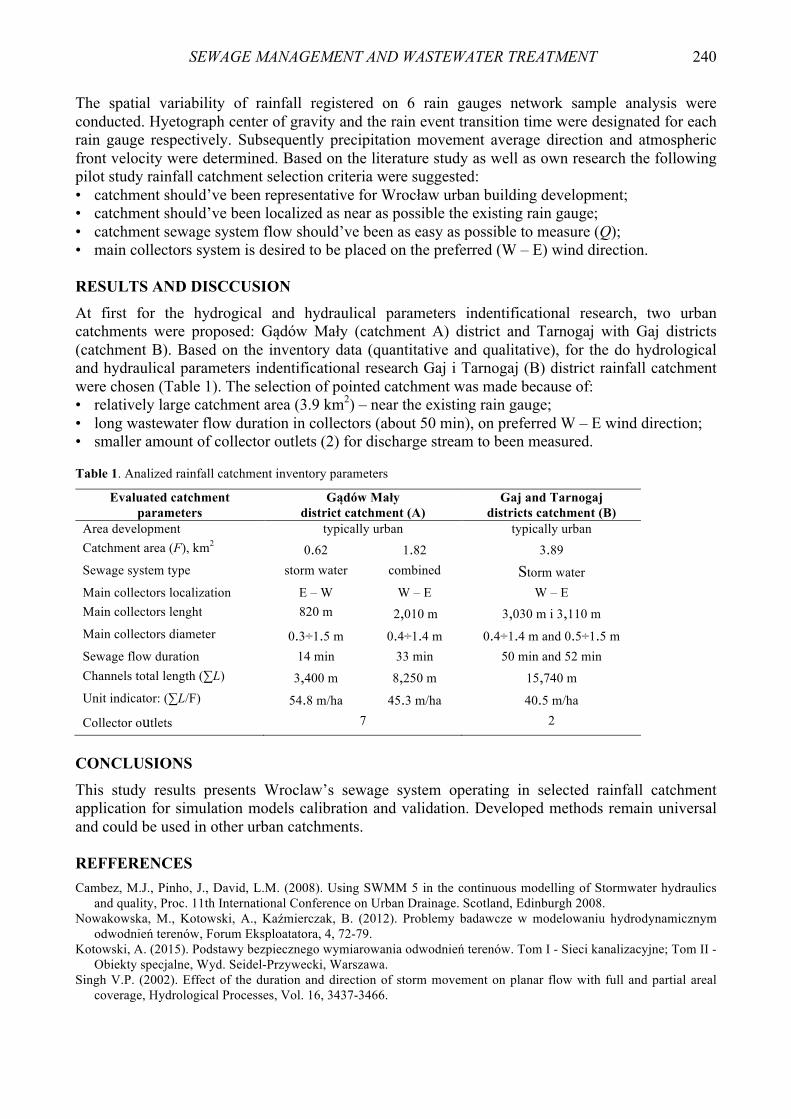
SEWAGE MANAGEMENT AND WASTEWATER TREATMENT 240
The spatial variability of rainfall registered on 6 rain gauges network sample analysis were conducted. Hyetograph center of gravity and the rain event transition time were designated for each rain gauge respectively. Subsequently precipitation movement average direction and atmospheric front velocity were determined. Based on the literature study as well as own research the following pilot study rainfall catchment selection criteria were suggested: • catchment should’ve been representative for Wrocław urban building development; • catchment should’ve been localized as near as possible the existing rain gauge; • catchment sewage system flow should’ve been as easy as possible to measure (Q); • main collectors system is desired to be placed on the preferred (W – E) wind direction. RESULTS AND DISCCUSION
At first for the hydrogical and hydraulical parameters indentificational research, two urban catchments were proposed: Gądów Mały (catchment A) district and Tarnogaj with Gaj districts (catchment B). Based on the inventory data (quantitative and qualitative), for the do hydrological and hydraulical parameters indentificational research Gaj i Tarnogaj (B) district rainfall catchment were chosen (Table 1). The selection of pointed catchment was made because of: • relatively large catchment area (3.9 km2) – near the existing rain gauge; • long wastewater flow duration in collectors (about 50 min), on preferred W – E wind direction; • smaller amount of collector outlets (2) for discharge stream to been measured. Table 1. Analized rainfall catchment inventory parameters
Evaluated catchment parameters
Gądów Mały district catchment (A)
Gaj and Tarnogaj districts catchment (B)
Area development typically urban typically urban Catchment area (F), km2 0.62 1.82 3.89 Sewage system type storm water combined Storm water Main collectors localization E – W W – E W – E Main collectors lenght 820 m 2,010 m 3,030 m i 3,110 m Main collectors diameter 0.3÷1.5 m 0.4÷1.4 m 0.4÷1.4 m and 0.5÷1.5 m Sewage flow duration 14 min 33 min 50 min and 52 min Channels total length (∑L) 3,400 m 8,250 m 15,740 m Unit indicator: (∑L/F) 54.8 m/ha 45.3 m/ha 40.5 m/ha
Collector outlets 7 2
CONCLUSIONS
This study results presents Wroclaw’s sewage system operating in selected rainfall catchment application for simulation models calibration and validation. Developed methods remain universal and could be used in other urban catchments. REFFERENCES Cambez, M.J., Pinho, J., David, L.M. (2008). Using SWMM 5 in the continuous modelling of Stormwater hydraulics
and quality, Proc. 11th International Conference on Urban Drainage. Scotland, Edinburgh 2008. Nowakowska, M., Kotowski, A., Kaźmierczak, B. (2012). Problemy badawcze w modelowaniu hydrodynamicznym
odwodnień terenów, Forum Eksploatatora, 4, 72-79. Kotowski, A. (2015). Podstawy bezpiecznego wymiarowania odwodnień terenów. Tom I - Sieci kanalizacyjne; Tom II -
Obiekty specjalne, Wyd. Seidel-Przywecki, Warszawa. Singh V.P. (2002). Effect of the duration and direction of storm movement on planar flow with full and partial areal
coverage, Hydrological Processes, Vol. 16, 3437-3466.
SEWAGE MANAGEMENT AND WASTEWATER TREATMENT 241
Elimination of Selected Pharmaceuticals from Municipal Wastewater in Vertical Flow Constructed Wetlands: the Effect of Operation Mode and Vegetation M. Nowrotek**, A. Sochacki*, E. Felis* and K. Miksch*
* Silesian University of Technology, Environmental Biotechnology Department, ul. Akademicka 2, 44-100 Gliwice, Poland ** Silesian University of Technology, Centre for Biotechnology, ul. Krzywoustego 8, 44-100 Gliwice, Poland (E-mail: [email protected])
INTRODUCTION Pharmaceutical substances and their residues are ubiquitously present in the aquatic environment at continuously increasing concentrations. Therefore, attempts are being made to reduce their transfer into the environment by using different wastewater treatment processes. Some pharmaceuticals, due to their refractory character, are not removed in conventional wastewater treatment systems with activated sludge, thus additional post-treatment methods are needed. In particular, the elimination anti-inflammatory drugs (such as diclofenac, DCF), which are often available over the counter, and various groups of antibiotics (e.g. sulfamethoxazole, SMX) appears to be a considerable challenge. Selected near-natural technologies, such as constructed wetlands (CWs), offer broader range (than in the activated sludge process) of potential removal mechanisms, which are associated with the effect of bacteria, substrate, plants and sunlight exposure. The objective of this study was to investigate the removal of DCF and SMX in a lab-scale vertical flow CW and to study the effect of plants and the operation mode on the removal of these compounds.
MATERIAL AND METHODS The lab-scale CW system consisted of 24 columns operated in a vertical flow mode with unsaturated sand bed. Eight types of columns (in triplicate) were used in the experiment depending on the: presence of a mixture of DCF/SMX in the feed, presence of plants (giant miscanthus), and the feeding/resting regime (80 mm/pulse; 2 d feeding/5 d resting, 32 mm/pulse; 5 d feeding/2 d resting). Simulated municipal wastewater was used to feed the system. The following symbols were used to denote the columns: planted columns (P), unplanted columns (U), columns fed with wastewater containing DCF and SMX (‘PhC’ columns), and columns fed with the wastewater without DCF and SMX (denoted as ‘noPhC’), which yielded: PhC-U, PhC-P, and their respective control columns noPhC-U, and noPhC-P. The duration of this phase of the experiment was 32 days (start-up period), but the overall duration of the experiment was more than 500 days (start-up for another period, prior to the replacement of the filtering medium presented in Nowrotek et al., 2016).
RESULTS AND CONCLUSIONS The removal and temporal behaviour of SMX and DCF are presented in Figure1. As it can be seen in Figure 1 the removal of DCF was relatively high in the columns fed in the 5 d feeding/2 d resting mode (88.07 % and 83.13 % in planted and unplanted columns, respectively). In the columns operated in the 2 d feeding/5 d resting regime the removal of DCF was slightly lower (74.82 % and 71.12 %). In the case of SMX the removal was moderately low in all the types of columns with the exception of the unplanted columns fed in the 5 d feeding/2 d resting mode. For DCF the presence of plants, lower hydraulic loading and shorter resting period positively affected the removal. For SMX the effect of these factors was considerably less apparent. These findings suggest that both the

SEWAGE MANAGEMENT AND WASTEWATER TREATMENT 242
operation mode and the presence of plants may play a role (possibly indirect) in the removal of pharmaceuticals. Table 1 presents the influent and effluent concentrations of TKN and TOC and the values of COD and the corresponding removal efficiency.
Figure 1. Removal and temporal behaviour of SMX and diclofenac DCF in the lab-scale constructed wetlands; A denotes the columns fed in the 2 d feeding/5 d resting regime, and B - columns fed in the 5 d feeding/2 d resting regime Table 1. Influent and effluent concentrations (mg/L; average±standard deviation) of the standard wastewater parameters (%; average±standard deviation)
DCF and SMX were not found to have any effect on the removal of TKN and organic matter (measured as COD and TOC), which allows conclusion that CW may be used for the treatment of wastewater containing elevated concentrations of these compounds (e.g. from hospitals). The 5 d feeding/2 d resting period affected the removal of TKN (even up to 30%) and to lower degree the removal of TOC.
The project was partly supported by Grant UMO-2012/05/B/ST8/02739 from the National Center for Science in the project “Mechanism of pharmaceutical removal in constructed wetland” REFERENCES Nowrotek, M., Sochacki, A., Felis, E., Miksch, K. (2016). Removal of diclofenac and sulfamethoxazole from synthetic
municipal waste water in microcosm downflow constructed wetlands: Start-up results. International Journal of Phytoremediation, 18(2), 157-163.
Parameters Influent Effluent
2 d feeding/5 d resting 5 d feeding/2 d resting noPhC-P PhC-P noPhC-U PhC-U noPhC-P PhC-P noPhC-U PhC-U
COD concentration 992.7±12.85 109.5±51.21 96.2±33.87 56±17.53 102±52.5 69.1±38.45 61.44±15.34 70.44±45.9 60.55±41.27
removal (%) 89.02±5.13 90.35±5.4 94.4±1.75 89.7±5.26 93.1±3.85 93.9±4.13 93.8±1.53 93±4.6
TOC concentration 312.12±19.0 53.41±19.0 44.42±10.86 38.04±10.07 50.19±11.31 28.64±6.7 26.0±12.5 27.25±4.04 28.2±5.8
removal (%) 83.16±6.66 86.15±3.44 88.1±3.4 84.3±3.7 91.02±2.33 91.5±1.26 91.8±4.06 91.2±1.71
TKN concentration 149.9±19.4 46.13±11.6 26.41±7.13 13.68±8.71 17.74±13.4 9.2±4.4 7.2±2.53 8.88±2.98 8.16±2.56
removal (%) 67.5±8.9 80.2±9.6 88.3±7.2 87.1±11.1 94.0±2.54 95.2±1.5 94.1±2.0 94.5±2.0
SEWAGE MANAGEMENT AND WASTEWATER TREATMENT 243
Removal of Cd(II) and Zn(II) from Binary Aqueous Solutions onto Natural Zeolite by the Column Process I. Nuić, M. Trgo, N. Vukojević Medvidović and M. Ugrina* * Faculty of Chemistry and Technology, Department of Environmental Engineering, University of Split, Ruđera Boškovića 33, 21 000 Split, Croatia (E-mail: [email protected])
INTRODUCTION Industrial wastewaters are considered to be a major source of pollution with heavy metals which are highly toxic and have a tendency to bio-accumulate (Nagajyoti, 2010). Their removal to concentrations below the maximum allowed required the third degree treatment processes such as adsorption, ion exchange and membrane techniques (Barakat, 2011). Due to their high costs, in recent years researches have focused on the use of cost-effective and efficient natural materials (Wang, 2010). Ion exchange on natural zeolites is widely used in wastewater treatment and can be performed by the batch or the column process. The specificity of the column process is the possibility of zeolite regeneration and its multiple uses in several consecutive service and regeneration cycles. It is suitable for treatment of a large quantity of wastewaters, requires less investment and operating costs, which makes it economically more profitable than the batch process. This paper is focused on the investigation of competition between Cd and Zn in their binding onto zeolite from the binary aqueous solutions with different Cd/Zn concentration ratios. MATERIALS AND METHODS The used raw zeolite sample with particle size dp = 0.6 - 0.8 mm originates from Zlatokop deposit (Serbia) and consists of up to 80% clinoptilolite. Laboratory column tests were performed in a 50 cm long glass column of 1.2 cm internal diameter filled with the zeolite sample up to H = 8 cm. The binary (Cd+Zn) feed solutions prepared by dissolving Cd(NO3)2 x 4 H2O and Zn(NO3)2 x 6 H2O in ultrapure water were fed through the bed in the down-flow mode at a constant flow rate of Q = 1 ml/min. The total initial concentration was co(Cd+Zn) ≈ 1 mmol/l, with different co(Cd)/co(Zn) concentration ratios in the range of Cd/Zn = 0.14 - 1.93. After exhaustion, the zeolite was regenerated with the NaNO3 solution, c = 176.5 mmol/l. The effluent samples collected in all experiments were analyzed for Cd and Zn concentrations (IC, AAS) and pH values. RESULTS AND DISCUSSION The service cycles are best described by breakthrough curves in Figure 1a by plotting effluent c(Cd+Zn) and influent co(Cd+Zn) concentration ratios vs. service time. Typical S-shape breakthrough curves for Cd/Zn ratios of 0.14 and 1.07 show complete overlapping, while for Cd/Zn = 1.93 overshooting in total concentration can be observed. This indicates that although Cd and Zn have similar values of hydrated ionic radius, electronegativity and energy of hydration (Minceva, 2008), changes in the Cd/Zn concentration ratio may affect their competition after t ≈ 40 h, when the breakthrough point occurs. Regeneration curves in Figure 2a show that regeneration ends after tR ≈ 5 - 8 h. The volume VR of regeneration effluents was up to ≈ 9 - 12 times smaller than the volume of solution treated in service cycles, and thus ion concentrations were higher. The Michael method was applied in calculation of characteristic parameters (tB, VB, tE, VE, qB, qE, η, nR, VR ) from breakthrough and regeneration curves (results not presented here).
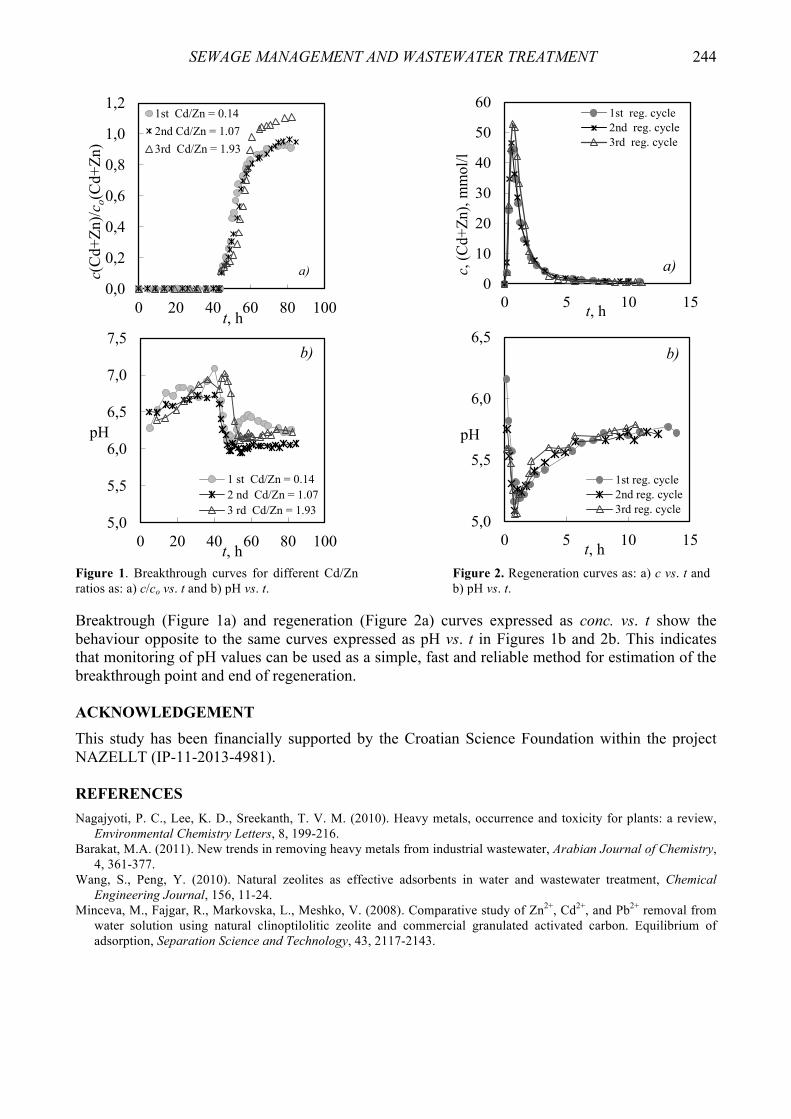
SEWAGE MANAGEMENT AND WASTEWATER TREATMENT 244
0,0
0,2
0,4
0,6
0,8
1,0
1,2
0 20 40 60 80 100
c(C
d+Zn
)/co(
Cd+
Zn)
t, h
1st Cd/Zn = 0.142nd Cd/Zn = 1.073rd Cd/Zn = 1.93
0
10
20
30
40
50
60
0 5 10 15
c, (C
d+Zn
), m
mol
/l
t, h
1st reg. cycle2nd reg. cycle3rd reg. cycle
5,0
5,5
6,0
6,5
7,0
7,5
0 20 40 60 80 100
pH
t, h
1 st Cd/Zn = 0.142 nd Cd/Zn = 1.073 rd Cd/Zn = 1.93
5,0
5,5
6,0
6,5
0 5 10 15
pH
t, h
1st reg. cycle2nd reg. cycle3rd reg. cycle
Figure 1. Breakthrough curves for different Cd/Zn ratios as: a) c/co vs. t and b) pH vs. t.
Figure 2. Regeneration curves as: a) c vs. t and b) pH vs. t.
Breaktrough (Figure 1a) and regeneration (Figure 2a) curves expressed as conc. vs. t show the behaviour opposite to the same curves expressed as pH vs. t in Figures 1b and 2b. This indicates that monitoring of pH values can be used as a simple, fast and reliable method for estimation of the breakthrough point and end of regeneration. ACKNOWLEDGEMENT This study has been financially supported by the Croatian Science Foundation within the project NAZELLT (IP-11-2013-4981). REFERENCES Nagajyoti, P. C., Lee, K. D., Sreekanth, T. V. M. (2010). Heavy metals, occurrence and toxicity for plants: a review,
Environmental Chemistry Letters, 8, 199-216. Barakat, M.A. (2011). New trends in removing heavy metals from industrial wastewater, Arabian Journal of Chemistry,
4, 361-377. Wang, S., Peng, Y. (2010). Natural zeolites as effective adsorbents in water and wastewater treatment, Chemical
Engineering Journal, 156, 11-24. Minceva, M., Fajgar, R., Markovska, L., Meshko, V. (2008). Comparative study of Zn2+, Cd2+, and Pb2+ removal from
water solution using natural clinoptilolitic zeolite and commercial granulated activated carbon. Equilibrium of adsorption, Separation Science and Technology, 43, 2117-2143.
a)
b)
a)
b)

SEWAGE MANAGEMENT AND WASTEWATER TREATMENT 245
Methodological Approach for Designing a Pilot Plant for Innovative Wastewater Treatment Process Based on Biofilm Technology Invention B. Pelivanoski*, K. Pirke*, E. Vasyukova*, M. Dohmann** and I. Sekoulov*** * WTE Wassertechnik GmbH, Ruhrallee 185, Essen, Germany (E-mails: [email protected]; [email protected]; [email protected]) ** Research Institute for Water and Waste Management at RWTH, Kackerstrasse 15-17, Aachen, Germany (E-mail: [email protected]) *** TuTech Innovation GmbH at TU Hamburg-Harburg, Harburger Schloßstrasse 6-12, Hamburg, Germany (E-mail: [email protected])
INTRODUCTION The innovative waste water treatment process considered in this study involves bacteria separation based on different bio-carrier media in a flow classifying reactor for nitrogen removal. The process includes pre-denitrification followed by nitrification and carbon removal. The hydraulic and process conditions in the reactor enable spatial separation of the bacteria on different materials, with nitrifying bacteria being fixed on one carrier type and heterotrophic bacteria on another. This approach promises high process efficiencies and was previously published elsewhere (Pelivanoski et al., 2015). This paper addresses a methodological approach for successful transformation of the mentioned wastewater treatment processes invention into a market-mature innovation. The available data from the completed batch scale experiments (Dohmann et al., 2004, Sekoulov et al., 2012) serve as an important base for assessing and upscaling the proposed new wastewater technology. The importance of furthering the treatment process to a pilot and later to a full scale waste water treatment plant is critical for its development, where at first the specification of the pilot plant components should be evaluated, automation set up developed and control systems defined. A proper design of a pilot plant as the first step towards process implementation can help avoiding disappointing performance of the process as well as reduce the unnecessary elevated costs during piloting due to possible mechanical and operational difficulties. The objective of this study is, therefore, to develop a methodological approach (algorithm) to design a pilot plant based on the available batch results under consideration of the relevant scaling factors. METHODOLOGY In order to reach the objective, quantification rules have to be defined, which should be correlated with appropriate scaling factors that influence the process performance and its upscaling. Furthermore, an economic evaluation of the design should be performed in order to redefine the quantification rules before the design finalisation. Selection of quantification rules Different operation scenarios for a biofilm reactor can be described with quantifying rules, such as water velocity, air flow velocity, retention time, sludge age, reactor surface area and volume as well as reaction rates. Moreover, this kind of approach not only implies the plant constructor’s capability of designing and operating large plants but also a skill of developing new and more efficient reaction-based wastewater treatment technologies in order to become cost and product competitive and to meet environmental and legislative requirements. The selection of the quantification rules is approached from two sides: by extrapolating the values that were obtained during batch scale
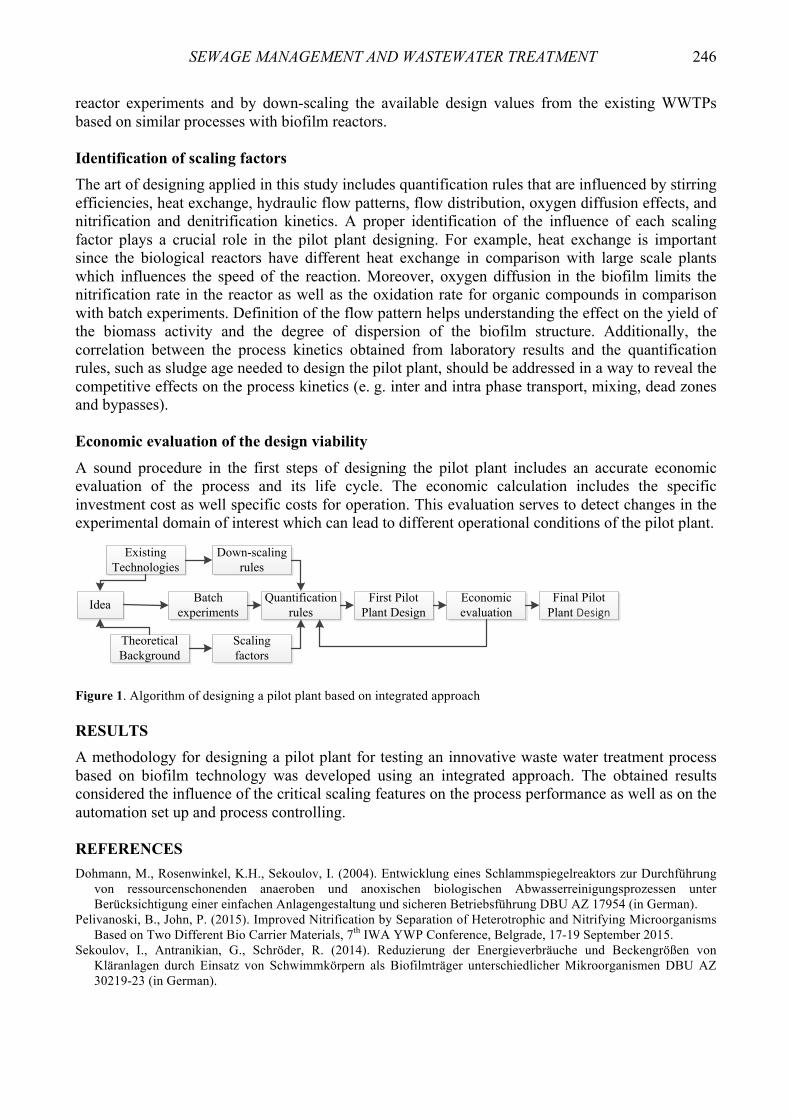
SEWAGE MANAGEMENT AND WASTEWATER TREATMENT 246
reactor experiments and by down-scaling the available design values from the existing WWTPs based on similar processes with biofilm reactors. Identification of scaling factors The art of designing applied in this study includes quantification rules that are influenced by stirring efficiencies, heat exchange, hydraulic flow patterns, flow distribution, oxygen diffusion effects, and nitrification and denitrification kinetics. A proper identification of the influence of each scaling factor plays a crucial role in the pilot plant designing. For example, heat exchange is important since the biological reactors have different heat exchange in comparison with large scale plants which influences the speed of the reaction. Moreover, oxygen diffusion in the biofilm limits the nitrification rate in the reactor as well as the oxidation rate for organic compounds in comparison with batch experiments. Definition of the flow pattern helps understanding the effect on the yield of the biomass activity and the degree of dispersion of the biofilm structure. Additionally, the correlation between the process kinetics obtained from laboratory results and the quantification rules, such as sludge age needed to design the pilot plant, should be addressed in a way to reveal the competitive effects on the process kinetics (e. g. inter and intra phase transport, mixing, dead zones and bypasses). Economic evaluation of the design viability
A sound procedure in the first steps of designing the pilot plant includes an accurate economic evaluation of the process and its life cycle. The economic calculation includes the specific investment cost as well specific costs for operation. This evaluation serves to detect changes in the experimental domain of interest which can lead to different operational conditions of the pilot plant. Figure 1. Algorithm of designing a pilot plant based on integrated approach RESULTS A methodology for designing a pilot plant for testing an innovative waste water treatment process based on biofilm technology was developed using an integrated approach. The obtained results considered the influence of the critical scaling features on the process performance as well as on the automation set up and process controlling. REFERENCES Dohmann, M., Rosenwinkel, K.H., Sekoulov, I. (2004). Entwicklung eines Schlammspiegelreaktors zur Durchführung
von ressourcenschonenden anaeroben und anoxischen biologischen Abwasserreinigungsprozessen unter Berücksichtigung einer einfachen Anlagengestaltung und sicheren Betriebsführung DBU AZ 17954 (in German).
Pelivanoski, B., John, P. (2015). Improved Nitrification by Separation of Heterotrophic and Nitrifying Microorganisms Based on Two Different Bio Carrier Materials, 7th IWA YWP Conference, Belgrade, 17-19 September 2015.
Sekoulov, I., Antranikian, G., Schröder, R. (2014). Reduzierung der Energieverbräuche und Beckengrößen von Kläranlagen durch Einsatz von Schwimmkörpern als Biofilmträger unterschiedlicher Mikroorganismen DBU AZ 30219-23 (in German).
Idea Batch experiments
Quantification rules
Scaling factors
Economic evaluation
First Pilot Plant Design
Down-scaling rules
Final Pilot Plant Design
Theoretical Background
Existing Technologies

SEWAGE MANAGEMENT AND WASTEWATER TREATMENT 247
Determination of COD Fractionation as a Key Factor for Appropriate Modelling and Monitoring of Activated Sludge Processes A. Remiszewska-Skwarek*, J. Drewnowski**, S. Fudala-Ksiazek** and A. Luczkiewicz**
* Water and Sewage Management Utility Ltd. in Gdynia, Witominska Str. 29, 81-311 Gdynia, Poland (E-mail: [email protected]) ** Gdansk University of Technology, Faculty of Civil and Environmental Engineering, Narutowicza Str. 11/12, 80-233 Gdansk, Poland (E-mails: [email protected]; [email protected]; [email protected])
INTRODUCTION An operation of wastewater treatment plant is usually controlled by global parameters such as flow, solids retention time, sludge age, concentration of ammonia and dissolved oxygen, etc. It is considered that, together with the chemical and biological oxygen demand (COD and BOD), those parameters indirectly exhibit the effectiveness of activated sludge processes. Especially the BOD indicate the amount of organic pollution that can be biologically degraded, but in fact it is inadequate to describe the biodegradation kinetics of all organic substrates present in wastewater. Thus, the Activated Sludge Models (Henze et al., 1987 and 1995) commonly used by IWA Task Group, they all based on the COD fractionations, determined on the basis of different methods. The aim of this study was to evaluate the modeling of the biological treatment processes at wastewater treatment plants (WWTPs) using the oxygen uptake rate (OUR)-based respirometric test method together with the flocculation/filtration COD method. The first method measures the biomass activity in situ, expressed by changes in the dissolved oxygen (DO), while in the second method the distinction of COD into readily, slowly and not biodegradable fractions is achieved indirectly and involves flocculation/precipitation/filtration processes. Those parameters were determined for WWTP Gdynia-Debogorze (northern Poland) and implemented into. MATERIAL AND METHODS Extracting experimental data and modeling study. For the laboratory OUR batch tests the wastewater and activated sludge was obtained from WWTP that receives mainly municipal wastewater with a pollutant load corresponding to 420,000 PE and an average flow rate of Qav= 55,000 m3/d. The experimental set-up consisted of batch reactor equipped with a stirring and aeration systems, thermostatic unit, DO, redox, and pH/temperature probes as well as with a computer control system. In order to eliminate the oxygen consumption during nitrification the allylthiourea (ATU) was added. The temperature was maintained at 20.0oC and pH was kept in the range from 7.0 to 8.0. The biodegradable COD fractions for modeling were directly estimated during the OUR batch tests, while the other fractions were defined by additional calculations (Drewnowski & Makinia, 2011). The flocculation/filtration method measurements of the COD fractions were carried out in WWTP in Gdynia using the method described by Mamais et al. (1993). The total soluble organic fraction ST was determined as COD of raw wastewater after coagulation, while the inert (soluble) non- biodegradable organic fraction – SI was determined as COD of treated wastewater after coagulation. In case of other COD fractions: SS – readily (soluble) biodegradable, XS – slowly (particulate) biodegradable, XI - inert (particulate) non-biodegradable and XT – total particulate organic fraction, they were calculated according to the conversion formulas set out in the ATV–A113 (DWA, 2002).

SEWAGE MANAGEMENT AND WASTEWATER TREATMENT 248
The COD fractions, determined in the respirometry-batch tests and in the flocculation/filtration COD method, were simulated with the calibrated expanded ASM2d model, in order to compare both methods used for determination of COD fractions and their influence on processes occurring in wastewater treatment Analytical methods. The COD, BOD20, and Total/Volatile Suspended Solids (TSS/VSS) were determined according to Standard Methods (APHA, 2005). The total soluble COD fractions (ST) and the inert (soluble) non-biodegradable organic fraction (SI) were determined in wastewater after coagulation with zinc sulfate (10 % ZnSO4, at pH = 10.5) followed by filtration through 0.45 µm membrane filters (Mamais et al., 1993). RESULTS AND DISCUSION The average values of COD fractionation, estimated for tested municipal wastewater are presented in Table 1. According to the obtained results, the SS determined by the flocculation/filtration COD method measurements and respirometric tests differs, and accounted for 18.1 % and 31.3 % of total COD, respectively. It should be noted that this fraction is very important, because is easily available for microorganisms. Activated sludge bacteria can directly transform the substrates into cell growth and/or energy for cell maintenance. Comparative studies performed on raw wastewater in 21 Dutch full-scale WWTPs, revealed that the ratio of SS/total COD varied within the range of 9-42 % with the average value of 26 % (Roeleveld & van Loosdrecht, 2002). In case of SI, estimated by flocculation/filtration COD method and respirometric test methods, this fraction constituted in average 2.4 % and 4.9 % of total COD, respectively. Since the SI is not affected by biological processes, the presence of this fraction in biologically treated wastewater is particularly important for maintain correct operation of the WWTP. It is valid for wastewater with high contribution of industrial wastewater. In such cases the modeling study increases the understanding of biological treatment efficiency. The computer simulations implemented in GPS-x showed that the appropriate determination of COD fraction is important for modeling of biochemical processes.
Table 1. Results of the average COD fractionation determined by the flocculation/filtration COD method and respirometric test method in municipal wastewater
Flocculation/Filtration COD Method Respirometric Test Method
Component COD COD g O2/m3 % g O2/m3 %
COD fraction in municipal wastewater
SI 27.0 2.4 54.7 4.9 XI 382.3 33.1 143.7 12.8 SS 200.0 18.1 351.5 31.3 XS 521.7 46.3 572.6 51.0
Total COD 1130.9 100 1122.4 100 REFERENCES Drewnowski, J., Makinia, J. (2011). The role of colloidal and particulate organic compounds in denitrification and
EBPR occurring in a full-scale activated sludge system. Wat. Sci. Tech., 63(2), 318-324. DWA (2002). ATV-DVWK Worksheet A 131 E. Dimensioning of Single-Stage activated Sludge Plants, GFA
Publishing Hennef. Henze, M., Gujer, W., Mino, T., Matsuo, T., Wentzel, M.C. and Marais, G.v.R. and van Loosdrecht M. (1999).
Activated Sludge Model No. 2d. Wat. Sci. Tech., 39(1), 165-182. Mamais, D., Jenkins, D., Pitt, P. (1993). A Rapid Physical Chemical Method for the Determination of Readily
Biodegradable Soluble COD in Municipal Wastewater. Wat. Res., 27, 195-197. Roeleveld. P.J., van Loosdrecht, M.C.M. (2002). Experience with guidelines for wastewater characterization in The
Netherlands. Water Sci. Technol., 45(6), 77-87.

SEWAGE MANAGEMENT AND WASTEWATER TREATMENT 249
Effect of Surfactants on Denitrification in Biological Municipal Wastewater Treatment V.M. Rossinskyi and L.A. Sablii* * Department of Ecobiotechnology and Bioenergy, National Technical University of Ukraine «Kyiv Polytechnic Institute» , 37, Prospect Peremohy, 03056, Kyiv-56, Ukraine (E-mails: [email protected]; [email protected])
INTRODUCTION The municipal wastewater in Ukraine contains suspended solids 147.3-468.2 mg/l, phosphor compounds 0.2-15.8 mg/l, nitrogen compounds 13.2-63.7 mg/l. The average concentration of surfactants in municipal wastewater is ordinary 8-25 mg/l. The biological wastewater treatment by aerobic condition is not an effective method for removal of nitrogen compounds. For the effective removal of nitrogen compounds from municipal wastewater aerobic and anaerobic biological treatment technology is mainly used (Vasylenko, 2014). The active use in industry and households of powders and detergents is the major reason for presence of surfactants in municipal wastewater. The synthetic surfactants are amphiphilic xenobiotics and membranotropic compounds which can change the permeability and structure of biological membranes (Ostroumov, 2006). The presence of surfactants affects the activity of microorganisms in activated sludge and finally influences on the efficiency of biological wastewater treatment from organic compounds. In order to establish the surfactants effect on denitrification in the process of biological wastewater treatment experimental research was conducted in static and dynamic conditions. MATERIALS AND METHODS The experimental research of denitrification in static condition was conducted in 150 ml measuring beakers. In the experiment activated sludge contained 1, 5, 15, 30 mg/l anionic surfactants. After registring the time of beginning of the experiment the moments of settling, swelling and floating of activated sludge were registered. The experiment in dynamic conditions was conducted in an experimental bioreactor. Bioreactor is a cylindrical unit with the diameter of 0.1 m and 0.3 m height. The bottom part of the bioreactor has an outlet pipe with control valve for sampling. The concentration of activated sludge was determined by gravimetric method. In the experiment concentration of activated sludge was 1.8-2.1 g/l. The initial volume of activated sludge was 2 liters. Mixing of the activated sludge in bioreactor was performed by a submerged pump (Atman PH) which has the best performance of 360 l/hr without pre-filter. The maximum duration of the experiment in a series was 45 min. Samples of the activated sludge were taken every 15 min. Determination of nitrate concentration decrease was performed in filtered through a ashless filter paper "White Ribbon" water with the help of laboratory ionomers I-160MI. In each series of experiments linear alkylbenzene sulfonate (anionic surfactant) was used as a surfactant.

SEWAGE MANAGEMENT AND WASTEWATER TREATMENT 250
RESULTS AND DISCUSSIONS The results of the experiments showed a gradual inhibition process of floating of activated sludge while increasing concentration of surfactants in the wastewater. Thus, increasing the concentration of anionic surfactants in the wastewater from 1 to 5 mg/l leads to increased duration of the process of activated sludge rising. The increase of surfactants concentration leads to increasing time period necessary for activated sludge floating to 6 %, with anionic surfactants – from 1 to 30 mg/l - leads to increasing time period necessary for activated sludge floating to 60 %.
Figure 1. Biological denitrification in static (a) and dynamic (b) anoxic conditions by concentration of anionic surfactants (mg/l): 1 - <1; 2 - 5; 3 - 15; 4 - 30 Results of series of experiments in anoxic conditions in the bioreactor (Figure 1), which lasted 45 min showed the efficiency of reducing nitrates concentration to 64 % in the wastewater containing surfactants less than 1 mg/l, N-NO3
- - 16.9 mg/l. Increasing concentrations of surfactants in the wastewater to 30 mg/l, with the initial concentration of 14.4 mgN-NO3
-/l, lead to inhibition of the efficiency of nitrates reduction in the wastewater to 39 %. The average specific velocity of denitrification with the concentration of anionic surfactants in the wastewater less than 1 mg/l was 5.9 mgN-NO3
-/(g·hr). Increase of concentrations of anionic surfactants in the wastewater to 30 mg/l reduces the average specific velocity of denitrification in biological wastewater treatment in anoxic conditions to 3.1 mgN-NO3
-/(g·hr). CONCLUSION The results of experimental research on the effect of surfactants on processes of denitrification in the biological treatment of municipal wastewater showed inhibition of denitrification processes while increasing of surfactants in the wastewater. The increasing concentration of surfactants in the wastewater from 1 mg/l to 30 mg/l leads to reduction of the average specific velocity of denitrification by 48 %. REFERENCES Vasylenko, O., Polishchuk, O., Vasylenko, L. (2014). The applying of the technology of biological wastewater treating
from compounds of nitrogen and phosphorus in city treatment plants. Ecological safety and Environmental Sciences, 15, 90-101. (in Ukrainian).
Ostroumov, S.A. (2006). Biological Effects of Surfactants. CRC Press. Taylor & Francis. Boca Raton, London, New York, 2006, 279.
SEWAGE MANAGEMENT AND WASTEWATER TREATMENT 251
The Role of Biodegradable Particulate Organic Substrates in Anaerobic Digestion Systems J. Rubio*, L. Romero*, J. Garcia Morales*, J. Drewnowski** and F.J. Fernandez-Morales*** *Department of Environmental Technologies, Faculty of Marine and Environmental Sciences, University of Cadiz, Poligono rio San Pedro s/n,11510 Puerto Real, Cadiz, Spain ** Faculty of Civil and Environmental Engineering, Gdansk University of Technology, ul. Narutowicza 11/12, 80-233 Gdansk, Poland *** University of Castilla-La Mancha, ITQUIMA, Chemical Engineering Department, Avenida Camilo José Cela S/N. 13071 Ciudad Real, Spain. (E-mail: [email protected])
INTRODUCTION The hydrolysis process is very important (Henze et al., 1987). In the anaerobic digesters its importance is because this particulate fraction needs to be hydrolyzed before it can be transformed into methane in the anaerobic digestion systems. In literature different experimental approaches for the determination of the hydrolysis processes have been described, these involve the measurement of specific hydrolytic enzymes, measurement of specific hydrolytic intermediates or specific end products, measurement of respiration rates and also solving overall mass balances for bulk organic parameters. Currently, available models of hydrolysis predict adequately the typical wastes such as the domestic wastewaters. However, when the composition of the wastewater is not the conventional one or when the wastewater present high solids content, current modeling approaches may not be applicable (Morgenroth et al., 2002). This is because in the wastes, the particulate fractions are composed of a heterogeneous mixture of colloids and particles with variable chemical composition (Spanjers and Vanrolleghem, 1995; Sophonsiri and Morgenroth, 2004). In this context, the aim of this work was to develop and validate a new able to describe the hydrolysis process in an anaerobic digestion process working at very high organic solids loading. MATERIAL AND METHODS In this work, Cattle Manure (CM) and fresh two phase olive mill waste (2POMW) was mixed in different ratios in order to obtain mixtures containing different final solids contents. In order to adequately balance the carbon to nitrogen ratio, the wastes were selected on the basis of the optimal C/N ratio for the development of anaerobic processes (C/N 20-30) (Yadvika et al., 2004). Four mixtures were prepared by increasing the proportion of 2POMW from 50 % to 85 % being the 2POMW:CM ratios 50:50, 60:40, 75:25 and 85:15. The inoculum was taken from a mesophilic anaerobic digester aclimatized to co-digestion of both wastes. A water jacket and a temperature probe were used to maintain mesophilic temperature (35 °C ± 1 °C) and the pH was maintained about 8.0 by using a solution of Na2CO3 (2.8 M). The anaerobic reactor was operated at a hydraulic retention time of 40 days and organic loading rate of 1.92 gVS/(L·d). RESULTS AND DISCUSSION The hydrolysis concept developed was based on the original ASM2d. The modification considered a two-step hydrolysis process with a new variable (rapidly hydrolyzable substrate, XSH). A scheme of the model is presented in Figure 1. This model incorporates one new component, XSH, and a new processes, the anaerobic hydrolysis of XSH. The new variable, XSH, identified as ‘readily hydrolyzable’ leads to a two-step hydrolysis process. The main difference with the ASM2d model is that XSH is hydrolyzed faster than the conventional particulated substrates, XS.
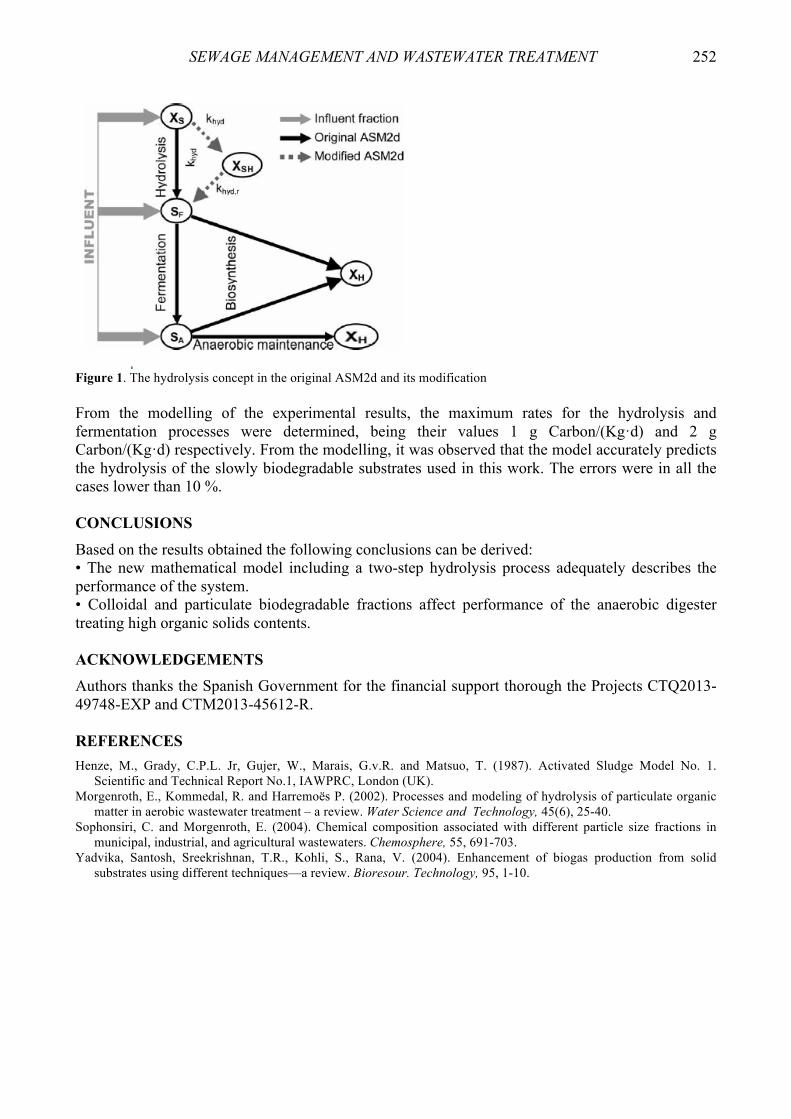
SEWAGE MANAGEMENT AND WASTEWATER TREATMENT 252
Figure 1. The hydrolysis concept in the original ASM2d and its modification From the modelling of the experimental results, the maximum rates for the hydrolysis and fermentation processes were determined, being their values 1 g Carbon/(Kg·d) and 2 g Carbon/(Kg·d) respectively. From the modelling, it was observed that the model accurately predicts the hydrolysis of the slowly biodegradable substrates used in this work. The errors were in all the cases lower than 10 %. CONCLUSIONS
Based on the results obtained the following conclusions can be derived: • The new mathematical model including a two-step hydrolysis process adequately describes the performance of the system. • Colloidal and particulate biodegradable fractions affect performance of the anaerobic digester treating high organic solids contents. ACKNOWLEDGEMENTS Authors thanks the Spanish Government for the financial support thorough the Projects CTQ2013-49748-EXP and CTM2013-45612-R. REFERENCES Henze, M., Grady, C.P.L. Jr, Gujer, W., Marais, G.v.R. and Matsuo, T. (1987). Activated Sludge Model No. 1.
Scientific and Technical Report No.1, IAWPRC, London (UK). Morgenroth, E., Kommedal, R. and Harremoës P. (2002). Processes and modeling of hydrolysis of particulate organic
matter in aerobic wastewater treatment – a review. Water Science and Technology, 45(6), 25-40. Sophonsiri, C. and Morgenroth, E. (2004). Chemical composition associated with different particle size fractions in
municipal, industrial, and agricultural wastewaters. Chemosphere, 55, 691-703. Yadvika, Santosh, Sreekrishnan, T.R., Kohli, S., Rana, V. (2004). Enhancement of biogas production from solid
substrates using different techniques––a review. Bioresour. Technology, 95, 1-10.

SEWAGE MANAGEMENT AND WASTEWATER TREATMENT 253
Evaluation of Various Samples of Activated Sludge for a Start-Up of Pharmaceutical Wastewater Treatment Plant M. Šabić*, M. Vuković Domanovac* and E. Meštrović** * Department of Industrial Ecology, Faculty of Chemical Engineering and Technology, University of Zagreb, Marulićev trg 19, HR-10000 Zagreb, Croatia (E-mail: [email protected]; [email protected]) ** PlivaHrvatska d.o.o., Prilaz baruna Filipovića 25, HR-10000 Zagreb, Croatia (E-mail: [email protected])
INTRODUCTION
The activated sludge flocs contain mostly bacterial cells as well as other microorganisms, and inorganic and organic particles. The presence of particular types of microorganisms is related to plant performance and effluent quality, so they can be used as indicators of sludge quality (Cordi, 2012). Pharmaceutical wastewater contains specific substances which may be difficult to biodegrade, so it is important to have fundamental understanding of the microbial community structure and stability, as well its response to different chemicals entering the wastewater (Meng, 2015). Thus, stable and efficient WWTP process can be achieved. MATERIALS AND METHODS
The goal of this study was to investigate which activated sludge (AS) would be more suitable to be used as inoculum for start-up of pharmaceutical wastewater treatment plant. Three samples of AS were analyzed: industrial (AS1) and municipal (AS2, AS3). During the experiments COD, pH, DO, MLSS and MLVSS were monitored. Microscopic analysis was performed to monitor the quality of activated sludge in order to give a quick insight into condition of the system. RESULTS AND DISCUSSION
Microscopic examination was conducted in order to characterize the quality of activate sludge (Figure 1). This means that morphology of the flocs, also as presence of other indicators of sludge quality were determined. In sample AS1, flocs are not formed and small number of protozoa is present, mainly as single stalked ciliates. Good indicator species should be found mostly in a single group of a typology and be present at the most of the sites belonging to that group (Papadimitriou, 2013). In AS2 the flocs appear in wide range of size and shape, but they are not compact enough, while AS3 have some formed flocs. The main problem in AS3 sample is large number of filamentous bacteria which can cause bulking and problems in WWTP process (Mesquita, 2011).
a) b) c) Figure 1. Microphotographs of activated sludge for a) AS1, b) AS2 and c) AS3, M = 100×

SEWAGE MANAGEMENT AND WASTEWATER TREATMENT 254
The results of MLVSS/MLSS, DO and pH value, for given initial concentrations of pharmaceutical wastewater (COD) and MLSS (Table 1), show that the conditions for biodegradation were favorable. Table 1. The results of experiments in batch conditions for AS1-AS3
Sample COD0 MLSS0 MLVSS/MLSS DO pH [mg dm-3] [g dm-3] [-] [mg dm-3] [-]
AS1 2690 3.62±0.12 0.52±0.70 7.42±0.31 8.45±0.05
AS2 2690 2.94±0.08 0.81±0.03 7.09±0.69 8.44±0.13
AS3 2100 2.38±0.31 0.75±0.03 6.38±0.80 8.19±0.15
Biodegradation experiments were conducted in order to evaluate which activated sludge is going to be more efficient in removal of organic contaminants. Removal efficiency of organic contaminants from wastewater at 8th hour was approximately 39 % for all three AS (Figure 2). After 96 hours, biodegradation efficiency achieved by AS1, AS2 and AS3 was 69.6 %, 65.2 % and 62.0 %, respectively.
Figure 2. Efficiency of biodegradation of pharmaceutical wastewater for AS1-AS3 CONCLUSIONS
Microscopic analysis gives quick feedback on the physical nature of activated sludge flocs and on the type and abundance of other microorganisms present in activated sludge. Based on microscopic analysis, samples AS1 and AS2 are medium quality activated sludges, while AS3 is poor quality sludge. The highest efficiency of biodegradation process in 8th and 96th hour was achieved with activated sludge AS1. REFERENCES
Cordi, L., Assalin, M. R., Ponezi, A. N., Duran, N. (2012) Identification of Microbiota for Activated Sludge Acclimated by Paper Mill Effluent Kraft E1 Bioremediation. Journal of Bioremediation & Biodegradation, 3(11), 169.
Meng, F., Gao, G., Yang, T.-T., Chen, X., Chao, Y., Na, G., Ge, L., Huang, L.-N. (2015) Effects of Fluoroquinolone Antibiotics on Reactor Performance and Microbial Community Structure of a Membrane Bioreactor. Chemical Engineering Journal, 280, 448-458.
Mesquita, D. P., Amaral, A. L., Ferreira, E. C. (2011) Identifying different types of bulking in an activated sludge system through quantitative image analysis. Chemosphere, 85, 643-652.
Papadimitriou, C. A., Petridis, D., Zouboulis, A. I., Samaras, P., Yiangou, M., Sakellaropoulos, G. P. (2013) Protozoans as indicators of sequential batch processes for phenol treatment; an autoecological approach. Ecotoxicology and Environmental Safety, 98, 210-218.
(a)

SEWAGE MANAGEMENT AND WASTEWATER TREATMENT 255
Energy Efficiency of Coarse- and Fine-Bubble Aeration Systems in the MBBR IFAS Process S. Sander and M. Wagner*
* Technische Universität Darmstadt, Institute IWAR, Franziska-Braun-Str. 7, 64287 Darmstadt, Germany (E-mails: [email protected]; [email protected])
INTRODUCTION With the MBBR (Moving Bed Biofilm Reactor) IFAS process (Integrated Fixed-Film Activated Sludge), the biomass required for biological wastewater treatment is either suspended or fixed on free-moving plastic carriers in the reactor. In order to ensure the oxygen transfer and to keep the carriers suspended, coarse- as well as fine-bubble aeration systems are used in the MBBR IFAS process (Ødegaard et al., 2014). There are a few industrial-scale case studies on how the carriers effect the energy efficiency of the aeration system (Rosso et al., 2011; Viswanathan et al., 2008). However, there is a deficit in systematic investigations regarding this topic, in particular under process conditions. MATERIAL AND METHODS Tests, investigating the energy efficiency of the aeration system, were carried out using two pilot-scale test reactors (length 1.2 m; width: 1.2 m; water depth: 5.94 m). Both reactors were operated in continuous mode and fed with activated sludge from a municipal wastewater treatment plant (WWTP Licunhe, Qingdao, China). One reactor was equipped with a coarse-bubble aeration system (4 PVC tubes, each with 14 holes of 3.5 mm in diameter), the other with a fine-bubble aeration system (2 disc aerators). For testing, the reactors were filled with plastic carriers (Spring Water-Treatment Ltd.) to 0; 17; 33 and 50 vol-%. Basically, the in-process energy consumption of diffused aeration systems is affected by two parameters: The specific standard oxygen transfer efficiency (αSSOTE in %/m) and the overall system pressure in the air pipes (pR in mbar). For each investigated filling rate, these two parameters were recorded continuously (2 x 24h) using off-gas tests (App. E, ASCE, 1996). The energy efficiencies of the coarse- and the fine-bubble aeration system were compared using the energy difference factor Δ E fine/coarse (-). The following applies: Δ E fine/coarse = (αSSOTE fine/ αSSOTE coarse) / (pR fine /pR coarse). RESULTS Figure 1 shows that with coarse-bubble aeration, αSSOTE increases linearly with the percentage of carrier volume. By increasing the percentage of the carrier volume from 0 to 50 vol-%, the mean increase in αSSOTE is approx. 50 % (from 2.4 to 3.7 %/m), i.e. per 1 vol-% of added carriers, αSSOTE increases approx. 1 %. With fine-bubble aeration, no clear effect of the carriers on αSSOTE was observed. αSSOTE of coarse-bubble aeration was always lower than with fine-bubble aeration, with all investigated carrier percentages. Even with a carrier volume of 50 vol-%, the mean αSSOTE was lower by more than 1 %/m. Even so, with coarse-bubble aeration, pR was lower by 19 – 25 mbar compared to the fine-bubble system (not illustrated in Figure 1). With a carrier volume of 0 vol-%, the fine-bubble aeration system shows an αSSOTE twice as high as with the coarse-bubble system. By the same time the overall system pressure pR is approx. 3 % higher. Altogether, the positive effect on αSSOTE prevails, i.e. the fine-bubble aeration system shows a 93 % better energy balance. With a carrier volume of 50 vol-%, the positive energy balance

SEWAGE MANAGEMENT AND WASTEWATER TREATMENT 256
of the fine-bubble aeration system declines significantly. αSSOTE is 37 % higher, pR is 4 % higher, i.e. altogether, the energy consumption of the fine-bubble system is still 31 % lower than with the coarse-bubble system (Table 1).
Figure1. αSSOTE (mean values with standard deviations) in coarse- and fine-bubble aeration systems as a function of the percentage of carrier volume Table 1. Overall energetic balance of coarse- and fine-bubble aeration systems at 0 and 50 vol-% carrier volume
αSSOTE coarse
αSSOTE fine
αSSOTE fine / αSSOTE coarse pR coarse pR fine pR fine/pR
coarse ΔE
fine/coarse %/m %/m - mbar mbar - -
0 vol-% 2.44 4.88 1.99 595 614 1.03 1.93 50 vol-% 3.72 5.09 1.37 596 621 1.04 1.31
DISCUSSION Although the efficiency of coarse-bubble aerations systems can be improved significantly by adding carrier material, fine-bubble systems are still more energy-efficient. Looking at the operational costs, fine-bubble aerations systems should therefore be favored when applying the MBBR IFAS process. However, regarding investment costs, maintenance and service life, coarse-bubble aeration systems are favorable. Therefore, the overall cost-effectiveness of both systems should be assessed in case of MBBR IFAS application. With coarse-bubble aeration systems assuming complete mixing of the carriers in the reactor, αSSOTE increases approx. 1 % with every vol-% of added carrier material. This knowledge is of crucial interest when dimensioning those kind of aeration system. This way, significant savings in investment and operational costs can be achieved. When applying a fine-bubble aeration system, the effect of the carriers on energy efficiency is negligible, and the same dimensioning approaches as with conventional activated sludge plants may be used. Carriers do not affect the overall system pressure, neither with coarse- nor with fine-bubble aeration systems REFERENCES ASCE (1996). Standard Guidelines for In-process Oxygen Transfer Testing. American Society of Civil Engineering,
New York, NY, USA. Ødegaard, H., Christensson, M., and Sørensen, K.K. (2014). Hybrid Systems. In: Activated Sludge – 100 years and
counting. Jenkins, D., Wanner, J. (ed.), IWA Publishing, London. Rosso, D., Lothman, S.E., Jeung, M.K., Pitt, P., Gellner, W.J., Stone, A.L. and Howard, D. (2011). Oxygen transfer and
uptake, nutrient removal, and energy footprint of parallel full-scale IFAS and activated sludge process. WaterResearch, 45, 5987-5996.
Viswanathan, S., Pham, H., Kelly R.F., Redmon, D.T. and Fernandes, W. (2008). Evaluation of oxygen transfer efficiency via off-gas testing at full scale integrated fixed film activated sludge installation. In: Proceedings WEFTEC 2008 Conference.

SEWAGE MANAGEMENT AND WASTEWATER TREATMENT 257
Optimization of Nitrogen Removal by Changing Aeration Control in Larnaca Wastewater Treatment Plant (Cyprus) J. Schewerda, A. Buinauskaitė and E. Vasyukova* * WTE Wassertechnik GmbH, Ruhrallee 185, 45136 Essen, Germany (E-mails: [email protected]; [email protected]; [email protected])
INTRODUCTION In 2012 the company WTE Wassertechnik GmbH was awarded a contract for the reconstruction and extension of Larnaca WWTP (Cyprus) with a daily rate of 18,000 m³/d for phase B (2027 scenario). The process design of the WWTP in Larnaca follows the rules of the German Association for Water, Wastewater and Waste and was performed on basis of the standard A131 (DWA, 2002). Wastewater treatment in reconstructed plant is performed using preliminary treatment, biological treatment in activated sludge tanks and tertiary treatment in membrane bioreactors (MBR). Nitrogen removal is based on the simultaneous nitrification-denitrification process implemented in circulating flow activated sludge tanks. The aeration tanks are equipped with a bottom aeration system, installed as two sections in each tank providing relative 50% of the tanks’ volume for denitrification (VD/VAT = 0.5). Since the start-up in November 2014, this plant has been operating under underload conditions and soon the first negative impacts were determined. Nitrate nitrogen (NO3-N) concentration in effluent increased and exceeded the given limits for total nitrogen (TN ≤ 5 mg/l). In order to fulfill strict effluent requirements for the treated wastewater, adjustments in the reconstructed plant’s operation control were necessary. Main aims were to increase the flexibility of the new treatment plant without big scope of additional mechanical changes and to adapt the denitrification process by introducing only minor changes in the initial aeration control program. PROBLEM Beneficial conditions like relatively warm wastewater (approx. 20 °C) and a new efficient aeration system helped to reach a stable nitrification process in about three weeks after the plant start-up. Shortly after this, the TN concentration in the treated wastewater increased up to 16 mg/l and, therefore, exceeded the given maximum limit by more than three times. Thereby ammonia nitrogen (NH4-N) was not higher than 0.3 mg/l, but nitrate nitrogen (NO3-N) increased up to 14 mg/l which indicates an inhibited denitrification. PROCEDURES Denitrification process requires organic substrate for the reduction of nitrate (NO3
-) to nitrogen (N2) gas, as well as the absence of dissolved oxygen in wastewater. In municipal wastewater treatment plants a typical ratio for BOD5:TN varies between 4 and 6 (Henze et al., 2002) and a typical ratio for BOD5:COD is in the range from 0.3 to 0.8 (Metcalf & Eddy, 2003). Wastewater coming to Larnaca WWTP has a ratio of BOD5:TN > 6 and BOD5:COD = 2.2 which points to the presence of easily biodegradable organic compounds. Thus, both ratios indicated that the denitrification was not limited by the absence of organic matter. Therefore, the most likely reason for the high NO3-N concentration in the effluent and the inhibited denitrification was over-aeration caused by the low actual oxygen demand. This was due to the fact that the actual hydraulic and pollution loads did not
SEWAGE MANAGEMENT AND WASTEWATER TREATMENT 258
reach the design values: the daily flow was 50 %, BOD5 load was 66 % and TN load 46 % of the design values (85 percentile, 2015). In order to decrease the aeration intensity, anoxic zones were extended by closing air valves to the separate aeration grits and the aeration blowers were operated with a minimum capacity (20 Hz). However, the effect on denitrification was insignificant and the NO3-N values in the effluent were still too high (≥ 5 mg/l). Therefore, the aeration program was adjusted. An intermittent aeration with 60 minutes aeration and 30 minutes without aeration was chosen. The oxygen set point value for aeration intervals was left equal to 0.5 mg/l like it was foreseen for the plant operation with continuous aeration, as pilot plant tests of Habermeyer et al. (2005) showed that the dissolved oxygen set-point has a minor influence on the overall performance. RESULTS The implemented changes in the aeration control program affected nitrogen removal significantly and allowed to reach extremely low TN values in the outlet. During a 10 months period, after the changes were implemented, the measured TN concentrations in permeate were 1.67 ± 0.66 mg/l (May 2015 – February 2016) which corresponds to a 97.4 ± 0.8 % removal efficiency. Due to the intermittent aeration, the operation time of the blowers was reduced to 16 hours per day instead of constant operation. This provides the possibility to save up to 30 % of total electrical energy demand for aeration (approx. 4320 kWh/d) or even more (Guglielmi et al., 2011). CONCLUSIONS In practice newly constructed or reconstructed treatment plants are often being operated with a different capacity than foreseen in the design which affects the performance efficiency of the plant. To ensure a high efficiency and to fulfil the effluent quality requirements, several adjustments might be necessary. Even minor changes without additional capital or current expenditures, like the adjustment of the aeration program, can help to significantly improve the performance of a wastewater treatment plant. At WWTP Larnaca extremely low total nitrogen level in effluent could be reached without dosing external carbon or implementing advanced nutrient removal processes e. g. reverse osmosis. REFERENCES DWA (2002). ATV-DVWK Worksheet A 131 E. Dimensioning of single-stage activated sludge slants, GFA Publishing
Hennef 2002. Guglielmi, G. and Andreottola, G. (2011). Alternate anoxic/aerobic operation for nitrogen removal in a membrane
bioreactor for municipal wastewater treatment. Water Science and Technology, 64(8), 1730-1735. Habermeyer, P., Sanchez, A. (2005). Optimization of the intermittent aeration in a full-scale wastewater treatment plant
biological reactor for nitrogen removal. Water Environment Research, 77 (3), 229-33. Henze, M., Harremoes, P., Jansen, J. C. (2002). Wastewater treatment. Biological and chemical processes. Spinger. Metcalf & Eddy, (2003). Wastewater engineering. Treatment and reuse. 4th edition. McGraw Hill.

SEWAGE MANAGEMENT AND WASTEWATER TREATMENT 259
Experiences of Full-Scale Deammonification of Dewatering Sidestream from Thermophilic Anaerobic Digestion Process at Budapest CWWTP E.Z. Sebestyén*
* Budapest Waterworks Ltd., Directorate of Wastewater Treatment, Department of Budapest Central Wastewater Treatment Plant, Váci út 23-27, 1134 Budapest, Hungary (E-mail: [email protected])
INTRODUCTION AND BACKGROUND Anaerobically digested sludge dewatering liquor represents 15-20 % of the nitrogen load on Budapest Central Wastewater Treatment Plant (BCWWTP). Compared to conventional nitrification/denitrification, the side stream deammonification process provides approximately 63 % reduction in O2. The process installed at BCWWTP is a single step, one reactor (SBR) nitritation- anammox system. Two anammox reactors has been designed with 2,000 m3 effective volume each, to treat 2,100 kg/day ammonium-nitrogen load with a minimum 85 % efficiency, so reducing the internal ammonium-nitrogen load by 10-15%. The technology was seeded with 25 m3 of anammox sludge. The installation is specific since not many anammox processes are reported following thermophilic anaerobic digestion process. The process is controlled by a PLC program developed by a pH control strategy. The SBR cycle time is 8 hours, processing three cycles per day. Each cycle is comprised of intervals of aeration, feeding with anoxic mixing and anoxic mixing periods. The design criteria are shown in Table 1. This study describes experiences and results of more than two years of operation. Table 1. Design criteria
Flow KOI BOI5 TSS TN NH4-N Temperature
[m3/d] [mg/l] [mg/l] [mg/l] [mg/l] [mg/l] [oC]
Average 1,550 1,500 150 800 1,450 1,390 38
Maximum 1,800 2,500 250 1,400 1,700 1,690 43
Minimum 1,100 1,200 70 300 1,050 1,000 33
RESULTS During the operation several events occurred, influencing the efficiency such as follows: • Physico-chemical properties and so the activity of the granules are strongly affected by the
composition of the surrounding such us struvite, polyelectrolyte, and also VFA concentration. Flotation of the granules was observed in some period of the operation. In other case - due to some not clearly evident reasons - inhibition of the process occurred causing the complete shutting down of the biological activity.
• Frequent fouling in sludge separation equipment is decreasing the efficiency of the sludge separation process and is making the control of sludge retention time more difficult.
• Due to the wide range of particle sizes in the reactor a more adjustable sludge separation unit has to be elaborated meeting site specific requirements. Higher load of suspended solid in the

SEWAGE MANAGEMENT AND WASTEWATER TREATMENT 260
centrate is not only affecting the balance of heterotrophic bacteria but the sludge separation as well.
• During the two years operation the reactors had to be emptied two times due to the damage of the aeration system. Reloading was successful without the necessity of reseeding the reactors with anammox sludge.
• Lack of alkalinity has been considered as limiting factor of the process, BOI5 concentration in centrate is higher than expected.
Despite the facts indicated above the technology has been able to reload, but both the load and the efficiency are not reaching the design criteria in long term. The ammonium- nitrogen removal efficiency in high loaded periods – 1,000-1,200 m3/d centrate - reaches 80 % in daily average as it is indicated in Figure 1.
Figure 1. Ammonium- nitrogen concentration in raw centrate and treated outflow CONCLUSIONS From more than two years of experience is outlined, that since such a sensible technology has highlighted his relatively fast re- loadability despite several malfunction and inhibiting factors of surrounding. Following up the whole deammonification mechanism is a kind of black-box from practical point of view which makes the process operation quite challenging. Accurate method except activity measuring is not yet available in practical science. During the years, possible issues affecting the process has being identified and solved, further optimisation of the installation is pending. ACKNOWLEDGEMENT For valuable contribution of László Váci in supporting my work. REFERENCES Cema, G. (2009, October). Comparative study on different anammox systems. TRITA-LWR PhD Thesis 1053 ISSN
1650-8602, 6. Royal Institute of Technology, Stockholm. Strous, M. and Kuenen, G.J. (1999). Key physiology of anaerobic ammonium oxidation. Applied & Environmental
Microbiology, 65 (7), 3248. Results of on-site measurements and internal laboratory analysis according international standards.
SEWAGE MANAGEMENT AND WASTEWATER TREATMENT 261
Estimation of Main Analysis Parameters of Infiltration Areas O. Shevchuk and O. Tkachuk* * Department of City Planning and Development, The National University of Water and Environmental Engineering , 11 Soborna, Rivne, 33028, Ukraine (E-mail: [email protected])
INTRODUCTION Stormwater management is an important task in solving of the urban areas flooding problems. Today the methods of accumulating rainfall directly at falling out areas become significant among others. These methods reduce the maximum load on the existent drainage system, and delay pollution, prevent the flooding of areas. One of these methods is a construction of infiltration areas with permeable pavements for temporary interception and followed by stormwater infiltration in the drainage system pipes. The using of the modern permeable pavements can significantly increase the areas, and the volume of temporarily intercepted rainwater. The analysis issue of the formation and regulation of rainwater runoff on urban areas is the researching works of many scientists (Alekseev, 2000; Ferguson, 2005; Tkachuk, 2012). But unresolved issues remain determination of the main parameters of rainwater interception by drainage structure with connecting them to the drainage systems, particularly for hydraulic analysis of infiltration areas. MAIN FUNCTION OF INFILTRATION AREA ANALYSIS A mathematical model to rainwater interception on infiltration areas (Tkachuk, 2016) shows that the main indicators of hydraulic loads are water volumes that accumulate in gravel base course, and drainage water discharges that flow through porous structure into the pipelines or channels of drainage system. When the runoff coefficient ψmid <1.0 and according to a mathematical model of rainwater interception on infiltration areas (Tkachuk, 2016) the formulas to determine the values of calculated (maximum) stormwater volumes Wdr, drainage water discharges Qdr, and time from the beginning of runoff concentration tdr are expressed as follows
( ) ,1etFіkW`сt*43.0
rrunrmiddimdrΔ−ϕ− ϕ+⋅⋅⋅⋅⋅ψ⋅= (1)
,te2
e1FіkQ `с
2)`сte1(runдmiddimdr ⎟
⎠
⎞⎜⎝
⎛ Δ⋅⋅ϕ
−−⋅⋅ψ⋅= ϕ⋅−Δ⋅ϕ−+⋅ϕ− (2)
,ett e*3.0rdr
ϕ−⋅= (3)
where kdim – a dimension coefficient; іr – a rainfall intensity, (іr ≈ const), mm/min; Frun – a runoff area, sq. m; φ – a non-dimensional parameter that depends on the gravel base course characteristics, and rainfall duration tr, min and estimates according to (Tkachuk, 2016) by the formula (5); Δt’c is a relative duration of infiltration area interception and estimates as
,tt
tr
с'с
Δ=Δ (4)
where Δtc – an intercepted duration of runoff areas, min.

SEWAGE MANAGEMENT AND WASTEWATER TREATMENT 262
,tНрKk
rfe ⋅
⋅
⋅=ϕ (5)
where ke – an equivalence coefficient characterizing drainage conditions though gravel base course of infiltration area; Кf – a filtration coefficient of gravel base course, mm/min; р – a porosity of gravel base course; Н – a summary height of gravel base course, mm. The equivalence coefficients ke depend on the conditions of water drainage and disposal from infiltration areas. Their values are regulated users over the range ke = 0..ke.max. Thus, ke = 0 when there isn’t water diversion from infiltration area, and ke = 0..ke.max when there is the regulation of water discharge on the outlet pipe to the drainage system structures. The value ke.max = 0,3 was determined experimentally during tests on laboratory facility (Tkachuk, 2015) in conditions of gravity filtration. MAIN PARAMETERS From the function of the formulas (1)-(3) the main influential factors of rainwater interception on infiltration areas with permeable surfaces by connecting them to the drainage systems are:
• the rainfall parameters of the area (average rainfall intensity іr and duration tr); • the infiltration areas parameters (area, type and height of the gravel base course, the
structure, and dimension of drainage, etc.); • the conditions of drainage discharges control and connection to the drainage system.
CONCLUSIONS Based on the mathematical model of rainwater interception on infiltration areas with permeable pavements (Tkachuk, 2016) the function to estimate the rainwater intercepted volumes on the infiltration areas, and their drainage discharges with connecting them to drainage systems are received. The influence factors and basic types of parameters of the calculation, design, and installation of infiltration areas with permeable pavements are estimated. REFERENCES Alekseev, M., Kurhanov, A. (2000). Orhanyzatsyia otvedenyia poverkhnostnoho (dozhdevoho y taloho) stoka s
urbanyzyrovannykh terrytoryi [Organization of runoff (rainfall and snowmelt) disposal from urban areas]. Moscow: Publishing ASB; SPb.:SPbHASU, 352 (in Russian).
Ferguson, B. (2005). Porous Pavement: Integrative studies in water management and land development. Boca Raton: CRC Press, 600.
Tkachuk, O., Shevchuk, O. (2015). Doslidzhennia roboty infiltratsiinykh maidanchykiv dlia system doshchovoho vodovidvedennia [Reaserching of the infiltration areas function for the drainage system] Bulletin NUWMNRU, vol.3 (71), 100-105 (in Ukrainian).
Tkachuk, O., Shevchuk, O. (2016). Model zatrymannia doshchovykh vod na infiltratsiinykh maidanchykakh [The model of stormwater detention on the infiltration areas] Bulletin NUWMNRU, vol.1 (73), 75-87 (in Ukrainian).
Tkachuk, S., Zhuk, V. (2012). Rehuliuvannia doshchovoho stoku v systemakh vodovidvedennia [Stormwater regulation on drainage systems] Lviv: Publishing Lviv Polytechnic (in Ukrainian).

SEWAGE MANAGEMENT AND WASTEWATER TREATMENT 263
The Comparison of Sludge Investigation Methods Accuracy M. Sobczyk, A. Pajdak-Stós, E. Fiałkowska, W. Kocerba-Soroka, J. Starzycka and J. Fyda* * Institute of Environmental Sciences, Jagiellonian University, Gronostajowa 7, 30-387 Kraków, Poland (E-mail: [email protected])
INTRODUCTION The microscopic sludge investigation is important part of activated sludge process control. For the first time general microscopic sludge investigation manual was proposed by Eikelboom and van Buijsen in 1981. The methods described in this manual and its sequel published in 2000 have become a standard procedure in treatment plants around the world. Microscopic sludge observations are becoming more popular and common practice, also in Polish wastewater treatment plants. Microscopic analysis are quite fast, relatively cheap and give operators additional information complementary to chemical analysis. Microscopic observations are helpful in defining causes of sedimentation problems (e.g. overgrowth of filamentous bacteria, dispersed flocs, turbid effluent).
THE AIM OF STUDY In our study two methods of microscopic sludge investigation: Sludge Index (SI) and Eikelboom van Buijsen method (EB) were evaluated and compared. The aim of both methods is to get general conclusion concerning the quality of the activated sludge. Sludge separation indicators such as: sludge settling after 30 minutes of sedimentation and Sludge Volume Index (SVI) were observed and calculated. Additionally concentrations of Suspended Solids (SS), BOD5, COD, Total Nitrogen, Total Phosphorus in effluent were checked . We investigated 78 activated sludge samples during one year period from April 2015 to April 2016. For each sample Sludge Index was calculated according to instructions of Rodriguez et al. (2004) with some modification proposed by Arregui et al. (2012) and sludge quality was estimated according to Eikelboom (2000) specifications. Sludge samples were taken from aeration tanks from 9 wastewater treatment plants located in Małopolska voivodship (southern Poland). Treatment plants varied in capacity (sewage flow from 164 to 160 000 m3/day) as well as technology design (only aeration tank, A/O, A2/O). In order to checked that both methods gave the same results we used General Regression Model (GLM). For all 78 samples settling after 30 minutes of sedimentation, mixed liquor suspended solids (MLSS) were determined, SVI values were calculated and compared with conclusions drawn from microscopic analysis. Additionally in 42 out of 78 cases the effluent quality was analysed in regard to obtained results. We also checked in EB method correlation between estimated density of Poliphosphate Accumulating Organisms (PAOs) in sludge and Total Phosphorus concentration in effluents, for this calculation we used non parametric Spearman Rank Order Correlation test. RESULTS The General Regression Model showed that between two investigated methods exist significant relationship in general conclusions (r = 0.47, F = 22.44, p = 0.00001). 27 of 78 samples gave different results, but none of investigated samples were estimated as “good” by one methods and simultaneously as “bad” by second method. Sludge Index method evaluated more samples as “bad” and at the same time less samples as “good” than Eikelboom and van Buijsen method. In both methods the most numerous were group with “moderate” sludges.

SEWAGE MANAGEMENT AND WASTEWATER TREATMENT 264
In both methods sludge evaluated as “good”, “moderate” and even “bad” showed high level of organic matter reduction and low concentrations of SS, BOD5 and COD in effluent. In none of investigated treatment plants above-mentioned during whole year monitoring period limits were exceeded. In all sludge samples evaluated by SI and 6 samples out of 10 evaluated by EB methods as “good” exceeded total N and P concentration limits in effluent, but none of these WWTP were obliged to reduce N and P to meet requirements of Water Law Act. Only 1 sample analysed according to SI method and 4 analysed according to EB specifications, evaluated as “good”, had SVI higher than 150. Sludge evaluated by SI methods as “good” had significantly lower mean SVI value than sludge in “medium” and “bad” conditions. We find significant differences in mean SVI value between “good” and “medium” sludge evaluated by EB methods, but we did not find such differences between “good” and “bad” sludge. In EB methods mean SVI for “bad” sludge had very big variance inside this group. In EB methods higher estimation of PAOs density is slightly correlated (r = -0.44, p < 0.05) with lower concentration of Total Phosphorus in effluent. However, there were samples qualified as “good” with exceeded limits of Total Phosphorous and nitrogen in effluent. CONCLUSIONS The comparison of both methods did not show strongly pronounced differences between them. In both methods sludge classified as “good”, “medium” or “bad” indicate that the values of organic matter reduction, suspended solids, BOD5 and COD in effluent are not exceeded. Both methods do not give reliable information concerning nitrogen and phosphorus removal, as the values of the nutrients exceeded the limits in effluent even when the sludge were classified as “medium” or “good”. Among the sample classified as “good” according to SI method there were fewer samples with bulking sludge than among samples assessed by EB methods. EB methods allow to very easy and cheap checked that investigated sludge has PAOs which are significantly correlated with better reduction of phosphorus (lower level of Total Phosphorus in effluent). Both methods are quite fast (one analysis lasts less than 1 hour) and gives information about liquid-solid separation ability of activated sludge. ACKNOWLEDGEMENTS The Research is founded by The National Center for Research and Development Grant GEKON1/O3/214361/8/2014 and Jagiellonian University Funds DS/WBiNoS/INoS/757. REFERENCES Arregui, L., Liébana, R., Rodríguez, E., Murciano, A., Conejero, F., Pérez-Uz, B. and Serrano, S. (2012). Analysis of
the usefulness of biological parameters for the control of activated sludge wastewater treatment plants in an interlaboratory study context. Journal of Environmental Monitoring, 14, 1444-1452.
Eikelboom, D.H. (2000). Process control of activated sludge plants by microscopic investigation, IWA publishing 2000. Jimenez, C., Fernandez, N., Rodrıguez, J.M., Isac, L., Salas, M. D. and Gomez, E. (2001). Rapid System of Estimation
of Wastewater Treatment Plants Performance Based on Macroscopic and Microscopic Characteristics of Activated Sludge (Sistema rapido de estimacion de los rendimientos en depuracion de una EDAR en funcion de las caracterısticas macroscopicas y microscopicas del fango activado). Tecnologıa del Agua, 216, 40-44.
Rodrıguez, E., Isac, L., Fernandez, N. and Salas, M. D. (2004). Working Manual for Biological Analysis in Activated Sludge (Manual de trabajo para analisis biologicos en fangos activados), Spain, 2004, ISBN (International Standard Book Number): 978-608-0189-4.

SEWAGE MANAGEMENT AND WASTEWATER TREATMENT 265
Modelling the Hydrogen Sulphide Removal in a New Rotating Bed Biofilm Reactor F. Spennati*, S. Rossi*, G. Mori** and G. Munz*
* Department of Civil and Environmental Engineering, University of Florence, S. Marta 3, 50139, Florence, Italy (E-mail: [email protected]) ** Cer2co lab, consorzio Cuiodepur, San Romano - San Miniato, Pisa, Italy
INTRODUCTION Recent tests on biotrickling filters (BTFs) technologies for H2S removal from natural gases (Fortuny, 2008) and biogas (Rodriguez, 2013) has highlighted the poor long-term performances of this technology, in relation to the biomass growth and the subsequent bed clogging. This often resulted in the need for high energy inputs in the gas-pumping section. The clogging phenomenon is particularly important when the specific load (in terms of g H2S m-3h-1 of reactor) is high (above 200 g H2S m-3h-1) due to growth rate of the biomass. In the context of the EU Project LIFE+ ENV/IT/075-BIOSUR (Rotanting bioreactors for hydrogen sulphide sustainable Removal), a full scale prototype of a (RBBR, Rotating Bed Biofilm Reactor) was designed and constructed in order to use the biodiscs rotation as an innovative strategy for the excess biomass removal, thanks to the shear stress applied between biodiscs and water, in the bottom part of the RBBR. The prototype was the first full scale moving bed BTF applied to gaseous effluent treatment operated worldwide. The RBBR was installed in the gas treatment line and it was connected in series, as a pre-treatment step, to the actual gas treatment section, composed by 7 chemical scrubbers using NaOH. In this configuration the reactor was intended as a chemicals-saving technology, since the major part of the influent S load is oxidized to sulphate in the previous RBBR step, allowing to save about 60 Kg d-1 of NaOH. A considerable amount of energy can be also saved, respect to conventional BTFs, since the typical clogging problems of BTFs are overtaken by means of the biodiscs rotation, thus reducing energy consumption. The bioreactor was tested for more than 1 year and a removal efficiency of about 80% was achieved, when operating under standard conditions. During the same experimental period, the elimination capacity reached over 90 g H2S m-3 h-1, referring to the reactor’s volume. The prototype allowed to overcome the critical point of static biotrickling filters, that is, the accumulation of biomass and the consequent head loss increase; the pressure head loss always remained below 4 millibar and was easily controlled by the simple slow rotation of the discs. A preliminary attempt was made to design a mathematical model in Aquasim and to calibrate the above-mentioned model on the experimental system. The goal of the modeling process is to allow a better understanding of the involved mechanisms and to optimize the operational parameters; in fact, the behavior of the system presents several aspects to be elucidated, related to both the stoichiometry and the kinetics of the S-cycle in the operating conditions tested (Munz, 2009; Mora, 2015).and to the role of the biofilm geometry in the gas-liquid transfer process. METHODS Prototype The RBBR had a cylindrical shape and the reaction volume was divided into four zones (sectors), holding two rotating discs each. Every sector was hydraulically separated from the others by means of a physical septum which didn’t allow the water to mix in the reactor and made it possible to separately dose and discharge the water from the different sectors. The gas flow crossed each of the sectors and it could be considered as an in series treatment. The biodiscs had a diameter of

SEWAGE MANAGEMENT AND WASTEWATER TREATMENT 266
2.38 meter and a disc thickness of 32 cm, the total volume resulting in about 8 m3. The reactor was filled with a partially submerged polyurethane foam (600 m2m-3, 35 kgm-3, Pores/Volume ratio: 0.97). Process and monitoring After one month of biomass start up the prototype was implemented, connected to the existing gas treatment facility and fed with 20% of the polluted stream treated in the plant; the reactor was operated for a year with a gas flow rates of 5,000-8,000 m3 h-1, corresponding to an empty bed retention time of 3-6 s and concentrations of H2S were within the range of 10 to 400 mg S m-3. The main parameters tested were: pH setpoint, recirculation flow rate and rotation speed. The monitoring of the prototype included the analysis of biological, chemical and physical parameters. A Gas Chromatograph (Agilent 7890B) equipped with Flame Photometric Detector measures the concentrations of H2S in the influent and effluent. The data collected were used for the model. Model Structures The model was designed with the software Aquasim that allows to define the spatial configuration of the system as a set of compartments connected to each other by links. Aquasim include biofilm reactors (consisting of a biofilm and a bulk fluid phase) that were used to simulate the behavior of biomass growing on the support media. The model was composed mainly by three compartments for each sector of the prototype: a gas phase (mixed reactor compartment), a water phase representing the recirculation water and makeup water (mixed reactor compartment) and the biofilm reactor compartment. Aquasim is a biofilm modeling in one-dimension, but allows pseudo two-dimensional modeling. The biofilm reactor compartment were simulated as a dynamic process, the growth and decay of biomass as described according to Monod kinetics equation. RESULTS AND DISCUSSION The model was able to reproduce rather accurately the concentrations of H2S in the output gas flow, despite the simplifying assumptions and the strong load fluctuations. The model overestimated the removal capacity when high concentration peaks of H2S occurred. The model was able also to calculate the total production of Sulphur as Sulfate (g S-SO4 h-1). The average measured production was around 250 g S-SO4 h-1. The model was able to estimate the average biomass removal due the rotation at steady state. ACKNOWLEDGEMENT The authors thank the EU LIFE+ Program (Biosur project ENV/IT/075), Miur (FIR RBFR13V3CH) and the EU Marie Curie Irses Program (Carbala Project PIRSES-GA-2011-295176). REFERENCES Fortuny, M., Baeza, J. a, Gamisans, X., Casas, C., Lafuente, J., Deshusses, M. a, and Gabriel, D. (2008). Biological
sweetening of energy gases mimics in biotrickling filters. Chemosphere, 71(1), 10-7. Mora, M., Dorado, A. D., Gamisans, X., and Gabriel, D. (2015). Investigating the kinetics of autotrophic denitrification
with thiosulfate: Modeling the denitritation mechanisms and the effect of the acclimation of SO-NR cultures to nitrite. Chemical Engineering Journal, 262, 235-241.
Munz, G., Gori, R., Mori, G., and Lubello, C. (2009). Monitoring biological sulphide oxidation processes using combined respirometric and titrimetric techniques. Chemosphere, 76(5), 644–50.
Rodriguez, G., Dorado, A. D., Fortuny, M., Gabriel, D., and Gamisans, X. (2013). Biotrickling filters for biogas sweetening: Oxygen transfer improvement for a reliable operation. Process Safety and Environmental Protection, 92(3), 261–268.
SEWAGE MANAGEMENT AND WASTEWATER TREATMENT 267
Effect of Food and Temperature on the Growth Rate of Lecane inermis Originating from Two Geographically Distant Populations
J. Starzycka, E. Fiałkowska, A. Walczyńska, W. Kocerba-Soroka, M. Sobczyk, J. Fyda and A. Pajdak-Stós* * Institute of Environmental Sciences, Jagiellonian University, Gronostajowa 7, 30-387 Kraków, Poland (E-mail: [email protected])
INTRODUCTION Activated sludge bulking is a common problem in sewage treatment plants (WWTPs). An extensive growth of filamentous bacteria results in poor sedimentation of activated sludge decreasing effectiveness of WWTPs due to difficulties in separating treated sewage from the sludge. The most popular methods used for reducing the bulking are chemicals applied in bioreactors. However, coagulants and/or inorganic flocculants does not eliminate the reasons of bulking and has negative effects on nitrification, increases the weight of the excess sludge and increases the costs (Jenkins et al., 2004). Alternative method is biological control of filaments proliferation, which. can be exerted by Lecane inermis (Rotifera) feeding on filamentous bacteria (Fiałkowska & Pajdak-Stós, 2008). L. inermis has positive effect on sludge sedimentation and decreases the mass of excess sludge. Rotifers do not influence nitrification and denitrification and could be a safe method to reduce bulking (Kocerba-Soroka et al. 2013). THE AIM OF STUDY
Temperature is a key factor influencing growth rate of Lecane rotifers (Herzig, 1983). The knowledge concerning the influence of food type on the growth rate (r) is still scarce. There are also no studies comparing growth rate of rotifers from populations living in different climate conditions. The aim of this study was to compare the influence of food types and temperature on the growth rate of two strains of L. inermis derived from two geographically distant populations to obtain optimal prerequisites for mass culture of the rotifers capable of bulking control. We used strains of L. inermis originating from WWTP in Spain – LkV2 and southern Poland – Lk6. Single individuals of the same age were placed individually in the wells of 24-wells tissue test plates (TPP), with 1 ml of spring water. We added 25 µl 3‰ molasses solution to 12 wells and the same volume of NOVO to 12 wells. NOVO is a mixture of yolk powder, vitamins and minerals. The procedure was repeated for both clones and each temperature. The plates were kept at 8 °, 15 °, 20 ° and 25 °C for 12 days. Every three days we counted alive individuals in each well. The growth rate (r) were calculated according to the formula r=(LnNt - LnN0)×t-1; were Nt and N0 means the final and initial number of rotifers; t – time. RESULTS Temperature significantly influenced rotifers growth rate in a range between 15 ° and 20 °C in case of both strains: LkV2 (p<0.05; F=7.181) and Lk6 (p<0.001; F=16.322). Type of food significantly influenced growth rate of LkV2 (p<0.05; F=4.448) and Lk6 (p<0.001; F=34.719).
SEWAGE MANAGEMENT AND WASTEWATER TREATMENT 268
At 15 °C in molasses treatment the growth rate for both clones were identical (r=0.39). Also in NOVO treatment the values were very similar (r=0.44 for LkV2, r=0.45 for Lk6). Growth rate of LkV2 at 20 °C were similar regardless of food (r=0.45 for molasses and r=0.49 for NOVO). In the case of Lk6 the growth rate was significantly higher (p<0.001) in NOVO treatment (r=0.60) than in molasses (r=0.41). Population density depended strongly on temperature and food. Population density at 20 °C for LkV2 with NOVO increased almost 2 times in comparison to treatment with 3 ‰ molasses solutions and reached 485.00 and 245.83 ind./ml respectively. For Lk6 an average number of alive individuals in a well was 3 times higher in NOVO than in molasses treatment and reached values 209.09 to 704.17 ind./ml respectively. Population density of LkV2 at 15 °C was similar in both NOVO and molasses treatments (21.25 and 20.75 ind./ml respectively). In case of Lk6 the values were lower but similar in both treatments. We found interesting differences in growth rate between the clones at temperature of 25 °C (p<0.001; F=26.91) fed with different types of food (p<0.001; F=81.73). LkV2 had higher growth rate in both NOVO and molasses treatments. Both clones had higher growth rate in NOVO treatment than in molasses. In molasses treatment the value of growth rate for LkV2 was significantly higher than for Lk6 (p<0.001). The difference was not significant in NOVO treatment. At 25 °C the highest population density on the last day of experiment was reached by LkV2 – 1093.75 ind./ml in NOVO treatment. For Lk6 the highest population density was also observed on the last day and reached 838,64 ind./ml in NOVO treatment. Both LKV2 and LK6 rotifers kept at 8 °C ceased proliferation. CONCLUSIONS 1) Temperature is one of the most important factors affecting the growth rate of rotifers L. inermis. In a range between 15 ° and 20 °C growth rate increased 1.5 times, whereas reproduction in 8 °C was not observed. 2) The kind of food is of crucial importance for mass culturing and population growth. The influence of NOVO on growth rate and rotifers density is significantly higher than that of 3 ‰ molasses. Thus, the NOVO is a better solution in mass culture when high density of rotifers is to be reached in a short time. 3) Significantly higher growth rate of LkV2 strain (in both NOVO and molasses treatments) at temperature 25 °C than that of Lk6 cultured with molasses suggests that there might be some genetics differences in temperature tolerance between strains caused by climate differences. 4) Similar differences were not observed in lower temperatures. It might result from the fact that the strains could be differently adapted to higher temperatures. However, the addition of NOVO can mitigate this variations. The National Center for Research and Development Grant GEKON1/O3/214361/8/2014 and Jagiellonian University Funds DS/WBiNoS/INoS/757. REFERENCES Fiałkowska, E., Pajdak-Stós, A. (2008). The role of Lecane Rotifers in Activated Sludge Bulking Control. Water
Research, 42 (10-11), 2483-2490. Herzig, A. (1983). Comparative Studies on the Relationship between Temperature and Duration of Embryonic
Development of Rotifers. Hydrobiologia, 104 (1), 237-246. Jenkins, D., Richard, M.G., Daigger, G.T. (2004). Manual on the Causes and Control of Activated Sludge Bulking,
Foaming, and Other Solids Separation Problems. IWA Publishing. Kocerba-Soroka, W., Fiałkowska, E., Pajdak-Stós, A., Sobczyk, M., Pławecka, M., Fyda, J. (2013). Effect of the Rotifer
Lecane inermis, a Potential Sludge Bulking Control Agent, on Process Parameters in a Laboratory-Scale SBR System. Water Science and Technology, 68 (9), 2012-2018.
SEWAGE MANAGEMENT AND WASTEWATER TREATMENT 269
Start-up Strategy for Nutrient Removal in Moving Bed Sequencing Batch Biofilm Reactor K. Sytek-Szmeichel, J. Podedworna and P. Augustyniak* * Faculty of Environmental Engineering, Warsaw University of Technology, Nowowiejska 20, 00-653 Warsaw, Poland (E-mails: [email protected]; [email protected]; [email protected])
INTRODUCTION Application of moving bed in wastewater treatment plants allows achieving multiple technological benefits, but requires implementation of a complicated acclimation period. Immobilization of the biomass in the form of biofilm on the carrier makes this technology resemble activated sludge technology. That provides additional profits, i.e. no necessity for sludge recirculation, what lowers operating costs, and elimination of the unfavorable sludge bulking. It also guarantees the independence of biomass retention time from wastewater hydraulic retention time, favoring the development of nitrifiers. Furthermore, biomass suspension in the whole capacity of the reactor ensures high effectiveness of wastewater treatment (McQuarrie & Boltz, 2011). Development of a biofilm of appropriate thickness and containing necessary microorganism groups is a difficult and a very time-consuming task. The factors, which decisively influence the biofilm immobilization are: characteristics of the influent, concentration of oxygen in the aerobic phases and the mixing strategy. The aim of this research was successional development of biofilm on the EvU carrier elements in a laboratory scale SBR (rich in appropriate groups of microorganisms for nutrient removal). METHODS Reactor operation. The experiment lasted 140 days and was carried out in the laboratory scale sequencing batch reactor with a working volume of 28 L. As carriers of biofilm EvU-Perl moving bed was used (active surface of 600 m2/m3 and density of 1.1 kg/L) and occupying 25 % of the active volume of the reactor. The SBR was operated at three eight-hour cycles per day. Each full reactor cycle consisted of the following phases: I unaerated (60 min.), I aerated (150 min.), II unaerated (30 min.), II aerated (150 min.), sedimentation (60 min.), decant (10 min.) and idle (20 min). During the unaerated phases the reactor was fed with synthetic raw wastewater, which was prepared once a day on the basis of peptone, starch, glucose, glycerol, ammonium acetate and phosphorus salts (10 L per cycle). In the aeration phases, the SBR was aerated using fine bubble aerators. Reactor performance (operation of the mixers, the fine bubble aerators, the dosing pump and solenoid valve used for decanting) was automated by using DreamSpark Premium software based on SCADA system. The SBR was inoculated with activated sludge from a full biological nutrient removal WWTP. Technological Approach. During the time of the experiment, the changes in the technological conditions of the reactor were successively introduced to stimulate the biomass immobilization on the surface of the moving bed. The loads of organic contamination and nitrogen in the influent was gradually being increased with simultaneous increase of the level of oxygen concentration in the aerated phases of the cycle (Fig.1). It is essential to keep in mind that oxygen diffusion to the inside of growing biofilm is difficult (to ensure highly effective nitrification in biofilm concentration of 5-6 mg O2/L is required). During the next working periods of the reactor, the changes of the

SEWAGE MANAGEMENT AND WASTEWATER TREATMENT 270
working time of the mixers were determined by: 1) the necessity of proper mixing of the dosed substrate; 2) reducing the level of turbulence in the reactor in order to keep the immobilization of the growing biofilm stable. Through the whole period start-up period, the suspended biomass was regularly discharged in order to maintain the mixed liquor suspended solids MLSS concentrations at about 1g/L and the SRT at about 1-2 days. It was assumed, that the experiments would be carried out until the moment of achieving high efficiency of nitrification process in the reactor, which would be fed wastewater that reflects the composition of municipal wastewater.
Figure 1. The operating conditions in MBSBBR The scope of technological analysis. As a tool to control the development of biofilm on the carriers was used: 1. Analysis of treatment efficiency (COD, TKN, N-NH4
+, N-NO2-, N-NO3
-, TP, P-PO43-, pH,
alkalinity) performed in accordance with APHA Standard Methods (APHA, 1998) 2. The phosphorus uptake batch test (PUBT), which have been performed on the moving bed
collected from the SBR. 3. The oxygen uptake rate (OUR) batch test in which evaluation of respiratory activity of nitrifiers
and heterotrophs was conducted.
RESULTS Obtained, at the end of experiment (since 122 to 140 day), average efficiencies of organic C removal – 97.3 % (COD concentration in the effluent 28.7 mgO2/l), nitrification – 97.6% (N-NH4 in the effluent 0.62 mg N-NH4/l), denitrification – 88.9 % (total N in the effluent 7.65 mg N/l) and biological P removal – 68.2% (P-PO4 in the effluent 2.70 mg P-PO4/l) indicate that the biofilm growing on the carrier was rich in appropriate groups of microorganisms. Confirmations of this hypothesis were the results of phosphorus uptake batch test (phosphorus uptake efficiency was 53.4 mgP-PO4/L) and oxygen uptake rates (34.2 mgO2/m2·h and 29.3 mg O2/m2·h for aerobic heterotrophs and autotrophic nitrifiers, respectively) occurred in OUR batch tests. REFERENCES McQuarrie, J.P. and Boltz, J.P. (2011). Moving bed biofilm reactor technology: process applications, design, and
performance. Water Environment Research, 83 (6), 560-575.

SEWAGE MANAGEMENT AND WASTEWATER TREATMENT 271
The COD Fractionation of Municipal Wastewater by Respirometric Method in Control and Modeling Activated Sludge Systems
A. Szaja*, J. Drewnowski**, G. Łagód* and J.A. Aguilar***
* Lublin University of Technology, Faculty of Environmental Engineering, ul. Nadbystrzycka 40B, 20-618 Lublin, Poland, (E-mail: [email protected]) ** Gdansk University of Technology, Faculty of Civil and Environmental Engineering (E-mail: [email protected]) *** Empresa Municipal Aguas de Málaga S.A. (E-mail: [email protected])
INTRODUCTION Municipal wastewater is composed of the mixture of organic substrates that have to be described separately in order to improve complex wastewater characteristics and achieve the high efficiencies of nutrient removal in activated sludge systems (Drewnowski, 2014). The wastewater characteristics is important in mathematical modeling to predict the process kinetics and control WWTP effluent and knowing influent composition is essential for the development of a reliable model. Wastewater characteristics are not only important for activated sludge system modeling, but have also impact on appropriate control of single unit operations. The aim of this study was to evaluate concepts of COD fractionation measurement in municipal wastewater by respirometric method in control and modeling the biological treatment processes at WWTP using the modified Activated Sludge Model no. 2d (ASM2d) developed by Drewnowski and Makinia (2013). The batch OUR test results and COD measurements obtained at BNR plant (96,000 m3/d, Gdansk, Poland), presented by Drewnowski (2014) and the main WWTP (144,000 m3/d, Malaga, Spain), provided the experimental database for comparison of the wastewater characteristics and model predictions at both large WWTPs. MATERIAL AND METHODS Extracting experimental data and modeling study. In both cases, the laboratory OUR batch experiments with the process biomass and settled wastewater were carried out in a specially designed and constructed experimental set-up consisting of batch reactor (equipped with a stirring and aeration systems, DO probe and the pH electrode), control system, thermostatic unit and computer. In order to eliminate oxygen consumption due to nitrification the allylthiourea (ATU) was added. The temperature was maintained around 20 oC and pH – in range 7.0-8.0. The results of the respirometry test were simulated with modified ASM2d to compare predictions in terms of OUR and COD behavior in both studied plant. The biodegradable COD fractions were directly estimated during OUR batch tests, other fractions were defined by additional calculations. Analytical methods. Total/Volatile Suspended Solids (TSS/VSS) and COD concentrations were determined according to Standard Methods (APHA,1992).The soluble COD fractions was obtained by filtration (0.45 мm) and/or rapid physical-chemical method of Mamais et al. (1993). RESULTS AND DISCUSSION Table 1 results the average COD fractionation in the settled wastewater at the Gdaсsk and Malaga WWTPs during the summer study session. The estimated SS accounted for 19.0% and 34.2% of total COD at the Gdańsk and Malaga WWTP, respectively. Comparative studies performed on raw wastewater in 21 Dutch full-scale WWTPs, revealed that the ratio of SS/total COD varied within the range of 9-42 %, average value 26 % (Roeleveld & van Loosdrecht, 2002). Ginestet et al. (2002) found in the studied plants that this ratio
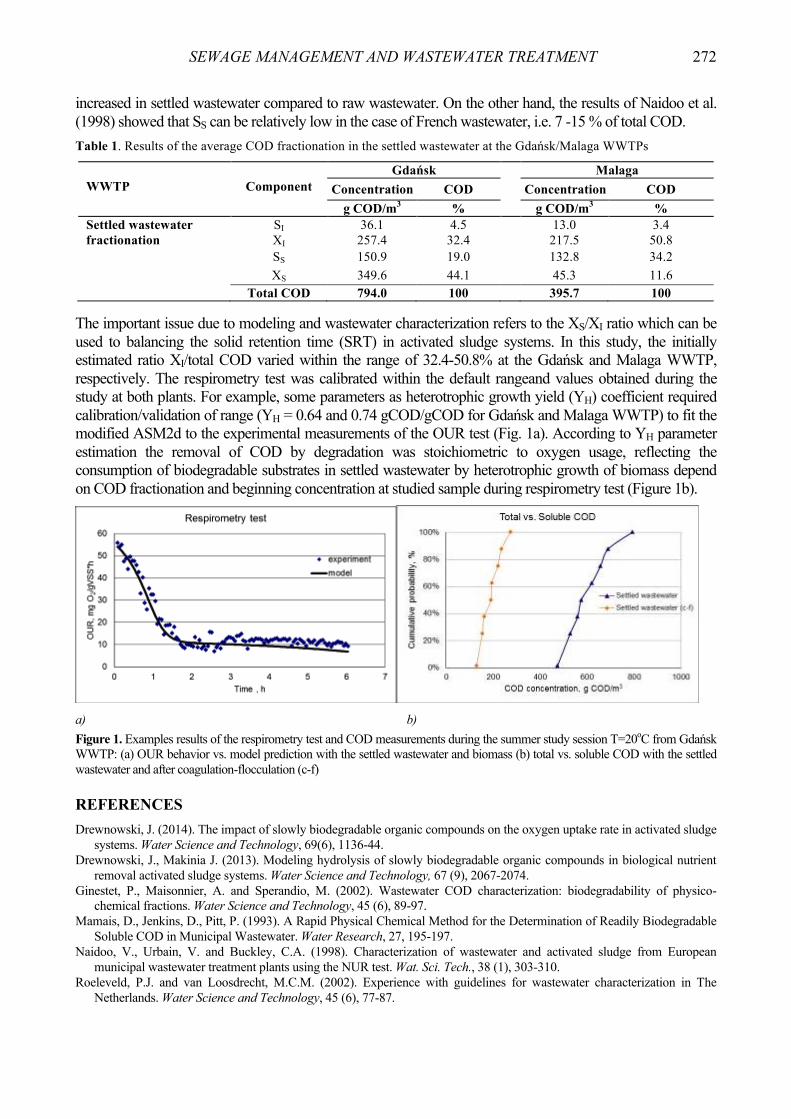
SEWAGE MANAGEMENT AND WASTEWATER TREATMENT 272
increased in settled wastewater compared to raw wastewater. On the other hand, the results of Naidoo et al. (1998) showed that SS can be relatively low in the case of French wastewater, i.e. 7 -15 % of total COD. Table 1. Results of the average COD fractionation in the settled wastewater at the Gdańsk/Malaga WWTPs
Gdańsk Malaga WWTP Component Concentration COD Concentration COD g COD/m3 % g COD/m3 % Settled wastewater fractionation
SI 36.1 4.5 13.0 3.4 XI 257.4 32.4 217.5 50.8 SS 150.9 19.0 132.8 34.2 XS 349.6 44.1 45.3 11.6
Total COD 794.0 100 395.7 100 The important issue due to modeling and wastewater characterization refers to the XS/XI ratio which can be used to balancing the solid retention time (SRT) in activated sludge systems. In this study, the initially estimated ratio XI/total COD varied within the range of 32.4-50.8% at the Gdańsk and Malaga WWTP, respectively. The respirometry test was calibrated within the default rangeand values obtained during the study at both plants. For example, some parameters as heterotrophic growth yield (YH) coefficient required calibration/validation of range (YH = 0.64 and 0.74 gCOD/gCOD for Gdańsk and Malaga WWTP) to fit the modified ASM2d to the experimental measurements of the OUR test (Fig. 1a). According to YH parameter estimation the removal of COD by degradation was stoichiometric to oxygen usage, reflecting the consumption of biodegradable substrates in settled wastewater by heterotrophic growth of biomass depend on COD fractionation and beginning concentration at studied sample during respirometry test (Figure 1b).
a) b) Figure 1. Examples results of the respirometry test and COD measurements during the summer study session T=20oC from Gdańsk WWTP: (a) OUR behavior vs. model prediction with the settled wastewater and biomass (b) total vs. soluble COD with the settled wastewater and after coagulation-flocculation (c-f) REFERENCES Drewnowski, J. (2014). The impact of slowly biodegradable organic compounds on the oxygen uptake rate in activated sludge
systems. Water Science and Technology, 69(6), 1136-44. Drewnowski, J., Makinia J. (2013). Modeling hydrolysis of slowly biodegradable organic compounds in biological nutrient
removal activated sludge systems. Water Science and Technology, 67 (9), 2067-2074. Ginestet, P., Maisonnier, A. and Sperandio, M. (2002). Wastewater COD characterization: biodegradability of physico-
chemical fractions. Water Science and Technology, 45 (6), 89-97. Mamais, D., Jenkins, D., Pitt, P. (1993). A Rapid Physical Chemical Method for the Determination of Readily Biodegradable
Soluble COD in Municipal Wastewater. Water Research, 27, 195-197. Naidoo, V., Urbain, V. and Buckley, C.A. (1998). Characterization of wastewater and activated sludge from European
municipal wastewater treatment plants using the NUR test. Wat. Sci. Tech., 38 (1), 303-310. Roeleveld, P.J. and van Loosdrecht, M.C.M. (2002). Experience with guidelines for wastewater characterization in The
Netherlands. Water Science and Technology, 45 (6), 77-87.

SEWAGE MANAGEMENT AND WASTEWATER TREATMENT 273
International Cooperation for Sustainable Treatment and Management of Waters from Gold Mines M. Szlachta*, P. Wójtowicz*, P. Włodarczyk*, A. Pasanen** and S. Backnäs** * Faculty of Environmental Engineering, Wrocław University of Technology, Wyb. S. Wyspiańskiego 27, 50-370 Wrocław, Poland (E-mails: [email protected]; [email protected]; [email protected]) ** Geological Survey of Finland, P.O. Box 1237, FI-70211 Kuopio, Finland (E-mails: [email protected]; [email protected])
INTRODUCTION Tools for sustainable gold mining in EU (SUSMIN) is an international project which identifies and evaluates environmental impacts and economical challenges of gold mining within European Union (Project information, 2016). In particular, the aim of the project is to evaluate socially and economically sustainable, eco-efficient technologies and solutions for gold mining, covering the entire operational and production chain from ore prospecting to the end product, treatment and management of mine waste, and mine closure (Figure 1).
Figure 1. Overview of the research areas in the SUSMIN project DISCUSSION AND CONCLUSIONS Environmental studies have been conducted on mining areas in Finland, Sweden, Portugal and Romania. The objective has been to develop the management of environmental impacts by studying leaching of possibly harmful substances from mining wastes and by testing novel isotope and environmental monitoring methods for studying contaminant migration, mixing and dilution in the recipient rivers. In addition, the focus has been to utilize ecological risk assessment to detect the possible key contaminants which should be prioritized in water treatment to improve and maintain good ecological status in rivers receiving mine waste waters. New technologies for treatment and management of mine waters are developed and tested during the project. The focus is in natural mineral and iron based adsorbents for treatment arsenic-rich mine water. High arsenic concentrations found in surface and groundwater may originate from the mining industry and the large amounts of country rock and tailings. The impact of mining activities on the natural environment depends on the amount of arsenic bearing minerals in the exploited rock

SEWAGE MANAGEMENT AND WASTEWATER TREATMENT 274
(Backman et al., 2007). Arsenic occurs as a major constituent in more than 200 minerals, including elemental arsenic, arsenides, sulphides, oxides, arsenates and arsenites. High concentrations of As minerals are often found in close association with the transition metals as well as Cd, Pb, Ag, Au, Sb, P, W and Mo. Arsenic is rarely found as a pure metalloid, but is usually a component of sulfur containing minerals. The most abundant mineral containing arsenic is arsenopyrite, which is usually present in sulphide ores associated with sediment-hosted gold deposits (Society for Mining, 2015). As-bearing sulphides tend to dissolve in contact with rainwater and air causing acid rock drainage. Mining operations use water for mineral processing, metal recovery or controlling dust. In this respect, discharging large volumes of water containing arsenic may cause substantial environmental problems. Therefore, arsenic species should be captured and effectively removed from mine water in order to prevent their contamination of aquatic environment. In the study, the efficiency of different adsorptive/ion exchange materials in arsenic removal has been tested in laboratory scale in Portugal and Poland and in pilot scale at a mine site in Finland. Investigated materials have a high adsorptive/ion exchange capacity and selectivity towards arsenic species, are effective in a wide range of pH, temperatures and in the presence of sulfides and chlorides in the solution. Furthermore, tested materials possess good stability and mechanical strength as well as favorable hydraulic properties what is important with the aim of their practical application. Due to the the network of cooperating project partners the research on treatment and management of waters from gold mines was possible. The SUSMIN project led by the Geological Survey of Finland, comprises research institutions and higher education institutions from six EU member states: Luleå University of Technology from Sweden, University of Porto from Portugal, Wrocław University of Technology from Poland, Trinity College Dublin from Ireland, the Geological Institute of Romania and Babeș-Bolyai University from Romania. Industrial interests are represented by Outotec Finland Oy, Oulu Water Alliance Oy and Kemira Plc. The studied mine sites are Agnico Eagle Finland Oy's Kittilä mine, Dragon Mining Oy's gold mines and Mineral Exploration Network Finland Ltd's gold projects in Finland, Dragon Mining Ab’s Svartliden mine in Sweden, Samax Romania SRL and Gabriel Resources mines in Romania, and Medgold Resources Corp mine project in Portugal. The project is implemented through the ERA-MIN programme (Network on the Industrial Handling of Raw Materials for European Industries) and funded by the national funding organisation of each participating country (Tekes in Finland, Vinnova in Sweden, UEFISCI in Romania, NCBiR in Poland and FCT in Portugal). ACKNOWLEDGEMENTS This research is supported by the National Centre for Research and Development grant (2014-2016) “Tools for sustainable gold mining in EU” - SUSMIN, within the FP7 ERA-NET ERA-MIN program. REFERENCES Backman, B. Kettunen, V. Ruskeeniemi, T. Luoma, S. Karttunen, V. (2007). Arsenic removal from groundwater and
surface water - Field tests in the Pirkanmaa Region, Finland. Risk assessment and risk management procedure for arsenic in the Tampere Region. Geological Survey of Finland.
SUSMIN project information from website http://projects.gtk.fi/susmin. Retrieved 31/03/2016. The role of arsenic in the mining industry. Society for Mining, Metallurgy and Exploration, April 2015.
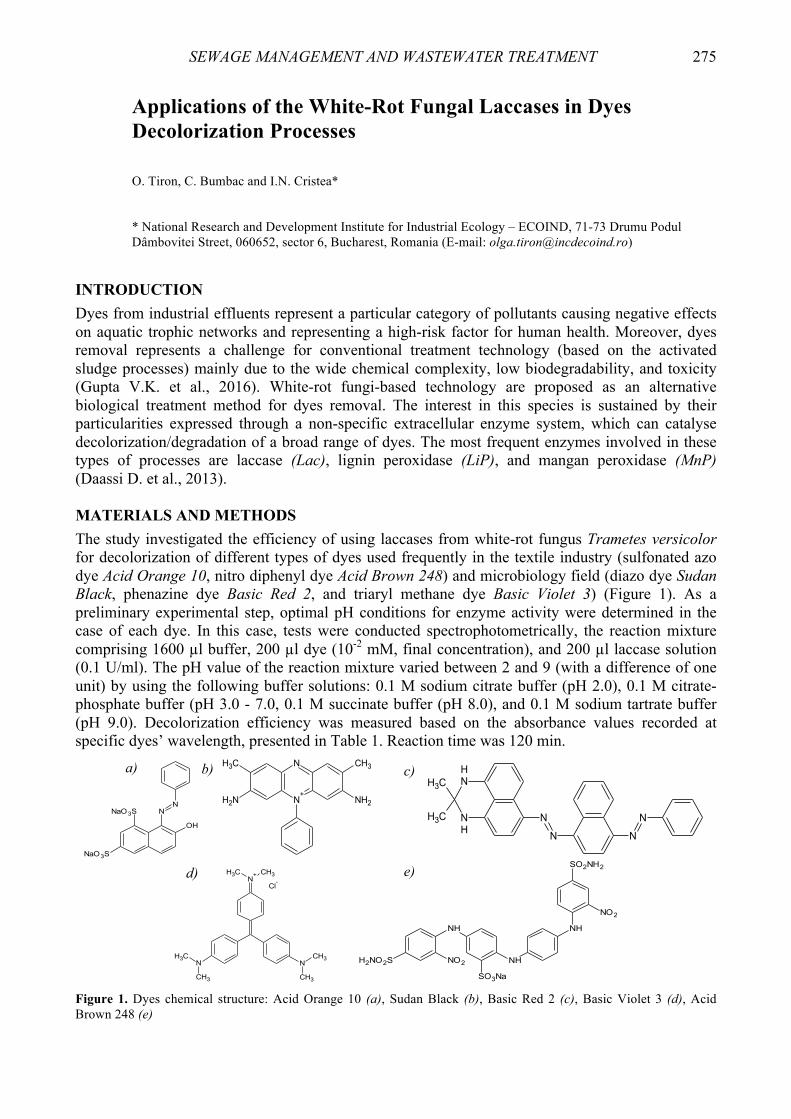
SEWAGE MANAGEMENT AND WASTEWATER TREATMENT 275
Applications of the White-Rot Fungal Laccases in Dyes Decolorization Processes
O. Tiron, C. Bumbac and I.N. Cristea*
* National Research and Development Institute for Industrial Ecology – ECOIND, 71-73 Drumu Podul Dâmbovitei Street, 060652, sector 6, Bucharest, Romania (E-mail: [email protected])
INTRODUCTION Dyes from industrial effluents represent a particular category of pollutants causing negative effects on aquatic trophic networks and representing a high-risk factor for human health. Moreover, dyes removal represents a challenge for conventional treatment technology (based on the activated sludge processes) mainly due to the wide chemical complexity, low biodegradability, and toxicity (Gupta V.K. et al., 2016). White-rot fungi-based technology are proposed as an alternative biological treatment method for dyes removal. The interest in this species is sustained by their particularities expressed through a non-specific extracellular enzyme system, which can catalyse decolorization/degradation of a broad range of dyes. The most frequent enzymes involved in these types of processes are laccase (Lac), lignin peroxidase (LiP), and mangan peroxidase (MnP) (Daassi D. et al., 2013). MATERIALS AND METHODS The study investigated the efficiency of using laccases from white-rot fungus Trametes versicolor for decolorization of different types of dyes used frequently in the textile industry (sulfonated azo dye Acid Orange 10, nitro diphenyl dye Acid Brown 248) and microbiology field (diazo dye Sudan Black, phenazine dye Basic Red 2, and triaryl methane dye Basic Violet 3) (Figure 1). As a preliminary experimental step, optimal pH conditions for enzyme activity were determined in the case of each dye. In this case, tests were conducted spectrophotometrically, the reaction mixture comprising 1600 µl buffer, 200 µl dye (10-2 mM, final concentration), and 200 µl laccase solution (0.1 U/ml). The pH value of the reaction mixture varied between 2 and 9 (with a difference of one unit) by using the following buffer solutions: 0.1 M sodium citrate buffer (pH 2.0), 0.1 M citrate-phosphate buffer (pH 3.0 - 7.0, 0.1 M succinate buffer (pH 8.0), and 0.1 M sodium tartrate buffer (pH 9.0). Decolorization efficiency was measured based on the absorbance values recorded at specific dyes’ wavelength, presented in Table 1. Reaction time was 120 min.
NN
NaO3S
NaO3S
OH
N
N+
CH3
NH2NH2
CH3
NH
NH
N
N
CH3
CH3N
N
N+
N N
CH3
CH3
CH3CH3
CH3
CH3
Cl-
NH
NO2H2NO2S NH
NH
SO2NH2
NO2
SO3Na Figure 1. Dyes chemical structure: Acid Orange 10 (a), Sudan Black (b), Basic Red 2 (c), Basic Violet 3 (d), Acid Brown 248 (e)
a)
e) d)
b) c)
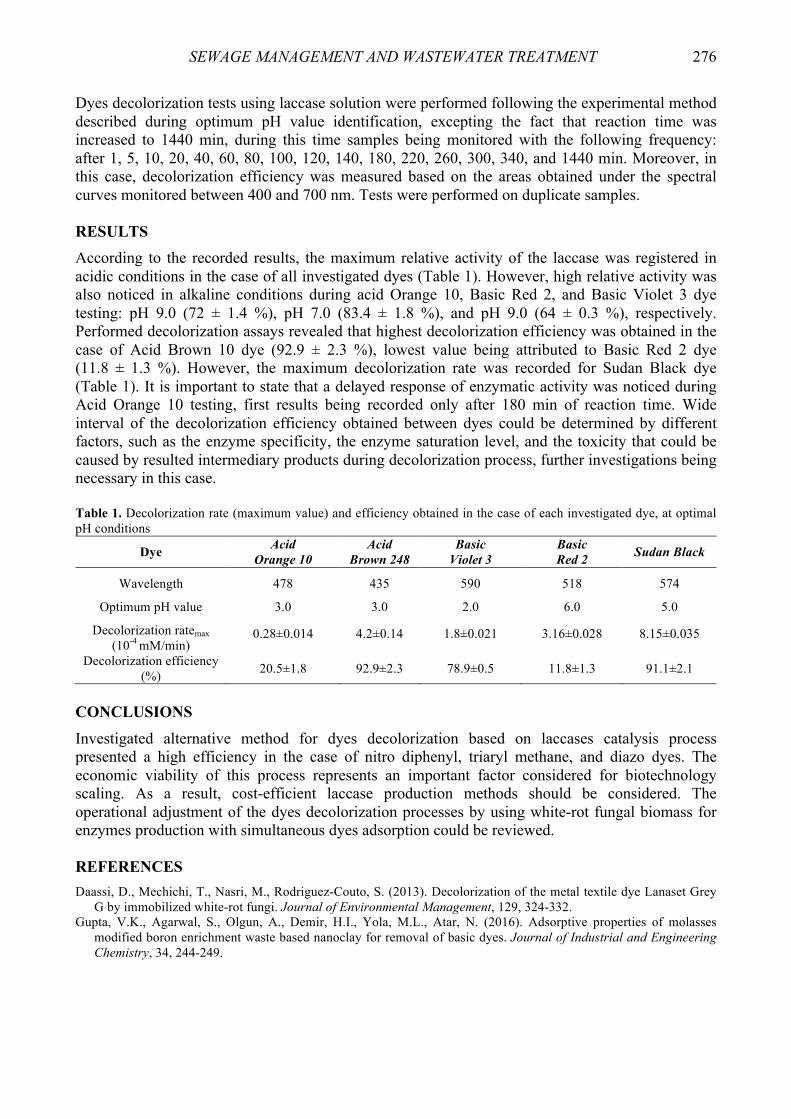
SEWAGE MANAGEMENT AND WASTEWATER TREATMENT 276
Dyes decolorization tests using laccase solution were performed following the experimental method described during optimum pH value identification, excepting the fact that reaction time was increased to 1440 min, during this time samples being monitored with the following frequency: after 1, 5, 10, 20, 40, 60, 80, 100, 120, 140, 180, 220, 260, 300, 340, and 1440 min. Moreover, in this case, decolorization efficiency was measured based on the areas obtained under the spectral curves monitored between 400 and 700 nm. Tests were performed on duplicate samples. RESULTS According to the recorded results, the maximum relative activity of the laccase was registered in acidic conditions in the case of all investigated dyes (Table 1). However, high relative activity was also noticed in alkaline conditions during acid Orange 10, Basic Red 2, and Basic Violet 3 dye testing: pH 9.0 (72 ± 1.4 %), pH 7.0 (83.4 ± 1.8 %), and pH 9.0 (64 ± 0.3 %), respectively. Performed decolorization assays revealed that highest decolorization efficiency was obtained in the case of Acid Brown 10 dye (92.9 ± 2.3 %), lowest value being attributed to Basic Red 2 dye (11.8 ± 1.3 %). However, the maximum decolorization rate was recorded for Sudan Black dye (Table 1). It is important to state that a delayed response of enzymatic activity was noticed during Acid Orange 10 testing, first results being recorded only after 180 min of reaction time. Wide interval of the decolorization efficiency obtained between dyes could be determined by different factors, such as the enzyme specificity, the enzyme saturation level, and the toxicity that could be caused by resulted intermediary products during decolorization process, further investigations being necessary in this case. Table 1. Decolorization rate (maximum value) and efficiency obtained in the case of each investigated dye, at optimal pH conditions
Dye Acid Orange 10
Acid Brown 248
Basic Violet 3
Basic Red 2 Sudan Black
Wavelength 478 435 590 518 574
Optimum pH value 3.0 3.0 2.0 6.0 5.0
Decolorization ratemax (10-4 mM/min)
0.28±0.014 4.2±0.14 1.8±0.021 3.16±0.028 8.15±0.035
Decolorization efficiency (%) 20.5±1.8 92.9±2.3 78.9±0.5 11.8±1.3 91.1±2.1
CONCLUSIONS Investigated alternative method for dyes decolorization based on laccases catalysis process presented a high efficiency in the case of nitro diphenyl, triaryl methane, and diazo dyes. The economic viability of this process represents an important factor considered for biotechnology scaling. As a result, cost-efficient laccase production methods should be considered. The operational adjustment of the dyes decolorization processes by using white-rot fungal biomass for enzymes production with simultaneous dyes adsorption could be reviewed. REFERENCES Daassi, D., Mechichi, T., Nasri, M., Rodriguez-Couto, S. (2013). Decolorization of the metal textile dye Lanaset Grey
G by immobilized white-rot fungi. Journal of Environmental Management, 129, 324-332. Gupta, V.K., Agarwal, S., Olgun, A., Demir, H.I., Yola, M.L., Atar, N. (2016). Adsorptive properties of molasses
modified boron enrichment waste based nanoclay for removal of basic dyes. Journal of Industrial and Engineering Chemistry, 34, 244-249.

SEWAGE MANAGEMENT AND WASTEWATER TREATMENT 277
Temperature and pH Influence on Anammox Activity: a Batch Test Study M. Tomaszewski, G. Cema, A. Ziembińska-Buczyńska* * The Silesian University of Technology, Environmental Biotechnology Department, Akademicka 2, 44-100 Gliwice, Poland (E-mail: [email protected])
INTRODUCTION Nitrogen is one of the major biogenic element which removal is a key task of the wastewater treatment. Biological processes based on nitrification and denitrification are commonly used for this purpose, but discovered in 1995 by Mulder et al. (1995) anaerobic ammonia oxidation (Anammox) brings many potential benefits in this field. When nitrification-denitrification systems require aeration and external organic carbon addition, Anammox main substrates are only ammonium (N-NH4) and nitrites (N-NO2), that allows to reduce costs significantly. What is more, Anammox process has higher removal rate, requires smaller bioreactor volume and produces less amount of excess sludge (Jin et al., 2012). Common use of Anammox process in full-scale wastewater plants is still problematic. One of the main limitation is relatively high optimal temperature, which is between 30 and 40°C for most Anammox bacteria species used in wastewater treatment (Jin et al., 2012), which is higher than average wastewater temperature. The second limitation is long doubling time of Anammox bacteria, which is in the range 9-11 days (Strous et al., 1998). Moreover, biomass is highly sensitive to such conditions changes as pH value and substrates concentration (Jin, 2012). Anammox biomass requires stable conditions, because its regeneration in full-scale takes a lot of time. pH value is a very important parameter and strongly influences bacteria. This parameter also influences the concentration of toxic forms of ammonia: free ammonia (NH3) and nitrites: free nitrous acid (HNO2). The effect of these interactions is significant for bacteria activity (Carvajal-Arroyo et al., 2014; Puyol et al., 2014). For these reasons, the knowledge about crucial physical-chemical factors is very important for effective and stable process performance. The aim of presented work was to study possibilities of Anammox process performance at different than optimal values of temperature and pH in range of 10-40 °C and 6.0-9.0, respectively. MATERIALS AND METHODS Anammox biomass used in all batch assays were cultivated in Sequencing Batch Reactor (SBR) with a volume of 20 L. Reactor was fed with a synthetic wastewater with a total nitrogen loading rate of 0.456±0.008 gN·L-1·d-1, temperature 31.5±1.1°C and pH 7.8±0.4. Batch experiments were conducted at seven different temperatures: 10, 15, 20, 25, 30, 35 and 40 °C (with constant pH 7.5) and at seven different pH: 6.0, 6.5, 7.0, 7.5, 8.0, 8.5 and 9.0 (with constant temperature 30 °C). Tests were performed in 1 L batch reactors in duplicate, with equal initial concentrations of ammonium and nitrite nitrogen (30 mgN·L-1). Samples from the batch test reactor were periodically collected for 1.5-3 hour (depending on the rate of reaction), filtered and stored at 4 °C for the N-NH4, N-NO2 and N-NO3 concentrations measurement. Specific Anammox Activity (SAA) was calculated based on the decrease of inorganic nitrogen in the linear range of substrates removal and expressed as gN·gVSS-1·d-1.

SEWAGE MANAGEMENT AND WASTEWATER TREATMENT 278
RESULTS Obtained results of the temperature and pH influence on Specific Anammox Activity are shown in Figure 1. Temperature test shows nearly linear dependence of the bacteria activity in the range from 10 to 35 °C. The highest Anammox activity (0.828 gN·gVSS-1·d-1) was obtained at 40 °C and the lowest activity (0.035 gN·gVSS-1·d-1) at 10°C. Batch tests results obtained for the pH show the optimum values in the range 7.0-7.5. SAA for this pH were 0.471 and 0.475 gN·gVSS-1·d-1, respectively. pH values below this range caused strongest activity inhibition than values above this range. Almost complete inhibition (0.010 gN·gVSS-1·d-1) was obtained in pH 6.0, when at pH 9.0 was equal 0.224 gN·gVSS-1·d-1.
Figure 1. Temperature (with constant pH 7.5) and pH (with constant temperature 30°C) influence on Specific Anammox Activity obtained in batch test experiments (bars represent standard deviation of the mean) ACKNOWLEDGEMENT The study was financed by Polish National Science Centre: UMO-2013/09/D/NZ9/02438. REFERENCES Carvajal-Arroyo, J.M., Puyol, D., Li, G., Sierra-Alvarez, R., Field, J.A. (2014). The Role of pH on the Resistance of
Resting- and Active Anammox Bacteria to NO2- Inhibition. Biotechnol. Bioeng., v. 111, n. 10, 1949-1956. Jin, R.-C., Yang, G.-F., Yu, J.-J., Zheng, P. (2012). The inhibition of the Anammox process: A review. Chem. Eng. J.,
197, 67-79. Mulder, A., van de Graaf, A.A., Robertson, L.A., Kuenen, J.G. (1995). Anaerobic ammonium oxidation discovered in a
denitrifying fluidized bed reactor. FEMS Microbiol. Ecol., 16, 177-184. Puyol, D., Carvajal-Arroyo, J.M., Li, G.B., Dougless, A., Fuentes-Velasco, M., Sierra-Alvarez, R., Field, J.A. (2014).
High pH (and not free ammonia) is responsible for Anammox inhibition in mildly alkaline solutions with excess of ammonium. Biotechnol. Lett., 36, 1981–1986.
Strous, M., Heijnen, J.J., Kuenen, J.G., Jetten, M.S.M. (1998). The sequencing batch reactor as a powerful tool for the study of slowly growing anaerobic ammonium-oxidizing microorganisms. Appl. Microbiol. Biotechnol., 50, 589-596.
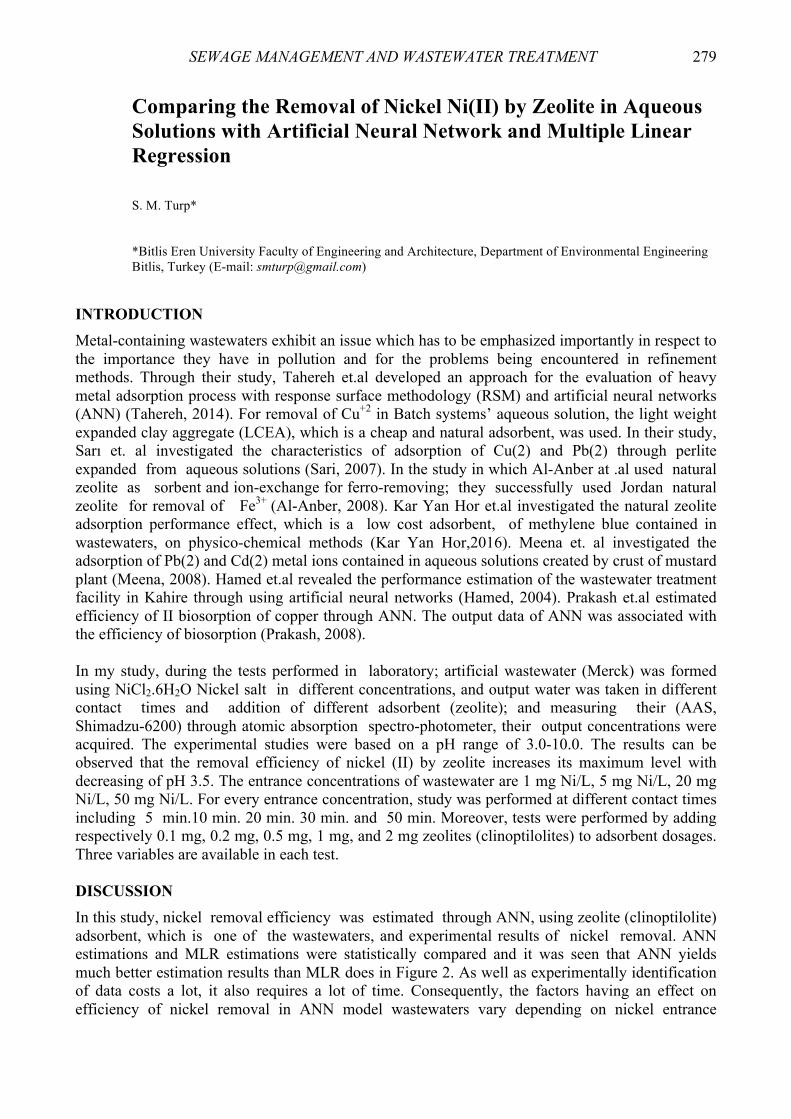
SEWAGE MANAGEMENT AND WASTEWATER TREATMENT 279
Comparing the Removal of Nickel Ni(II) by Zeolite in Aqueous Solutions with Artificial Neural Network and Multiple Linear Regression S. M. Turp* *Bitlis Eren University Faculty of Engineering and Architecture, Department of Environmental Engineering Bitlis, Turkey (E-mail: [email protected])
INTRODUCTION Metal-containing wastewaters exhibit an issue which has to be emphasized importantly in respect to the importance they have in pollution and for the problems being encountered in refinement methods. Through their study, Tahereh et.al developed an approach for the evaluation of heavy metal adsorption process with response surface methodology (RSM) and artificial neural networks (ANN) (Tahereh, 2014). For removal of Cu+2 in Batch systems’ aqueous solution, the light weight expanded clay aggregate (LCEA), which is a cheap and natural adsorbent, was used. In their study, Sarı et. al investigated the characteristics of adsorption of Cu(2) and Pb(2) through perlite expanded from aqueous solutions (Sari, 2007). In the study in which Al-Anber at .al used natural zeolite as sorbent and ion-exchange for ferro-removing; they successfully used Jordan natural zeolite for removal of Fe3+ (Al-Anber, 2008). Kar Yan Hor et.al investigated the natural zeolite adsorption performance effect, which is a low cost adsorbent, of methylene blue contained in wastewaters, on physico-chemical methods (Kar Yan Hor,2016). Meena et. al investigated the adsorption of Pb(2) and Cd(2) metal ions contained in aqueous solutions created by crust of mustard plant (Meena, 2008). Hamed et.al revealed the performance estimation of the wastewater treatment facility in Kahire through using artificial neural networks (Hamed, 2004). Prakash et.al estimated efficiency of II biosorption of copper through ANN. The output data of ANN was associated with the efficiency of biosorption (Prakash, 2008). In my study, during the tests performed in laboratory; artificial wastewater (Merck) was formed using NiCl2.6H2O Nickel salt in different concentrations, and output water was taken in different contact times and addition of different adsorbent (zeolite); and measuring their (AAS, Shimadzu-6200) through atomic absorption spectro-photometer, their output concentrations were acquired. The experimental studies were based on a pH range of 3.0-10.0. The results can be observed that the removal efficiency of nickel (II) by zeolite increases its maximum level with decreasing of pH 3.5. The entrance concentrations of wastewater are 1 mg Ni/L, 5 mg Ni/L, 20 mg Ni/L, 50 mg Ni/L. For every entrance concentration, study was performed at different contact times including 5 min.10 min. 20 min. 30 min. and 50 min. Moreover, tests were performed by adding respectively 0.1 mg, 0.2 mg, 0.5 mg, 1 mg, and 2 mg zeolites (clinoptilolites) to adsorbent dosages. Three variables are available in each test. DISCUSSION In this study, nickel removal efficiency was estimated through ANN, using zeolite (clinoptilolite) adsorbent, which is one of the wastewaters, and experimental results of nickel removal. ANN estimations and MLR estimations were statistically compared and it was seen that ANN yields much better estimation results than MLR does in Figure 2. As well as experimentally identification of data costs a lot, it also requires a lot of time. Consequently, the factors having an effect on efficiency of nickel removal in ANN model wastewaters vary depending on nickel entrance
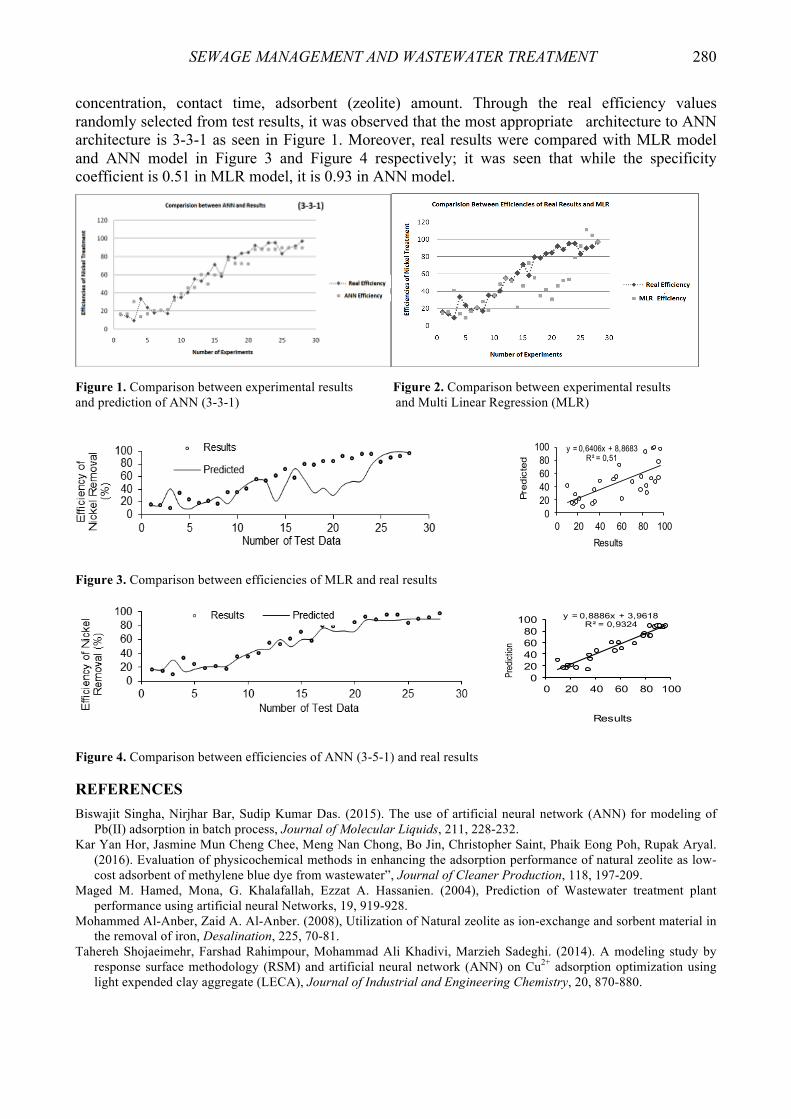
SEWAGE MANAGEMENT AND WASTEWATER TREATMENT 280
concentration, contact time, adsorbent (zeolite) amount. Through the real efficiency values randomly selected from test results, it was observed that the most appropriate architecture to ANN architecture is 3-3-1 as seen in Figure 1. Moreover, real results were compared with MLR model and ANN model in Figure 3 and Figure 4 respectively; it was seen that while the specificity coefficient is 0.51 in MLR model, it is 0.93 in ANN model.
Figure 1. Comparison between experimental results Figure 2. Comparison between experimental results and prediction of ANN (3-3-1) and Multi Linear Regression (MLR)
Figure 3. Comparison between efficiencies of MLR and real results
Figure 4. Comparison between efficiencies of ANN (3-5-1) and real results REFERENCES
Biswajit Singha, Nirjhar Bar, Sudip Kumar Das. (2015). The use of artificial neural network (ANN) for modeling of Pb(II) adsorption in batch process, Journal of Molecular Liquids, 211, 228-232.
Kar Yan Hor, Jasmine Mun Cheng Chee, Meng Nan Chong, Bo Jin, Christopher Saint, Phaik Eong Poh, Rupak Aryal. (2016). Evaluation of physicochemical methods in enhancing the adsorption performance of natural zeolite as low-cost adsorbent of methylene blue dye from wastewater”, Journal of Cleaner Production, 118, 197-209.
Maged M. Hamed, Mona, G. Khalafallah, Ezzat A. Hassanien. (2004), Prediction of Wastewater treatment plant performance using artificial neural Networks, 19, 919-928.
Mohammed Al-Anber, Zaid A. Al-Anber. (2008), Utilization of Natural zeolite as ion-exchange and sorbent material in the removal of iron, Desalination, 225, 70-81.
Tahereh Shojaeimehr, Farshad Rahimpour, Mohammad Ali Khadivi, Marzieh Sadeghi. (2014). A modeling study by response surface methodology (RSM) and artificial neural network (ANN) on Cu2+ adsorption optimization using light expended clay aggregate (LECA), Journal of Industrial and Engineering Chemistry, 20, 870-880.
y = 0,8886x + 3,9618R² = 0,9324
020406080
100
0 20 40 60 80 100
Pred
iction
Results
y = 0,6406x + 8,8683R² = 0,51
020406080
100
0 20 40 60 80 100Pr
edic
ted
Results

SEWAGE MANAGEMENT AND WASTEWATER TREATMENT 281
Effect of pH on Efficiency of Sorption/Desorption of Heavy Metals on Natural and Iron-modified Zeolite M. Ugrina, N. Vukojević Medvidović, M. Trgo and I. Nuić* * University of Split, Faculty of Chemistry and Technology, Ruđera Boškovića 33, 21000 Split, Croatia (E-mail: [email protected])
INTRODUCTION Natural zeolites are already recognized as efficient sorbent materials for different toxic substances from wastewater, especially for removal of ammonia, radioactive ions and heavy metals. Their modification allows the removal of anionic and organic compounds. Unique properties and environmental compatibility rapidly expand their application in the field of environmental protection. Recent investigations have been focused on their application in soil remedy as well as materials in permeable reactive barriers. In this light, the investigation of sorption/desorption of heavy metals on zeolite in relation to pH is very important for their practical application. EXPERIMENTAL METHODS Sample preparation The natural zeolite (NZ) originated from the Vranjska Banja deposit, Serbia with the particle size of 0.6-0.8 mm. The iron-modified zeolite (IMZ) was prepared from NZ according to the procedure described in a previous paper (Ugrina, 2015). Sorption experiment The sorption of zinc, cadmium, copper and lead on natural and iron-modified zeolite was studied in the pH range 2-8. The initial concentrations of 3.052 mmol Zn/l, 2.942 mmol Cd/l, 3.971 mmol Cu/l and 4.006 mmol Pb/l were prepared by dissolving their nitrate salts in ultrapure water. The pH of the solution was adjusted by a small addition of 0.1 mol/l HNO3 or 0.1 mol/l KOH. The mass of 1.0000 g of NZ or IMZ was mixed with 100 ml of each metal ion solution during 48 h at 25°C. After equilibration, the remaining concentration of each metal in solution was determined by AAS.
Sorption/desorption experiments The desorption study was performed into two steps. In the first step, the sorption of zinc, cadmium, copper and lead on IMZ from the solution of 8.727 mmol Zn/l, 10.297 mmol Cd/l, 10.061 mmol Cu/l and 10.619 mmol Pb/l at optimal pH was carried out in the batch mode. The mass of 10.0000 g of IMZ with 1 l of each metal ion solution was mixed 48 hours at 25°C. At desired time intervals within 48 hours, samples were collected and pH as well as concentrations was determined. In the second step, collected saturated samples IMZZn, IMZCd, IMZCu and IMZPb were used for desorption in ultrapure water at different initial pH values. The desorption tests were performed by mixing of 1.0000 g of each saturated sample with 100 ml of ultrapure water with the initial pH=3-9. In the period of 48 hours the continuous measured of pH and concentration of desorbed metal in equilibrium was measured. RESULTS AND DISCUSSION The sorption efficiency of zinc, cadmium, copper and lead on NZ and IMZ at different initial pH values of solutions is represented by sorption edge curves in Figure 1. Higher sorption efficiency for NZ was found to be in the range of pH = 4-6 for zinc, pH = 4-7 for cadmium, pH = 3-5 for copper

SEWAGE MANAGEMENT AND WASTEWATER TREATMENT 282
and pH = 4-5 for lead, and for IMZ in the range of pH = 3-6 for zinc, pH = 3-7 for cadmium, pH = 2.5-3 for copper and pH = 3-5 for lead. At lower pH, the sorption efficiency is reduced due to the competition effect of hydrogen ions with metal cations. At higher pH, precipitation reactions take place. The time dependence of sorption curves of heavy metals on IMZ (Figure 2) shows the selectivity sequence in the order Pb>Zn>Cd>Cu. The reaction and diffusion kinetic models were applied to sorption data and results revealed intra-particle diffusion as the rate limiting step.
0
20
40
60
80
100
0 2 4 6 8
Rem
oval
, %
pHo
Zn
Cd
Cu
Pb
NZ
0
20
40
60
80
100
0 2 4 6 8
Rem
oval
, %
pHo
Zn
Cd
Cu
Pb
IMZ
Figure 1. The effect of pH value on removal of zinc, cadmium, copper and lead ions on NZ and IMZ
0
0,1
0,2
0,3
0,4
0,5
0,6
0,7
0 1000 2000 3000
q t, m
mol
/g .
t, min
PbZnCdCu
0
0,1
0,2
0,3
0,4
0,5
0,6
0,7
0 2 4 6 8 10
q, m
mol
/g
pH
Heavy metals sorbedPb retainedZn retainedCu retainedCd retained
Figure 2. Time dependence sorption curves for heavy metals on IMZ
Figure 3. Comparison of metal sorbed on IMZ and metal retained in saturated IMZ
The time dependence pH curve of the solution during desorption of heavy metals from saturated IMZ shows a tendency of neutralization (results not presented here). This indicates the buffer properties of saturated IMZ and its acceptability for use in a wide pH range. The amount of metal sorbed on IMZ as well as metal retained after desorption of saturated IMZ is shown in Figure 3. The results indicate that at pH>3 IMZ has excellent sorption properties and ability of retention of heavy metals. At pH=3 desorption of zinc was not recorded, while desorption of cadmium, copper and lead was determined and equalled 6.16 %, 19.20 % and 4.76%, respectively. This work has been fully supported by Croatian Science Foundation under the project NAZELLT (IP-11-2013-4981). REFERENCES Ugrina, M., Vukojević Medvidović, N. and Daković, A. (2015). Characterization and environmental application of iron-
modified zeolite from the Zlatokop deposit. Desalination and Water Treatment, 53, 3557-3570.

SEWAGE MANAGEMENT AND WASTEWATER TREATMENT 283
Influence and Time Dependence of Nitrite on the Nitrous Oxide Accumulation during Denitrification
B. Vogel, M. Beier and K.-H. Rosenwinkel* * Institute for Sanitary Engineering and Waste Management (ISAH), Leibniz Universität Hannover, Welfengarten 1, 30167 Hannover, Germany (E-mail: [email protected])
INTRODUCTION In the face of global climate change, the calculation of CO2-footprints to quantify greenhouse gas (GHG) emissions has become an issue also for wastewater treatment plants (WWTPs). One of the most relevant gases, which is produced during nitrogen removal processes, is nitrous oxide (N2O) with a high global warming potential (GWP) of 298. N2O is formed as a by-product during nitrification and as an intermediate during denitrification (Desloover et al., 2011). In relation to the denitrification process, N2O gas emits into the atmosphere, if the N2O concentration in the liquid phase accumulates and exceeds the saturation concentration. In the literature, different influencing random conditions such as pH, O2 level or temperature are given favour the N2O accumulation and emission (Schneider et al. 2010). Also high NO2 concentrations have an influence to the N2O accumulation. However, the influence of NO2 is not constant but is attenuated over time. This phenomenon has already been noted by (Alinsafi et al. 2008) and is confirmed by own investigations. The results show that an increase of N2O emission is not only depending to the height of feed concentration, but also from the period of the concentration fluctuation. Same applies to temporarily elevated NO3 concentration but with a lower effect to the N2O accumulation (Source 3 and own results). This suggests, that N2O emission plays essentially a role for waste water treatment plants with strongly fluctuating feed concentrations or in process water treatment through nitritation/denitritation, such as the method of PANDA process (Hartwig & Beier, 2008). In this paper the influence of high NO2 concentration and the time dependency on the N2O accumulation is shown, based on own batch test results. Also a novel model approach is presented, which includes the time dependency of inflow fluctuation with respect to the N2O reductase. EQUIPMENT, ANALYTICAL METHODS AND PERFORMING OF BATCH TESTS A closed column shaped lab-scale continuously stirred tank reactor (CSTR) (V = 4 L) was operated with a constant temperature of 25 °C. The oxygen concentration (below 0.07 mg/L all the time) and pH was measured online. Two clark-type microsensor (Unisense AS, Denmark) were used to measure N2O concentration once in the liquid phase and in the gas phase. The N2O formation rate (N2O_FR) was determined from the slope of the N2O concentration (linear regression), plus the concentration of the consumed NO2-N. Samples of mixed liquor were filtered and NO2-N and COD were determined by HACH LANGE cuvettes and Xion 500 spectrophotometer (Dr Lange GmbH, Berlin, Germany). Activated Sludge was taken from a denitrification basin of a municipal WWTP, filled up into the CSTR (Volume liquid phase: 3.5L, Volume gas phase: 0.5L) and aerated for 12 hours to eliminate remaining easy biodegradable COD. The batch test started by dosing sodium nitrite to rise NO2 concentration and sodium acetate or ethanol to rise the COD concentration. When NO2 was completely consumed, dosing was repeated to rise the NO2 concentration again. RESULTS AND MODEL DEVELOPMENT The results show that the N2O peaks/accumulation after dosing NO2 is decreasing over time constantly (Figure 1). So it seems, that the activated sludge, which is adapted to low NO3

SEWAGE MANAGEMENT AND WASTEWATER TREATMENT 284
concentrations, adapts to the circumstances of present/increased NO2 concentration, with an increase of the N2O reduction rate or less inhibition due to NO2 over time. Same behaviour was found in other experiments. The reasons for the adaptation and increase of the N2O reductase must be investigated further.
Figure 1. Laboratory and simulation results of denitrification batch tests with nitrite and ethanol As a consequence the results, the model approach developed by ISAH (2 step denitrification, based on ASM3), was extended by implementing of a new inhibition term for N2O reductase, a fictive fraction (Sadapt) and a constant process rate (dec_S_adapt) (See Figure 2). Moreover a new external variable (fadapt) was integrated, which is calculated in the technical model, depending to the NO2 fluctuation for a specific time period and as inverse of Sadapt. With this arrangement, the concentration of Sadapt will be zero in case of no/low NO2 concentration fluctuation. In case of a sudden strong increase of NO2, Sadapt will increase during NO2 consumption. Because fadapt is the inverse of Sadapt, the N2O reduction rate will be inhibited immediately. Due to the fact that Sadapt will rise during NO2 reduction, the inhibition on the N2O reduction rate will decrease and the process will accelerate. Sadapt will be reduced slowly by the process dec_S_adapt, for the case that no/low NO2 concentrations occurs for a long time period and bacteria will lose the ability to respond high NO2 concentrations. As you can see in Figure 1, the model represents a good behaviour but parameter calibration is not finished yet.
Figure 2. Model approach for denitrification, advanced according to the batch test results REFERENCES Alinsafi, A., Adouani, N., Beline, F., Lendormi, T., Limousy, L. and Sire, O. (2008). Nitrite effect on nitrous oxide
emission from denitrifying activated sludge. Process Biochemistry, 43(6), 683-689. Desloover, J., Vlaeminck, SE., Clauwaert, P., Verstraete, W., Boon, N. (2011). Strategies to mitigate N2O emissions
from biological nitrogen removal systems. Curr Opin Biotechnol 23, 1-9. Hartwig, P., Beier, M. (2008). Das PANDA/PANDA+-Verfahren – Betriebserfahrungen zur Nitritation/Denitritation
auf großtechnischen Anlagen mit hohem Industrieanteil, Colloquium produktionsintegrierte wasser-/ abwassertechnik, Bremen.
Schneider, Y., Beier, M., Rosenwinkel, K-H. (2010). Nitrous Oxide Emissions from Wastewater Treatment Plants – Improving the Quality of Measuring Data. Conference Proceedings of 7th IWA Leading Edge Conference on Water and Wastewater Technologies, Phoenix (AZ), USA, IWA.

SEWAGE MANAGEMENT AND WASTEWATER TREATMENT 285
COD Fractions and the Activity of Aerobic Microorganisms in the Process of Hydrodynamic Disintegration of Activated Sludge J. Walczak, M. Zubrowska-Sudol and A. Garlicka* * Department of Water Supply and Wastewater Treatment, Faculty of Building Services, Hydro and Environmental Engineering, Warsaw University of Technology, Nowowiejska 20, 00-653 Warsaw, Poland (E-mails: [email protected]; msudol@ is.pw.edu.pl; [email protected])
INTRODUCTION In recent years the process of sludge disintegration gains growing interest in the scientific community. This is due to the significant advantages of this process, such as: (i) increasing the efficiency of methane fermentation process, (ii) reducing the volume of wasted sludge, (iii) improvement in digested sludge dewatering, and (iv) the intensification of biogenic compounds removal from wastewater (Huan et al., 2009). By using the additional energy, the process of disintegration leads to an increase in the concentration of organic compounds in the sludge liquid (Zubrowska-Sudol & Walczak, 2014). Disintegrated sludge thus becomes a potential substrate for the microorganisms responsible for fermentation or nutrients removal from wastewater. Many authors, analysing the process of organic compounds release, determine COD values of organic compounds with a diameter <0.45 microns, assuming that they represent soluble compounds. In fact, these are not only soluble (<0.1 µm), but also colloidal compounds with a diameter of 0.1-0.45 mm. The main objective of the study was to evaluate the changes of following fractions of sludge COD before and after the process of disintegration: (i) compounds with a diameter >1.2 microns - present in the suspension, (ii) colloidal compounds with a diameter 0.45-1.2 microns (considered as hardly consumed by bacteria), (iii) colloidal compounds with a diameter of 0.1-0.45 microns (considered to be easily consumed by bacteria), and (iv) soluble compounds with a diameter <0.1 µm (considered to be easily consumed by bacteria) (Metcalf & Eddy, 2014). To our knowledge, so far such research has not been carried out. In addition, we analysed the effect of hydrodynamic disintegration of sludge on microbial aerobic activity (oxygen uptake rate tests (OUR)). MATERIALS AND METHODS The experiment consisted of 7 research series including COD fractionation, OUR tests (Zubrowska-Sudol and Walczak, 2014) and determining the degree of disintegration (DD) (Nickle & Neis, 2007) before and after disintegration. The amount of energy used in the disintegration process was expressed as energy density (εL). In the experiment five levels of energy were used: 70, 140, 210, 280 and 350 kJ/L. In each series the other batch of sludge was used. For the experiment, excess sludge concentrated by a belt press was used, with total solids (TS) concentration equal to 3.40−4.54 %. It originated from a biological nutrient removal wastewater treatment plant (PE = 53 040). In the experiment, a laboratory hydrodynamic disintegration apparatus was used as described in detail in Zubrowska-Sudol and Walczak (2014). Fractionation of organic compounds released into the sludge liquid based on sequential filtration of sludge samples (before and after disintegration) by filters with a pore diameter of 0.1, 0.45 and 1.2 µm. Then, the filtrate was analysed for COD (in duplicates) (APHA, 1998).
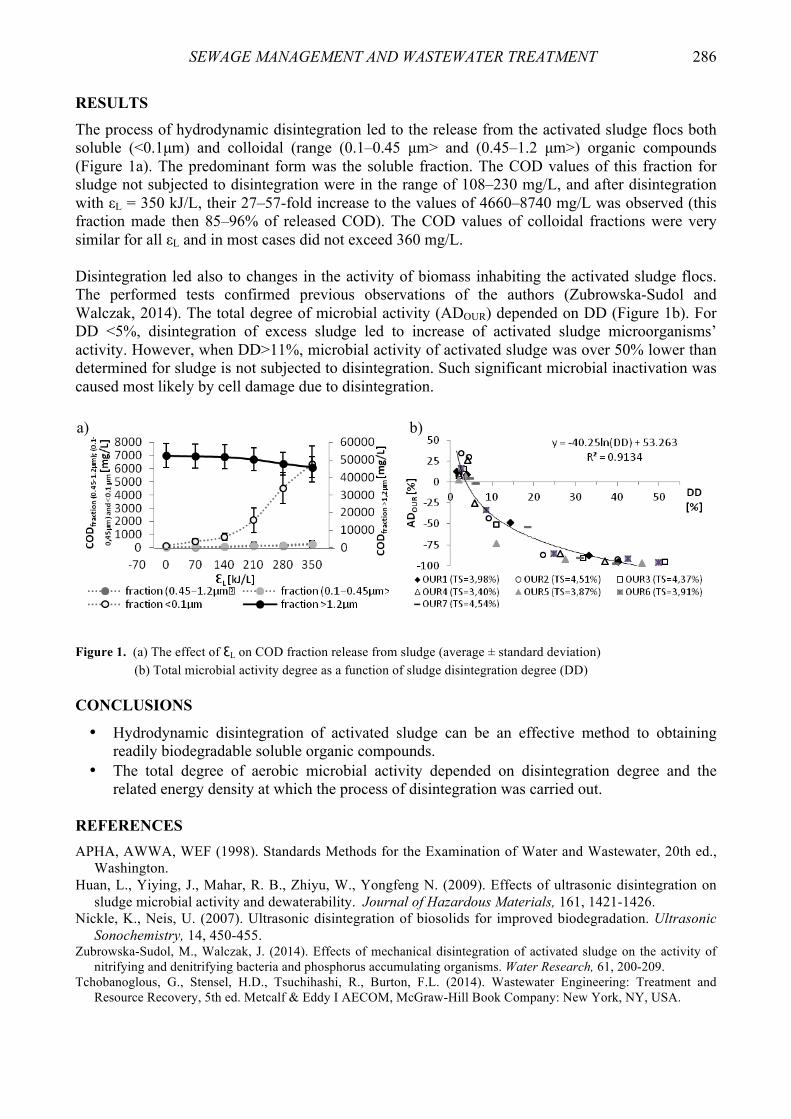
SEWAGE MANAGEMENT AND WASTEWATER TREATMENT 286
RESULTS The process of hydrodynamic disintegration led to the release from the activated sludge flocs both soluble (<0.1µm) and colloidal (range (0.1–0.45 µm> and (0.45–1.2 µm>) organic compounds (Figure 1a). The predominant form was the soluble fraction. The COD values of this fraction for sludge not subjected to disintegration were in the range of 108–230 mg/L, and after disintegration with εL = 350 kJ/L, their 27–57-fold increase to the values of 4660–8740 mg/L was observed (this fraction made then 85–96% of released COD). The COD values of colloidal fractions were very similar for all εL and in most cases did not exceed 360 mg/L. Disintegration led also to changes in the activity of biomass inhabiting the activated sludge flocs. The performed tests confirmed previous observations of the authors (Zubrowska-Sudol and Walczak, 2014). The total degree of microbial activity (ADOUR) depended on DD (Figure 1b). For DD <5%, disintegration of excess sludge led to increase of activated sludge microorganisms’ activity. However, when DD>11%, microbial activity of activated sludge was over 50% lower than determined for sludge is not subjected to disintegration. Such significant microbial inactivation was caused most likely by cell damage due to disintegration.
Figure 1. (a) The effect of ƐL on COD fraction release from sludge (average ± standard deviation) (b) Total microbial activity degree as a function of sludge disintegration degree (DD) CONCLUSIONS
• Hydrodynamic disintegration of activated sludge can be an effective method to obtaining readily biodegradable soluble organic compounds.
• The total degree of aerobic microbial activity depended on disintegration degree and the related energy density at which the process of disintegration was carried out.
REFERENCES APHA, AWWA, WEF (1998). Standards Methods for the Examination of Water and Wastewater, 20th ed.,
Washington. Huan, L., Yiying, J., Mahar, R. B., Zhiyu, W., Yongfeng N. (2009). Effects of ultrasonic disintegration on
sludge microbial activity and dewaterability. Journal of Hazardous Materials, 161, 1421-1426. Nickle, K., Neis, U. (2007). Ultrasonic disintegration of biosolids for improved biodegradation. Ultrasonic
Sonochemistry, 14, 450-455. Zubrowska-Sudol, M., Walczak, J. (2014). Effects of mechanical disintegration of activated sludge on the activity of
nitrifying and denitrifying bacteria and phosphorus accumulating organisms. Water Research, 61, 200-209. Tchobanoglous, G., Stensel, H.D., Tsuchihashi, R., Burton, F.L. (2014). Wastewater Engineering: Treatment and
Resource Recovery, 5th ed. Metcalf & Eddy I AECOM, McGraw-Hill Book Company: New York, NY, USA.
a) b)
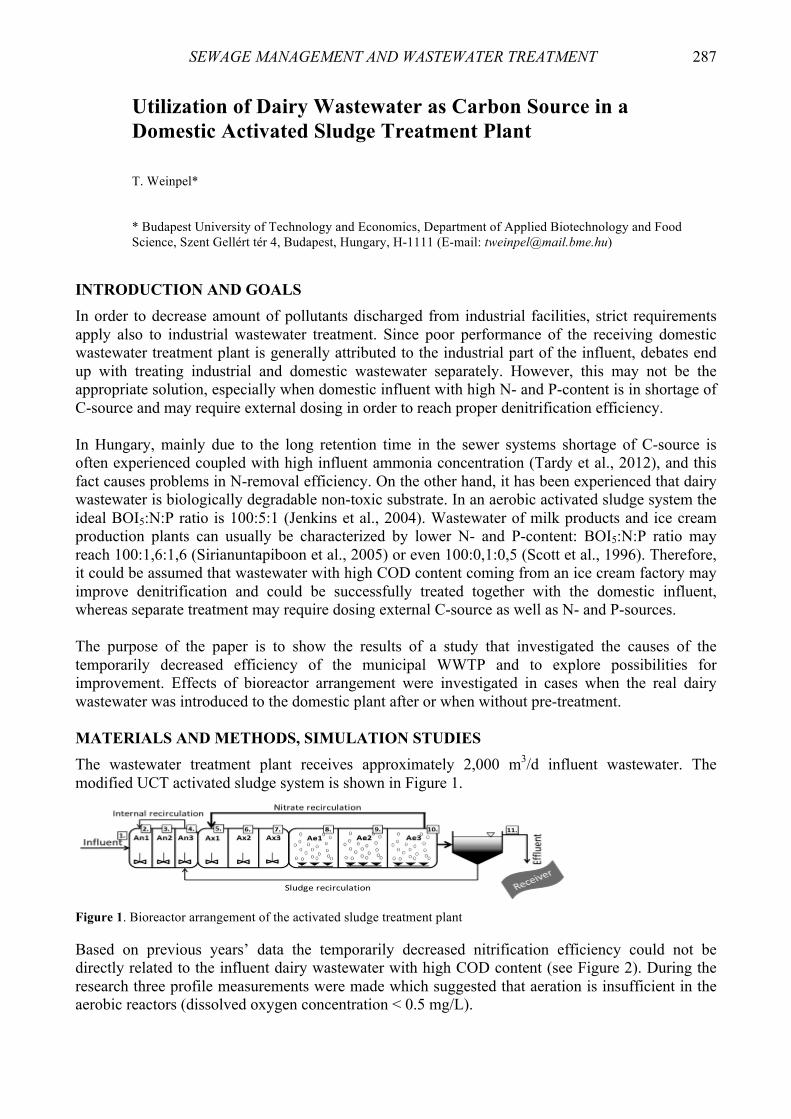
SEWAGE MANAGEMENT AND WASTEWATER TREATMENT 287
Utilization of Dairy Wastewater as Carbon Source in a Domestic Activated Sludge Treatment Plant T. Weinpel* * Budapest University of Technology and Economics, Department of Applied Biotechnology and Food Science, Szent Gellért tér 4, Budapest, Hungary, H-1111 (E-mail: [email protected])
INTRODUCTION AND GOALS In order to decrease amount of pollutants discharged from industrial facilities, strict requirements apply also to industrial wastewater treatment. Since poor performance of the receiving domestic wastewater treatment plant is generally attributed to the industrial part of the influent, debates end up with treating industrial and domestic wastewater separately. However, this may not be the appropriate solution, especially when domestic influent with high N- and P-content is in shortage of C-source and may require external dosing in order to reach proper denitrification efficiency. In Hungary, mainly due to the long retention time in the sewer systems shortage of C-source is often experienced coupled with high influent ammonia concentration (Tardy et al., 2012), and this fact causes problems in N-removal efficiency. On the other hand, it has been experienced that dairy wastewater is biologically degradable non-toxic substrate. In an aerobic activated sludge system the ideal BOI5:N:P ratio is 100:5:1 (Jenkins et al., 2004). Wastewater of milk products and ice cream production plants can usually be characterized by lower N- and P-content: BOI5:N:P ratio may reach 100:1,6:1,6 (Sirianuntapiboon et al., 2005) or even 100:0,1:0,5 (Scott et al., 1996). Therefore, it could be assumed that wastewater with high COD content coming from an ice cream factory may improve denitrification and could be successfully treated together with the domestic influent, whereas separate treatment may require dosing external C-source as well as N- and P-sources. The purpose of the paper is to show the results of a study that investigated the causes of the temporarily decreased efficiency of the municipal WWTP and to explore possibilities for improvement. Effects of bioreactor arrangement were investigated in cases when the real dairy wastewater was introduced to the domestic plant after or when without pre-treatment. MATERIALS AND METHODS, SIMULATION STUDIES The wastewater treatment plant receives approximately 2,000 m3/d influent wastewater. The modified UCT activated sludge system is shown in Figure 1.
Figure 1. Bioreactor arrangement of the activated sludge treatment plant Based on previous years’ data the temporarily decreased nitrification efficiency could not be directly related to the influent dairy wastewater with high COD content (see Figure 2). During the research three profile measurements were made which suggested that aeration is insufficient in the aerobic reactors (dissolved oxygen concentration < 0.5 mg/L).

SEWAGE MANAGEMENT AND WASTEWATER TREATMENT 288
Figure 2. United influent and effluent NH4-N concentrations, and united influent COD concentrations of the WWTP and COD concentration values of the dairy wastewater To investigate the efficiency of the WWTP, mathematical simulation studies were carried out based on profile measurements’ and previous years’ data. Having validated the model, calculations were made at 2,500 m3/d influent flow rate, different biomass concentrations (5 and 8 g/L) and bioreactor arrangements (Current, Current+DO up, BioP, Pre-DN and Pre- and post-DN). The initial concept was to investigate the activated sludge treatment efficiency at different influent COD concentrations depending on whether the dairy wastewater is pre-treated (lower influent COD) or not. CONCLUSION The temporarily decreased efficiency of municipal WWTP was not necessarily caused by the industrial discharge. The dairy wastewater proved to have favorable impact on nitrogen removal efficiency. Profile measurements showed that dissolved oxygen concentration has to be increased in the aerobic reactors to achieve appropriate nitrification. Simulation studies confirmed that aeration was insufficient in wintertime (see Figure 3a), and suggested that with adequate aeration the efficiency of denitrification would decrease when dairy wastewater was not received by the WWTP (see Figures 3b-c). Dosing expensive external C-source would be required.
Figure 3. (a) Insufficient nitrification due to currently low oxygen supply; and efficient nitrogen removal with dairy wastewater (b – wintertime, c – summertime) ACKNOWLEDGEMENTS The project was funded by Budapest Sewage Works Ltd. The author expresses special thanks to Prof. Andrea Jobbágy research leader. Valuable contribution of József Simon is also acknowledged. REFERENCES Jenkins, D., Richard, M.G., Daigger, G.T. (2004). Manual on the causes and control of activated sludge bulking,
foaming, and other solids separation problems, 3rd Edition, CRC Press LLC. Scott, J.A., Smith, K.L. (1996). A bioreactor coupled to a membrane to provide aeration and filtration in ice-cream
factory wastewater remediation. Water Research, 31, 69-74. Sirianuntapiboon, S., Jeeyachok, N., Larplai, R. (2005). Sequencing batch reactor biofilm system for treatment of milk
industry wastewater, Journal of Environmental Management, 76, 177-183. Tardy, G.M., Bakos, V. and Jobbágy, A. (2012). Conditions and technologies of biological wastewater treatment in
Hungary. Water Science and Technology, 65(9), 1676-1683.

SEWAGE MANAGEMENT AND WASTEWATER TREATMENT 289
Tracer Study of Dispersion in Full-Scale Activated Sludge System P. Wielgat and P. Zima* * Gdansk University of Technology, Faculty of Civil and Environmental Engineering, ul. Narutowicza 11/12, 80-233 Gdansk, Poland (E-mails: [email protected]; [email protected])
INTRODUCTION Flows of waste water streams within the system of activated sludge are caused by equipment located inside the reactor, and also by external devices. These include recirculated sludge pumps after sedimentation in the secondary clarifier and stirrers installed inside the reactor zones and on their borders (designed to cause circulation within each zone and internal recirculation between the zones of reactor). The method of their installation and arrangement (and hence the distribution of flow between the zones) depends on the activated sludge system. Unfortunately, very often used technical solutions (and even design intent) underlie malfunctioning of the reactor. Thus, one of the basic elements of a well-implemented mathematical model is appropriate diagnosis of bioreactor hydraulics (it means quantitative determination of streams within individual zones and their flow directions). The stream of waste water not only obeys the advective transfer but also the dispersion process, resulting from the mixing occurring during flow. Dispersion is related to the turbulent nature of the flow, to the work of pumps or stirrers and processes taking place in certain zones of the bioreactor (Zima et al., 2008, 2009). A particularly important process significantly affecting the dispersion is the process of wastewater aeration in the aeration zone. There are many empirical formulas allowing to describe this process. They were created as a result of research conducted by different researchers in different activated sludge systems. Their application in the case of the same object can give results which differ even more than 200% (Zima et al., 2008). Therefore, the tracer study is the best way to adequately describe the dispersion processes taking place in different zones of the bioreactor (USGS, 1986). This study also allows properly to identify directions and propagation of fluxes between the zones (Zima, 2007). MATERIAL AND METHODS
Study site. Within the framework of this research have been made tracer study and measurements of the velocity of flow in the activated sludge system located at WWTP “Dębogórze” in Gdynia. It is a block of bioreactors with a total capacity of 104.000 m3. These are BARDENPHO bioreactors with simultaneous denitrification system CARROUSEL and the possibility of partial raw sewage bypass of anaerobic chamber and bring them directly to the denitrification/nitrification zone (bioreactor process diagram is shown in Figure 1). Tracer studies. The tracer studies aiming at the determination of the flow conditions in the bioreactor zones were carried out using Rhodamine WT 20 % as a fluorescent tracer (USGS, 1986). The dye samples were analyzed on-site with a Turner Designs “Trilogy” fluorometer. The injection of the dye was preceded by background fluorescence analysis of mixed liquor samples. Then 0.5 dm3 of the Rhodamine WT was injected at a point located before the separation of flux at the inlet to the reactor. Mixed liquor samples (V = 3 cm3) were taken for a fluorescence measures at

SEWAGE MANAGEMENT AND WASTEWATER TREATMENT 290
several points located in specific places of bioreactor (between zones). Samples were withdrawn with the frequency of 1-20 min.
anoxic zone (1.625 m )3
effluent
influent
recirculation
sludge Bio P (750 m )3
Pre DN(375 m )3
anoxic zone (1.500 m )3 anoxic/aerobic zone (1.500 m )3
anaerobic zone (1125 m )3
internal recirculation
anoxic/aerobic zone (1.625 m )3
influent
influent
aerobic zone (4.625 m )3
redox
redox
O2 O2N03 Figure 1. Bioreactor process diagram with simultaneous denitrification and with additional inlet of sewage into the anoxic zone forming part of the block of bioreactors at WWTP “Dębogórze” in Gdynia Estimation of the longitudinal dispersion coefficient. The dispersion process is described by Fick’s low, where EL is the longitudinal dispersion coefficient. There are several empirical methods and formulas to estimate a value of the EL coefficient (Makinia and Wells, 2005, Zima, et al., 2008). Alternatively, the EL coefficient can be calculated by the statistical method of Fischer (Zima et al., 2008) based on data series in two sampling points:
( )E q WL A= ⋅ ⋅31180 346 2..
, (1)
where q – flow rate, L3T-1; A – a cross-section area, L2; σ2i – standard deviation of time distribution
of tracer, Δt – time interval between series peaks, T. RESULTS AND DISSCUSION The results of tracer studies carried out in the bioreactor at the “Dębogórze” WWTP allowed to estimate value of the dispersion coefficient EL, respectively in each sections of the bioreactor with different mixing intensities. Several empirical formulas for evaluating a value of the dispersion coefficient, EL, produced a wide range of the values (from less than 100 to about 2,000 m2/h). REFERENCES Makinia, J. and Wells, S.A. (2005). Evaluation of empirical formulae for estimation of the longitudinal dispersion in
activated sludge reactors. Water Research, 39, 1533-1542. USGS (1986). Fluorometric Procedures for Dye Tracing. US Government Printing Office, Washington, DC. Zima, P.(2007). The CFD modeling in bioreactor tracer studies. TASK Quarterly: scientific bulletin of Academic
Computer Centre in Gdansk, 4, 439-447. Zima, P., Mąkinia, J., Swinarski, M., Czerwionka, K. (2008). Effects of different hydraulic models on predicting
longitudinal profiles of reactive pollutants in activated sludge reactors. Water Science and Technology, 58(3), 555-561.
Zima, P., Mąkinia, J., Swinarski, M., Czerwionka, K. (2009). Combining Computational Fluid Dynamics with a Biokinetic Model for Predicting Ammonia and Phosphate Behavior in Aeration Tanks. Water Environment Research, 81(11), Nov., 2353-2362.

SEWAGE MANAGEMENT AND WASTEWATER TREATMENT 291
Ultrafiltration Membranes Formed from Polyaniline, Ionic Liquid and Cellulose - Transport Properties and Energy Efficiency B. Wilk*
* Institute of Water Supply and Environmental Protection, Cracow University of Technology, Warszawska 24, 31-155 Cracow, Poland (E-mail: [email protected])
INTRODUCTION In order to cope with increasing water pollution some technologies should be implemented that are not only effective and economically reasonable, but also environmentally friendly (i.e. green technologies). Application of conductive (admixture of polyaniline) and clean (ionic liquid as a solvent) ultrafiltration membranes can be of great importance for a separation process. Such membranes may be used as biosensors in some industrial processes, in medicine and during treatment of specific wastewater. The paper presents a method of formation of ultrafiltration membranes from such raw materials as: cellulose, polyaniline and an ionic liquid, as gelling substance, as well as points out how beneficial may be their use for energy costs. MATERIALS AND METHODS The membranes have been formed using a phase inversion method, phase separation was achieved in a wet process. Film-forming solutions were prepared comprising cellulose, polyaniline and 1-ethyl-3-methyl imidazole acetate. There were four types of solutions, numbered as solutions 1, 2, 3 and 4. They all were 10 % cellulose solutions in a ionic liquid, though had a different content of polyaniline. Solution 1 had no polyaniline while in solutions 2, 3 and 4 a polyaniline content was 1 %, 5 % and 10 %, respectively. To determine the effect of coagulant on transport properties of prepared membranes they were gelled in methanol, ethanol, 1-propanol, 2-propanol, butanol and deionized water. Table 1. Composition of a film-forming solutions and identification of tested membranes
Solution 10% cellulose 10% cellulose + 1% polyaniline
10% cellulose + 5% polyaniline
10% cellulose + 10% polyaniline
1-propanol 1A 2A 3A 4A methanol 1B 2B 3B 4B H2O 1C 2C 3C 4C butanol 1D 2D 3D 4D 2-propanol 1E 2E 3E 4E pentanol 1F 2F 3F 4F ethanol 1G 2G 3G 4G
To evaluate transport properties of ultrafiltration membranes the following parameters have been used:
• Jv − volumetric permeate flow, m3/m2·s; • Lw − water permabeality, m3/m2·s·MPa.

SEWAGE MANAGEMENT AND WASTEWATER TREATMENT 292
The membranes were conditioned and tested in two laboratory reactors supplied by Amicon and Nucleopore. The structure and operational principle of both reactors were identical; the reactors differed in volume (500 cm3 and 50 cm3) and filtration surface (38.5 cm2 and 13.4 cm2). Ultrafiltration chambers were adjusted to work with flat membranes.
Figure 1. Measuring position plan: 1, 5 - pressurised gas supply system; 2 - supply tank; 3, 7 - magnetic mixers; 4, 6 - ultrafiltration chambers Transport properties of the membranes was determined while filtering a deionized water at a transmembrane pressure (0.1 to 0.3 MPa) and at fixed mixing intensity of a filtered medium - 100 rev/min. A permeate volume obtained within 15 minutes was measured and double checked. A permeate flow volume was also calculated and a relation between Jv and a transmembrane pressure was determined. RESULTS Studies conducted by the author have confirmed the preliminary assumptions since the results - particularly in the case of the 3F membrane - indicated that there is a possibility of their broad application in practice. The 3F membrane proved to be the most "open" membrane (5 % addition of PANI, gelled in pentanol). On the other hand, polyaniline increases the Jv value for some membranes (e.g. 3F, 2A, 2C, 3B) while for others it acts just in an opposite way (e.g. 2E, 2G, 4A, 3G). Analysis of the membranes in terms of the required transmembrane pressure and its impact on their mechanical and transport properties has enabled production of membranes with a lower (than in traditional solutions) energy use - expressed as a lower transmembrane pressure. REFERENCES Anastas, P.T.,Warner, J. (1998). Green Chemistry. Theory and Practice. Oxford Univ. Press, Oxford. Majewska, E. (2015). Ciecze jonowe w procesach ekstrakcji metali i związków organicznych z procesów spożywczych, Żywność. Nauka. Technologia. Jakość. (98), 5-15.
Ratti, R. (2014). Ionic liquids: synthesis and applications in catalysis, Advances in Chemistry, Volume 2014. Kosmulski, M., Tendaj, B. Niskotemperaturowe ciecze jonowe- ciekawostka laboratoryjna czy zapowiedź rewolucji
technologicznej? Cz. I. Anielak, Anna M. (2015). Wysokoefektywne metody oczyszczania wody, Wydawnictwo Naukowe PWN SA,
Warszawa. Zhang, H., Wu, J., Zhang, J. and He J. S. (2005). 1-Allyl-3-methylimidazolium chloride room temperature ionic liquid:
A new and powerful nonderivatizing solvent for cellulose , Macromolecules, (38). Bodzek, M., Bohdziewicz, J., Konieczny, K. (1997). Techniki membranowe w ochronie środowiska, Wydawnictwo
Politechniki Śląskiej, Gliwice.
PERMEATE DRAIN
PERMEATE DRAIN

SEWAGE MANAGEMENT AND WASTEWATER TREATMENT 293
Photocatalytic Degradation of Methyl Orange in Presence of TiO2 Nanotubes Synthesized by Anodic Oxidation P.I. Zaragoza*, A.C. Chávez* and C.E. Barrera** * Engineering Institute, UNAM, Av. University 3000, National Autonomous University of Mexico, C. U., Mexico City 04510, Mexico (E-mail: [email protected]) ** Joint Center for Research in Sustainable Chemistry UAEM - UNAM, highway Toluca-Atlacomulco 14.5 km, Toluca de Lerdo 50200, Mexico.
INTRODUCTION Methyl orange is used as an organic dye compound in the textile industry, which is not known to be biodegradable when is present in water due to their low solubility. An alternative to remove those compounds (azo-compounds) from water could be through of a process of heterogeneous photocatalysts, which employs TiO2 as a photocatalyst. This substrate can generate hydroxyl radicals (OH•) that are non-selective and highly reactive for organic compounds oxidation. This non-selectivity has a negative effect on ηd, thus the use of TNT increases the active area of the photocatalyst causing a high efficiency photodegradation reaction. Therefore, this research aims to study the photodegradation MO by using TNT which was synthesized through anodic oxidation. EXPERIMENTAL Materials and Reagents Titanium foils (Ti, 99.7 % purity, 0.127 mm thickness, Aldrich), acid electrolyte (0.5 M H3PO4 85.7 % and 0.14 M NaF 99 %, J. T. Baker) and Methyl orange (C14H14N3NaO3S, 85 %, HYCEL). The aqueous solutions were prepared with high purity deionized water. Study of photocatalytic degradation NTT synthesis was performed in galvanostatic cell two electrodes. Titanium substrates pretreated were used as electrodes which were immersed in 300 mL of acid electrolyte. The electrochemical process was performed at 20 V with a temperature at 23 °C. Subsequently anodized substrates underwent a heat treatment at 500 °C for 3 h. The study of the morphology of the surface of the anodized substrates was performed by FESEM (JEOL JSM–7600F). Whit EDS technical (sensor OXFORD INCAX-ACT) was possible to determine the elemental content on the surface of the substrates. Crystalline phases were characterized by XRD (Bruker D8 Advance, radiation Cu Kα). Photocatalytic experiments were carried out in a quartz glass where the anodized substrates (2.5 x 2.5 cm) were immersed in 50 mL of solution of MO. Then, this solution was irradiated by using three UV lamps (254 nm) of 15 W each one. The solution was maintained under constant stirring for 45 min. The distance between the substrates and the light source was around 10 cm. The photodegradation reaction was followed by recording the absorbance measures by using a UV-vis spectrophotometer (HACH, DR 5000) at time intervals of 30 minutes. Photocatalytic experiments were conducted for different initial concentrations of MO. Moreover, the effect of pH for the highest initial concentration was measured. RESULTS AND DISCUSSION In Figure 1a the formation of nanotube structures was perpendicular to the Ti substrate. The average inner diameter and length of TNT were 75 nm and 0.8 µm, respectively. The EDS spectrum

SEWAGE MANAGEMENT AND WASTEWATER TREATMENT 294
confirmed the presence of Ti and O. XRD results (Figure 1b) showed that the dominant crystal phase was anatase (86 %) followed by rutile (14 %). However, Ti peaks observed in it were attributed to the formation of amorphous TiO2. In Fig. 1c shows that ηd decreased as the initial concentration increased from 1 to 10 mg / L. According to Hailei et al., 2012 at the lowest initial concentration ηd was high. In contrast, molecules of the MO competing with OH- ions adsorbed on the active sites of TNT surface, as result of this, the production of OH• was reduced, so the ηd decreased. Figure 1d shows the ηd of MO solution (10 mg/L) at different pH values. The results exhibited that the ηd improved under acidic or alkaline conditions in contrast to the solution of MO at natural pH.
Figure 1. a) FESEM image of TNT, b) XRD patterns of TNT, c) Effects of initial concentration solution on ηd of MO and d) Effects of initial pH on ηd of MO. CONCLUSIONS Applying the anodic oxidation method was possible the TNT synthesis. A well organized and uniform TNT arrays on the Ti substrate was exhibited by FESEM. The anatase and rutile crystalline phases were found by XRD. The presence of Ti and O on the TNT was confirmed by EDS. The ηd decreased with increasing the MO concentration. Moreover, the ηd of MO was enhanced in both acidic and alkaline solution and the best condition of pH was 1. REFERENCES Hailei, L., Lixin, C., Wei, L., Ge, S. And Bohua, D. (2012). Synthesis and investigation of TiO2 nanotube arrays
prepared by anodization and their photocatalytic activity. Ceramics International, 38, 5791-5797.
a) b)
d) c)
SEWAGE MANAGEMENT AND WASTEWATER TREATMENT 295
Analysis of Growth Rates of The Micro Algae Chlorella Vulgaris in Different Culture Media and Waste Water S. Zydorczyk, S. Schmuck and T. Mietzel* * Department of Urban Water and Waste Management, University of Duisburg-Essen, Universitätsstraße 15, 45141 Essen, Germany (E-mail: [email protected])
INTRODUCTION Microalgae cultivation has received more attention in the last years as an alternative source of energy for biofuel and biogas production (Pittman et al., 2011). Moreover, microalgae can be used for treating waste water. The microalgae have the ability to remove inorganic nutrients (like phosphorous and nitrogen) from the waste water and assimilate them for their growth. (Pozza, 2014; Kim et al., 2010; Pittman et al., 2011). These abilities make the microalgae attractive for sustainable and low cost wastewater treatment (Pittman et al., 2011). The aim of the study was to evaluate the applicability of microalgae to grow in waste water, especially in comparison to culture media with all relevant microelements and vitamins. Therefore, the paper analyses the growth of microalgae in different culture media and waste water and their ability to grow under phototrophic and heterotrophic conditions. Furthermore, the batch tests were carried out under aerated and non aerated conditions. MATERIALS AND ANALYSES Cultivation The Chlorella vulgaris was obtained from the Culture Collection of Algae in Goettingen (Germany). The species was selected because the microalgae is often found in waste water, showing a good adaptability and grow rates (Wang et al., 2009). It was cultivated before the experiment in BG-11-media (Pozza, 2014). After the cultivation, microalgae were harvested using a centrifuge and inoculated in three culture media and two types of waste water: BG-11 medium, modified FSi medium (Guillard and Ryther, 1962, but with distilled water instead of sea water), Bold’s Basal Medium (Bischoff & Bold, 1963 and modified after Starr and Zeikus, 1993) and samples from a waste water treatment plant (at the final effluent and after the biological treatment). The waste water was obtained from the waste water treatment plant Duisburg-Kaßlerfeld (Germany). All culture media have been reported for a good growth rate of the Chlorella species (Wang et al, 2014). The Bold’s Basal Medium (BBM) includes in comparison to the BG-11 and FSi-media the vitamins biotin, thiamine and vitamin B12. Batch Tests The room temperature was 22 ±1 °C. Temperature and pH were monitored every day without any adaption. Ten reactors are illuminated by using two fluorescent lamps with chlorophyll spectrum with a photoperiod of 20:4 hours day:night cycle. The other ten reactors were not illuminated. The cultivation was carried out in 500-ml reactors mixed by continuous rotation. Five reactors of each batch test were aerated by periods of 15 minutes aeration one per hour and the other five non aerated.

SEWAGE MANAGEMENT AND WASTEWATER TREATMENT 296
Figure 1. Batch conditionAnalysis In this paper the measurement of the growth rate was carried out using the following three methods: total suspended solids (TSS) (DIN 38409 part 2), the Chlorophyll-a analysis and cell counting. The NH4-N, NO2-N, NO3-N and the Total Phosphorous were determined after filtration with a 0.45 µm cellulose acetate filter (Sartorius AG) using Hach-Lange tests as indicated in Table 1. Table 1. Hach-Lange tests
Parameter Hach-Lange test NH4-N LCK 303 2-47 [mg/L] NH4-N NO2-N LCK 342 0.6-6.0 [mg/L] NO2-N NO3-N LCK 339 0.23-13.5 [mg/L] NO3-N TP LCK 348 0.5-5 [mg/L] PO4-P
RESULTS & CONCLUSIONS First results have shown, that the growth rates of the heterotrophically cultured microalgae we much lower compared to the phototropic cultured microalgae. Another result auf the batch test is that the microalgae Chlorella vulgaris dies if dark conditions remain for more than 24 hours. The growth rate of Chlorella vulgaris (in culture media) determined using the TSS was higher among the aerated and rotated samples (samples 1.X). Among the culture media the results of the TSS-analyses have shown, that algae in the BBM have the highest growth rate. The highest growth rate (based on the TSS increase) was achieved in the sample grown in waste water from the final effluent, illuminated, aerated and rotated. This shows, that algae can grow in waste water even better than in different culture media. REFERENCES Becker. (1994). Microalgae Biotechnology and Microbiology, Cambridge. Bischoff, H. W. & Bold, H. C. (1963). Phycological Studies IV. Some Soil Algae from Enchanted Rock and Related
Algal Species. University of Texas Publication No. 6318,Austin, Texas. DIN 38409 part 2 (March 1987). Summarische Wirkungs- und Stoffkenngrößen (Gruppe H) (in German). Guillard, R.R., Ryther, J.H. (1962). Studies of marine planktonic diatoms I. Cyclotella nana Hustedt and Detonula
confervacea (cleve) Gran. Can. J. Microbiol., 8, 229-239. Kim, J., Lingaraju, B.P., Rheaume, R., Lee, J.-Y., and Siddiqui, K.F. (2010), Removal of Ammonia from wastewater
Effluent by Chlorella vulgaris, Tsinghua Science & Technology, 15(4), 391-396. Pittman, J.K., Dean, A.P. and Osundeko, O. (2011). The potenial of suistainable algal biofuel production using
wastewater resources, Bioresource Technology, 102(1), 17-25. Pozza, C. (2014). Nutrient removal in wastewater using microalgae, ISBN 978-3-8440-2754-9. Starr, R.C. & Zeikus, J.A. (1993) – UTEX – The Culture Collection of Algae at the University of Texas at Austin.
J. Phycol. Suppl, 29 Wang, L., Min, M., Li, Y., Chen, P., Chen, Y., Liu, Y., and Ruan, R. (2009). Cultivation of Green Algae Chlorella sp.
in Different Wastewaters from Municipal Wastewater Treatment Plant, Applied Biochemistry and Biotechnology, 162(4), 1174-1186.
Wang, L., Han, F., Li, Y., Wu, Y., Wang, J., Pan, R., Shen, G. (2014). Medium screeing and optimization for photoautotrophic culture of Chlorella pyrenoidosa with high lipid poductivity indoors and outdoors, Bioresource Technology, 170, 395-403.
IWA: Alliance House • 12 Caxton Street • London SW1H 0QS • United Kingdom Tel: +44 (0) 20 7654 5500 • Fax: +44 (0) 20 7654 5555 E-mail: [email protected] • Website: www.iwahq.org • Registered in England No.3597005 • Registered Charity (England) No.1076690 YWP: Adrian Puigarnau YWP Programmes Officer • P.O. Box 90405, 2509 LK The Hague • The Netherland • Tel.:+31 (0) 703150782 • [email protected]
ISBN 978-83-7493-936-2