African elephants Loxodonta africana amplify browse heterogeneity in African savanna
Upload
khangminh22Category
view
5download
0
African Elephants and Rhinos
Status Survey and
Conservation Action Plan
Compiled by
D. H. M. Cumming, R. F. Du Toit and S. N. Stuart
IUCN/SSC African Elephant and Rhino Specialist Group
Contents
Page Page
Foreword . . .
. . . . . . . . . . . . . . . . . . . . . . . . . . . . . . . . . . . . . . . . . . . . . . . . . . . . . . . . . . . . . . . . . . . . . . . . . . . . . . . . . . . 111
Acknowledgements . . . . . . . . . . . . . . . . . . . . . . . . . . . . . . . . . . . . . . . . . . . . . . . . . . . . . . . . . . . . . . . . . . . . iv
Chapter 1: Introduction . . . . . . . . . . . . . . . . . . . . . . . . . . . . . . . . . . . . . . . . . . . . . . . . . . . . . . . 1
1.1 The African Elephant . . . . . . . . . . . . . . ..*................. 1 1.2 The African Rhinos . . . . . . . . . . . . . . . . . . . . . . . . . . . . . . . . . . . . 3 1.3 The IUCN/SSC African Elephant and
Rhino Specialist Group . . . . . . . . . . . . . . . . . . . . . . . . . . . . . . 4 1.4 The Structure of the Action Plan . . . . . . . . . . . . . . 6
Chapter 5: Resources for Elephant and Rhino Conservation in Africa . . . . . . . . . . . . . . . . . . . . . . . . . . . . . . . . . . . . . 38
5.1 Manpower . . . . . . . . . . . . . . . . . . . . . . . . . . . . . . . . . . . . . . . . . . . . . . . . . . 38 5.2 Equipment . . . . . . . . . . . . . . . . . . . . . . . . . . . . . . . . . . . . . . . . . . . . . . . . 38 5.3 Funds . . . . . . . . . . . . . . . . . . . . . . . . . . . . . . . . . . . . . . . . . . . . . . . . . . . . . . . . . . 38 5.4 Management and Protection Policies . . . . 42 5.5 Identified Deficiencies . . . . . . . . . . . . . . . . . . . . . . . . . . . . . . 42
Chapter 2: A Review of Numbers of Black and White Rhinos in Africa . . . . . . . . . . . . . . . . . . . . . . . . . . . . . . . . . . . . . . . . . . . . . . . . . 7
2.1 Introduction . . . . . . . . . . . . . . . . . . . . . . . . . . . . . . . . . . . . . . . . . . . . . . . . . . 7 2.2 Results . . . . . . . . . . . . . . . . . . . . . . . . . . . . . . . . . . . . . . . . . . . . . . . . . . . . . . . . . . 8 2.3 Conclusion . . . . . . . . . . . . . . . . . . . . . . . . . . . . . . . . . . . . . . . . . . . . . . . . . . 11
Chapter 6: A Review of the Ivory and Rhino Horn Trades . . . . . . . . . . . . . . . . . . . . . . . . . . . . . . . . . . . . . . . . . . . . . . . . . . . . . . . . . . . . . . . . . 43
6.1 Elephant Population Estimates, Trends, Ivory Quotas and Harvests . . . . . . . . . . . . . . . . . . . . . . 43
_ 6.2 Rhino Horn Trade . . . . . . . . . . . . . . . . . . . . . . . . . . . . . . . . . . . . 49
Chapter 7: A Review of Action Priorities Established for Elephant and Rhino in 1981 . . . . . . . . . . . . . . . . . . . . . . 54 7.1 Action Priorities 1981 . . . . . . . . . . . . . . . . . . . . . . . . . . . . . . 54
Chapter 3: Conservation Priority Ranking of Black Rhino Populations . . . . . . . . . . . . . . . . . . . . . . . . . . . . . . . . . . . . . . . . . . . . 12
3.1 Introduction . . . . . . . . . . . . . . . . . . . . . . . . . . . . . . . . . . . . . . . . . . . . . . . . 12 3.2 Priority Ranking System Used at the
1987 Nyeri Meeting . . . . . . . . . . . . . . . . . . . . . . . . . . . . . . . . . . 12 3.3 Results and Discussion . . . . . . . . . . . . . . . . . . . . . . . . . . . . . . 14
Chapter 8: Action Plan for African Elephant and Rhino Conservation . . . . . . . . . . . . . . . . . . . . . . . . . . . . . . . . . . . . . . . . . 56
8.1 Political Action . . . . . . . . . . . . . . . . . . . . . . . . . . . . . . . . . . . . . . . . . . 56 8.2 Trade . . . . . . . . . . . . . . . . . . . . . . . . . . . . . . . . . . . . . . . . . . . . . . . . . . . . . . . . . . 56 8.3 Field Action . ..*.......................................... 57 8.4 Resource Management . . . . . . . . . . . . . . . . . . . . . . . . . . . . 60
Chapter 4: The Status and Conservation of Elephants in Africa . . . . . . . . . . . . . . . . . . . . . . . . . . . . . . . . . . . . . . . . . . . . . . . . . . . . . . . . . . . . . . 17
4.1 Introduction . . . . . . . ..*...................................... 17 4.2 Summary of Elephant Population
Estimates, May 1987 . . . . . . . . . . . . . . . . . . . . . . . . . . . . . . . . . . 18 4.3 Elephant Populations in West and
Central Africa . . . . . . . . . . . . . . . . . . . . . . . . . . . . . . . . . . . . . . . . . . . . 18 4.4 Elephant Populations in East Africa . . . . . . 21 4.5 Elephant Populations in Southern
Appendix 1: Analysis of Conservation Success . . . . . . . . . . . . . . . . . . 61
Appendix 2: List of Papers Presented at the AERSG Meeting Held in Nyeri, Kenya, May 1987 . . . . . 64
Appendix 3: List of AERSG Members (1984-1987 IUCN Triennium) . . . . . . . . . . . . . . . . . . . . . . . . . . . . . . . . . . . . . . . . . . . . . 65
Appendix 4: Resolutions on Rhino Horn and Ivory
Trade Passed at the 6th Conference of the CITES Parties . . . . . . . . . . . . . . . . . . . . . . . . . . . . . . . . . . . . . . . . . . . . 69
Africa . . . . . . . . . . . . . . . . . . . . . . . . . . . . . . . . . . . . . . . . . . . . . . . . . . . . . . . . . . 22 References . . . . . . . . . . . . . . . . . . . . . . . . . . . . . . . . . . . . . . . . . . . . . . . . . . . . . . . . . . . . . . . . . . . . . . . . . . . . . . . . . 73

The conservation situation surrounding Africa’s elephants and rhinos is evolving very rapidly. This document describes the situation as it was in 1987 in detail, and presents a number of recommended actions. This report has already been used in the formulation of conservation policies for elephants and rhinos in many African countries, and had catalysed increased donor interest and activity on behalf of these species. In view of the rapidly changing situation, IUCN and the other organisations associated with this publication are likely to revise their policies, particularly as they involve the control and regulation of the international trade in ivory.
This publication is produced by IUCN - The World Conservation Union, with the collaboration of the United Nations Environment Programme (UNEP), the World Wide Fund for Nature (WWF), Wildlife Conservation International (WCI), the African Wildlife Foundation (AWF), the Save African Endangered Wildlife Foundation (SAVE), and the African Fund for Endangered Wildlife (AFEW).
c 1990 International Union for Conservation of Nature and Natural Resources
Reproduction of this publication for educational and other non-commercial purposes is authorizedwithout
provided the source is cited and the copyright holder receives a copy of the reproduced material.
permi ssion from the copyrigh .t h .older,
Reproduction for resale or other commercial purposes is prohibited without prior permission of the copyright holder.
ISBN 2-88032-975-2
Published by IUCN, Gland, Switzerland.
Camera-ready copy produced by The Nature Consemtion Bureau 122 Derwent Road, Thatcham RG13 4UP, UK
Printed by Thatcham Printers, Bath Road, Thatcham, UK
Cover photo: Black rhino and calf (Mark Boulton/WWF)

A frica n Elephants and Rhinos
Status Survey and
Conservation Action Plan
Compiled by
D. M. M. Cumming, R. F. Du Toit and S. N. Stuart
IUCN/SSC African Elephant and Rhino Specialist Group

Contents
Page Page
Foreword . . .
. . . . . . . . . . . . . . . . . . . . . . . . . . . . . . . . . . . . . . . . . . . . . . . . . . . . . . . . . . . . . . . . . . . . . . . . . . . . . . . . . . . 111
Acknowledgements . . . . . . . . . . . . . . . . . . . . . . . . . . . . . . . . . . . . . . . . . . . . . . . . . . . . . . . . . . . . . . . . . . . . iv
Chapter 1: Introduction . . . . . . . . . . . . . . . . . . . . . . . . . . . . . . . . . . . . . . . . . . . . . . . . . . . . . . . 1
1.1 The African Elephant . . . . . . . . . . . . . . ..*................. 1 1.2 The African Rhinos . . . . . . . . . . . . . . . . . . . . . . . . . . . . . . . . . . . . 3 1.3 The IUCN/SSC African Elephant and
Rhino Specialist Group . . . . . . . . . . . . . . . . . . . . . . . . . . . . . . 4 1.4 The Structure of the Action Plan . . . . . . . . . . . . . . 6
Chapter 5: Resources for Elephant and Rhino Conservation in Africa . . . . . . . . . . . . . . . . . . . . . . . . . . . . . . . . . . . . . 38
5.1 Manpower . . . . . . . . . . . . . . . . . . . . . . . . . . . . . . . . . . . . . . . . . . . . . . . . . . 38 5.2 Equipment . . . . . . . . . . . . . . . . . . . . . . . . . . . . . . . . . . . . . . . . . . . . . . . . 38 5.3 Funds . . . . . . . . . . . . . . . . . . . . . . . . . . . . . . . . . . . . . . . . . . . . . . . . . . . . . . . . . . 38 5.4 Management and Protection Policies . . . . 42 5.5 Identified Deficiencies . . . . . . . . . . . . . . . . . . . . . . . . . . . . . . 42
Chapter 2: A Review of Numbers of Black and White Rhinos in Africa . . . . . . . . . . . . . . . . . . . . . . . . . . . . . . . . . . . . . . . . . . . . . . . . . 7
2.1 Introduction . . . . . . . . . . . . . . . . . . . . . . . . . . . . . . . . . . . . . . . . . . . . . . . . . . 7 2.2 Results . . . . . . . . . . . . . . . . . . . . . . . . . . . . . . . . . . . . . . . . . . . . . . . . . . . . . . . . . . 8 2.3 Conclusion . . . . . . . . . . . . . . . . . . . . . . . . . . . . . . . . . . . . . . . . . . . . . . . . . . 11
Chapter 6: A Review of the Ivory and Rhino Horn Trades . . . . . . . . . . . . . . . . . . . . . . . . . . . . . . . . . . . . . . . . . . . . . . . . . . . . . . . . . . . . . . . . . 43
6.1 Elephant Population Estimates, Trends, Ivory Quotas and Harvests . . . . . . . . . . . . . . . . . . . . . . 43
_ 6.2 Rhino Horn Trade . . . . . . . . . . . . . . . . . . . . . . . . . . . . . . . . . . . . 49
Chapter 7: A Review of Action Priorities Established for Elephant and Rhino in 1981 . . . . . . . . . . . . . . . . . . . . . . 54 7.1 Action Priorities 1981 . . . . . . . . . . . . . . . . . . . . . . . . . . . . . . 54
Chapter 3: Conservation Priority Ranking of Black Rhino Populations . . . . . . . . . . . . . . . . . . . . . . . . . . . . . . . . . . . . . . . . . . . . 12
3.1 Introduction . . . . . . . . . . . . . . . . . . . . . . . . . . . . . . . . . . . . . . . . . . . . . . . . 12 3.2 Priority Ranking System Used at the
1987 Nyeri Meeting . . . . . . . . . . . . . . . . . . . . . . . . . . . . . . . . . . 12 3.3 Results and Discussion . . . . . . . . . . . . . . . . . . . . . . . . . . . . . . 14
Chapter 8: Action Plan for African Elephant and Rhino Conservation . . . . . . . . . . . . . . . . . . . . . . . . . . . . . . . . . . . . . . . . . 56
8.1 Political Action . . . . . . . . . . . . . . . . . . . . . . . . . . . . . . . . . . . . . . . . . . 56 8.2 Trade . . . . . . . . . . . . . . . . . . . . . . . . . . . . . . . . . . . . . . . . . . . . . . . . . . . . . . . . . . 56 8.3 Field Action . ..*.......................................... 57 8.4 Resource Management . . . . . . . . . . . . . . . . . . . . . . . . . . . . 60
Chapter 4: The Status and Conservation of Elephants in Africa . . . . . . . . . . . . . . . . . . . . . . . . . . . . . . . . . . . . . . . . . . . . . . . . . . . . . . . . . . . . . . 17
4.1 Introduction . . . . . . . ..*...................................... 17 4.2 Summary of Elephant Population
Estimates, May 1987 . . . . . . . . . . . . . . . . . . . . . . . . . . . . . . . . . . 18 4.3 Elephant Populations in West and
Central Africa . . . . . . . . . . . . . . . . . . . . . . . . . . . . . . . . . . . . . . . . . . . . 18 4.4 Elephant Populations in East Africa . . . . . . 21 4.5 Elephant Populations in Southern
Appendix 1: Analysis of Conservation Success . . . . . . . . . . . . . . . . . . 61
Appendix 2: List of Papers Presented at the AERSG Meeting Held in Nyeri, Kenya, May 1987 . . . . . 64
Appendix 3: List of AERSG Members (1984-1987 IUCN Triennium) . . . . . . . . . . . . . . . . . . . . . . . . . . . . . . . . . . . . . . . . . . . . . 65
Appendix 4: Resolutions on Rhino Horn and Ivory
Trade Passed at the 6th Conference of the CITES Parties . . . . . . . . . . . . . . . . . . . . . . . . . . . . . . . . . . . . . . . . . . . . 69
Africa . . . . . . . . . . . . . . . . . . . . . . . . . . . . . . . . . . . . . . . . . . . . . . . . . . . . . . . . . . 22 References . . . . . . . . . . . . . . . . . . . . . . . . . . . . . . . . . . . . . . . . . . . . . . . . . . . . . . . . . . . . . . . . . . . . . . . . . . . . . . . . . 73
Foreword
The African mega-vertebrate fauna, in its richness and diversity, surpasses that of any other continent. It is uniquely African and is a resource of high economic value that can be used for the benefit of the people of the countries in which it occurs. However, such use must be skillfully managed if the resource is to retain its value. It must be recognised that the resource is based on living systems with characteristic biological limitations, that its use is frequently highly charged with emotions, and that its marketability is based on the maintenance of acceptable aesthetic standards.
These conflicting emotions generated around the aesthetic qualities of wildlife and its pragmatic use as a resource are a feature of human societies stretching back into antiquity. Wildlife has been, and remains, the subject of much folklore and art, extending from the stone age to the present age of technology. Hunting for the necessities of life, and more recently for recreation, goes very deep into the history of the human race.
It is these consumptive uses of the elephant and the rhinoceroses that has caused their distributions to become increasingly restricted within the African continent. These species have become symbols of the conservation movement in Africa. The rhinos are becoming increasingly restricted to southern Africa. Most of the white rhinos now occur in South Africa, and Zimbabwe how has nearly half the total population of the black rhinoceros. The production of this action plan by the IUCN/SSC African Elephant and Rhino Specialist Group on the conservation of these three species of large mammal is highly commendable. The information presented in this plan will be used for the protection of these mammals, all of which have become major tourist attractions on the African continent.
These species are being threatened by illegal hunting by poachers, some of which is organised by syndicates outside the African continent. The elephant is treasured for its ivory and the rhinos for their horn. However, of late, the Zimbabwe National Parks anti-poaching units have noticed that the poachers are also removing rhinoceros ears, tails and male sex organs. Information received from apprehended poachers is making it clear that these rhinoceros parts are also used for medicinal purposes. This means that even if rhinos were to be dehorned, they would still be poached for these other parts and derivatives.
It is for this reason that this action plan considers means to curb poaching at the local level and the illegal trade at the international level. The plan considers not only environmental issues but also the international cooperation needed to reduce the illegal trade in ivory and rhino horn. The nations and people who use parts or derivatives of these animals must be encouraged
to use substitutes. For example, those states that use rhino horn for the manufacture of dagger handles can easily be persuaded to use substitutes if international pressure is applied and if the illegal trafficking of the horn is halted.
However, if these species are to survive in the long-term, it is probably also necessary to justify their existence in economic terms. In those countries where their numbers are now very low, economic benefits can be derived by non-consumptive uses of the animals. These animals can generate a lot of revenue if used for game viewing, photographic safaris, and by the film industry. But in those countries in which the elephant is still found in large numbers, carefully controlled recreational hunting could continue to be authorised, if so desired. If these animals are not seen to be accruing benefits to local people on the ground, who bear the social costs of living with the animals, no amount of protection will save them in the long-term if these people decide against their protection and conservation. This is particularly true with e!ephants and rhinos, which are dangerous and can cause severe problems. The people living with these animals have less cause to protect them if they realise no economic or other benefits from them. This action plan produced by wildlife specialists also includes these economic considerations.
It is also necessary to recognise that nature conservation, especially in areas set aside exclusively for this purpose, is a form of land-use dependent upon certain basic criteria. It is worth noting that the long-term success of human endeavours in organised society depends upon the reconciliation of three sets of factors linked in a chain of survival. Reduced to their generalised forms, these are the socio-political, ecological and economic parameters upon which the fabric of society and government ultimately depends. In this context, we should recall that both the socio-politi.cal and the economic links in this chain are forged by man, and can be modified by him. However, the ecological link is based on the laws of nature, which cannot be changed. This action plan considers ways in which the socio- political and economic parameters can be modified in order to promote the conservation of the ecosystems in which the African elephant Loxodonta africana, the black rhinoceros Diceros bicomis, and the white rhinoceros Ceratothetium simum can thrive, thereby ensuring that the laws of nature work in favour of the continued existence of these remarkable species.
W.K. Nduku Director of National Parks and Wildlife Management Zimbabwe
,.. 111

Acknowledgements
Much of this action plan is based on the work done by the members of the IUCN/SSC African Elephant and Rhino Specialist Group (AERSG) at its meeting held in Nyeri, Kenya, 17-20 May 1987. Permission to hold the meeting was kindly granted by the Government of Kenya through the Department of Wildlife Conservation and Management, which also actively participated in the organisation of the meeting. Particular thanks are due to the Department’s then Director and AERSG member, Dr. Perez Olindo. The costs of the meeting were largely met by WWF -- the World Wide Fund for Nature, with additional financial contributions from the African Wildlife Foundation, the African Fund for Endangered Wildlife, and the Save African Endangered Wildlife Foundation. Considerable assistance in arranging the meeting was provided by Dr. Esmond Bradley Martin, Ms. Lucy Vigne, and Mr. Ed Wilson.
Most of this document was drafted by DHMC and RFdT, and SNS was responsible for editing the entire text and preparing it for publication. Mr. Rowan Martin authored section 4.5 and Appendix 1 and Dr. Iain Douglas-Hamilton provided extensive
advice for section 4.4. The document has been extensively reviewed by AERSG members around Africa, in particular the current AERSG Chairman, Dr. David Western. Additional advicecame from FredericBriand, Steve Edwards, JohnHanks, Martin Holdgate, Jeff McNeely, Jeff Sayer, and Jim Thorsell. Without the help of all these people, we would not have been able to complete this document, and we are very grateful for this kind assistance.
Finally, special thanks are needed for the United Nations Environment Programme (UNEP) for supporting this publication, and the World Wide Fund for Nature (WWF) for their continued support of the IUCN Species Survival Commission action planning process.
David H.M. Cumming Raoul F. Du Toit Simon N. Stuart
1v

Chapter 1: Introduction
This action plan addresses the conservation needs of three species of large mammal occurring in Africa: the African elephant Loxodonta mcana; the black rhinoceros Diceros bicomis; and the white &inoceros Ceratothetium simum. All three species are major foci of the conservation movement in Africa, and they also are the subject of much international concern. It has become clear that a coordinated approach is
essential if these species are to be saved from extinction, and effectively managed for the benefit of the people of Africa.
1.1 The African Elephant
The African elephant is the largest of all land mammals, and is a symbol of the African continent. Its only close living relative is the slightly smaller Asian elephant Elephas maximus. Male Africanelephants, when fully grown, have a shoulder height of 3-4 metres and a weight of 5,000 to 6,000 kg. Two subspecies are recognised, the savanna elephant L. a. africana, and the forest elephant L. a. cyclotis. The forest elephant, which lives in the equatorial forests of the central African basin and West Africa, is smaller than the savanna elephant and has slender tusks,
which are generally straight or only slightly curved. The tusks point downwards, rather than forwards as in the savanna elephant. Over large areas of Africa where forests and savannas merge, elephants intermediate between the two subspecies are found. It is now known that this area of hybridisation is very extensive.
Elephants belong to a unique order of mammals, the Proboscidea, of which they form the only surviving family. Remains of the earliest known ancestor of the elephants were found at Lake Moeris, near El Fayyum in Egypt. Moeritherium, as it is named, lived about 25 million years ago and was the same size as a large pig. Several evolutionary lines became extinct, and modern elephants, which appear to have evolved some five million years ago along with the mammoths, are the only survivors. Less than 50,000 years ago mammoths still existed and early man depicted them in cave drawings. The cause of the extinction of the mammoths is still a matter of debate, but climatic change and over-hunting have been implicated, an ominous warning since these are probably the most serious threats to the African elephant today.
The elephant ranges throughout Africa south of the Sahara in almost all habitats from savannas to rain forests, swamps to deserts, and seashores to high mountains. Its range includes
Elephant (Photo: R Dal Belle/WWF)
1

Figure l.la Probable distribution of the African elephant around 1600.
i . i i \
those of most of Africa’s large wild animals and the impact of elephants on habitat has a profound effect on the other species among which it lives. It is only in relatively recent times that its range has become fragmented, with populations being wiped out over large areas.
Elephants have a complex social system with strong maternal bonds based on breeding groups of females and young. Males which live singly or in small groups, have no permanent ties with the females, but may associate with them while feeding as well as breeding. The area over which herds move is dependent on the availability of food and water. Where both are plentiful throughout the year elephants may move over relatively small distances, but elsewhere they may migrate hundreds of kilometres to fmd nourishment.
Unlike the situation with its Asian cousin, n;> indigenous tradition of elephant domestication survives in Africa. Howemr, the popular belief that the African elephant cannot be domesticated is incorrect. Hannibals’s marches across Europe indicate that there must once have been a tradition of domestication. More recently, during the colonial period the Belgians successfully domesticated elephants in north-eastern Zaire, and four of these animals still survive in the Garamba National Park, where they are used as a tourist attraction. There is now a fresh attempt to renew the domestication programme in Garamba.
1.1.1 The decline of the elephant
It is clear from ancient historical writings that the elephant once occurred in North Africa, up to the Mediterranean coast. Today it is extinct throughout this area. The decline of the elephant seems to be linked to three major factors:
The demand for ivory, which has often been at a level that is totally unsustainable.
Desertification, which has clearly been a major cause for the disappearance of thespecies in North Africa and the Sahara, and continues to beleaguer the tiny remaining populations in the Sahel.
I Conflicts between elephants and humans for the use of land. Although this has perhaps been of minor significance through most of history, the rapid growth in human populations in Africa means that large areas of the continent are now permanently unsuitable for elephants.
Although the last of these factors is likely to become the long-term limitation on elephant numbers, there can be no doubt that today, as through most of history, it is the ivory trade that is reducing the population of the species most severely.
The elephant became extinct in North Africa during the European Middle Ages, causing ivory traders to look further afield for supplies. Excessive hunting brought the elephant to
Figure l.lb Distribution of the Africanelephant in 1987 (from Burrill and the brink of extinction in South Africa in the 18th and 19th Douglas-Hamilton 1987). centuries. A similarly unrestricted rush for ivory took place in
2

West Africa, peaking in the late 19th and early 20th centuries, reducing the population to tiny scattered fragments in this part of the continent, from which it has never recovered. Savanna elephants were particular susceptible to hunting, since they lived in more accessible areas.
At the end of the last century, legislation introduced over much of the continent brought the situationmore under control. These measures were greatly helped by a fall in the ivory price and a drop in demand following the first world war. As a result, during the middle part of the 20th century, elephant populations recovered substantially over much of central, eastern and southern Africa, to the extent that in several areas, major culling programmes had to be introduced to prevent serious habitat damage and human-elephant conflicts. All this changed suddenly in the early 1970s when the trade revived in response to world financial instability. Both the demand and the supplies soared and the amount of ivory leaving Africa rose to pre-1914 levels. There has always been a legal ivory trade, resulting from natural mortality, sport-hunting, and control and culling programmes. However, in recent years this has beeninsufficient
to supply the renewed demand for ivory, especially in eastern Asia (the Asian elephant now being much too rare to supply local demand). Most of the ivory now leaving the continent has been taken illegally, and the profits derived from it are not returned to the countries of origin. The illegal ivory trade is
Southern white rhino (Photo: National Parks, Pretoria/WWF)
little more than economic sabotage of some of the world’s poorest countries. The situation is all the more tragic because
a legal and controlled trade could bring great economic benefits to Africa without jeopardising the conservation of the species. Zimbabwe is an example of a country where this balance has been achieved.
The contraction of the elephant’s range in Africa is displayed
in Figures l.la and l.lb.
1.2 The African Rhinos
The black rhinoceros once ranged widely throughout the savannas of Africa, only avoiding the equatorial forest belt and some of the most arid desert regions. The white rhinoceros, by contrast has always been more restricted (at least in historical times), occurring as two isolated subspecies, the southern white rhino Ceratothetium s. simum, restricted to southern Africa, and the northern white rhino C. s. cottoni, confined to a belt north of the tropical forests. Both species are very large animals: the black rhino can measure up to 1.5 m at the shoulder, and can weigh up to 1,400 kg; equivalent figures for the white rhino are 1.75 m and 3,600 kg. This is considerably larger than their three Asian cousins, the great one-horned rhino Rhinoceros unicomis, the Javan rhino R. sondaicus, and the Sumatran rhino Dicerorhinus sumatrensis. Despite their names, both the African species are grey. The name “white” is believed to have arisen from a mistaken translation of the Boer word “wijde” for wide, referring to the broad square lips of the species.
At least seven subspecies of the black rhino have been described, as follows:
Diceros b. bicomis Cape Province, South Africa
D. b. chobiensis Southern Angola, and Chobe area, Botswana
D. b. minor South Africa to Kenya
D. b. michaeli Kenya and Tanzania
D. 6. ladoensis Northern Kenya and Sudan D. b. longipes Central Africa
D. b. brucii Somalia and Ethiopia
The validity of these forms is, however, based on inadequate material, and is still open to question. In this action plan, it has been decided to consider the black rhino as four separate regional units, rather than following the named subspecies. These regional units are the south-western desert rhinos (in Namibia), the animals of south-central Africa (north to central Tanzania), those in East Africa (northern Tanzania and Kenya), and the tiny remnant populations north of the rainforest belt (in
Cameroon, Chad and Central African Republic). The rationale
for adopting this approach is given by Du Toit, Foose and Gumming (1987) and outlined in Chapter 3.
Rhinos and elephants are not closely related. The rhinos (Rhinocerotidae) are one of the three surviving families of the order Perissodactyla (odd-toed ungulates), the others being the horses and asses (Equidae) and the tapirs (Tapiridae). Several species of rhino are known from the fossil record. The lineage of the black rhino dates back 12 million years when Paradiceros mukirii occurred in Kenya and Morocco. Several species of Diceros subsequently occurred in Africa and Europe, with D. bicomis appearing about four to five million years ago. The
lineage of the white rhino is much more recent; the genus Ceratotherium first appeared during the Pliocene, with the earliest records of C. simum dating back three million years.
Both the African rhino species are savanna animals, and generally avoid the forest zones (although the black rhino
3
occurs in mountain forests in parts of East Africa). The black rapidly as Yemeni men began to earn high wages in Saudi rhino is a browser, often associated with denser thickets, whereas Arabia and other oil-rich states. As a result the price of rhino the white rhino is a grazer living more in the open plains. While horn soared, with a 21.fold increase during the 1970s. The the black rhino is generally solitary and hostile when disturbed, reason for the extraordinary declines in the black and northern the white rhino is more social and rather placid. white rhinos is therefore clearly apparent.
The contraction of the ranges of the black and white rhinos is shown in Figures 1.2a, 1.2b, 1.3a and 1.3b.
1.2.1 The decline of the rhinos
The decline of both species of rhino in Africa is mainly due to the excessive demand for the horn. Early European travellers to Africa reported large numbers of both black and white rhinos.
1.3 The IUCN/SSC African Elephant and
However, major declines had already started during the last Rhino Specialist Group century. The black rhino was wiped out through almost all of West Africa during the last century, and since the 1940s there In view of the rapidly deteriorating conservation situation of have been no reports of the species west of Cameroon. The both elephants and rhinos in Africa, the IUCN Species Survival species was also severely reduced throughout southern Africa
century as stricter conservation measures were introduced, but during the last century. Some recovery took place during this
with the increasing demand for rhino horn during the 197Os,
Commission (SSC) established two specialist groups during the
were composedof experts on the conservationand management 197Os, one to cover elephants and one for rhinos. These groups
of these species. The role of the groups was to provide advice to
black rhinos survived in Africa; by 1981 only 10,000 to 15,000
these gains have since been lost in most of the southern African countries. Black rhinos initially declined much more slowly in East Africa, but this situation deteriorated rapidly starting in
survived, and this was further reduced to only about 3,800 in
the early 197Os, and today only small fragmented populations survive. During the late 1960s it was estimated that some 70,000
1987. The white rhino has similarly been greatly reduced. The
southern subspecies was held in high esteem by early European settlers for its meat and for its valuable fat, and was heavily
IUCN, and its member governments and organisations, on the actions needed to conserve elephants and rhinos. This culminated in an important joint meeting of the two groups, held in . Hwange, Zimbabwe, in August 1981, at which conservation priorities were assessed, and recommendations for long-term conservation action were developed. It was at this meeting that the groups were combined to form the existing IUCN/SSC African Elephant and Rhino Specialist Group (AERSG).
The action plan produced at the Hwange meeting was highly regarded as a model in terms of adopting a rational approach to setting priorities for species conservation. However, during the
in Natal and given protection. These have now increased to
exploited. By 1892 it was considered extinct. However, a few years later some were found in the Umfolozi-Hluhluwe region
subsequent years it soon became apparent that it had not been successful in catalysing the action needed to halt the continuing decline in elephant and rhino populations. It was for this reason
remained in the Garamba National Park in Zaire by 1983. This
4,500 animals, and the population has been expanded with the help of many translocations and reintroductions. However, the history of the northern subspecies has been much less satisfactory. Of a population of some 700 animals in Zaire, Sudan, Central African Republic and Uganda in the 197Os, only 12 animals
to develop conservation programmes for elephants and rhinos.
that the AERSG reconvened in Nyeri, Kenya, in May 1987 to consider a more consolidated approach to the problem. This publication is the result of that meeting. Although the publication of this document has been delayed for various reasons, its contents have already been used by a number of organisations
collaborative conservation project, and by 1988 the number had increased to 22.
For many years, there has been a continuous whittling away
last remaining population has been the focus of a major is the formation of a new inter-organisational committee, the African Elephant Conservation Coordinating Group (AECCG), made up of seven organisations which intend to collaborate to
One major new development subsequent to the Nyeri meeting
of rhino populations to provide horn for use in Chinese and allied medical systems. This demand has been responsible for bringing the three Asian species to the verge of extinction, and, as a result of their decline, demand for African horn grew. In the early 1970s there was a dramatic increase in the demand for rhino horn because of a new factor: the increased use of the horn for dagger handles in North Yemen. Most men in the Yemen Arab Republic wear a traditional type of dagger known as a jambia. Rhino horn has been used for many years for the handle of the more expensive jambias, which few could afford. But in the early 197Os, demand for rhino horn jambias rose
implement the elephant component of the action plan: IUCN, WWF, Wildlife Conservation International (WCI), the African Wndlife Foundation (AWF), the World Conservation Monitoring Centre (WCMC), the TRAFFIC Network, and the European Economic Community @EC). The Secretariat of the Convention on International Trade in Endangered Species of Wild Fauna and Flora (CITES) also works in close collaboration with the AECCG. The action plan published here is being used by these and other organisations, and by African governments, to develop the necessary projects and other activities to ensure that implementation actually takes place.
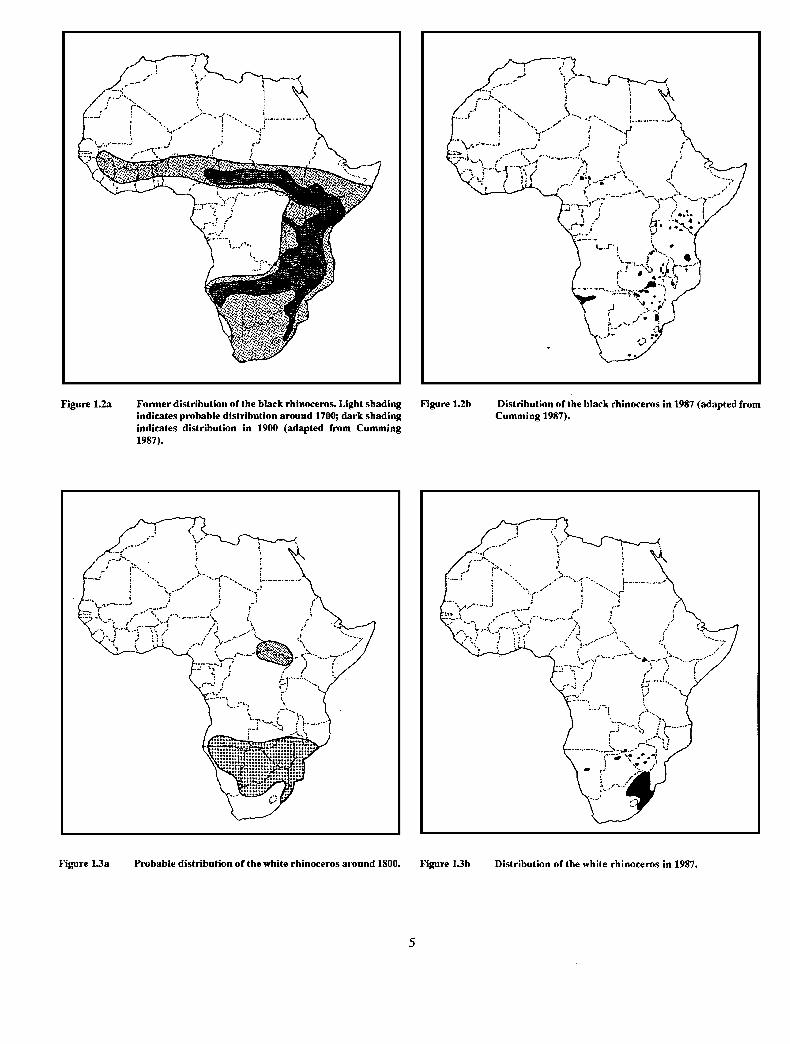
Figure 1.2a Former distribution of the black rhinoceros. Light shading indicates probable distribution around 1700; dark shading indicates distribution in 1900 (adapted from Cumming 1987).
Figure 1.2b Distribution of the black rhinoceros in 1987 (adapted from Cumming 1987).
Figure 13a Probable distribution of the white rhinoceros around 1800. Figure 13b Distribution of the white rhinoceros in 1987.

1.4 The Structure of the Action Plan In addition, four appendices are presented as follows: 1. An analysis of conservation success (based on a model used for
A key aspect of the plan is that it is based on the best available elephants in southern Africa); 2. List of papers presented at the
data. These are reviewed for rhinos in Chapters 2 and 3, and for AERSG Nyeri meeting; 3. List of AERSG members during the
elephants in Chapter 4. Chapter 5 is a review of the resources 1984-1987 IUCN triennium, and a list of invited guests to the
available for elephant and rhino conservation in selected African Nyeri meeting; 4. Resolutions on rhino horn and ivory trade
countries, and Chapter 6 examines the status of the trade in passed at the 6th Conference of the CITES Parties in Ottawa,
ivory and rhino horn. The implementation of the 1981 Hwange July 1987.
action plan is reviewed in Chapter 7. The action plan itself is
presented in Chapter 8, and draws together the information presented in previous chapters to provide a coherent and realistic set of recommendations.
Black rhino (Photo: Peter Jackson)
6

Chapter 2: A Review of Numbers of Black and White Rhinos in Africa
2.1 Introduction 1.
A fundamental part of the conservation of an endangered species is knowing how many exist, where they are and whether the population is increasing, stable or declining. Monitoring populations of rhino in Africa is a key activity of the AERSG 2 . and is carried out mainly through the collation of information provided by members of the group and other contacts. Such information as is available also needs to be criticially reviewed and this was effectively done during plenary sessions at the Nyeri meeting of the AERSG. 3 .
The information under review was derived from questionnaires
Total counts where the population was completely enumerated. This could be achieved in small and often open protected areas and where there were small recently introduced populations.
Estimate based on a rhino survey with the last 2 years. This category included sample surveys of the rhino population in question or attempts at complete enumeration.
sent out towards the end of 1986 to AERSG members, to national parks and wildife agencies and to correspondents in all the countries in Africa which still have rhinos. The questionnaire included sheets which provided the information on numbers
and distribution from earlier surveys and respondents were 4 ’ asked to correct and update this information where possible.
Comprehensive contributions were made by some members at the meeting, particularly through the detailed data on South Africa and Namibia submitted by Martin Brooks. The data for each population were critically examined and the reliability of
Estimate based on a rhino survey carried out more than 2 years ago or on a recent ( < 2 years ago) non-specific survey. The term “non-specific survey” referred to sample surveys carried out for other species, such as elephant, and in which counts of rhinos had been included.
Informed guess. This included estimates based on visits, ground reconnaisance and reports knowledge of the area in question.
from persons with a
Trends in populations were assessed on the basis of survey
the estimates was assessed. Four categories of census reliability figures available or where these were absent on the basis of
were used: information on poaching in the region or the area.
Northern white rhino (Photo: H. de Saeger/WWF)
7
2.2 Results
2.2.1 Numbers
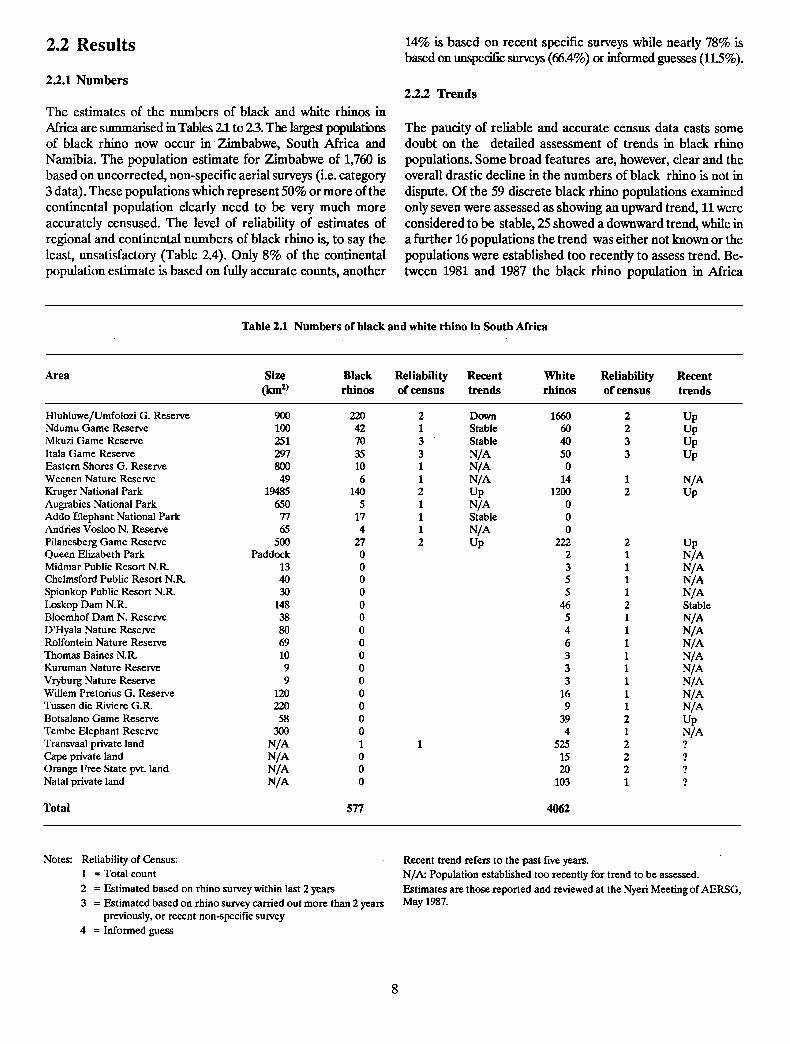
The estimates of the numbers of black and white rhinos in Africa are summarised in Tables 21 to 23. The largest populations of black rhino now occur in Zimbabwe, South Africa and Namibia. The population estimate for Zimbabwe of 1,760 is based on uncorrected, non-specific aerial surveys (i.e. category 3 data). These populations which represent 50% or more of the continental population clearly need to be very much more accurately censused. The level of reliability of estimates of regional and continental numbers of black rhino is, to say the least, unsatisfactory (Table 2.4). Only 8% of the continental population estimate is based on fully accurate counts, another
14% is based on recent specific surveys while nearly 78% is based on unsmc surveys (66.4%) or informed guesses (11.5%).
22.2 Trends
The paucity of reliable and accurate census data casts some doubt on the detailed assessment of trends in black rhino populations. Some broad features are, however, clear and the overall drastic decline in the numbers of black rhino is not in dispute. Of the 59 discrete black rhino populations examined only seven were assessed as showing an upward trend, 11 were considered to be stable, 25 showed a downward trend, while in a further 16 populations the trend was either not known or the populations were established too recently to assess trend. Be- tween 1981 and 1987 the black rhino population in Africa
Table 2.1 Numbers of black and white rhino in South Africa
Area Size (km2’
Black Reliability Recent White Reliability Recent rhinos of census trends rhinos ’ of census trends
Hluhluwe/Umfolozi G. Reserve 900 220 Ndumu Game Reserve 100 42 Mkuzi Game Reserve 251 70 Itala Game Reserve 297 35 Eastern Shores G. Reserve 800 10
Weenen Nature Reserve 49 6 Kruger National Park 19485 140 Augrabies National Park 650 5 Addo Elephant National Park 77 17 Andries Vosloo N. Reserve 65 4
Pilanesberg Game Reserve 500 27 Queen Elizabeth Park Paddock 0 Midmar Public Resort N.R 13 0 Chelmsford Public Resort N.R 40 0 Spionkop Public Resort N.R 30 0 Loskop Dam N.R 148 0
Bloemhof Dam N. Reserve 38 0 D’Hyala Nature Reserve 80 0 Rolfontein Nature Reserve 69 0 Thomas Baines N.R 10 0 Kuruman Nature Reserve 9 0 Vryburg Nature Reserve 9 0 Willem Pretorius G. Reserve 120 0 Tussen die Riviere G.R 220 0 Botsalano Game Reserve 58 0 Tembe Elephant Reserve 300 0 Transvaal private land N/A 1 Cape private land N/A 0 Orange Free State pvt. land NIA 0 Natal private land N/A 0
2 Down 1660 2 UP 1 Stable 60 2 UP 3 * Stable 40 3 UP 3 N/A SO 3 UP 1 N/A 0
1 N/A 14 1 N/A 2 UP 1200 2 UP 1 N/A 0 1 Stable 0 1 N/A 0
2 UP 222 2 UP 2 1 N/A 3 1 N/A 5 1 NIA 5 1 N/A
46 2 Stable
5 1 N/A 4 1 N/A 6 1 N/A 3 1 N/A 3 1 N/A 3 1 NIA
16 1 N/A 9 1 N/A
39 2 UP 4 1 N/A
525 2 ? 15 2 ? 20 2 ?
103 1 ?
Total 577 4062
Notes: Reliability of Census: Recent trend refers to the past five years. 1 = Total count N/A: Population established too recently for trend to be assessed. 2 = Estimated based on rhino survey within last 2 years Estimates are those reported and reviewed at the Nyeri Meeting of AERSG, 3 = Estimated based on rhino survey carried out more than 2 years May 1987.
previously, or recent non-specific survey 4 = Informed guess

Table 2.2 Numbers of black and white rhinos in southern Africa (other than South Africa)
Area Size Black Reliability Recent White Reliability Recent
(km2) rhinos of census trends rhinos of census trends
Angola No data 0
Botswana
Moremi and Chobe areas
Malawi
Kasungu National Park Mwabvi Game Reserve
Total
15380
2316 340
cl0 ? 100-150 4 ?
20 5
Stable ?
25
0 0
0
Mozambique v.low nbr Down 0 Recently extinct
Namibia
Etosha National Park Damaraland Kaokoland Waterberg National Park Private land
Total
22270 13000 3500
400
N/A
350 5-8
85-100 0 0
440-458
Stable Stable
UP
0 0 0
28 35
63
2 UP 2 Down?
Swaziland 60-100 4 Down?
Zambia
Kafue National Park Mweru-Wantipa National Park Luangwa South N.P. Chindini Hills GMA Lukusuzi National Park Lumimba GMA Luano/W. Petauke GMAs Livingstone Game Park
Total
22400 3134 9050
? 2720 4500
13000 10
20 5
50 >6
5 >lO
10 0
4 4 3 3 4 4 4
3 3 3 3 1 1
Down ?
Stable? Down Down Down Down
Down
Zimbabwe
Zambezi Valley Sebungwe Region Hwange/Matetsi Gonarezhou National Park Matopos National Park Private ranches Lake Kyle Recreation Park Lake McIlwaine Rec. Park Ngamo/Sikumi Forest Land Cecil Kop Reserve
Total
11000 5000
18400
3900 432
N/A 90 61
930
>106
750 650
>260 75 5
14 0 0 0 0
> 1754
Down Stable/Up Stable/Up
Down
N/A N/A
0 0
110 0
28
26 30
8 4 2
?
Stable Stable Stable Stable
N/A N/A
208
Notes: As for Table 2.1

Table 23 Numbers of black and white rhinos in West, Central and East Africa
Area Size Black Reliability .Recent * White Reliability Recent (km21 rhinos of census trends rhinos of census trends
Cameroon/Chad
Central African Republic
Ethiopia/Somalia
Kenya
Amboseli N.P. and surrounds Nairobi National Park Aberdare National Park Masai Mara National Reserve Meru National Park Tsavo National Park Nakuru National Park Marsabit N.R Tana River Ngeng Valley North Horr Nguruman. Escarpment Laikipia Ranch Lewa Downs Ranch 01 Jogi Ranch Solio Ranch Mount Kenya National Park
Total
Rwanda
Akagera National Park 2500
Sudan
Badingeru G.R
Tanzania
Selous Game Reserve 5mo Lake Manyara National Park 320 Ngorongoro Conservation Area 8288 Ruaha N.P./Rungwa G.R 27216 Serengeti N.P./Maswa G.R 14763 Rubondo National Park 457
Total
Zaire Garamba National park
800 117 766
1510 870
20200 140 140
N/A N/A N/A N/A
350 20
52 700
moo
4900
30
10
?
10 >32
60 19 >5 150
2 5 6
18 3 5
47 11 7
91 SO
> 521
15
3
200 5
20-30 10
cl0 20-30
265-28s
0
4
4
1 2 4 1 3 4 1 4 3 2 3 3 1 1 1 1 4
4
1
3 4 3 4 4 4
Down 0
0
Stable Stable ? Down Down DoWlI
N/A DoWII DoWn
DoWlI DoWfl Stable/Up
N/A N/A UP ?
0 0 0 0 6 0 0 0 0 0 0 0 0 1 0
40 0
47
Stable?
DoWlI DoWlI Down DoWlI DCWII Stable?
0
0
0 0 0 0 0 0
0
22 1 UP
0
1 Stable
1 N/A
1 UP
Continental totals (Tables 2.1-23) c. 3800 4568-4658
Notes: As in Table 2.1
10

Table 2.4 Numbers of black rhino in each region falling within each category of census reliability (see text for categories of reliability).
Reliability of census data
Region 1 2 3 4 Total %
South Africa 85 387 105 0 577 15.3 Rest of Southern Africa 19 108 2161 65 2353 62.2 West, Central and East Africa 190 SO 244 370 854 22.5
Total 294 545 2510 435 3784 Percentage 7.7 14.4 66.4 11.5 - 100
Table 2.5 Regional declines in black rhino populations between 1981 (from AERSG Hwange meeting) and 1987 (from AERSG Nyeri meeting).
Numbers of black rhino
Region 1981 1987
South Africa 625 577
Rest of Southern Africa 5,055 2,353
West, Central and East Africa 7,073 854
Total 12,753 3,784
% decline
7.7
53.5
87.9
703
Table 2.6 The size distributions of existing black rhino populations
in three regions of Africa.
Numbers of populations Cumulative
Population South Rest of W, C & E Totals % %
Size Africa S Africa Africa
< 10 10-25 26-50 51-100 101-200 201-400 > 400
Totals 12 21 27 60 100.0
8 4 1 2 2 3 1*
23 38.3 .38.3 16 26.7 65.0 6 10.0 75.0 5 8.3 83.3 5 8.3 91.6 4 6.7 98.3 1 1.7 100.0
declined by some 70% with the greatest declines (88%) occurring in the West, Central and East African region (Table 2.5). In 1981 the black rhino population was estimated to be some three times greater than the white rhino population. By mid 1987 there were fewer black rhino in Africa than white rhino. In contrast to black rhino, the southern white rhino populations have continued to show clear upward trends in all but a few instances. The white rhino population of South Africa has increased from an estimated 2,500 in 1981 to 4,062 in 1987. Numbers in Botswana, Namibia, Swaziland and Zimbabwe have increased while the species has become extinct for the second time in Mozambique and some of the animals in the Livingstone Game Park in Zambia have been killed. The entire southern white rhino population in Africa was estimated to number 4,560 (which includes 40 animals on Solio Ranch in Kenya) as compared with an estimate of 2,861 animals in 1981 - an increase of 59% or 8% per annum.
The northern white rhino has not fared so well. By 1983 it was clear that the subspecies was on the brink of extinction in the wild. The Garamba population had dropped to only 12 animals and there wasp0 evidence of survivors in the southern Sudan. The decline of the of the once large population in the Garamba National Park was arrested in 1984 has now increased to 22 during the last four years.
223 Population sizes
The rapid decline in numbers of black rhino has been accompa- nied by an equally alarming fragmentation into small popula- tions of dubious viablity. Some 75% of the 60 discrete popula- tions reviewed (Tables 2.1 to 2.6) comprised less than 50 animals (Table 2.6). Only one population comprises more than 400 animals. On the basis of the criteria outlined by Du Toit, Foose and Cumming (1987) none of the countries in Africa now carries a Minimum Viable Population (MVP) of 2,000 animals and only the southern central population (Natal to Southern Tanzania) exceeds this level. These data have impor- tant implications for the management of rhino populations in Africa apart from the immediate problem of protection.
2.3 Conclusion
Although the broad trend of major declines in black rhino populations and encouraging population growth of the south- ern white rhino are clear, the information on numbers for most populations of black rhinos remains sketchy and out of date. This situation must be corrected if sound decisions are to be taken on conservation action for the remaining wild rhino populations.
(* The Sebungwe region population of 650 in Zimbabwe (Table 2.2) comprises three nowprobably discrete populations: Matusadona N.P. - 150; Chete Safari Area - 150; Chizarira N.P./Chirisa S.A. - 350.)
11
Chapter 3: Conservation Priority Ranking of Black Rhino Populations
3.1 Introduction
The review of black rhino population numbers and trends (Chapter 2) revealed that only seven of the 59 populations examined had shown an upward trend. The* remaining 52 populations were either stable (ll), declining (25) or their status was unknown (8). A further 8 populations had been es- tablished too recently to assess their trend. Given the alarming decline in black rhino over much of their range (Chapter 2)and
the limited resources available to combat the problem (Chap- ter 5) it is clearly desirable, if not necessary, to define priorities for conservation action. Setting such priorities is complicated by the range of scientific, aesthetic and practical considerations that impinge upon and influence individual or group decisions. Consensus within a diverse group, such as the AERSG, can be greatly facilitated by using a structured framework of questions and scores to establish priorities for conservation action in the field. The initial system for ranking rhino and elephant popula- tions stimulated by Parker’s (1984) presentation and used so successfully at the 1981 Hwange meeting (Cumming and Jackson, 1984) had a number of shortcomings. Questions about conser- vation status of areas and their rhino populations were not always answered consistently between countries or at different times. The questions and scores on economic and national factors affecting populations and areas faced similar difficulties and the three-dimensional array could not easily be used during a meeting without a computer. Many of these problems were highlighted at the Luangwa AERSG meeting in July 1986 when the previous scores, and attempts to revise them, could be examined with the value of hindsight. The Hwange system was successfully modified to examine priorites for protected area
management at the 1984 Annual Ecologist’s Meeting of the Branch of Terrestrial Ecology in the Zimbabwe Department of National Parks and Wildlife Management. A four-dimensional structure was later outlined by Cumming (1984). The system was further modified and improved by Bell and Martin (1987), again primarily to establish priorities for protected areas or po- tential protected areas. The system devised by Bell and Martin (1987) was not easily used for rhino populations in a workshop with limited time and imformation. This was apparent at the Luangwa AERSG meeting where a much simpler system based
largely on population sizes was eventually used. Because of these various difficulties with previous scoring and ranking sys-
tems, R.B. Martin developed a revised system for the Nyeri meeting which aimed to:
1. Emphasise scores of the more objectively measured para- meters such as population size, financial expenditures and resources of manpower and equipment.
2. Simplify the choices in the more subjective areas of political
climate, law enforcement, and civil security.
3. Introduce more explicit weighting factors for positive and negative influences on conservation effectiveness.
An initial attempt to apply this system to rhino at the Nyeri meeting foundered because for many areas the requisite financial information was not available, it took too long to score each population and a consensus could not be reached on some of the assumptions in the system. The assumption that for conservation to be successful a minimum level of funding was necessarywas the major point of controversy. In the light of the debate which ensued in trying to apply the scoring and ranking procedure, coupled with the constraints of time, a simpler approach was adopted at the meeting (see below). The system
developed by Martin was applied successfully to some elephant populations in southern and eastern Africa by the southern African working group (see Chapter 4). It is acknowledged that composite indices of this sort inevitably contain an element of subjectivity that should not be obscured behind the impression of numerical precision. However, the purposes of calculating and using such indices is to introduce rational, dispassionate thinking into the process of setting priorities and to reduce arbitrary, subjective elements as much as possible. A primary function of such excercises is to make the rationale for choices explicit and so aid in reaching consensus about priorities for conservation action.
3.2 Priority Ranking System Used at the 1987 Nyeri Meeting
The major basis for ranking black rhino populations in order of priority was a score for biological importance which considered present and potential population size, genetic rarity, and diver- sity of the ecosystem occupied by the population in question. Subsidiary considerations involved very subjective evaluations of the likelihood of conservation action being successful and the need for funding or support.
3.2.1. Biological importance
The scoring for biological importance was based on three criteria, namely, population size, genetic rarity, and diversity of
the ecosystem holding the population in question.
i. Population size Both the current and the potential population size in each area were considered and combined into a single index. It was considered desirable to include a weighting for those large
protected areas which might presently have very low popula-
12

Score
80
60
ASSUMPTIONS
N e” 500 for evolutio;lary potential N 50 for short term fitness N:/i ratio - 0.25
I I I I I I I I I I I I I I I I I I I 1 100 200 300 400 500 1000 1500 2000
Population numbers (rhino*)
Figure 3.1 A population score curve to relate biological importance scores to population size.
* For elephant, numbers are multiplied by 10
tions but which without poaching could carry large populations of rhino. To establish the potential population size, the area available for rhinos was mutiplied by a density of 0.33 rhino/ km.2 except in arid zones where a density of 0.25 rhino/km2 was used. A density of 0.2 rhino/km2 was used for Damaraland and the Kaokoveld in Namibia. Scores for present and potential population size were read from a population score curve (Fig. 3.1), summed and divided by 4, that is:
present population scorn + potential population score
4
The population score curve is based on the simplest curve to reach an asymptote of 100 at a population size of 2,000 starting at a score of 1 for a population of 1. The figure of 2,000 (N) is
based on the assumption of a minimum effective population size (N,) of 500, with an N,/N ratio of 0.25, for long term evolutionary potential. The curve is described by:
Population scoye = 2,9&J x (I- e._O.~J~)
where n = population size.
ii. Genetic rarity In keeping with the results of the rhino workshop held in Cin- cinnati in October 1986 (Du Toit, Foose and Cumming, 1987), and until more is known about the genetic and ecological differences within the species, an interim classification of four black rhino ecotypes or “subspecies” conservation units was recognized:

a. The south-western populations in Namibia and the Cape Province of South Africa (genetic rarity score = 12);
b. The southern-central populations extending from Natal through to Zimbabwe, Zambia and into southern Tanzania (genetic rarity score = 3);
c. The eastern populations in Kenya and northern Tanzania
(genetic rarity score = 9);
d. The northern and western populations extending from the horn of Africa to the Central African Republic and Cameroon (genetic rarity score = 9).
iii: Ecosystem diversity A rough evaluation was made of the combination of other
faunal and floral features of each area that added to its overall conservation importance. Scores ranged from 10 points for rare and diverse ecosystems to 2 points for common ecosystems of limited diversity. The scores awarded to each population and its area for population size, genetic rarity and ecosystem diversity were added to derive a score for biological importance (Table
3 9 . .
32.2. Success probability of conservation measures
Recent trends in the rhino populations, available knowledge of poaching pressures, and the commitment and operational efficiency of the responsible wildlife agencies were used by the AERSG meeting at Nyeri to assess the likelihood that addi- tional assistance from external agencies would be effective in conserving rhinos in each area. The populations were catego- rized according to the probability (low, moderate or high) of maintaining the populations at current or higher levels through the provision of funds or other support. The category into which
a population was placed was based on information available to
the working group and to plenary sessions at the Nyeri meeting.
3.23. Requirements for external assistance
Each area was further assessed according to the actual require-
ment for external assistance, taking into account the poaching pressures and capabilities of the responsible wildlife agencies to protect the rhinos with their current resources. Again these were simply rated as high, moderate or low requirements.
3.3 Results and discussion
The scores for each of the 38 populations examined are shown in Table 3.1. The final priority ranking of populations is shown in Fig. 3.2, with biological importance on the vertical axis, and the areas grouped into three columns according to anticipated effectiveness of funding. The data contained in Table 3.1 and particulary in Fig. 3.2 provided the basis for examining priori- ties for field action for black rhino populations. The priorities finally agreed upon at the Nyeri meeting (Chapter 8) repre- sented a compromise between the priority positions reflected in Fig. 3.2 and additional considerations which emerged in plenary discussion. The apparent discrepancies between scores and po- sitions in Fig. 3.2 and the final priorities in the action plan
(Chapter 8) reflect the way in which the AERSG has used its scoring systems. The systems for scoring and ranking popula- tions do not provide a magic touchstone for arriving at priori- ties. The systems do, however, provide a framework on which which to base rational discussions and reach a sensible ordering of priorities for conservation action which is likely to be more
widely accepted.
Black Rhino (Mark Boulton/ICCE/VVWF)
14

Table 3.1 Priority ranking scores for black rhino populations: AERSG Nyeri meeting, May 1987
Black rhino population Population size Biological Importance Scores Total Rating for:
score (km2) Present Potential Present Potent. Pop Score Genetic Ecosyst Prob. External
pop.(A) pop.(B) (A+ B/4) Rarity Divers. success assistance
Etosha National Park 22,270 350 5,567 65 100 41.25 12 6 59.25 2 0 Zambezi Valley (Zimbabwe) 13,000 750 4,290 85 100 46.25 3 8 57.25 1 2 Sebungwe complex 10,000 600 3,300 78 100 44.5 3 6 53.5 1 1 Tsavo National Park 20,200 150 5,050 40 100 3s 9 6 SO 1 2 Damaraland/Kaokoveld 70,OuO 90 14,000 24 100 31 12 10 53 1 1 Chirisa S.A./Chizarira N.P. 3,600 350 1,188 65 9s 40 3 6 49 2 1 Hwange National Park 14,000 300 4,620 60 100 40 3 6 49 2 1 Cameroon/Chad WOO 30 1,650 15 98 28.25 9 9 46.25 0 2 Selous Game Reserve 55,000 200 18,150 SO 100 37.5 3 6 46.5 0 2 Kruger National Park 19,485 140 6,430 38 100 34.5 3 6 43.5 2 0 Ngorongoro Conservation Area 8,300 25 2,739 10 100 27.5 9 6 42.5 0 1 Bouba-Njida National Park 2,200 25 726 10 84 23.5 12 6 41.5 1 2 Luangwa Valley complex 16,600 7s 5,478 20 100 30 3 6 39 1 2 Masai Mara National Park 1310 19 498 6 90 24 9 6 39 1 1 Gonarezhou National Park WOO 7s 1,650 20 98 29.5 3 6 38.5 1 2 Kafue National Park 22,400 20 7,392 7 100 26.75 3 8 37.7s 0 2 Matusadona National Park 1,407 150 464 40 75 28.7s 3 6 37.7s 2 1 Umfolozi/Hluhluwe complex 900 220 297 53 61 28.5 3 6 37.5 2 0 Aberdares National Park 700 60 231 17 55 18 9 8 3s 1 1 Mount Kenya National Park 700 40 231 14 55 17.25 9 8 34.25 1 0 Matetsi Safari Area 4,400 12 1,452 3 97 25 3 4 32 2 0 Akagera National Park 2300 15 825 4 87 22.75 3 6 31.7s 0 2 Chete Safari Area 810 150 267 40 58 24.5 3 4 31.5 1 1 Kasungu National Park 2,300 20 759 7 86 23.25 3 4 30.25 1 1 Augrabies National Park 650 5 162 1 53 13.5 12 4 29.5 2 0 Meru National Park 870 5 287 1 60 15X 9 4 28.25 1 2 Amboseli N.P. and surrounds 400 11 132 3 33 9 9 6 24 1 1 Laikipia Ranch 350 47 11s 15 27 10.5 9 4 23.5 2 1 Solio Ranch 62 91 20 24 18 10.5 9 4 23.5 2 0 Addo National Park 80 17 26 6 28 8.5 9 4 21.5 2 0 Rubondo Game Reserve 460 25 151 10 39 12.2S 3 6 21.25 1 1 Eastern Shores Game Reserve 800 10 264 3 SO 13.25 3 4 20.25 1 1 Nairobi National Park 120 40 39 14 14 7 9 4 20 2 0 Pilanesberg National Park 500 27 165 7 41 12 3 5 20 2 0 Mkuzi Game Reserve 251 70 82 19 23 10.5 3 6 19.5 2 0 Nakuru National Park 140 20 46 S 9 3.5 9 6 18.5 2 1 Itala Game Reserve 297 3s 98 10 25 8.75 3 6 17.7s 2 0 Manyara National Park 320 5 105 1 26 6.75 3 6 15.75 0 2 Ndumu Game Reserve 100 42 33 13 10 5.75 3 6 14.7s 2 0
15

60
50
40
30
20
10
Selous (47) Cameroon/Chad (46)
Ngorongom (43)
Kafue (38)
Akagera (32)
Manyara (16)
Zambezi Valley (57)
Sebungwe (54) Kizokoveld (53)
Tsavo (50)
Bouba-Njida (42)
Gonarezhou/Luangwa/ Masai Mara (39)
Aberdam (35) Mt Kenya (34)
Chete (32)
Kmungu (30)
Meru (28)
Amboseli (24)
Rubondo (21) Eastern Shores (20)
Etosha (59)
Chirisa/Chizm*m/?7wange
(49)
Kruger (44)
Matusadona (38) Hluhluwe/Umfolozi (38)
Matetsi (32)
Augrabies Falls (30)
Laikipia/SoIio (24)
Addo (22)
Nairobi/Mkuzi/ Pilanesberg (20) Nakuru (19) Itala (18)
Ndumu (15)
0 .Low
1 Moderate
Success Rating
2 High
Figure 3.2 Priority ranking scores and positions for black rhino populations. Scores for biological importance (see text and Table 3.1) are shown on the vertical axis. Populations are further arranged into three columns on the basis of t.he likelihood (low, moderate or
high) of support being effective. Populations with a high or immediate requirement for assistance are shown in bold print, those
.with a moderate requirement in italics, and those with no immediate requirement in normal script.
16

Chapter 4: The Status and Conservation of Elephants in Africa
4.1. Introduction
A major responsibility of the former African Elephant Specialist Group and subsequently of the AERSG has been to attempt to monitor the numbers and,distribution of elephants in Africa. A full review of elephant numbers was undertaken at the 1981 meeting in Hwange (Cumming and Jackson, 1984) and R.B. Martin carried out a survey on behalf of CITES in 1985. The AERSG data base on elephants which comprises reports from members and responses to questionnaire surveys has been maintained by Dr. I. Douglas-Hamilton in Nairobi (see Pachyderm No. 8). In a recent attempt to make fuller use of this data base Burrill and Douglas-Hamilton (1987) used the UNEP/ GRID system in Nairobi to update the range maps and population estimates for elephant and to explore the links between a range of variables and elephant numbers and trends. As in the case of rhino, a questionnaire survey was circulated by the AERSG prior to the Nyeri meeting. Responses to the questionnaire, the expertise available at the Nyeri meeting, and the preliminary results from the GRID project allowed a full and critical review of the current information on elephant numbers and distribution.
Three regional working groups of the AERSG (southern, eastern, and west and central Africa) examined the distribution maps and data contained in the UNEP/GRID data base being prepared by A. Burrill and I. Douglas-Hamilton. These data wereused, together with the most recent AERSG questionnaire returns on elephant populations, to produce estimates, of varying degrees of accuracy, of the numbers and distribution of elephants in each region and to consider regional conservation
strategies for the species. The main purpose of preparing regional conservation strategies
for elephant is to attempt to define now, rather than later, those priority or baseline populations necessary for the long term conservation of the species in a full range of ecosystems in Africa (Parker, 1984). A regional framework seems more appropriate than a continental framework. The regions have different problems and administrative and legal structures, and of equal importance are the differing traditions in approaches to the management of protected areas. A common formula for tackling the elephant conservation problems of the continent is unlikely to be widely acceptable or applicable at present. The variety of approaches reflected in the regional reports is thus probably more useful. The information and expertise available

from southern Africa allowed the analysis of conservation priorities to be more fully developed for this region than for eastern, or central and west Africa. The data base and analysis of conservation priorities for southern Africa nevertheless needs further development and it is hoped that it will be possible to develop the analysis for other regions to a similar level.
A summary of the numbers of elephant reported for each country is provided in Section 4.2 and the reports from the regional working groups in Sections 4.3 to 4.5.
4.2 Summary of Elephant Population Estimates, May 1987
The estimates of the numbers of elephants in each country resulting from the reviews of elephant numbers by the regional working groups are summarised in Table 4.1. In many instances the basis for these estimates is extremely poor and if anything there has been a deterioration since the 1981 review in the availability of good recent aerial survey data. The only major surveys of large areas since then have been the work on forest elephant numbers in Gabon by R. Barnes and the censuses in Selous Game Reserve (Tanzania) and the Central African Republic by I. Douglas-Hamilton. Surveys in some southern African countries have continued on a regular annual basis and there have been some recent surveys of small populations in West Africa.
4.3 Elephant Populations in West and Central Africa
43.1 The problem
West and Central Africa present two quite different facets of the elephant problem, the first region containing a highly fragmented scatter of small, isolated populations, and the second a virtually undocumented spread of elephants through the lowland rainforest, where they are very difficult to count but where the area of potentially suitable habitat extends for thousands of square kilometres.
Both subspecies of African elephant, Loxodonta africana africana and L. a. cyclotis, are present in the forests, with their distribution being less governed by vegetation types than has previously been supposed.
It is apparent that elephant numbers are declining in many areas. However, in what is numerically the most important area (the lowland rainforests of Cameroon, Gabon, the Congo, Zaire and the Central African Republic) we do not know enough to be confident either of overall numbers, or of their trends. False assumptions about elephant densities in the lowland
Table 4.1 Summary of the estimates of numbers of elephants in African countries. It should be note that many of these figures are no more than first order of magnitude guesses, especially in West and Central Africa.
West Africa
Benin 2,100 Burkina Faso 3,900 Ghana 1,100 Guinea 300 Guinea-Bissau 20 Ivory Coast 3,300 Liberia 650 Mali 600 Mauritania 20 Niger 800 Nigeria 3,100 Senegal 50 Sierra Leone 250 Togo 100 Subtotal U&290 (2%)
Central Africa
Cameroon 21,200 Central African Rep. 19,000 Chad 3,100 Congo 61,000 Equatorial Guinea 500 Gabon 76,000 Zaire 195,000 Subtotal 375,800 (49%)
East Africa
Ethiopia Kenya Rwanda Somalia Sudan Tanzania Uganda Subtotal
6,650 35,ooo
70
6,ooo 40,ooo
100,000 3,000
190,720 (25%)
Southern Africa Angola Botswana Malawi Mozambique Namibia South Africa Zambia Zimbabwe Subtotal
< 12,400 51,000
2,400 18,600 5WO 8,200
41,000 43,000
181,600 (24%)
Continental Total 764410
rainforests could lead to errors in the estimation of the continental elephant population of the order of 20%.
In the dry savanna areas of West Africa, increasing human population pressure and declining natural productivity (due to a drastic reduction in rainfall) over the last two decades, have largely confined the remaining elephants to the isolated pockets
18

of national parks and other reserves. Even within those areas, high densities are rarely attained. The low densities are still sufficiently attractive to ivory hunters to have resulted in a relatively intensive hunting pressure in recent years, thereby making it possible that many local (and also national) populations will become extinct within the near future.
Conservation, in a conventional sense, is only now starting to take root in West Africa, and only in a few of the countries is there a networkof well-managed protected areas. The majority of the countries’ conservation agencies are under-funded and consequently suffer from organisational deficiencies. Elephants are thus hunted, and ivory traded, often with impunity. There have been few attempts made to base conservation actions on the detailed knowledge, economic interests and potential goodwill of the rural people. In at least one area, a healthy elephant population is sustained through the tolerance of the local people; in other areas, traditional hunters’ associations are able and willing to participate in wildlife management. If government conservation agencies are to work more effectively in West Africa, they will need considerable injections of external support, and in some cases might have to reconsider their basic objectives and modes of operation.
The importance of the Central African countries to elephant conservation rests in particular on the integrity of the vast area of lowland rainforest, mainly in the Zaire River basin. Large expanses, particularly in Gabon and the Congo, remain sparsely populated by humans and relatively unexploited, and consequently access by hunters is hindered; while in this state, these areas c<-;ulcj co:astitute reasonably secure refuges for perhaps one- fiff-‘fm of Africa% elephants. But changing national economies ifrd&ate potential threats in the near future. In Zaire, the X”Ql1,1 e;; c, of ivory exports and first-hand accounts of poaching su%gest ihat the elephants in its 1 million km* of rainforest are aire& being extensively poached.
ThE savanna areas of Central Africa (in northern Zaire, the Central African Republic and southern Chad), where elephants are relatively accessible and law enforcement is weak, have witnessed, over the last five years, as rapid a decline in these populations as anywhere on the continent. Conservation action to maintain vital populations in these areas has been initiated, and must be continued and strengthened if long-term success is to be achieved.
The volume of ivory being traded and worked locally, both legally and illegally, remains a matter of extreme concern; statistics are few and law enforcement is weak.
4X Population estimates
The scanty demographic information that is available was reviewed to estimate the sizes of the elephant populations remaining in the West and Central African countries. Most of the estimates (presented in Table 4.1) should be regarded as little more than guesses made in a systematic way. For each country, the order of magnitude estimate is probably the most valid assessment that can be presented with current knowledge,
19
Table 4.2 Estimated elephant densities in Zaire.
Area km2 Estimated Total density elephants
Lowland Forestr
Salonga N.P. 36,000 Kahuzi-Biega N.P. 6,600 Maiko N.P. 10,000 Rest of forest range 947 400
Northern and eastern savanna mosaic:
0.4 14,400 0.3 1,900 0.2 2,000 0.1 94,740
Garamba N.P. Virunga N.P. Remaining range
Southern vegetation mosaic:
4,900 recent survey 4,400 8,090 recent survey 750
396,110 0.1 39,611
Southern range 373,700 0.1 37,370
Total elephants 195,000
but the attempt has been made to derivemore precise (although not necessarily more accurate) country estimates so that regional populations can be totalled. These figures constitute interim estimates, pending more sophisticated population modelling exercises that will be carried out by R. Barnes, I. Douglas- Hamilton and A. Burr-ill.
The 1981 estimates were produced at the joint meeting of the then separate IUCN/SSC African Elephant and African Rhino Specialist Groups, at Hwange, Zimbabwe. Where these estimates differ considerably from the 1987 estimates (e.g. for the Gabon and Zaire populations) this is a reflection of inadequate data resulting in varying estimates and does not necessarily indicate real population increases or decreases.
In the guinea-savanna and sahelian zOnes the average elephant density is estimated to be 0.17/km2 in national parks, 0.06/km2 in game reserves, forest reserves and domaines de chasse, and O.l4/km* in non-classified zones.
To estimate the populationin Zaire (Table 4.2) the following procedure was used:
1. Available information on elephant ranges (from the UNEP/ GRID data base compiled by A. Burrill and I. Douglas- Hamilton) was amalgamated to give total ranges in three vegetation categories:
i. lowland forest (l,OOO,OOO km*);
ii. northern and eastern savanna/mosaic (409,100 km*);
iii. southern mosaic of savanna types (373,700 km*).
2. For the lowland forest, elephant densities were based on estimates derived by R. Barnes in Gabon: 0.4 elephant/km* in undisturbed forest; 0.1 elephant/k.rn* in disturbed forest (Table 4.2).

For northern and eastern savanna mosaic: estimates for the areas were multiplied by assumed densities of elephants of O.l/
Virunga and Garamba National Parks were from recent km2 in disturbed and 0.45/km2 in undisturbed forest.
surveys. For the remaining range in this veget .ation type, a
density of 0.1 elephant/km2 was used, based onan extrapolation of densities from 3 sets of aerial transects across the Bili- Uere region in the north-west (by I. Douglas-Hamilton, 1985; D. Western, 1986; C. Ma&e, 1986).
The area of southern vegetation mosaic includes tW0 national
parks and some “domaines d,e chasse”, for which there is little information except that elephants occur and poaching is high, so an estimate of 0.1 elephant/km2 has been used.
In Gabon, Congo and Cameroon, estimates were made of
the proportions of disturbed and undisturbed rainforest (based on the densitiy of roads) within the elephant ranges, and these
Table 43: Elephant population estimates for West and Central Africa. These figures represent little more than possible orders of magnitude for the numbers of elephants in West and and Central Africa.
Country 1981 estimate 1987 order of 1987 interim
magnitude estimate
West Africa
Benin Burkina Faso Ghana Guinea Guinea-Bissau Ivory Coast Liberia Mali Mauritania Niger Nigeria Sierra Leone Senegal Togo
Sub-total
Overall estimate
Central Africa
Cameroon Central Afr. Rep. Chad Congo Equatorial Guinea Gabon Zaire
Sub-total
Overall estimate
Total
Overall estimate
1,250 3,500
970 800
4,800
2,000 780 40
800 1,820
500 200 150
17,610
Low 1,000s 2,100
Low 1,000s 3,900 v. low 1,000s 1,100
Low 100s 300 Low 10s 20
Low 1,000s 3,300 Mid 100s 650
Mid 100s 600 Low 10s 20
High 100s 800
Low 1,000s 3,100 Low 100s 250
Mid 10s 50 v. low 100s 100
16290
10,0M-20,u00
5,ooo 31,000
10,800
13,400 376,000
436po
Low 1,000s 21,200 Low 10,000s 19,000 Low 1,ooos 3,100
Mid 10,000s 61,000 Mid 100s 500
High 10,000s 76,000 <200,000 195,000
375,800
200,00@400, oa,
453,810 392,090
214 OO@420, UOO
4.3.3 Goals for cortwv&n of Wmt and C’entmiAfiican elmhan&
To gather information on the status and numbers of elephants in the rainforests.
To conserve those large populations of elephants that live outside reserves, where this is feasible.
To secure the remaining viable populations of savanna and
forest elephants that live within existing and potential protected areas, together with the full diversity of their habitats.
To bring the volume of traded raw and worked ivory to within the limits sustainable by the present elephant
populations.
43.4 Elements of a regional elephant conservation strategy
Throughout the West and Central African region, there is an urgent need to attract high quality staff to the wildlife departments, to train them and to motivate them. Governments need assistance in reducing corruption, and poaching should be reduced so that that the annual crop of animals is less than the sustainable yield. Within each country, elephant conservation issues should feature as part of existing or proposed national conservation strategies.
All states that are not parties to CITES should be urged either to join or to adhere to the convention; CITES regulations concerning ivory need to be more strictly enforced; steps should be taken to monitor, and if necessary reduce, the volume of worked ivory circulating in the region; and publicity campaigns should be conducted to reduce the desirability of, and hence local demand for, ivory in the region. All these actions should be aimed at bringing the demand for ivory into equilibrium with the sustainable supply of this commodity within the region.
The most urgent need in the rainforest zone is to find out how many elephants there are; their distribution, densities, and total potential population size are virtually unknown, as are
present trends and future threats. In several countries (e.g.
Gabon and the Congo), poaching is apparently not a major threat at present, but is likely to become so as the demands of the ivory trade cause internationally-connected ivory hunters to look for new sources of ivory. These countries should be assisted to prepare themselves now for this potential threat. The numbers and effectiveness of protected areas within the rainforest zone must be increased (particularly in Gabon and the Congo); these areas may be both of national park status and zones in which various degrees of controlled exploitation are
permitted. Within the savanna zone the primary need is to enforce
existing legislation to reduce the present level of poaching and to ensure stricter documentation of the ivory trade. The majority of the savanna elephants are in protected areas, and the efforts already underway to improve their management, with international aid (in the Central African Republic, Chad, Zaire, Niger, Ivory
Coast and Benin) must be supported, reinforced, and matched
20

Table 4.4 Priority populations in West and Central Africa
West African rainforests:
Tai Forest (Ivory Coast)
Mano and Lofa river forests (Liberia)
Bia forest (Ghana)
West African savanna=
Comoe (Ivory Coast)
Pama-Singou-Arli-Pendjari-“W” complex (Benin, Niger, Burkina Faso)
PO and Nazinga (Burkina Faso)
Kainji (Nigeria)
West African sahek
Gourma (Mali)
Central African rainforests:
Bayanga (Central African Republic)
North-eastern forests (area drained by the Mvoung, Oua, Ntsie and Ntem rivers (Gabon))
Salonga (Zaire)
Kahuzi-Biega (Zaire)
Undeveloped areas of Congo, Cameroon, Zaire
Central African savanna=
Zakouma (Chad)
Garamba (Zaire)
Bamingui-Bangoran and surrounding areas (Central
African Republic)
. . -
._‘a@ * I r-.* * *. . ’ I
:w _, . ” .I
>.
5. .& ‘* *> .
‘a \ * *.
. -.. _ .
Young female forest elephant (Photo: N. Bolwig/WWF)
of the savanna elephants are in protected areas, and the efforts already underway to improve their management, with international aid (in the Central African Republic, Chad, Zaire, Niger, Ivory Coast and Benin) must be supported, reinforced, and matched with similar actions in neighbouring countries.
Integration of the sole truly Sahelian elephant population, in Gourma, Mali, as a conservation component of the development
planning of this area, is a further priority. The 15 priority populations identified for West and Central
Africa are listed in Table 4.4.
4.4 Elephant Populations in East Africa
4.4.1 The problem
Poaching and loss of habitat are causing the extermination and
compression of elephant populations throughout eastern Africa. In Tanzania, where the largest numbers remain, the population is declining at 7.5% per year; in eastern Kenya, Somalia and Sudan at 10% or more per year. (In fact, trends made on changes in gross estimates suggest even more rapid rates of decline: see Section 6.1.1.) Large remote parks such as Selous Game Reserve in Tanzania and the Southern National Park in Sudan, are morevulnerable than small parks, such as Aberdares and Mount Kenya, in densely settled areas. Habitat loss due to expanding human settlement reduces the potential elephant
range still further. Many reasons for the decline exist, including a large illegal
ivory trade, poverty (including that of wildlife officers), civilian disruption, lack of arms control antagonism to wildlife (especially elephants causing crop damage), undermanned, underfinanced and undertrained wildlife authorities; lack of liaison between ivory traders and conservation authorities; and lack of understanding of the seriousness of the problem.
On the other hand, wildlife authorities have not addressed the problems and hardships elephants cause landowners and
agriculturalists, or the costs they entail in development terms.
4.4.2 Population estimates
Population estimates for the elephant in East Africa are given in Table 4.5. The estimates made by the AERSG in 1981 are compared with those made at the Nyeri meeting in May 1987.
These data suggest that the regional population has more than halved in just six years. In addition, population estimates made by UNEP/GRID (see Burrill and Douglas-Hamilton (1987) and Douglas-Hamilton (1988)) are provided in Table 4.5. These estimates vary somewhat from those made by the AERSG, and they tend to be higher (see Table 6.2), except for most East African countries. This is partly because of a bias towards over- estimation in the UNEP/GRID data input, in which counts are
made mainly in high density areas, and then used for extrapolation (for more details, see Burrill and Douglas-Hamilton (1987) and
Douglas-Hamilton (1988)). However, in the case of East
21
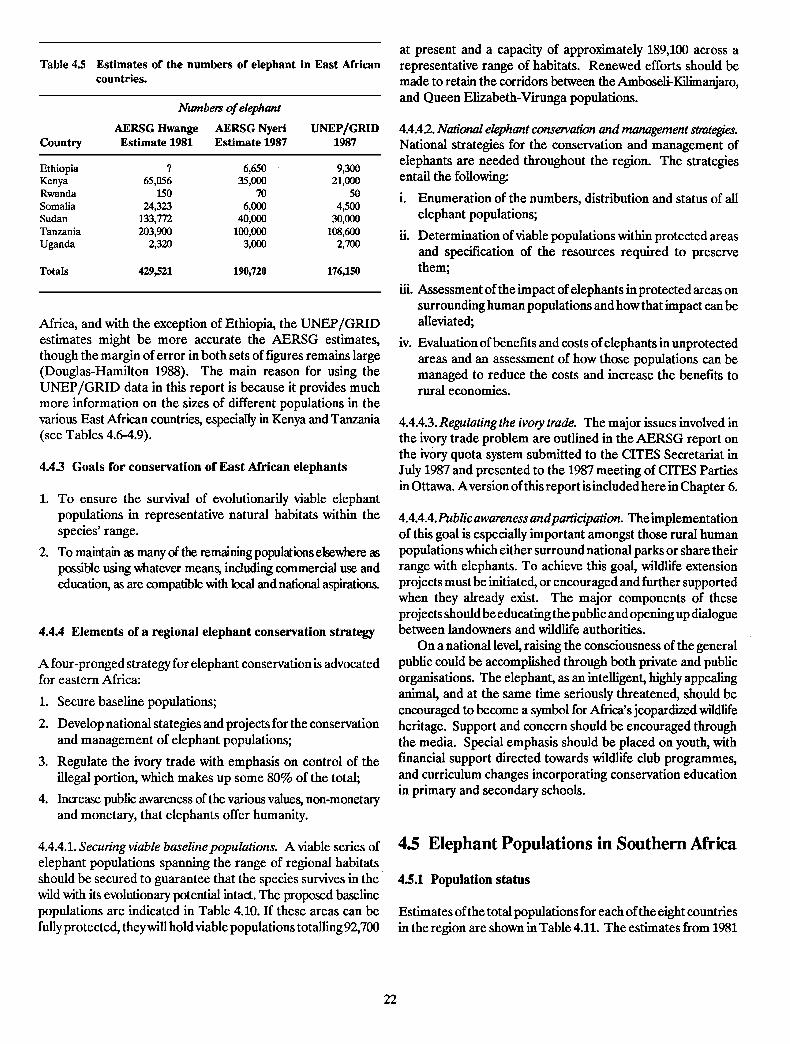
Table 4.5 Estimates countries.
of the numbers of in East African
Country
Nmbers of elephant
AERSG Hwange AERSG Nyeri UNEP/GRID Estimate 1981 Estimate 1987 1987
Ethiopia Kenya Rwanda Somalia Sudan Tanzania Uganda
Totals 429,521 190,720 176,150
? 6,650 9,300 65,056 3%~ 21,000
150 70 50 X,323 6,000 490
133,772 40,000 30,000 203,900 100,000 108,600
2,320 3,000 2,700
Africa, and with the exception of Ethiopia, the UNEP/GRID estimates might be more accurate the AERSG estimates, though the margin of error in both sets of figures remains large (Douglas-Hamilton 1988). The main reason for using the UNEP/GRID data in this report is because it provides much more information on the sizes of different populations in the various East African countries, especially in Kenya and Tanzania (see Tables 4.6-4.9).
4.43 Goals for conservation of East African elephants
1.
2 .
To ensure the survival of evolutionarily viable elephant populations in representative natural habitats within the species’ range.
To maintain as many of the remaining populations elsewhere as possible using whatever mean% including commercial use and education, as are compatible with local and national aspirations
4.4.4 Elements of a regional elephant conservation strategy
A four-pronged strategy for elephant conservation is advocated for eastern Africa:
Secure baseline populations;
Develop national stategies and projects for the conservation and management of elephant populations;
Regulate the ivory trade with emphasis on control of the illegal portion, which makes up some 80% of the total;
Increase public awareness of the various values, non-monetary and monetary, that elephants offer humanity.
4.4.4.1. Secuning viable baseline populations. A viable series of elephant populations spanning the range of regional habitats should be secured to guarantee that the species survives in the wild with its evolutionary potential intact. The proposed baseline populations are indicated in Table 4.10. If these areas can be fully protected, theywill holdviable populations totalling92,700
at present and a capacity of approximately 189,100 across a representative range of habitats. Renewed efforts should be made to retain the corridors between the AmboseliXilimanjaro, and Queen Elizabeth-Virunga populations.
4.4.42. Nah’onal elephant conservation and manugement stmtegies. National strategies for the conservation and management of elephants are needed throughout the region. The strategies entail the following:
i.
ii.
. . . m
iv.
Enumeration of the numbers, elephant populations;
distribution and status ofall
Determination of viable populations within protected areas and specification of the resources required to preserve them;
Assessment of the impact of elephants in protected areas on surrounding human populations and how that impact can be alleviated;
Evaluation of benefits and costs of elephants in unprotected areas and an assessment of how those populations can be managed to reduce the costs and increase the benefits to rural economies.
4.4.4.3. Regulating the ivory trade. The major issues involved in the ivory trade problem are outlined in the AERSG report on the ivory quota system submitted to the CITES Secretariat in July 1987 and presented to the 1987 meeting of CITES Parties in Ottawa. Aversion of this report isincluded here in Chapter 6.
4.4.4.4.Publicawarenessandparticipation. Theimplementation of this goal is especially important amongst those rural human populations which either surround national parks or share their range with elephants. To achieve this goal, wildlife extension projects must be initiated, or encouraged and further supported when they already exist. The major components of these projects should be educating the public and opening up dialogue between landowners and wildlife authorities.
On a national level, raising the consciousness of the general public could be accomplished through both private and public organisations. The elephant, as an intelligent, highly appealing animal, and at the same time seriously threatened, should be encouraged to become a symbol for Africa’s jeopardized wildlife heritage. Support and concern should be encouraged through the media. Special emphasis should be placed on youth, with financial support directed towards wildlife club programmes, and curriculum changes incorporating conservation education in primary and secondary schools.
4.5 Elephant Populations in Southern Africa
45.1 Population status
Estimates of the total populations for each of the eight countries in the region are shown in Table 4.11. The estimates from 1981
22
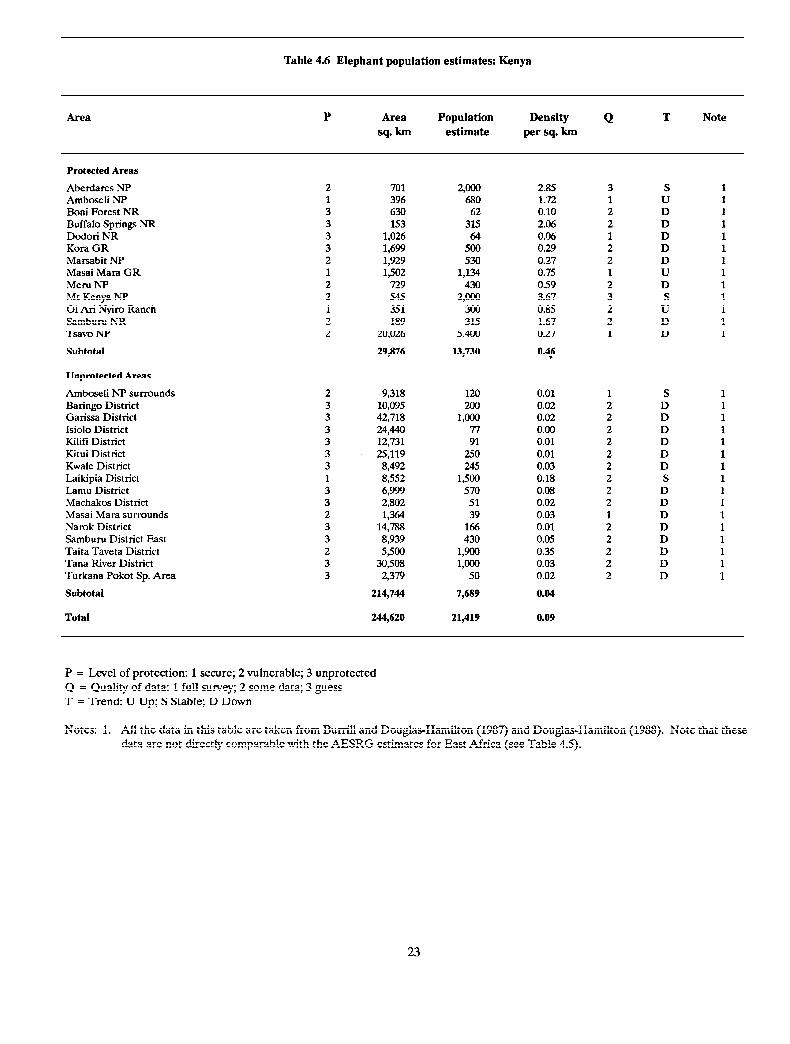
Table 4.6 Elephant population estimates: Kenya
Area P Area sq. km
Population estimate
Density per sq. km
Q T Note
Protected Areas
Aberdares NP Amboseli NP Boni Forest NR Buffalo Springs NR Dodori NR Kora GR Marsabit NP Masai Mara GR Meru hT Mt Kenya NP 01 Ari Nyiro Ranch Samburu NR Tsavo N-P
Subtotal
Unprotected Areas
Amboseli NP surrounds Baring0 District Garissa’ District Isiolo District Kilifi District Kitui District Kwale District Laikipia District Lamu District Machakos District Masai Mara surrounds Narok District Samburu District East Taita Taveta District Tana River District Turkana Pokot Sp. Area
Subtotal
Total
2 701 WOO 2.85 3 S 1 396 680 1.72 1 U 3 630 62 0.10 2 D 3 153 315 2.06 2 D 3 1,026 64 0.06 1 D 3 1,699 500 0.29 2 D 2 1,929 530 0.27 2 D 1 1502 1,134 0.75 1 U 2 729 430 0.59 2 D 2 545 2,000 3.67 3 S 1 351 300 0.85 2 U 2 189 315 1.67 2 D 2 20,026 5,400 0.27 1 D
2 9,318 120 0.01 1 S 3 10,095 200 0.02 2 D 3 42,718 1,000 0.02 2 D 3 24,440 77 0.00 2 D 3 12,731 91 0.01 2 D 3 25,119 250 0.01 2 D 3 8,492 245 0.03 2 D 1 8,552 1,500 0.18 2 S 3 6,999 570 0.08 2 D 3 2,802 51 0.02 2 D 2 1,364 39 0.03 1 D 3 14,788 166 0.01 2 D 3 8,939 430 0.05 2 D 2 WO 1,900 0.35 2 D 3 30,508 1,000 0.03 2 D 3 2,3?9 50 0.02 2 D
29,876
214,744
244,620
13,730
7,689
21fl19
0.45
0.04
0.09
1 1. 1 1 1 1 1 1 1 1 1 1 1
1 1 1 1 1 1 1 1 1 1 1 1 1 1 1 1
P = Level of protection: 1 secure; 2 vulnerable; 3 unprotected Q = Quality of data: 1 full survey; 2 some data; 3 guess T = Trend: U Up; S Stable; D Down
Notes: 1. All the data in this table are taken from Burrill and Douglas-Hamilton (1987) and Douglas-Hamilton (1988). Note that these data are not directly comparable with the AESRG estimates for East Africa (see Table 4.5).
23

Table 4.7 Elephant population estimates: Tanzania
Area P Area sq. km
Population estimate
Density per sq. km
Q T Note
Protected Areas
Arusha NP Burigi GR Katavi NP Kilimanjaro NP Lake Manyara NP Mikumi NP Mkomazi GR Ngorongoro CA and FR Ruaha NP Rungwa GR Selous GR Serengeti NP Tarangire NP Ugalla River GR Uwanda GR and surrounds
2 391 85 0.22 3 D 2 1,801 100 0.06 3 D 2 2,419 407 0.17 1 D 2 1W 1,000 0.65 3 S 2 246 434 1.76 1 D 2 3,126 2,086 0.67 1 D 2 2,971 193 0.06 3 D 2 7,064 519 0.07 3 D 2 l2,274 13,700 1.12 3 D 2 13379 8,400 0.62 3 D 2 42,789 41,766 0.98 1 D 2 11,501 395 0.03 1 D 2 1,596 3,000 1.88 1 U 3 2,680 65 0.02 2 D 2 16,314 2,280 0.14 2 D
Subtotal l.20295 74430 0.62
Unprotected Areas
Endulen (Arusha) Hanang (Arusha) Kilombero Valley Loliondo (Arusha) Marang Forest (Arusha) Masai Steppe (Arusha) Selous GR surrounds Tabora Gombe Tabora Inyonga Tabora Kigozi Tabora South Tabora Ugunda Yaida (Arusha)
3 1,497 178 0.12 2 D 3 12,717 223 0.02 2 D 2 7,701 2,230 0.29 1 D 2 5,778 161 0.03 3 D 2 268 200 0.75 3 D 3 16,404 2,010 0.12 2 D 3 27,819 12,314 0.44 1 D 3 1,959 17 0.01 2 D 3 3,845 222 0.06 2 D 3 3,175 838 0.26 2 D 3 18,192 585 0.03 2 D 3 3,349 276 0.08 2 D 3 1,971 384 0.19 2 D
Subtotal 104,675 19,638 0.19
Qther populations 3 14,532 3 D
Total 224,970’ 108,600 oA24
1 1 1 1
192 1 1 1
193 193
1 1 1 1 1
1 1 1 1 1 1 1 1 1 1 1 1 1
1
P = Level of protection: 1 secure; 2 vulnerable; 3 unprotected Q = Quality of data: 1 full survey; 2 some data; 3 guess T = Trend: U Up; S Stable; D Down
Notes: 1. All the data in this table are taken from Burrill and Douglas-Hamilton (1987) and Douglas-Hamilton (1988). Note that these data are not directly comparable with the AESRG estimates for East Africa (see Table 4.5).
2. The Lake Manyara population has recently been estimated at 200-300 animals (I. Douglas-Hamilton pers. comm.). 3. The combined Ruaha-Rungwa population has recently been estimated at ll,OOO-12,000 animals from an aerial sample survey
(I. Douglas-Hamilton pers. comm.). 4. The totals for areas and density exclude the “other populations”, which are widely scattered through the country.
24

Table 4.8 Elephant population estimates: Uganda
Area P Area Population Density sq. km estimate per sq. km
Q T Note
Bwindi Forest 2 335 18 0.05 2 D 1 Itwara 3 68 6 0.09 2 D 1 Kasyhoma-Kitomi 3 376 20 0.05 2 D 1 Kibale Forest 2 509 100 0.20 2 D 1 Kidepo NP 2 1,366 428 0.31 2 D 1 Mt Elgon 2 1,107 100 0.09 2 D 1 Murchison NP and Budongo 2 5,075 1,200 0.24 2 D 192 Queen Elizabeth NP 2 2,668 700 0.26 2 D 1 Rwenzori Mts 2 948 100 0.11 2 D 1 Semliki GR 2 208 30 0.14 2 D 1
Totals l2,660 2,702 0.21
P = Level of protection: 1 secure; 2 vulnerable; 3 unprotected Q = Quality of data: 1 full survey; 2 some data; 3 guess T = Trend: U Up; S Stable; D Down
Notes: 1.
2.
All the data in this table are taken from Burrill and Douglas-Hamilton (1987) and Douglas-Hamilton (1988). Note that these data are not directly comparable with the AESRG estimates for East Africa (see Table 4.5). The combined Murchison-Budongo population is now thought to number 750 animals (I. Douglas-Hamilton pers. comm.).
Table 4.9 Elephant population estimates: Ethiopia, Rwanda, Somalia, and Sudan
Area P Area Population Density sq. km estimate /sq. km
Q T Note
Ethiopia
Rwanda Akagera NP Elsewhere Total
3 m 9300 I 3 D 1
1 3
2,730 25 25
- 50
0.01 2 3
U D
1 1
56,076 4,474 0.08 2 D Somalia
Sudan Jonglei Shambe NP Southern NP Southern NP surrounds Elsewhere Total
64,554 1,379 11,813 57 15,366 5,653 14,459 2,305
20,000 I 29,394
0.02 3 0.00 3 0.37 3 0.16 3
3 -
D D D D D
P = Level of protection: 1 secure; 2 vulnerable; 3 unprotected
Q = Quality of data: 1 full survey; 2 some data; 3 guess T = Trend: U Up; S Stable; D Down
Notes: 1. All the data in this table are taken from Burrill and Douglas-Hamilton (1987) and Douglas-Hamilton (1988). Note that these data are not directly comparable with the AESRG estimates for East Africa (see Table 4.5)
2. The elephant has recently been reported as virtually eliminated in Somalia (I. Douglas-Hamilton pers. comm.)
25

There is no new information for Angola and the 1981
estimate has simply been carried forward. If the new estimate for Botswana of 51,000 elephants is accepted then the figure for 1981 must have been an underestimate, since it is impossible that the population could have grown by more than about 50% though natural increase. Whilst some emigration from Zimbabwe may have occurred, it is unlikely to account for the difference. The elephant populations in Namibia, South Africa and Zimbabwe are managed for specific levels.
Individual country estimates are shown in Tables 4.12 to
4.18.
Table 4.10 Proposed baseline populations of elephants in East Africa
Protected Area Habitat Population size Actual Potential
Kenya
2,ooo 680
1,130 430
2,000 5,400
2,ooo 600
2,ooo 2,~ 2,ooo
WOO
WOO 500
50,000
Loo0 100,000
3,000
189,100
Aberdares Montane Amboseli Wooded savanna
Masai Mara Plains/woodlands
Meru Dry bushland Mount Kenya Montane
Tsavo Dry bushland
Tanzania 45.2 Conservation priority analysis
Kilimanjaro Montane l,ooo Manyara Moist woodland 430 Ruaha/Rungwa Moist deciduous 22,100 Ngorongoro Montanelsavanna 520
Selous Moist deciduous 56,3101
4.5.2.1 Biologicalimportance. Selected areas in the region were ranked in order of biological importance using the criteria employed at the 1981AERSG meeting (Cumming and Jackson, 1984) with revisions which included:
i. A new system for scoring population size (T. Foose and R. Martin);
ii. The addition of a section on research (C. Moss);
iii. The allocation of weighting factors to each section (T. Foose and R. Martin).
The revised criteria are shown in Table 4.19 with details of the analysis for each country in Table 4.20. The outcome of this exercise is summarised below, and compared with the protected area priorities of Mackinnon and Mackinnon (1986) in Table
4.21.
Uganda
Queen Elizabeth Plains/woodlands 700
Totals 92,700
Note 1: De current population estimate for the Selous includes areas surrounding the Game Reserve, and the Kilombero
Valley.
Table 4.11 Estimates of the numbers of elephant in southern African countries.
Country
Numbers of elephant 1981 1987
Angola 12,400 12,400 Botswana 20,000 51,000 Malawi 4,500 2,400 Mozambique 54,800 18,600 Namibia 2,300 5,000 South Africa 8,000 8,200 Zambia 160,000 41,000 Zimbabwe 49,000 43,000
Totals 311,000 181,600
(made at the Hwange AERSG meeting) are compared with those made in 1987 at the Nyeri AERSG meeting.
The decline is 42% since 1981 and has ocurred mainly in Zambia and Mozambique. It represents a net annual rate of decrease of 7% for the region. This must be the result of gross
annual harvest rates of about 12%, since elephant populations can sustain offtakes of about 5% without decline. However, to consider the region as a single unit is misleading since circumstances are very different in individual countries. Elephants at drinking place (Photo: Peter Jackson)
26
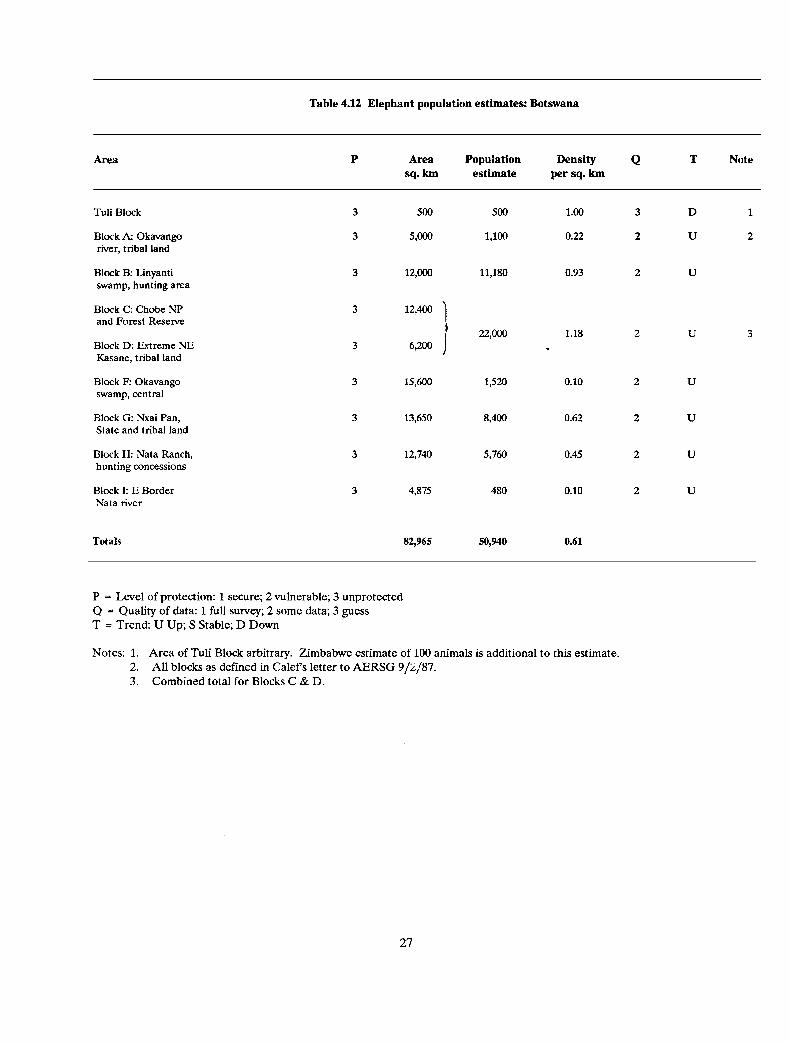
Table 4.12 Elephant population estimates: Botswana
Area P Area Population sq. km estimate
Density per sq. km
Q T Note
Tuli Block 3
3
500
5,~
500 1.00 3 D 1
1,100 0.22 2 U 2
11,180 0.93 2 U
Block A: Okavango river, tribal land
Block B: Linyanti swamp, hunting area
3 12,000
12,400
6,200 i
Block C: Chobe NP and Forest Reserve
3
22,000 1.18 2 U 3 V
1,520 0.10 2 U
8,400 0.62 2 U
5,760 0.45 2 U
480 0.10 2 U
Block D: Extreme NE Kasane, tribal land
3
Block F: Okavango swamp, central
3 15,600
Block G: Nxai Pan, State and tribal land
3 13,650
Block H: Nata Ranch, hunting concessions
3 12,740
Block I: E Border Nata river
3 4,875
Totals 82,965 50,940 0.61
P = Level of protection: 1 secure; 2 vulnerable; 3 unprotected Q = Quality of data: 1 full survey; 2 some data; 3 guess T = Trend: U Up; S Stable; D Down
Notes: 1. Area of Tuli Block arbitrary. Zimbabwe estimate of 100 animals is additional to this estimate. 2. All blocks as defined in Calef’s letter to AERSG 9/2,/87. 3. Combined total for Blocks C & D.
27

Table 4.U Elephant population estimates: Malawi
Area P Area sq. km
Population Density estimate per sq. km
Q T Note
Nyika NP
Vwaza Marsh GR
Kasungu NP
Nkhotakota GR
Thuma Forest Reserve
Phirilongwe Forest Res.
Liwonde NP
Mangochi/Namizimu area
Majete GR
Totals 10p!w
3,134
1,000
2,316
1,802
200
200
548
600
690
100 0.03
250 0.25
900 0.39
400 0.22
50 0.25
100 0.50
300 0.55
100 0.17
200 0.29
023
S
S/D 1
U
S
D
S/U
S/U
D
S 2
P = Level of protection: 1 secure; 2 vulnerable; 3 unprotected Q = Quality of data: 1 full survey; 2 some data; 3 guess T = Trend: U Up; S Stable; D Down
Notes: 1. Confidence intervals + /- 50%. 2. Population in the Game Reserve c.70. Rest in adjacent area.
Data from J.H.B. Mphande’s letter to AERSG 24/2/87.
28

Table 4.14 Elephant population estimates: Mozambique
Area P Area sq. km
Population Density estimate per sq. km
Q T Note
Protected Areas
7,~ 5,000 3,750
900 2,100
10,000
0 400
2,ooo 100 100
2,000
0.00 0.08 0.53 0.11 0.05 0.20
D 1 D D D D D
Banhine NP Zinave NP Gorongosa NP Maputo GR Gile GR Niassa GR
Subtotal 28,750 4,600 0.16 3
IJnprotected Areas
3 3 3 3 3 3 3 3 3 3 3 3 3 3 3
10,000 3
750 50
300
1,000 200
1,000 300
2,000 100 50
250 2,000
2,000 1,000 3,000
20
0.08 3 3 3 3 3 3 3 3 3 3 3 3 3 1 3 3
D D D D D D D D 2 D D D D D D 3 D 4 D
Zambezi Valley Util Unit North west Limpopo North west Gaza Western Inhambane Southern Manica Tambara/Guro/Barve Southern Sofala Central Districts North west Tete North east Tete Southern Tete West Lugenda Southern & east Niassa East Lugenda Cabo Delgado province Mopeia/Morrumbala 3
Subtotal 14,020
Total 18,620
P = Level of protection: 1 secure; 2 vulnerable; 3 unprotected Q = Quality of data: 1 full survey; 2 some data; 3 guess T = Trend: U Up; S Stable; D Down
Notes: 1. Occasional vagrants in wet season. 2. Central districts: Gorongosa/Caia/Chemba/Cheringoma. 3. Aerial survey 1981.
. .
4. Excluding Lugenda east.
Data from J. Lobao Tello: AERSG meeting, 1987.
29
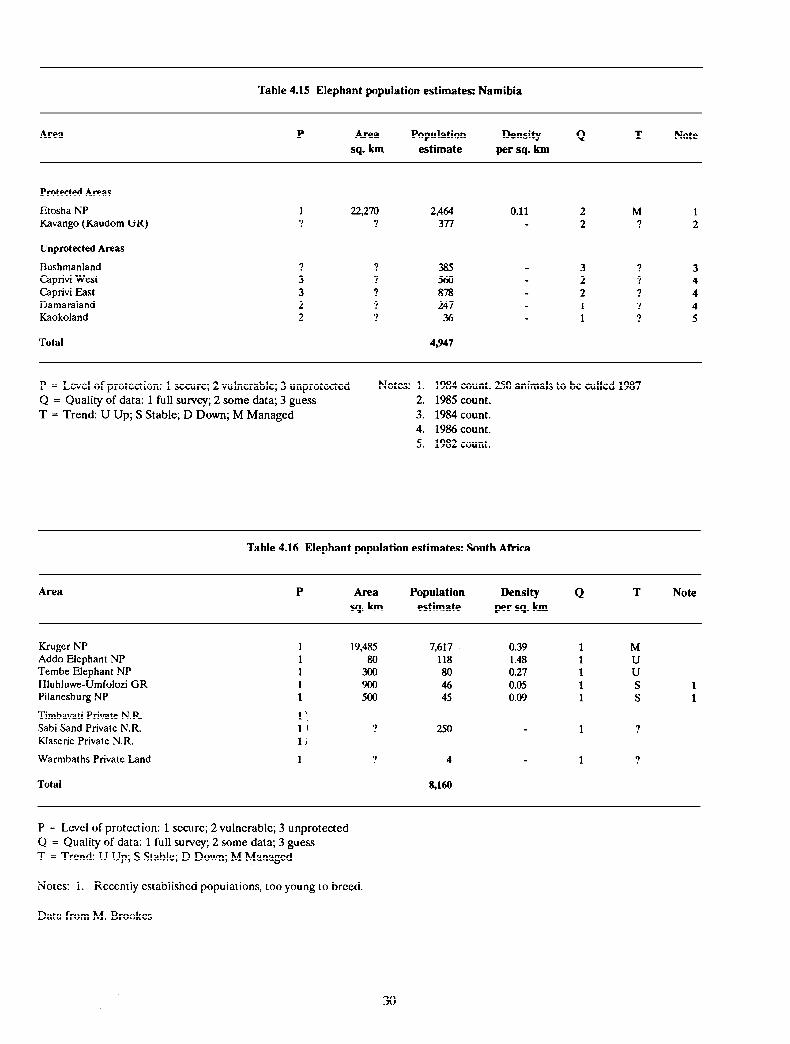
Table 4.15 Elephant population estimates: Namibia
Area P Area sq. km
Population estimate
Density per sq. km
Q T Note
Protected Areas
Etosha NP Kavango (Kaudom GR)
Unprotected Areas
Bushmanland caprivi west caprivi East Damaraland Kaokoland
Total
1 22,270 2,464 0.11 2 M 1 ? ? 377 2 ? 2
? ? 385 3 ? 3 3 ? 560 2 ? 4 3 ? 878 2 ? 4 2 ? 247 1 ? 4 2 ? 36 1 ? 5
4,947
P = Level of protection: 1 secure; 2 vulnerable; 3 unprotected Q = Quality of data: 1 full survey; 2 some data; 3 guess T = Trend: U Up; S Stable; D Down; M Managed
Notes: 1. 1984 count. 250 animals to be culled 1987 2. 1985 count. 3. 1984 count. 4. 1986 count. 5. 1982 count.
Table 4.16 Elephant population estimates: South Africa
Area P Area sq. km
Population estimate
Density per sq. km
Q T Note
Kruger NP Addo Elephant NP Tembe Elephant NP
I-iluhluwe-Umfolozi GR Pilanesburg NP
Timbavati Private N.R Sabi Sand Private N.R Klaserie Private N.R
Warmbaths Private Land
Total
1 19,485 7,617 . 0.39 1 M 1 80 118 1.48 1 U 1 300 80 0.27 1 U 1 900 46 0.05 1 S 1 1 500 45 0.09 1 S 1
?
1 ?
250 - 1 ?
4 1 ?
8,160
P = Level of protection: 1. secure; 2 vulnerable; 3 unprotected Q = Quality of data: 1 full survey; 2 some data; 3 guess T = Trend: U Up; S Stable; D Down; M Managed
Notes: 1. Recently established populations, too young to breed.
Data from M. Brookcs
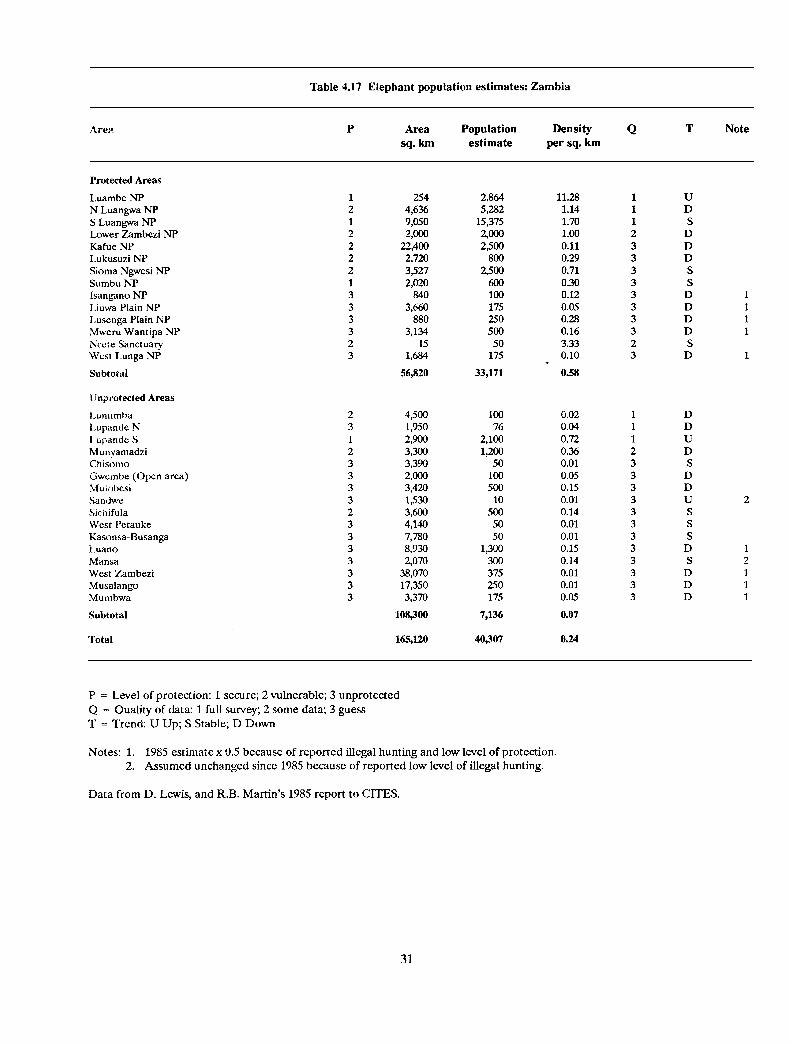
Table 4.17 Elephant population estimates: Zambia
P tirea sq. km
Population estimate
Density per sq. km
Q T Note
Protected Areas
Luambe NP 1 254 2$64 N Luangwa NP 2 4,636 5,282 S Luangwa NP 1 9,050 15,375 Lower Zambezi NP 2 2,000 2,~ Kafue NY 2 22,400 2,500 Lukusuzi NP 2 2,720 800 Sioma Ngwesi NP 2 3,527 2300 Sumbu NP 1 2,020 600 Xsangano NP 3 840 100 Liuwa Plain NP 3 3,660 175 Lusenga Plain NP 3 880 250 Mweru Wantipa NP 3 3,134 SO0 Ncete Sanctuary 2 15 50 West Lunga NP 3 1,684 175
Stlbt0td
Unprotected Areas
II .urmmba 2 4,500 I’ .upande N 3 1,950 1 upande S 1 2,900 Munyamadzi 2 3,300 Chisomo 3 3,390 Gwembe (Open area) 3 2,m Mu iibesi 3 3,420 Sandwe 3 1,530 Sic hifula 2 3,600 West Petauke 3 4,140 Kasonsa-Busanga 3 7,780 Luano 3 8,930 Mansa 3 2,070 West Tambezi 3 38,070 Musalango 3 17,350 ?&mbwa 3 3,370
Subtotal
Total 165,120
56,820
losy300
33,171
100 76
2,100 1,200
50 100 500
10 500
50 50
1,300 300 375 250 175
7,136
40907
11.28 1.14
1.70 1.00 0.11 0.29
0.71 0.30 0.12 0.05 0.28 0.16 3.33 0.10
t 0.58
0.02 1 D 0.04 1 D 0.72 1 U 0.36 2 D 0.01 3 S 0.05 3 D 0.15 3 D 0.01 3 U 0.14 3 S 0.01 3 S 0.01 3 S 0.15 3 D 0.14 3 S
0.01 3 D 0.01 3 D 0.05 3 D
0.07
0.24
1 1
1 2 3 3 3 3 3 3 3 3 2 3
U D S
D
D D S S
D D D D S
D 1
2
P = Level of protection: 1 secure; 2 vulnerable; 3 unprotected
Q = Quality of data: 1 full survey; 2 some data; 3 guess T = Trend: U Up; S Stable; D Down
Notes: 1. 1985 estimate x 0.5 because of reported illegal hunting and low level of protection. 2. Assumed unchanged since 1985 because of reported low level of illegal hunting.
Data from D. Lewis, and R.B. Martin’s 1985 report to CITES.
31

Notes: 1. 2. 3.
Data from
Unprotected area included as part of region. Areas are crude estimates. I Tuli Safari Area included here because most of range is unprotected.
D.H.M. Cumming: AERSG 1987 questionaire.
1
1 14,500 13,000 0.90 1 U/M 2 4,964 4,451 0.90 1 S/M
4,400 3,763 0.86 1 U/M 1 1 2
1 1,910 2,000 1.05 1 S/M 1 1,400 1,286 0.92 1 S/M 1 1,713 1,500 0.88 1 S/M 1 1,081 800 0.74 1 S/M 3 9,000 3,716 0.41 1 D/M
12,500 11,260 0.90 1 U/M 1 1 1 1 1 2 2
51,468 41,776 0.81
2
2 WO 1,400 0.28 2 D 3 3,000 500 0.17 2 D 1 1,000 100 0.10 2 D 3
9,000 2,000 0.22
60,468 43,776 0.72
Table 4.18 Elephant population estimates: Zimbabwe
Area P Area sq. km
Population Density estimate per sq. km
Q T Note
Protected Areas
Hwange NP Gonarezhou
Matetsi area Zambezi NP Matetsi Safari Area Forest Areas
Sebungwe region
Chizarira NP Matusadona NP Chirisa Safari Area Chete Safari Area Communal Land
Zambezi Valley Mana Pools NP Charara Safari Area Urungwe Safari Area Sapi Safari Area Chewore Safari Area Doma Safari Area Dande Safari Area
Subtotal
Unprotected Areas
NE Communal Lands Tjolotjo Communal land Tuli Communal land & SA
Subtotal
Total
P = Level of protection: 1 secure; 2 vulnerable; 3 unprotected Q = Quality of data: 1 full survey; 2 some data; 3 guess T = Trend: U Up; S Stable; D Down; M Managed
. 1
32
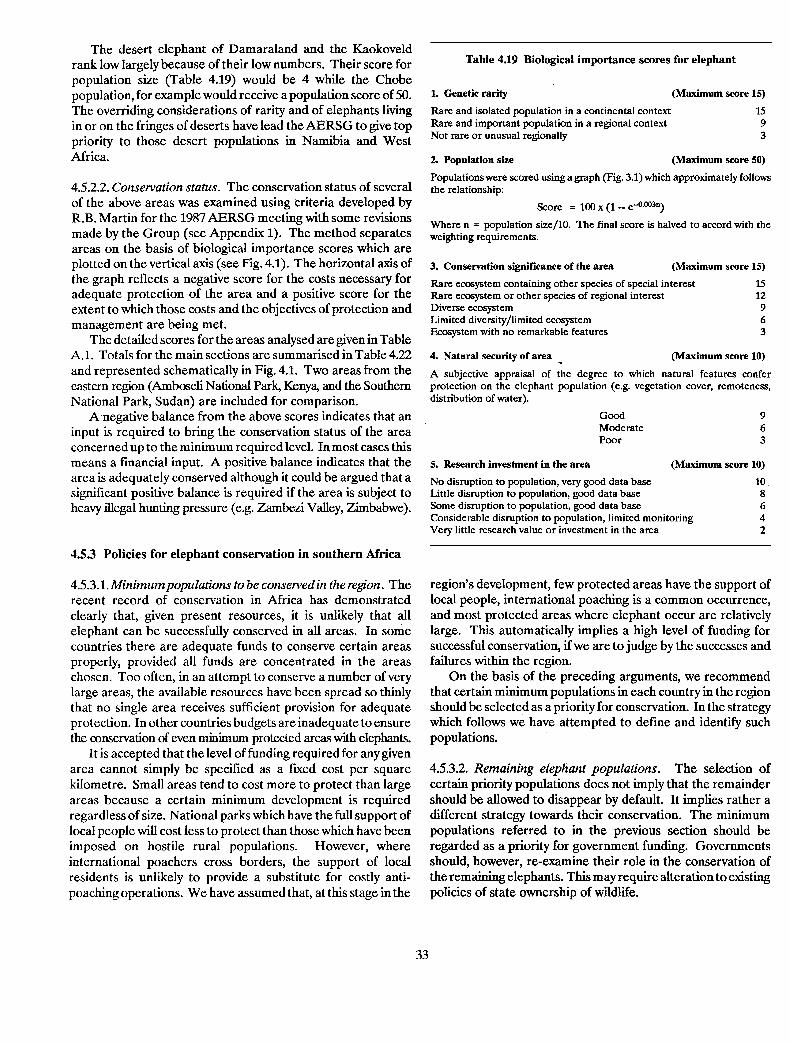
The desert elephant of Damaraland and the Kaokoveld rank low largely because of their low numbers. Their score for population size (Table 4.19) would be 4 while the Chobe population, for example would receive a population score of 50. The overriding considerations of rarity and of elephants living in or on the fringes of deserts have lead the AERSG to give top priority to those desert populations in Namibia and West Africa.
4.5.2.2. Conservation status. The conservation status of several of the above areas was examined using criteria developed by R.B. Martin for the 1987 AERSG meeting with some revisions made by the Group (see Appendix 1). The method separates areas on the basis of biological importance scores which are plotted on the vertical axis (see Fig. 4.1). The horizontal axis of the graph reflects a negative score for the costs necessary for adequate protection of the area and a positive score for the extent to which those costs and the objectives of protection and management are being met.
The detailed scores for the areas analysed are given in Table A.1. Totals for the main sections are summarised in Table 4.22 and represented schematically in Fig. 4.1. Two areas from the eastern region (Amboseli National Park, Kenya, and the Southern National Park, Sudan) are included for comparison.
Anegative balance from the above scores indicates that an input is required to bring the conservation status of the area concerned up to the minimum required level. In most cases this means a financial input. A positive balance indicates that the area is adequately conserved although it could be argued that a significant positive balance is required if the area is subject to heavy illegal hunting pressure (e.g. Zambezi Valley, Zimbabwe).
4.53 Policies for elephant conservation in southern Africa
4.5.3.LMinimumpopulations to be conserved in the region. The recent record of conservation in Africa has demonstrated clearly that, given present resources, it is unlikely that all elephant can be successfully conserved in all areas. In some countries there are adequate funds to conserve certain areas properly, provided all funds are concentrated in the areas chosen. Too often, in an attempt to conserve a number of very large areas, the available resources have been spread so thinly that no single area receives sufficient provision for adequate protection. In other countries budgets are inadequate to ensure the conservation of even minimum protected aras with elephants.
It is accepted that the level of funding required for any given area cannot simply be specified as a fixed cost per square kilometre. Small areas tend to cost more to protect than large areas because a certain minimum development is required regardless of size. National parks which have the full support of local people will cost less to protect than those which have been imposed on hostile rural populations. However, where international poachers cross borders, the support of local residents is unlikely to provide a substitute for costly anti- poaching operations. We have assumed that, at this stage in the
Table 4.19 Biological importance scores for elephant
1. Genetic rarity (Maximum score 15)
Rare and isolated population in a continental context Rare and important population in a regional context Not rare or unusual regionally
15 9 3
2. Population size (Maximum score 50)
Populations were scored using a graph (Fig. 3.1) which approximately follows the relationship:
Score = 100 x (1 __ e-O*mn)
Where n = population size/l weighting requirements.
.O. The final score is to accord with the
3. Conservation significance of the area (Maximum score 15)
Rare ecosystem containing other species of special interest 15 Rare ecosystem or other species of regional interest 12 Diverse ecosystem 9 Limited diversity/limited ecosystem 6 Ecosystem with no remarkable features 3
4. Natural security of area ~ (Maximum score 10)
A subjective appraisal of the degree to which natural features confer protection on the elephant population (e.g. vegetation cover, remoteness, distribution of water).
Good 9 Moderate 6 Poor 3
5. Research investment in the area (Maximum score 10)
No disruption to population, very good data base 10 Little disruption to population, good data base 8 Some disruption to population, good data base 6 Considerable disruption to population, limited monitoring 4 Very little research value or investment in the area 2
region’s development, few protected areas have the support of local people, international poaching is a common occurrence, and most protected areas where elephant occur are relatively large. This automatically implies a high level of funding for successful conservation, if we are to judge by the successes and failures within the region.
On the basis of the preceding arguments, we recommend that certain minimum populations in each country in the region should be selected as a priority for conservation. In the strategy which follows we have attempted to defme and identify such populations.
4.5.3.2. Remaining elephant populations. The selection of certain priority populations does not imply that the remainder should be allowed to disappear by default. It implies rather a different strategy towards their conservation. The minimum populations referred to in the previous section should be regarded as a priority for government funding. Governments should, however, re-examine their role in the conservation of the remaining elephants. This may require alteration to existing policies of state ownership of wildlife.
33

BIOLOGICAL IMPORTANCE
-100
Luangwa Valley (Zambia) Zam besi Valley
(Zimbabwe) 1 &?a --80 Kruger NP T
(South Africa)
Southern Sudan
(Sudan)
Zambesi Valley 1 e (Mozambique)
I Chobe NP
(Botswana) a’40 Kasungu NP
t ’ * (Malawi)
Amboseli NP
(Kenya) _ _ 20
Etosha NP (Namibia)
-iO $0 -;0 1
d ;0 4;
I-- I
40 ll0
I I
-20 60 80 100 160 180
CONSERVATION COSTS CONSERVATION STATUS
Figure 4.1 Conservation Costs and Conservation Status, plotted against Biological Importance Scores for seven areas in the southern region and two in the eastern region (see text for explanation)
. c

Table 4.20 Comparative biological importance for elephant populations from selected areas in southern Africa.
Country Genetic Selected area rarity
Population
size Ecosystem
rarity Natural
security Research
value Overall
total
Angola -mm _-__ ___m _- -_
Botswana Chobe NP 3 49 6 3 7 68
Malawi Kasungu NP 3 20 3 3 6 35
Mozambique Gorongosa NP Maputo GR Zambesi Valley
3 9 3
28 6
28
12 12 15
3 0 9
4 4 4
50 31 59
Namibia Etosha NP Kaokoland
9 27 15 3 9 63 15 6 15 3 4 43
South Africa Kruger NP Addo NP
3 45 9 3 9 69 15 1 12 6 10 44
Zambia Luangwa Valley Kafue NP
3 50 12 6 8 79 3 39 9 3 2 56
Zimbabwe Zambesi Valley Gonarezhou NP Hwange NP
3 47 12 6 8 76 3 37 12 3 8 63 3 49 6 3 8 69
Table 4.21 Priority ranking of selected protected areas within the Table 4.22 Summary of the indices for biological importance and southern African region. Scores are those for Biological rating for conservation success for selected areas within Importance using the criteria in Table 4.19. PA Priority southern and eastern Africa. (see Appendix 1 for details) refers to the protected area priorities of MacKinnon and MacKinnon (1986) Area Country Biological Conservation Balance
importance Costs Credits
Luangwa Valley Zambia 79 78 15 -63 Zambezi Valley Zimbabwe 76 58 114 +56 Kruger NP South Africa 69 87 250 + 163 Southern NP Sudan 67 90 8 -82 Etosha NP Namibia 63 18 129 +lll Zambezi GR Mozambique 59 33 11 -22 Chobe NP Botswana 68 25 18 -- 7 Kasungu NP Malawi 35 22 34 +12 Amboseli NP Kenya 34 25 22 -- 3
Rank Area Country Score PA Priority
1 Luangwa Valley Zambia ?9 A 2 Zambezi Valley Zimbabwe 76 A 3 Hwange NP Zimbabwe 69 B 4 Kruger NP South Africa 69 A 5 Chobe NP Botswana 68* B 6 Gonarezhou NP Zimbabwe 63 7 Etosha NP Namibia 63 8 Zambezi GR Mozambique 59 9 Kafue NP Zambia 56 10 Gorongosa NP Mozambique 50 11 Addo NP South Africa 44 12 Kaokoland Namibia 43 13 Kasungu NP Malawi 35 14 Maputo GR Mozambique 31
B C
(* Chobe NP scored a high priority based mainly on the very large number of elephant presently in the area. In the subsequent examination of conservation status this importance was lowered to a score of 50 since the area was considered stocked beyond a desirable level.)
35

Table 4.23 Proposed elephant baseline populations for southern Africa
Country and Minimum protected area population
Present population
Area sq. km
cost U.S.$/sq.km
Total cost U.S.$/year
Botswana Chobe NP Okavango
Malawi Kasungu NP
Mozambique Gorongosa NP
Zambesi Val. GR Maputo GR
Lugenda Valley
Namibia Etosha Pan NP Kaokolandl
South Africa Kruger NP
Addo NP2
Zambia Luangwa Valley Kafue NP Lower Zambezi NP Sioma-Ngwezi NP
Zimbabwe Zambezi Valley Hwange NP Gonarezhou NP
Totals
10,000 22,000 12,400 94 1,166,OOO 2,000 WOO 15,000 89 1,335,OOO
2,000 900 2,316 155 359,000
2,000 2,000 3,750 134 503,000
4,000 750 10,000 100 l,OOO,OOO 500 100 900 206 185,000
WOO 2,000 10,000 100 l,OOO,OOO
2,000 2,000 22,270 79 1,759,OOO 500 100 10,000 100 1,000,000
7,~ 7,800 19,485 82 1,598,OOO
1,000 120 80 430 34,000
2WO 25000 26,000 75 1,950,OOO 10,000 2500 22,400 78 1,747,OOO 2,000 2,000 2,000 162 324,000 2500 2,500 3,527 137 483,000
8,000 11,000 12,500 93 1,163,OOO 10,000 14,000 14,500 89 1,291,OOO
2,000 4,000 4,964 162 804,000
95,500 100370 192,092 17,701,000
Notes: 1. 2.
3.
It is intended here to increase the number of desert elephant to 500 to achieve a minimum viable population. It is appreciated that the existing Addo NP cannot ever support 1,000 elephants. The intention would be to translocate animals to other areas to achieve a minimum viable population. Angola was excluded from consideration because no information was available on elephant populations and the status of protected areas within that country.
36

Human interests should be paramount in the future of these elephants. It must be accepted that this could lead to the reduction or elimination of populations in areas where other land uses should take precedence. Even if governments had adequate funds to conserve such elephant in a typical protected area system it is not necessarily desirable to create new national parks. Policies for the sustainable utilisation of these elephant should be developed.
Management might involve the development of tourism, sport hunting, culling or other forms of utilisation. The responsibility for management should be delegated to the landholder (be it the state, private landholder or rural peasant) or, in the case of unsettled areas, to any reliable agency (government or private) willing and competent to undertake the appropriate development.
4.5.3.3 Ol?zer conservation issues.
i.
ii.
. . . 111
the southern region. To achieve this goal, the following steps are recommended:
A clear public statement of the new policy should be made.
n The required budget should be provided.
n The elephant populations should be managed to meet the minimum level. This does not necessarily imply a reduction in numbers but, in those cases where numbers are at present lower than recommended, every effort should be made to increase them.
n Population levels should be monitored by aerial surveys.
4.5.4.2 Remaining elephant populations. The priorites for action entail:
An examination of policy for the areas con .cerned. If agreed, policies should be adopted under which landowners have
The illegal trade in ivory, both within Africa and globally, rights to manage wildlife on their land and benefit directly.
needs to be reduced. International trade controls are I Land-use planning which assesses the economic value of
secondary to effective control at a national level. Emphasis wildlife.
should be placed on internal law enforcement rather than I The provision by governments of technical assistance to the external trade regulation. managers of the wildlife in these areas.
Management techniques for elephant need to be improved through applied research of an adaptive nature. 4.5.4.3 Other conservation issues
Improvement of the present information base on elephant g numbers and distribution is required. There is currently no reliable census data for half of the elephants in southern Africa.
4.5.4 Elements of a regional elephant conservation strategy
4.5.4.1 Minimum populations to be conserved. The baseline populations proposed for southern Africa are listed in Table 4.23. These represent the minimum set of populations which should be conserved on the basis of the arguments presented in the previous section. The expected costs for each area were calculated using the the system outlined in Appendix 1. It should be borne in mind that much of the projected conservation bill of U.S.$ 17,000,000 is already being met by government agencies in the region.
The above policy would entail protecting a regional population of less than 100,000 elephants at an annual cost of about U.S.$ 17,000,000 at current rates. The present populations in the n
designated areas are mostly above this level at present. The areas chosen also represent a range of the ecosystem types in
Illegal trade: The primary need is seen as the provision of institutions under which trade is unlikely to be illegal. It is better to know the full extent of the trade, even if it exceeds a sustainable yield, than to have it go underground. The present CITES quota system should be supported. There should be a greater emphasis on the reconciliation of national elephant management policies with the number of tusks appearing in the trade, rather than on simply examining whether the number of elephants dying is above or below a sustained yield. Under the present policies adopted by the majority of nation states whereby their declared intentions do not include any form of exploitation, many of the present quotas are a contradiction of stated aims. To improve law enforcement within Africa there is a need to strengthen anti-poaching forces in the field and to co-operate regionally in the development of intelligence systems.
Management skills: The present state-of-the-art of managing elephant populations is still in its infancy and both experimental and theoretical research is required to improve it.
Data base: The new elephant data base initiated under the auspices of UNEP should be supported as an AERSG project.
37

Chapter 5: Resources for Elephant and Rhino Conservation in Africa
Many African countries have proclaimed a large proportion of their land as national parks or equivalent protected areas. In eastern and southern Africa this proportion varies from 8% to as much as 17%. Few developing countries, however, have the fmancial and manpower resources to manage these areas as they would wish. A comparative study of various indicators of resources available to agencies (e.g. annual budgets, manpower, and equipment per man and per unit area managed) provides a useful starting point for gauging the resources necessary for succesful conservation and protected area management. Not only do conservationists seldom appreciate just how much it does cost to protect and manage national parks and equivalent areas, but they also seldom appreciate how much African governments spend on conservation. Comparative analyses of the resources available for conservation need to be extended to provide a sounder basis on which to assess the true costs of conservation action in Africa.
A questionnaire, very similar to that used for the 1981 AERSG meeting at Hwange (Cumming, Martin and Taylor, 1984), was sent to individuals and government agencies in 47 countries prior to the AERSG Nyeri meeting. The survey aimed to update and extend the information contained in the earlier survey on the resources of funds, manpower and equipment available to conservation agencies in Africa. In addition the questionnaire covered other aspects relating to policy and law enforcement for the conservation of elephants and rhinos.
Returns were received from only 14 countries and of these only three countries were covered in the previous survey. Despite the small size of the sample it does achieve a good spread across Africa and provide some insights into the problems faced by many conservation agencies. The budgets, manpower and equipment available to 13 conservation agencies (for which sufficient information was provided) are summarised in Table 5.1, while some policy and economic factors impinging on elephant and rhino conservation are summarised in Table 5.2. It is apparent from the data contained in Table 5.1 that there is a wide range in the availability of manpower, equipment and funds for wildlife conservation in the 13 countries surveyed.
5.1 Manpower
Bell and Clarke (1984) suggested a law enforcement staff density of 1: 50 km2 as a minimum requirement for areas containing elephants and a density of 1: 20 km2 for areas containing high priority species such as rhinos and gorillas. Some of the surveved countries (Table 5.1) are within or close to these Malawi,
m anpower Cameroon
requirements (South Africa, Zimbabwe, and Burkina Faso), but in a number of manpower density is well below such an other countries the
effective level (notably in Mozambique, Niger, Central African Republic, Congo and Zaire (apart from Garamba National Park)). To the list of countries with inadequate manpower for elephant and rhino protection could probably be added most of those which did not return questionnaires.
The efficiency of wildlife agencies obviously depends as much on the morale, discipline and level of training of staff as on the number of men and the availability of logistical support for field operations. Table 5.2 shows considerable variation in salaries paid in the various wildlife agencies. In some cases the monthly salary is well below that required to support a man and his family and is less than the value of a single kilogram of ivory. In-service training facilities are generally deficient; where training is arranged, this usually consists of basic para-military courses. The Garoua (Cameroon) and Mweka (Tanzania) colleges for more advanced training appear to be important channels through which wildlife management training is imparted to middle and senior African countries.
level wildlife officials in central and east
5.2 Equipment
The general shortage of manpower is aggravated by insufficient vehicles and other equipment to allow those men who are in the field to operate effectively. With the lack of employment opportunities in many African countries and the consequent willingness of citizens to work for very low salaries, wildlife agencies are able to employ relatively large staffs on limited budgets, but cannot acquire equipment such as vehicles, firearms and radios which must be imported. This situation is typified by Sudan, where the Wildlife Conservation and National Parks Forces can achieve a manpower density in the Sudanese wildlife area of 1 man: 85 km2, but can only supply one truck or 4-wheel drive vehicle for every 17,000 km2.
The wildlife agencies of Malawi, South Africa and Zimbabwe are reasonably well-equipped, and the equipment situation in Tanzania’s national parks is also relatively good as a consequence of foreign aid.
5.3 Funds
Parker (1979) and Bell and Clarke (1984) estimated that the minimum level of recurrent expenditure that wildlife agencies must maintain to protect adequately areas under their control is U.S.$200 per km2 per annum. Of the countries that were surveyed, only South Africa is maintaining expenditure above this level (Table 5.1). Zimbabwe has dropped below this level recently to U.S.$194 per km2 in 1986-87, whereas in 1980-81,
38

Table 52 So&-economic conditions for wildlife conservation
Country Elephant hunting allowed
wpotedicur - e
~imptmceofwildlifetorrcrfiout Service~in~e~
Cost of Penaity for Wildlife-based Sport hunting Direct return of Salaries In-setices Moraie hunting poaching in tourist industry industry revenue to local (US$ per year) training permit national park development funds Guard Warden facilities uss (1) (2) (3)
Burkina Faso NO S/A
YtS
NO
loo0
N/A
YtZS 360
10 Y
NO
10 v
YtZS
N/A
N/A
N/A
125
NO N/A
South Africa (Natal) INO N/A
YiS
YCS (Outside M’s)
400
1000 + taxon
ivory
NO N/A
YeS
UptoE8OO + 2-3 yrs prison
?
$2900 and/or 1 )zar prison
$30 +
Small. SlOOOOO p.a.
Significant
Significant. Sl million pa.
Virtually collapsed
Insignificant
Small? Some 1720 3’20 Some Moderate
Moderate
.Moderate
.Moderate
Improved
Cameroon
CentmA African Rep
.Modera te
Small. SlOOOOO p.a.
Virtually collapsed
Insignificant
Nil
sii
1400
1240
Some
Yone
cow Sil 3 Some ?
Guinea
Liberia
hhAawi
ti _Mmambique
Sl40
3
Ml ?
200
410
3 .
430
1100
Yone?
Xone
Some
None?
$110 or 1 year
P-n $325 (not enforced)
Smail. s107000 pa
None since 1981
Insignificant.
Collapsed
Some
(~0000)
xl lso 360
Xger Law enforcement almost non-
Very small iVi1 Sil l350 None
existant
Considerable. 960 million p.a. for SiL as a whole.
Small
Important relative to Tanzania’s economy but small relative to potential
Insignificant
Significant. S1.75 million p.a. in Natal alone.
Small
Important reiative to Tanzania’s economy but small relative to potential
Insignificant
Nil 1860 7830 Well- organised
Some
Ml
430 880
170 370
Xone
Some Tanzania (National Parks only)
Zyearsprison
zaim Law enforcement almost non- existent
Nil 96 Sane?
7660 Some Variable Zimbabwe Considerable Significant. S6O mill. pa $4.2 million
Yes. $330,000 in lS80 1986 = $0.24/ha
Notes: 1. Cost to non-resident (excluding fees of safari operator). 2. Guards = scouts, gards, cadres, pisteurs. 3. Wardens = officers, consetiers, conservateurs.
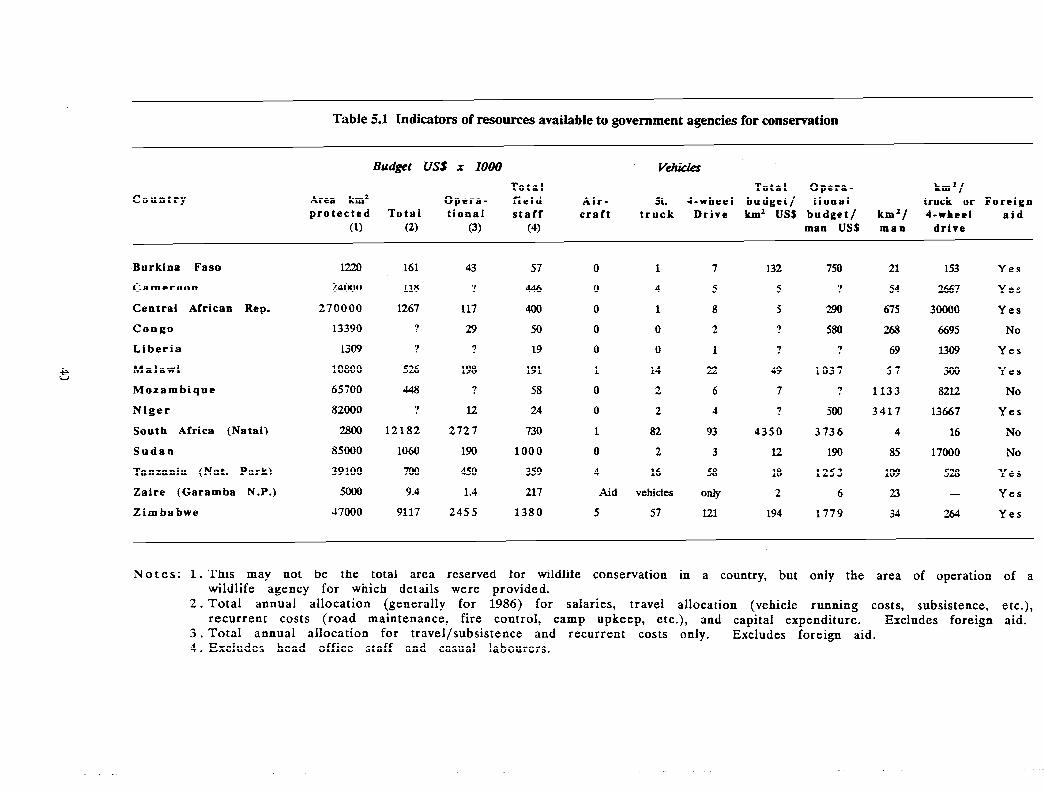
Table 5.1 Indicators of resources available to government agencies for conservation
Budset USS x 1000 VM
Country Total Total Opera- km2/
Area km2 Opera- field Air- 5t. Gwheei budget/ tional truck or Foreign protected Total tional staff craft truck Drive km2 USS budget/ km2/ 40wheel aid
(1) (2) (3) (4) man USS man drive
Burkina Faso
Cameroon
Central African Rep.
Congo
Liberia
Maiawi
Mozambique
Niger
South Africa (Natai)
Sudan
Tanzania (Nat. Park)
Zaire (Garamba N.P.)
Zimbabwe
24000
270000
13390
1309
10800
65700
82000
85000
39100
5000
47000
161
118
1267
9 .
?
526
448
?
12182
1060
700
9.4
9117
43
9 .
117
29
?
198
9
12
2727
190
450
1.4
2455
57 0
446 0
400 0
50 0
19 0
191 1
58 0
24 0
730 1
1000 0
359 4
217 Aid
1380 5
1
4
1
0
0
14
2
2
82
2
16
vehicles
57
7
5
8
2
1
22
6
4
93
3
58
OW
121
132
5
5
9 .
?
49
7
9 .
4350
12
18
2
194
750
9
290
580
9
1037
?
500
3736
190
1253
6
1779
21
54
675
268
69
57
1133
3417
4
85
109
23
34
153
2667
30000
6695
1309
300
8212
13667
16
17000
528
-
244
Yes
Yes
Yes
No
Yes
Yes
No
Yes
No
No
Yes
Yes
Yes
Notes: 1.
2.
3. 4.
This mav not be the total area reserved for wildlife conservation in a country,
wildlife *agency for but only the area of operation of a
which details were provided. Total annual allocation (generailv for 1986) for salaries. travei allocation (vehicle running costs, subsistence. etc.), recurrent costs (road maintenance, fire control, camp upkeep, etc.), and capital expenditure. Excludes foreigh aid. Totai annual allocation for travel/subsistence and recurrent costs only. Excludes foreign aid. Excludes head office staff and casual labourers.
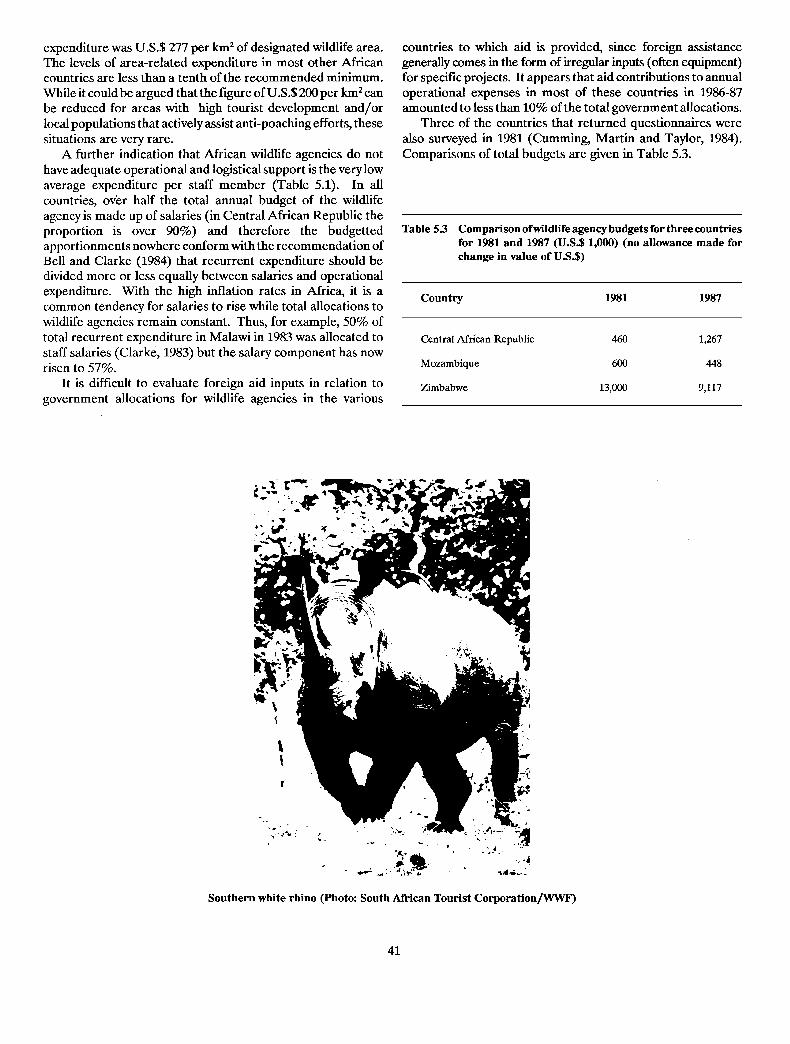
expenditure was U.S.$277 per km2 of designated wildlife area. The levels of area-related expenditure in most other African countries are less than a tenth of the recommended minimum. While it could be argued that the figure of U.S.$200 per km2 can be reduced for areas with high tourist development and/or local populations that actively assist anti-poaching efforts, these situations are very rare.
A further indication that African wildlife agencies do not
have adequate operational and logistical support is the very low average expenditure per staff member (Table 5.1). In all countries, over half the total annual budget of the wildlife agency is made up of salaries (in Central African Republic the proportion is over 90%) and therefore the budgetted apportionments nowhere conform with the recommendation of Bell and Clarke (1984) that recurrent expenditure should be divided more or less equally between salaries and operational expenditure. With the high inflation rates in Africa, it is a
common tendency for salaries to rise while total allocations to wildlife agencies remain constant. Thus, for example, 50% of total recurrent expenditure in Malawi in 1983 was allocated to staff salaries (Clarke, 1983) but the salary component has now risen to 57%.
It is difficult to evaluate foreign aid inputs in relation to government allocations for wildlife agencies in the various
countries to which aid is since foreign assistance generally comes in the form of irregular inputs (often equipment) for specific projects. It appears that aid contributions to annual operational expenses in most of these countries in 1986-87 amounted to less than 10% of the total government allocations.
Three of the countries that returned questionnaires were also surveyed in 1981 (Cumming, Martin and Taylor, 1984).
Comparisons of total budgets are given in Table 5.3.
Table 53 Comparison ofwildlife agency budgets for three countries for 1981 and 1987 (U.S.$ 1,000) (no allowance made for change in value of U.S.$)
Country 1981 1987
Central African Republic 460 1,267
Mozambique 600 448
Zimbabwe 13,000 9,117
Southern white rhino (Photo: South African Tourist Corporation/WWF)
41

5.4 Management and Protection Policies
The hunting of elephant is allowed in six of the 14 countries from which questionnaires were returned (Table 5.2). This refers essentially to sport hunting; in all countries elephants are shot in protection of people and crops. Control hu .nting is undertaken by government st :aff (although Sudanese citizens can kill marauding elephants provided they report their actions to wildlife oflicials), and invariably the meat is given or sold cheaply to the local people while the tusks are taken by the state. Black rhinos cannot be legally hunted in any country, while white rhinos can be hunted on licence in South Africa and Zimbabwe.
The cost of elephant hunting permits varies greatly among the countries that allow sport hunting, with some countries seriously undervaluing their elephants. Zimbabwe has the highest licence fees, and the revenue derived from elephant hunting is further increased because trophy bulls are offered only on the longer safaris, hence generating the maximum possible number of “hunter-days”.
Elephant skin is not considered as a valuable resource except in southern Africa where the dried, salted, skin of an elephant is worth about U.S.$600. No concerted effort is made elsewhere in Africa to process the skins of elephants shot on safaris or control work.
The full value of the elephant resource is seldom realized in countries with depressed economies. The mechanisms for
5.5 Identified Deficiencies
The responses to a question on the fundamental weakness in the effective enforcement of protection for rhinos and elephants in each country can be classified as follows:
5.5.1 Staff problems
I Insufficient manpower in wildlife agencies (Zimbabwe, Liberia, Guinea).
I Insufficiently motivated staff (Niger, Zaire, Tanzania, Central African Republic).
5.5.4 Political problems using the resource in a controlled and profitable way (through tourism, sport hunting or cropping) to promote species n
conservation have not been developed. A vicious circle exists: wildlife tourism and safari hunting could generate substantial _
Government not supporting wildlife conservation sufficiently (Guinea, Central African Republic).
Populace lacking conservation awareness (Mozambique, Burkina Faso, Central African Republic).
Neighbouring states not cooperating in controlling cross- border poaching (Zimbabwe).
5.5.2 Equipment problems
D Insufficient equipment to combat poaching (Sudan, Zimbabwe, Liberia, Cameroon).
5.53 Law enforcement problems
I Wildlife legislation weak (Malawi, Cameroon, Zaire).
n Law enforcement agencies not operating efficiently or courts not imposing sentences strictly (Liberia, Mozambique, Tanzania, Zaire).
foreign currency in most of these countri and low government investment preclude the necessary infrastructure.
.es, but poor security the est ablishment of
Penalties for elephant and rhino poaching are also very low in these countries. Poachers can sell ivory at prices that make the risk of prosecution worth taking. -Poaching is further 5.5.5 Trade problems
aggravated by the low average incomes in these parts of Africa. The incentive to poach is often increased by extremely weak law n “International trade causing poaching” (Congo, Tanzania).
enforcement, and lack of cooperation between court officials, police and wildlife staff. It is clear that on a continental level measures for protection
of elephants and rhinos are totally inadequate, and the economic benefits of wildlife are hardly being realized, except by poachers and illegal dealers. There is no evidence that the situation has improved over the last six years and this is reflected in the continuing downward trends in both rhino and elephant populations (see Chapters 2 to 4).
42

Chapter 6: A Review of the Ivory and Rhino Horn Trades
Ivory and rhino horn are valuable products. The value of raw ivory in Africa can exceed U.S.$250 per kg while rhino horn is valued at between U.S.$750 and U.S.$ 1,000 per kg. The illegal trade in rhino horn has been almost entirely responsible for the drastic decline of black rhino over most of its range in Africa during the last 15 years. The illegal trade in ivory now greatly exceeds the legal trade and Africa’s elephants are consequently being harvested at rates far higher than can be sustained. An important AERSG responsibility is to assist in the study and monitoring of the ivory and rhino horn trades. The topic has been addressed at each of the AERSG meetings and in studies conducted by members of the Group. At the request of the CITES Secretariat reports were prepared on the ivory quota system and on the rhino horn trade for the 6th Conference of the CITES Parties held in Ottawa, Canada, in July 1987.
These reports are presented below with some subsequent updating. The original reports provided the background documents to the development of six resolutions of the Comerenoe of the Parties relating to the ivory trade and conservation of elephants and to a major resolution on the rhino horn trade and the conservation of rhino. The text of these resolutions is contained in Appendix 4.
The report on elephant numbers, trends and the ivory quota system is based on material presented and generated at the AERSG Nyeri meeting in Kenya, in May 1987, and was written by R.B. Martin and D.H.M. Cumming and presented on behalf of the AERSG. Likewise the report on the trade in rhino horn was prepared by E. Bradley Martin from his continuing studies of the problem and with critical input from the Nyeri meeting.
6.1 Elephant Population Estimates, Trends, Ivory Quotas and Harvests
6.1.1 Population estimates
For the purposes of this analysis of the ivory trade and quota system, estimates for African elephant population (Table 6.1) were taken from the AERSG meeting held at Hwange in 1981, R.B. Martin’s report to the CITES Secretariat on the quota system in 1985, and the AERSG meeting held at Nyeri, Kenya, in May 1987. The UNEP/GRID estimates prepared by I. Douglas-Hamilton and A. Burrill are shown in Table 6.2, though these were not available at the time the analysis was carried out. Notes on these estimates follow.
The West African data are not particularly significant in the context of the CITES quota system. The West African population is less than 3% of the total African population, and no countries from West Africa have set ivory export quotas. The data for all
the countries are population trend.
too poor to allow a meaningful statement of
The Central African data are equally poor. The Zaire elephant population could lie anywhere between 100,000 and 800,000 animals. The apparent increases in the Cameroon, Congo and Gabon elephant populations over the past 6 years are a reflection of improved estimates rather than any real increase. Recent work by R. Barnes suggests that the Gabon population is about 55,000 animals; however the Gabonaise authorities have estimated the population at 93,000 in their latest quota submission and the AERSG group working on Central Africa put the population at 76,000. This serves to illustrate the level of accuracy involved.
In East Africa there has been no recent survey for Ethiopia and the estimate of the Wildlife Conservation Organisation for their quota submission has been taken to apply to all three years. The Kenya decline from 65,000 elephants to 35,000 elephants is spectacular and data can be expected to be better than for most countries. The 1987 Somalia estimate of 6,000 is no more than an educated guess based on reports of deteriorating range conditions in the country. Similarly, the latest estimate of 40,000 elephants in the Sudan has no sound backing. The Tanzania estimates since 1981 are doubtful, but if the decline in the Selous Game Reserve population can be taken as an indicator, elephants are unlikely to be present at densities greater than 1 per sq km anywhere in Tanzania. Recent estimates by the government (quota submission) of 20,000 elephant in Rungwa (1,200 sq km) and 50,000 in Moyowosi (6,QOO sq km) are unlikely. In the Southern Region, estimates vary from excellent to very poor. Counts in Botswana, South Africa, Namibia and Zimbabwe are likely to be fairly accurate, whilst in Zambia, Mozambique and Angola the information is either incomplete or absent. The 1987 estimates are summarized in Table 6.2.
It would appear that the African elephant population has decreased by some 36% since 1981. However, it is stressed that the data for some of the largest populations on the continent (e.g. for Zaire) are extremely crude. It is necessary to point out that the population estimates critically affect the deductions made later in this report. If indeed elephant populations in certain countries (Zaire, Sudan, Kenya, Tanzania, Mozambique and Zambia) have declined as greatly as the AERSG figures indicate, then this implies very large quantities of ivory entering the world market.
6.1.2 Trends
The data for individual countries in the Western and Central regions are not good enough to present clear trends. The
43

Table 6.1 Elephant population estimates, trends, ivory quotas and harvests
Country Population estimates
1981 1985 1987
Trend Elephant Est’d No Quota Quota as Tusks % of Exports: Illegal Quota Old killed of tusks (tusks) % of el. exported quota % of el. harvest 1987 Stock
%pa in 1986 produced 1986 kiIled 1986 used kiIIed (No eL)
West Africa
Benin Burkina Faso Ghana Guinea Ivory Coast Liberia Mali Mauritania Niger Nigeria Senegal Sierra Leone Togo
Subtotal
1,250 2,300 3,500 3,500
970 1,~ 800 800
4,800 4,800
2WO 800 780 700 40 0
800 800 1,820 1,500
370 100 500 500 150 100
17,780 16,900
2,100 - 3,900 - 1,100 -
320 - 3,300 -
650 - 600 - 20 -
800 - 3,100 -
50 - 250 - 100 -
16,290 -1.7
99 188 184 350 52 99 15 29
156 2% 31 59 28 53
1 2 38 72
147 279 2 4
12 23 5 10
770 1,464
1 1 - 0 0 12,400 21,200 - 1,269 2,411 19,500 19,000 - 1,138 2,162 2,500 3,100 - 186 353
59,000 61,000 - 3,652 6,939 1,800 500 - 30 57
48,000 76,000 - 4,550 8,645 523,000 195,000 - 11,675 22,183
666400 375,800 -2.8 22,500 42,751
0 0 0 0 0 0 0 0 0 0 0 0 0
0
0.0 99 0.0 184 0.0 52 0.0 15 0.0 156 0.0 31 0.0 28 0.0 1 0.0 38 0.0 147 0.0 2 0.0 12 0.0 5
0 0 0 0 0 0 0 0 0 0 0 0 0
0 0
0 0.0 0.0 0.0 0.0 0.0 0.0 0.0 0.0 0.0 0.0 0.0 0.0 0.0
- 0
0 0
0 0.0 0.0 770
Central Africa
em (22,989) 12.4 100 0.0 0 0.0 0
17.3 610 0.0 0 0.0 0
45.1 1,425
26.9 2,135
no quota -- 33.3 4.1
- 0.0 0.0
50.8 8.8 0.0 0.0
14.3 6.4
Burundi Cameroon Centr Afr Rep Chad Congo Equat.Guinea Gabon (NP) Zaire
Subtotal
1
5,m 31,000
10,800 -
13,400 376,000
436,200
300 0 0
1,200 -
0 10,000
11,500
300 800 320 0
3,784 4,547 0
2,600 12,153 15,000
22,804 16,700
1,217 1,138
186 3,331
30 4,550
10,925
21377 18.6 5.0
Note: M = population managed for a specific level.

Table 6.1 (continued) Elephant population estimates, trends, ivory quotas and harvests
Country Population estimates
1981 1985 1987
Trend Elephant Est’d No Quota Quota as Tusks % of Exports: Illegal Quota Old killed of tusks (tusks) % of el. exported quota % of el. harvest 1987 Stock
% p.a in 1986 produced 1986 killed 1986 used killed (No el.)
East Africa
Ethiopia (NP) 9,m 9,m 6,650 - Kenya 65,056 28,000 35,000 -13.3 Rwanda 150 100 70 - Somalia 24,323 8,600 6WO -33.4 Sudan 133,772 32,300 40,000 -29.5 Tanzania 203,900 216,000 100,000 -15.7 Uganda (NP) 2,320 2,000 3,000 -
Subtotal 438,521 296,000 190,720 -18.9
400 760 700 92.1 640 91.4 84.2 63 530 6,600 12,540 2,000 15.9 0 0.0 0.0 6,600 2,000
2 4 0.0 0 - 0.0 2 0 3,500 6,650 17,002 255.7 16,986 99.9 255.4 -5,440 0
18,500 35,150 12,971 36.9 13,009 100.3 37.0 11,653 21,500 22,200 42,180 16,400 38.9 2,001 12.2 4.7 21,147 18,150
200 380 0 0.0 0 - 0.0 200 302
172 800
21,500
2,ooo 156
51,402 97,664 49,073 50.2 32,636 66.5 33.4 34,225 42,482 24,628
Southern Africa
Angola Botswana Malawi Mozambique Namibia South Africa Zambia Zimbabwe
12,400 12,400 12,400 - 2,001 3,802 - 0.0 20,000 45,300 51,000 6.0 300 570 520 91.2 4,500 2,400 2,400 - 150 285 20 7.0
54,800 27,400 18,600 -25.5 7,200 13,680 120 0.9 2,300 2,000 5,000 M 500 950 1,376 144.8 8,000 8,300 8,200 M 500 950 12,100 1,273.7
160,000 58,000 41,000 -34.2 11,600 22,040 5,800 26.3 49,000 47,000 43,000 M 5,000 9,500 14,000 147.4
311,000 202,800 181,600 -11.3 27,251 51,777 33,936 65.5
0 - 0.0 14 2.7 2.5 20 100.0 7.0 96 80.0 0.7 50 3.6 5.3
4,197 34.7 441.8 2,961 51.1 13.4
507 3.6 3.9
70
279
Subtotal 7,845 23.1 15.2
2,001 0 293 520 139 150
7,149 200 474 1,033
-1,709 14,000 10,042 8,500 4,733 9,000
23,122 33403
6,100 4,572
11,021
Grand Totals 1$03,501 1,181,900 764,410 -8.8 101,923 193,653 94,509 48.8 42,616 45.1 22.0 79,494 98,689 52249
Note: M = population managed for a specific level; NP = National Parks.
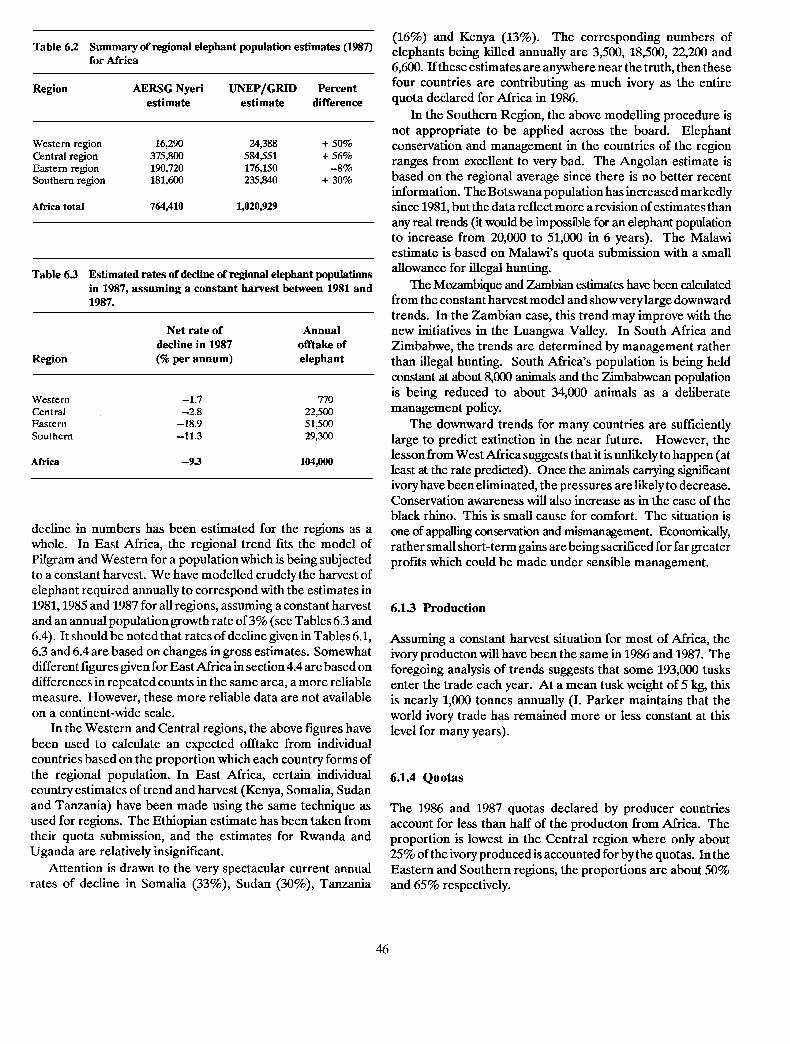
Table 6.2 Summary of regional elephant population estimates (1987) for Africa
Region AERSG Nyeri UNEP/GRID Percent
estimate estimate difference
Western region 16,290 24,388 + 50% Central region 375,800 584,551 + 56% Eastern region 190,720 176,150 -8% Southern region 181,600 235,840 + 30%
Africa total 764410 1,020,929
Table 63 Estimated rates of decline of regional elephant populations in 1987, assuming a constant harvest between 1981 and 1987.
Region
Net rate of decline in 1987 (% per annum)
Annual offtake of elephant
Western Central Eastern Southern
-1.7 770 -2.8 22,500
-18.9 51,500 -11.3 29,300
Africa -93 104,000
decline in numbers has been estimated for the regions as a whole. In East Africa, the regional trend fits the model of Pilgram and Western for a population which is being subjected to a constant harvest. We have modelled crudely the harvest of elephant required annually to correspond with the estimates in 1981,1985 and 1987 for all regions, assuming a constant harvest and an annual population growth rate of 3% (see Tables 6.3 and 6.4). It should be noted that rates of decline given in Tables 6.1, 6.3 and 6.4 are based on changes in gross estimates. Somewhat different figures given for East Africa in section 4.4 are based on differences in repeated counts in the same area, a more reliable measure. However, these more reliable data are not available on a continent-wide scale.
In the Western and Central regions, the above figures have been used to calculate an expected offtake from individual countries based on the proportion which each country forms of the regional population. In East Africa, certain individual country estimates of trend and harvest (Kenya, Somalia, Sudan and Tanzania) have been made using the same technique as used for regions. The Ethiopian estimate has been taken from their quota submission, and the estimates for Rwanda and Uganda are relatively insignificant.
Attention is drawn to the very spectacular current annual rates of decline in Somalia (33%), Sudan (30%), Tanzania
(16%) and Kenya (13%). The corresponding numbers of elephants being killed annually are 3,500, 18,500, 22,200 and 6,600. If these estimates are anywhere near the truth, then these four countries are contributing as much ivory as the entire quota declared for Africa in 1986.
In the Southern Region, the above modelling procedure is not appropriate to be applied across the board. Elephant conservation and management in the countries of the region ranges from excellent to very bad. The Angolan estimate is based on the regional average since there is no better recent information. The Botswana population has increased markedly since 1981, but the data reflect more a revision of estimates than any real trends (it would be impossrble for an elephant population to increase from 20,000 to 51,000 in 6 years). The Malawi estimate is based on Malawi’s quota submission with a small allowance for illegal hunting.
The Mozambique and Zambian estimates have been calculated from the constant harvest model and show very large downward trends. In the Zambian case, this trend may improve with the new initiatives in the Luangwa Valley. In South Africa and Zimbabwe, the trends are determined by management rather than illegal hunting. South Africa’s population is being held constant at about 8,000 animals and the Zimbabwean population is being reduced to about 34,000 animals as a deliberate management policy.
The downward trends for many countries are sufficiently large to predict extinction in the near future. However, the lesson from West Africa suggests that it is unlikely to happen (at least at the rate predicted). Once the animals carry& sign&ant ivory have been eliminated, the pressures are likely to decrease. Conservation awareness will also increase as in the case of the black rhino. This is small cause for comfort. The situation is one of appalling conservation and mismanagement. Economically, rather small short-term gains are being sacrificed for far greater profits which could be made under sensible management.
6.13 Production
Assuming a constant harvest situation for most of Africa, the ivory producton will have been the same in 1986 and 1987. The foregoing analysis of trends suggests that some 193,000 tusks enter the trade each year. At a mean tusk weight of 5 kg, this is nearly 1,000 tonnes annually (I. Parker maintains that the world ivory trade has remained more or less constant at this level for many years).
6.1.4 Quotas
The 1986 and 1987 quotas declared by producer countries account for less than half of the producton from Africa. The proportion is lowest in the Central region where only about 25% of the ivory produced is accounted for by the quotas. In the Eastern and Southern regions, the proportions are about 50% and 65% respectively.
46
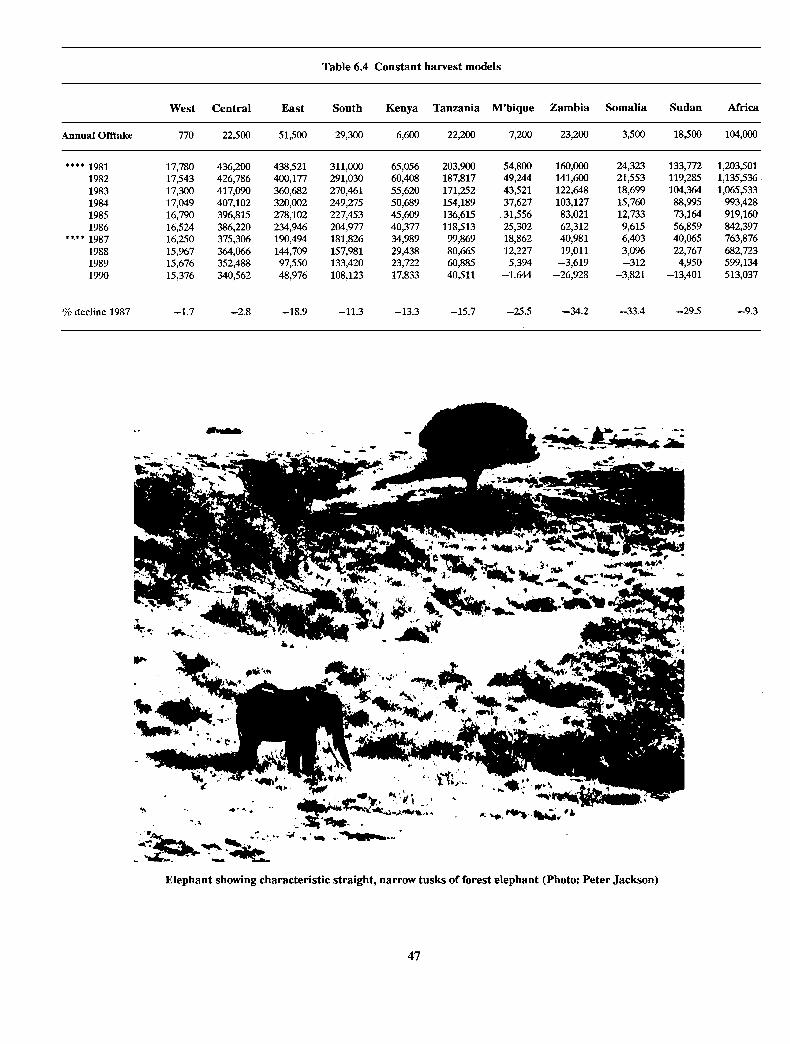
Table 6.4 Constant harvest models
West Central East South Kenya Tanzania M’bique Zambia Somalia Sudan Africa
Annual Offtake 770 22,500 51$HI 29,300 6,600 22,200 7,200 23,200 3,500 18,500 104,000
**** 1981 17,780 436,200 438,521 311,000 65,056 203,900 54,800 160,000 24,323 133,772 1,203,501 1982 17,543 426,786 400,177 291,030 60,408 187,817 49,244 141,600 21,553 119,285 1,135,536
1983 17,300 417,090 360,682 270,461 55,620 171,252 43,521 122,648 18,699 104,364 1,065J33
1984 17,049 407,102 320,002 249,275 50,689 154,189 37,627 103,127 15,760 88,995 993,428
1985 16,790 396,815 278,102 227,453 45,609 136,615 31,556 83,021 12,733 73,164 919,160
1986 16,524 386,220 234,946 204,977 40,377 118,513 25,302 62,312 9,615 56,859 842,397 **.** 1987 16,250 375,306 190,494 181,826 34,989 99,869 18,862 40,981 6,403 40,065 763,876
1988 15,967 364,066 144,709 157,981 29,438 80,665 12,227 19,011 3,096 22,767 682,723 1989 15,676 352,488 97,550 133,420 23,722 60,885 5,394 -3,619 -312 4,950 599,134
1990 15,376 340,562 48,976 108,123 17,833 40,511 -1,644 -26,928 -3,821 -13,401 513,037
% decline 1987 -1.7 -2.8 -18.9 -11.3 -13.3 -15.7 -25.5 -34.2 -33.4 -29.5 -9.3
Elephant showing characteristic straight, narrow tusks of forest elephant (Photo: Peter Jackson)
47

In some individual countries, the quota is greater than the total national production. This applies when a country claims relatively large stocks of old ivory on hand (e.g. Somalia, which recently exported about 50 tonnes of old stock, and South Africa which produces relatively little ivory but has a large ivory industry). The Zimbabwe quota is greater than the number of tusks which were produced simply because fewer elephants were killed in 1986 than was intended.
It is important to note that at this stage in the development of the quota system, it is somewhat early to judge the validity of claims for large existing stocks of ivory. Such declared ivory stocks should work their way out of the quota system within one or two quota years. Thereafter, the apearance of any new stockpiles should be apparent.
6.15 Legal exports of ivory against decIared quotas
Only 45% of the total quota declared by producer countries appears to have been used according to data from the CITES Ivory Unit and the Wildlife Trade Monitoring Unit. Only Sudan, Ethiopia, Malawi and Mozambique exported amounts close to those declared. In certain cases (e.g. Zimbabwe), although the quota provided a contingency for a large number of tusks to be exported, most of the ivory was consumed in domestic carving industries.
No countries exceeded their quotas. However, this is a Pyrrhic victory. The trend data indicate that large numbers of elephants were killed in the 1986 quota year,and the inevitable conclusion is that most of this ivory was not recorded as legal tade. When legal exports are compared with elephants killed, they account for only 22% of the producton. The tusks of some 89,000 elephants entered the trade illegally during the 1986 quota year. Two situations account for this:
E In certain countries, the authorities lack the resources to enforce the law. Although the state claims ownership of the resource, it is unable to implement its policies.
In other countries, widespread corruption mocks all at rational management of elephant populations.
attempts
In several countries, both of these problems exist. Burundi had no quota and exported 23,000 tusks in 1986 (Wildlife Trade Monitoring Unit data). Unofficial estimates suggest that considerably more (50,000 tusks) left the country. Burundi derives most of its ivory from T anzania, Zaire and Zambia. Even an amount of 50,000 tusks accounts for only a quarter of the predicted illegal trade. There is good evidence to suggest that large quantities of ivory are moving from central Africa to the Ivory Coast and other West tiican countries, that significant trade takes place through the Sudan, and that some ivory leaves Africa directly from the east coast.
It is wrong to assume that all of the unaccounted-for production leaves Africa as raw ivory. A large quantity goes into the domestic carving industries. This is particularly true in most of the Central and West Africa urgent need for a quantitative study
countries. There is an of the internal
industry in Africa. Certain countries show a negative value for the illegal
harvest of elephants. This apparent contradiction arises when a country has a relatively low production of ivory but intends, nevertheless, to export a large quantity (e.g. South Africa and Somalia). This situation can only pertain while countries have existing stocks. It should be noted that with an annual production of less than 1,000 tusks, the accumulation in South Africa either represents about 14years of production (which is commercially unlikely) or recently acquired significantly large stocks.
6.1.6 Individual quota submissions
Of the 18 countries which submitted non-zero quotas in 1986 and 1987, only the following submitted their quotas in the full format recommended by the CITES Secretariat: Cameroon, Chad, Congo, Ethiopia, Gabon, Malawi, Tanzam ‘a, Zambia and Zimbabwe. Before discussing individual countries, it is perhaps worth restating the intended function of the quota submisson. The forms developed by R.B. Martin are intended to reflect the management policies for elephants in any given country.
Quotas should be the end result of a logical process whereby a country estimates its elephant populations, calculates how many will die as a result of its management policy, and after allowing for existing stocks, provides an estimate of raw ivory which may enter the international trade. Estimates for large amounts of ivory which may be confiscated should not appear on the quota submission (e.g. Zambia, Tanzania), since it is not a result of desired management. If large amounts of ivory should be acquired in the quota year, there is no difficulty in advising the CITES Secretariat that this will be exported over and above the original quota (in effect, the quota can be revised at any time during the year). There is no obligation for any country to use the format provided for submitting quotas. Nevertheless, by not doing so, there will inevitably remain an atmosphere of doubt surrounding the sincerity of intentions of any country which simply states a exported. This is particularly true
. lf
number of tusks to be the quota is high and the
country does not have a policy to exploit elephants. In the case of Sudan which banned all ivory exports in 1983,
quotas were submitted to clear l3,OOO tusks in 1986 and 21,500 tusks in 1987. This represents about 18,000 elephants, which would not be a sustainable yield from a population of 350,000 elephants, let alone the current estimate of about 100,000 elephants by the authorities in the country, or the AERSG estimate of 40,000 elephants.
The Tanzanian quota submission for 1987 is bound to give rise to query. In 1986, a quota of 16,000 was submitted of which only 2,000 tusks were exported. This year, the quota is for 18,000 tusks, of which about 7,000 will arise from elephants dying in the quota year, 2,000 are current stocks and 9,000 will be confiscated during the year. This implies that poaching cannot be prevented.
It is clear from many of the detailed submissons that the method of deriving the quota is not fully understood. Certain submissions contain arithmetic errors and contradictions. In

one country, where there is no policy to cull, crop, or control problem elephants, large numbers in each of these categories have been entered.
Very good submissions were received from Chad, Congo, Ethiopia, Malawi, Zambia and Zimbabwe. These reflect the management policies of the countries and are biologically realistic.
6.1.7 Conclusions
There is undoubtedly a massive illegal ivory trade operating over and above the legal quota system. Some criticisms have been levelled at the quota system because of this. This is not logical. The quota system was the brainchild of the producer countries, and it was an attempt to bring this situation under control. Properly used, the quota system is no more than a statement of intent by producer countries arising from their management policies. It appears to be working in those countries where law enforcement is effective. More importantly the quota system, in conjunction with data on elephant numbers and trends, has provided the means for determining the extent of both the legal and illegal trade in ivory. This data can provide basis for programmes to reduce and eventually eliminate the illegal trade in ivory.
It may be tempting for Parties to propose a complete ban on the ivory trade. The futility of pursuing a legal export system while the vast bulk of trade remains illegal appears to provide sound grounds for such an action. Nevertheless, such a proposal is unlikely to succeed and the following points need to be taken into account:
It is apparent that the illegal trade is already highly successful. A ban would not work. It has not worked for rhino horn.
The investment in ivory worldwide is too great to countenance a ban. Such an action may well result in the withdrawal of several Parties from the convention.
It is highly undesirable for all trade to become illegal. This leads to a situation where nothing can be monitored or controlled.
The quota system is in its infancy and the illegal trade is still of such magnitude that it is too early to judge its effectiveness.
Some countries are managing and conserving their elephant populations satisfactorily. They should not be penalised because of the problems in other countries.
There is a need to address elephant management and law enforcement problems in the producer countries.
There are still approximately 750,000 elephants in Africa. The species is not yet endangered but will become so if the illegal tade continues at present levels.
At this stage, the AERSG believes that positive management ror the conservation of elephants in Africa is more likely to succeed than ineffectual international trade bans.
6.2 Rhino Horn Trade
6.2.1 Introduction
Since 1970 the world’s rhino population has declined by about 85%. Of those surviving in Africa, the best protected are the southern white rhinos of southern Africa. These have built up over the last 50 years from a nucleus of under 100 to over 4,000 today. In contrast, less than 30 northern white rhinos exist compared with thousands in the 1960s. The black rhino has also been heavily poached in most parts of its formerly extensive range in Africa due to the demand for rhino horn in North Yemen (to make dagger handles) and in eastern Asia (to make traditional medicines).
The black rhino population stood at 65,000 seventeen years ago, but numbers about 4,000 today. Poaching has been particularly severe in Chad, the Central African Republic, all countries in East Africa, Zambia, Mozambique and Angola. Illegal killing of the last major population in the Zambezi Valley of Zimbabwe started in late 1984 with a number of people being killed and wounded in clashes between anti-poaching forces and well-armed commercial poachers from Zambia. These poachers kill only a few elephants in addition to rhinos, since it is solely the high demand for rhino horn that induces them to risk death by intruding into Zimbabwe.
In Asia 1,700 great one-horned rhinos, 500-900 Sumatran rhinos and less than 60 Javan rhinos are all that remain. Since 1982 the main great one-horned rhino population in India’s state ofAssam has been seriously poached, though this situation has since been bought under control. Sumatran rhinos in Sabah and Indonesia are also being killed in order to supply Asian markets with horn and other rhino products.
6.2.2 Status of the major rhino populations
India: The world’s largest population of great one-horned rhinos, about 1,300, survives in India. In 1982 a heavy outbreak of rhino poaching began in Assam due to breakdown of law and order and an influx of automatic weapons from neighouring Nagaland. A minimum of 233 rhinos were illegally killed between 1982 and 1985 in Assam. The horn was exported to Singapore; however, some African horn is sold in parts of western India. Strong an&poaching measures have now stabilised the situation.
Indonesia: There remain about 400-800 Sumatran rhino. Rhino are poached and horn is exported via Singapore. Resident Chinese have reduced consumption of Sumatran rhino products; in 1986 only 6% of the pharmacies in Djakarta were offering rhino horn for sale as opposed to 27% in 1980. The last of the Javan rhinos are maintained in a national park on the western tip of Java, but this population remains extremely vulnerable and some poaching has occurred in recent years. Malaysia: An estimated 200 Sumatran rhinos occur, and they are well protected on the Peninsula. The most vulnerable
49
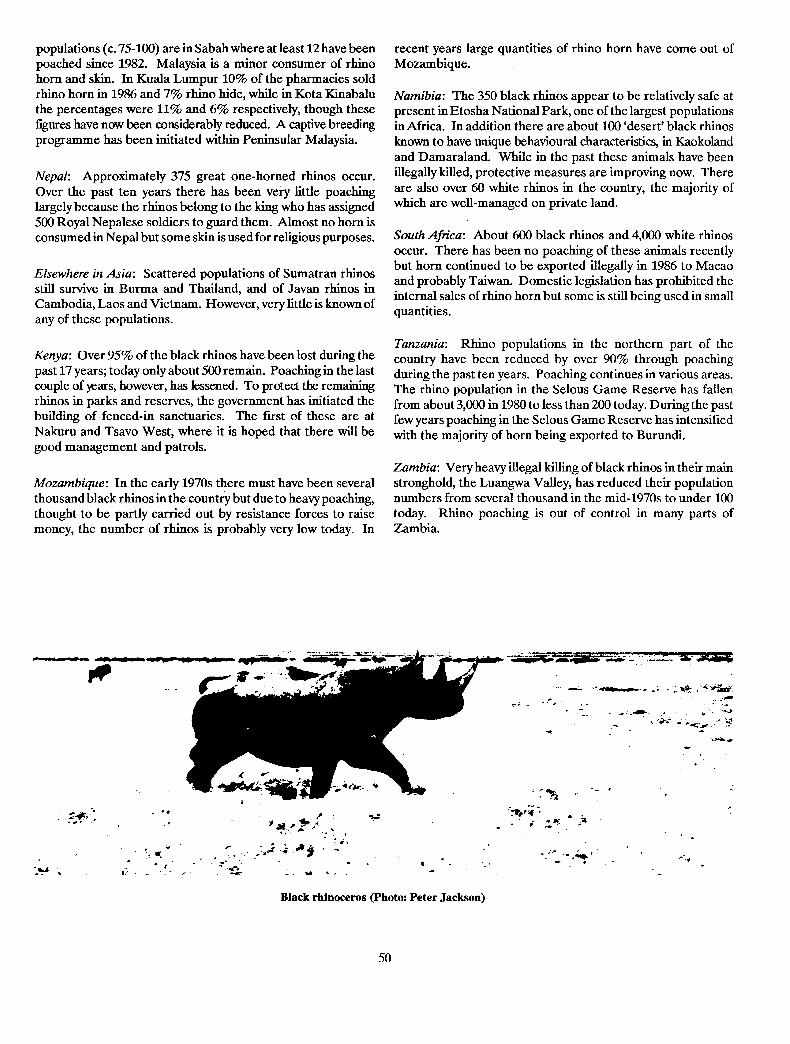
populations (c. 75400) are in Sabah where at least 12 have been poached since 1982. Malaysia is a minor consumer of rhino horn and skin. In Kuala Lumpur 10% of the pharmacies sold rhino horn in 1986 and 7% rhino hide, while in Kota Kinabalu the percentages were 11% and 6% respectively, though these figures have now been considerably reduced. A captive breeding programme has been initiated within Peninsular Malaysia.
NepaZ: Approximately 375 great one-horned rhinos occur.
Over the past ten years there has been very little poaching largely because the rhinos belong to the king who has assigned 500 Royal Nepalese soldiers to guard them. Almost no horn is consumed in Nepal but some skin is used for religious purposes.
Elsewhere in Asia: Scattered populations of Sumatran rhinos still survive in Burma and Thailand, and of Javan rhinos in Cambodia, Laos and Vietnam. However, very little is known of any of these populations.
Kenya: Over 95% of the black rhinos have been lost during the past 17 years; today only about 500 remain. Poaching in the last couple of years, however, has lessened. To protect the remaining rhinos in parks and reserves, the government has initiated the building of. fenced-in sanctuaries. The first of these are at
Nakuru and Tsavo West, where it is hoped that there will be good management and patrols.
Mozambique: In the early 1970s there must have been several thousand black rhinos in the country but due to heavy poaching, thought to be partly carried out by resistance forces to raise money, the number of rhinos is probably very low today. In
recent years large quantities of rhino horn have come out of Mozambique.
Namibia: The 350 black rhinos appear to be relatively safe at present in Etosha National Park, one of the largest populations in Africa. In addition there are about 100 ‘desert’ black rhinos known to have unique behavioural characteristics, in Kaokoland
and Damaraland. While in the past these animals have been illegally killed, protective measures are improving now. There
are also over 60 white rhinos in the country, the majority of which are well-managed on private land.
South Africa: About 600 black rhinos and 4,000 white rhinos occur. There has been no poaching of these animals recently but horn continued to be exported illegally in 1986 to Macao and probably Taiwan. Domestic legislation has prohibited the internal sales of rhino horn but some is still being used in small quantities.
Tanzania: Rhino populations in the northern part of the country have been reduced by over 90% through poaching during the past ten years. Poaching continues in various areas. The rhino population in the Selous Game Reserve has fallen from about 3,000 in 1980 to less than 200 today. During the past few years poaching in the Selous Game Reserve has intensified
with the majority of horn being exported to Burundi.
Zambia: Very heavy illegal killing of black rhinos in their main stronghold, the Luangwa Valley, has reduced their population numbers from several thousand in the mid-1970s to under 100 today. Rhino poaching is out of control in many parts of Zambia.
Black rhinoceros (Photo: Peter Jackson)
50

Zimbabwe: The largest population of black rhino in Africa consisting of at least 1,700 animals. However, from July 1984 to April 1987, a minimum of 250 rhinos were killed in the Lower Zambezi Valley, and at present there is a major confrontation between the Zimbabwean authorities and Zambian poachers in the Zambezi Valley. In addition, at least ten rhinos were poached in the Gonarezhou National Park in the south-east part of the country in 1986. There are also about 200 white rhinos whose populations are stable. There is no internal consumption of rhino horn in Zimbabwe and the illegal stocks are exported illicitly.
Elsewhere in Africa: Tiny populations of black rhino also survive in Botswana, Cameroon, Central African Republic, Chad, Malawi, Rwanda, Sudan and possibly Angola, Ethiopia and Somalia. Small population of white rhino exist in Botswana, Kenya, Swaziland and Zaire.
6.23 Status of the trade in rhino products
The principal reason for the precipitous decline in rhino populations is the sudden growth in the rhino horn trade starting in the 1970s. This expanding trade was due to the increasing purchasing power in the Middle East because of the oil boom and in eastern Asia because of rising imports of consumer goods to many countries.
Since the 1970s the largest importer of rhino horn in the world has been North Yemen which has been importing about half the rhino horn on the world market annually. The horn is carved into the handles of traditionally worn daggers. Rhino horn imports were legally banned in 1982, but horn has continued to be smuggled into the country.
In 1984 North Yemen began to suffer an economic recession due to the fall in the oil price which meant that Yemenis employed in Saudi Arabia and other oil producing countries returned home, thus reducing the country’s hard currency income. In order to prevent the further loss of hard currency, the government cut back smuggling by increasing the number of border officials and enforced the law. The rhino horn trade was thus reduced. From 1982 to 1984 about 1,700 kilos of rhino horn were imported each year. Imports fell to less than 1,000 kilos in 1985 and under 500 kilos in 1986. Furthermore, fewer people can now afford daggers with rhino horn handles. Water buffalo horn is being used increasingly as a less expensive substitute. Only one out of twenty dagger handles is made out of rhino horn today.
In December 1986 meetings were held in Sanaa, the capital of North Yemen, with the Minister of Foreign Affairs and the Minister of Economy, Supply and Trade, to discuss ways of enforcing the ban on rhino horn imports further. A six-point action plan was devised which the government agreed to implement fully as soon as possible.
1. The Prime Minister would appeal to the main trader (who has been handling over two-thirds of North Yemen’s rhino horn imports over the years) to desist from handling new
2.
3 .
4 .
5 .
6 .
supplies of rhino horn.
The Foreign Minister would talk to a senior official of the United Arab Emirates about controlling the rhino horn into the Emirates, which eventually way illicitly into North Yemen.
imports of make their
The government would issue a decree prohibiting of rhino horn shavings which go to East Asia.
the export
The Customs Department would encourage water horn as a substitute for rhino horn by eliminating duties.
buffdo import
The government would request the Grand Mufti to issue a fatwa (religious edict) stating that it is against the will of God for man to eliminate an animal species.
The government would require all the dagger craftsmen to sign an affidavit stating that they would not use rhino horn, in default of which their licences would be withdrawn.
The first three points have been implemented and the Foreign Minister has promised that the fmal measures would be carried out before the end of 1987. The most effective measure will be the affidavit system.
The remaining rhino horn on the world market goes to eastern Asia, where it is prized in Oriental traditional medicine as a fever-reducing drug. Since 1985 the last major rhino horn importing countries (South Korea, Taiwan, Macao and Singapore) have officially banned the internatonal trade in rhino products.
Brunei, a small independent countrywith a Chinese population of approximately 55,000, consumes Sumatran rhino horn and skin. The imports of Sumatran rhino products are legal, but their re-export is illegal. Further, the Customs Act was implemented recently by the Sultan, which bans the export of African rhino horn.
China continues to import rhino horn illegally and Hong Kong, Macao, Singapore and Thailand all exported shipments to China in 1985. The horn is mostly used as an ingredient in various traditional medicines manufactured in large factories in China’s main cities and exported to eastern Asia. Although China is a member of CITES these medicines containing tiny quantities of rhino horn are legal because the horn, although on the ingredients list, cannot be readily identified Small quantities of rhino horn are also available in 17% of the medicine shops in Guangzhou, where it sold for U.S.!! 18,772 per kilo. This horn is imported illegally from Hong Kong. In Xian 50% of the medicine shops sold rhino horn at U.S.$2,413 per kilo because it is old stock.
Hong Kong is still a major consumer of rhino products although, since 1979, imports and exports have been illegal. In 1986 exports of ‘old stocks’ were banned. Over the past couple of years horn has been smuggled into Hong Kong from Macao and has been re-exported to China along with some rhino skin.
In the 1970s Japan was also one of the largest importers and consumers of rhino horn. Since 1980, when Japan outlawed its trade, little rhino horn has been imported and old stocks are being used up. In Japan, saiga antelope horn has been sucessfully
51

encouraged as a substitute for rhino horn. In 1980, 44% of Tokyo’s larger pharmacies sold rhino horn but by early 1986 this had fallen to 17%. In Osaka, a more traditional city, the percentage fell from 90% to 76% during this period.
In 1984 and 1985, Macao, with its population of only365,000, became one of the major traders of African rhino horn in eastern Asia as other countries began to close up. In December 1985 the Macao government started to outlaw it by refusing to provide rhino horn import licences to traders; and in February 1986 Macao conformed with CITES principles. However, rhino horn continued to be brought in, some from South Africa. Most of the horn is re-exported to China and Hong Kong (illegally), but the remainder finds its way into Macao’s Chinese medicine shops, 80% of which offer rhino horn to patients.
Singapore banned international trade in rhino products in October 1986, following pressure from the American government and international criticism. Singapore has not been a large consumer of rhino products (in 1986,39% of the pharmacies sampled sold rhino horn, 24% rhino nails, and 15% rhino skin). Because it was legal to trade in rhino horn prior to October 1986 it had been a major entrepot for Asian rhino products and indirectly stimulated much of the poaching of Asian rhinos.
South Korea used to be one of the largest importers and consumers of rhino horn in the world. In this country the horn is used primarily in making Chung Sim Hwan balls for treating a variety of ailments. During the past few years there is evidence that rhino horn shavings have been imported into South Korea from North Yemen. Legislation against rhino horn imports was passed in 1985. Water buffalo horn has now been accepted by the doctors as a substitute for rhino horn and is being promoted in the Oriental medicine clinics.
Taiwan was a major importer and consumer of rhino horn from the 1970s until 1985 when the government banned imports. In-1986 there was some evidence that African rhino horn was being smuggled from Hong Kong into the country via Gaoxiong. Taiwanese fishermen are known to exchange electronic goods for rhino horn in the international waters off mainland China. Rhino horn is widely consumed in Taiwan. A survey in December 1985 showed that 76% of Taipei’s medicine shops and 90% of those in Gaoxiong offered rhino horn for sale.
Thailand has been a fairly large consumer of a wide variety of rhino products: horn, hide, nails, blood and dung, although the trade is illegal. Recently most of these products have come from Asian, rather than African, rhinos. Bangkok businessmen buy whole, fresh Sumatran rhino carcasses for between U.S.$ 3,800 and U.S.$7,600 each, supposedly from Burma, Laos and Thailand. A survey in February 1986 showed that 34% of Bangkok’s Chinese pharmacies sold Sumatran rhino horn for U.S.$11,629 per kilo. One shop offered six Sumatran rhino penises for sale at an average price of U.S.$600 each in 1986. They are purchased by the Chinese for use as aphrodisiacs.
6.2.4 Principal trade routes and entrepots for rhino products
From 1972 to 1979, minimally, an average of 8 tonnes per year of rhino horn went onto the world market. From 1980 to 1984
the amount fell to an average of 3.5 tonnes per year due to the reductions in rhino populations. Most horn originating from African states was exported to North Yemen via Burundi, Djibouti, Sudan or the United Arab Emirates; or it went to eastern Asia via Burundi, Central African Republic, Namibia, Portugal, Tanzam ‘a, United Arab Emirates or Zambia.
Burundi is the major entrepot on the African continent for rhino horn. Burundi obtains illicit rhino horn from Zambia, Mozambique, Tanzania and Kenya. The import and export of rhinoceros horn in Burundi is apparently legal and, therefore, contributes to the decimation of a valuable natural resource in many African countries.
In Zambia, since mid-1984, poachers have crossed into Zimbabwe for rhino horn to supply the middlemen in the capital, Lusaka. Most stock goes to Burundi. The poaching continues, partly because the rhino horn is easily moved out of Zambia to the major world markets. It is known how this horn is transported within Zambia and appropriate action should be taken immediately.
From Burundi most of the horn is exported by air to the United Arab Emirates (UA.E.) wheremuch of it is re-exported to North Yemen. There is no evidence that any of the horn is consumed in the U.A.E. but some is being stockpiled. Some rhino horn comes into Saudi Arabia (some of it to Jeddah) for re-export to North Yemen. Some is used for dagger handles carved by Yemenis in the Jeddah suq.
In addition, some horn from the U&E. is transported through Saudi Arabia to the eastern border of North Yemen. The U.A.E. is presently a CITES member. However, the U.A.E. government has announced its intention to withdraw from the Convention in early 1988. Measures should be taken as soon as possible to win the government’s support for rhino conservation and to stop imports and exports of rhino products. The U.A.E. is now the largest entrepot for rhino horn going to Asia.
North Yemen itself acts as an entrepot. Eastern Asian peoples and some Yemenis have been purchasing the chippings and dust in large quantities from the carvers (of rhino horn dagger handles) in Sanaa, and have exported it to eastern Asia. Since January 1987, however, the export of these chippings has been illegal.
Also, since 1981 traders in the Sudan have been exporting considerable quantities of rhino horn, mostly by air, to North Yemen. The trade has been illegal at least since the early part of 1983.
In the past, Singapore was the main entrepot for Indian and Sumatran rhino products and for some African rhino hide and horn. On 24 October 1986, however, the Singapore government announced that, with immediate effect, all imports and exports would be stopped.
Although China is a party to CITES, factories continue to export relatively large quantities of manufactured medicines said to contain rhino horn. From a technical point of view this is legal since the rhino horn in the medicines is not readily distinguishable from other ingredients. Nevertheless, China should stop this trade by using substitutes for the rhino horn in
52
order [a end the imports of new stocks of horn. The main consuming coilntries in eastern Asia could also help by refusing to import mcdicint:s whose labels state that rhino products are contained in them,
6.2.5 Progress and improvement in the trade
Over the past fwe years almost all the major consuming countries of rhino products in Asia have imposed laws to stop imports and exports: Hong Kong prohibited imports in 1979 and curtailed exports of ‘old stocks’ in 1986. North Yemen passed a law against rhino horn imports in 1982 and outlawed exports of rhino horn shavings in 1987. South Korea’s protective legislation came into effect in 1% and 1985. Taiwan banned the international trade in 1985, the same year as Macao. And Singapore banned international trade in 1986. In most cases these governments have enforced their new laws and the amount of horn going into these countries has decreased sharply.
During this period there have also been major efforts taken to encourage the use of substitutes for rhino horn and skin in Asia. The Japanese government, for example, distributed a circular to pharmacists in the early 1980s asking them to use other traditional drugs instead of rhino horn. Now saiga antelope, cow and water buffalo horn are widely used in place of rhino horn. The Korean Oriental Doctors Association, supported by research carried out at Kyung Hee University, began promoting water buffalo horn as a substitute for rhino horn in 1985. In North Yemen, since 1985, dagger makers who have had difficulties in obtaining supplies of rhino horn have switched to water buffalo horn and today less than one out of twenty dagger handles is being made from rhino horn.
Further, there has been a widespread international media campaign in newspapers, magazines, radio and television deploring the desperate plight of the rhinos and the need to discourage the demand for their products. The fact that fewer customers ask for rhino-based medicines in Asian pharmacies is evidence that the campaign has had effect.
62.6 Conclusions and recommendations
The rhino is facing a severe crisis. In 1970 there were about 70,000 individuals of the five species. The black rhinoceros of Africa has been affected the most severely where its numbers have declined from an estimated 65,000 in 1970 to 4,000 today. Today under 11,000 rhinos survive representing an 85% decline due primarily to poaching for the horn.
Nevertheless sufficient demand remains that, if the rhino is to survive in the wild, the remaining problems of international trade must be solved. Further, based on the relative ease by which rhino products move between countries in Africa and Asia which are Parties to CITES (and therefore must have legal prohibitions governing the rhino) implies complicity at the highest levels in public and private sectors. First and foremost is the need to close down the entrepots in Africa.
1.
2.
3 .
4.
5 .
6 .
7 .
Bring political, diplomatic and economic pressure on the governments of United Arab Emirates and Zambia to take the necessary steps to prevent their nations from serving as entrepots for illegally obtained rhino horn.
Urge the government of the People’s Republic of China to prohibit export of traditional medicines which are stated to contain rhino products.
Request all CITES Part& to prohibit importation of traditional medicines which are stated to contain rhino products.
Request all those nations in which rhino products are traded internationally to implement measures to prohibit the trade. Such prohibitions should establish a time-table in which existing stocks can be depleted.
All nations in which rhino products are consumed should actively promote the substitution of alternative animal products such as water buffalo or saiga antelope horn, for rhino horn in products imported, exported or consumed internally.
Continue to improve the management procedures for the remaining rhino populations in Africa and Asia, including: expanding captive breeding programmes; increased guard patrols; use of electrified fences where necessary and feasible; increased investigative police act&&es; and increased penalties for violation of existing laws.
Continue efforts at alerting world public opinion to the severe threat of extinction faced by the world’s rhinoceros species resulting from the illegal trade in their products.
Because the rhino is facing a crisis, the internal trade in rhino products should be phased out. In order to avoid the problem of financial compensation, the legal possession of rhino products should not be prohibited and countries should establish a time limit in which the existing stocks are to be depleted. In some countries where buying and selling rhino horn is still carried out in medicine shops, new stocks are purchased illicitly and passed on to customers as ‘old stocks’. This, of course, encourages poaching. Also the legal presence of rhino products in pharmacies further encourages buyers and stimulates demand.
For the rhinoceros to survive in the world more dedicated manpower and money must be allocated to improve the management of these animals. Each African and Asian country should produce a national strategy plan on how to protect the rhinos within their borders, and follow it. Specifically the following actions are recommended:
53

Chapter 7: A Review of Action Priorities Established for
Elephant and Rhino in 1981
Organisations funding conservation projects need a clearly defined minimum set of priority projects in rank order which are part of a clearly stated programme (Cumming, 1984). They need to be convinced that the programme and projects can be implemented and that they represent the best use of available
tunds. The 1981 joint meeting of the then separate IUCN/SSC
African Elephant and African Rhino Specialist Groups held at Hwange set out to accomplish this and provided a minimum set of continental action priorities for elephant and rhino conservation. These priorities, which became those of the newly formed AERSG in 1982, also gave emphasis to appropriate ecosystem protection and management, and to effective administrative devices to execute the action plan (Jackson, 1982; Cumming
and Jackson, 1984). This brief review summarises the action plan established at
Hwange and evaluates subsequent progress in meeting the identified priorities. There is no attempt to claim credit on behalf of, or to discredit, AERSG, funding organisations, governments, conservation groups or individuals. AERSG, in its technical and scientific advisory capacity, strives to provide an objective set of guidelines for action to conserve Africa’s elephants and rhinos. Governments, NGOs and funding organisations are in no way obliged to adhere to such guidelines, and indeed may have their own respective sets of priorities. However, the AERSG action plan probably provided the best available minimum set of priorities and guidelines for the two species at the time.
7.1 Action Priorities 1981
Priorities were examined within three major categories of equal importance: (1) political and government action; (2) action on
trade; and (3) field action. Priorities were determined in terms of particular species or subspecies, the ecosystems they inhabit, and the cost-effectiveness and chances of changing a low conservation status to a higher conservation status (Jackson, 1982). Emphasis was also placed on maintaining a high conservation status of kev species. The agreed prior&v ranking for and regional
d
populations w a:
1.
2.
3 .
4.
5 .
6.
7 .
Northern white rhinos
Black rhinos
Southern white rhinos
Kaokoland desert elephants in Namibia
West African forest elephants
West African savanna elephants
Central and East African elephants.
The priorities for action under each of the main categories (political action, trade and field action) are listed in Table 7.1. Further details of each priority are given in Jackson (1982) and Cumming and Jackson (1984).
During the six years between the Hwange and Nyeri meetings action which could be rated as successful was taken on only five of the 34 priorities listed in the action plan. Partially successful or limited action was taken in respect of a further 14 of the priorities, action on at least two of the remaining priorities showed no significant success, and no action seems to have been taken on 11 of the priorities (Table 7.1).
There are some fundamental problems in evaluating conservation action in relation to priorities such as those established at Hwange. The more important are:
n the action and inputs required and indicators of success were often not clearly specified at the time so that clear criteria on which to base an evaluation of success or failure are often not available;
n particular priorities were seldom directed to any particular individual or organisation for action which makes it difficult to establish why no action was taken;
I there is a tendency to regard “Action” as that being taken by NGOs and in some instances action may well have been taken by the appropriate authorities in the countries concerned without AERSG members being aware of it.
Despite these qualifications it is nevertheless clear that very little successful action was taken in response to the AERSG priorities and in many instances the action that was taken was
too little and too late.
Northern white rhino (Photo: Ministry of
Information - Uganda/WWF)
54

Table 7.1 An assessment of progress on conservation action priorities established by AERSG since 1981
Conservation Action Action taken
1 2 3 4 Remarks
1. Desert elephants and rhinos, Namibia 2. Part “W’t elephants, West Africa
3. Gourma Desert elephants, Mali 4. Trade
5. African Convention on Conservation
6. Regional cooperation, anti-poaching
X
X
X
X X
X
Immediate action taken
Chad, CAR, Sudan: poaching unabated
Action on Trade
1. Rhino horn, govts. of consumer nations 2. Rhino horn, traders in consumer nations 3. Monitoring of ivory trade 4. Licensing legal dealers
5. Implementation of CITES resolutions
Field Action= Northern White Rhino
1. Strengthen present captive herd 2. Add animals from wild to captive herd 3. Protect rhinos in Garamba N.P.
4. Protect rhinos in Sudan
Field Action: Southern White Rhino
5. Translocate surplus animals
Field Action: Black Rhino
6. Taxonomic study 7. Cameroon population 8. Central African Republic
9. Kenya 10. Tanzania - Selous Game Reserve 11. Zambia - Luangwa Valley 12. Southern Africa - translocations
X X X
X
X
X
X
X
X In Zimbabwe, S. Africa and Namibia
X X X
X
X
X
X X
Agreed at CITES meeting, 1987 Ivory quota system, 1986
Ongoing studies
EEC project too late for rhinos
Field Action: Elephant - West Africa
13. Ivory Coast
14. Liberia 15. Sierra Leone
16. Ghana
17. Senegal 18. Benin, Niger, Burkina Faso - Park “W”
? X X
Surveys Surveys
Surveys
Field Action: Elephant - Central, East Africa
19. Central African Republic 20. Cameroon 21. Zaire - Garamba and Virunga NP’s 22. Gabon - surveys 23. Tanzania - Selous Game Reserve
X
X X
?
X
Projects implemented belatedly
Garamba rehabilitation project Forest elephant survey Survey in 1986
Totals 5 14 2 11
Columns assessing “action taken” are: 1 = Successful action taken; 2 = Partially successful or limited action taken; 3 = Unsuccessful action taken; 4 = No action taken.
Chapter 8: Action Plan for African Elephant and Rhino Conservation
The primary objective of the Nyeri meeting of the AERSG was to review critically the status and trends of elephant and rhino populations in Africa as a basis for generating a minimum set of priority actions for the conservation of these species. The numbers, trends and status of rhino populations are reviewed in Chapter 2, while Chapter 3 provides a priority ranking for black rhino populations. The numbers and trends of elephants in Africa are examined in Chapter 4 and the links between the ivory trade, the ivory quota system and population trends are reported on in Chapter 6, as is a review of the rhino horn trade. A major innovation in AERSG’s approach to elephant conservation was a first attempt to generate regional conservation strategies for elephants. These are presented in Chapter 4. This information base, together with information on the resources available for conservation in Africa (Chapter S), and a review of previous action plan priorities (Chapter 7) were brought to bear on the task of drawing up a minimum set of priority conservation actions for the rhinos and elephants in Africa.
The format of previous AERSG Action Plans was followed and priorities were examined at four distinct operational levels for rhinos and elephants.
Political action
Trade
Field action
Resource management (elephants only)
The order of conservation priority for species and for regional populations of elephants was considered to be:
1.
2.
3 .
4.
5 .
6 .
7 .
Black rhinos
Northern white rhinos
Desert elephants
Southern white rhinos
West African elephants
Forest elephants
Savann .a elephants
8.1 Political Action
8.1.1 ‘The United Arab Emirates is now the major entrepot state for ivory and rhino horn and has recently withdrawn from CITES. International diplomatic pressure on the UAE to control trade in ivory and rhino horn is urgently required.
8.1.2 Corruption within countries in Africa is a common underlying factor associated with rhino and elephant poaching
and the continuing illegal trade in ivory and rhino horn. Much good work being carried out by government departments responsible for conservation has been undermined by such activities. Poached ivory is entering the international market with legal documents issued by corrupt officials. Governments and heads of state need to be made aware of the problem, be provided with specific information on illegal activities and be given assistance to bring the illegal trade under control.
81.3 Key individuals involved in the illegal trade in ivory should be identified through the involvement of professional investigators and this information should be supplied to governments to enable them to take the necessary action to halt such sabotage of their economies.
8.1.4 IUCN and other appropriate organisations should place the issues of elephant and rhino conservation, and illegal trade in their products, within the forum of the Organisation for African Unity, so as to inform OAU member governments about these problems and the need for improved conservation measures.
8.2 Trade
8.2.1 Rhino horn trade
821.1 7&e Lusaka connectioqkovtduit should be closed. Poaching pressure on the Zambesi Valley population of black rhinos in Zimbabwe is coming from neighbouring Zambia. Action to close this conduit is urgently required. Similar considerations apply to Burundi.
8.2.1.2 Internal trade in China, Taiwan and other Asian counties should be stopped. The manufacture and trade in traditional medicines containing rhino products is still permitted in several Asian countries, and there is a need to seek the co- operation of these countries in closing down this aspect of the rhino horn trade. Although strictly speaking outside the purview of CITES, the matter was the subject of a resolution of the Conference of the Parties in Ottawa in July 1987 (see Appendix
4) .
8.2.1.3 Initiatives to encourage the use of substitutes to rhino horn in consumer countries should continue.
8.2.1.4 North Yemen. The entry of rhino horn into North Yemen has been reduced but not eliminated, despite official bans on its import. Earlier partially successful initiatives to close this trade should be pursued.
56

82.2 Ivory
8.2.2.1 The illegal trade within Africa should be investigated. There is little concrete information on the illegal trade in ivory within Africa, and a comprehensive undercover investigation of the form and extent of this trade is required if effective controls are to be introduced.
8.2.2.2 The consumption of raw ivory within Afica should be investigated. While reasonably good data are available on the amount of raw ivory leaving Africa, only fragmentary data are available on the levels of production and use of ivory within the continent. Without this information it is not possible to establish the full extent to which elephants are being harvested.
8.2.2.3. Analysis and assessment of the ivory quota system. The quota system was introduced in 1986 at the request of the African states which effwtively constitute the producer countries for ivory in Africa. The system has been criticised by some conservationists and those involved in the legal trade in ivory. There is a continuing need to analyse the statistics on ivory quotas, trade in ivory, and trends in elephant populations in Africa. The evidence available to the AERSG at the Nyeri meeting made it clear that the present annual continental harvest of elephant is not sustainable.
8.3 Field Action
8.3.1 Black rhinos
8.3.1.1 The Continental Conservation Strategy for black rhinos being prepared by AERSG should be completed and published by IUCN.
8.3.1.2 Field aztin prion’tiees fcK the consman ofwildpopuIations of black rhinos. Some 37 populations of black rhinos have been examined and scored for biological importance, the likelihood of external assistance being successful, and the urgency with which such assistance is needed (see Chapter 3). The priority areas and the field actions and support required in each are listed below. Apparent discrepancies between the list below and the priorities set in Chapter 3 are the result of additional considerations which were not not catered for in the initial scoring system.
a. Zambezi Valley, Zimbabwe. This area lies downstream of Lake Kariba and includes a number of components of the Zimbabwean Parks and Wildlife estate, which covers an area of nearly 12,000 sq km. The Mana Pools National Park and the Chewore and Sapi Safari Areas comprise a World Heritage Site within the complex. The Zambezi Valley carries the largest remaining coherent population of black, rhinos left in Africa and the only single population of more than 500. The population is under threat from Zambian- based poachers who have accounted for a minimum of 300
rhinos over the last three years. Requirements are for a helicopter to assist in the rapid deployment of anti-poaching forces, a light aircraft for surveillance, and an effective research and monitoring programme to estimate accurately the size of the population and to develop monitoring techniques both to assess rhino population trends and the of anti-poaching str sategies and tactics.
effectiveness
b. K&kdand~amuraland (Kiwkoveld), Nmntiia. A population of approximately 90 black rhinos lives in desert or near- desert conditions outside protected areas in Kaokoland and Damaraland. There is a need for additional support for patrols and possibly the recruitment of additional auxillaries who, drawn from the local communities, could assist the authorities in patrolling the area. Additionally, there is a need to maintain the existing monitoring prograrnme (which depends on the regular identification of individual rhinos), and to support public relations and extension work amongst the pastoral communities living in the region.
c. Gzmeroon/Chad These small populations lie on the western extremity of rhino distribution in Africa, and represent the only remaining black rhinos in the region. There is no recent information on the size and status of the small population which resides in the Bouba-Njida National Park and a thorough reconnaisance survey is required of the park and of the area from which sightings have been reported recently in Chad.
d. Tsavo National Park, Kenya. The population has declined over the last two decades from several thousand to less than 200. There is a need to enlarge the fenced and protected sanctuary created within the park to hold black rhinos. Anti- poaching activities require support and a survey should be carried out to determine the numbers and distribution of rhinos remaining in the park.
e. Selous Game Reserve, Tanzania. The Selous Game Reserve of 55,000 sq km has the potential to hold some 18,000 or more black rhinos. Numbers in the reserve have declined from more than 3,ooO in 1980 to less than 300 in 1987. There is a need to review the management of the reserve, establish effective anti-poaching operations and conduct intensive ground surveys and censuses in appropriate areas. The staff of the Selous Game Reserve are urged to collect data on rhino sightings and signs in a systematic way to facilitate these exercises.
f. Gonarezhou National Park Zimbabwe. Rhinos were re- introduced into this 5,000 km2 park in 1971. The 72 animals introduced increased to over 150, but poaching over the last three years has reduced this to less than 50 rhinos. Anti- poaching efforts are complicated by the Mozambique civil war and the movement of refugees through the park. Staffing levels should be improved and some equipment, particularly vehicles, is needed to support anti-poaching operations.
57

h .
i.
Luangwa Valley, Zambia. The rhino population of the Luangwa Valley has declined from several thousand to less than 100 within this decade. Support is required for the Zambian Government proposal to establish a protected j. sanctuary within the Luangwa South National Park. There
is also a requirement to strengthen anti-poaching efforts and to involve local communities further in conservation efforts.
Sebungweregion, Zimbabwe. The Sebungwe region of some 15,000 sq km lies to the south of Lake Kariba and comprises a complex of protected areas and communal farming land. The Parks and Wildlife areas are the Chizarira National Park and contiguous Chirisa Safari Area, the Chete Safari
is being undertaken on the ranch. The anti-poaching work, monitoring and research should receive continued support.
Aberdare National Park Kenya. The rhino population is estimated to be about 60 but no systematic survey has been undertaken over the complete area. A survey is therefore necessary, and requirements for increasing protection for the rhinos must be identified and acted upon. If the
intensively-managed rhino sanctuaries in Kenya are successful in breeding rhinos, Aberdare National Park may be important as a release area to absorb and allow continued rapid breeding of rhinos from these sanctuaries.
The above constitute the 10 areas of highest priority for
Area and the Matusadona National Park The rhino population black rhino conservation action. The next five areas on the
of at least 500 is dispersed between the four protected areas priority list, in order of importance, are listed below. For all of
with some animals still living on communal farm land. these, situation reports are required to specify population sizes
Major requirements are for extension and public relations and conservation needs.
work to involve local communities in the conservation of rhinos in the region, for the establishment of a highly mobile k . and efficient anti-poaching unit to pre-empt any poaching threat, and to census accurately and monitor the population. 1 .
Laikipia Ranch, Kenya. This private ranch of 400 sq km contains a rhino population of 47, within an unfenced area
m.
of about 190 sq km. A private anti-poaching force of 35-40 men, funded in part by WWF, patrols the ranch and poaching no
has been negligible over the past six years. Rewarding research on rhino social behaviour and reproductive patterns o.
Mount Kenya National Pa& Kenya (Est. 40 rhinosj
Rubondo National Park, Tanzania (20-30 rhinos)
Ngorongoro Conservation Area, Tanzania (20 - 30 rhinos)
Akagera National Park, Rwanda (Est. 15 rhinos)
Xasungu National Park, Malawi (Est. 20 rhinos)
Black rhinos (Photo: Peter Jackson)
58

8.3.2 Northern white rhinos
8.3.2.1 Efforts to co-ordinate the breeding of existing captive northern white rhinos should be encouraged.
8.3.2.2 The continuing rehabilitation of Garamba National Park, Zaire, with the northern white rhino as a component of the ecosystem, should be supported. There is a need to re- introduce a monitoring programme for the population of 22 northern white rhinos in Garamba and to include a strong training component to ensure continuity.
83.3 Desert elephants
The status of the elephant populations in Mali, Mauritania and Namibia needs continued monitoring and appropriate conservation action should be supported.
83.4 Southern white rhinos
No specific conservation action has so far been identified for the southern white rhinos, although there is concern about the possible overhunting of white rhino on private farms in South
Africa. White rhino have recently become extinct in Mozambique for the second time. Populations in southern Africa outside of South Africa are still low and further restocking and management of these populations merits attention.
83.5 West African elephants
8.3.5.1 The West African elephant population, guessed to number about 17,000, comprises numerous fragmented populations of both forest and savanna elephants. There is very little recent information on their distribution, numbers and status and a priority is to obtain this information as a basis for developing an effective conservation strategy for elephants in the region.
8.3.5.2 The existing wing of AERSG in West Africa should be strengthened and steps should be taken to make AERSG material available in French for dissemination in Francophone Africa.
83.6 Forest elephants
A sound knowledge of the size of the forest elephant population is crucial to the management of African elephants and to the regulation of the ivory trade. The first phase of the project, the development of census techniques for forest elephants, has now been completed. The second phase of the study of forest elephant numbers and distribution, based on further censuses and the classification and delineation of elephant habitats,
should proceed as soon as possible.
Male elephant eating (Photo: C A W Guggisberg/WWF)
59
83.7 Savanna elephants 8.43 Legal and administrative frameworks
Regional Elephant Conservation Strategies, i.e. for West, Central, East and Southern Africa, should be developed as soon as possible. These strategies should identify priority “baseline” populations for the long-term conservation of the species and their habitats within each region, and generate strategies for the effective conservation and management of elephant populations living outside protected areas. These strategies will define the priorities for conservation action for elephants within each region (and would include both forest and savanna elephants). Initial attempts to define baseline populations have been made in Chapter 4.
8.4. Resource Management
The conservation and management of elephant populations in Africa on:
should be promoted bY providing inform .ation and advice
8.4.1 Monitoring elephant populations
8.4.2 Management and harvesting
8.4.4 Law enforcement
8.4.5 Ivory trade
The main focus of conservation action for elephants in Africa has been on anti-poaching and on attempts to halt the ivory trade. While these maybe the most appropriate actions in some cases, there are many circumstances in which positive management of elephants, as a valuable aesthetic and economic resource, may be more successful. In particular, there is a need to explore the protection of elephants through greater community involvement in their conservation. This may involve both benign and consumptive uses of elephants, changes in legislation, administration, marketing of products (whether tourism or ivory) and reducing conflicts between elephants and farmers. Imprmed resource management and law enforcement capabilities willbe a vital component in implementing regional conservation strategies for elephants. A key element will be finding ways in which agencies responsible for protected areas can fully finance their operations.
60

Appendix 1: Analysis of Conservation Success
R B. Martin
This appendix outlines part of an ongoing attempt to understand some of the factors that contribute to conservation success and failure. The technique used is still at an early stage of development, and therefore can only be considered an initial analysis; it is not at this stage endorsed as a method by IUCN or WWF.
The technique described below estimates the costs necessary to conserve any given area, and the degree to which those costs are presently being met. Costs are expressed as a negative index with a maximum value of about 100. The extent to which costs are met (Conservation Status) is a positive index which may be greater than 100. However, an area is considered satisfactorily provided for if the negative and positive costs balance one another.
The costs are based primarily on the size of the area and a sliding scale is used which allows the cost/sq.km to decrease with increasing size of area. The basis for the scale of costs chosen is entirely empirical: it relies on using the present budgets in known cases where conservation is considered to be successful to establish a cost threshold below which conservation is unlikely to work.
The score for conservation status is based on the sum of a set of “conditional” questions and a set of “unconditional” questions. The initial score from the conditional questions is multiplied by a weighting factor which reduces the score depending on the general effectiveness of security, law and order, corruption and the economic situation in the country concerned. The reason for this is to identify those situations where the provision of outside funding is unlikely to be effective due to such factors. The unconditional questions, which provide a smaller part of the total, pertain to those matters which are unaffected by the “state of the nation”. It should be born in mind that weightings given to the various questions and answers inevitably have an arbitrary nature.
2. Type of aYea
The final outcome can be displayed on a diagram (Fig. 4.1) where a. Climate: Is area subject to periodic droughts: the central vertical axis represents the Biological Importance of the severe enough to cause extinction? YES = 15points population (Table 4.19) and the X axis represents the expenditure on severe enough to threaten population? YES = 10 points conservation minus the calculated costs of adequate conservation. A severe enough to result in die-offs? YES = 5 points
1. Area-related cost
Assumes required input cost rate = U.S.$ 100 x 2(4-10JJfo(A))
Some examples of costs per area are given below. An area of 50,000 sqkm is adjusted to score the maximum negative value of 100 and all other scores are linearly scaled to this.
Area sq.km
Cost rate U.S.$/sq.km
cost U.S.$
Score
10 800 8,000 1 20 650 13,000 1 50 493 24,650 1
100 400 40,000 1 200 325 65,000 2 500 246 123,000 4
1,000 200 200,000 7 2,000 162 324,000 11 5,000 123 615,000 21
10,000 100 1,000,000 33 20,000 81 1,620,OOO 54 50,000 62 3,000,~ 100
positive score, falling to the right of the vertical axis, is taken as an indication that expenditure is sufficient; a negative scores indicates b. Topography: Does topography provide any protection for elephants?
that exDenditure falls short of what is needed. NO = 5 points
.e at this stage and to more careful allocated to the into the results a
C. Vegetation: Does vegetation
false impression of numerical precision. Some results of this system are presented in Table A.1. a.
b.
Conservation Status
Conservation Costs C.
Conservation costs can be influenced by inherent qualities of the conservation area concerned. For example, if an area is subject to frequent droughts it might be necessary to provide artificial water to support animals confined to the area. If the terrain is very broken, this might make poaching difficult and so reduce conservation costs. Similarly, dense vegetation cover can serve to protect elephants from poachers. The “location of an area” can have a marked effect on conservation costs. Those protected areas on international boundaries are often very much more vulnerable to poaching than those situated well within a country.
The following questions are used to establish weighting factors for the Conditional section immediately following. For example, if there is a full-scale war in the area where a population of elephant is being considered, then any scores arising from the conditional questions are largely irrelevant.
The scores from this section are totalled, deducted from 100 and then divided by 100 to establish the weighting factor. Thus if the score
3. Location of ma
provide any protection for elephants? NO = 5 points
Convenient for international poachers? YES = 10 points
High human densities on part of periphery? YES = 5 points
Small “island” in “sea” of humans? YES = 5 points
61

totals zero the weighting factor will be unity and the answers to the conditional questions which follow will retain their full value. If the total score reaches 100 before the end of the questions is reached, ignore anv further questions in this section: the weighting factorwill be
Helicopter full time 4 points on call 2 points occasionally 1 points
Radios full VHF mobile network 4 points HF to base stations 2 points
Camp equipment 2 point
uniforms 1 point
The scores from this section are totalled and multiplied by the weighting factor derived earlier.
ziro.
War zone -50 Widespread civil unrest -30 Locally unsafe areas -10 Sporadic lawlessness -5
a. Civil security:
Permeates entire society Some evidence in civil service Minor feature in country
Massive foreign debt and low
-50
-25 -5
civil service salaries -20 Significant foreign debt etc. -10 Minor problems in economy -5
b. Corruption:
Unconditional Questions (maximum 25 points)
1. Level of illegal activity (maximum score 10 points)
No poaching threat 10 points Limited subsistence poaching of other species 8 points Occasional elephant taken 5 points Illegal hunting less than sustained yield (5% pop.) 3 points Hunting more than sustained yield but being limited 2 points Anti-poaching having a slight effect 1 point
2. Rights regardingpoachers
Are staff prosecuted for manslaughter if, in the course of effecting an arrest, they should happen to kill a poacher? NO = 5 points
A
c. Economy:
d. Co-operation from police, army, courts: Active harrassment -20 No co-operation -10 Little co-operation -5
e. Proportion of anti-poaching costs shouldered by government: Most funding from NGOs -20 Government contributes 25% -15 Government contributes 50% -10 Government contributes 75% -5
3 points 2 points 1 points
2 points 1 point
2 points 1 point
2 points 1 point
1 point
3. Support from courts
Courts administer heavy fines and imprisonment Courts usually convict and sentence Courts have some deterrent effect
4. Public awarevless and support
Major topic of news media, public campaigns Some awareness, limited public contributions
5. Land puessu~
Remote area with no nearby settlement Some pressure from would-be settlers
6. Research input
Resident staff, regular surveys Some relevant input
7. Pnzsence in area
Tourists, professional hunters, research workers
Conditional Questions (maximum 75 points)
The final totals for this section are to be multiplied by the factor derived from the preceding section.
weighting
1. Opemtional budget for anza: (maximum 50 points)
Score as a fraction of the cost determined in the first section. If the budget exceeds the costs this scores as a positive value. For this calculation, exclude the salary component of the budget.
2. Law enforcement capability: (maximum 25 points)
Note: most of the following topics are inherently covered by the previous section on budget. Positive scores indicate that the budget is being used effectively.
a. Manpower: density of field staff -- l/10 sq.km 5 points l/20 sqkm 4 points l/50 sq.km 3 points l/100 sqkm 2 points l/200 sqkm 1 points
Vehicles: l/l00 sqkm l/200 sq.km l/500 sq.km l/1000 sqkm l/2000 sqkm
5 points 4 points 3 points 2 points 1 points
Final Conservation Score =
(Conditional Section x Weighting Factor) + Unconditional Section Equipment: Fixed-wing aircraft -- full time on call occasionally
4 points 2 points 1 points
62
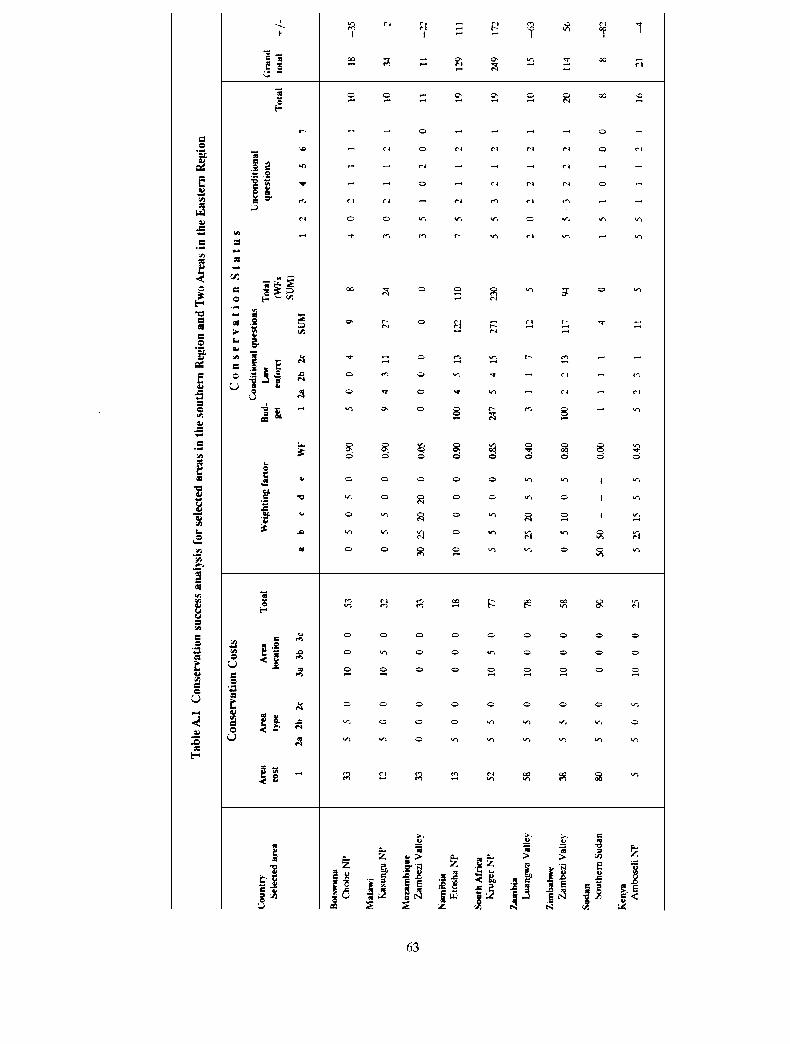
0 0 0 0 0 0 0 0 0
0 vr 0 0 v5 0 0 0 0
0 0 0 0 s 0 0 0 0 e

1.
2.
3.
4.
5.
6.
7.
8.
9.
Appendix 2: List of Papers Presented at the AERSG Meeting Held in Nyeri, Kenya, May 1987
National plans for the black rhino (D. Western)
Black rhino management strategies in South Africa
(P.M. Brooks)
Small population biology and management of black rhinos (T.J. Foose)
Black rhino social organisation: implications for management (R. Brett)
Black rhino systematics based on skull measurements
(R. Du Toit)
Investigating and combatting the rhino horn trade, 1985-86 (E.B. Martin)
Overview of African elephant trends
(I. Douglas-Hamilton)
Continental model for elephant populations
(A. Burrill and I. Douglas-Hamilton)
The elephant problem in the Central African Republic
(J.-M. Froment)
10.
11.
12.
13.
14.
15.
16.
17.
18.
Notes from the Gourma, Mali (S. Cobb)
A preliminary report on the status of elephants in Gabon (R.F.W. Barnes and K.L. Jensen)
Elephants and habitats with a focus on the Luangwa Valley, Zambia (D. Lewis)
Ivory trade statistics
(J. Caldwell)
Ivory Export Quota System in 1986 - first year (J. Yovino)
Managing elephants for ivory profit (T. Pilgram)
Population models and elephant management (R.B. Martin)
Vocal communication in African elephants (J. Poole)
Pachyderms and ecosystem conservation in Africa (J. and K. MacKinnon)
64

Appendix 3: List of AERSG Members (1984-1987 IUCN Triennium)
Dr David H.M. Cumming (Chairman) African Elephant and Rhino (Presently at:
Specialist Group WWF Multispecies Project P.O. Box 8437 P.O. Box 8437 Causeway, Harare Causeway, Harare ZIMBABWE ZIMBABWE)
Dr Esmond Bradley Martin (Vice Chairman) Villa Langata P.O. Box 15510 Mbagathi Nairobi KENYA
Dr David Western (Vice Chairman) Wildlife Conservation International P.O. Box 62844 Nairobi KENYA
Mr Raoul Du Toit (Scientific/Executive Officer) African Elephant and Rhino (Presently at:
Specialist Group WWF Zambezi Rhino Project P.O. Box 8437 P.O. Box 8437 Causeway Causeway Harare Harare ZIMBABWE ZIMBABWE)
Dr Jeremy L. Anderson Director KaNgwane Parks & Environmental Affairs Board P.O. Box 1990 Nelspruit 12000 SOUTH AFRICA
Dr R.F.W. Barnes c/o New York Zoological
Society Institut de Recherche en
Ecologic Tropicale B.P. 180 Makokou GABON
Dr R.H.V. Bell c/o National Commission for
Development Planning P.O. Box 50268 Lusaka ZAMBIA
Dr Bihini Won wa Musiti Chef de Service Chasse IZCN B.P. 868 Kinshasa 1 ZAIRE
(Presently at: Department of Zoology University of Cambridge Pembroke Street Cambridge CB2 3EJ UNITED KINGDOM)
Dr Markus Bomer Frankfurt Zoological Society P.O. Box 3134 Arusha TANZANIA
Dr P.M. Brooks Chief Research Officer Natal Parks, Game and
Fish Preservation Board P.O. Box 662 Pietermaritzburg 3200 SOUTH AFRICA
Dr G.F.T. Child Director Department of National Parks
and Wildlife Management P.O. 8365 Causeway Harare ZIMBABWE
Dr Stephen Cobb B.P. 91 Mopti MALI
Dr Daboulaye Ban-Ymari Directeur du Tourisme,
des Parts Nationaux et Reserves de Faune
B.P. 905 N’djamena CHAD
(Presently at: c/o Dr A.H. Abu-Zinada Secretary General National Commission for Wildlife
Conservation and Development P.O. Box 61681 Riyadh 11575 SAUDI ARABIA)
(Presently at: Great Leys Binsey Oxford OX2 ONG UNITED KINGDOM)
Dr Iain Douglas-Hamilton P.O. Box 54667 Nairobi KENYA
Dr Thomas J. Foose AAZPA Conservation Coordinator American Association of Zoological
Parks & Aquariums 12101 Johnny Cake Ridge Road Apple Valley, MN 55124 UNITED STATES
Mr J.-M. Froment (Presently at: c/o D.C.C.E. 69A rue des Bataves B.P. 1298 1040 Bruxelles Bangui BELGIUM) CENTRAL AFRICAN REPUBLIC
65

Dr Anthony Hall-Martin Mr Fred M.R. Lwezaula
Control Research Officer Director of Wildlife (now retired)
(Inland Parks & Coastal Areas) Ministry of Natural Resources
Kruger National Park and Tourism
Private Bag X402 P.O. Box 1994
Skukuza 1350 Dar-es-Salaam
SOUTH AFRICA TANZANIA
Mr Peter M. Hitchins P.O. Box 8 Mfolozi 3925 Zululand SOUTH AFRICA
Mr Muembo Kabemba Institut de Zoologie Quai van Beneden 22 B-4020 Liege BELGIUM
Dr Abdillahi Ahmed Karani General Manager National Range Agency P.O. Box 1759 Mogadishu SOMALIA
Mr G. B. Kaweche Chief Wildlife Research Officer Box 1 Chilanga ZAMBIA
Prof. F.I.B. Kayanja Dept Veterinary Anatomy Makerere University P.O. Box 7062 Kampala UGANDA
Mr Moses Kumpumula Parks & Wildlife P.O. Box 30131 Lilongwe 3 MALAWI
Dr Francis Lauginie 01 BP 932 Abidjan 01 IVORY COAST
Dr Dale Lewis P.O. Box 18 Mfuwe ZAMBIA
Mrs Hanne Lindemann Gronhottvej 35B 3480 Fredensborg DENMARK
(Presently at: Nyika National Park Private Bag Rumphi
MALAWI)
Dr Mankoto ma Mbaelele President Delegue General Institut Zairois pour la
Conservation de la nature B.P. 868 Kinshasa 1 ZAIRE
Mr R.B. Martin Principal Ecologist Dept of National Parks
& Wildlife Management P.O. Box 8365 Causeway Harare ZIMBABWE
MS C. Moss Amboseli Elephant Research Project P.O. Box 48177 Nairobi KENYA
Dr J. Ngog-Nje Directeur Ecole pour la formation
des specialistes de la faune B.P. 271 Garoua CAMEROON
Dr. Perez M. Olindo Director Wildlife Conservation and
Management Dept P.O. Box 40241 Nairobi KENYA
(Presently at: African Wildlife Foundation P 0 Box 48177 Nairobi KENYA)
Mr Ian S.C. Parker P.O. Box 30678 Nairobi KENYA
Dr Norman Owen-Smith Centre for Resource Ecology University of the Witwatersrand P.O. Box 1176 Johannesburg 2001 SOUTH AFRICA
66

Dr Kes Hillman Smith IUCN Part National de
la Garamba
c/o AIMFvzAF P.O. Box 21285 Nairobi KENYA
Dr Clive A. Spinage Dept. of Wildlife and Nat. Parks P.O. Box 131 Gaberone BOTSWANA
Mr R.D. Taylor Matusadona National Park Private Bag 2003 Kariba ZIMBABWE
(Presently at: WWF Multispecies Project P.O. Box 8437 Causeway Harare ZIMBABWE)
Mr Jose Lobao Tello Box 1319 Maputo MOZAMBIQUE
(Presently at: c/o AGRER/SECA Mr P Bligny B.P. 1957 Bangui CENTRAL AFRICAN REPUBLIC)
Invited participants in the Nyeri meeting working sessions
MS A. Burrill GEMS/UNEP P.O. Box 4704 Nairobi KENYA
Mr J. Barrah Wildlife Dept. P.O. Box 40241 Nairobi KENYA
Mr J. Caldwell WTMU 219~ Huntingdon Rd Cambridge CB3 ODL UNITED KINGDOM
Dr S. Edwards IUCN Species Survival Commission Avenue du Mont-Blanc 1196 Gland SWITZERLAND
Mr R. Elliott Solio Ranch P.O. Box 2 Naro Moru KENYA
Mr P. Hamilton Wildlife Dept. P.O. Box 40241 Nairobi KENYA
Mr K. Jensen 56 Caswell Rd Caswell Swansea SA3 4SD UNITED KINGDOM
Dr H. Lamprey WWF Regional Office P.O. Box 62440 Nairobi KENYA
Mrs J. Lewis P.O. Box 18 Mfuwe ZAMBIA .
Dr K. MacKinnon 86 Aldreth Rd, Haddenham Cambridge CB6 3PN UNITED KINGDOM
Dr T. Pi&ram Dept. Anthropology Washington University St Louis, MO 63130 UNITED STATES
Dr J. Poole Amboseli Elephant Research Project P.O. Box 48177 Nairobi KENYA
MS I. Schroeder SAVE P.O. Box 4386 New York 10163 UNITED STATES
Mr G. Tatham Dept. National Parks and Wildlife Management P.O. Box 8365 Causeway, Harare ZIMBABWE
67

MS L. Vigne Rhino P.O. Box 15510 Mbagathi Nairobi KENYA
Mr E. Wilson WWF Regional Office P.O. Box 62440 Nairobi KENYA
Mr J. Yovino CITES Secretariat 6 rue du Maupas loo0 Lausanne 9 SWITZERLAND

Appendix 4: Resolutions on Rhino Horn and Ivory Trade Passed at the 6th Conference of the CITES Parties.
Resolution Conf. 6.10
Trade in Rhinoceros Products
RECALLING Resolution Conf. 3.11 on the Trade in Rhinoceros Horn adopted at the third meeting of the Conference of the Parties (New Delhi, 1981);
NOTING that the black rhinoceros has continued to decline catastrophically, and that the species is currently extremely endangered;
NOTING also the precarious conservation status of Asian rhinoceros species and the continuing threat posed to these species by commerce in their parts and derivatives;
ACKNOWLEDGING that the efforts of the Parties, the Secretariat and other interested agencies have failed to stem the flow of illegal trade in rhinoceros products, particularly horn; and that this trade is the primary factor responsible for the destruction of rhinoceros populations;
AWARE that the situation will continue to deteriorate unless drastic measures are taken immediately;
CONSIDERING that certain countries that do not have rhinoceros populations have been acting as safe entrepots for illegal shipments of rhinoceros horn and have thus been stimulating the disastrous wave of poaching;
RECOGNIZING that poachers cross international borders to kill rhinos;
CONSCIOUS of the security risk involved in holding large stocks of valuable rhinoceros horn in a routine fashion in government stores and the fact that this has already stimulated criminal action and theft of such stocks;
THE CONFERENCE OFTHE PARTIES TO THE CONVENTION
URGES all Parties to take steps to establish the following measures immediately:
a complete prohibition on &l sales and trade, internal and international, of rhinoceros parts and derivatives, especially horn, whether whole or in any other form, including personal effects, but excluding (solely) non-commercial movement of legitimate hunting trophies where appropriate full CITES documents are issued to that effect;
the destruction of all government and parastatal stocks of rhinoceros horn with supporting contributory funds from external aid sources to be used for rhino conservation in the state concerned;
the issuance of special instructions to a law enforcement agencies to be particularly alert to the problem of rhinoceros horn smuggling;
d) an increase in penalties for individuals/companies convicted of relevant offences; and
e) firm action against middlemen and poachers involved in cross border poaching and trafficking in horn; and
RECOMMENDS
a) that Parties use all appropriate means (including economic, political and diplomatic) to exert pressure on countries continuing to allow trade in rhinoceros horn, in particular Burundi and the United Arab Emirates, (including the “passive” allowance of such trade), to take the necessary action to prohibit such trade and to enforce such a prohibition;
b) that Parties encourage the use of substitutes for rhinoceros horn and other rhinoceros products used; and
c) that Parties encourage the development of national and continental rhino conservation strategies.
Resolution Conf. 6.11
Trade in Afican Elephant Ivory
RECOGNIZING that there has been a substantial decline in some African elephant populations due to the illegal trade in ivory;
AWARE that African Governments are losing millions of dollars each year in foreign exchange due to the illegal ivory trade;
CONSCIOUS that the African elephant will become endangered if the illegal ivory trade continues at present levels;
RECOGNIZING that much of this illegal trade is facilitated by entrepot states both inside and outside Africa;
CONSCIOUS that there have been particular problems in this respect in Burundi and the United Arab Emirates;
THE CONFERENCE OFTHE PARTIESTO THECONVENTION
RECOMMENDS
a) that Parties use all possible means (including economic, diplomatic and political) to exert pressure on countries continuing to allow illegal trade in ivory, in particular Burundi and the United Arab Emirates, to take the necessary action to prohibit such trade and to become or remain Parties to CITES;
b) that a Delegation be established by the Standing Committee on behalf of the Conference of the Parties to meet with the Heads of State of Burundi and the United Arab Emirates to encourage them to eliminate illegal trade in ivory, to bring to their attention the gravity of the problem of the illegal ivory trade and to make
69

them aware of the seriousness with which the range states of the African Elephant and the CITES Parties consider the matter;
and
c) that the Delegation report back to the Standing Committee as soon as possible and that the Standing Committee consider within twelve months what further measures may be required to
resolve the matter.
Resolution Conf. 6.12
Integration of the Management of the Aftican Elephant and Ivory Trade Contmls
WHEREAS Resolution Conf. 5.12, adopted at the fifth meeting of the Conference of the Parties (Buenos Aires, 1985), recommended procedures for the control of trade in ivory from African elephants, generally referred to as the “Quota System”, and directed that the CITES Secretariat assist in the implementation of the System;
RECOGNIZING that present harvests of elephant for ivory are not sustainable and that a large proportion of these harvests is illegal and threatening elephant populations in Africa;
NOTING that Resolution Conf. 4.18 adopted at the fourth meeting of the Conference of the Parties (Gaborone, 1983) recommends procedures for the disposal and return of illegally traded Appendix II specimens;
RECOGNIZING further that range states require the co-operation and assistan= of Parties in the management of their elqhant populations and in the implementation of improved law enforcement and control
procedures;
ACKNOWLEDGING the need for better information on the trade in raw and worked ivory, particularly within Africa;
THE CONFERENCE OFTHE PARTIES TO THE CONVENTION
RECOMMENDS
a) that Parties support and fully comply with the quota system (Resolution Conf. 5.12) and in particular:
ii)
iii)
iv)
follow the procedures for quota submissions documented in the CITES Ivory Trade Control Procedures Manual;
improve communications on ivory consignments between producer and consumer states and between such states and
the Secretariat by providing Management Authorities of producer countries with the means to do so, and ivory user states in particular are urged to assist;
take due care in the notification of existing legal ivory stocks in quota submissions so as to avoid the possibility of illegal
stocks appearing as legal stocks;
ensure that significant amounts of confiscated ivory are treated as a separate notification to the Secretariat and are not incorporated in quota submissions; and
9 notify the Secretariat, when possible, about convicted illegal
traders and persistent offenders and direct the Secretariat to provide such information to the Parties in a timely
manner;
b) that Parties assist range states to improve their capacity to manage and conserve their elephant populations through improved law enforcement, surveys and monitoring of wild populations;
c) that states be encouraged to offer rewards for information on illegal hunting and trafficking in ivory leading to the arrest and conviction of illegal traffickers in ivory; and
d) that Parties establish an African Elephant Working Group,
under the Standing Committee on behalf of the Parties to:
i) work closely with the Secretariat and the IUCN/SSC African Elephant and Rhino Specialist Group to facilitate the implementation of the provisions of this Resolution and Resolution Conf. 5.12;
ii) report to the Standing Committee six months prior to the seventh meeting of the Conference of the Parties, or earlier if necessary, or as directed by the Standing Committee; and
iii) undertake an examination of disposal procedures and distribution, in accordance with Resolution Conf. 4.18, of the proceeds emanating from the sale of illegal ivory seized outside its country of origin; and
DIRECTS the Secretariat to initiate a survey of the trade in raw and worked ivory within Africa as soon as possible.
Resolution Conf. 6.l3
Improving, Co-ordinating and FinancingAfrican Elephant Ivory Tmde Controls
WHEREAS Resolution Conf. 5.12, adopted at the fifth meeting of the Conference of the Parties (Buenos Aires, 1985), recommended procedures for the control of trade in ivory from African elephants, generally referred to as the “Quota System”, and directed that the CITES Secretariat assist in the implementation of the System;
WHEREAS Resolution Conf. 5.12 noted that the Secretariat could not effectively co-ordinate ivory trade controls without adequate
resources, and appealed for the provision of funds for this purpose;
RECOGNIZING that the level of voluntary contributions from governments, non-governmental organizations and individuals is not
adequate for the Secretatiat to continue providing effective coordination;
RECOGNIZING further the need for a source of funds that will ensure continuity in the co-ordination on ivory trade controls;
THE CONFERENCE OFTHE PARTIESTO THECONVENTION
URGES that governments, non-governmental organizations, trade
groups and other appropriate agencies contribute on avoluntary basis
70

to the Secretariat for ivory trade control co-ordination activities, with contributions proportionate to their trade in African elephant ivory; and
DIRECTS the Secretariat to consult with the IUCN Environmental Law Centre and report within one year to the Standing Committee on potential sources of revenue from duties, taxes, awards, fines, fees and assessments that Parties could implement or use for the purpose of financially assisting in CITES enforcement and Secretariat activities such as those of the Ivory Unit.
Resolution Conf. 6.14
Registmtion of Raw Ivory Importes and &porters
RECALLING Resolution Conf. 5.12, adopted at the fifth meeting of the Conference of the Parties (Buenos Aires, 1985), and related Resolutions designed to better regulate the trade in African Ivory;
NOTING that the status of legal ivory traders is prejudiced by the illegal trade and that the legal ivory traders can assist in improving controls;
ACKNOWLEDGING the accepted institutional principle of registering companieswhere thisisnecessary to ensure the proper conduct of their enterprises;
NOTING that reputable enterprises have welcomed the better regulation of the trade;
THE CONFERENCE OFTHE PARTIES TO THE CONVENTION
RECOMMENDS
a)
b)
9
that Parties establish a system of registration or licensing, or both, for commercial importers and exporters of raw ivory in their countries, but that this requirement need not apply to individuals engaged in bona-fide transactions in personal and household effects covered by Article VII, paragraph 3, of the Convention;
that commercial imports, exports and re-exports of raw ivory be limited to such registered or licensed importers and exporters effective 1 January 1989; and
that registered or licensed importers and exporters be encouraged to form an association to regulate their own industry, and to maintain liaison with the CITES Secretariat; and
SUGGESTS to those Parties where the ivory craftsmen are not yet structured, organized or controlled, that procedures be examined to:
a)
b)
register or license merchants dealing in raw ivory;
register and
or license all crafts enterprises which cut or carve ivory;
9 introduce recording and inspection procedures to enable the Management Authority to monitor the flow of ivory within the state.
Resolution Conf. 6.15
ManGirzg of Raw Ivory Cut Pieces
WHEREAS Resolution Conf. 3.12, adopted at the third meeting of the Conference of the Parties (New Delhi, 1981), defines the term “raw” African elephant ivory and recommends that each tusk or piece of raw ivory be marked;
WHEREAS Resolution Conf. 5.12, adopted at the fifth meeting of the Conference of the Parties (Buenos Aires, 1985), recommends that marking of raw African elephant ivory should be in accordance with Resolution Conf. 3.12 or with an implementation manual to be prepared by the Secretariat;
RECOGNIZING that it is not necessary that all raw ivory cut pieces be marked to provide reasonable trade controls;
NOTING that it is not possible to comply strictly with the marking requirements of Resolution Conf. 3.12 for all raw ivory cut pieces traded;
THE CONFE~NCEOFTHEPARTIESTOTHECONVENTION
RECOMMENDS
a) that “raw” African elephant ivory continue be defmed as described in Resolution Conf. 3.12, recommendation b);
b) that raw ivory be marked as recommended in Resolution Conf. 3.12, recommendation e), except that:
i) where it is not practicable to mark by means of punch dies, indelible ink may be used; and
ii) only whole tusks of any size and ivory cut pieces which are both 20 cm or longer and one kilogramme or heavier must be marked; and
c) that importing countries accept reexport certificates for raw ivory where the country of origin is not given when there is justification given for this omission in relation to the recommendations of Resolution Conf. 3.6, adopted at the third meeting of the Conference of the Parties (New Delhi, 1981), and the certificate bears a statement to this effect.
Resolution Conf. 6.16
Trade in Wbrked Ivory from Aftican Elephants
WHEREASResolution Conf. 3.12 adopted at the third meeting of the Conference of the Parties (New Delhi, 1981) defines the terms “raw” and “worked” ivory;
NOTING that Resolution Conf. 4.14 adopted at the fourth meeting of the Conference of the Parties (Gaborone, 1983) directed theTechnical Committee to draw up guidelines for controlling the trade in worked ivory as quickly as possible;

NOTING further that R&solution Conf. 4.12 adopted at the fourth meeting of the Conference of the Parties (Gaborone, 1983) urges that Parties which regulate the export or import of Appendix II souvenir specimens communicate to the Parties through the Secretariat which species are so regulated;
RECOGNIZING the need for continued control and monitoring of trade in worked ivory for the purposes of verification of shipments to prevent illegal trade;
RECOGNIZING also that a Party which does not require issuance or presentation of an export permit or reexport certificate for trade in worked ivory because it is considered to be not readily recognizeable presents a serious threat to the effective implementation of Resolution Conf. 5.12 and the ivory trade control procedures;
RECOGNIZING further that worked ivory qualifying as personal or household effects under Article VII, paragraph 3, of the Convention, is exempt from the requirements of Articles IV;
ACKNOWLEDGING the need for a practical and reasonable approach to control of trade in worked ivory that will not impede legitimate trade, not burden government authorities with non-essential documentation, and will minimize inconvenience to travellers;
THE CONFERENCE OF THE PARTIES To THE CONVENTION
RECOMMENDS
a) that worked ivory be considered as being readily recognizable in relation to the Article I, paragraph (b)(ii), of the Convention definition of “specimen” and the provisions of Article IV;
b)
9
(9
e)
that all trade in worked ivory from African elephants that does not qualify for exemption under Article VII of the Convention
continue to be subject to the provisions of Article IV;
that Parties note the exemption provided for by Article VII,
paragraph 3, in regulating export/reexport and import of personal or household effects, and under this aremption require presentation of an export permit upon import into the owner’s state of usual residence from a state where removal from the wild occurred which requires an export permit, but need not require presentation of certificate with respect to a reexport;
that in applying the provisions of Article VII, paragraph 3, a practical approach be taken in determining what quantity of items qualifies for the exemption; and
that importing countries accept reexport certificates for worked ivory where the country of origin is not given when there is justification given for this omission in relation to the recommendations of Resolution Conf. 3.6, adopted at the third meeting of the Conference of the Parties (New Delhi, 1981), and the certificate bears a statement to this effect;
SUGGESTS that, to inhibit illegal practices, range states producing worked ivory adopt internal controls such as registering or licensing ivory workers, industries and wholesale and retail outlets, and require them to keep records adequate for documenting the flow of ivory; and
DIRECTS the Secretariat to notifjr the Parties when it has been informed that a Party intends to regulate the export or import of worked ivory as personal or household effects.
72
IUCN/SSC Action Plans for the Conservation of Biological Diversity
1.
2.
3.
4.
5.
6.
7.
8.
9.
Action Plan for African Primate Conservation: 19861990. Compiled by J.F. Oates and the IUCN/SSC Primate Specialist Group, 1986, 41 pp., f7.50, U.S.$ 15.00.
Action Plan for Asian Primate Conservation: 1987-1991. Compiled by A.A. Eudey and the IUCN/SSC Primate Specialist Group, 1987,
65 pp, f7.50, U.S.$ 15.00.
Antelopes. Global Survey and Regional Action Plans. Part 1. East and Northeast Africa. Compiled by R. East and the IUCN/SSC Antelope Specialist Group, 1988,96 pp., g7.50, U.S.$l5.00.
Dolphins, Porpoises and Whales. An Action Plan for the Conservation of Biological Diversity: 1988-1992. Second Edition. Compiled by
W.F. Pert-in and the IUCN/SSC Cetacean Specialist Group, 1989,27 pp., fi.00, U.S.$ 10.00.
The Kouprey. An Action Plan for its Conservation. Compiled by J.R. MacKinnon, S.N. Stuart and the IUCN/SSC Asian Wild Cattle Specialist Group, 1988, 19 pp., fi.00, U.S.$ 10.00.
Weasels, Civets, Mongooses and their Relatives. An Action Plan for the Conservation of Mustelids and Viverrids. Compiled by A. Schreiber, R. Wirth, M. Riffel, H. van Rompaey and the IUCN/SSC Mustelid and Viverrid Specialist Group, 1989, 99 pp., f7.50,
U.S.$ 15.00.
Antelopes. Global Survey and Regional Action Plans. Part 2. Southern and South-central Africa. Compiled by R. East and the IUCN/ SSC Antelope Specialist Group, 1989,96 pp., X7.50, U.S.$l5.00.
Asian Rhinos. An Action Plan for their Conservation. Compiled by Mohd Khan bin Momin Khan and the IUCN/SSC Asian Rhino Specialist Group, 1989,23 pp., X5.00, U.S.$ 10.00.
Tortoises and Freshwater Turtles. An Action Plan for their Conservation. Compiled by the IUCN/SSC Tortoise and Freshwater Turtle Specialist Group, 1989,47 pp., X5.00, U.S.$ 10.00.
Where to order:
IUCN Publications Services Unit, 219~ Huntingdon Road, Cambridge, CB3 ODL, U.K. Please pay by cheque/intemational money order to IUCN. Add 15% for packing and surface mail costs. A catalogue of IUCN publications can be obtained from the above address.
Copyright © 2022 FDOKUMEN