Reconciling apparent conflicts between mitochondrial and nuclear phylogenies in African elephants
16
Reconciling Apparent Conflicts between Mitochondrial and Nuclear Phylogenies in African Elephants Yasuko Ishida 1. , Taras K. Oleksyk 2 * . , Nicholas J. Georgiadis 3 , Victor A. David 4 , Kai Zhao 1 , Robert M. Stephens 5 , Sergios-Orestis Kolokotronis 6 , Alfred L. Roca 1,7 * 1 Department of Animal Sciences, University of Illinois at Urbana-Champaign, Urbana, Illinois, United States of America, 2 Department of Biology, University of Puerto Rico at Mayagu ¨ ez, Mayagu ¨ ez, Puerto Rico, 3 Bole and Klingenstein Foundation, Cody, Wyoming, United States of America, 4 Laboratory of Genomic Diversity, National Cancer Institute at Frederick, Frederick, Maryland, United States of America, 5 Advanced Biomedical Computing Center, SAIC-Frederick, Inc., National Cancer Institute at Frederick, Frederick, Maryland, United States of America, 6 Sackler Institute for Comparative Genomics, American Museum of Natural History, New York, New York, United States of America, 7 Institute for Genomic Biology, University of Illinois at Urbana-Champaign, Urbana, Illinois, United States of America Abstract Conservation strategies for African elephants would be advanced by resolution of conflicting claims that they comprise one, two, three or four taxonomic groups, and by development of genetic markers that establish more incisively the provenance of confiscated ivory. We addressed these related issues by genotyping 555 elephants from across Africa with microsatellite markers, developing a method to identify those loci most effective at geographic assignment of elephants (or their ivory), and conducting novel analyses of continent-wide datasets of mitochondrial DNA. Results showed that nuclear genetic diversity was partitioned into two clusters, corresponding to African forest elephants (99.5% Cluster-1) and African savanna elephants (99.4% Cluster-2). Hybrid individuals were rare. In a comparison of basal forest ‘‘F’’ and savanna ‘‘S’’ mtDNA clade distributions to nuclear DNA partitions, forest elephant nuclear genotypes occurred only in populations in which S clade mtDNA was absent, suggesting that nuclear partitioning corresponds to the presence or absence of S clade mtDNA. We reanalyzed African elephant mtDNA sequences from 81 locales spanning the continent and discovered that S clade mtDNA was completely absent among elephants at all 30 sampled tropical forest locales. The distribution of savanna nuclear DNA and S clade mtDNA corresponded closely to range boundaries traditionally ascribed to the savanna elephant species based on habitat and morphology. Further, a reanalysis of nuclear genetic assignment results suggested that West African elephants do not comprise a distinct third species. Finally, we show that some DNA markers will be more useful than others for determining the geographic origins of illegal ivory. These findings resolve the apparent incongruence between mtDNA and nuclear genetic patterns that has confounded the taxonomy of African elephants, affirm the limitations of using mtDNA patterns to infer elephant systematics or population structure, and strongly support the existence of two elephant species in Africa. Citation: Ishida Y, Oleksyk TK, Georgiadis NJ, David VA, Zhao K, et al. (2011) Reconciling Apparent Conflicts between Mitochondrial and Nuclear Phylogenies in African Elephants. PLoS ONE 6(6): e20642. doi:10.1371/journal.pone.0020642 Editor: William J. Murphy, Texas A&M University, United States of America Received February 23, 2011; Accepted May 6, 2011; Published June 8, 2011 This is an open-access article, free of all copyright, and may be freely reproduced, distributed, transmitted, modified, built upon, or otherwise used by anyone for any lawful purpose. The work is made available under the Creative Commons CC0 public domain dedication. Funding: Funding was provided by the U. S. Fish and Wildlife Service African Elephant Conservation Fund Grant no. AFE-0458-98210-8-G743. The funders had no role in study design, data collection and analysis, decision to publish, or preparation of the manuscript. Competing Interests: The authors have declared that no competing interests exist. * E-mail: [email protected] (ALR); [email protected] (TKO) . These authors contributed equally to this work. Introduction Central to the successful management of endangered taxa is determination of whether their populations comprise one or more species. Molecular methods can play a major role in establishing the systematics of endangered taxa. Where more than one species is revealed, a separate conservation strategy would be justified for each. African elephants (genus Loxodonta) occupying tropical forest habitats were long considered to comprise a single species with elephants in other African habitats. Recent studies have renewed debate about their taxonomy, after both morphological and nuclear DNA analyses suggested that African elephants form two distinct species separated by a relatively narrow hybrid zone [1]. Skull measurements from 295 elephants of known provenance suggested that forest and savanna elephants fall into two mor- phologically distinct species [2,3]. Nuclear DNA analyses using both slower-evolving nuclear sequences [4,5,6] and more rapidly evolving microsatellite loci [7] have provided concordant evidence that forest and savanna elephants are distinct species [4,6,8,9] that are as divergent genetically as Asian elephants are from mammoths [5]. Few morphological intermediates [3,10] and nuclear genetic hybrids [4,6,7] between forest and savanna elephants have been detected, primarily in a zone of mixed forest-savanna habitat that surrounds the tropical forests of Africa [1]. The deeper relationships present among mtDNA lineages have also been determined in African elephants [4,11,12,13]. While two highly divergent mtDNA clades are present, a non-monophyletic pattern was revealed that did not cleanly separate forest and savanna elephants. Studies basing their conclusions primarily or completely on mtDNA data have inferred conflicting conclusions about African elephant systematics. Debruyne (2005) has stated that ‘‘the only defendable attitude assumes that Africa harbors a PLoS ONE | www.plosone.org 1 June 2011 | Volume 6 | Issue 6 | e20642
Transcript of Reconciling apparent conflicts between mitochondrial and nuclear phylogenies in African elephants

Reconciling Apparent Conflicts between Mitochondrialand Nuclear Phylogenies in African ElephantsYasuko Ishida1., Taras K. Oleksyk2*., Nicholas J. Georgiadis3, Victor A. David4, Kai Zhao1, Robert M.
Stephens5, Sergios-Orestis Kolokotronis6, Alfred L. Roca1,7*
1 Department of Animal Sciences, University of Illinois at Urbana-Champaign, Urbana, Illinois, United States of America, 2 Department of Biology, University of Puerto Rico
at Mayaguez, Mayaguez, Puerto Rico, 3 Bole and Klingenstein Foundation, Cody, Wyoming, United States of America, 4 Laboratory of Genomic Diversity, National Cancer
Institute at Frederick, Frederick, Maryland, United States of America, 5 Advanced Biomedical Computing Center, SAIC-Frederick, Inc., National Cancer Institute at Frederick,
Frederick, Maryland, United States of America, 6 Sackler Institute for Comparative Genomics, American Museum of Natural History, New York, New York, United States of
America, 7 Institute for Genomic Biology, University of Illinois at Urbana-Champaign, Urbana, Illinois, United States of America
Abstract
Conservation strategies for African elephants would be advanced by resolution of conflicting claims that they comprise one,two, three or four taxonomic groups, and by development of genetic markers that establish more incisively the provenanceof confiscated ivory. We addressed these related issues by genotyping 555 elephants from across Africa with microsatellitemarkers, developing a method to identify those loci most effective at geographic assignment of elephants (or their ivory),and conducting novel analyses of continent-wide datasets of mitochondrial DNA. Results showed that nuclear geneticdiversity was partitioned into two clusters, corresponding to African forest elephants (99.5% Cluster-1) and African savannaelephants (99.4% Cluster-2). Hybrid individuals were rare. In a comparison of basal forest ‘‘F’’ and savanna ‘‘S’’ mtDNA cladedistributions to nuclear DNA partitions, forest elephant nuclear genotypes occurred only in populations in which S clademtDNA was absent, suggesting that nuclear partitioning corresponds to the presence or absence of S clade mtDNA. Wereanalyzed African elephant mtDNA sequences from 81 locales spanning the continent and discovered that S clade mtDNAwas completely absent among elephants at all 30 sampled tropical forest locales. The distribution of savanna nuclear DNAand S clade mtDNA corresponded closely to range boundaries traditionally ascribed to the savanna elephant species basedon habitat and morphology. Further, a reanalysis of nuclear genetic assignment results suggested that West Africanelephants do not comprise a distinct third species. Finally, we show that some DNA markers will be more useful than othersfor determining the geographic origins of illegal ivory. These findings resolve the apparent incongruence between mtDNAand nuclear genetic patterns that has confounded the taxonomy of African elephants, affirm the limitations of using mtDNApatterns to infer elephant systematics or population structure, and strongly support the existence of two elephant speciesin Africa.
Citation: Ishida Y, Oleksyk TK, Georgiadis NJ, David VA, Zhao K, et al. (2011) Reconciling Apparent Conflicts between Mitochondrial and Nuclear Phylogenies inAfrican Elephants. PLoS ONE 6(6): e20642. doi:10.1371/journal.pone.0020642
Editor: William J. Murphy, Texas A&M University, United States of America
Received February 23, 2011; Accepted May 6, 2011; Published June 8, 2011
This is an open-access article, free of all copyright, and may be freely reproduced, distributed, transmitted, modified, built upon, or otherwise used by anyone forany lawful purpose. The work is made available under the Creative Commons CC0 public domain dedication.
Funding: Funding was provided by the U. S. Fish and Wildlife Service African Elephant Conservation Fund Grant no. AFE-0458-98210-8-G743. The funders had norole in study design, data collection and analysis, decision to publish, or preparation of the manuscript.
Competing Interests: The authors have declared that no competing interests exist.
* E-mail: [email protected] (ALR); [email protected] (TKO)
. These authors contributed equally to this work.
Introduction
Central to the successful management of endangered taxa is
determination of whether their populations comprise one or more
species. Molecular methods can play a major role in establishing
the systematics of endangered taxa. Where more than one species
is revealed, a separate conservation strategy would be justified
for each. African elephants (genus Loxodonta) occupying tropical
forest habitats were long considered to comprise a single species
with elephants in other African habitats. Recent studies have
renewed debate about their taxonomy, after both morphological
and nuclear DNA analyses suggested that African elephants form
two distinct species separated by a relatively narrow hybrid zone [1].
Skull measurements from 295 elephants of known provenance
suggested that forest and savanna elephants fall into two mor-
phologically distinct species [2,3]. Nuclear DNA analyses using both
slower-evolving nuclear sequences [4,5,6] and more rapidly
evolving microsatellite loci [7] have provided concordant evidence
that forest and savanna elephants are distinct species [4,6,8,9] that
are as divergent genetically as Asian elephants are from mammoths
[5]. Few morphological intermediates [3,10] and nuclear genetic
hybrids [4,6,7] between forest and savanna elephants have been
detected, primarily in a zone of mixed forest-savanna habitat that
surrounds the tropical forests of Africa [1].
The deeper relationships present among mtDNA lineages have
also been determined in African elephants [4,11,12,13]. While two
highly divergent mtDNA clades are present, a non-monophyletic
pattern was revealed that did not cleanly separate forest and
savanna elephants. Studies basing their conclusions primarily or
completely on mtDNA data have inferred conflicting conclusions
about African elephant systematics. Debruyne (2005) has stated
that ‘‘the only defendable attitude assumes that Africa harbors a
PLoS ONE | www.plosone.org 1 June 2011 | Volume 6 | Issue 6 | e20642

single species of elephant’’ [12]. Eggert et al. (2002) [14,15] have
hypothesized that the elephants ‘‘of west Africa belong to a newly
recognized and yet to be formally named species’’ [14]. Johnson
et al. (2007) have stated that ‘‘the classification of species into
savannah and forest may not reflect their evolutionary history but
simply the habitat in which they currently exist’’; and that Africa’s
elephants fall into three or four ‘‘groups’’ with ‘‘implications for
taxonomy’’ [16]. By contrast, analyzing both mtDNA and nuclear
genetic patterns within the same individuals and populations,
Roca et al. (2005) [4] discovered that the non-monophyletic
mtDNA pattern was strongly incongruent with patterns present
among nuclear markers (characterized as ‘‘cyto[or mito]-nuclear
genomic dissociation’’), and therefore did not detract from the
two-species model for living Loxodonta taxa [1].
These sometimes strikingly opposed interpretations of molecular
data are influenced by the types of genetic markers used [1]. Thus,
despite exceptionally intensive genetic analysis, opposing taxo-
nomic designations of African elephants persist to date, and the
African Elephant Specialist Group and Species Survival Commis-
sion of the International Union for the Conservation of Nature
(IUCN) have cited the multiplicity of taxonomic interpretations
of genetic data as justification for its decision to ‘‘continue to treat
African elephants as a single species’’ [17]. A 2011 published
survey of conservation priorities among afrotherian mammals con-
cluded that resolution of the relationships and diversity among
African elephants constitutes an ‘‘urgent priority’’ given ‘‘the
important conservation implications of elephant taxonomy’’ [18].
In this study, we sought to resolve these apparent conflicts by
further examining nuclear and mtDNA patterns among savanna
elephants using a novel set of short tandem repeat (STR) loci in
African forest and savanna elephants that had previously been
typed for mtDNA. Employing a Bayesian clustering approach, we
sought to better quantify the degree and geographic extent of
hybridization based on these STR loci. We examined the rela-
tionships between mtDNA and nuclear patterns in these elephants
and determined what these patterns imply about evolutionary
relationships of almost a thousand African elephants from 81 geo-
graphic locales for which mtDNA sequence had been previously
generated. We determined whether geographically mapping the
mtDNA and nuclear genetic partitions among the elephants of
Africa might provide additional insights into resolving the differing
assertions regarding their taxonomic status. We found that our
novel approach to mtDNA analysis could reconcile the apparent
conflict previously reported between mitochondrial and nuclear
phylogenies in African elephants [12].
Based on this systematic clarification, we further sought to
improve upon the other major area in which genetics can contri-
bute to African elephant conservation: the forensic analysis of
ivory samples. Although the Convention on International Trade in
Endangered Species (CITES) banned the ivory trade in 1989,
large numbers of elephants continue to be poached for their tusks,
and the illegal trade in ivory is a major threat to their conservation
[19]. Since ivory is often confiscated in markets far from the
locations where elephants are poached, DNA markers have been
used to identify the source population of confiscated ivory [20,21].
Wasser and colleagues have successfully extracted DNA from
small amounts of elephant ivory [22,23], and applied spatial
smoothing methods to allele frequencies of STRs in order to assign
ivory to its source. Using this approach, they have genotyped tusks
of smuggled ivory and assigned them as originating within a par-
ticular range country [24]. The success of these methods is
encouraging, though further enhancement of the accuracy and
precision of assignment would be desirable [25,26]. We therefore
also sought to improve DNA-based methods for tracking ivory by
developing a means of quantifying the effectiveness of each of our
STR loci for assigning elephants to their place of origin, and to
identify those STR loci most and least effective at geographic
assignment.
Results
Samples of African elephants collected primarily by dart biopsy,
as previously described [11,27], were grouped by geographic
location of collection (Figure 1). Samples were grouped into 17
savanna locales and 5 forest locales, all except for the elephants of
Garamba, which are from a region historically of mixed forest and
savanna habitats [28] where both types of elephants have been
reported based on morphology [3,10], and where hybrids have
been detected based on morphology [10] or nuclear genotypes
[4,6,7]. Samples recently collected included forest elephants from
the Bili Forest in the Democratic Republic of Congo, a location
previously not included in elephant genetic studies; and a forest
elephant sample from the Paris Zoo (France) of Sierra Leone
origin (Figure 1) [29]. We also report from previously sampled
locations [7] the STR genotypes of a much larger number of
individuals. A total of 555 African elephant individuals (75 forest,
19 Garamba and 461 savanna elephants) were successfully geno-
typed, along with 9 Asian elephants (Elephas maximus), using fifteen
microsatellite loci, including newly developed loci (Tables S1, S2),
with a minimum of 11 loci used for each of the analyses. Summary
statistics for the loci are shown in Table S2.
Genetic separation between forest and savanna Africanelephants
Bayesian clustering analysis was performed on the microsatellite
data using the program STRUCTURE [30], with strong evidence
for K = 2 clusters among African elephants (Table S3) [31]. With
K = 2, the clusters showed a geographic split that corresponded
closely to the split between forest and savanna elephants (Figures 1, 2),
in agreement with previous studies of morphology and nuclear
genetic markers [1,2,3,4,6,7,13,32,33]. Every elephant from a
tropical forest locale was identified as completely or primarily of
forest elephant ancestry (Cluster 1 in green), while not a single
elephant assigned primarily or completely to cluster 1 was from
a location outside of tropical forest or mixed habitat (Figure 2).
Likewise, every individual from a locale outside the tropical
forest range was identified as primarily or completely savanna-
elephant like (Cluster 2 in orange) in genotype, while elephants
assigned predominantly or completely to Cluster 2 were all from
locales outside the tropical forest range (Figure 2). There were no
exceptions.
The overall contributions of Clusters 1 and 2 (forest elephant
and savanna elephant genotypes, respectively) to the elephant
population at each locale are shown in Figure 1. Across all ele-
phants at tropical forest locales, the estimated percentage assign-
ment to the forest elephant cluster averaged 99.5%. Among all
savanna elephants, assignment to the savanna elephant cluster
averaged 99.4%. In some cases, a low level of ancestry was
assigned to the cluster of the other species. Some of these represent
the few individuals that previous nuclear sequences have shown to
be hybrids [4,6,7]. For others, the small proportion partitioned to
the other species may reflect lower limits of resolution for the
software STRUCTURE.
One of our locales, Garamba, is in a region of the Democratic
Republic of Congo that historically included both forest and
savanna habitats [28,34]. Previous genetic studies also established
the presence of hybrid nuclear genotypes in our Garamba samples
[4,6,7]. This finding is supported by the current analysis, which
Reconciling African Elephant Phylogenies
PLoS ONE | www.plosone.org 2 June 2011 | Volume 6 | Issue 6 | e20642

indicated that Garamba has the greatest degree of nuclear gene-
tic admixture detected between forest and savanna elephants
(Figure 1), although with a much larger proportion of ancestry par-
titioned to the forest cluster (90.8%; Figure 1). Individual hybrids
previously identified using nuclear gene sequences (notably in
Benoue and Garamba) [4,6] are also apparent in the STRUC-
TURE analysis (Figure 2). No genetic hybrid has ever been
previously detected among elephants in locations deep in the
tropical forest [4,6,7], although among the savanna elephants two
individuals in Cameroon had been identified as hybrids [4].
Overall, the elephants in Cameroon did demonstrate a slightly
lower overall assignment to the savanna cluster than other savanna
locales, with 95.6% assignment to the savanna cluster for Benoue
elephants, and 99.7% assignment for Waza; although even in
Cameroon savannas, the forest elephant genetic contribution was
quite limited (Figures 1 and 2). Contrary to the hypothesis that
forest-savanna elephant hybrids are both common and widespread
[12,16] these findings support the view that hybrids are rare and
limited in geographic distribution (Figures 1, 2) [1], as the overall
proportion of genotypes inferred to derive from admixture with
the other species was less than one percent for both forest and
savanna elephants.
A factorial correspondence analysis (FCA) implemented using
the software GENETIX [35] also demonstrated distinctiveness
between forest and savanna elephants (Figure 2). The low degree
of hybridization, even among the few populations that contain
hybrids, was also evident in this analysis. Figure 2 shows the rep-
resentation of the two major axes determined by the FCA in a
combined analysis of all African elephants. The 461 savanna
elephants formed a distinct group from 75 forest elephants. The
apparent genetic diversity of the forest/Garamba elephants is
noteworthy (and likely accounts for much of the variability in the
FCA), especially given that many more savanna elephants from a
wider geographic range were used for the analysis, and given that
ascertainment bias would tend to increase the relative diversity of
the savanna elephants in which most of the STR markers were
selected for their polymorphism (Table S1). The lack of true
genetic intermediates was striking in the FCA. With only one
exception (GR0020), hybrid elephants did not occupy the middle
space between forest and savanna species; rather, they tended to
show only a low level of admixture, even in the hybrid zone of
Garamba (Figure 2). Thus hybridization of forest and savanna
elephants has not led to a ‘‘hybrid swarm’’ condition in which
some populations are comprised primarily of genetic hybrids
between the two species.
Genetic relationships among different locales were also inferred
from the STR data using the chord distance. The elephants from
savanna and forest locales formed two distinctive phylogenetic
clusters (Figure 2). Likewise, our STRUCTURE results were not
different after (1) the number of individual savanna elephants was
Figure 1. Location map and nuclear genetic clustering of sampled elephant populations in Africa. The map portrays the extent oftropical forest (dark green), and the forest-savanna transition zone (light green) [28]. Bar plots for each locale represent the average contribution tothe genotypes of elephants made by forest (green) or savanna (orange) elephants, as partitioned using the program STRUCTURE (K = 2) using datafrom 11 microsatellite loci (see Figure 2). STRUCTURE cluster 1 (green) comprised 99.5% of forest populations and 0.6% of savanna populations.Cluster 2 (orange) comprised 0.5% of forest populations and 99.4% of savanna populations. Sampling locations in forest habitats were: DS-DzangaSangha, Central African Republic; OD-Odzala, Congo (Brazzaville); BF-Bili Forest, Congo (Kinshasa); LO-Lope, Gabon; and SL-Sierra Leone (one zooindividual). Savanna locations: CH-Chobe, MA-Mashatu, SA-Savuti in Botswana; BE-Benoue, WA-Waza in Cameroon; AB-Aberdares, AM-Amboseli, KE-Central Kenya/Laikipia, MK-Mount Kenya in Kenya; NA-Northern Namibia/Etosha; KR-Kruger in South Africa; NG-Ngorongoro, SE-Serengeti, TA-Tarangire in Tanzania; HW-Hwange, SW-Sengwa, ZZ-Zambezi in Zimbabwe. GR-Garamba is located in the Guinea-Congolian/Sudanian transition zoneof vegetation in D.R. Congo that historically included a mixture of forest and secondary grasslands [28] suitable for both African elephant groups [3].doi:10.1371/journal.pone.0020642.g001
Reconciling African Elephant Phylogenies
PLoS ONE | www.plosone.org 3 June 2011 | Volume 6 | Issue 6 | e20642

Figure 2. Species subdivisions and population substructure among African elephants. (A) Distinctiveness of forest and savanna elephantspecies and the pattern of hybridization between forest and savanna elephants was demonstrated using the program STRUCTURE, which applies amodel-based clustering algorithm to identify subgroups that have distinctive allele frequencies [30]. The two partitions correspond to African forestelephant ancestry (green) and African savanna elephant ancestry (orange), and each is confined almost exclusively ($99.4%) to locales in,respectively, tropical forest and non-tropical forest habitats (Figure 1). Garamba (GR) is the only population that spans an intermediate habitat zonecontaining both forest and savanna vegetation, and both types of elephants [3,28]. (B) A factorial correspondence analysis (FCA) implemented usingthe software GENETIX [35] reveals the distinctiveness of forest and savanna elephants, with a very limited degree of hybridization. A total of 555African elephant individuals (75 forest, 19 Garamba, and 461 savanna elephants) were used in the analysis. The two major axes determined by theFCA were used; plotted on the x- and y-axes, respectively accounting for 6.68% and 2.26% of the total variability. Savanna elephants formed a groupdistinct from the group formed by forest plus Garamba elephants. With only one exception (GR0020), hybrid elephants do not occupy the middlespace between forest and savanna elephants; rather, they tend to show only a low level of admixture [4]. (C) Neighbor-joining phylogram depictingthe genetic relationships among elephants by locale, based on the STR data using the chord distance. Elephants from savanna (orange) and forest(green) locales form distinct groups. Locale abbreviations are as in Figure 1.doi:10.1371/journal.pone.0020642.g002
Reconciling African Elephant Phylogenies
PLoS ONE | www.plosone.org 4 June 2011 | Volume 6 | Issue 6 | e20642

randomly reduced to equal the number of forest elephants (run
multiple times with different sets of savanna elephants); (2) the
number of forest and savanna elephant individuals was randomly
trimmed to each equal the number of Garamba elephants (run
multiple times with different sets of forest and savanna elephants);
or (3) the number of STR loci genotyped was increased to 27 for
a subset of 35 forest, 9 Garamba, and 142 savanna elephants.
Consequently, our results were robust across methodologies and
across different resampling schemes of individuals and loci.
Geographic distribution of nuclear and mtDNA partitionsThe mtDNA lineages of African elephants have been studied by
a number of researchers who used different designations for
mtDNA haplogroups, and who often compared different regions
of the mtDNA genome [4,12,13,15,16,36,37]. We were able to
combine the results of all of these studies, including that of Johnson
et al. (2007) [16] which had included the sequences of Eggert et al.
(2002) [15] and Nyakaana et al. (2002) [37] and others, by
comparing overlapping fragments of mtDNA across the studies.
Given the priority of Debruyne’s (2005) [12] publication (which
established with strong bootstrap support the deepest relationships
among haplogroups), the current study employs the clade ‘‘S’’ and
clade ‘‘F’’ designations of Debruyne (2005) for the two most deeply
rooted mtDNA clades. Since mtDNA is non-recombinant, all
genes or regions in the mtDNA genome have followed the same
evolutionary trajectory [9]; and since some studies had sequenced
individual elephants for two or more mtDNA regions [12,13], it
was possible to discover the equivalent designations used for the F
and S clades across the other elephant mtDNA studies (Figure 3;
Figure S1), even across studies that used non-overlapping regions
of the mtDNA genome (see Figure S2 for details). For example,
Roca et al. (2005) [4] had sequenced a portion of the mtDNA ND5
gene and detected two deep clades, designated I and II (Figure 3).
Debruyne (2005) also detected two deep clades, by sequencing the
CYTB mtDNA gene, calling them Clades S and F. Sequences from
both studies were compared to those of Lei et al. (2008), who had
sequenced individual elephants for longer mtDNA regions that
overlapped with the sequences both of Debruyne (2005) and of
Roca et al. (2005) (Figure S2) [4,12,13]. Using this system, desig-
nations for the equivalent clades across studies were identified.
The mtDNA clade designations used by all other elephant mtDNA
surveys for clades or ‘‘groups’’ corresponding to the F/S clade
nomenclature of Debruyne (2005) [12] are shown in Figure 3.
In the most recent of these surveys, Johnson et al. (2007) [16],
reported the presence of four taxonomic groups of elephants in
Africa. They hypothesized that they had uncovered the presence
of new genetic groupings of African elephants due to their
collection of elephant samples from previously unexamined loca-
tions. In our attempt to identify haplogroup synonyms across
various studies, we identified the elephants of Debruyne (2005)
[12] and Eggert et al. (2002) [15] within the network of Johnson
et al. (2007) [16] (Figure 3). We found that the elephant groups of
Johnson et al. (2007) were synonymous with five subclades of the
basal F and S clades previously identified by Debruyne (2005)
[12], with the subclades designated F4 and F5 by Debruyne (2005)
[12] consolidated into ‘‘Group II’’ by Johnson et al. (2007) [16]
(Figure 3 and Figure S1). Thus, while recognizing the importance
of the intensive geographic sampling conducted by Johnson et al.
(2007) [16], we consider that the best interpretation of the mtDNA
network generated by Johnson et al. (2007) would not be that
previously undetected genetic groupings of elephants had been
found, but rather that one of their groups corresponded to the
mtDNA S clade, while each of the other groups of Johnson et al.
(2007) corresponded to subdivisions of the mtDNA F clade
identified previously by Debruyne (2005) [12] and Eggert et al.
(2002) [15] (Figure 3).
Having established the relationship of mtDNA designations
across studies, we combined all of their results, assessing F and S
clade mtDNA data on elephants from 81 locations across Africa
(Figure 4; Figure S3) [4,12,13,15,16,36,37]. The conclusion drawn
from this combined dataset was remarkable: not a single elephant
from the African tropical forests carried S clade mtDNA (Figure 4).
The combined results surveyed at least 30 tropical forest locations
across both Guinean and Congolian forest blocks (Figure 4, Figure
S3), yet S clade was not detected at any tropical forest locales. This
is especially remarkable given that three independent surveys have
each reported, by contrast, that about 20% of Africa’s savanna
elephants carry forest elephant (F clade) mtDNA (Figures 3, 5)
[4,12,13].
Although S clade was not detected in all savanna locales, in many
cases, the apparent absence of S clade at a locale was likely due to an
insufficient number of elephants being sampled, since samples from
nearby savanna regions did detect S clade (e.g., in northern
Botswana; Figure 4). Some previous studies had analyzed mtDNA
haplogroups before Debruyne (2005) identified the basal F and S
clades [15,37]; others did not consider whether their mtDNA
haplogroups comprised subsets of the F or S clade [16]. Thus the
pattern we are demonstrating for the distribution of mtDNA S clade
has not been reported previously with this degree of geographic
sampling. Our approach to mtDNA phylogeography (Figure 4)
produced another notable result: the presence of S clade mtDNA
closely corresponds to the range boundaries traditionally ascribed to
the savanna elephant species based on nuclear DNA (Figure 1),
morphology and habitat [1,2,3,4,6,7,13,24,25,26,32,33,38,39].
This helps to reconcile the apparent conflict previously reported
between phylogeographic patterns of mtDNA in African elephants
and the very different geographic patterns in morphology and
nuclear genotypes [12]. For mtDNA the presence or absence of S
clade corresponded to the geographic pattern previously reported
using nuclear and morphological markers [3,6]. A contingency
table was analyzed, comparing the presence (vs. lack of detection)
of S clade mtDNA to the type of habitat at a locale (tropical forest
vs. other or mixed habitats). Since 30 tropical forest locales lacked
elephants carrying S-clade mtDNA, while S clade was detected in
34 of 51 non-tropical-forest samples, the association was found to
be extremely significant (Fisher’s exact test, two-tailed p,1024).
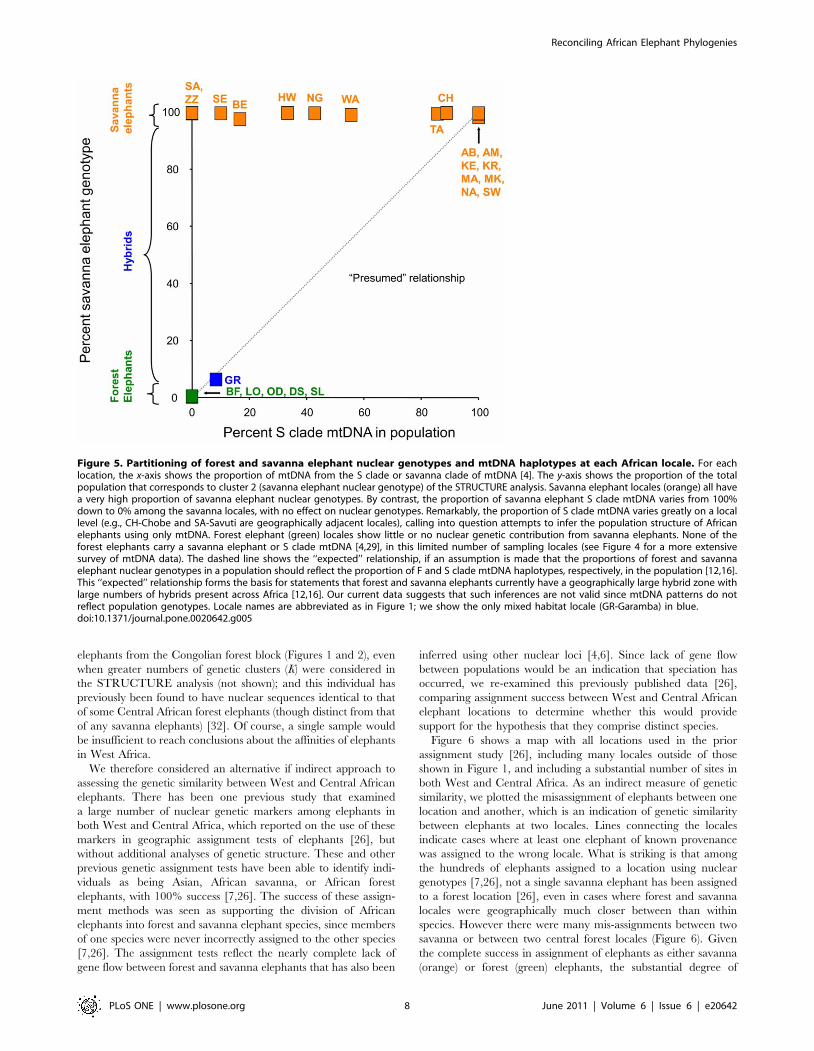
Genetic studies of African elephants have detected mito-nuclear
discordance [4], in which patterns inferred using mtDNA markers
do not correspond to those found using nuclear markers in the
same forest and savanna elephants [4,11,12,13]. We therefore
compared the partitioning of elephant nuclear genotypes by the
program STRUCTURE with the pattern of mtDNA present in
the same elephant individuals and locales [4]. In Figure 5, each
African elephant locale is plotted with the x-axis showing the
proportion of mtDNA haplotypes that belong to the ‘‘S clade’’ or
savanna clade of mtDNA [4], while the y-axis shows the pro-
portion of the nuclear genotypes assigned to the savanna elephant
cluster by STRUCTURE (see Figure 1). Although savanna
elephant locales all had an overwhelmingly high proportion of
savanna elephant nuclear genotypes, the proportion of savanna
clade mtDNA (S clade) carried by the elephants at savanna locales
can range from 100% down to 0% (Figure 5) [4]. In fact, the
proportion of savanna elephant nuclear genotypes carried by
savanna elephants appeared to have no relationship to the pro-
portion of S clade savanna mtDNA present in the population
(Figure 5). By contrast, while forest elephant locales showed little
or no nuclear genetic contribution from savanna elephants, they
also carry no S clade mtDNA (Figure 5) [4]. Previous studies have
Reconciling African Elephant Phylogenies
PLoS ONE | www.plosone.org 5 June 2011 | Volume 6 | Issue 6 | e20642

Figure 3. Relationship of the four groups identified by Johnson and colleagues to the F and S mtDNA clades and subcladesdescribed by other researchers. (A) Johnson et al. (2007) [16] proposed dividing elephants into four novel ‘‘groups’’ based on an unrootednetwork using the D-loop hypervariable region of mtDNA (reproduced under a Creative Commons Attribution license, from BioMed Central Ltd). (B)We identified the mtDNA haplotypes of Debruyne (2005) [12] and Eggert et al. (2002) [15] within the Johnson et al. (2007) [16] network, finding thatthere was considerable overlap between the mtDNA diversity reported by Johnson et al. (2007) and the diversity reported by the prior studies.Debruyne (2005) [12] had reported strong support for a separation of African elephant mtDNA haplotypes into two deep subdivisions, designatedmtDNA clades ‘‘F’’ and ‘‘S’’, subsequently verified by two other researcher teams [4,13]. Debruyne (2005) [12] established further subdivisions withinthe F clade (designated F1, F2, F4 and F5; the S clade was also designated S3 with no further subdivisions) [12,15]. Three of the groups identified byJohnson et al. (2007) [16] corresponded to subclades of the F clade previously identified by Debruyne (2005) [12]; the other corresponded to the Sclade. (C) Across the previously reported mtDNA surveys of African elephants, sufficient overlap existed among sequences and individuals for mtDNArelationships to be established across all of the studies. Cladograms show the naming conventions used for S clade and F clade mtDNAs acrossdifferent studies [4,12,13,16], including that of Johnson et al. (2007), which had incorporated the sequences of Eggert et al. (2002) [15] and Nyakaana
Reconciling African Elephant Phylogenies
PLoS ONE | www.plosone.org 6 June 2011 | Volume 6 | Issue 6 | e20642

made the suggestion that forest and savanna elephants have a
geographically expansive hybrid zone with large numbers of
hybrids present across Africa [12,16], based on the often unstated
assumption that the proportions of forest-savanna nuclear markers
in a population likely reflect the proportion of F and S clade
mtDNA markers. In Figure 5, the dashed line shows this
‘‘presumed’’ relationship if the proportions of S and F clade
mtDNAs are assumed to serve as accurate estimators of the overall
contribution of savanna and forest lineages to the nuclear genetic
makeup of the elephants. If this were the case, many savanna
populations should have a high proportion of forest elephant
admixture. Instead, the actual data showed that no relationship
existed for savanna elephants between the proportion of F to S
clade mtDNA and the degree of hybridization present in the
locales. Thus the suggestion that African regions that include both
F clade and S clade elephants represent geographically extensive
hybrid zones in which both forest and savanna elephants are
present and the populations are a mixture of the two [12,16] is
contradicted by the current data for Cameroon, Southern and
Eastern Africa (Figure 5). Since the lack of association between
mtDNA and nuclear patterns holds true for these three regions,
one may also question the validity of taxonomic and population
genetic inferences drawn from analogous mtDNA patterns in West
Africa.
Nuclear genetic similarity between Central and WestAfrican elephants
The Guinean forest block in West Africa is currently not
contiguous with the Congolian forest block in Central Africa
[28,40]. One genetic study that conducted extensive sampling of
elephants in West Africa hypothesized that West African elephants
may comprise a third species of elephant, separate from forest and
savanna elephants in the rest of Africa [14,15]. The single elephant
in our sample from a West African locale in the Guinean forest
block, for which the mtDNA haplotype [29] further established its
West African origin [15], clustered with the Central African
et al. (2002) [37]. The ‘‘clade F’’ identified by Debruyne (2005) [12] proved synonymous with the other clade designations shown in green; the ‘‘cladeS’’ identified by Debruyne (2005) [12] proved synonymous with the other clade designations shown in orange [4,12,13,16]. Supplementary Figure S2details the overlapping informative sequences that established the relationships shown across the datasets.doi:10.1371/journal.pone.0020642.g003
Figure 4. The distribution of ‘‘S’’ clade mtDNA across the African continent corresponds to the distribution of savanna elephants.The map shows the distribution of S clade mtDNA across Africa, using results reported by all previous continent-wide studies of elephant mtDNA inAfrica [4,12,13,15,16,36,37], with results shown by location. A plus sign (orange) on the map indicates that S clade mtDNA was present at the location(whether or not F clade mtDNA was also detected). A triangle indicates that S clade was not detected in the sample. S clade mtDNA was completelyabsent across the entire range of forest elephants at 30 tropical forest locales (dark green) across West and Central Africa. By contrast, at somesavanna locales where S clade was not detected in some samples, such as Botswana, the apparent absence of S clade was likely due to an insufficientnumbers of elephants being sampled, since other nearby samples did detect S clade. The presence or absence of S clade mtDNA was found to behighly significantly associated with type of habitat (tropical forest vs. other or mixed habitats; Fisher’s exact test, two-tailed p,1024). The distributionof S clade closely corresponds to the geographic distribution of savanna elephant habitat, morphology and nuclear genotypes [2,3,4,6,7]. The arrowindicates that the mtDNA S clade haplogroup was also present in West African savanna elephant populations. Further information on sample typesand locations is supplied in Supplementary Figure S3.doi:10.1371/journal.pone.0020642.g004
Reconciling African Elephant Phylogenies
PLoS ONE | www.plosone.org 7 June 2011 | Volume 6 | Issue 6 | e20642
elephants from the Congolian forest block (Figures 1 and 2), even
when greater numbers of genetic clusters (K) were considered in
the STRUCTURE analysis (not shown); and this individual has
previously been found to have nuclear sequences identical to that
of some Central African forest elephants (though distinct from that
of any savanna elephants) [32]. Of course, a single sample would
be insufficient to reach conclusions about the affinities of elephants
in West Africa.
We therefore considered an alternative if indirect approach to
assessing the genetic similarity between West and Central African
elephants. There has been one previous study that examined
a large number of nuclear genetic markers among elephants in
both West and Central Africa, which reported on the use of these
markers in geographic assignment tests of elephants [26], but
without additional analyses of genetic structure. These and other
previous genetic assignment tests have been able to identify indi-
viduals as being Asian, African savanna, or African forest
elephants, with 100% success [7,26]. The success of these assign-
ment methods was seen as supporting the division of African
elephants into forest and savanna elephant species, since members
of one species were never incorrectly assigned to the other species
[7,26]. The assignment tests reflect the nearly complete lack of
gene flow between forest and savanna elephants that has also been
inferred using other nuclear loci [4,6]. Since lack of gene flow
between populations would be an indication that speciation has
occurred, we re-examined this previously published data [26],
comparing assignment success between West and Central African
elephant locations to determine whether this would provide
support for the hypothesis that they comprise distinct species.
Figure 6 shows a map with all locations used in the prior
assignment study [26], including many locales outside of those
shown in Figure 1, and including a substantial number of sites in
both West and Central Africa. As an indirect measure of genetic
similarity, we plotted the misassignment of elephants between one
location and another, which is an indication of genetic similarity
between elephants at two locales. Lines connecting the locales
indicate cases where at least one elephant of known provenance
was assigned to the wrong locale. What is striking is that among
the hundreds of elephants assigned to a location using nuclear
genotypes [7,26], not a single savanna elephant has been assigned
to a forest location [26], even in cases where forest and savanna
locales were geographically much closer between than within
species. However there were many mis-assignments between two
savanna or between two central forest locales (Figure 6). Given
the complete success in assignment of elephants as either savanna
(orange) or forest (green) elephants, the substantial degree of
Figure 5. Partitioning of forest and savanna elephant nuclear genotypes and mtDNA haplotypes at each African locale. For eachlocation, the x-axis shows the proportion of mtDNA from the S clade or savanna clade of mtDNA [4]. The y-axis shows the proportion of the totalpopulation that corresponds to cluster 2 (savanna elephant nuclear genotype) of the STRUCTURE analysis. Savanna elephant locales (orange) all havea very high proportion of savanna elephant nuclear genotypes. By contrast, the proportion of savanna elephant S clade mtDNA varies from 100%down to 0% among the savanna locales, with no effect on nuclear genotypes. Remarkably, the proportion of S clade mtDNA varies greatly on a locallevel (e.g., CH-Chobe and SA-Savuti are geographically adjacent locales), calling into question attempts to infer the population structure of Africanelephants using only mtDNA. Forest elephant (green) locales show little or no nuclear genetic contribution from savanna elephants. None of theforest elephants carry a savanna elephant or S clade mtDNA [4,29], in this limited number of sampling locales (see Figure 4 for a more extensivesurvey of mtDNA data). The dashed line shows the ‘‘expected’’ relationship, if an assumption is made that the proportions of forest and savannaelephant nuclear genotypes in a population should reflect the proportion of F and S clade mtDNA haplotypes, respectively, in the population [12,16].This ‘‘expected’’ relationship forms the basis for statements that forest and savanna elephants currently have a geographically large hybrid zone withlarge numbers of hybrids present across Africa [12,16]. Our current data suggests that such inferences are not valid since mtDNA patterns do notreflect population genotypes. Locale names are abbreviated as in Figure 1; we show the only mixed habitat locale (GR-Garamba) in blue.doi:10.1371/journal.pone.0020642.g005
Reconciling African Elephant Phylogenies
PLoS ONE | www.plosone.org 8 June 2011 | Volume 6 | Issue 6 | e20642

misassignment between Congolian and Guinean block forest ele-
phants (Figure 6) suggested that nuclear genetic similarity exists
between forest elephants in the two forest blocks. The genetic
similarity implied by the misassignment of elephants between the
two forest blocks fails to provide support for the hypothesis that the
elephants of West Africa comprise a distinct species [14].
Quantifying STR loci for their utility in assigninggeographic provenance
Besides taxonomy and population structure, the other major
area in which genetics can contribute to African elephant con-
servation is in the geographic assignment of ivory samples
[20,21,22,23,24,26]. Current geographic assignment methods for
elephants and ivory that use STRs may sometimes be imprecise or
inaccurate (Figure 6) [7,24,25,26]. The mis-assignments depicted
in Figure 6, for example, show that room exists for improvement
of genetic markers to establish the provenance of elephants (and
their ivory). Furthermore, the considerable variation in allelic size
range for different STR loci used in the current study (Table S2)
suggested that some STR loci would prove more effective than
others for genetically assigning an elephant to its geographic
origin. While previous studies have shown that STR genotypes
can be used to assign ivory to its geographic region of origin
[7,24,25,26], they have not attempted to rate the effectiveness of
individual STR loci in assignment studies. We therefore adopted
methods used in admixture mapping of human disease genes, for
which genetic markers have been identified that have a high ability
to distinguish among human lineages of different geographic
origin [41,42,43,44], to determine the utility of each elephant STR
locus for geographic assignment.
In order to quantify the ability of different genetic markers to
assign the provenance of elephants, the Shannon Information
Content (SIC) [45] of each microsatellite locus was estimated. The
SIC is often preferred over other measures of informativeness
because many other measures do not consider the influence of
centrality, whereby alleles that are absent (or nearly so) in one
population will be more informative than those common in both
populations [41,42]. The SIC quantifies the informativeness of
the marker or set of markers in determining the ancestral state
(or source of origin) of the loci [41,42]. In the case of a biallelic
locus such as a microsatellite in an elephant sample of unknown
provenance, it is necessary to know the frequency of the alleles
in the parental populations from Africa, information that was
provided by our current STR data.
The ability of each of our STR loci to differentiate among
elephants from different locales is shown in Figure 7. Each locus
was tested for the ability to distinguish between forest and savanna
elephants, between southern and eastern African savanna ele-
phants, and between elephants at the two most sampled locales
within various regions. Highly informative loci for a given pair of
populations had the highest values of SIC, for example, p04 in
the Kruger-Namibia comparison (Figure 7, top). For almost all
markers (except p04), the highest information content was present
in the savanna-forest comparison, with the next most informa-
tive comparisons coming in a distant second (Figure 7, bottom).
Most maximum SIC values coincided with the 50% admixture
Figure 6. West African elephants–a distinct third species? This map, depicting the mis-assignment of elephants to the wrong locales by anSTR-based assignment method, does not lend support to the hypothesis that West African elephants are a distinct species. Assignment data is fromWasser et al. [26], but plotted geographically with forest elephant locales in green and savanna locales in orange. Arrowheads indicate the directionof misassignment (e.g., elephants in GR were assigned wrongly to TI); lines without arrowheads indicate that misassignments occurred in bothdirections. Each misassignment would be an indication of genetic similarity between elephants at the two locales. Among the hundreds of elephantsassigned using STRs [26], there is no overlap in cross-assignments between forest and savanna elephant groups, even in cases where some forest andsavanna elephant locales were geographically much closer between than within species (e.g. BE is closer to DS than to most other savanna locales);nor did misassignment ever occur between Asian and African elephants. By contrast, a very high degree of cross-assignment is evident betweenlocales in West Africa and those in Central Africa, an indication of substantial genetic similarity between elephants in the two forest blocks, which failsto provide support for the hypothesis that a distinct elephant species inhabits West Africa [14,15]. Locales are as in Figure 1, with additional locales:BI-Bia, BM-Banyang Mbo, DJ-Dja, MG-Mago, MI-Mikumi, MO-Mole, RU-Ruaha, TI-Tai, TZ-Tsavo [26].doi:10.1371/journal.pone.0020642.g006
Reconciling African Elephant Phylogenies
PLoS ONE | www.plosone.org 9 June 2011 | Volume 6 | Issue 6 | e20642

proportion overall, but some individual values deviated. For
example, the maximum SIC for p11 in the Kruger-Namibia
comparison (the gray line, second in height) occurred slightly
towards the left, thus the information content is not the same. The
maximum SIC does not always occur at the 0.5 admixture value
since a locus may be more effective at distinguishing one popu-
lation than the other. For example, if the major allele frequency is
about 50% in population one, but 100% in population two, it
would be more effective to use the given marker to identify
individuals from population one in population two than vice versa.
As has been shown in the case of human STRs [44], our results
suggested that replacement of relatively uninformative loci by
highly informative loci could produce a set of markers with an
ability much greater than that of the current set of randomly
chosen markers to establish the provenance of illegally poached
ivory. For example, when we used 4 STRs with low SIC values
(p11, p14, p15, p16) in a STRUCTURE analysis, they did not
distinguish Kruger elephants at all from Namibian elephants, as
50% of each population fell into each of the partitions at K = 2
(using only these two populations). However, using 4 STRs with
high SIC values (p12, p17, p18, p29) in a similar analysis did
begin to differentiate elephants between these two locales: using
only these two populations, at K = 2 the values for STRUCTURE
partitions 1 and 2 were 0.36 and 0.64, respectively, for Kruger
elephants; while they were 0.61 and 0.39, respectively, for Nami-
bia elephants. This quantitative approach comparing different
STRs for their SIC can thus identify an improved set of STR loci
to utilize for the purpose of assigning the geographic provenance
of elephants.
Discussion
Two species of elephant are present in AfricaOur new data and reanalyses of previous data reconciled the
mtDNA phylogeographic patterns present among African ele-
phants to the two-species division that is evident from nuclear
DNA and morphological analyses. Previous studies found a deep
and almost complete nuclear genetic separation of African ele-
phants into forest and savanna species, with a few hybrids detected
primarily in the regions where tropical forest and savanna habitats
Figure 7. Quantification of the effectiveness of individual STR loci for establishing the provenance of African elephants. Each locuswas tested for the ability to distinguish between forest and savanna elephants, between southern and eastern African savanna elephants, andbetween elephants at the two most populous locales within various regions. (Top) The Shannon Information Content (SIC) is plotted for four pairwisecomparisons between locales for STR loci (note that the y-axis scale differs among comparisons). The maximum SIC does not always occur at the 0.5admixture value since the locus may be more effective at distinguishing one population than the other. (Bottom) Most loci were better atdistinguishing forest and savanna elephants than at distinguishing between two regional locales. Some STR loci, such as p18, are consistentlyinformative for distinguishing between elephants from different locales; other loci such as p16 are consistently uninformative. This suggests that p18should be used, and p16 replaced, when selecting a set of STR loci for use in establishing the origins of poached ivory. This quantitative approachcomparing different STRs for their utility can be used to identify an improved set of STR loci that would enhance the ability to establish the origins ofconfiscated ivory [44].doi:10.1371/journal.pone.0020642.g007
Reconciling African Elephant Phylogenies
PLoS ONE | www.plosone.org 10 June 2011 | Volume 6 | Issue 6 | e20642

meet [4,6,7]. This genetic separation into forest and savanna
elephant species has now been demonstrated using slower-evolving
nuclear autosomal sequences, faster-evolving autosomal STRs,
sequences of multiple X-linked loci, and Y-chromosome sequenc-
es, and was recently supported following comparison of hundreds
of nuclear sequences across proboscideans [4,5,6,7]. The lack of
gene flow between forest and savanna populations, despite the
existence of a hybrid zone, has especially supported their status
as species under the biological species concept [46,47,48] (as
previously discussed [1]): among 1764 savanna elephant X-chro-
mosome sequences previously examined, 1762 (99.9%) had been
found to be haplotypes not present among forest elephants, while
not a single savanna elephant nuclear haplotype has ever been
reported in a tropical forest elephant population [4]. Likewise,
among Y-chromosome sequences examined in 205 male ele-
phants, there had been only one hybrid exception to the otherwise
complete separation into distinctive forest and savanna elephant
clades [4].
The Bayesian STRUCTURE analysis conducted for the
current study used a novel set of STR loci to support and extend
these conclusions. Few forest–savanna elephant hybrids were
identified by STRUCTURE, and for each species the proportion
of admixture from the other species was inferred to be under one
percent. Previous studies have convincingly reported data sup-
porting the ‘‘polyphyly of the forest and savannah [mtDNA]
haplotypes’’ [12] and ‘‘multiple refugial mitochondrial lineages’’
[16], and these observations are also in accordance with mtDNA
patterns found among the elephants used for the current study [4].
However, based on these mtDNA patterns, it had been further
hypothesized that ‘‘interbreeding has had a major impact on the
reciprocal integrity of extant forest and savannah elephants’’ [12],
and that ‘‘recurrent hybridization among them render[s] a simple
forest/savannah elephant split inapplicable to modern African
elephant populations’’ [16]. Yet these hypotheses regarding the
overall genomic affinities of African elephants were not supported
by the results of nuclear genotyping (Figures 1, 2, 5). The current
genetic assignment and factorial correspondence analyses demon-
strate nuclear genetic partitioning between forest and savanna
elephants (Figures 1, 2), with nuclear admixture between species at
under one percent, even in the face of widespread forest clade
mtDNA introgression in the same savanna elephants (Figure 5)
[4].
Should incongruent mtDNA patterns in African elephantshave been anticipated?
Our results also strongly support the observation that mtDNA
patterns in elephants are incongruent with their overall population
structure [1,4,13]. Before discussing the observed genetic patterns
in detail, it is worth considering whether the phylogeographic
patterns of mitochondrial genetic markers should have been
expected to be incongruent with those of nuclear markers, given
the social structure of elephants. Elephant females reaching
maturity remain with their natal core social group or ‘‘herd’’
[49,50]. Since females are not typically exchanged between herds
[49,50], mitochondrial gene flow between herds will be essentially
nonexistent, and only changes in the geographic ranges of the core
social groups would alter the phylogeography of mtDNA hap-
lotypes. Since the mitochondrial genome is only transmitted
maternally, there is an important consequence of the matrilineal
and matrilocal structure of core social groups among elephants:
the mitochondrial genome is necessarily coupled to the geographic
range of the core social group. By contrast, males leave the natal
herd and mediate gene flow between herds and across the African
landscape [1,49,50,51]. This is consistent with the observation that
sex differences in dispersal tend to be high among long-lived,
highly social, polygynous mammals [52,53].
Since males can transmit every locus except mtDNA, the
mitochondrial genome is subject to an extremely circumscribed
evolutionary trajectory very different from that affecting every
other genetic locus [1,54]. For example, were two herds of dif-
ferent mtDNA and nuclear genotypes to continuously inhabit
adjacent ranges for hundreds of generations, the two locales would
become indistinguishable in terms of nuclear markers (even at the
fastest-evolving nuclear markers) due to male-mediated gene flow.
Yet since females are not typically exchanged between two herds,
in principle there might be no mitochondrial gene flow between
the locales, and even between adjacent herds the mtDNA genetic
differences would persist and might even increase due to novel
mutations within each lineage. The combination of matrilocal
social structure and intense male reproductive competition greatly
increases the effective population size and coalescent of the
mtDNA genome relative to nuclear loci [54,55]. Thus mtDNA
could provide a signal of ancient population partitioning that
would not be at all reflective of the overall current population
structure [55].
By contrast, not a single nuclear locus is ‘‘bound to the herd’’
like mtDNA. Males in one generation can transmit nuclear alleles
from their natal herd to other herds. This occurs regardless of
whether or not males traverse long distances. Males of one gene-
ration may transmit nuclear alleles to a nearby herd; their male
offspring can then transmit them to even more distant herds, and
thus nuclear alleles have the potential to traverse the African
landscape. One notable point in this regard is that females do
transmit their nuclear genetic endowment to male offspring, thus
all of their nuclear alleles (autosomal or X-linked) thereby become
easily transmitted across the landscape. Among genetic markers,
only the mtDNA molecule is subject to the severe demographic
constraint of being bound to the herd. All other elephant genetic
markers are geographically unbound and subject to widespread
and (compared to mtDNA) relatively rapid transmission across the
geographic landscape [54]. Since the mtDNA would be expected
to have a phylogeographic pattern that is unique and different
from that of any other genetic loci, use of this marker in elephants
should have been expected to lead to quite faulty inferences
regarding their overall population structure or systematics [55].
Similar incongruence between mtDNA and nuclear phylogeo-
graphic patterns has been reported among a number of other
mammalian taxa and, in cases where two species hybridize,
genetic markers transmitted by the more highly dispersing sex
were found to better delimit species [56].
Reconciling the phylogeography of mtDNA and nuclearDNA in African elephants
We have quantified the relationship between the proportion of
elephants in a population that carry S clade savanna mtDNA and
the proportion of the population assigned to forest- or savanna-
elephant nuclear genetic partitions (Figure 5). Surprisingly, the
presence of S clade mtDNA among even a few elephants, even at
low frequencies, or even in a nearby location (Figures 4 and 5), was
sufficient to confer overwhelmingly savanna elephant nuclear
genotypes to the elephants (Figure 5). By establishing the identity
or similarity of mtDNA designations that differed across studies
(Figure 3 and Figure S2), we could also analyze the geographic
distribution of F clade and S clade mtDNA for hundreds of
previously sequenced haplotypes in 81 locations across the ranges
of forest and savanna elephants. This revealed that S clade
mtDNA was only carried by elephants across the traditionally
accepted range of the savanna elephant. S clade mtDNA was
Reconciling African Elephant Phylogenies
PLoS ONE | www.plosone.org 11 June 2011 | Volume 6 | Issue 6 | e20642

completely absent among elephants across the traditional range
of the forest elephant. Previous discrepancies between mtDNA
patterns and those of nuclear loci or morphology could thus begin
to be resolved by considering the distribution of mtDNA haplo-
groups in populations rather than individuals [12]. The pattern we
found lends support to a hypothesis that the source of nuclear
alleles present in savanna but not forest elephants was the
population in which the mtDNA S clade evolved [1,4,5,25].
The integrity of two species was maintained despite ahistorically shifting hybrid zone
Some previous studies have made the (often unstated)
assumption that the presence of both F (forest elephant-derived)
and S (savanna elephant-derived) mitochondrial DNA clades at a
locale is an indication that the population of elephants at that
locale must comprise a mixture of forest and savanna elephant
genotypes [12,16]. By contrast, we find that the mtDNA is an
incongruent locus, not representative of the overall genetic
makeup of the populations (Figure 5). In savanna locales where
F clade mtDNA haplotypes are carried by a majority of the
elephants the savanna elephant populations nonetheless have little
or no discernible forest elephant contribution to nuclear genotypes
(Figure 5). Other than carrying F clade mtDNA, these elephants
proved not to be hybrids (Figures 1, 2) [57], with most savanna
individuals carrying F clade mtDNA nonetheless displaying ca.
100% assignment of their genotypes into the savanna elephant
partition in STRUCTURE analyses (Figures 2, 5). Even in
Garamba, which demonstrates the greatest degree of hybridization
among our sampled locales, the majority of individuals partitioned
completely as forest elephants (Figure 2). This might be consistent
with hybridization being a response to recent destruction of forests
in Garamba [34], which may have permitted migration of savanna
elephants into previously forested habitat and recent nuclear intro-
gression [58]. Even in Garamba, a panmictic blend of forest and
savanna elephants, in which all individuals would display a mix of
forest and savanna genotypes, is not evident (Figure 2). One
previous hypothesis, based on interpretations of mtDNA patterns,
that ‘‘the hybrid zone between africana and cyclotis is not fairly
‘narrow’,’’ [12] is not supported by the current data, especially
given the overlap of sampling locations (Cameroon, Zimbabwe)
between the current and previous studies.
Isolation from savanna elephant gene flow appears to be
complete among forest elephants, since in the current survey not
a single forest elephant was found to carry S clade mtDNA across
30 forest locales in West or Central Africa. Previous studies had
failed to detect, among a smaller survey of forest elephants, even a
single Y-chromosome or X-chromosome haplotype derived from
savanna elephants [4]. Although F clade mtDNA has crossed the
species barrier and is often present in savanna elephants (Figures 3,
4, 5), the reverse pattern has not occurred to any detectable degree
in our numerically large and geographically extensive current
reanalysis of previously sequenced [4,12,13,15,16,36,37] forest
elephants. Given the presence of hybrid individuals where the two
types of elephant currently meet, and given the extensive historic
hybrid zone suggested by the geographic expanse of F clade
mtDNA [1,4,12], the complete absence of any detectable savanna
elephant nuclear or mtDNA haplotype introgression into elephant
populations in the tropical forests strongly suggests that isolating
mechanisms between species [1,25,46] have prevented savanna
or hybrid elephants from successfully contributing to the forest
elephant gene pool.
The situation is more complicated among savanna elephants.
Forest elephant derived F clade mtDNA has a very broad
geographic range that extends long distances away from current
forest habitats. F clade mtDNA is carried by ca. 20% of savanna
elephants [4,12,13], as far north as Mali, east into Tanzania, and
is carried by a majority of elephants in some locations as far south
as Botswana and Zimbabwe [4,12,13,15,16]. Given the lack of any
nuclear genetic evidence for hybridization in these regions
(Figure 5), the presence of F clade mtDNA in these locales is
likely an indication that the hybrid zone separating forest and
savanna elephants has shifted [58] as climate and the distribution
of forest habitats shifted during the geological history of Africa
[4,59,60,61,62]. While at any point in time the hybrid zone may
have remained narrow even as habitats shifted, nonetheless the
very large geographic distribution of F clade [1,4,12] suggests that
the hybrid zone shifted across a vast expanse of the African
continent, suggesting that many generations of hybridization
generated the current mtDNA pattern. Nonetheless, the genetic
integrity of forest and savanna elephants has remained intact
(Figure 5). This would also be consistent with the presence of
species isolation mechanisms restricting nuclear gene flow between
forest and savanna elephants [1,25,46]. Maintenance of genetic
integrity and isolation in amidst such a hybrid zone would define
species even under the biological species concept [46,47,48], as has
been noted previously [1].
The historical reproductive success of female hybrids can
be inferred by the presence of F clade mtDNA, derived from forest
elephants, in these savanna elephant herds (Figures 3, 5)
[1,4,12,13,25,33]; while the failure of male hybrids to reproduce
was inferred from the complete or nearly complete lack of forest
elephant contribution to the nuclear genetic makeup of the
savanna populations carrying forest-derived mtDNA (Figure 5)
[1,4,13,33]. The mito-nuclear pattern observed in savanna
elephants can only result if male forest-savanna elephant hybrids
are (relatively) reproductively unsuccessful while hybrid females
repeatedly backcross to savanna males [1,4,25]. These inferences
would be consistent with Haldane’s rule [63] sensu lato, a com-
monly observed phenomenon detected following hybridization
between distant taxa, in which the deleterious effects of hybri-
dization tend to have greater impact on the heterogametic sex
(i.e. males in the case of mammals), since the mito-nuclear patterns
suggest that hybrid females have been reproductively successful
but hybrid males have not [4,46,63]. The inferred backcrossing of
hybrid females to non-hybrid savanna males would over gene-
rations dilute out forest elephant typical nuclear alleles in the
savanna population, hence removing the relationship between the
apparent population structure revealed by examination of mtDNA
patterns, and the true population structure that remains after a
population is stripped of the presence of forest elephant-derived
nuclear alleles [1,4,13]. The mtDNA patterns would be rendered
misleading for inferring the overall population structure or taxo-
nomic status of Africa’s elephants (Figures 1, 2, 5) [4,56,57].
The taxonomic status of West Africa’s elephantsAlthough cautious in their interpretation [15], Eggert and
colleagues have proposed the hypotheses that the elephants ‘‘of
West Africa belong to a newly recognized and yet to be formally
named species’’ [14], and that ‘‘West African populations are now
genetically distinct from other forest and savanna elephants and
have been on a different trajectory for more than 2 Myr’’ [15],
based in part on the phylogeography of mtDNA control region
haplotypes. Debruyne (2005) [36] has questioned this hypothesis,
after finding West African elephants interspersed with Central
African elephants on a phylogenetic reconstruction based on their
mtDNA. It may also be relevant that markers that are 100%
effective at assigning African savanna, Asian, and African forest
elephant species, are nonetheless found to mis-assign many
Reconciling African Elephant Phylogenies
PLoS ONE | www.plosone.org 12 June 2011 | Volume 6 | Issue 6 | e20642

elephants between West and Central African locales (Figure 6).
This suggested that genetic similarities were present between West
African and Central African forest elephants, and fails to lend
support to the hypothesis that West African elephants comprise a
distinct species.
Eggert et al. (2002) [15] also had hypothesized that in West
Africa the elephants ‘‘do not divide into separate forest and
savanna forms’’, while Johnson et al. (2007) [16] state that in West
Africa ‘‘savannah elephants are indistinguishable at both the
mitochondrial and morphological level from their forest counter-
parts.’’ These hypotheses are difficult to reconcile with the
conclusion drawn by Groves (2000) based on morphometric mea-
surements on elephant skulls from across Africa, that some West
African elephants were ‘‘firmly confirmed as L. cyclotis’’ in discri-
minant analyses [64]. Photographic evidence has also suggested
that both forest and savanna elephants can be distinguished in
West Africa [64,65]. Among the highly disrupted habitats of West
Africa [17,66,67] forest elephants currently range into some
regions outside the tropical forest [64,65]. However, historical
surveys have concluded that most elephants in West Africa were
eradicated by the first decades of the twentieth century, due to the
ivory trade [66,67,68]. The impact was greater on savanna than
on forest populations [66,67]; thus one cannot readily assume that
current geographic distributions of the elephant species in West
Africa reflect their historic patterns.
Eggert et al. (2002) [15] had inferred nuclear relationships
among their elephants using four STR loci, with the highest
bootstrap values on nuclear phylograms supporting a clade that
grouped the West African elephants of Mali with those of nearby
savanna populations in Waza and Benoue in Cameroon. It may
not be possible to draw strong inferences from just four STR loci
(especially as the placement of some populations such as Addo had
likely been affected by inbreeding). Nonetheless, three of four STR
loci genotyped by Eggert et al. (2002) [15] show similar allele sizes
between Mali and either Waza or Benoue (or both). The fourth
locus was not similar in allele sizes between Mali and the Came-
roon locales; however for locus LA5, the frequency of allele 191
was 1.00 in Mali and 0.46 in Waza, but 0.00 in all other savanna
or forest locales sampled by Eggert et al. (2002) [15]; for locus LA6,
the three highest frequencies for allele 172 were found in Mali
(1.00), Waza (0.50), and Benoue (0.27); and for locus LafMS02, the
three highest frequencies for allele 150 were also in Mali (1.00),
Waza (0.50), and Benoue (0.27). Since Waza and Benoue
elephants have been shown by all nuclear DNA analyses including
the current ones to partition as savanna elephants (Figures 1, 2, 5,
6), this suggests that the West African elephants in Mali may be
genetically similar to other savanna elephants, a suggestion sup-
ported by the presence of S clade mtDNA in Mali (Figure 4,
arrow). Thus, in the published STR dataset [15] it is difficult to
find strong evidence for the hypothesis that Mali elephants may
belong to a different species than Cameroon savanna elephants.
‘‘Mitochondrial essentialism’’ and the conservation ofAfrica’s elephants
Given that mtDNA haplotypes among elephants are an
unreliable indicator of overall genetic similarity (Figure 5) [4], it
is unfortunate that mtDNA alone continues to be used as a guide
to elephant genealogical affinities. This ‘‘mitochondrial essential-
ism,’’ the continuing use of mtDNA to partition populations and
species, among elephants where morphological and nuclear
markers have established that mtDNA patterns may be inaccurate
or misleading, might lead to adverse results for elephant con-
servation, as the following examples illustrate: If mtDNA data
were used as the sole basis for elephant taxonomy and population
structure, elephants in the Guinean forest block could be recom-
mended for translocation to the deserts of Mali, on the grounds
that their mtDNA similarity implies that they must be genetically
similar. Likewise, relying on mtDNA to infer population structure
would mean that savanna elephants from Tanzania could be
moved west into the Congolian tropical forest, since forest and
savanna elephants in these regions share similar F clade mtDNAs.
Either of these translocations would be inappropriate, since even
while carrying mtDNA from the same haplogroup, individuals
in forest and savanna locations are very different in nuclear
genotypes (Figure 5), belong to different species [4], and are thus
unlikely to thrive when moved to the wrong habitats. Although
the examples are extreme, it may be equally troublesome that
mtDNA-based misinterpretations of African elephant taxonomy
constitute an unacknowledged potential hindrance to their proper
conservation by convincing conservation groups to ‘‘continue to
treat African elephants as a single species’’ [17].
Improving the utility of nuclear genetic markers forfighting the ivory trade
Along with the destruction of habitats, one of the major threats
to elephant populations is illegal hunting for the ivory trade. DNA
has been successfully extracted from ivory [22,23], while previous
studies have shown that STR genotypes can be used to assign ivory
to its geographic region of origin [20,21,24,26]. However, previous
studies have not attempted to rate each STR locus for its utility
in assignment. In an attempt to further improve STR-based
assignment methods, our STR loci were subjected to a novel
analysis to assess their Shannon Information Content (SIC) using
pairwise population comparisons to quantify their ability to
distinguish elephants living in one geographic region or location
from those living in a second region or location, which would
gauge their utility for ivory forensics. For each comparison, some
loci had a much higher SIC than others (Figure 7), suggesting that
some STR loci would be much better than others for establishing
the provenance of ivory. Our method permits the quantification of
previously developed and current STR loci, and should permit
the assessment of novel markers before they are brought into
widespread use. Those loci that demonstrate an enhanced ability
to distinguish among geographic locales can be chosen for
inclusion in STR panels for ivory forensics. Our analysis makes
it possible to develop a panel of STR markers, each component of
which has a much a higher SIC than the current (randomly
chosen) markers, and thus more effective for inferring the pro-
venance of illegally poached ivory. Increased accuracy of assign-
ment would enhance the ability of conservation, anti-corruption
and law-enforcement efforts to identify elephant populations being
targeted by poachers. Thus enhanced STR panels have the
potential of aiding the conservation of Africa’s two species of
elephant.
Materials and Methods
SamplesThe study was conducted in compliance with the University of
Illinois Institutional Animal Care and Use Committed (IACUC)
approved protocol number 09036. Samples were obtained in
full compliance with required CITES (Convention on Interna-
tional Trade in Endangered Species of Wild Fauna and Flora)
and other permits. As previously described, samples were collected
from wild African elephants (Loxodonta) primarily by biopsy darting
[11,27,69] of individuals from distinct herds. Blood samples were
collected from Asian elephants and from Coco, a male forest
elephant (Loxodonta cyclotis) from Sierra Leone, which had been
Reconciling African Elephant Phylogenies
PLoS ONE | www.plosone.org 13 June 2011 | Volume 6 | Issue 6 | e20642
kept at the Paris Zoo (Parc Zoologique de Paris-Vincennes,
France). DNA was extracted primarily using kits (Qiagen), or
standard phenol-chloroform methods [70]; samples of dung were
extracted with DNA using a QIAmp DNA Stool Mini Kit
(Qiagen).
Microsatellite lociFifteen microsatellite loci were amplified (Supplementary Table
S1). Five loci were from published sources [71,72]; six loci were
tetra-nucleotide microsatellites isolated from a savanna elephant
using a capture hybridization method as previously described [73],
with their sequences deposited in GenBank (accession numbers
JF692777–JF692782); four loci with STRs were identified in
savanna elephant DNA sequences mined from the NIH Com-
parative Vertebrate Sequencing Project (http://www.nisc.nih.
gov/open_page.cgi?path = /projects/comp_seq.html). Microsatel-
lites were identified using a repeat finder script written in Perl.
PCR primers for novel STR loci were designed using Primer3
(http://fokker.wi.mit.edu/primer3/input.htm). PCR primers were
tagged for fluorescence detection [74]. PCR amplification used a
touchdown protocol as previously described [75]. Samples were
genotyped on an ABI 3100 Genetic Analyzer and analyzed with
Genescan 3.7 and Genotyper 2.5 programs (Applied Biosystems).
Microsatellite data was binned in Allelogram [76] (http://code.
google.com/p/allelogram).
A total of 15 loci were amplified in 555 African and 9 Asian
elephants. The data was analyzed for deviation from Hardy–
Weinberg equilibrium or excess of null alleles using Cervus 3.0 [77]
(http://www.fieldgenetics.com/pages/aboutCervus_Overview.
jsp). Two of the novel loci developed for this study from a
capture hybridization library (LAF4 and LAF6, also designat-
ed p04 and p06) were excluded from some analyses because
they exhibited an excess of homozygosity due to null alleles.
Loci were examined for linkage using GENEPOP [78]
(http://genepop.curtin.edu.au). Loci LAF30 and LAF35 (also
designated p30 and p35, respectively) were excluded because
of potential linkage to the more diverse loci LAF29 (p29) and
LAF37 (p37), respectively.
Microsatellite analysesWe used the program STRUCTURE 2.3.1 to apply a model-
based clustering algorithm to identify subgroups of individual
elephants that have distinctive allele frequencies [30,79]. Each
combination of species or locales was run 5 times using values of K
between 1 and 21 genetic clusters, without any prior population
information. Each analysis was run for at least 1 million Markov
chain Monte Carlo generations following a burn-in of at least
100,000 steps. STRUCTURE was run using four models [30]
combining assumptions on the genetic ancestry of individuals
(i.e. the genome of a given individual is allowed –or not– to
originate from more than one genetic cluster) and the genetic
relatedness among populations (i.e. in the case of recent
population subdivision allele frequencies in different populations
are correlated): admixture–correlated, admixture–independent,
no admixture–correlated, and no admixture–independent; with
an inferred Dirichlet a parameter for population admixture (low avalues suggest that most individuals do not have an admixed
genome, while a.1 indicates that most individuals are of admixed
genetic ancestry). Results were similar in each case. We estimated
the uppermost hierarchical level of clusters using the ad hoc statistic
DK based on the rate of change in the log probability of the data
between successive values of K [31]. A multivariate representation
of the analyzed individuals was carried out by subjecting data from
11 STR loci to Factorial Correspondence Analysis (FCA) in
GENETIX 4.02 [35]. Genetic relationships among sampling
locales were estimated using the chord distance [80] calculated in
GenoDive [81], and visualized on a neighbor-joining tree [82]
calculated in PAUP* 4b10 [83].
Mitochondrial DNA sequencing and analysesPCR amplifications using DNA from Bili Forest (BF) elephants
were performed using 0.4 uM final concentration of each primer,
1.5 mM MgCl2, 200 uM of each dNTP (Applied Biosystems Inc.
[ABI]) and 1 ug/ul final concentration of bovine serum albumin
(BSA; New England BioLabs Inc.) with 0.04 units/ul final
concentration of AmpliTaq Gold DNA Polymerase (ABI). PCR
consisted of an initial denaturation at 95uC for 9:45 min; cycles
of denaturation for 20 sec at 94uC, annealing for 30 sec at 60u(initial 3 cycles), 58uC, 56uC, 54uC, 52uC (5 additional cycles each
temperature), or 50uC (last 22 cycles), and 1 min extension at 72uC;
with a final extension of 7 min at 72uC. PCR amplicons were
examined on a 1% agarose gel and were enzyme-purified and
sequenced using the BigDye Terminator v3.1 Cycle Sequencing
Kit (ABI). Eight BF samples were successfully amplified and
sequenced with amplicon sizes of 726 bp (681 bp excluding primers)
or 375 bp (322 bp excluding primers), using the following primers:
for the 726 bp amplicon, PCR primers were CBCR-F5 AT-
TACAATGGTCTTGTAAGCCATAAA and CBCR-R1d CTC-
AGACGGCCATAGCTGA; sequencing used the PCR primers
and CBCR-F6 GATAAACCATAGTCTTACATAGCACAT and
CBCR-R5 CTTTAATGTGCTATGTAAGACTATGG. For the
375 bp amplicon, PCR and sequencing primers consisted of CBCR-
F5 and -R5. Novel mtDNA sequences have been deposited in
Genbank (accession numbers: JF827273–JF827275). NCBI Blast
(http://www.ncbi.nlm.nih.gov/blast/Blast.cgi) and comparison to
previously sequenced elephant mtDNA were used to identify all BF
elephant mtDNA sequences as F clade (Supplementary Figure S2).
Fisher’s exact test (two-tailed; http://www.graphpad.com/quick-
calcs/contingency1.cfm) was used to analyze a 262 contingency
table for association between the presence or absence of S clade
mtDNA and the type of habitat at a locale (tropical forest vs. non-
tropical forest or mixed).
Shannon Information ContentShannon Information Content (SIC) measures the amount of
information contained in a message [43]. The greater the
information in a message, the less random noise it contains, so
the information can be referred to as a reduction in uncertainty
[45]. Information thus becomes a measure of the improbability of
an event. Specifically, Shannon defined information in terms of
the base-2 logarithm of the reduction in uncertainty [45]. In terms
of genetic markers, a very improbable allele in a locus is therefore
assigned very high information content, since the information is
comprised of the uncertainty that is eliminated by the appea-
rance of the allele. The SIC considers the influence of centrality,
whereby alleles that are absent (or nearly so) in one population are
more informative than those common in both populations.
SIC has been successfully adapted to genetic studies, particu-
larly for identifying genetic markers with frequencies highly
specific for human populations of different geographic origins;
which are used in admixture mapping of the human genome [42],
a proven approach for mapping genetic variants that are involved
in human disease [84]. In order to quantify the ability of different
genetic markers to distinguish between elephants from different
species and different regions or locales, we applied a routine
described in Smith and O’Brien (2005) [42] to determine the
Shannon Information Content. This was implemented in the
statistical package SAS 9.1 (SAS Inc., Cary, NC), while Microsoft
Reconciling African Elephant Phylogenies
PLoS ONE | www.plosone.org 14 June 2011 | Volume 6 | Issue 6 | e20642

Excel was used to generate figures for comparisons among all
markers: Supplementary Table S4 includes the contingency table,
formulas and description of the routine.
Supporting Information
Figure S1 The groups identified by Johnson et al. (2007) [16]
based on African elephant mtDNA CYTB sequences largely
overlap the mtDNA diversity reported by Debruyne (2005) [12].
Panel descriptions are shown in the figure.
(PDF)
Figure S2 Comparison of mtDNA sequences across studies of
African elephant genetics: (A) Diagram illustrating mtDNA regions
sequenced by different researchers, showing overlapping and
non-overlapping regions across studies. Positions follow those of
the elephant reference mtDNA genome (Genbank accession
number NC_000934) [85]. (B) Corresponding clade designations
for representative elephant sequences across studies. Relevant
sequences that proved identical or matched closely across studies
are indicated. The ND4-tRNAGLU sequences of Lei et al. (2008)
[13] were used in a Blast query to retrieve the overlapping ND5
sequences Roca et al. (2005) [4]. The CYTB sequences of the same
individual elephant (same ‘‘sample ID’’) of Lei et al. (2008) [13]
was also used to retrieve matching CYTB and control region (CR)
sequences of Debruyne (2005) [12] and CYTB sequences of
Johnson et al. (2007) [16]. Through a Blast query using the
retrieved Debruyne (2005) [12] sequence, matching mtDNA
hypervariable region (HVR) sequences of Johnson et al. (2007)
[16] were also obtained. Using this system, designations for the
equivalent clades across studies were identified.
(PDF)
Figure S3 Map and list of locations of elephants sampled and
sequenced for mtDNA across genetic studies [4,12,13,15,16,36,37].
(PDF)
Table S1 Fifteen elephant short tandem repeat loci amplified
[71,72].
(PDF)
Table S2 Allele range, number and frequency for 11 STR loci.
(PDF)
Table S3 Calculation of the ad hoc Evanno et al. (2005) [31]
method for examining the true number of population subdivisions.
(PDF)
Table S4 Contingency table, formulas and other information for
the Shannon Information Content.
(PDF)
Acknowledgments
We dedicate this paper to the memory of Jeheskel ‘‘Hezy’’ Shoshani. We
thank J. Koonz, M. Malasky and Russ Hanson for technical or other
assistance. For elephant samples, we thank A. Turkalo, J. M. Fay, R.
Weladji, W. Karesh, M. Lindeque, W. Versvelt, K. Hillman Smith, F.
Smith, M. Tchamba, S. Gartlan, P. Aarhaug, A. M. Austmyr, Bakari,
Jibrila, J. Pelleteret, L. White, M. Habibou, M. W. Beskreo, D. Pierre, C.
Tutin, M. Fernandez, R. Barnes, B. Powell, G. Doungoube, M. Storey, M.
Phillips, B. Mwasaga, A. Mackanga-Missandzou, K. Amman, K. Com-
stock, M. Keele, D. Olson, B. York and A. Baker at the Burnet Park Zoo,
M. Bush at the National Zoological Park, and A. Lecu at Zoo de Vincennes
(Paris Zoo). We thank the governments of Botswana, Cameroon, the
Central African Republic, Congo (Brazzaville), Congo (Kinshasa), Gabon,
Kenya, Namibia, South Africa, Tanzania, and Zimbabwe for permission to
collect samples.
Author Contributions
Conceived and designed the experiments: ALR. Performed the experi-
ments: VAD YI. Analyzed the data: YI TKO VAD KZ S-OK.
Contributed reagents/materials/analysis tools: NJG TKO YI ALR
RMS. Wrote the paper: ALR NJG YI TKO S-OK VAD.
References
1. Roca AL, Georgiadis N, O’Brien SJ (2007) Cyto-nuclear genomic dissociation
and the African elephant species question. Quaternary International 169–170:4–16.
2. Grubb P, Groves CP, Dudley JP, Shoshani J (2000) Living African elephants
belong to two species: Loxodonta africana (Blumenbach, 1797) and Loxodonta cyclotis
(Matschie, 1900). Elephant 2: 1–4.
3. Groves CP, Grubb P (2000) Do Loxodonta cyclotis and L. africana interbreed?Elephant 2: 4–7.
4. Roca AL, Georgiadis N, O’Brien SJ (2005) Cytonuclear genomic dissociation in
African elephant species. Nat Genet 37: 96–100.
5. Rohland N, Reich D, Mallick S, Meyer M, Green RE, et al. (2010) Genomic
DNA sequences from mastodon and woolly mammoth reveal deep speciation offorest and savanna elephants. PLoS Biol 8: e1000564.
6. Roca AL, Georgiadis N, Pecon-Slattery J, O’Brien SJ (2001) Genetic evidence
for two species of elephant in Africa. Science 293: 1473–1477.
7. Comstock KE, Georgiadis N, Pecon-Slattery J, Roca AL, Ostrander EA, et al.
(2002) Patterns of molecular genetic variation among African elephantpopulations. Mol Ecol 11: 2489–2498.
8. Rohland N, Malaspinas AS, Pollack JL, Slatkin M, Matheus P, et al. (2007)
Proboscidean mitogenomics: chronology and mode of elephant evolution usingmastodon as outgroup. PLoS Biol 5: e207.
9. Roca AL (2008) The mastodon mitochondrial genome: a mammoth accom-plishment. Trends Genet 24: 49–52.
10. Backhaus D (1958) Zur Variabilitat der ausseren systematischen Merkmale des
afrikanischen Elefanten (Loxodonta Cuvier, 1825). Saugetierk Mitt 6: 166–173.
11. Georgiadis N, Bischof L, Templeton A, Patton J, Karesh W, et al. (1994)
Structure and history of African elephant populations: I. Eastern and southernAfrica. J Heredity 85: 100–104.
12. Debruyne R (2005) A case study of apparent conflict between molecularphylogenies: the interrelationships of African elephants. Cladistics 21: 31–50.
13. Lei R, Brenneman RA, Louis EE (2008) Genetic diversity in the North
American captive African elephant collection. Journal of Zoology 275: 252–267.
14. Eggert LS, Eggert JA, Woodruff DS (2003) Estimating population sizes for
elusive animals: the forest elephants of Kakum National Park, Ghana. Mol Ecol12: 1389–1402.
15. Eggert LS, Rasner CA, Woodruff DS (2002) The evolution and phylogeography
of the African elephant inferred from mitochondrial DNA sequence and nuclearmicrosatellite markers. Proc R Soc Lond B Biol Sci 269: 1993–2006.
16. Johnson MB, Clifford SL, Goossens B, Nyakaana S, Curran B, et al. (2007)
Complex phylogeographic history of central African forest elephants and its
implications for taxonomy. BMC Evol Biol 7: 244.
17. Blanc JJ, Barnes RFW, Craig CG, Dublin HT, Thouless CR, et al. (2007)African Elephant Status Report 2007. Gland, Switzerland: IUCN.
18. Kuntner M, May-Collado LJ, Agnarsson I (2011) Phylogeny and conservation prio-
rities of afrotherian mammals (Afrotheria, Mammalia). Zoologica Scripta 40: 1–15.
19. Species Survival Network (2006) Ivory Update. Geneva: Species Survival
Network.
20. Wasser SK, Clark B, Laurie C (2009) The ivory trail. Sci Am 301: 68–74, 76.
21. Wasser SK, Joseph Clark W, Drori O, Stephen Kisamo E, Mailand C, et al.(2008) Combating the illegal trade in African elephant ivory with DNA forensics.
Conserv Biol 22: 1065–1071.
22. Comstock KE, Ostrander EA, Wasser SK (2003) Amplifying nuclear and
mitochondrial DNA from African elephant ivory: a tool for monitoring the ivorytrade. Conservation Biology 17: 1840–1843.
23. Mailand C, Wasser SK (2007) Isolation of DNA from small amounts of elephant
ivory. Nat Protoc 2: 2228–2232.
24. Wasser SK, Mailand C, Booth R, Mutayoba B, Kisamo E, et al. (2007) Using
DNA to track the origin of the largest ivory seizure since the 1989 trade ban.Proc Natl Acad Sci U S A 104: 4228–4233.
25. Roca AL, O’Brien SJ (2005) Genomic inferences from Afrotheria and theevolution of elephants. Curr Opin Genet Dev 15: 652–659.
26. Wasser SK, Shedlock AM, Comstock K, Ostrander EA, Mutayoba B, et al.
(2004) Assigning African elephant DNA to geographic region of origin:applications to the ivory trade. Proc Natl Acad Sci U S A 101: 14847–14852.
27. Karesh W, Smith F, Frazier-Taylor H (1989) A remote method for obtainingskin biopsy samples. Conservation Biology 1: 261–262.
28. White F (1983) The Vegetation of Africa. Paris: UNESCO. 356 p .
29. Barriel V, Thuet E, Tassy P (1999) Molecular phylogeny of Elephantidae.
Extreme divergence of the extant forest African elephant. C R Acad Sci III 322:
447–454.
Reconciling African Elephant Phylogenies
PLoS ONE | www.plosone.org 15 June 2011 | Volume 6 | Issue 6 | e20642

30. Pritchard JK, Stephens M, Donnelly P (2000) Inference of population structure
using multilocus genotype data. Genetics 155: 945–959.31. Evanno G, Regnaut S, Goudet J (2005) Detecting the number of clusters of
individuals using the software STRUCTURE: a simulation study. Mol Ecol 14:
2611–2620.32. Capelli C, MacPhee RD, Roca AL, Brisighelli F, Georgiadis N, et al. (2006) A
nuclear DNA phylogeny of the woolly mammoth (Mammuthus primigenius). MolPhylogenet Evol 40: 620–627.
33. Lei R, Brenneman RA, Schmitt DL, Louis EE, Jr. (2009) Detection of
cytonuclear genomic dissociation in the North American captive Africanelephant collection. J Hered 100: 675–680.
34. De Saeger H (1954) Exploration du Parc National de la Garamba. I.Introduction. Brussels: Institut des parcs nationaux du Congo Belge.
35. Belkhir K, Borsa P, Chikhi L, Raufaste N, Bonhomme F (2004) Genetix 4.05.Montpellier: Laboratoire Genome, Populations, Interactions, CNRS UMR
5000, Universite de Montpellier II.
36. Debruyne R, Van Holt A, Barriel V, Tassy P (2003) Status of the so-calledAfrican pygmy elephant (Loxodonta pumilio [NOACK 1906]): phylogeny of
cytochrome b and mitochondrial control region sequences. C R Biol 326: 687–697.37. Nyakaana S, Arctander P, Siegismund HR (2002) Population structure of the
African savannah elephant inferred from mitochondrial control region
sequences and nuclear microsatellite loci. Heredity 89: 90–98.38. Frade F (1934) Sur l’existence en Afrique de deux especes d’elephants. Bull Soc
Portug Sci Nat 11: 135.39. Matschie P (1900) Uber geographische Abarten des afrikanischen elefanten.
Sitzber Ges Naturforsch Fr Berlin 8: 189–197.40. Salzmann U, Hoelzmann P (2005) The Dahomey Gap: an abrupt climatically
induced rain forest fragmentation in West Africa during the late Holocene.
Holocene 15: 190–199.41. Shriver MD, Smith MW, Jin L, Marcini A, Akey JM, et al. (1997) Ethnic-
affiliation estimation by use of population-specific DNA markers. Am J HumGenet 60: 957–964.
42. Smith MW, O’Brien SJ (2005) Mapping by admixture linkage disequilibrium:
advances, limitations and guidelines. Nat Rev Genet 6: 623–632.43. Kopp JB, Smith MW, Nelson GW, Johnson RC, Freedman BI, et al. (2008)
MYH9 is a major-effect risk gene for focal segmental glomerulosclerosis. NatGenet 40: 1175–1184.
44. Rosenberg NA, Li LM, Ward R, Pritchard JK (2003) Informativeness of geneticmarkers for inference of ancestry. Am J Hum Genet 73: 1402–1422.
45. Shannon CE, Weaver W (1949) The Mathematical Theory of Communication.
Urbana: University of Illinois Press.46. Coyne JA, Orr HA (2004) Speciation. SunderlandMA: Sinauer Associates.
47. Mayr E (1969) Principles of Systematic Zoology. New York: McGraw-Hill.428 p.
48. Wu C-I (2001) The genic view of the process of speciation. J Evol Biol 14:
851–865.49. Archie EA, Hollister-Smith JA, Poole JH, Lee PC, Moss CJ, et al. (2007)
Behavioural inbreeding avoidance in wild African elephants. Molecular Ecology16: 4138–4148.
50. Hollister-Smith JA, Poole JH, Archie EA, Vance EA, Georgiadis NJ, et al. (2007)Age, musth and paternity success in wild male African elephants, Loxodonta
africana. Animal Behaviour 74: 287–296.
51. Sukumar R (2003) The Living Elephants: Evolutionary Ecology, Behavior, andConservation. Oxford: Oxford University Press.
52. Handley LJL, Perrin N (2007) Advances in our understanding of mammaliansex-biased dispersal. Molecular Ecology 16: 1559–1578.
53. Pusey AE (1987) Sex-biased dispersal and inbreeding avoidance in birds and
mammals. Trends in Ecology & Evolution 2: 295–299.54. Hedrick PW (2007) Sex: differences in mutation, recombination, selection, gene
flow, and genetic drift. Evolution 61: 2750–2771.55. Hoelzer GA (1997) Inferring phylogenies from mtDNA variation: Mitochon-
drial-gene trees versus nuclear-gene trees revisited. Evolution 51: 622–626.
56. Petit RJ, Excoffier L (2009) Gene flow and species delimitation. Trends EcolEvol 24: 386–393.
57. Good JM, Hird S, Reid N, Demboski JR, Steppan SJ, et al. (2008) Ancienthybridization and mitochondrial capture between two species of chipmunks.
Mol Ecol 17: 1313–1327.58. Buggs RJA (2007) Empirical study of hybrid zone movement. Heredity 99:
301–312.
59. Barker PA, Street-Perrott FA, Leng MJ, Greenwood PB, Swain DL, et al. (2001)A 14,000-year oxygen isotope record from diatom silica in two alpine lakes on
Mt. Kenya. Science 292: 2307–2310.
60. deMenocal P, Ortiz J, Guilderson T, Sarnthein M (2000) Coherent high- and
low-latitude climate variability during the Holocene warm period. Science 288:2198–2202.
61. Stokes S, Thomas DSG, Washington R (1997) Multiple episodes of aridity in
southern Africa since the last interglacial period. Nature 388: 154–158.
62. Thompson LG, Mosley-Thompson E, Davis ME, Henderson KA, Brecher HH,
et al. (2002) Kilimanjaro ice core records: evidence of Holocene climate change
in tropical Africa. Science 298: 589–593.
63. Haldane JBS (1922) Sex ratio and unisexual sterility in hybrid animals. J Genetics12: 101–109.
64. Groves CP (2000) What are the elephants of West Africa? Elephant 2: 7–8.
65. Pfeffer P (1989) Vie et mort d’un geant: l’elephant d’Afrique. Paris: collection‘‘L’odyssee’’, Flammarion.
66. Barnes RFW (1999) Is there a future for elephants in West Africa? Mammal
Review 29: 175–199.
67. Roth HH, Douglas-Hamilton I (1991) Distribution and status of elephants inwest Africa. Mammalia 55: 489–527.
68. Douglas-Hamilton I (1987) African elephants: population trends and their
causes. Oryx 21: 11–24.
69. Roca AL, Geogiadis N, O’Brien SJ (2002) African elephant genetics: request forsamples. Pachyderm 33: 93–95.
70. Sambrook J, Fritsch EF, Maniatis T (1989) Molecular Cloning: A Laboratory
Manual. Cold Spring Harbor, N.Y.: Cold Spring Harbor Laboratory Press.
71. Fernando PJ, Vidya TNC, Melnick DJ (2001) Isolation and characterization oftri- and tetranucleotide microsatellite loci in the Asian elephant, Elephas maximus.
Molecular Ecology Notes 1: 232–233.
72. Archie EA, Moss CJ, Alberts SC (2003) Characterization of tetranucleotidemicrosatellite loci in the African Savannah Elephant (Loxodonta africana africana).
Molecular Ecology Notes 3: 244–246.
73. Sarno RJ, David VA, Franklin WL, O’Brien SJ, Johnson WE (2000)Development of microsatellite markers in the guanaco, Lama guanicoe: utility
for South American camelids. Mol Ecol 9: 1922–1924.
74. Boutin-Ganache I, Raposo M, Raymond M, Deschepper CF (2001) M13-tailedprimers improve the readability and usability of microsatellite analyses
performed with two different allele-sizing methods. Biotechniques 31: 24–26, 28.
75. Menotti-Raymond MA, David VA, Wachter LL, Butler JM, O’Brien SJ (2005)
An STR forensic typing system for genetic individualization of domestic cat (Felis
catus) samples. J Forensic Sci 50: 1061–1070.
76. Morin PA, Manaster C, Mesnick SL, Holland R (2009) Normalization and
binning of historical and multi-source microsatellite data: overcoming theproblems of allele size shift with allelogram. Molecular Ecology Resources 9:
1451–1455.
77. Kalinowski ST, Taper ML, Marshall TC (2007) Revising how the computerprogram CERVUS accommodates genotyping error increases success in
paternity assignment. Mol Ecol 16: 1099–1106.
78. Raymond M, Rousset F (1995) Genepop (Version-1.2) - Population-geneticssoftware for exact tests and ecumenicism. Journal of Heredity 86: 248–249.
79. Hubisz MJ, Falush D, Stephens M, Pritchard JK (2009) Inferring weak
population structure with the assistance of sample group information. MolecularEcology Resources 9: 1322–1332.
80. Cavalli-Sforza LL, Edwards AW (1967) Phylogenetic analysis. Models and
estimation procedures. Am J Hum Genet 19: 233–257.
81. Meirmans PG, Van Tienderen PH (2004) GENOTYPE and GENODIVE: twoprograms for the analysis of genetic diversity of asexual organisms. Molecular
Ecology Notes 4: 792–794.
82. Saitou N, Nei M (1987) The neighbor-joining method: a new method forreconstructing phylogenetic trees. Mol Biol Evol 4: 406–425.
83. Swofford DL (2002) PAUP*: Phylogenetic Analysis Using Parsimony (*and
Other Methods). Version 4.0b10. Sunderland, MA: Sinauer.
84. Winkler CA, Nelson GW, Smith MW (2010) Admixture mapping comes of age.Annu Rev Genomics Hum Genet 11: 65–89.
85. Hauf J, Waddell PJ, Chalwatzis N, Joger U, Zimmermann FK (2000) The
complete mitochondrial genome sequence of the African elephant (Loxodonta
africana), phylogenetic relationships of Proboscidea to other mammals and D-
loop heteroplasmy. Zoology 102: 184–195.
Reconciling African Elephant Phylogenies
PLoS ONE | www.plosone.org 16 June 2011 | Volume 6 | Issue 6 | e20642