PARAMETRIC PROCESS OPTIMIZATION TO IMPROVE THE ACCURACY OF RAPID PROTOTYPED STEREOLITHOGRAPHY PARTS
23
“Parametric Process Optimization to Improve the Accuracy of Rapid Prototyped Stereolithography Parts,” Jack Zhou, Dan Herscovici & Calvin Chen, International Journal of Machine Tools and Manufacture, No.40, 1-17,1999 1 PARAMETRIC PROCESS OPTIMIZATION TO IMPROVE THE ACCURACY OF RAPID PROTOTYPED STEREOLITHOGRAPHY PARTS Jack G. Zhou Department of Mechanical Engineering and Mechanics Drexel University, Philadelphia, PA 19104, USA Daniel Herscovici Motorola Cellular Subscriber Sector Piscataway, NJ 08854, USA and Calvin C. Chen Bell Labs, Lucent Technologies Inc. Murray Hill, NJ 07974, USA ABSTRACT The functional requirements of a rapid prototyping system are speed and accuracy, and they both are functions of vendor defaulted and user selected manufacturing parameters. Accuracy is evaluated by dimensional errors, form errors and surface roughness of manufactured parts. A special designed specimen with twenty dimensional, geometrical, and surface roughness features has been used in the inspection of RP manufacturing processes. In terms of Taguchi experimental design techniques, an orthogonal array of experiments has been developed which has the least number of experimental runs and desired process parameter settings. Using the 3-D coordinate measuring machine and surface profilometer, a series of measurements in evaluating the SLA parts quality has been conducted to find the functional relationships between the output part quality and input manufacturing process parameters. Two analysis tools, response surface methodology and Analysis of Variance (ANOVA) have been used to evaluate the SLA RP process and to perform the product optimization. The optimal setups of SLA manufacturing parameters for both individual features and a general part with various features have been concluded from this study. KEYWORDS Rapid Prototyping, Stereolithography, Parameter Tuning, Taguchi Method, Response Surface Method
Transcript of PARAMETRIC PROCESS OPTIMIZATION TO IMPROVE THE ACCURACY OF RAPID PROTOTYPED STEREOLITHOGRAPHY PARTS
“Parametric Process Optimization to Improve the Accuracy of Rapid Prototyped Stereolithography Parts,” Jack Zhou, Dan Herscovici & Calvin Chen, International Journal of Machine Tools and Manufacture, No.40, 1-17,1999
1
PARAMETRIC PROCESS OPTIMIZATION TO IMPROVE THE ACCURACY OF RAPID PROTOTYPED STEREOLITHOGRAPHY PARTS
Jack G. Zhou Department of Mechanical Engineering and Mechanics
Drexel University, Philadelphia, PA 19104, USA
Daniel Herscovici
Motorola Cellular Subscriber Sector
Piscataway, NJ 08854, USA and
Calvin C. Chen Bell Labs, Lucent Technologies Inc.
Murray Hill, NJ 07974, USA
ABSTRACT
The functional requirements of a rapid prototyping system are speed and accuracy, and they both are
functions of vendor defaulted and user selected manufacturing parameters. Accuracy is evaluated by
dimensional errors, form errors and surface roughness of manufactured parts. A special designed specimen
with twenty dimensional, geometrical, and surface roughness features has been used in the inspection of RP
manufacturing processes. In terms of Taguchi experimental design techniques, an orthogonal array of
experiments has been developed which has the least number of experimental runs and desired process
parameter settings. Using the 3-D coordinate measuring machine and surface profilometer, a series of
measurements in evaluating the SLA parts quality has been conducted to find the functional relationships
between the output part quality and input manufacturing process parameters. Two analysis tools, response
surface methodology and Analysis of Variance (ANOVA) have been used to evaluate the SLA RP process
and to perform the product optimization. The optimal setups of SLA manufacturing parameters for both
individual features and a general part with various features have been concluded from this study.
KEYWORDS
Rapid Prototyping, Stereolithography, Parameter Tuning, Taguchi Method, Response Surface Method

“Parametric Process Optimization to Improve the Accuracy of Rapid Prototyped Stereolithography Parts,” Jack Zhou, Dan Herscovici & Calvin Chen, International Journal of Machine Tools and Manufacture, No.40, 1-17,1999
2
1. INTRODUCTION
In 1987, 3D Systems introduced the first commercialized Rapid Prototyping (RP) system based on
Stereolithography (SL), and the system is called Stereolithography Apparatus (SLA). Since then, RP has
grown into an integral part of new product development. The use of RP has reduced time to market, cut
total costs and improved product quality by giving design and manufacturing teams the opportunity to
verify and fine tune designs before committing them to expensive tooling and fabrication. Today SL
remains the most popular RP technique with the largest installed user base in the world. RP is a material
additive process, where a 3D computer model is sliced and reassembled in real space, layer by layer. In the
SL process, this is accomplished using a UV laser to trace and cure successive layers on a photosensitive
resin. The virtual part, which is usually a 3-D part with certain complexity, is rebuilt in real space in a
fraction of the time needed to create a “traditional” prototype. Although RP has evolved so fast and
received more and more attention in these years, it is still in its developing stage, and some critical research
problems affect RP’s survival, maturation and further applications [1]. In particular, there exists a problem
that deservesetration distancnd needs to be addressed urgently, which is ‘how to improve RP parts
accuracy/quality to be comparable to the conventional machined parts?’
2. ACCURACY PROBLEMS IN THE SLA RP PROCESSES
RP processes are integrated manufacturing processes that include CAD/CAM, control of laser
devices, materials, manufacturing parameter setup, and post-processing. Individual process can introduce
some errors one way or another [2, 3, 4, 5, 15], as explained below. These errors severely reduce RP
product accuracy and obstruct its further applications in rapid tooling and functional part fabrication.
1. CAD/CAM induced error. Most rapid prototyping systems use the de facto standard STL CAD file
format of solid representation to define parts to be built. However, STL files pose the problems of
dimension, form and surface errors resulting from approximation of three-dimensional surfaces by
triangular facets. Although a large number of facets can be used to reduce these errors, doing so will result

“Parametric Process Optimization to Improve the Accuracy of Rapid Prototyped Stereolithography Parts,” Jack Zhou, Dan Herscovici & Calvin Chen, International Journal of Machine Tools and Manufacture, No.40, 1-17,1999
3
in a giant data file and longer part build time. 2. Laser beam width induced error. The laser beam used to
create parts is of a finite width, though the file used to drive the machine represents the edges as zero-width
lines. The width of this beam can be compensated for in the laser beam scan control software, but the beam
width is not constant from machine to machine and even not the same on a single machine over time. This
induces part errors. 3. Material shrinkage error. SLA part accuracy is a direct result of the resin
properties. Many researchers are striving to develop new resins that offer low shrinkage and high
dimensional stability. The earlier resins available from 3D Systems Inc. are primarily limited to the
Acrylate base resins with relatively large shrinkage (5%-7% in volume), causing severe distortions of the
finished parts. 4. RP Machine Parameter Setup. Errors that occur during the building time are mainly in
the manufacturing control factor setups, which are RP machine vendor defaulted and user selected
parameters. Different parameter setup will generate different machining accuracy and build time. 5. Post-
processing error. SL parts are designed to be post-cured as soon as they are built, otherwise green creep
distortion, which results from the residual internal stress generated during the SLA building cycle, will
occur. An accumulation of the above five errors usually causes 250-500 µm dimensional error and very
unpleasant surface roughness, which make RP products unacceptable in many applications for a long time.
3. IMPROVEMENT OF RP ACCURACY
Fortunately in the last several years, many research efforts have been dedicated to RP technology and
the accuracy problems have been improved significantly. In CAD/CAM a new SLC file format was defined
by 3D Systems in 1992. Unlike the tessellated solid STL representation, it is a 2-1/2D contour
representation of the model boundaries within each layer. SLC data can be generated from various sources
such as CAD solid or surface models or CT scanners. The SLC file format can virtually eliminate the
problem of translating a part from the original representation to an intermediate tessellation form, where the
error is induced. Some other approaches to eliminating STL format error are also under investigation such
as NURBS and direct slicing methods [6]. In laser beam width, a better laser beam control mechanism and
“Parametric Process Optimization to Improve the Accuracy of Rapid Prototyped Stereolithography Parts,” Jack Zhou, Dan Herscovici & Calvin Chen, International Journal of Machine Tools and Manufacture, No.40, 1-17,1999
4
beam width compensation software has been used, which reduces the error to a minimum. On the materials
side, in early 1994 a significant advance was accomplished when 3D Systems and Ciba Geigy Corporation
introduced an Epoxy resin called XB5170. Unlike the Acrylate resin, the small shrinkage of XB5170 (2%-
3% in volume) makes it possible to build a stable and accurate part. In postprocessing, along with XB5170
resin, 3D Systems also developed a new part build style ACES (Accurate, Clear, Epoxy, Solid). This is
accomplished by completing and uniforming polymerization during the part building process, virtually
eliminating post-cure distortion and internal stresses. The only problem left on which not much work has
been done is RP machine parameter setup.
Many factors contribute to the output accuracy and part build time. However, among these there are
only a selected few that are adjustable by users. On the surface they appear to be simple to adjust, but
users quickly realize that small adjustments may have large output effects. Furthermore, changing
combinations of parameter setup turns into a guessing game, where only after many experimental runs
gives a glimpse of what the settings should be for different situations.
4. OBJECTIVES OF THIS STUDY
This research aims at conducting a scientific and experimental study in improving RP part accuracy
through parameter tuning and optimization of SLA manufacturing processes. The optimization results or
technology obtained from this research can be applied to any other RP machines using similar approaches.
The objectives of the research are: (1) to conduct a detailed experimental study and to search for
interrelationship between the SLA RP product accuracy and the machine parameter setup by using Taguchi
experimental design, and parameter tuning and optimization techniques; (2) to achieve an accuracy of less
than 0.0013mm/mm error in the X and Y dimensions, less than 0.0039mm/mm in Z dimension, and less
than 0.002mm/mm in various form features, respectively, and also to achieve surface roughness around
0.5 µm for top surface and 6 µm for layered surfaces; (3) it is very possible in the near future based on the
data and knowledge obtained from this study to build an expert system that can be trained to provide an
“Parametric Process Optimization to Improve the Accuracy of Rapid Prototyped Stereolithography Parts,” Jack Zhou, Dan Herscovici & Calvin Chen, International Journal of Machine Tools and Manufacture, No.40, 1-17,1999
5
optimal combination of manufacturing control parameters according to the user specified machining speed
and SLA parts accuracy.
5. RESEARCH APPROACHES
5.1. Enhancing Accuracy Using Parameter Tuning and Optimization for SLA RP Processes
Current RP methods have several shortcomings. Layer building rapid prototyping techniques result in
surfaces that frequently require a secondary finishing operation to achieve the desired surface quality. Also,
accuracy and repeatability of the machine do not consistently match the claims of the manufacturer, and the
mating of parts is often difficult to achieve. Finally, there is a strong demand to further decrease the rapid
prototyping build time [1]. For rapid prototyping to become economically and technologically more
attractive, it must be able to achieve higher accuracy and have the ability to directly generate fine parts and
smooth surfaces while further minimizing build time without incurring expensive development cost. An
economical way of achieving these goals without major changes in the developed hardware and software
architecture is to re-tune the control factors of the existing rapid prototyping process for the given machine.
Most users attempt to minimize build time by manipulating initial manufacturer suggested build
parameters. They may not realize that interactions between these build parameters can severely affect the
output quality of their parts. On the other hand, with proper adjustment of the build parameters, part
quality can be significantly improved and build time can be greatly reduced without the necessity of
incurring additional expenses. A standard sample has been designed which contains twenty separate
features for inspection. Using this sample, more than 100 SLA parts, including 27 different runs, and trial
and error statistical analysis, were built. The experimental data were gathered using a Brown & Sharpe
Coordinate Measuring Machine (CMM). The state of the art CMM can provide a fully programmable
inspection process, thus allowing us to achieve high accuracy and have strong confidence in our measured
results. Based on Taguchi’s experimental design, two analysis tools, response surface methodology and
“Parametric Process Optimization to Improve the Accuracy of Rapid Prototyped Stereolithography Parts,” Jack Zhou, Dan Herscovici & Calvin Chen, International Journal of Machine Tools and Manufacture, No.40, 1-17,1999
6
Analysis of Variance (ANOVA), have been used to evaluate the SLA RP processes and to perform product
optimization. In the following, the new approaches will be discussed in detail.
5.2. Determination of the Major Control Factors for SLA Processes
In the Stereolithography Apparatus there are about fifteen variables to consider prior to a
manufacturing process (e.g., layer thickness, Z level wait, sweep period, overcure, blade gap, hatch
spacing, dip velocity and dip acceleration). Each of these variables affects the output part quality and build
time in some way [2]. Through initial observations and experience with the SLA system it has been found
that although most controllable factors have some effects, a major part of output quality is dictated by a
few primary control factors [7, 8, 15], such as layer thickness, hatch spacing, overcure, blade gap, and
position on the build plane. In the present investigation, we have included these five build parameters as the
main factors, and examined their effects on dimensional and geometrical accuracy, and surface roughness
of the final parts, individually or interactively. Definitions or interpretation of the five major control
factors can be defined as follows.
Layer thickness: the thickness of each slice of the part building on the previous layer.
Hatch spacing: defined as the distance between the centerlines of adjacent parallel hatch vectors.
Overcure: refers to the depth that the laser cures past the layer thickness.
Blade Gap: allows the vertical separation between the bottom of the recoater blade and the top of the
previous (cured) layer to be increased per sweep.
Position on the build plane: the build plane can be partitioned as inner, middle and outer (from the
center to the edge) of the platform.
In order to conduct an experiment, the five factors selected need to be directly or indirectly adjustable
within the SLA control software. Four of the five factors chosen for the experiment can be directly
adjusted. However it has been found that the value entered for overcure does not directly correlate to the
“Parametric Process Optimization to Improve the Accuracy of Rapid Prototyped Stereolithography Parts,” Jack Zhou, Dan Herscovici & Calvin Chen, International Journal of Machine Tools and Manufacture, No.40, 1-17,1999
7
actual overcure in a prototyped part. Therefore a method has been developed to calculate the input value of
overcure to the control software in order to achieve the desired overcure, or so called resultant overcure.
In order to derive an equation to find the adjustable input overcure, we first define the following
symbols.
LT : Layer thickness; OC : Input overcure;
Cd : Desired cure depth = LT + OC ;
Dp : The rated penetration distance of the resin; Ecrit : Critical exposure energy;
Emax : Maximum energy deposited by the laser; Wo : Half beam width;
PL : Laser power; Vs= Laser scan speed;
L : Total length the laser has traversed; Hs : Hatch spacing.
The required input overcure for a desired cure depth (LT + OC) can be calculated using the following
equations [2, 9].
C DE
Ed pcrit
=
ln max (1); E
P
W VL
smax =
2
0π (2)
From the fundamental equation (1) and (2), the laser scan speed can be obtained as
VP
W E
C
DsL
crit
d
p
= −
2
0πexp (3)
Considering a unit square inch area, to achieve the maximum energy we need a total exposure time
TE
PtL
= max or T
L
Vts
= (4)
For a unit square inch area, the laser-traveled length is
“Parametric Process Optimization to Improve the Accuracy of Rapid Prototyped Stereolithography Parts,” Jack Zhou, Dan Herscovici & Calvin Chen, International Journal of Machine Tools and Manufacture, No.40, 1-17,1999
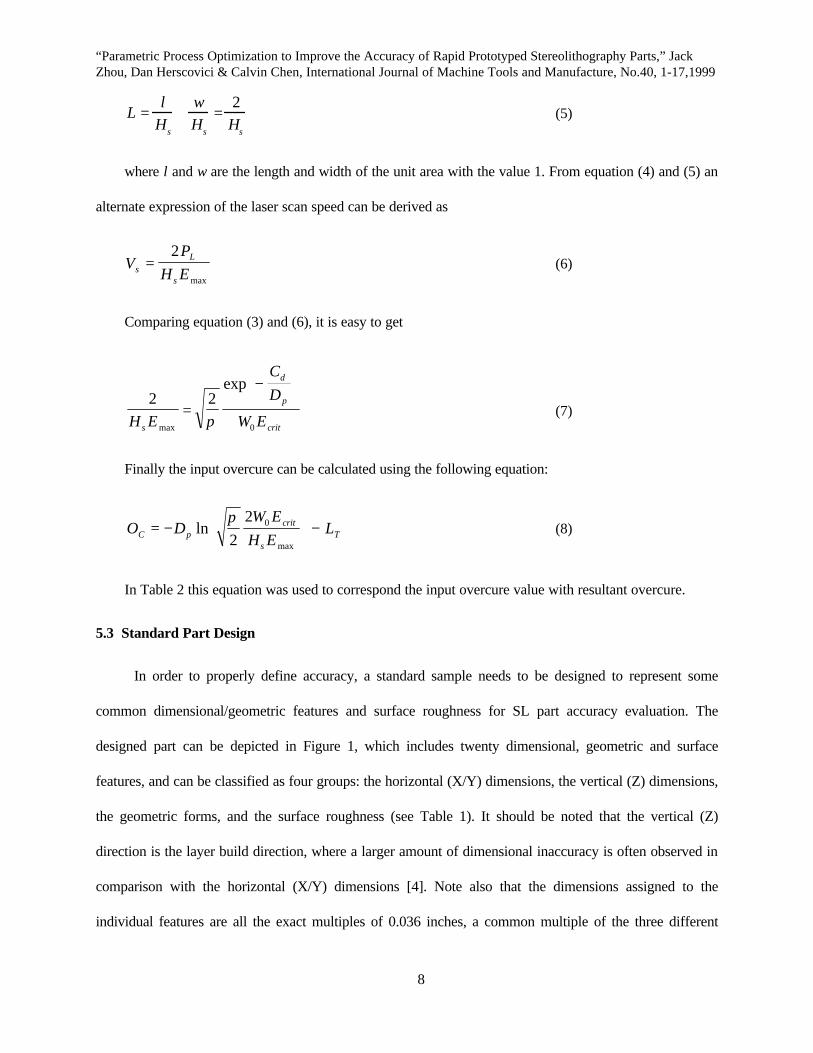
8
L =l
Hs
+w
Hs
=2
Hs
(5)
where l and w are the length and width of the unit area with the value 1. From equation (4) and (5) an
alternate expression of the laser scan speed can be derived as
VP
H EsL
s
=2
max
(6)
Comparing equation (3) and (6), it is easy to get
2 2
0H E
C
D
W Es
d
p
critmax
exp
=
−
π (7)
Finally the input overcure can be calculated using the following equation:
O DW E
H ELC p
crit
sT= −
−ln
max
π2
2 0 (8)
In Table 2 this equation was used to correspond the input overcure value with resultant overcure.
5.3 Standard Part Design
In order to properly define accuracy, a standard sample needs to be designed to represent some
common dimensional/geometric features and surface roughness for SL part accuracy evaluation. The
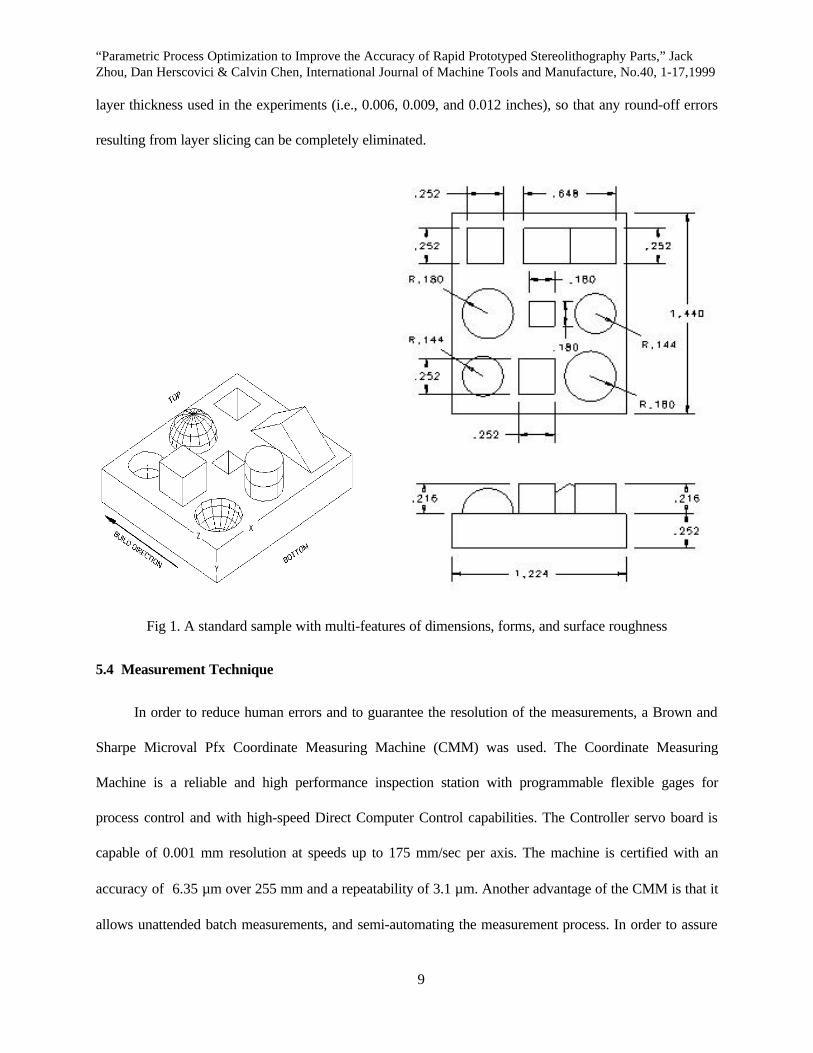
designed part can be depicted in Figure 1, which includes twenty dimensional, geometric and surface
features, and can be classified as four groups: the horizontal (X/Y) dimensions, the vertical (Z) dimensions,
the geometric forms, and the surface roughness (see Table 1). It should be noted that the vertical (Z)
direction is the layer build direction, where a larger amount of dimensional inaccuracy is often observed in
comparison with the horizontal (X/Y) dimensions [4]. Note also that the dimensions assigned to the
individual features are all the exact multiples of 0.036 inches, a common multiple of the three different
“Parametric Process Optimization to Improve the Accuracy of Rapid Prototyped Stereolithography Parts,” Jack Zhou, Dan Herscovici & Calvin Chen, International Journal of Machine Tools and Manufacture, No.40, 1-17,1999
9
layer thickness used in the experiments (i.e., 0.006, 0.009, and 0.012 inches), so that any round-off errors
resulting from layer slicing can be completely eliminated.
Fig 1. A standard sample with multi-features of dimensions, forms, and surface roughness
5.4 Measurement Technique
In order to reduce human errors and to guarantee the resolution of the measurements, a Brown and
Sharpe Microval Pfx Coordinate Measuring Machine (CMM) was used. The Coordinate Measuring
Machine is a reliable and high performance inspection station with programmable flexible gages for
process control and with high-speed Direct Computer Control capabilities. The Controller servo board is
capable of 0.001 mm resolution at speeds up to 175 mm/sec per axis. The machine is certified with an
accuracy of 6.35 µm over 255 mm and a repeatability of 3.1 µm. Another advantage of the CMM is that it
allows unattended batch measurements, and semi-automating the measurement process. In order to assure
“Parametric Process Optimization to Improve the Accuracy of Rapid Prototyped Stereolithography Parts,” Jack Zhou, Dan Herscovici & Calvin Chen, International Journal of Machine Tools and Manufacture, No.40, 1-17,1999
10
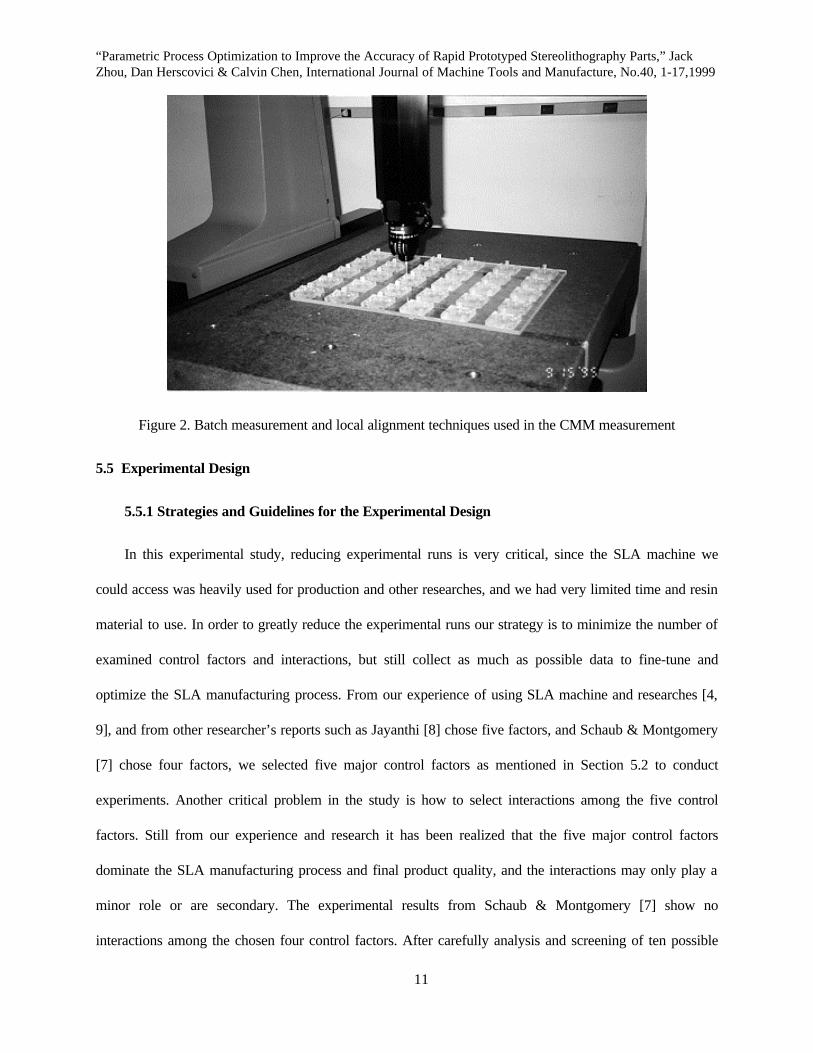
the integrity of each part measurement procedure, a new local alignment system was constructed for each
part. Therefore errors in placing the parts on the batch sheet did not contribute any errors to the
measurements. Figure 2 is a photograph showing the batch measurement with thirty standard parts and
local alignment techniques.
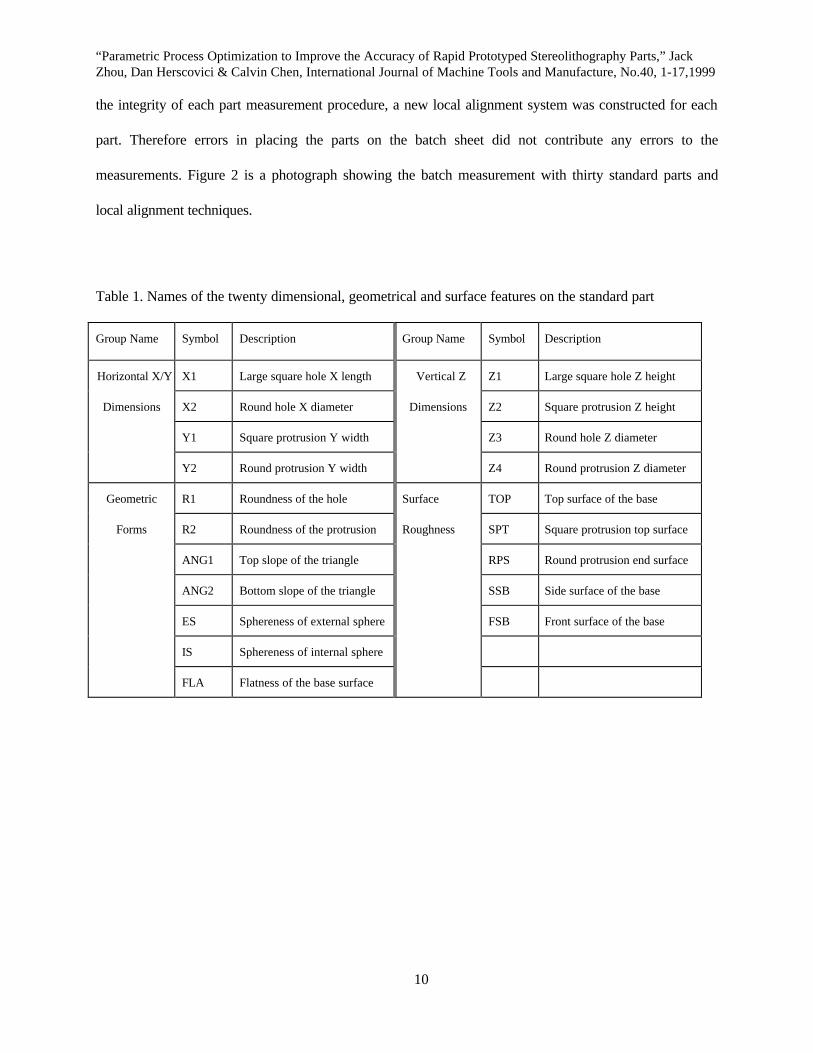
Table 1. Names of the twenty dimensional, geometrical and surface features on the standard part
Group Name Symbol Description Group Name Symbol Description
Horizontal X/Y X1 Large square hole X length Vertical Z Z1 Large square hole Z height
Dimensions X2 Round hole X diameter Dimensions Z2 Square protrusion Z height
Y1 Square protrusion Y width Z3 Round hole Z diameter
Y2 Round protrusion Y width Z4 Round protrusion Z diameter
Geometric R1 Roundness of the hole Surface TOP Top surface of the base
Forms R2 Roundness of the protrusion Roughness SPT Square protrusion top surface
ANG1 Top slope of the triangle RPS Round protrusion end surface
ANG2 Bottom slope of the triangle SSB Side surface of the base
ES Sphereness of external sphere FSB Front surface of the base
IS Sphereness of internal sphere
FLA Flatness of the base surface
“Parametric Process Optimization to Improve the Accuracy of Rapid Prototyped Stereolithography Parts,” Jack Zhou, Dan Herscovici & Calvin Chen, International Journal of Machine Tools and Manufacture, No.40, 1-17,1999
11
Figure 2. Batch measurement and local alignment techniques used in the CMM measurement
5.5 Experimental Design
5.5.1 Strategies and Guidelines for the Experimental Design
In this experimental study, reducing experimental runs is very critical, since the SLA machine we
could access was heavily used for production and other researches, and we had very limited time and resin
material to use. In order to greatly reduce the experimental runs our strategy is to minimize the number of
examined control factors and interactions, but still collect as much as possible data to fine-tune and
optimize the SLA manufacturing process. From our experience of using SLA machine and researches [4,
9], and from other researcher’s reports such as Jayanthi [8] chose five factors, and Schaub & Montgomery
[7] chose four factors, we selected five major control factors as mentioned in Section 5.2 to conduct
experiments. Another critical problem in the study is how to select interactions among the five control
factors. Still from our experience and research it has been realized that the five major control factors
dominate the SLA manufacturing process and final product quality, and the interactions may only play a
minor role or are secondary. The experimental results from Schaub & Montgomery [7] show no
interactions among the chosen four control factors. After carefully analysis and screening of ten possible
“Parametric Process Optimization to Improve the Accuracy of Rapid Prototyped Stereolithography Parts,” Jack Zhou, Dan Herscovici & Calvin Chen, International Journal of Machine Tools and Manufacture, No.40, 1-17,1999
12
interaction combinations for five main factors, three interactions (Layer thickness with Overcure L x O,
Layer thickness with Hatch spacing L x H, and Overcure with Hatch spacing O x H) were chosen in the
response surface modeling.
Once examined factors and interactions were determined, the next step is to determine how many
levels we want to examine for each factor. Since all the five factors are multi-level variables and their out-
come effects are not linear relation, we determined to use three level test for each factor [10, 11]. To check
degrees of freedom (DOF) in the experimental design modeling, for three level test five main factors take 10
DOFs (5 x 2), three interactions take 12 DOFs (3 x4), and total will be 22 DOFs. By using Taguchi
method [10, 11], the most suitable orthogonal array is L27 which needs 27 runs, has 26 DOFs, and can
conduct three level testing. In the L27 array there are 13 columns can be used to assign test factors and
their interactions. To avoid aliasing and overlap of the three interactions with main factors we chose
columns 1, 2, 5, 12, and 13 to test layer thickness, overcure, hatch spacing, blade gap and position,
respectively, and columns 3 + 4, 6 +7, and 8 + 11 to calculate interactions of L x O, L x H, and O x H,
respectively (Peace,1993).
5.5.2 Taguchi method
A standard approach for experimental design is to use the full factorial method. However, a full
factorial approach is acceptable only when a few (usually not more than three) factors are to be
investigated. For example, a full factorial approach requires a total of 3f experimental runs if there are f
number of factors to be investigated, each consists of 3 different levels (i.e., high, medium, and low). In the
present investigation, we are searching for the effects of five controllable factors, as well as the interactions
among them, if there is any. Application of the full factorial approach to the present investigation requires a
total of 243 experimental runs, and is, therefore, not practical. Instead of the full factorial approach, by
using Fractional Factorial method Taguchi [12] has developed a family of experimental arrays to minimize
the number of total experimental runs. These Fractional Factorials are orthogonal in nature, based on a set
“Parametric Process Optimization to Improve the Accuracy of Rapid Prototyped Stereolithography Parts,” Jack Zhou, Dan Herscovici & Calvin Chen, International Journal of Machine Tools and Manufacture, No.40, 1-17,1999
13
of orthogonal linear equations, and therefore allow experimenters to isolate individual factors and use fewer
experimental runs [13, 10]. Using Taguchi technique we were able to reduce the 243 experimental runs to
only 27 runs to study the effects of these five main factors including the effects of interactions of any three
variables, each at three different levels. Our intentions are not only to improve individual part quality but
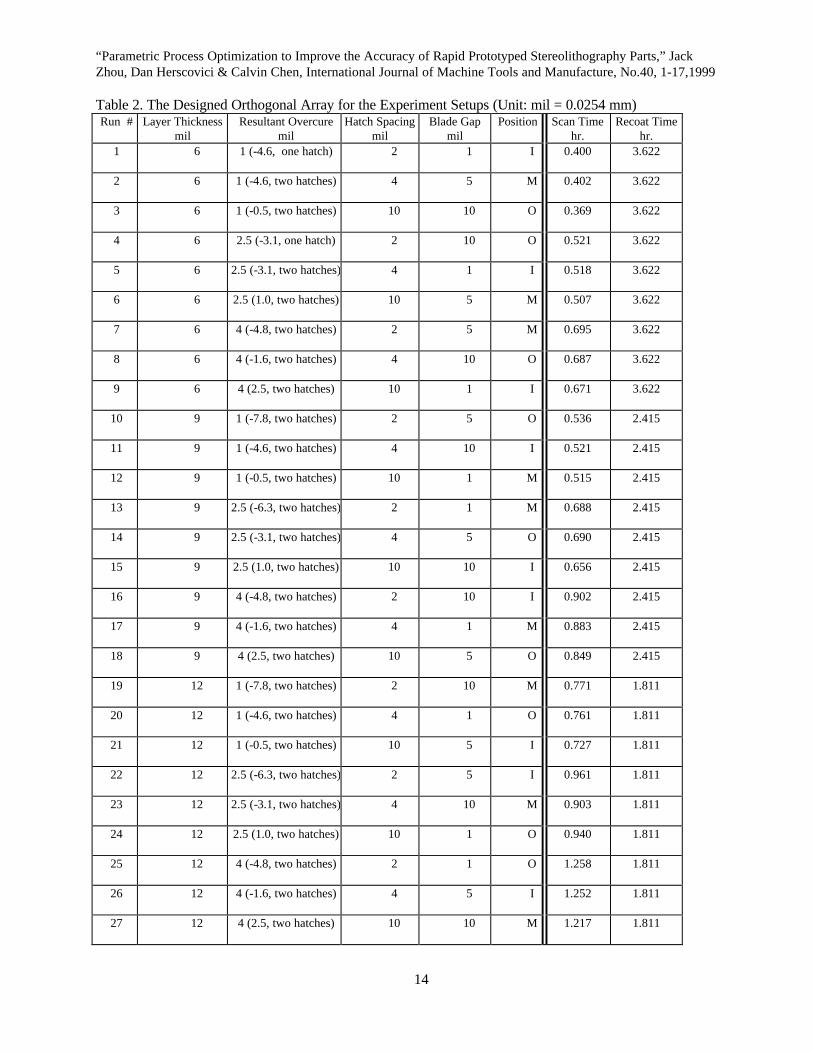
also to minimize the variance from part to part. The experimental set-up is shown in Table 2, according to
Taguchi's L27 Orthogonal Array. In order to obtain meaningful measurement results, four identical parts,
using a 3D Systems' SLA-250 machine, were built for each case, which resulted in a total of 108 parts.
Note that in Table 2, all units used are in milli-inch except for the position where I, M, and O represent the
part location at inner, middle and outer portion of the platform and each occupies approximately 1/3 of the
total platform area respectively. Note also that, in order to obtain the same amount of resultant overcure as
specified in Table 2, the input values of overcure to the SLA part's preparation program need to be
different depending on the hatch space and number of scan paths used in the processes. These values can
be calculated according to the maximum exposure versus cure depth equation (8) [4, 9], and the
corresponding input values (mostly negative) are shown in brackets in Table 2.
5.6 Statistical Analysis and Optimization Using the Response Surface Method and ANOVA
In many technical fields, there is a relationship between a response variable y of interest and a set of
controllable variables {x1, x2,...,xn}. In some systems, the nature of the relationship between y and the x’s
might be known exactly, based on the underlying scientific principles. Then one can write a model of the
form y = g(x1, x2,..., xn) + ε, where the term ε represents the error in the system. This type of relationship
is called a mechanistic model. However, in most practical situations, the underlying mechanism is either
unknown or difficult to describe completely, and the experimenter (scientist or engineer) must approximate
the unknown function g(.) with an appropriate empirical model $ ( , , ... , )y f x x xn= +1 2 ε . Usually the
function f(.) is a first-order or second-order polynomial.
“Parametric Process Optimization to Improve the Accuracy of Rapid Prototyped Stereolithography Parts,” Jack Zhou, Dan Herscovici & Calvin Chen, International Journal of Machine Tools and Manufacture, No.40, 1-17,1999
14
Table 2. The Designed Orthogonal Array for the Experiment Setups (Unit: mil = 0.0254 mm) Run # Layer Thickness
mil Resultant Overcure
mil Hatch Spacing
mil Blade Gap
mil Position Scan Time
hr. Recoat Time
hr. 1 6 1 (-4.6, one hatch) 2 1 I 0.400 3.622
2 6 1 (-4.6, two hatches) 4 5 M 0.402 3.622
3 6 1 (-0.5, two hatches) 10 10 O 0.369 3.622
4 6 2.5 (-3.1, one hatch) 2 10 O 0.521 3.622
5 6 2.5 (-3.1, two hatches) 4 1 I 0.518 3.622
6 6 2.5 (1.0, two hatches) 10 5 M 0.507 3.622
7 6 4 (-4.8, two hatches) 2 5 M 0.695 3.622
8 6 4 (-1.6, two hatches) 4 10 O 0.687 3.622
9 6 4 (2.5, two hatches) 10 1 I 0.671 3.622
10 9 1 (-7.8, two hatches) 2 5 O 0.536 2.415
11 9 1 (-4.6, two hatches) 4 10 I 0.521 2.415
12 9 1 (-0.5, two hatches) 10 1 M 0.515 2.415
13 9 2.5 (-6.3, two hatches) 2 1 M 0.688 2.415
14 9 2.5 (-3.1, two hatches) 4 5 O 0.690 2.415
15 9 2.5 (1.0, two hatches) 10 10 I 0.656 2.415
16 9 4 (-4.8, two hatches) 2 10 I 0.902 2.415
17 9 4 (-1.6, two hatches) 4 1 M 0.883 2.415
18 9 4 (2.5, two hatches) 10 5 O 0.849 2.415
19 12 1 (-7.8, two hatches) 2 10 M 0.771 1.811
20 12 1 (-4.6, two hatches) 4 1 O 0.761 1.811
21 12 1 (-0.5, two hatches) 10 5 I 0.727 1.811
22 12 2.5 (-6.3, two hatches) 2 5 I 0.961 1.811
23 12 2.5 (-3.1, two hatches) 4 10 M 0.903 1.811
24 12 2.5 (1.0, two hatches) 10 1 O 0.940 1.811
25 12 4 (-4.8, two hatches) 2 1 O 1.258 1.811
26 12 4 (-1.6, two hatches) 4 5 I 1.252 1.811
27 12 4 (2.5, two hatches) 10 10 M 1.217 1.811
“Parametric Process Optimization to Improve the Accuracy of Rapid Prototyped Stereolithography Parts,” Jack Zhou, Dan Herscovici & Calvin Chen, International Journal of Machine Tools and Manufacture, No.40, 1-17,1999
15
Multiple variable regression is used to develop the empirical model by determining an optimal set of model
coefficients. This empirical model is called a response surface model [14]. After finding the optimal set of
model coefficients, the empirical model f(.) is obtained. Then the Analysis of Variance (ANOVA) method is
used to evaluate the confidence interval and adequacy of the model f(.) or say, test for significance of
regression. The following table summarizes the analysis procedures of the ANOVA. Details of the
parameters and applications of ANOVA can be found in the reference [14].
Table 3. Analysis of Variance for Significance of Regression in Multiple Regression
Source of Variation Sum of Square Degrees of Freedom Mean Square F0
Regression SSR n MSR MSR/MSE
Error or residual SSE K-n-1 MSE
Total Syy K-1
The Response Surface Methodology can be used to find the levels of the controllable variables that
result in optimization of the response variable, or discover what levels for the x’s will result in a product
(process) satisfying several requirements or specifications.
6. EXPERIMENTAL RESULTS, ANALYSIS AND DISCUSSION
As stated above, a total of 20 dimensional, geometry and surface features were defined for the
standard part. The test parts were manufactured using a SLA-250 rapid prototyping machine, according to
the individual build parameters shown in Table 2. After manufacturing of the total of 108 parts (4 parts
each setup for 27 different experimental runs), detailed measurements were then taken using the Brown &
Sharpe Coordinate Measurement Machine. For every dimensional or geometry feature, approximately 100
points on each part were measured using the CMM. Among the four parts for each run, some of these
measurement values were discarded if they were outside the valid 6σ criterion range of the corresponding
statistical distribution curve, possibly due to the contamination during the manufacturing and cleaning
processes. Then the measurement values were taken an average from the valid parts. Since this is a strong
case by case situation we could not get a general amount of variation from sample to sample for various
“Parametric Process Optimization to Improve the Accuracy of Rapid Prototyped Stereolithography Parts,” Jack Zhou, Dan Herscovici & Calvin Chen, International Journal of Machine Tools and Manufacture, No.40, 1-17,1999
16
parameter settings. For the cases of low overcure, layer de-laminations were sometimes observed along the
bottom face of square holes or protrusions due to the extreme low overcure used, and these data were also
discarded. The remaining valid measurements were then analyzed using the Response Surface and ANOVA
methods to conduct the parameter tuning and optimization process. The results obtained can be best
illustrated using the following two examples, as shown in Table 4 and Figure 3.
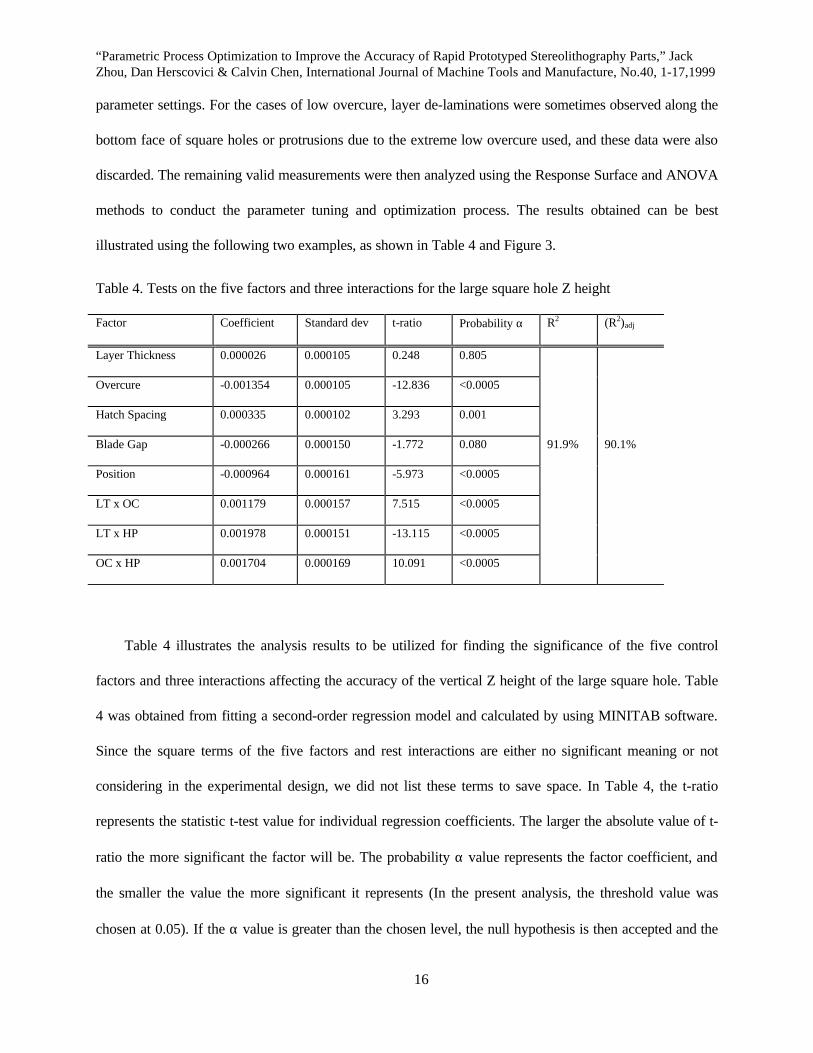
Table 4. Tests on the five factors and three interactions for the large square hole Z height
Factor Coefficient Standard dev t-ratio Probability α R2 (R2)adj
Layer Thickness 0.000026 0.000105 0.248 0.805
Overcure -0.001354 0.000105 -12.836 <0.0005
Hatch Spacing 0.000335 0.000102 3.293 0.001
Blade Gap -0.000266 0.000150 -1.772 0.080 91.9% 90.1%
Position -0.000964 0.000161 -5.973 <0.0005
LT x OC 0.001179 0.000157 7.515 <0.0005
LT x HP 0.001978 0.000151 -13.115 <0.0005
OC x HP 0.001704 0.000169 10.091 <0.0005
Table 4 illustrates the analysis results to be utilized for finding the significance of the five control
factors and three interactions affecting the accuracy of the vertical Z height of the large square hole. Table
4 was obtained from fitting a second-order regression model and calculated by using MINITAB software.
Since the square terms of the five factors and rest interactions are either no significant meaning or not
considering in the experimental design, we did not list these terms to save space. In Table 4, the t-ratio
represents the statistic t-test value for individual regression coefficients. The larger the absolute value of t-
ratio the more significant the factor will be. The probability α value represents the factor coefficient, and
the smaller the value the more significant it represents (In the present analysis, the threshold value was
chosen at 0.05). If the α value is greater than the chosen level, the null hypothesis is then accepted and the
“Parametric Process Optimization to Improve the Accuracy of Rapid Prototyped Stereolithography Parts,” Jack Zhou, Dan Herscovici & Calvin Chen, International Journal of Machine Tools and Manufacture, No.40, 1-17,1999
17
coefficient is judged not significant. Finally, the values of R2 and (R2)adj represent the regression confidence
and the adjusted regression confidence respectively. They should be at least as large as 60%, and the two
values should not differ too much. In view of the analysis results shown in Table 4, it can be concluded
that the confidence of the regression model is satisfactory with a value larger than 90%, and the overcure
has the most effects on the vertical Z dimension, which has the largest absolute value of t-ratio (not
including interactions), with a probability α value of less than 0.0005. The relatively large values of the
three interactions (L x H, L x H, and O x H) in Table 4 were the worst case from all the 20 features. We
still could not give a definite explanation. Possible reasons are: there are still some aliasing and overlap of
the three interactions with main factors, measurement contamination, Taguchi method’s defect in
interaction examination, or interaction effects are significant These are worth further investigation. In
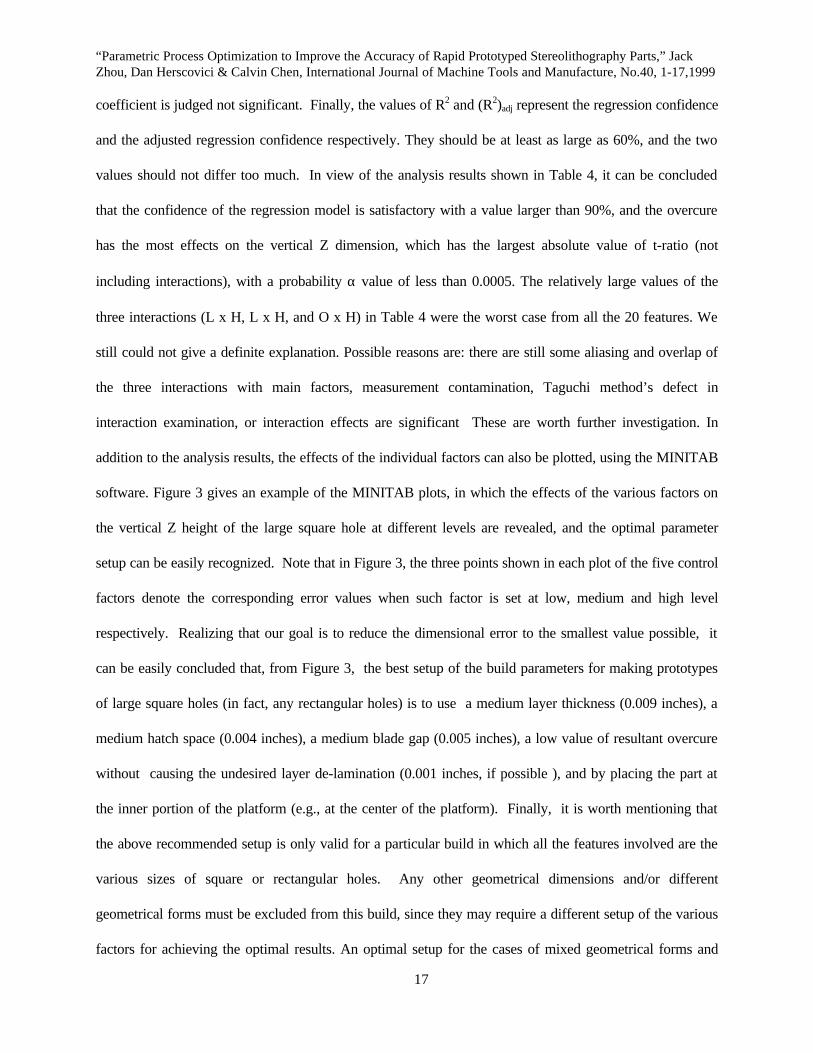
addition to the analysis results, the effects of the individual factors can also be plotted, using the MINITAB
software. Figure 3 gives an example of the MINITAB plots, in which the effects of the various factors on
the vertical Z height of the large square hole at different levels are revealed, and the optimal parameter
setup can be easily recognized. Note that in Figure 3, the three points shown in each plot of the five control
factors denote the corresponding error values when such factor is set at low, medium and high level
respectively. Realizing that our goal is to reduce the dimensional error to the smallest value possible, it
can be easily concluded that, from Figure 3, the best setup of the build parameters for making prototypes
of large square holes (in fact, any rectangular holes) is to use a medium layer thickness (0.009 inches), a
medium hatch space (0.004 inches), a medium blade gap (0.005 inches), a low value of resultant overcure
without causing the undesired layer de-lamination (0.001 inches, if possible ), and by placing the part at
the inner portion of the platform (e.g., at the center of the platform). Finally, it is worth mentioning that
the above recommended setup is only valid for a particular build in which all the features involved are the
various sizes of square or rectangular holes. Any other geometrical dimensions and/or different
geometrical forms must be excluded from this build, since they may require a different setup of the various
factors for achieving the optimal results. An optimal setup for the cases of mixed geometrical forms and
“Parametric Process Optimization to Improve the Accuracy of Rapid Prototyped Stereolithography Parts,” Jack Zhou, Dan Herscovici & Calvin Chen, International Journal of Machine Tools and Manufacture, No.40, 1-17,1999
18
dimensions can only be suggested after all the twenty features are examined and the results are carefully
analyzed. Following the procedures mentioned above, all the twenty dimensional, geometry and surface
features specified in Table 1 of the standard sample were examined. The measurement results from each of
the 108 parts were carefully screened, and the remaining valid measurements were then analyzed according
to RSM and ANOVA methods, together with the Main Effect Plots obtained from MINITAB. From these
analyses, we were able to reach the conclusion of the main factors and best setup of the build parameters
for each of the twenty dimension and form features. Such findings are summarized in Table 5, in which we
also list the suggested setting level of the main factors for achieving the best results.
Figure 3. The main effects plot for the large square hole Z height
“Parametric Process Optimization to Improve the Accuracy of Rapid Prototyped Stereolithography Parts,” Jack Zhou, Dan Herscovici & Calvin Chen, International Journal of Machine Tools and Manufacture, No.40, 1-17,1999
19
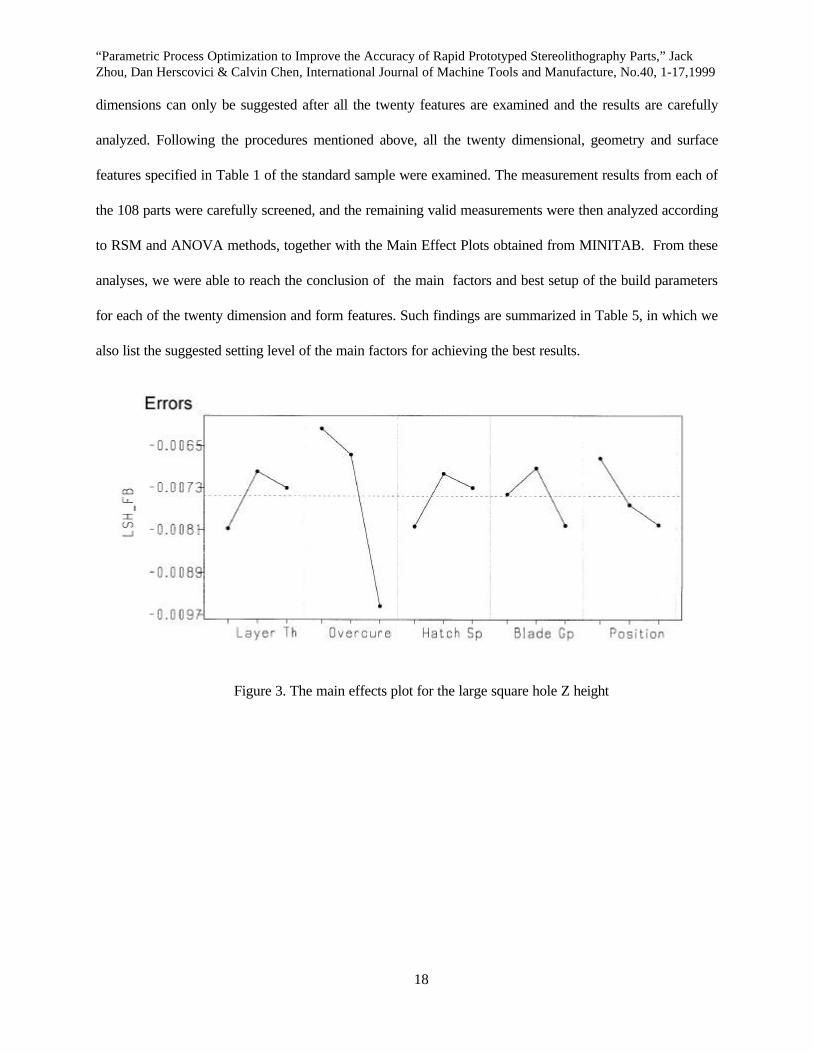
Table 5. Summary of main factors and the best setting for various dimensional, geometry and surfaces
Group Name Symbol Major Factors & Best Setting Group Name Symbol Major Factors & Best Setting
Horizontal X/Y X1 For all the X/Y dimensions, Vertical Z Z1 Overcure has the largest effect.
Dimensions X2 the blade-gap has the largest Dimensions Z2 Low overcure is the best.
Y1 effect on accuracy. Medium Z3 Layer thickness has the largest
Y2 blade-gap is the best. Z4 effect. Low setting is the best.
Geometric R1 Layer thickness has the Surface TOP Overcure and layer thickness
Forms R2 largest effect. Low is the best. Roughness SPT both are significant. Low best.
ANG1 No major factors. Confidence
is less than 50%
RPS For all the three features layer
thickness has the largest effect
ANG2 For all the four features SSB Low thickness is the best.
ES Layer thickness is significant. FSB
IS Low thickness is the best.
FLA
The analysis results shown in Table 5 give SLA users a guideline for building accurate
stereolithography parts when a specific dimensional, geometry or surface feature is encountered. It is
recognized, however, that most stereolithography parts involve many features listed above, and since every
one of them is equally important. A suggested optimal setting of the various build parameters for general
parts is deemed very useful. We, therefore, carefully examined our experimental and analysis results, and
concluded that, for a general part, the best setting to achieve an over-all high dimensional, geometry and
surface accuracy is to use low layer thickness (0.006 inches or less), low resultant overcure (0.001 inch),
“Parametric Process Optimization to Improve the Accuracy of Rapid Prototyped Stereolithography Parts,” Jack Zhou, Dan Herscovici & Calvin Chen, International Journal of Machine Tools and Manufacture, No.40, 1-17,1999
20
medium blade gap (0.005 inches), medium or low hatch space (0.004 or 0.002 inches), and medium or low
position on the platform (i.e., in the center or close to the center of the platform). From our experiments,
using this optimal set-up, the resulted accuracy was that for horizontal X/Y dimension errors are less than
45 µm, for vertical Z dimensions less than 150 µm, for form features less than 75 µm, and for the surface
roughness: top surface less than 0.5 µm and layered surface less than 5 µm, in average. This accuracy is
fairly close to our expected objective.
7. BUILD TIME CONSIDERATIONS
Since the total build time required for a specific part depends on the total recoating time consumed
between layers and the laser scan time used at each layer, and both of them are functions of part size and
geometry. The optimal build time obtained from the present experiments serves little use and may lead to a
wrongful conclusion when applied to other parts with different sizes and geometry. Instead, we should
compare the total laser scan time and the total recoating time separately. The saving due to laser scan time
can be significant when building large cross section area parts, and the saving in total recoating time is
important for building long and tall parts. For the present cases, the total laser scan time required to build
one part for each of the 27 runs can be calculated using the build time prediction program written by Chen
and Sullivan [9], and the corresponding calculated results, based on an assumed laser power of 25 mW, are
shown in Table 2. Table 2 also gives the calculated total recoating time for each case, which reveals a
saving of factors 1.5 and 2 respectively when using 0.009 inches and 0.012 inches layer thickness instead
of the 0.006 inches layer thickness normally used in ACES build. As expected, no significant difference in
total laser scan time was found when applying different hatch space to the parts building process, as long
as the resultant overcure remains the same. Table 2 reveals, however, that the saving in total laser scan
time can reach 4 times if the low resultant overcure of 0.001 inches and low layer thickness of 0.006
inches are used in comparing with the high resultant overcure of 0.004 inches and high layer thickness of
0.012 inches. From these observations, we conclude that the suggested optimal set up mentioned in the
“Parametric Process Optimization to Improve the Accuracy of Rapid Prototyped Stereolithography Parts,” Jack Zhou, Dan Herscovici & Calvin Chen, International Journal of Machine Tools and Manufacture, No.40, 1-17,1999
21
previous section can reduce the total laser scan time significantly on the one hand, but it also requires larger
amount of total recoating time on the other hand. The resultant total build time (scan + recoating) may
increase or decrease when comparing with other setups, which depends on the specific part's geometry and
dimensions in consideration.
8. CONCLUSIONS
A detailed study of the most important five build parameters that affect the quality and accuracy of the
final stereolithography parts, namely, the layer thickness, resultant overcure, hatch space, blade gap, and
the part location, was performed in the present investigation. To reduce the large amount of the total
number of experiments required, the study employs the Taguchi L27 orthogonal array for setting up the
different combination of the respective control factors, each at three different levels. A standard sample
was developed which provides a benchmark for comparison of the total of twenty different dimensional,
geometrical, and surface features. Using the RSM and ANOVA analysis techniques, together with the help
of MINITAB software, we were able to identify, among the many thousands measurement data, the factors
that are most significant in affecting the quality and accuracy of these twenty representative dimensional
and form features, and surface roughness. The analysis results also suggest the best setting of these control
factors for each individual feature. For example, to build a square (or rectangular) hole vertically, a low
value of resultant overcure (say, 0.001 inches) and medium layer thickness (say, 0.009 inches) must be
used to effectively reduce the dimensional error caused by the extra overcure at the down facing layer, and
to provide adequate support so that the sagging problems can be eliminated. Aiming at producing the best
overall quality parts, the present investigation also proposes an optimal setup of the build parameters for
building a general part consisting of a mixture of the various features. Finally, the respective total laser
scan time and the corresponding total recoating time were also examined separately for each of the 27 cases
studied. It is concluded that the suggested optimal build condition corresponds to the least amount of laser
scan time, although the total recoating time may increase due to the smaller layer thickness used. It is noted
“Parametric Process Optimization to Improve the Accuracy of Rapid Prototyped Stereolithography Parts,” Jack Zhou, Dan Herscovici & Calvin Chen, International Journal of Machine Tools and Manufacture, No.40, 1-17,1999
22
that, although the conclusions derived from the present investigation are all based on the streolithography
parts made from the SLA 250 rapid prototyping machine, the same experimental setup and analysis
techniques can be readily applied to different RP technologies, and the corresponding best setting of the
various control parameters can be obtained accordingly. In this study we mainly considered the main
control factor’s effects on 20 general geometry, dimension and surface features. Some other design and
manufacturing features such as overhangs and thin shells were not considered. These may not respond in
the same way as the features identified. This would be worth in our future study.
REFERENCES CITED
[1] Brown, R., Lightman, A., and Wohlers, T., “Need for Expanding the Development and Refinement of
Rapid Prototyping Technologies,” Newsletter, RPA of SME, Dec., 1994.
[2] Jacobs, P., Rapid Prototyping & Manufacturing: Fundamentals of Stereolithography, Published by
SME, 1992
[3] Jacobs, P., Stereolithography and Other RP&M Technologies, Published by SME, 1996
[4] Chen, C. C., and Sullivan, P., "Solving the Mystery-The Problem of Z-Height Inaccuracy of the SLA
Parts", Proceedings of the Sixth International Conference on Rapid Prototyping, Dayton, Ohio, 1995,
pp.153-174.
[5] Gargiulo, E., “Stereolithography Accuracy: A User Study”, Proceedings of Stereolithography Users
Group Meeting, San Francisco, 1992
[6] Vuyyuru, P., Kirschman, C. F. and Fadel, G., A NURBS-Based Approach for Rapid Product
Realization, Proceedings of the Fifth International Conference on rapid Prototyping, Dayton, OH, 1994.
[7] Schaub, D.A. and Montgomery, D. C., “Using Experimental Design to Optimize the Stereolithography
Process,” Quality Engineering, 1997, Vol. 9, No.4, pp. 575-585.
“Parametric Process Optimization to Improve the Accuracy of Rapid Prototyped Stereolithography Parts,” Jack Zhou, Dan Herscovici & Calvin Chen, International Journal of Machine Tools and Manufacture, No.40, 1-17,1999
23
[8] Jayanthi, S., Keef, M., and Gargiulo, E., “Studies in Stereolithography: Influence of Process
Parameters on Curl Distortion in PhotoPolymer Models,” 5th Solid Freeform Fabrication Symposium,
Austin, Texas, 1995.
[9] Chen, C. C., and Sullivan, P., "Predicting Total Build Time and the Resultant Cure Depth of the 3D
Stereolithography Process", Rapid Prototyping Journal, MCB University Press, England, Vol. 2, Issue 4,
1996, pp.27-40.
[10] Ross, P., Taguchi Techniques for Quality Engineering, second edition, McGraw Hill 1996
[11] Peace, G. S., Taguchi Method, Addison-Wesley, 1993
[12] Taguchi, G., Quality Engineering Series, Volume 4, Taguchi Methods, Design of Experiments, ASI
Press 1993
[13] Roy, R., A Primer on the Taguchi Method, Van Nostrand Reinhold 1990
[14] Myers, R. H. and Montgomery D. C., Response Surface Methodology, John Wiley & Sons, 1995
[15] Reeves, P.E., Dickens P. M., Davey N., and Cobb R. C., “Surface roughness of Stereolithography
models using an Alternative Build strategy,” 6th European Conference on Rapid Prototyping &
Manufacturing, Nottingham, UK, July 1997, pp. 85-94.