Optimization of ultrasound and microbubbles targeted gene delivery to cultured primary endothelial...
120
Ultrasound and Microbubble Targeted Delivery Exploring the mechanism and its therapeutic potential BernadetMeijering
Transcript of Optimization of ultrasound and microbubbles targeted gene delivery to cultured primary endothelial...

Ultrasound and Microbubble Targeted Delivery
Exploring the mechanism and its therapeutic potential
�
�
�
�
�
�
�
�
�
�
�
�
�
�
�
�
�
�
Bernadet�Meijering�

Publication�of�this�thesis�was�supported�by�generous�contributions�from:��
Graduate�school�for�Drug�Exploration�(GUIDE)�Interuniversity�Cardiology�Institute�Netherlands�Rijksuniversiteit�Groningen��
�
�
�
�
�
�
�
�
�
�
�
�
�
�
�
�
�
�
�
ISBN:�978�90�367�4024�1�
©�Copyright�2009�B.�Meijering�All�rights�reserved.�No�part�of�this�publication�may�be�reproduced,�or�transmitted�in�any�form�or�by�any�means,�without�permission�of�the�author.�
Cover�design:�Noenie�Printed�by:�Ipskamp�PrintPartners�Enschede,�The�Netherlands�

RIJKSUNIVERSITEIT�GRONINGEN�
�
�
Ultrasound and Microbubble Targeted Delivery
Exploring the mechanism and its therapeutic potential
�
Proefschrift�
�
ter�verkrijging�van�het�doctoraat�in�de��Medische�Wetenschappen�
aan�de�Rijksuniversiteit�Groningen�op�gezag�van�de��
Rector�Magnificus,�dr.�F.�Zwarts,�in�het�openbaar�te�verdedigen�op�
maandag�9�november�2009�om�13:15�uur�
���
�
�
�door�
�
�
�
Bernadet�Dagmar�Mari�lle�Meijering�geboren�op�5�augustus�1979�
te�Emmen�

Promotores:�� � � � � Prof.�dr.�R.H.�Henning�� � � � � � Prof.�dr.�W.H.�van�Gilst��Copromotor:� � � � � Dr.�L.E.�Deelman��Beoordelingscommissie:� � � Prof.�dr.�D.�Hoekstra�� � � � � � Prof.�dr.�ir.��N.�de�Jong�
Dr.�J.J.�Rychak�� � � � � � �� � � ������������������������������������ISBN:�978�90�367�4024�1�

Paranimfen:� � � � � Roelien�Meijering�� � � � � � Ingrid�Alsema��
�
�
�
�
�
�
�
�
�
�
�
�
�
�
�
�
�
�
�
�
�


Table of Contents
Chapter 1 Introduction 9
Chapter 2 Optimization of ultrasound and microbubbles targeted gene delivery to cultured primary endothelial cells. J Drug Target. 2007 Dec;15(10):664-71. 17
Chapter 3 Ultrasound and microbubble mediated gene therapy: effectiveness of siRNA versus plasmid DNA delivery 31
Chapter 4 Ultrasound and microbubble-targeted delivery of macro-molecules is regulated by induction of endocytosis and pore formation.Circ Res. 2009 Mar 13;104(5):679-87 47
Chapter 5 TGF-ß inhibits Ang II-induced MAPK p44/42 signaling in vascular smooth muscle cells by Ang II type 1 receptor downregulation.J Vasc Res. 2009 Feb 10;46(5):459-468. 69
Chapter 6 Antibody mediated targeting of microbubbles to the vasculature of diabetic kidneys. 87
Chapter 7 Summary, discussion and future directions. 103
Nederlandse samenvatting 111
Dankwoord 115
Curriculum vitae 119


Chapter 1
General introduction and aim of the thesis

Chapter 1
10
The vascular system, disease and treatment
The vascular system of the human body is an extensive network of arteries, capillaries and
veins through which blood is pumped by the heart. It performs an essential role in
homeostatic regulation of the human body, transporting oxygen, nutrients and cellular and
metabolic waste1. The integrity of the endothelium, a single layer of endothelial cells
covering the vascular lumen, is fundamental for the homeostasis of the vascular system. The
endothelium plays a pivotal role in regulation of coagulation, blood pressure, immunological
and inflammatory processes and vascular remodeling through the production of autocrine,
paracrine and endocrine compounds2-5 The pathogenesis of various diseases including
hypertension, atherosclerosis, arterial restenosis, diabetes mellitus and nephropathy has
been associated with dysfunction of the endothelium. Endothelial dysfunction is associated
with a decreased synthesis of vascular nitric oxide (NO), and an altered responsiveness of
the blood vessel to important hormones, including angiotensin II (AngII) and transforming
growth factor beta (TGF-β)6-9.
NO induces vasodilation and possesses anti-inflammatory, anti-coagulant, anti-proliferative
and anti-inflammatory properties10, 11and counteracts the vascular actions of endogenous
Ang II12. Ang II induces vasoconstriction by acting on the vascular smooth muscle cells and
is critically involved in the regulation of blood pressure. In addition to its hemodynamic
actions, Ang II promotes cell proliferation and migration as well as extracellular matrix
deposition in the vascular wall. Therefore it is not surprising that Ang II is a key mediator of
vascular remodeling, which is a close interplay of changes between vascular tone and
structure.
The effects of the cytokine transforming growth factor beta (TGF-β) on the cardiovascular
system are ambiguous. On the one hand, TGF-β acts as an anti-atherogenic and plaque-
stabilizing factor13, but on the other hand it has been demonstrated that TGF-β participates in the development of vascular fibrosis and vascular remodeling14. TGF-β affects all cell
types of the vessel and regulates various aspects of cellular homeostasis, including
proliferation, differentiation, migration and cell death. In addition to direct signaling via the
TGF-β receptors and downstream effectors (smads), crosstalk of TGF-β signaling with other major signaling pathways such as the mitogen-activated protein kinases (MAPKs) is involved
in the final cellular response to TGF-β. This characteristic of TGF-β signaling is probably
responsible for the pleiotropic and multifunctional nature of its cellular responses, which
makes it strongly dependent on contextual factors, such as ligand concentration, cell type,
differentiation status and presence of other hormones15-17.
Given their key function in vascular homeostasis, established and experimental therapeutic
approaches in cardiovascular disease target NO, angiotensin II and TGF-β signaling.
Nitroglycerin, which is believed to use the same signaling pathway as NO, is the most
commonly used anti-ischemic drug in the last century. Unfortunately, upon chronic treatment
with nitroglycerin its vasodilatory effect diminishes rapidly18. Furthermore, to treat
hypertension, myocardial infarction, stroke, renal disease and heart failure, interference with
the angiotensin II signaling cascade through inhibition of its production (ACE inhibitors) or

General introduction and aim of the thesis
11
blockade of the Angiotensin II type I receptor (angiotensin receptor blockers: ARB) represent
the most effective therapeutic strategies19. However, treatment with ACE inhibitors as well as
ARBs is only effective in a part of the patient population20, 21.
Besides NO and Angiotensin II, TGF-β signaling may be a potential target of therapy. Currently, several strategies are under investigation, including scavenging of the TGF-β ligand by TGF-β1 neutralizing antibodies, or selective inhibition of intracellular signaling
transduction by targeted overexpression of either Smad7 or dominant-negative receptor
mutants15, 22. However, as the action of TGF-β is tissue specific and dependent of the stage of the disease, interference with the TGF-β pathway must be well controlled in a spatio-
temporal manner15, 16.
Gene Therapy
The emerging field of gene therapy is recognized as a potential additional therapy in
cardiovascular disease, particular in cases in which patients are resistant to current
approaches23, 24. The vascular system, especially the endothelium, is an attractive target for
gene therapy because of its accessibility, its importance in vascular (patho)physiology and
its involvement in a wide range of diseases. Gene therapy comprises of the cellular delivery
of oligonucleotides (DNA or RNA) in an attempt to modify the expression of specific gene(s),
or to correct abnormal genes by providing copies of the healthy gene. Modification of gene
expression may constitute of upregulation by administration of DNA encoding for the gene of
choice or downregulation by interference at the post-transcriptional level employing gene
specific synthetic antisense oligonucleotides, such as oligodeoxynucleotides (ODNs) or
siRNA.
More recently, microRNAs, which are endogenous antisense oligonucleotides, are
discovered to play an important role in the regulation of gene expression in normal as well as
pathological conditions. To date, several studies have indicated that specific microRNAs or
mutation in the target mRNA sequence play a role in vascular inflammation and disease 5, 25.
These and future identification of the mechanism and targets of miRNAs may offer new gene
therapeutic strategies to treat vascular diseases.
Thus far, more than 1300 human gene therapeutic trials have been performed worldwide.
However, gene therapy has still not been approved for regular clinical use. In about 70% of
the clinical trials, recombinant viruses have been used as a gene delivery vector26. As
viruses have the innate ability to infect host cells, they are efficient vectors for gene delivery.
However, the drawbacks of viral gene transfer are the possible immunogenic, inflammatory,
cytotoxic and in the case of retroviruses, oncogenic responses27,28. Furthermore, the costs of
large-scale production of such viruses are generally high29. For these reasons, non-viral
based delivery systems for DNA or RNA have received considerable attention. A wide
variety of non viral methods are developed ranging from intramuscular injection of plasmid
DNA to specified systems that are devised to enhance cellular delivery like liposomes and
polyplexes. These non-viral vectors have the potential to be relatively safe, due to their low
inflammatory, non-infectious properties and may be produced at a large scale with relatively

Chapter 1
12
low costs. However, the main drawback of non-viral vectors is their limited efficiency,
restricting their clinical use30.
To accomplish efficient delivery of oligonucleotides to the vascular wall, several biological
barriers have to be overcome. First, oligonucleotides need to be transported to the
endothelium. In the bloodstream the (delivery systems with the) oligonucleotides will
encounter degrading enzymes, such as DNAses and RNAses, and immune cells. Both may
result in the degradation of the oligonucleotides prior to reaching the endothelium.
Furthermore regarding safety issues, since the delivery system encounters immune cells, it
needs to be low immunogenic31. The first physical barrier comprises of the plasma
membrane, which needs to be crossed to enter the cytosol. The entrance process may be
facilitated by fusion of the delivery system to the plasma membrane, or by pore formation
and/or endocytosis. When entering the cell via endocytosis, the delivery system also needs
to facilitate endosomal escape in order to deliver the oligonucleotides in the cytosol31.
Finally, in many approaches the delivered genes have to migrate to the nucleus and
overcome the barrier of the nuclear envelope to result in expression of the transgene30, 32-34.
Ultrasound and Microbubble Targeted Therapy
Microbubbles were originally developed as ultrasound (US) contrast agents and are
administered intravenously to the systemic circulation to enhance the scattering of blood in
echocardiography. Microbubbles consist of a gas core stabilized with an encapsulation, and
range from 1 to 10 �m in diameter35. Nowadays, an important aspect of research is the
therapeutic application of US and encapsulated microbubbles in gene therapy and targeted
delivery of drugs, due to their low toxicity and immunogenicity, local application and cost-
effectiveness. Moreover, molecular imaging and therapeutic compound delivery may be
performed simultaneously, in an efficient way36.
To date, US and microbubble mediated gene therapy targeting the vascular system has
already been successfully applied in several experimental disease models to promote
angiogenesis37-39, attenuate vascular sclerosis40, reduce neointima formation41-43 and
augment endothelial function44. It is of importance to note that virtually all of these studies,
which used transgene expression instead of gene silencing, used plasmids encoding potent
paracrine factors, limiting the need for a highly efficient vector able to transfect the majority
of all target cells.
To fully exploit the therapeutic possibilities of ultrasound and microbubble mediated
therapy it is necessary to understand all facets of how ultrasound and microbubble mediated
drug and gene therapy is facilitated. Despite studies demonstrating that ultrasound and
microbubble targeted gene delivery may be a promising technique for gene therapy, there is
limited data on the parameters of UMTD of oligonucleotides that influence transfection
efficiency in endothelial cells. Furthermore the exact mechanism of cellular uptake of
therapeutics after ultrasound and microbubble targeted delivery (UMTD) is also not fully
understood, though one of the principal mechanisms is thought to be induction of cell
membrane pores45, 46. To modulate vascular function through ultrasound and microbubble

General introduction and aim of the thesis
13
targeted gene therapy both plasmids encoding transgenes or siRNA’s mediating gene silencing may be used. Although siRNA and plasmid DNA are both oligonucleotides, they
differ substantially in size (~15 kDa vs ~3500 kDa), which may strongly influence the rate of
diffusion. Furthermore, oligonucleotides for gene silencing are effective in the cytoplasm
whereas plasmid DNA needs to be transported to the nucleus for transcription. These
characteristics may influence the efficacy of ultrasound and microbubble targeted gene
therapy, however a direct comparison between these two strategies has not been made.
Intravenous injection of microbubbles is the most convenient route of administration in
vascular ultrasound and microbubble mediated therapy. However when the microbubbles
disperse over the total blood volume, the concentration of microbubbles drops dramatically.
Furthermore, microbubbles and drugs or nucleotides quickly separate after intravenous
injection if both are not directly coupled. For this reason, most in-vivo studies relied on
microbubble infusion directly upstream of the target organ37,47,48. The development of organ-
or cell-targeted microbubbles that bear drugs or nucleotides, will not only help to identify the
diseased target area and locally increase the concentration of the therapeutics, but may also
decrease side effects and protect the therapeutics from degradation.
Aim of the thesis
The aim of the first part of this thesis was to determine the optimal parameters of UMTGD
and to determine if induction of gene expression or gene silencing is the most efficient
method of modifying gene expression with UMTD. Therefore in chapter 2, ultrasound and
microbubble targeted gene delivery parameters were systematically changed and its effect
on gene delivery to endothelial cells was determined. In chapter 3 we studied the
modulation of the expression of the moderately expressed gene glyceraldehyde-3-
phosphate dehydrogenase (GAPDH) in cultured endothelial cells after UMTD with plasmid
encoding transgenes (to increase its expression) or siRNA (to reduce its expression). The
aim of chapter 4 was to establish the mechanism(s) of UMTD. For this, we studied uptake of
dextran molecules ranging in size of 4-500 kDa by endothelial cells after exposure to
ultrasound and microbubbles. The aim of the second part of the thesis was to identify
possible targets of intervention and to explore novel administration techniques in vivo. In
chapter 5, we studied the interaction between TGF-β1 and AngII signaling in vascular smooth muscle cells. Finally the possibility of targeting microbubbles to TGF-β expressing cells was explored (chapter 6).

Chapter 1
14
References
(1) Pugsley MK, Tabrizchi R. The vascular system. An overview of structure and function. J
Pharmacol Toxicol Methods 2000 September;44(2):333-40.
(2) Brewster LP, Brey EM, Greisler HP. Cardiovascular gene delivery: The good road is awaiting.
Adv Drug Deliv Rev 2006 July 7;58(4):604-29.
(3) Esper RJ, Nordaby RA, Vilarino JO, Paragano A, Cacharron JL, Machado RA. Endothelial
dysfunction: a comprehensive appraisal. Cardiovasc Diabetol 2006 February 23;5:4.:4.
(4) Cohen JD. Overview of physiology, vascular biology, and mechanisms of hypertension. J
Manag Care Pharm 2007 June;13(5 Suppl):S6-S8.
(5) Urbich C, Kuehbacher A, Dimmeler S. Role of microRNAs in vascular diseases, inflammation,
and angiogenesis. Cardiovasc Res 2008 September 1;79(4):581-8.
(6) Davignon J, Ganz P. Role of endothelial dysfunction in atherosclerosis. Circulation 2004 June
15;109(23 Suppl 1):III27-III32.
(7) Esmon CT. The interactions between inflammation and coagulation. Br J Haematol 2005
November;131(4):417-30.
(8) Feletou M, Vanhoutte PM. Endothelial dysfunction: a multifaceted disorder (The Wiggers
Award Lecture). Am J Physiol Heart Circ Physiol 2006 September;291(3):H985-1002.
(9) Balakumar P, Chakkarwar VA, Krishan P, Singh M. Vascular endothelial dysfunction: a tug of
war in diabetic nephropathy? Biomed Pharmacother 2009 March;63(3):171-9.
(10) Naseem KM. The role of nitric oxide in cardiovascular diseases. Mol Aspects Med 2005
February;26(1-2):33-65.
(11) Desjardins F, Balligand JL. Nitric oxide-dependent endothelial function and cardiovascular
disease. Acta Clin Belg 2006 November;61(6):326-34.
(12) Toda N, Ayajiki K, Okamura T. Interaction of endothelial nitric oxide and angiotensin in the
circulation. Pharmacol Rev 2007 March;59(1):54-87.
(13) Grainger DJ. TGF-beta and atherosclerosis in man. Cardiovasc Res 2007 May 1;74(2):213-
22.
(14) Redondo S, Santos-Gallego CG, Tejerina T. TGF-beta1: a novel target for cardiovascular
pharmacology. Cytokine Growth Factor Rev 2007 June;18(3-4):279-86.
(15) Javelaud D, Mauviel A. Mammalian transforming growth factor-betas: Smad signaling and
physio-pathological roles. Int J Biochem Cell Biol 2004 July;36(7):1161-5.
(16) Dabek J, Kulach A, Monastyrska-Cup B, Gasior Z. Transforming growth factor beta and
cardiovascular diseases: the other facet of the 'protective cytokine'. Pharmacol Rep 2006
November;58(6):799-805.
(17) Clarke DC, Liu X. Decoding the quantitative nature of TGF-beta/Smad signaling. Trends Cell
Biol 2008 September;18(9):430-42.
(18) Munzel T, Daiber A, Mulsch A. Explaining the phenomenon of nitrate tolerance. Circ Res
2005 September 30;97(7):618-28.
(19) Bommer WJ. Use of angiotensin-converting enzyme inhibitor/angiotensin II receptor blocker
therapy to reduce cardiovascular events in high-risk patients: Part 1. Prev Cardiol
2008;11(3):148-54.
(20) Heeg JE, de Jong PE, van der Hem GK, de ZD. Efficacy and variability of the antiproteinuric
effect of ACE inhibition by lisinopril. Kidney Int 1989 August;36(2):272-9.

General introduction and aim of the thesis
15
(21) Mellen PB, Herrington DM. Pharmacogenomics of blood pressure response to
antihypertensive treatment. J Hypertens 2005 July;23(7):1311-25.
(22) Varga J, Pasche B. Antitransforming growth factor-beta therapy in fibrosis: recent progress
and implications for systemic sclerosis. Curr Opin Rheumatol 2008 November;20(6):720-8.
(23) Isner JM. Myocardial gene therapy. Nature 2002 January 10;415(6868):234-9.
(24) Gaffney MM, Hynes SO, Barry F, O'Brien T. Cardiovascular gene therapy: current status and
therapeutic potential. Br J Pharmacol 2007 September;152(2):175-88.
(25) Li M, Marin-Muller C, Bharadwaj U, Chow KH, Yao Q, Chen C. MicroRNAs: Control and Loss
of Control in Human Physiology and Disease. World J Surg 2009 April;33(4):667-84.
(26) Edelstein ML, Abedi MR, Wixon J. Gene therapy clinical trials worldwide to 2007--an update.
J Gene Med 2007 October;9(10):833-42.
(27) Hollon T. Researchers and regulators reflect on first gene therapy death. Nat Med 2000
January;6(1):6.
(28) Hacein-Bey-Abina S, Von KC, Schmidt M, McCormack MP, Wulffraat N, Leboulch P, Lim A,
Osborne CS, Pawliuk R, Morillon E, Sorensen R, Forster A, Fraser P, Cohen JI, de Saint BG,
Alexander I, Wintergerst U, Frebourg T, Aurias A, Stoppa-Lyonnet D, Romana S, Radford-
Weiss I, Gross F, Valensi F, Delabesse E, Macintyre E, Sigaux F, Soulier J, Leiva LE, Wissler
M, Prinz C, Rabbitts TH, Le DF, Fischer A, Cavazzana-Calvo M. LMO2-associated clonal T
cell proliferation in two patients after gene therapy for SCID-X1. Science 2003 October
17;302(5644):415-9.
(29) Boulaiz H, Marchal JA, Prados J, Melguizo C, Aranega A. Non-viral and viral vectors for gene
therapy. Cell Mol Biol (Noisy -le-grand) 2005 September 2;51(1):3-22.
(30) Glover DJ, Lipps HJ, Jans DA. Towards safe, non-viral therapeutic gene expression in
humans. Nat Rev Genet 2005 April;6(4):299-310.
(31) Pouton CW, Seymour LW. Key issues in non-viral gene delivery. Adv Drug Deliv Rev 2001
March 1;46(1-3):187-203.
(32) Kaneda Y. Gene therapy: a battle against biological barriers. Curr Mol Med 2001
September;1(4):493-9.
(33) Li S, Ma Z. Nonviral gene therapy. Curr Gene Ther 2001 July;1(2):201-26.
(34) Kodama K, Katayama Y, Shoji Y, Nakashima H. The features and shortcomings for gene
delivery of current non-viral carriers. Curr Med Chem 2006;13(18):2155-61.
(35) Dijkmans PA, Juffermans LJ, Musters RJ, van WA, ten Cate FJ, van GW, Visser CA, de JN,
Kamp O. Microbubbles and ultrasound: from diagnosis to therapy. Eur J Echocardiogr 2004
August;5(4):245-56.
(36) Schneider M. Molecular imaging and ultrasound-assisted drug delivery. J Endourol 2008
April;22(4):795-802.
(37) Kondo I, Ohmori K, Oshita A, Takeuchi H, Fuke S, Shinomiya K, Noma T, Namba T, Kohno
M. Treatment of acute myocardial infarction by hepatocyte growth factor gene transfer: the
first demonstration of myocardial transfer of a "functional" gene using ultrasonic microbubble
destruction. J Am Coll Cardiol 2004 August 4;44(3):644-53.
(38) Zhigang W, Zhiyu L, Haitao R, Hong R, Qunxia Z, Ailong H, Qi L, Chunjing Z, Hailin T, Lin G,
Mingli P, Shiyu P. Ultrasound-mediated microbubble destruction enhances VEGF gene
delivery to the infarcted myocardium in rats. Clin Imaging 2004 November;28(6):395-8.

Chapter 1
16
(39) Korpanty G, Chen S, Shohet RV, Ding J, Yang B, Frenkel PA, Grayburn PA. Targeting of
VEGF-mediated angiogenesis to rat myocardium using ultrasonic destruction of
microbubbles. Gene Ther 2005 September;12(17):1305-12.
(40) Hou CC, Wang W, Huang XR, Fu P, Chen TH, Sheikh-Hamad D, Lan HY. Ultrasound-
microbubble-mediated gene transfer of inducible Smad7 blocks transforming growth factor-
beta signaling and fibrosis in rat remnant kidney. Am J Pathol 2005 March;166(3):761-71.
(41) Porter TR, Hiser WL, Kricsfeld D, Deligonul U, Xie F, Iversen P, Radio S. Inhibition of carotid
artery neointimal formation with intravenous microbubbles. Ultrasound Med Biol 2001
February;27(2):259-65.
(42) Taniyama Y, Tachibana K, Hiraoka K, Namba T, Yamasaki K, Hashiya N, Aoki M, Ogihara T,
Yasufumi K, Morishita R. Local delivery of plasmid DNA into rat carotid artery using
ultrasound. Circulation 2002 March 12;105(10):1233-9.
(43) Hashiya N, Aoki M, Tachibana K, Taniyama Y, Yamasaki K, Hiraoka K, Makino H, Yasufumi
K, Ogihara T, Morishita R. Local delivery of E2F decoy oligodeoxynucleotides using
ultrasound with microbubble agent (Optison) inhibits intimal hyperplasia after balloon injury in
rat carotid artery model. Biochem Biophys Res Commun 2004 April 30;317(2):508-14.
(44) Teupe C, Richter S, Fisslthaler B, Randriamboavonjy V, Ihling C, Fleming I, Busse R, Zeiher
AM, Dimmeler S. Vascular gene transfer of phosphomimetic endothelial nitric oxide synthase
(S1177D) using ultrasound-enhanced destruction of plasmid-loaded microbubbles improves
vasoreactivity. Circulation 2002 March 5;105(9):1104-9.
(45) Tachibana K, Uchida T, Ogawa K, Yamashita N, Tamura K. Induction of cell-membrane
porosity by ultrasound. Lancet 1999 April 24;353(9162):1409.
(46) van WA, Kooiman K, Emmer M, ten Cate FJ, Versluis M, de JN. Ultrasound microbubble
induced endothelial cell permeability. J Control Release 2006 November 28;116(2):e100-
e102.
(47) Bekeredjian R, Chen S, Frenkel PA, Grayburn PA, Shohet RV. Ultrasound-targeted
microbubble destruction can repeatedly direct highly specific plasmid expression to the heart.
Circulation 2003 August 26;108(8):1022-6.
(48) Lan HY, Mu W, Tomita N, Huang XR, Li JH, Zhu HJ, Morishita R, Johnson RJ. Inhibition of
renal fibrosis by gene transfer of inducible Smad7 using ultrasound-microbubble system in rat
UUO model. J Am Soc Nephrol 2003 June;14(6):1535-48.

Chapter 2
Optimization of ultrasound and microbubbles targeted
gene delivery to cultured primary endothelial cells
B.D.M. Meijering1-2, R.H. Henning1, W.H. van Gilst1-2, I. Gavrilović1, A. van Wamel2-3, L.E.
Deelman1-2
1Department of Clinical Pharmacology, Groningen Institute for Drug Exploration (GUIDE),
University Medical Center Groningen, University of Groningen, Groningen, the Netherlands 2Interuniversity Cardiology Institute of the Netherlands, Utrecht, the Netherlands 3Department of Biomedical Engineering, Thorax center, Erasmus MC, Rotterdam, the
Netherlands
J Drug Target. 2007 Dec;15(10):664-71.

Chapter 2
18
Abstract
Ultrasound and microbubbles targeted gene delivery (UMTGD) is a promising technique for
local gene delivery. As the endothelium is a primary target for systemic UMTGD this study
aimed at establishing the optimal parameters of UMTGD to primary endothelial cells. For
this, an in vitro ultrasound (US) setup was employed in which individual UMTGD parameters
were systematically optimized. The criteria for the final optimized protocol were 1) relative
high reporter gene expression levels, restricted to the ultrasound exposed area and 2)
induction of not more than 5% cell death. US frequency and timing of medium replacement
had a strong effect on UMTGD efficiency. Furthermore, ultrasound intensity, DNA
concentration and total duration of US all affected UMTGD efficiency. Optimal targeted gene
delivery to primary endothelial cells can be accomplished with Sonovue® microbubbles,
using 20 μg/ml plasmid DNA, a 1 MHz US exposure of Ispta 0.10 W/cm2 for 30 sec with immediate medium change after UMTGD. This optimized protocol resulted in both an
increase in the number of transfected cells (more than 3 fold) and increased levels of
transgene expression per cell (170%).
Introduction
Although gene therapy has been used in several clinical trials, it is still not approved for
regular clinical use. In about 70 % of the clinical trials, recombinant viruses have been used
as a gene delivery vector1. As viruses have the innate ability to infect host cells, they are
efficient vectors for gene delivery. However, the drawbacks of viral gene transfer are the
possible immunogenic, inflammatory, cytotoxic and in the case of retroviruses, oncogenic
responses2, 3. Furthermore, the costs of large-scale production of such viruses are generally
high 4. For these reasons, non-viral vectors have received considerable attention. These
non-viral vectors have the potential to be relatively safe, due to their low inflammatory, non-
infectious properties and may be produced at a large scale with relatively low costs.
However, the main drawback of non-viral vectors is their limited efficiency, limiting their
clinical usefulness5.
It has been demonstrated that ultrasound (US) and microbubbles targeted gene delivery
(UMTGD) is a promising non-viral vector for local gene delivery. UMTGD has several
advantageous properties; the method is relatively cheap, requires minimal invasive
procedures6, can be applied locally and repeatedly to tissue 7. Furthermore, microbubbles
are commercially available and are approved by the regulatory authorities for use as contrast
agent in US imaging. Clinical practice demonstrates that microbubbles are well tolerated as
severe adverse side effects are rarely observed8.
The ultimate goal for systemic UMTGD, would be to inject microbubbles coated with DNA
into the circulation and after subsequent exposure to US, confine gene delivery to the
tissues exposed to US. The endothelium is a primary target tissue for this systemic approach
of UMTGD and plays an important role in several vascular pathologies, including
hypertension, arteriosclerosis, arterial restenosis and thrombosis9-11. To date, UMTGD has
Optimization of ultrasound and microbubbles targeted gene delivery.
19
already been successfully applied in several experimental cardiovascular disease models to
promote angiogenesis12-14, reduce neointima formation15 and augment endothelial function16.
Despite these studies, there is limited data on the parameters of UMTGD that influence
transfection efficiency in endothelial cells. It has been shown for several cell lines, including
endothelial cells, that addition of microbubbles improves US mediated delivery of naked
DNA17, 18. Further the importance of several other UMTGD parameters were identified in
immortalized cell lines19-21. However, as primary endothelial cells and immortalized cells
differ substantially in physiology and ability to take up DNA 22, 23, specific UMTGD settings
may be required for primary endothelial cells. Therefore, the aim of this study is to determine
the optimal parameters for an maximal UMTGD to primary endothelial cells using
commercially available Sonovue® microbubbles. The hypothesis is that important UMTGD
parameters, i.e. ultrasound (US) intensity, total time of US exposure, US frequency, DNA
concentration and timing of medium change will affect transfection efficiency and cell viability
of the endothelial cells. Therefore, these parameters were systematically changed to
establish an optimal UMTGD protocol.
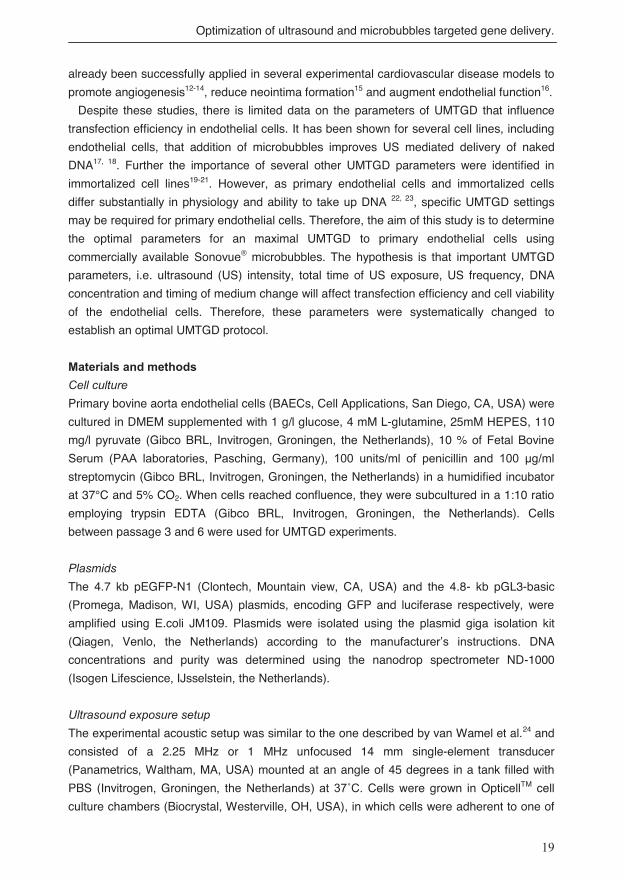
Materials and methods
Cell culture
Primary bovine aorta endothelial cells (BAECs, Cell Applications, San Diego, CA, USA) were
cultured in DMEM supplemented with 1 g/l glucose, 4 mM L-glutamine, 25mM HEPES, 110
mg/l pyruvate (Gibco BRL, Invitrogen, Groningen, the Netherlands), 10 % of Fetal Bovine
Serum (PAA laboratories, Pasching, Germany), 100 units/ml of penicillin and 100 μg/ml streptomycin (Gibco BRL, Invitrogen, Groningen, the Netherlands) in a humidified incubator
at 37°C and 5% CO2. When cells reached confluence, they were subcultured in a 1:10 ratio
employing trypsin EDTA (Gibco BRL, Invitrogen, Groningen, the Netherlands). Cells
between passage 3 and 6 were used for UMTGD experiments.
Plasmids
The 4.7 kb pEGFP-N1 (Clontech, Mountain view, CA, USA) and the 4.8- kb pGL3-basic
(Promega, Madison, WI, USA) plasmids, encoding GFP and luciferase respectively, were
amplified using E.coli JM109. Plasmids were isolated using the plasmid giga isolation kit
(Qiagen, Venlo, the Netherlands) according to the manufacturer’s instructions. DNA
concentrations and purity was determined using the nanodrop spectrometer ND-1000
(Isogen Lifescience, IJsselstein, the Netherlands).
Ultrasound exposure setup
The experimental acoustic setup was similar to the one described by van Wamel et al.24 and
consisted of a 2.25 MHz or 1 MHz unfocused 14 mm single-element transducer
(Panametrics, Waltham, MA, USA) mounted at an angle of 45 degrees in a tank filled with
PBS (Invitrogen, Groningen, the Netherlands) at 37˚C. Cells were grown in OpticellTM cell
culture chambers (Biocrystal, Westerville, OH, USA), in which cells were adherent to one of

Chapter 2
20
the two gas-permeable membranes enclosing a 10 ml chamber. OpticellTM chambers were
mounted in the experimental setup as shown in figure 1A. The membranes of the OpticellTM
caused no change in the characteristics of the US (data not shown). US was generated by a
computer controlled waveform generator (33220A, Agilent, Palto Alto, CA, USA) and
amplified by a linear power amplifier (150A100B, Amplifier Research, Bothell, WA, USA).
The amplified signal was monitored by a synchronized digital oscilloscope (GOULD DSO
465, Valley View, OH, USA). The peak to peak and peak negative acoustic pressure
generated at the region-of-interest were measured with a calibrated hydrophone (PVDFZ44-
0400, Specialty Engineering Associates, Soquel, CA, USA). The peak negative acoustic
pressure was 0.33 MPa for the 2.25 MHz transducer and 0.22 MPa for the 1 MHz
transducer.
Preparation of Sonovue® microbubbles / DNA suspension
Sonovue® microbubble contrast agent (Bracco, High Wycombe, UK) was reconstituted in 5
ml of saline solution, according to manufacturer’s protocol, resulting is a solution containing
2· 108 – 5 · 108 microbubbles/ml. For the transfection of one OpticellTM, 125 μl of Sonovue®
microbubble suspension was transferred to a new vial and 100 μg pGL3 basic and 100 μg of pEGFP-n1 was added, resulting in a total volume of approximately 250 μl. After thorough
mixing, the mixture was incubated for 5 minutes at room temperature, before being injected
into the OpticellsTM.
Opticell
US beam
US transducer
A
number of cycles
Pulse PRP = 50 ms
B
duration of US
Figure 1: Experimental setup and US parameters. A. Diagram showing experimental US setup.
An unfocused 14 mm single-element US transducer (1MHz or 2.25 MHz) was mounted at an angle of
45 degrees in a tank filled with PBS. Endothelial cells were cultured in OpticellTM cell culture
chambers. B. Diagram showing the US protocol used to transfect endothelial cells. PRP = pulse
repetition period is the time from the beginning of a pulse to the beginning of the next pulse.

Optimization of ultrasound and microbubbles targeted gene delivery.
21
Initial UMTGD protocol
Based on literature and pilot experiments the following initial protocol was established. One
day before gene delivery, cells were seeded at 33% confluence in OpticellTM cell culture
chambers. Prior to US exposure, culture medium was replaced with 10 ml of medium without
fetal bovine serum and microbubbles and DNA suspension was added to the medium in the
OpticellsTM. The microbubbles were homogenously distributed throughout the medium.
OpticellTM chambers were subsequently placed horizontally to allow microbubbles to rise to
the surface of the cells and mounted in the experimental acoustic set up. Microbubbles and
cells were exposed to sinusoidal US waves with a frequency of 2.25 MHz with a pulse
repetition period (PRP) of 50 ms with 10 000 cycles per pulse for 120 seconds (figure 1B).
After US exposure, OpticellTM chambers were incubated in a humidified incubator at 37°C
and 5% CO2. Serum free medium was replaced with normal culture medium 16 hours after
US exposure. Twenty-four hours after US exposure, GFP expression and cell detachment
were assessed by fluorescent and phase-contrast microscopy. Subsequently, luciferase
activity was measured to quantify gene delivery efficiency.
Optimization protocol
The UMTGD parameters, ultrasound intensity (spatial peak temporal average intensity
(Ispta)), DNA concentration, timing of changing transfection medium for culture medium,
total time of ultrasound and frequency, were systematically changed. The most optimal
parameter setting, as determined by luciferase expression and cell detachment was carried
forward in the subsequent steps of the optimization. For obtaining an optimal UMTGD
protocol the following criteria were used: 1) Transfection should be mediated by US,
therefore transfection should only occur in the region exposed to the US. 2) Cell death,
determined by cell detachment, should be less than 5% in the final optimized protocol.
Cell detachment
The percentage of cell detachment was scored and ranked in a scale from 0 to 3. Score 0:
less than 5% cell detachment, score 1: between 5 and 10% detachment, score 2: between
10 and 30% detachment, score 3: more than 30% cell detachment. Cell detachment was
scored both inside and outside of the US exposed area to exclude potential culturing
artefacts and toxicity of the transfection medium.
Luciferase activity
Using a template, a square of 3.24 cm2 was cut from the OpticellTM membrane in the region
exposed to US. Similarly, a section of unexposed membrane was cut from the same
OpticellTM. Subsequently, the cells on the excised membranes were lysed with 125 μl luciferase assay lysis buffer. Luciferase activity was measured per 40 μl sample according to
the manufacturer’s instructions (Promega, Madison, WI, USA).

Chapter 2
22
Quantification of GFP expression
24 hours after UMTGD, five fields of 1.3 mm by 1.3 mm per OpticellTM were scanned in the
area exposed to US using confocal microscopy (LSM 410, Carl Zeiss, Germany). The
number of GFP positive cells per field and their intensity were determined with Image-Pro
plus, v 4.5 (Media Cybernetics, Silver Spring, MD, USA).
Microscopic observations of microbubbles during US exposure
The behaviour of the Sonovue® microbubbles was observed with a high speed CCD camera
(LCL-902K, Watec America Corp., Las Vegas, NV, USA) mounted on top of a inverted
microscope (Olympus, Zoeterwoude, the Netherlands) Recordings were made with 2000
frames per second
Statistics
Each transfection condition was evaluated in at least six-fold. Luciferase activity and
fluorescent intensity data are presented as mean±SEM. The Student’s t-test was used to
test differences between 2 groups, otherwise one way ANOVA with least squared
differences post hoc analysis was used or in case of differences in variances between
groups a Dunnett T3 post hoc analysis was used. Detachment scores and number of GFP
positive cells were presented as median±IQR (interquartile range) and compared with a
Kruskal-Wallis test followed by Mann-Whitney tests for individual group comparisons with a
Bonferroni's correction. A P-value lower than 0.05 was considered significant.
Results
Initial UMTGD protocol
UMTGD was evaluated with an initial protocol of sinusoidal US waves (peak negative
acoustic pressure of 0.33 MPa) with a frequency of 2.25 MHz in a pulse repetition period
(PRP) of 50 ms with 10 000 cycles per pulse for 120 seconds (figure 1B). After 24 hours,
fluorescent microscopy of GFP expression demonstrated that the initial UMTGD protocol
resulted in transfection of endothelial cells, which was restricted to cells exposed to US (data
not shown). These data were confirmed by quantification of luciferase activity, as cells
outside the US exposed area showed no significant luciferase activity (62.3 ± 2.8 relative
light units per second [RLU/sec]) compared to untreated control cells (69.2 ±2.3 RLU/sec).
Luciferase activity in the cells exposed to US was significantly increased to 273.0 ± 47.8
RLU/sec.Using the initial protocol, moderate to severe cell detachment was observed in the
US exposed area (detachment score: 2.0 ± 0.3). Cell detachment was negligible in the area
that was not exposed to US (detachment score: 0.0 ± 0.0.), indicating that the observed cell
detachment in the US exposed area is caused by exposure to US. To reduce the level of cell
detachment, we first aimed at reducing the US intensity, by reducing the number of cycles
per pulse.

Optimization of ultrasound and microbubbles targeted gene delivery.
23
Cycles per pulse
1.000 5.000 7.000 10.000
luci
fera
se a
ctiv
ity
(%)
0
50
100
150
200
250
300
350
DNA concentration (�g/ml)
4 8 14 20 40
luci
fera
se a
ctiv
ity
(%)
0
50
100
150
Medium replacement
0 hours 16 hours
luci
fera
se a
ctiv
ity
(%)
0
200
400
600
800
1000
1200
1400
1600
1800
Ultrasound frequency
1MHz 1 MHz 2.25 MHz
luci
fera
se a
ctiv
ity
(%)
0
200
400
600
800
1000
1200
1400
1600
1800
Duration of ultrasound exposure
5 sec 15 sec 30 sec 60 sec 120 sec
luci
fera
se a
ctiv
ity
(%)
0
50
100
150
200
250
300
350
Figure 2: Optimization of UMTGD to endothelial cells.
Individual UMTGD parameters were optimized in the following order: A) cycles per pulse, B) DNA
concentration, C) timing of medium change, D) total time of US exposure and E) US frequency. For
each round of experiments the most optimal parameter combination from the previous round, was
carried forward into the next experimental series. Asterisks show significant differences compared to
default setting of each experimental. Optimization started with a protocol of sinusoidal US waves
A B
C D
E

Chapter 2
24
(peak negative acoustic pressure of 0.33 MPa) with a frequency of 2.25 MHz in a pulse repetition
period (PRP) of 50 ms with 10000 cycles per pulse for 120 seconds, DNA concentration 20µg DNA/
ml. A. The use of 7000 cycles per pulse (Ispta 0.23 W/cm2) resulted in a significant increase in
luciferase activity compared to the default setting of 10 000 cycles per pulse (0.32 W/cm2) (p < 0.05).
B. The default DNA concentration of 20 μg/ml was more efficient than 4, 8 and 14 μg/ml of plasmid DNA (p < 0.05) C. Direct change of transfection medium for culture medium results in a better
efficiency over changing the medium after 16 hours (p < 0.001). D. Exposure of the cells to 30
seconds of ultrasound shows a significant increase in luciferase activity compared to the default
setting of 120 seconds of ultrasound exposure p < 0.05. E. The use of ultrasound with a frequency of
1 MHz, with an ultrasound intensity of Ispta 0.23 and 0.1 W/ cm2, resulted in a significant increase in
UMTGD efficiency over 2.25 MHz (Ispta 0.23 W/ cm2)
Ultrasound intensity
Varying the ultrasound intensity, by varying the number of cycles per pulse, in the initial
UMTGD protocol resulted in a 2.5 fold increase in transfection efficiency at 7000 cycles per
pulse (Ispta 0.23 W/cm2) over the initial protocol of 10 000 cycles per pulse (Ispta 0.32
W/cm2) (figure 2A). Cell detachment scores for 1000 (Ispta 0.03 W/ cm2), 5000 (Ispta 0.16
W/ cm2) and 7000 cycles per pulse (Ispta 0.23 W/cm2) were similar (1.0±0.0, 1.0±0.0 and
1.0±0.0, respectively), but were decreased compared to 10 000 cycles per pulse
(detachment score: 2.0 ± 0.3). For further optimization, 7000 cycles per pulse was carried
forward into the next experimental series.
DNA concentration
To study the effect of DNA concentration, we studied plasmid DNA concentrations from 4 to
40 μg/ml. As shown in figure 2B, decreasing the plasmid DNA concentration from the default 20 μg/ml resulted in reduced luciferase activities. Increasing the DNA concentration to 40
μg/ml did not result in a significant change in luciferase activity. Cell detachment scores for
the DNA concentrations of 4, 8, 14, 20 and 40 μg/ml were 0.0±0.0, 0.0±0.0, 1.0±0.5, 1.0±0.8,
3.0±0.0 respectively. A DNA concentration of 20 μg/ml was used in subsequent experiments.
Timing of replacement of transfection medium
In the experiments described above, cells were incubated with transfection medium for 16
hours after UMTGD. Transfection efficiency was increased by about 7.5 fold when the
transfection medium was replaced with culture medium immediately after UMTGD (figure
2C). This was accompanied by a significant decrease in cell detachment score from 1.0±0.8
to 0.0±0.0. Therefore, transfection medium was immediately replaced with normal culture
medium after US exposure in all subsequent experiments.

Optimization of ultrasound and microbubbles targeted gene delivery.
25
Total duration of US exposure
Further, the effect of the total duration of US exposure on UMTGD efficiency was studied
(figure 2D). Compared to the default of 120 seconds of US exposure, luciferase activity was
significantly increased to 175% using an US duration of 30 seconds. Detachment scores
were 0.0 ±0.0 for all durations. In the subsequent experiments, cells were exposed to 30
seconds US.
US frequency
The final parameter investigated was the effect of US frequency on UMTGD efficiency. For
this the US frequencies of 2.25 MHz was compared to 1 MHz, while keeping the US intensity
identical for both frequencies (Ispta 0.23 W/cm2). UMTGD with 1 MHz US was 2.5 fold more
efficient than US with a frequency of 2.25 MHz (figure 2E). However, large numbers of cells
detached from the membrane after 1 MHz US exposure (detachment score 2.0 ± 0.0)
whereas the cell detachment score for 2.25 MHz stimulation was 0.0 ± 0.0. Because of the
severe cell detachment with 1MHz US (Ispta 0.23 W/cm2), the number of cycles was
decreased from 7000 to 3111 cycles per pulse, resulting in lower US intensity (Ipsta 0.1
W/cm2) but identical duty factors for both frequencies. The protocol of 1 MHz US with 3111
cycles per pulse resulted in a cell detachment score of 0.0±0.0. Despite lower US intensity
(Ispta 0.10 W/cm2), UMTGD efficiency at 1 MHz was increased by 13-fold compared to 2.25
MHz.
Transfection efficiency and expression levels
Next we aimed at determining whether the increased UMTGD efficiency as measured by
luciferase expression, was caused by increased transgene expression per cell or whether
more cells were transfected. To study this, the number of GFP expressing cells per
microscopic field and the intensity of GFP expression per positive cell for both the initial
protocol and the optimized protocol were determined. The number of GFP expressing cells
increased from 6.0 ± 2.6 cells per field (area 1.7 mm2) for the initial protocol to 20.8 ± 6.8
cells per field, amounting to 5% of all cells, for the optimized protocol (p<0.001). Fluorescent
intensity increased from 100 ±10 arbitrary units per cell for the initial protocol to 177 ± 15
arbitrary units for the optimized protocol (p<0.001).
High speed recordings of microbubble behaviour
Furthermore, because the mechanism of transfection is thought to be linked to acoustic
bioeffects created by microbubbles when sonified, high speed recordings were taken to
monitor microbubble behavior during US exposure. These experiments showed that all
microbubbles disappeared or fused to clusters of larger stable macrobubbles immediately
after onset of US. All macrobubble clusters were subsequently pushed out of the area
exposed to US within 5 seconds. Furthermore, no formation of gas bubbles larger than 1 μm occurred by dissolved gas during negative pressure cycles of the acoustic waves (data not
shown).

Chapter 2
26
Discussion
This study demonstrates that targeted transfection of primary endothelial cells is possible
using UMTGD. Furthermore, all the parameters studied, ultrasound intensity, exposure time
and frequency of ultrasound, the DNA concentration and timing of medium change
significantly influenced UMTGD efficiency in endothelial cells. Optimal parameter settings
increased the total number of transfected cells as well as the expression levels of the
transgene per cell.
In all of our experiments, luciferase activity was restricted to the cells exposed to US.
Therefore our data demonstrate that specific targeting of UMTGD to endothelial cells is
possible using Sonovue® microbubbles. The observation that UMTGD is confined to the cells
in the US exposed area may be dependent on the type of microbubble used. A recent in vivo
study demonstrated that OptisonTM microbubbles effectively transfected mouse skeletal
muscle without US exposure, whereas transfection with Sonovue® microbubbles was
dependent on US exposure25. Obviously, this ability of OptisonTM to transfect cells without
US exposure would seriously affect the preferred local confinement of gene delivery to
tissues. Although these data were obtained by intramuscular injection of DNA and
microbubbles, it indicates that Sonovue® microbubbles may be more suitable for local
UMTGD following systemic administration.
Using our initial protocol, moderate to severe cell death was observed in the US exposed
area. Cell detachment was negligible in the area that was not exposed to US, indicating that
the observed cell detachment in the US exposed area is caused by exposure to US. To
reduce the level of cell detachment, we first aimed at reducing the US intensity, by reducing
the number of cycles per pulse. Reducing the number of cycles per pulse from 10000 to
7000, 5000 and 1000, resulted in decreased cell detachment, confirming that the observed
cell detachment in the US exposed area is caused by exposure to US. A significant increase
in UMTGD efficiency was observed only at 7000 cycles per pulse, indicating that a narrow
optimal intensity of US for UMTGD is present close to the US intensity causing severe cell
detachment. In contrast to our findings, Rahim et al.20 reported that duty factor does not
significantly affect UMTGD efficiency in CHO cells. However, Rahim et al.20 did not
investigate US intensities close to the levels causing severe cell detachment and therefore
the narrow optimum in US intensity may have been missed.
Similar to the optimal US intensity the optimal DNA concentration of 20 μg/ml was close to
the concentration causing severe cell detachment (40 μg/ml). In general, our and previous
studies19-21 demonstrate that relatively high DNA concentrations are needed for efficient
UMTGD. As only a small fraction of the DNA binds to the Sonovue® bubbles (data not
shown), UMTGD seems dependent on DNA that is dissolved in the transfection medium.
When injected into the circulation, the DNA and microbubbles would separate quickly.
Therefore, with Sonovue® microbubbles, systemic UMTGD will depend on a technique that
injects both microbubbles and DNA directly upstream of the target tissue.
In initial experiments, cells were left on transfection medium (without fetal bovine serum)
for 16 hours after UMTGD. Direct replacement of the transfection medium for culture

Optimization of ultrasound and microbubbles targeted gene delivery.
27
medium resulted in a 7.5 fold increase in transfection efficiency. This is likely due to a
reduction in cell death and enhanced transcription as a result of removal of residual
components in the transfection medium and/or addition of FCS. Moreover, the increase of
transfection by immediate change of medium following US exposure suggest that
transfection of endothelial cells by UMTGD is mainly accomplished during the US exposure.
This is an agreement with a study by van Wamel et al.26, who showed that the uptake of
dextrans of 10, 40 and 70 KDa after US exposure was accomplished within 60 seconds.
In this study optimal UMTGD efficiency was achieved with an US duration of 30 seconds.
Other studies indicate that the optimal duration of US exposure depend on the type of cell
studied. For MCF7 cells the optimum duration is between 1 and 2 minutes19, while for CHO
cells no clear optimum could be established 20. The exact mechanisms of UMTGD are still
not completely understood, but are thought to be linked to a bioeffect called sonoporation.
This process is defined as the transfer of extracellular molecules through transient pores in
the cell membrane which are created as a consequence of acoustic cavitation 27. Our results
showed a significant increase in UMTGD efficiency when cells are exposed to 30 sec of
ultrasound compared to 5 sec (p< 0.05), even though no microbubbles are existing anymore
in the area exposed to ultrasound within 5 sec. Consequently, our data suggest that in
addition to acoustic cavitation, other mechanisms are involved in increasing efficiency of
UMTGD by prolonged exposure to US. Recently, 18 suggested that the collapse of the
microbubbles destabilizes the cell membrane and that continued US enhances the
membrane destabilization, increasing the efficiency of UMTGD. Alternatively, 28 suggested
that gas bodies capable of cavitation still exist after destruction of microbubbles. However,
using high speed camera recordings, we could not support the latter hypothesis as we did
not detect any gasbubbles larger than 1 μm after 5 seconds of US exposure. A better
understanding of the mechanism(s) of UMTGD to endothelial cells may further improve
UMTGD efficiency and increase its potential for systemic UMTGD gene therapeutic use.
UMTGD with 1 MHz US was more efficient than US with a frequency of 2.25 MHz, although
cells detachement increased. Lowering the US energy for 1MHz US, further increased
UMTGD efficiency while decreasing cell detachment to acceptable levels. From this we
conclude that US of 1MHz is the optimal frequency for UMTGD to endothelial cells in our
experimental setup. However, the most efficient frequency for UMTGD may depend on the
type of microbubble being used. Although we found more efficient UMTGD delivery with
Sonovue® using US of 1 MHz over 2.25 MHz, Larina et al.19 demonstrated improved
UMTGD efficiency with 3 MHz US over 1 MHz US using OptisonTM. These differences may
originate from factors that influence the cavitational behavior of microbubbles, such as the
composition of the microbubble shell and bubble size distribution29, 30. Furthermore Larina et
al.19 also observed more cell damage using 1 MHz US than for 3 MHz over a wide range of
US intensities. Possibly the non-cavitational bioeffects of US may be involved in increased
cell damage using 1MHz US.
In summary, optimal targeted gene delivery of endothelial cells can be accomplished using
Sonovue® microbubbles with 20 μg/ml of plasmid DNA and ultrasound exposure (Ispta 0.10

Chapter 2
28
W/cm2) with a frequency of 1MHz for 30 sec and direct medium change after UMTGD. In
this study discrepancies were noted compared to other optimization studies with respect to
the influence of specific parameters on UMTGD efficiency, including ultrasound intensity,
duration and frequency. This may be explained by the variability between experimental set-
ups between labs. However, a previous study19 demonstrated that UMTGD vary
substantially between different cancer cell lines using one experimental setup, which was
likely caused by differences in physiology between the cancer cell lines. Therefore, it is more
conceivable that differences in physiology and uptake of DNA between endothelial cells and
immortalized cell lines may play an important role in the differences found in the influence of
specific parameters on UMTGD efficiency.

Optimization of ultrasound and microbubbles targeted gene delivery.
29
References
(1) Edelstein ML, Abedi MR, Wixon J, Edelstein RM. Gene therapy clinical trials worldwide 1989-
2004-an overview. J Gene Med 2004 June;6(6):597-602.
(2) Hacein-Bey-Abina S, von KC, Schmidt M, Le DF, Wulffraat N, McIntyre E, Radford I, Villeval
JL, Fraser CC, Cavazzana-Calvo M, Fischer A. A serious adverse event after successful
gene therapy for X-linked severe combined immunodeficiency. N Engl J Med 2003 January
16;348(3):255-6.
(3) Hollon T. Researchers and regulators reflect on first gene therapy death. Nat Med 2000
January;6(1):6.
(4) Boulaiz H, Marchal JA, Prados J, Melguizo C, Aranega A. Non-viral and viral vectors for gene
therapy. Cell Mol Biol (Noisy -le-grand) 2005 September 2;51(1):3-22.
(5) Glover DJ, Lipps HJ, Jans DA. Towards safe, non-viral therapeutic gene expression in
humans. Nat Rev Genet 2005 April;6(4):299-310.
(6) Bekeredjian R, Grayburn PA, Shohet RV. Use of ultrasound contrast agents for gene or drug
delivery in cardiovascular medicine. J Am Coll Cardiol 2005 February 1;45(3):329-35.
(7) Bekeredjian R, Chen S, Frenkel PA, Grayburn PA, Shohet RV. Ultrasound-targeted
microbubble destruction can repeatedly direct highly specific plasmid expression to the heart.
Circulation 2003 August 26;108(8):1022-6.
(8) Jakobsen JA, Oyen R, Thomsen HS, Morcos SK. Safety of ultrasound contrast agents. Eur
Radiol 2005 May;15(5):941-5.
(9) Davignon J, Ganz P. Role of endothelial dysfunction in atherosclerosis. Circulation 2004 June
15;109(23 Suppl 1):III27-III32.
(10) Esmon CT. The interactions between inflammation and coagulation. Br J Haematol 2005
November;131(4):417-30.
(11) Feletou M, Vanhoutte PM. Endothelial dysfunction: a multifaceted disorder (The Wiggers
Award Lecture). Am J Physiol Heart Circ Physiol 2006 September;291(3):H985-1002.
(12) Kondo I, Ohmori K, Oshita A, Takeuchi H, Fuke S, Shinomiya K, Noma T, Namba T, Kohno
M. Treatment of acute myocardial infarction by hepatocyte growth factor gene transfer: the
first demonstration of myocardial transfer of a "functional" gene using ultrasonic microbubble
destruction. J Am Coll Cardiol 2004 August 4;44(3):644-53.
(13) Korpanty G, Chen S, Shohet RV, Ding J, Yang B, Frenkel PA, Grayburn PA. Targeting of
VEGF-mediated angiogenesis to rat myocardium using ultrasonic destruction of
microbubbles. Gene Ther 2005 September;12(17):1305-12.
(14) Zhigang W, Zhiyu L, Haitao R, Hong R, Qunxia Z, Ailong H, Qi L, Chunjing Z, Hailin T, Lin G,
Mingli P, Shiyu P. Ultrasound-mediated microbubble destruction enhances VEGF gene
delivery to the infarcted myocardium in rats. Clin Imaging 2004 November;28(6):395-8.
(15) Taniyama Y, Tachibana K, Hiraoka K, Namba T, Yamasaki K, Hashiya N, Aoki M, Ogihara T,
Yasufumi K, Morishita R. Local delivery of plasmid DNA into rat carotid artery using
ultrasound. Circulation 2002 March 12;105(10):1233-9.
(16) Teupe C, Richter S, Fisslthaler B, Randriamboavonjy V, Ihling C, Fleming I, Busse R, Zeiher
AM, Dimmeler S. Vascular gene transfer of phosphomimetic endothelial nitric oxide synthase
(S1177D) using ultrasound-enhanced destruction of plasmid-loaded microbubbles improves
vasoreactivity. Circulation 2002 March 5;105(9):1104-9.

Chapter 2
30
(17) Nie F, Xu HX, Tang Q, Lu MD. Microbubble-enhanced ultrasound exposure improves gene
transfer in vascular endothelial cells. World J Gastroenterol 2006 December 14;12(46):7508-
13.
(18) Duvshani-Eshet M, Adam D, Machluf M. The effects of albumin-coated microbubbles in DNA
delivery mediated by therapeutic ultrasound. J Control Release 2006 May 15;112(2):156-66.
(19) Larina IV, Evers BM, Esenaliev RO. Optimal drug and gene delivery in cancer cells by
ultrasound-induced cavitation. Anticancer Res 2005 January;25(1A):149-56.
(20) Rahim A, Taylor SL, Bush NL, ter Haar GR, Bamber JC, Porter CD. Physical parameters
affecting ultrasound/microbubble-mediated gene delivery efficiency in vitro. Ultrasound Med
Biol 2006 August;32(8):1269-79.
(21) Zarnitsyn VG, Prausnitz MR. Physical parameters influencing optimization of ultrasound-
mediated DNA transfection. Ultrasound Med Biol 2004 April;30(4):527-38.
(22) Brunner S, Sauer T, Carotta S, Cotten M, Saltik M, Wagner E. Cell cycle dependence of gene
transfer by lipoplex, polyplex and recombinant adenovirus. Gene Ther 2000 March;7(5):401-
7.
(23) Gresch O, Engel FB, Nesic D, Tran TT, England HM, Hickman ES, Korner I, Gan L, Chen S,
Castro-Obregon S, Hammermann R, Wolf J, Muller-Hartmann H, Nix M, Siebenkotten G,
Kraus G, Lun K. New non-viral method for gene transfer into primary cells. Methods 2004
June;33(2):151-63.
(24) van WA, Bouakaz A, Versluis M, de JN. Micromanipulation of endothelial cells: ultrasound-
microbubble-cell interaction. Ultrasound Med Biol 2004 September;30(9):1255-8.
(25) Wang X, Liang HD, Dong B, Lu QL, Blomley MJ. Gene transfer with microbubble ultrasound
and plasmid DNA into skeletal muscle of mice: comparison between commercially available
microbubble contrast agents. Radiology 2005 October;237(1):224-9.
(26) van Wamel A, Bouakaz A, de Jong N. Duration of ultrasound bubbles enhanced cell
membrane permeability. 2003.
(27) Postema M, van WA, ten Cate FJ, de JN. High-speed photography during ultrasound
illustrates potential therapeutic applications of microbubbles. Med Phys 2005
December;32(12):3707-11.
(28) Brayman AA, Miller MW. Acoustic cavitation nuclei survive the apparent ultrasonic destruction
of Albunex microspheres. Ultrasound Med Biol 1997;23(5):793-6.
(29) Greis C. Technology overview: SonoVue (Bracco, Milan). Eur Radiol 2004 October;14 Suppl
8:P11-5.:11-5.
(30) Podell S, Burrascano C, Gaal M, Golec B, Maniquis J, Mehlhaff P. Physical and biochemical
stability of Optison, an injectable ultrasound contrast agent. Biotechnol Appl Biochem 1999
December;30(Pt 3):213-23.

Chapter 3
Ultrasound and microbubble mediated gene therapy:
effectiveness of siRNA versus plasmid DNA delivery
Bernadet.D.M. Meijering1,2, Robert H. Henning1, Lynda Juffermans3, Leo.E.Deelman1.
1 Department of Clinical Pharmacology, Groningen Institute for Drug Exploration (GUIDE),
University Medical Center Groningen, University of Groningen, Groningen, TheNetherlands. 2 Interuniversity Cardiology Institute of The Netherlands, Utrecht, The Netherlands 3 Department of Cardiology and Physiology, VU University Medical Center, Amsterdam, the
Netherlands
Submitted for publication

Chapter 3
�32�
Abstract
The enhanced delivery of nucleic acids and the favorable safety profile may transform
ultrasound and microbubbles targeted delivery (UMTD) into a valuable therapeutic tool in the
treatment of vascular disease. Recently, we demonstrated that in UMTD of primary
endothelial cells, small molecules enter the cell mainly through transient pores while larger
molecules are more dependent on endocytosis. Based on the molecular weights and cellular
targets of siRNA and plasmid DNA, we hypothesized that UMTD of siRNA is more efficient in
changing gene expression than UMTD of plasmids. Therefore, the aim of this study is to
evaluate the efficiencies of both strategies in changing the expression of the moderately
expressed gene glyceraldehyde-3-phosphate dehydrogenase (GAPDH) in cultured
endothelial cells.
UMTD of GAPDH siRNA resulted in transfection of 97.9±1.5% of all endothelial cells, with
labeled siRNA both in the nucleus and cytoplasm immediately after UMTD. Transfection of
siRNA decreased GAPDH protein levels by approximately 70%. In contrast, following UMTD
of GAPDH plasmid DNA, only 2.0 ± 0.7 % of cells expressed the transgene, which failed to
increase overall GAPDH protein levels. Importantly, labeled plasmid DNA was delivered to
43.0 ± 4.2% of all cells and was detected in endosomes positive for clathrin and caveolin
immediately and 24 hours after UMTD.
In conclusion, UMTD of siRNA is more effective than UMDT of plasmid in modifying
protein levels of the moderately expressed gene GAPDH in cultured endothelial cells,
suggesting that UMTD of siRNA may become a valuable therapeutic strategy in the
treatment of vascular disease.
Introduction
The vascular endothelium is an attractive target for gene therapy because of its accessibility
and its importance in a wide range of cardiovascular pathologies, including hypertension,
arteriosclerosis, arterial restenosis and thrombosis1-3. Gene therapy may be used as a
therapeutic strategy to alter the homeostatic balance of endothelial cells by expressing
transgenes or by silencing endogenous target genes. Upregulation of genes may be
accomplished by the administration of DNA encoding for the gene of choice, while
downregulation is generally achieved by interference at the post-transcriptional level
employing gene specific synthetic antisense oligonucleotides, such as oligodeoxynucleotides
(ODNs) or siRNA.
Ultrasound contrast microbubbles are a promising vehicle in gene therapy, due to their low
toxicity and immunogenicity, non-invasive nature, local application and its cost-effectiveness.
Moreover, molecular imaging and therapeutic compound delivery may be performed
simultaneously, in an efficient way4.
Ultrasound and microbubbles targeted delivery (UMTD) of nucleic acids targeting the
endothelium has been applied in vitro as well as in vivo. In vitro, UMTD of plasmids to
endothelial cells reached transfection efficiencies of 5-20%5-7. Furthermore, UMTD of
plasmid in-vivo targeting the endothelium was successfully applied in models of

siRNA versus plasmid DNA delivery
� 33
cardiovascular disease to augment endothelial function (eNOS)8 or promote angiogenesis
(VEGF, HGF, FGF)9-11, although the exact transfection efficiencies were not determined.
Only a limited number of studies have reported on ultrasound and microbubble mediated
delivery of siRNA. In vivo, UMTD of siRNA has been performed in the tibialis muscle of
mice12. In addition, several studies demonstrated UMTD of siRNA in in-vitro models12-15.
Recently, we investigated the mechanisms underlying UMTD in primary endothelial cells16.
There, we demonstrated that endocytosis is a key mechanism in UMTD besides transient
pore formation, with the contribution of endocytosis being dependent on molecular size.
Although siRNA and plasmid DNA are both oligonucleotides, they differ substantially in size
(~15 kDa versus ~3500 kDa). Therefore, siRNA may enter the cell mainly through transient
pores and deliver the siRNA directly to its target, the mature mRNA residing in the cytosol.
The uptake of plasmids would be mediated mainly through endocytosis. For transcription of
the plasmids, the plasmid DNA needs to escape the endosome with subsequent active
transport to the nucleus. As it is unlikely that UMTD promotes these latter two processes, we
hypothesized that UMTD mediated delivery of siRNA is more effective in changing gene
transcription than UMTD mediated delivery of plasmids.
To test this hypothesis, we aimed at changing the gene expression levels of the
moderately expressed gene for glyceraldehyde-3-phosphate dehydrogenase (GAPDH) in
cultured endothelial cells by UMTD using GAPDH siRNA and a GAPDH expression plasmid.
For this, we employed our optimized protocol for delivery of plasmid DNA to cultured primary
endothelial cells5.
Materials and Methods
Cell culture
Primary bovine aorta endothelial cells (BAECs, Cell Applications, San Diego, CA, USA) were
cultured in DMEM supplemented with 1 g/l glucose, 4 mM L-glutamine, 25mM HEPES, 110
mg/l pyruvate (Gibco BRL, Invitrogen, Groningen, Netherlands), 10 % of Fetal Bovine Serum
(FBS, PAA laboratories, Pasching, Germany), 100 units/ml of penicillin and 100 µg/ml
streptomycin (Gibco BRL, Invitrogen, Groningen, Netherlands) in a humidified incubator at
37°C and 5% CO2. When cells reached confluence, they were subcultured in a 1:10 ratio
employing trypsin EDTA (Gibco BRL, Invitrogen, Groningen, Netherlands). Cells between
passage 3 and 7 were used for UMTD experiments. 48 Hours prior to ultrasound exposure,
cells were seeded at 33% confluency in OpticellTM cell culture chambers (Biocrystal,
Westerville, OH, USA), in which cells could adhere to one of the two gas-permeable,
ultrasound transparent membranes.
Preparation of Sonovue® microbubbles
Sonovue® microbubble contrast agent (Bracco, High Wycombe, UK) was reconstituted in 5
ml of saline solution according to manufacturer’s protocol. Reconstitution of the Sonovue®
microbubbles resulted in a preparation containing 2·108 – 5·108 microbubbles/ml.

Chapter 3
�34�
Ultrasound exposure setup
The experimental acoustic setup used was similar a described before5. In short, the
ultrasound setup consisted of a 1 MHz unfocused 14mm single-element transducer
(Panametrics, Waltham, MA, USA) mounted at an angle of 45 degrees in a tank filled with
PBS (Invitrogen, Groningen, Netherlands) at 37˚C. US was generated by a computer
controlled waveform generator (33220A, Agilent, Palto Alto, CA, USA) and amplified by a
linear power amplifier (150A100B, Amplifier Research, Bothell, WA, USA). The amplified
signal was monitored by a synchronized digital oscilloscope (GOULD DSO 465, Valley View,
OH, USA).
UMTD protocol
For the evaluation of the relative efficiencies of UMTD of siRNA and plasmid DNA, we used
the previously optimized protocol for the delivery of plasmid DNA to cultured primary
endothelial cells5. There, we determined that a plasmid DNA concentration of 20 µg/ml was
optimal in UMTD of plasmids in endothelial cells. siRNA concentrations ranged between
2.25 nM and 2.25 µM. For the transfection of one Opticell, 125 µl of Sonovue microbubble
suspension was transferred to a new vial and either plasmid or siRNA was added in a
volume 125 µl at a concentration of 80 times the end-concentration. After thorough mixing,
the mixture was incubated for 5 min at room temperature. Addition of 9.75 ml medium
without FBS resulted in the desired end-concentration and the mixture was subsequently
injected into the Opticells™. Microbubbles and cells were exposed to sinusoidal US waves
with a frequency of 1 MHz with a pulse repetition period of 50 ms with 3111 cycles per pulse
during 30 seconds. Peak negative acoustic pressure generated at the region-of-interest was
0.22 MPa as measured with a calibrated hydrophone (PVDFZ44-0400, Specialty
Engineering Associates, Soquel, CA, USA).
Plasmids and fluorescent microscopy
The 5.7 kb plasmid CMV-sport6 encoding bovine GAPDH (LGC promochem, Teddington,
UK) and the 4.7 kb plasmid EGFP-N1 encoding green fluorescent protein (GFP; Clontech,
Mountain view, CA, USA) were amplified using Escherichia coli JM109. Plasmids were
isolated using the nucleobond pc10000 isolation kit (Machery Nachel, Düren, Germany)
according to the manufacturer’s instructions. DNA concentrations and purity were
determined using a nanodrop spectrometer ND-1000 (Isogen Lifescience, IJsselstein,
Netherlands). Functionality of both plasmids was established in human 293 cells by
transfection of the plasmids using lipofectamine (invitrogen). After 24 hours, the expression
of EGFP and bovine GAPDH was established by fluorescent microscopy and western-blot,
respectively (data not shown).
Plasmid labeling
For fluorescent microscopy experiments, plasmid DNA was covalently labeled with the
fluorophore Cy3 using the Label IT kit (MIRUS, Madison, WI) according to the

siRNA versus plasmid DNA delivery
� 35
manufacturer’s instructions. On average, one Cy3 molecule was bound per 71 bp.
Immediately and 24 hours after UMTD, fluorescent microscopy (LSM 410, Carl Zeiss,
Sliedrecht, Netherlands) images were made using a 40x or 100x magnification oil-
immersion lens (Carl-Zeiss, Sliedrecht, Netherlands).
siRNA and fluorescent microscopy
Double stranded siRNA directed toward the mRNA target for bovine glyceraldehyde 3-
phosphate dehydrogenase (sense strand 5’-CCACUUUGUCAAGCUCAUUTT-3’, antisense
strand 5’-AAUGAGCUUGACAAAGUGGTT-3’, Eurogentec, Maastricht, Netherlands) was
used. As a control, the Eurogentec universal negative control sequence (scrambled siRNA)
was used. To study its cellular localization, siRNA was labeled with a 5’ TAMRA label
(Eurogentec, Maastricht, Netherlands) and used at a final concentration of 2.2 µM.
Immediately after UMTD, fluorescent and bright-field images were recorded.
Co-localisation of plasmids with endocytosis markers clathrin and caveolin-1
Directly following UMTD of Cy3-labeled plasmid, regions-of-interest were cut from the
Opticell (approximately 1.5 cm2) and placed in PBS. Cells were fixed in 4% formaldehyde 10
minutes at room temperature. Cells were washed three times with PBS, permeabilized for 5
minutes in 0.05% Triton X-100 (Sigma-Aldrich) in PBS, followed by three washes in PBS-
Tween (0.5%, Tween 20; Sigma-Aldrich). Cells were incubated with polyclonal goat anti-
clathrin heavy chain, a marker for clathrin-mediated endocytosis (Santa Cruz, the
Netherlands) or with monoclonal mouse anti-caveolin-1 (Clone C060; BD Biosciences,
Breda, the Netherlands), a marker for caveolin-mediated endocytosis; both antibodies were
diluted 1:100. Cells were incubated overnight at 4ºC, washed three times with PBS-Tween,
and incubated with both Cy3-labeled rat-anti-mouse and Cy5-labeled donkey-anti-goat
secondary antibodies (1:100, Molecular Probes) 30 minutes at room temperature in the dark.
Cells were washed twice with PBS-Tween, washed once with PBS and mounted on a
microscope slide with mounting-medium containing DAPI nuclear stain (VectashieldTM,
Vector Laboratories, Burlingame, CA, USA). 3-Dimensional (3D) images were acquired
using a ZEISS Axiovert 200M MarianasTM inverted microscope (I.I.I) equipped with a
motorized stage (stepper-motor z-axis increments: 0.2 micron). Images were taken using a
63x oil-immersion lens (Carl-Zeiss). A cooled CCD camera (C1280x1024 pixels; Cooke
Sensicam, Cooke, Tonawanda, NY), recorded images with true 16-bit capability. The
camera is linear over its full dynamic range (up to intensities of over 4000) while
dark/background currents (estimated by the intensity outside the cells) are typically <100.
The microscope, camera, data viewing/processing were conducted/controlled by
SlideBookTM. This software was also used to deconvolve the 3D image stacks in order to
remove out-of-focus light, as well as to quantify the extent of co-localization for plasmid with
clathrin or caveolin by calculating Pearson’s correlation factor. Pearson’s correlation factor
lies between +1 and –1. A positive value implies a positive correlation, thus co-localization,

Chapter 3
�36�
‘0’ implies no correlation, and a negative value implies an inverse correlation. As a control,
the correlation factor between clathrin (Cy5)/DAPI and caveolin (Cy3)/DAPI was determined.
Western blotting
Cells were homogenized in RIPA buffer and protein concentration was determined according
to the Bradford method (Sigma, Zwijndrecht, Netherlands), with bovine albumin as a
standard. Protein expression was determined by Western blot analysis and expressed as
ratio levels of GAPDH/ beta-actin. For this, denatured protein (20 µg) was separated by SDS-
PAGE using 4-20% precise protein gels (Pierce, Rockford, IL,USA), transferred to
nitrocellulose membranes (Stratagene, Amsterdam, Netherlands) and incubated with primary
antibodies against GAPDH (Fitzgerald, Concord, MA, USA) and beta-actin (Sigma-Aldrich,
Zwijndrecht, Netherlands). Horeseradish peroxidase conjugated anti-rabbit IgG (Santa Cruz
Biotechnology, Heerhugowaard, Netherlands) was used as secondary antibody. Signals
were detected by the ECL detection method (Amersham, Roosendaal, Netherlands) and
quantified by densitometry.
Immunofluorescence
Cells were fixed in 4% formaldehyde (Klinipath, Duiven, Netherlands) for 10 minutes at room
temperature and were subsequently washed three times in PBS. Cells were permeabilized
for 5 min in 0.1% Triton-x (Sigma-Aldrich, Zwijndrecht, Netherlands) in PBS (Gibco BRL,
Invitrogen, Groningen, Netherlands), followed by three washes with PBS. After cells were
incubated with 3% bovine serum albumine (BSA) (Sigma-Aldrich, Zwijndrecht, Netherlands)
in PBS for 30 minutes, a drop of 100 µL of dissolved rabbit monoclonal anti-GAPDH (1:150,
Fitzgerald, Concord, MA, USA) in 3%BSA /PBS, was placed on parafilm. Cells were placed
on top of the antibody mixture and incubated for 1 hour at room temperature, followed by
three PBS wash steps. Thereafter, a drop of 100 µL PBS containing 3% BSA, FITC labeled
goat-anti-rabbit secondary antibody (1:200, Molecular Probes, Leiden, Netherlands) was
placed on parafilm. Cells were put on top of the secondary reaction mixture and incubated
for 60 min at room temperature, in the dark. Subsequently, cells were washed 3 times with
PBS and mounted on a microscope slide with mounting medium (Vectashield, Vector
Laboratories) and sealed with nail polish. Fluorescent microscopy (LSM 410, Carl Zeiss,
Sliedrecht, Netherlands) pictures were taken using a 100x oil-immersion lens (Carl-Zeiss,
Sliedrecht, Netherlands). Cellular GAPDH levels were quantified using Image Pro plus, v 5.0
(Media Cybernetics, Silver Spring, MD, USA).
Cell viability assay
Using a metal mask, a section of the membrane carrying the cells exposed to ultrasound
was cut from the OpticellTM cell culture chamber. Cells were harvested using trypsin and
resuspended in 1 ml of medium. 50 ul of the cell suspension was transferred to a well of a
96-well plate. Cell-viability was determined using the CellTiter 96 AQueous One Solution
Cell Proliferation Assay (Promega, Madison, USA).

siRNA versus plasmid DNA delivery
� 37
Statistics and analyses
All data are shown as the mean±S.D. (n=5). Data were considered significant when P<0.05.
The t-test was used to calculate statistical significance.
Results
To compare the efficiency of modulation of gene expression using UMTD, endothelial cells
were transfected with GAPDH siRNA to reduce GAPDH protein levels, or with plasmid DNA
encoding the bovine GAPDH gene to enhance its expression. Moreover, uptake of the gene
constructs and cellular distribution were determined by fluorescently labeled nucleic acids.
The previously optimized protocol for the delivery of plasmid DNA to cultured primary
endothelial cells was employed5.
Silencing of GAPDH after UMTD of GAPDH siRNA
UMTD of GAPDH siRNA to endothelial cells was performed to reduce GAPDH protein
levels. Western blot demonstrated that GAPDH protein levels were decreased to 24.3±7.9%
of controls using 2.25 µM GAPDH siRNA, while scrambled siRNA had no effect on GAPDH
protein levels (figure 1A and 1B). To determine the optimal siRNA concentration, we varied
GAPDH siRNA concentrations between 2.25 nM and 2.25 µM. All concentrations were
equally effective in down-regulating GAPDH protein levels to about 30% of controls (figure
1C). No differences in cell viability were observed (data not shown).
To determine the efficiency of siRNA delivery, we performed UMTD with TAMRA labeled
siRNA. Immediately after UMTD, 97.9±1.5% of the cells was positive for TAMRA labeled
siRNA. Next, the cellular localization of the TAMRA-labeled siRNA was determined by high
magnification confocal microscopy. Immediately after UMTD, labeled siRNA was detected in
the cytosol, nucleus and occasionally in large vesicles (figure 2A). 3D confocal imaging of
syto-green labeled nuclei and TAMRA labeled siRNA confirmed the nuclear delivery of
siRNA after UMTD (data not shown). TAMRA-labeled siRNA could not be detected after 24
hours.
Finally, we investigated whether GAPDH protein levels were decreased in all cells which
received the GAPDH siRNA. Unfortunately, fluorescent siRNA could not be detected 24
hours after UMTD, making a direct comparison between siRNA delivery and GAPDH protein
expression in individual cells impossible. However, a frequency diagram of the GAPDH
protein expression levels before and after siRNA delivery indicates that GAPDH protein
levels were decreased in virtually all cells (figure 3).
Over-expression of GAPDH after UMTD of a GAPDH expression plasmid
To enhance GAPDH protein levels, an optimal dose (20 µg) of plasmid DNA encoding the
bovine GAPDH gene was delivered to endothelial cells by UMTD. Twenty-four hours after
UMTD, GAPDH protein levels were determined by western blotting. Following UMTD of a
GAPDH expression plasmid, no significant increase in GAPDH protein levels was found
(figure 1D).

Chapter 3
�38�
We questioned whether the failure to increase GAPDH protein levels using UMTD of
GAPDH plasmid was the result of inefficient plasmid delivery or caused by inefficient plasmid
expression. To examine this, we performed a UMTD cotransfection experiment of both a
Cy3 labeled plasmid and an unmodified GFP expression plasmid (10ug/ml of each).
Immediately after UMTD, 43.0 ± 4.2% of all cells was positive for Cy3, However, 24 hours
after UMTD, only 2.0±0.7% of the Cy3 positive cells were also positive for GFP (figure 4). No
GFP expression was observed in cells negative for Cy3. Finally, the cellular localization of
the Cy3-plasmid was determined. Immediately after UMTD, Cy3-labeled plasmid DNA was
mainly found in cytoplasmic vesicles and no Cy3-labeled plasmid was detected in the
nucleus (figure 2B). Immediately after UMTD these vesicles appeared to be clustered within
the cytoplasm. After 24 hours, the vesicles appeared to be distributed more evenly within the
cytoplasm (figure 2C).
Co-localization of endocytosis markers and labeled plasmid
To further investigate the nature of the vesicles positive for labeled plasmid, we investigated
whether internalized labeled plasmid co-localizes with clathrin and/or caveolin-1, which are
established markers for two main routes of endocytosis. Figure 5 shows clear co-localization
of labeled plasmid with clathrin (figure 5A) and with caveolin-1 (figure 5B), as demonstrated
by the yellow/orange color in the merged images of plasmid (red) and clathrin/caveolin-1
(green). The extent of co-localization was determined using Pearson’s correlation factor. A
positive correlation was found for plasmid with clathrin was 0.28±0.03 (p<0.01, compared to
hypothetical value of 0.0), for plasmid with caveolin 0.32±0.12 (p<0.01). As control, no
correlation was found for DAPI (nuclei) with either Cy3 (0.01±0.01, p=0.3) or Cy5 channel (-
0.01±0.02, p=0.7) (both secondary antibodies).

siRNA versus plasmid DNA delivery
� 39
Figure 1: GAPDH protein levels 24 hours after UMTD of siRNA and plasmid. A) Western blot
showing typical result after UMTD of GAPDH plasmid and siRNA. B) UMTD of GAPDH siRNA
resulted in significantly decreased GAPDH levels, 24 hours after UMTD. UMTD in the absence of
siRNA or in the presence of scrambled siRNA did not affect GAPDH levels. C) GAPDH siRNA
concentrations ranging from 2.25 nM to 2.25 µM were equally effective in reducing GAPDH protein
levels D) UMTD of GAPDH plasmid DNA did not increase basal GAPDH levels. UMTD in the absence
of plasmid DNA and UMTD of GFP plasmid did not affect GAPDH levels. (* indicates p<0.01 vs
control).

Chapter 3
�40�
Figure 2: Cellular localization of siRNA and plasmid DNA. A. TAMRA labeled siRNA, immediately
after UMTD. B. CY3 labeled plasmid immediately after UMTD. C. CY3 labeled plasmid 24h after
UMTD.
Figure 3: histogram of GAPDH levels per cell. A frequency histogram was constructed from the
cellular GAPDH staining intensity of 75 cells after UMTD of GAPDH siRNA and scrambled siRNA.

siRNA versus plasmid DNA delivery
� 41
Figure 4: Colocalization of CY3 labeled plasmid and expression of GFP. Cells were transfected
by UMTD using Cy3 labeled plasmid and an unmodified GFP expression plasmid in equal amounts.
After 24 hours, the localization of CY3 labeled plasmid (red signal) and the expression of GFP (green
signal) were evaluated using confocal microscopy.
Figure 5: Colocalization of CY3 labeled plasmid with endocytosis markers. A) Colocalization
between CY3 plasmid (red) with clathrin (green). Arrows indicate cells positive for both markers. B)
Colocalization between CY3 plasmid (red) with caveolin-1 (green).

Chapter 3
�42�
Discussion
Recently, we demonstrated that in UMTD of primary endothelial cells, small molecules enter
the cell mainly through transient pores while larger molecules are more dependent on
endocytosis16. Based on the molecular weights and cellular targets of siRNA and plasmid
DNA, we hypothesized that UMTD of siRNA is more efficient in changing gene expression
than UMTD of plasmids in cultured endothelial cells. To test this hypothesis, we compared
the efficiencies of both strategies using the moderately expressed gene GAPDH as a
common target.
The previously optimized protocol for UMTD mediated delivery of plasmid DNA5 was used
to deliver siRNA to primary endothelial cells. This protocol resulted in siRNA delivery to
almost all cells, resulting in GAPDH protein down-regulation in approximately all transfected
cells. Therefore, our optimized protocol for UMTD of plasmid DNA is also very efficient in
delivering siRNA to primary endothelial cells. High transfection efficiency (~50%) and
effective knockdown of target mRNA was also observed after UMTD of siRNA in cultured
mesenchymal stem cells14. UMTD of siRNA is therefore comparable to the transfection
efficiency of bovine aorta endothelial cells using lentiviruses, adenoviral and retroviral
transfection which are between 50-100%17. The efficiency of vascular delivery of siRNA
through UMTD of siRNA is still largely unknown. Intraventricular co-injection of siRNA-GFP
and microbubbles with concomitant ultrasonic exposure resulted in substantial reduction in
EGFP expression in the coronary artery in EGFP transgenic mice18. Furthermore, it has
been demonstrated that in UMTD, siRNA could be delivered to the tibial muscle, skin and
heart of mice although the delivery to the kidney failed12. These in-vivo studies all
demonstrated knock-down of reporter genes and therefore the efficiency of UMTD siRNA
therapy in vascular pathology remains to be established.
Confocal microscopy demonstrated that labeled siRNA was homogeneously distributed in
the cytoplasm and nucleus immediately after UMTD. Occasionally, siRNA was observed in
large vesicular structures in the cytoplasm. These data support our general finding that in
UMTD, small molecules enter the cell mainly through transient pores16. Therefore UMTD of
siRNA efficiently delivers siRNA to its target, the mature GAPDH mRNA residing in the
cytosol. Furthermore, the nuclear delivery of siRNA may indicate that UMTD of siRNA may
also be effective in the knock-down of transcripts restricted to the nucleus19. However, there
is no evidence that UMTD enhances the transfer of nucleic acids over the nuclear
membrane. Therefore, the efficiency of the nuclear delivery of siRNA may depend primarily
on the rapid diffusion of small nucleic acids throughout the cell20.
Despite the strong fluorescence of TAMRA-labeled siRNA immediately after UMTD, no
fluorescent signal could be detected 24 hours after UMTD. This is in contrast to a study in
gastrointestinal cancer cells showing TAMRA-labeled siRNA in vesicular structures at 24
hours after transfection21. However, these vesicular structures most likely represent stable
aggregates of labeled siRNA and may not reflect active siRNA in the cytosol.
Furthermore our study showed a 70% downregulation of the targeted protein by a broad
range of siRNA concentrations (2.5 nM and higher) without a clear siRNA dose-dependent

siRNA versus plasmid DNA delivery
� 43
effect. This is in contrast to a previous study demonstrating that the expression of a
luciferase plasmid could be inhibited by UMTD of siRNA in a dose dependent manner using
siRNA concentrations ranging from 5 to 50 nM12. However, this study was performed using
COS-7 cells transfected with a luciferase plasmid, resulting in high luciferase mRNA levels.
The absence of a siRNA dose-dependent effect on the knockdown of the moderately
expressed GAPDH gene in endothelial cell, suggest that the maximal effect of GAPDH-
siRNA was already achieved at the lowest concentration investigated by us (2.5 nM).
All investigated siRNA concentrations in UMTD of siRNA had no effect on cell-viability,
indicating the absence of cytotoxicity. This is in-line with a previous study investigating
UMTD of siRNA in COS-7 cells12. This is in contrast to UMTD of plasmid DNA, as
demonstrated in a previous study by our group5. There, deviation from the optimal DNA
concentration (20 µg/ml) by a factor of two, resulted in either decreased transfection (10
µg/ml) or severe cell death (40 µg/ml). Therefore, these results indicate that UMTD of siRNA
is more efficient over a larger concentration range than UMTD of plasmid DNA.
In contrast to UMTD of siRNA, UMTD of a GAPDH plasmid did not increase GAPDH
levels over endogenous GAPDH protein levels. Although post-transcriptional control may be
an underlying mechanism for maintaining GAPDH protein levels at fixed levels, our data
obtained with the GFP expression vector indicate that poor transfection efficiencies of
plasmid UMTD is the main cause for the inability to upregulate GAPDH protein levels. This
study however demonstrates that poor delivery of the GAPDH plasmid is not the underlying
mechanism for the inability to enhance GAPDH protein levels. Cotransfection of a Cy3-
labeled plasmid with a GFP reporter vector demonstrated that a substantial number of cells
took up the Cy3-labeled plasmid (43.0 ± 4.2%). However, of these positive cells, only 2%
expressed the GFP reporter protein . Similar delivery efficiency of plasmid was observed in
rat mammary carcinoma cells22, showing UMTD of YOYO-1 labeled plasmid to transfect
approximately 27% of all cells immediately after UMTD. Previously, we demonstrated that
UMTD of large molecules (500 kDa dextran) is completely dependent on endocytosis and
the delivered molecules were mainly localized in endosomes positive for clathrin and to a
lesser extent in endosomes positive for caveolin16. In the present study, we demonstrate that
labeled plasmid was delivered equally to both endosomes positive for clathrin and to
endosomes positive for caveolin-1, indicating that plasmid DNA is taken up by both routes of
endocytosis. The subsequent escape from these endosomes and transport to the nucleus is
therefore the most likely bottleneck for efficient transcription of plasmid DNA after UMTD. In
accord, attachment of nuclear localization peptides to the plasmid does not enhance the
efficiency of UMTD of plasmid DNA23.
Despite the higher efficiency of siRNA to change the protein levels of GAPDH, this does
not mean that UMTD mediated delivery of plasmids has no therapeutic potential. Several in-
vivo studies employing UMTD of plasmids have been successfully completed8,11,24-26.
However, these studies used plasmids encoding potent paracrine factors, avoiding the need
for a highly efficient vector able to transfect the majority of all target cells.

Chapter 3
�44�
In summary, this study demonstrates that UMTD of GAPDH siRNA is more effective than
UMDT of GAPDH plasmid in modifying protein levels of the moderately expressed gene
GAPDH in cultured endothelial cells. UMTD of siRNA was effective over a broad range of
siRNA concentrations without cytotoxic effects, suggesting that UMTD of siRNA may
become a valuable therapeutic strategy in the treatment of vascular disease.

siRNA versus plasmid DNA delivery
� 45
References
(1) Davignon J, Ganz P: Role of endothelial dysfunction in atherosclerosis. Circulation
2004;109:III27-32.
(2) Esmon CT: The interactions between inflammation and coagulation. Br J Haematol
2005;131:417-430.
(3) Feletou M, Vanhoutte PM: Endothelial dysfunction: A multifaceted disorder (the wiggers
award lecture). Am J Physiol Heart Circ Physiol 2006;291:H985-1002.
(4) Schneider M: Molecular imaging and ultrasound-assisted drug delivery. J Endourol
2008;22:795-802.
(5) Meijering BD, Henning RH, Van Gilst WH, Gavrilovic I, Van WA, Deelman LE: Optimization of
ultrasound and microbubbles targeted gene delivery to cultured primary endothelial cells.
JDrug Target 2007;15:664-671.
(6) Wang Y, Xu HX, Lu MD, Tang Q: Expression of thymidine kinase mediated by a novel non-
viral delivery system under the control of vascular endothelial growth factor receptor 2
promoter selectively kills human umbilical vein endothelial cells. World J Gastroenterol
2008;14:224-230.
(7) Nie F, Xu HX, Tang Q, Lu MD: Microbubble-enhanced ultrasound exposure improves gene
transfer in vascular endothelial cells. World J Gastroenterol 2006;12:7508-7513.
(8) Teupe C, Richter S, Fisslthaler B, Randriamboavonjy V, Ihling C, Fleming I, Busse R, Zeiher
AM, Dimmeler S: Vascular gene transfer of phosphomimetic endothelial nitric oxide synthase
(s1177d) using ultrasound-enhanced destruction of plasmid-loaded microbubbles improves
vasoreactivity. Circulation 2002;105:1104-1109.
(9) Kondo I, Ohmori K, Oshita A, Takeuchi H, Fuke S, Shinomiya K, Noma T, Namba T, Kohno
M: Treatment of acute myocardial infarction by hepatocyte growth factor gene transfer: The
first demonstration of myocardial transfer of a "Functional" Gene using ultrasonic microbubble
destruction. J Am Coll Cardiol 2004;44:644-653.
(10) Zhigang W, Zhiyu L, Haitao R, Hong R, Qunxia Z, Ailong H, Qi L, Chunjing Z, Hailin T, Lin G,
Mingli P, Shiyu P: Ultrasound-mediated microbubble destruction enhances vegf gene delivery
to the infarcted myocardium in rats. Clin Imaging 2004;28:395-398.
(11) Korpanty G, Chen S, Shohet RV, Ding J, Yang B, Frenkel PA, Grayburn PA: Targeting of
vegf-mediated angiogenesis to rat myocardium using ultrasonic destruction of microbubbles.
Gene Ther 2005;12:1305-1312.
(12) Negishi Y, Endo Y, Fukuyama T, Suzuki R, Takizawa T, Omata D, Maruyama K, Aramaki Y:
Delivery of sirna into the cytoplasm by liposomal bubbles and ultrasound. J Control Release
2008;132:124-130.
(13) Kinoshita M, Hynynen K: A novel method for the intracellular delivery of sirna using
microbubble-enhanced focused ultrasound. Biochem Biophys Res Commun 2005;335:393-
399.
(14) Otani K, Yamahara K, Ohnishi S, Obata H, Kitamura S, Nagaya N: Nonviral delivery of sirna
into mesenchymal stem cells by a combination of ultrasound and microbubbles. J Control
Release 2009;133:146-153.

Chapter 3
�46�
(15) Vandenbroucke RE, Lentacker I, Demeester J, De Smedt SC, Sanders NN: Ultrasound
assisted sirna delivery using peg-siplex loaded microbubbles. J Control Release
2008;126:265-273.
(16) Meijering BD, Juffermans LJ, van Wamel A, Henning RH, Zuhorn IS, Emmer M, Versteilen
AM, Paulus W, van Gilst WH, Kooiman K, de Jong N, Musters RJ, Deelman LE, Kamp O:
Ultrasound and microbubble-targeted delivery of macromolecules is regulated by induction of
endocytosis and pore formation. Circ Res 2009
(17) Sakoda T, Kasahara N, Kedes L, Ohyanagi M: Lentiviral vector-mediated gene transfer to
endotherial cells compared with adenoviral and retroviral vectors. Prep Biochem Biotechnol
2007;37:1-11.
(18) Tsunoda S, Mazda O, Oda Y, Iida Y, Akabame S, Kishida T, Shin-Ya M, Asada H, Gojo S,
Imanishi J, Matsubara H, Yoshikawa T: Sonoporation using microbubble br14 promotes
pdna/sirna transduction to murine heart. Biochem Biophys Res Commun 2005;336:118-127.
(19) Berezhna SY, Supekova L, Supek F, Schultz PG, Deniz AA: Sirna in human cells selectively l
ocalizes to target rna sites. Proc Natl Acad Sci U S A 2006;103:7682-7687.
(20) Lukacs GL, Haggie P, Seksek O, Lechardeur D, Freedman N, Verkman AS: Size-dependent
DNA mobility in cytoplasm and nucleus. JBiolChem 2000;275:1625-1629.
(21) Grabowska AM, Hughes J, Watson SA: Use of interfering rna to investigate the role of
endogenous gastrin in the survival of gastrointestinal cancer cells. BrJCancer 2007;96:464-
473.
(22) Mehier-Humbert S, Bettinger T, Yan F, Guy RH: Ultrasound-mediated gene delivery: Kinetics
of plasmid internalization and gene expression. Journal of Controlled Release 2005;104:203-
211.
(23) Duvshani-Eshet M, Keren H, Oz S, Radzishevsky IS, Mor A, Machluf M: Effect of peptides
bearing nuclear localization signals on therapeutic ultrasound mediated gene delivery. J Gene
Med 2008;10:1150-1159.
(24) Li X, Wang Z, Ran H, Yuan Q, Zheng Y, Ren J, Su L, Zhang W, Li Q, Xu C: Experimental
research on therapeutic angiogenesis induced by hepatocyte growth factor directed by
ultrasound-targeted microbubble destruction in rats. JUltrasound Med 2008;27:453-460.
(25) Leong-Poi H, Kuliszewski MA, Lekas M, Sibbald M, Teichert-Kuliszewska K, Klibanov AL,
Stewart DJ, Lindner JR: Therapeutic arteriogenesis by ultrasound-mediated vegf165 plasmid
gene delivery to chronically ischemic skeletal muscle. CircRes 2007;101:295-303.
(26) Inagaki H, Suzuki J, Ogawa M, Taniyama Y, Morishita R, Isobe M: Ultrasound-microbubble-
mediated nf-kappab decoy transfection attenuates neointimal formation after arterial injury in
mice. JVascRes 2006;43:12-18.

Chapter 4
Ultrasound and microbubble-targeted delivery of
macromolecules is regulated by induction of endocytosis
and pore formation
B.D.M. Meijering1,4, L.J.M. Juffermans2,4, A. van Wamel3,4, R.H. Henning1, I.S. Zuhorn5, M.
Emmer3, A.M.G. Versteilen2, W. Paulus2, W.H. van Gilst1,4, K. Kooiman3, N. de Jong3,4,
R.J.P. Musters2, L.E. Deelman1,4, O. Kamp2,4.
1Department of Clinical Pharmacology, University Medical Center Groningen, University of
Groningen, the Netherlands; 2Department of Cardiology and Physiology, VU University Medical Center, Amsterdam, the
Netherlands; 3Department of Biomedical Engineering, Thorax Center, Erasmus MC,
Rotterdam, the Netherlands; 4Interuniversity Cardiology Institute of the Netherlands, Utrecht,
the Netherlands; 5Department of Cell Biology/Membrane Cell Biology, University Medical Center Groningen,
University of Groningen, Groningen, The Netherlands.
Circ Res. 2009 Mar 13;104(5):679-87

Chapter 4
48
Abstract
Contrast microbubbles in combination with ultrasound (US) are promising vehicles for local
drug and gene delivery. However, the exact mechanisms behind intracellular delivery of
therapeutic compounds remain to be resolved. We hypothesized that endocytosis and pore
formation are involved during US and microbubble targeted delivery (UMTD) of therapeutic
compounds. Therefore, primary endothelial cells were subjected to UMTD of fluorescent
dextrans (4.4 to 500-kDa) using 1-MHz pulsed US with 0.22-MPa peak-negative pressure,
during 30s. Fluorescence microscopy showed homogeneous distribution of 4.4 and 70-kDa
dextrans through the cytosol, and localization of 155 and 500-kDa dextrans in distinct
vesicles after UMTD. After ATP depletion reduced uptake of 4.4-kDa dextran and no uptake
of 500-kDa dextran was observed after UMTD. Independently inhibiting clathrin- and
caveolae-mediated endocytosis, as well as macropinocytosis significantly decreased
intracellular delivery of 4.4 to 500-kDa dextrans. Furthermore, 3D-fluorescence microscopy
demonstrated dextran vesicles (500-kDa) to co-localize with caveolin-1 and especially
clathrin. Finally, after UMTD of dextran (500-kDa) into rat femoral artery endothelium in vivo,
dextran molecules were again localized in vesicles that partially co-localized with caveolin-1
and clathrin. Together, these data indicated uptake of molecules via endocytosis after
UMTD. In addition to triggering endocytosis, UMTD also evoked transient pore formation, as
demonstrated by the influx of calcium ions and cellular release of pre-loaded dextrans after
US and microbubble-exposure. In conclusion, these data demonstrate that endocytosis is a
key mechanism in UMTD besides transient pore formation, with the contribution of
endocytosis being dependent on molecular size.
Introduction
Conventional delivery methods for drugs or genes, such as systemic administration via
intravenous injection or oral administration, often do not suffice for therapeutic compounds
such as peptides, silencing RNAs and genes1. A recent development in delivery systems for
therapeutic compounds is the microbubble-ultrasound (US) interaction2, 3. Before its use as a
clinical modality, it is of utmost importance to obtain new physiological insights into the
mechanisms of uptake by US and microbubble-exposed cells.
Microbubbles were originally developed as US contrast agents, and are administered
intravenously to the systemic circulation to enhance scattering of blood in echocardiography.
They consist of a gas core stabilized with an encapsulation, ranging from 1-10 μm in diameter4. Nowadays, research focuses on the use of US and microbubbles for therapeutic
applications. It has been demonstrated that US–exposed microbubbles can achieve safe
and efficient local delivery of a variety of drugs5, 6 and genes7-9. In an US field, microbubbles
will oscillate, and this may stimulate cells to admit the drug or gene10. The advantage of
using US and microbubbles is that only the microbubbles in the US beam will be activated.
In this way, delivery can be targeted to specific organs or sites by focusing the US beam on
the specific target. This is indicated by the term US microbubble-targeted delivery (UMTD).

Endocytosis and pore formation
49
However, the exact mechanism of cellular uptake of therapeutics after UMTD is not fully
understood. One of the principal mechanisms is thought to be induction of cell membrane
pores11, 12. Studies employing scanning-electron microscopy revealed pore-like structures in
the cell membrane after treatment by US either with or without microbubbles1, 9, 11, 13 . The
presence of enhanced transmembrane ion fluxes during US and microbubble-exposure was
also demonstrated14, 15. Although the hypothesis of pore formation during UMTD is supported
by these studies, it was recently questioned in studies by Duvshani-Eshet et al.16, 17. In these
studies, pore-like structures were found both in US and microbubble-exposed cells as well
as in control cells16. Furthermore, atomic-force microscopy studies suggested that these
pore-like structures represented depressions in the membrane rather than actual pores.
Exposing cells to US and microbubbles altered both diameter and depth of these
depressions17, indicating that the depressions in the membrane might represent endocytotic
invaginations. Interestingly, Juffermans et al. recently demonstrated that US-exposed
microbubbles induced formation of hydrogen peroxide (H2O2), and an influx of calcium ions,
causing local hyperpolarization of the cell membrane18. In addition, other studies
demonstrated that H2O2, as well as a rise in intracellular calcium levels are directly
correlated with endocytosis19-21.
Nevertheless, as there is still no consensus about the internalization mechanisms involved
in UMTD, the aim of this study was to examine whether macromolecules enter the cell solely
via transient pores, or that endocytosis might also be involved in the uptake during UMTD.
As a model for drug delivery, uptake of dextrans ranging from 4.4 to 500-kDa in size was
studied. Primary endothelial cells and rat femoral artery endothelium, the prime target cells
for intravenous microbubbles, were subjected to UMTD of different sized dextran molecules
to study whether the mechanism behind UMTD is dependent on molecular size.
Materials and methods
Cell culture
Primary bovine aortic endothelial cells (BAECs, Cell Applications, San Diego, CA, USA)
were cultured as described previously22. Cells between passage 3 and 7 were used for
UMTD experiments. Forty-eight hours prior to UMTD, cells were seeded at 33% confluency
to one of the two gas-permeable, US-transparent membranes of an OpticellTM cell culture
chamber (Biocrystal, Westerville, OH, USA).
Ultrasound exposure
Prior to UMTD, the OpticellTM chamber was mounted in the experimental acoustic set-up,
described in detail in22 In short, a v303-SU 1-MHz unfocused 14mm diameter single-element
transducer (Panametrics, Waltham, MA, USA) was placed in a water-tank filled with 37�C
phosphate-buffered saline (PBS, Invitrogen, Groningen, the Netherlands) at an angle of 45� relative to the cell monolayer. The transducer was connected to an arbitrary waveform
generator (33220A, Agilent, Palto Alto, CA, USA) and a linear 60-dB power amplifier
(150A100B, Amplifier Research, Bothell, WA, USA). The US signal was monitored by a

Chapter 4
50
synchronized digital oscilloscope (GOULD DSO 465, Valley View, OH, USA). Peak negative
acoustic pressure generated at the region-of-interest (ROI) was 0.22 MPa as verified with a
calibrated hydrophone (PVDFZ44-0400, Specialty Engineering Associates, Soquel, CA,
USA). Cells were exposed to sine-wave US-bursts with a 6.2% duty cycle and a 20-Hz pulse
repetition frequency for 30 seconds.
Preparation of microbubbles and dextran suspensions
The ultrasound contrast agent Sonovue® (Bracco, High Wycombe, UK) was reconstituted in
5 mL of saline solution according to the manufacturer’s protocol, resulting in a preparation containing 2-5·108 microbubbles/mL. Tetramethylrhodamine isothiocyanate (TRITC)-labeled
dextran (4.4, 70 or 155-kDa; Sigma-Aldrich), fluorescein isothiocyanate (FITC)-labeled
dextran (500-kDa; Sigma-Aldrich) or lysine-fixable FITC-labeled dextran (500-kDa, Molecular
Probes, Invitrogen) was added to 125 μL of Sonovue®, with a final concentration of 2 mg/mL
in 10 mL PBS.
Cellular distribution
Above described microbubble-dextran solution was added to the cells directly followed by
the US protocol. Immediately after UMTD, cells were washed with PBS at room temperature
and confocal laser microscopy images were taken with a 100x oil-immersion lens (Carl-
Zeiss, Sliedrecht, the Netherlands) to investigate the cellular distribution and localization of
the dextran.
Inhibition of endocytosis during UMTD
To prevent active uptake of extracellular molecules, cells were depleted from adenosine
triphosphate (ATP) by incubation with ATP-depletion buffer containing 50 mM NaN3 and 50
mM deoxyglucose in PBS supplemented with 1.8 mM Ca2+. To test the ATP depletion buffer,
cells were pre-incubated with ATP-depletion buffer or with PBS (no depletion) for 30
minutes, followed by 1-hour incubation with Alexa-fluor 488-conjugated transferrin (0.1
mg/mL), or with TRITC-labeled 70-kDa dextran (2 mg/mL), which is specifically taken up via
clathrin-coated pits23 or macropinocytosis25, respectively. Cells were pre-incubated with
ATP-depletion buffer or with PBS for 30 minutes, followed by the UMTD protocol. Finally,
cells were washed twice in PBS, mounted on a microscope slide, followed by direct
acquisition of confocal images using a 40x lens (Carl-Zeiss). SlideBookTM software
(Intelligent Imaging Innovations, I.I.I.; www.intelligent-imaging.com, Denver, CO, USA) was
used to assess the mean intensity of fluorescence (MIF) per cell.
To study the involvement of three main endocytosis pathways, cells were pre-treated 30
minutes with chlorpromazine (15 μM; Sigma-Aldrich), inhibitor of clathrin-mediated
endocytosis; filipin (4 μg/mL; Sigma-Aldrich), inhibitor of caveolin-mediated endocytosis or
wortmannin (0.1 μM; Sigma-Aldrich), inhibitor of macropinocytosis prior to UMTD of 4.4, 70,
155 and 500-kDa dextrans.

Endocytosis and pore formation
51
The specificity of the inhibitor was tested in a separate assay, where BAECs were either not
pre-treated or pre-treated for 30 minutes with one of the above mentioned endocytosis
inhibitors. Thereafter, cells were either incubated 1-hour with Alexa-fluor 488-conjugated
transferrin (Molecular Probes, Invitrogen, the Netherlands), which is specifically taken up by
clathrin-coated pits23 or with Alexa-fluor 488-conjugated cholera toxin subunit-B (Molecular
Probes), which is specific for caveolin-mediated endocytosis24. To assess the inhibitory
effect of the endocytosis inhibitors on macropinocytosis, cells were incubated 1-hour with
FITC-labeled 70-kDa dextran25. Afterwards, cells were fixed with 4% formaldehyde. Confocal
images were taken at 100x magnification using an oil-immersion lens (LSM410, Carl-Zeiss,
the Netherlands). The number of fluorescent vesicles per cell per image was counted, and
expressed as percentage of non-inhibited cells.
In vivo dextran delivery
Figure 1: Schematic overview of microbubble-dextran administration to rat femoral arteries.
Both femoral arteries were cannulated proximal to the aorta and connected with T-tubing to an
infusion pump (arrow). The internal iliac and deep femoral arteries were closed to optimize
microbubble-dextran delivery to the femoral artery. Area 1 was exposed to ultrasound (US) and area
2 served as control. The area of the artery between the dotted lines was dissected for analysis. An
example of the vessel is shown by 10x magnification image, with actin stained red and nuclei blue.
The animal study was approved by the Animal Research Committee at the VU University
Medical Center. Male Wistar rats (n=4, 400-450g; Harlan, Horst, the Netherlands) were
anesthetized with pentobarbital (60 mg/kg intraperitoneal) and ketamine HCl (70 mg/kg
intramuscular) with a pentobarbital maintenance dose (30 min/15 mg/kg intraperitoneal).
Rats were placed in a supine position on a heating pad maintaining body temperature at
37ºC. An intraperitoneal catheter was placed to administer pentobarbital. The trachea was

Chapter 4
52
intubated with polyethylene tubing to facilitate breathing. The animals received 75 IU/kg
heparin (Leo Pharmaceutical Products, Weesp, the Netherlands) intravenously to prevent
catheter clotting. Mean arterial pressure (100-120 mm Hg), and heart rate (340-380 bpm)
were continuously monitored via a catheter in the carotid artery connected to a pressure
transducer. Both femoral arteries were uncovered by opening the skin and cannulated in the
common iliac artery, schematically depicted in figure 1. The internal iliac and deep femoral
arteries were closed to optimize microbubble-dextran delivery to the femoral artery. The
microbubble-dextran (500-kDa, FITC-labeled, lysine-fixable) saline solution was infused
using bifurcated tubing at a constant rate of 4 mL/h. The tip of the US transducer was fixed
at 3 cm distance from the left femoral artery (right femoral artery served as control), with a
2% agarose gel between the tip of the transducer and the exposed artery for good US
conductance. Same US protocol as described above was applied to the in vitro situation.
Directly after US exposure, 4% formaldehyde in saline was infused for fixation of the
arteries, followed by 5 minute treatment of 0.05% Triton X-100 in saline for permeabilization
of the endothelial cells. Arteries were dissected, cut open longitudinally and fixed on silicone
plates. Arteries were stained for clathrin and caveolin-1 as described for BAECs. After
staining, arteries were placed on a microscope slide covered with VectashieldTM containing
nuclear stain DAPI, and sealed using a cover slip and colorless nail polish. Image acquisition
was performed as described in the section below.
Immunostaining for clathrin and caveolin-1
Directly following UMTD of the lysine-fixable FITC-labeled dextran (500-kDa), regions-of-
interest were cut from the Opticell� (approximately 1.5 cm2) and placed in PBS. Cells were
fixed in 4% formaldehyde 10 minutes at room temperature. Cells were washed three times
with PBS, permeabilized for 5 minutes in 0.05% Triton X-100 (Sigma-Aldrich) in PBS,
followed by three washes in PBS-Tween (0.5%, Tween 20; Sigma-Aldrich). Cells were
incubated with polyclonal goat anti-clathrin heavy chain, a marker for clathrin-mediated
endocytosis (Santa Cruz, the Netherlands) or with monoclonal mouse anti-caveolin-1 (Clone
C060; BD Biosciences, Breda, the Netherlands), a marker for caveolin-mediated
endocytosis; both antibodies were diluted 1:100. Cells were incubated overnight at 4�C,
washed three times with PBS-Tween, and incubated with both Cy3-labeled rat-anti-mouse
and Cy5-labeled donkey-anti-goat secondary antibodies (1:100, Molecular Probes) 30
minutes at room temperature in the dark. Cells were washed twice with PBS-Tween, washed
once with PBS and mounted on a microscope slide with mounting-medium containing DAPI
nuclear stain (VectashieldTM, Vector Laboratories, Burlingame, CA, USA). 3-Dimensional
(3D) images were acquired using a ZEISS Axiovert 200M MarianasTM inverted microscope
(I.I.I) equipped with a motorized stage (stepper-motor z-axis increments: 0.2 micron). Images
were taken using a 63x oil-immersion lens (Carl-Zeiss). A cooled CCD camera (C1280x1024
pixels; Cooke Sensicam, Cooke, Tonawanda, NY), recorded images with true 16-bit
capability. The camera is linear over its full dynamic range (up to intensities of over 4000)
while dark/background currents (estimated by the intensity outside the cells) are typically

Endocytosis and pore formation
53
<100. The microscope, camera, data viewing/processing were conducted/controlled by
SlideBookTM. This software was also used to deconvolve the 3D image stacks in order to
remove out-of-focus light, as well as to quantify the extent of co-localization for dextran with
clathrin or caveolin by calculating Pearson’s correlation factor. Pearson’s correlation factor lies between +1 and –1. A positive value implies a positive correlation, thus co-localization,
‘0’ implies no correlation, and a negative value implies an inverse correlation. As a control, the correlation factor between clathrin (Cy5)/DAPI and caveolin (Cy3)/DAPI was determined. Ultrasound and microbubble-induced pore formation
To study pore formation, the influx of calcium ions was measured with the fluorescent probe
Fluo-4 (Molecular Probes), a cell-permeant acetoxymethyl ester sensitive for free cytosolic
calcium. To acquire time-lapse images during US exposure the transducer was mounted on
the microscope, as described in15. To study the effect of inhibitors of endocytosis on the US
and microbubble-evoked calcium influx, cells were pre-incubated 30 minutes with
chlorpromazine, filipin and wortmannin at concentrations indicated above prior to the calcium
measurements
BAECs were pre-loaded with dextran molecules using the syringe loading protocol of
Clarke and McNeil26, with minor adaptations. In short, 1 mL of DMEM containing 2% PF-68
(Sigma-Aldrich, the Netherlands), 20 mg TRITC-labeled dextran (4.4 or 155-kDa) and 106
cells was drawn in and expelled through a 29-gauge needle for four times, using a sterile 1
mL syringe. Subsequently, culture medium was added to the dextran-loaded cell suspension
in a 1:1 ratio. This was repeated 5 times for each OpticellTM so a total of 10 mL of the
dextran-loaded cells mixture was added to an OpticellTM. Cells were allowed to recover
overnight. As positive control, dextran-loaded cells were permeabilized to release all dextran
from the cell, using 0.1% triton X-100 PBS solution for 5 minutes. Differences in
fluorescence were assed using ImagePro-plus 5.0. Mean intensity of fluorescence per cell
after triton X-100 treatment of the cells was used as baseline.
Statistics
Data are presented as mean±standard error of the mean (SEM). All experiments were
repeated at least three times. Per condition at least six microscopical fields were analyzed,
containing approximately 10-20 cells per field. Groups were tested for normal distribution
with one sample Kolmogorov-Smirnov test. Differences between groups were tested using a
one-way ANOVA with Bonferroni post-hoc analysis or the non-parametric Kruskal-Wallis test
with Dunn’s post-hoc test. Differences between groups in the experiment of calcium influx
were tested using two-way ANOVA with Bonferroni post-hoc analysis. A p-value lower than
0.05 was considered statistically significant.

Chapter 4
54
Results
Cellular distribution of differently sized dextrans
After UMTD dextran molecules of 4.4-kDa showed a homogeneous distribution throughout
the cytosol as well as in the nucleus (figure 2B). Dextran molecules of 70-kDa showed a
similar distribution pattern in the cytosol, but were absent in the nucleus (figure 2C). Larger
dextrans (155 and 500-kDa) showed a different cytosolic pattern of distribution after UMTD,
as they were mainly found in vesicle-like structures, but lacked nuclear localization (figure
2D and 2E, respectively). In the absence of US no uptake of dextran molecules was found
(figure 2A, results shown for 4.4-kDa).
Figure 2: Cellular distribution of fluorescent dextrans after UMTD. A. No uptake of 4.4-kDa
dextran in the absence of US. B. Homogeneous distribution in the cytosol, and nucleus of 4.4-kDa
dextran after UMTD. C. Homogeneous distribution in the cytosol of 70-kDa dextran, but absence of
nuclear localization. D. Localization of 155-kDa mainly in vesicle-like structures. E. Vesicular-like
localization of 500-kDa dextran.
A
70 kD10 um
UMTD 70No US 4.4
10 um
UMTD 4.4
10 um
C B
10 um
UMTD 155 k
D UMTD 500k
10 um
E

Endocytosis and pore formation
55
Figure 3: ATP depletion. Confocal images demonstrating uptake of transferrin and fluorescent
dextrans in the absence or presence of ATP depletion. Cells were pre-treated with PBS (no depletion)
or ATP-depletion buffer for 30 minutes. A,D,G,J. Relative negative controls; A. no transferrin, D. no
70 kDa dextran, G,J. no UMTD. B. Uptake of transferrin after 1-hour incubation in PBS, C. in ATP-
depletion buffer. E. Uptake of 70 kDa dextran after 1-hour incubation in PBS, F. in ATP-depletion
buffer. H. UMTD of 4.4 kDa dextran without depletion, I. after ATP depletion. K. UMTD of 500-kDa
dextran without depletion, L. after ATP depletion.

Chapter 4
56
Inhibition of endocytosis during UMTD
To further investigate whether vesicle-like dextran-positive structures found after UMTD
were endocytotic vesicles, UMTD of dextran was studied after overall inhibition of
endocytosis through ATP depletion of the cells as well as inhibition of specific endocytotic
pathways. Deprivation of cells from ATP resulted in inactivation of the endocytotic
machinery, as these cells were no longer capable to actively internalize transferrin (figure
3A-C) or 70-kDa dextran (figure 3D-F). Interestingly, UMTD of 4.4-kDa dextran was still
successful after ATP depletion (figure 3G-I). However, mean intensity of fluorescence
(MIF±SEM) decreased by 62% (no depletion: 365.4±15.1, ATP depletion: 138.7±13.3,
p<0.001). UMTD of 500-kDa dextran was completely inhibited when cells were ATP
depleted (figure 3J-L).
The specificity of the inhibitors of endocytosis was evaluated using specific substrates for
clathrin-mediated endocytosis, caveolin-mediated endocytosis and macropinocytosis. In
BAECs, chlorpromazine inhibited clathrin-mediated endocytosis of transferrin by
55.7±14.9%. Filipin inhibited caveolin-mediated endocytosis of choleratoxin subunit-B by
50.9±11.4%. Macropinocytosis of 4.4-kDa dextrans was inhibited by 61.7±7.6% when cells
were pre-treated with wortmannin. Importantly, all three inhibitors were found to have the
most pronounced effect on their respective pathway at the concentrations used (table I).
Blocking macropinocytosis (wortmannin), or clathrin-mediated endocytosis (chlorpromazine)
both caused a significant decrease in MIF after UMTD of all studied dextran sizes (figure 4).
Filipin, inhibiting caveolin-mediated endocytosis, caused a significant decrease in MIF after
UMTD of dextrans of 155 and 500-kDa (figure 4C,D), but not for 4.4 and 70-kDa dextrans
(figure 4A,B).

Endocytosis and pore formation
57
Figure 4: UMTD of dextrans in the presence of endocytosis blockers. Graphs show mean
intensity of intracellular fluorescence (MIF)±SEM for UMTD of all sizes of dextran, expressed as
percentage of control (non-exposed cells). A. Significant reduction in cellular uptake of 4.4, and 70-
kDa (B) dextrans in the presence of chlorpromazine (CPZ; clathrin-mediated uptake) and wortmannin
(macropinocytosis). Filipin (caveolin-mediated endocytosis) had no significant effect on the uptake of
4.4 and 70-kDa dextrans. C. Significant reduction in cellular uptake of 155-kDa, and 500-kDa (D)
dextrans for all blockers.
Co-localization of endocytosis markers and 500-kDa dextran molecules
To further substantiate the role of endocytosis, we investigated whether internalized 500-kDa
dextran co-localizes with clathrin and/or caveolin-1, which are established markers for two
main routes of endocytosis. Figure 5 shows clear co-localization of dextran with clathrin
(figure 5B,C) and to a minor extent with caveolin-1 (figure 5D,E), as demonstrated by the
yellow/orange color in the merged images of dextran (green) and clathrin/caveolin-1 (red).
The extent of co-localization was determined using Pearson’s correlation factor. A positive correlation was found for dextran with clathrin was 0.35±0.06 (p<0.001, compared to
hypothetical value of 0.0), for dextran with caveolin 0.19±0.05 (p<0.01). As control, no
correlation was found for DAPI (nuclei) with either Cy3 (0.01±0.01, p=0.3) or Cy5 channel (-
0.01±0.02, p=0.7) (both secondary antibodies).

Chapter 4
58
Figure 5: Co-localization of dextran with endocytosis markers after UMTD. One optical section
from a 3D-image stack is shown. A. Vesicle-like localization of 500-kDa dextran in green. B.
Immunostaining for clathrin in red. C. Co-localization of dextran and clathrin, demonstrated by the
yellow/orange color (indicated by arrows). D. Immunostaining for caveolin-1 in red. E. Co-localization
of dextran and caveolin, demonstrated by the yellow/orange color (indicated by arrows). DAPI was
used as nuclear counterstain.
In vivo dextran delivery
Results derived from in vivo experiments showed that dextran molecules of 500-kDa were
localized in vesicle-like structures in the endothelium of the rat femoral artery after UMTD
(figure 6A,B). No dextran was internalized in control artery not exposed to US. The
endothelium was stained for clathrin and caveolin-1, and clear changes could be detected in
the cellular pattern of both proteins in the US-exposed artery (figure 6D,F) compared to
control artery (figure 6C,E). Furthermore, part of the dextran-positive vesicles clearly co-
localized with clathrin (figure 6D), indicated by the yellow/orange color. Co-localization with
caveolin-1 was detected to a lesser degree (figure 6F). After determining Pearson’s correlation factor, results similar to the in vitro situation were found. A positive correlation
factor of 0.35±0.11 was found for clathrin, as well as for caveolin-1 (0.16±0.04). Both
correlations were significantly different from the hypothetical value of 0.0 (p<0.05). As
control, no correlation was found for DAPI with either Cy3 (-0.05±0.02, p=0.7) or Cy5 (-
0.04±0.02, p=0.7).
Clathrin Merged Dextran A

Endocytosis and pore formation
59
Figure 6: UMTD of 500-kDa dextran in vivo. Images are optical sections from 3D-image stacks from
the endothelial layer of the femoral arteries. A,C,E. Image from control artery not exposed to US,
demonstrating no dextran uptake. B,D,F. Image from artery exposed to US, demonstrating dextran
(green) uptake by the endothelium and localization in vesicle-like structures. C,D. Immunostaining for
clathrin in red. Panels demonstrate redistribution of clathrin-positive vesicles, indicated by more and
larger clathrin-positive vesicles (possibly early endosomes) after UMTD. Arrows indicate co-
localization of a part of the dextran-positive vesicles with clathrin. E,F. Immunostaining for caveolin-
1in red. Panels demonstrate redistribution of caveolin-1, indicated by larger internalized caveolin-
positive vesicles after UMTD, compared to a well-organized pattern on the cell membrane. However,
minor co-localization with dextran is observed (one arrow indicating yellow vesicle).
Caveolin
A
Clathrin C
Dextran B
E F
D

Chapter 4
60
Ultrasound and microbubble-induced pore formation
Previously, we ascribed the increase in intracellular calcium levels after US and
microbubbles exposure to transient pore formation in cardiomyoblast cells15. Also, US and
microbubbles caused influx of calcium ions in BAECs. Fluorescent intensity reached a peak
value of 186.4�3.4%, followed by a decrease towards basal levels (figure 7A). There was no
detectable change in the calcium influx in cells exposed to either US alone (no
microbubbles) (98.2�0.2%) or microbubbles alone (no US; 97.1�0.3%), or without both US
and microbubbles (94.3�0.3%) as respectively shown in figure 7B-D. In order to investigate
whether the inhibitors of endocytosis affected the calcium influx evoked by US and
microbubbles, the calcium influx was also measured in the presence of chlorpromazine,
filipin and wortmannin. It was found that chlorpromazine and wortmannin did not significantly
affect the US and microbubble-evoked influx (figure 7E). However, filipin caused a large
increase in the US and microbubble-evoked influx (320.4�7.2%, p<0.001).
Figure 7: US and microbubble-mediated calcium
influx. Live-cell measurements of intracellular calcium levels over time. Data shown as mean intensity of fluorescence (MIF)�SEM, expressed as percentage of MIF on t=0s. Dotted lines represent moments of US on and off-switch, respectively. A. Increase in MIF during US-exposed microbubbles (black squares). The absence of extracellular calcium in the buffer resulted in a minor increase in fluorescence, compared to US and microbubbles with calcium (p<0.001). B,C,D. Calcium influx controls. No influx of calcium ions was measured when cells were exposed to US alone (B), microbubbles alone (C) or no US and no microbubbles (D) E. Effect of endocytosis inhibitors on the US and microbubble-evoked calcium influx. Chlorpromazine and wortmannin have no significant effect on the US and microbubble-evoked calcium influx, however, filipin significantly augmented the US and microbubble-evoked calcium influx (p<0.001).
0 60 120 180 240 300 360 420
100
125
150
175
200
225US microbubbles No calcium
***
Time (sec)
%M
IF/c
ontr
ol
0 60 120 180 240 300 360 420
100
150
200
250
300
350US microbubbles Filipin Cpz Wortmannin
***
Time (sec)
%M
IF/c
ontr
ol
A E
0 60 120 180 240 300 360 42080
100
120
US only
Time (sec)
%M
IF/c
on
tro
l
0 60 120 180 240 300 360 42080
100
120
Bubbles only
Time (sec)
%M
IF/c
on
tro
l
0 60 120 180 240 300 360 42080
100
120
No US no bubbles
Time (sec)
%M
IF/c
on
tro
l
B
D
C

Endocytosis and pore formation
61
Furthermore, formation of transient pores was studied by cellular release of dextran following
exposure to US and microbubbles (figure 8). Cells were pre-loaded with dextran, and
following US exposure MIF significantly decreased to 63.4±2.1% for 4.4-kDa dextran (figure
8A) and to 79.1±2.3% for 155-kDa dextran (figure 8B), compared to cells not exposed to US
and microbubbles (100.0±2.7%, p<0.05). Because filipin did not inhibit uptake of 4.4 and 70-
kDa dextrans and augmented the US and microbubble-evoked calcium influx, its influence
on dextran release was explored. Treatment with filipin alone, without US and microbubbles,
did not cause a decrease in MIF (100.0±1.5%, figure 7). However, exposure of filipin-treated
cells to US and microbubbles caused significantly more release of the 4.4-kDa dextrans
(54.9±3.1%, p<0.05), compared to non-filipin-treated cells exposed to US and microbubbles
(63.4±2.1%) (figure 8a). Filipin-treatment of cells did not significantly alter the release of 155-
kDa dextran (75.6±2.3%) after US and microbubble exposure (figure 8b).
Figure 8: US and microbubble-mediated cellular dextran release. A. Mean intensity of
fluorescence (MIF)±SEM of 4.4-kDa dextran-loaded cells after US and microbubble-
exposure (grey bars), compared to cells not treated with US and microbubbles (black bars).
US-exposed microbubbles resulted in a significant release of dextran (p<0.05). Pre-
treatment of cells with filipin prior to US and microbubble-exposure, resulted in significantly
more dextran release (p<0.05), compared to cells that only received pre-treatment with filipin
(without US and microbubbles) and to cells exposed to US and microbubbles (no filipin). B.
155-kDa dextran loaded cells. Exposure of cells to US and microbubbles (grey bars) resulted
in a significant release of dextran (p<0.05), compared to cells not treated with US and
microbubbles (black bars). Filipin had no additional effect on release of 155-kDa dextran.
Release of 4.4-kDa dextran was significantly higher than release of 155-kDa dextran after
US and microbubble-exposure (p<0.05).
b
0
60
80
100
120
% M
IF /
cont
rol
*a
% M
IF /
cont
rol
0
60
80
100
120 ** * *
no filipin filipin no filipin filipin
A B

Chapter 4
62
Discussion
This is, to the best of our knowledge, the first study demonstrating that endocytosis plays a
key role in UMTD of macromolecules sized between 4 and 500-kDa besides transient pores.
The role of endocytosis was established by studying cellular localization of dextrans after
UMTD, uptake of dextrans during ATP depletion, and the effect of individual blockers of the
three main routes of endocytosis on dextran uptake. Furthermore, co-localization of 500-kDa
dextran with markers for different endocytosis pathways was demonstrated in vitro as well as
in vivo. In addition to endocytosis, we demonstrated the occurrence of transient pores in the
cell membrane by showing both influx of calcium ions and cellular release of pre-loaded
dextrans.
Studying cellular localization of fluorescent dextrans after UMTD, we found that the smaller
dextran molecules of 4.4 and 70-kDa were homogeneously distributed throughout the
cytosol. This is similar to the cellular distribution found after micro-injection of dextran
molecules from 3-70-kDa into the cytosol27, 28, indicating that during UMTD the small dextran
molecules enter cells via transient pores in the cell membrane. In contrast, dextran
molecules of 155 and 500-kDa were mainly localized in vesicle-like structures after UMTD,
indicating that the larger dextrans might be taken up via endocytosis29. When these dextran
molecules had entered via pores, a homogeneous cytosolic distribution would be expected,
comparable to the distribution of these dextran molecules after micro-injection27, 28.
Therefore, uptake of larger dextrans through UMTD appears to be mediated through other
pathways than pore formation. After this first indication of endocytosis, these experiments
were repeated while depriving the cell from ATP. Depleting the cells from ATP did not stop
the 4.4-kDa from entering the cell, but did significantly block the uptake by 62%. This
decrease in fluorescence may be explained by either a 62% contribution of the endocytotic
pathway or by a (partial) wash-out of the dextrans taken up via pores as these pores might
not have resealed, as this is also - like all cellular processes - an energy-dependent
process30. Interestingly, UMTD of 500-kDa dextran was completely blocked after ATP
depletion, suggesting endocytosis as a route of entry during UMTD. Endocytosis is further
evidenced as an important mechanism of UMTD by the decrease in cellular uptake of
dextran molecules after inhibition of clathrin-mediated endocytosis, caveolin-mediated
endocytosis and macropinocytosis. Interestingly, not only the uptake of larger dextrans was
inhibited by the endocytosis inhibitors, but also the smaller dextrans showed a similar
decrease after inhibiting clathrin-mediated endocytosis and macropinocytosis, although the
confocal images of the smaller dextrans indicated uptake via pores. This discrepancy might
be explained by the high level of fluorescence in the cytosol masking seperate vesicles.
Finally, co-localization of 500-kDa dextran with clathrin, and to a lesser degree caveolin-1,
further supported the role of endocytosis during UMTD.
Importantly, the in vitro findings pointing to the involvement of endocytosis were extended
to the in vivo situation. Using the same US parameters, 500-kDa dextrans were delivered
into endothelium of the rat femoral artery. Confocal images of the US and microbubble-
exposed artery showed conspicuous changes in the cellular pattern of caveolin-1 and

Endocytosis and pore formation
63
clathrin, compared to the artery not exposed to US, indicating translocation of caveolin and
clathrin upon UMTD. It has been described in literature that in vitro for example shear stress
can induce translocation of caveolin-131, 32. Furthermore, the dextran was clearly localized in
vesicle-like structures that partially co-localized with both clathrin, and to a lesser degree
caveolin-1, comparable to the in vitro data. These in vivo data further substantiated the role
of endocytosis in UMTD of macromolecules to endothelial cells.
All three main routes of endocytosis were involved in UMTD of dextran molecules of 155
and 500-kDa, as demonstrated by the effect of the inhibitors of these routes of endocytosis.
Caveolin-mediated endocytosis did not seem to be involved in UMTD of dextran molecules
of 4.4 and 70-kDa, as filipin was not able to block the uptake of these smaller dextrans.
However, it is known that filipin disrupts formation of caveolae by altering the distribution of
cholesterol in the membrane33, thereby changing the physical properties of the membrane.
This is confirmed by pre-treating the cells with filipin, followed by exposure to US and
microbubbles. Under these conditions, filipin enhanced the US and microbubble-induced
calcium influx three-fold. Secondly, filipin augmented the loss of cytosolic small fluorescent
dextrans following UMTD, but did not affect the loss of larger dextrans. Together, these data
suggest that filipin increased vulnerability of the cell membrane, and enhanced pore
formation during exposure to US and microbubbles. Thus, caveolin-mediated endocytosis is
also likely to play a role in UMTD of molecules ≤70-kDa. Unfortunately, replacing filipin with
another inhibitor of caveolin-mediated endocytosis would most likely also result in increased
formation of transient pores as these inhibitor all interfere with the physical properties of the
cell membrane34.
We previously demonstrated the occurrence of transient pores evoked by US and
microbubbles in cardiomyoblast cells. We showed that an increase in intracellular calcium
was caused by the influx of calcium ions from the extracellular environment through transient
pores in the cell membrane15. In the present study it was found that also in BAECs, US and
microbubbles evoked a calcium influx. Pore formation caused by US and microbubbles is
further supported by the cellular release of fluorescent dextrans. Cells pre-loaded with 4.4-
kDa dextran (diameter of 2.8 nm) showed a decrease in cytosolic fluorescence down to
63.4% after UMTD compared to only a small decrease down to 79.1% for 155-kDa dextran
(diameter of 17 nm). This indicates that the contribution of transient pores is less important
for UMTD of macromolecules ≥155-kDa using our US parameters. These data are in
contrast with the study of Mehier-Humbert et al. who suggested that dextran molecules with
a diameter between 11.6 and 37.0 nm were able to enter the cell via pores, and no
differences were found between molecule sizes13. However, the role of endocytosis in
cellular entry of these molecules was not excluded in that study.
It remains unclear how UMTD induces endocytosis. It has been demonstrated that US-
exposed microbubbles may cause a rise in temperature, which might affect membrane
permeability and endocytosis. However, the rise in temperature has only been demonstrated
for cavitating microbubbles35. Exposing microbubbles to US with our parameters does not
cause inertial cavitation and most likely also no increase in temperature. Several studies

Chapter 4
64
demonstrated that shear stress induces endocytosis in endothelial cells36-38. Flow of
extracellular fluid induced by oscillation of microbubbles in an US field may cause shear
stress and subsequent activation of endocytotic pathways. Furthermore, US and
microbubble-evoked generation of H2O2, as well as a rise in intracellular calcium levels are
involved in inducing endocytosis15, 18-21, 39. Another recent publication showed that resealing
of pores in the cell membrane, induced by a bacterial toxin, requires calcium-dependent
endocytosis to remove the pores from the plasma membrane. They also found that this
calcium-dependent endocytosis is required in a similar way to repair lesions formed in
mechanically porated cells40, which may be comparable with US and microbubble-porated
cells. Besides US and microbubble-induced uptake via endocytosis, another route of uptake
that has been proposed is fusion of microbubble shell components with the cell membrane,
especially in the case of lipid microbubbles. However, fusion has not yet been demonstrated
experimentally, only suggested4, 41. Furthermore, if fusion does take place, it is to be
expected that this will lead to a homogeneous distribution of the dextran in the cytosol. In
this study, we found a vesicular localization of the larger dextrans and a key role for
endocytosis, arguing against an important role for fusion.
To summarize, UMTD provides opportunities for new therapies due to its low toxicity, low
immunogenicity, non-invasive nature, local application and its cost-effectiveness. Another
advantage over other targeted delivery systems for therapeutic compounds is that molecular
imaging and therapeutic compound delivery can be performed simultaneously42. The finding
that the contribution of endocytosis and pore formation to intracellular delivery and
subsequent subcellular localization of the therapeutic compound is dependent on the
molecular size, should be taken into account when designing new effective therapies using
UMTD. Pharmaceutical chemical compounds are generally smaller than 4-kDa and may
have their target in the cytosol or nucleus, as they are small enough to pass the nuclear
pore. Proteins may range from 4 to 500-kDa. DNA, which needs to enter the nucleus for
effective therapy, often exceeds 500-kDa and is likely to be trapped in endosomes. This
compartmentalization of therapeutic compounds, and most importantly genes, may affect
therapy efficiency and should be taken into consideration when measuring drug action
following UMTD. On the other hand, as many crucial signalling events are known to occur in
these endosomes43, the endocytotic mechanism could also be exploited for therapy.
In conclusion, endocytosis plays a key role in UMTD of molecules sized between 4 and
500-kDa besides transient pore formation. The contribution of transient pores as a
mechanism of UMTD decreases, when molecule size increases. These findings provide
important new insight in the mechanisms of UMTD and will lead to the rational design of new
drug or gene therapies involving UMTD.

Endocytosis and pore formation
65
References
(1) Schlicher RK, Radhakrishna H, Tolentino TP, Apkarian RP, Zarnitsyn V, Prausnitz MR.
Mechanism of intracellular delivery by acoustic cavitation. Ultrasound Med Biol 2006
June;32(6):915-24.
(2) Mayer CR, Bekeredjian R. Ultrasonic gene and drug delivery to the cardiovascular system.
Adv Drug Deliv Rev 2008 June 30;60(10):1177-92.
(3) Newman CM, Bettinger T. Gene therapy progress and prospects: ultrasound for gene
transfer. Gene Ther 2007 March;14(6):465-75.
(4) Dijkmans PA, Juffermans LJ, Musters RJ, van Wamel A, ten Cate FJ, van Gilst W, Visser CA,
de Jong N, Kamp O. Microbubbles and ultrasound: from diagnosis to therapy. Eur J
Echocardiogr 2004 August;5(4):245-56.
(5) Bekeredjian R, Chen S, Grayburn PA, Shohet RV. Augmentation of cardiac protein delivery
using ultrasound targeted microbubble destruction. Ultrasound Med Biol 2005 May;31(5):687-
91.
(6) Unger EC, McCreery TP, Sweitzer RH, Caldwell VE, Wu Y. Acoustically active lipospheres
containing paclitaxel: a new therapeutic ultrasound contrast agent. Invest Radiol 1998
December;33(12):886-92.
(7) Chen S, Ding JH, Bekeredjian R, Yang BZ, Shohet RV, Johnston SA, Hohmeier HE, Newgard
CB, Grayburn PA. Efficient gene delivery to pancreatic islets with ultrasonic microbubble
destruction technology. Proc Natl Acad Sci U S A 2006 May 30;103(22):8469-74.
(8) Leong-Poi H, Kuliszewski MA, Lekas M, Sibbald M, Teichert-Kuliszewska K, Klibanov AL,
Stewart DJ, Lindner JR. Therapeutic arteriogenesis by ultrasound-mediated VEGF165
plasmid gene delivery to chronically ischemic skeletal muscle. Circ Res 2007 August
3;101(3):295-303.
(9) Taniyama Y, Tachibana K, Hiraoka K, Namba T, Yamasaki K, Hashiya N, Aoki M, Ogihara T,
Yasufumi K, Morishita R. Local delivery of plasmid DNA into rat carotid artery using
ultrasound. Circulation 2002 March 12;105(10):1233-9.
(10) van Wamel A, Bouakaz A, Versluis M, de Jong N. Micromanipulation of endothelial cells:
ultrasound-microbubble-cell interaction. Ultrasound Med Biol 2004 September;30(9):1255-8.
(11) Tachibana K, Uchida T, Ogawa K, Yamashita N, Tamura K. Induction of cell-membrane
porosity by ultrasound. Lancet 1999 April 24;353(9162):1409.
(12) van Wamel A, Kooiman K, Harteveld M, Emmer M, ten Cate FJ, Versluis M, de Jong N.
Vibrating microbubbles poking individual cells: drug transfer into cells via sonoporation. J
Control Release 2006 May 15;112(2):149-55.
(13) Mehier-Humbert S, Bettinger T, Yan F, Guy RH. Plasma membrane poration induced by
ultrasound exposure: implication for drug delivery. J Control Release 2005 May 5;104(1):213-
22.
(14) Deng CX, Sieling F, Pan H, Cui J. Ultrasound-induced cell membrane porosity. Ultrasound
Med Biol 2004 April;30(4):519-26.
(15) Juffermans LJ, Dijkmans PA, Musters RJ, Visser CA, Kamp O. Transient permeabilization of
cell membranes by ultrasound-exposed microbubbles is related to formation of hydrogen
peroxide. Am J Physiol Heart Circ Physiol 2006 October;291(4):H1595-H1601.

Chapter 4
66
(16) Duvshani-Eshet M, Machluf M. Therapeutic ultrasound optimization for gene delivery: a key
factor achieving nuclear DNA localization. J Control Release 2005 November 28;108(2-
3):513-28.
(17) Duvshani-Eshet M, Baruch L, Kesselman E, Shimoni E, Machluf M. Therapeutic ultrasound-
mediated DNA to cell and nucleus: bioeffects revealed by confocal and atomic force
microscopy. Gene Ther 2006 January;13(2):163-72.
(18) Juffermans LJ, Kamp O, Dijkmans PA, Visser CA, Musters RJ. Low-intensity ultrasound-
exposed microbubbles provoke local hyperpolarization of the cell membrane via activation of
BK(Ca) channels. Ultrasound Med Biol 2008 March;34(3):502-8.
(19) MacDonald PE, Eliasson L, Rorsman P. Calcium increases endocytotic vesicle size and
accelerates membrane fission in insulin-secreting INS-1 cells. J Cell Sci 2005 December
15;118(Pt 24):5911-20.
(20) Saliez J, Bouzin C, Rath G, Ghisdal P, Desjardins F, Rezzani R, Rodella LF, Vriens J, Nilius
B, Feron O, Balligand JL, Dessy C. Role of caveolar compartmentation in endothelium-
derived hyperpolarizing factor-mediated relaxation: Ca2+ signals and gap junction function
are regulated by caveolin in endothelial cells. Circulation 2008 February 26;117(8):1065-74.
(21) Sundqvist T, Liu SM. Hydrogen peroxide stimulates endocytosis in cultured bovine aortic
endothelial cells. Acta Physiol Scand 1993 October;149(2):127-31.
(22) Meijering BD, Henning RH, van Gilst WH, Gavrilovic I, van Wamel A, Deelman LE.
Optimization of ultrasound and microbubbles targeted gene delivery to cultured primary
endothelial cells. J Drug Target 2007 December;15(10):664-71.
(23) Zuhorn IS, Kalicharan R, Hoekstra D. Lipoplex-mediated transfection of mammalian cells
occurs through the cholesterol-dependent clathrin-mediated pathway of endocytosis. J Biol
Chem 2002 May 17;277(20):18021-8.
(24) Li H, Brodsky S, Basco M, Romanov V, De Angelis DA, Goligorsky MS. Nitric oxide
attenuates signal transduction: possible role in dissociating caveolin-1 scaffold. Circ Res 2001
February 2;88(2):229-36.
(25) Falcone S, Cocucci E, Podini P, Kirchhausen T, Clementi E, Meldolesi J. Macropinocytosis:
regulated coordination of endocytic and exocytic membrane traffic events. J Cell Sci 2006
November 15;119(Pt 22):4758-69.
(26) Clarke MS, McNeil PL. Syringe loading introduces macromolecules into living mammalian cell
cytosol. J Cell Sci 1992 July;102(Pt 3):533-41.
(27) Perez-Terzic C, Gacy AM, Bortolon R, Dzeja PP, Puceat M, Jaconi M, Prendergast FG,
Terzic A. Structural plasticity of the cardiac nuclear pore complex in response to regulators of
nuclear import. Circ Res 1999 June 11;84(11):1292-301.
(28) Seksek O, Biwersi J, Verkman AS. Translational diffusion of macromolecule-sized solutes in
cytoplasm and nucleus. J Cell Biol 1997 July 14;138(1):131-42.
(29) Miller DL, Quddus J. Sonoporation of monolayer cells by diagnostic ultrasound activation of
contrast-agent gas bodies. Ultrasound Med Biol 2000 May;26(4):661-7.
(30) Bement WM, Yu HY, Burkel BM, Vaughan EM, Clark AG. Rehabilitation and the single cell.
Curr Opin Cell Biol 2007 February;19(1):95-100.
(31) Fawzi-Grancher S, Sun RJ, Traore M, Stoltz JF, Muller S. Role of Ca2+ in the effects of shear
stress and TNF-alpha on caveolin-1 expression. Clin Hemorheol Microcirc 2005;33(3):253-61.

Endocytosis and pore formation
67
(32) Sun RJ, Muller S, Stoltz JF, Wang X. Shear stress induces caveolin-1 translocation in
cultured endothelial cells. Eur Biophys J 2002 February;30(8):605-11.
(33) Orlandi PA, Fishman PH. Filipin-dependent inhibition of cholera toxin: evidence for toxin
internalization and activation through caveolae-like domains. J Cell Biol 1998 May
18;141(4):905-15.
(34) Byfield FJ, randa-Espinoza H, Romanenko VG, Rothblat GH, Levitan I. Cholesterol depletion
increases membrane stiffness of aortic endothelial cells. Biophys J 2004
November;87(5):3336-43.
(35) Hilgenfeldt S, Lohse D, Zomack M. Sound scattering and localized heat deposition of pulse-
driven microbubbles. J Acoust Soc Am 2000 June;107(6):3530-9.
(36) Apodaca G. Modulation of membrane traffic by mechanical stimuli. Am J Physiol Renal
Physiol 2002 February;282(2):F179-F190.
(37) Niwa K, Sakai J, Karino T, Aonuma H, Watanabe T, Ohyama T, Inanami O, Kuwabara M.
Reactive oxygen species mediate shear stress-induced fluid-phase endocytosis in vascular
endothelial cells. Free Radic Res 2006 February;40(2):167-74.
(38) van Bavel E. Effects of shear stress on endothelial cells: possible relevance for ultrasound
applications. Prog Biophys Mol Biol 2007 January;93(1-3):374-83.
(39) Wu LG. Kinetic regulation of vesicle endocytosis at synapses. Trends Neurosci 2004
September;27(9):548-54.
(40) Idone V, Tam C, Goss JW, Toomre D, Pypaert M, Andrews NW. Repair of injured plasma
membrane by rapid Ca2+-dependent endocytosis. J Cell Biol 2008 March 10;180(5):905-14.
(41) Hernot S, Klibanov AL. Microbubbles in ultrasound-triggered drug and gene delivery. Adv
Drug Deliv Rev 2008 June 30;60(10):1153-66.
(42) Schneider M. Molecular imaging and ultrasound-assisted drug delivery. J Endourol 2008
April;22(4):795-802.
(43) Xu Y, Buikema H, van Gilst WH, Henning RH. Caveolae and endothelial dysfunction: filling
the caves in cardiovascular disease. Eur J Pharmacol 2008 May 13;585(2-3):256-60.

Chapter 4
68

Chapter 5
TGF-ß inhibits Ang II-induced MAPK p44/42 signaling in
vascular smooth muscle cells by Ang II type 1 receptor
downregulation
B.D.M. Meijering1,3, E.A. van der Wouden1, V.Pelgröm1, R.H. Henning1, K. Sharma2, L.E.
Deelman1.
1Department of Clinical Pharmacology, Groningen University Institute for Drug Exploration
(GUIDE), University Medical Center Groningen, University of Groningen, Groningen, The
Netherlands 2 Director, Translational Research in Kidney Disease, University of California at San
Diego/VA Medical System, San Diego, USA. 3 Interuniversity Cardiology Institute Netherlands, Utrecht, The Netherlands
J Vasc Res. 2009 Feb 10;46(5):459-468

Chapter 5
70
Abstract
Vascular changes in diabetes are characterized by reduced vasoconstriction and vascular
remodeling. Previously, we demonstrated that TGF-ß1 impairs AngII-induced contraction
through reduced calcium mobilization. However, the effect of TGF-ß1 on AngII-induced
vascular remodeling is unknown. Therefore, we investigated the effect of TGF-ß1 on AngII-
induced activation of the MAPK-p44/42 pathway in cultured rat aortic smooth muscle cells
(RASMC).
Activation of MAPK p44/42 was determined with a phospho-specific antibody. Angiotensin
type 1 receptor (AT1) and AT1 mRNA levels were measured by [3H]-candesartan-binding and
real-time PCR, respectively. AT1-gene transcription activity was assessed using AT1-
promoter-reporter constructs and by a nuclear runoff assay.
In TGF-ß1 pretreated cells, AngII-induced phosphorylation of MAPK-p44/42 was inhibited by
29% and 46% for p42 and p44, respectively, and AT1 density was reduced by 31%.
Furthermore, pretreatment with TGF-ß1 resulted in a 64% reduction in AT1 mRNA levels and
decreased AT1 mRNA transcription rate by 42%. Pretreatment with TGF-ß1 blocked AngII
induced proliferation of RASMC, while stimulating AngII induced upregulation of PAI-1.
In conclusion, TGF-ß1 attenuates AngII-mediated MAPK-p44/42 kinase signaling in RASMC
through downregulation of AT1 levels, which is mainly caused by the inhibition of
transcription of the AT1 gene.
Introduction
Vascular alterations are a common feature in patients with diabetes mellitus and consist of
abnormal growth, proliferation and migration of cells. In previous studies, we demonstrated
that in early diabetes, transforming growth factor ß1 (TGF-ß1) plays an important role in
mediating vascular dysfunction in both renal microvascular smooth muscle cells and in aortic
smooth muscle cells1.
One of the prominent vascular changes induced by diabetes and mediated by TGF-ß is
decreased sensitivity of vascular smooth muscle cells (VSMC) to angiotensin II (Ang II). We
previously demonstrated that aortic ring contraction in response to Ang II was impaired in
diabetic rats, but completely restored to normal in diabetic rats treated with anti-TGF-ß1
antibodies1. Further, VSMC isolated from diabetic rat aorta exhibited impaired Ang II-induced
cytosolic calcium signaling, but calcium signaling was normal in VSMC from diabetic rats
treated with anti-TGF-ß1 antibodies in vivo. Further, the effect of diabetes on Ang II-induced
calcium signaling was replicated in vitro by administration of TGF-ß1 and TGF-ß2 to aortic
VSMC in culture. As a possible mechanism, a downregulation of inositol 1,4,5-trisphosphate
receptors may be involved in TGF-ß-mediated impairment of Ang II-induced calcium
signaling in VSMC1.
Ang II signaling is mediated through two types of receptors, the angiotensin II type 1 (AT1)
and the angiotensin II type 2 (AT2) receptor. In rodents two distinct isoforms or subtypes of
AT1 exist, the AT1a and AT1b, with the AT1a being the predominant isoform in vascular

TGF-ß inhibits Ang II-induced MAPK p44/42 signaling
71
smooth muscle cells. Ang II-mediated vascular contraction and vascular hypertrophy is
mediated mainly through the AT1 2. The AT1 is a G-protein coupled seven-transmembrane
receptor that signals through several signaling pathways. Ang II-induced vascular
contraction is mediated mainly through the PLC/ IP3/ calcium route, while Ang II-induced
vascular remodeling in diabetes is mediated mainly through the MAPK p44/42 kinase
signaling pathway2. The involvement of the MAPK p44/42 pathway in vascular remodeling
has been demonstrated in several in vitro experiments. Inhibition of the MAPK p44/42
pathway with the MAP kinase (MEK) inhibitor, PD98059, completely blocked the growth
stimulatory effects of Ang II on VSMC2. In addition, the migration of vascular smooth muscle
cells by Ang II is mediated by the MAPK p44/42 pathway, although the signaling through
MAPK p38 appears to be predominant3.
Besides these effects on proliferation and migration, Ang II mediated activation of the MAPK
p44/42 pathway is involved in the accumulation of extracellular matrix (ECM) in VSMC. A
key mediator in this process is plasminogen activator inhibitor-1 (PAI-1), an inhibitor of the
conversion of inactive plasminogen to active plasmin. Plasmin is able to degrade fibrin and
ECM components and therefore PAI-1 contributes to an increased risk of thrombosis and
atherosclerotic plaque formation4-7. The expression of PAI-1 can be induced by both Ang II
and TGF-ß1, a process that can be inhibited by the MEK/ MAPK p44/42 inhibitor PD98059 8,
although other members of the MAPK signaling may be involved9, 10.
Although we have reported an inhibitory effect of TGF-ß1 on the Ang II induced activation of
the PLC/ IP3/ calcium route, the effect of TGF-ß1 on Ang II-induced activation of the MAPK
p44/42 signaling pathway in VSMC is still unclear. Therefore, the aim of this study is to
investigate the effect of TGF-ß1 on Ang II-induced activation of the MAPK p44/42 pathway in
cultured rat aortic smooth muscle cells.
Methods
Cell culture
Primary rat aortic smooth muscle cells (RASMC) were isolated from rat aorta as described
earlier1. Cells were cultured in DMEM supplemented with 1000 mg/l glucose, L-glutamine, 25
mM HEPES, pyruvate (Gibco BRL, The Netherlands), 10% of Bovine Calf Serum (PAA
laboratories, Germany), 100 units/ml of penicillin and 100 μg/ml streptomycin (Gibco BRL, The Netherlands) in a humidified incubator at 37°C and 5% CO2. When cells reached
confluence, they were passaged in a 1:3 ratio with trypsin EDTA (Gibco BRL, The
Netherlands). For all experiments, cells were used between passage 3 to 12.
Western blotting
Cells were washed three times using ice-cold phosphate buffered saline (PBS) and
subsequently lysed in 300 μl of ice-cold RIPA buffer (1% Igepal ca-630, 1% SDS, 5 mg/ml
sodium deoxycholate, 1 mM sodium orthovanadate, 10 mM ß-mercapto-ethanol, 40 μg/ml
PMSF, 100 μg/ml benzamidine, 500 ng/ml pepstatin A, 500 ng/ml leupeptine and 500 ng/ml

Chapter 5
72
aprotinin in PBS). Protein concentrations were determined using Bio-Rad protein assay (Bio-
Rad, The Netherlands). On a 7,5 % SDS-PAGE gel 10 μg of total protein was run,
transferred to nitrocellulose, and immunoblotted with the MAPK p44/42 (1:1,000 dilution)
antibody (sc-7383, Santa-Cruz, Germany).
Saturation binding assay
RASMC cells were cultured on 24-well cell culture plates. Twenty-four hours before the start
of the binding assay, the medium was replaced with fresh medium or fresh medium
supplemented with 10 ng/ml TGF-ß1. After 24 hours of incubation, cells were washed three
times with HBSS at 37˚C. Tritium-labeled candesartan ([3H]-candesartan) (629 Bq/mmol)
was added in a concentration series of 0-10 nM in a volume of 0.5 ml HBSS. Nonspecific
binding was determined by adding 1 μM cold candesartan. After 1 hour of incubation at
37˚C, plates were placed on ice and the cells were washed three times with ice-cold PBS.
Cells were subsequently lysed with 500 µl of 1 N NaOH and total protein content of the
lysate was determined using a DC protein assay (Biorad). Total protein content did not differ
between groups and the remaining lysate (490 µl) was transferred to a scintillation vial
containing 3 ml of scintillation fluid. Vials were counted for three minutes in a scintillation
counter. Analysis of the binding data was performed according to the method of Scatchard.
Real time PCR
The expression of AT1 (rat vascular AT1a), PAI-1, fibronectin, collagen I and III mRNA in rat
aortic smooth cells was analyzed using real-time two-step quantitative RT-PCR.
Quantification was performed with SYBR Green PCR reagents (Molecular Probes Europe,
Leiden, The Netherlands) and an ABI PRISM 5700 sequence detection system (Applied
Biosystems, Nieuwerkerk a/d IJssel, The Netherlands). A 50 μl PCR mixture contained 0.5 unit Taq polymerase (Eurogentec, Belgium), 5 μl of the supplied reaction buffer, 250 nM dATP, 250 nM dCTP, 250 nM dGTP, 500 nM dUTP, 2 mM MgCl2, 50 ng cDNA, 500 nM of
each gene specific primer, 1 μl of 50× ROX reference dye (Invitrogen, Breda, The Netherlands) and 1 μl of 10× Sybr Green I (Molecular Probes Europe, Leiden, The
Netherlands). The PCR profile consisted of 5 min at 95 °C, followed by 40 cycles with
heating to 95°C for 15 s and cooling to 60°C for 1 min. PCR product specificity and purity
was evaluated by gel-electrophoresis and by generating a dissociation curve following the
manufacturer’s recommendations. Sequence-specific PCR primers were purchased from
Biolegio (Nijmegen, Netherlands). The PCR primers used were as follows: AT1 sense: 5'-
CACCAATATCACAGTGTGCGC-3', AT1 antisense:5'-AGCGTCGAATTCCGAGACT C-3'
(AT1 receptor primer pair is specific for the rat vascular AT1a receptor), PAI-1 sense: 5’-ACCACGGTGAAGCAGGTGGACT-3’, PAI-1 antisense: 5’-AGCACCAGGC
GTGTCAGCTCAT-3’, fibronectin sense: 5’-CTGGATGATGGTGGACTGTACT-3’, fibronectin antisense: 5’-TCCTTCTTGCTCCATGTGTCTC-3’, collagen I sense: 5’-TGCCGTGACCTCAAGATGTG-3’, collagen I antisense: 5’-CACAAGCGTGCTGTAGGTGA-
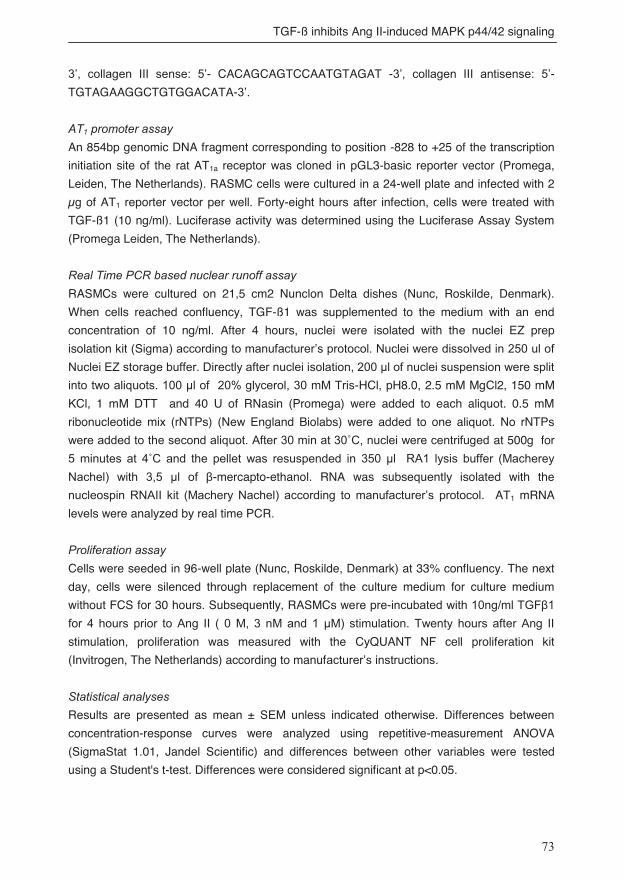
TGF-ß inhibits Ang II-induced MAPK p44/42 signaling
73
3’, collagen III sense: 5’- CACAGCAGTCCAATGTAGAT -3’, collagen III antisense: 5’- TGTAGAAGGCTGTGGACATA-3’.
AT1 promoter assay
An 854bp genomic DNA fragment corresponding to position -828 to +25 of the transcription
initiation site of the rat AT1a receptor was cloned in pGL3-basic reporter vector (Promega,
Leiden, The Netherlands). RASMC cells were cultured in a 24-well plate and infected with 2
µg of AT1 reporter vector per well. Forty-eight hours after infection, cells were treated with
TGF-ß1 (10 ng/ml). Luciferase activity was determined using the Luciferase Assay System
(Promega Leiden, The Netherlands).
Real Time PCR based nuclear runoff assay
RASMCs were cultured on 21,5 cm2 Nunclon Delta dishes (Nunc, Roskilde, Denmark).
When cells reached confluency, TGF-ß1 was supplemented to the medium with an end
concentration of 10 ng/ml. After 4 hours, nuclei were isolated with the nuclei EZ prep
isolation kit (Sigma) according to manufacturer’s protocol. Nuclei were dissolved in 250 ul of Nuclei EZ storage buffer. Directly after nuclei isolation, 200 μl of nuclei suspension were split into two aliquots. 100 μl of 20% glycerol, 30 mM Tris-HCl, pH8.0, 2.5 mM MgCl2, 150 mM
KCl, 1 mM DTT and 40 U of RNasin (Promega) were added to each aliquot. 0.5 mM
ribonucleotide mix (rNTPs) (New England Biolabs) were added to one aliquot. No rNTPs
were added to the second aliquot. After 30 min at 30˚C, nuclei were centrifuged at 500g for
5 minutes at 4˚C and the pellet was resuspended in 350 μl RA1 lysis buffer (Macherey Nachel) with 3,5 μl of β-mercapto-ethanol. RNA was subsequently isolated with the
nucleospin RNAII kit (Machery Nachel) according to manufacturer’s protocol. AT1 mRNA
levels were analyzed by real time PCR.
Proliferation assay
Cells were seeded in 96-well plate (Nunc, Roskilde, Denmark) at 33% confluency. The next
day, cells were silenced through replacement of the culture medium for culture medium
without FCS for 30 hours. Subsequently, RASMCs were pre-incubated with 10ng/ml TGFβ1 for 4 hours prior to Ang II ( 0 M, 3 nM and 1 μM) stimulation. Twenty hours after Ang II stimulation, proliferation was measured with the CyQUANT NF cell proliferation kit
(Invitrogen, The Netherlands) according to manufacturer’s instructions.
Statistical analyses
Results are presented as mean ± SEM unless indicated otherwise. Differences between
concentration-response curves were analyzed using repetitive-measurement ANOVA
(SigmaStat 1.01, Jandel Scientific) and differences between other variables were tested
using a Student's t-test. Differences were considered significant at p<0.05.

Chapter 5
74
Results
MAP kinase p44 and p42
Stimulation of RASMC with Ang II resulted in a dose-dependent increase in phosphorylated
MAP kinase p44 and p42 (figure 1A). In control cells, maximal levels of phosphorylated
p44/42 were observed at 3 nM Ang II. Pre-incubation of the cells for 24 hours with TGF-ß1
(10 ng/ml) resulted in a right-shift of the dose-response curve to Ang II (figure 1A), showing a
50-fold increase in EC50. Pre-incubation for 24 hours with TGF-ß1 (10 ng/ml) did not affect
basal phosphorylated MAPK p44/42 levels (figure 1A, see 0 M Ang II).
We next examined the dose-dependency of this Ang II-inhibiting effect of TGF-ß1 on
phosphorylation of p42/p44 (figure 1B). TGF-ß1 impaired Ang II-induced MAPK p44/42
signaling in a dose-dependent manner with an apparent maximal effect at 10 ng/ml, although
higher concentrations were not investigated.
Figure 1: TGF-ß1 impairs Ang II-induced MAPK p44/42 signaling. A. Incubation of RASMC cells
with TGF-ß1 (10 ng/ml) for 24 hours results in a right-shift of the dose-response curve to Ang II (n= 3).
ERK phosphorylation was significantly attenuated in TGF-ß1 treated cells at -8.5 log[Ang II] compared
to controls. B. TGF-ß1 impairs Ang II-induced MAPK p44/42 signaling in a dose-dependent manner.
RASMC were pretreated for 24 hours with different concentrations of TGF-ß1. After 5 minutes of
stimulation with Ang II (3 nM), cells were harvested and phosphorylation of MAPK p44/42 was
determined by Western blot (n=3, values normalized to untreated cells).
TGF-ß1 and AT1 binding characteristics
To establish the mechanism of TGF-ß1-impaired Ang II-induced MAPK p44/42 signaling, we
first examined regulation of AT1 by assessing receptor binding characteristics. Scatchard
analysis of the equilibrium binding studies showed that Bmax and equilibrium Kd values were
985 ± 24 dpm and 0.09 ± 0.01 nM for control cells, respectively (figure 2). Incubation of cells
with TGF-ß1 significantly decreased Bmax to 680 ± 18 dpm, without an effect on Kd (0.07 ±

TGF-ß inhibits Ang II-induced MAPK p44/42 signaling
75
0.01 nM). These data demonstrate pretreatment with TGF-ß1 to result in a downregulation of
AT1, without changes in receptor affinity for candesartan.
AT1 downregulation and MAPK p44/42 signaling
We next investigated whether the timing of AT1 downregulation matched the timing of the
inhibition of Ang II-mediated MAPK p44/42 signaling. RASMC cells were incubated with
TGF-ß1 (10 ng/ml) at different incubation times and both the levels of specific candesartan
binding and phosphorylated p44/p42 were determined (figure 3). These results demonstrate
that the timing of the inhibition of Ang II-mediated MAPK p44/42 signaling parallels the
downregulation of AT1.
TGF-ß1 and AT1 mRNA levels
To establish the mechanism of AT1 downregulation by TGF-ß1, we determined AT1 mRNA
levels in RASMC after incubation with TGF-ß1 (10 ng/ml) with different incubations times
(figure 4A). Incubation with TGF-ß1 for 4 hours and longer resulted in decreased AT1 mRNA
levels. Next, we investigated whether decreased AT1 mRNA levels by TGF-ß1 were the
result of decreased transcriptional activity of the AT1 gene. Incubation of RASMC with TGF-
ß1 (10 ng/ml) resulted in decreased AT1 promoter activity after 12 hours of incubation (figure
4B). These data were further supported by the real time PCR based nuclear runoff assay.
Thirty minutes of in vitro transcription resulted in a 1.3 fold increase in AT1 mRNA in control
cells whereas 4h treatment of TGF-ß1 totally blocked transcription of AT1 mRNA (figure 5A).
Figure 2: Scatchard plots of the binding
of candesartan. Cells were cultured for 24
hours in the absence (�) and presence of
TGF-ß1 (10 ng/ml) (�) (n= 3). Scatchard
analysis of the equilibrium binding studies
showed that Bmax and equilibrium Kd values
were 985 ± 24 dpm and 0.09 ± 0.01 nM for
control cells, respectively. Incubation of cells
with TGF-ß1 significantly decreased Bmax to
680 ± 18 dpm, without an effect on Kd (0.07
± 0.01 nM).

Chapter 5
76
Figure 3: Time course of TGF-ß1-mediated downregulation of AT1 and inhibition of Ang II-
induced MAPK p44/42 activation in RASMC. A. Effect of TGF-ß1 on candesartan binding. Cells
were incubated with 10ng/ml TGF-ß1 for 0-24 hours, and specific candesartan binding was
subsequently determined. B. Effect of TGF-ß1 pretreatment on Ang II-induced MAPK p44/42
phosphorylation. Cells were pretreated with 10ng/ml TGF-ß1 for 0-24 hours, and subsequently
stimulated with 3nM Ang II for 5 minutes. Cells were harvested and pERK phosphorylation was
determined by Western blot. Data are expressed as % of values obtained in cells unexposed to TGF-
ß1 (n=3).
Figure 4: Time course of TGF-ß1 effect on AT1 mRNA and AT1 promoter activity. A. Effect of
TGF-ß1 on AT1 mRNA levels. B. Effect of TGF-ß1 on AT1 promoter activity. Data are expressed as %
of values obtained in cells unexposed to TGF- ß1 (n=3, * p<0.05 vs. baseline).

TGF-ß inhibits Ang II-induced MAPK p44/42 signaling
77
Figure 5: Effect of TGF-ß1 on AT1 mRNA stability and AT1 gene transcription. A. Nuclear Runoff
assay on AT1 gene transcription. AT1 gene activity was determined in nuclei from control and TGF-ß1
pretreated cells (n=9, *p<0.05 vs. baseline). B. AT1 mRNA levels were determined after blockage of
transcription with actinomycin D in the absence (�) and presence of TGF-ß1 (�) (n=3). Data are
expressed as % of values obtained in cells unexposed to TGF- ß1.
TGF-ß1 and AT1 mRNA stability
Further, we investigated whether the decrease in AT1 mRNA levels by TGF-ß1 is resulting
from changes in AT1 mRNA stability. To this end, all transcription of mRNA was blocked by
incubating the cells with actinomycin D prior to administration of TGF-ß1. In control cells, the
half-life of AT1 mRNA levels was approximately 6 hours. Incubation with TGF-ß1, did not
affect the half-life of AT1 mRNA levels (fig. 5B), resulting in identical rates of AT1 mRNA
decay for both TGF-ß1-treated and control cells. Also, identical AT1 mRNA decay rates were
observed in untreated and treated cells when TGF-ß1 was added to the cells 1 hour before
the addition of actinomycin D (data not shown). Therefore, incubation with TGF-ß1 does not
affect the stability of the AT1 mRNA.
Proliferation and fibrotic markers
To assess the functional implications of the interaction of TGF-ß and Ang II signaling, the
proliferation and expression of profibrotic genes was assessed. Stimulation of RASMC with
Ang II resulted in a dose dependent increase in proliferation in control cells. TGF-ß1 (10
ng/ml) itself increased proliferation slightly, however 4h of pre-incubation of the cells with
TGF-ß1 (10 ng/ml) completely blocked Ang II induced proliferation (figure 6).

Chapter 5
78
Figure 6: Effect of TGF-ß1 pretreatment on Ang II induced RASMC proliferation. RASMC were
pretreated for 4 hours with TGF-ß1 (10 ng/ml) and subsequently exposed to 0 nM, 3 nM or 1 µM Ang
II for 24 hours. TGF-ß1 completely blocked Ang II induced proliferation. (n≥9 *p<0.05 vs untreated control). Data are expressed as % of values obtained in cells unexposed to TGF- ß1.
Finally, we examined the expression of the fibrotic markers PAI-1, fibronectin, collagen I and
collagen III (figure 7). Stimulation of RASMC with Ang II resulted in increased mRNA levels
of PAI-1 and fibronectin. TGF-ß1 (10 ng/ml) itself increased PAI-1 expression. Pre-
incubation with TGF-ß1 (10 ng/ml) strongly augmented Ang II induced PAI-1 expression,
indicating a synergistic effect of TGF-ß1 and Ang II on PAI-1 expression. The expression of
collagen I was decreased after exposure to 3nM Ang II. The expression of collagen III was
not affected by Ang II or TGF-ß1.

TGF-ß inhibits Ang II-induced MAPK p44/42 signaling
79
Figure 7: Effect of TGF-ß1 pretreatment and Ang II on the expression of fibrotic markers.
RASMC were pretreated for 4 hours with TGF-ß1 (10ng/ml) and subsequently exposed to 0nM, 3nM
or 1µM Ang II for 24 hours. A. TGF-ß1 and Ang II act synergistically on the expression of PAI-1.
(*p<0.05 vs untreated control, #p<0.05 vs same concentration Ang II without TGF-ß1 pretreatment).
B. Fibronectin expression was increased by Ang II. C. Collagen I expression was reduced by 3nM
Ang II. D. Collagen III expression was not affected. Data are expressed as % of values obtained in
cells unexposed to TGF- ß1.
Discussion
The present study demonstrates that TGF-ß1 inhibits the Ang II-induced MAPK p44/42
signaling pathway in cultured RASMC. In TGF-ß1 pretreated cells, we observed an inhibition
of Ang II-induced phosphorylation of MAPK p44/42 and a reduction in AT1 density, without
an effect on receptor affinity for candesartan. In addition, AT1 mRNA levels were down
regulated and accompanied by a decrease in transcriptional activity of the AT1 gene, without
a reduction in AT1 mRNA stability.
The kinetics of the inhibition of Ang II-mediated MAPK p44/42 signaling by TGF-ß1 closely
followed the kinetics of AT1 mRNA downregulation. In addition, the downregulation of AT1
mRNA levels was accompanied by a reduction in AT1 promoter activity, although the
reduction in AT1 promoter activity lagged behind the downregulation of AT1 mRNA levels,
probably due to the stability of the luciferase reporter-protein. Furthermore, the nuclear
runoff assay demonstrated that pretreatment with TGF-ß1 for 4 hours resulted in decreased

Chapter 5
80
AT1 mRNA levels and that AT1 gene transcription had halted. As the downregulation of AT1
mRNA levels by TGF-ß1 did not involve changes in the stability of the AT1 mRNA, we
conclude that the downregulation of AT1 mRNA by TGF-ß1 is the result of decreased
transcription of the AT1 gene.
Downregulation of AT1 levels has been described previously in TGF-ß1 treated primary
renal proximal tubule cells11. Moreover, decreased transcriptional activity of the AT1
promoter by TGF-ß appears to be a general mechanism for downregulation of AT1 levels in
multiple tissues in experimental diabetes11, 12. Indeed, decreased levels of AT1 in VSMC
exposed to high glucose was already reported in 1992 12, although the involvement of TGF-
ß1 and its effects on MAPK p44/42 signaling has not been demonstrated before. In contrast
to our findings, transcriptional upregulation of human AT1 by TGF-ß1 has recently been
reported in human lung fibroblasts13. However, vascular smooth muscle cells contain a
specific set of transcription factors14 and therefore the difference in AT1 regulation may arise
from cell-type specific gene regulation. Furthermore, in rodents two subtypes of the AT1
receptor exist, while in humans only a single AT1 subtype is present. The promoters of the
human AT1 and rat vascular AT1a genes differ considerably and may explain the difference in
TGF-ß1 mediated AT1 regulation in human fibroblasts and rat vascular smooth muscle cells.
The decreased transcription of the AT1 gene resulted in a reduction in the number of
binding sites for the specific AT1 blocker candesartan, indicating a reduction in the number of
AT1 receptors on the plasmamembrane of RASMC pretreated with TGF-ß1. Previously, it
has been demonstrated that the specific downregulation of AT1 mRNA levels using siRNA
against AT1, results in decreased AT1 receptor levels and inhibition of MAPK p44/42
signaling15. We therefore conclude that the inhibition of Ang II induced MAPK p44/42
signaling in TGF-ß1 pretreated RASMC is most likely caused by decreased gene
transcription of the AT1 gene and decreased AT1 receptor levels. It is however unclear how
the observed moderate decrease in AT1 receptor levels, could result in an increase of the
EC50 of AngII by a factor of 50. Possibly, post-translational modifications to the AT1 could
alter the affinity of the AT1 for AngII as has been demonstrated previously16. However, we
did not observe a change in the affinity of the AT1 for the competitive antagonist candesartan
after TGF-ß1 pretreatment. It is therefore unlikely that pretreatment with TGF-ß1 results in
conformational changes to the AngII binding site of the AT1. Alternatively, inhibition of down-
stream coupling of the AT1 to G-proteins and second-messenger systems may be additional
mechanisms for inhibiting Ang II induced MAPK p44/42 signaling in TGF-ß1 pretreated
RASMC. Previously, it has been demonstrated that TGF-ß1 could inhibit the epidermal
growth factor (EGF) and alpha1B-Adrenergic receptors by modifying their phosphorylation
status17, 18. It is however unclear whether TGF-ß1 could have similar effects on AT1
receptors.
Several studies have demonstrated that the hypertrophic effects of Ang II on VSMC in
experimental models of diabetes are mediated through the MAPK p44/42 signaling
pathway2, 19. In a recent paper by Wang et al.20, it has been demonstrated that activation of
AT1 by Ang II in VSMC, results in the activation of the Smad2/3 signaling pathway, a

TGF-ß inhibits Ang II-induced MAPK p44/42 signaling
81
profibrotic pathway that is also activated by TGF-ß. Our study demonstrates for the first time
that TGF-ß1 inhibits the Ang II-mediated MAPK p44/42 signaling pathway. Therefore the
cross-talk between the Ang II and TGF-ß1 signaling pathways appears to be bi-directional.
We demonstrated that Ang II mediated proliferation of RASMC could be completely
inhibited by pretreatment with TGF-ß1. This is in line with a previous study demonstrating
that Ang II induced proliferation of human vascular smooth muscle cells was mediated
through AT1 and MEK2. Therefore the inhibition of Ang II mediated proliferation of TGF-ß1
pretreated RASMC is most likely caused by the impaired MAPK p44/42 signaling.
Furthermore, it has been demonstrated that TGF-ß1 could also inhibit EGF mediated MAPK
p44/42 signaling and proliferation of human epithelial cells through inhibition of the EGF
receptor17. Therefore TGF-ß1 mediated inhibition of MAPK p44/42 signaling and proliferation
appears to apply to multiple receptor systems and cell-types.
In contrast to the effect of TGF-ß1 pretreatment on proliferation, inhibition of MAPK p44/42
signaling by pretreatment with TGF-ß1 augmented Ang II induced PAI-1 expression in
RASMC. This is surprising, as several studies have demonstrated that PAI-1 expression is
dependent on MEK8, 21-24. Possibly, PAI-I expression may be induced through other MAPK
routes. It has been demonstrated that both TGF-ß1 and Ang II can signal through the
Reactive Oxygen Species (ROS) p38MAP/ JNK route8, 25, 26. Indeed, in fibroblasts, TGF-ß1
induced PAI-1 expression is dependent on this pathway25. Furthermore, PAI-1 expression
may be mediated by HIF-1α expression through Ang II mediated stimulation of AT2 receptors27. However, the involvement of the p38MAP/ JNK or other pathways in the
synergistic upregulation of PAI-1 by TGF-ß1 and Ang II in RASMC remains to be
established.
The pathophysiological relevance of the inhibitory effect of TGF-ß1 on MAPK p44/42 is still
unclear. Previous studies have suggested that the balance between vascular fibrosis and
vascular proliferation may be controlled by the relative levels of Ang II and TGF-ß20, 28.
Indeed, in our study, pretreatment with TGF-ß1 completely inhibited Ang II induced
proliferation of RASMC, while Ang II and TGF-ß1 acted synergistically on the increased
expression of the early fibrotic marker PAI-1. In recent papers20, 29, 30 a new model has
emerged to describe the interaction between AT1 and TGF-ß1 signaling in vascular
remodeling. In these studies, it has been demonstrated that Ang II can directly stimulate the
intracellular mediators of TGF-ß1 signaling, the Smads 2 and 3. This activation of Smads 2/3
appears to be bimodal in nature. In the initial phase at 15 minutes, Ang II directly activates
Smads 2/ 3 through the AT1 and via MAPK p44/42. In the delayed response to Ang II at 24
hours, paracrine production of TGF-ß1 maintains Smad3 activation, leading to the activation
of profibrotic genes. Our current findings suggest that the inhibition of Ang II mediated MAPK
p44/42 signaling by TGF-ß1 may be part of a negative feedback loop that attenuates the
direct activation of Smads 2/3 by Ang II and inhibits excessive Ang II mediated smooth
muscle cell proliferation.
In conclusion, in this study we provide the pharmacological characteristics of the TGF-ß1-
induced decrease in Ang II-mediated MAP kinase signaling in rat aortic smooth muscle cells.

Chapter 5
82
We demonstrate that TGF-ß1 attenuates Ang II-mediated MAPK p44/42 signaling in rat
aortic smooth muscle cells through downregulation of AT1 levels, which seems mainly
dependent on the inhibition of transcriptional activity of the AT1 gene. Pretreatment with
TGF-ß1 completely inhibited Ang II mediated proliferation of RASMC but synergistically
increased Ang II induced PAI-1 expression.

TGF-ß inhibits Ang II-induced MAPK p44/42 signaling
83
References
(1) Sharma K, Deelman L, Madesh M, Kurz B, Ciccone E, Siva S, Hu T, Zhu Y, Wang L, Henning
R, Ma X, Hajnoczky G. Involvement of transforming growth factor-beta in regulation of
calcium transients in diabetic vascular smooth muscle cells. Am J Physiol Renal Physiol 2003
December;285(6):F1258-F1270.
(2) Touyz RM, Deng LY, He G, Wu XH, Schiffrin EL. Angiotensin II stimulates DNA and protein
synthesis in vascular smooth muscle cells from human arteries: role of extracellular signal-
regulated kinases. J Hypertens 1999 July;17(7):907-16.
(3) Lee HM, Lee CK, Lee SH, Roh HY, Bae YM, Lee KY, Lim J, Park PJ, Park TK, Lee YL, Won
KJ, Kim B. p38 mitogen-activated protein kinase contributes to angiotensin II-stimulated
migration of rat aortic smooth muscle cells. J Pharmacol Sci 2007 September;105(1):74-81.
(4) Schafer K, Muller K, Hecke A, Mounier E, Goebel J, Loskutoff DJ, Konstantinides S.
Enhanced thrombosis in atherosclerosis-prone mice is associated with increased arterial
expression of plasminogen activator inhibitor-1. Arterioscler Thromb Vasc Biol 2003
November 1;23(11):2097-103.
(5) Eitzman DT, Westrick RJ, Xu Z, Tyson J, Ginsburg D. Plasminogen activator inhibitor-1
deficiency protects against atherosclerosis progression in the mouse carotid artery. Blood
2000 December 15;96(13):4212-5.
(6) Zunker P, Schick A, Padro T, Kienast J, Phillips A, Ringelstein EB. Tissue plasminogen
activator and plasminogen activator inhibitor in patients with acute ischemic stroke: relation to
stroke etiology. Neurol Res 1999 December;21(8):727-32.
(7) Johansson L, Jansson JH, Boman K, Nilsson TK, Stegmayr B, Hallmans G. Tissue
plasminogen activator, plasminogen activator inhibitor-1, and tissue plasminogen
activator/plasminogen activator inhibitor-1 complex as risk factors for the development of a
first stroke. Stroke 2000 January;31(1):26-32.
(8) Suzuki M, Akimoto K, Hattori Y. Glucose upregulates plasminogen activator inhibitor-1 gene
expression in vascular smooth muscle cells. Life Sci 2002 November 22;72(1):59-66.
(9) Yang C, Patel K, Harding P, Sorokin A, Glass WF. Regulation of TGF-beta1/MAPK-mediated
PAI-1 gene expression by the actin cytoskeleton in human mesangial cells. Exp Cell Res
2007 April 1;313(6):1240-50.
(10) Kutz SM, Hordines J, Keown-Longo PJ, Higgins PJ. TGF-beta1-induced PAI-1 gene
expression requires MEK activity and cell-to-substrate adhesion. J Cell Sci 2001
November;114(Pt 21):3905-14.
(11) Park SH, Han HJ. The mechanism of angiotensin II binding downregulation by high glucose in
primary renal proximal tubule cells. Am J Physiol Renal Physiol 2002 February;282(2):F228-
F237.
(12) Williams B, Tsai P, Schrier RW. Glucose-induced downregulation of angiotensin II and
arginine vasopressin receptors in cultured rat aortic vascular smooth muscle cells. Role of
protein kinase C. J Clin Invest 1992 November;90(5):1992-9.
(13) Martin MM, Buckenberger JA, Jiang J, Malana GE, Knoell DL, Feldman DS, Elton TS. TGF-
beta1 stimulates human AT1 receptor expression in lung fibroblasts by cross talk between the
Smad, p38 MAPK, JNK, and PI3K signaling pathways. Am J Physiol Lung Cell Mol Physiol
2007 September;293(3):L790-L799.

Chapter 5
84
(14) Hautmann MB, Adam PJ, Owens GK. Similarities and differences in smooth muscle alpha-
actin induction by TGF-beta in smooth muscle versus non-smooth muscle cells. Arterioscler
Thromb Vasc Biol 1999 September;19(9):2049-58.
(15) Li XC, Zhuo JL. Selective knockdown of AT1 receptors by RNA interference inhibits Val5-
ANG II endocytosis and NHE-3 expression in immortalized rabbit proximal tubule cells. Am J
Physiol Cell Physiol 2007 July;293(1):C367-C378.
(16) Boulay G, Chretien L, Richard DE, Guillemette G. Short-term desensitization of the
angiotensin II receptor of bovine adrenal glomerulosa cells corresponds to a shift from a high
to a low affinity state. Endocrinology 1994 November;135(5):2130-6.
(17) Semlali A, Jacques E, Plante S, Biardel S, Milot J, Laviolette M, Boulet LP, Chakir J. TGF-
beta suppresses EGF-induced MAPK signaling and proliferation in asthmatic epithelial cells.
Am J Respir Cell Mol Biol 2008 February;38(2):202-8.
(18) Romero-Avila MT, Flores-Jasso CF, Garcia-Sainz JA. alpha1B-Adrenergic receptor
phosphorylation and desensitization induced by transforming growth factor-beta. Biochem J
2002 December 1;368(Pt 2):581-7.
(19) Natarajan R, Scott S, Bai W, Yerneni KK, Nadler J. Angiotensin II signaling in vascular
smooth muscle cells under high glucose conditions. Hypertension 1999 January;33(1 Pt
2):378-84.
(20) Wang W, Huang XR, Canlas E, Oka K, Truong LD, Deng C, Bhowmick NA, Ju W, Bottinger
EP, Lan HY. Essential role of Smad3 in angiotensin II-induced vascular fibrosis. Circ Res
2006 April 28;98(8):1032-9.
(21) Chen HC, Feener EP. MEK1,2 response element mediates angiotensin II-stimulated
plasminogen activator inhibitor-1 promoter activation. Blood 2004 April 1;103(7):2636-44.
(22) Samarakoon R, Higgins CE, Higgins SP, Kutz SM, Higgins PJ. Plasminogen activator
inhibitor type-1 gene expression and induced migration in TGF-beta1-stimulated smooth
muscle cells is pp60(c-src)/MEK-dependent. J Cell Physiol 2005 July;204(1):236-46.
(23) Samarakoon R, Higgins PJ. MEK/ERK pathway mediates cell-shape-dependent plasminogen
activator inhibitor type 1 gene expression upon drug-induced disruption of the microfilament
and microtubule networks. J Cell Sci 2002 August 1;115(Pt 15):3093-103.
(24) Ding L, Xu J, Luo X, Chegini N. Gonadotropin releasing hormone and transforming growth
factor beta activate mitogen-activated protein kinase/extracellularly regulated kinase and
differentially regulate fibronectin, type I collagen, and plasminogen activator inhibitor-1
expression in leiomyoma and myometrial smooth muscle cells. J Clin Endocrinol Metab 2004
November;89(11):5549-57.
(25) Vayalil PK, Iles KE, Choi J, Yi AK, Postlethwait EM, Liu RM. Glutathione suppresses TGF-
beta-induced PAI-1 expression by inhibiting p38 and JNK MAPK and the binding of AP-1, SP-
1, and Smad to the PAI-1 promoter. Am J Physiol Lung Cell Mol Physiol 2007
November;293(5):L1281-L1292.
(26) Baas AS, Berk BC. Differential activation of mitogen-activated protein kinases by H2O2 and
O2- in vascular smooth muscle cells. Circ Res 1995 July;77(1):29-36.
(27) Wolf G, Schroeder R, Stahl RA. Angiotensin II induces hypoxia-inducible factor-1 alpha in PC
12 cells through a posttranscriptional mechanism: role of AT2 receptors. Am J Nephrol 2004
July;24(4):415-21.

TGF-ß inhibits Ang II-induced MAPK p44/42 signaling
85
(28) Yokote K, Kobayashi K, Saito Y. The role of Smad3-dependent TGF-beta signal in vascular
response to injury. Trends Cardiovasc Med 2006 October;16(7):240-5.
(29) Sorescu D. Smad3 mediates angiotensin II- and TGF-beta1-induced vascular fibrosis: Smad3
thickens the plot. Circ Res 2006 April 28;98(8):988-9.
(30) Rodriguez-Vita J, Sanchez-Lopez E, Esteban V, Ruperez M, Egido J, Ruiz-Ortega M.
Angiotensin II activates the Smad pathway in vascular smooth muscle cells by a transforming
growth factor-beta-independent mechanism. Circulation 2005 May 17;111(19):2509-17.

Chapter 5
86

Chapter 6
Antibody mediated targeting of microbubbles to the
vasculature of diabetic kidneys
L.E. Deelman1, B.D.M. Meijering1, R.H. Henning1, J.J. Rychak2, K. Sharma3
1Department of Clinical Pharmacology, University Medical Center Groningen, Groningen,
The Netherlands 2Targeson, LLC, Charlottesville, VA, USA 3Center for Renal Translational Medicine, UCSD/VA San Diego Health System, La Jolla,
California, USA
Manuscript in preparation

Chapter 6
88
Abstract
Drugs can be delivered locally using ultrasound and microbubbles targeted drug delivery.
When microbubbles are injected intravenously, local delivery of drugs can be achieved by
applying ultrasound to specific tissues or organs. The targeting of microbubbles using
antibodies against vascular disease markers would render the concentration of microbubbles
in the target tissue dependently on the level of antigen. This allows for a less invasive
method for monitoring disease progression without the need for biopsies. Furthermore, this
approach may be used therapeutically if the antibodies are able to neutralize factors involved
in the progression of disease. In the present study we explored the feasibility of targeting
microbubbles bearing neutralizing antibodies to the vasculature of diabetic kidneys in
experimental diabetes using neutralizing antibodies against TGF-ß and P-selectin.
Neutralizing antibodies against TGF-ß and P-selectin were attached to Targestar B
microbubbles via avidin/biotin coupling chemistry. Targeted microbubbles were injected
intravenously in control and diabetic C57/Bl6 mice and accumulation of microbubbles in the
kidney was observed using a Siemens Sequoia ultrasound imaging platform in Contrast
Pulse Sequencing mode.
TGF-ß and P-selectin targeted microbubbles targeted specifically to the diabetic kidney
and were retained in the kidney. A high intensity ultrasound pulse was able to destroy the
microbubbles. However, the released neutralizing antibodies were not detectable in the
kidney using fluorescent microscopy.
Introduction
It has been demonstrated that ultrasound and microbubble mediated delivery is a promising
vector for local drug delivery. A significant body of prior work has established that low-
frequency ultrasound energy induces sonoporation in targeted cells in vitro and in vivo;
microbubbles have been shown to potentiate the sonoporation effect by several orders of
magnitude1, 2. Examination of the behavior of microbubbles in an acoustic field has revealed
the formation of transient microporation and signal transduction events1-5. In addition, the
involvement of endocytosis in ultrasound and microbubble mediated delivery of large
molecules has recently been demonstrated6.
Microbubble induced delivery has been shown to result in efficient transfection with good
cell viability, and can be performed within FDA-approved acoustic safety thresholds.
Microbubble-based delivery has primarily been investigated in the context of gene delivery7-
11, although recent work has explored the feasibility of delivery of drugs12. Microbubbles have
been shown to be useful for delivering drugs in models of thrombosis13 and cancer14-16.
Local delivery using ultrasound mediated drug therapy can be accomplished by applying
ultrasound to specific tissues and organs. This effect can be mediated in a wide variety of
settings using most conventional ultrasound imaging platforms and low-frequency
therapeutic ultrasound devices.
Intravenous injection of microbubbles is the most convenient route of administration in
vascular ultrasound and microbubble delivery therapy. However, when microbubbles

Antibody mediated targeting of microbubbles
89
distribute throughout the total blood volume, the concentration of microbubbles drops
dramatically. Furthermore, microbubbles and drugs quickly separate after intravenous
injection if both are not directly coupled. For this reason, most in-vivo studies relied on
microbubble infusion directly upstream of the target organ.
Gas
biotinylated ligand
streptavidin
biotin
PEG
Figure 1: Schematic of Targeson’s biotinylated contrast agent,
Targestar-B. Biotinylated PEG
molecules are anchored to the lipid
shell, and ligands are attached via
avidin/biotin coupling chemistry.
Recent advances in microbubble technology allows for the coupling of antibodies to the
shell of the microbubble (figure 1), enhancing the retention of the microbubbles in specific
organs and allowing for the specific delivery of drugs to the target tissue. Destruction of the
microbubble shell using locally applied ultrasound releases the drug within the target tissue.
This approach would specifically deliver drugs to the target tissue, contributing to the
development of a clinical ultrasound and microbubble mediated delivery therapy. In addition,
the specific retention of targeted-microbubbles to the diseased tissue, may enable
monitoring of the progression of disease without the need for biopsies. In such a strategy,
the presence of disease markers can be quantified using targeted microbubbles and
conventional low-power ultrasound-imaging platforms.
In the present study, we aimed at evaluating the feasibility of targeting microbubbles to the
diabetic kidney using antibodies directed against TGF-ß and P-selectin. P-selectin is known
to be upregulated in the kidney of diabetic humans and in experimental models of diabetes
and thus presents an excellent molecular target for specific renal targeting. Although TGF-ß
is activated in diabetic nephropathy and is expressed on cells that line the blood vessels, it is
not extensively used as a targeting entity. As high concentrations of latent TGF can be found
in the blood, targeting would require an antibody that is specific for active TGF-ß. The
neutralizing monoclonal TGF-ß antibody 2G7 is specific for active TGF-ß.
TGF-ß has been established as an important cytokine intimately involved in tissue fibrosis.
TGF-ß has been found to be up-regulated in a variety of kidney diseases characterized by
excess matrix deposition, including diabetic kidney disease. Further, the involvement of
TGF-ß as mediator of experimental diabetic kidney disease was clearly demonstrated in
experiments using neutralizing TGF-ß antibodies17, 18. Although the negative effects of TGF-
ß in kidney have been widely studied, some TGF-ß expression may be necessary for normal
organ function. The TGF-ß1 knockout mouse develops a multi-focal autoimmune process

Chapter 6
90
which is likely mediated by the effect of TGF-ß to finely modulate T cell subsets, B cells, and
macrophages19, 20. Inhibition of TGF-ß signaling through over-expression of Smad7 resulted
in severe pathological alterations in multiple epithelial tissues, indicating an important role of
TGF-ß signaling in development and maintenance of homeostasis of epithelial tissues21.
Therefore, a complete blockade of all TGF-ß signaling pathways may result in unwanted
side-effects in non-renal tissues.
Previously, we demonstrated that the chronic type 1 diabetic mouse22 and the db/db
mouse overexpress TGF-ß in the glomeruli17. Therefore we hypothesize that administration
of TGF-ß antibody complexed with microbubbles will localize to cells that overexpress TGF-
ß in the diabetic kidney. The likely target cells are mesangial cells as these cells have clearly
been demonstrated to stimulate TGF-ß protein production in the diabetic kidney and they are
exposed to the luminal surface of the circulation. Given their unique location, the mesangial
cell would be in a prime location to have the circulating TGF-ß antibody-microbubble
complex localize to this site. As the microbubble can be visualized with ultrasound, the
trapping of microbubbles will provide a real time, non-invasive readout of TGF-ß production
in the diabetic glomeruli. Destruction of the microbubbles will release the neutralizing TGF
antibody from the microbubble, increasing the availability of the neutralizing antibody within
the target tissue. A similar approach can be taken with P-selectin antibodies. An optimization
of this approach would provide a potential clinical application to identify patients at high risk
for progressive diabetic nephropathy, even if on standard of care therapy.
The endothelial selectin P-selectin is a biomarker for various inflammatory disorders and
has been found to be upregulated in both diabetic patients and in experimental models of
diabetes23, 24. Previously, we have used the Targestar-B coupling scheme to conjugate
biotinylated P-selectin monoclonal antibodies, and several selectin binding glycoconjugates
to the surface of biotin-bearing microbubbles25-28. We have shown that these ligands mediate
specific adhesion to P-selectin in vitro using the flow chamber assay. Furthermore, these
selectin-avid microbubbles were subsequently used to image post-ischemic kidney injury in
a mouse28. Selectin-targeting strategies have also been utilized to image ischemic injury in
several mouse models of myocardial injury29, 30. Further, neutralizing P-selectin antibody
therapy has been effective in reducing the influx of neutrophils in experimental models of
myocardial ischemia-reperfusion injury31. However, the efficacy of P-selectin antibody
therapy in attenuating injury in diabetic nephropathy remains to be established.
In the present study we explore the feasibility of targeting microbubbles to the vasculature
of diabetic kidneys in experimental diabetes by coating them with neutralizing antibodies
against TGF-ß and P-selectin.
Materials and methods
Microbubble Synthesis and Analysis
Microbubbles were synthesized at Targeson (Charlottesville, VA, USA) using established
protocols and existing equipment. A mixture of 1 mg/mL poly(ethylene glycol stearate)
(Sigma), 2 mg/mL disteroyl phosphatidylcholine (Avanti), 0.4 mg/mL 1,2-distearoyl-3-

Antibody mediated targeting of microbubbles
91
trimethylammoniumpropane (Avanti), and 0.05 mg/mL biotin-PEG-distearoyl
phosphoethanolamine (Avanti) was sonicated to clarity in normal saline using a probe-type
sonicator (Misonix; Farmingdale, NY), while bubbling perfluorocarbon gas (Flura; Newport,
TN) through the dispersion. This procedure generated lipid-stabilized microbubbles bearing
a cationic charge. Approximately 2-5% of the lipid molecules bear a biotin residue, which
formed the basis for coupling the TGF and P-selectin antibodies.
Unreacted components not incorporated into microbubbles were removed by centrifugal
washing for 2 minutes at 400g. Microbubbles of the desired diameter were isolated from the
raw dispersion by floatation. The dispersion was be placed in a 100 mL syringe and
positioned upright. Large microbubbles possess a greater buoyant force, and will travel to
the top of the syringe more rapidly than smaller microbubbles; unwanted large microbubbles
(10-30 �m diameter) were thus isolated from the bulk by collecting the infranatant after
allowing sufficient time for the large particles to float to the top of the syringe.
Microbubbles were packaged into crimp-seal vials containing 1-2 mL of microbubble
dispersion and the balance perfluorocarbon gas. Microbubble synthesis, sizing, and
packaging were performed under aseptic conditions in a laminar flow cabinet.
Targeting Ligand Conjugation
Microbubbles were targeted to P-selectin and TGF-ß by means of a surface-bound targeting
ligand. The anti-P-selectin antibody R40.34 has been shown to mediate specific retention of
microbubbles to P-selectin in vitro and in vivo28. As high concentrations of latent TGF can be
found in the blood, targeting requires an antibody that is specific for active TGF-ß. The
neutralizing monoclonal TGF-ß antibody 2G7 is specific for active TGF-ß. Approximately
10% of the neutralizing antibodies were labeled with a Fitc-fluorescent dye to enable
detection of the delivered antibodies in the kidney.
Microbubbles were incubated with 3 �g streptavidin per 107 microbubbles for 30 minutes,
then centrifugally washed at 400xg for 2 minutes to remove unreacted streptavidin.
Biotinylated antibody was conjugated to the microbubble surface by incubation at 8 �g
antibody per 107 microbubbles, as in Rychak26. Antibody conjugation was assessed
spectrophotometrically.
Animals
Diabetes in C57/Bl6 mice (18 weeks) was induced by treatment with streptozotocin (STZ
50mg/kg body weight) over five days. This protocol induces hyperglycemia and glomerular
hypertrophy, and is an established model for type 1 diabetes. Two weeks after induction of
diabetes, mice were anesthetized with an intraperitoneal injection of 125 mg/kg body mass
ketamine (Parke-Davis; Morris Plains, NJ), 12.5 mg/kg xylazine (Phoenix Scientific; St.
Joseph, MO) and 0.025 mg/kg atropine sulfate (Elkins-Sinn; Cherry Hill, NJ) and the ventral
surface was clipped and depilated. Body temperature was maintained using a heat pad.
Microbubbles bearing antibody were administered at a dose of 4x10⁴ microbubbles per gram
body mass via a tail-vein injection.

Chapter 6
92
Ultrasound Imaging and Destruction of Targeted Microbubbles
A Siemens Sequoia ultrasound imaging platform was used to observe microbubble
accumulation in the mouse kidney. The scanner was configured for small-animal imaging by
the manufacturer, and a small parts transducer (15L8 operating at 7 – 14 MHz) was used for
all experiments. The kidney and adjacent tissues (liver, gallbladder, bowel) were visualized
in B-mode (greyscale) at 14 MHz. The kidney was imaged in the long axis with the mouse
placed in the left lateral position. In some animals, the kidney was imaged at a slightly
oblique angle to permit visualization of adjacent liver. Contrast Pulse Sequencing (CPS), an
imaging scheme with high sensitivity to microbubbles, was used to image adherent
microbubbles at 8 MHz. The microbubble signal was visualized using a color map in shades
of orange. Microbubble wash-in was imaged at low mechanical index (non-destructive
imaging) to verify delivery to the kidney; imaging was re-commenced 10 minutes after
administration. After collecting several images, a low-frequency destructive pulse was
applied, which served to destroy the microbubbles within the beam. Imaging was continued
for 1 minute after microbubble destruction.
Fluorescent microscopy
Immediately after imaging, the abdomen of the mouse was opened by a mid-line incision
and both kidneys were excised. Kidneys were cut in to smaller fragments, embedded in
tissue-tek and frozen in liquid nitrogen. 7 µm sections were cut and the presence of the fitc-
labeled antibodies was evaluated using confocal-microscopy.
Western-blotting
Kidney fragments were lysed in 300 μl of ice-cold RIPA buffer (1% Igepal ca-630, 1% SDS,
5 mg/ml sodium deoxycholate, 1 mM sodium orthovanadate, 10 mM ß-mercapto-ethanol, 40
μg/ml PMSF, 100 μg/ml benzamidine, 500 ng/ml pepstatin A, 500 ng/ml leupeptine and 500
ng/ml aprotinin in PBS). Protein concentrations were determined using Bio-Rad protein
assay (Bio-Rad, The Netherlands). On a 5-20 % SDS-PAGE gel, 20 μg of total protein was
run and transferred to nitrocellulose.
Polyclonal HRP conjugated anti-mouse IgG secondary antibody, HRP-conjugated
streptavadin and HRP-conjugated anti-mouse-IgG2b antibody (sc-2062, Santa Cruz) were
used for detection of the mouse 2g7 TGF-ß IgG2b antibody.
Results
Prior to microbubble administration, the kidney and adjacent tissues (liver, gallbladder,
bowel) were visualized in B-mode (greyscale) at 14 MHz (figure 2). Furthermore, Color
Doppler showed arterial blood flow and arterial branching in the mouse kidney. CPS imaging
prior to microbubble injection demonstrated some artifacts in the skin, but not in liver or
kidney.

Antibody mediated targeting of microbubbles
93
Kidney cortex
Kidney medulla
liver
head
A B
DC
Figure 3: Representative images of adherent microbubbles in healthy and diabetic mice 10
minutes after microbubble injection. Organ positions were outlined from B-mode images: liver is
outlined in green and kidney is outlined in red. Accumulation of targeted microbubbles in liver, but not
kidney, is apparent in healthy mice. In diabetic mice, additional specific accumulation of P-selectin
and TGF- ß targeted microbubbles was observed in kidney.
Figure 2: Pre-contrast images
of mouse kidney.
Pre-contrast images of mouse
kidney in long axis at 14 MHz in
B-mode (A) and with liver and
regions of kidney indicated (B).
Color Doppler image of kidney
in long axis shows arterial flow
in kidney (C). A representative
pre-contrast CPS image shows
good tissue signal suppression
with some artifact from tissue at
skin line (arrows) before
microbubble administration (D).

Chapter 6
94
Accumulation of targeted microbubbles in the diabetic kidney
Ten minutes after microbubble injection, diabetic mice showed appreciable accumulation of
microbubbles bearing anti-P-selectin and anti-TGF- ß mAb in the kidney, while healthy
control animals showed minimal microbubble accumulation (figure 3). In animals imaged at
an oblique angle in which the liver was visible, focal accumulation of microbubbles was
observed in the adjacent liver. Microbubble destruction was verified by the disappearance of
the microbubble contrast signal after the application of the destructive sequence. No
replenishment of the microbubble signal was observed after destruction, suggesting that
circulating microbubbles were cleared during the 10 minute dwell time.
Detection of anti-TGF-ß antibodies in the kidney
Using fluorescent microscopy we aimed at detecting the fluorescently labeled anti-TGF-ß
antibody in both the kidney exposed to the destructive ultrasound pulse and in the
contralateral kidney that had not been exposed to ultrasound. In both kidneys, we
occasionally observed staining in the glomerulus and in the tubulointerstitial space (figure 4).
No intact microbubbles could be detected in the kidney that had not been exposed to
ultrasound.
Figure 4: Detection of Fitc-labeled anti-TGF-ß antibody. Confocal laser scanning microscopy was
used to detect the Fitc-labeled anti-TGF-ß antibody in the kidneys exposed to the destructive
ultrasound pulse. Occasionally, staining could be observed in the glomerulus (A) and in the tubular
interstitium (B). Similar results were obtained in the kidney that was not exposed to the destructive
ultrasound pulse (data not shown).
Next, we aimed at detecting the anti-TGF-ß antibodies in the kidney by Western-blotting
using a polyclonal HRP conjugated anti-mouse IgG secondary antibody, HRP-conjugated
streptavadin or a HRP-conjugated anti-mouse-IgG2b antibody. For this, both diabetic and
control animals were injected with either anti-TGF-ß-microbubbles or non-conjugated

Antibody mediated targeting of microbubbles
95
microbubbles. All blots showed strong signals in the lanes of mice injected with non-
conjugated microbubbles, indicating the presence of high background levels of mouse IgG,
biotin-like epitopes and mouse IgG2b, respectively (figure 5). Injection of anti-TGF-ß
microbubbles did not result in a further increase of these signals.
Figure 5: Detection of anti-TGF-ß antibody in the kidney by Western blot. Diabetic and
control mice were injected with either anti-TGF-ß-microbubbles (T) or non-conjugated
microbubbles (C). Approximately 10 minutes after injection, animals were killed and the
kidneys were snap frozen in liquid nitrogen. Kidneys homogenates were analyzed by
Western blot. A. The polyclonal HRP conjugated anti-mouse IgG secondary antibody
detected both the light and heavy chains of IgG molecules present in the kidney. No
increase in IgG’s could be observed in mice injected with the anti-TGF-ß-microbubbles. B.
HRP-conjugated streptavadin reacted with molecules larger than 100kDa, indicating that
TGF-B CON TGF-B CONIg
G in
tens
ity (
AU
)0
2e+4
4e+4
6e+4
8e+4
1e+5
1e+5TGF-B microbubblenon-conjugated
Diabetic Non-diabetic
TGF-B CON TGF-B CON
Bio
tin in
tens
ity (
AU
)
0
2e+4
4e+4
6e+4
8e+4
1e+5
1e+5
Diabetic Non-diabetic
TGF-B CON TGF-B CON
IgG
2b in
tens
ity (
AU
)
0
2e+4
4e+4
6e+4
8e+4
1e+5
1e+5
Diabetic Non-diabetic

Chapter 6
96
molecules other than biotin-labeled IgG’s were detected. Similar results were obtained in
mice that were not injected with microbubbles (data not shown). No increase in signal could
be observed in mice injected with anti-TGF-ß-microbubbles. C) The HRP-conjugated anti-
mouse-IgG2b antibody detected the heavy chain of mouse IgG2b molecules present in the
kidney. No increase in IgG2b molecules could be observed in mice injected with the anti-
TGF-ß-microbubbles.
Discussion
In the present study we demonstrate that microbubbles can be targeted to the vasculature of
diabetic kidneys in experimental diabetes using neutralizing antibodies against TGF-ß and
P-selectin. Therefore, these microbubbles may be used in a diagnostic setting. Targeted
microbubbles can be used to quantify disease progression as has been demonstrated with
microbubbles targeted to mucosal addressin cellular adhesion molecule-1 (MAdCAM-1) in
experimental ileitis32. As the involvement of TGF-ß has been demonstrated in several (renal)
diseases, anti-TGF-ß microbubbles may be used to detect and monitor the progression of
kidney disease.
Previously we have shown that neutralizing antibodies directed against TGF-ß attenuated
kidney hypertrophy and decreased extracellular matrix gene expression in experimental
models of diabetic kidney disease17, 18. Furthermore, combination therapy of anti-TGF-ß
antibody with an ACE inhibitor completely arrested progressive diabetic nephropathy in the
rat33. For these studies in small rodents, large amounts of anti-TGF-ß antibody were needed.
The implementation of the anti-TGF-ß antibody therapy in humans would be extremely
costly, due to even larger amounts of antibody needed. Local delivery of anti-TGF-ß
antibody directly to the kidney would require lower amounts of antibody, while reducing
unwanted side-effects. Recently several large biotech and pharmaceutical companies have
developed humanized anti-TGF-ß antibodies. Their use has been limited by the potential for
systemic side effects. The major concern has been an effect on the immune system and in
potentially disrupting the beneficial wound healing process in non-renal sites34-38. Therefore
our approach to deliver anti-TGF-ß antibodies to the kidney using targeted microbubbles
would be a major advance towards a personalized and targeted approach.
Although P-selectin is upregulated in diabetes, it is unclear whether neutralizing P-selectin
antibody therapy would be beneficial in diabetic kidney disease. Neutralizing P-selectin
antibody therapy in the kidney has been successfully employed in models of kidney
ischemia28 and glomerulonephritis39. In these models, the influx of neutrophils and platelets
could be inhibited by P-selectin antibodies. Although diabetic nephropathy was not
considered an inflammatory disease in the past, recent studies have demonstrated the role
of neutrophils and other inflammatory cells in diabetic nephropathy (reviewed by Galkina et
al.40), indicating that neutralizing P-selectin antibody therapy may also be useful in diabetic
kidney disease.

Antibody mediated targeting of microbubbles
97
In the present study, we targeted molecules that were exposed to the lumen of blood
vessels. However, the delivery of antibodies may not be confined to the endothelium as
gene delivery of perivascular cells has been demonstrated in vivo following intravenous
administration of plasmid-bearing microbubbles7. This suggests that extravascular
deposition of antibodies is possible, and may be related to microbubble fragmentation due to
applied high-power ultrasound. Microbubble-potentiated drug delivery is thus not limited to
the endothelium, although microbubbles remain confined (due to the several-micron
diameter of the microbubbles) within the intravascular compartment until release by
ultrasound.
Although ultrasound imaging of the kidney demonstrated the accumulation of anti-TGF-ß
microbubbles in the kidney, we only occasionally detected fluorescently labeled antibodies in
the kidney after microbubble destruction. In addition, no intact microbubbles could be
detected in the kidney that was not exposed to the destructive ultrasound pulse. As
individual microbubbles could be easily visualized by fluorescent microscopy prior to
injection, these results suggest that microbubbles are destroyed by the procedure of snap-
freezing and subsequent manipulations.
At present, it is unclear why the fluorescently labeled antibodies could not be detected well
in the kidney. Microbubble destruction by the high intensity ultrasound pulse may have
released the attached antibodies with subsequent flushing of labeled antibodies out of the
kidney by the blood stream. However, labeled antibodies were also poorly detectable in
kidneys that were not exposed to the high intensity ultrasound pulse. As the microbubbles
were still present in the kidney at the moment of excision, the destruction of microbubbles by
the freezing procedure may have resulted in dispersion of the attached antibodies and the
fluorescent properties of the individual Fitc-labeled antibodies may have been too low for
detection. For future research, alternative strategies for antibody labeling should be
employed. Possibly, conjugation of antibodies with quantum dots would enable the detection
of individual antibodies.
Detection of the anti-TGF-ß antibody (mouse monoclonal IgG2b) in mouse kidney using
Western blotting was hindered by high background levels in control kidneys. High levels of
mouse IgG and IgG2b molecules are present in both diabetic and non-diabetic animals.
Furthermore, the biotin-groups on the labeled antibody could not be used for specific
detection of the anti-TGF-ß antibody as high background levels of biotin-like epitopes are
present in the kidney. Radioactive or quantum dot labeling could improve the specific
detection and quantification of microbubble delivered antibodies in the kidney.
In addition to the specific targeting of microbubbles to the kidney, we observed some
accumulation of microbubbles in the liver. Non-specific delivery in the liver and spleen is
reportedly on the order of 0.1% of that of the targeted organs8. It is possible that this
microbubble accumulation in the liver is due to non-specific mechanisms, such as retention
by resident Kupfer cells or via entrapment in liver sinusoids. Future approaches of
microbubble mediated antibody therapy should therefore consider possible side effects in
the liver.

Chapter 6
98
At present, it is unclear whether the microbubble delivered antibodies could have a local
therapeutic effect in the kidney. Preliminary data presented at the Fourteenth European
Symposium on Ultrasound Contrast Imaging (2009) demonstrate that plasmids can be
delivered locally to the intestines using MadCam-1 targeted microbubbles41, indicating that
the microbubbles can carry a substantial load of large molecules. Furthermore, several
strategies may be taken should microbubbles fail to deliver a therapeutic dose of antibody to
the targeted organ. As microbubbles are well tolerated, increased local delivery of antibodies
may be achieved by repeated treatments. Alternatively, local therapeutic concentrations of
antibodies could be achieved by supporting microbubble antibody delivery with systemic
administration of a sub-therapeutic dose of antibody.
In summary, in the present study we demonstrated that microbubbles can be targeted to
the vasculature of diabetic kidneys in experimental diabetes using neutralizing antibodies
against TGF-ß and P-selectin. This approach may reduce the amount of antibodies needed
for neutralizing antibody therapy while limiting possible side-effects.

Antibody mediated targeting of microbubbles
99
References
(1) van WA, Kooiman K, Harteveld M, Emmer M, ten Cate FJ, Versluis M, de JN. Vibrating
microbubbles poking individual cells: drug transfer into cells via sonoporation. J Control
Release 2006 May 15;112(2):149-55.
(2) Postema M, van WA, ten Cate FJ, de JN. High-speed photography during ultrasound
illustrates potential therapeutic applications of microbubbles. Med Phys 2005
December;32(12):3707-11.
(3) Caskey CF, Stieger SM, Qin S, Dayton PA, Ferrara KW. Direct observations of ultrasound
microbubble contrast agent interaction with the microvessel wall. J Acoust Soc Am 2007
August;122(2):1191-200.
(4) Bekeredjian R, Kroll RD, Fein E, Tinkov S, Coester C, Winter G, Katus HA, Kulaksiz H.
Ultrasound targeted microbubble destruction increases capillary permeability in hepatomas.
Ultrasound Med Biol 2007 October;33(10):1592-8.
(5) Chappell JC, Price RJ. Targeted therapeutic applications of acoustically active microspheres
in the microcirculation. Microcirculation 2006 January;13(1):57-70.
(6) Meijering BD, Juffermans LJ, van WA, Henning RH, Zuhorn IS, Emmer M, Versteilen AM,
Paulus WJ, van Gilst WH, Kooiman K, de JN, Musters RJ, Deelman LE, Kamp O. Ultrasound
and microbubble-targeted delivery of macromolecules is regulated by induction of endocytosis
and pore formation. Circ Res 2009 March 13;104(5):679-87.
(7) Christiansen JP, French BA, Klibanov AL, Kaul S, Lindner JR. Targeted tissue transfection
with ultrasound destruction of plasmid-bearing cationic microbubbles. Ultrasound Med Biol
2003 December;29(12):1759-67.
(8) Bekeredjian R, Chen S, Frenkel PA, Grayburn PA, Shohet RV. Ultrasound-targeted
microbubble destruction can repeatedly direct highly specific plasmid expression to the heart.
Circulation 2003 August 26;108(8):1022-6.
(9) Taniyama Y, Tachibana K, Hiraoka K, Namba T, Yamasaki K, Hashiya N, Aoki M, Ogihara T,
Yasufumi K, Morishita R. Local delivery of plasmid DNA into rat carotid artery using
ultrasound. Circulation 2002 March 12;105(10):1233-9.
(10) Sonoda S, Tachibana K, Uchino E, Okubo A, Yamamoto M, Sakoda K, Hisatomi T, Sonoda
KH, Negishi Y, Izumi Y, Takao S, Sakamoto T. Gene transfer to corneal epithelium and
keratocytes mediated by ultrasound with microbubbles. Invest Ophthalmol Vis Sci 2006
February;47(2):558-64.
(11) Haag P, Frauscher F, Gradl J, Seitz A, Schafer G, Lindner JR, Klibanov AL, Bartsch G,
Klocker H, Eder IE. Microbubble-enhanced ultrasound to deliver an antisense
oligodeoxynucleotide targeting the human androgen receptor into prostate tumours. J Steroid
Biochem Mol Biol 2006 December;102(1-5):103-13.
(12) Liu Y, Miyoshi H, Nakamura M. Encapsulated ultrasound microbubbles: therapeutic
application in drug/gene delivery. J Control Release 2006 August 10;114(1):89-99.
(13) Mizushige K, Kondo I, Ohmori K, Hirao K, Matsuo H. Enhancement of ultrasound-accelerated
thrombolysis by echo contrast agents: dependence on microbubble structure. Ultrasound Med
Biol 1999 November;25(9):1431-7.

Chapter 6
100
(14) Iwanaga K, Tominaga K, Yamamoto K, Habu M, Maeda H, Akifusa S, Tsujisawa T, Okinaga
T, Fukuda J, Nishihara T. Local delivery system of cytotoxic agents to tumors by focused
sonoporation. Cancer Gene Ther 2007 April;14(4):354-63.
(15) Zhao YZ, Liang HD, Mei XG, Halliwell M. Preparation, characterization and in vivo
observation of phospholipid-based gas-filled microbubbles containing hirudin. Ultrasound Med
Biol 2005 September;31(9):1237-43.
(16) Sonoda S, Tachibana K, Uchino E, Yamashita T, Sakoda K, Sonoda KH, Hisatomi T, Izumi Y,
Sakamoto T. Inhibition of melanoma by ultrasound-microbubble-aided drug delivery suggests
membrane permeabilization. Cancer Biol Ther 2007 August;6(8):1276-83.
(17) Ziyadeh FN, Hoffman BB, Han DC, Iglesias-De La Cruz MC, Hong SW, Isono M, Chen S,
McGowan TA, Sharma K. Long-term prevention of renal insufficiency, excess matrix gene
expression, and glomerular mesangial matrix expansion by treatment with monoclonal
antitransforming growth factor-beta antibody in db/db diabetic mice. Proc Natl Acad Sci U S A
2000 July 5;97(14):8015-20.
(18) Sharma K, Jin Y, Guo J, Ziyadeh FN. Neutralization of TGF-beta by anti-TGF-beta antibody
attenuates kidney hypertrophy and the enhanced extracellular matrix gene expression in STZ-
induced diabetic mice. Diabetes 1996 April;45(4):522-30.
(19) Shull MM, Ormsby I, Kier AB, Pawlowski S, Diebold RJ, Yin M, Allen R, Sidman C, Proetzel
G, Calvin D. Targeted disruption of the mouse transforming growth factor-beta 1 gene results
in multifocal inflammatory disease. Nature 1992 October 22;359(6397):693-9.
(20) Diebold RJ, Eis MJ, Yin M, Ormsby I, Boivin GP, Darrow BJ, Saffitz JE, Doetschman T. Early-
onset multifocal inflammation in the transforming growth factor beta 1-null mouse is
lymphocyte mediated. Proc Natl Acad Sci U S A 1995 December 19;92(26):12215-9.
(21) He W, Li AG, Wang D, Han S, Zheng B, Goumans MJ, Ten DP, Wang XJ. Overexpression of
Smad7 results in severe pathological alterations in multiple epithelial tissues. EMBO J 2002
June 3;21(11):2580-90.
(22) Williams KJ, Qiu G, Usui HK, Dunn SR, McCue P, Bottinger E, Iozzo RV, Sharma K. Decorin
deficiency enhances progressive nephropathy in diabetic mice. Am J Pathol 2007
November;171(5):1441-50.
(23) Iwamoto M, Mizuiri S, Arita M, Hemmi H. Nuclear factor-kappaB activation in diabetic rat
kidney: evidence for involvement of P-selectin in diabetic nephropathy. Tohoku J Exp Med
2005 June;206(2):163-71.
(24) Hirata K, Shikata K, Matsuda M, Akiyama K, Sugimoto H, Kushiro M, Makino H. Increased
expression of selectins in kidneys of patients with diabetic nephropathy. Diabetologia 1998
February;41(2):185-92.
(25) Takalkar AM, Klibanov AL, Rychak JJ, Lindner JR, Ley K. Binding and detachment dynamics
of microbubbles targeted to P-selectin under controlled shear flow. J Control Release 2004
May 18;96(3):473-82.
(26) Rychak JJ, Lindner JR, Ley K, Klibanov AL. Deformable gas-filled microbubbles targeted to P-
selectin. J Control Release 2006 September 12;114(3):288-99.
(27) Klibanov AL, Rychak JJ, Yang WC, Alikhani S, Li B, Acton S, Lindner JR, Ley K, Kaul S.
Targeted ultrasound contrast agent for molecular imaging of inflammation in high-shear flow.
Contrast Media Mol Imaging 2006 November;1(6):259-66.

Antibody mediated targeting of microbubbles
101
(28) Lindner JR, Song J, Christiansen J, Klibanov AL, Xu F, Ley K. Ultrasound assessment of
inflammation and renal tissue injury with microbubbles targeted to P-selectin. Circulation 2001
October 23;104(17):2107-12.
(29) Villanueva FS, Lu E, Bowry S, Kilic S, Tom E, Wang J, Gretton J, Pacella JJ, Wagner WR.
Myocardial ischemic memory imaging with molecular echocardiography. Circulation 2007
January 23;115(3):345-52.
(30) Kaufmann BA, Lewis C, Xie A, Mirza-Mohd A, Lindner JR. Detection of recent myocardial
ischaemia by molecular imaging of P-selectin with targeted contrast echocardiography. Eur
Heart J 2007 August;28(16):2011-7.
(31) Tsuchihashi S, Fondevila C, Shaw GD, Lorenz M, Marquette K, Benard S, Shen XD, Ke B,
Busuttil RW, Kupiec-Weglinski JW. Molecular characterization of rat leukocyte P-selectin
glycoprotein ligand-1 and effect of its blockade: protection from ischemia-reperfusion injury in
liver transplantation. J Immunol 2006 January 1;176(1):616-24.
(32) Bachmann C, Klibanov AL, Olson TS, Sonnenschein JR, Rivera-Nieves J, Cominelli F, Ley
KF, Lindner JR, Pizarro TT. Targeting mucosal addressin cellular adhesion molecule
(MAdCAM)-1 to noninvasively image experimental Crohn's disease. Gastroenterology 2006
January;130(1):8-16.
(33) Benigni A, Zoja C, Corna D, Zatelli C, Conti S, Campana M, Gagliardini E, Rottoli D, Zanchi
C, Abbate M, Ledbetter S, Remuzzi G. Add-on anti-TGF-beta antibody to ACE inhibitor
arrests progressive diabetic nephropathy in the rat. J Am Soc Nephrol 2003 July;14(7):1816-
24.
(34) Ruzek MC, Hawes M, Pratt B, McPherson J, Ledbetter S, Richards SM, Garman RD. Minimal
effects on immune parameters following chronic anti-TGF-beta monoclonal antibody
administration to normal mice. Immunopharmacol Immunotoxicol 2003 May;25(2):235-57.
(35) Yang YA, Dukhanina O, Tang B, Mamura M, Letterio JJ, MacGregor J, Patel SC, Khozin S,
Liu ZY, Green J, Anver MR, Merlino G, Wakefield LM. Lifetime exposure to a soluble TGF-
beta antagonist protects mice against metastasis without adverse side effects. J Clin Invest
2002 June;109(12):1607-15.
(36) Forrester E, Chytil A, Bierie B, Aakre M, Gorska AE, Sharif-Afshar AR, Muller WJ, Moses HL.
Effect of conditional knockout of the type II TGF-beta receptor gene in mammary epithelia on
mammary gland development and polyomavirus middle T antigen induced tumor formation
and metastasis. Cancer Res 2005 March 15;65(6):2296-302.
(37) Frazier K, Thomas R, Scicchitano M, Mirabile R, Boyce R, Zimmerman D, Grygielko E, Nold
J, DeGouville AC, Huet S, Laping N, Gellibert F. Inhibition of ALK5 signaling induces physeal
dysplasia in rats. Toxicol Pathol 2007;35(2):284-95.
(38) Frantz S, Hu K, Adamek A, Wolf J, Sallam A, Maier SK, Lonning S, Ling H, Ertl G,
Bauersachs J. Transforming growth factor beta inhibition increases mortality and left
ventricular dilatation after myocardial infarction. Basic Res Cardiol 2008
September;103(5):485-92.
(39) Zachem CR, Alpers CE, Way W, Shankland SJ, Couser WG, Johnson RJ. A role for P-
selectin in neutrophil and platelet infiltration in immune complex glomerulonephritis. J Am Soc
Nephrol 1997 December;8(12):1838-44.

Chapter 6
102
(40) Galkina E, Ley K. Leukocyte recruitment and vascular injury in diabetic nephropathy. J Am
Soc Nephrol 2006 February;17(2):368-77.
(41) Tlaxca J, Andersen C, Klibanov AL, Hossack JA, Ley K. Targeted Transfection by
Sonoporation in Inflammatory Bowel Disease. Fourteenth European Symposium on
Ultrasound Contrast Imaging Rotterdam 2009: 15-16.

Chapter 7
Summary, discussion and future directions

Chapter 7
104
Conventional delivery methods for drugs or genes, such as systemic administration via
intravenous injection or oral administration, often do not suffice for therapeutic compounds
such as peptides, silencing RNAs and genes1. A recent development in delivery systems for
therapeutic compounds is the microbubble-ultrasound (US) interaction. Nowadays, research
focuses on the use of US and encapsulated microbubbles for therapeutic applications, taking
advantage of their low toxicity and immunogenicity, low-invasive nature, local application and
cost-effectiveness2-4. In particular the vascular system, especially the endothelium, is an
attractive target for ultrasound and microbubble targeted therapy because of its accessibility
and its importance in a wide range of pathological conditions5-8.
To fully exploit the therapeutic possibilities of ultrasound and microbubble mediated
therapy, it is necessary to understand all facets of how ultrasound and microbubble
mediated gene delivery (UMTGD) is facilitated. Chapter 2 demonstrates that targeted
transfection of primary endothelial cells is possible using UMTGD. Furthermore, all the
parameters studied, US intensity, exposure time and frequency of US, the DNA
concentration and timing of medium change significantly influenced UMTGD efficiency in
endothelial cells in vitro. Optimal parameter settings increased the total number of
transfected cells as well as the expression levels of the transgene per cell.
Using UMTGD, two strategies can be used to alter the homeostatic balance of endothelial
cells by expressing transgenes or by silencing endogenous target genes. In chapter 3 both
strategies were evaluated by studying changes in the expression of the moderately
expressed gene glyceraldehyde-3-phosphate dehydrogenase (GAPDH) in cultured
endothelial cells. This study showed that almost all endothelial cells harbored siRNA after
UMTD and about half of all cells harbored plasmid DNA. However, whereas siRNA was very
effective in downregulation of GAPDH protein by approximately 70%, only 2% of the
endothelial cells expressed the plasmid DNA. This difference in the efficacy of UMTD of
siRNA versus plasmid DNA may be explained by the cellular localization of the nucleotides
after UMTD. siRNA was mainly found in the cytosol of endothelial cells, i.e. at the location
where it directs the degradation or translational expression of their target mRNA in a
sequence specific way9. In contrast, plasmid DNA has to end up into the nucleus for
transcription10. However, immediately after UMTD, we found plasmid DNA to be mainly
localized in endosomes in the cytosol, whereas it was absent in the nucleus. Also, 24 hours
after UMTD, plasmid DNA was still found in endosomes and not in the nucleus. The low
efficacy of expression of the transgene after ultrasound and microbubble targeted delivery
found in this study may also explain why most of the reported successful studies in
experimental disease models use plasmids encoding potent paracrine factors, as their
efficacy does not depend on the need to transfect the majority of all target cells.
The discrepancy in efficacy of UMTD of siRNA versus plasmid DNA may further be
explained by our study on the mechanisms that facilitate the uptake of compounds following
UMTD (chapter 4). In this chapter we show in vitro as well as in vivo endocytosis to
represent an important mechanism in UMTD facilitated uptake of molecules sized between 4
and 500-kDa, in addition to transient pore formation. Deprivation of the endothelial cells from
Summary, discussion and future directions
105
ATP, inhibition of clathrin- and caveolae-mediated endocytosis, and blockade of
macropinocytosis, all resulted in a significantly decrease of intracellular delivery of the
dextrans, demonstrating that endocytosis is a key mechanism of UMTD. Moreover,
fluorescence microscopy showed that 155 and 500-kDa dextrans were localized in distinct
vesicles after UMTD, whereas smaller molecules were homogenously distributed throughout
the cytosol and -when small enough- pass the nuclear pore through diffusion. In addition, in
vitro as well as in vivo, 500 kDa dextran vesicles were found to co-localize with clathrin and
to a minor extent with caveolin, markers for clathrin- and caveolin mediated endocytosis
respectively, confirming the importance of endocytosis in UMTD. In addition to triggering
endocytosis, UMTD also evoked transient pore formation, as demonstrated by the
homogeneous distribution of 4.4 and 70-kDa dextrans in the cytosol. Additionally, the influx
of calcium ions and cellular release of pre-loaded dextrans after US and microbubble-
exposure demonstrated pore formation. Interestingly, the contribution of transient pores as a
mechanism of UMTD decreases when molecule size increases. Thus, the cellular uptake of
larger molecules is more dependent on endocytosis in UMTD.
Taken together, the high efficacy of UMTD with siRNA may be explained by the size of
siRNA. As SiRNA is only about 15 kDa, it is likely that most of the siRNA will enter the cell
via pores and, as shown in chapter 3, end up in the cytosol of cells. On the other hand, the
uptake of plasmid DNA (with a size of ~3500 kDa), which needs to end up in the nucleus for
transcription, is most likely dependent on endocytosis. From this perspective it is not
surprising that only a few cells, which received plasmid DNA after UMTD, express the
transgene. Together, these chapters demonstrate that silencing of endogenous target
genes, using siRNA, is the most promising ultrasound and microbubble targeted gene
therapeutic strategy to alter the homeostatic balance of endothelial cells.
Besides the potential use of ultrasound and microbubbles for gene therapy, this technique
may be useful in a wide variety of therapies. In designing novel therapeutic approaches
employing UMTD, the finding that the molecular size of the compounds dictates its ease of
uptake and its subsequent subcellular localization, should however be taken into account.
Furthermore, the endocytotic mechanism may be exploited for therapeutic purposes, as
many crucial signaling events are known to occur in the endocytotic pathway, especially
endosomes.
Vascular remodeling is closely related to the progression of vascular pathologies11.
Angiotensin II and TGF-β are both key mediators of vascular remodeling11, 12. TGF-β is known to decrease the sensitivity of vascular smooth muscle cells to ANG II. Chapter 5
demonstrates that TGF-ß1 attenuates Ang II-mediated MAPK p44/42 signaling in rat aortic
smooth muscle cells through downregulation of AT1R levels, which seems mainly dependent
on the inhibition of transcriptional activity of the AT1R gene. Furthermore, pretreatment with
TGF-ß1 completely inhibited Ang II mediated proliferation of RASMC but synergistically
increased Ang II induced plasminogen activator inhibitor-1 expression. Further insight in the
mechanism of transcriptional repression of the AT1R gene through TGF-β may be exploited

Chapter 7
106
to develop new therapeutic strategies for vascular disease which are associated with
vascular remodeling.
While TGF-β has ambiguous effects on the cardiovascular system, decreasing the
sensitivity of vascular smooth muscle cells to Ang II through down regulation of AT1R mRNA
by ultrasound and microbubble targeted delivery of AT1R siRNA may also be an effective
strategy to treat e.g. arterial restenosis after angioplasty. In angioplasty, the endothelial cell
layer is damaged and the vascular smooth muscle cells are exposed to the lumen, which
makes these cells easily accessible for ultrasound and microbubbles targeted delivery of
AT1R siRNA. Surprisingly, in vitro exposure of vascular smooth muscle cells (VSMCs) to
ultrasound and microbubbles alone already results in decreased AT1R mRNA levels of about
50% compared to cells not exposed to ultrasound and microbubbles (figure 1). In
cardiomyoblast cells, Juffermans et al.13 found that ultrasound and microbubbles cause an
increase in intracellular levels of hydrogen peroxide (H2O2). As reactive oxygen species,
including H2O2, were reported to downregulate AT1R mRNA by Ang II 14, this mechanism
may account for the downregulation of AT1R mRNA in vascular smooth muscle cells after
ultrasound and microbubble exposure. This effect may be explored in detail to examine the
therapeutic potential of ultrasound and microbubbles to reduce arterial restenosis. If
effective, ultrasound and microbubble exposure during stenting may be instituted relatively
easily in the clinic because the microbubbles are approved by the regulatory authorities for
use as ultrasound contrast agents in echocardiography.
Figure 1: UMTD reduces AT1R mRNA by about 50% in VSMCs 18 hours after exposure. VSMCs
were cultured in OpticellsTM. After cells had grown to 90% confluence, 125 μL of Sonovue
microbubbles were added and cells were subsequently exposed to sine-wave US-bursts (1MHz) with
a 6.2% duty cycle and a 20-Hz pulse repetition frequency for 30 seconds. Peak negative acoustic
pressure generated at the region-of-interest (ROI) was 0.22 MPa. (P<0.001)
no UMTD UMTD
AT
1R m
RN
A (
%)
0
20
40
60
80
100
120
*

Summary, discussion and future directions
107
Intravenous injection of microbubbles is the most convenient route of administration in
vascular UMTD therapy. However, following i.v. injection the microbubbles disperse over the
total blood volume, resulting in a dramatic drop in their concentration. Furthermore,
microbubbles and drugs quickly separate after intravenous injection if both are not coupled.
For this reason, most in-vivo UMTD studies rely on microbubble infusion immediately
upstream of the target organ.
In chapter 6, we examined whether microbubbles may be targeted to blood vessels of a
specific organ to increase their local concentration. To this end, microbubbles were equipped
with antibodies that recognize TGF-ß, a marker that is strongly expressed on the endothelial
cells of diabetic kidneys. We demonstrated that the TGF-ß targeted microbubbles homed
specifically to the kidney and attached themselves firmly to the vascular wall, demonstrating
the feasibility of microbubble targeting. Importantly, this type of targeted microbubbles may
not only be used for targeted delivery of drugs or genes, but may also be used to monitor the
extent or progression of disease. Furthermore, targeted microbubbles may be used to
transport neutralizing therapeutic antibodies to the target organ. Destruction of the
microbubble shell using a high intensity pulse would release the attached antibodies directly
in the target organ. Such a strategy would reduce the amount of antibody needed, making
neutralizing antibody therapy substantially more cost-effective. Although it has been
demonstrated that the specific TGF-ß antibody used in our study has a beneficial effect in
several models of kidney disease15, the functionality of the microbubble delivered TGF-ß
antibodies remains to be established.
Future directions
In conclusion, this thesis shows that in vitro US intensity, exposure time and frequency of
US, the DNA concentration and timing of medium affect gene transfection efficiency and
demonstrates that the contribution of endocytosis and pore formation to intracellular delivery
mediated by ultrasound and microbubbles and subsequent subcellular localization of the
therapeutic compound is dependent on the molecular size. To design a gene therapy, one
can choose to express transgenes or silence endogenous target genes to interfere in the
progression of vascular disease. When using ultrasound and microbubbles for the delivery of
oligonucleotides it seems that silencing of endogenous target genes, using siRNA, is far
more effective than the delivery and subsequent expression of transgenes. To further
improve ultrasound and microbubble targeted gene therapy efficiency and increase its
potential for gene therapeutic use, further studies should focus on improving the release of
plasmid DNA from the endosomes.and study how plasmid DNA could be more efficiently
transported to the nucleus for transcription. For these studies, one may look into strategies
developed for other non viral techniques, such as a fusion of microbubbles and liposomes in
combination with the use of plasmid DNA with a nuclear localization signal16.
In addition to the potential use of ultrasound and microbubbles for gene therapy, this
technique may be useful for a wide variety of therapeutic applications to treat vascular
diseases. The unexpected finding that AT1R mRNA in vascular smooth muscle cells is

Chapter 7
108
reduced by 50% after ultrasound and microbubble exposure may be explored in detail to
study the therapeutic potential of ultrasound and microbubbles to reduce arterial restenosis
in vessels after angioplasty. Moreover further research on the mechanism of transcriptional
repression of the AT1R gene by TGF-β may result into development of new ultrasound and microbubble mediated therapeutic strategies for vascular disease which are associated with
vascular remodeling. Finally, chapter 6 demonstrates that microbubbles can be targeted to
the site of disease using antibodies aimed at specific disease markers. These microbubbles
may provide new non-invasive diagnostic tools, improve UMTD efficiencies and may act as
an efficient vector for local delivery of neutralizing antibodies.

Summary, discussion and future directions
109
References
(1) Schlicher RK, Radhakrishna H, Tolentino TP, Apkarian RP, Zarnitsyn V, Prausnitz MR.
Mechanism of intracellular delivery by acoustic cavitation. Ultrasound Med Biol 2006
June;32(6):915-24.
(2) Mayer CR, Bekeredjian R. Ultrasonic gene and drug delivery to the cardiovascular system.
Adv Drug Deliv Rev 2008 June 30;60(10):1177-92.
(3) Newman CM, Bettinger T. Gene therapy progress and prospects: ultrasound for gene
transfer. Gene Ther 2007 March;14(6):465-75.
(4) Hernot S, Klibanov AL. Microbubbles in ultrasound-triggered drug and gene delivery. Adv
Drug Deliv Rev 2008 June 30;60(10):1153-66.
(5) Balakumar P, Chakkarwar VA, Krishan P, Singh M. Vascular endothelial dysfunction: a tug of
war in diabetic nephropathy? Biomed Pharmacother 2009 March;63(3):171-9.
(6) Davignon J, Ganz P. Role of endothelial dysfunction in atherosclerosis. Circulation 2004 June
15;109(23 Suppl 1):III27-III32.
(7) Esmon CT. The interactions between inflammation and coagulation. Br J Haematol 2005
November;131(4):417-30.
(8) Feletou M, Vanhoutte PM. Endothelial dysfunction: a multifaceted disorder (The Wiggers
Award Lecture). Am J Physiol Heart Circ Physiol 2006 September;291(3):H985-1002.
(9) Berezhna SY, Supekova L, Supek F, Schultz PG, Deniz AA. siRNA in human cells selectively
localizes to target RNA sites. Proc Natl Acad Sci U S A 2006 May 16;103(20):7682-7.
(10) Kodama K, Katayama Y, Shoji Y, Nakashima H. The features and shortcomings for gene
delivery of current non-viral carriers. Curr Med Chem 2006;13(18):2155-61.
(11) Heeneman S, Sluimer JC, Daemen MJ. Angiotensin-converting enzyme and vascular
remodeling. Circ Res 2007 August 31;101(5):441-54.
(12) Redondo S, Santos-Gallego CG, Tejerina T. TGF-beta1: a novel target for cardiovascular
pharmacology. Cytokine Growth Factor Rev 2007 June;18(3-4):279-86.
(13) Juffermans LJ, Dijkmans PA, Musters RJ, Visser CA, Kamp O. Transient permeabilization of
cell membranes by ultrasound-exposed microbubbles is related to formation of hydrogen
peroxide. Am J Physiol Heart Circ Physiol 2006 October;291(4):H1595-H1601.
(14) Ichiki T, Takeda K, Tokunou T, Funakoshi Y, Ito K, Iino N, Takeshita A. Reactive oxygen
species-mediated homologous downregulation of angiotensin II type 1 receptor mRNA by
angiotensin II. Hypertension 2001 February;37(2 Part 2):535-40.
(15) Sharma K, Jin Y, Guo J, Ziyadeh FN. Neutralization of TGF-beta by anti-TGF-beta antibody
attenuates kidney hypertrophy and the enhanced extracellular matrix gene expression in STZ-
induced diabetic mice. Diabetes 1996 April;45(4):522-30.
(16) Lentacker I, Vandenbroucke RE, Lucas B, Demeester J, De Smedt SC, Sanders NN. New
strategies for nucleic acid delivery to conquer cellular and nuclear membranes. J Control
Release 2008 July 4.

Chapter 7
110

Nederlandse samenvatting

Nederlandse samenvatting
112
Microbellen zijn gasgevulde belletjes die als contrastmiddel gebruikt worden in de
echografie. Onder invloed van positieve en negatieve drukverschillen die door ultrageluid
gecreëerd worden, worden de microbellen respectievelijk ineengeduwd en uit elkaar
getrokken (oscilleren). Wanneer de intensiteit van het ultrageluid toeneemt, gaan de bellen
chaotisch oscilleren en kunnen de bellen zelfs knappen. Het is gebleken dat moleculen zoals
DNA en medicijnen in verhoogde mate worden opgenomen door cellen die worden
blootgesteld aan deze oscillerende of uit elkaar knappende microbellen. Het is hiermee
mogelijk om lokaal voor een verhoogde opname van DNA of medicijnen te zorgen door het
ultrageluid specifiek te richten op het te behandelen orgaan of weefsel, een proces dat drug
targeting wordt genoemd. Deze drug targeting kan worden verbeterd door de microbellen uit
te rusten met antilichamen die zieke weefsels of organen herkennen. Deze microbellen
worden door de bloedsomloop meegevoerd totdat ze binden aan de vaatwand van de zieke
weefsels.
Microbellen en ultrageluid zijn mogelijk geschikt voor het bedrijven van gentherapie, een
therapie waarbij DNA-technologie gebruikt wordt voor de behandeling van een ziekte.
Binnen de gentherapie kan men kiezen uit twee strategieën, namelijk het de-novo tot
expressie brengen van therapeutische genen (op plasmide DNA) of door de expressie van
“eigen” genen te remmen door middel van bijvoorbeeld siRNA. Voor beide strategieën geldt
dat het plasmide DNA en het siRNA in de cellen moet worden ingebracht.
De meest gebruikelijke manier van toediening van microbellen is het injecteren van
microbellen in de bloedbaan. De binnenkant van de bloedvaten is bekleed met zogenaamde
endotheelcellen, waardoor deze cellen het primaire doelwit zullen zijn voor therapieën op
basis van microbellen en ultrageluid. In hoofdstuk 2 is te lezen dat de opname en transcriptie
van plasmide DNA door endotheelcellen wordt beïnvloed door de intensiteit en de frequentie
van het ultrageluid. Ook de DNA concentratie en het tijdstip van medium verwisseling na
blootstelling van de cellen aan microbellen en ultrageluid zijn belangrijke parameters. Door
de optimalisatie van deze parameters, nam het percentage cellen dat het plasmide DNA had
opgenomen toe (tot ongeveer 5%). Bovendien nam per cel het genexpressie niveau van het
plasmide DNA toe.
Ondanks deze optimalisatie, is de opname van siRNA door endotheelcellen middels
microbellen en ultrageluid veel effectiever dan de opname van plasmide DNA. Zoals in
hoofdstuk 3 is beschreven, bevatten bijna alle endotheelcellen siRNA nadat ze waren
blootgesteld aan microbellen en ultrageluid. Het ingebrachte siRNA reduceerde de expressie
van het gen waartegen het gericht was met 70%. Bij de opname van plasmide DNA, bleek
dat ongeveer 50% van de endotheelcellen het plasmide DNA had opgenomen. Echter
slechts 2% van deze cellen bracht het plasmide DNA tot expressie. Dit verschil in efficiëntie
is te verklaren door de verschillen in de intracellulaire lokalisatie van siRNA en plasmide
DNA na opname middels microbellen en ultrageluid. SiRNA was voornamelijk te vinden in
het cytosol van de endotheelcellen wat tevens ook de plaats is waar het siRNA zijn functie
kan uitoefenen. Plasmide DNA daarentegen kan alleen tot expressie komen in de celkern
van de endotheelcel. Echter, het plasmide DNA was gelokaliseerd in endosomen en niet in

113
de celkern. Het transport van plasmide DNA naar de celkern is dus de beperkende stap in
het effectief afleveren van plasmide DNA middels microbellen en ultrageluid.
Om de verschillen in intracellulaire lokalisatie van siRNA en plasmide DNA te verklaren is
het belangrijk te begrijpen hoe microbellen en ultrageluid ervoor zorgen dat moleculen in een
cel terecht komen. Uit ons onderzoek bleek dat de manier waarop een molecuul in de cel
wordt opgenomen na blootstelling aan microbellen en ultrageluid, afhankelijk is van het
molecuulgewicht. Tot nu toe werd algemeen aangenomen dat moleculen door kleine
tijdelijke poriën de cel en het cytosol binnen kwamen na blootstelling aan microbellen en
ultrageluid. Zoals hoofdstuk 4 laat zien, is dit echter slechts ten dele waar. Kleine moleculen
(<70 kDa, zoals siRNA) komen inderdaad door deze poriën de cel binnen, maar grotere
moleculen blijken via een actieve manier opgenomen te worden door de endotheelcel. Ons
onderzoek demonstreert dat de microbellen in combinatie met het ultrageluid ervoor zorgen
dat endocytose (actieve internalisatie) wordt gestimuleerd, waardoor grote moleculen (zoals
plasmide DNA) worden opgenomen door de cel. Tijdens endocytose worden membraan
blaasjes (endosomen) afgesnoerd van het celmembraan en wanneer deze moleculen niet uit
de endosomen kunnen ontsnappen zullen ze in de afbraakroute van de cel terechtkomen.
Bij het ontwikkelen van nieuwe therapieën, waaronder gen therapie, is het dus belangrijk
rekening te houden met het molecuulgewicht van de therapeutische componenten.
In het tweede deel van dit proefschrift is er gekeken naar mogelijke targets voor ultrageluid
en microbellen gefaciliteerde therapieën. De Angiotensine receptor type I (AT1R) speelt een
belangrijke rol in de ontwikkeling van hart en vaatziekten. In hoofdstuk 5 is te lezen dat de
cytokine transforming growth factor β1 (TGF-β1) de transcriptie van het AT1R gen remt
waardoor er minder AT1R zijn op het celmembraan van TGF-β1 voorbehandelde vasculaire
gladde spiercellen. Hierdoor werd de proliferatie van deze cellen, als reactie op Angiotensine
II, geblokkeerd. De proliferatie van vasculaire gladde spiercellen is een belangrijke oorzaak
voor het dichtgroeien van bloedvaten na een dotter- of stent behandeling. TGF-β1 zou
daarom mogelijk gebruikt kunnen worden om het dichtgroeien van bloedvaten te voorkomen.
Echter, TGF-β1 versterkte de door Angiotensine II gemedieerde expressie van plasminogen
activator inhibitor-1 (PAI-1) waardoor de ontwikkeling van fibrose mogelijk wordt
gestimuleerd. Ons onderzoek laat zien dat het balans tussen een proliferatief en een
fibrotisch fenotype van gladde spiercellen bepaald wordt door de verhouding tussen
Angiotensine II en TGF-β1. Verder onderzoek op dit gebied kan leiden tot nieuwe op
ultrageluid en microbellen gebaseerde therapieën voor de behandeling van hart- en
vaatziekten.
Naast de rol van TGF-β1 in de ontwikkeling van vaatafwijkingen, is TGF-β1 mogelijk een
geschikt doelwit voor de verdere ontwikkeling van drug targeting middels microbellen en
ultrageluid. TGF-β1 komt namelijk tot expressie op endotheelcellen van organen in een
aantal ziekten. In een model van nierschade door diabetes bleek dat microbellen die waren
voorzien van antilichamen tegen TGF-β1, zich specifiek ophopen in de diabetische nier
(hoofdstuk 6). Middels standaard echografie, is deze ophoping gemakkelijk te meten
waardoor deze microbellen mogelijk geschikt zijn voor het niet-invasief vervolgen van

Nederlandse samenvatting
114
progressieve nieraandoeningen. Door deze microbellen te voorzien van therapeutische
antilichamen zou tevens mogelijk het ziekteproces lokaal geremd kunnen worden.
In conclusie, microbellen en ultrageluid maken nieuwe gerichte therapieën mogelijk. Bij het
ontwikkelen van deze nieuwe therapieën, waaronder gen therapie, is het belangrijk rekening
te houden met het molecuulgewicht van de therapeutische componenten, omdat deze
bepaalt waar de componenten in de cel terecht zullen komen. Microbellen voorzien van
antilichamen kunnen een belangrijke rol gaan spelen binnen de niet-invasieve diagnostiek.

Dankwoord

Dankwoord
116
“Ik wil nooit onderzoeker worden”. Dit was mijn overtuiging voordat ik mijn eerste afstudeer stage begon bij de afdeling Straling en Stress. Maar tijdens deze stage kreeg ik de smaak
van het onderzoek te pakken. En tijdens mijn tweede afstudeerstage bij de Klinische
Farmacologie was ik helemaal om. Tijdens deze stage kwam er een uitdagend
onderzoeksproject op mijn pad waarvoor men een AIO zocht. Het project viel onder de
vleugels van het Interuniversitair Cardiologisch Instituut Nederland (ICIN) en was een
samenwerking met de Biomedical engineeringsgroep van prof. dr. ir. Ton van der Steen en
prof. dr. ir. Nico de Jong (Erasmuc MC) en de afdeling cardiologie en physiologie van prof.
dr. Cees Visser. Het onderwerp; drug afgifte door middel van microbellen en ultrageluid was
nog een groot onontgonnen terrein en die uitdaging wilde ik wel aangaan. Maar deze
uitdaging heb ik natuurlijk niet alleen tot een succesvol eind gebracht en nu ben ik dan
eindelijk aangekomen bij het schrijven van het dankwoord, waarbij ik iedereen wil bedanken
die dit mogelijk hebben gemaakt.
Ten eerste wil ik graag beginnen bij mijn promoteres R.H. Henning en W.H van Gilst. Wiek ik
wil je graag bedanken voor de mogelijkheid die je mij hebt gegeven om mij te storten op dit
project en het vertrouwen dat je me hebt gegeven dat dit project tot een goed eind zou
komen. Rob tijdens mijn stage heb ik al mogen ervaren dat jouw deur altijd wagenwijd
openstaat en dat er een ingeslepen pad naar jouw kamer liep. Dit is ook altijd zo gebleven
tijdens mijn promotie en wanneer het even tegen zat in het onderzoek, zag ik het altijd weer
zonnig in wanneer ik je kamer weer verliet. Ik ben benieuwd hoeveel verbaasde gezichten
Dick de Zeeuw nog op zijn kamer heeft gezien, nadat hij naar “jouw” kamer was verhuisd.
Mijn co-promotor tijdens mijn promotie onderzoek was L.E.Deelman. Leo ook wij hebben
elkaar al leren kennen tijdens mijn stage bij de Klinische Farmacologie waarbij je mijn
begeleider was. Jij en Rob hebben er echt voor gezorgd dat deze stage mij echt bevestigde
hoe leuk de wereld van onderzoek eigenlijk is. Leo ik wil je ook bedanken voor je
begeleiding tijdens mijn promotieonderzoek, maar vooral ook voor het feit dat je ervoor
zorgde dat de snelheid erin bleef tijdens het schrijven van mijn proefschrift wat veelal in de
avonduren moest gebeuren naast mijn baan bij Philips.
De leden van de beoordelingscommissie prof. dr. Dick Hoekstra en prof dr. Nico de Jong wil
ik bedanken voor de bereidheid om mijn proefschrift kritisch te beoordelen. My special
thanks go to dr. Rychack for his acceptation to be a member of the reading committee and
his presence during the defence of my thesis.
Maar een AIO periode bestaat niet alleen uit experimenten doen op een lab en het schrijven
van artikelen en uiteindelijk een proefschrift. Dat wat er ook bij hoort is de samenwerking en
gezelligheid van en met medeonderzoekers.

117
Net een maand werkende aan het project viel ik meteen met mijn neus in de boter en had ik
al mijn eerste microbubble congres dat georganiseerd wordt door de Biomedical
engineeringsgroep. Daar heb ik meteen een goede introductie in het veld gehad en heb ik
ook de groepen die bij dit project betrokken waren beter leren kennen. Hoe kan dat beter
dan tijdens een social event en dan wel in de ochtend natuurlijk in alle vroegte op voor de
poster presentaties. Ik wil hierbij hen dan ook bedanken voor de aangename samenwerking
die we hebben gehad.
Daarnaast zijn er ook nog tal van mensen, binnen de universiteit, die ik te rade ben gegaan
voor mijn onderzoek. Ik wil hen dan ook bedanken voor hun openheid en bereidheid om hun
kennis met mij te delen. Onderhen Inge Zuhorn, Inge ik wil je hierbij nogmaals bedanken
voor je tijd en kennis over endocytose die je met me deelde. Dit heeft echt een bijdrage
geleverd aan ons Circulation Research artikel. En 1 van mijn stellingen is dan ook zeker
hierop van toepassing.
Ik wil dan ook al mijn collega’s bedanken, om te beginnen met het kippenhok. Meiden, Willemijn, Mirjam en Ying, ik heb een erg leuke tijd gehad met jullie. We deden de naam eer
aan van onze kamer, maar daarnaast werd er ook zeker altijd hard gewerkt. Alex, Bianca M,
Annemarieke, Anton, Kristien, Peter v/d M, Maria, Erik, Cheng, Peter O, Peter V, Jalmar,
Hisko, Irma, Daan, Maggy, Nadir, Bas, Rik, Hiddo, Iryna, Antoinette, Linda, Marry, Maaike,
Adriaan, Bart, Hendrik, Regien, Richard, Bianca B, Jacoba, Larissa, Jan, Wessel, Azuwerus,
Ceciel, Ardy, Ellen en Alexandra jullie hebben er echt voor gezorgd dat ik een hele leuke tijd
heb gehad bij de Klinische Farmacologie. Linda toen je bij de KF kwam werken konden we
het meteen goed met elkaar vinden, ik heb het een eer gevonden dat ik ceremonie meester
mocht zijn tijdens het bruiloftsfeest van jou en Rene. Nederland is niet zo groot, dus ik twijfel
er niet aan dat we nog veel belangrijke momenten met elkaar zullen delen. Iryna, jij hebt me
veel geleerd van de Oekraïnse cultuur en jullie chocolade is echt de beste. En als straks de
kleine er is kom ik zeker nog weer even langs. Bianca jij was mijn begeleidster tijdens mijn
eerste stage, waar ik de smaak voor het onderzoek te pakken kreeg. Tijdens deze stage is
ook onze vriendschap ontstaan, de zeer vroege ochtenduren voor de FACs experimenten
hebben daar zeker aan bijgedragen, alsook het “werkoverleg” dat we ook veelvuldig na mijn
stage hebben gehouden. Wie weet kruizen onze paden zich ook nog wel weer eens op het
onderzoeksvlak �.
Zoals al eerder genoemd heb ik mijn proefschrift vooral in de vrije uurtjes naast mijn baan bij
Philips geschreven. Ik wil ook graag mijn collega’s bij Philips bedanken voor de zeer goede werksfeer. Ik heb er veel energie uit kunnen halen en dit heeft er zeker aan bijgedragen dat
het proefschrift nu daadwerkelijk af is.
Mijn Paranimfen stonden vanaf dag 1 van mijn promotie traject al vast. Wie kunnen mij nou
beter ondersteunen tijdens mijn verdediging van mijn proefschrift dan mijn zusje Roelien
Meijering en vriendin Ingrid Alsema. Roelien ik vind het erg leuk dat je in mijn voetsporen

Dankwoord
118
bent getreden en nu zelfs je AIO onderzoek doet bij dezelfde afdeling en promotor. Ik ben
blij dat je toegezegd hebt mijn paranimf te zijn en mij straks ter zijde staat tijdens mijn
verdediging. Ook wil ik je bedanken voor de mooie illustratie op de cover van mijn
proefschrift, Een echte Noenie! Ingrid wij kennen elkaar al vanaf de middelbare school en
vanaf het moment dat we elkaar tegen kwamen was onze vriendschap bezegeld. Ik
waardeer je echt ontzettend om je humor en je enorme doorzettingsvermogen. Met jou als
paranimf aan mijn zijde kom ik mijn promotie lachend door.
Mijn Pap en Mam, ook wil ik bij deze graag mijn waardering voor jullie uitspreken. Jullie
hebben ons altijd gestimuleerd door te leren. Tja, en dit krijg je er dan van he. En dan mijn
zusjes en broertje, Jolanda, Roelien, Marjon, Monique en Gertjan; mijn leven is rijk met jullie.
Het voordeel dat we nu over het hele land verspreid zitten; er is altijd wel iets leuks te doen,
concerten, opera, museumnacht of gewoonweg een hele stad leegshoppen, in de buurt van
een van ons. Daar maken we dan ook veelvuldig gebruik van.
Mijn schoonfamilie wil ik ook graag bedanken voor hun interesse die ze altijd hebben
getoond in mij en mijn onderzoek. Ik heb me vanaf het begin af aan ook altijd welkom en
thuis gevoeld bij jullie.
Ten slotte natuurlijk Marten. Om dan maar jou stelling te citeren; “ Ik ben schattig”. Ik heb er niets tegen in te brengen, alleen wat aan toe te voegen. Je weet namelijk altijd alles weer
lekker te relativeren, bent af en toe compleet maf en bovenal mijn maatje.

Curriculum vitae

Curriculum vitae
120
Bernadet Meijering werd op 5 augustus 1979 geboren in Emmen. In 1997 behaalde zij haar VWO
diploma aan de Rijksscholengemeenschap te Coevorden. Haar eerste onderzoeksstage heeft zij
gelopen op de afdeling Straling en Stress van het Universiteits Medisch Centrum Groningen (UMCG),
Haar tweede onderzoeksstage op de afdeling Klinische Farmacologie van het UMCG. In december
2003 behaalde zij haar doctoraalexamen medische biologie. In januari 2004 startte ze als assistent in
opleiding aan de afdeling Klinische Farmacologie, onder de vleugels van het Interuniversitair
Cardiologisch Instituut Nederland (ICIN). De resultaten van dit promotie onderzoek staan in dit
proefschrift beschreven. Vanaf 1 juli 2008 tot op heden is ze werkzaam bij Philips in Eindhoven.