Optimization of a Novel Method Based on Ultrasound-Assisted ...
20
foods Article Optimization of a Novel Method Based on Ultrasound-Assisted Extraction for the Quantification of Anthocyanins and Total Phenolic Compounds in Blueberry Samples (Vaccinium corymbosum L.) María José Aliaño-González 1 , José Antonio Jarillo 1 , Ceferino Carrera 1 , Marta Ferreiro-González 1 , JoséÁngel Álvarez 2 , Miguel Palma 1 , Jesús Ayuso 2 , Gerardo F. Barbero 1, * and Estrella Espada-Bellido 1 1 Department of Analytical Chemistry, Faculty of Sciences, Agrifood Campus of International Excellence (ceiA3), IVAGRO, University of Cadiz, 11510 Puerto Real, Cadiz, Spain; [email protected] (M.J.A.-G.); [email protected] (J.A.J.); [email protected] (C.C.); [email protected] (M.F.-G.); [email protected] (M.P.); [email protected] (E.E.-B.) 2 Department of Physical Chemistry, Faculty of Sciences, Institute of Biomolecules (INBIO), University of Cadiz, 11510 Puerto Real, Cadiz, Spain; [email protected] (J.Á.Á.); [email protected] (J.A.) * Correspondence: [email protected]; Tel.: +34-956-016355; Fax: +34-956-016460 Received: 3 November 2020; Accepted: 26 November 2020; Published: 28 November 2020 Abstract: In recent years, consumers’ preference for fruits such as blueberry has increased noticeably. This fact is probably related to their bioactive components such as anthocyanins, phenolic compounds, vitamins, minerals, and tannins that have been found in blueberries by the latest research studies. Both total anthocyanins (TA) and total phenolic compounds (TPC) are known for their multiple beneficial effects on our health, due to their anti-inflammatory, anti-oxidant, and anti-cancer properties. This is the reason why the development of new methodologies for the quality control analysis of raw materials or derived products from blueberry has a great relevance. Two ultrasound-assisted extraction methods (UAE) have been optimized for the quantification of TA and TPC in blueberry samples. The six variables to be optimized were: solvent composition, temperature, amplitude, cycle, extraction solvent pH, and sample/solvent ratio using response surface methodology. The optimized methods have proven to be suitable for the extraction of the TPC and TA with good precision (repeatability and intermediate precision) (coefficient of variation (CV) < 5%) and potentially for application in commercial samples. This fact, together with the multiple advantages of UAE, makes these methods a good alternative to be used in quality control analysis by both industries and laboratories. Keywords: anthocyanins; antioxidants; blueberry; Box–Behnken design; phenolic compounds; response surface methodology; ultra-high-performance liquid chromatography; UHPLC; UV–Vis; Vaccinium corymbosum L. 1. Introduction Blueberry is a small reddish or bluish-black fruit with a size of around 1.5 cm in diameter that grows in deciduous shrubs from the Ericaceae family [1,2]. Blueberry has been extensively cultivated worldwide with an estimated production of over 600,000 tons per year, being Canada, Chile, China, Spain, USA, and Morocco, among other 30 countries, the major blueberry distributors [3]. Foods 2020, 9, 1763; doi:10.3390/foods9121763 www.mdpi.com/journal/foods
-
Upload
khangminh22 -
Category
Documents
-
view
1 -
download
0
Transcript of Optimization of a Novel Method Based on Ultrasound-Assisted ...
foods
Article
Optimization of a Novel Method Based onUltrasound-Assisted Extraction for the Quantificationof Anthocyanins and Total Phenolic Compounds inBlueberry Samples (Vaccinium corymbosum L.)
María José Aliaño-González 1 , José Antonio Jarillo 1, Ceferino Carrera 1 ,Marta Ferreiro-González 1 , José Ángel Álvarez 2, Miguel Palma 1 , Jesús Ayuso 2 ,Gerardo F. Barbero 1,* and Estrella Espada-Bellido 1
1 Department of Analytical Chemistry, Faculty of Sciences, Agrifood Campus of InternationalExcellence (ceiA3), IVAGRO, University of Cadiz, 11510 Puerto Real, Cadiz, Spain;[email protected] (M.J.A.-G.); [email protected] (J.A.J.);[email protected] (C.C.); [email protected] (M.F.-G.); [email protected] (M.P.);[email protected] (E.E.-B.)
2 Department of Physical Chemistry, Faculty of Sciences, Institute of Biomolecules (INBIO),University of Cadiz, 11510 Puerto Real, Cadiz, Spain; [email protected] (J.Á.Á.);[email protected] (J.A.)
* Correspondence: [email protected]; Tel.: +34-956-016355; Fax: +34-956-016460
Received: 3 November 2020; Accepted: 26 November 2020; Published: 28 November 2020 �����������������
Abstract: In recent years, consumers’ preference for fruits such as blueberry has increased noticeably.This fact is probably related to their bioactive components such as anthocyanins, phenolic compounds,vitamins, minerals, and tannins that have been found in blueberries by the latest research studies.Both total anthocyanins (TA) and total phenolic compounds (TPC) are known for their multiplebeneficial effects on our health, due to their anti-inflammatory, anti-oxidant, and anti-cancer properties.This is the reason why the development of new methodologies for the quality control analysis ofraw materials or derived products from blueberry has a great relevance. Two ultrasound-assistedextraction methods (UAE) have been optimized for the quantification of TA and TPC in blueberrysamples. The six variables to be optimized were: solvent composition, temperature, amplitude, cycle,extraction solvent pH, and sample/solvent ratio using response surface methodology. The optimizedmethods have proven to be suitable for the extraction of the TPC and TA with good precision(repeatability and intermediate precision) (coefficient of variation (CV) < 5%) and potentially forapplication in commercial samples. This fact, together with the multiple advantages of UAE,makes these methods a good alternative to be used in quality control analysis by both industriesand laboratories.
Keywords: anthocyanins; antioxidants; blueberry; Box–Behnken design; phenolic compounds;response surface methodology; ultra-high-performance liquid chromatography; UHPLC; UV–Vis;Vaccinium corymbosum L.
1. Introduction
Blueberry is a small reddish or bluish-black fruit with a size of around 1.5 cm in diameter thatgrows in deciduous shrubs from the Ericaceae family [1,2]. Blueberry has been extensively cultivatedworldwide with an estimated production of over 600,000 tons per year, being Canada, Chile, China,Spain, USA, and Morocco, among other 30 countries, the major blueberry distributors [3].
Foods 2020, 9, 1763; doi:10.3390/foods9121763 www.mdpi.com/journal/foods
Foods 2020, 9, 1763 2 of 20
Although blueberry is not so often consumed as fresh fruit, it is increasingly common to find it asthe main ingredient in jams and pastry preparations or as a secondary ingredient in different candiesor desserts (yogurts, cookies, etc.) [4–6]. Moreover, recent investigations have proven its high contentin anthocyanins, phenolic compounds, vitamins, and minerals. A fact that has caused blueberry to beincluded in different extracts and numerous food supplements [7].
The Ericaceae family includes nearly 4000 different plant species, where the Vaccinium genus isone of the best known and more frequently consumed [8]. The Vaccinium genus can be categorizedinto four main varieties: bilberry (V. myrtillus), blueberry (V. angustifolium, V. ashei, and V. corymbosum),cranberry (V. macrocarpon and V. oxycoccos), and lingonberry (V. Vitis-idaea), with V. corymbosum beingone of the most cultivated varieties. Its fruit, with a bittersweet and rather pleasant flavor, exhibits veryinteresting nutritional properties because of its high content in compounds of biological interest suchas phenolic compounds, like catechol, coumaric acid, chlorogenic acid, ellagic acid, epicathechin, gallicacid, anthocyanins (cyanidin 3-O-galactoside, delphinidin 3-O-arabinoside, petunidin 3-O-galactoside,malvidin 3-O-galactoside, etc.) and flavonols (mainly quercetin derivatives) [9–13]. Culture conditionsof V. corymbosum have shown a clear influence on its composition, including phenolic compounds.In relation to temperature, different authors have shown that temperatures between 20 and 30 ◦Censure the highest phenolic concentration in blueberries, while higher temperatures have adverseimpacts on their growth and composition [14–16]. In addition, the use of ammonium compounds(RNH4
+) improved the plant performance and the phenolic compounds composition. Similar effectswere detected when phytochemicals with acid pH were applied, indicating that acidification is animportant mechanism in the composition of blueberry [17,18].
Different research works have proven that blueberry, similarly to other dark-colored berries,contains a high polyphenols concentration, such as total anthocyanins (TA) and phenolic compounds(TPC) [19]. Consequently, blueberry extracts have exhibited beneficial properties for human healththat have been associated with the presence of these compounds. They have been confirmed as aconsiderable advancement for the treatment of cardiovascular diseases [20,21], diabetes [22] or evenfor the prevention of atherosclerosis [23,24]. In addition, decisive anti-inflammatory activity hasbeen appreciated [25], since they reduce cell death and diminish the morphological criteria that areassociated with inflammation in microglia cell cultures. This discovery represents a novel way for thetreatment of some neurological diseases [26]. They have also shown a significant activity to decreaseoxidative stress (anti-oxidant) with a significant effect against pulmonary arterial hypertension [27],skin damage by UV radiation [28,29] and in the microbial diversity with health benefits [30,31]. Finally,blueberry extracts have exhibited a meaningful activity that favors the treatment of different types ofcancer including leukemia [32–34].
Therefore, it has been proven that extracts rich in TA and TPC obtained from blueberry aresuitable for a considerable number of applications in the nutrition, cosmetics or medicine industries.For this reason, the development of new methodologies that allow the extraction of these compoundsfrom the blueberries in a fast, easy to use and reliable way is of great importance. Several analyticalextraction techniques such as maceration [35–37], Soxhlet [38,39], pressurized liquid extraction [40,41],microwave-assisted extraction [42–44], have been employed to obtain rich anthocyanins and phenoliccompound extracts from berries. Among them, ultrasound-assisted extraction (UAE) [45] andpressurized liquid extraction (PLE) [46,47] are the most commonly used for the extraction of bothbioactive compounds in blueberries.
UAE has been successfully used for the recovery of TA and TPC. This technique produces theextraction of the organic compounds that can be found in different matrices making use of the energyderived from ultrasounds. Its efficiency is attributed to acoustic cavitation, a phenomenon whichconsists on the formation, development and collapse of microbubbles on the surface of the solid, whichallows the penetration of the solvent into the solid and favors mass transfer processes [48]. In addition,ultrasounds exert a mechanical effect that can contribute to both the release of intracellular materialand the desorption of compounds from the solid surface, resulting in higher extraction rates. Finally,
Foods 2020, 9, 1763 3 of 20
the use of a wider temperature range results in an increased production of cavitation bubbles andconsequently improved extraction efficiency [49].
In addition, UAE presents some critical advantages, such as its simplicity, low acquisition cost,no specific maintenance requirements and availability in most laboratories. For all these reasons, thistechnique has been largely applied to the extraction of bioactive compounds from similar matrices suchas myrtle [50], açai [51], black chokeberry [52], maqui [53], sesame [54–56]. In fact, different researchershas previously employed UAE to study the blueberry composition [57–62]. However, as far as theauthors are concerned, an exhaustive study (evaluating seven extraction variables) using UAE forthe extraction of these bioactive compounds from blueberries has not yet been performed. Differentsolvents have been applied on UAE of several fruits, with methanol being one of the most employeddue to its high effectivity in TA and TPC extraction. It is true that methanol has been classified as class 2according to FDA (Food and Drug Administration) [63] due to the toxicity and the health consequenceswhen it is consumed. Nevertheless, it is extensively recommended for analytical purposes due to itspolarity, viscosity and small size, which makes it very easy to penetrate into cell membranes.
This research is focused on the optimization of two methods based on UAE. Both methods havebeen combined with spectrometric techniques to confirm that the developed optimized methodsproduce a successful recovery of TA and TPC from blueberry and, therefore, could be used by industriesand laboratories. Following such purposes, repeatability and intermediate precision analyses havebeen performed and the methods that have been developed have been tested on real samples todemonstrate their applicability.
2. Materials and Methods
2.1. Blueberry Samples
To optimize the extraction methods, 5 kg of blueberries at their optimal state of maturity(Vaccinium corymbosum L. var. Legacy) was collected from a 1.5 ha plantation at the village of Ballota(Asturias-Spain; 43.552571, −6.329105) during the month of August. The sampling was carried outrandomly throughout the entire crop plot, picking blueberries from all parts of the plant (upper,middle and lower zone). Afterward, the fresh berries were freeze-dried and crushed by means of aconventional electric grinder and the final matrix was homogenized and kept at −20 ◦C in a freezeruntil use.
Once the two methods were optimized, they were tested on commercial samples to ensure theiractual suitability for industrial and research analysis. In order to guarantee a diversity of samples,five blueberry (Vaccinium corymbosum L.) jams were acquired from three different sources and withdifferent content percentages of blueberry according to the respective product’s label. Their descriptionscan be seen in Table 1. The commercial samples were also kept at −20 ◦C until analysis.
Table 1. Commercial samples acquired to corroborate the validity of the optimized extraction methods.
Commercial Mark Origin of Production % Blueberry
Jam 1 Spain 45Jam 2 Spain 50Jam 3 Spain 60Jam 4 Brazil 50Jam 5 France 65
2.2. Solvents and Chemical Agents
Methanol (Fisher Scientific, Loughborough, UK), and formic acid (Panreac, Barcelona, Spain),both high-performance liquid chromatography (HPLC) grade, were used for extraction andchromatographic analysis. Ultra-pure water was obtained from a Milli-Q water purifier system
Foods 2020, 9, 1763 4 of 20
from Millipore (Bedford, MA, USA) and hydrochloric acid (Panreac, Barcelona, Spain; “for analysis”grade) was employed to adjust the pH of the solvents for the extraction.
For the anthocyanin quantification, the standard cyanidin chloride was acquired with a purityhigher than 95% from Sigma–Aldrich Chemical Co. (St. Louis, MO, USA) whereas for totalphenolic compounds analysis, Folin–Ciocalteu reactive (EMD Millipore, Darmstadt, Germany), sodiumcarbonate anhydrous (Panreac, Barcelona, Spain), and gallic acid standard ≥ 99% (Sigma–AldrichChemical Co., St. Louis, MO, USA) were used.
2.3. Ultrasound-Assisted Extraction
A UP200S sonifier (200 W, 24 kHz) (Dr. Hielscher. GmbH, Teltow, Germany) equipment wasselected to carry out this study. The sonifier included a water bath coupled to a temperature controller(FRIGITERM-10, J.P. Selecta, S.A., Barcelona, Spain) to allow the optimization of this variable duringthe development of the method.
Six variables were selected for the optimization and three different levels were establishedfor the range of study (low, medium and high): extraction solvent (25–50–75% MeOH in water),temperature of extraction (10–40–70 ◦C), amplitude (30–50–70% of the maximum amplitude—200 W),cycle (0.2–0.45–0.7 s), pH of the extraction solvent (2–4.5–7) and samples’ mass (g):solvent volume (mL)ratio (0.5:10–0.5:15–0.5:20). Both the selected variables to be optimized and their range of study werechosen according to the existing bibliography and the previous experience of the research group withsimilar matrices and compounds [51,53,64]. The amount of sample and the time of the experiment wereset at 0.5 g and 10 min, respectively, based on similar studies previously completed by our researchgroup [43,65].
In this way, 0.5 g of the sample was weighted and the specific amount of solvents to reach theratio corresponding to each experiment was added. These solvents had been previously prepared toensure the right percentage of methanol in water corresponding to each experiment.
The required volume of solution was added to the amount of sample, the extraction probe wasput in the mixture and the extraction was carried out under the specific conditions of each experiment.After 10 min, the centrifugation process was realized twice for 5 min at 7500 rpm (9.5 cm orbital radius).The supernatant was moved to a 25 mL volumetric flask and a 0.20 µm nylon syringe filter (MembraneSolutions, Dallas, TX, USA) was employed before the analysis.
2.4. Box–Behnken Design
This research was aimed at developing two extraction methods that would achieve themaximum possible recoveries of TA and TPC from freeze-dried blueberry samples. For this purpose,a Box–Behnken design with response surface methodology (BBD-RSM) was used to optimize thesix extraction variables. The amount of TA (mg of anthocyanins per g of sample) determined byultra-high-performance liquid chromatography (UHPLC) was used as the response variable and theTPC (mg of gallic acid equivalents (GAE) per g of sample) determined by the method of Folin–Ciocalteuwas considered as the other response variable. The resulting design included a total of 54 extractionsincluding 6 at the central point (Table S1).
The second-order polynomial equation below, which includes all the six variables, was applied tothe responses obtained from all the extractions.
Y = β0 + β1 × 1 + β2X2 + β3X3 + β4X4 + β5X5 + β6X6 + β12X1X2 + β13X1X3 + β14X1X4 + β15X1X5 +
β16X1X6 + β23X2X3 + β24X2X4 + β25X2X5 + β26X2X6 + β34X3X4 + β35X3X5 + β36X3X6 + β45X4X5 +
β46X4X6 + β56X5X6 + β11X12 + β22X2
2 + β33X32 + β44X4
2 + β55X52 + β66X6
2(1)
In our equation, Y is the corresponding response, β0 is the ordinate at the origin; X1 (percentage ofMeOH in the extraction solvent), X2 (the extraction temperature), X3 (the ultrasound amplitude), X4
(the cycle), X5 (the solvent pH), and X6 (the ratio of solid sample (g): extraction volume (mL)) are the
Foods 2020, 9, 1763 5 of 20
independent variables; βi represents the linear coefficients; βij depicts the cross product coefficientsand βii shows the quadratic coefficients.
Statgraphic Centurion (version XVII) (Statgraphics Technologies, Inc., The Plains, VA, USA) was thesoftware used to calculate the effects of the extraction variables on the final response, the second-ordermathematical model, the surface plots, the optimal levels of the significant variables and the varianceof the analysis.
2.5. Anthocyanins Identification by UHPLC-Q-ToF-MS
The TA present in the blueberry samples were identified by an ultra-high-performance liquidchromatography (UHPLC) system coupled to quadrupole time-of-flight (Q-ToF-MS) mass spectrometry(XEVO G2, Waters Corp., Milford, MA, USA). The chromatography column employed was a C18with dimensions of 2.1 mm × 100 mm and a particle size of 1.7 µm (Acquity UPLC BEH C18, Waters).The injection volume was set at 3 µL. The chromatographic conditions used as well as the analysisconditions in the mass spectrometer (Q-ToF-MS) are those described by Aliaño et al. [42].
The identification of the TA present in blueberries was determined by the exact m/z mass/chargeratio obtained for each of the chromatographic peaks corresponding to anthocyanins. The ratiowas compared with other works found in the literature that describe the anthocyanins present inblueberries [66], and by the order of elution of the anthocyanins. A total of 14 anthocyanins wereidentified in the blueberry extracts; the data regarding each compound and the theoretical and measuredmass/charge ratios can be found in Table 2.
Table 2. Mass information and regression equation data of the 14 anthocyanins identified inblueberry extracts.
Anthocyanins MolecularFormula m/z Regression Equation R2 *
LOD **(ppm)
LOQ ***(ppm)
Malvidin 3-O-galactoside C23H25O12 493.1346 y = 170,426.24x − 4292.66 0.9999 0.303 1.012Malvidin 3-O-glucoside C23H25O12 493.1346 y = 170,426.24x − 4292.66 0.9999 0.303 1.012
Petunidin 3-O-galactoside C22H23O12 479.1190 y = 175,412.35x − 4292.66 0.9999 0.294 0.983Petunidin 3-O-glucoside C22H23O12 479.1190 y = 175,412.35x − 4292.66 0.9999 0.294 0.983
Delphinidin 3-O-galactoside C21H21O12 465.1033 y = 180,699.41x − 4292.66 0.9999 0.286 0.955Delphinidin 3-O-glucoside C21H21O12 465.1033 y = 180,699.41x − 4292.66 0.9999 0.286 0.955Peonidin 3-O-galactoside C22H23O11 463.1240 y = 181,468.74x − 4292.66 0.9999 0.284 0.951Peonidin 3-O-glucoside C22H23O11 463.1240 y = 181,468.74x − 4292.66 0.9999 0.284 0.951
Malvidin 3-O-arabinoside C23H23O11 463.1240 y = 181,468.74x − 4292.66 0.9999 0.284 0.951Cyanidin 3-O-galactoside C21H21O11 449.1084 y = 187,132.66x − 4292.66 0.9999 0.276 0.922Cyanidin 3-O-glucoside C21H21O11 449.1084 y = 187,132.66x − 4292.66 0.9999 0.276 0.922
Petunidin 3-O-arabinoside C21H21O11 449.1084 y = 187,132.66x − 4292.66 0.9999 0.276 0.922Delphinidin 3-O-arabinoside C20H19O11 435.0927 y = 193,161.98x − 4292.66 0.9999 0.267 0.893
Cyanidin 3-O-arabinoside C20H19O10 419.0978 y = 200,531.32x − 4292.66 0.9999 0.257 0.860
* Coefficient of determination; ** Limit of detection; *** Limit of quantification.
2.6. Separation and Quantification of Anthocyanins
Once the TA were identified by UHPLC-Q-ToF-MS, its separation and quantification was the nextstep to be completed. A LaChrom Ultra Elite UHPLC system (VWR Hitachi, Tokyo, Japan) was usedfor this purpose. This system included an L-2200U autosampler, an L-2160U pump and an L2300column oven which was set at 50 ◦C for the analysis. In addition, the UHPLC was equipped with anL-2420U UV–vis Detector that was set at 520 nm for anthocyanin quantification. The anthocyaninswere analyzed on a Hitachi LaChrom HaloTM C18 column (100 × 3 mm inside diameter, particle size2.7 µm).
Acidified water (5% formic acid) was selected as solvent A, while pure methanol was chosen assolvent B, working at a flow rate of 1.0 mL min−1. The chromatographic separation was performedby the following gradient method: 0 min, 15% B; 1.50 min, 20% B; 3.30 min, 30% B; 4.80 min, 40% B;5.40 min, 55% B; 5.90 min, 60% B; 6.60 min, 95% B; 9.30 min, 95% B; 10 min, 15% B.
Foods 2020, 9, 1763 6 of 20
Cyanidin chloride was used as anthocyanin standard, obtaining the following calibration curve:y = 300,568.88x − 28,462.43. The regression equation and the determination coefficient (R2 = 0.9999)were determined by means of Microsoft Office Excel 2010.
The Shapiro–Wilk test and the t-test were used to evaluate the normal distribution of the residues,obtaining a W value of 0.8514 (very close to 1) and a p value of 0.803 (higher than 0.05), respectively,which demonstrated the normal distribution of the residues.
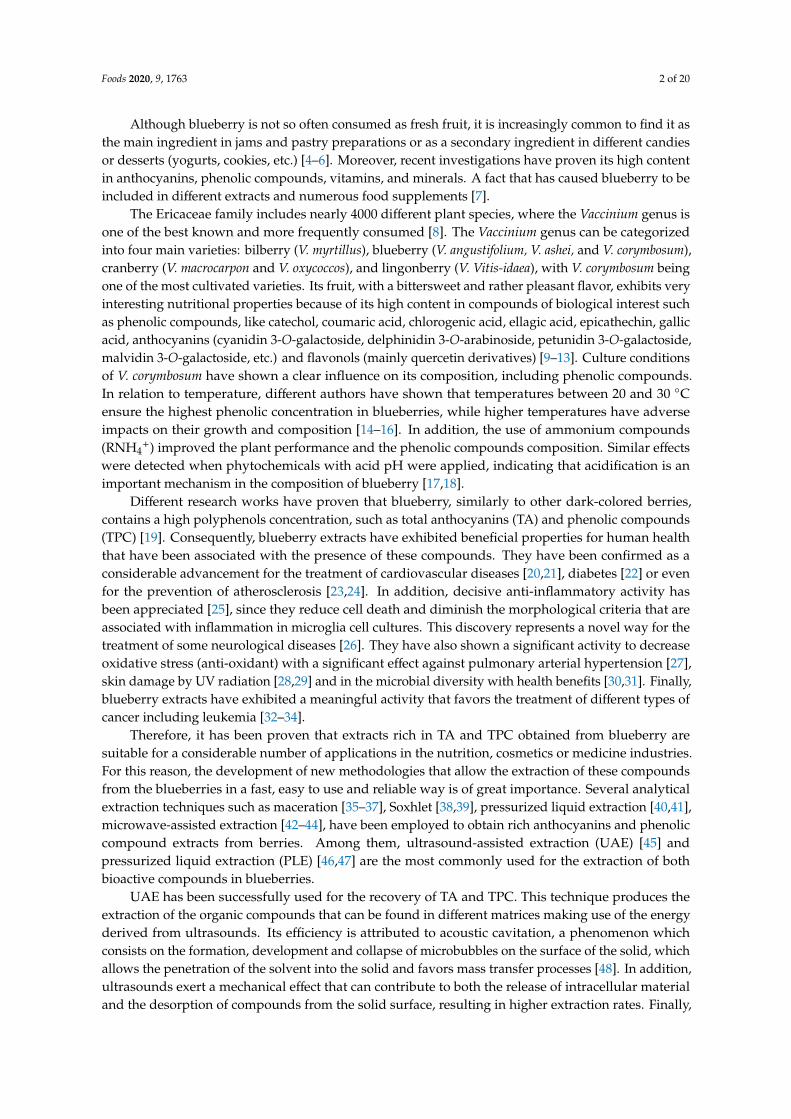
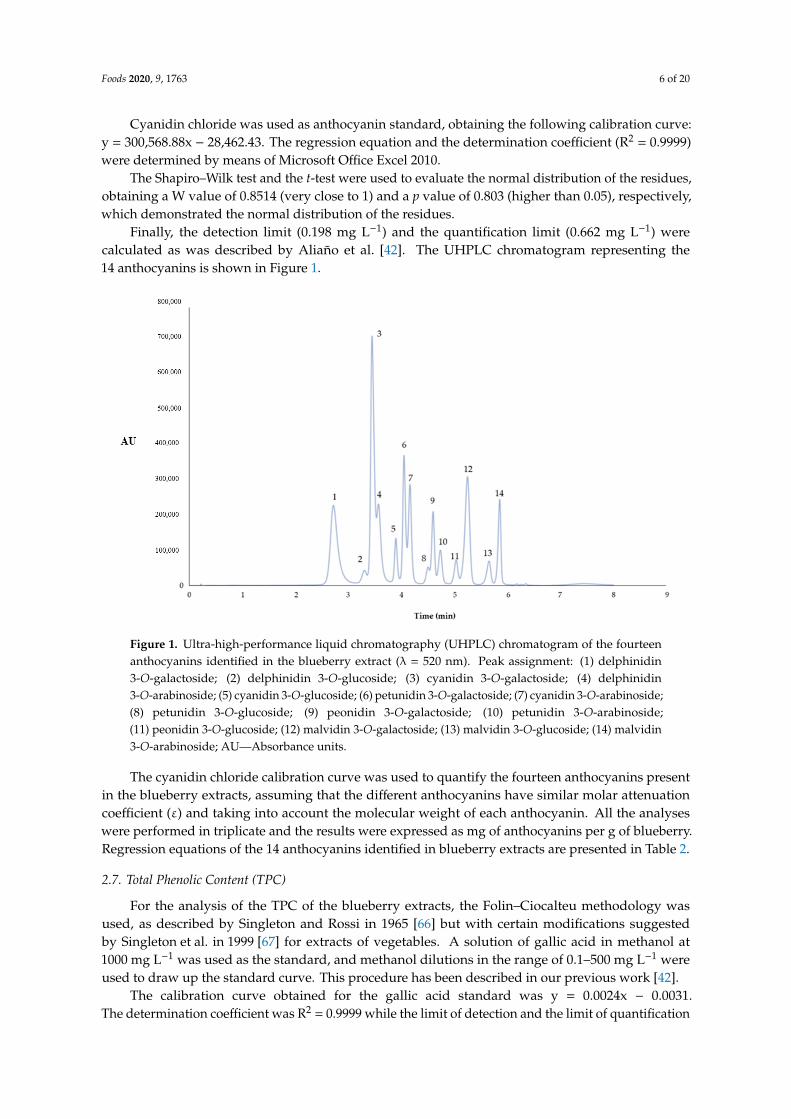
Finally, the detection limit (0.198 mg L−1) and the quantification limit (0.662 mg L−1) werecalculated as was described by Aliaño et al. [42]. The UHPLC chromatogram representing the14 anthocyanins is shown in Figure 1.
Foods 2020, 9, x FOR PEER REVIEW 7 of 22
used for this purpose. This system included an L-2200U autosampler, an L-2160U pump and an L2300 column oven which was set at 50 °C for the analysis. In addition, the UHPLC was equipped with an L-2420U UV–vis Detector that was set at 520 nm for anthocyanin quantification. The anthocyanins were analyzed on a Hitachi LaChrom HaloTM C18 column (100 × 3 mm inside diameter, particle size 2.7 μm).
Acidified water (5% formic acid) was selected as solvent A, while pure methanol was chosen as solvent B, working at a flow rate of 1.0 mL min–1. The chromatographic separation was performed by the following gradient method: 0 min, 15% B; 1.50 min, 20% B; 3.30 min, 30% B; 4.80 min, 40% B; 5.40 min, 55% B; 5.90 min, 60% B; 6.60 min, 95% B; 9.30 min, 95% B; 10 min, 15% B.
Cyanidin chloride was used as anthocyanin standard, obtaining the following calibration curve: y = 300568.88x − 28462.43. The regression equation and the determination coefficient (R2 = 0.9999) were determined by means of Microsoft Office Excel 2010.
The Shapiro–Wilk test and the t-test were used to evaluate the normal distribution of the residues, obtaining a W value of 0.8514 (very close to 1) and a p value of 0.803 (higher than 0.05), respectively, which demonstrated the normal distribution of the residues.
Finally, the detection limit (0.198 mg L–1) and the quantification limit (0.662 mg L–1) were calculated as was described by Aliaño et al. [42]. The UHPLC chromatogram representing the 14 anthocyanins is shown in Figure 1.
Figure 1. Ultra-high-performance liquid chromatography (UHPLC) chromatogram of the fourteen anthocyanins identified in the blueberry extract (λ = 520 nm). Peak assignment: (1) delphinidin 3-O-galactoside; (2) delphinidin 3-O-glucoside; (3) cyanidin 3-O-galactoside; (4) delphinidin 3-O-arabinoside; (5) cyanidin 3-O-glucoside; (6) petunidin 3-O-galactoside; (7) cyanidin 3-O-arabinoside; (8) petunidin 3-O-glucoside; (9) peonidin 3-O-galactoside; (10) petunidin 3-O-arabinoside; (11) peonidin 3-O-glucoside; (12) malvidin 3-O-galactoside; (13) malvidin 3-O-glucoside; (14) malvidin 3-O-arabinoside; AU—Absorbance units.
The cyanidin chloride calibration curve was used to quantify the fourteen anthocyanins present in the blueberry extracts, assuming that the different anthocyanins have similar molar attenuation coefficient (ε) and taking into account the molecular weight of each anthocyanin. All the analyses were performed in triplicate and the results were expressed as mg of anthocyanins per g of blueberry. Regression equations of the 14 anthocyanins identified in blueberry extracts are presented in Table 2.
Figure 1. Ultra-high-performance liquid chromatography (UHPLC) chromatogram of the fourteenanthocyanins identified in the blueberry extract (λ = 520 nm). Peak assignment: (1) delphinidin3-O-galactoside; (2) delphinidin 3-O-glucoside; (3) cyanidin 3-O-galactoside; (4) delphinidin3-O-arabinoside; (5) cyanidin 3-O-glucoside; (6) petunidin 3-O-galactoside; (7) cyanidin 3-O-arabinoside;(8) petunidin 3-O-glucoside; (9) peonidin 3-O-galactoside; (10) petunidin 3-O-arabinoside;(11) peonidin 3-O-glucoside; (12) malvidin 3-O-galactoside; (13) malvidin 3-O-glucoside; (14) malvidin3-O-arabinoside; AU—Absorbance units.
The cyanidin chloride calibration curve was used to quantify the fourteen anthocyanins presentin the blueberry extracts, assuming that the different anthocyanins have similar molar attenuationcoefficient (ε) and taking into account the molecular weight of each anthocyanin. All the analyseswere performed in triplicate and the results were expressed as mg of anthocyanins per g of blueberry.Regression equations of the 14 anthocyanins identified in blueberry extracts are presented in Table 2.
2.7. Total Phenolic Content (TPC)
For the analysis of the TPC of the blueberry extracts, the Folin–Ciocalteu methodology wasused, as described by Singleton and Rossi in 1965 [66] but with certain modifications suggestedby Singleton et al. in 1999 [67] for extracts of vegetables. A solution of gallic acid in methanol at1000 mg L−1 was used as the standard, and methanol dilutions in the range of 0.1–500 mg L−1 wereused to draw up the standard curve. This procedure has been described in our previous work [42].
The calibration curve obtained for the gallic acid standard was y = 0.0024x − 0.0031.The determination coefficient was R2 = 0.9999 while the limit of detection and the limit of quantification
Foods 2020, 9, 1763 7 of 20
were 1.649 mg L−1 and 5.498 mg L−1, respectively; the limits were calculated as explained inSection 2.6 above. The normal distribution of the residues for the gallic acid standard was also studied;the Shapiro–Wilk test showed a W value of 0.9201 and the p-value was 0.762, which indicated thenormal distribution of the residues.
2.8. Statistical Analysis
As it was previously mentioned, a Box–Behnken design was selected to evaluate the influenceof different variables on TA and TPC extraction. For that, the effect of the extraction variables on thefinal response was studied. The surface plots were evaluated to see how these variables affect the TAand TPC extraction. Once the optimal levels of the significant variables were obtained, a repeatabilityand intermediate precision study was carried out. Standard deviation and coefficient of variationwere the statistical parameters selected to evaluate the precision. Statgraphic Centurion (version XVII)(Statgraphics Technologies, Inc., The Plains, VA, USA) was the software used for the statistical analysis.
3. Results
The aim of this research was the optimization of two different methods both based on UAE to findthe maximum recovery of bioactive compounds (TA and TPC) from blueberry samples. Thus, theycould be used by industries and laboratories for quality control analysis and to ensure the maximumpossible compound concentration in both the raw material and their commercially derived products.For this purpose, a BBD-RSM was selected and a total of 54 experiments with specific conditions foreach of them were obtained (Table S1). The extractions were performed in duplicate according tothese parameters and after that the TA and TPC were measured. The TA and TPC contents were usedto determine the optimal conditions to achieve the maximum yields of these compounds. In all thecases, the analytical parameters of repeatability and intermediate precision have been evaluated toguarantee the suitability of the developed methods. Finally, commercial samples were analyzed underthe optimum conditions to prove the suitability of the developed methods.
3.1. Anthocyanins Optimization
3.1.1. Optimization of the Extraction Method
The extracts obtained from the 54 experiments were analyzed by UHPLC–UV–vis to quantifythe 14 anthocyanins previously identified. The individual anthocyanin content was aggregated todetermine the total anthocyanin content and the average of the two replicates of the same experimentwas used as the response variable.
BBD-RSM was applied to determine the influence from each one of the six variables and theirpossible interaction on the response variable. On the other hand, the correlation between the realvalues of the TA and the values predicted from Equation (1) was evaluated, and the differences betweenthe actual and the predicted values were computed as relative prediction error (Table S1). The meanprediction error was 4.79%, with values ranging from 0.02% to 15.84%, which implies a clear influenceof the extraction variables on the anthocyanin recoveries and, consequently, the possibility of adjustingthem to obtain the maximum anthocyanin recovery from the blueberry samples.
The t-test was employed to evaluate the influence of the optimized variables, considering a95% confidence level, which means that the variables with p-values lower than 0.05 were consideredinfluential. Table 3 shows the calculated p-values. As it can be seen, the most influential variables were:percentage of methanol in the solvent (p-value: 0.0005), the quadratic interaction of the percentage ofmethanol in the water used as extraction solvent (p-value: 0.0268), and the interaction percentage ofmethanol: amplitude (p-value: 0.0295). In linear terms, the percentage of methanol in the extractionsolvent had a positive influence, which means that the anthocyanin extractions were more favorablewhen the percentage of methanol was higher.
Foods 2020, 9, 1763 8 of 20
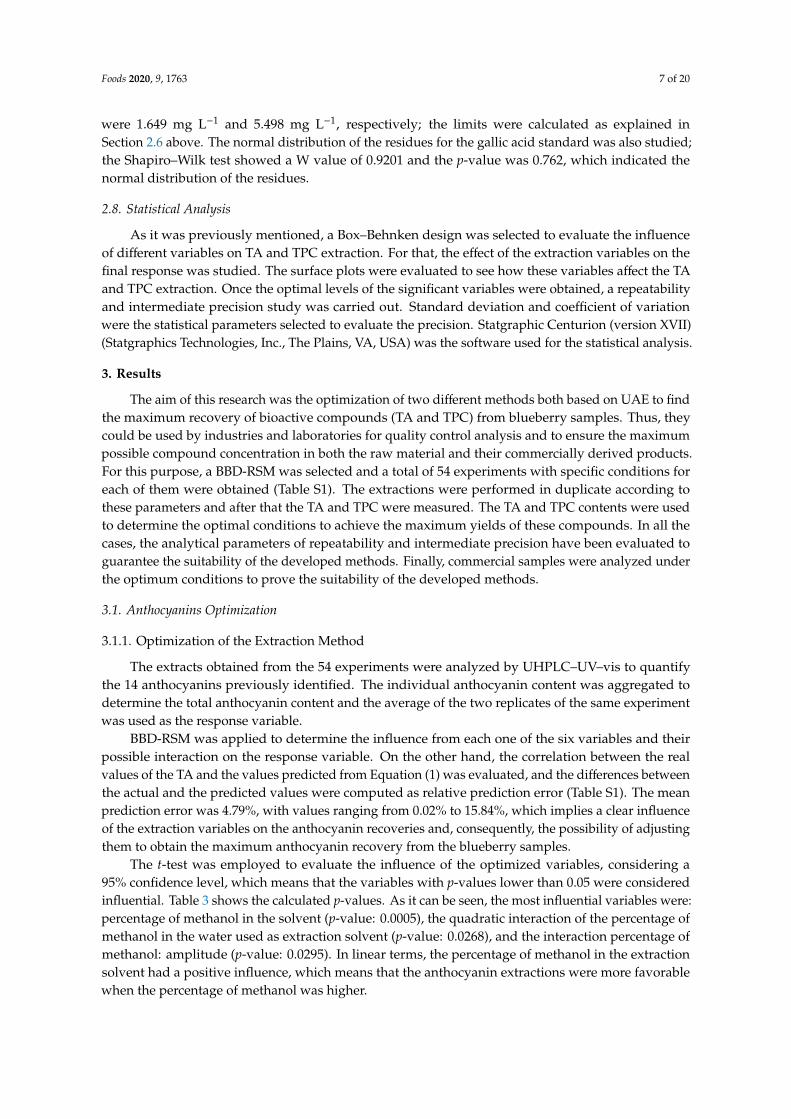
Table 3. Analysis of variance of the quadratic model adjusted to the extraction of anthocyanins.A: %MeOH; B: temperature; C: amplitude; D: cycle; E: pH; F: ratio.
Variable Source Coefficient Sum ofSquares
Degreesof Freedom
MeanSquare F-Value p-Value
β0 24.0196 325.9582 27A X1 −0.3187 105.9240 1 105.9240 15.8500 0.0005B X2 0.1353 0.4483 1 0.4483 0.0700 0.7977C X3 −0.2988 23.3445 1 23.3445 3.4900 0.0729D X4 −24.0790 27.6705 1 27.6705 4.1400 0.0522E X5 3.0896 0.4401 1 0.4401 0.0700 0.7995F X6 −0.1373 0.2400 1 0.2400 0.0400 0.8512
A:A X12 0.0030 36.8281 1 36.8281 5.5100 0.0268
A:B X12 −0.0006 1.4878 1 1.4878 0.2200 0.6410A:C X13 0.0042 35.4482 1 35.4482 5.3000 0.0295A:D X14 0.1073 7.1958 1 7.1958 1.0800 0.3090A:E X15 −0.0108 3.6585 1 3.6585 0.5500 0.4660A:F X16 −0.0058 4.2195 1 4.2195 0.6300 0.4340B:B X2
2 −0.0011 9.2232 1 9.2232 1.3800 0.2507B:C X23 −0.0002 0.0861 1 0.0861 0.0100 0.9105B:D X24 0.0290 0.3785 1 0.3785 0.0600 0.8138B:E X25 −0.0002 0.0053 1 0.0053 0.0000 0.9778B:F X26 −0.0014 0.3570 1 0.3570 0.0500 0.8190C:C X3
2 0.0000 0.0041 1 0.0041 0.0000 0.9805C:D X34 0.2210 9.7682 1 9.7682 1.4600 0.2375C:E X35 −0.0037 0.2665 1 0.2665 0.0400 0.8433C:F X36 0.0044 3.1418 1 3.1418 0.4700 0.4990D:D X4
2 −12.4244 6.2022 1 6.2022 0.9300 0.3442D:E X45 1.0280 3.3025 1 3.3025 0.4900 0.4883D:F X46 1.1570 16.7331 1 16.7331 2.5000 0.1256E:E X5
2 −0.2649 28.1965 1 28.1965 4.2200 0.0501E:F X56 −0.0326 1.3285 1 1.3285 0.2000 0.6594F:F X6
2 −0.0030 0.0596 1 0.0596 0.0100 0.9255Pure Error 173.7380 26 6.6822
Total 539.3450 53
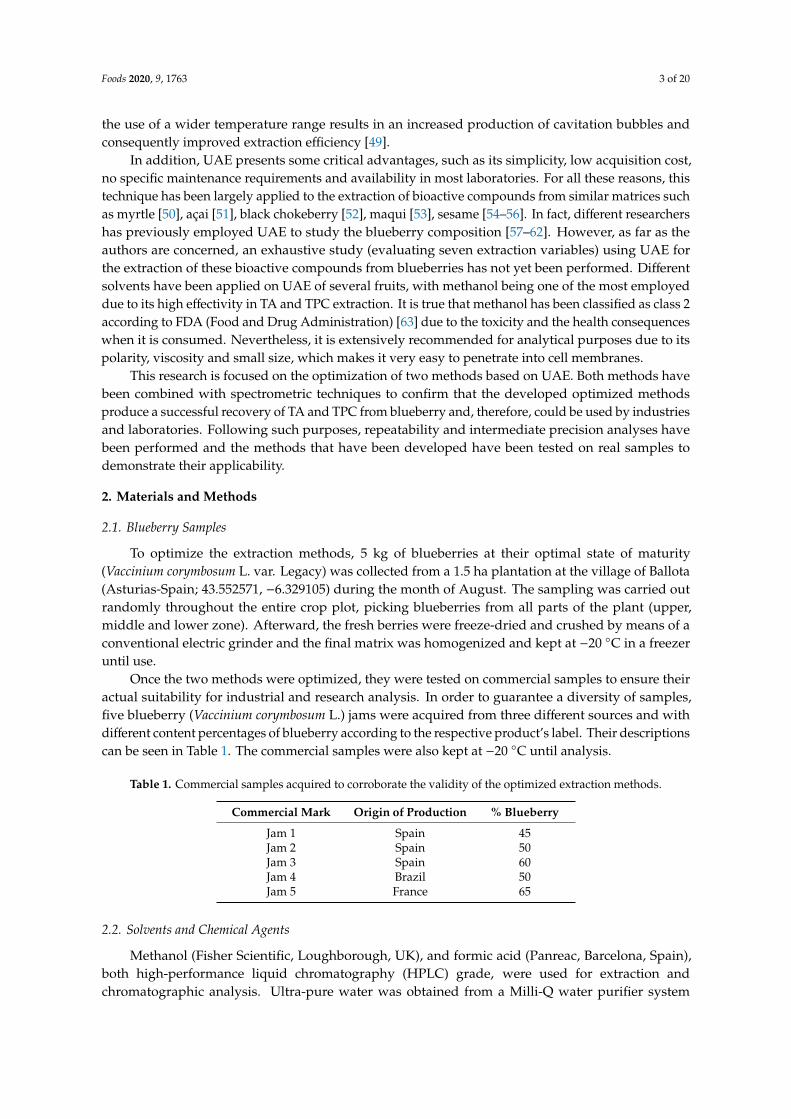
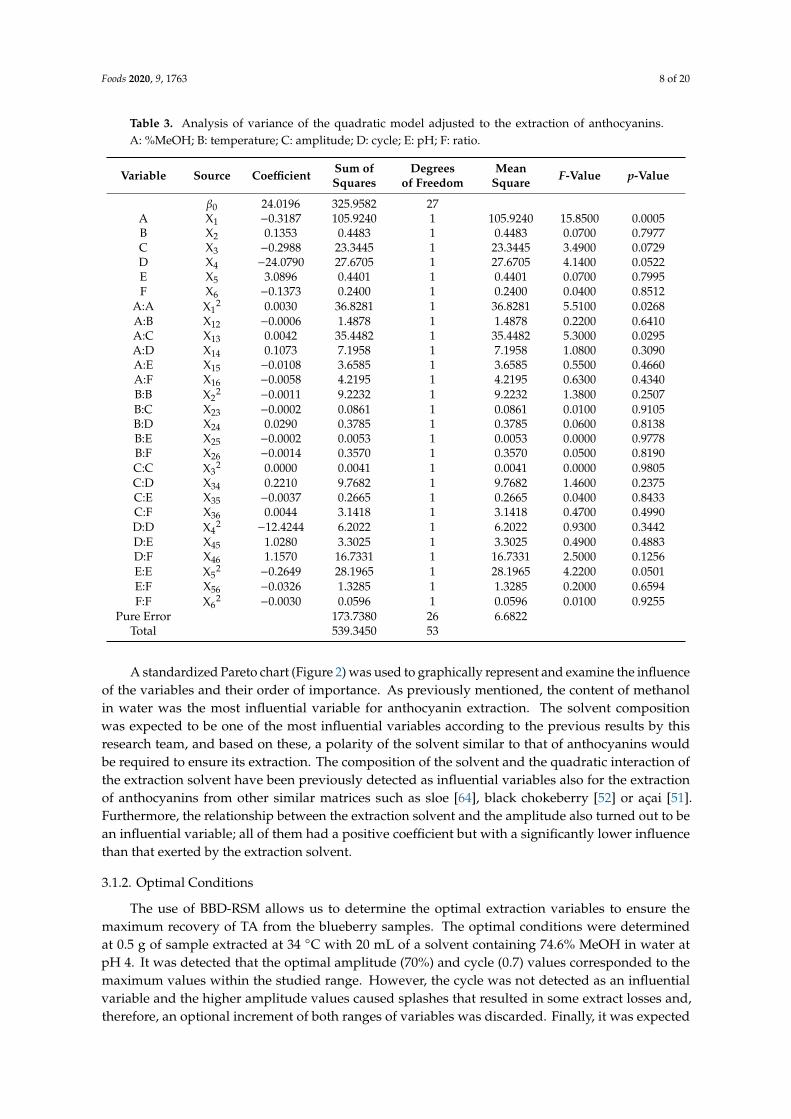
A standardized Pareto chart (Figure 2) was used to graphically represent and examine the influenceof the variables and their order of importance. As previously mentioned, the content of methanolin water was the most influential variable for anthocyanin extraction. The solvent compositionwas expected to be one of the most influential variables according to the previous results by thisresearch team, and based on these, a polarity of the solvent similar to that of anthocyanins wouldbe required to ensure its extraction. The composition of the solvent and the quadratic interaction ofthe extraction solvent have been previously detected as influential variables also for the extractionof anthocyanins from other similar matrices such as sloe [64], black chokeberry [52] or açai [51].Furthermore, the relationship between the extraction solvent and the amplitude also turned out to bean influential variable; all of them had a positive coefficient but with a significantly lower influencethan that exerted by the extraction solvent.
3.1.2. Optimal Conditions
The use of BBD-RSM allows us to determine the optimal extraction variables to ensure themaximum recovery of TA from the blueberry samples. The optimal conditions were determinedat 0.5 g of sample extracted at 34 ◦C with 20 mL of a solvent containing 74.6% MeOH in water atpH 4. It was detected that the optimal amplitude (70%) and cycle (0.7) values corresponded to themaximum values within the studied range. However, the cycle was not detected as an influentialvariable and the higher amplitude values caused splashes that resulted in some extract losses and,therefore, an optional increment of both ranges of variables was discarded. Finally, it was expected
Foods 2020, 9, 1763 9 of 20
that relatively low temperature values within the studied range would yield the optimal extractionvalues, since anthocyanins have shown to be easily degraded under extreme thermal conditions [68].Other authors have found for bilberry that the extracts after 60 min applying ultrasound had alower concentration of anthocyanins than the extracts obtained only by conventional maceration [69].This may be because the sonication process can lead to the formation of free radicals that can enhancepolymerization/depolymerization reactions. To see how ultrasound influences our particular extractionconditions, a comparison was made between the total concentration of anthocyanins obtained throughthe optimal extraction conditions obtained for ultrasound (5 min), with the same optimal extractionconditions, without the application of ultrasound, applying only maceration with magnetic stirring(5 min and 60 min; 300 rpm). The extractions have been carried out in triplicate. Under our extractionconditions, a greater amount of total anthocyanins has been obtained by applying ultrasound, comparedto using maceration with magnetic stirring (32.16% for 5 min and 9.42% for 60 min). Although it is truethat ultrasound can degrade anthocyanins, by applying ultrasound for a very short period of time,and through cycles, this degradation can be minimized and the positive effects of ultrasound on theextraction of compounds can be optimized. On the other hand, longer ultrasound times present aconsiderable reduction in the total amount of anthocyanins extracted (Figure 3), so it is recommendedto use ultrasound for short periods of time and under optimal extraction conditions.
Foods 2020, 9, x FOR PEER REVIEW 10 of 22
interaction of the extraction solvent have been previously detected as influential variables also for the extraction of anthocyanins from other similar matrices such as sloe [64], black chokeberry [52] or açai [51]. Furthermore, the relationship between the extraction solvent and the amplitude also turned out to be an influential variable; all of them had a positive coefficient but with a significantly lower influence than that exerted by the extraction solvent.
Figure 2. Standardized Pareto chart representing the extraction optimization of total anthocyanins. A: solvent (% MeOH); B: temperature (°C); C: amplitude (%); D: cycle (s); E: pH; F: ratio (mL).
3.1.2. Optimal Conditions
The use of BBD-RSM allows us to determine the optimal extraction variables to ensure the maximum recovery of TA from the blueberry samples. The optimal conditions were determined at 0.5 g of sample extracted at 34 °C with 20 mL of a solvent containing 74.6% MeOH in water at pH 4. It was detected that the optimal amplitude (70%) and cycle (0.7) values corresponded to the maximum values within the studied range. However, the cycle was not detected as an influential variable and the higher amplitude values caused splashes that resulted in some extract losses and, therefore, an optional increment of both ranges of variables was discarded. Finally, it was expected that relatively low temperature values within the studied range would yield the optimal extraction values, since anthocyanins have shown to be easily degraded under extreme thermal conditions [68]. Other authors have found for bilberry that the extracts after 60 min applying ultrasound had a lower concentration of anthocyanins than the extracts obtained only by conventional maceration [69]. This may be because the sonication process can lead to the formation of free radicals that can enhance polymerization/depolymerization reactions. To see how ultrasound influences our particular extraction conditions, a comparison was made between the total concentration of anthocyanins obtained through the optimal extraction conditions obtained for ultrasound (5 min), with the same optimal extraction conditions, without the application of ultrasound, applying only maceration with magnetic stirring (5 min and 60 min; 300 rpm). The extractions have been carried out in triplicate. Under our extraction conditions, a greater amount of total anthocyanins has been obtained by applying ultrasound, compared to using maceration with magnetic stirring (32.16% for 5 min and 9.42% for 60 min). Although it is true that ultrasound can degrade anthocyanins, by applying ultrasound for a very short period of time, and through cycles, this degradation can be minimized and the positive effects of ultrasound on the extraction of compounds can be optimized. On the other hand, longer ultrasound times present a considerable reduction in the total amount of anthocyanins extracted (Figure 3), so it is recommended to use ultrasound for short periods of time and under optimal extraction conditions.
Figure 2. Standardized Pareto chart representing the extraction optimization of total anthocyanins.A: solvent (% MeOH); B: temperature (◦C); C: amplitude (%); D: cycle (s); E: pH; F: ratio (mL).
The optimal conditions were compared with recent research studies on the extraction ofanthocyanins from berry matrices using UAE. Bonat Celli et al. [68] investigated the extractionof anthocyanin from haskap berries (Lonicera caerulea L.) using UAE. The optimal conditions establishedwere similar to those found for this research, such as the ratio (25:1 (mL g−1)), temperature (35 ◦C),or percentage of methanol (80%). However, the extraction time required was 20 min, which is twicethe length of the period measured in this research.
On the other hand, Quiang Cheng et al. [70] and R. Albuquerque et al. [71] studied the extractionof anthocyanins from the fruits of Rubia sylvatica Nakai and from Jabuticaba’s epicarp, respectively.Both authors included pH as an influential variable and demonstrated that acid-level pH (3–4)facilitated the extraction of anthocyanins similarly as it was observed in the present research. Finally,Fibigr et al. [72] investigated the optimal amount of açai berry samples for maximum anthocyaninextraction using UAE. Thus, the experiments performed with 0.4–0.7 g samples allowed the maximumrecoveries. As it could be observed, the optimal conditions determined for the extraction of anthocyaninsfrom blueberries were in agreement with the results found in the literature.
Foods 2020, 9, 1763 10 of 20
Foods 2020, 9, x FOR PEER REVIEW 11 of 22
The optimal conditions were compared with recent research studies on the extraction of anthocyanins from berry matrices using UAE. Bonat Celli et al. [68] investigated the extraction of anthocyanin from haskap berries (Lonicera caerulea L.) using UAE. The optimal conditions established were similar to those found for this research, such as the ratio (25:1 (mL g–1)), temperature (35 °C), or percentage of methanol (80%). However, the extraction time required was 20 min, which is twice the length of the period measured in this research.
On the other hand, Quiang Cheng et al. [70] and R. Albuquerque et al. [71] studied the extraction of anthocyanins from the fruits of Rubia sylvatica Nakai and from Jabuticaba’s epicarp, respectively. Both authors included pH as an influential variable and demonstrated that acid-level pH (3–4) facilitated the extraction of anthocyanins similarly as it was observed in the present research. Finally, Fibigr et al. [72] investigated the optimal amount of açai berry samples for maximum anthocyanin extraction using UAE. Thus, the experiments performed with 0.4–0.7 g samples allowed the maximum recoveries. As it could be observed, the optimal conditions determined for the extraction of anthocyanins from blueberries were in agreement with the results found in the literature.
3.1.3. Extraction Time
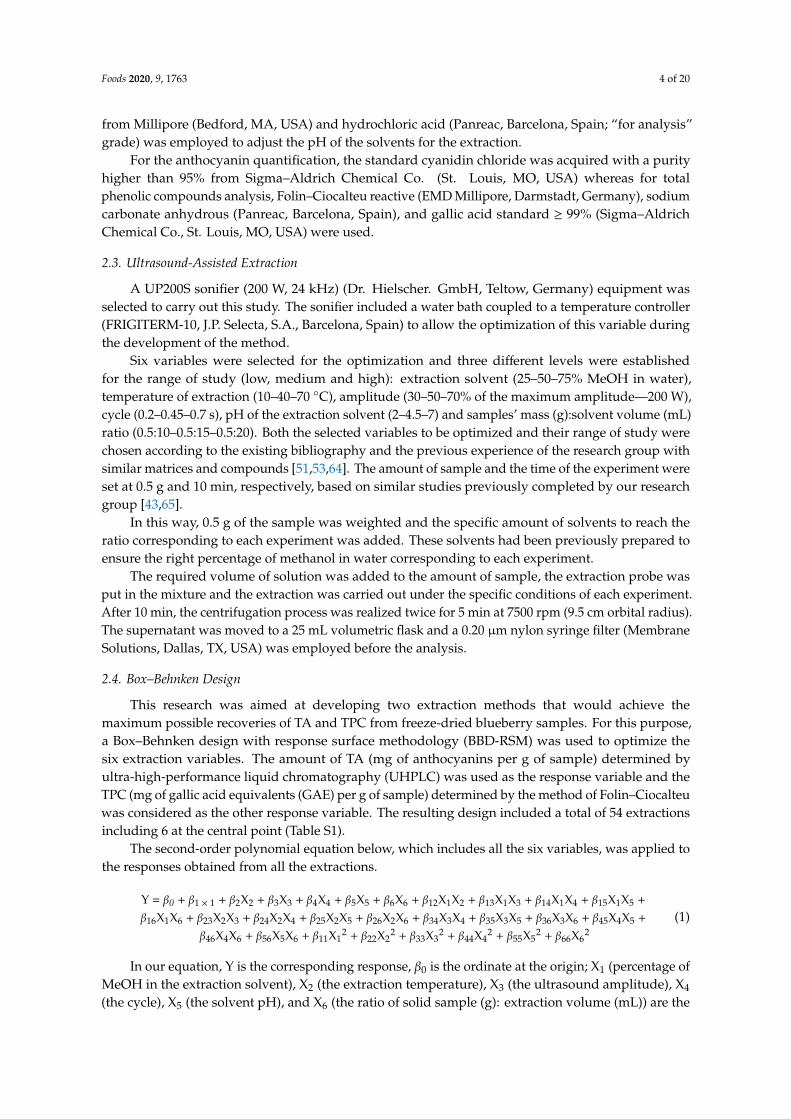
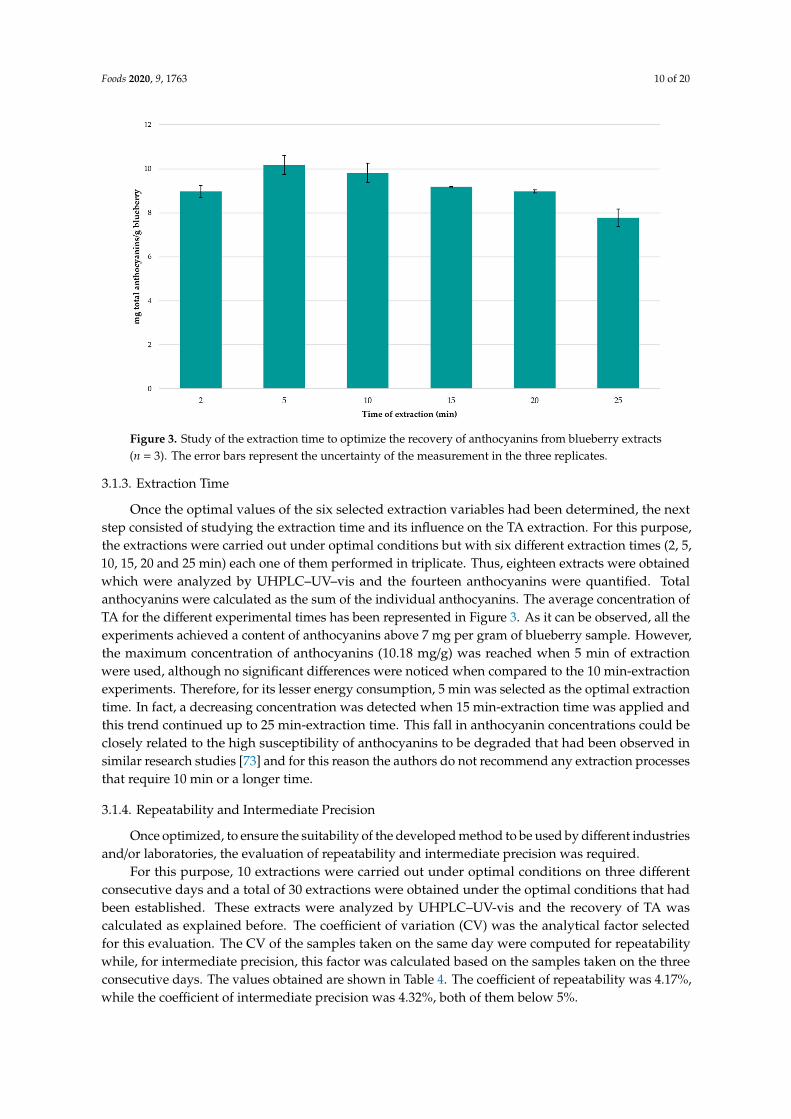
Once the optimal values of the six selected extraction variables had been determined, the next step consisted of studying the extraction time and its influence on the TA extraction. For this purpose, the extractions were carried out under optimal conditions but with six different extraction times (2, 5, 10, 15, 20 and 25 min) each one of them performed in triplicate. Thus, eighteen extracts were obtained which were analyzed by UHPLC–UV–vis and the fourteen anthocyanins were quantified. Total anthocyanins were calculated as the sum of the individual anthocyanins. The average concentration of TA for the different experimental times has been represented in Figure 3. As it can be observed, all the experiments achieved a content of anthocyanins above 7 mg per gram of blueberry sample. However, the maximum concentration of anthocyanins (10.18 mg/g) was reached when 5 min of extraction were used, although no significant differences were noticed when compared to the 10 min-extraction experiments. Therefore, for its lesser energy consumption, 5 min was selected as the optimal extraction time. In fact, a decreasing concentration was detected when 15 min-extraction time was applied and this trend continued up to 25 min-extraction time. This fall in anthocyanin concentrations could be closely related to the high susceptibility of anthocyanins to be degraded that had been observed in similar research studies [73] and for this reason the authors do not recommend any extraction processes that require 10 min or a longer time.
Figure 3. Study of the extraction time to optimize the recovery of anthocyanins from blueberry extracts(n = 3). The error bars represent the uncertainty of the measurement in the three replicates.
3.1.3. Extraction Time
Once the optimal values of the six selected extraction variables had been determined, the nextstep consisted of studying the extraction time and its influence on the TA extraction. For this purpose,the extractions were carried out under optimal conditions but with six different extraction times (2, 5,10, 15, 20 and 25 min) each one of them performed in triplicate. Thus, eighteen extracts were obtainedwhich were analyzed by UHPLC–UV–vis and the fourteen anthocyanins were quantified. Totalanthocyanins were calculated as the sum of the individual anthocyanins. The average concentration ofTA for the different experimental times has been represented in Figure 3. As it can be observed, all theexperiments achieved a content of anthocyanins above 7 mg per gram of blueberry sample. However,the maximum concentration of anthocyanins (10.18 mg/g) was reached when 5 min of extractionwere used, although no significant differences were noticed when compared to the 10 min-extractionexperiments. Therefore, for its lesser energy consumption, 5 min was selected as the optimal extractiontime. In fact, a decreasing concentration was detected when 15 min-extraction time was applied andthis trend continued up to 25 min-extraction time. This fall in anthocyanin concentrations could beclosely related to the high susceptibility of anthocyanins to be degraded that had been observed insimilar research studies [73] and for this reason the authors do not recommend any extraction processesthat require 10 min or a longer time.
3.1.4. Repeatability and Intermediate Precision
Once optimized, to ensure the suitability of the developed method to be used by different industriesand/or laboratories, the evaluation of repeatability and intermediate precision was required.
For this purpose, 10 extractions were carried out under optimal conditions on three differentconsecutive days and a total of 30 extractions were obtained under the optimal conditions that hadbeen established. These extracts were analyzed by UHPLC–UV-vis and the recovery of TA wascalculated as explained before. The coefficient of variation (CV) was the analytical factor selectedfor this evaluation. The CV of the samples taken on the same day were computed for repeatabilitywhile, for intermediate precision, this factor was calculated based on the samples taken on the threeconsecutive days. The values obtained are shown in Table 4. The coefficient of repeatability was 4.17%,while the coefficient of intermediate precision was 4.32%, both of them below 5%.
Foods 2020, 9, 1763 11 of 20
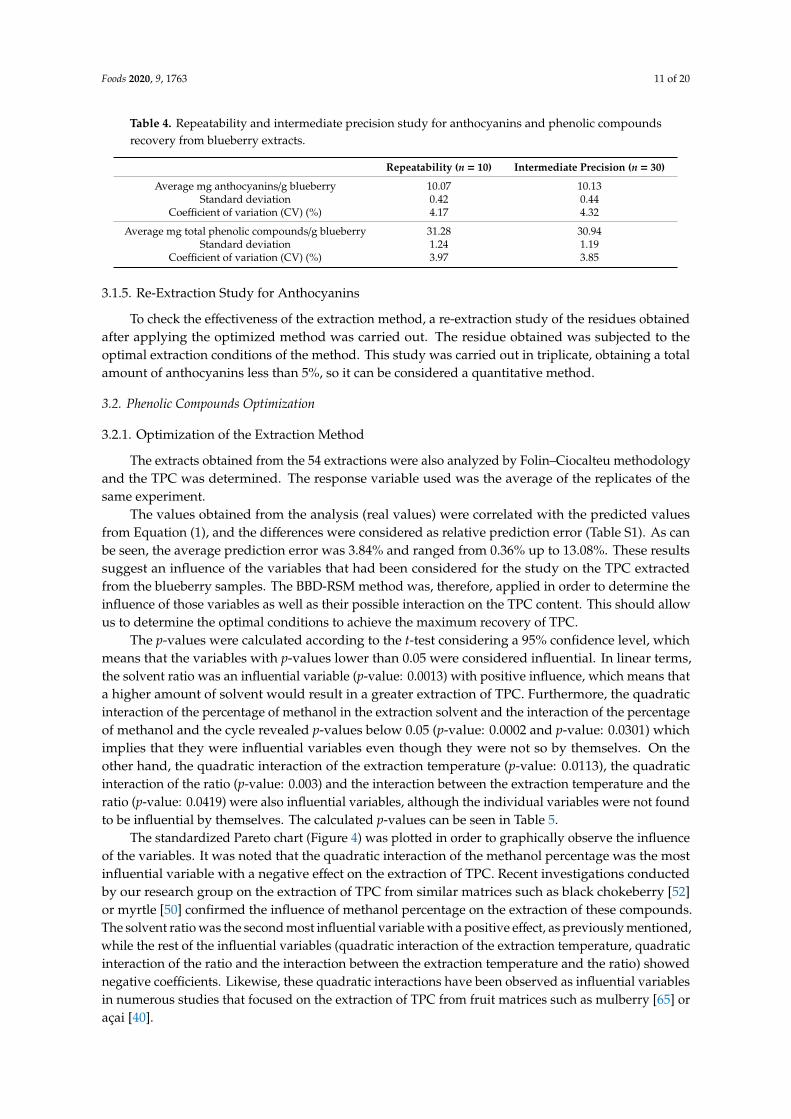
Table 4. Repeatability and intermediate precision study for anthocyanins and phenolic compoundsrecovery from blueberry extracts.
Repeatability (n = 10) Intermediate Precision (n = 30)
Average mg anthocyanins/g blueberry 10.07 10.13Standard deviation 0.42 0.44
Coefficient of variation (CV) (%) 4.17 4.32
Average mg total phenolic compounds/g blueberry 31.28 30.94Standard deviation 1.24 1.19
Coefficient of variation (CV) (%) 3.97 3.85
3.1.5. Re-Extraction Study for Anthocyanins
To check the effectiveness of the extraction method, a re-extraction study of the residues obtainedafter applying the optimized method was carried out. The residue obtained was subjected to theoptimal extraction conditions of the method. This study was carried out in triplicate, obtaining a totalamount of anthocyanins less than 5%, so it can be considered a quantitative method.
3.2. Phenolic Compounds Optimization
3.2.1. Optimization of the Extraction Method
The extracts obtained from the 54 extractions were also analyzed by Folin–Ciocalteu methodologyand the TPC was determined. The response variable used was the average of the replicates of thesame experiment.
The values obtained from the analysis (real values) were correlated with the predicted valuesfrom Equation (1), and the differences were considered as relative prediction error (Table S1). As canbe seen, the average prediction error was 3.84% and ranged from 0.36% up to 13.08%. These resultssuggest an influence of the variables that had been considered for the study on the TPC extractedfrom the blueberry samples. The BBD-RSM method was, therefore, applied in order to determine theinfluence of those variables as well as their possible interaction on the TPC content. This should allowus to determine the optimal conditions to achieve the maximum recovery of TPC.
The p-values were calculated according to the t-test considering a 95% confidence level, whichmeans that the variables with p-values lower than 0.05 were considered influential. In linear terms,the solvent ratio was an influential variable (p-value: 0.0013) with positive influence, which means thata higher amount of solvent would result in a greater extraction of TPC. Furthermore, the quadraticinteraction of the percentage of methanol in the extraction solvent and the interaction of the percentageof methanol and the cycle revealed p-values below 0.05 (p-value: 0.0002 and p-value: 0.0301) whichimplies that they were influential variables even though they were not so by themselves. On theother hand, the quadratic interaction of the extraction temperature (p-value: 0.0113), the quadraticinteraction of the ratio (p-value: 0.003) and the interaction between the extraction temperature and theratio (p-value: 0.0419) were also influential variables, although the individual variables were not foundto be influential by themselves. The calculated p-values can be seen in Table 5.
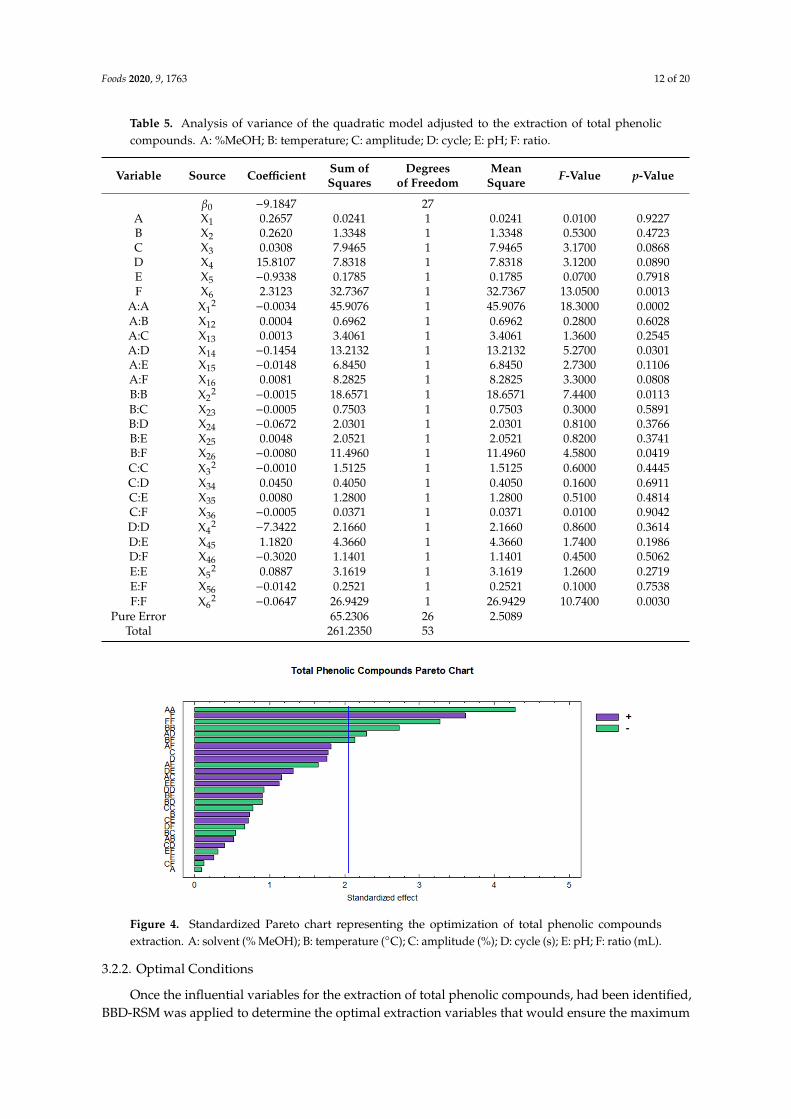
The standardized Pareto chart (Figure 4) was plotted in order to graphically observe the influenceof the variables. It was noted that the quadratic interaction of the methanol percentage was the mostinfluential variable with a negative effect on the extraction of TPC. Recent investigations conductedby our research group on the extraction of TPC from similar matrices such as black chokeberry [52]or myrtle [50] confirmed the influence of methanol percentage on the extraction of these compounds.The solvent ratio was the second most influential variable with a positive effect, as previously mentioned,while the rest of the influential variables (quadratic interaction of the extraction temperature, quadraticinteraction of the ratio and the interaction between the extraction temperature and the ratio) showednegative coefficients. Likewise, these quadratic interactions have been observed as influential variablesin numerous studies that focused on the extraction of TPC from fruit matrices such as mulberry [65] oraçai [40].
Foods 2020, 9, 1763 12 of 20
Table 5. Analysis of variance of the quadratic model adjusted to the extraction of total phenoliccompounds. A: %MeOH; B: temperature; C: amplitude; D: cycle; E: pH; F: ratio.
Variable Source Coefficient Sum ofSquares
Degreesof Freedom
MeanSquare F-Value p-Value
β0 −9.1847 27A X1 0.2657 0.0241 1 0.0241 0.0100 0.9227B X2 0.2620 1.3348 1 1.3348 0.5300 0.4723C X3 0.0308 7.9465 1 7.9465 3.1700 0.0868D X4 15.8107 7.8318 1 7.8318 3.1200 0.0890E X5 −0.9338 0.1785 1 0.1785 0.0700 0.7918F X6 2.3123 32.7367 1 32.7367 13.0500 0.0013
A:A X12 −0.0034 45.9076 1 45.9076 18.3000 0.0002
A:B X12 0.0004 0.6962 1 0.6962 0.2800 0.6028A:C X13 0.0013 3.4061 1 3.4061 1.3600 0.2545A:D X14 −0.1454 13.2132 1 13.2132 5.2700 0.0301A:E X15 −0.0148 6.8450 1 6.8450 2.7300 0.1106A:F X16 0.0081 8.2825 1 8.2825 3.3000 0.0808B:B X2
2 −0.0015 18.6571 1 18.6571 7.4400 0.0113B:C X23 −0.0005 0.7503 1 0.7503 0.3000 0.5891B:D X24 −0.0672 2.0301 1 2.0301 0.8100 0.3766B:E X25 0.0048 2.0521 1 2.0521 0.8200 0.3741B:F X26 −0.0080 11.4960 1 11.4960 4.5800 0.0419C:C X3
2 −0.0010 1.5125 1 1.5125 0.6000 0.4445C:D X34 0.0450 0.4050 1 0.4050 0.1600 0.6911C:E X35 0.0080 1.2800 1 1.2800 0.5100 0.4814C:F X36 −0.0005 0.0371 1 0.0371 0.0100 0.9042D:D X4
2 −7.3422 2.1660 1 2.1660 0.8600 0.3614D:E X45 1.1820 4.3660 1 4.3660 1.7400 0.1986D:F X46 −0.3020 1.1401 1 1.1401 0.4500 0.5062E:E X5
2 0.0887 3.1619 1 3.1619 1.2600 0.2719E:F X56 −0.0142 0.2521 1 0.2521 0.1000 0.7538F:F X6
2 −0.0647 26.9429 1 26.9429 10.7400 0.0030Pure Error 65.2306 26 2.5089
Total 261.2350 53
Foods 2020, 9, x FOR PEER REVIEW 14 of 22
been observed as influential variables in numerous studies that focused on the extraction of TPC from fruit matrices such as mulberry [65] or açai [40].
Figure 4. Standardized Pareto chart representing the optimization of total phenolic compounds extraction. A: solvent (% MeOH); B: temperature (°C); C: amplitude (%); D: cycle (s); E: pH; F: ratio (mL).
3.2.2. Optimal Conditions
Once the influential variables for the extraction of total phenolic compounds, had been identified, BBD-RSM was applied to determine the optimal extraction variables that would ensure the maximum recovery of TPC. The optimal conditions were established at 0.5 g of sample extracted at 33.3 °C with 16 mL of solvent containing 44% MeOH in water at pH 7. Finally, 0.7 cycles at 70% amplitude were selected for the ultrasound system to ensure the maximum extraction of TPC as commented for anthocyanins. Although the optimum pH was set at the maximum value within the range, no higher points were tested since, according to the literature, basic pH could cause the degradation of the phenolic compounds [74,75]. Some similarities were observed with respect to the optimal conditions for the extraction of TA. However, the extraction of TPC was improved when using solvents with a lower percentage of methanol and with a more basic pH than that used for the extraction of TA.
Espada-Bellido et al. [65] carried out an optimization research on the extraction of phenolic compounds from mulberry (Morus nigra) pulp using UAE. The optimal conditions were similar to those already determined in this research, namely the solvent pH (7), the ultrasound amplitude (70%), the cycle (0.7) or the ratio (11:1.5 mL g–1). However, the percentage of methanol (61%) and the temperature (64 °C) required were higher than those observed in this study; both factors could be closely interrelated to the nature of the sample.
3.2.3. Extraction Time
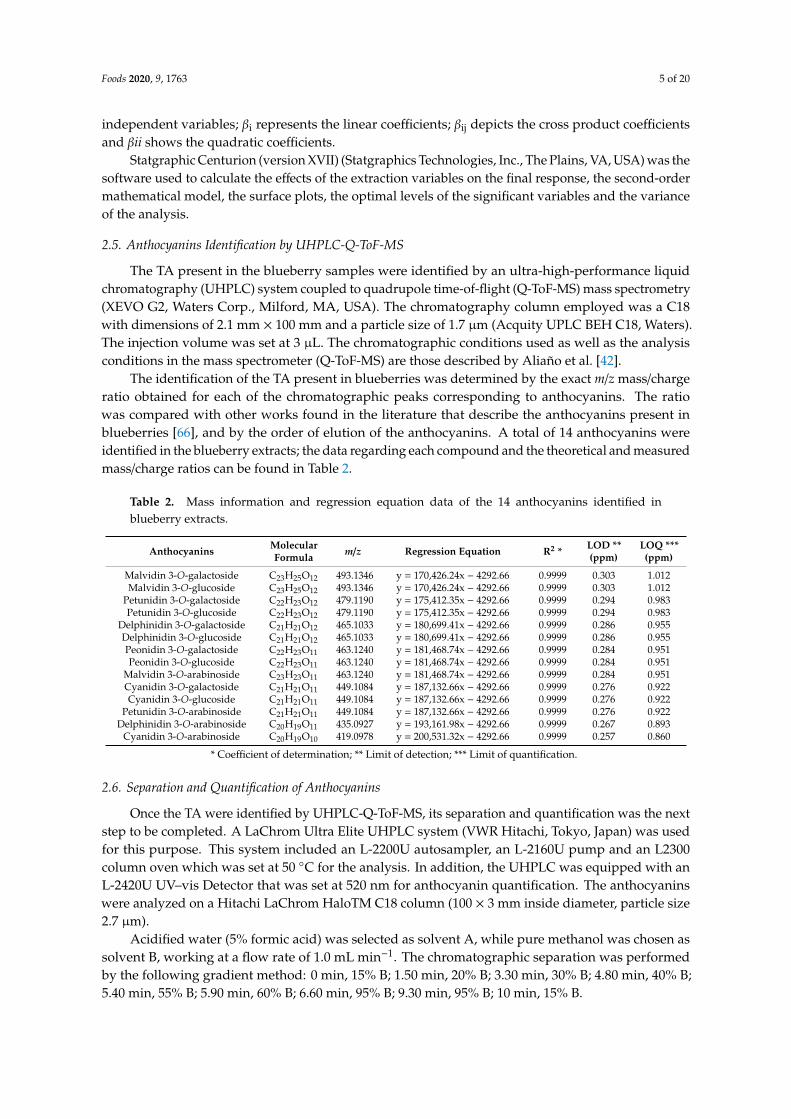
Similarly, to the research on TA extraction, a study to determine the optimal extraction time for the recovery of the TPC was required. For this purpose, different extractions were performed under the optimal conditions. Six different extraction times were employed (2, 5, 10, 15, 20 and 25 min) in triplicate. The extracts were analyzed by Folin–Ciocalteu methodology and the total content in phenolic compounds was determined. The average of the three replicates under the same conditions was calculated and represented for each extraction time in Figure 5. The maximum total phenolic content (32.18 mg g–1) was reached when the extraction time was 15 min, without any significant difference when compared to the extraction from the 20 min experiments. For this reason, the optimal extraction time was established at 15 min. Furthermore, it was observed that after that time the TPC
Figure 4. Standardized Pareto chart representing the optimization of total phenolic compoundsextraction. A: solvent (% MeOH); B: temperature (◦C); C: amplitude (%); D: cycle (s); E: pH; F: ratio (mL).
3.2.2. Optimal Conditions
Once the influential variables for the extraction of total phenolic compounds, had been identified,BBD-RSM was applied to determine the optimal extraction variables that would ensure the maximum
Foods 2020, 9, 1763 13 of 20
recovery of TPC. The optimal conditions were established at 0.5 g of sample extracted at 33.3 ◦Cwith 16 mL of solvent containing 44% MeOH in water at pH 7. Finally, 0.7 cycles at 70% amplitudewere selected for the ultrasound system to ensure the maximum extraction of TPC as commented foranthocyanins. Although the optimum pH was set at the maximum value within the range, no higherpoints were tested since, according to the literature, basic pH could cause the degradation of thephenolic compounds [74,75]. Some similarities were observed with respect to the optimal conditionsfor the extraction of TA. However, the extraction of TPC was improved when using solvents with alower percentage of methanol and with a more basic pH than that used for the extraction of TA.
Espada-Bellido et al. [65] carried out an optimization research on the extraction of phenoliccompounds from mulberry (Morus nigra) pulp using UAE. The optimal conditions were similar tothose already determined in this research, namely the solvent pH (7), the ultrasound amplitude (70%),the cycle (0.7) or the ratio (11:1.5 mL g−1). However, the percentage of methanol (61%) and thetemperature (64 ◦C) required were higher than those observed in this study; both factors could beclosely interrelated to the nature of the sample.
3.2.3. Extraction Time
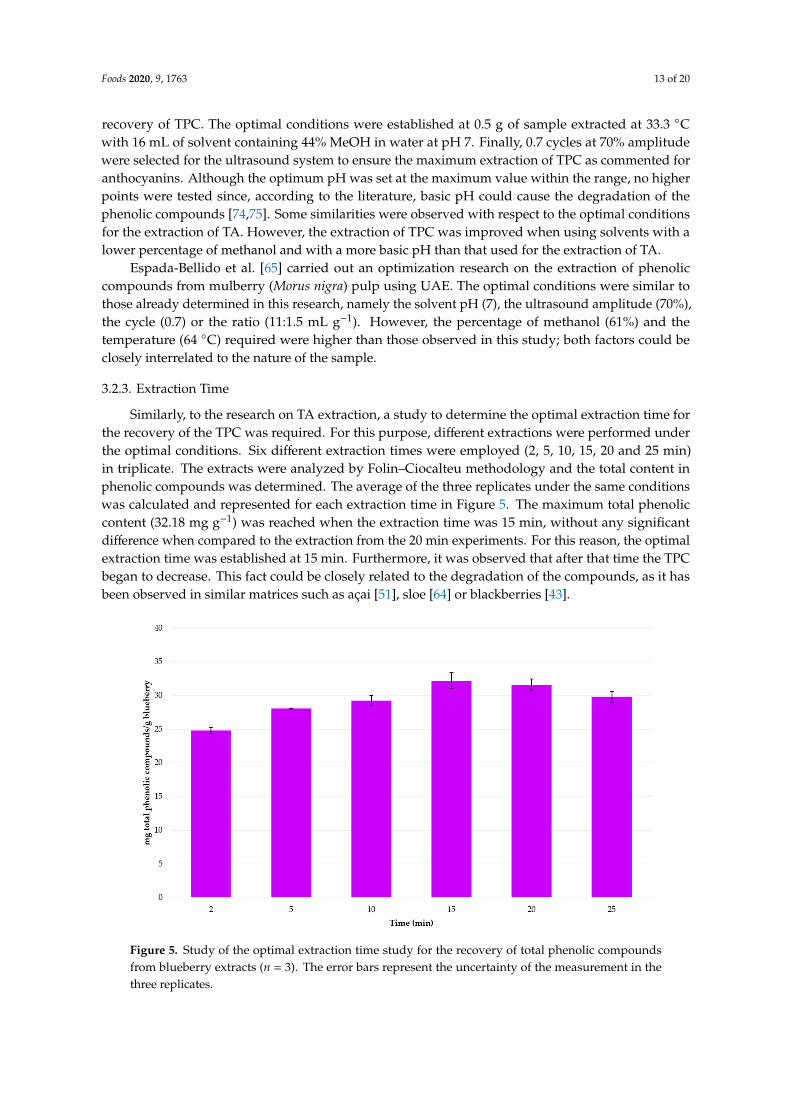
Similarly, to the research on TA extraction, a study to determine the optimal extraction time forthe recovery of the TPC was required. For this purpose, different extractions were performed underthe optimal conditions. Six different extraction times were employed (2, 5, 10, 15, 20 and 25 min)in triplicate. The extracts were analyzed by Folin–Ciocalteu methodology and the total content inphenolic compounds was determined. The average of the three replicates under the same conditionswas calculated and represented for each extraction time in Figure 5. The maximum total phenoliccontent (32.18 mg g−1) was reached when the extraction time was 15 min, without any significantdifference when compared to the extraction from the 20 min experiments. For this reason, the optimalextraction time was established at 15 min. Furthermore, it was observed that after that time the TPCbegan to decrease. This fact could be closely related to the degradation of the compounds, as it hasbeen observed in similar matrices such as açai [51], sloe [64] or blackberries [43].
Foods 2020, 9, x FOR PEER REVIEW 15 of 22
began to decrease. This fact could be closely related to the degradation of the compounds, as it has been observed in similar matrices such as açai [51], sloe [64] or blackberries [43].
Figure 5. Study of the optimal extraction time study for the recovery of total phenolic compounds from blueberry extracts (n = 3). The error bars represent the uncertainty of the measurement in the three replicates.
3.2.4. Repeatability and Intermediate Precision
The optimized method for the extraction of total phenolic compounds was also evaluated for reliability. For this purpose, in the same way as for the anthocyanins, 10 extractions were carried out on the same day and 10 more extractions on 2 consecutive days. The extracts were analyzed by Folin–Ciocalteu methodology and the total phenolic compounds content was determined. The CV was calculated for the samples analyzed on the same day and on different days. The results can be seen in Table 4.
The method’s repeatability exhibited a CV of 3.97% while for its intermediate accuracy the CV obtained was 3.85%; both of them are below 5%, which confirms that the optimized methods are reliable and they could be applied in different industries/laboratories with no relevant differences to be expected between their results.
3.2.5. Re-Extraction Study for Total Phenolic Compounds
As previously carried out for TA, to check the effectiveness of the extraction method, a re-extraction study of the residues obtained after applying the optimized method was carried out. The residue obtained was subjected to the optimal extraction conditions of the method. This study was carried out in triplicate, obtaining a total amount of phenolic compounds less than 5%, so it can be considered a quantitative method for these compounds.
3.3. Application to Real Samples
In the course of this research, two methods based on UAE have been developed. These methods have focused on maximizing the extraction of TA and TPC from blueberry samples. Furthermore, both methods have displayed good repeatability and intermediate accuracy, which means that they could be used both in industrial and research laboratories. Finally, the methods developed were applied to five commercial samples such as jams with blueberry contents (Table 1).
Figure 5. Study of the optimal extraction time study for the recovery of total phenolic compoundsfrom blueberry extracts (n = 3). The error bars represent the uncertainty of the measurement in thethree replicates.
Foods 2020, 9, 1763 14 of 20
3.2.4. Repeatability and Intermediate Precision
The optimized method for the extraction of total phenolic compounds was also evaluated forreliability. For this purpose, in the same way as for the anthocyanins, 10 extractions were carriedout on the same day and 10 more extractions on 2 consecutive days. The extracts were analyzed byFolin–Ciocalteu methodology and the total phenolic compounds content was determined. The CV wascalculated for the samples analyzed on the same day and on different days. The results can be seen inTable 4.
The method’s repeatability exhibited a CV of 3.97% while for its intermediate accuracy the CVobtained was 3.85%; both of them are below 5%, which confirms that the optimized methods arereliable and they could be applied in different industries/laboratories with no relevant differences to beexpected between their results.
3.2.5. Re-Extraction Study for Total Phenolic Compounds
As previously carried out for TA, to check the effectiveness of the extraction method, a re-extractionstudy of the residues obtained after applying the optimized method was carried out. The residueobtained was subjected to the optimal extraction conditions of the method. This study was carried outin triplicate, obtaining a total amount of phenolic compounds less than 5%, so it can be considered aquantitative method for these compounds.
3.3. Application to Real Samples
In the course of this research, two methods based on UAE have been developed. These methodshave focused on maximizing the extraction of TA and TPC from blueberry samples. Furthermore,both methods have displayed good repeatability and intermediate accuracy, which means that theycould be used both in industrial and research laboratories. Finally, the methods developed wereapplied to five commercial samples such as jams with blueberry contents (Table 1).
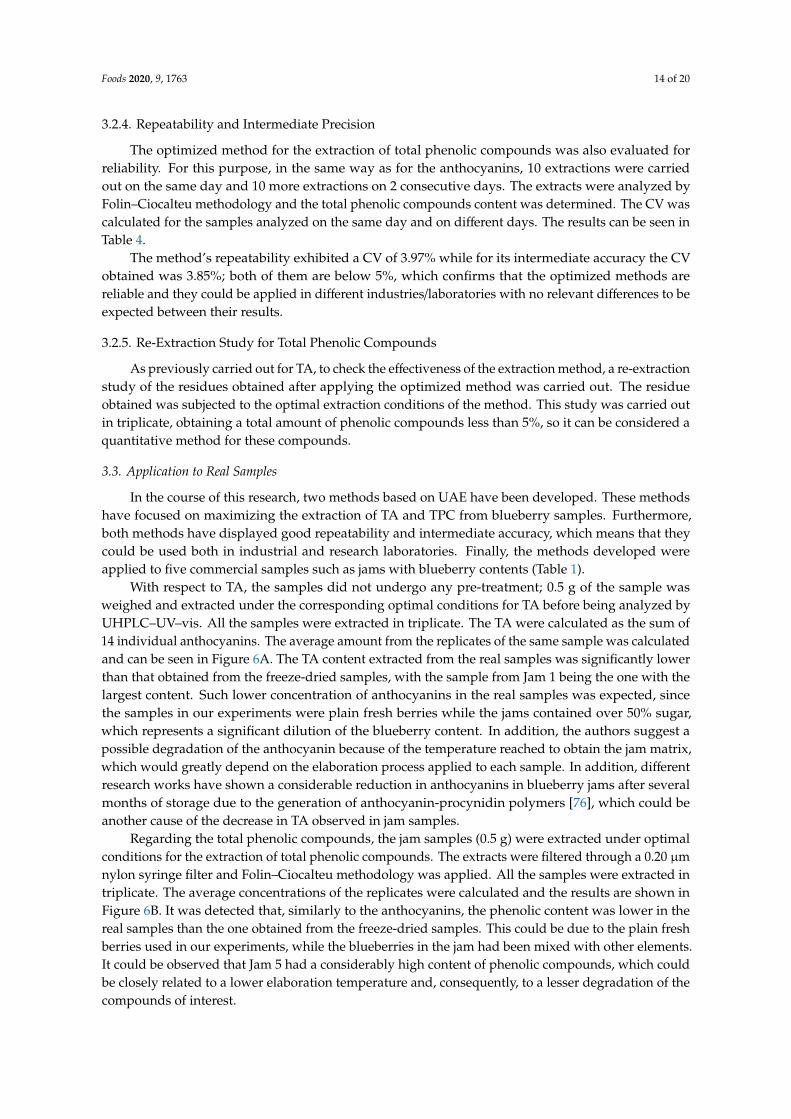
With respect to TA, the samples did not undergo any pre-treatment; 0.5 g of the sample wasweighed and extracted under the corresponding optimal conditions for TA before being analyzed byUHPLC–UV–vis. All the samples were extracted in triplicate. The TA were calculated as the sum of14 individual anthocyanins. The average amount from the replicates of the same sample was calculatedand can be seen in Figure 6A. The TA content extracted from the real samples was significantly lowerthan that obtained from the freeze-dried samples, with the sample from Jam 1 being the one with thelargest content. Such lower concentration of anthocyanins in the real samples was expected, sincethe samples in our experiments were plain fresh berries while the jams contained over 50% sugar,which represents a significant dilution of the blueberry content. In addition, the authors suggest apossible degradation of the anthocyanin because of the temperature reached to obtain the jam matrix,which would greatly depend on the elaboration process applied to each sample. In addition, differentresearch works have shown a considerable reduction in anthocyanins in blueberry jams after severalmonths of storage due to the generation of anthocyanin-procynidin polymers [76], which could beanother cause of the decrease in TA observed in jam samples.
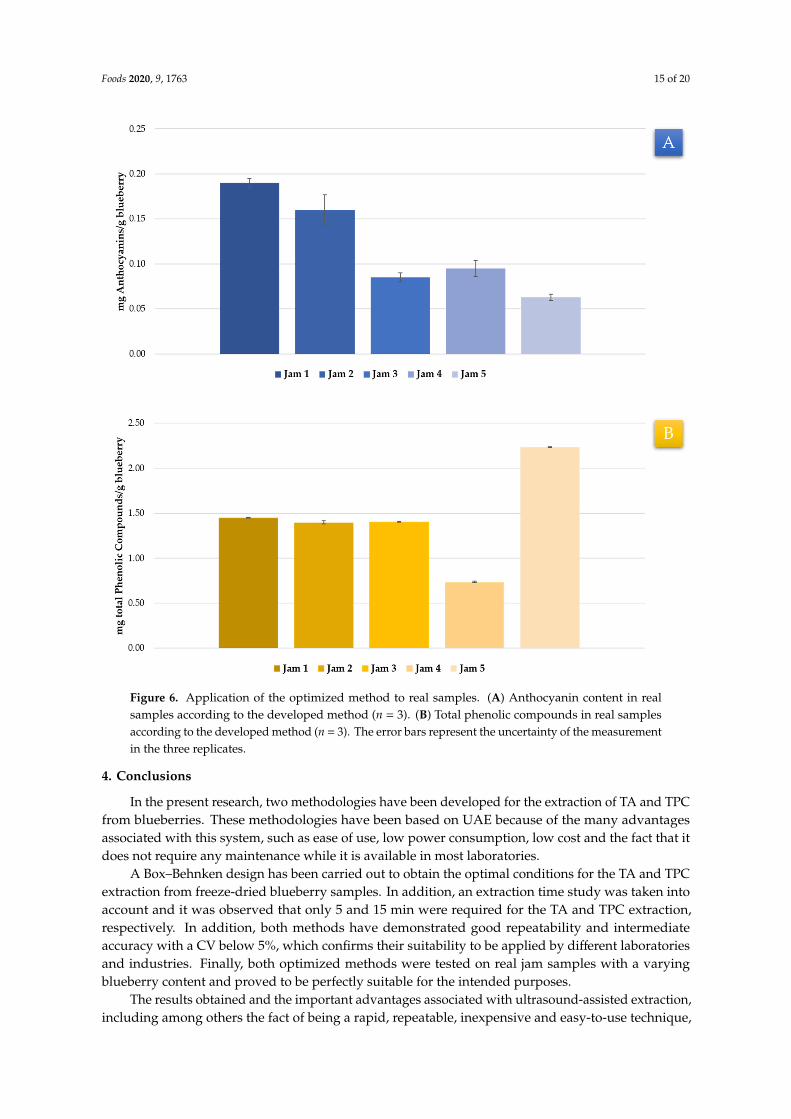
Regarding the total phenolic compounds, the jam samples (0.5 g) were extracted under optimalconditions for the extraction of total phenolic compounds. The extracts were filtered through a 0.20 µmnylon syringe filter and Folin–Ciocalteu methodology was applied. All the samples were extracted intriplicate. The average concentrations of the replicates were calculated and the results are shown inFigure 6B. It was detected that, similarly to the anthocyanins, the phenolic content was lower in thereal samples than the one obtained from the freeze-dried samples. This could be due to the plain freshberries used in our experiments, while the blueberries in the jam had been mixed with other elements.It could be observed that Jam 5 had a considerably high content of phenolic compounds, which couldbe closely related to a lower elaboration temperature and, consequently, to a lesser degradation of thecompounds of interest.
Foods 2020, 9, 1763 15 of 20
Foods 2020, 9, x FOR PEER REVIEW 17 of 22
Figure 6. Application of the optimized method to real samples. (A) Anthocyanin content in real samples according to the developed method (n = 3). (B) Total phenolic compounds in real samples according to the developed method (n = 3). The error bars represent the uncertainty of the measurement in the three replicates.
4. Conclusions
In the present research, two methodologies have been developed for the extraction of TA and TPC from blueberries. These methodologies have been based on UAE because of the many advantages associated with this system, such as ease of use, low power consumption, low cost and the fact that it does not require any maintenance while it is available in most laboratories.
A Box–Behnken design has been carried out to obtain the optimal conditions for the TA and TPC extraction from freeze-dried blueberry samples. In addition, an extraction time study was taken into account and it was observed that only 5 and 15 min were required for the TA and TPC extraction, respectively. In addition, both methods have demonstrated good repeatability and intermediate accuracy with a CV below 5%, which confirms their suitability to be applied by different laboratories and industries. Finally, both optimized methods were tested on real jam samples with a varying blueberry content and proved to be perfectly suitable for the intended purposes.
The results obtained and the important advantages associated with ultrasound-assisted extraction, including among others the fact of being a rapid, repeatable, inexpensive and easy-to-use technique, suggest that both the methodologies developed could be easily used by laboratories or
Figure 6. Application of the optimized method to real samples. (A) Anthocyanin content in realsamples according to the developed method (n = 3). (B) Total phenolic compounds in real samplesaccording to the developed method (n = 3). The error bars represent the uncertainty of the measurementin the three replicates.
4. Conclusions
In the present research, two methodologies have been developed for the extraction of TA and TPCfrom blueberries. These methodologies have been based on UAE because of the many advantagesassociated with this system, such as ease of use, low power consumption, low cost and the fact that itdoes not require any maintenance while it is available in most laboratories.
A Box–Behnken design has been carried out to obtain the optimal conditions for the TA and TPCextraction from freeze-dried blueberry samples. In addition, an extraction time study was taken intoaccount and it was observed that only 5 and 15 min were required for the TA and TPC extraction,respectively. In addition, both methods have demonstrated good repeatability and intermediateaccuracy with a CV below 5%, which confirms their suitability to be applied by different laboratoriesand industries. Finally, both optimized methods were tested on real jam samples with a varyingblueberry content and proved to be perfectly suitable for the intended purposes.
The results obtained and the important advantages associated with ultrasound-assisted extraction,including among others the fact of being a rapid, repeatable, inexpensive and easy-to-use technique,
Foods 2020, 9, 1763 16 of 20
suggest that both the methodologies developed could be easily used by laboratories or industries forquality control analysis to assure the content of anthocyanins and total phenolic compounds either intheir raw material or in their intermediate or finished blueberry products.
Supplementary Materials: The following are available online at http://www.mdpi.com/2304-8158/9/12/1763/s1,Table S1. Box–Behnken design matrix with the values of the six variables for each experiment and measured andpredicted responses (n = 2).
Author Contributions: Conceptualization, E.E.-B. and G.F.B.; methodology, E.E.-B. and G.F.B.; software, M.F.-G.;formal analysis, J.A.J., M.J.A.-G. and C.C.; investigation, E.E.-B., C.C. and G.F.B.; resources, J.Á.Á., M.P. and J.A.;data curation, J.A.J., M.J.A.-G., M.F.-G. and G.F.B.; writing—original draft preparation, M.J.A.-G.; writing—reviewand editing, G.F.B., M.F.-G. and E.E.-B.; supervision, G.F.B., M.F.-G. and E.E.-B.; project administration, G.F.B.,J.Á.Á., M.P. and J.A. All authors have read and agreed to the published version of the manuscript.
Funding: This work has been supported by the project “EQC2018-005135-P” (Equipment for liquid chromatographyby means of mass spectrometry and ion chromatography), of the State Subprogram of Research Infrastructures andTechnical Scientific Equipment. The authors acknowledge University of Cadiz and V. la Andaluza for the supportprovided through the project OT2016/046. The authors are grateful to the Instituto de Investigación Vitivinícolay Agroalimentaria (IVAGRO) for providing the necessary facilities to carry out the research and Programa deFomento e Impulso de la Actividad de Investigación y Transferencia de la Universidad de Cádiz for the paymentsupport of this manuscript.
Acknowledgments: The authors are grateful to IVAGRO (University of Cadiz) for provision of the necessaryfacilities to carry out the research.
Conflicts of Interest: The authors declare no conflict of interest.
References
1. Zhao, Y. Berry Fruit: Value-Added Products for Health Promotion (Food Science and Technology), 1st ed.;CRC Press, Ed.; CRC Press: Boca Raton, FL, USA, 2007; pp. 1–444. ISBN 978-0849358029.
2. Retamales, J.B.; Hancock, J.F. Blueberries, 1st ed.; CABI, Ed.; CABI: Egham, UK, 2012; pp. 1–352, ISBN978-1845938260.
3. Ma, L.; Sun, Z.; Zeng, Y.; Luo, M.; Yang, J. Molecular Mechanism and Health Role of Functional Ingredientsin Blueberry for Chronic Disease in Human Beings. Int. J. Mol. Sci. 2018, 19, 2785. [CrossRef] [PubMed]
4. Higuera-Hernández, M.F.; Reyes-Cuapio, E.; Gutiérrez-Mendoza, M.; Budde, H.; Blanco-Centurión, C.;Veras, A.B.; Rocha, N.B.; Yamamoto, T.; Monteiro, D.; Zaldívar-Rae, J.; et al. Blueberry intake included inhypocaloric diet decreases weight, glucose, cholesterol, triglycerides and adenosine levels in obese subjects.J. Funct. Foods 2019, 60, 103409. [CrossRef]
5. Seo, H.-S.; Adams, S.H.; Howard, L.R.; Brownmiller, C.; Hogan, V.; Chen, J.-R.; Pramudya, R.C. Children’sliking and wanting of foods vary over multiple bites/sips of consumption: A case study of foods containingwild blueberry powder in the amounts targeted to deliver bioactive phytonutrients for children. Food Res. Int.2020, 131, 108981. [CrossRef]
6. Dimitrellou, D.; Solomakou, N.; Kokkinomagoulos, E.; Kandylis, P. Yogurts Supplemented with Juices fromGrapes and Berries. Foods 2020, 9, 1158. [CrossRef] [PubMed]
7. Krikorian, R.; Kalt, W.; McDonald, J.E.; Shidler, M.D.; Summer, S.S.; Stein, A.L. Cognitive performance inrelation to urinary anthocyanins and their flavonoid-based products following blueberry supplementationin older adults at risk for dementia. J. Funct. Foods 2020, 64, 103667. [CrossRef]
8. Encyclopaedia Britannica List of Plants in the Family Ericaceae|Britannica. Available online: https://www.britannica.com/topic/list-of-plants-in-the-family-Ericaceae-2038184 (accessed on 18 April 2020).
9. Lavefve, L.; Brownmiller, C.; Howard, L.; Reeves, D.; Adams, S.H.; Chen, J.-R.; Diaz, E.C.; Mauromoustakos, A.Changes in Polyphenolics during Storage of Products Prepared with Freeze-Dried Wild Blueberry Powder.Foods 2020, 9, 466. [CrossRef] [PubMed]
10. Hwang, H.; Kim, Y.-J.; Shin, Y. Assessment of Physicochemical Quality, Antioxidant Content and Activity,and Inhibition of Cholinesterase between Unripe and Ripe Blueberry Fruit. Foods 2020, 9, 690. [CrossRef]
11. Baenas, N.; Ruales, J.; Moreno, D.A.; Barrio, D.A.; Stinco, C.M.; Martínez-Cifuentes, G.; Meléndez-Martínez, A.J.;García-Ruiz, A. Characterization of Andean Blueberry in Bioactive Compounds, Evaluation of BiologicalProperties, and In Vitro Bioaccessibility. Foods 2020, 9, 1483. [CrossRef]
Foods 2020, 9, 1763 17 of 20
12. Norberto, S.; Silva, S.; Meireles, M.; Faria, A.; Pintado, M.; Calhau, C. Blueberry anthocyanins in healthpromotion: A metabolic overview. J. Funct. Foods 2013, 5, 1518–1528. [CrossRef]
13. Lima, M.C.; Paiva de Sousa, C.; Fernandez-Prada, C.; Harel, J.; Dubreuil, J.D.; de Souza, E.L. A review ofthe current evidence of fruit phenolic compounds as potential antimicrobials against pathogenic bacteria.Microb. Pathog. 2019, 130, 259–270. [CrossRef]
14. Liu, Y.; Mu, J.; Niklas, K.J.; Li, G.; Sun, S. Global warming reduces plant reproductive output for temperatemulti-inflorescence species on the Tibetan plateau. New Phytol. 2012, 195, 427–436. [CrossRef] [PubMed]
15. Hao, L.; Guo, L.; Li, R.; Cheng, Y.; Huang, L.; Zhou, H.; Xu, M.; Li, F.; Zhang, X.; Zheng, Y. Responses ofphotosynthesis to high temperature stress associated with changes in leaf structure and biochemistry ofblueberry (Vaccinium corymbosum L.). Sci. Hortic. (Amsterdam) 2019, 246, 251–264. [CrossRef]
16. Starast, M.; Paal, T.; Vool, E.; Karp, K.; Albert, T.; Moor, U. The productivity of some blueberry cultivarsunder Estonian conditions. Acta Hortic. 2009, 810, 103–108. [CrossRef]
17. Rodgers Dinstel, R.; Cascio, J.; Koukel, S. The antioxidant level of Alaska’s wild berries: High, higher andhighest. Int. J. Circumpolar Health 2013, 72, 21188. [CrossRef]
18. Kang, J.; Thakali, K.M.; Jensen, G.S.; Wu, X. Phenolic Acids of the Two Major Blueberry Species in the USMarket and Their Antioxidant and Anti-inflammatory Activities. Plant Foods Hum. Nutr. 2015, 70, 56–62.[CrossRef] [PubMed]
19. Miraghajani, M.; Momenyan, S.; Arab, A.; Hasanpour Dehkordi, A.; Symonds, M.E. Blueberry andcardiovascular disease risk factors: A systematic review and meta-analysis of randomized controlled trials.Complement. Ther. Med. 2020, 53, 102389. [CrossRef]
20. Zhao, C.-N.; Meng, X.; Li, Y.; Li, S.; Liu, Q.; Tang, G.-Y.; Li, H.-B. Fruits for Prevention and Treatment ofCardiovascular Diseases. Nutrients 2017, 9, 598. [CrossRef]
21. Basu, A.; Alexander, J.; Ebersole, J.; Planinic, P. Dietary fiber and blueberry intervention lowers gestationalweight gain and C-reactive protein in women at high risk for gestational diabetes. Metabolism 2020, 104,154117. [CrossRef]
22. Stote, K.; Corkum, A.; Sweeney, M.; Shakerley, N.; Kean, T.; Gottschall-Pass, K. Postprandial Effectsof Blueberry (Vaccinium angustifolium) Consumption on Glucose Metabolism, Gastrointestinal HormoneResponse, and Perceived Appetite in Healthy Adults: A Randomized, Placebo-Controlled Crossover Trial.Nutrients 2019, 11, 202. [CrossRef]
23. Wu, X.; Wang, T.T.Y.; Prior, R.L.; Pehrsson, P.R. Prevention of Atherosclerosis by Berries: The Case ofBlueberries. J. Agric. Food Chem. 2018, 66, 9172–9188. [CrossRef]
24. Du, C.; Smith, A.; Avalos, M.; South, S.; Crabtree, K.; Wang, W.; Kwon, Y.-H.; Vijayagopal, P.; Juma, S.Blueberries Improve Pain, Gait Performance, and Inflammation in Individuals with Symptomatic KneeOsteoarthritis. Nutrients 2019, 11, 290. [CrossRef] [PubMed]
25. Su, X.; Zhang, J.; Wang, H.; Xu, J.; He, J.; Liu, L.; Zhang, T.; Chen, R.; Kang, J. Phenolic Acid Profiling,Antioxidant, and Anti-Inflammatory Activities, and miRNA Regulation in the Polyphenols of 16 BlueberrySamples from China. Molecules 2017, 22, 312. [CrossRef] [PubMed]
26. Debnath-Canning, M.; Unruh, S.; Vyas, P.; Daneshtalab, N.; Igamberdiev, A.U.; Weber, J.T. Fruits and leavesfrom wild blueberry plants contain diverse polyphenols and decrease neuroinflammatory responses inmicroglia. J. Funct. Foods 2020, 68, 103906. [CrossRef]
27. Türck, P.; Fraga, S.; Salvador, I.; Campos-Carraro, C.; Lacerda, D.; Bahr, A.; Ortiz, V.; Hickmann, A.; Koetz, M.;Belló-Klein, A.; et al. Blueberry extract decreases oxidative stress and improves functional parameters inlungs from rats with pulmonary arterial hypertension. Nutrition 2020, 70, 110579. [CrossRef] [PubMed]
28. Wang, H.; Liu, J.; Pang, D.; Li, T.; Liu, R.H. Mechanisms underlying the protective effects of blueberry extractagainst ultraviolet radiation in a skin cell co-culture system. J. Funct. Foods 2019, 52, 603–610. [CrossRef]
29. Zhou, L.; Xie, M.; Yang, F.; Liu, J. Antioxidant activity of high purity blueberry anthocyanins and the effectson human intestinal microbiota. LWT 2020, 117, 108621. [CrossRef]
30. Sun, X.; Hao, L.; Xie, Q.; Lan, W.; Zhao, Y.; Pan, Y.; Wu, V.C.H. Antimicrobial effects and membrane damagemechanism of blueberry (Vaccinium corymbosum L.) extract against Vibrio parahaemolyticus. Food Control2020, 111, 107020. [CrossRef]
31. Zunino, S.J.; Zhang, Y.; Seeram, N.P.; Storms, D.H. Berry fruit extracts inhibit growth and induce apoptosisof high-risk acute lymphoblastic leukemia cells in vitro. J. Funct. Foods 2010, 2, 187–195. [CrossRef]
Foods 2020, 9, 1763 18 of 20
32. Cheng, Z.; Lin, J.; Gao, N.; Sun, X.; Meng, X.; Liu, R.; Liu, Y.; Wang, W.; Li, B.; Wang, Y. Blueberrymalvidin-3-galactoside modulated gut microbial dysbiosis and microbial TCA cycle KEGG pathwaydisrupted in a liver cancer model induced by HepG2 cells. Food Sci. Hum. Wellness 2020, 9, 245–255.[CrossRef]
33. Poklar Ulrih, N.; Opara, R.; Skrt, M.; Košmerl, T.; Wondra, M.; Abram, V. Part I. Polyphenols compositionand antioxidant potential during ‘Blaufränkisch’ grape maceration and red wine maturation, and the effectsof trans-resveratrol addition. Food Chem. Toxicol. 2020, 137, 111122. [CrossRef]
34. Pace, C.; Giacosa, S.; Torchio, F.; Río Segade, S.; Cagnasso, E.; Rolle, L. Extraction kinetics of anthocyaninsfrom skin to pulp during carbonic maceration of winegrape berries with different ripeness levels. Food Chem.2014, 165, 77–84. [CrossRef] [PubMed]
35. Garzón, G.A.; Narváez-Cuenca, C.-E.; Vincken, J.-P.; Gruppen, H. Polyphenolic composition and antioxidantactivity of açai (Euterpe oleracea Mart.) from Colombia. Food Chem. 2017, 217, 364–372. [CrossRef] [PubMed]
36. López, V.; Les, F.; Iannarelli, R.; Caprioli, G.; Maggi, F. Methanolic extract from red berry-like fruits ofHypericum androsaemum: Chemical characterization and inhibitory potential of central nervous systemenzymes. Ind. Crops Prod. 2016, 94, 363–367. [CrossRef]
37. Bastías-Montes, J.M.; Monterrosa, K.; Muñoz-Fariña, O.; García, O.; Acuña-Nelson, S.M.; Vidal-San Martín, C.;Quevedo-Leon, R.; Kubo, I.; Avila-Acevedo, J.G.; Domiguez-Lopez, M.; et al. Chemoprotective and antiobesityeffects of tocols from seed oil of Maqui-berry: Their antioxidative and digestive enzyme inhibition potential.Food Chem. Toxicol. 2020, 136, 111036. [CrossRef] [PubMed]
38. Garcia-Mendoza, M.d.P.; Espinosa-Pardo, F.A.; Baseggio, A.M.; Barbero, G.F.; Maróstica Junior, M.R.;Rostagno, M.A.; Martínez, J. Extraction of phenolic compounds and anthocyanins from juçara (Euterpeedulis Mart.) residues using pressurized liquids and supercritical fluids. J. Supercrit. Fluids 2017, 119, 9–16.[CrossRef]
39. da Silveira, T.F.F.; Cristianini, M.; Kuhnle, G.G.; Ribeiro, A.B.; Filho, J.T.; Godoy, H.T. Anthocyanins,non-anthocyanin phenolics, tocopherols and antioxidant capacity of açaí juice (Euterpe oleracea) as affectedby high pressure processing and thermal pasteurization. Innov. Food Sci. Emerg. Technol. 2019, 55, 88–96.[CrossRef]
40. Aliaño-González, M.J.; Ferreiro-González, M.; Espada-Bellido, E.; Carrera, C.; Palma, M.; Álvarez, J.A.;Ayuso, J.; Barbero, G.F. Extraction of anthocyanins and total phenolic compounds from açai (euterpe oleraceamart.) using an experimental design methodology. part 1: Pressurized liquid extraction. Agronomy 2020, 10,183. [CrossRef]
41. de Peredo, A.V.G.; Vázquez-Espinosa, M.; Piñeiro, Z.; Espada-Bellido, E.; Ferreiro-González, M.; Barbero, G.F.;Palma, M. Development of a rapid and accurate UHPLC-PDA-FL method for the quantification of phenoliccompounds in grapes. Food Chem. 2021, 334, 2992. [CrossRef]
42. Aliaño-González, M.J.; Ferreiro-González, M.; Espada-Bellido, E.; Carrera, C.; Palma, M.; Ayuso, J.;Barbero, G.F.; Álvarez, J.Á. Extraction of Anthocyanins and Total Phenolic Compounds from Açai (Euterpeoleracea Mart.) Using an Experimental Design Methodology. Part 3: Microwave-Assisted Extraction.Agronomy 2020, 10, 179. [CrossRef]
43. Espada-Bellido, E.; Ferreiro-González, M.; Carrera, C.; Palma, M.; Álvarez, J.A.; Barbero, G.F.; Ayuso, J.Extraction of Antioxidants from Blackberry (Rubus ulmifolius L.): Comparison between Ultrasound- andMicrowave-Assisted Extraction Techniques. Agronomy 2019, 9, 745. [CrossRef]
44. Cervantes, L.; Martínez-Ferri, E.; Soria, C.; Ariza, M.T. Bioavailability of phenolic compounds in strawberry,raspberry and blueberry: Insights for breeding programs. Food Biosci. 2020, 37, 100680. [CrossRef]
45. Paes, J.; Dotta, R.; Barbero, G.F.; Martínez, J. Extraction of phenolic compounds and anthocyaninsfrom blueberry (Vaccinium myrtillus L.) residues using supercritical CO2 and pressurized liquids.J. Supercrit. Fluids 2014, 95, 8–16. [CrossRef]
46. Chemat, F.; Zill-e-Huma; Khan, M.K. Applications of ultrasound in food technology: Processing, preservationand extraction. Ultrason. Sonochem. 2011, 18, 813–835. [CrossRef] [PubMed]
47. Medina-Torres, N.; Ayora-Talavera, T.; Espinosa-Andrews, H.; Sánchez-Contreras, A.; Pacheco, N. UltrasoundAssisted Extraction for the Recovery of Phenolic Compounds from Vegetable Sources. Agronomy 2017, 7, 47.[CrossRef]
48. Baiano, A. Recovery of Biomolecules from Food Wastes—A Review. Molecules 2014, 19, 14821–14842.[CrossRef]
Foods 2020, 9, 1763 19 of 20
49. Ciulu, M.; Cádiz-Gurrea, M.; Segura-Carretero, A. Extraction and Analysis of Phenolic Compounds in Rice:A Review. Molecules 2018, 23, 2890. [CrossRef]
50. V. González de Peredo, A.; Vázquez-Espinosa, M.; Espada-Bellido, E.; Ferreiro-González, M.;Amores-Arrocha, A.; Palma, M.; Barbero, G.F.; Jiménez-Cantizano, A. Alternative Ultrasound-AssistedMethod for the Extraction of the Bioactive Compounds Present in Myrtle (Myrtus communis L.). Molecules2019, 24, 882. [CrossRef]
51. Aliaño-González, M.J.; Espada-Bellido, E.; Ferreiro-González, M.; Carrera, C.; Palma, M.; Ayuso, J.;Álvarez, J.Á.; Barbero, G.F. Extraction of Anthocyanins and Total Phenolic Compounds from Açai (Euterpeoleracea Mart.) Using an Experimental Design Methodology. Part 2: Ultrasound-Assisted Extraction.Agronomy 2020, 10, 326. [CrossRef]
52. Vázquez-Espinosa, M.; V. González-de-Peredo, A.; Espada-Bellido, E.; Ferreiro-González, M.;Toledo-Domínguez, J.J.; Carrera, C.; Palma, M.; Barbero, G.F. Ultrasound-Assisted Extraction of Two Typesof Antioxidant Compounds (TPC and TA) from Black Chokeberry (Aronia melanocarpa L.): Optimization ofthe Individual and Simultaneous Extraction Methods. Agronomy 2019, 9, 456. [CrossRef]
53. Vázquez-Espinosa, M.; V. González de Peredo, A.; Ferreiro-González, M.; Carrera, C.; Palma, M.; Barbero, G.F.;Espada-Bellido, E. Assessment of Ultrasound Assisted Extraction as an Alternative Method for the Extractionof Anthocyanins and Total Phenolic Compounds from Maqui Berries (Aristotelia chilensis (Mol.) Stuntz).Agronomy 2019, 9, 148. [CrossRef]
54. Wang, D.; Zhang, L.; Xu, Y.; Qi, X.; Wang, X.; Wang, X.; Zhang, Q.; Li, P. Optimization of an Ultrasound-AssistedExtraction for Simultaneous Determination of Antioxidants in Sesame with Response Surface Methodology.Antioxidants 2019, 8, 321. [CrossRef] [PubMed]
55. Wu, Y.; Han, Y.; Tao, Y.; Fan, S.; Chu, D.-T.; Ye, X.; Ye, M.; Xie, G. Ultrasound assisted adsorption anddesorption of blueberry anthocyanins using macroporous resins. Ultrason. Sonochem. 2018, 48, 311–320.[CrossRef] [PubMed]
56. Li, X.; Zhang, L.; Peng, Z.; Zhao, Y.; Wu, K.; Zhou, N.; Yan, Y.; Ramaswamy, H.S.; Sun, J.; Bai, W. The impactof ultrasonic treatment on blueberry wine anthocyanin color and its In-vitro anti-oxidant capacity. Food Chem.2020, 333, 127455. [CrossRef] [PubMed]
57. Wang, T.; Guo, N.; Wang, S.-X.; Kou, P.; Zhao, C.-J.; Fu, Y.-J. Ultrasound-negative pressure cavitationextraction of phenolic compounds from blueberry leaves and evaluation of its DPPH radical scavengingactivity. Food Bioprod. Process. 2018, 108, 69–80. [CrossRef]
58. Bamba, B.; Shi, J.; Tranchant, C.; Xue, S.; Forney, C.; Lim, L.-T. Influence of Extraction Conditions onUltrasound-Assisted Recovery of Bioactive Phenolics from Blueberry Pomace and Their Antioxidant Activity.Molecules 2018, 23, 1685. [CrossRef]
59. He, B.; Zhang, L.-L.; Yue, X.-Y.; Liang, J.; Jiang, J.; Gao, X.-L.; Yue, P.-X. Optimization of Ultrasound-AssistedExtraction of phenolic compounds and anthocyanins from blueberry (Vaccinium ashei) wine pomace.Food Chem. 2016, 204, 70–76. [CrossRef]
60. Rocha, J.C.G.; Procópio, F.R.; Mendonça, A.C.; Vieira, L.M.; Perrone, Í.T.; de Barros, F.A.R.; Stringheta, P.C.Optimization of ultrasound-assisted extraction of phenolic compounds from jussara (Euterpe edulis M.) andblueberry (Vaccinium myrtillus) fruits. Food Sci. Technol. 2018, 38, 45–53. [CrossRef]
61. Jiang, H.-L.; Yang, J.-L.; Shi, Y.-P. Optimization of ultrasonic cell grinder extraction of anthocyanins fromblueberry using response surface methodology. Ultrason. Sonochem. 2017, 34, 325–331. [CrossRef]
62. Yuan, J.; Li, H.; Tao, W.; Han, Q.; Dong, H.; Zhang, J.; Jing, Y.; Wang, Y.; Xiong, Q.; Xu, T. An effective method forextracting anthocyanins from blueberry based on freeze-ultrasonic thawing technology. Ultrason. Sonochem.2020, 68, 105192. [CrossRef]
63. FDA. Cder Q3C-Tables and List Guidance for Industry Q3C-Tables and List Guidance for Industry Q3C-Tablesand List Guidance for Industry 1. Available online: https://www.fda.gov/media/71737/download (accessedon 16 November 2020).
64. V. González-de-Peredo, A.; Vázquez-Espinosa, M.; Espada-Bellido, E.; Ferreiro-González, M.; Carrera, C.;Palma, M.; Álvarez, J.Á.; Barbero, G.F.; Ayuso, J. Optimization of Analytical Ultrasound-Assisted Methodsfor the Extraction of Total Phenolic Compounds and Anthocyanins from Sloes (Prunus spinosa L.). Agronomy2020, 10, 966. [CrossRef]
Foods 2020, 9, 1763 20 of 20
65. Espada-Bellido, E.; Ferreiro-González, M.; Carrera, C.; Palma, M.; Barroso, C.G.; Barbero, G.F. Optimization ofthe ultrasound-assisted extraction of anthocyanins and total phenolic compounds in mulberry (Morus nigra)pulp. Food Chem. 2017, 219, 23–32. [CrossRef]
66. Singleton, V.L.; Rossi, J.A. Colorimetry of Total Phenolics with Phosphomolybdic-Phosphotungstic AcidReagents. Am. J. Enol. Vitic. 1965, 16, 144–158.
67. Singleton, V.L.; Orthofer, R.; Lamuela-Raventós, R.M. Analysis of total phenols and other oxidation substratesand antioxidants by means of folin-ciocalteu reagent. In Methods in Enzymology; Packer, L., Ed.; Elsevier:Amsterdam, The Netherlands, 1998; pp. 152–178.
68. Celli, G.B.; Ghanem, A.; Brooks, M.S.-L. Optimization of ultrasound-assisted extraction of anthocyaninsfrom haskap berries (Lonicera caerulea L.) using Response Surface Methodology. Ultrason. Sonochem. 2015, 27,449–455. [CrossRef] [PubMed]
69. Varo, M.A.; Jacotet-Navarro, M.; Serratosa, M.P.; Mérida, J.; Fabiano-Tixier, A.-S.; Bily, A.; Chemat, F. GreenUltrasound-Assisted Extraction of Antioxidant Phenolic Compounds Determined by High PerformanceLiquid Chromatography from Bilberry (Vaccinium Myrtillus L.) Juice By-products. Waste Biomass Valorization2019, 10, 1945–1955. [CrossRef]
70. Chen, X.-Q.; Li, Z.-H.; Wang, Z.-J.; Liu, L.-L.; Sun, T.-T.; Ma, J.-Z.; Zhang, Y. Ultrasound-assisted extractionof total anthocyanins from Rubia sylvatica Nakai fruit and radical scavenging activity of the extract.Ind. Crops Prod. 2020, 150, 112420. [CrossRef]
71. Albuquerque, B.R.; Pinela, J.; Barros, L.; Oliveira, M.B.P.P.; Ferreira, I.C.F.R. Anthocyanin-rich extract ofjabuticaba epicarp as a natural colorant: Optimization of heat- and ultrasound-assisted extractions andapplication in a bakery product. Food Chem. 2020, 316, 126364. [CrossRef] [PubMed]
72. Fibigr, J.; Šatínský, D.; Solich, P. A UHPLC method for the rapid separation and quantification of anthocyaninsin acai berry and dry blueberry extracts. J. Pharm. Biomed. Anal. 2017, 143, 204–213. [CrossRef] [PubMed]
73. Verbeyst, L.; Van Crombruggen, K.; Van der Plancken, I.; Hendrickx, M.; Van Loey, A. Anthocyanindegradation kinetics during thermal and high pressure treatments of raspberries. J. Food Eng. 2011, 105,513–521. [CrossRef]
74. Akbal, F.; Onar, A.N. Photocatalytic degradation of phenol. Environ. Monit. Assess. 2003, 83, 295–302.[CrossRef]
75. Friedman, M.; Jürgens, H.S. Effect of pH on the Stability of Plant Phenolic Compounds. J. Agric. Food Chem.2000, 48, 2101–2110. [CrossRef]
76. Howard, L.R.; Castrodale, C.; Brownmiller, C.; Mauromoustakos, A. Jam Processing and Storage Effects onBlueberry Polyphenolics and Antioxidant Capacity. J. Agric. Food Chem. 2010, 58, 4022–4029. [CrossRef]
Publisher’s Note: MDPI stays neutral with regard to jurisdictional claims in published maps and institutionalaffiliations.
© 2020 by the authors. Licensee MDPI, Basel, Switzerland. This article is an open accessarticle distributed under the terms and conditions of the Creative Commons Attribution(CC BY) license (http://creativecommons.org/licenses/by/4.0/).