Optimisation of an in vitro model for anti-diabetic screening by ...
118
Optimisation of an in vitro model for anti-diabetic screening by Gayle Pamela Wilson Submitted in partial fulfillment of the requirements for the degree of MAGISTER SCIENTIAE in the Faculty of Science at the Nelson Mandela Metropolitan University 2006 Supervisor: Dr S Roux Co-Supervisor: Dr M van de Venter brought to you by CORE View metadata, citation and similar papers at core.ac.uk provided by South East Academic Libraries System (SEALS)
-
Upload
khangminh22 -
Category
Documents
-
view
0 -
download
0
Transcript of Optimisation of an in vitro model for anti-diabetic screening by ...
Optimisation of an in vitro model for
anti-diabetic screening
by
Gayle Pamela Wilson
Submitted in partial fulfillment of the requirements for the
degree of
MAGISTER SCIENTIAE
in the
Faculty of Science
at the
Nelson Mandela Metropolitan University
2006
Supervisor: Dr S Roux
Co-Supervisor: Dr M van de Venter
brought to you by COREView metadata, citation and similar papers at core.ac.uk
provided by South East Academic Libraries System (SEALS)
II
Contents Summary..........................................................................................................................IV
Acknowledgements .........................................................................................................VI
List of Abbreviations .................................................................................................... VII
List of Figures................................................................................................................... X
List of Tables ................................................................................................................XIII
Chapter 1 Literature Review ........................................................................................... 1
1.1 Introduction..........................................................................................................1 1.2 Insulin ..................................................................................................................3
1.2.1 Insulin Secretion ...........................................................................................4 1.2.2 Insulin Receptor ............................................................................................6
1.3 Glucose Absorption By Cells...............................................................................9 1.4 Diabetes Mellitus ...............................................................................................13
1.4.1 Pharmacological Treatment ........................................................................15 1.4.1.1) Biguanides ..........................................................................................17 1.4.1.2) Sulfonylurea Drugs.............................................................................18 1.4.1.3) Thiazolidinediones..............................................................................19 1.4.1.4) Insulin .................................................................................................24
1.5 Plants and the treatment of Diabetes Mellitus ...................................................24 1.5.1 Sutherlandia frutescens (Fabaceae) ...........................................................25 1.5.2 Toxicity of Hypoglycaemic Plants..............................................................26
Chapter 2 Introduction to the present study................................................................ 28
Chapter 3 Models for glucose utilization ...................................................................... 30
3.1 General methods ................................................................................................33 3.1.1 Maintenance of cell lines ............................................................................33 3.1.2 Cytotoxicity Assay......................................................................................34 3.1.3 Sulforhodamine B Assay ............................................................................34 3.1.4 Glucose oxidase assay.................................................................................35 3.1.5 Cell viability assay......................................................................................35
3.2 3T3-L1 cell line..................................................................................................35 3.2.1 Induction of 3T3-L1 preadipocyte differentiation ......................................35 3.2.2 Adipocyte differentiation assays.................................................................36
3.2.2.1 Glycerol-3-phosphate dehydrogenase assay ........................................36 3.2.3 Protein concentration determination ...........................................................37
3.2.3.1 Adapted Folin method for microtiter plates.........................................37 3.2.4 Glucose Uptake...........................................................................................37
3.3 C2C12 cell line ..................................................................................................37 3.3.1 Glucose uptake............................................................................................37
3.4 Chang cell line ...................................................................................................38 3.4.1 Glucose uptake............................................................................................38
III
3.5 Statistical analysis..............................................................................................39 3.6 Results and Discussion ......................................................................................39
3.6.1 3T3-L1 cell line...........................................................................................39 3.6.1.1 Cytotoxicity..........................................................................................39 3.6.1.2 Glycerol-3-phosphate dehydrogenase activity.....................................41 3.6.1.3 Glucose uptake.....................................................................................43
3.6.2 C2C12 skeletal muscle cell line..................................................................51 3.6.2.1 Cytotoxicity..........................................................................................51 3.6.2.2 Glucose uptake.....................................................................................52
3.6.3 Chang liver cell line ....................................................................................56 3.6.3.1 Cytotoxicity..........................................................................................56 3.6.3.2 Glucose uptake.....................................................................................57
Chapter 4 Models for insulin secretion......................................................................... 64
4.1 Materials and methods .......................................................................................65 4.1.1 INS cells maintenance.................................................................................65
4.1.1.1 Mercaptoethanol ..................................................................................65 4.1.1.2 Complete Medium ...............................................................................65 4.1.1.3 Poly-L-Lysine (PLL) ...........................................................................66 4.1.1.4 Pretreatment of culture dishes..............................................................66
4.1.2 Insulin Secretion by INS-1 cells .................................................................66 4.1.3 Plasma insulin determination from rat model.............................................67
4.1.3.1 Preparation of medication ....................................................................67 1) Sutherlandia frutescens (kankerbos) .......................................................67 2) Amitriptyline and Metformin ..................................................................67
4.1.3.2 Experimental Procedure.......................................................................68 4.1.4 Binding studies with INS-1 rat pancreatic cells..........................................69
4.1.4.1 Binding time study...............................................................................69 4.1.4.2 Saturation binding study ......................................................................70 4.1.4.3 Displacement study..............................................................................70
4.1.5 Statistical analysis.......................................................................................70 4.2 Results and Discussion ......................................................................................71
4.2.1 Cytotoxicity.................................................................................................71 4.2.2 Insulin Secretion by INS-1 cells .................................................................72 4.2.3 Serum insulin determination in an animal model .......................................82 4.2.4 Binding studies using INS-1 rat pancreatic cells ........................................83
4.2.4.1 Choice of incubation time....................................................................83 4.2.4.2 Saturation binding................................................................................84 4.2.4.3 Displacement studies ...........................................................................85
Chapter 5 Conclusion ..................................................................................................... 90
References........................................................................................................................ 99
Appendix A.................................................................................................................... 105
IV
Summary The need for alternative strategies for the prevention and treatment of diabetes is
growing rapidly as type II diabetes is reaching epidemic status in our society. This
need was the basis for the creation of this study, as it was necessary to start looking
towards medicinal plants as potential antidiabetic treatment and no comprehensive in
vitro model existed.
In creating a model for determining the effects of alternative traditional medicines as
antidiabetic potentiates, it was necessary that two metabolic pathways, namely
glucose uptake and insulin secretion, which play a significant role in glucose
homeostasis, be at the centre of our investigations. The objective of this project was to
optimize the methodology required to screen and ultimately determine the
effectiveness of the plant extracts Kankerbos and MRC2003, as antidiabetic
potentiates, through observing their effects on glucose utilisation and insulin
secretion. If these medicinal plants are going to make a positive contribution to the
health of type II diabetic South Africans, then the determination of their efficacy is
essential. The cell lines used in this study included 3T3-L1 preadipocytes, Chang
liver, C2C12 muscle and INS-1 rat pancreatic cells. Each cell line represents a
different in vivo organ that is known to have an influence on glucose homeostasis in
our bodies, each with its own unique metabolic pathways and mechanisms of activity,
thereby making each one a vital component in the study.
The positive controls for the two models were insulin and metformin (glucose
utilisation) and glibenclamide (insulin secretion). Insulin was shown to provide a
significant increase in the amount of glucose taken up in C2C12 muscle and Chang
liver cells for acute conditions. Chronic treatments with metformin provided a
significant increase in glucose utilised by Chang liver cells. Glibenclamide was an
effective positive control for stimulating insulin secretion by INS-1 cells under acute
conditions as there was a significant increase in the amount of insulin secreted.
MRC2003 did not show any significant antidiabetic activity. Sutherlandia frutescens
(Kankerbos) showed biological activities comparable to some of the more recognized

V
antidiabetic compounds throughout the study. With regards to the glucose utilisation
model, Kankerbos was seen to have both acute and chronic effects in different cell
lines. In the C2C12 muscle cell line, Kankerbos significantly increased glucose uptake
when they were exposed to acute conditions. Kankerbos also had a significant effect
on the Chang liver cells as it was observed that under both acute and chronic
conditions, this plant extract induced the uptake of glucose into these cells. With
respect to the insulin secretion model involving INS-1 cells, no significant effect was
seen during acute exposure with Kankerbos treatment. However during chronic
exposure, an increase in insulin secretion was initiated by this plant extract. Overall,
the results of this study suggest that Kankerbos has a twofold mechanism of action for
its glucose-lowering effects. Given that Kankerbos is widely available in South
Africa, this study was valuable as it provided an indication that Kankerbos has
antidiabetic activities and could possibly be used as an alternative antidiabetic
medication.

VI
Acknowledgements I would like to extend my sincere thanks and appreciation to everyone who made this
study possible, especially to:
God, for His strength and faithfulness
Dr Roux and Dr van de Venter for their unwavering guidance and support as well as
their willing assistance in the preparation of this manuscript
All staff and postgraduate students in the Department of Biochemistry and
Microbiology, Nelson Mandela Metropolitan University, for their continual support
and encouragement
The National Research Foundation and University of Port Elizabeth for their financial
support
My Mom and Dad, Greg, family and friends for their unconditional love and support
VII
List of Abbreviations
ADD1/SREBP1 Adipocyte determination and differentiation factor 1/ sterol regulatory element binding protein-1
ADP Adenosine diphosphate
α Alpha
AMP Adenosine monophosphate
Arg Arginine
ATP Adenosine triphosphate
β Beta
BSA Bovine serum albumin
Ca2+ Calcium ion
CaCl2 Calcium chloride
C/EBP CCAAT/enhancer-binding proteins
δ Delta
DEX Dexamethazone
DHAP Dihydroxyacetone phosphate
DMEM Dulbecco’s Modification of Eagle’s Medium
DMSO Dimethyl sulfoxide
EDTA Ethylenediaminetetraacetic acid tetrasodium salt
FCS Fetal Calf Serum
FFA Free fatty acid
γ Gamma
GABA Gamma-aminobutyric acid
GLUT Glucose transporter
G3PDH Glycerol-3-phosphate dehydrogenase
g Gram
HDL High density lipoprotein
HCl Hydrochloric acid
HEPES N-[2-Hydroxyethyl]piperazine-N- [2- ethanesulfonic acid]
IRS Insulin receptor substrate
IBMX Isobutylmethylxanthine
KD Dissociation constant
kg Kilogram
VIII
Kir 6.x Potassium channel subunit
K+ Potassium ion
K+ATP ATP- sensitive potassium channel
KRBH Krebs-Ringer-bicarbonate-HEPES buffer
l Litre
LXR Lipid-modulated nuclear receptor
Lys Lysine
m Milli
MAPK Ras/mitogen-activated protein kinase
MgSO4 Magnesium sulphate
2 - ME 2 - Mercaptoethanol
μ Micro
M Molar
n Nano
NaCl Sodium chloride
NaHCO3 Sodium bicarbonate
PBS Complete phosphate buffered saline
PBSA Phosphate buffered saline (without Ca2+ and Mg2+)
PC-1 Plasma cell antigen-1
PI3-kinase Phosphatidylinositol 3-kinase
PLL Poly-L-lysine
PPARγ Peroxisome proliferator-activated receptor γ
P Probability
r2 Correlation coefficient
RIA Radioimmunoassay
rpm Revolutions per minute
RPMI 1640 Roswell Park Memorial Institute culture medium
RXR Retinoid X receptor
SD Standard deviation
SEM Standard error of mean
SRB Sulforhodamine B
SUR Sulfonylurea receptor
TCA Trichloroacetic acid
TEA Triethylamine

IX
Tris Tris(hydroxymethyl)aminomethane
TNFα Tumor necrosis factor α
TZD Thiazolidinediones
WHO World Health Organisation
X
List of Figures Figure 1.1: Insulin is the principal regulator of energy metabolism…………………..3
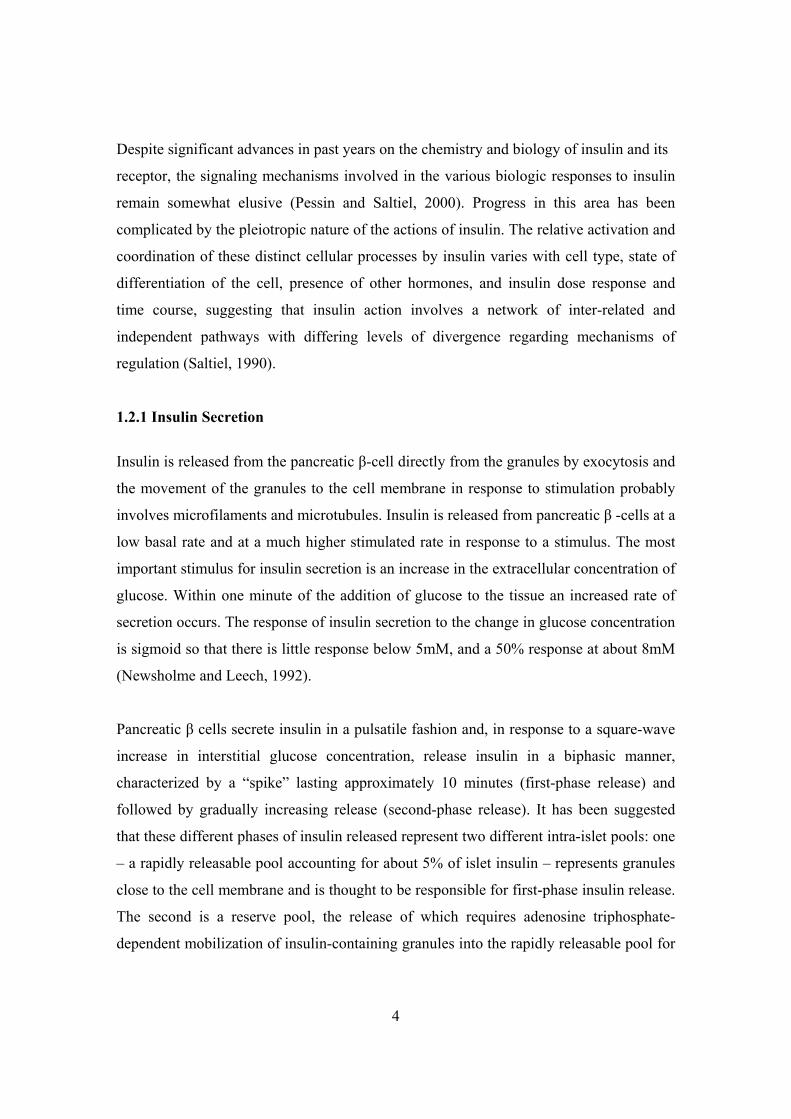
Figure 1.2: Schematic diagram of the probable structure of the insulin receptor
tetramer in the activated state……………………………………………..7
Figure 1.3: Pathways of insulin control……………………………………………… 7
Figure 1.4: Central role of Akt in the actions of insulin………………………………8
Figure 1.5: Hypothetical model of the action of insulin on glucose transport
specifically for GLUT 4…………………………………………………12
Figure 1.6: Diabetes mellitus type II: the tip of the iceberg………………………….16
Figure 1.7: Common mechanism of insulin release in response to hyperglycaemia
or sulfonylurea administration…………………………………………...18
Figure 1.8: The transcriptional control of adipogenesis involves the activation
of several families of transcription factors………………………………20
Figure 1.9: Sutherlandia frutescens…………………………………………………..26
Figure 3.1: Cytotoxicity results of compounds (BDM1, BDH1 BDP1 and metformin)
and plant extracts (Kankerbos and MRC2003) on 3T3-L1 adipocyte cells
after a 48 hour exposure period………………………………………….40
Figure 3.2: The effect of plant extracts (Kankerbos and MRC; 12.5μg/well)
(with and without inducers) on glycerol-3-phosphate dehydrogenase
(G3PDH) specific activity……………………………………………….42
Figure 3.3: The percentage glucose taken up by undifferentiated (a) and differentiated
(b) 3T3-L1 cells when exposed to treatments under acute conditions…..45
Figure 3.4: Acute effect of treatments on glucose uptake in 3T3-L1 cells after
10 minute incubation time………………………………………………..45
Figure 3.5: Acute effect of treatments on glucose uptake in 3T3-L1 cells after
120 minute incubation time………………………………………………46
Figure 3.6: Comparison of glucose standard curve with and without 10% serum in
8mM RPMI 1640………………………………………………………..47
Figure 3.7: Glucose uptake as a percent of control in 3T3-L1 cells with wells lined
with PLL (a) and FCS (b)………………………………………………..48
Figure 3.8: Acute effects of treatments (1μM BDM1, BDH1 and BDP1) on glucose
uptake in 3T3-L1 cells after 60 minute incubation……………………...49
XI
Figure 3.9: Cytotoxicity results of compounds (BDM1, BDH1, BDP1 and metformin)
and plant extracts (Kankerbos and MRC2003) on C2C12 muscle cells
after a 48 hour exposure period………………………………………….51
Figure 3.10: The acute effect of positive controls, metformin and insulin (1μM)
on glucose uptake in C2C12 cells after 90 minute exposure…………..53
Figure 3.11: Acute effects of treatments on glucose uptake by C2C12 cells after
90 minutes……………………………………………………………...54
Figure 3.12: Effect of insulin (1μM) on glucose uptake in C2C12 muscle cells
compared to control after chronic exposure……………………………55
Figure 3.13: Cytotoxicity results of compounds (BDM1, BDH1 and BDP1) and
plant extract (MRC2003) on Chang liver cells after a 48 hour
exposure period………………………………………………………...56
Figure 3.14: Acute effect of two positive controls (1μM metformin and insulin)
on glucose uptake in Chang liver cells…………………………………57
Figure 3.15: Acute effect of treatments on glucose uptake in Chang liver cells……..58
Figure 3.16: Acute effect of treatments on glucose uptake in Chang liver cells……..59
Figure 3.17: Chronic effects of treatments exposed to Chang liver cells for 48 hours
prior to glucose uptake experimentation ………………………………60
Figure 3.18: Effect of different treatments (BDM1, BDH1, BDP1; 1μM and
Kankerbos and MRC2003; 12.5μg/well) on glucose uptake in Chang
liver cells under chronic conditions……………………………………61
Figure 3.19: CellTiter-BlueTM results of Chang liver cells exposed to
different treatments for chronic experimentation………………………62
Figure 4.1: Cytotoxicity results of compounds (Glibenclamide and Amitriptyline)
and plant extracts (Kankerbos and MRC2003) on INS-1 cell line………72
Figure 4.2: Effect of 1μM glibenclamide (30 minute exposure) on insulin secretion
in INS-1 including 2mM glucose in the medium………………………..74
Figure 4.3: Effect of extracellular glucose concentration (glucose-free, 2mM and
10mM glucose) on insulin secretion in INS-1 cells……………………...74
Figure 4.4: Insulin secretion after 30 minute treatment without glucose and with
effect of extracellular glucose concentration (glucose-free, 2mM and
10mM glucose) (10 and 30 minute exposure) on insulin secretion in
INS-1 cells including glibenclamide in the test medium………………..75
XII
Figure 4.5: Effect of extracellular glucose concentration (glucose-free, 2mM
and 10mM glucose) (10 and 30 minute exposure) on insulin secretion
in INS-1 cells including glibenclamide in the test medium……………..76
Figure 4.6: Effect of different glucose concentrations (basal, 2mM and 10mM) on
insulin stimulation in INS-1 cells under acute conditions……………….77
Figure 4.7: Effect of compounds (glibenclamide and amitriptyline, 1μM) and
plant extracts (Kankerbos and MRC2003, 0.5ng/well) on insulin secretion
in INS-1 cells under acute conditions (10 minute exposure)……………78
Figure 4.8: Effect of extracellular glucose as well as the test compounds
(Glibenclamide and Amitriptyline, 1μM) and plant extracts
(Kankerbos and MRC2003, 0.5ng/well) on insulin secretion in
INS-1 cells under chronic conditions……………………………………80
Figure 4.9: Fasting serum insulin concentrations as a result of a 19 week treatment
with the medication……………………………………………………...82
Figure 4.10: Specific binding of [3H]glibenclamide by INS-1 cells as a function
of incubation time………………………………………………………84
Figure 4.11: Saturation binding curve………………………………………………..84
Figure 4.12: Saturation binding curve………………………………………………..85
Figure 4.13: Displacement of [3H]glibenclamide by unlabelled glibenclamide
(1.34nM – 1.34µM) and amitriptyline (0.67µM and 6.67µM)…………87
Figure 4.14: Displacement of [3H]glibenclamide by unlabelled glibenclamide
(1.34nM – 1.34µM), amitriptyline and trimipramine
(0.67µM and 6.67µM)…………………………………………………..88
Figure 4.15: Displacement of [3H]glibenclamide by unlabelled glibenclamide
(1.34nM – 1.34µM) and varying concentrations of unlabelled
amitriptyline (0.67nM – 6.67μM).……………………………………..88
Figure 5.1: Summary of carbohydrate metabolism ………………………………….92
Figure 5.2: Mechanisms of insulin action……………………………………………93
Figure 5.3: Mechanisms of metformin action on hepatic glucose production and
muscle consumption……………………………………………………...94

XIII
List of Tables Table 4.1: Experimental plan for medicinal exposure .................................................68 Table 4.2: Probability (P) of binding to SUR-1 receptors ...........................................86 Table A1: Conversion table for plant extract concentrations ....................................105
1
Chapter 1
Literature Review 1.1 Introduction The identification of substances that mediate or mimic the action of insulin could lead to
the development of novel structures which may be of clinical use in the treatment of
persons having disorders of glucose metabolism, such as impaired glucose tolerance,
elevated blood glucose associated with type II diabetes and insulin resistance (Larner et
al., 1997).
Modern drug discovery requires a systematic approach to optimize time and resource use
in order to test the maximum number of samples in systems which hopefully predict
therapeutic efficacy (Wagner and Farnsworth, 1994).
Techniques for the study of hypoglycaemic activity in vivo employ animals with
normoglycaemia or induced hyperglycaemia, as well as diabetic humans. In vivo
bioassays are essential to prove the value of new hypoglycaemic agents, however, animal
tests reveal relatively little about the specific mechanisms of action of the compound, and
it is evident that there are a great many mechanisms by which blood glucose levels may
be reduced. Some of these mechanisms, such as those producing hypoglycaemia as a
side-effect of their toxicity, are obviously not useful in diabetes treatment. The lack of
perfect models for type II diabetes, coupled with financial restrictions on obtaining and
maintaining animals, and social restrictions on extensive use of animals in
experimentation, indicate that a more practical approach would involve a series of in vitro
prescreens before testing a potential new hypoglycaemic agent in animals. Many in vitro
techniques have been developed to elucidate the varied mechanisms of action of
hypoglycaemic agents discovered by in vivo bioassays. Three aspects of the
hypoglycaemic response are commonly studied in vitro: insulin release from the
pancreatic islets, peripheral insulin binding and glucose uptake, and effects on hepatic
enzymes (Wagner and Farnsworth, 1994).
2
During the last 20 years, the considerable and significant advances in tissue culture
methodology, the use of chemically-defined cell and tissue culture media, and the
availability of mammalian cells have transformed in vitro methods from a new
technology to a valuable research tool. In the past, in vitro methodology was used as the
last approach in product development. Today, the use of in vitro tests in product
development, drug discovery and safety evaluation has become commonplace, resulting
almost exclusively from the evolution of science rather than any fundamental change in
philosophy. Yet all in vitro methods are alternatives to animal testing. It is not known
how well any in vitro system would recapitulate the in vivo system. Thus, it would be
difficult to design an in vitro test battery to replace in vivo test systems.
In vitro systems are well suited to the study of biological processes in a more isolated
context, therefore, in vitro tests have their greatest potential in providing information on
basic mechanistic processes in order to refine specific experimental questions to be
addressed in the animal.
Advantages of in vitro models include the ability to directly manipulate cultivation
conditions and isolate the target tissue from the physiological effects of other organs and
tissues. Additional unique competitive advantages of in vitro models include: 1) Rapid
large-scale screening of drug candidates allows promising substances to be identified at
an early stage of the drug development process; 2) The time and costs involved in
developing active agents are significantly reduced and 3) Cost-intensive and ethically
controversial animal experiments can be reduced to a minimum.
In order to determine the best model for antidiabetic screening, it is essential to elucidate
and understand the molecular machinery involved in the regulation of blood glucose
levels.
3
1.2 Insulin
Insulin is the most potent anabolic hormone known and it is essential for appropriate
tissue development, growth, and maintenance of whole-body glucose homeostasis. It
regulates glucose homeostasis at many sites, reducing hepatic glucose output (via
decreased gluconeogenesis and glycogenolysis) and increasing the rate of glucose uptake,
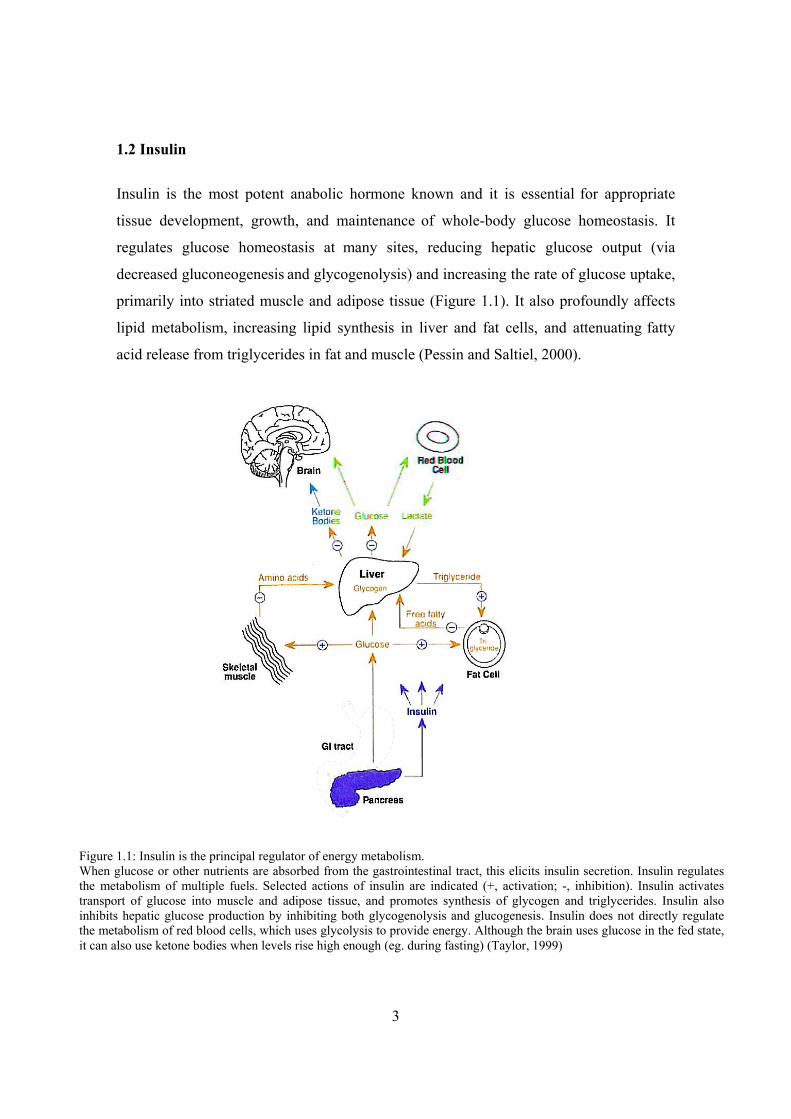
primarily into striated muscle and adipose tissue (Figure 1.1). It also profoundly affects
lipid metabolism, increasing lipid synthesis in liver and fat cells, and attenuating fatty
acid release from triglycerides in fat and muscle (Pessin and Saltiel, 2000).
Figure 1.1: Insulin is the principal regulator of energy metabolism. When glucose or other nutrients are absorbed from the gastrointestinal tract, this elicits insulin secretion. Insulin regulates the metabolism of multiple fuels. Selected actions of insulin are indicated (+, activation; -, inhibition). Insulin activates transport of glucose into muscle and adipose tissue, and promotes synthesis of glycogen and triglycerides. Insulin also inhibits hepatic glucose production by inhibiting both glycogenolysis and glucogenesis. Insulin does not directly regulate the metabolism of red blood cells, which uses glycolysis to provide energy. Although the brain uses glucose in the fed state, it can also use ketone bodies when levels rise high enough (eg. during fasting) (Taylor, 1999)
4
Despite significant advances in past years on the chemistry and biology of insulin and its
receptor, the signaling mechanisms involved in the various biologic responses to insulin
remain somewhat elusive (Pessin and Saltiel, 2000). Progress in this area has been
complicated by the pleiotropic nature of the actions of insulin. The relative activation and
coordination of these distinct cellular processes by insulin varies with cell type, state of
differentiation of the cell, presence of other hormones, and insulin dose response and
time course, suggesting that insulin action involves a network of inter-related and
independent pathways with differing levels of divergence regarding mechanisms of
regulation (Saltiel, 1990).
1.2.1 Insulin Secretion
Insulin is released from the pancreatic β-cell directly from the granules by exocytosis and
the movement of the granules to the cell membrane in response to stimulation probably
involves microfilaments and microtubules. Insulin is released from pancreatic β -cells at a
low basal rate and at a much higher stimulated rate in response to a stimulus. The most
important stimulus for insulin secretion is an increase in the extracellular concentration of
glucose. Within one minute of the addition of glucose to the tissue an increased rate of
secretion occurs. The response of insulin secretion to the change in glucose concentration
is sigmoid so that there is little response below 5mM, and a 50% response at about 8mM
(Newsholme and Leech, 1992).
Pancreatic β cells secrete insulin in a pulsatile fashion and, in response to a square-wave
increase in interstitial glucose concentration, release insulin in a biphasic manner,
characterized by a “spike” lasting approximately 10 minutes (first-phase release) and
followed by gradually increasing release (second-phase release). It has been suggested
that these different phases of insulin released represent two different intra-islet pools: one
– a rapidly releasable pool accounting for about 5% of islet insulin – represents granules
close to the cell membrane and is thought to be responsible for first-phase insulin release.
The second is a reserve pool, the release of which requires adenosine triphosphate-
dependent mobilization of insulin-containing granules into the rapidly releasable pool for
5
subsequent exocytosis. Both phases of insulin release are important for maintaining
normal glucose homeostasis. However, considerably more emphasis has been placed on
the importance of first-phase insulin, assuming that this is the major determinant of
“early” insulin release, that is, the increase in plasma insulin levels observed during the
initial 30 minutes following glucose or meal ingestion (Gerich, 2000).
The proposed hypothesis of insulin secretion: An increase in the extracellular glucose
concentration above 5mM increases proportionally the rate of glycolysis (through
operation of the glucose/glucose 6-phosphate cycle) and this raises the concentration of
phosphoenol pyruvate which, increases the rate of uptake of calcium ions and probably
increases the rate of release from intracellular calcium stores. An increased cytosolic
concentration of calcium ions, via calmodulin, causes contraction of the microfilaments
or microtubules and hence results in an increased rate of exocytosis and insulin secretion.
The hypothesis attempts to link the rate of glycolysis, calcium ions and rate of insulin
secretion (Newsholme and Leech, 1992).
Potassium channels are sensitive to ATP and function in coupling cell metabolism to
membrane potential in many tissues (Hernandez-Sanchez et al., 1999). K+ATP channels
have been found in a variety of tissues including heart, pancreatic β-cells, skeletal
muscle, smooth muscle and the central nervous system (Isomoto et al., 1996). K+ATP
channels comprise an octameric complex of pore-forming Kir6.x subunits and regulatory
sulfonylurea receptors (SURs) (Gribble and Ashcroft, 2000). There are three isoforms of
the sulfonylurea receptor, SUR1 and two spliced variants of SUR 2, SUR 2A and SUR
2B. The SUR1-Kir 6.2 and SUR2B-Kir 6.2 or Kir 6.1, constitute the cardiac and vascular
smooth muscle-type channels, respectively (Hernandez-Sanchez et al., 1999). SUR is a
member of the family of ATP-binding cassette (ABC) transporter proteins and appears to
be the major determinant of the pharmacological properties of K+ATP channels (Gribble
and Ashcroft, 2000; Isomoto et al., 1996). K+ATP channels which consist of SUR1 and
Kir 6.2 do not only occur in β cells but are also present in the alpha, delta and pancreatic
polypeptide cells of the pancreatic islets (Fujikura et al., 1999). The K+ATP (SUR1-Kir
6.2) channels mediate glucose-induced insulin secretion in pancreatic cells. K+ATP
6
channels are modulated by intracellular ATP/ADP ratios: ATP closes the K+ATP
dependent channels, while ADP opens them (Raab-Graham et al., 1999). When the level
of blood glucose increases, glucose enters β-cells via GLUT 1, 2 and 3 transporters,
which are insulin independent (Walker, 2000). Following glucose metabolism, the
intracellular ATP/ADP ratio increases thereby inactivating the K+ATP channels. This
increase in the ATP concentration causes closure of the K+ATP sensitive channels and
the efflux of K+ through the channel is decreased causing depolarization of the
membrane. This in turn results in the opening of the voltage-dependent calcium channels
with a subsequent increase in the intracellular Ca2+, which initiates insulin secretion
(Hernandez-Sanchez et al., 1999).
1.2.2 Insulin Receptor
Once insulin has entered the circulation it reacts with target cells that have insulin
receptors on their plasma membranes (Katzung, 1995). The most important target cells,
which have insulin receptors are liver, muscle and fat. The number of insulin receptors on
individual cells and the affinity of the receptor to insulin varies. The receptors bind
insulin with high specificity and affinity in the picomole range. Insulin action is initiated
through the binding to and activation of its cell-surface receptor, which consists of two α
subunits and two β subunits that are disulfide linked into an α2β2 heterotetrameric
complex, as illustrated in figure 1.2. Insulin binds to the extracellular α subunits,
transmitting a signal across the plasma membrane that activates the intracellular tyrosine
kinase domain of the β subunit. Although PI 3-kinase activity is clearly necessary for
insulin-stimulated glucose uptake, additional signals are also required for the stimulation
of GLUT4 translocation (Pessin and Saltiel, 2000).
7
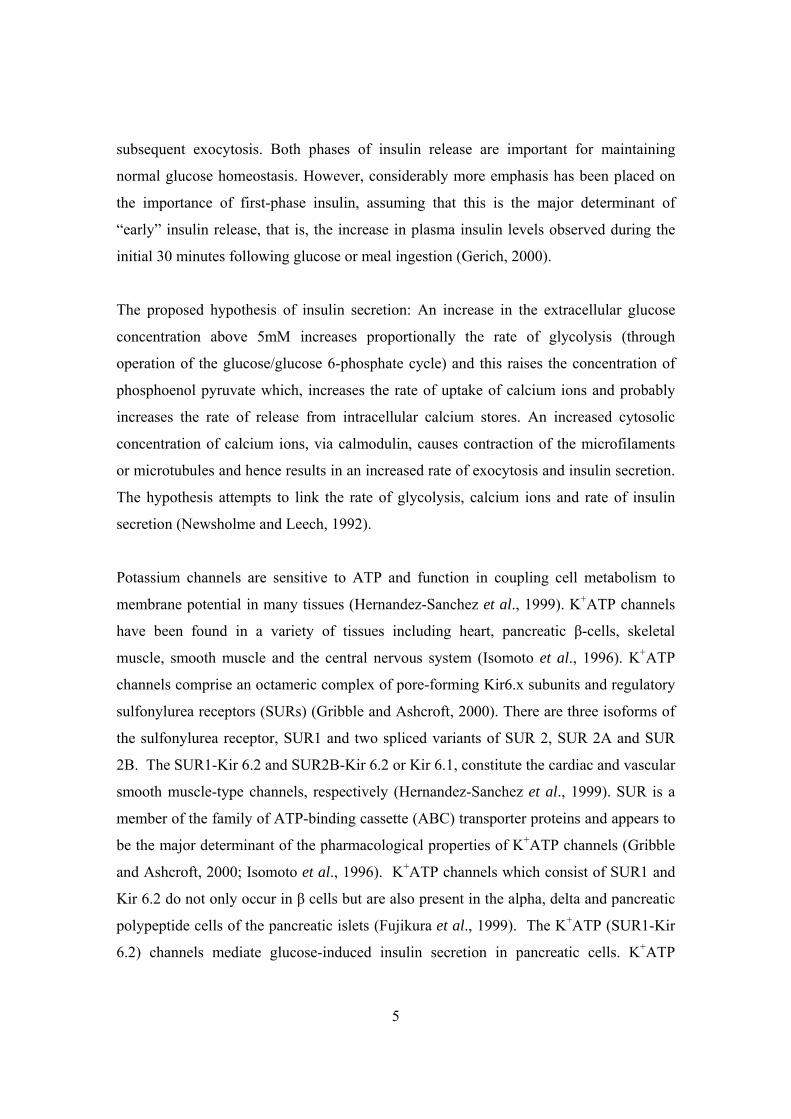
Upon binding insulin, the protein tyrosine kinase phosphorylates itself as well as target
substances (Figure 1.3), such as the insulin receptor proteins (IRS-1 and IRS-2), Cbl and
p52Sho (Galic et al., 2005). IRS-1 plays a more prominent role in stimulating glucose
uptake by muscle and fat, whereas IRS-2 functions mainly in the liver. It has been
discovered that IRS-2 boosts insulin production by the pancreas (Alper, 2000).
Figure 1.3: Pathways of insulin control (Alper, 2000)
Figure 1.2: Schematic diagram of the probable structure of the insulin receptor tetramer in the activated state (Katzung, 1995)
8
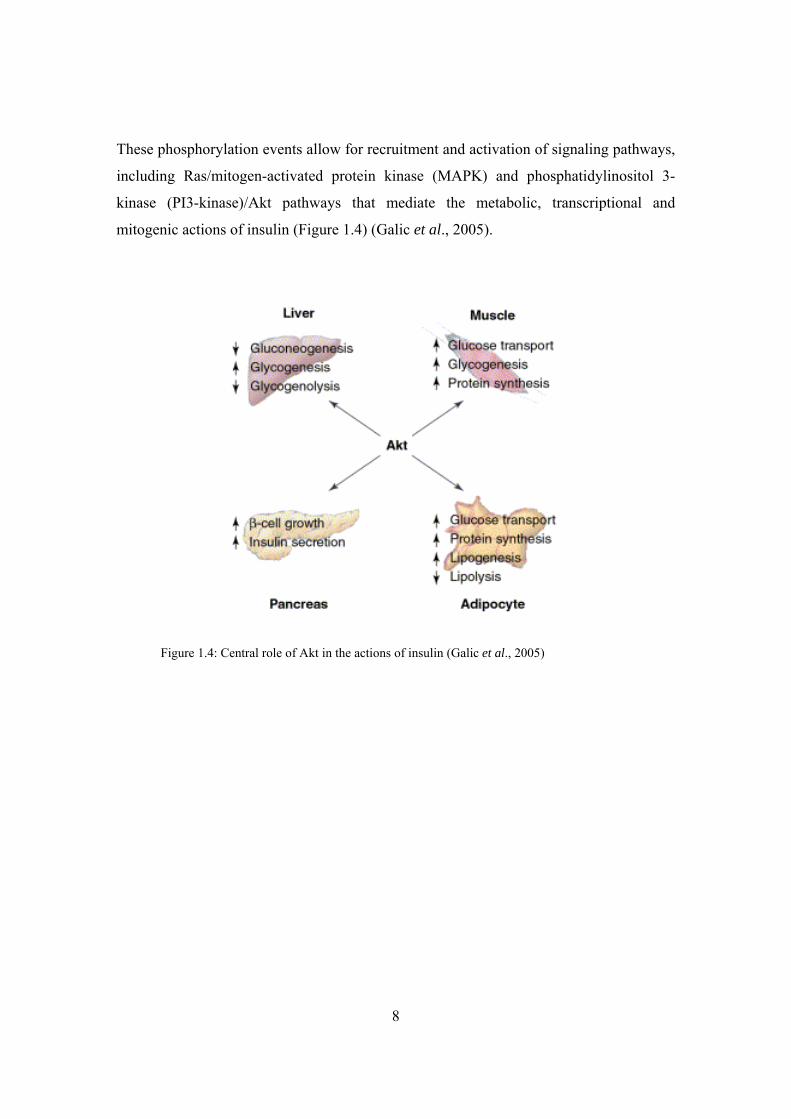
These phosphorylation events allow for recruitment and activation of signaling pathways,
including Ras/mitogen-activated protein kinase (MAPK) and phosphatidylinositol 3-
kinase (PI3-kinase)/Akt pathways that mediate the metabolic, transcriptional and
mitogenic actions of insulin (Figure 1.4) (Galic et al., 2005).
Figure 1.4: Central role of Akt in the actions of insulin (Galic et al., 2005)

9
1.3 Glucose Absorption By Cells
The entry of glucose into cells is a crucial step in life-supporting processes since glucose
is the main monosaccharide in nature that provides carbon and energy for almost all cells.
The passage of glucose into cells depends on different parameters, including expression
of the appropriate glucose transporters in the target tissues and hormonal regulation of
their function (Gorovits and Charron, 2003). Glucose is a hydrophilic compound; it
cannot pass through the lipid bilayer by simple diffusion, and therefore requires specific
carrier proteins to mediate its specific transport into the cytosol. Cells take up glucose by
facilitated diffusion, via glucose transporters (GLUTs) associated with the plasma
membrane (Medina and Owen, 2002).
Until now the search for the mammalian facilitative glucose transporters has yielded 12
carriers including GLUT1–5 and the recently discovered GLUT6–12. The kinetic
properties and substrate specificities of the different isoforms are specifically suited to the
energy requirements of the particular cell types (Medina and Owen, 2002). The
transporters form a family whose members are broadly alike in structure and function.
Each transporter consists of a polypeptide chain consisting of approximately 500 amino
acids (Lienhard et al., 1992). All GLUTs have been predicted to have 12 membrane-
spanning domains (helices) connected by hydrophilic loops, the first of which is exofacial
and contains an N-glycosylation site in GLUT1–5. Both the amino and carboxyl termini
of GLUTs reside on the cytoplasmic side of the cell membrane. Models of GLUTs
suggest that five of the transmembrane helices form an aqueous pore providing a channel
for substrate passage. Lack of a crystal structure leaves the precise structure of GLUTs
hypothetical (Gorovits and Charron, 2003).
Glucose passage into the cell is an intricate one. In the process, the transporter takes on
two shapes, one which binds glucose on the extracellular side and the other which binds it
on the intracellular side. It is suggested that a glucose molecule enters the cell through a
four step process. First, it occupies the outward-facing binding site. Second, the complex
of transporter and glucose changes conformation. The glucose occupies the binding site
10
facing into the cell. Third, the transporter releases the glucose into the cytoplasm. Fourth,
the unoccupied transporter changes back into the conformation in which the binding site
is on the outward side, thereby enabling the binding of another glucose molecule. The
transporter is envisioned as a conformational oscillator which shifts the binding pocket
for glucose between opposite sides of the cell membrane (Lienhard et al., 1992).
GLUTs expression is cell-specific and subject to hormonal and environmental control.
(Medina and Owen, 2002). GLUT1 is a high affinity glucose transporter that is
ubiquitously expressed in most mammalian tissues. It provides basal glucose transport
and, most importantly, transport of glucose through the blood-brain barrier, erythrocytes,
and neuronal cell membranes. GLUT2 is a low affinity glucose transporter with a high
turnover rate expressed in adult liver, kidney, intestinal epithelium, and pancreatic β-cells
(Gorovits and Charron, 2003). These kinetic properties allow GLUT2 to function in the
liver where glucose transport must not be rate limiting for influx or efflux. When
circulating glucose levels are high there needs to be net hepatic uptake as the intracellular
glucose is metabolized or converted into glycogen. Conversely, when glucose levels are
low, the liver needs to export glucose to the plasma. This is achieved by GLUT2 coupled
with the regulated phosphorylating activity of hexokinase IV. GLUT2 therefore functions
in the regulation of insulin levels because changes in the blood glucose level are
effectively transmitted to the liver and the pancreatic β cells by GLUT2. In order to
regulate insulin secretion, pancreatic cells need to be highly sensitive to changes in
plasma glucose concentrations. Therefore, a low-affinity transporter, such as GLUT2 will
not be saturated at physiological levels and glucose flux will be proportional to plasma
glucose concentration. As in the liver, hexokinase regulates the entry of glucose into the
glycolytic pathway and, along with GLUT2, plays a role in glucose sensing by β-cells
(Medina and Owen, 2002). GLUT3 is found in the neuronal cells of the brain and
functions to ensure a constant movement of the glucose into these cells. This transporter
takes up glucose and converts it into energy-yielding compounds in an insulin-mediated
step (Katzung, 1995; Lienhard et al., 1992). The insulin-stimulated, high affinity glucose
transporter protein GLUT4 is expressed predominantly, but not exclusively, in all insulin-
sensitive tissues: skeletal muscle, adipose tissue, and heart. GLUT4 is unique in that it is
11
the only insulin-responsive GLUT that has been characterized so far. Stimuli leading to
the increase in translocation of GLUT4 to the plasma membrane include insulin,
contraction, and hypoxia (Gorovits and Charron, 2003). One of the primary functions of
insulin is to facilitate the disposal of blood glucose into the peripheral tissues during the
post-absorptive state. Insulin increases cellular uptake and metabolism of glucose by
accelerating its transmembrane transport (Johnson, 1998). Undoubtedly GLUT4
translocation to the plasma membrane from the intracellular pool leads to an increase in
glucose uptake. Insulin-stimulated translocation of GLUT4 to the plasma membranes
requires phosphatidylinositol 3-kinase (PI3K) activity. However, the activity of PI3K
alone is not sufficient to cause a GLUT4-mediated increase in glucose transport,
suggesting that additional stimuli are important for GLUT4 translocation (Gorovits and
Charron, 2003). GLUT5 is found in the small intestine and kidney, where it functions in
the absorption of fructose (Katzung, 1995; Lienhard et al., 1992).
GLUT1 and GLUT4 are the main GLUTs functioning in adipose and muscle tissue.
GLUT1 is thought to play a constitutive role, and is responsible for basal glucose uptake
while GLUT4 is the inducible transporter. One of the most important, and well
established, models of GLUT regulation is the stimulation of GLUT expression and
translocation in adipose and muscle tissue by insulin. It is this process that provides the
regulation of whole-body glucose homeostasis and, when dysfunctional, plays a vital role
in diabetes mellitus. GLUT4 is almost completely responsible for insulin-stimulated
glucose transport. In rat adipocytes, the most studied cell system for insulin action on
glucose transport, more than 95% of GLUT4 and 30-40% of GLUT1 is associated with
intracellular membranes, and are therefore non-functional. These GLUTs are translocated
to the plasma membrane in response to insulin, where they are then able to facilitate the
transport of substrate (Medina and Owen, 2002).
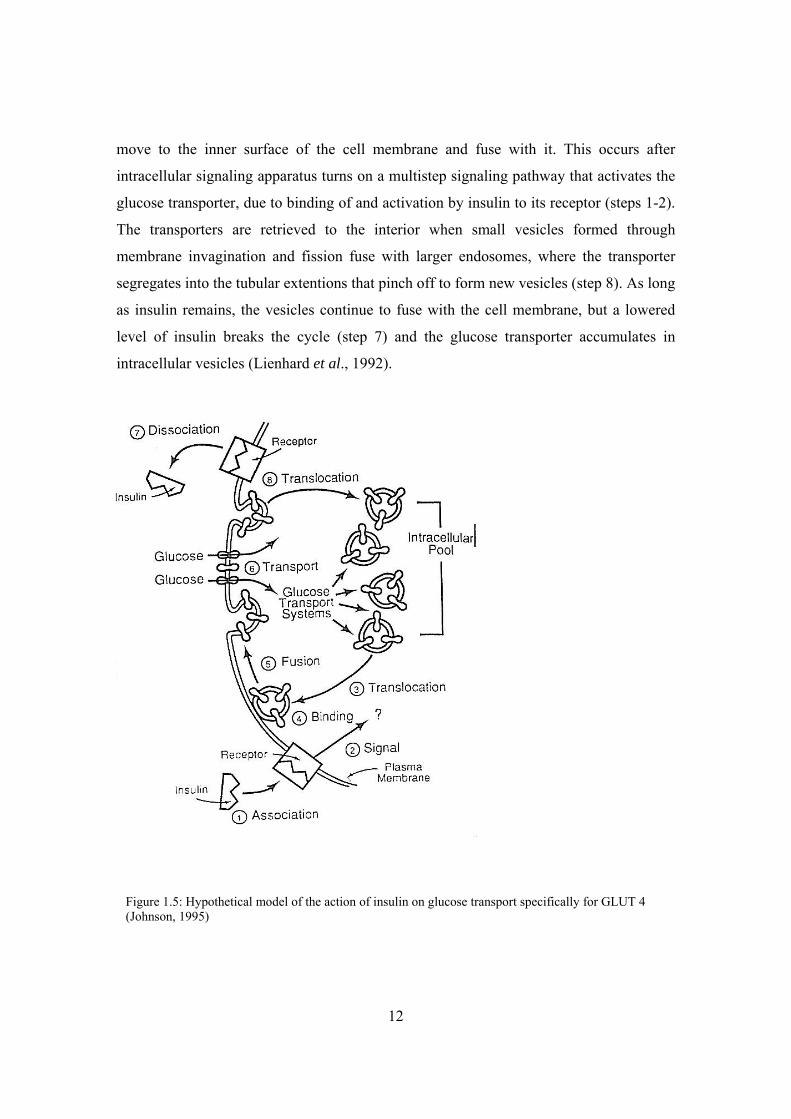
It is well established that the mechanism by which glucose transport (Figure 1.5, step 6)
is upregulated in fat and skeletal muscle, in response to insulin, involves recruitment of
the insulin-responsive GLUT4 transporter from an intracellular compartment to the
plasma membrane (steps 3-5). Insulin induces intracellular vesicles containing GLUT4 to
12
move to the inner surface of the cell membrane and fuse with it. This occurs after
intracellular signaling apparatus turns on a multistep signaling pathway that activates the
glucose transporter, due to binding of and activation by insulin to its receptor (steps 1-2).
The transporters are retrieved to the interior when small vesicles formed through
membrane invagination and fission fuse with larger endosomes, where the transporter
segregates into the tubular extentions that pinch off to form new vesicles (step 8). As long
as insulin remains, the vesicles continue to fuse with the cell membrane, but a lowered
level of insulin breaks the cycle (step 7) and the glucose transporter accumulates in
intracellular vesicles (Lienhard et al., 1992).
Figure 1.5: Hypothetical model of the action of insulin on glucose transport specifically for GLUT 4 (Johnson, 1995)
13
1.4 Diabetes Mellitus
Type II diabetes mellitus is a heterogeneous disorder due to a combination of inherited
and acquired factors that adversely affect glucose metabolism. It is thought that these
factors lead to diabetes mainly by affecting β-cell function and tissue insulin sensitivity.
If the amount of insulin produced is too little to allow for glucose to be used or stored, or
if the insulin being produced does not work effectively, glucose accumulates in the blood.
Hyperglycaemia develops when rates of glucose release into the circulation exceed rates
of tissue glucose uptake. This may occur because release is increased, because uptake is
reduced, or due to a combination of factors such as increased release with a lesser
increase in uptake (Gerich, 2000). In the normal individual, the concentration of glucose
in blood is maintained at about 90 mg/dL of plasma. However, fasting blood glucose in
diabetics may be 300-400 mg/dL and may even reach 1000 mg/dL (Johnson, 1998).
Type II diabetes is associated with insulin resistance initially and later, as the function of
the β-cell decreases, insulin deficiency (Cerasi, 2000). Type II diabetes is characterized
both by abnormalities of insulin secretion progressively leading to secretion failure as
well as insulin resistance of all major target tissues (Haring, 1999). Although insulin
resistance is important in the early stages of type II diabetes, the failure in adequate β-cell
compensation leads to the progression to the diabetic state. Compensation for insulin
resistance is through increased secretion per β-cell or by an increase in β-cell mass
through neogenesis or replication of the existing β-cells (Withers et al., 1998). Beta-cell
mass is normally tightly maintained through a balance of β-cell birth (β-cell replication
and islet neogenesis) and β-cell death through apoptosis. Most of the increase in β-cell
mass with insulin resistance is probably due to increased β-cell number, but β-cell
hypertrophy may also contribute (Weir and Bonner-Weir, 2004).
It is suggested that the disease is triggered when the delicate balance between insulin
production and insulin responsiveness goes awry. First, cells in muscle, fat and liver lose
some of their ability to respond fully to insulin. In response to growing insulin resistance,
pancreatic cells temporarily over produce insulin causing hyperinsulinemia (Alper,
2000). Much of the increase in insulin secretion undoubtedly results from the increase in
14
β-cell mass. At some point, β-cells are no longer able to keep glucose levels in the
prediabetic range. This failure presumably occurring because of a critical decline of β-cell
mass and/or increase in insulin resistance (Weir and Bonner-Weir, 2004). But the insulin-
producing cells eventually die, leading to full-blown diabetes. Therefore type II diabetes
results when the body loses the fine-tuned balance between insulin action and insulin
secretion. For years up until recently, it was believed that a malfunction in the insulin
receptor leads to insulin resistance, however researchers are converging on a new
hypothesis to explain this metabolic disorder. The shift in thinking occurred as a result of
failure in linking insulin receptor malfunction and the disease. It is now believed by some
researchers that two related pathways that normally respond to insulin by signaling cells
in the tissues to remove glucose, lie at the heart of insulin resistance. They are however
unsure as to why the biochemical pathways believed to be involved are not functioning
properly. It is believed that defects in the insulin signaling pathway leading to the disease
are subtle, as no mutations in the insulin receptor substrate (IRS) genes in diabetics have
been uncovered. Due to insulin’s regulation of glucose metabolism being so finely tuned,
it is believed that one or two subtle mutations will upset the entire system when
combined with the proper environmental insults. Another new insight into type II
diabetes is that in order for this disease to develop, insulin resistance must occur in both
muscle and liver, leading researchers to conclude that the insulin regulating system must
fail at multiple points (Alper, 2000).
The new insights into type II diabetes are mainly from studies in knockout mice,
however, human genetics does not necessarily correlate with animal data, therefore not
everyone is convinced and the old dogma is still being followed. The major causes of
insulin resistance of the skeletal muscle in the prediabetic state may be discussed as
genetic background, obesity related insulin resistance and of physical inactivity. Type II
diabetes is known to have both genetic and environmental determinants and is strongly
associated with age and obesity (Sheard and Clark, 2000). Among the environmental
factors causing insulin resistance, obesity is of predominant importance (Haring, 1999).
Obesity is defined as an excess of body weight that is mainly attributable to an increased
body fat accumulation (Tremblay and Doucet, 2000). Obesity is the most important
15
modifiable risk factor for type II diabetes (Sakurai et al., 1999). About 90 percent of
people with this form of the disease are overweight (Sheard and Clark, 2000). An excess
of body fat is associated with a deterioration of glucose utilisation and promotes
development of type II diabetes, particularly in those with a genetic predisposition for the
disease (www.geocities.com/jqjacobs).
There are a number of different hypotheses explaining the mechanism of insulin
resistance in obesity. It was proposed that tumor necrosis factor alpha (TNF-α) is released
by adipose tissue and is able to impair insulin signaling through serine kinase and
tyrosine phosphatase dependent modulation of the insulin signaling chain at the level of
the insulin receptor and substrates (IRS) (Haring, 1999). Another proposed mechanism
of insulin resistance in obesity is related to a protein molecule which interferes with
insulin action. Membrane glycoprotein PC-1 (plasma cell antigen-1) has been shown to
reduce the uptake of glucose by cells through inhibiting insulin receptor tyrosine kinase
activity. Obesity’s contribution to the onset of diabetes may be by increasing the levels of
PC-1 (www.pslgroup.com). The increase in obesity prevalence has led the World Health
Organization (WHO) to refer to a ‘global epidemic’ to describe the obesity issue. Body
weight and fat losses are essential if the health burden which obesity imposes on a great
proportion of individuals throughout the world is to be alleviated (Tremblay and Doucet,
2000).
1.4.1 Pharmacological Treatment
In figure 1.6, the simplified schematic presentation illustrates the evolution of type II
diabetes mellitus. Type II diabetes is a progressive disease. In these patients the blood
glucose level often does not rise high enough to produce many symptoms and therefore
goes undiagnosed. Because insulin is being produced they can often be treated without
insulin and may respond to dietary measures with or without addition of medication
(Vardaxis, 1994). Diabetes mellitus type II represents the end stage of long lasting
metabolic disturbances caused by insulin resistance associated with hyperinsulinemia,
obesity, dyslipoproteinemia, arterial hypertension and consequently premature
atherosclerosis. Since this detrimental metabolic milieu is present for many years before
16
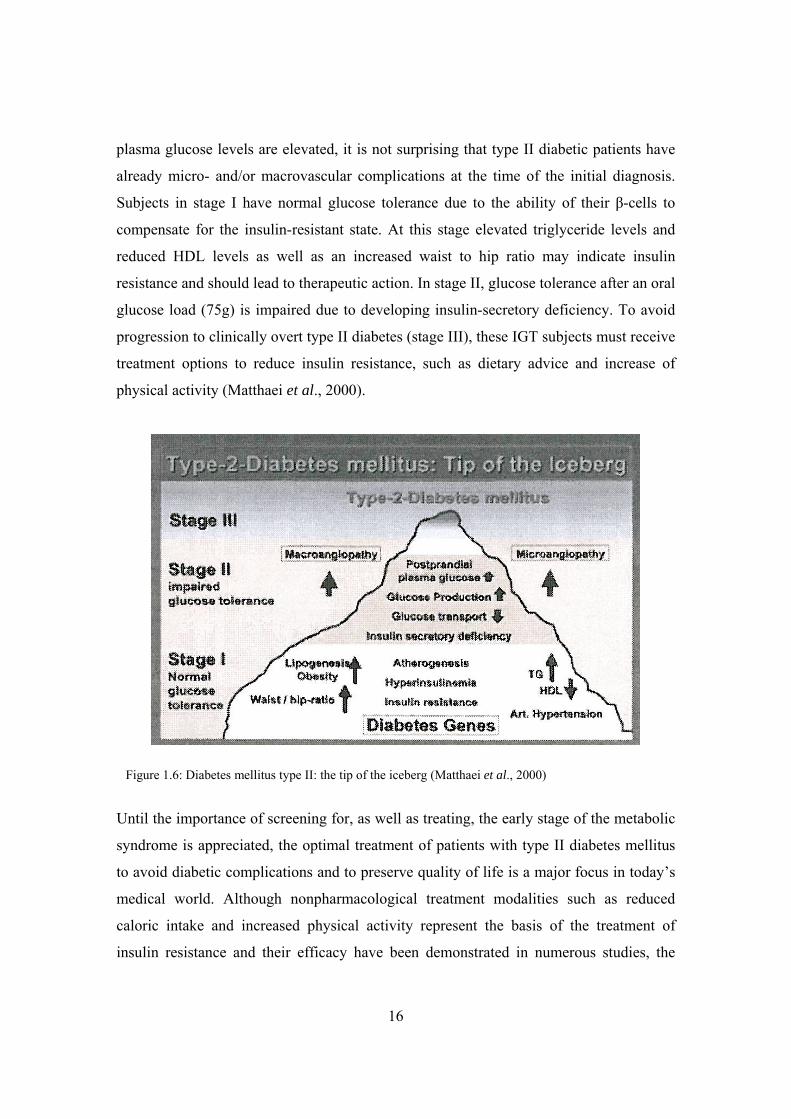
plasma glucose levels are elevated, it is not surprising that type II diabetic patients have
already micro- and/or macrovascular complications at the time of the initial diagnosis.
Subjects in stage I have normal glucose tolerance due to the ability of their β-cells to
compensate for the insulin-resistant state. At this stage elevated triglyceride levels and
reduced HDL levels as well as an increased waist to hip ratio may indicate insulin
resistance and should lead to therapeutic action. In stage II, glucose tolerance after an oral
glucose load (75g) is impaired due to developing insulin-secretory deficiency. To avoid
progression to clinically overt type II diabetes (stage III), these IGT subjects must receive
treatment options to reduce insulin resistance, such as dietary advice and increase of
physical activity (Matthaei et al., 2000).
Until the importance of screening for, as well as treating, the early stage of the metabolic
syndrome is appreciated, the optimal treatment of patients with type II diabetes mellitus
to avoid diabetic complications and to preserve quality of life is a major focus in today’s
medical world. Although nonpharmacological treatment modalities such as reduced
caloric intake and increased physical activity represent the basis of the treatment of
insulin resistance and their efficacy have been demonstrated in numerous studies, the
Figure 1.6: Diabetes mellitus type II: the tip of the iceberg (Matthaei et al., 2000)
17
actual number of patients sufficiently treated without pharmacological agents is
comparatively low. Therefore, pharmacological treatment is required in the vast majority
of type II diabetic patients (Matthaei et al., 2000). The choice of an oral antidiabetic
agent may be influenced by a large number of factors, but often comes down as much to
personal preference or experience as to detailed knowledge of the differential actions of
each molecule.
The following are the available antihyperglycaemic agents which are known to
ameliorate insulin resistance, namely, biguanides, sulfonylureas, thiazolidinediones and
insulin.
1.4.1.1) Biguanides
Metformin is a hypoglycaemic drug effective in the treatment of type II diabetes mellitus
(Klip and Leiter, 1990). Despite almost 40 years of research, the precise mechanism of
metformin action is still not entirely understood. Several cellular mechanisms have been
described but a single unifying site of action has yet to be identified (Matthaei et al.,
2000). Biguanides have no direct effect on insulin release and in fact actually reduce the
serum insulin level in both the basal and stimulated states. This decrease is believed to be
secondary to the biguanide-induced decrease in blood glucose concentration and is
usually attributed to one or more influences, working individually or in combination, that
include: decreased lumen-to-plasma glucose transport, suppression of hepatic
gluconeogenesis coupled with a net decrease in hepatic glucose output, and increased
anaerobic glucose utilization in tissues. At the subcellular level, metformin has been
shown to increase insulin binding to its receptor both in vitro and in vivo. Therefore,
metformin promotes glucose uptake at tissue level and insulin secretion is not enhanced
by its action (Foye et al., 1995; Klip and Leiter, 1990).
Metformin appears to be the drug of choice to start pharmacological treatment in insulin
resistant and overweight/obese diabetic subjects. Unlike other pharmacological therapies
for type II diabetes, metformin is not associated with weight gain (Matthaei et al., 2000).
18
1.4.1.2) Sulfonylurea Drugs
Sulfonylureas are a class of compounds available for treating hyperglycemia in non-
insulin-dependant diabetics. Sulfonylurea drugs are oral hypoglycaemic agents, which
increase the release of endogenous insulin as well as improve its peripheral effectiveness
(Katzung, 1995).
Sulfonylurea drugs have three mechanisms of action including the release of insulin from
pancreatic β cells, the reduction of serum glucagon levels and directly increasing tissue
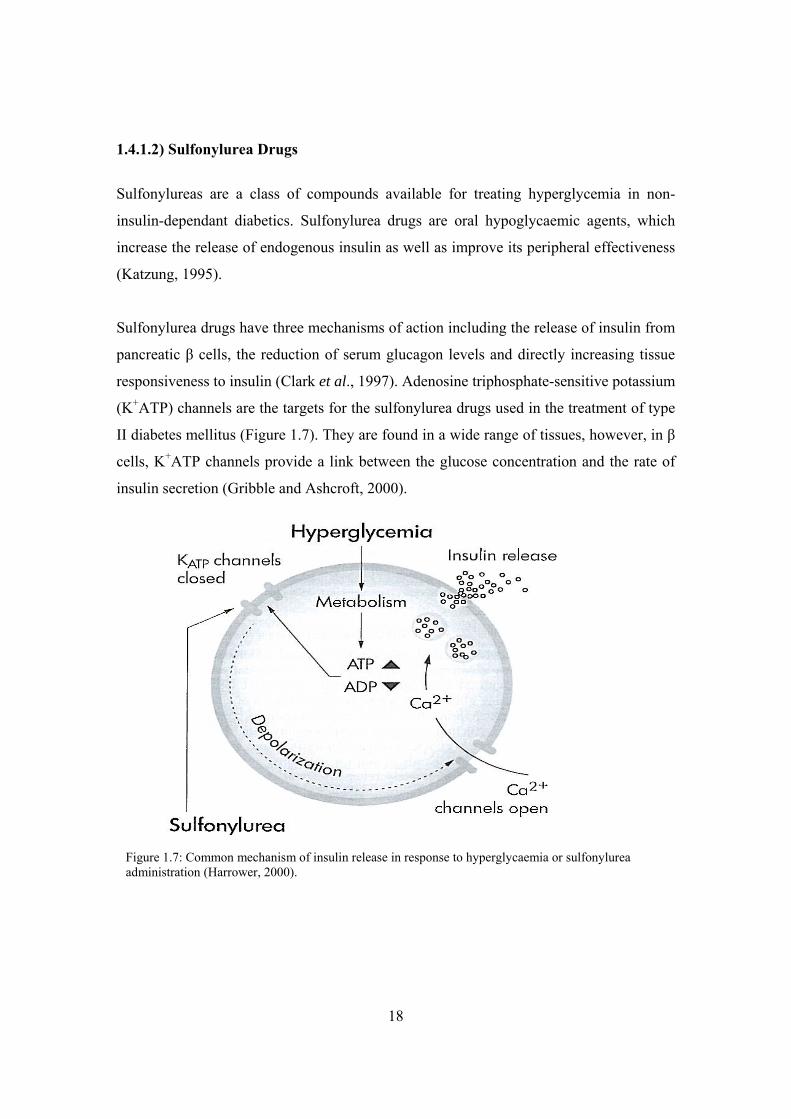
responsiveness to insulin (Clark et al., 1997). Adenosine triphosphate-sensitive potassium
(K+ATP) channels are the targets for the sulfonylurea drugs used in the treatment of type
II diabetes mellitus (Figure 1.7). They are found in a wide range of tissues, however, in β
cells, K+ATP channels provide a link between the glucose concentration and the rate of
insulin secretion (Gribble and Ashcroft, 2000).
Figure 1.7: Common mechanism of insulin release in response to hyperglycaemia or sulfonylurea administration (Harrower, 2000).
19
In type II diabetes, once insulin secretion becomes defective, the drug, sulfonylurea, is
administered to increase insulin release. Sulfonylureas promote insulin secretion by
favouring the closure of K+ATP channels. Sulfonylureas block K+ATP (SUR1-Kir 6.2)
channels by binding to the receptor (SUR1). Binding of the sulfonylurea inhibits the
efflux of K+ through the channel and results in depolarization. Depolarization of the
membrane provokes calcium influx by opening a voltage-gated Ca2+ channel. The
increased intracellular Ca2+ concentration triggers the secretion of insulin (Katzung,
1995; Quesada et al., 1999).
The use of sulfonylureas in the treatment of diabetes mellitus is controversial.
Hypoglycaemia is a danger with sulfonylureas and may be caused by drug overdose, drug
interactions, altered drug metabolism or the patient failing to eat (Clark et al., 1997)
1.4.1.3) Thiazolidinediones
Adipose tissue has been the subject of intense scrutiny, and one important reason for this
is that this tissue provides a critical link in maintaining systemic energy balance. The
ongoing explosion in the incidence of obesity and its ugly stepsister, type II diabetes, has
focused attention on all aspects of adipocyte biology, including adipogenesis (Rosen et
al., 2000).
Functionally, cellular differentiation can be thought of as a shift in gene expression
patterns, such that transcripts that determine the primitive, multipotent state give way to
those that define the final phenotype. Morphological changes result from the actions of
the genes that are induced as the cells differentiate, including alterations in the cell shape
and the accumulation of lipid that accompany adipogenesis. A transcriptional cascade has
been found to drive adipogenesis. Three classes of transcription factors have been
identified that directly influence fat cell development. These include peroxisome
proliferator-activated receptor γ (PPARγ), CCAAT/enhancer-binding proteins (C/EBPs)
and the basic helix-loop-helix family, adipocyte determination and differentiation factor
1/sterol regulatory element binding protein-1 (ADD1/SREBP1c) (Rosen et al., 2000)
20
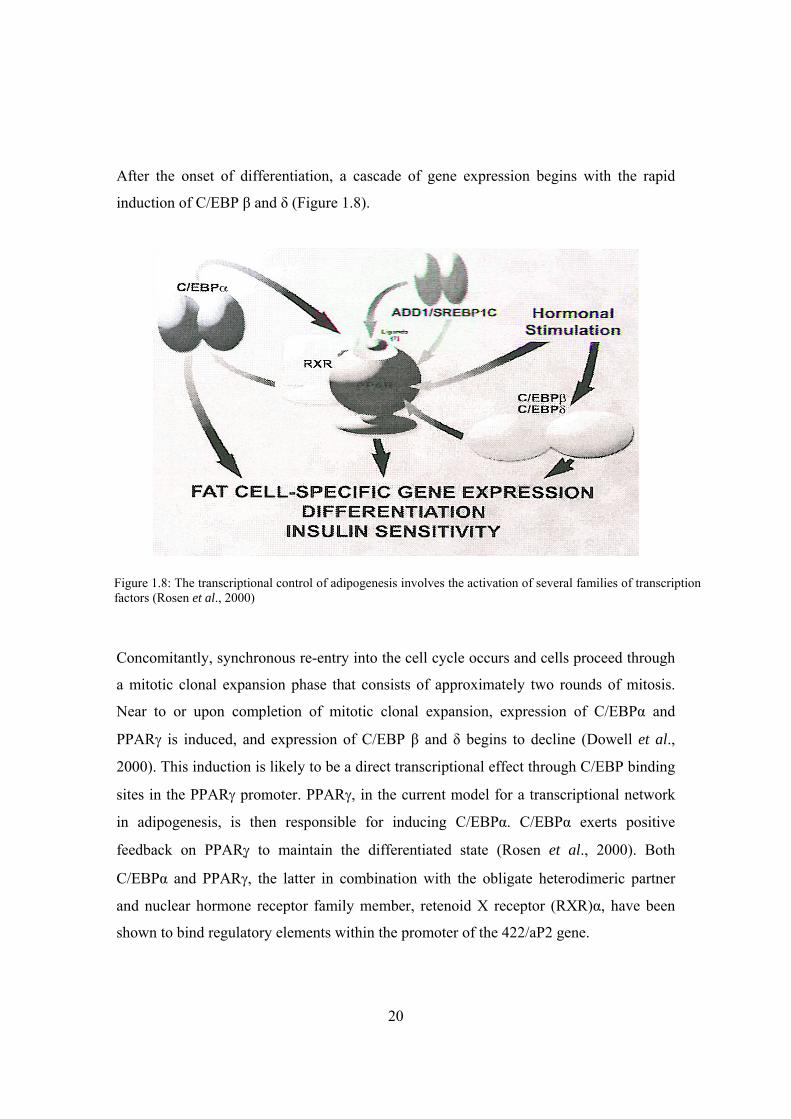
After the onset of differentiation, a cascade of gene expression begins with the rapid
induction of C/EBP β and δ (Figure 1.8).
Concomitantly, synchronous re-entry into the cell cycle occurs and cells proceed through
a mitotic clonal expansion phase that consists of approximately two rounds of mitosis.
Near to or upon completion of mitotic clonal expansion, expression of C/EBPα and
PPARγ is induced, and expression of C/EBP β and δ begins to decline (Dowell et al.,
2000). This induction is likely to be a direct transcriptional effect through C/EBP binding
sites in the PPARγ promoter. PPARγ, in the current model for a transcriptional network
in adipogenesis, is then responsible for inducing C/EBPα. C/EBPα exerts positive
feedback on PPARγ to maintain the differentiated state (Rosen et al., 2000). Both
C/EBPα and PPARγ, the latter in combination with the obligate heterodimeric partner
and nuclear hormone receptor family member, retenoid X receptor (RXR)α, have been
shown to bind regulatory elements within the promoter of the 422/aP2 gene.
Figure 1.8: The transcriptional control of adipogenesis involves the activation of several families of transcription factors (Rosen et al., 2000)
21
In addition ADD1/SREBP1c, a member of the basic helix-loop-helix leucine zipper
transcription factor class, promotes lipogenic gene expression and stimulates production
of an unidentified PPARγ ligand (Dowell et al., 2000). ADD1/SREBP1 can activate
PPARγ by inducing its expression as well as by promoting the production of an
endogenous PPARγ ligand. Thus, C/EBPα, PPARγ and ADD1/SREBP1 cooperatively
promote adipogenesis and subsequent maintenance of the adipocyte phenotype (Rosen et
al., 2000).
Thiazolidinediones (TZDs) are structurally related agents used for the treatment of type II
diabetes. In addition to improving glucose metabolic insulin sensitivity and reducing the
requirement for insulin, these agents impressively reduce hypertriglyceridemia and have
been reported to lower plasma free fatty acid (FFA) levels in various animal models of
insulin resistance. Despite the fact that these compounds have been studied for almost 20
years, the in vivo mechanisms of insulin-sensitization remain unclear. Improvements in
glucoregulation may occur via their action on lipid metabolism; a body of evidence
suggests that an oversupply of fatty acids to insulin-sensitive target tissues, particularly
liver and skeletal muscle, contributes to the development of insulin resistance. Treatment-
induced reductions in fatty acid availability may thus contribute to the insulin-sensitizing
effects of these compounds (Oakes et al., 2001).
TZDs may exert their effects via ligand activation of PPARγ, which is primarily
expressed in adipose tissue. PPARγ activation contributes to the triggering of
differentiation of preadipocytes and induces expression of genes involved in the transport
and sequestration of FFA. These cellular and molecular effects of PPARγ agonism could
influence FFA exchange between adipose and other tissues, but direct evidence based on
measurements of in vivo fluxes and the metabolic fate of FFA are lacking (Oakes et al.,
2001).
Compounds that bind to and activate the PPARγ subunit of the PPARγ - RXR nuclear
receptor heterodimer alter transcription of genes involved in glucose and lipid
metabolism. Included in these target genes are lipid transporters (CD36, aquaporin), key
22
metabolic enzymes (lipoprotein lipase, phosphoenolpyruvate carboxykinase, uncoupling
protein-1), adipocyte-enriched signaling molecules (leptin, resistin, ACRP30,
FIAF/PGAR), lipid-modulated nuclear receptors (LXRα), and an intermediate in the
insulin signaling pathway (c-Cbl-associating protein) (Forman, 2002). TZD treatment
therefore results in expression of a number of adipocyte-specific genes so that PPARγ
activation and/or overexpression is essentially associated with adipose-cell differentiation
and adipogenesis. Therefore, the clinical observations that treatment with TZDs improves
insulin-stimulated glucose uptake (muscle) and endogenous (essentially hepatic) glucose
production while PPARγ is mainly expressed in fat cells makes it difficult to link cellular
and metabolic mechanisms of action. In addition, considering the well known connection
between obesity and insulin resistance, it seems paradoxical that an agent that promotes
adipogenesis should improve insulin sensitivity (Matthaei et al., 2000).
A number of hypothetical schemas to reconcile these apparent quandaries and explain the
overall mode of action of TZDs have been put forward. First, the minute quantities of
PPARγ expressed in muscle may be sufficient or alternatively might be induced during
treatment with TZDs, leading to a direct PPARγ-mediated response. Second, the effect of
TZDs may also be mediated by FFA, which have been shown to interfere with muscle
glucose metabolism and contribute to the impaired insulin-stimulated glucose. Since
TZDs have been shown to selectively stimulate lipogenic activities in fat cells, a
TZD/PPARγ-mediated “fatty-acid-steal phenomenon” has been proposed leaving less
FFAs available for muscle. Third, TZDs have been shown to reduce expression levels in
fat cells of TNFα and leptin, both of which have been implicated in obesity-related
insulin resistance. Although the definite role of the cytokine TNFα for human insulin
resistance remains to be determined, TNFα has been shown to interfere with proximal
insulin signaling events. In addition, leptin has been shown to impair insulin signaling in
isolated rat adipocytes. Since TZDs have been shown to reduce expression levels of both
TNFα and leptin, in fat cells, they could contribute to alleviating obesity-related insulin
resistance. Which of these mechanisms plays the most important role in vivo is unclear at
23
present, but since they are not mutually exclusive all of them may be involved (Matthaei
et al., 2000)
It is evident that there are a number of critical gaps in our understanding of the type II-
PPARγ connection. For example, PPARγ is required for adipogenesis and its synthetic
agonists increase adipose mass in vivo. This is unexpected, since insulin resistance
worsens in most patients as fat mass increases. Therefore the question raised is how an
adipogenic agent can also act as an antidiabetic agent. The PPARγ ligand deficiency
hypothesis claims to provide the answer to this particular unresolved matter. LG754
defines a new class of nuclear receptor agonist that has minimal coactivator recruitment
activity and therefore minimal inherent transcriptional activity. Instead, this compound
activates transcription by allosterically enhancing the ligand binding activity of its partner
receptor, PPARγ. LG754 therefore represents the first example of a nuclear receptor-
sensitizing agent. As well as being a PPARγ sensitizer, it has been found that LG754
relieves insulin resistance in vivo. These findings have important implications, since the
molecular events that result in insulin resistance remain obscure. PPARγ agonists have
the interesting property of lowering blood glucose in diabetic animals but not in non-
diabetic animals. This implies that PPARγ ligands reverse or replace a deficiency that is
unique to the diabetic state. It is speculated that insulin resistance arises from a relative
deficiency in endogenous PPARγ and that PPARγ agonists are antidiabetic agents,
because they correct this deficiency (Forman, 2002).
Although the identity of the endogenous PPARγ ligand is unknown, it is known that the
transcription factor ADD1/SREBP1c is required to produce an endogenous ligand in
adipocytes. It has been shown that SREBP-1c levels are lower in obesity, suggesting that
the obese state may be associated with a corresponding decrease in endogenous PPARγ
ligands. While this response may provide short term benefits, a chronic deficiency in
PPARγ ligands eventually lead to the development of insulin resistance (Forman, 2002).
24
1.4.1.4) Insulin
The primary goal in the treatment of diabetes mellitus is to prevent the development of
the metabolic abnormalities experienced by diabetics. For many diabetics, the goal can be
realized only by supplemental or replacement insulin therapy. Insulin is required by type
II diabetics who cannot be maintained adequately on oral hypoglycaemic agents or
dietary regulation. No single insulin preparation or combination of preparations can
successfully meet the demands of such a diverse group. Consequently, a large number of
insulin preparations have been developed, each of which has certain advantages and
disadvantages. Although all of these preparations consist primarily of insulin and exhibit
the biologic effects of insulin, they do differ in their onset and duration of action.
Accordingly, they are classified on the basis of their duration of action into short (usual
onset 0.5-2 hours; usual duration 3-6 hours), intermediate (usual onset 3-6 hours; usual
duration 12-20 hours) and long-acting categories (usual onset 6-12 hours; usual duration
18-36 hours). The time course of action of any insulin may vary considerably in different
individuals, or at different times of day in the same individual. Consequently, these time
courses should be considered only as general guidelines (Foye et al., 1995).
1.5 Plants and the treatment of Diabetes Mellitus Medicinal plants have been part of the great healing traditions around the world going
back thousands of years. The World Health Organisation (WHO) defines traditional
medicine as health practices, approaches, knowledge and beliefs incorporating plant,
animal and mineral based medicines, spiritual therapies, manual techniques applied
singularly or in combination to treat, diagnose and prevent illness or maintain well-being.
In 2002 WHO launched its first comprehensive traditional medicine strategy to assist
efforts to promote affordable, effective and safe use of traditional medicine and
complimentary alternative medicine. In Africa, traditional medicine is used by up to 80%
of the population to meet primary healthcare needs and is crucial in the fight against
diseases. The ratio of a conventional, or western-trained general practitioner to patients is
1:20 000, whereas the availability of traditional medicine practitioners is 1:200 to 1:400.
25
This highlights the need for reliable and affordable herbal medicines that are locally
available (www.i-sis.org.uk/). More than 1123 species of plants have been used
enthnopharmacologically or experimentally to treat symptoms of diabetes mellitus. These
are very large and widely distributed families and the phylogenetic distance between even
this select group is a good indication of the varied nature of the active constituents. It is
therefore necessary to learn more about particular groups of hypoglycaemic natural
products and their mechanism of action before this method of drug discovery can be
successfully employed (Wagner and Farnsworth, 1994). The high percentage of active
plants found probably reflects, at least in part, the great variety of possible active
constituents and mechanism of action.
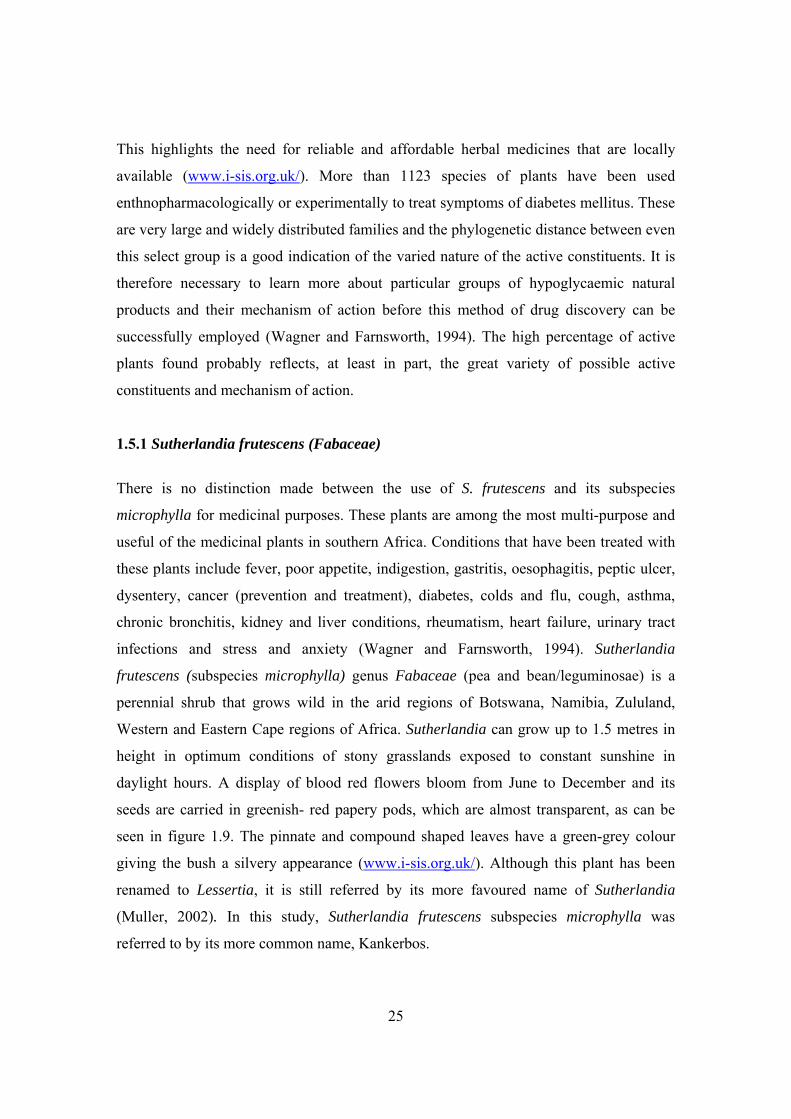
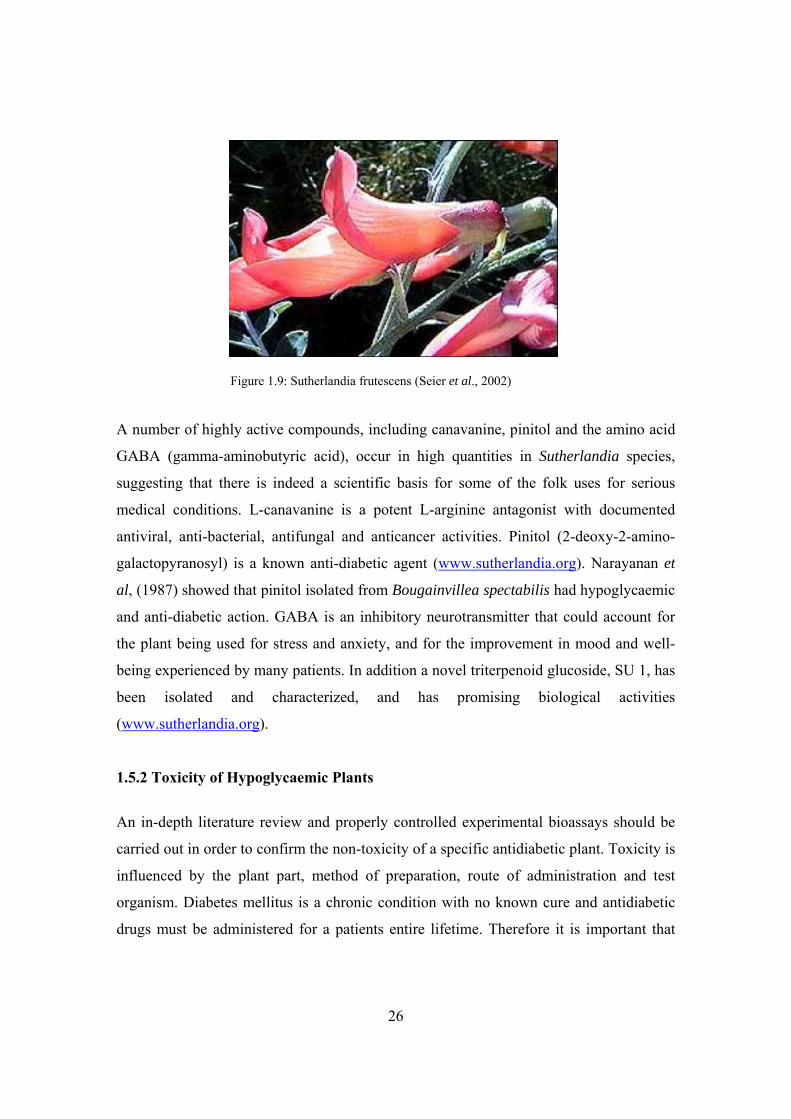
1.5.1 Sutherlandia frutescens (Fabaceae)
There is no distinction made between the use of S. frutescens and its subspecies
microphylla for medicinal purposes. These plants are among the most multi-purpose and
useful of the medicinal plants in southern Africa. Conditions that have been treated with
these plants include fever, poor appetite, indigestion, gastritis, oesophagitis, peptic ulcer,
dysentery, cancer (prevention and treatment), diabetes, colds and flu, cough, asthma,
chronic bronchitis, kidney and liver conditions, rheumatism, heart failure, urinary tract
infections and stress and anxiety (Wagner and Farnsworth, 1994). Sutherlandia
frutescens (subspecies microphylla) genus Fabaceae (pea and bean/leguminosae) is a
perennial shrub that grows wild in the arid regions of Botswana, Namibia, Zululand,
Western and Eastern Cape regions of Africa. Sutherlandia can grow up to 1.5 metres in
height in optimum conditions of stony grasslands exposed to constant sunshine in
daylight hours. A display of blood red flowers bloom from June to December and its
seeds are carried in greenish- red papery pods, which are almost transparent, as can be
seen in figure 1.9. The pinnate and compound shaped leaves have a green-grey colour
giving the bush a silvery appearance (www.i-sis.org.uk/). Although this plant has been
renamed to Lessertia, it is still referred by its more favoured name of Sutherlandia
(Muller, 2002). In this study, Sutherlandia frutescens subspecies microphylla was
referred to by its more common name, Kankerbos.
26
A number of highly active compounds, including canavanine, pinitol and the amino acid
GABA (gamma-aminobutyric acid), occur in high quantities in Sutherlandia species,
suggesting that there is indeed a scientific basis for some of the folk uses for serious
medical conditions. L-canavanine is a potent L-arginine antagonist with documented
antiviral, anti-bacterial, antifungal and anticancer activities. Pinitol (2-deoxy-2-amino-
galactopyranosyl) is a known anti-diabetic agent (www.sutherlandia.org). Narayanan et
al, (1987) showed that pinitol isolated from Bougainvillea spectabilis had hypoglycaemic
and anti-diabetic action. GABA is an inhibitory neurotransmitter that could account for
the plant being used for stress and anxiety, and for the improvement in mood and well-
being experienced by many patients. In addition a novel triterpenoid glucoside, SU 1, has
been isolated and characterized, and has promising biological activities
(www.sutherlandia.org).
1.5.2 Toxicity of Hypoglycaemic Plants
An in-depth literature review and properly controlled experimental bioassays should be
carried out in order to confirm the non-toxicity of a specific antidiabetic plant. Toxicity is
influenced by the plant part, method of preparation, route of administration and test
organism. Diabetes mellitus is a chronic condition with no known cure and antidiabetic
drugs must be administered for a patients entire lifetime. Therefore it is important that
Figure 1.9: Sutherlandia frutescens (Seier et al., 2002)
27
chronic toxicity studies be performed before recommending a plant-derived drug for
antidiabetic therapy (Wagner and Farnsworth, 1994).
An investigation into the possible toxicity of consumption of Sutherlandia leaf powder
(Sutherlandia frutescens subspecies microphylla) in vervet monkeys (Chlorocebus
aethiops), was carried out by determining a variety of biochemical, haematological,
physiological and physical variables. These variables reflected liver, kidney, muscle,
respiratory, intestinal, bone and general biological function. The conclusions referred to
Sutherlandia leaf powder consumption in adult male vervet monkeys for three months.
At the recommended dose, 3x the recommended dose and 9x the recommended dose,
Sutherlandia leaf powder consumption was found not to be associated with toxic or other
side-effects (Seier et al., 2002).
28
Chapter 2
Introduction to the present study
Insulin resistance and non-insulin-dependent diabetes mellitus (type II) have reached
epidemic status in industrialized societies. Over 125 million people worldwide suffer
from type II diabetes, and these individuals face a dramatically increased risk for
developing atherosclerotic heart disease, stroke, renal disease, blindness and limb
amputations. It is thus alarming that the number of type II cases have increased 5-fold in
the past decade, a trend that is predicted to continue. Equally worrisome is that type II,
initially defined as a disease of adult onset, is now appearing in adolescents (Forman,
2002). Type II diabetes is more common than type I and accounts for 90% of diabetic
cases in South Africa. It has been estimated that of the four million diabetics in South
Africa, half remain undiagnosed.
The enormous costs of modern treatment and the evidence that current methods of
treatment fail to achieve the ideals of normoglycaemia and the prevention of diabetic
complications, indicate that alternative strategies for the prevention and treatment of
diabetes must be developed. Due to the fact that almost 90% of people in developing
countries still rely on traditional medicines for their primary health care and the fact that
scientific investigations of traditional medicines have led to the discovery of drugs now
in professional use worldwide, a synthesis of local traditional and modern knowledge and
techniques for the management of diabetes should be feasible (Wagner and Farnsworth,
1994). Therefore indigenous, renewable, medicinal plant resources could prove to be the
practical and cost-efficient alternative that is clearly and desperately needed.
The present study was planned keeping the above issues in mind. The objective of this
project was to optimize the methodology required to screen and determine the
effectiveness of the specific plants as antidiabetic potentiates, through observing if
increases in glucose utilisation and insulin secretion occurred under treatment. Once
optimal methodology is achieved through this specific project, the parameters used to
29
validate the models will in the future be able to be applied to scientifically establish the
antidiabetic effect(s) and mechanism(s) of the plants under investigation.
The cell lines used in this study, namely 3T3-L1 preadipocytes, Chang liver cells, C2C12
muscle cells and INS-1 rat pancreatic cells, were investigated as potential in vitro models
for type II diabetes. Indigenous antidiabetic plants were used as test samples in order to
determine optimal conditions for screening and clearing mechanisms.
30
Chapter 3
Models for glucose utilization
The raison d’etre of the adipocyte is to store energy (in the form of triacylglycerol) for
use during periods of caloric insufficiency. Adipocytes first appear late in fetal
development preparatory to postnatal life when substantial energy reserve is needed to
survive periods of fasting (Mandrup and Lane, 1997). Adipogenesis has been one of the
most intensely studied models of cellular differentiation. In part this has been because of
the availability of in vitro models that faithfully recapitulate most of the critical aspects of
fat cell formation in vivo. This includes morphological changes, cessation of cell growth,
expression of many lipogenic enzymes, extensive lipid accumulation, and the
establishment of sensitivity to most or all of the key hormones that impact on this cell
type, including insulin (Rosen and Spiegelman, 2000).
3T3-L1 is a continuous mouse strain of 3T3 developed through clonal isolation, which
has a fibroblast-like morphology. Cells undergo a pre-adipose to adipose-like conversion
as they progress from rapidly dividing to a confluent and contact inhibited state
(www.biotech.ist.unige.it/cldb/c173.html). Considerable progress has been made in
understanding the molecular mechanisms of adipocyte biology using the 3T3-L1 cell line
as a model. A large body of evidence shows that differentiation of 3T3 preadipocytes
faithfully mimics the in vivo process giving rise to cells that possess virtually all the
biochemical and morphological characteristics of adipocytes. 3T3-L1 cells propagated
under normal conditions have a fibroblastic phenotype. However, when treated with a
combination of dexamethasone (DEX), isobutylmethylxanthine (IBMX) and insulin,
3T3-L1 cells adopt a rounded phenotype and within 5 days begin to accumulate lipids
intracellularly in the form of lipid droplets. Treatment of cells with DEX activates the
transcription factor CCAAT/enhancer-binding protein b (C/EBPb). IBMX inhibits
soluble cyclic nucleotide phosphodiesterases and results in increased intracellular cAMP
levels (Elks and Manganiello, 1985). At the nuclear level, treatment with IBMX results in
activation of the related transcription factor C/EBPd. C/EBPb and d in turn induce
31
transcription of C/EBPα and PPARγ. Within 3 days of exposure to inducers, the cells
undergo two rounds of mitosis, termed mitotic clonal expansion, which are required for
differentiation. Insulin or insulin-like growth factor-1 promote adipocyte differentiation
by activating PI3-kinase and Akt activity. Modulation of the activity of the forkhead
transcription factor Foxo1 appears to be necessary for insulin to promote adipocyte
differentiation. C/EBPα and PPARγ direct the final phase of adipogenesis by activating
expression of adipocyte-specific genes, such as fatty acid synthetase, fatty acid binding
protein, leptin and adiponectin. Endogenous negative regulators of adipocyte
differentiation, such as Pref-1 and Wnt-10b, are highly expressed on undifferentiated
3T3-L1 cells, and are down-regulated upon addition of adipogenesis inducers
(www.chemicon.com).
The evolution of glycerol-3-phosphate dehydrogenase (G3PDH) activity as well as of
G3PDH protein and mRNA is used as an indicator of adipocyte differentiation. The
enzyme accumulates to a low extent during culture in the absence of insulin. When
insulin is present, the enzyme level is dramatically increased. DEX accelerates the
insulin-dependent adipose conversion but alone does not ensure the complete
differentiation process (Gaben-Cogneville et al.,1990). IBMX also functions in
accelerating the differentiation of 3T3-L1 preadipocytes. This effect seems to be
mediated by increased cyclic AMP levels (Wiederer and Loffler, 1987). Following
hormonal induction, confluent preadipocytes undergo mitotic clonal expansion, become
growth arrested, and then coordinately express adipocyte gene products (Mandrup and
Lane, 1997).
The C2C12 muscle cell line is a subclone from a myoblast line established from normal
adult C3H mouse leg muscle. The C2C12 cell line differentiates rapidly, forming
contractile myotubes and producing characteristic muscle proteins. Cultures must not be
allowed to become confluent, as this will deplete the myoblastic population in the culture
(Tortorella and Pilch, 2002).
32
Insulin promotes the postprandial clearance of glucose from the blood primarily into
skeletal muscle in both humans and rodents. Glucose transport into skeletal muscle is
regulated by translocation of the glucose transporter GLUT4 from intracellular vesicles to
the plasma membrane (Aslesen et al., 2001). Several lines of independent
experimentation support the notion that insulin-dependent regulation of GLUT4
movement is similar or identical in skeletal muscle and adipocytes. However, GLUT4
translocates in response to exercise and hypoxia in the former and not in the latter tissue.
Insulin-dependent GLUT4 translocation is PI3-kinase dependent in both tissues. Overall,
it is the inability of insulin to promote glucose uptake in skeletal muscle that causes
insulin resistance, and, eventually type II diabetes (Tortorella and Pilch, 2002).
The development of muscle and fat cell lines has facilitated our understanding of the
translocation process, specifically C2C12 and 3T3-L1 cell lines, which are unique in their
expression of the GLUT4 protein. Both of these cell lines undergo differentiation in
culture from myoblasts into myotubes in the case of C2C12 and from fibroblasts into
adipocytes in the case of 3T3-L1. In both models, GLUT4 expression occurs on and after
differentiation into myotubes or adipocytes (Ueyama et al., 1999).
The liver plays a central role in glucose homeostasis. During the postabsorptive and
fasting period, >90% of glucose production is derived from the liver. When glucose
enters the blood following feeding, the liver switches from net glucose production to net
glucose uptake to lessen the rise in blood glucose. Such switching is regulated by raised
blood glucose per se and plasma insulin. One third of an oral glucose load is taken up by
the liver. Glucose uptake by the liver is dependent on the amount of glucose reaching it,
the insulin level within the hepatic sinusoids and a signal generated by portal glucose
delivery. Impaired suppression of hepatic glucose production and a defect in hepatic
glucose uptake in response to the raise in plasma glucose and insulin are major
pathogenesis in fasting and excessive postprandial hyperglycemia, that are common
features in obesity and diabetes (Rutter et al., 2003). Liver cell membranes have non-
insulin-dependent glucose transporters and therefore do not require insulin for glucose
entry. However insulin, acting through intracellular signaling systems, stimulates the
33
liver cell enzymes that promote utilization of glucose for the synthesis of glycogen,
amino acids, proteins and fats, particularly fatty acids. The glucose transporter, GLUT2,
is primarily expressed in hepatocytes. GLUT2 is a low-affinity receptor with a high
turnover rate. These kinetic properties allow GLUT2 to function in the liver where
glucose transport must not be rate limiting for influx or efflux (Medina and Owen, 2002).
The Chang liver cell line is derived from non-malignant human tissue. These cells are
epithelial in morphology and tend to pile up in cultures with high population density
(www.biotech.ist.unige.it).
Plant extracts were tested for potential antidiabetic activity by exposing these three cell
lines (3T3-L1 adipocyte cells, C2C12 muscle cells and Chang liver cells) to the samples
and determining the amount of glucose taken up. Each cell line represents a different in
vivo organ that is known to have an involvement in glucose homeostasis, each with its
own unique metabolic pathways and mechanism of glucose uptake. Therefore in order to
develop a model for determining glucose utilization, all three cell lines were required as
each represents a small part of the complete entity.
3.1 General methods
The methods described in the following sections are the final optimised ones used in the
glucose utilization models.
3.1.1 Maintenance of cell lines
The cells were grown in a humidified atmosphere containing 5% CO2 at 37ºC (Asfari et
al., 1992). The cells were routinely maintained in antibiotic free growth medium which
consisted of RPMI 1640 (Sigma) supplemented with 10% heat-inactivated fetal calf
serum (FCS) (Highveld Biological, SA). Proliferating preadipocytes were refed fresh
growth medium every 2-3 days. For routine maintainance, trypsin in phosphate-buffered
saline without Ca2+ and Mg2+ (PBSA) was used as the treatment to detach the cells from
the culture plate and after 5-10 minute exposure at 37ºC the cells were seeded in growth

34
medium using a split ratio of 1:5. Routine cell counting was carried out using an
improved Neubauer haemocytometer (Superior).
3.1.2 Cytotoxicity Assay A cell suspension was prepared in growth medium to give 4 000 cells per well using a
96-well plate (Nunc). Cells were inoculated in a volume of 200μl per well and 200μl
aliquots of growth medium was added to cell-free wells. The cells were preincubated for
24 hours after which they were fed fresh culture medium containing test compounds and
exposed for 48 hours after which cell survival percentage was determined using the
sulforhodamine B (SRB) assay.
3.1.3 Sulforhodamine B Assay Determination of cell growth and cell viability was performed by in situ fixation of cells,
followed by staining with a protein-binding dye, sulforhodamine B (SRB) (Sigma). The
SRB binds to the basic amino acids of cellular macromolecules; the solubilized stain is
measured spectrophotometrically to determine relative cell growth (Monks et al., 1991).
After 48 hours incubation with plant extract/medicine, 50μl cold 50% TCA (4ºC) was
added on top of the growth medium in each well (final concentration 10%) and an
incubation period of 1 hour at 4ºC followed. After removal of the contents of all the
wells, the plate was washed five times with tap water and air-dried. 100μl of 0.4% SRB
(w/v in 1% acetic acid) was added to all the wells and incubated for 10 minutes at room
temperature. The plate was then washed four times with 1% acetic acid to remove
unbound dye and air-dried until no moisture was visible. The plates could then be stored
for a period of up to 7 days or processed immediately as follows: 100μl 10mM Tris base
(pH 10.5) was added to solubilise the bound stain and the 96-well plate was placed on the
shaker for 5 minutes. Optical densities were read using the Multiscan MS microtiter plate
reader (Labsystem Multiscan MS, 665 Dosimat) at 540nm.
35
3.1.4 Glucose oxidase assay
The amount of glucose taken up by the cells in each experiment was indirectly measured
by assaying the amount of glucose remaining in the incubation medium using a glucose
oxidase kit (Glu-cinet®, Bayer), after a limited incubation time.
3.1.5 Cell viability assay
Due to the variability of cell numbers in different wells, the viability of the cells in each
well in each experiment should be determined so that any significant difference between
the cells exposed to the treatments compared to the control wells under chronic
conditions can be determined. The CellTiter-BlueTM viability assay kit (Promega, USA)
was used in accordance with the instruction manual protocol. This assay uses resazurin
(indicator dye) to measure the metabolic capacity of cells, thereby indicating cell
viability.
3.2 3T3-L1 cell line The 3T3-L1 preadipocyte cell line, used in the present study, was obtained from the
American Type Culture Collection (ATCC) through Highveld Biological (Johannesburg,
South Africa).
3.2.1 Induction of 3T3-L1 preadipocyte differentiation
Cells were plated at a density of 12 000 cells/well in 24-well plates, which were coated
with poly-L-lysine (PLL) (procedure described in section 4.1.1.3) and incubated for 24
hours in the above growth medium (section 3.1.1). On day 1, the growth medium was
replaced by supplemented medium, which consisted of RPMI 1640, supplemented with
10% FCS, 10 µg insulin/ml, 10-8 M DEX, 0.1mM IBMX and the appropriate plant extract
(Kankerbos or MRC2003). Cells were refed 48 hours later with the same supplemented
medium and after another 24 hours (day 4), this medium was removed and replaced with
growth medium including the plant extracts. After a further 48 hour incubation (day 6),
the cells were assayed in their appropriate experiments.
36
3.2.2 Adipocyte differentiation assays
This assay was used as the method of measuring the degree of fat cell differentiation.
3.2.2.1 Glycerol-3-phosphate dehydrogenase assay
In this assay glycerol-3-phosphate dehydrogenase (G3PDH) acts by reducing
dihydroxyacetone phosphate (DHAP) to glycerol-3-phosphate and at the same time there
is oxidation of the cofactor NADH to NAD+, which can be followed at 340nm (Wise and
Green, 1979). 3T3-L1 cells were grown and subcultured in 24-well plates, after which
they were harvested at 4ºC by the addition of 250μl Tris buffer (pH 7.5, containing 1mM
EDTA) and scraping the bottom of each well. Once the cells were suspended and
homogenized using a Dounce homogeniser with a Teflon pestle, the homogenate of each
separate well was transferred to individual eppendorfs and microfuged at 4ºC for 5min.
The pellet formed contained cell debris and the supernatant was collected for further
assaying.
The substrate was prepared by adding 0.5g wet weight of a Dowex-50 (H+) cation
exchange resin to 25mg cyclohexylammonium dihydroxyacetone phosphate dimethyl
ketal dissolved in 2ml water. This mixture was swirled for 30s and then the resin was
allowed to settle. The supernatant was removed and incubated at 40ºC for 4 hours at
which time the ketal was hydrolysed. The pH was then increased to 4.5 with a saturated
sodium bicarbonate solution.
To assay the supernatant for G3PDH activity, the following substances were sequentially
introduced into a microcuvette: 325µl water (37ºC); 50μl TEA buffer (pH 7.5, containing
6.66ml triethylamine, 3.6µl 2-mercaptoethanol and 420mg EDTA in 50ml water) (37ºC);
100µl sample supernatant (4ºC). The reaction was initiated by addition of 20µl DHAP
(4ºC). After rapid but gentle mixing, the cuvette was immediately placed in the 37ºC
heating mantle of a spectrophotometer and the decrease in absorption at 340nm followed
against air.
37
3.2.3 Protein concentration determination
Protein concentration was determined for calculation of the specific activity of the
enzyme, G3PDH. The protein concentration of the samples was determined using an
adapted Folin-Lowry method for microtiter plates.
3.2.3.1 Adapted Folin method for microtiter plates
A 2mg/ml BSA stock solution was prepared and diluted 10x on the day of use to prepare
the dilutions for the protein standard curve. The 0.2mg/ml sample was serially diluted to
give 6 points on the standard curve.
The procedure involved addition of 100μl serially diluted standard or sample (controls
contained 100µl of 25mM Tris buffer, pH 7.4, containing 1mM EDTA) and 25µl copper-
tartrate-alkaline solution. This was mixed and incubated for 10min at room temperature.
10µl diluted Folin-Ciocalteau phenol reagent (1:1 with 0.1 N NaOH) was added, mixed
and a further incubation period of 20min at room temperature followed. The absorbance
was read at 600nm on a microplate reader.
3.2.4 Glucose Uptake 3T3-L1 cells were grown and differentiated into adipocytes in medium which consisted
of RPMI 1640, supplemented with 10% FCS, 10 µg insulin/ml, 10-8 M DEX, 0.1mM
IBMX and the appropriate test compound or plant extract. The final method was not
achieved, however the reasons and explanations are discussed in section 3.6.1.3.
3.3 C2C12 cell line 3.3.1 Glucose uptake
The C2C12 skeletal muscle cell line was purchased from Highveld Biological
(Johannesburg, South Africa) and passage 8 to 11 was used in this study. Prior to this, a
previous study had been carried out and the growth and differentiation conditions of this
cell line had been optimised (Askew, 2003). It was determined that after being cultured in
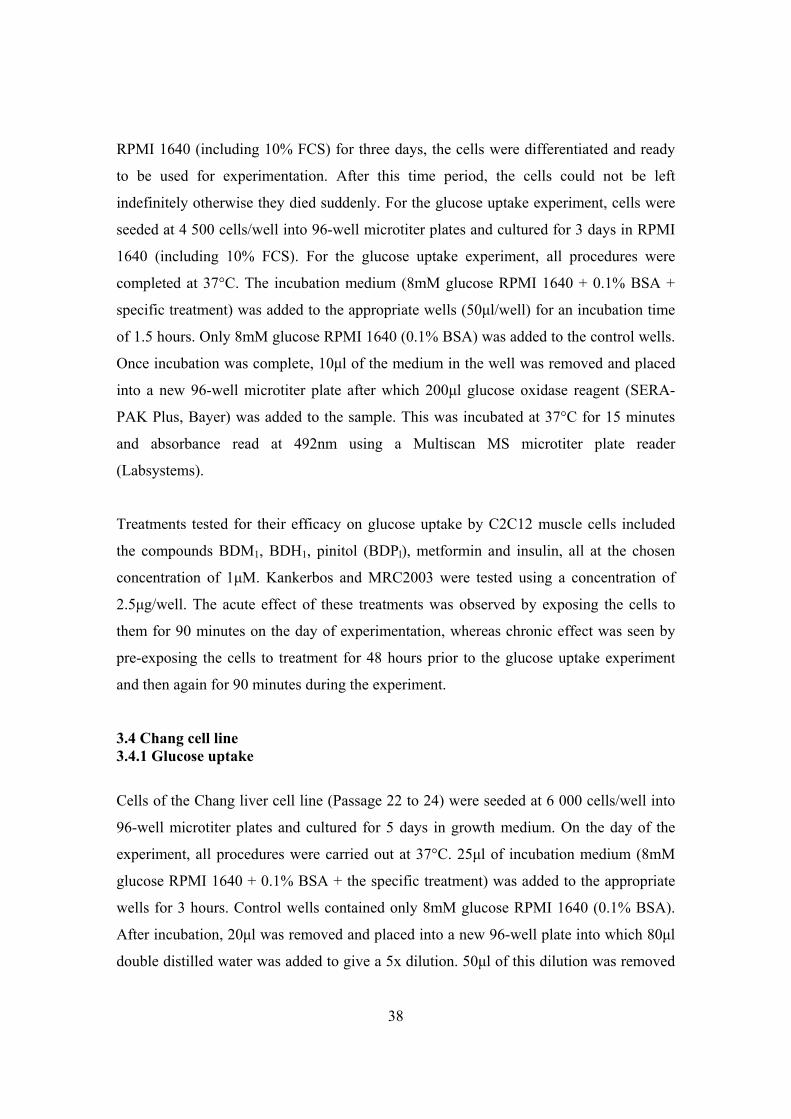
38
RPMI 1640 (including 10% FCS) for three days, the cells were differentiated and ready
to be used for experimentation. After this time period, the cells could not be left
indefinitely otherwise they died suddenly. For the glucose uptake experiment, cells were
seeded at 4 500 cells/well into 96-well microtiter plates and cultured for 3 days in RPMI
1640 (including 10% FCS). For the glucose uptake experiment, all procedures were
completed at 37°C. The incubation medium (8mM glucose RPMI 1640 + 0.1% BSA +
specific treatment) was added to the appropriate wells (50μl/well) for an incubation time
of 1.5 hours. Only 8mM glucose RPMI 1640 (0.1% BSA) was added to the control wells.
Once incubation was complete, 10μl of the medium in the well was removed and placed
into a new 96-well microtiter plate after which 200μl glucose oxidase reagent (SERA-
PAK Plus, Bayer) was added to the sample. This was incubated at 37°C for 15 minutes
and absorbance read at 492nm using a Multiscan MS microtiter plate reader
(Labsystems).
Treatments tested for their efficacy on glucose uptake by C2C12 muscle cells included
the compounds BDM1, BDH1, pinitol (BDPl), metformin and insulin, all at the chosen
concentration of 1μM. Kankerbos and MRC2003 were tested using a concentration of
2.5μg/well. The acute effect of these treatments was observed by exposing the cells to
them for 90 minutes on the day of experimentation, whereas chronic effect was seen by
pre-exposing the cells to treatment for 48 hours prior to the glucose uptake experiment
and then again for 90 minutes during the experiment.
3.4 Chang cell line 3.4.1 Glucose uptake
Cells of the Chang liver cell line (Passage 22 to 24) were seeded at 6 000 cells/well into
96-well microtiter plates and cultured for 5 days in growth medium. On the day of the
experiment, all procedures were carried out at 37°C. 25μl of incubation medium (8mM
glucose RPMI 1640 + 0.1% BSA + the specific treatment) was added to the appropriate
wells for 3 hours. Control wells contained only 8mM glucose RPMI 1640 (0.1% BSA).
After incubation, 20μl was removed and placed into a new 96-well plate into which 80μl
double distilled water was added to give a 5x dilution. 50μl of this dilution was removed
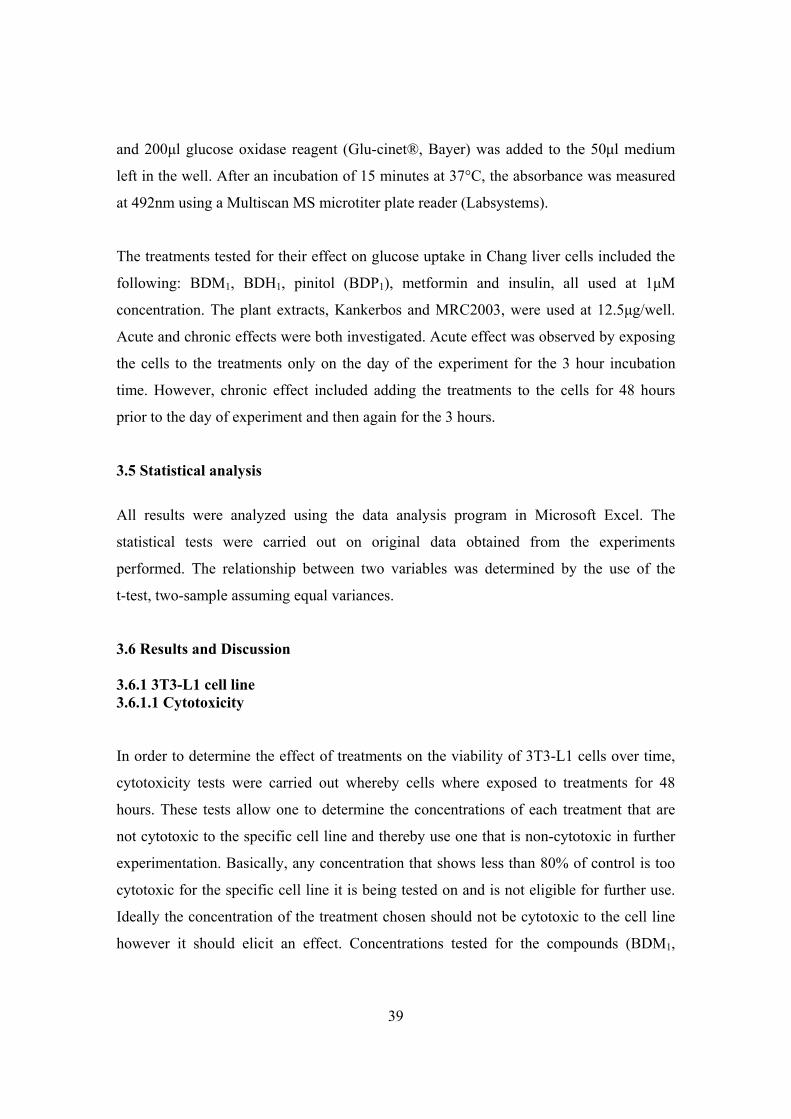
39
and 200μl glucose oxidase reagent (Glu-cinet®, Bayer) was added to the 50μl medium
left in the well. After an incubation of 15 minutes at 37°C, the absorbance was measured
at 492nm using a Multiscan MS microtiter plate reader (Labsystems).
The treatments tested for their effect on glucose uptake in Chang liver cells included the
following: BDM1, BDH1, pinitol (BDP1), metformin and insulin, all used at 1μM
concentration. The plant extracts, Kankerbos and MRC2003, were used at 12.5μg/well.
Acute and chronic effects were both investigated. Acute effect was observed by exposing
the cells to the treatments only on the day of the experiment for the 3 hour incubation
time. However, chronic effect included adding the treatments to the cells for 48 hours
prior to the day of experiment and then again for the 3 hours.
3.5 Statistical analysis
All results were analyzed using the data analysis program in Microsoft Excel. The
statistical tests were carried out on original data obtained from the experiments
performed. The relationship between two variables was determined by the use of the
t-test, two-sample assuming equal variances.
3.6 Results and Discussion 3.6.1 3T3-L1 cell line 3.6.1.1 Cytotoxicity
In order to determine the effect of treatments on the viability of 3T3-L1 cells over time,
cytotoxicity tests were carried out whereby cells where exposed to treatments for 48
hours. These tests allow one to determine the concentrations of each treatment that are
not cytotoxic to the specific cell line and thereby use one that is non-cytotoxic in further
experimentation. Basically, any concentration that shows less than 80% of control is too
cytotoxic for the specific cell line it is being tested on and is not eligible for further use.
Ideally the concentration of the treatment chosen should not be cytotoxic to the cell line
however it should elicit an effect. Concentrations tested for the compounds (BDM1,
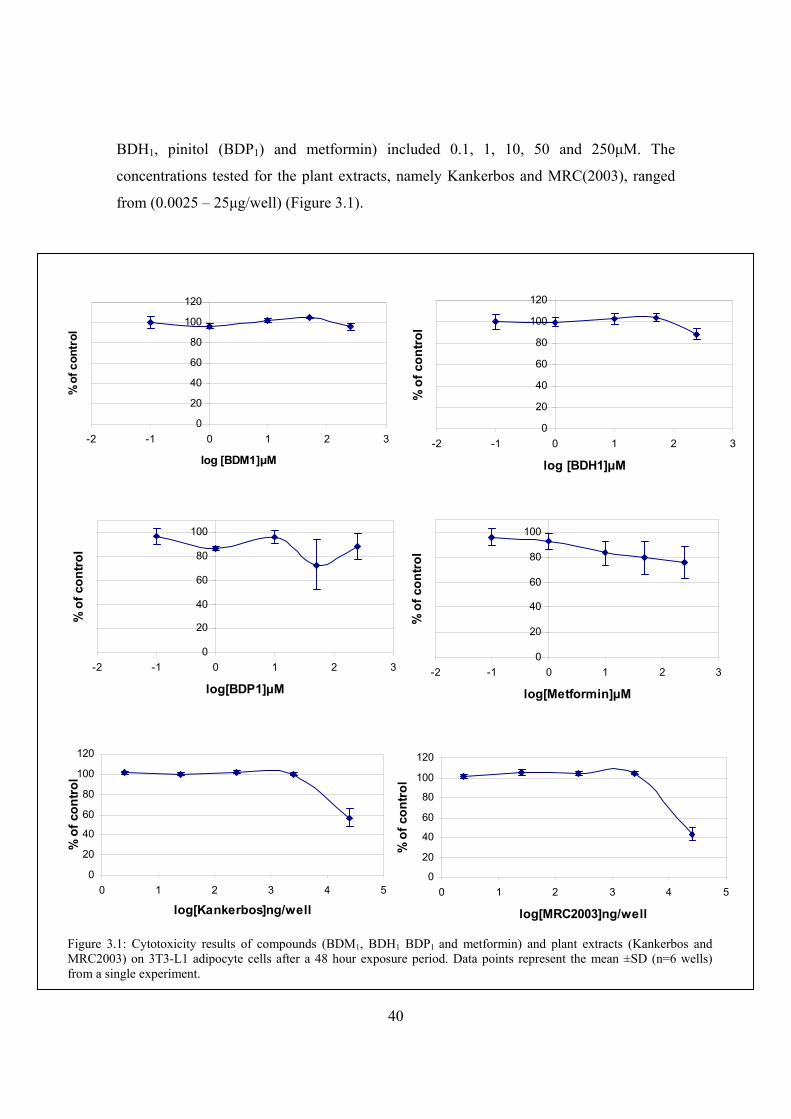
40
BDH1, pinitol (BDP1) and metformin) included 0.1, 1, 10, 50 and 250μM. The
concentrations tested for the plant extracts, namely Kankerbos and MRC(2003), ranged
from (0.0025 – 25μg/well) (Figure 3.1).
0
20
40
60
80
100
120
-2 -1 0 1 2 3
log [BDM1]μM
% o
f con
trol
0
20
40
60
80
100
120
-2 -1 0 1 2 3
log [BDH1]μM
% o
f con
trol
0
20
40
60
80
100
-2 -1 0 1 2 3
log[BDP1]μM
% o
f con
trol
0
20
40
60
80
100
-2 -1 0 1 2 3
log[Metformin]μM
% o
f con
trol
0
20
40
60
80
100
120
0 1 2 3 4 5
log[MRC2003]ng/well
% o
f con
trol
Figure 3.1: Cytotoxicity results of compounds (BDM1, BDH1 BDP1 and metformin) and plant extracts (Kankerbos and MRC2003) on 3T3-L1 adipocyte cells after a 48 hour exposure period. Data points represent the mean ±SD (n=6 wells) from a single experiment.
0
20
40
60
80
100
120
0 1 2 3 4 5
log[Kankerbos]ng/well
% o
f con
trol
41
In figure 3.1, the compounds (BDM1 and BDH1) showed no cytotoxic effect on the 3T3-
L1 cell line. The concentrations of BDP1 showed varied results for percentage control and
metformin was only cytotoxic to the cells at 250μM. For these compounds, no significant
cytotoxicity was seen and it was decided that all further experimentation carried out with
3T3-L1 cells would be done so at a concentration of 1μM. For the plant extracts
(Kankerbos and MRC2003) only the cells exposed to the highest concentration of
25μg/well showed signs of cytotoxicity. All results shown for the plant extracts are
μg/well, however a conversion table showing the μg/ml values is shown in Appendix 1
3.6.1.2 Glycerol-3-phosphate dehydrogenase activity
As the 3T3-L1 cells differentiated, observations were an alteration in cell shape and the
accumulation of lipid droplets in the cytoplasm. Samples tested included Kankerbos
(12.5μg/well/1ml) and MRC (12.5μg/well/1ml) plant extracts and the control included
cells not exposed to any form of treatment other than inducers where applicable. Once the
cells had reached confluency, the inducers of differentiation (insulin, DEX and IBMX)
were added for 3 days to the appropriate cells. After this they were removed and the cells
fed without inducers for another 7 days.
The glycerol-3-phosphate dehydrogenase assay functions in measuring fat cell
differentiation. The reason for using this enzymatic assay is because G3PDH is an
intermediatory enzyme in the pathway by which triacylglycerols are formed, therefore
before fat droplets form the presence of G3PDH is detectable. G3PDH reduces DHAP to
G-3-P and corresponding to this reduction, NADH is oxidized to NAD+. With the
oxidation is a decrease in absorbance at 340nm and by using the slope of this decrease,
one can calculate the enzyme activity. Determination of protein concentration then
enables one to finally calculate the specific activity of G3PDH.
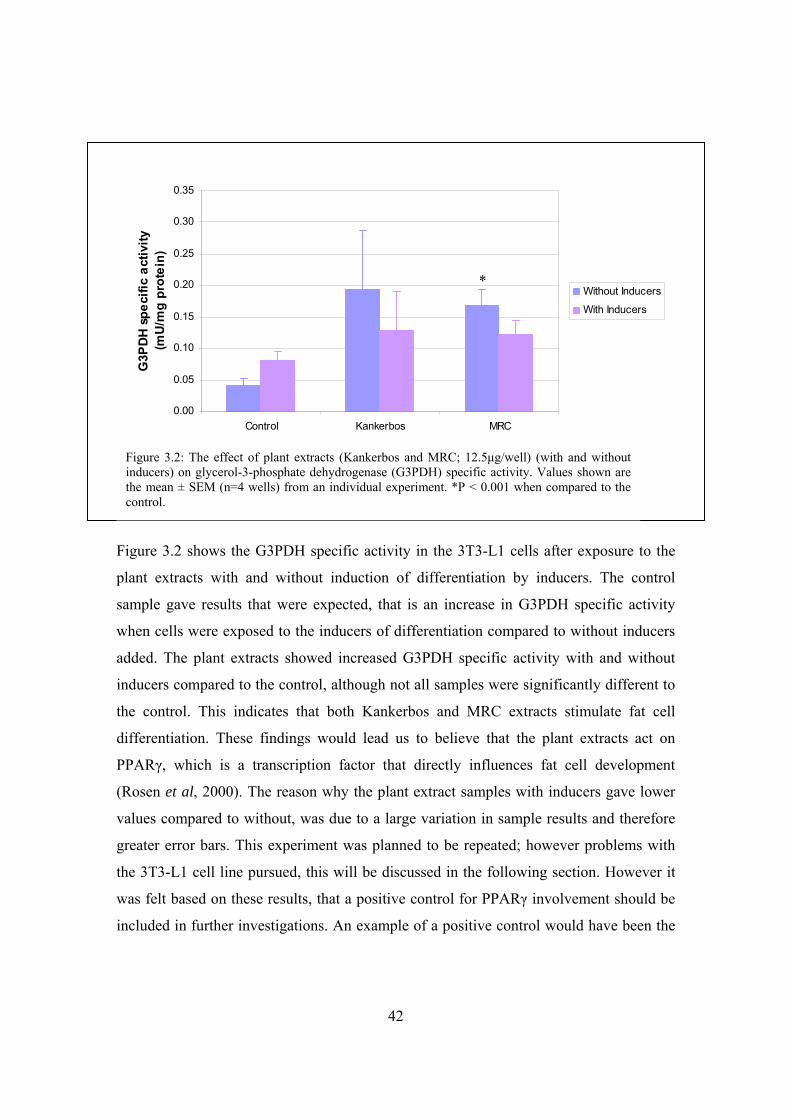
42
Figure 3.2 shows the G3PDH specific activity in the 3T3-L1 cells after exposure to the
plant extracts with and without induction of differentiation by inducers. The control
sample gave results that were expected, that is an increase in G3PDH specific activity
when cells were exposed to the inducers of differentiation compared to without inducers
added. The plant extracts showed increased G3PDH specific activity with and without
inducers compared to the control, although not all samples were significantly different to
the control. This indicates that both Kankerbos and MRC extracts stimulate fat cell
differentiation. These findings would lead us to believe that the plant extracts act on
PPARγ, which is a transcription factor that directly influences fat cell development
(Rosen et al, 2000). The reason why the plant extract samples with inducers gave lower
values compared to without, was due to a large variation in sample results and therefore
greater error bars. This experiment was planned to be repeated; however problems with
the 3T3-L1 cell line pursued, this will be discussed in the following section. However it
was felt based on these results, that a positive control for PPARγ involvement should be
included in further investigations. An example of a positive control would have been the
0.00
0.05
0.10
0.15
0.20
0.25
0.30
0.35
Control Kankerbos MRC
G3P
DH
spec
ific
activ
ity
(mU
/mg
prot
ein)
Without Inducers
With Inducers
Figure 3.2: The effect of plant extracts (Kankerbos and MRC; 12.5μg/well) (with and without inducers) on glycerol-3-phosphate dehydrogenase (G3PDH) specific activity. Values shown are the mean ± SEM (n=4 wells) from an individual experiment. *P < 0.001 when compared to the control.
*
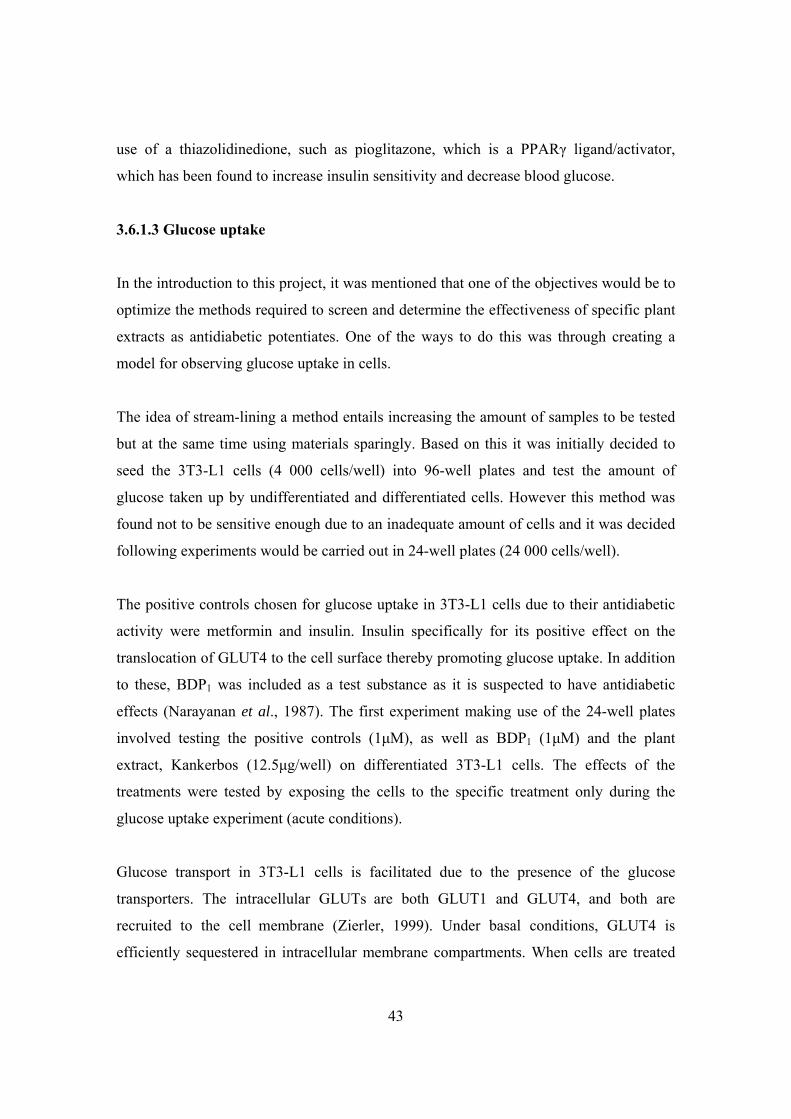
43
use of a thiazolidinedione, such as pioglitazone, which is a PPARγ ligand/activator,
which has been found to increase insulin sensitivity and decrease blood glucose.
3.6.1.3 Glucose uptake
In the introduction to this project, it was mentioned that one of the objectives would be to
optimize the methods required to screen and determine the effectiveness of specific plant
extracts as antidiabetic potentiates. One of the ways to do this was through creating a
model for observing glucose uptake in cells.
The idea of stream-lining a method entails increasing the amount of samples to be tested
but at the same time using materials sparingly. Based on this it was initially decided to
seed the 3T3-L1 cells (4 000 cells/well) into 96-well plates and test the amount of
glucose taken up by undifferentiated and differentiated cells. However this method was
found not to be sensitive enough due to an inadequate amount of cells and it was decided
following experiments would be carried out in 24-well plates (24 000 cells/well).
The positive controls chosen for glucose uptake in 3T3-L1 cells due to their antidiabetic
activity were metformin and insulin. Insulin specifically for its positive effect on the
translocation of GLUT4 to the cell surface thereby promoting glucose uptake. In addition
to these, BDP1 was included as a test substance as it is suspected to have antidiabetic
effects (Narayanan et al., 1987). The first experiment making use of the 24-well plates
involved testing the positive controls (1μM), as well as BDP1 (1μM) and the plant
extract, Kankerbos (12.5μg/well) on differentiated 3T3-L1 cells. The effects of the
treatments were tested by exposing the cells to the specific treatment only during the
glucose uptake experiment (acute conditions).
Glucose transport in 3T3-L1 cells is facilitated due to the presence of the glucose
transporters. The intracellular GLUTs are both GLUT1 and GLUT4, and both are
recruited to the cell membrane (Zierler, 1999). Under basal conditions, GLUT4 is
efficiently sequestered in intracellular membrane compartments. When cells are treated
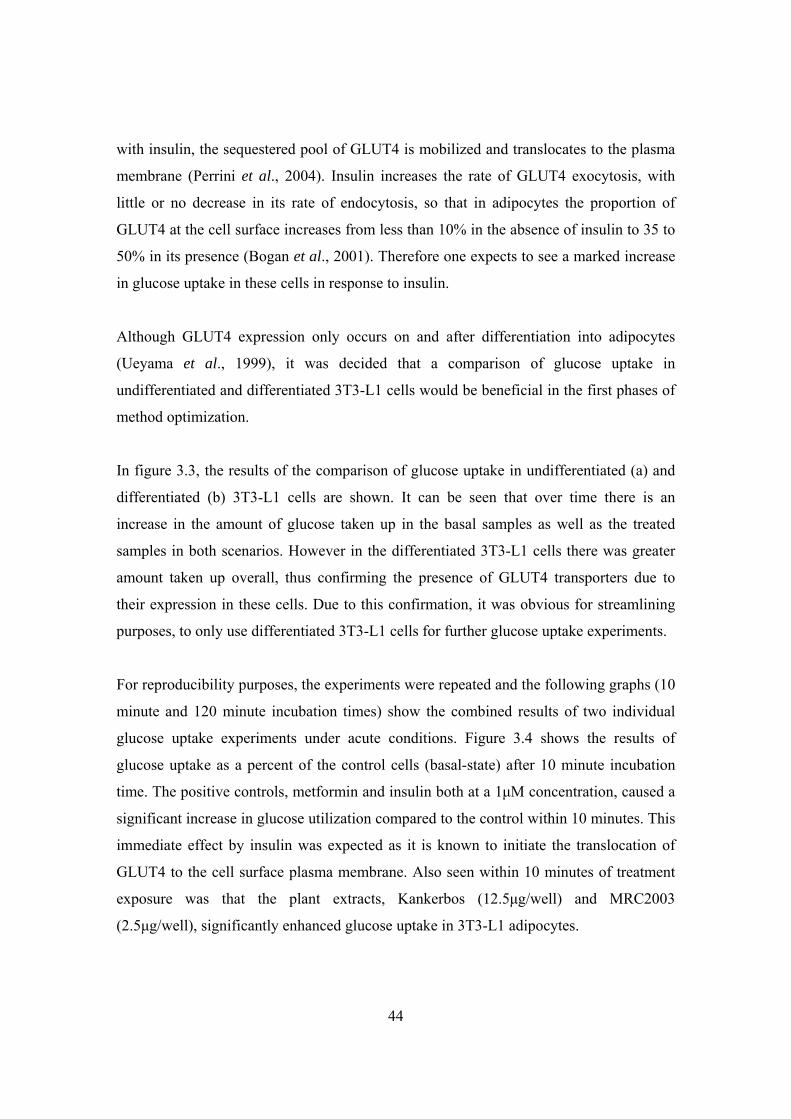
44
with insulin, the sequestered pool of GLUT4 is mobilized and translocates to the plasma
membrane (Perrini et al., 2004). Insulin increases the rate of GLUT4 exocytosis, with
little or no decrease in its rate of endocytosis, so that in adipocytes the proportion of
GLUT4 at the cell surface increases from less than 10% in the absence of insulin to 35 to
50% in its presence (Bogan et al., 2001). Therefore one expects to see a marked increase
in glucose uptake in these cells in response to insulin.
Although GLUT4 expression only occurs on and after differentiation into adipocytes
(Ueyama et al., 1999), it was decided that a comparison of glucose uptake in
undifferentiated and differentiated 3T3-L1 cells would be beneficial in the first phases of
method optimization.
In figure 3.3, the results of the comparison of glucose uptake in undifferentiated (a) and
differentiated (b) 3T3-L1 cells are shown. It can be seen that over time there is an
increase in the amount of glucose taken up in the basal samples as well as the treated
samples in both scenarios. However in the differentiated 3T3-L1 cells there was greater
amount taken up overall, thus confirming the presence of GLUT4 transporters due to
their expression in these cells. Due to this confirmation, it was obvious for streamlining
purposes, to only use differentiated 3T3-L1 cells for further glucose uptake experiments.
For reproducibility purposes, the experiments were repeated and the following graphs (10
minute and 120 minute incubation times) show the combined results of two individual
glucose uptake experiments under acute conditions. Figure 3.4 shows the results of
glucose uptake as a percent of the control cells (basal-state) after 10 minute incubation
time. The positive controls, metformin and insulin both at a 1μM concentration, caused a
significant increase in glucose utilization compared to the control within 10 minutes. This
immediate effect by insulin was expected as it is known to initiate the translocation of
GLUT4 to the cell surface plasma membrane. Also seen within 10 minutes of treatment
exposure was that the plant extracts, Kankerbos (12.5μg/well) and MRC2003
(2.5μg/well), significantly enhanced glucose uptake in 3T3-L1 adipocytes.
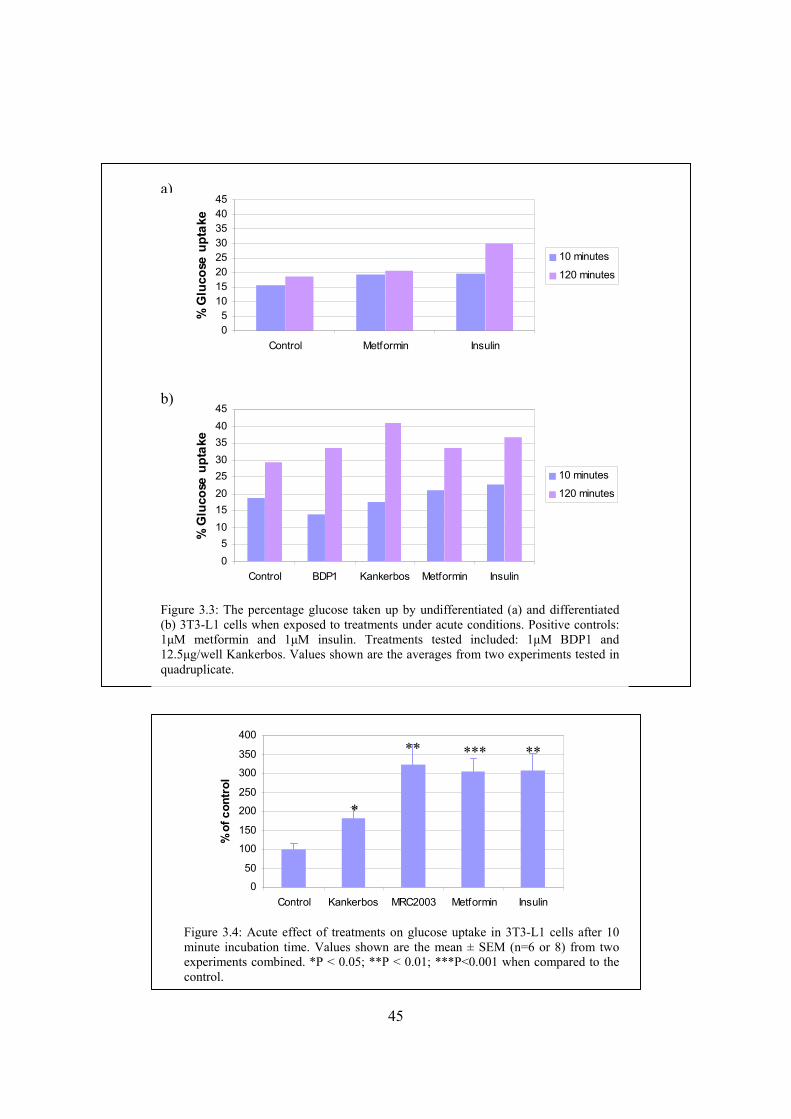
45
0
50
100
150
200
250
300
350
400
Control Kankerbos MRC2003 Metformin Insulin
% o
f con
trol
Figure 3.4: Acute effect of treatments on glucose uptake in 3T3-L1 cells after 10 minute incubation time. Values shown are the mean ± SEM (n=6 or 8) from two experiments combined. *P < 0.05; **P < 0.01; ***P<0.001 when compared to the control.
*
Figure 3.3: The percentage glucose taken up by undifferentiated (a) and differentiated (b) 3T3-L1 cells when exposed to treatments under acute conditions. Positive controls: 1μM metformin and 1μM insulin. Treatments tested included: 1μM BDP1 and 12.5μg/well Kankerbos. Values shown are the averages from two experiments tested in quadruplicate.
05
1015202530354045
Control Metformin Insulin
% G
luco
se u
ptak
e
10 minutes
120 minutes
05
1015202530354045
Control BDP1 Kankerbos Metformin Insulin
% G
luco
se u
ptak
e
10 minutes
120 minutes
a)
b)
** *** **
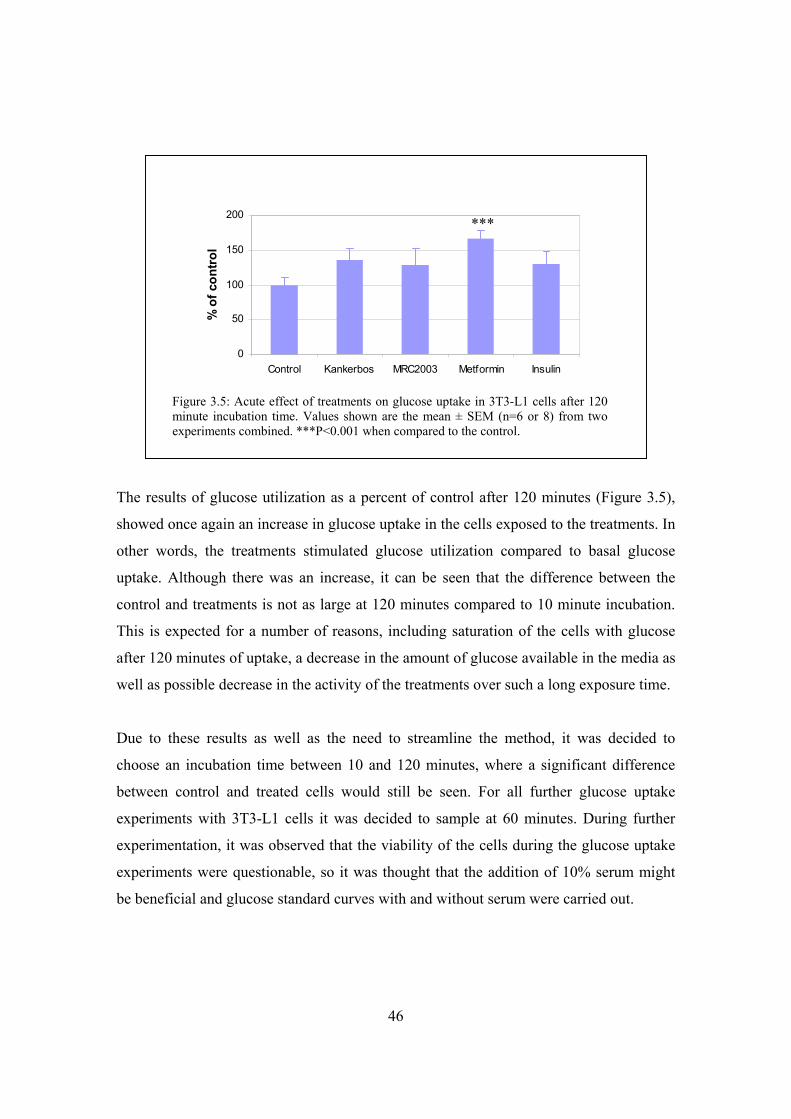
46
The results of glucose utilization as a percent of control after 120 minutes (Figure 3.5),
showed once again an increase in glucose uptake in the cells exposed to the treatments. In
other words, the treatments stimulated glucose utilization compared to basal glucose
uptake. Although there was an increase, it can be seen that the difference between the
control and treatments is not as large at 120 minutes compared to 10 minute incubation.
This is expected for a number of reasons, including saturation of the cells with glucose
after 120 minutes of uptake, a decrease in the amount of glucose available in the media as
well as possible decrease in the activity of the treatments over such a long exposure time.
Due to these results as well as the need to streamline the method, it was decided to
choose an incubation time between 10 and 120 minutes, where a significant difference
between control and treated cells would still be seen. For all further glucose uptake
experiments with 3T3-L1 cells it was decided to sample at 60 minutes. During further
experimentation, it was observed that the viability of the cells during the glucose uptake
experiments were questionable, so it was thought that the addition of 10% serum might
be beneficial and glucose standard curves with and without serum were carried out.
0
50
100
150
200
Control Kankerbos MRC2003 Metformin Insulin
% o
f con
trol
Figure 3.5: Acute effect of treatments on glucose uptake in 3T3-L1 cells after 120 minute incubation time. Values shown are the mean ± SEM (n=6 or 8) from two experiments combined. ***P<0.001 when compared to the control.
***
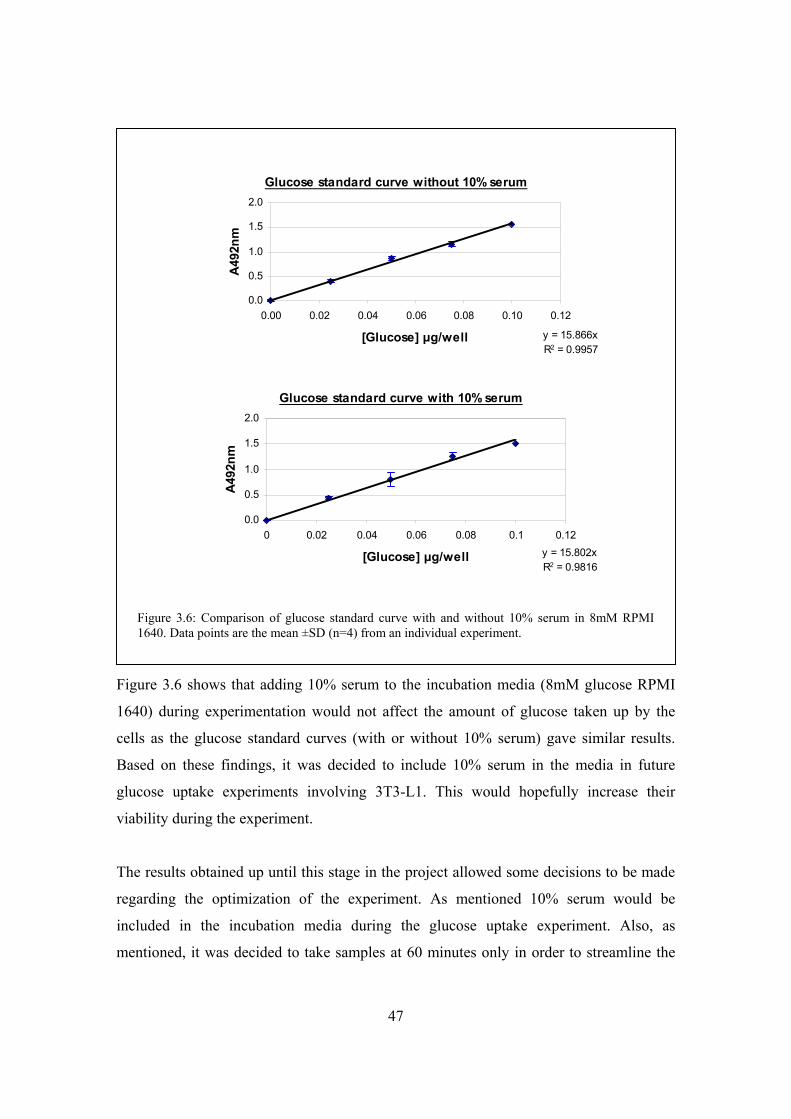
47
Figure 3.6 shows that adding 10% serum to the incubation media (8mM glucose RPMI
1640) during experimentation would not affect the amount of glucose taken up by the
cells as the glucose standard curves (with or without 10% serum) gave similar results.
Based on these findings, it was decided to include 10% serum in the media in future
glucose uptake experiments involving 3T3-L1. This would hopefully increase their
viability during the experiment.
The results obtained up until this stage in the project allowed some decisions to be made
regarding the optimization of the experiment. As mentioned 10% serum would be
included in the incubation media during the glucose uptake experiment. Also, as
mentioned, it was decided to take samples at 60 minutes only in order to streamline the
Figure 3.6: Comparison of glucose standard curve with and without 10% serum in 8mM RPMI 1640. Data points are the mean ±SD (n=4) from an individual experiment.
Glucose standard curve without 10% serum
y = 15.866xR2 = 0.9957
0.0
0.5
1.0
1.5
2.0
0.00 0.02 0.04 0.06 0.08 0.10 0.12
[Glucose] μg/well
A49
2nm
Glucose standard curve with 10% serum
y = 15.802xR2 = 0.9816
0.0
0.5
1.0
1.5
2.0
0 0.02 0.04 0.06 0.08 0.1 0.12
[Glucose] μg/well
A492
nm
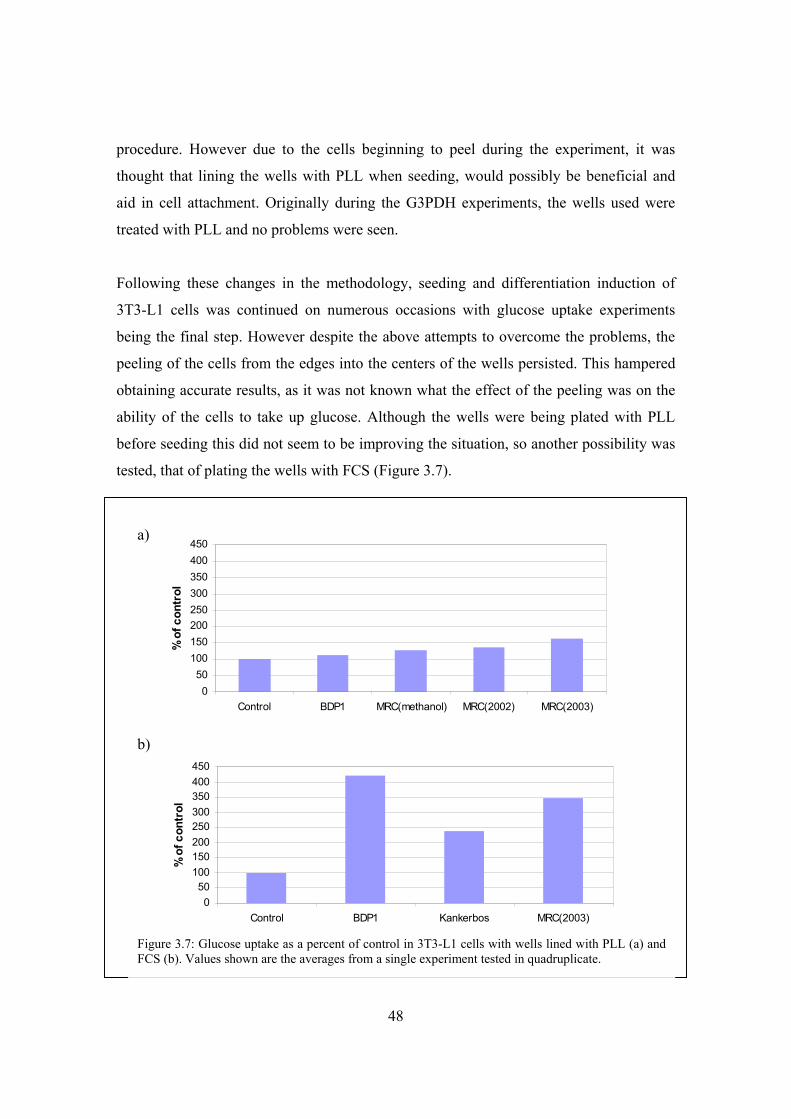
48
procedure. However due to the cells beginning to peel during the experiment, it was
thought that lining the wells with PLL when seeding, would possibly be beneficial and
aid in cell attachment. Originally during the G3PDH experiments, the wells used were
treated with PLL and no problems were seen.
Following these changes in the methodology, seeding and differentiation induction of
3T3-L1 cells was continued on numerous occasions with glucose uptake experiments
being the final step. However despite the above attempts to overcome the problems, the
peeling of the cells from the edges into the centers of the wells persisted. This hampered
obtaining accurate results, as it was not known what the effect of the peeling was on the
ability of the cells to take up glucose. Although the wells were being plated with PLL
before seeding this did not seem to be improving the situation, so another possibility was
tested, that of plating the wells with FCS (Figure 3.7).
050
100150200250300350400450
Control BDP1 MRC(methanol) MRC(2002) MRC(2003)
% o
f con
trol
050
100150200250300350400450
Control BDP1 Kankerbos MRC(2003)
% o
f con
trol
a)
b)
Figure 3.7: Glucose uptake as a percent of control in 3T3-L1 cells with wells lined with PLL (a) and FCS (b). Values shown are the averages from a single experiment tested in quadruplicate.
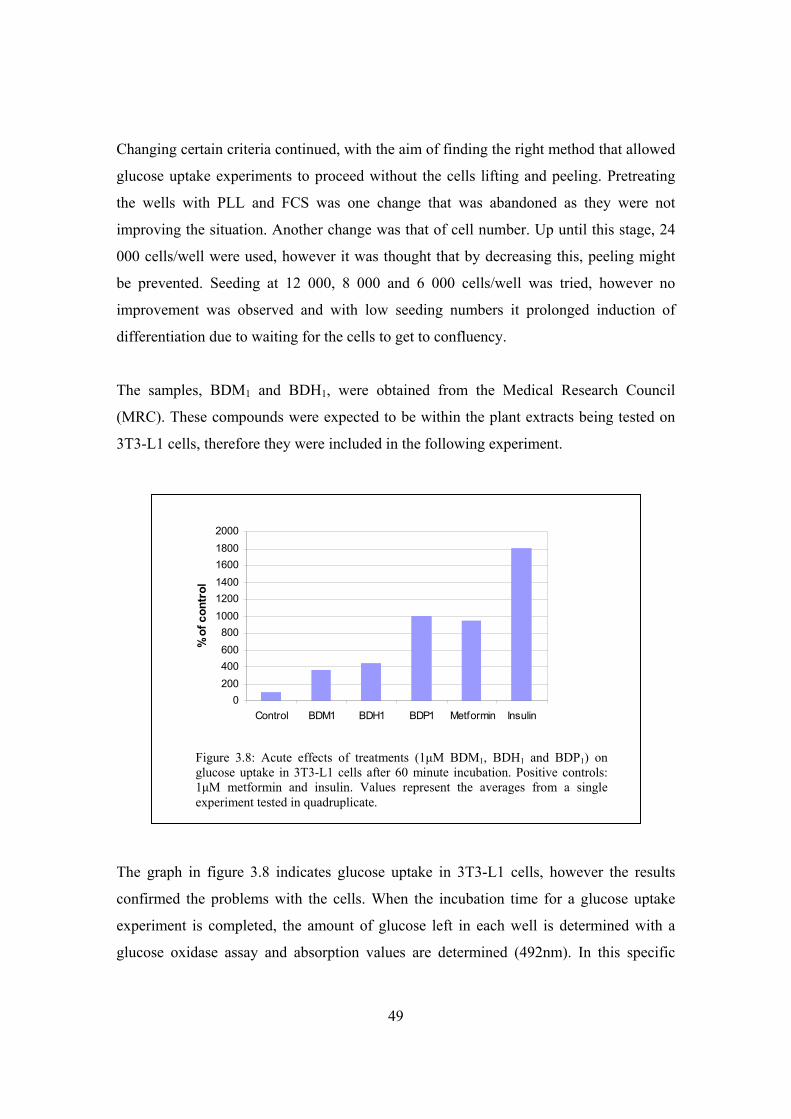
49
Changing certain criteria continued, with the aim of finding the right method that allowed
glucose uptake experiments to proceed without the cells lifting and peeling. Pretreating
the wells with PLL and FCS was one change that was abandoned as they were not
improving the situation. Another change was that of cell number. Up until this stage, 24
000 cells/well were used, however it was thought that by decreasing this, peeling might
be prevented. Seeding at 12 000, 8 000 and 6 000 cells/well was tried, however no
improvement was observed and with low seeding numbers it prolonged induction of
differentiation due to waiting for the cells to get to confluency.
The samples, BDM1 and BDH1, were obtained from the Medical Research Council
(MRC). These compounds were expected to be within the plant extracts being tested on
3T3-L1 cells, therefore they were included in the following experiment.
The graph in figure 3.8 indicates glucose uptake in 3T3-L1 cells, however the results
confirmed the problems with the cells. When the incubation time for a glucose uptake
experiment is completed, the amount of glucose left in each well is determined with a
glucose oxidase assay and absorption values are determined (492nm). In this specific
0200400600800
100012001400160018002000
Control BDM1 BDH1 BDP1 Metformin Insulin
% o
f con
trol
Figure 3.8: Acute effects of treatments (1μM BDM1, BDH1 and BDP1) on glucose uptake in 3T3-L1 cells after 60 minute incubation. Positive controls: 1μM metformin and insulin. Values represent the averages from a single experiment tested in quadruplicate.

50
experiment, the differences in absorption between the 0 time and 60 minute samples for
the control cells were minimal. Due to these nominal values, the subsequent increases in
glucose uptake calculated for treated cells compared to control cells were invalid.
Contamination also plagued the 3T3-L1 cell line and this was also thought to be adding
to their inability to grow and behave normally. Micoplasmas were suspected and so on
two separate occasions the cells were run through treatments with ciprobay. However this
did not seem to affect their well-being. Different types of preincubation media were also
tested, including Krebs Ringer bicarbonate buffer and RPMI 1640 instead of DMEM,
however neither of these made any significant difference in preventing the cells from
peeling into the center of the wells and forming clumps. Also on numerous occasions, the
number of days the cells were being cultured was decreased, however once again this
made no positive impact on the cells.
Over time, the 3T3-L1 behaviour had changed and their morphology had changed to
more spindly cells, so overall they were not behaving as expected. Finally it was
confirmed by the European Collection of Cell Culture (ECACC) that the 3T3-L1 cell line
had transformed and was not exhibiting contact inhibition, so this aided in explaining all
the problems discussed.
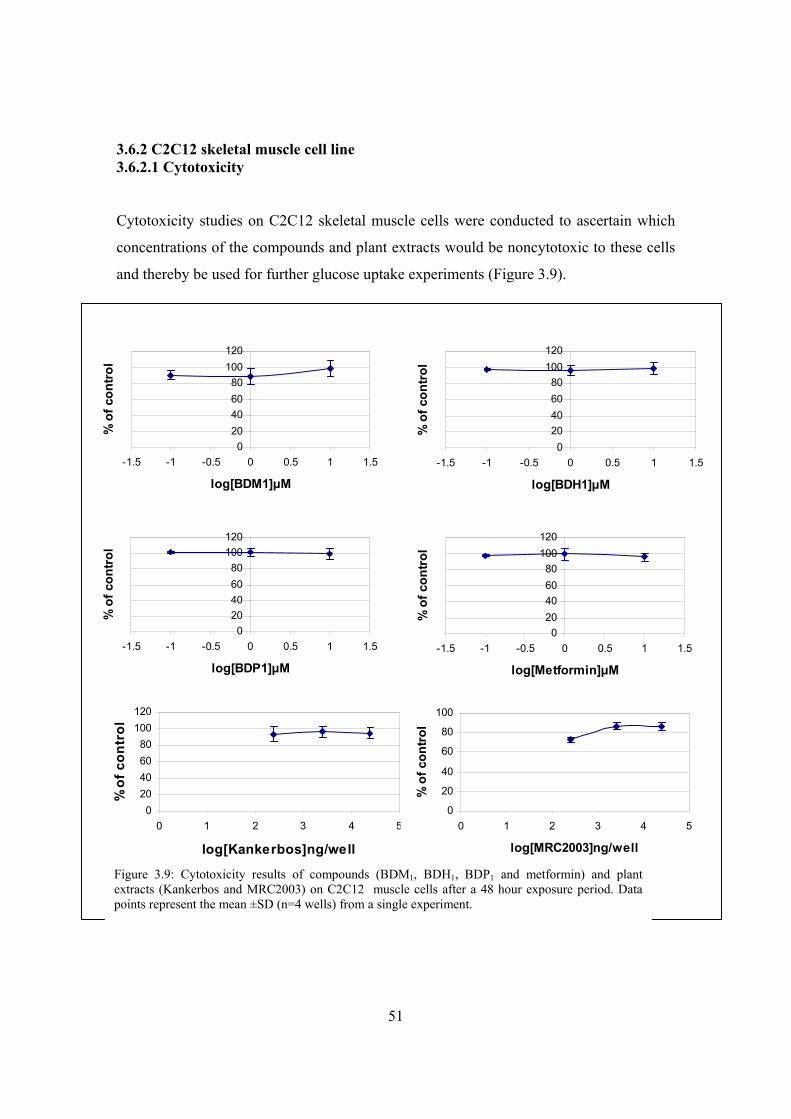
51
3.6.2 C2C12 skeletal muscle cell line 3.6.2.1 Cytotoxicity
Cytotoxicity studies on C2C12 skeletal muscle cells were conducted to ascertain which
concentrations of the compounds and plant extracts would be noncytotoxic to these cells
and thereby be used for further glucose uptake experiments (Figure 3.9).
020406080
100120
-1.5 -1 -0.5 0 0.5 1 1.5
log[Metformin]μM
% o
f con
trol
020406080
100120
-1.5 -1 -0.5 0 0.5 1 1.5
log[BDP1]μM
% o
f con
trol
020406080
100120
-1.5 -1 -0.5 0 0.5 1 1.5
log[BDM1]μM
% o
f con
trol
020406080
100120
-1.5 -1 -0.5 0 0.5 1 1.5
log[BDH1]μM
% o
f con
trol
020406080
100120
0 1 2 3 4 5
log[Kankerbos]ng/well
% o
f con
trol
0
20
40
60
80
100
0 1 2 3 4 5
log[MRC2003]ng/well
% o
f con
trol
Figure 3.9: Cytotoxicity results of compounds (BDM1, BDH1, BDP1 and metformin) and plant extracts (Kankerbos and MRC2003) on C2C12 muscle cells after a 48 hour exposure period. Data points represent the mean ±SD (n=4 wells) from a single experiment.
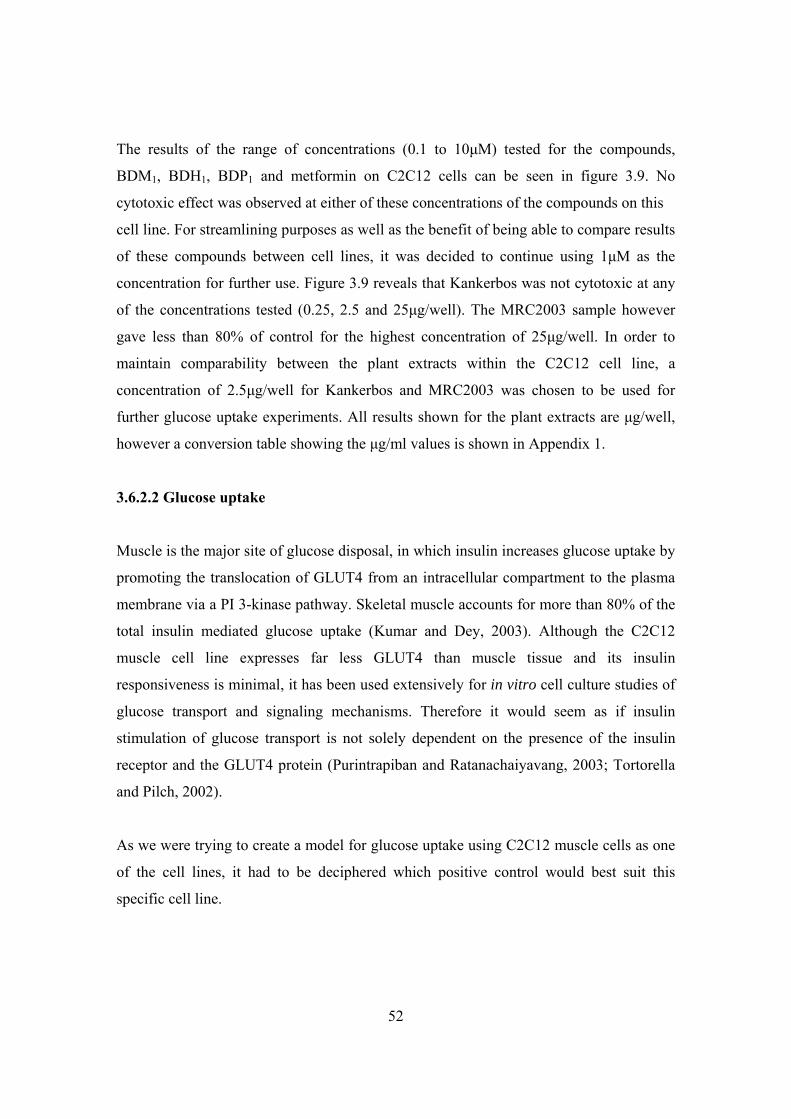
52
The results of the range of concentrations (0.1 to 10μM) tested for the compounds,
BDM1, BDH1, BDP1 and metformin on C2C12 cells can be seen in figure 3.9. No
cytotoxic effect was observed at either of these concentrations of the compounds on this
cell line. For streamlining purposes as well as the benefit of being able to compare results
of these compounds between cell lines, it was decided to continue using 1μM as the
concentration for further use. Figure 3.9 reveals that Kankerbos was not cytotoxic at any
of the concentrations tested (0.25, 2.5 and 25μg/well). The MRC2003 sample however
gave less than 80% of control for the highest concentration of 25μg/well. In order to
maintain comparability between the plant extracts within the C2C12 cell line, a
concentration of 2.5μg/well for Kankerbos and MRC2003 was chosen to be used for
further glucose uptake experiments. All results shown for the plant extracts are μg/well,
however a conversion table showing the μg/ml values is shown in Appendix 1.
3.6.2.2 Glucose uptake
Muscle is the major site of glucose disposal, in which insulin increases glucose uptake by
promoting the translocation of GLUT4 from an intracellular compartment to the plasma
membrane via a PI 3-kinase pathway. Skeletal muscle accounts for more than 80% of the
total insulin mediated glucose uptake (Kumar and Dey, 2003). Although the C2C12
muscle cell line expresses far less GLUT4 than muscle tissue and its insulin
responsiveness is minimal, it has been used extensively for in vitro cell culture studies of
glucose transport and signaling mechanisms. Therefore it would seem as if insulin
stimulation of glucose transport is not solely dependent on the presence of the insulin
receptor and the GLUT4 protein (Purintrapiban and Ratanachaiyavang, 2003; Tortorella
and Pilch, 2002).
As we were trying to create a model for glucose uptake using C2C12 muscle cells as one
of the cell lines, it had to be deciphered which positive control would best suit this
specific cell line.
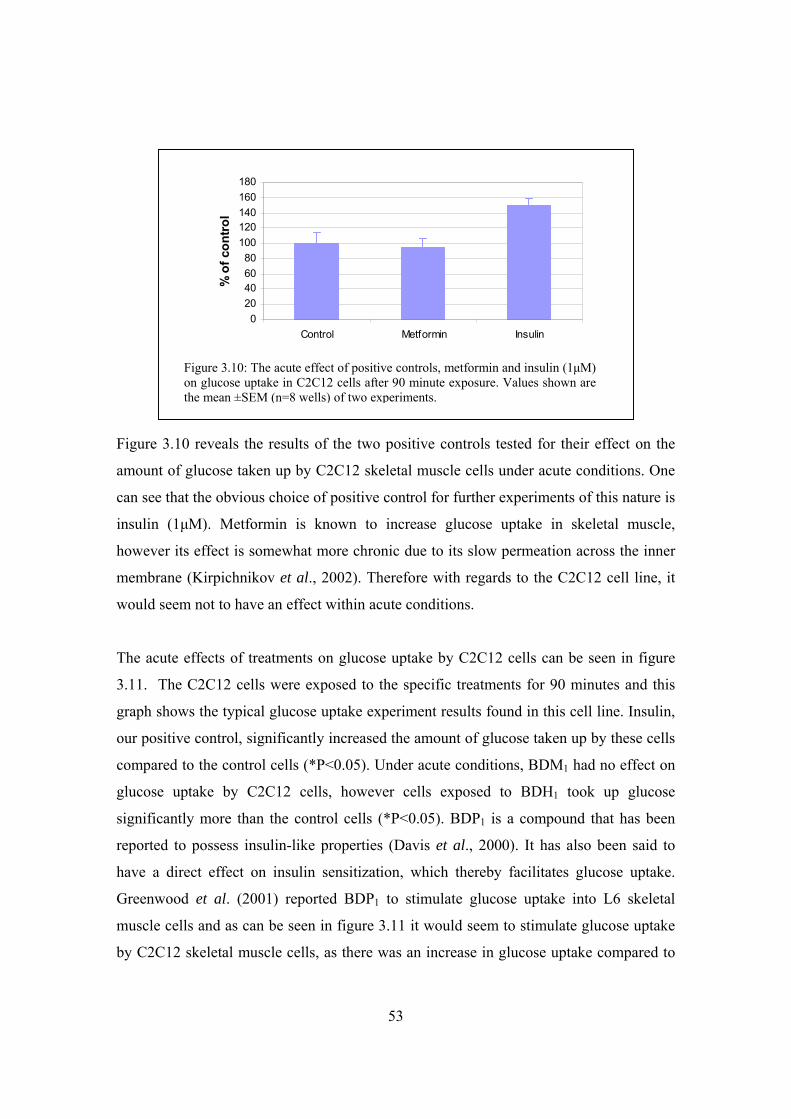
53
Figure 3.10 reveals the results of the two positive controls tested for their effect on the
amount of glucose taken up by C2C12 skeletal muscle cells under acute conditions. One
can see that the obvious choice of positive control for further experiments of this nature is
insulin (1μM). Metformin is known to increase glucose uptake in skeletal muscle,
however its effect is somewhat more chronic due to its slow permeation across the inner
membrane (Kirpichnikov et al., 2002). Therefore with regards to the C2C12 cell line, it
would seem not to have an effect within acute conditions.
The acute effects of treatments on glucose uptake by C2C12 cells can be seen in figure
3.11. The C2C12 cells were exposed to the specific treatments for 90 minutes and this
graph shows the typical glucose uptake experiment results found in this cell line. Insulin,
our positive control, significantly increased the amount of glucose taken up by these cells
compared to the control cells (*P<0.05). Under acute conditions, BDM1 had no effect on
glucose uptake by C2C12 cells, however cells exposed to BDH1 took up glucose
significantly more than the control cells (*P<0.05). BDP1 is a compound that has been
reported to possess insulin-like properties (Davis et al., 2000). It has also been said to
have a direct effect on insulin sensitization, which thereby facilitates glucose uptake.
Greenwood et al. (2001) reported BDP1 to stimulate glucose uptake into L6 skeletal
muscle cells and as can be seen in figure 3.11 it would seem to stimulate glucose uptake
by C2C12 skeletal muscle cells, as there was an increase in glucose uptake compared to
020406080
100120140160180
Control Metformin Insulin
% o
f con
trol
Figure 3.10: The acute effect of positive controls, metformin and insulin (1μM) on glucose uptake in C2C12 cells after 90 minute exposure. Values shown are the mean ±SEM (n=8 wells) of two experiments.

54
the control (**P<0.01). The two main plant extracts under investigation, namely
Kankerbos and MRC2003, gave differing results in their effect on glucose uptake into
C2C12 cells. Kankerbos significantly increased the glucose entering the cells (**P<0.01),
whereas the cells exposed to the MRC2003 extract showed no significant glucose uptake.
C2C12 cells were exposed to treatments over a longer time period, by adding them 48
hours prior to experimentation, to investigate the chronic effect of the treatments.
Glucose uptake experiments were carried out under chronic conditions a number of
times, however the results were unexplainably inconsistent every time. It was therefore
decided that for the C2C12 cell line model, acute exposure experiments would only be
carried out in future investigations. The one finding that did remain consistent time after
time, was for the cells exposed to insulin (1μM) under chronic conditions (figure 3.12).
0
50
100
150
200
250
300
Control BDM1 BDH1 BDP1 Kankerbos MRC2003 Insulin
% o
f con
trol
Figure 3.11: Acute effects of treatments on glucose uptake by C2C12 cells after 90 minutes. Treatments included: 1μM BDM1, BDH1 and BDP1 as well as plant extracts, Kankerbos and MRC2003 (2.5μg/well). Positive control: 1μM insulin. Values shown are the mean ± SEM (n=8 wells) from two experiments. *P < 0.05; **P < 0.01 when compared to the control.
* *
**
**
55
Figure 3.12 revealed that the chronic presence of insulin inhibited the uptake of glucose
by C2C12 cells. It would seem that resistance to insulin was induced in the C2C12 cells
under these conditions. Insulin resistance in skeletal muscle is characteristic in type II
diabetic patients (Dela et al., 1994). The results obtained in this experiment are not
unknown, because insulin resistance has been developed in skeletal muscle cell lines such
as C2C12 muscle cells (Kumar and Dey, 2003). This part of the glucose utilisation model
could possibly play an important role, as it could be used to screen the potential
antidiabetic compounds and plant extracts for their effects on insulin resistance in skeletal
muscle.
0
20
40
60
80
100
120
140
160
Control Insulin
% o
f con
trol
Figure 3.12: Effect of insulin (1μM) on glucose uptake in C2C12 muscle cells compared to control after chronic exposure. Data points are the mean ±SEM (n=6 wells) from two experiments.
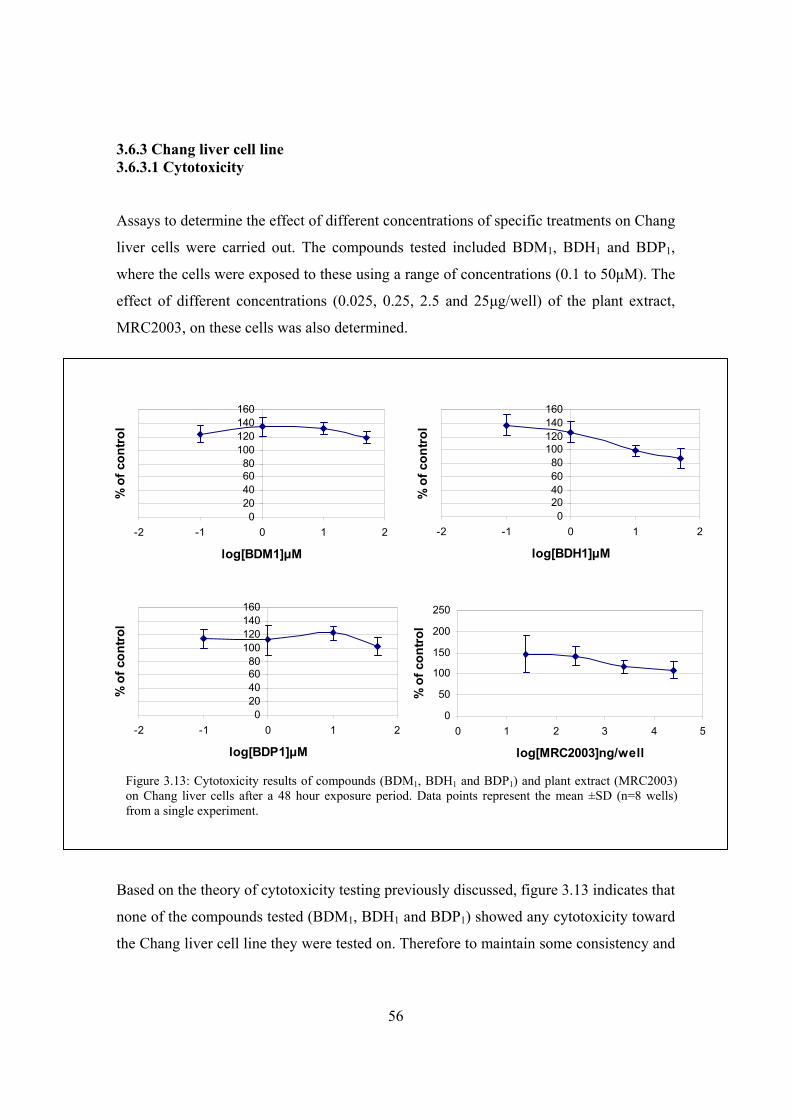
56
3.6.3 Chang liver cell line 3.6.3.1 Cytotoxicity
Assays to determine the effect of different concentrations of specific treatments on Chang
liver cells were carried out. The compounds tested included BDM1, BDH1 and BDP1,
where the cells were exposed to these using a range of concentrations (0.1 to 50μM). The
effect of different concentrations (0.025, 0.25, 2.5 and 25μg/well) of the plant extract,
MRC2003, on these cells was also determined.
Based on the theory of cytotoxicity testing previously discussed, figure 3.13 indicates that
none of the compounds tested (BDM1, BDH1 and BDP1) showed any cytotoxicity toward
the Chang liver cell line they were tested on. Therefore to maintain some consistency and
020406080
100120140160
-2 -1 0 1 2
log[BDH1]μM
% o
f con
trol
020406080
100120140160
-2 -1 0 1 2
log[BDM1]μM
% o
f con
trol
020406080
100120140160
-2 -1 0 1 2
log[BDP1]μM
% o
f con
trol
0
50
100
150
200
250
0 1 2 3 4 5
log[MRC2003]ng/well
% o
f con
trol
Figure 3.13: Cytotoxicity results of compounds (BDM1, BDH1 and BDP1) and plant extract (MRC2003) on Chang liver cells after a 48 hour exposure period. Data points represent the mean ±SD (n=8 wells) from a single experiment.
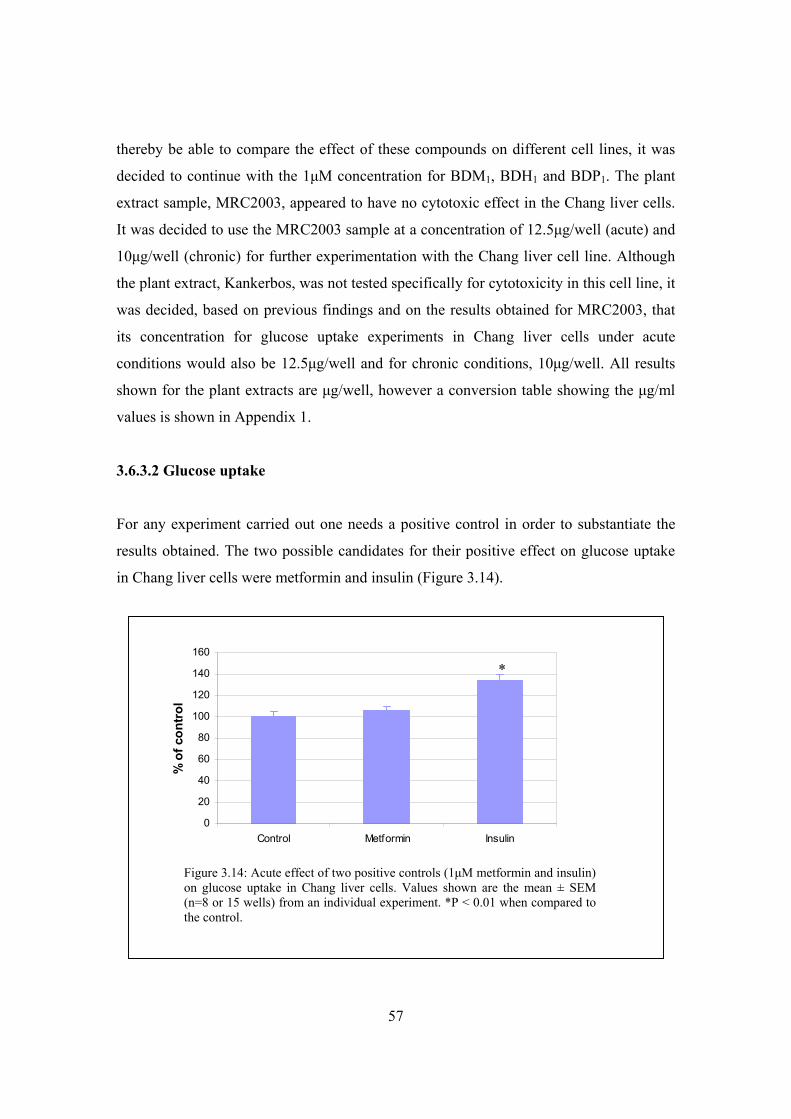
57
thereby be able to compare the effect of these compounds on different cell lines, it was
decided to continue with the 1μM concentration for BDM1, BDH1 and BDP1. The plant
extract sample, MRC2003, appeared to have no cytotoxic effect in the Chang liver cells.
It was decided to use the MRC2003 sample at a concentration of 12.5μg/well (acute) and
10μg/well (chronic) for further experimentation with the Chang liver cell line. Although
the plant extract, Kankerbos, was not tested specifically for cytotoxicity in this cell line, it
was decided, based on previous findings and on the results obtained for MRC2003, that
its concentration for glucose uptake experiments in Chang liver cells under acute
conditions would also be 12.5μg/well and for chronic conditions, 10μg/well. All results
shown for the plant extracts are μg/well, however a conversion table showing the μg/ml
values is shown in Appendix 1.
3.6.3.2 Glucose uptake
For any experiment carried out one needs a positive control in order to substantiate the
results obtained. The two possible candidates for their positive effect on glucose uptake
in Chang liver cells were metformin and insulin (Figure 3.14).
0
20
40
60
80
100
120
140
160
Control Metformin Insulin
% o
f con
trol
Figure 3.14: Acute effect of two positive controls (1μM metformin and insulin) on glucose uptake in Chang liver cells. Values shown are the mean ± SEM (n=8 or 15 wells) from an individual experiment. *P < 0.01 when compared to the control.
*
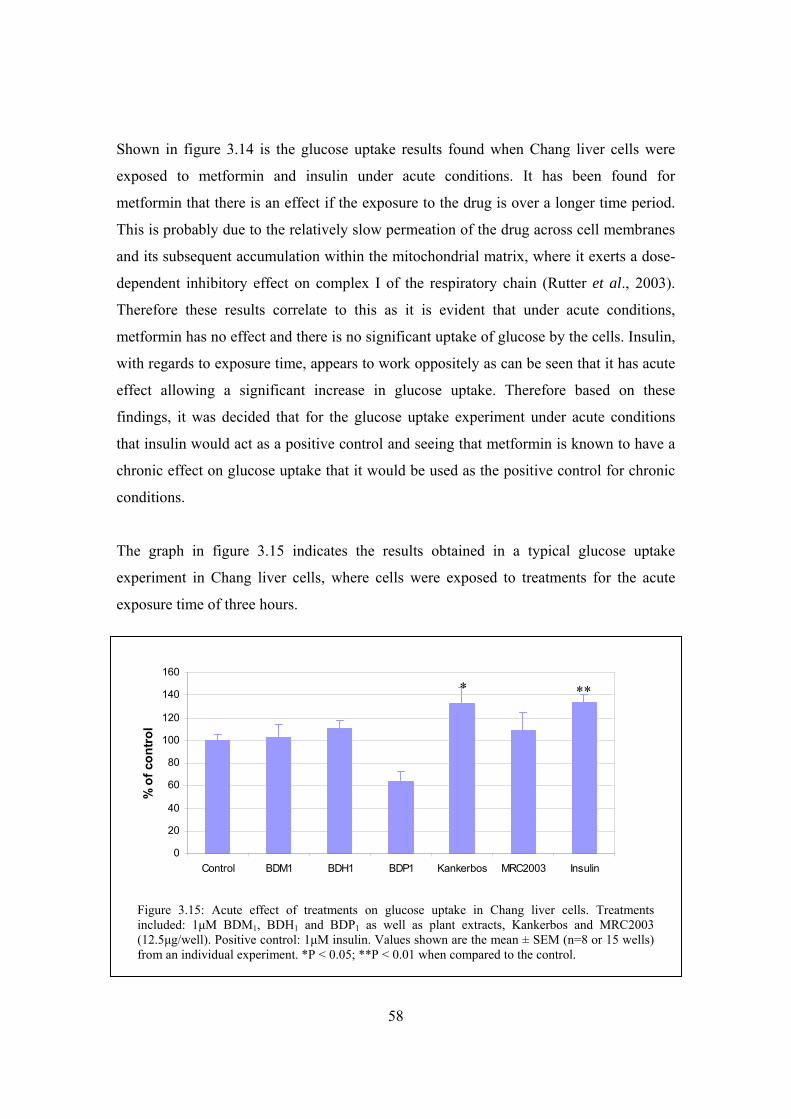
58
Shown in figure 3.14 is the glucose uptake results found when Chang liver cells were
exposed to metformin and insulin under acute conditions. It has been found for
metformin that there is an effect if the exposure to the drug is over a longer time period.
This is probably due to the relatively slow permeation of the drug across cell membranes
and its subsequent accumulation within the mitochondrial matrix, where it exerts a dose-
dependent inhibitory effect on complex I of the respiratory chain (Rutter et al., 2003).
Therefore these results correlate to this as it is evident that under acute conditions,
metformin has no effect and there is no significant uptake of glucose by the cells. Insulin,
with regards to exposure time, appears to work oppositely as can be seen that it has acute
effect allowing a significant increase in glucose uptake. Therefore based on these
findings, it was decided that for the glucose uptake experiment under acute conditions
that insulin would act as a positive control and seeing that metformin is known to have a
chronic effect on glucose uptake that it would be used as the positive control for chronic
conditions.
The graph in figure 3.15 indicates the results obtained in a typical glucose uptake
experiment in Chang liver cells, where cells were exposed to treatments for the acute
exposure time of three hours.
0
20
40
60
80
100
120
140
160
Control BDM1 BDH1 BDP1 Kankerbos MRC2003 Insulin
% o
f con
trol
Figure 3.15: Acute effect of treatments on glucose uptake in Chang liver cells. Treatments included: 1μM BDM1, BDH1 and BDP1 as well as plant extracts, Kankerbos and MRC2003 (12.5μg/well). Positive control: 1μM insulin. Values shown are the mean ± SEM (n=8 or 15 wells) from an individual experiment. *P < 0.05; **P < 0.01 when compared to the control.
** *
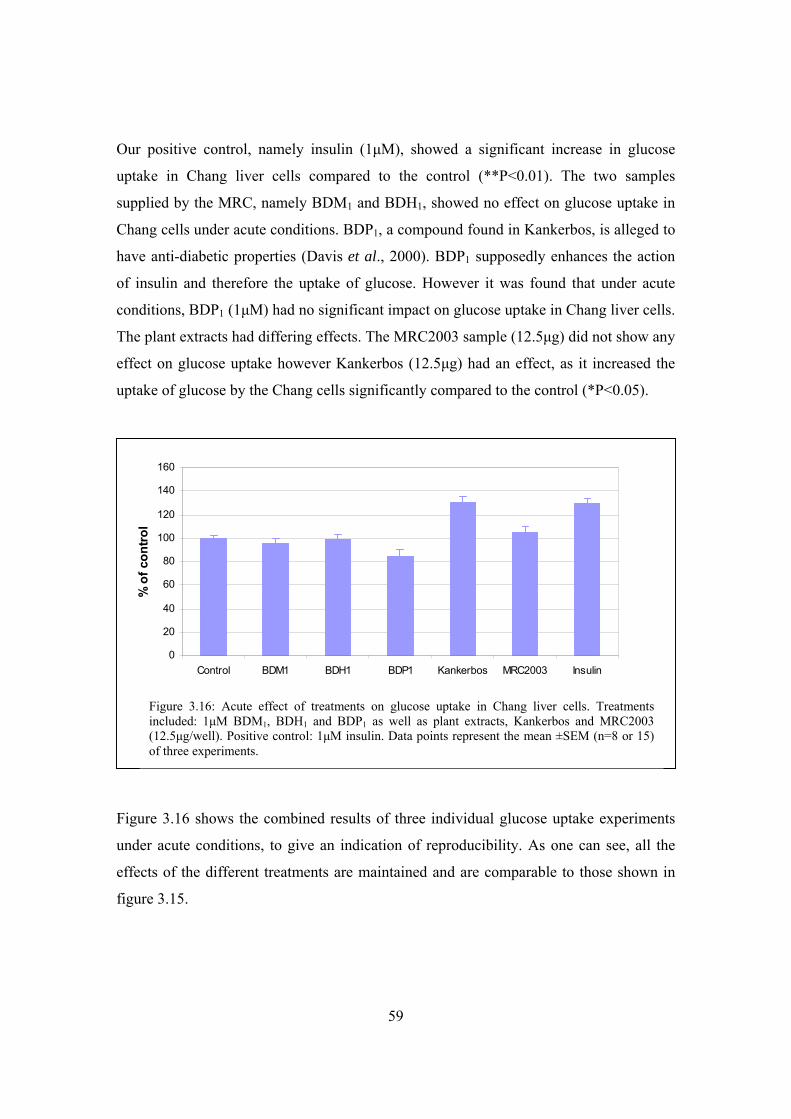
59
Our positive control, namely insulin (1μM), showed a significant increase in glucose
uptake in Chang liver cells compared to the control (**P<0.01). The two samples
supplied by the MRC, namely BDM1 and BDH1, showed no effect on glucose uptake in
Chang cells under acute conditions. BDP1, a compound found in Kankerbos, is alleged to
have anti-diabetic properties (Davis et al., 2000). BDP1 supposedly enhances the action
of insulin and therefore the uptake of glucose. However it was found that under acute
conditions, BDP1 (1μM) had no significant impact on glucose uptake in Chang liver cells.
The plant extracts had differing effects. The MRC2003 sample (12.5μg) did not show any
effect on glucose uptake however Kankerbos (12.5μg) had an effect, as it increased the
uptake of glucose by the Chang cells significantly compared to the control (*P<0.05).
Figure 3.16 shows the combined results of three individual glucose uptake experiments
under acute conditions, to give an indication of reproducibility. As one can see, all the
effects of the different treatments are maintained and are comparable to those shown in
figure 3.15.
0
20
40
60
80
100
120
140
160
Control BDM1 BDH1 BDP1 Kankerbos MRC2003 Insulin
% o
f con
trol
Figure 3.16: Acute effect of treatments on glucose uptake in Chang liver cells. Treatments included: 1μM BDM1, BDH1 and BDP1 as well as plant extracts, Kankerbos and MRC2003 (12.5μg/well). Positive control: 1μM insulin. Data points represent the mean ±SEM (n=8 or 15) of three experiments.
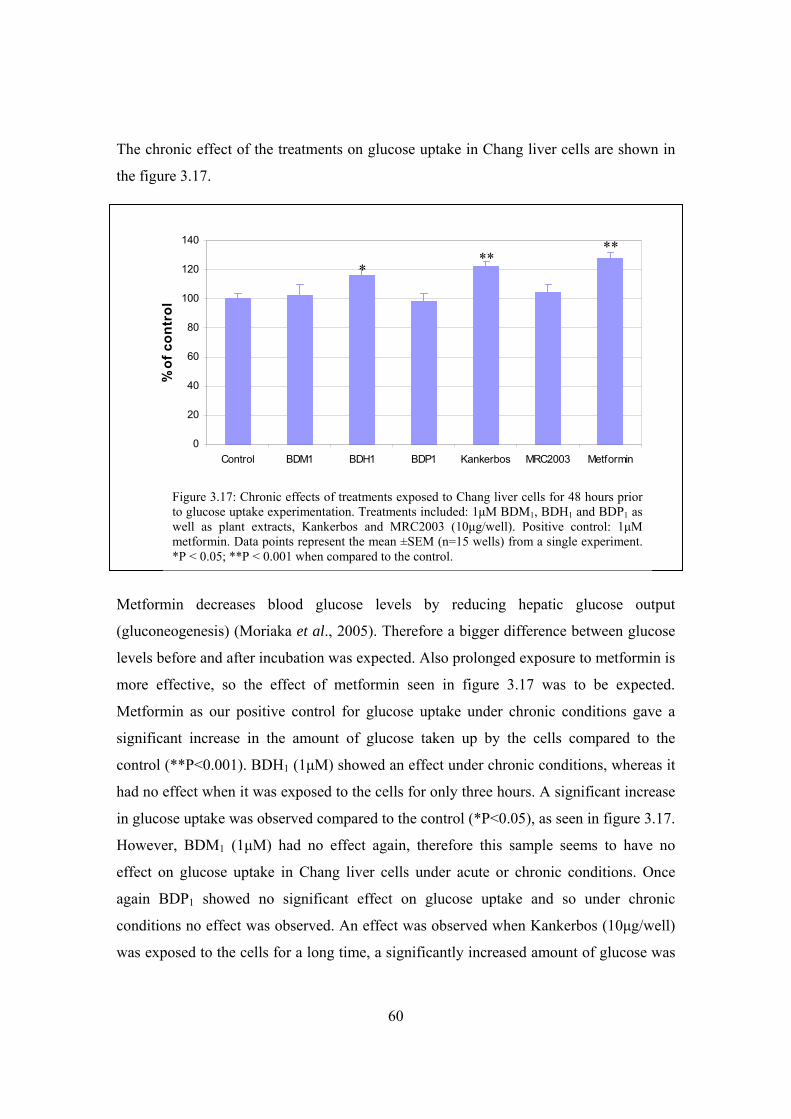
60
The chronic effect of the treatments on glucose uptake in Chang liver cells are shown in
the figure 3.17.
Metformin decreases blood glucose levels by reducing hepatic glucose output
(gluconeogenesis) (Moriaka et al., 2005). Therefore a bigger difference between glucose
levels before and after incubation was expected. Also prolonged exposure to metformin is
more effective, so the effect of metformin seen in figure 3.17 was to be expected.
Metformin as our positive control for glucose uptake under chronic conditions gave a
significant increase in the amount of glucose taken up by the cells compared to the
control (**P<0.001). BDH1 (1μM) showed an effect under chronic conditions, whereas it
had no effect when it was exposed to the cells for only three hours. A significant increase
in glucose uptake was observed compared to the control (*P<0.05), as seen in figure 3.17.
However, BDM1 (1μM) had no effect again, therefore this sample seems to have no
effect on glucose uptake in Chang liver cells under acute or chronic conditions. Once
again BDP1 showed no significant effect on glucose uptake and so under chronic
conditions no effect was observed. An effect was observed when Kankerbos (10μg/well)
was exposed to the cells for a long time, a significantly increased amount of glucose was
Figure 3.17: Chronic effects of treatments exposed to Chang liver cells for 48 hours prior to glucose uptake experimentation. Treatments included: 1μM BDM1, BDH1 and BDP1 as well as plant extracts, Kankerbos and MRC2003 (10μg/well). Positive control: 1μM metformin. Data points represent the mean ±SEM (n=15 wells) from a single experiment. *P < 0.05; **P < 0.001 when compared to the control.
0
20
40
60
80
100
120
140
Control BDM1 BDH1 BDP1 Kankerbos MRC2003 Metformin
% o
f con
trol
** *
**
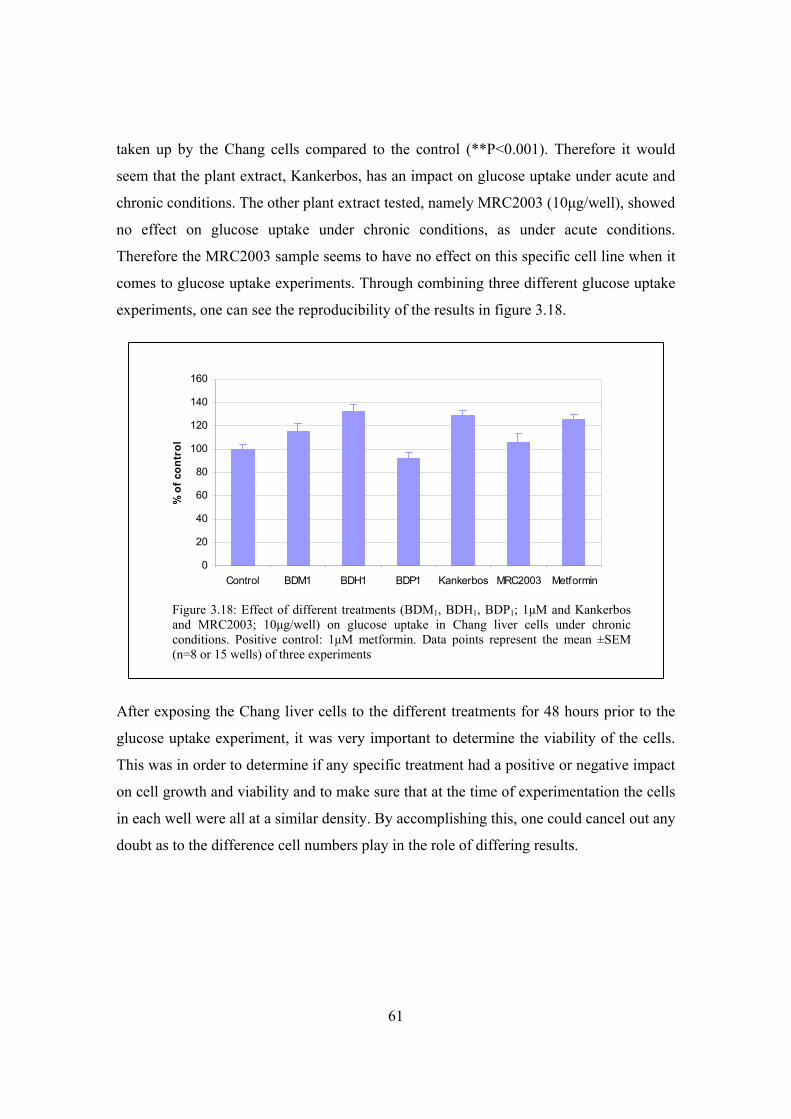
61
taken up by the Chang cells compared to the control (**P<0.001). Therefore it would
seem that the plant extract, Kankerbos, has an impact on glucose uptake under acute and
chronic conditions. The other plant extract tested, namely MRC2003 (10μg/well), showed
no effect on glucose uptake under chronic conditions, as under acute conditions.
Therefore the MRC2003 sample seems to have no effect on this specific cell line when it
comes to glucose uptake experiments. Through combining three different glucose uptake
experiments, one can see the reproducibility of the results in figure 3.18.
After exposing the Chang liver cells to the different treatments for 48 hours prior to the
glucose uptake experiment, it was very important to determine the viability of the cells.
This was in order to determine if any specific treatment had a positive or negative impact
on cell growth and viability and to make sure that at the time of experimentation the cells
in each well were all at a similar density. By accomplishing this, one could cancel out any
doubt as to the difference cell numbers play in the role of differing results.
0
20
40
60
80
100
120
140
160
Control BDM1 BDH1 BDP1 Kankerbos MRC2003 Metformin
% o
f con
trol
Figure 3.18: Effect of different treatments (BDM1, BDH1, BDP1; 1μM and Kankerbos and MRC2003; 10μg/well) on glucose uptake in Chang liver cells under chronic conditions. Positive control: 1μM metformin. Data points represent the mean ±SEM (n=8 or 15 wells) of three experiments
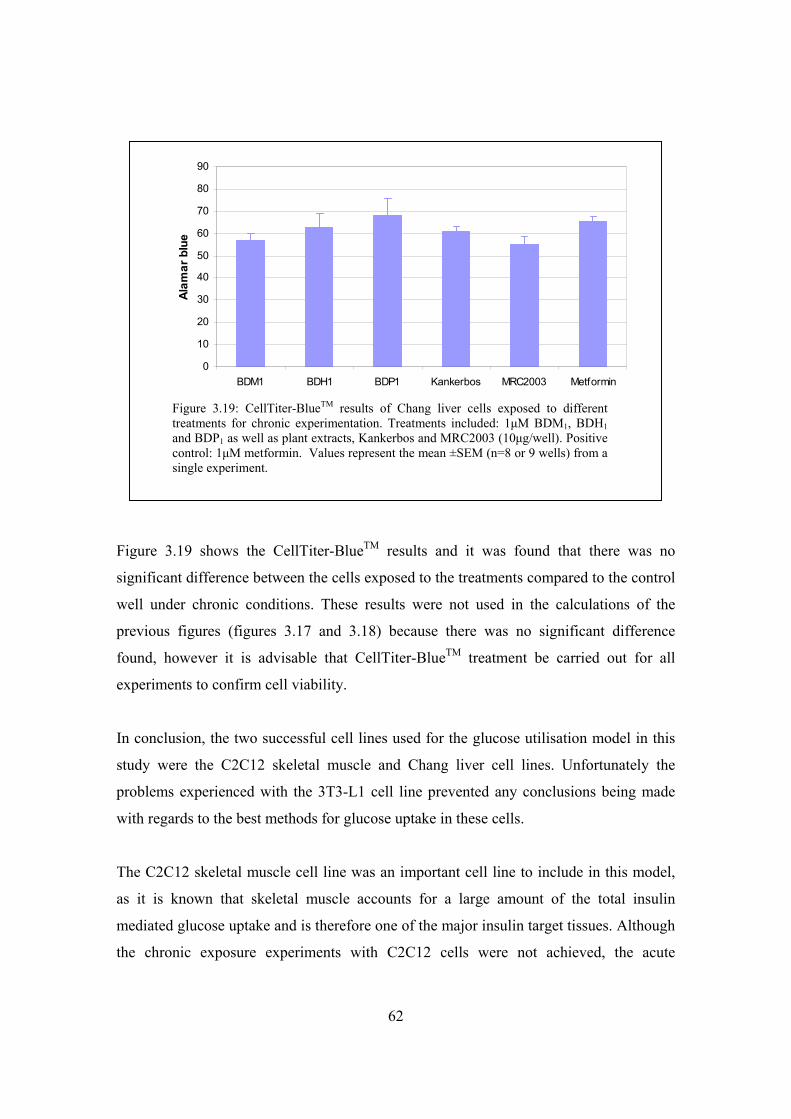
62
Figure 3.19 shows the CellTiter-BlueTM results and it was found that there was no
significant difference between the cells exposed to the treatments compared to the control
well under chronic conditions. These results were not used in the calculations of the
previous figures (figures 3.17 and 3.18) because there was no significant difference
found, however it is advisable that CellTiter-BlueTM treatment be carried out for all
experiments to confirm cell viability.
In conclusion, the two successful cell lines used for the glucose utilisation model in this
study were the C2C12 skeletal muscle and Chang liver cell lines. Unfortunately the
problems experienced with the 3T3-L1 cell line prevented any conclusions being made
with regards to the best methods for glucose uptake in these cells.
The C2C12 skeletal muscle cell line was an important cell line to include in this model,
as it is known that skeletal muscle accounts for a large amount of the total insulin
mediated glucose uptake and is therefore one of the major insulin target tissues. Although
the chronic exposure experiments with C2C12 cells were not achieved, the acute
0
10
20
30
40
50
60
70
80
90
BDM1 BDH1 BDP1 Kankerbos MRC2003 Metformin
Alam
ar b
lue
Figure 3.19: CellTiter-BlueTM results of Chang liver cells exposed to different treatments for chronic experimentation. Treatments included: 1μM BDM1, BDH1 and BDP1 as well as plant extracts, Kankerbos and MRC2003 (10μg/well). Positive control: 1μM metformin. Values represent the mean ±SEM (n=8 or 9 wells) from a single experiment.
63
condition (1.5 hours) experiments were successful using insulin as the positive control for
glucose uptake. As a result of these findings, it was decided that in the future, all glucose
uptake experiments with C2C12 muscle cells would only include acute exposure
conditions.
For the Chang liver cell line, both the acute (3 hours) and chronic (48 hour pretreatment +
3 hours) condition experiments were successful. When observing the acute effects of the
treatments on glucose uptake in these cells, it was found that insulin was the best positive
control. However due to metformin’s mechanisms of action, it showed the required effect
when exposed to the Chang liver cells chronically and was therefore chosen as the
positive control under these conditions.
All together, these two cell lines provided a good basis for the creation of a model
whereby the effects on glucose utilisation could be investigated for treatments that were
possible antidiabetic potentiates.
64
Chapter 4
Models for insulin secretion
The insulin-secreting cell lines (INS-1 and INS-2) were established from the cells
isolated from an x-ray-induced rat transplantable insulinoma. INS-1 cell morphology,
insulin biosynthesis and secretion are remarkably similar to those of the parent tumour
propagated in vivo (Asfari et al., 1992).
The continuous growth of INS cells depends on the presence of 2-mercaptoethanol (2-
ME) in the culture medium. It was found that the presence of 2-ME (optimal
concentration 50µM) promoted cell proliferation. In the absence of 2-ME, these cells do
not only stop proliferating, but actually do not survive after trypsinization for culture
transfer. The high and stable insulin content of INS-1 cells (averaging 8µg/106 cells) as
compared to normal islets (40µg/106 cells), is probably due to the continuous presence of
2-ME. Several mechanisms have been proposed to explain the effect of 2-ME, however
whether 2-ME participates in sustaining the differentiated state of INS-1 cells remains
hypothetical. 2-ME may exert its effects through participation in cellular metabolism,
which leads to the enhancement of growth factor receptor activation, or on the expression
of oncogenes (Asfari et al., 1992).
Therefore, compared to normal β-cells, INS-1 cells retain a differentiated β-cell
phenotype with respect to glucose transport and metabolism, which are important
functions for normal metabolism-secretion coupling (Janjic et al., 1999).
Unwanted weight gain has been associated with the use of tricyclic antidepressants and it
has been postulated that the mechanism is due to antidepressants increasing blood insulin
levels (Garland et al., 1988 ; Hurr, 1996). Obesity, which is a condition caused by an
excessive amount of adipose tissue, is strongly associated with the development of type II
diabetes (Sheard and Clark, 2000). Due to type II diabetes complications and chronicity,
reducing risk factors such as obesity through lifestyle modification is crucial to the long-
term health of patients. Therefore weight gain, which is an undesired effect of some

65
antidepressants, is a major problem, which needs to be solved and further investigation is
required.
One of the main aims of the project was to create an in vitro model using an insulin-
secreting cell line in order to determine the effect of different drugs (antidepressants and
traditional medicine) on insulin secretion. Through setting up a model, one would be able
to determine the positive or negative effects of the drugs on insulin secretion.
4.1 Materials and methods
Methods described in the following sections are the final optimised methods used in the
model, decided upon when the initial set of experiments were completed.
4.1.1 INS cells maintenance
INS–1 cells were kindly donated by Professor Guy Rutter from the University of Bristol,
England.
4.1.1.1 Mercaptoethanol
Stock mercaptoethanol (3.48µl) (0.5mM) was made up to 10ml with RPMI 1640 and this
solution was filtered through a 0.22µm filter. Aliquots (0.6ml) were frozen in cryo vials
at –20ºC.
4.1.1.2 Complete Medium
The INS–I cells are maintained in complete medium composed of RPMI 1640
supplemented with 10% heat-inactivated FCS and 50µM 2-ME. The complete medium
was made up by adding 0.5ml mercaptoethanol from frozen aliquots to 5ml heat
inactivated serum (10%) and then adding 44.5ml RPMI to make 50ml, which could be
kept for 10 days at 4ºC.
66
4.1.1.3 Poly-L-Lysine (PLL)
Twenty five millilitres of sterile water was added to 5mg PLL (Sigma) in the bottle and
1ml aliquots were placed into vials. For use, 19ml sterile water was added to the 1ml PLL
in the vial.
4.1.1.4 Pretreatment of culture dishes
Prior to use of culture dishes, 2ml PLL was placed into the culture dish, coating the
surface. This was left for 10 minutes at room temperature, removed through aspiration
and the surface washed once with PBSA.
4.1.2 Insulin Secretion by INS-1 cells
Optimal seeding density was determined as 30 000 cells/well. Cells were seeded into 96-
well microtiter plates and cultured for 2 days in complete medium. For the experiments,
each well was washed once with 50μl Krebs-Ringer-bicarbonate-HEPES buffer (KRBH)
composed of 118.4mM NaCl, 4.75mM KCl, 1.192mM MgSO4, 2.54mM CaCl2, 10mM
HEPES, 2mM NaHCO3, 0.1% BSA (Janjic et al., 1999). The cells were then exposed to
50μl preincubation medium (KRBH) for 30 minutes and after removal, treatment
incubation medium (KRBH including applicable medication) (100μl/well) was added for
10 minutes. After this incubation was complete, 50μl incubation medium was removed
and a 50x dilution was made for insulin determination using the LINCO Research rat
insulin radioimmunoassay (RIA) kit (Cat no. RI-13K), which makes use of rat insulin as
a standard. All incubations were carried out at 37ºC. Samples were stored at -20°C until
required for insulin determination. Assay buffer from the LINCO kit was used as the
diluant for all the dilutions required in these experiments.
INS-I cells were exposed to an antidepressant, namely amitriptyline (1μM), plant extracts
of S frutenscens (Kankerbos) (0.5μg/well) and MRC2003 (0.5μg/well) as well as a
positive control: glibenclamide (a sulfonylurea) (1μM), at different exposure times.
67
4.1.3 Plasma insulin determination from rat model To determine whether results obtained with cell culture experiments correlate with results
in an animal model, a collaborative project between Wayne Chadwick (NMMU
Biochemistry PhD Student) and myself was done where I determined the concentration of
insulin in plasma samples from rats. The care of the animals as well as the preparation of
the medication was the responsibility of Wayne. All procedures were first tested on rats
that were not part of the experimental setup.
4.1.3.1 Preparation of medication
1) Sutherlandia frutescens (kankerbos) Dried kankerbos leaves (2.5g) were weighed and placed in 100 ml boiling water to form
an infusion, which was then brewed overnight. The extract was filtered and the rats
received a dose concentration of 0.01ml/g body weight in 100ml tea extract in water. The
drinking water with extract was replaced daily and the volume remaining each day was
recorded.
2) Amitriptyline and Metformin Amitriptyline, the best documented antidepressant that is still used by some patients and
is known to cause weight gain was used in this study. Metformin, a biguanide drug, was
given as a positive control for glucose uptake in Wayne’s project. To be consistent in the
project the pancreases of all the rats were tested for insulin secretion. An amitriptyline
tablet (0.11g) containing 25 mg amitriptyline (highest dose available) or a metformin
tablet (0.55g) containing 500 mg metformin (highest dose available) was dissolved in 1
ml of a 0.1 M HCl solution, ensuring that the drugs would dissolve. The relevant drug
and water was then added to the water bottles (200ml) and these were placed in the
respective cages. Due to the fact that the stability of these drugs in solution is unknown,
the medication was changed twice daily and the volume remaining was monitored.
Rats were weighed weekly. The doses of the different treatments were relevant to the
body weights of the rats in the specific cage. Rats were administered a daily dosage of
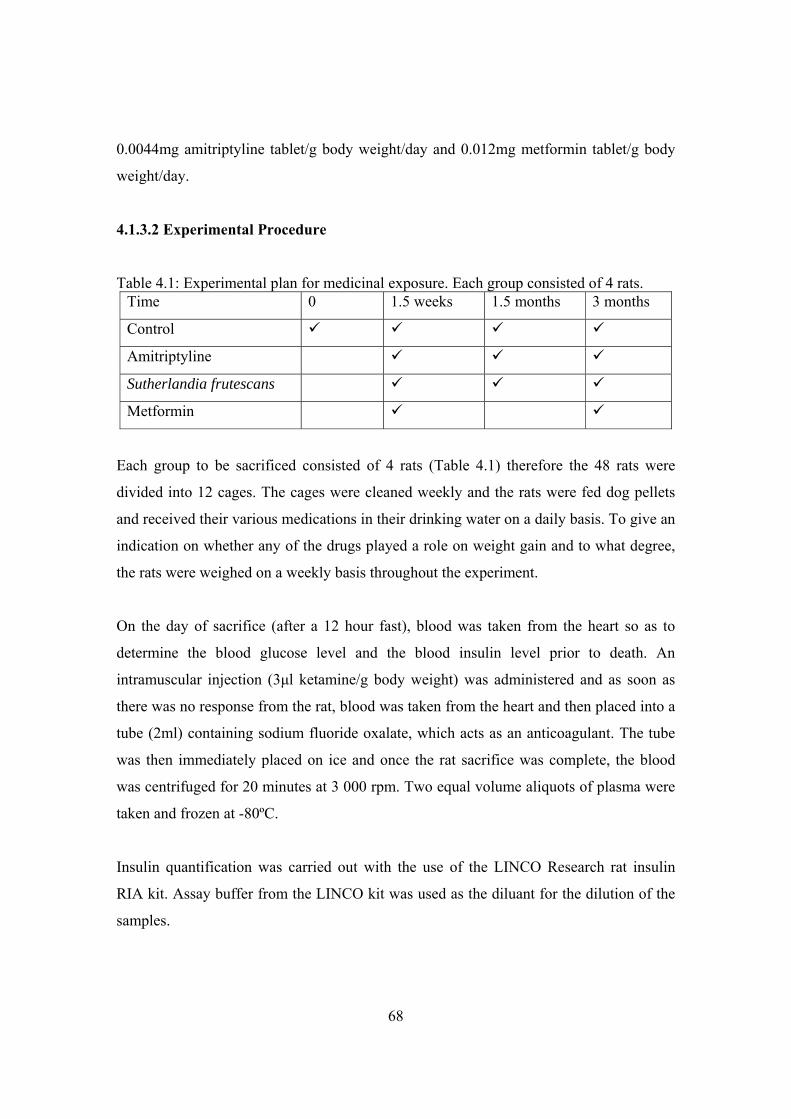
68
0.0044mg amitriptyline tablet/g body weight/day and 0.012mg metformin tablet/g body
weight/day.
4.1.3.2 Experimental Procedure
Table 4.1: Experimental plan for medicinal exposure. Each group consisted of 4 rats. Time 0 1.5 weeks 1.5 months 3 months
Control
Amitriptyline
Sutherlandia frutescans
Metformin
Each group to be sacrificed consisted of 4 rats (Table 4.1) therefore the 48 rats were
divided into 12 cages. The cages were cleaned weekly and the rats were fed dog pellets
and received their various medications in their drinking water on a daily basis. To give an
indication on whether any of the drugs played a role on weight gain and to what degree,
the rats were weighed on a weekly basis throughout the experiment.
On the day of sacrifice (after a 12 hour fast), blood was taken from the heart so as to
determine the blood glucose level and the blood insulin level prior to death. An
intramuscular injection (3μl ketamine/g body weight) was administered and as soon as
there was no response from the rat, blood was taken from the heart and then placed into a
tube (2ml) containing sodium fluoride oxalate, which acts as an anticoagulant. The tube
was then immediately placed on ice and once the rat sacrifice was complete, the blood
was centrifuged for 20 minutes at 3 000 rpm. Two equal volume aliquots of plasma were
taken and frozen at -80ºC.
Insulin quantification was carried out with the use of the LINCO Research rat insulin
RIA kit. Assay buffer from the LINCO kit was used as the diluant for the dilution of the
samples.
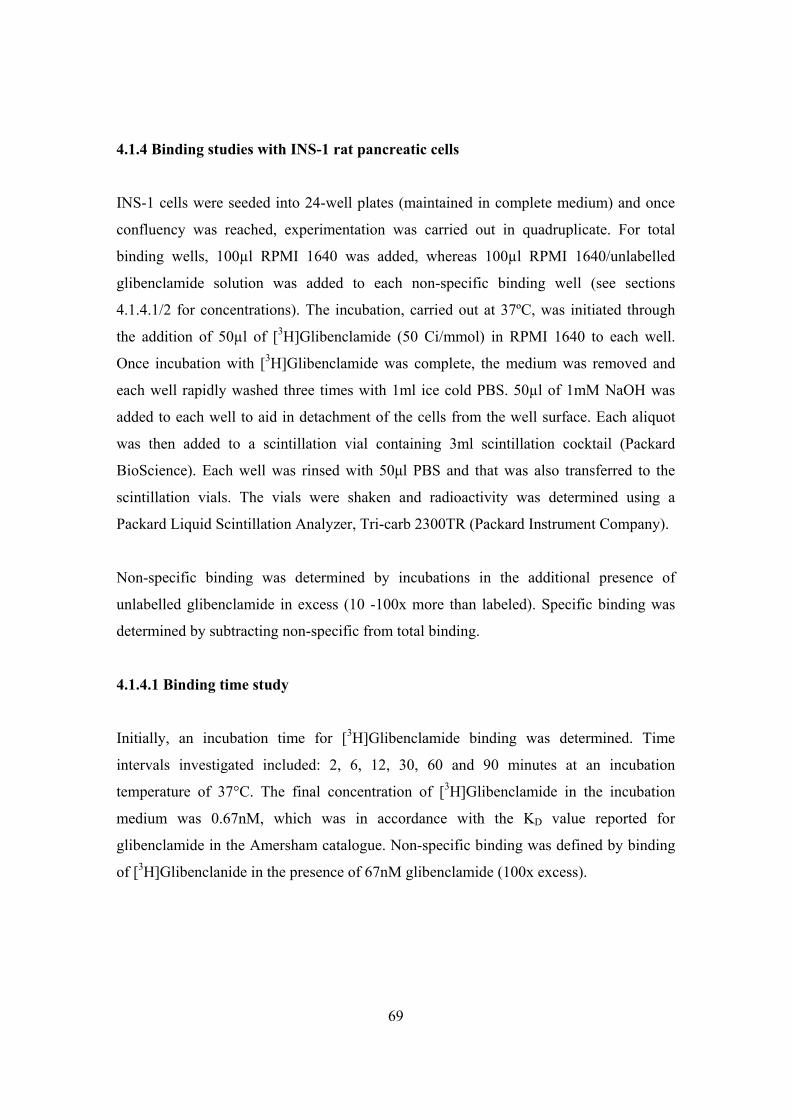
69
4.1.4 Binding studies with INS-1 rat pancreatic cells INS-1 cells were seeded into 24-well plates (maintained in complete medium) and once
confluency was reached, experimentation was carried out in quadruplicate. For total
binding wells, 100µl RPMI 1640 was added, whereas 100µl RPMI 1640/unlabelled
glibenclamide solution was added to each non-specific binding well (see sections
4.1.4.1/2 for concentrations). The incubation, carried out at 37ºC, was initiated through
the addition of 50µl of [3H]Glibenclamide (50 Ci/mmol) in RPMI 1640 to each well.
Once incubation with [3H]Glibenclamide was complete, the medium was removed and
each well rapidly washed three times with 1ml ice cold PBS. 50µl of 1mM NaOH was
added to each well to aid in detachment of the cells from the well surface. Each aliquot
was then added to a scintillation vial containing 3ml scintillation cocktail (Packard
BioScience). Each well was rinsed with 50μl PBS and that was also transferred to the
scintillation vials. The vials were shaken and radioactivity was determined using a
Packard Liquid Scintillation Analyzer, Tri-carb 2300TR (Packard Instrument Company).
Non-specific binding was determined by incubations in the additional presence of
unlabelled glibenclamide in excess (10 -100x more than labeled). Specific binding was
determined by subtracting non-specific from total binding.
4.1.4.1 Binding time study
Initially, an incubation time for [3H]Glibenclamide binding was determined. Time
intervals investigated included: 2, 6, 12, 30, 60 and 90 minutes at an incubation
temperature of 37°C. The final concentration of [3H]Glibenclamide in the incubation
medium was 0.67nM, which was in accordance with the KD value reported for
glibenclamide in the Amersham catalogue. Non-specific binding was defined by binding
of [3H]Glibenclanide in the presence of 67nM glibenclamide (100x excess).
70
4.1.4.2 Saturation binding study
For saturation experiments, the concentration of [3H]Glibenclamide was varied in order
to determine the actual KD value in the experimentation. This was performed using
concentrations of [3H]Glibenclamide between 0.25µM and 67nM. Non-specific binding
was determined by incubations in the presence of 1.34µM unlabelled glibenclamide.
Saturation binding studies were performed using a 30 minute incubation time at 37°C.
4.1.4.3 Displacement study
Inhibition of [3H]Glibenclamide binding to INS-1 cells was studied in the presence of
[3H]Glibenclamide (8nM) and unlabelled glibenclamide (1.34nM - 1.34µM) or the two
antidepressants, amitriptyline and trimipramine (0.67µM - 6.67µM). The concentration of
the two antidepressants was in accordance with reported plasma levels. Displacement
studies were carried out at a temperature of 37°C for 30 minutes.
4.1.5 Statistical analysis
Statistics were carried out on results using the data analysis program in Microsoft Excel
as described in section 3.5. The actual KD value for [3H]Glibenclamide was calculated
using GraphPad Prism Version 4.
71
4.2 Results and Discussion 4.2.1 Cytotoxicity
The assays to determine the cytotoxicity of treatments to INS-1 cells were carried out in
the same way seen in sections 3.1.1 and 3.1.2. Similarily the concentrations tested for the
plant extracts, namely Kankerbos and MRC(2003), ranged from (0.0025 – 25μg/well).
The antidepressant, amitriptyline, was tested using the same concentrations used for other
treatments tested, ranging from 0.1 to 250μM. Glibenclamide was used as the positive
control and the concentrations tested included: 0.001, 0.01, 0.1, 1 and 10μM. The reason
that the highest concentration tested was only 10μM compared to the usual 250μM, was
due to solubility problems experienced as well as information obtained from the binding
studies performed.
The cytotoxicity results shown in figure 4.1 reveal at which concentration each treatment
should be tested on the INS-1 cells. The basic rule of cytotoxicity tests is that any
concentration that shows less than 80% of control is too cytotoxic for the specific cell
line it is being tested on. The graph of amitriptyline indicates that at high concentrations
(50 and 250 μM) it is very cytotoxic to INS-1 cells. One does not want too low a dosage
of a treatment for experimentation because one requires an effect of some sort to be seen.
Therefore the 1μM concentration was chosen to be used on all the tests on INS-1 cells.
All the concentrations of glibenclamide tested on INS-1 showed no cytotoxic effect. 1μM
glibenclamide was chosen for further studies on the INS-1 cell line, as it was decided to
keep the treatment concentrations the same. The plant extract Kankerbos was found to be
cytotoxic at the two highest concentrations tested, namely 2.5 and 25 μg/well. A
concentration of 0.5 μg/well was decided upon for further experimentation and the same
concentration would be used for the MRC2003 plant extract as well. All results shown
for the plant extracts are μg/well, however a conversion table showing the μg/ml values is
shown in Appendix 1.
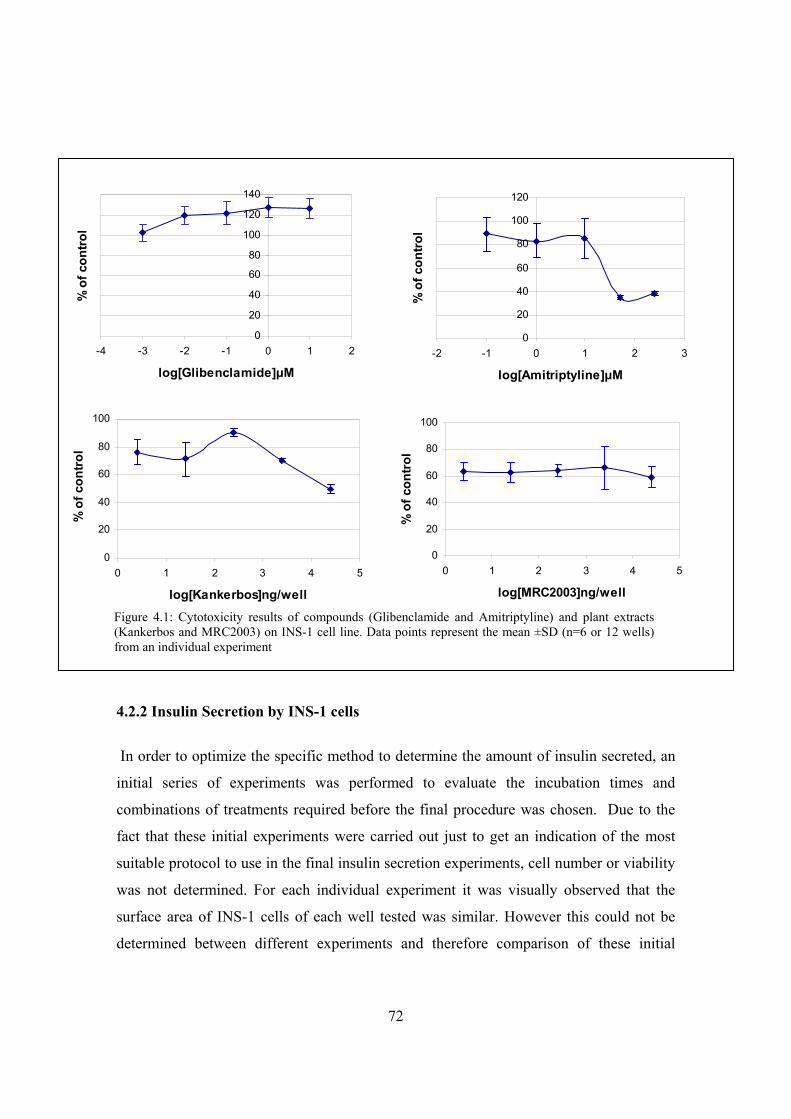
72
4.2.2 Insulin Secretion by INS-1 cells
In order to optimize the specific method to determine the amount of insulin secreted, an
initial series of experiments was performed to evaluate the incubation times and
combinations of treatments required before the final procedure was chosen. Due to the
fact that these initial experiments were carried out just to get an indication of the most
suitable protocol to use in the final insulin secretion experiments, cell number or viability
was not determined. For each individual experiment it was visually observed that the
surface area of INS-1 cells of each well tested was similar. However this could not be
determined between different experiments and therefore comparison of these initial
0
20
40
60
80
100
0 1 2 3 4 5
log[Kankerbos]ng/well
% o
f con
trol
0
20
40
60
80
100
0 1 2 3 4 5
log[MRC2003]ng/well
% o
f con
trol
0
20
40
60
80
100
120
140
-4 -3 -2 -1 0 1 2
log[Glibenclamide]μM
% o
f con
trol
0
20
40
60
80
100
120
-2 -1 0 1 2 3
log[Amitriptyline]μM
% o
f con
trol
Figure 4.1: Cytotoxicity results of compounds (Glibenclamide and Amitriptyline) and plant extracts (Kankerbos and MRC2003) on INS-1 cell line. Data points represent the mean ±SD (n=6 or 12 wells) from an individual experiment
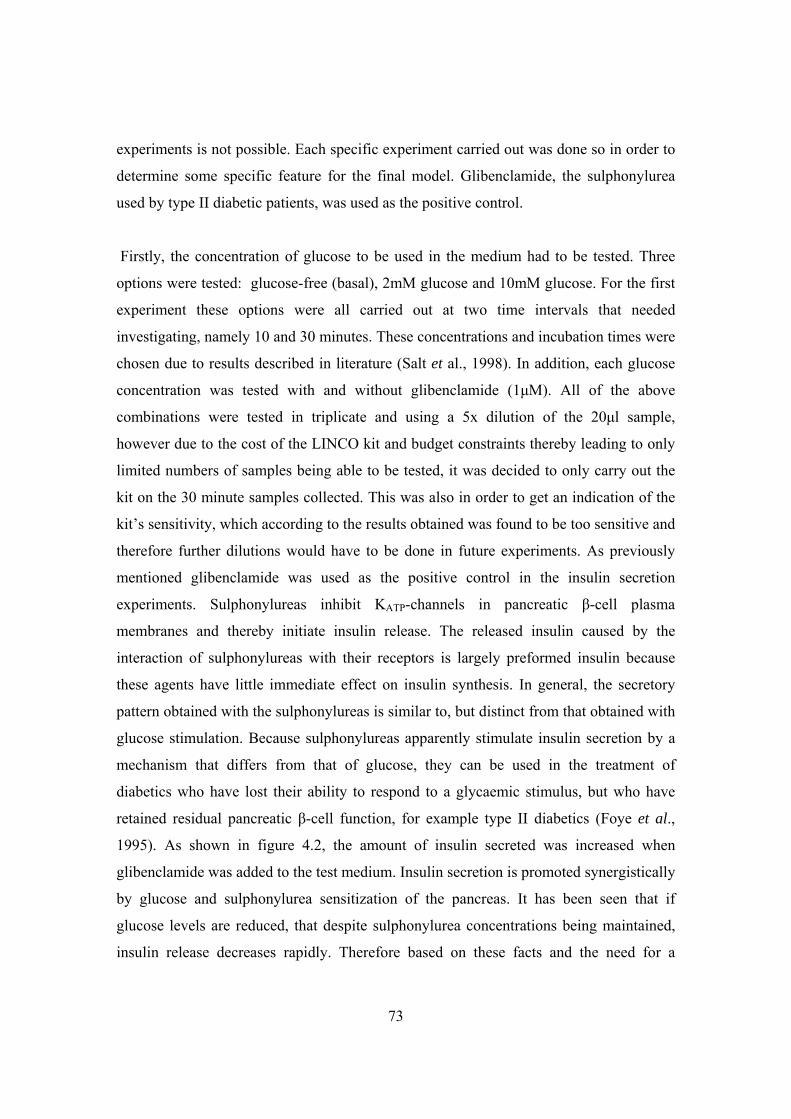
73
experiments is not possible. Each specific experiment carried out was done so in order to
determine some specific feature for the final model. Glibenclamide, the sulphonylurea
used by type II diabetic patients, was used as the positive control.
Firstly, the concentration of glucose to be used in the medium had to be tested. Three
options were tested: glucose-free (basal), 2mM glucose and 10mM glucose. For the first
experiment these options were all carried out at two time intervals that needed
investigating, namely 10 and 30 minutes. These concentrations and incubation times were
chosen due to results described in literature (Salt et al., 1998). In addition, each glucose
concentration was tested with and without glibenclamide (1μM). All of the above
combinations were tested in triplicate and using a 5x dilution of the 20μl sample,
however due to the cost of the LINCO kit and budget constraints thereby leading to only
limited numbers of samples being able to be tested, it was decided to only carry out the
kit on the 30 minute samples collected. This was also in order to get an indication of the
kit’s sensitivity, which according to the results obtained was found to be too sensitive and
therefore further dilutions would have to be done in future experiments. As previously
mentioned glibenclamide was used as the positive control in the insulin secretion
experiments. Sulphonylureas inhibit KATP-channels in pancreatic β-cell plasma
membranes and thereby initiate insulin release. The released insulin caused by the
interaction of sulphonylureas with their receptors is largely preformed insulin because
these agents have little immediate effect on insulin synthesis. In general, the secretory
pattern obtained with the sulphonylureas is similar to, but distinct from that obtained with
glucose stimulation. Because sulphonylureas apparently stimulate insulin secretion by a
mechanism that differs from that of glucose, they can be used in the treatment of
diabetics who have lost their ability to respond to a glycaemic stimulus, but who have
retained residual pancreatic β-cell function, for example type II diabetics (Foye et al.,
1995). As shown in figure 4.2, the amount of insulin secreted was increased when
glibenclamide was added to the test medium. Insulin secretion is promoted synergistically
by glucose and sulphonylurea sensitization of the pancreas. It has been seen that if
glucose levels are reduced, that despite sulphonylurea concentrations being maintained,
insulin release decreases rapidly. Therefore based on these facts and the need for a
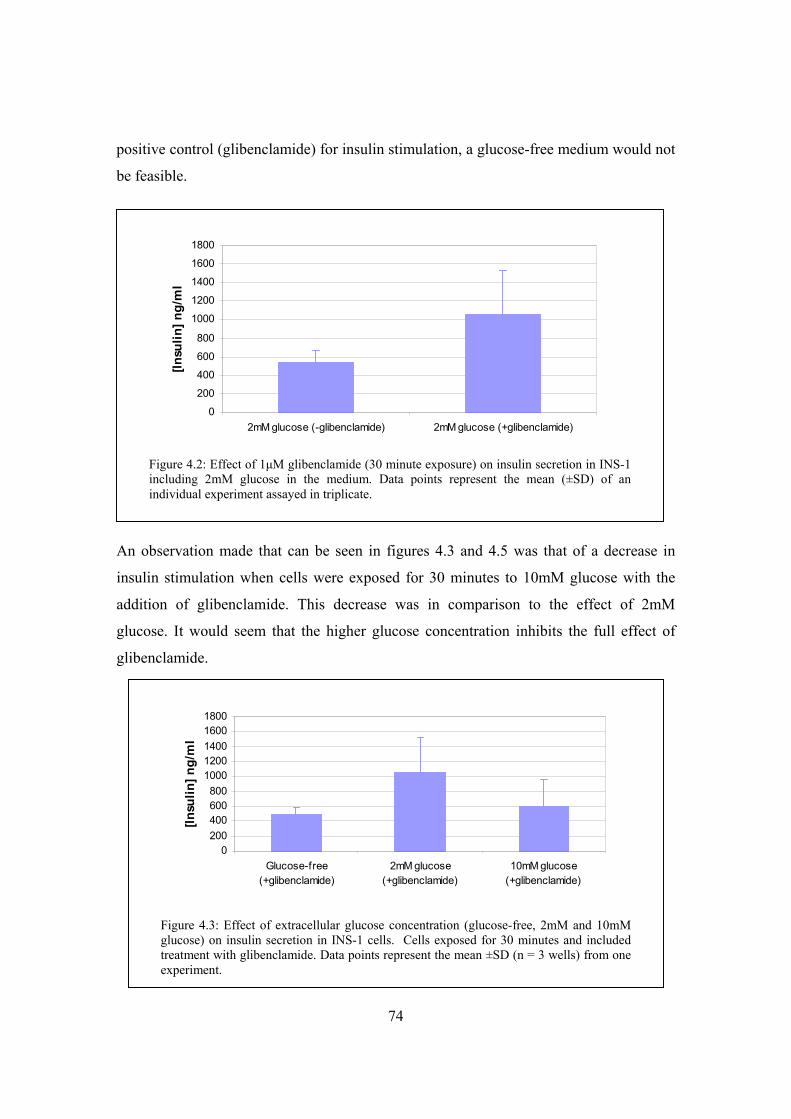
74
positive control (glibenclamide) for insulin stimulation, a glucose-free medium would not
be feasible.
An observation made that can be seen in figures 4.3 and 4.5 was that of a decrease in
insulin stimulation when cells were exposed for 30 minutes to 10mM glucose with the
addition of glibenclamide. This decrease was in comparison to the effect of 2mM
glucose. It would seem that the higher glucose concentration inhibits the full effect of
glibenclamide.
0
200
400
600
800
1000
1200
1400
1600
1800
2mM glucose (-glibenclamide) 2mM glucose (+glibenclamide)
[Insu
lin] n
g/m
l
Figure 4.2: Effect of 1μM glibenclamide (30 minute exposure) on insulin secretion in INS-1 including 2mM glucose in the medium. Data points represent the mean (±SD) of an individual experiment assayed in triplicate.
0200400600800
10001200140016001800
Glucose-free(+glibenclamide)
2mM glucose(+glibenclamide)
10mM glucose(+glibenclamide)
[Insu
lin] n
g/m
l
Figure 4.3: Effect of extracellular glucose concentration (glucose-free, 2mM and 10mM glucose) on insulin secretion in INS-1 cells. Cells exposed for 30 minutes and included treatment with glibenclamide. Data points represent the mean ±SD (n = 3 wells) from one experiment.
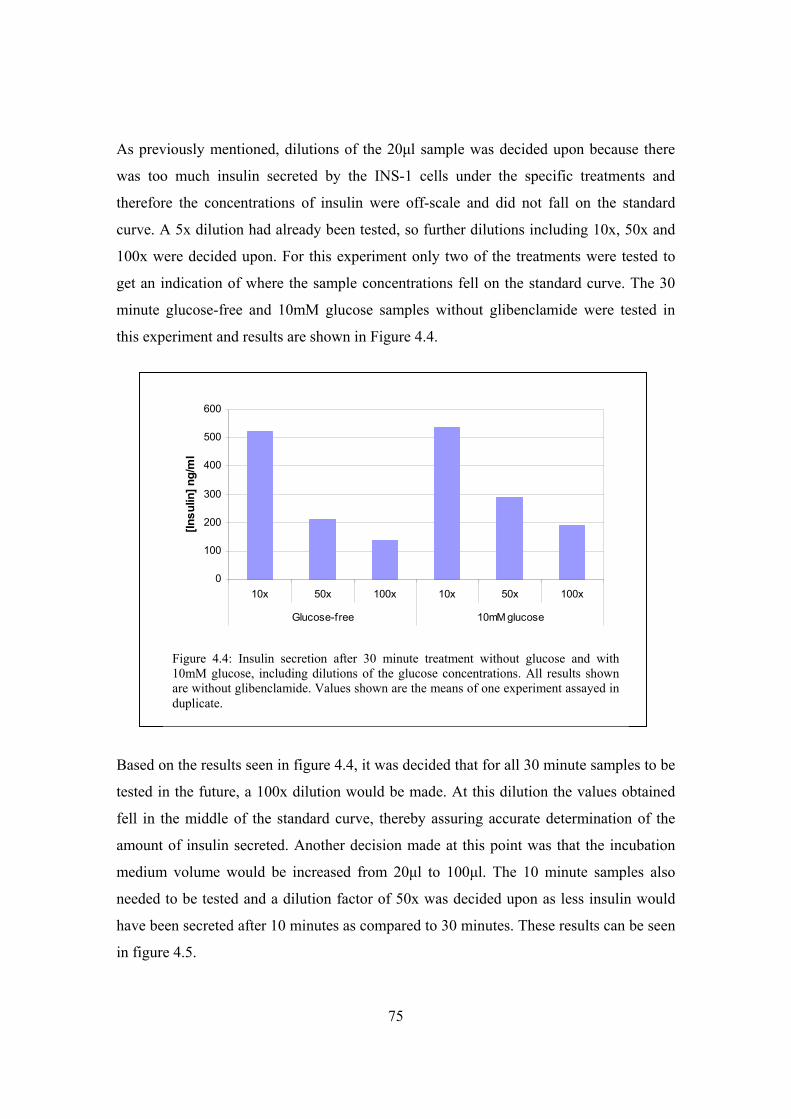
75
As previously mentioned, dilutions of the 20μl sample was decided upon because there
was too much insulin secreted by the INS-1 cells under the specific treatments and
therefore the concentrations of insulin were off-scale and did not fall on the standard
curve. A 5x dilution had already been tested, so further dilutions including 10x, 50x and
100x were decided upon. For this experiment only two of the treatments were tested to
get an indication of where the sample concentrations fell on the standard curve. The 30
minute glucose-free and 10mM glucose samples without glibenclamide were tested in
this experiment and results are shown in Figure 4.4.
Based on the results seen in figure 4.4, it was decided that for all 30 minute samples to be
tested in the future, a 100x dilution would be made. At this dilution the values obtained
fell in the middle of the standard curve, thereby assuring accurate determination of the
amount of insulin secreted. Another decision made at this point was that the incubation
medium volume would be increased from 20μl to 100μl. The 10 minute samples also
needed to be tested and a dilution factor of 50x was decided upon as less insulin would
have been secreted after 10 minutes as compared to 30 minutes. These results can be seen
in figure 4.5.
0
100
200
300
400
500
600
10x 50x 100x 10x 50x 100x
Glucose-free 10mM glucose
[Insu
lin] n
g/m
l
Figure 4.4: Insulin secretion after 30 minute treatment without glucose and with 10mM glucose, including dilutions of the glucose concentrations. All results shown are without glibenclamide. Values shown are the means of one experiment assayed in duplicate.
Figure 4.4: Insulin secretion after 30 minute treatment without glucose and with 10mM glucose, including dilutions of the glucose concentrations. All results shown are without glibenclamide. Values shown are the means of one experiment assayed in duplicate.
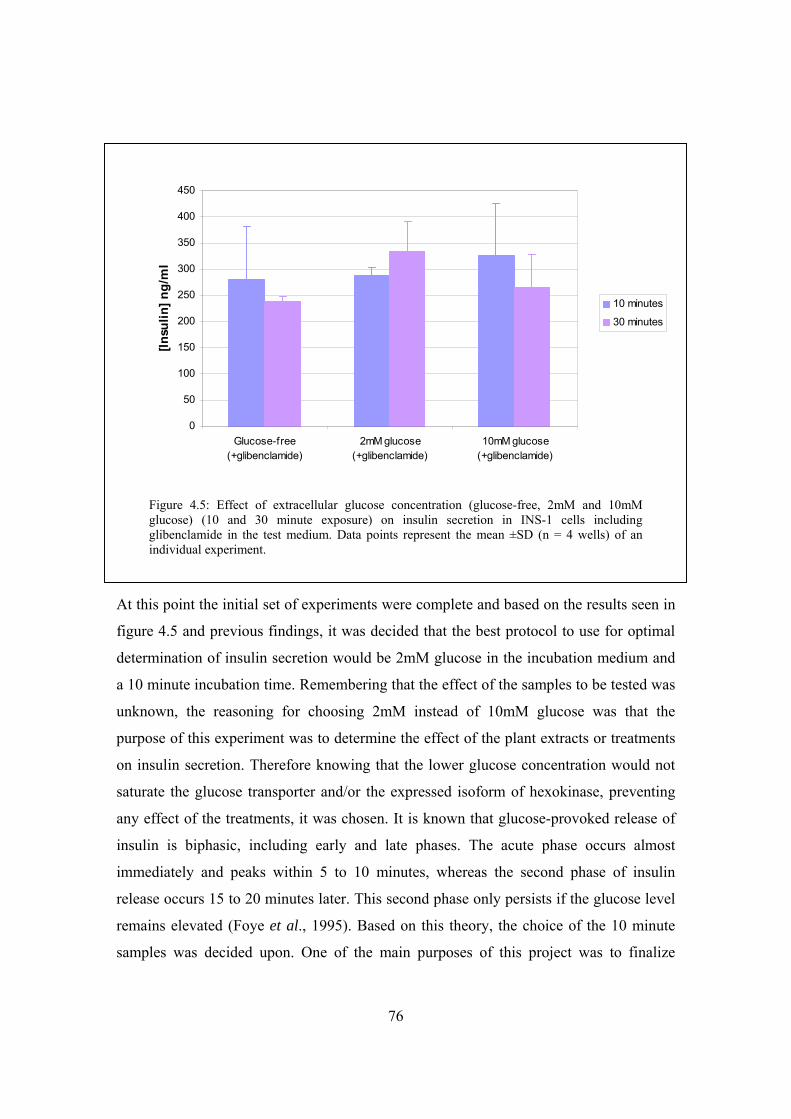
76
At this point the initial set of experiments were complete and based on the results seen in
figure 4.5 and previous findings, it was decided that the best protocol to use for optimal
determination of insulin secretion would be 2mM glucose in the incubation medium and
a 10 minute incubation time. Remembering that the effect of the samples to be tested was
unknown, the reasoning for choosing 2mM instead of 10mM glucose was that the
purpose of this experiment was to determine the effect of the plant extracts or treatments
on insulin secretion. Therefore knowing that the lower glucose concentration would not
saturate the glucose transporter and/or the expressed isoform of hexokinase, preventing
any effect of the treatments, it was chosen. It is known that glucose-provoked release of
insulin is biphasic, including early and late phases. The acute phase occurs almost
immediately and peaks within 5 to 10 minutes, whereas the second phase of insulin
release occurs 15 to 20 minutes later. This second phase only persists if the glucose level
remains elevated (Foye et al., 1995). Based on this theory, the choice of the 10 minute
samples was decided upon. One of the main purposes of this project was to finalize
0
50
100
150
200
250
300
350
400
450
Glucose-free(+glibenclamide)
2mM glucose(+glibenclamide)
10mM glucose(+glibenclamide)
[Insu
lin] n
g/m
l
10 minutes
30 minutes
Figure 4.5: Effect of extracellular glucose concentration (glucose-free, 2mM and 10mM glucose) (10 and 30 minute exposure) on insulin secretion in INS-1 cells including glibenclamide in the test medium. Data points represent the mean ±SD (n = 4 wells) of an individual experiment.
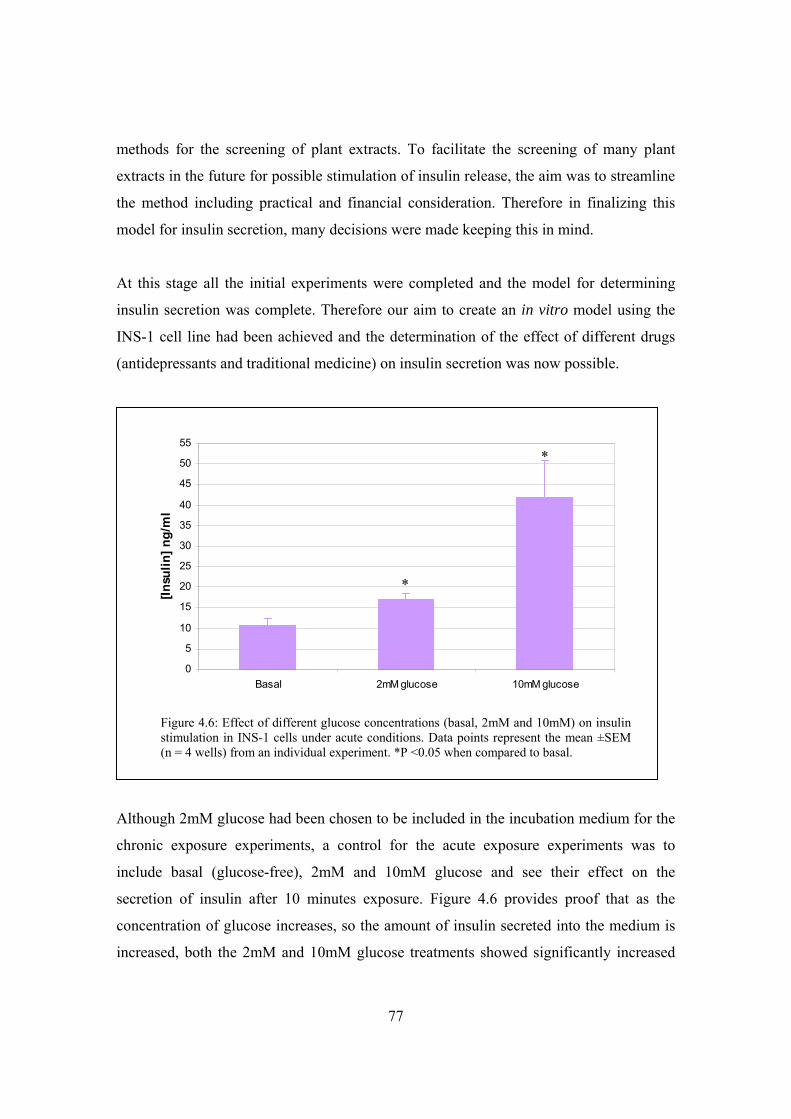
77
methods for the screening of plant extracts. To facilitate the screening of many plant
extracts in the future for possible stimulation of insulin release, the aim was to streamline
the method including practical and financial consideration. Therefore in finalizing this
model for insulin secretion, many decisions were made keeping this in mind.
At this stage all the initial experiments were completed and the model for determining
insulin secretion was complete. Therefore our aim to create an in vitro model using the
INS-1 cell line had been achieved and the determination of the effect of different drugs
(antidepressants and traditional medicine) on insulin secretion was now possible.
Although 2mM glucose had been chosen to be included in the incubation medium for the
chronic exposure experiments, a control for the acute exposure experiments was to
include basal (glucose-free), 2mM and 10mM glucose and see their effect on the
secretion of insulin after 10 minutes exposure. Figure 4.6 provides proof that as the
concentration of glucose increases, so the amount of insulin secreted into the medium is
increased, both the 2mM and 10mM glucose treatments showed significantly increased
0
5
10
15
20
25
30
35
40
45
50
55
Basal 2mM glucose 10mM glucose
[Insu
lin] n
g/m
l
Figure 4.6: Effect of different glucose concentrations (basal, 2mM and 10mM) on insulin stimulation in INS-1 cells under acute conditions. Data points represent the mean ±SEM (n = 4 wells) from an individual experiment. *P <0.05 when compared to basal.
*
*
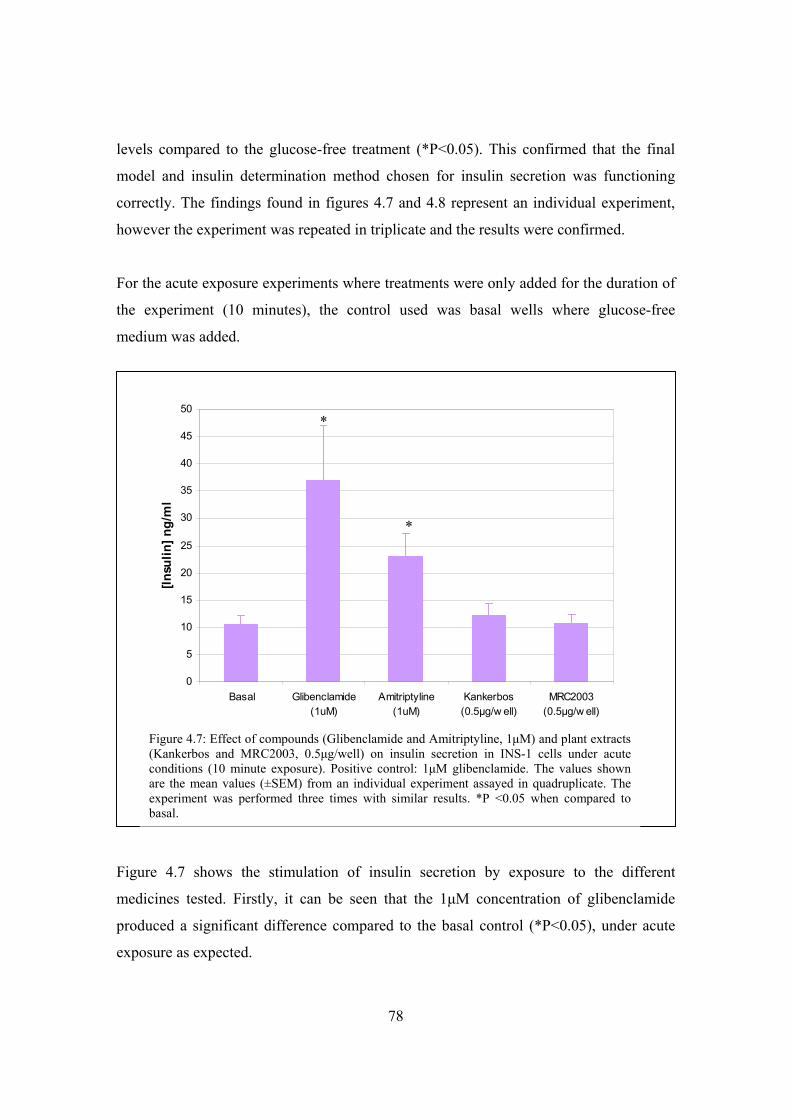
78
levels compared to the glucose-free treatment (*P<0.05). This confirmed that the final
model and insulin determination method chosen for insulin secretion was functioning
correctly. The findings found in figures 4.7 and 4.8 represent an individual experiment,
however the experiment was repeated in triplicate and the results were confirmed.
For the acute exposure experiments where treatments were only added for the duration of
the experiment (10 minutes), the control used was basal wells where glucose-free
medium was added.
Figure 4.7 shows the stimulation of insulin secretion by exposure to the different
medicines tested. Firstly, it can be seen that the 1μM concentration of glibenclamide
produced a significant difference compared to the basal control (*P<0.05), under acute
exposure as expected.
0
5
10
15
20
25
30
35
40
45
50
Basal Glibenclamide(1uM)
Amitriptyline(1uM)
Kankerbos(0.5μg/w ell)
MRC2003(0.5μg/w ell)
[Insu
lin] n
g/m
l
Figure 4.7: Effect of compounds (Glibenclamide and Amitriptyline, 1μM) and plant extracts (Kankerbos and MRC2003, 0.5μg/well) on insulin secretion in INS-1 cells under acute conditions (10 minute exposure). Positive control: 1μM glibenclamide. The values shown are the mean values (±SEM) from an individual experiment assayed in quadruplicate. The experiment was performed three times with similar results. *P <0.05 when compared to basal.
*
*
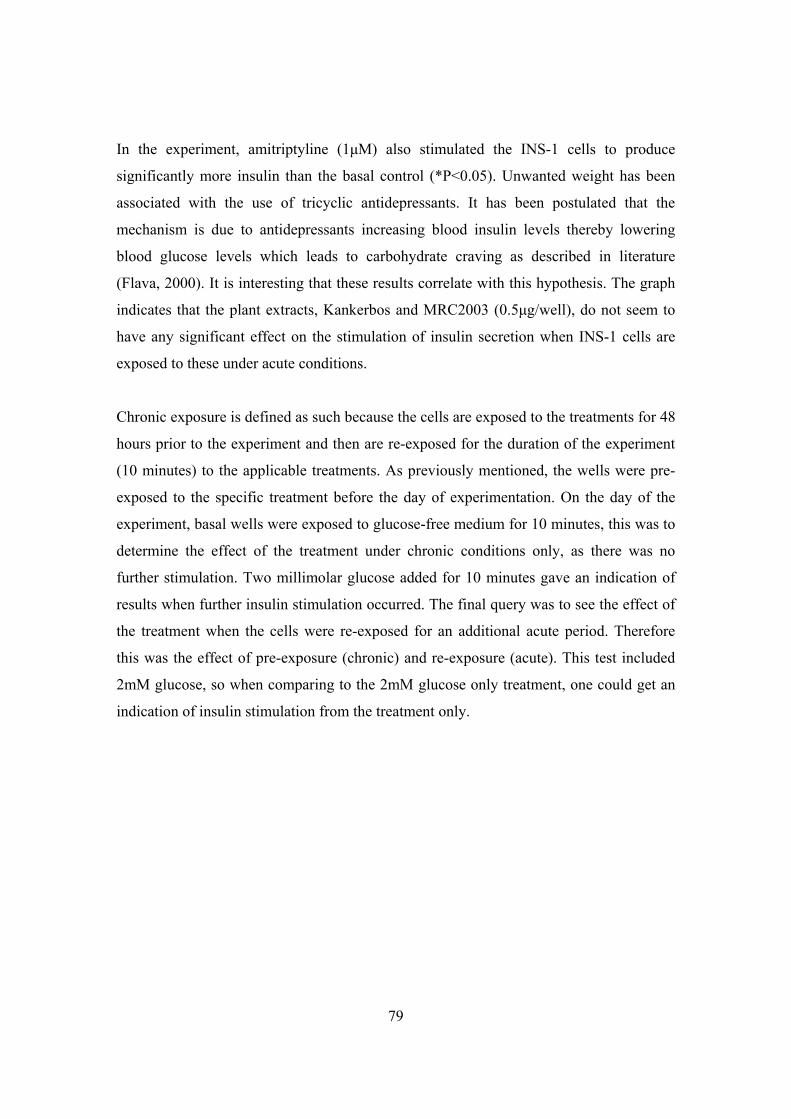
79
In the experiment, amitriptyline (1μM) also stimulated the INS-1 cells to produce
significantly more insulin than the basal control (*P<0.05). Unwanted weight has been
associated with the use of tricyclic antidepressants. It has been postulated that the
mechanism is due to antidepressants increasing blood insulin levels thereby lowering
blood glucose levels which leads to carbohydrate craving as described in literature
(Flava, 2000). It is interesting that these results correlate with this hypothesis. The graph
indicates that the plant extracts, Kankerbos and MRC2003 (0.5μg/well), do not seem to
have any significant effect on the stimulation of insulin secretion when INS-1 cells are
exposed to these under acute conditions.
Chronic exposure is defined as such because the cells are exposed to the treatments for 48
hours prior to the experiment and then are re-exposed for the duration of the experiment
(10 minutes) to the applicable treatments. As previously mentioned, the wells were pre-
exposed to the specific treatment before the day of experimentation. On the day of the
experiment, basal wells were exposed to glucose-free medium for 10 minutes, this was to
determine the effect of the treatment under chronic conditions only, as there was no
further stimulation. Two millimolar glucose added for 10 minutes gave an indication of
results when further insulin stimulation occurred. The final query was to see the effect of
the treatment when the cells were re-exposed for an additional acute period. Therefore
this was the effect of pre-exposure (chronic) and re-exposure (acute). This test included
2mM glucose, so when comparing to the 2mM glucose only treatment, one could get an
indication of insulin stimulation from the treatment only.
80
The hyperinsulinemia realized with sulphonylureas (glibenclamide) is transient. When
the sulphonylureas are administered chronically, the plasma insulin levels usually, but not
always, decline to pretreatment levels or below. The decline has been shown to be
associated with decreases in proinsulin synthesis, pancreatic insulin content and insulin
secretion (Foye et al., 1995). Based on the theory discussed, glibenclamide (1μM) was
not expected to have a chronic effect, as its primary effect is seen with acute exposure
conditions. This was confirmed with the results obtained (figure 4.8), as no significant
difference was noted. As discussed previously, amitriptyline increased the amount of
insulin secreted by the INS-1 cells under acute conditions (figure 4.7), however one can
see in figure 4.8 that there was no significant difference between the basal, 2mM glucose,
2mM glucose including amitriptyline, thereby indicating that amitriptyline does not affect
insulin secretion on the chronic exposure level. There was no significant difference seen
between basal and 2mM for the plant extract, Kankerbos (0.5μg/well), indicating that
0
10
20
30
40
50
60
Glibenclamide(1μM)
Amitriptyline(1μM)
Kankerbos(0.5μg/w ell)
MRC2003(0.5μg/w ell)
[Insu
lin] n
g/m
l
Basal
2mM glucose
2mM glucose + treatment
Figure 4.8: Effect of extracellular glucose as well as the test compounds (Glibenclamide and Amitriptyline, 1μM) and plant extracts (Kankerbos and MRC2003, 0.5μg/well) on insulin secretion in INS-1 cells under chronic conditions. The values shown are the mean values (±SEM) from an individual experiment assayed in quadruplicate. The experiment was performed three times with similar results. *P <0.05 when compared to 2mM glucose.
*
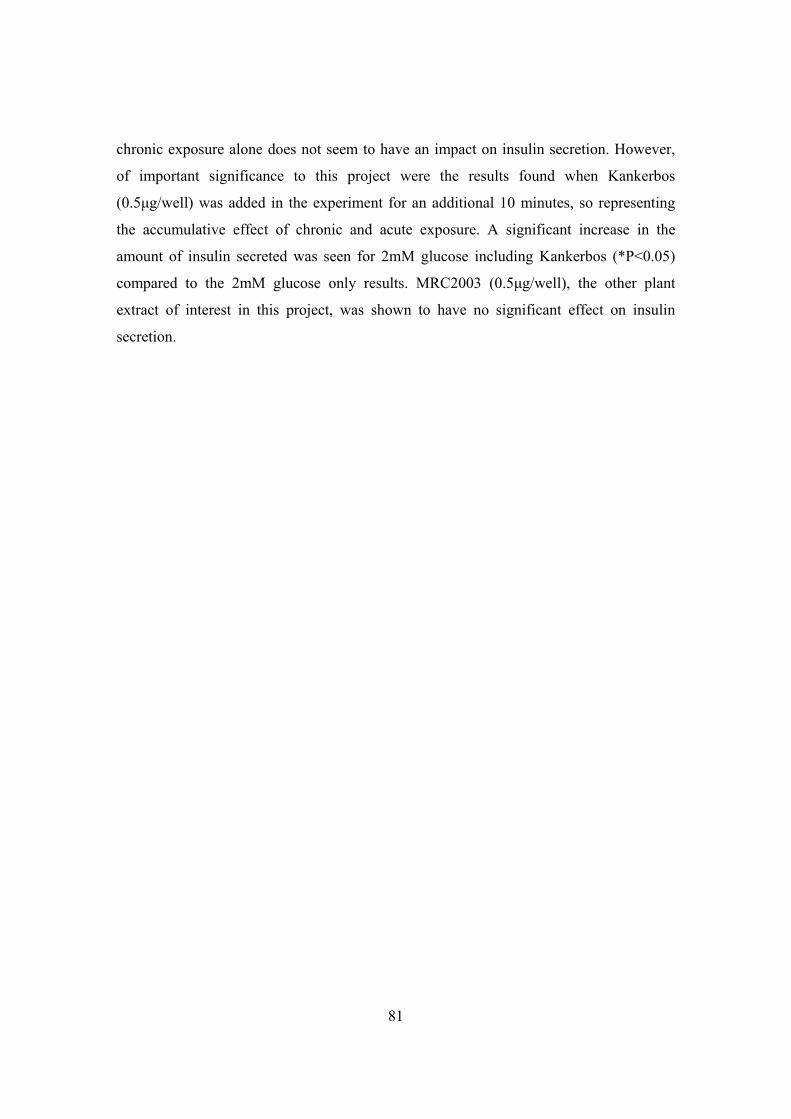
81
chronic exposure alone does not seem to have an impact on insulin secretion. However,
of important significance to this project were the results found when Kankerbos
(0.5μg/well) was added in the experiment for an additional 10 minutes, so representing
the accumulative effect of chronic and acute exposure. A significant increase in the
amount of insulin secreted was seen for 2mM glucose including Kankerbos (*P<0.05)
compared to the 2mM glucose only results. MRC2003 (0.5μg/well), the other plant
extract of interest in this project, was shown to have no significant effect on insulin
secretion.
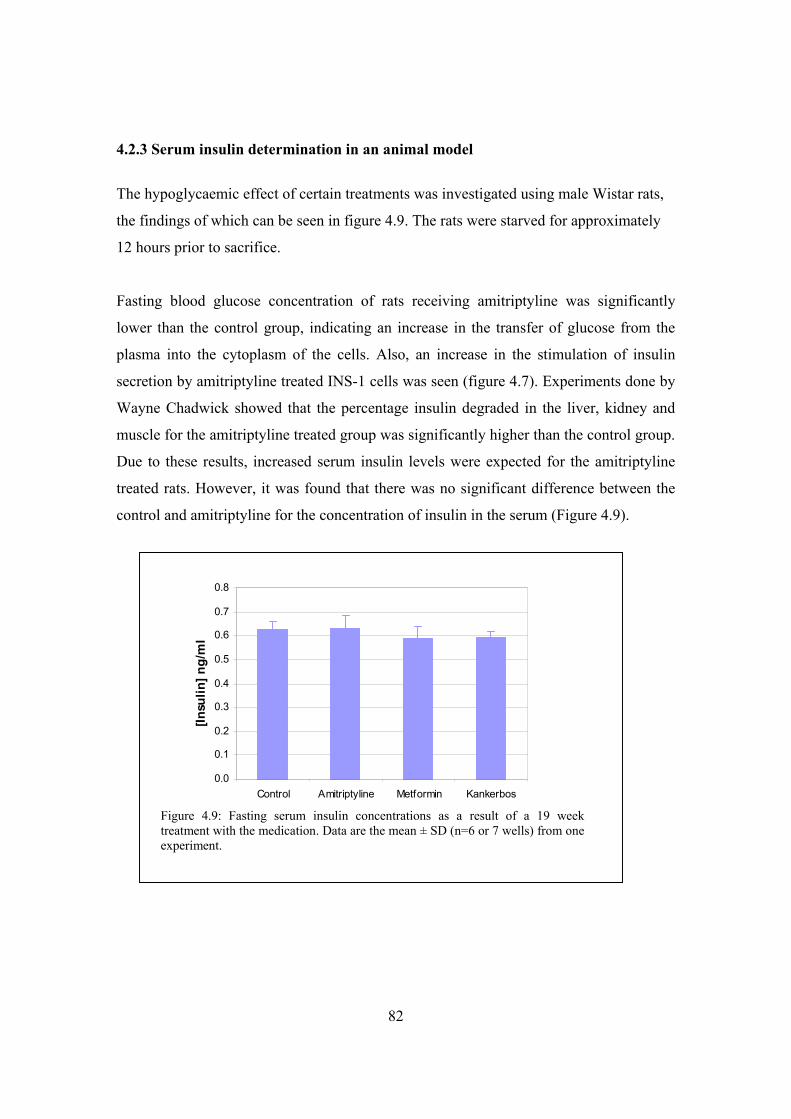
82
4.2.3 Serum insulin determination in an animal model
The hypoglycaemic effect of certain treatments was investigated using male Wistar rats,
the findings of which can be seen in figure 4.9. The rats were starved for approximately
12 hours prior to sacrifice.
Fasting blood glucose concentration of rats receiving amitriptyline was significantly
lower than the control group, indicating an increase in the transfer of glucose from the
plasma into the cytoplasm of the cells. Also, an increase in the stimulation of insulin
secretion by amitriptyline treated INS-1 cells was seen (figure 4.7). Experiments done by
Wayne Chadwick showed that the percentage insulin degraded in the liver, kidney and
muscle for the amitriptyline treated group was significantly higher than the control group.
Due to these results, increased serum insulin levels were expected for the amitriptyline
treated rats. However, it was found that there was no significant difference between the
control and amitriptyline for the concentration of insulin in the serum (Figure 4.9).
0.0
0.1
0.2
0.3
0.4
0.5
0.6
0.7
0.8
Control Amitriptyline Metformin Kankerbos
[Insu
lin] n
g/m
l
Figure 4.9: Fasting serum insulin concentrations as a result of a 19 week treatment with the medication. Data are the mean ± SD (n=6 or 7 wells) from one experiment.
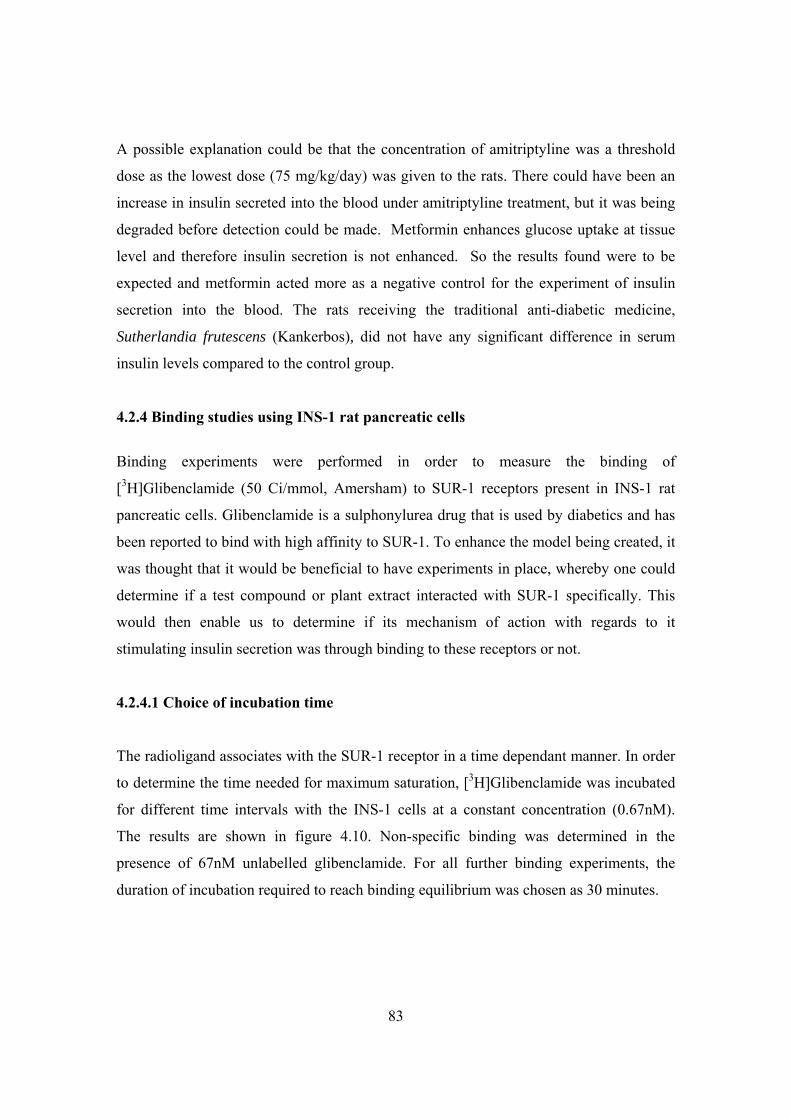
83
A possible explanation could be that the concentration of amitriptyline was a threshold
dose as the lowest dose (75 mg/kg/day) was given to the rats. There could have been an
increase in insulin secreted into the blood under amitriptyline treatment, but it was being
degraded before detection could be made. Metformin enhances glucose uptake at tissue
level and therefore insulin secretion is not enhanced. So the results found were to be
expected and metformin acted more as a negative control for the experiment of insulin
secretion into the blood. The rats receiving the traditional anti-diabetic medicine,
Sutherlandia frutescens (Kankerbos), did not have any significant difference in serum
insulin levels compared to the control group.
4.2.4 Binding studies using INS-1 rat pancreatic cells
Binding experiments were performed in order to measure the binding of
[3H]Glibenclamide (50 Ci/mmol, Amersham) to SUR-1 receptors present in INS-1 rat
pancreatic cells. Glibenclamide is a sulphonylurea drug that is used by diabetics and has
been reported to bind with high affinity to SUR-1. To enhance the model being created, it
was thought that it would be beneficial to have experiments in place, whereby one could
determine if a test compound or plant extract interacted with SUR-1 specifically. This
would then enable us to determine if its mechanism of action with regards to it
stimulating insulin secretion was through binding to these receptors or not.
4.2.4.1 Choice of incubation time
The radioligand associates with the SUR-1 receptor in a time dependant manner. In order
to determine the time needed for maximum saturation, [3H]Glibenclamide was incubated
for different time intervals with the INS-1 cells at a constant concentration (0.67nM).
The results are shown in figure 4.10. Non-specific binding was determined in the
presence of 67nM unlabelled glibenclamide. For all further binding experiments, the
duration of incubation required to reach binding equilibrium was chosen as 30 minutes.
84
4.2.4.2 Saturation binding
Non-specific binding was measured at different radioligand concentrations in
combination with an excess (saturating) of unlabelled competing ligand. Through the
subtraction of these values from the total binding at each radioligand concentration, the
specific binding was calculated (figure 4.11). Non-specific binding increased linearly as
expected, whereas specific binding was saturable indicating that all the receptors were
saturated with glibenclamide.
Figure 4.10: Specific binding of [3H]glibenclamide by INS-1 cells as a function of incubation time. Data points represent the mean ±SEM (n = 3 or 4 wells) from a single experiment.
0
200
400
600
800
1000
1200
0 10 20 30 40 50 60 70 80
[Glibenclamide] (nM)
Bou
nd li
gand
(cpm
/wel
l)
Total
Non-specific
Specific
Figure 4.11: Saturation binding curve. Data points for total, non-specific and specific binding are mean ±SD (n=3 or 4 wells) from a single experiment.
020406080
100120140160
0 20 40 60 80 100
Time (min)
Spe
cific
bin
ding
(C
PM
/wel
l)
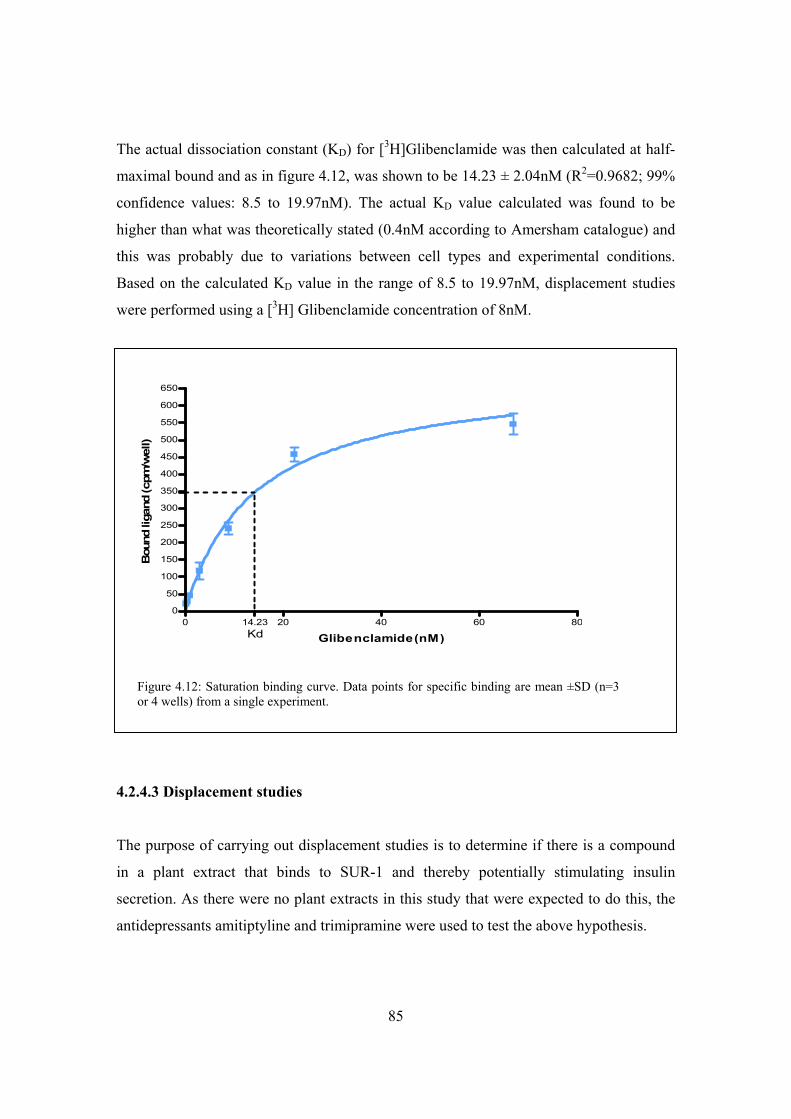
85
The actual dissociation constant (KD) for [3H]Glibenclamide was then calculated at half-
maximal bound and as in figure 4.12, was shown to be 14.23 ± 2.04nM (R2=0.9682; 99%
confidence values: 8.5 to 19.97nM). The actual KD value calculated was found to be
higher than what was theoretically stated (0.4nM according to Amersham catalogue) and
this was probably due to variations between cell types and experimental conditions.
Based on the calculated KD value in the range of 8.5 to 19.97nM, displacement studies
were performed using a [3H] Glibenclamide concentration of 8nM.
4.2.4.3 Displacement studies
The purpose of carrying out displacement studies is to determine if there is a compound
in a plant extract that binds to SUR-1 and thereby potentially stimulating insulin
secretion. As there were no plant extracts in this study that were expected to do this, the
antidepressants amitiptyline and trimipramine were used to test the above hypothesis.
0 20 40 60 8014.230
50
100
150
200
250
300
350
400
450
500
550
600
650
Kd Glibenclamide(nM)
Bou
nd li
gand
(cpm
/wel
l)
Figure 4.12: Saturation binding curve. Data points for specific binding are mean ±SD (n=3 or 4 wells) from a single experiment.
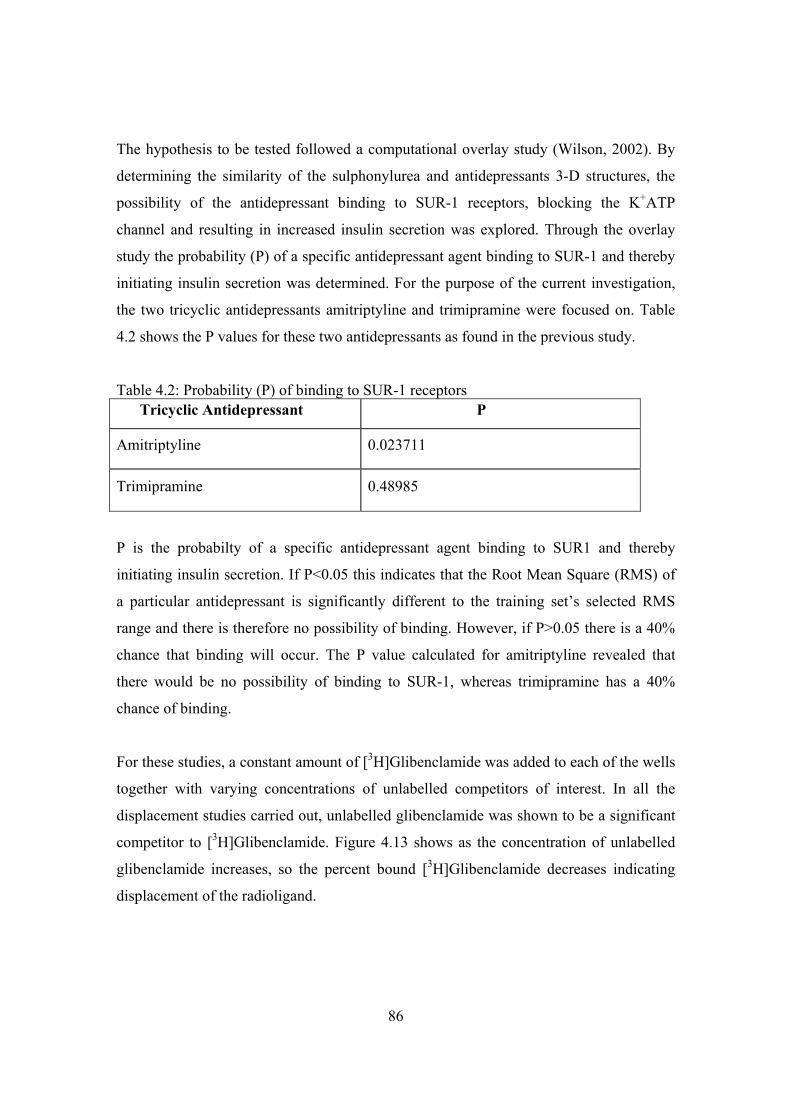
86
The hypothesis to be tested followed a computational overlay study (Wilson, 2002). By
determining the similarity of the sulphonylurea and antidepressants 3-D structures, the
possibility of the antidepressant binding to SUR-1 receptors, blocking the K+ATP
channel and resulting in increased insulin secretion was explored. Through the overlay
study the probability (P) of a specific antidepressant agent binding to SUR-1 and thereby
initiating insulin secretion was determined. For the purpose of the current investigation,
the two tricyclic antidepressants amitriptyline and trimipramine were focused on. Table
4.2 shows the P values for these two antidepressants as found in the previous study.
Table 4.2: Probability (P) of binding to SUR-1 receptors Tricyclic Antidepressant P
Amitriptyline 0.023711
Trimipramine 0.48985
P is the probabilty of a specific antidepressant agent binding to SUR1 and thereby
initiating insulin secretion. If P<0.05 this indicates that the Root Mean Square (RMS) of
a particular antidepressant is significantly different to the training set’s selected RMS
range and there is therefore no possibility of binding. However, if P>0.05 there is a 40%
chance that binding will occur. The P value calculated for amitriptyline revealed that
there would be no possibility of binding to SUR-1, whereas trimipramine has a 40%
chance of binding.
For these studies, a constant amount of [3H]Glibenclamide was added to each of the wells
together with varying concentrations of unlabelled competitors of interest. In all the
displacement studies carried out, unlabelled glibenclamide was shown to be a significant
competitor to [3H]Glibenclamide. Figure 4.13 shows as the concentration of unlabelled
glibenclamide increases, so the percent bound [3H]Glibenclamide decreases indicating
displacement of the radioligand.
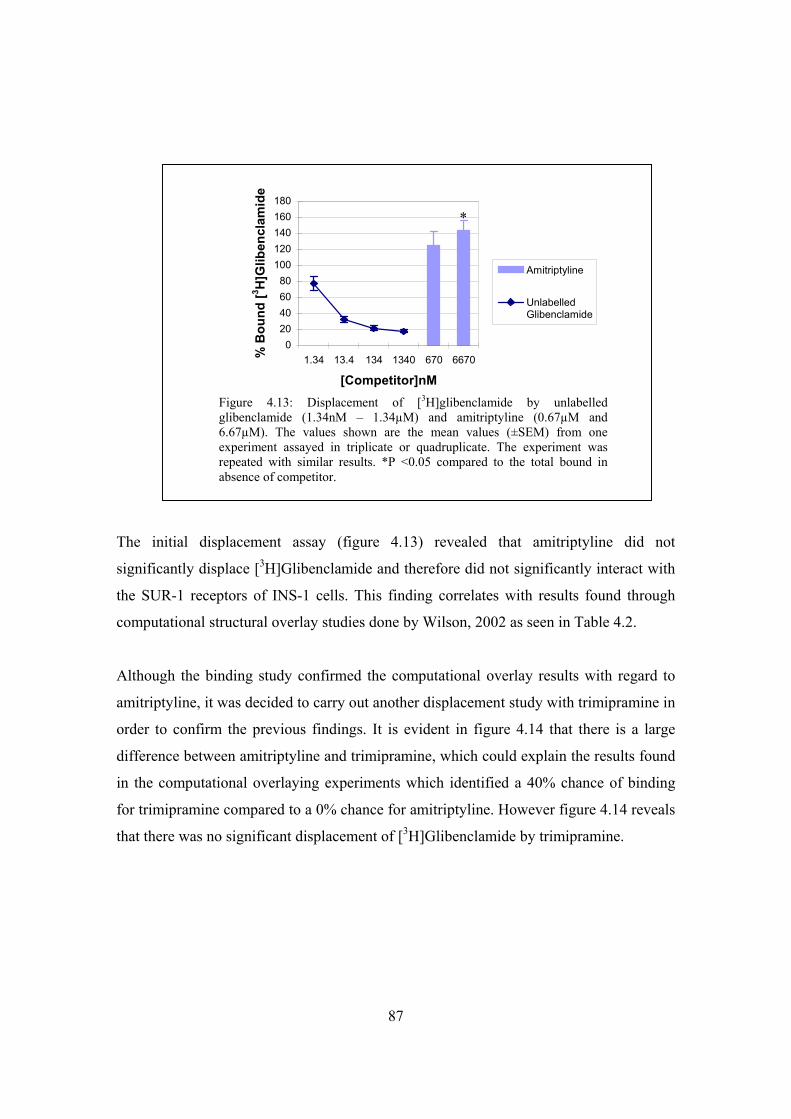
87
The initial displacement assay (figure 4.13) revealed that amitriptyline did not
significantly displace [3H]Glibenclamide and therefore did not significantly interact with
the SUR-1 receptors of INS-1 cells. This finding correlates with results found through
computational structural overlay studies done by Wilson, 2002 as seen in Table 4.2.
Although the binding study confirmed the computational overlay results with regard to
amitriptyline, it was decided to carry out another displacement study with trimipramine in
order to confirm the previous findings. It is evident in figure 4.14 that there is a large
difference between amitriptyline and trimipramine, which could explain the results found
in the computational overlaying experiments which identified a 40% chance of binding
for trimipramine compared to a 0% chance for amitriptyline. However figure 4.14 reveals
that there was no significant displacement of [3H]Glibenclamide by trimipramine.
020406080
100120140160180
1.34 13.4 134 1340 670 6670
[Competitor]nM
% B
ound
[3 H]G
liben
clam
ide
Amitriptyline
UnlabelledGlibenclamide
Figure 4.13: Displacement of [3H]glibenclamide by unlabelled glibenclamide (1.34nM – 1.34µM) and amitriptyline (0.67µM and 6.67µM). The values shown are the mean values (±SEM) from one experiment assayed in triplicate or quadruplicate. The experiment was repeated with similar results. *P <0.05 compared to the total bound in absence of competitor.
*

88
Figure 4.14 shows a continual finding during the binding studies was that amitriptyline
competition produced an increase in bound [3H]Glibenclamide greater than 100%. This
was investigated by implementing the use of a range of lower concentrations of
amitriptyline in the displacement studies, as seen in figure 4.15.
0
25
50
75
100
125
150
175
1.34 13.4 134 1340 670 6670
[Competitor]nM
% B
ound
[3 H]G
liben
clam
ide
Amitriptyline
Trimipramine
UnlabelledGlibenclamide
Figure 4.14: Displacement of [3H]glibenclamide by unlabelled glibenclamide (1.34nM – 1.34µM), amitriptyline and trimipramine (0.67µM and 6.67µM). The values shown are the mean values (±SEM) from one experiment assayed in triplicate or quadruplicate. *P <0.05 compared to the total bound in absence of competitor.
Figure 4.15: Displacement of [3H]glibenclamide by unlabelled glibenclamide (1.34nM – 1.34µM) and varying concentrations of unlabelled amitriptyline (0.67nM – 6.67μM). Mean ±SEM (n=3 or 4 wells) from an individual experiment.
*
0
20
40
60
80
100
120
140
1.34 13.4 134 1340 0.67 67 670 6670
[Competitor]nM
% B
ound
[3 H]G
liben
clam
ide
0
20
40
60
80
100
120
140
Amitriptyline
UnlabelledGlibenclamide
89
Figure 4.15 confirms that amitriptyline does not bind to the receptor, as there is no
displacement of [3H]Glibenclamide. Even at the lower concentrations of amitriptyline
tested, results produced binding of [3H]Glibenclamide that was greater than 100%.
Previous experiments (see figure 4.7), however show that amitriptyline does stimulate
insulin secretion by INS-1 cells under acute conditions. The mechanism is therefore not
clear at this stage, though we know it is not via the SUR-1 receptors, like sulphonylureas.
This confirms the results obtained previously ie. theoretical binding possibilities of
tricyclic antidepressants to SUR-1 (Wilson, 2002) in the computational overlaying
studies.
This series of experiments successfully determined the conditions needed to screen the
effects of drugs (compounds) or plant extracts on pancreatic cells.
90
Chapter 5
Conclusion
The present study investigated the in vitro antidiabetic properties of two indigenous
plants, with the aim to optimise the processes required for their screening and ultimately
the determination of their effectiveness. The study was based on the fact that these plant
extracts are being widely used as medicinal plants, however there is a lack of scientific
evidence for their efficacy. Determination of their efficacy is vital as these medicinal
plants may serve as important participants in the management of type II diabetes in the
future and thereby make a positive contribution to South Africa’s health care services.
Type II diabetes is characterised by abnormal glucose homeostasis leading to
hyperglycaemia. The mechanism of action of many hypoglycaemic drugs used for type II
diabetes is based on their ability to positively affect glucose utilisation and insulin
secretion. Therefore in creating a model for determining the effects of alternative
traditional medicines as antidiabetic potentiates, it was necessary that these two metabolic
pathways (glucose uptake and insulin secretion) play the role of centre pivot in our
investigations.
In chapter 1 the pharmacological treatments available for type II diabetic patients were
discussed. The hypoglycaemic drugs which base their mechanisms on glucose utilisation
are namely the biguanides (metformin), thiazolidinediones and insulin. Sulfonylurea
drugs such as glibenclamide in this study, employ insulin secretion as their mechanism of
action. This study encompassed these two vital processes in creating a model for
antidiabetic screening, therefore a model for glucose utilisation (Chapter 3) and a model
for insulin secretion (Chapter 4) was developed. The biguanides function as antidiabetic
agents by stimulating hepatic glucose metabolism, reducing hepatic glucose output and
reducing intestinal glucose absorption (Moriaka et al., 2005). The thiazolidinediones
increase peripheral glucose uptake and metabolism as well as increase insulin sensitivity
(Oakes et al., 2001). Insulin functions by stimulating hepatic glucose metabolism as well
as increasing peripheral glucose uptake and metabolism (Levinthal and Tavill, 1999). The
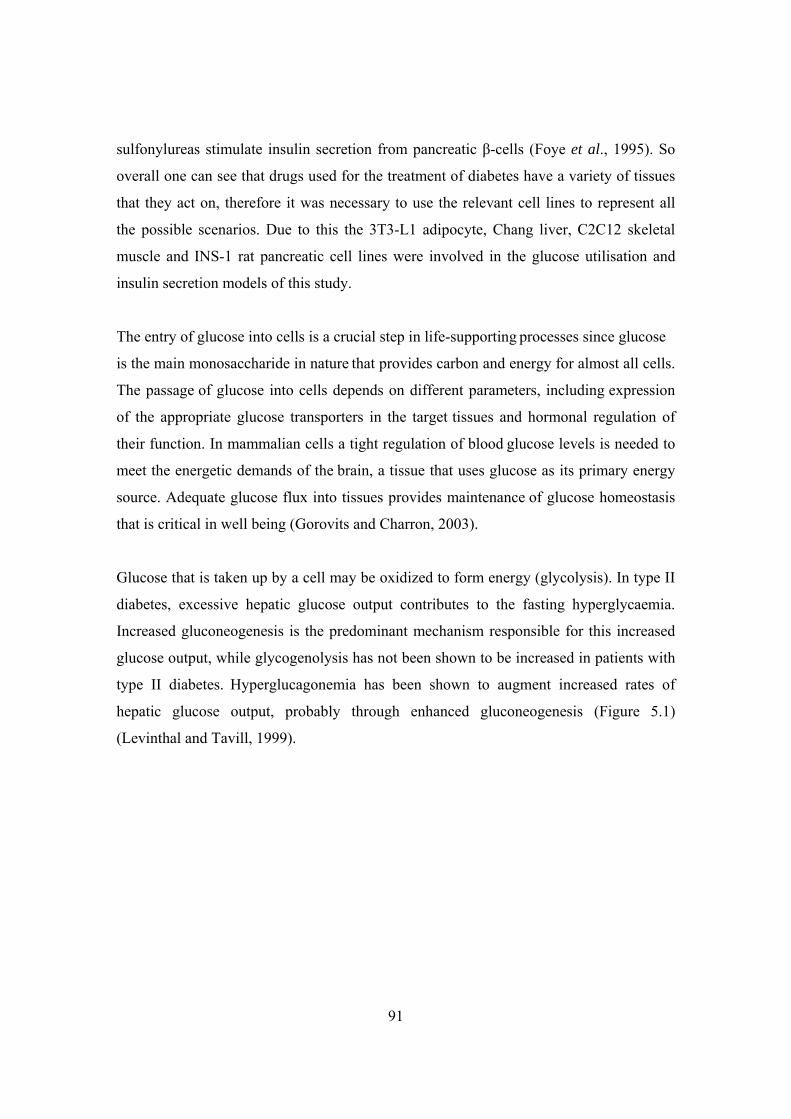
91
sulfonylureas stimulate insulin secretion from pancreatic β-cells (Foye et al., 1995). So
overall one can see that drugs used for the treatment of diabetes have a variety of tissues
that they act on, therefore it was necessary to use the relevant cell lines to represent all
the possible scenarios. Due to this the 3T3-L1 adipocyte, Chang liver, C2C12 skeletal
muscle and INS-1 rat pancreatic cell lines were involved in the glucose utilisation and
insulin secretion models of this study.
The entry of glucose into cells is a crucial step in life-supporting processes since glucose
is the main monosaccharide in nature that provides carbon and energy for almost all cells.
The passage of glucose into cells depends on different parameters, including expression
of the appropriate glucose transporters in the target tissues and hormonal regulation of
their function. In mammalian cells a tight regulation of blood glucose levels is needed to
meet the energetic demands of the brain, a tissue that uses glucose as its primary energy
source. Adequate glucose flux into tissues provides maintenance of glucose homeostasis
that is critical in well being (Gorovits and Charron, 2003).
Glucose that is taken up by a cell may be oxidized to form energy (glycolysis). In type II
diabetes, excessive hepatic glucose output contributes to the fasting hyperglycaemia.
Increased gluconeogenesis is the predominant mechanism responsible for this increased
glucose output, while glycogenolysis has not been shown to be increased in patients with
type II diabetes. Hyperglucagonemia has been shown to augment increased rates of
hepatic glucose output, probably through enhanced gluconeogenesis (Figure 5.1)
(Levinthal and Tavill, 1999).
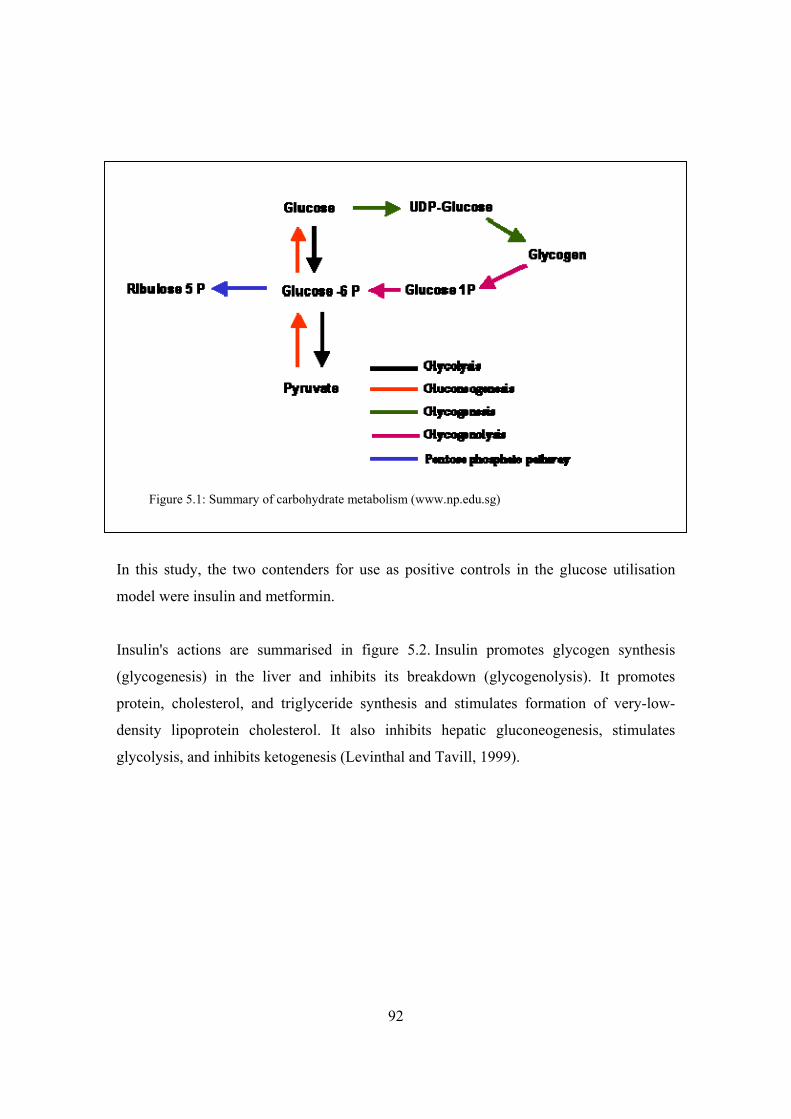
92
In this study, the two contenders for use as positive controls in the glucose utilisation
model were insulin and metformin.
Insulin's actions are summarised in figure 5.2. Insulin promotes glycogen synthesis
(glycogenesis) in the liver and inhibits its breakdown (glycogenolysis). It promotes
protein, cholesterol, and triglyceride synthesis and stimulates formation of very-low-
density lipoprotein cholesterol. It also inhibits hepatic gluconeogenesis, stimulates
glycolysis, and inhibits ketogenesis (Levinthal and Tavill, 1999).
Figure 5.1: Summary of carbohydrate metabolism (www.np.edu.sg)
93
Exposure to insulin, which dominates in the prandial and immediate postprandial period,
encourages storage of carbohydrate and fat and reduces or prevents hepatic glucose
production. There is a general agreement that the major factor in insulin's indirect
suppression of endogenous glucose production is decreased plasma FFA concentration,
due to the antilipolytic effect of insulin on adipose tissue. When hyperinsulinaemia
becomes sufficiently high, the insulin-receptor complex in adipocytes and in skeletal
muscle initiates a transduction chain that results in translocation of intracellular vesicles
to fuse with the plasma membrane. Laced in the walls of these vesicles are GLUTs,
GLUT1 and GLUT4 in adipocytes, but almost exclusively GLUT4 in skeletal muscle
(Zierler, 1999). Insulin does not directly stimulate hepatic glucose uptake through
translocation of glucose transporters to the plasma membrane as it does in skeletal
muscle. Instead, insulin promotes glucose uptake in the liver cell, at least in part, through
increased expression of hepatic glucokinase (Iozza et al., 2003).
Figure 5.2: Mechanisms of insulin action. Key: stimulated by insulin; inhibited by insulin. (Saltiel and Kahn, 2001)
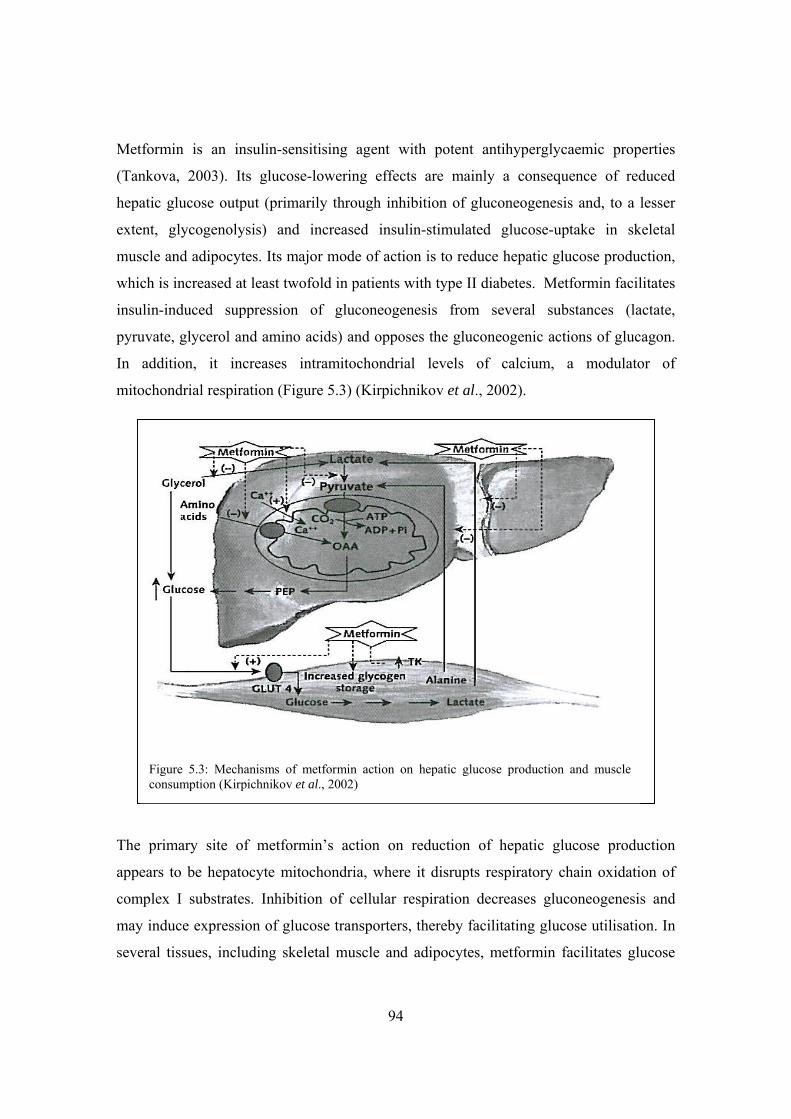
94
Metformin is an insulin-sensitising agent with potent antihyperglycaemic properties
(Tankova, 2003). Its glucose-lowering effects are mainly a consequence of reduced
hepatic glucose output (primarily through inhibition of gluconeogenesis and, to a lesser
extent, glycogenolysis) and increased insulin-stimulated glucose-uptake in skeletal
muscle and adipocytes. Its major mode of action is to reduce hepatic glucose production,
which is increased at least twofold in patients with type II diabetes. Metformin facilitates
insulin-induced suppression of gluconeogenesis from several substances (lactate,
pyruvate, glycerol and amino acids) and opposes the gluconeogenic actions of glucagon.
In addition, it increases intramitochondrial levels of calcium, a modulator of
mitochondrial respiration (Figure 5.3) (Kirpichnikov et al., 2002).
The primary site of metformin’s action on reduction of hepatic glucose production
appears to be hepatocyte mitochondria, where it disrupts respiratory chain oxidation of
complex I substrates. Inhibition of cellular respiration decreases gluconeogenesis and
may induce expression of glucose transporters, thereby facilitating glucose utilisation. In
several tissues, including skeletal muscle and adipocytes, metformin facilitates glucose
Figure 5.3: Mechanisms of metformin action on hepatic glucose production and muscle consumption (Kirpichnikov et al., 2002)
95
transport by increasing tyrosine kinase activity in insulin receptors and enhancing the
trafficking of glucose transporters 1 and 4 to the cell membrane (Kirpichnikov et al.,
2002).
Insulin and metformin were chosen as positive controls for glucose uptake in 3T3-L1
cells. In the C2C12 cell line, the results for the determination of the ideal positive control
correlated to theory, as it is known that insulin increases peripheral glucose uptake and
metabolism in skeletal muscle. Insulin was shown to provide a significant increase in the
amount of glucose taken up by these cells (Figure 3.11), however this only qualified for
acute conditions as no viable results were obtained with these cells when they were
exposed to chronic circumstances. Considering the role of muscle in glucose clearance in
the body, and the mechanism of glucose uptake in this tissue, it would be more
appropriate for an antidiabetic agent to act immediately upon administration rather than
over a long period of time.
Knowing that both insulin and metformin stimulate hepatic glucose metabolism, the
results obtained for Chang liver cells in this study were expected. For acute exposure,
insulin showed a significant effect on glucose utilisation by Chang liver cells (Figures
3.14 and 3.15) and because of this significant effect was chosen as the positive control for
this condition. Due to the results found in figure 3.14 as well as the fact that it is known
that metformin has an effect with chronic exposure, it was decided to use it as the
positive control for glucose utilisation in the cells under chronic conditions. Chronic
treatments with metformin provided a significant increase in glucose utilised by Chang
liver cells, as was seen in figure 3.17.
The positive control used for the insulin secretion model in this study was the
sulfonylurea, glibenclamide. Glibenclamide is used by type II diabetics and it functions
through its ability to bind to SUR-1 receptors of pancreatic β-cells, thereby initiating the
release of insulin. Glibenclamide was an effective positive control for stimulating insulin
secretion by INS-1 cells under acute conditions as there was a significant increase in the
amount of insulin secreted when these cells were exposed to this drug (Figure 4.7).
96
However no significant effect was seen with regards to the chronic conditions tested
when glibenclamide was included. This was not unexpected as it is known that
glibenclamide’s activity does not favour the chronic case but rather the acute one.
Therefore the results from this study correlated with previous information of
glibenclamide’s mechanism of action.
BDM1 and BDH1 are compounds expected to be present in the plant extracts tested in this
study. Although these compounds were included as test substances for their effect on
glucose utilisation in 3T3-L1 cells, results were inconclusive due to the unforeseen
problems experienced with the cell line. BDM1 was shown to have no effect on glucose
uptake in C2C12 muscle cells for either acute or chronic conditions. However, BDH1
significantly increased the amount of glucose taken up by the C2C12 cells being exposed
to acute conditions (Figure 3.11) but not in chronic exposure conditions. When tested on
the Chang liver cell line, BDM1 once again seemed to have no significant effect on
glucose utilisation in these cells. When the Chang cells were exposed to BDH1 under
acute conditions, no significant effect was seen either. On the other hand, when these
cells were treated to BDH1 chronically, a significant increase in glucose uptake was seen
(Figure 3.17). BDP1, as mentioned, is a compound that in previous studies has been found
to display similar characteristics to insulin and has been said to be an antidiabetic
compound. In this study, the only positive results that correlate to these previous findings
were observed in C2C12 muscle cells. It was found that when these cells were exposed to
BDP1 acutely, that a significant increase in glucose utilisation was seen (Figure 3.11).
Other than BDP1’s significant effect on C2C12 cell (acute exposure), no other significant
results were found for this compound on any of the other cell lines.
Throughout the course of this study it was seen that Kankerbos has biological activities
which are comparable to some of the more well-known antidiabetic compounds. The
three successful cell lines that Kankerbos was tested on included: C2C12 muscle, Chang
liver and INS-1 pancreatic cells. With regards to the glucose utilisation model,
Kankerbos was seen to have both acute and chronic effects in different cell lines. In the
C2C12 muscle cells, Kankerbos significantly increased glucose uptake when they were
97
exposed to acute conditions (Figure 3.11). Kankerbos also had a significant effect on the
Chang liver cell line as it was observed that under both acute (Figure 3.15) and chronic
(Figures 3.17) conditions, this plant extract induced the uptake of glucose into these cells.
With respect to the insulin secretion model involving INS-1 cells, no significant effect
was seen during acute exposure when they were treated with Kankerbos. However during
chronic exposure, this plant extract initiated an increased insulin secretion from INS-1
cells (Figure 4.8). Taken together, the results of this study suggest that Kankerbos has a
dual mechanism of action for its glucose-lowering effects: It stimulates glucose usage by
C2C12 muscle and Chang liver cells as well as enhances insulin release from INS-1 cells.
Since Kankerbos is widely distributed in South Africa and therefore accessible to many
communities, this study was useful as it provides an indication that Kankerbos has
antidiabetic activities and could therefore be used as a possible alternative once further
analysis has been completed.
The plant extract, MRC2003, proved not to be as effective as Kankerbos in this study.
Although it was seen in two experiments that the MRC2003 sample significantly
enhanced glucose utilisation in 3T3-L1 adipocytes (Figure 3.4), no conclusions could be
drawn due to the fact that no feasible results were obtained from the experiments carried
out on the 3T3-L1 cell line. Further experimentation involving the MRC2003 sample
included it being tested on the C2C12 skeletal muscle, Chang liver and INS-1 pancreatic
cell lines. For all these cell lines within both models, no significant effect was seen when
the cells were exposed to MRC2003 under acute and chronic conditions. Therefore no
conclusions could be made about this plant extract’s potential as an antidiabetic
compound.
Seeing that glibenclamide is known to bind with high affinity to SUR-1 and thereby
initiate insulin secretion, it was decided to use this theory for further investigations. This
was used as the basis and reasoning for carrying out binding studies. It was thought that
by carrying out these studies it would allow one to determine if the mechanism of a
compound or plant extract in stimulating insulin secretion was subsequent to its binding
to the SUR-1 receptor or whether it was accomplished by another mechanism. Owing to

98
the fact that there was no plant extract in this specific study that was expected to do this,
amitriptyline and trimipramine were used.
Due to amitriptyline being included as a test substance for the binding studies in this
study as well as the computational overlay study previously done, it was included in the
insulin secretion model of this study. The amitriptyline-treated INS-1 pancreatic cells
showed a significant increase in insulin stimulation and secretion when exposure was
acute (Figure 4.7). These results correlated with a previous hypothesis in literature:
Unwanted weight gain associated with a few antidepressants could be due to their
increasing blood insulin levels causing blood glucose to drop and thereby leading to the
food cravings experienced by the patients. This significant effect was however only
observed when the INS-1 cells were exposed to amitriptyline under acute conditions and
not chronic. Although amitriptyline had this effect on insulin secretion by INS-1 cells, the
binding studies revealed that amitriptyline does not bind to the SUR-1 receptor of
pancreatic β cells (Figures 4.13, 4.14, 4.15). Amitriptyline’s mechanism of action on
insulin secretion is still elusive at this stage, however it seems that amitriptyline does not
exert its effect on insulin secretion in the same manner as the sulphonylureas, that is via
the SUR -1 receptors.
In conclusion, the objective of this study, to optimize the techniques required for the
screening and determination of the effectiveness of specific compounds and plants as
antidiabetic potentiates, through observing if they had effects on glucose utilisation and
insulin secretion, was accomplished. Since optimal methodology was achieved through
this specific project, the criteria used to validate the models will now be able to be
applied to scientifically ascertain the antidiabetic effect(s) and mechanism(s) of plants
being researched in the future.

99
References
Alper J (2000) New Insights into type 2 diabetes, Science 289: 37-39
Asfari M, Janjic D, Meda P, Li G, Halban PA, Wollheim CB (1992) Establishment of 2 – Mercaptoethanol-Dependent Differentiated Insulin-Secreting Cell Lines, Endocrinology 130(1): 167-178
Askew SL (2003) Evaluation of methods to culture C2C12 skeletal muscle cells and detect differentiation markers, BSc. Honours, University of Port Elizabeth
Aslesen R, Engebretsen EML, Franch J, Jensen J (2001) Glucose uptake and metabolic stress in rat muscles stimulated electrically with different protocols, J. Appl. Physiol. 91(3): 1237-1244
Bogan JS, McKee AE, Lodish HF (2001) Insulin-Responsive Compartments Containing GLUT4 in 3T3-L1 and CHO Cells: Regulation by Amino Acid Concentrations, Molecular and Cellular Biology 21(14): 4785-4806
Cerasi E (2000) Type 2 Diabetes: To Stimulate or Not to Stimulate the β Cell, Metabolism: Clinical and Experimental 49(10) Suppl 2: 1-2
Clark JBF, Queener SF, Karlb VB (1997) Pharmacologic Basis of Nursing Practice, 5th Ed Mosby-Year Book Inc.: 755-763
Davis A, Christiansen M, Horowitz JF, Klein S, Hellerstein MK, Ostlund RE (2000) Effect of Pinitol Treatment on Insulin Action in Subjects with Insulin Resistance, Diabetes Care 23: 1000-1005
Dela F, Ploug T, Handberg A, Peterson LN, Larsen JJ, Mikines KJ, Galbo H (1994) Physical Training Increases Muscle GLUT4 Protein and mRNA in Patients With NIDDM, Diabetes 43: 862-865
Dowell P, Flexner C, Kwiterovich PO, Lane MD (2000) Suppression of Preadipocyte Differentiation and Promotion of Adipocyte Death by HIV Protease Inhibitors, J. Biol. Chem. 275(52): 41325-41332
Elks ML, Manganiello VC (1985) Antilipolytic action of insulin: role of cAMP phosphodiesterase activation, Endocrinology 116: 2119-2121
Flava M (2000) Weight gain and antidepressants, J.Clin. Psychiatry 61(11): 37-41
Forman BM (2002) The Antidiabetic Agent LG100754 Sensitizes Cells to Low Concentrations of Peroxisome Proliferator-activated Receptor γ Ligands, J. Biol. Chem. 277(15): 12503-12506
Foye WO, Lemke TL, Williams DA (1995) Principles of Medicinal Chemistry, 4th Ed. Williams and Wilkins: 37-599
100
Fujikura K, Suzuki M, Kotake K, Inagaki N, Seino S, Takata K (1999) Immuno-localization of Sulfonylurea receptor 1 in rat pancreas, Diabetologia 42(10): 1204-1211
Gaben-Cogneville AM, Breant B, Coudray AM, Hoa DH, Mester J (1990) Differentiation of newborn rat preadipocytes in culture: effects of insulin and dexamethasone, Exp. Cell. Res. 191(1):133-140
Galic S, Hauser C, Kahn BB, Haj FG, Neel BG, Tonks NK, Tiganis T (2005) Coordinated Regulation of Insulin Signaling by the Protein Tyrosine Phosphatases PTP1B and TCPTP, Molecular and Cellular Biology 25(2): 819-829
Garland EJ, Remick RA, Zis AP (1988) Weight gain with antidepressants and lithium, Journal of Clinical Psychopharmacology 8(5): 323-330
Gerich JE (2000) Addressing the Insulin Secretion Defect: A Logical First-Line Approach, Metabolism: Clinical and Experimental 49(10) Suppl. 2: 12-16
Gorovits N, Charron MJ (2003) What we know about facilitative glucose transporters, Biochemistry and Molecular Education 31(3) : 163-172
Greenwood M, Kreider RB, Rasmussen C, Almada AL, Earnest CP (2001) D-Pinitol Augments Whole Body Creatine Retention in Man, Journal of Exercise Physiology, 4(4) : 41-47
Gribble FM, Ashcroft FM (2000) Sulphonylurea Sensitivity of Adenosine Triphosphate-Sensitive Potassium Channels From β Cells and Extrapancreatic Tissues, Metabolism: Clinical and Experimental 49(10) Suppl. 2: 3-6
Haring HU (1999) Pathogenesis of type 2 diabetes : are there common causes for insulin resistance and secretion failure ?, Exp Clin Endocrinal Diabetes 107(2) : 17-23
Harrower A (2000) Gliclazide Modified Release : From Once-Daily Administration to 24-Hour Blood Glucose Control, Metabolism : Clinical and Experimental 49(10) Suppl. 2 : 7-11
Hernandez-Sanchez C, Ito Y, Ferrer J, Reitman M, Le Roith D (1999) Characterization of the mouse sulfonylurea receptor 1 promoter and its regulation, J Biol Chem 274 (26): 1-5
Hurr NA (1996) The effect of aerobic exercise on the adipose tissue of subjects using antidepressant medication, MSc. Dissertation, University of Port Elizabeth
Iozzo P, Hallsten K, Oikonen V, Virtanen KA, Kemppainen J, Solin O, Ferrannini E, Knuuti J, Nuutila P (2003) Insulin-mediated hepatic glucose uptake is impaired in type 2 diabetes: evidence for a relationship with glycemic control, J Clin Endocrinol Metab 88: 2055–60.
101
Isomoto S, Kando C, Yamada M, Matsumoto S, Higashiguchi O, Hario Y Matsuzawa Y, Kurachi Y (1996) Communication : A novel sulfonylurea receptor forms with Bir (Kir 6.2) a smooth muscle type ATP-sensitive K+ channel, J Biol Chem 271 (40): 1-14
Janjic D, Maechler P, Sekine N, Bartley C, Annen AS, Wollheim CB (1999) Free Radical Modulation of Insulin Release in INS – 1 Cells Exposed to Alloxan, Biochemical Pharmacology 57: 639-648
Johnson LR (1998) Essential Medical Physiology, 2nd Ed Lippincott-Raven Publishers: 565-581
Katzung BG (1995) Basic and Clinical Pharmacology, 6th Ed Appleton and Lange :448-457, 637-650
Kirpichnikov D, McFarlane S, Sowers J (2002) Metformin: An Update, Ann. Intern. Med. 137: 25-33
Klip A, Leiter LA (1990) Cellular mechanism of action of metformin, Diabetes Care 13(6): 696-704
Kumar N, Dey CS (2003) Development of insulin resistance and reversal by thiazolidinediones in C2C12 skeletal muscle cells, Biochemical Pharmacology 65: 249-257
Larner J, Price J, Picariello T, Huang L (1997) Method of treating defective glucose metabolism using synthetic insulin substances, United States Patent
Levinthal GN, Tavill AS (1999) Liver Disease and Diabetes Mellitus, Clinical Diabetes 17(2)
Lienhard GE, Slot JW, James DE, Muecklar MM (1992) How cells absorb glucose, Scientific American 206: 34-39
Mandrup S, Lane MD (1997) Regulating Adipogenesis, JBC 272(9): 5367-5370
Matthaei S, Stumvoll M, Kellerer M, Haring H (2000) Pathophysiology and Pharmacological Treatment of insulin Resistance, Endocrine Reviews 21(6): 585-618
Medina RA, Owen GI (2002) Glucose transporters: expression, regulation and cancer, Biol. Res. 35(1)
Monks A, Scudiero D, Skehan P, Shoemaker R, Paull K, Vistica D, Hose C, Langley J, Cronise P, Vaigro-Wolff A, Gray-Goodrich M, Campbell H, Mayo J, Boyd M (1991) Feasibility of a High-flux Anticancer Drug Screen Using a Diverse Panel of Cultured Human Tumor Cell Lines, Journal of the National Cancer Institute 83(11): 757-766
102
Morioka K, Nakatani K, Matsumoto K, Urakawa H, Kitagawa N, Katsuki A, Hori Y, Gabazza EC, Yano Y, Nishioka J, Noboni T, Sumida Y, Adachi Y (2005) Metformin-induced suppression of glucose-6-phosphatase expression is independent of insulin signaling in rat hepatoma cells, Int J Mol Med 15(3): 449-452
Muller F (2002) Sutherlandia: a useful African herb in medical practice, The South African Journal of Natural Medicine 8: 69-94
Narayanan CR, Joshi DD, Mujumdar AM, Dhekne VV (1987) Pinitol-A new antidiabetic compound from the leaves of Bougainvillea Spectabilis, Current Science 56(3): 139-141
Newsholme EA, Leech AR (1992) Biochemistry for the medical sciences, John Wiley & Sons Ltd: 562-582, 694-709, 828-838
Oakes ND, Thalen PG, Jacinto SM, Ljung B (2001) Thiazolidinediones Increase Plasma-Adipose Tissue FFA Exchange Capacity and Enhance Insulin-Mediated Control of Systemic FFA Availability, Diabetes 50: 1158-1165
Perrini S, Natalicchio A, Laviola L, Belsanti G, Montrone C, Cigarelli A, Minielli V, Grano M, De Pergola G, Giorgino R, Giorgina F (2004) Dehydroepiandrosterone Stimulates Glucose Uptake in Human and Murine Adipocytes by Inducing GLUT1 and GLUT4 Translocation to the Plasma Membrane, Diabetes 53: 41-52
Pessin JE, Saltiel AR (2000) Signaling pathways in insulin action: molecular targets of insulin resistance, J. Clin. Invest. 106(2): 165-169
Purintrapiban J, Ratanachaiyavong S (2003) The Effects of Insulin and Metformin on Glucose Uptake in L8 Myotubes, ScienceAsia 29: 341-346
Quesada I, Nadal A, Soria B (1999) Different effects of tolbutamide and diazoxide in alpha-, beta-, and delta- cells within intact islets of Langerhans, Diabetes 48(12): 2390-2397
Raab-Graham KF, Cirilo LJ, Boettcher AA, Radeke CM, Vandenberg CA (1999) Membrane Topology of the Amino-terminal Region of the Sulfonylurea Receptor, J Biol Chem 274(41): 1-19
Rosen ED, Spiegelman BM (2000) Molecular Regulation Of Adipogenesis, Annu. Rev. Cell Dev. Biol 16: 145-171
Rosen ED, Walkey CJ, Puigserver P, Spiegelman BM (2000) Transcriptional regulation of adipogenesis, Genes and Development 14: 1293-1307
Rutter GA, da Silva Xavier GDS, Leclerc I (2003) Roles of 5’AMP-activated protein kinase in mammalian glucose homeostasis, Biochemical Journal 375: 1-16
103
Sakurai Y, Teruya K, Shimoda N, Umeda T, Tanaka H, Muto T, Kondo T, Nakamura K, Yoshizawa N (1999) Association between duration of obesity and the risk of non-insulin-dependant Diabetes Mellitus, American Journal of Epidemiology 149(3): 256-260
Salt IP, Johnson G, Ashcroft SJH, Hardie DG (1998) AMP-activated protein kinase is activated by low glucose in cell lines derived from pancreatic β cells, and may regulate insulin release, Biochem. J. 335: 533-539
Saltiel AR (1990) Second Messengers of Insulin Action, Diabetes Care 13(3): 244-256
Saltiel AR, Kahn CR (2001) Insulin signaling and the regulation of glucose and lipid metabolism Nature 414: 799-806
Seier JV, Mdhluli M, Dhansay MA, Loza J, Laubscher R (2002) A Toxicity Study Of Sutherlandia Leaf Powder (Sutherlandia microphylla) Consumption, Medical Research Council: 1-35
Sheard NF, Clark NG (2000) The Role of Nutrition Therapy in the Management of Diabetes Mellitus, Nutrition in Clinical Care 3(6): 334-348
Tankova T (2003) Current indications for metformin therapy, Rom. J. Intern. Med. 41(3): 215-225
Taylor SI (1999) Deconstructing Type 2 Diabetes, Cell 97: 9-12
Tortorella LL, Pilch PF (2002) C2C12 myocytes lack an insulin-responsive vesicular compartment despite dexamethasone-induced GLUT 4 expression, Am. J. Physiol. Endocrinol. Metab. 283(3): 514-524
Trembley A, Doucet E (2000) Obesity: a disease or a biological adaptation?, Obesity Reviews 1:27-35
Ueyama A, Yaworsky KL, Wang Q, Ebina Y, Klip A (1999) GLUT-4myc ectopic expression in L6 myoblasts generates a GLUT-4-specific pool conferring insulin sensitivity, Am. J. Physiol. Endocrinol. Metab. 277(3): E572-E578
Vardaxis NJ (1994) Pathology for the health sciences, Macmillan Education
Wagner H, Farnsworth NR (1994) Economic and Medicinal Plant Research, Volume 6, Academic Press Ltd: 149-187
Walker P (2000) Studies on the influence of antidepressants on insulin secretion by the RIN-m5F cells, BSc. Honours, University of Port Elizabeth
Weir GC, Bonner-Weir S (2004) Five Stages of Evolving Beta-Cell Dysfunction During Progression to Diabetes, Diabetes 53:S16-S21
Wiederer O, Loffler G (1987) Hormonal regulation of the differentiation of rat adipocyte precursor cells in primary culture, J. Lipid. Res. 28(6): 649-658
104
Wilson GP (2002) Experimental models to determine the effect of different drugs on insulin secretion, BSc. Honours, University of Port Elizabeth
Wise LS, Green H (1979) Participation of one isoenzyme cytosolic glycerophosphate dehydrogenase in the adipose precursor cells, J. Biol. Chem. 254: 273-275
Withers DJ, Sanchez Eutierrez J, Towery H, Burks DJ, Ren J, Previs S, Zhang Y, Bernal D, Pans S, Shulman GI, Banner-Weier S, White MF (1998) Disruption of IRS-2 causes type 2 diabetes in mice, Nature 391: 900-904
Zierler K (1999) Whole body glucose metabolism, Am J Physiol Endocrinol Metab 276 (3): E409-E426
www.biotech.ist.unige.it
www.chemicon.com/adipogenesis assay
www.geocities.com
www.i-sis.org.uk/
www.lifeclinic.com
www.np.edu.sg
www.pslgroup.com
www.sutherlandia.org
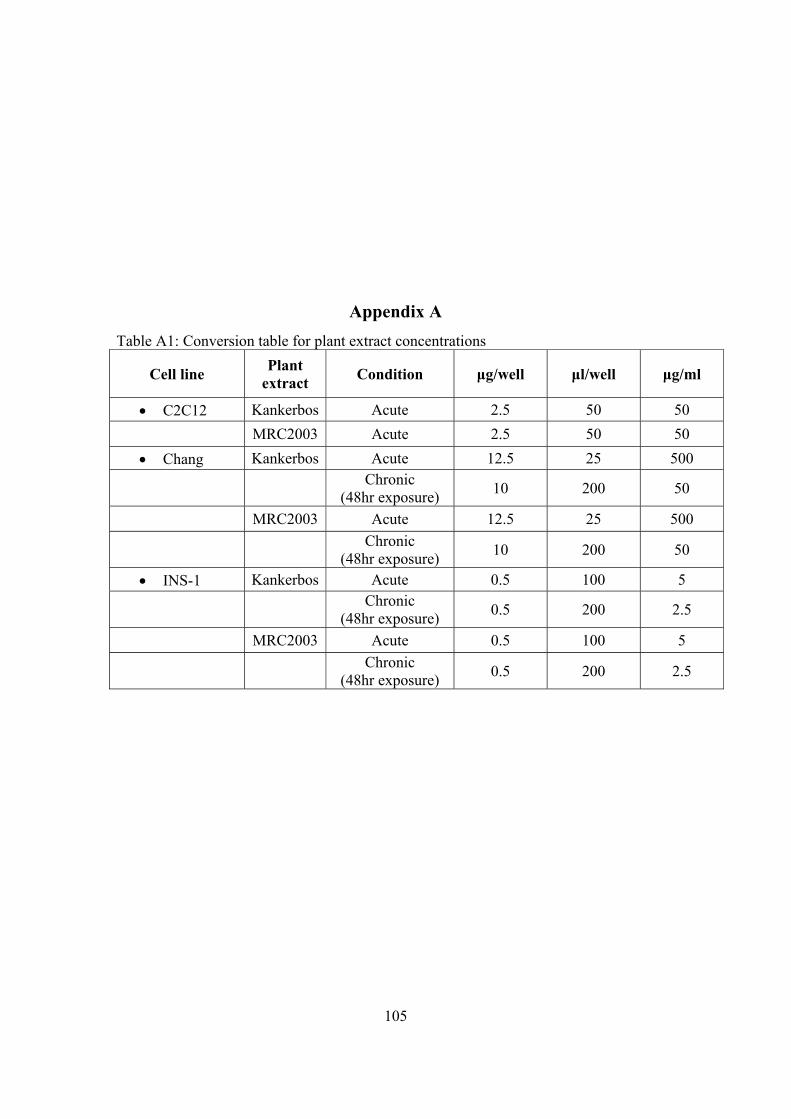
105
Appendix A Table A1: Conversion table for plant extract concentrations
Cell line Plant extract Condition μg/well μl/well μg/ml
• C2C12 Kankerbos Acute 2.5 50 50 MRC2003 Acute 2.5 50 50
• Chang Kankerbos Acute 12.5 25 500
Chronic (48hr exposure) 10 200 50
MRC2003 Acute 12.5 25 500
Chronic (48hr exposure) 10 200 50
• INS-1 Kankerbos Acute 0.5 100 5
Chronic (48hr exposure) 0.5 200 2.5
MRC2003 Acute 0.5 100 5
Chronic (48hr exposure) 0.5 200 2.5