Automatic Screening and Classification of Diabetic ...
210
Automatic Screening and Classification of Diabetic Retinopathy Eye Fundus Images Rahim, S.S. Submitted version deposited in Coventry University’s Institutional Repository Original citation: Rahim, S.S. (2016) Automatic Screening and Classification of Diabetic Retinopathy Eye Fundus Images. Unpublished PhD Thesis. Coventry: Coventry University Copyright © and Moral Rights are retained by the author. A copy can be downloaded for personal non-commercial research or study, without prior permission or charge. This item cannot be reproduced or quoted extensively from without first obtaining permission in writing from the copyright holder(s). The content must not be changed in any way or sold commercially in any format or medium without the formal permission of the copyright holders. Some materials have been removed from this thesis due to third party copyright. Pages where material has been removed are clearly marked in the electronic version. The unabridged version of the thesis can be viewed at the Lanchester Library, Coventry University.
-
Upload
khangminh22 -
Category
Documents
-
view
1 -
download
0
Transcript of Automatic Screening and Classification of Diabetic ...

Automatic Screening and Classification of Diabetic Retinopathy Eye Fundus Images Rahim, S.S. Submitted version deposited in Coventry University’s Institutional Repository Original citation: Rahim, S.S. (2016) Automatic Screening and Classification of Diabetic Retinopathy Eye Fundus Images. Unpublished PhD Thesis. Coventry: Coventry University Copyright © and Moral Rights are retained by the author. A copy can be downloaded for personal non-commercial research or study, without prior permission or charge. This item cannot be reproduced or quoted extensively from without first obtaining permission in writing from the copyright holder(s). The content must not be changed in any way or sold commercially in any format or medium without the formal permission of the copyright holders. Some materials have been removed from this thesis due to third party copyright. Pages where material has been removed are clearly marked in the electronic version. The unabridged version of the thesis can be viewed at the Lanchester Library, Coventry University.


Automatic Screening and
Classification of Diabetic
Retinopathy Eye Fundus Images
Sarni Suhaila Rahim
June 2016
By
A thesis submitted in partial fulfilment of the University’s
requirements for the Degree of Doctor of Philosophy

i
ABSTRACT
Diabetic Retinopathy (DR) is a disorder of the retinal vasculature. It develops to
some degree in nearly all patients with long-standing diabetes mellitus and can result in
blindness. Screening of DR is essential for both early detection and early treatment.
This thesis aims to investigate automatic methods for diabetic retinopathy detection and
subsequently develop an effective system for the detection and screening of diabetic
retinopathy.
The presented diabetic retinopathy research involves three development stages.
Firstly, the thesis presents the development of a preliminary classification and screening
system for diabetic retinopathy using eye fundus images. The research will then focus
on the detection of the earliest signs of diabetic retinopathy, which are the
microaneurysms. The detection of microaneurysms at an early stage is vital and is the
first step in preventing diabetic retinopathy. Finally, the thesis will present decision
support systems for the detection of diabetic retinopathy and maculopathy in eye fundus
images. The detection of maculopathy, which are yellow lesions near the macula, is
essential as it will eventually cause the loss of vision if the affected macula is not treated
in time.
An accurate retinal screening, therefore, is required to assist the retinal screeners
to classify the retinal images effectively. Highly efficient and accurate image processing
techniques must thus be used in order to produce an effective screening of diabetic
retinopathy. In addition to the proposed diabetic retinopathy detection systems, this
thesis will present a new dataset, and will highlight the dataset collection, the expert
diagnosis process and the advantages of the new dataset, compared to other public eye
fundus images datasets available. The new dataset will be useful to researchers and
practitioners working in the retinal imaging area and would widely encourage
comparative studies in the field of diabetic retinopathy research. It is envisaged that the
proposed decision support system for clinical screening would greatly contribute to and
assist the management and the detection of diabetic retinopathy. It is also hoped that the
developed automatic detection techniques will assist clinicians to diagnose diabetic
retinopathy at an early stage.

ii
ACKNOWLEDGEMENTS
First of all, I would like to express my gratitude to my Director of Studies, Dr. Vasile
Palade, for his time, guidance and support for me during my studies. I am also grateful
to my supervisors, Dr. James Shuttleworth and Prof. Chrisina Jayne. I would like to
thank them for being a great supervisory team.
My gratitude also goes to my previous supervisory team, Dr. Rajeev Bali and Prof.
Raouf Naguib. Under their supervision, I learnt a lot from their vast knowledge and
experience.
The deepest gratitude and thanks go to the Universiti Teknikal Malaysia Melaka and
Ministry of Higher Education Malaysia for sponsoring this PhD research. I am also
thankful to the Ministry of Health Malaysia and the Melaka Hospital, Malaysia for
providing access and approve the research and data collection.
Special thanks go to Dr. Raja Norliza Raja Omar and the staff at the Eye Clinic,
Department of Ophthalmology, Melaka Hospital, Malaysia for the medical guidance,
supports and for making my research data collection possible.
Thanks go to my wonderful parents, my siblings, other members of my family and my
friends for their countless support.
Finally, I would like to thank everyone who was involved directly or indirectly
throughout this research.

iii
TABLE OF CONTENTS
ABSTRACT ...................................................................................................................... i
ACKNOWLEDGEMENTS ............................................................................................. ii
LIST OF FIGURES ......................................................................................................... vi
LIST OF FIGURES FOR APPENDICES ..................................................................... viii
LIST OF TABLES .......................................................................................................... ix
LIST OF TABLES FOR APPENDICES ......................................................................... x
LIST OF EQUATIONS .................................................................................................... x
LIST OF ABBREVIATIONS ......................................................................................... xi
LIST OF PUBLISHED PAPERS ON THIS RESEARCH ............................................ xii
1 INTRODUCTION ......................................................................................................... 1
1.1 Diabetic Retinopathy Screening and the Challenges Faced by the Malaysian
Government .................................................................................................................. 2
1.2 Research Aims and Objectives ............................................................................... 5
1.3 Motivation and Contributions of the Thesis ........................................................... 8
1.4 Research Methodology ......................................................................................... 11
1.5 Thesis Overview ................................................................................................... 13
2 BACKGROUND AND LITERATURE REVIEW ..................................................... 15
2.1 Diabetes Mellitus .................................................................................................. 15
2.2 Diabetic Retinopathy ............................................................................................ 17
2.3 Epidemiology of Diabetic Retinopathy ................................................................ 21
2.3.1 Diabetic Retinopathy and Global Epidemiology ........................................... 21
2.3.2 Diabetic Retinopathy Epidemiology in Malaysia .......................................... 23
2.4 Classification of Diabetic Retinopathy ................................................................. 26
2.5 Diabetic Retinopathy Screening ........................................................................... 27
2.5.1 Diabetic Retinopathy Grading ....................................................................... 33
2.5.2 Examination Schedule ................................................................................... 38
2.5.3 Diabetic Retinopathy Management and Treatment ....................................... 40
2.6 Diabetic Retinopathy Image Processing ............................................................... 41
2.6.1 Image Preprocessing ...................................................................................... 41
2.6.2 Feature Extraction ......................................................................................... 47
2.6.3 Classification ................................................................................................. 51
2.6.3.1 Support Vector Machines ....................................................................... 52
2.6.3.2 Neural Networks ..................................................................................... 53
2.6.3.3 Other Classification Methods ................................................................. 55
2.7 Fuzzy Image Processing ....................................................................................... 58
2.8 Summary ............................................................................................................... 62
3 RESEARCH METHODOLOGY AND DATA COLLECTION ................................ 63
3.1 Research Design ................................................................................................... 63
3.2 Study Population................................................................................................... 65
3.3 Location of the Research Study ............................................................................ 65

iv
3.4 Data Collection ..................................................................................................... 65
3.4.1 Primary Data .................................................................................................. 66
3.4.2 Secondary Data .............................................................................................. 66
3.5 Collecting Data Procedure .................................................................................... 67
3.5.1 Collecting Primary Data through Observation .............................................. 67
3.5.2 Collecting Primary Data through Interview .................................................. 69
3.5.3 Collecting Secondary Data through Existing Fundus Images ....................... 69
3.6 Data Management and Analysis Procedure .......................................................... 70
3.7 Ethical Considerations .......................................................................................... 71
3.8 Benchmark Public Data Sets ................................................................................ 72
3.9 Developed Data Set .............................................................................................. 74
3.10 Summary ............................................................................................................. 79
4 CONTRIBUTIONS TO DEVELOPING SYSTEMS FOR DIABETIC
RETINOPATHY AND MACULOPATHY DETECTION ........................................... 81
4.1 Basic System for General Diabetic Retinopathy Detection (System I) ................ 82
4.1.1 Image Preprocessing ...................................................................................... 84
4.1.2 Feature Extraction ......................................................................................... 87
4.1.3 Classification ................................................................................................. 88
4.1.4 System Results and Evaluation ..................................................................... 89
4.2 Microaneurysms Detection ................................................................................... 91
4.2.1 Automatic Detection of Microaneurysms in Colour Fundus Images
Using Vessel Segmentation and Features Extraction (System II) ......................... 91
4.2.1.1 Image Preprocessing ............................................................................... 93
4.2.1.2 Feature Extraction................................................................................... 94
4.2.1.3 Classification .......................................................................................... 95
4.2.1.4 System Results and Evaluation............................................................... 95
4.2.2 Automatic Detection of Microaneurysms in Colour Fundus Images
Using a Combination of Image Preprocessing Techniques and Circular Hough
Transform (System III) ........................................................................................... 97
4.2.2.1 Image Preprocessing ............................................................................... 98
4.2.2.2 Circular Hough Transform ..................................................................... 98
4.2.2.3 System Results and Evaluation............................................................. 100
4.2.3 Automatic Detection of Microaneurysms in Colour Fundus Images
Using Fuzzy Image Processing (System IV) ........................................................ 102
4.2.3.1 Image Preprocessing ............................................................................. 103
4.2.3.2 Microaneurysms Detection ................................................................... 105
4.2.3.3 System Results ...................................................................................... 105
4.2.4 Automatic Detection of Microaneurysms Using Fuzzy Histogram
Equalisation, Fuzzy Filtering and Fuzzy Edge Detection (System V) ................. 107
4.2.4.1 Image Preprocessing ............................................................................. 108
4.2.4.2 Localisation and Detection of Microaneurysms ................................... 111
4.2.4.3 Classification ........................................................................................ 111

v
4.2.4.4 System Results and Evaluation............................................................. 112
4.3 Maculopathy and Diabetic Retinopathy Detection ............................................. 114
4.3.1 Detection of Diabetic Retinopathy and Maculopathy in Eye Fundus
Images Using Fuzzy Image Processing (System VI) ........................................... 116
4.3.1.1 Image Preprocessing ............................................................................. 118
4.3.1.2 Feature Extraction................................................................................. 119
4.3.1.3 Classification ........................................................................................ 120
4.3.1.4 System Results and Evaluation............................................................. 120
4.3.2 Detection of Diabetic Retinopathy and Maculopathy in Eye Fundus
Images Using Fuzzy Image Processing and Retinal Structures Segmentation
(System VII) ......................................................................................................... 122
4.3.2.1 Image Preprocessing ............................................................................. 123
4.3.2.2 Retinal Structure Extraction ................................................................. 125
4.3.2.3 Exudate and Maculopathy Detection .................................................... 129
4.3.2.4 Features Extraction ............................................................................... 130
4.3.2.5 Classification ........................................................................................ 131
4.3.2.6 System Results and Evaluation............................................................. 131
4.4 Summary ............................................................................................................. 132
5 OVERALL RESULTS ANALYSIS AND DISCUSSION ....................................... 135
5.1 Developed Data Set Analysis ............................................................................. 135
5.2 System Results Analysis ..................................................................................... 140
5.2.1 Confusion Matrix ......................................................................................... 140
5.2.2 Statistical Analysis ...................................................................................... 141
5.3 Discussion ........................................................................................................... 148
5.4 Summary ............................................................................................................. 151
6 CONCLUSIONS AND FUTURE WORK ................................................................ 152
6.1 Review of the Work and Contributions .............................................................. 152
6.2 Future Work ........................................................................................................ 155
6.3 Summary ............................................................................................................. 158
REFERENCES ............................................................................................................. 159
APPENDICES .............................................................................................................. 171

vi
LIST OF FIGURES
Figure 1.1 Methodology of the research ......................................................................... 12
Figure 2.1 Retina (eyeSmart, 2014) ............................................................................... 17
Figure 2.2 Diagrammatic representation of the different types of damage to capillaries
in diabetic retinopathy (Taylor and Batey, 2012:24) (a) Normal capillary (b)
Microaneurysm (c) Blot haemorrhage (d) Exudate ................................................ 18
Figure 2.3 Features of diabetic retinopathy (Ministry of Health Diabetic Retinopathy
Screening Team, 2012b) ......................................................................................... 20
Figure 2.4 Normal retina compared to retina with diabetic retinopathy signs ............... 21
Figure 2.5 Global causes of visual impairment, including blindness, as percentage
(World Health Organization, 2012b:6) ................................................................... 23
Figure 2.6 Global causes of blindness as a percentage of global blindness in 2010
(World Health Organization, 2012b:6) ................................................................... 23
Figure 2.7 Percentage distribution of diabetic retinopathy cases, glaucoma or lens-
induced glaucoma, 2002-2013 (NED Steering Committee Members, 2015:112) .. 25
Figure 2.8 Diabetic retinopathy screening tools (Ministry of Health Diabetic
Retinopathy Screening Team, 2012c:14) ................................................................ 29
Figure 2.9 Screening process of diabetic retinopathy to prevent blindness (Ministry of
Health Malaysia, Malaysian Society of Ophthalmology and Academy of Medicine
of Malaysia, 2011) .................................................................................................. 31
Figure 2.10 Fundus camera photography (Ministry of Health Diabetic Retinopathy
Screening Team, 2012b, 2012d) ............................................................................. 32
Figure 2.11 Good quality fundus photos (Ministry of Health Diabetic Retinopathy
Screening Team, 2012b) ......................................................................................... 32
Figure 2.12 Normal fundus image (Ministry of Health Diabetic Retinopathy Screening
Team, 2012b) .......................................................................................................... 33
Figure 2.13 Basic two-class classifications with Support Vector Machines (The
Mathworks, Inc., 2016a) ......................................................................................... 53
Figure 2.14 Brightness Preserving Dynamic Fuzzy Histogram Equalization stages ..... 59
Figure 2.15 Membership functions of the inputs and outputs (The Mathworks, Inc.,
2016c) ..................................................................................................................... 61
Figure 2.16 Edge detection using fuzzy logic output (The Mathworks, Inc., 2016c) .... 61
Figure 3.1 Research development design ....................................................................... 64
Figure 3.2 Research study location................................................................................. 66

vii
Figure 3.3 Fundus images capturing and the grading process ........................................ 68
Figure 3.4 Examples of images in the dataset ................................................................ 75
Figure 3.5 Expert diagnosis file ...................................................................................... 76
Figure 3.6 Expert diagnosis summary ............................................................................ 76
Figure 3.7 Expert diagnosis average............................................................................... 77
Figure 3.8 Main web page for the developed dataset ..................................................... 78
Figure 4.1 Block diagram of the proposed general automatic screening and classification
of diabetic retinopathy ............................................................................................ 83
Figure 4.2 Image preprocessing...................................................................................... 87
Figure 4.3 Snapshot of the proposed system user interface ........................................... 90
Figure 4.4 Block diagram of the proposed automatic detection of microaneurysms ..... 92
Figure 4.5 Preprocessing the output image .................................................................... 94
Figure 4.6 Snapshot of the proposed system user interface ........................................... 96
Figure 4.7 Block diagram of the proposed automatic detection of microaneurysms using
Circular Hough Transform ...................................................................................... 98
Figure 4.8 Microaneurysms detection by using the Circular Hough Transform ............ 99
Figure 4.9 Snapshot of the user interface of System III ............................................... 100
Figure 4.10 Block diagram of System IV for the automatic detection of microaneurysms
............................................................................................................................... 104
Figure 4.11 Preprocessing the output image ................................................................ 104
Figure 4.12 Snapshot of the user interface of System IV ............................................. 106
Figure 4.13 Block diagram of System V for the automatic detection of microaneurysms
............................................................................................................................... 108
Figure 4.14 Membership functions for inputs and outputs ........................................... 110
Figure 4.15 Preprocessing the output image with fuzzy approaches ........................... 111
Figure 4.16 Snapshot of the proposed system user interface ....................................... 113
Figure 4.17 Block diagram of System VI for the automatic detection of diabetic
retinopathy and maculopathy using fuzzy image processing................................ 117
Figure 4.18 Membership functions for inputs and outputs ........................................... 118
Figure 4.19 Preprocessing of the output image ............................................................ 119
Figure 4.20 Snapshot of the proposed system user interface ....................................... 121

viii
Figure 4.21 Block diagram of System VII for the automatic detection of diabetic
retinopathy and maculopathy using fuzzy image processing................................ 123
Figure 4.22 Preprocessing the output image ................................................................ 125
Figure 4.23 Extraction of retinal structures .................................................................. 128
Figure 4.24 Exudates and maculopathy extraction output image ................................. 130
Figure 4.25 Snapshot of the proposed system user interface ....................................... 132
Figure 5.1 Boxplot assessment ..................................................................................... 137
Figure 5.2 Histogram assessment ................................................................................. 138
Figure 5.3 System development workflow ................................................................... 147
LIST OF FIGURES FOR APPENDICES
Figure A.1 Data collection and diabetic retinopathy screening process ....................... 171
Figure A.2 No diabetic retinopathy images .................................................................. 172
Figure A.3 Mild DR without maculopathy images ...................................................... 172
Figure A.4 Mild DR with maculopathy images ........................................................... 173
Figure A.5 Moderate DR without maculopathy images ............................................... 173
Figure A.6 Moderate DR with maculopathy images .................................................... 174
Figure A.7 Severe DR without maculopathy images ................................................... 174
Figure A.8 Severe DR with maculopathy images ........................................................ 175
Figure A.9 Proliferative DR without maculopathy images .......................................... 175
Figure A.10 Proliferative DR with maculopathy images ............................................. 176
Figure A.11 Advanced diabetic eye disease images .................................................... 176
Figure B.1 ‘Home’ page ............................................................................................... 184
Figure B.2 ‘About’ page ............................................................................................... 184
Figure B.3 ‘Team’ page ................................................................................................ 185
Figure B.4 ‘Publications’ page ..................................................................................... 185
Figure B.5 ‘Dataset’ page and ‘Download’ link .......................................................... 186
Figure B.6 ‘Contact’ page ............................................................................................ 186

ix
LIST OF TABLES
Table 2.1 Terminology definition of diabetic retinopathy signs (adapted from Taylor
and Batey, 2012) ..................................................................................................... 19
Table 2.2 Sensitivity and specificity of diabetic retinopathy tools (Ministry of Health
Malaysia, Malaysia Society of Ophthalmology and Academy of Medicine of
Malaysia, 2011) ....................................................................................................... 29
Table 2.3 Retinopathy stages and findings (Ministry of Health Diabetic Retinopathy
Screening Team, 2012b) ......................................................................................... 34
Table 2.4 International Clinical Diabetic Retinopathy Disease Severity Scale
(Wilkinson et al., 2003) .......................................................................................... 37
Table 2.5 Diabetic Macular Edema Disease Severity Scale (Wilkinson et al., 2003).... 38
Table 2.6 Timing of the first screening (Ministry of Health Malaysia, Malaysian Society
of Ophthalmology and Academy of Medicine of Malaysia, 2011) ........................ 39
Table 2.7 Recommended follow-up schedule (American Academy of Ophthalmology
Retina Panel, 2008) ................................................................................................. 39
Table 2.8 Criteria for urgent referral (National Institute for Clinical Excellence, 2002) 40
Table 2.9 Summary of treatment for diabetic retinopathy (Ministry of Health Malaysia,
Malaysian Society of Ophthalmology and Academy of Medicine of Malaysia,
2011) ....................................................................................................................... 40
Table 2.10 Summary of preprocessing techniques used in diabetic retinopathy screening
research ................................................................................................................... 43
Table 2.11 Summary of feature extraction methods used in previous diabetic
retinopathy screening research ................................................................................ 48
Table 2.12 Summary of machine learning techniques for classification used in previous
diabetic retinopathy screening research .................................................................. 56
Table 3.1 Sensitivity, specificity and accuracy formula ................................................. 71
Table 3.2 Expert diagnosis summary ............................................................................. 77
Table 3.3 Summary of datasets used for systems development ..................................... 80
Table 4.1 Feature extraction in the proposed system ..................................................... 88
Table 4.2 Average results when using the four classifiers ............................................. 90
Table 4.3 Feature extraction in the proposed microaneurysms detection system .......... 95
Table 4.4 Average results when using the four classifiers ............................................. 96
Table 4.5 T-test analysis ............................................................................................... 101
Table 4.6 Chi-square analysis ....................................................................................... 101

x
Table 4.7 Summary results for Systems IV(a) and IV(b) ............................................. 106
Table 4.8 Summary results for System V(a), V(b), V(c) and V(d) .............................. 113
Table 4.9 Summary results for System VI ................................................................... 121
Table 4.10 Average results when using the four classifiers ......................................... 132
Table 5.1 Expert diagnosis summary categorisation .................................................... 136
Table 5.2 ANOVA multiple comparisons .................................................................... 139
Table 5.3 Chi-square analysis ....................................................................................... 140
Table 5.4 Confusion matrix analysis of the proposed systems..................................... 142
Table 5.5 Inferential statistical analysis of the proposed systems ................................ 145
LIST OF TABLES FOR APPENDICES
Table A.1 Data collection methods .............................................................................. 177
Table A.2 Data collection assessment .......................................................................... 178
Table A.3 Expert diagnosis .......................................................................................... 179
Table A.4 Expert diagnosis summary .......................................................................... 180
Table A.5 Findings summary ....................................................................................... 182
Table A.6 Discussion summary .................................................................................... 183
LIST OF EQUATIONS
(4.1) ................................................................................................................................ 85
(4.2) ................................................................................................................................ 86

xi
LIST OF ABBREVIATIONS
DM Diabetes Mellitus
DR Diabetic Retinopathy
DME Diabetic Macula Edema
MOHM Ministry of Health Malaysia
NPDR Non-proliferative Diabetic Retinopathy
PDR Proliferative Diabetic Retinopathy
WHO World Health Organization
NHMS National Health and Morbidity Survey
T1DM Type 1 Diabetes Mellitus
T2DM Type 2 Diabetes Mellitus
IRMAs Intraretinal Microvascular Anomalies
NED National Eye Database
SVM Support Vector Machines
HOS Higher Order Spectra
DWT Discrete Wavelet Transform
ANN Artificial Neural Network
D-FNN Dynamic Fuzzy Neural Network
RBFNN Radial Basis Function Neural Network
PNN Probabilistic Neural Network
kNN k-Nearest Neighbours
CNN Convolutional Neural Networks

xii
LIST OF PUBLISHED PAPERS ON THIS RESEARCH
Journal:
Rahim, S, S., Jayne, C., Palade, V., and Shuttleworth, J. (2015) ‘Automatic Detection
of Microaneurysms in Colour Fundus Images for Diabetic Retinopathy
Screening’. Journal of Neural Computing and Applications 521, 1-16
Rahim, S. S., Palade, V., Shuttleworth, J., and Jayne, C. (2016) ‘Automatic Screening
and Classification of Diabetic Retinopathy and Maculopathy Using Fuzzy Image
Processing’. in Zhong, N., and Peng, H. (ed.) Brain Informatics 40708, 1-19
Conference Papers:
Rahim, S. S., Palade, V., Shuttleworth, J., and Jayne, C. (2014) ‘Automatic Screening
and Classification of Diabetic Retinopathy Fundus Images’. in Mladenov, V. et
al. (ed.) Proceedings of 15th
International Conference on Engineering
Applications of Neural Networks, EANN 2014, Communications in Computer
and Information Science 459. held 5-7 September 2014 at Sofia, Bulgaria.
Switzerland: Springer, 113-122
Rahim, S. S., Palade, V., Shuttleworth, J., Jayne, C., and Raja Omar, R. N. (2015)
‘Automatic Detection of Microaneurysms for Diabetic Retinopathy Screening
Using Fuzzy Image Processing’. in Iliadis, L., and Jayne, C. (ed.) Proceedings of
16th
International Conference on Engineering Applications of Neural Networks,
EANN 2015, Communications in Computer and Information Science 517. held
25-28 September 2015 at Rhodes, Greece. Switzerland: Springer, 69-79
Rahim, S. S., Palade, V., Jayne, C., Holzinger, A., and Shuttleworth, J. (2015)
‘Detection of Diabetic Retinopathy and Maculopathy in Eye Fundus Images
Using Fuzzy Image Processing’. in Guo, Y. et al. (ed.) Proceedings of 8th
International Conference on Brain Informatics and Health, BIH 2015, LNAI
9250. held 30 August-2 September 2015 at London, UK. Switzerland: Springer,
379-388

1
1 INTRODUCTION
Diabetic Retinopathy (DR) is one of the diabetes complications and is an important
cause of visual disability and blindness. It is vital to have a regular eye examination for
initial detection and early treatment. This thesis is about the development of a medical
decision support system for automatic diabetic retinopathy screening and classification
in eye fundus images.
The scope of this research focuses on the Asian country of Malaysia. The research was
sponsored by the Ministry of Higher Education in Malaysia and the Universiti Teknikal
Malaysia Melaka (UTeM). In addition, the research also received support, particularly
in the contribution of expertise, from the Department of Ophthalmology at the Melaka
Hospital, Malaysia, under the Ministry of Health for Malaysia.
In order to develop an accurate and efficient diabetic retinopathy screening system, the
capabilities of image processing techniques are investigated in this research work.
Several highly efficient image processing techniques are implemented and tested to
evaluate the system performance. The main image processing techniques used in this
research involve fuzzy image processing on eye fundus images, which has not been
previously investigated. A more reliable screening system can be produced with fuzzy
image processing capability and therefore enable the achievement of the screening
general aim, which is the earlier detection of sight threatening problems to ensure
prompt treatment for the prevention of vision loss.
This chapter introduces diabetic retinopathy and its screening. It focuses on Malaysia
and highlights some challenges faced by the Malaysian healthcare system in dealing
with diabetic retinopathy screening. Section 1.2 presents the research aims and
objectives. Section 1.3 explains the research motivation, alongside the contributions of
the thesis. Finally, Section 1.4 presents the overview of the chapters of this thesis.

2
1.1 Diabetic Retinopathy Screening and the Challenges Faced
by the Malaysian Government Diabetic Retinopathy (DR) is a diabetes mellitus complication, which also include
stroke, cardiovascular disease, diabetic nephropathy and diabetic neuropathy. The
retinal capillaries damage occurs in diabetes mellitus. Diabetic retinopathy can be
visualised only in the retina (Taylor and Batey, 2012), which is a layer of tissue.
Diabetic retinopathy happens through lasting of small blood vessels damage in the
retina, which eventually results in blindness. Hence, an effective screening of diabetic
retinopathy is important for early treatment, as well as an effective management of risk
factor to prevent diabetic complications.
The prevalence of diabetes globally presented by the World Health Organization
(WHO), reported in 2014 was estimated to be 9% among adults aged 18 and above
(2012a). Diabetes contributes to about one percent of global blindness (2012b).
Globally, 4.8% of the 37 million blindness cases is caused by the diabetic retinopathy
and approximately 366 million will be affected by diabetes mellitus worldwide in the
year 2030 (World Health Organization, 2005). In addition, diabetes has also been
predicted to be the seventh leading cause of death by the year 2030 (Mathers and
Loncar, 2006). The initial National Health and Morbidity Survey I (NHMS I) for
Malaysia was conducted in 1986. The survey reveals a prevalence of diabetes mellitus is
6.3%. In the year 1996, the percentage in NHMS II had increased to 8.3% and, the
newest NHMS III 2006 report shows that the total diabetes mellitus prevalence is 14.9%
(Letchuman et al., 2010).
Diabetes Mellitus (DM) is a complex disease resulting in severe complications in
various parts of the body. Nevertheless, good control of DM will avoid or delay various
complications, including diabetic retinopathy. The length of DM is associated with the
diabetic retinopathy incidence, and it has been reported that more than 75% of diabetes
patients have some diabetic retinopathy form after 20 years of the disease (World
Health Organization, 2005). Thus, screening and early treatment can avoid significant
loss of vision. Such efforts to control this enduring disease as well as the early
complications detection such as diabetic retinopathy should be strengthened, because
diabetic retinopathy is an asymptomatic condition in its initial stage (Taylor and Batey,

3
2012; Ministry of Health Malaysia, Malaysian Society of Ophthalmology and Academy
of Medicine Malaysia, 2011). It is also stated that diabetics are twenty-five times more
likely to develop blindness compared to the general population (Health Technology
Assessment Unit, Medical Development Division, Ministry of Health Malaysia, 2002).
Considering these complications and the rising numbers of diabetic patients in
Malaysia, a programme of diabetic retinopathy screening in the country must be
complete, covering all people with DM in Malaysia. To achieve this, significant
resources will be required for the management of the condition including human
resources, to increase the current workload within the field of disease diagnostics.
Diabetic retinopathy can only be identified through medical eye examination since it is
asymptomatic in its initial stage. The diabetes management at the facilities of the
Ministry of Health Malaysia (MOHM) is presently being performed in health clinics, in
addition in polyclinics, specialised clinics as well as hospital wards. In Malaysia,
screening is currently performed by general practitioners, clinicians in hospital based
diabetes centres, ophthalmologists, optometrists or a technician and a medically trained
photographic interpreter, in the case of photography (Health Technology Assessment
Unit, Medical Development Division, Ministry of Health Malaysia, 2002). There are
many modalities of screening available to detect and classify diabetic retinopathy. One
of the most common techniques used is ophthalmoscopy. Non-mydriatic digital fundus
photography is also popular (Ministry of Health Malaysia, Malaysian Society of
Ophthalmology and Academy of Medicine Malaysia, 2011).
Different screening modalities performed by different practitioners will produce a wide
variation of sensitivity and specificity. The screening tools include the following: the
direct and indirect ophthalmoscope, the slit lamp biomicroscope, the mydriatic fundus
camera and the non-mydriatic fundus camera. The non-mydratic fundus camera has
high sensitivity and specificity among other advantages. For example pupillary
dilatation is not required, especially if the room is adequately darkened, promoting
compliance, efficiency and safety (Ministry of Health Malaysia, Malaysian Society of
Ophthalmology and Academy of Medicine Malaysia, 2011). Trained primary care
clinicians are needed for screening of diabetic retinopathy to increase the accuracy of

4
interpretation and grading. Proper training among all healthcare personnel therefore is
essential. Specialised personnel for retinal screening and grading need specific training
and regular performance assessment. Moreover, the Clinical Practice Guidelines
Screening for Diabetic Retinopathy requires that the module of training should comprise
clinical skills and knowledge, computer imaging and skills, in addition operational
concerns and training of fundus grading (Ministry of Health Malaysia, Malaysian
Society of Ophthalmology and Academy of Medicine Malaysia, 2011).
Diabetes Mellitus is a growing problem among increasing numbers of diabetics every
year. Subsequently, there are several challenges faced by the Ministry of Health
Malaysia in diabetic retinopathy handling cases (Ministry of Health Malaysia, 2012a),
including:
i. Inadequate diabetic eye screening programs
In order to perform successful eye screening, a team of trained healthcare
personnel is required. Fewer screening teams, especially in rural hospitals,
have significantly decreased the number of the eye screening programs. At
the moment, screening programs are exclusively performed at primary health
care centres (selected health clinic with fundus camera), hospital or clinics
with eye care providers such as ophthalmology and optometry clinics.
According to a relatively recent report on diabetic retinopathy screening by
the Unit of Health Technology Assessment, only 24 out of the 114 Ministry
of Health hospitals have a department of ophthalmology, while
ophthalmologists aim to visits other hospitals regularly (Health Technology
Assessment Unit, Medical Development Division, Ministry of Health
Malaysia, 2002).
ii. Inadequate resources to complete the task
The main resources needed for the screening are trained staff and fundus
cameras. All healthcare personnel involved in screening require proper
training before they can join the programs. There is a need for training on
5
how to screen the images and how to improve the accuracy of interpretation
and grading, in addition in terms of sensitivity and specificity.
The screening tools and techniques used in the program are the other
important factors to be considered. There are many available screening
modalities used for diabetic retinopathy screening. Ophthalmoscopy is a
popular screening method, but non-mydriatic digital camera is also widely
prescribed due to its high sensitivity and specificity. The fundus camera
however is limited throughout Malaysian hospitals and health clinics. In the
year of 2011, the total number of fundus camera available at health clinics
under the Ministry of Health was only 107 (Ministry of Health Malaysia,
Malaysian Society of Ophthalmology, Academy of Medicine Malaysia,
2011). This lack of vital screening resources will invariably result in longer
waiting lists for initial screenings and referrals to ophthalmologist. This will
ultimately lead to more serious eye complications.
iii. Poor patient information or awareness
One of the barriers in handling diabetic retinopathy is the patient factor. A
lack of awareness of the possible eye complications from diabetes mellitus is
one of the factors that have decreased the frequency of diabetic retinopathy
screening. Moreover, other factors which impede the level of diabetic
retinopathy awareness amongst Malaysians are eye care services poor access
and dissimilar cultural beliefs. As such, patients should be aware that regular
eye examinations are important.
1.2 Research Aims and Objectives The aim of this research is to investigate automatic methods for diabetic retinopathy
detection that can contribute towards improving diabetic retinopathy management and,
subsequently, to develop an efficient system for diabetic retinopathy screening.
Basically, the proposed diabetic retinopathy research consists of three types of systems.
Firstly, the thesis will present the development of a basic system for the screening and
classification of diabetic retinopathy using eye fundus images, which is a system for

6
general detection for diabetic retinopathy screening and will classify images into two
respective cases: Normal and Diabetic Retinopathy. The research will then focus on the
microaneurysms detection which are the earliest diabetic retinopathy signs.
Different image processing techniques, including fuzzy image processing, are
implemented in a variety of detection systems for microaneurysms which classify
images into two main categories. The first categorisation classifies them into detected
and non-detected cases. The second categorisation is based on Normal (No DR) and
Diabetic Retinopathy cases. In addition, the thesis presents the fuzzy-based image
processing decision support systems for diabetic retinopathy and maculopathy detection
in eye fundus images. The proposed systems classify the images into two types of
classification, in order to generate a diversity of results and system performance
analysis, which are the two above cases (Normal and Diabetic Retinopathy) and an
additional ten cases which follow the ophthalmologists’ practice and provide more
details. The second classification involves No Diabetic Retinopathy and the other nine
detailed classes of the DR cases: Mild DR without maculopathy, Mild DR with
maculopathy, Moderate DR without maculopathy, Moderate DR with maculopathy,
Severe DR without maculopathy, Severe DR with maculopathy, Proliferative DR
without maculopathy, Proliferative DR with maculopathy and Advanced Diabetic Eye
Disease (ADED).
In order to assist screeners to classify the retinal images effectively and with high
confidence, an accurate retinal screening system is necessary. Therefore, to develop a
diabetic retinopathy screening grading and classification system, effective techniques of
image processing must be used. This research project examines the use of the fundus
images for detecting the diabetic retinopathy features presence in the eyes. This is a
particularly challenging problem and this thesis proposes novel use of image processing
techniques in order to automatically detect the stages of retinopathy. To achieve this
aim, highly efficient and accurate image processing techniques must be used to produce
an effective screening of diabetic retinopathy.

7
Despite the existence of a range of image processing techniques, the need for highly
effective and specialised image processing techniques in this case cannot be over
emphasised. Factors such as the fundus images suffering from noise and latency are
often encountered, necessitating calibration and filtering before the images can be used
reliably. In addition, the quality of the image depends on the skills applied by the
paramedic in capturing the eye fundus images, as well as on other factors including the
quality of the equipment and possible distractions from the environment. Due to these
facts, all healthcare staff requires proper training before they are qualified and equipped
for diabetic retinopathy screening. This is important as it can help increase the
likelihood of accurate interpretation and grading. In addition to the lengthy and rigorous
training of healthcare personnel before qualification, a growing challenge faced by the
healthcare sector is the fact that diabetes mellitus is on the increase, with higher
numbers of diabetics each year. It has also been highlighted by governments and other
relevant stakeholders that the diabetic eye screening program is inadequate, as are the
resources to complete the task, in addition to poor patient information or awareness
(Ministry of Health Diabetic Retinopathy Screening Team, 2012b).
Further to the range of complications associated with images captured by the fundus
camera, there is also the need for an experienced paramedic to diagnose whether the
patient has any conditions (i.e., diabetic retinopathy). This screening phase is carried out
manually by the paramedic who looks for any changes (abnormalities) on the retinal
image, making the whole diagnostic process highly convoluted and protracted.
Based on the aforementioned reasons, in order to pursue this study primary research
outcome, which is the development of a computer-based imaging tool, a method must
be created in order to effectively detect important features on the fundus images and
efficiently classify patients into the correct retinopathy stages. This automatic diabetic
retinopathy grading will facilitate a reduction in the burden of manual grading for the
screening team, and help alleviate the pressure on the limited eye screening centres in
Malaysia (Ministry of Health Malaysia, Malaysian Society of Ophthalmology and
Academy of Medicine Malaysia, 2011). As a result of early detection, it would also help
ophthalmologists to treat patients before their conditions worsen and, most importantly,
8
increase the chance of protecting the patient’s vision. Moreover, an automatic diabetic
retinopathy system would diagnose it in a faster and more efficient way. In addition, as
suggested by the available literature, the initial detection of retinopathy, the existing
retinopathy monitoring with consistent fundus examinations and effective laser
treatment at suitable times, are among the key measures to prevent visual loss from
diabetic retinopathy (Health Technology Assessment Unit, Medical Development
Division, Ministry of Health Malaysia, 2002).
The main objectives of the research described in this thesis are as follows:
i. To develop an automatic screening and classification systems for diabetic
retinopathy using fundus images in order to detect diabetic retinopathy at an
early stage.
ii. To propose novel use of image processing and machine learning techniques
for early detection of the signs of diabetic retinopathy.
The research introduced novel use of image processing techniques for the automated
detection of retinopathy stages, including the combination of various pre-processing
techniques as well as fuzzy image processing techniques, such as fuzzy histogram
equalisation, fuzzy filtering and fuzzy edge detection. In addition, the research proposed
the use of Circular Hough Transform and various machine learning classifiers.
1.3 Motivation and Contributions of the Thesis
Eye screening is important for the early detection and treatment of diabetic retinopathy.
Regular screening can help detect patients with diabetes at an early stage thus, earlier
identification of any retinopathy can allow changes in blood pressure or blood glucose
to be managed efficiently to slow the rate of progression of the disease. The importance
of the proposed research is to overcome the current problems faced in the diabetic
retinopathy screening process, such as:

9
i. Manual diagnosis by the ophthalmologist
Currently, clinicians use non-mydratic fundus cameras to capture retinal
images. Based on the image produced from the fundus camera, the
experienced screening team will diagnose whether or not patients have any
conditions (including diabetic retinopathy). The diagnosis is carried out
manually by screeners who assess any changes (abnormalities) on the retinal
image. This process is both laborious and prone to error. Therefore, a
computer-based imaging tool is needed to effectively detect the signs of
diabetic retinopathy, allowing ophthalmologists to gain a suitable window in
which to treat patients, before serious damage occurs, thus increasing the
chance of protecting the patient’s vision. It will also help decrease the
workload for healthcare personnel in the diabetic retinopathy screening
process.
ii. Time taken and limitations of screening resources
The proposed automatic diabetic retinopathy system would help save time,
costs and ultimately the vision of patients. With appropriate automation (i.e.,
decision support systems) in place, preventative actions to protect vision can
then be taken earlier and therefore can help reduce the number of diabetic
retinopathy problems, in addition to the risk of blindness. A decision support
system for clinical diagnosis would contribute greatly in assisting with the
management and detection of diabetic retinopathy. An automatic system will
assist an ophthalmologist (or optometrist) to detect diabetic retinopathy (and
its detailed classification) in a more efficient and faster way compared with
manual analysis, which is more time-consuming. As a result, the proposed
system will indirectly assist in the process of recommended follow-up
schedules for each category of diabetic retinopathy based on the system
detection. Furthermore, the development of the proposed system will
contribute to overcoming the diabetic retinopathy screening limitations
inherent in the present manual screening procedure, especially given the
problems of inadequately trained staff and the use of the fundus camera, as
highlighted in Section 1.1.

10
iii. Developing effective techniques of image processing for the diabetic
retinopathy detection
Diabetic retinopathy screening is a popular research area and many
researchers focus on and contribute to the advancement of this study area.
Most researchers focus on finding and proposing an accurate technique or
method for detecting certain features of diabetic retinopathy through
exploring the eye fundus images. Although there have been immense
advancements in this area of research, there are still lacunae or spaces for
improvement. The proposed techniques in this research will most notably
benefit the realm of image processing in a number of areas or ways that
include the provision of an accurate method for effectively detecting features
of diabetic retinopathy.
Based on the general objectives in Section 1.2 above, in particular the
second objective, the highlighted contributions of this thesis include:
implementing image processing techniques combination for the general
diabetic retinopathy screening detection (Rahim et al., 2014), investigating
image processing techniques combination for the diabetic retinopathy
features detection, focusing on microaneurysms, an important early feature
of diabetic retinopathy (Rahim et al., 2015a; 2015b) and the evaluation of
image processing techniques combination for the diabetic retinopathy and
diabetic maculopathy detection (Rahim et al., 2015c; 2016). In addition, the
contributions of this thesis include employing the novel use of fuzzy image
processing techniques for the pre-processing stage of medical images, i.e.,
eye fundus images for diabetic retinopathy screening (Rahim et al., 2015a;
2015b; 2015c; 2016), as well as implementing a new online dataset
containing normal and diabetic retinopathy fundus images (Rahim et al.,
2015b; 2015c; 2016) and finally, testing a new method for macula region
localisation in order to detect maculopathy (Rahim et al., 2016).
To summarise, diabetes mellitus is a main health problem. One of the diabetes mellitus
health effects is diabetic retinopathy, which causes blindness. Therefore, an effective

11
tool to help in the diabetic retinopathy detection is essential. A computer-based imaging
screening method is needed to be developed where effective and cost-effective
approaches are required. Automatic detection systems of diabetic retinopathy for
patients with diabetes using the eye fundus photography will help the screening process
by providing a user- or patient-friendly approach in addition to a cost-effective
screening tool. Automatic classification systems with a high accuracy of diabetic
retinopathy screening will help in decreasing the workload for healthcare personnel in
the process of the early detection of diabetic retinopathy. It would also be helpful to
patients in terms of early treatment, which could prevent or ameliorate substantial visual
loss. This thesis proposes an automatic diabetic retinopathy detection system, and also
introduces a new dataset of fundus images, which would be beneficial to retinal imaging
researchers and practitioners, especially in the diabetic retinopathy screening field.
1.4 Research Methodology The research methodology is concerned with the base of the inverted triangle in Figure
1.1. The figure shows that the main components of this research are diabetic retinopathy
screening, fundus images as input and image processing techniques. The developed
system consists of three stages: image pre-processing, feature extraction and
classification. In order to validate the systems output performance, the results generated
from the developed system are compared to the expert findings and several analyses are
performed.
Understanding the diabetic retinopathy screening process, including the diabetic
retinopathy development and diabetic retinopathy signs, are essential and information is
collected through observation and interview techniques. The fundus images, which are
the main data for this research, are extracted from the personal computer that is attached
to the fundus camera. Each patient folder consists of the patient information and the eye
fundus images. The automatic diabetic retinopathy detection systems are developed by
employing a novel use of image processing techniques. The developed systems consists
of three types of system development, which are the general detection of diabetic
retinopathy, the development of an automatic system for microaneurysms detection and
the development of an automatic diabetic retinopathy and maculopathy detection

12
system. The systems are evaluated with the combination of normal and diabetic
retinopathy fundus images from a new data set collected during this research and also
from several public datasets available as benchmark data. A thorough system
performance analysis has been undertaken, which compared the performance of
automatic systems to the manual diagnosis performed by the experts.
Figure 1.1 Methodology of the research

13
1.5 Thesis Overview The thesis is organised into six chapters, each focusing on different features of the
research work. The following is a summary of the contents of each chapter.
Chapter 1 provides an overview of diabetic retinopathy screening and a more detailed
investigation of the problems, particularly in Malaysia. The research aims and
objectives of this study are also presented. In addition, the motivations which have led
to this research, the contributions of the thesis and the research methodology are
presented in this introductory chapter.
Chapter 2 describes the background and the literature review in addition to basic
information on diabetes mellitus and diabetic retinopathy, as well as the prevalence of
diabetes mellitus and diabetic retinopathy worldwide and, particularly, in Malaysia. It
also provides information on the level of advancement in the area of image processing
for diabetic retinopathy screening systems. The chapter also highlights the
implementation of fuzzy image processing techniques on medical and non-medical
images, which is the core of this research work.
Chapter 3 discusses the research methodology used, including the process of data
collection for this study. The research design, as a guide for planning the research
development, is also presented. The experimental datasets, which consist of the existing
datasets and a novel developed dataset, are presented in Chapter 3 in greater detail. The
development of this new dataset is highlighted, including the expert diagnosis process,
the diagnosis summary and its overall advantages.
Chapter 4 explains the development of the proposed systems, using the previously
described datasets and image processing techniques. Each system presents a
combination of different techniques, such as different pre-processing techniques,
different feature parameters and different classifiers in the diabetic retinopathy
screening system. These systems are different from those proposed by other researchers.
The evaluations of the developed systems are also presented in Chapter 4, where it

14
presents the efficiency and the validity of diabetic retinopathy classification through the
developed systems.
Chapter 5 presents the overall results analysis of a new dataset. It also presents the
overall result analysis for the automatic developed systems. The chapter discusses the
analysis performed on the expert diagnosis, including descriptive and inferential
analysis. In order to generate a variance of system testing results and system
performance, the overall analysis of the developed systems are presented in two ways:
confusion matrix and statistical analysis. In addition, some discussions on the findings
of this study are presented.
Chapter 6 summarises the accomplishments of the research work. It concludes the
contents of the thesis and also highlights some recommendations for future research
work. It also provides information regarding the research contributions, which have
benefited a number of areas.

15
2 BACKGROUND AND LITERATURE REVIEW
Diabetes Mellitus (DM) is a significant public health concern. The diabetes epidemic is
leading to an increasing number of severe and chronic complications, including those
that are sight-threatening. Diabetic Retinopathy (DR) is a complication of diabetes
caused by high blood glucose. Diabetic retinopathy is a microvascular complication of
both insulin dependent (type 1) and non-insulin dependent (type 2) diabetes. It is one of
the diabetes mellitus complications that damages blood vessels inside the retina. The
retina is located at the back of the eye. Diabetic retinopathy commonly affects both eyes
and can lead to vision loss if it is not promptly treated (Centre for Eye Research
Australia, 2013).
This chapter provides the background for each of the main components involved in the
research. It comprises seven main components which are diabetes mellitus, diabetic
retinopathy, epidemiology of diabetic retinopathy, classification of diabetic retinopathy,
diabetic retinopathy screening, diabetic retinopathy image processing and finally, fuzzy
image processing, particularly on medical images. The chapter starts with the
explanation of diabetes mellitus in Section 2.1, followed by Section 2.2 which presents
one of its complications, i.e., diabetic retinopathy. Section 2.3 reveals the prevalence of
diabetes mellitus and diabetic retinopathy from a global perspective in addition to an
epidemiologic perspective in Malaysia. The classification of diabetic retinopathy is
explained in Section 2.4. Section 2.5 describes how diabetic retinopathy screening is
performed, including the grading process, examination schedule, diabetic retinopathy
treatment and management in addition to the follow up schedule. The image processing
approach, which is particularly used in diabetic retinopathy screening research, is
explained in Section 2.6. The implementation of fuzzy image processing that focuses on
medical images, which is the core of the proposed research, is presented in Section 2.7.
Finally, a summary of the second chapter is provided in Section 2.8.
2.1 Diabetes Mellitus Diabetes mellitus is a disorder caused by constant hyperglycemia of variable severity,
incidental to a lack or lessened efficacy of insulin (Ministry of Health Diabetic
16
Retinopathy Screening Team, 2012a). Meanwhile, Scanlon et al. (2012) have defined
diabetes mellitus as a chronic condition due to an excess of glucose circulating in the
bloodstream. Diabetes is a disorder caused by high levels of glucose in the blood
(Taylor and Batey, 2012; NHS Choices, 2012). It happens either when the pancreas
does not produce enough insulin or because cells do not respond to the insulin
produced. Insulin is a peptide hormone, produced by beta cells of the pancreas, a large
gland which is located behind the stomach. There are two types of diabetes mellitus,
which are Type 1 diabetes and Type 2 diabetes.
The increasing numbers of cases of diabetes are due to the following factors: a longer
life-span, modern lifestyles (urbanisation, mechanisation and industrialisation) and also
environmental and social factors, such as an unhealthy diet, obesity and physical
inactivity (International Diabetes Federation, World Health Organization and Secretariat
of the Pacific Community, 2000; Ministry of Health Diabetic Retinopathy Screening
Team, 2012a; Sivaprasad et al., 2012), in addition to uncontrolled hypertension and
smoking (Health Technology Assessment Unit, Medical Development Division,
Ministry of Health Malaysia, 2002). Tajunisah and others (2006) have claimed that the
duration of diabetes, hypertension and systemic complications including diabetic foot
ulcer, lower limb amputation, nephropathy and neuropathy were also factors of
retinopathy incidence. In addition, Mallika et al. (2011) confirmed that the duration of
diabetes, body mass index and visual loss are associated with diabetic retinopathy.
Meanwhile, the main symptoms of both types of diabetes are thirst, urinating frequently
(particularly at night), tiredness, weight loss, loss of muscle bulk, skin infections and
urinary infections (NHS Choices, 2012; Taylor and Batey, 2012).
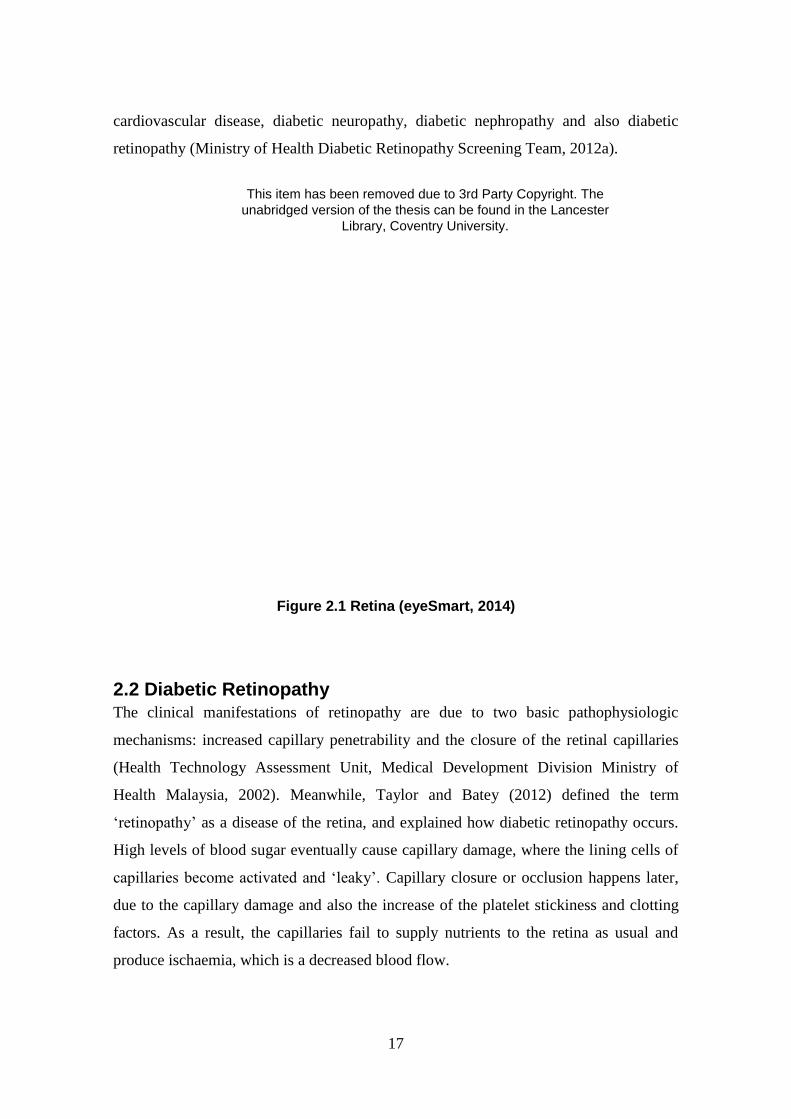
Diabetes causes capillaries problems in the body, and the merely way to visualise this
condition is by looking into the retina (Taylor and Batey, 2012). Figure 2.1 shows the
anatomy of the eye including the retina, optic nerve, retinal vessels, cornea, lens, iris
and sclera. The retina is a light-sensitive tissue that located at the back of the eye, as
illustrated in Figure 2.1. Diabetes mellitus, if left untreated, can cause many health
problems. Among the systemic complications of diabetes mellitus are stroke,
17
cardiovascular disease, diabetic neuropathy, diabetic nephropathy and also diabetic
retinopathy (Ministry of Health Diabetic Retinopathy Screening Team, 2012a).
Figure 2.1 Retina (eyeSmart, 2014)
2.2 Diabetic Retinopathy The clinical manifestations of retinopathy are due to two basic pathophysiologic
mechanisms: increased capillary penetrability and the closure of the retinal capillaries
(Health Technology Assessment Unit, Medical Development Division Ministry of
Health Malaysia, 2002). Meanwhile, Taylor and Batey (2012) defined the term
‘retinopathy’ as a disease of the retina, and explained how diabetic retinopathy occurs.
High levels of blood sugar eventually cause capillary damage, where the lining cells of
capillaries become activated and ‘leaky’. Capillary closure or occlusion happens later,
due to the capillary damage and also the increase of the platelet stickiness and clotting
factors. As a result, the capillaries fail to supply nutrients to the retina as usual and
produce ischaemia, which is a decreased blood flow.
This item has been removed due to 3rd Party Copyright. The unabridged version of the thesis can be found in the Lancester
Library, Coventry University.


19
A fundus image with diabetic retinopathy features is presented in Figure 2.3, while the
explanation of the features is presented in Table 2.1. Amongst the detected retinopathy
signs are the microaneurysms, the retinal haemorrhages, the hard exudates, cotton wool
spots, abnormal new vessels and venous beadings, which are presented in Figure 2.3.
The definitions of these signs of diabetic retinopathy are listed in Table 2.1.
Table 2.1 Terminology definition of diabetic retinopathy signs (adapted from
Taylor and Batey, 2012)
This item has been removed due to 3rd Party Copyright. The unabridged version of the thesis can be found in the Lancester Library, Coventry University.

20
Table 2.1 (continued)
Figure 2.3 Features of diabetic retinopathy (Ministry of Health Diabetic
Retinopathy Screening Team, 2012b)
This item has been removed due to 3rd Party Copyright. The unabridged version of the thesis can be found in the Lancester Library, Coventry University.
This
This item has been removed due to 3rd Party Copyright. The unabridged version of the thesis can be found in the Lancester Library, Coventry University.

21
Figure 2.4 shows a comparison between the ordinary retina and a retina with diabetic
retinopathy signs. Figure 2.4 (a) shows the normal retina, which is free of any signs of
diabetic retinopathy. Meanwhile, Figure 2.4 (b) shows the retina with the presence of
several features of diabetic retinopathy, such as microaneurysms, haemorrhages,
exudates, cotton wool spots and maculopathy. The terminology of these features is
described in Table 2.1, while the visualisation of these features is presented in Figure
2.3.
(a) Normal retina
(b) Diabetic retinopathy signs
Figure 2.4 Normal retina compared to retina with diabetic retinopathy signs
2.3 Epidemiology of Diabetic Retinopathy
This section will reveal both the Malaysian and the worldwide prevalence of visual
impairment and diabetic retinopathy.
2.3.1 Diabetic Retinopathy and Global Epidemiology
Diabetic Retinopathy is an important cause which can lead to blindness. Global Data on
Visual Impairment, a 2010 article by the World Health Organization (WHO) stated that
globally, the number of visually impaired people of all ages was estimated to be 285
million, where 39 million are blind and 246 million suffered from low vision (World
Health Organization, 2012b). In addition, people aged 50 years and older make up 82%
This item has been removed due to 3rd Party Copyright. The
unabridged version of the thesis can be found in the Lancester Library, Coventry University.
This item has been removed due to 3rd Party Copyright. The
unabridged version of the thesis can be found in the Lancester Library, Coventry University.

22
of the blind and 65% of the visually impaired. The report makes estimates for three age
groups (0 to 14 years, 15 to 49 years and 50 years above) coming from six WHO
regions (the African Region, the Region of the Americas, the Eastern Mediterranean
Region, the European Region, the South-East Asian Region and the Western Pacific
Region). The major global causes of visual impairment are uncorrected refractive errors
(42%), cataracts (33%), glaucoma (2%), age related macular degeneration (1%),
diabetic retinopathy (1%), trachoma (1%), corneal opacities (1%) and the remaining
18% is undetermined. Meanwhile, the major causes of blindness are cataracts (51%),
glaucoma (8%), age related macular degeneration (5%), childhood blindness (4%),
corneal opacities (4%), uncorrected refractive errors and trachoma (3%), diabetic
retinopathy (1%) and other undetermined causes (21%). The global visual impairment
and blindness reasons are depicted in pie chart form in Figure 2.5 and Figure 2.6,
respectively. The report summarises that retinal diseases are the main global of visual
impairment cause. In addition, the article confirms that the total number of visual
impairments and blindness due to age-related macular degeneration, glaucoma and
diabetic retinopathy is more compared to trachoma and corneal opacities, which are the
infective causes. The report suggests an urgent development of the eye care system
including rehabilitation, education and support services is required to overcome those
enduring eye diseases. It can be concluded therefore that diabetic retinopathy is among
of the visual impairment and blindness causes. Thus, this eye problem should be
addressed before it is worsens.
In addition, Sivaprasad and others (2012) examine a global prevalence of diabetic
retinopathy according to ethnicity and region. The survey reveals that the prevalence of
diabetic retinopathy, including sight threatening diabetic retinopathy and macular
edema, are higher in South Asian, African and Latin American populations compared to
the white population. The survey also concludes that ethnic-specificity is one of the
contribution rates of diabetic retinopathy, in addition to other factors, including the
length of exposure and severity of hyperglycemia, hypertension and hyperlipidemia. In
addition, factors like obesity, urbanisation, changes in diet, sedentary lifestyles and
communicable diseases rate will increase the demands on healthcare for many
ethnicities, particularly in Asia.

23
Figure 2.5 Global causes of visual impairment, including blindness, as
percentage (World Health Organization, 2012b:6)
Figure 2.6 Global causes of blindness as a percentage of global blindness
in 2010 (World Health Organization, 2012b:6)
2.3.2 Diabetic Retinopathy Epidemiology in Malaysia
Diabetes mellitus is a significant public health concern and one of the most established
enduring diseases in Malaysia. The National Health and Morbidity Survey (NHMS)
presented the diabetes prevalence for Malaysians (Letchuman et al., 2010). The survey,
This item has been removed due to 3rd Party Copyright. The unabridged version of the thesis can be found in the Lancester Library, Coventry
University.
This item has been removed due to 3rd Party Copyright. The unabridged version of the thesis can be found in the Lancester Library, Coventry
University.

24
which involved 34,539 respondents and covered all states of Malaysia, reported that the
highest prevalence of diabetes among ethnic groups is thus: Indians (19.9%), followed
by Malays (11.9%) and Chinese (11.4%). In addition, the survey also revealed other
information, such as the prevalence of people with known diabetes was 7.0%, while
newly diagnosed diabetes was 4.5% and 4.2% for Impaired Fasting Glycaemia. It was
also reported that about 73.5% of the patients used the government healthcare services
and only 45.05% of known diabetics had undergone an eye examination. Letchuman
and others (2010) were unsatisfied with the results showing that only one third of
respondents had their eyes examined within one year from the time of the survey.
Although they are required to have an eye examination at diagnosis and subsequently
annually (as recommended by the clinical practice guidelines on the management of
diabetic retinopathy in type 2 diabetes), the patients seldom had their eye examinations
as suggested. In addition, Letchuman and others (2010) conclude that the reasons for
the lower percentage of eye examination are include: patients’ lack of awareness of the
schedule and the lack of eye screening services due to insufficient numbers of trained
staff and resources.
The survey also reported the prevalence of diabetes cases in Malaysia by state, where
Negeri Sembilan, Melaka and Penang have the highest frequency of diabetes, with
15.3%, 15.2% and 14.9%, respectively. The location of this research is Melaka, which
is highlighted as having the highest prevalence of diabetes. The survey also reveals that
the prevalence of diabetes is higher in urban (12.2%) compared to rural areas (10.6%).
In addition, Mafauzy and colleagues (2011) proposed a study on the diabetes care status
in Malaysia, which involved 1,670 patients from general hospitals, diabetes clinics and
referral clinics. The most commonly reported eye complications of the study include
proliferative diabetic retinopathy.
Goh’s research (2008) reported that in 2007 the total number of diabetics with diabetic
retinopathy registered to the Diabetic Eye Registry was about 36.8%. In addition, the
research revealed some demographic characteristics, such as the mean age of the
registered patients was 57.2 years and that half of them (52.8%) were aged between 30
to 60 years. Diabetic patients were most commonly female at 54.6% and the majority of

25
the patients were Malay (54.0%). Moreover, about 92.2% of patients diagnosed with
type 2 diabetes mellitus had the condition for below 10 years and 91.7% had been
referred from a government healthcare facility. It was also reported that two thirds of
diabetic patients had never previously undergone an eye examination and 71.9% of
those who had an eye examination had attended a year ago. There were about 63.3%
patients diagnosed as having no diabetic retinopathy, in addition to mild non-
proliferative diabetic retinopathy accounting for 16.5%, moderate non-proliferative
diabetic retinopathy (9.8%), severe non-proliferative diabetic retinopathy (3.4%),
proliferative diabetic retinopathy (7.1%) and maculopathy was detected in 9.5% of
cases (Goh, 2008).
The 7th
Report of the National Eye Database 2013 by the NED Steering Committee
Members (2015) presented the distribution of three eye diseases, which consisted of
diabetic retinopathy, glaucoma and lens-related complications, from the year 2002 to
2013, as illustrated in Figure 2.7. It can be concluded that among the three eye diseases,
diabetic retinopathy showed the highest percentage of distribution. The percentage of
diabetic retinopathy cases however, seemed to be reducing from 2010 onwards.
Figure 2.7 Percentage distribution of diabetic retinopathy cases, glaucoma or
lens-induced glaucoma, 2002-2013 (NED Steering Committee Members,
2015:112)
This item has been removed due to 3rd Party Copyright. The unabridged version of the thesis can be found in the Lancester Library, Coventry University.

26
In addition, Addoor and others (2011) conducted a study of the awareness of diabetic
retinopathy among the patients attending the diabetic clinics in Melaka, Malaysia and
reported that 79.8% of the respondents were aware of diabetes mellitus complications
and 87.2% were aware that diabetes can affect the eyes. The study also reported
however that only 50% of the patients had undergone an ophthalmological evaluation.
The proposed study concluded that although awareness among the patients was good,
the motivation to undergo the assessment was poor. Furthermore, Thevi et al. (2012)
revealed the eye diseases and visual impairment frequency among the rural population.
It was reported that cataracts (22.9%) were the most popular eye disease, after that
retinal illnesses including diabetic retinopathy (11.5%) and ocular trauma (9.8%).
2.4 Classification of Diabetic Retinopathy There are several classifications or stages of diabetic retinopathy. The Screening for
Diabetic Retinopathy Report by the Ministry of Health in Malaysia explained the
technical features of how the stages of diabetic retinopathy occur (Health Technology
Assessment Unit, Medical Development Division, Ministry of Health Malaysia, 2002).
The enlargement of the veins in the retina is reported as one of the initial signs of
diabetic retinopathy. The small capillaries present may also produce some changes,
which affect the blocking, and later result in small swellings in the vascular walls,
called microaneurysms. This is termed minimal non-proliferative diabetic retinopathy
(NPDR), and, at this early stage, the sight may not be affected. The incidence of
diabetic retinopathy continued in cases where the blood flow gradually worsens and
progressively causes damage to larger portions of the retina. At this level, small
haemorrhages and other vascular changes in the fundus of the eye appear, due to
vascular blocking and leakage. Consequently, the retinopathy progresses from minimal
to mild, due to the appearance of retinal haemorrhages, hard exudates and nerve layer
infarct. In addition to minimal and mild NPDR, moderate NPDR occurs due to venous
beading and intra-retinal microvascular irregularities. For severe NPDR classification,
there should be more haemorrhages, microaneurysms, intra-retinal microvascular
abnormalities and venous beading than is present in moderate NPDR (Health
Technology Assessment Unit, Medical Development Division, Ministry of Health
Malaysia, 2002).

27
The next severe stage of diabetic retinopathy, or proliferate diabetic retinopathy (PDR)
occurs when new vessels (neovascularisation) are detected. This stage is high risk and
could result in blindness. These diabetic retinopathy stages and their respective features
are presented in Table 2.4. The macula disorders which affect the central vision happen
due to visual loss from diabetic retinopathy. Therefore, eye examinations for the
diagnosis of diabetic retinopathy at an initial stage are important, because diabetic
retinopathy can bring to blindness. Moreover, regular screening can help save sight.
2.5 Diabetic Retinopathy Screening
Screening is defined as the testing of a population in order to identify individuals
exhibiting attributes that could be early symptoms, or indicators, of a predisposition
associated with a particular condition (Taylor and Batey, 2012). The main purpose of
diabetic retinopathy screening is to detect whether the individuals require referral for
further treatment, in order to prevent blindness (Taylor and Batey, 2012). In addition to
this main purpose, there are other purposes for diabetic retinopathy screening. These
include: identifying the disease at an early stage; possibly detecting a requirement for
blood pressure and blood sugar treatment; educating the population about the causes of
diabetic retinopathy and ways to reduce the risk; and, potentially, to identify non-
diabetic conditions through the screening process (Taylor and Batey, 2012). One major
problem is that diabetic eye disease does not interfere with sight until it reaches an
advanced stage (Taylor and Batey, 2012). Laser treatment can save sight, but only if it is
used at an early stage. This shows the importance of essential regular screening, which
can help detect the diabetic patients at an early stage of diabetic retinopathy. Moreover,
earlier identification of any retinopathy signs can allow changes to blood pressure or
blood glucose management in order to slow the rate of progression.
Digital retinal imaging is usually used as a screening technique. The proposed method is
recommended in the UK and also by the National Retinal Screening Project Group
(Taylor and Batey, 2012). However, there are some challenges, such as efficient and
cost-effective measures, that need to be considered to establish the screening systems.
Furthermore, Taylor and Batey (2012) considered digital retinal imaging as one of the
screening choices and underlined five principles of retinal screening. These are

28
comprised of regular screening assurance, the availability of an efficient screening
system, eye screening practise being included as part of diabetes care, the
ophthalmologist’s participation in the planning and operation of the screening system
and finally, the quality control of the screening process. Scanlon and colleagues (2009)
recommended four steps in systematic screening programmes developed for the sight-
threatening diabetic retinopathy. Firstly effective treatment, opportunistic as well as
systematic screening, and finally, full quality assurance and coverage screening.
Meanwhile, Hutchins et al. (2012) presented a study of diabetic retinopathy screening in
New Zealand, and concluded that among the requirements in improving the retinal
screening quality should be quality data and quality assurance platforms.
As discussed in Chapter 1, there are many screening methods available for diabetic
retinopathy screening. Figure 2.8 shows the screening modalities used in screening
programmes including the direct ophthalmoscope, the slit-lamp biomicroscopy with
contact lens, the binocular indirect ophthalmoscopy and the fundus photography.
However, different screening modalities will provide a variation in the sensitivities and
specificities obtained.
Table 2.2 describes the diagnostic accuracy of different screening tools, which are the
direct ophthalmoscope, the slit lamp biomicroscope, the mydriatic fundus camera and
also the non-mydriatic fundus camera. It can be concluded from Table 2.2, that the non-
mydriatic fundus camera has high sensitivity and specificity, eliminating the need for
pupillary dilatation, promoting compliance, efficiency and safety. The clinical practice
guidelines for the screening of diabetic retinopathy (Ministry of Health Malaysia,
Malaysian Society of Ophthalmology and Academy of Medicine Malaysia, 2011)
recommend that the non-mydriatic fundus camera should be used as a screening tool for
diabetic retinopathy, whenever possible with a double field fundus photo assessment.
When there is no access to a fundus camera, an ophthalmoscope should be used.

29
Direct ophthalmoscope Slit-lamp biomicroscopy with contact
lens
Binocular indirect ophthalmoscopy Fundus photography
Figure 2.8 Diabetic retinopathy screening tools (Ministry of Health Diabetic
Retinopathy Screening Team, 2012c:14)
Table 2.2 Sensitivity and specificity of diabetic retinopathy tools (Ministry of
Health Malaysia, Malaysia Society of Ophthalmology and Academy of Medicine
of Malaysia, 2011)
This item has been removed due to 3rd Party Copyright. The unabridged version of
the thesis can be found in the Lancester Library, Coventry University.
This item has been removed due to 3rd Party Copyright. The unabridged version of
the thesis can be found in the Lancester Library, Coventry University.
This item has been removed due to 3rd Party Copyright. The unabridged version of
the thesis can be found in the Lancester Library, Coventry University.
This item has been removed due to 3rd Party Copyright. The unabridged version of
the thesis can be found in the Lancester Library, Coventry University.
This item has been removed due to 3rd Party Copyright. The unabridged version of the thesis can be found in the Lancester Library, Coventry University.

30
Generally, in current practice, all registered diabetic patients will first undergo the
visual acuity test. Following this, fundus photography session will be organised using
the fundus camera and assessment will then be performed. A trained paramedic will
play a role in grading the captured fundus images into a diabetic retinopathy stage,
based on the changes or abnormalities shown on the fundus images. The management of
the condition, including a follow-up schedule or referral to an ophthalmologist for
further diagnosis, will be decided upon based on the retinopathy stages. This
explanation of the diabetic retinopathy screening process is illustrated in Figure 2.9.
Currently in Malaysia, the clinicians use the non-mydratic fundus camera to capture
retinal images. The fundus camera comprises an internal or external digital camera, a
computer and a software system. It is used because of its strengths as it is easy to use,
patient-friendly, user-friendly, time and cost effective and also pupil dilatation is
performed only if necessary. The fundus camera produces high quality digital
photographs that can be viewed immediately and shown to the patients to improve their
understanding of the disease. A fundus camera is designed to photograph the interior
surface of the eye such as the retina, the optic disc, the macula, and the posterior pole
(i.e., the fundus). Fundus cameras are used by optometrists, ophthalmologists, and
trained medical professionals in order to monitor the disease progression, for the
diagnosis of a disease or in screening programmes, where the photos can be analysed
later.

31
Figure 2.9 Screening process of diabetic retinopathy to prevent blindness
(Ministry of Health Malaysia, Malaysian Society of Ophthalmology and Academy
of Medicine of Malaysia, 2011)
The handbook or guide to diabetic retinopathy screening by the Ministry of Health
Diabetic Retinopathy Screening Team (2012b) explains the technique of photography
and also details the features of diabetic retinopathy, visible through the use of the
fundus camera. The screening group suggested that two photographs of two views (with
the optic disc as the centre and the fovea as the centre) should be taken as the input for
This item has been removed due to 3rd Party Copyright. The unabridged version of the thesis can be found in the Lancester Library, Coventry University.

32
screening, as presented in Figure 2.10. The optic disc or the optic nerve is a round area
in the back of the eye while the fovea is the centre of the macula region. Figure 2.11
presents good quality fundus photos, which are essential for the process of diabetic
retinopathy screening.
Optic disc as the centre Fovea as the centre
Figure 2.10 Fundus camera photography (Ministry of Health Diabetic Retinopathy
Screening Team, 2012b, 2012d)
Figure 2.11 Good quality fundus photos (Ministry of Health Diabetic Retinopathy
Screening Team, 2012b)
This
This
This item has been removed due to 3rd Party Copyright. The
unabridged version of the thesis can be found in the
Lancester Library, Coventry University.
This item has been removed due to 3rd Party Copyright. The
unabridged version of the thesis can be found in the
Lancester Library, Coventry University.
This item has been removed due to 3rd Party Copyright. The
unabridged version of the thesis can be found in the
Lancester Library, Coventry University.
This item has been removed due to 3rd Party Copyright. The
unabridged version of the thesis can be found in the
Lancester Library, Coventry University.
This item has been removed due to 3rd Party Copyright. The unabridged version of the thesis can be found in the Lancester Library, Coventry University.

33
The fundus image can be divided into four quadrants which are superonasal,
inferonasal, superotemporal and inferotemporal, as shown in Figure 2.12. The macula
region is at the posterior pole of the eye, within one disc diameter of the fovea (Taylor
and Batey, 2012).
Fundus image quadrants Macula
Figure 2.12 Normal fundus image (Ministry of Health Diabetic Retinopathy
Screening Team, 2012b)
2.5.1 Diabetic Retinopathy Grading
Based on the fundus image captured by the fundus camera, the experienced paramedic
will then make the diagnosis as to whether or not the patient has any eye disease,
including diabetic retinopathy. The grading is performed manually by the paramedics,
with reference to any changes or abnormality seen on the retinal image. Table 2.3 shows
the findings of diabetic retinopathy features for each stage of the condition. The
presented retinopathy stages are the non-proliferative diabetic retinopathy (mild,
moderate and severe), the proliferative diabetic retinopathy, the diabetic maculopathy
(mild, moderate and severe) and the advanced diabetic eye disease. Information about
the retinopathy stages and the terminology used to describe their features of are
presented in Section 2.4 and Table 2.1, respectively, for a detailed explanation.
This item has been removed due to 3rd Party Copyright. The unabridged version of the thesis can be found in
the Lancester Library, Coventry University.
This item has been removed due to 3rd Party Copyright. The unabridged version of the thesis can be found in
the Lancester Library, Coventry University.


37
The Early Treatment Diabetic Retinopathy Study (ETDRS) group initially proposed the
diabetic retinopathy severity scale (Early Treatment Diabetic Retinopathy Study
Research Group, 1991). In addition to the early classification by ETDRS, an
international clinical disease severity scale for diabetic retinopathy and diabetic macula
oedema (DME) was proposed by Wilkinson and others in 2003. It is much simpler,
having less severity levels and diagnostic criteria as compared to the ETDRS
classification system. Table 2.4 shows the Diabetic Retinopathy Disease Severity Scale
including no apparent retinopathy, nonproliferative diabetic retinopathy (mild, moderate
and severe) and proliferative diabetic retinopathy. Table 2.5 shows the Diabetic Macular
Edema Disease Severity Scale proposed by Wilkinson and colleagues (2003), which has
been used as an international scale in order to assist in the grading of fundus images into
distinct categories based on the retinal findings.
Table 2.4 International Clinical Diabetic Retinopathy Disease Severity Scale
(Wilkinson et al., 2003)
This item has been removed due to 3rd Party Copyright. The unabridged version of the thesis can be found in the Lancester Library, Coventry University.

38
Table 2.5 Diabetic Macular Edema Disease Severity Scale (Wilkinson et al., 2003)
2.5.2 Examination Schedule
Regular screening is important for early detection and early treatment, in order to assist
the management of diabetic retinopathy. The preliminary fundus examination for
diabetic retinopathy varies according to the types of diabetes mellitus, and is presented
in Table 2.6 below.
Individuals with diabetes mellitus should be screened at least every two years.
Individuals who can be categorised as high risk (i.e. with a longer duration of diabetes
or poor control of blood sugar, blood pressure or serum lipid) should be examined at
least annually. Moreover, individuals with any signs of non-proliferative diabetic
retinopathy should be examined at 6-12 monthly intervals. Earlier follow-up may be
required in high risk groups, including the presence of renal complications and the
progression of diabetic retinopathy. Table 2.7 provides the recommendations for eye
examination follow-up schedules for patients with diabetes mellitus.
This item has been removed due to 3rd Party Copyright. The unabridged version of the thesis can be found in the Lancester Library, Coventry University.

39
Table 2.6 Timing of the first screening (Ministry of Health Malaysia, Malaysian
Society of Ophthalmology and Academy of Medicine of Malaysia, 2011)
Table 2.7 Recommended follow-up schedule (American Academy of
Ophthalmology Retina Panel, 2008)
The crucial aim for diabetic retinopathy screening is to detect sight threatening factors
and to ensure their timely treatment in order to prevent vision loss. Therefore,
appropriate referral to an ophthalmologist should be performed. Among the criteria
which would require referral are the presence of any level of diabetic maculopathy,
severe NPDR, any PDR, unexplained loss of vision and also if the screening
examination cannot be performed with an upgradable fundus photo. The National
Institute for Clinical Excellence (NICE) presents the urgency of referral as shown in
Table 2.8. It is recommended that the examination schedule and urgency of referral to
an ophthalmologist should be based on the grade and severity of the diabetic retinopathy
along with the presence of risk factors (Ministry of Health Malaysia, Malaysian Society
of Ophthalmology and Academy of Medicine of Malaysia, 2011).
This item has been removed due to 3rd Party Copyright. The unabridged version of the thesis can be found in the Lancester Library, Coventry University.
This item has been removed due to 3rd Party Copyright. The unabridged version of the thesis can be found in the Lancester Library, Coventry University.

40
Table 2.8 Criteria for urgent referral (National Institute for Clinical Excellence,
2002)
2.5.3 Diabetic Retinopathy Management and Treatment
Early detection of diabetic retinopathy is vital because diabetic retinopathy is
irreversible. The standard practice for treating diabetic retinopathy is by using laser
photocoagulation, where the blood capillaries immersed the energy. The summary of
the treatment for diabetic retinopathy is presented in Table 2.9.
Table 2.9 Summary of treatment for diabetic retinopathy (Ministry of Health
Malaysia, Malaysian Society of Ophthalmology and Academy of Medicine of
Malaysia, 2011)
This item has been removed due to 3rd Party Copyright. The unabridged version of the thesis can be found in the Lancester Library, Coventry University.
This item has been removed due to 3rd Party Copyright. The unabridged version of the thesis can be found in the Lancester Library, Coventry University.

41
2.6 Diabetic Retinopathy Image Processing
Currently, image processing techniques are widely used as a means of diagnosing
diseases, including eye diseases. Computer-based imaging tools are necessary to
effectively detect signs of diabetic retinopathy. Early detection would allow the
ophthalmologist to treat patients before major damage occurs and would present the
best chance of protecting the patient’s vision. The automatic diabetic retinopathy
grading system would allow a faster and more efficient diagnosis. Preventive actions
could be taken early to protect vision and avoid blindness.
Diabetic retinopathy screening is currently a common research area, in which some
researchers focus on finding and proposing several techniques or methods for detecting
certain features of diabetic retinopathy (i.e., microaneurysms, haemorrhages, exudates,
and neovascularisation). Nonetheless, there are some researchers who propose the
development of automated systems for detecting and classifying normal or abnormal
diabetic retinopathy.
Digital image processing systems generally have three main parts: image preprocessing,
feature extraction and classification.
2.6.1 Image Preprocessing
Preprocessing is the process of enhancing or improving features of image data for the
next processing task. According to Sonka and colleagues (2008), image preprocessing
methods can be classified into four categories: pixel brightness transformations,
geometric transformations, local preprocessing and image restoration. However, some
papers classify image preprocessing methods into image enhancement and image
restoration only.
Pixel brightness transformations deal with pixel brightness, and consist of brightness
corrections and greyscale transformations. The brightness of pixel is adjusted in
brightness correction according to the current brightness and image location; whereas in
greyscale transformation, the brightness values contrast of the image is enhanced. The
greyscale image is defined as a data matrix which the values are indicated by the shades

42
of grey (Gonzalez et al., 2009). Sonka and others (2008) concluded that greyscale
transformations are mainly used for manual viewing in which the image is simply
defined in an improved contrast. For example, greyscale transformation provides a clear
contrast to an X-ray image. Greyscale transformation technique includes histogram
equalisation for enhancement of contrast. The technique creates an equal distribution of
brightness level for the image.
Geometric transformations offer the removal of geometric misrepresentation that
happens during the image capturing process. The two basic steps of a geometric
transform are pixel coordinate transformation and brightness interpolation. In addition,
a significant purpose of image restoration methods, are to subdue degradation. The
image restoration methods apply the concept of deconvolution across the whole image.
Local preprocessing methods utilise a small pixel neighbourhood in order to generate an
output image with a new brightness value. Two common groups are used to achieve
this, namely smoothing and edge detection. Smoothing is used to reduce noise or other
minor fluctuations in the image. Gradient operators determine edges where the locations
undergo fast changes. There are two components of edge detection, which are
magnitude and direction. Most gradient operators such as Roberts, Laplace, Prewitt,
Sobel, Robinson and Kirsch can be expressed using convolution masks.
Amongst the preprocessing techniques used in the present diabetic retinopathy detection
system are greyscale conversion, green channel extraction, contrast enhancement (such
as histogram equalisation), filtering, morphological operations, segmentation and
thresholding among others. Within the scope of diabetic retinopathy detection, optic
disc elimination and blood vessel removal are two main processes that are widely used
as an additional stage, before the next process is performed. In addition, the localisation
of the fovea and macula are important for the detection of maculopathy. This detection
of these retinal structures also requires some preprocessing techniques. Table 2.10 lists
the preprocessing techniques which have been implemented in diabetic retinopathy
detection research.


52
2.6.3.1 Support Vector Machines
Support Vector Machines (SVM) was introduced in 1992 by Boser, Guyon and
Vapnikin in COLT-92 (Jakkula, 2008). SVM are a set of related supervised learning
methods used for classification and regression. A support vector machine is a
classification and regression prediction tool that uses machine learning theory to
maximise the predictive accuracy while automatically avoiding the over-fit of the data
(Jakkula, 2008). SVMs can be defined as systems which use the hypothesis space of a
linear function in a high dimensional feature space. The original support vector
classifier was developed for the linear separation of two classes and later this limitation
was overcome by allowing non-linearly separable classes, non-separable classes,
combining multiple 2-class classifiers to yield multi-class classification and other
extensions (Sonka et al., 2008).
An SVM works by finding the best hyperplane which separates all data points, which is
where the best hyperplane will have the largest margin between the two classes. The
margin is the maximal width of the slab parallels to the hyperplane that has no interior
data points. The data points closest to the separating hyperplane are support vectors.
Figure 2.13 illustrates the functioning of SVM.
An SVM is a popular technique for data classification. Jakkula (2008) concluded its
strengths and weaknesses. The major strength of an SVM is that the training is
relatively easy, with no local optimum. In addition, it scales relatively easy to high
dimensional data and the trade-off between classifier complexity and error can be
controlled explicitly. On the other hand, SVM requires a good kernel function and this
is one of its weaknesses (Jakkula, 2008; Burges, 1998). In addition its speed and size
are its other limitations, both in training and testing (Burges, 1998).
The SVM has been successfully used for pattern classification problems and is also
widely used in medical image processing and analysis. Mookiah and others (2012)
proposed data mining techniques for an automated diagnosis of glaucoma using Higher
Order Spectra (HOS) and Discrete Wavelet Transform (DWT) features. In this case, a
support vector machine classifier is used to identify the glaucoma and normal images
automatically and with high accuracy. Priya and Aruna (2011) investigated and

53
proposed a computer-based system for diabetic retinopathy in identifying normal,
NPDR and PDR classes. The proposed system uses colour fundus images, where the
features are extracted from the raw image using image processing techniques and fed to
a support vector machine for classification. Experimental results show that the
classification accuracy can provide an improved result, with a sensitivity of 99.45% and
a specificity of 100%.
Figure 2.13 Basic two-class classifications with Support Vector Machines (The
Mathworks, Inc., 2016a)
2.6.3.2 Neural Networks
Neural networks are widely used in application areas such as system identification and
control, pattern recognition, medical diagnosis, financial application, data mining,
visualisation and many more. One of the main applications of neural networks is
classification. A neural network consists of many neurons called units or nodes, each of
which performs two functions. Firstly the aggregation of its input from other neurons or
the external environment, and secondly, the generation of an output from the aggregated
inputs (Er et al., 2003).
This item has been removed due to 3rd Party Copyright. The unabridged version of the thesis can be found in the Lancester
Library, Coventry University.

54
According to Er and others (2003), a neural network is characterised by its architecture,
or connecting pattern among the neurons, its method of determining the weights of the
connections and its activation function. Er and colleagues (2003) also presented
biomedical engineering applications using one of the Artificial Neural Network (ANN)
paradigms. One of its popular applications is in the classification of breast cancer. Er
and others (2003) presented the methods and results of the studies corresponding to
extracting rules from a mammography dataset and automatically constructed a fuzzy
classifier using the Dynamic Fuzzy Neural Network (D-FNN). This was done in order
to classify the two important features in breast cancer diagnosis, which are benign and
malignant masses. Lin and other co-workers (2003) proposed a neural networks method
to determine the progression of glaucoma based on visual field thresholds and
concluded that the progression of glaucoma could be detected from visual field
thresholds with a neural network.
Gardner and others (1996) initially developed a screening tool for the automatic
detection of diabetic retinopathy using an artificial neural network and comparing the
network against the ophthalmologist screening of a set of fundus images. As a result,
the network achieved good accuracy therefore the system could be used as an aid to the
screening of diabetic retinopathy for diabetic patients. Priya and Aruna (2012) enhanced
the computer-based system for diabetic retinopathy in identifying normal, NPDR and
PDR classes, by using two types of classifiers: a Probabilistic Neural Network (PNN)
and a Support Vector Machine (SVM). The classifiers are described in detail and their
performances are compared. As a conclusion, it is shown that, from the results obtained,
the SVM model is more effective compared to the PNN. Priya and Aruna (2013a)
proposed and compared three models, namely a Bayesian classifier, while maintaining
the PNN and the SVM in the developed system. Experimental results show that the
SVM outperforms all other models and this proves once again, that the SVM is a better
choice in detecting and classifying DR categories. The detection of DR disease and its
classification with the help of the Radial Basis Function Neural Network (RBFNN)
method has also been proposed in (Priya et al., 2013b). However, the experimental
results show that the accuracy of the proposed system is relatively low (76.25%) and it

55
is recommended that its accuracy could be improved by finding more relevant features
and by combining it with other classification methods.
2.6.3.3 Other Classification Methods
Naive Bayes classification is another machine learning technique used for classification
purpose. The Naïve Bayes classifier can be used when the features are independent of
one another within each class, but it works well in practice even when that
independence assumption does not hold (The MathWorks, Inc., 2016b). The classifier
works in two steps. In the training step, the method estimates the parameters of a
probability distribution from the training samples by assuming that the features are
conditionally independent, given the class. The method computes the posterior
probability of an unseen test sample belonging to each class in the prediction step. The
method later classifies the test sample according to the largest posterior probability.
Decision trees are considered to be one of the most popular approaches for
implementing classifiers. A decision tree is a classifier in the form of a tree structure
and it classifies instances or examples by starting at the root of the tree and moving
through it until a leaf node is reached. Rokash and Maimon (2005) pointed out some
advantages of using a decision tree, for example it is easy to follow when compacted, as
it is self-explanatory. It can handle both nominal and numeric input attributes, can
represent any discrete-value classifier and is also capable of handling datasets with
errors and missing values.
In the k-nearest neighbour (k-NN) classifier, the object is classified by a ‘majority vote’
from its neighbours, with the object being assigned to the most common class among its
k nearest neighbours. K-NN offers several advantages including simplicity,
effectiveness, intuitiveness and competitive classification performance and it can handle
the noisy training data. However, the limitations of the k-NN method include a poor
run-time performance if the training set is large and it is also very sensitive to irrelevant
or redundant features because all the features contribute to the similarity and the
classification (Imandoust and Bolandraftar, 2013).


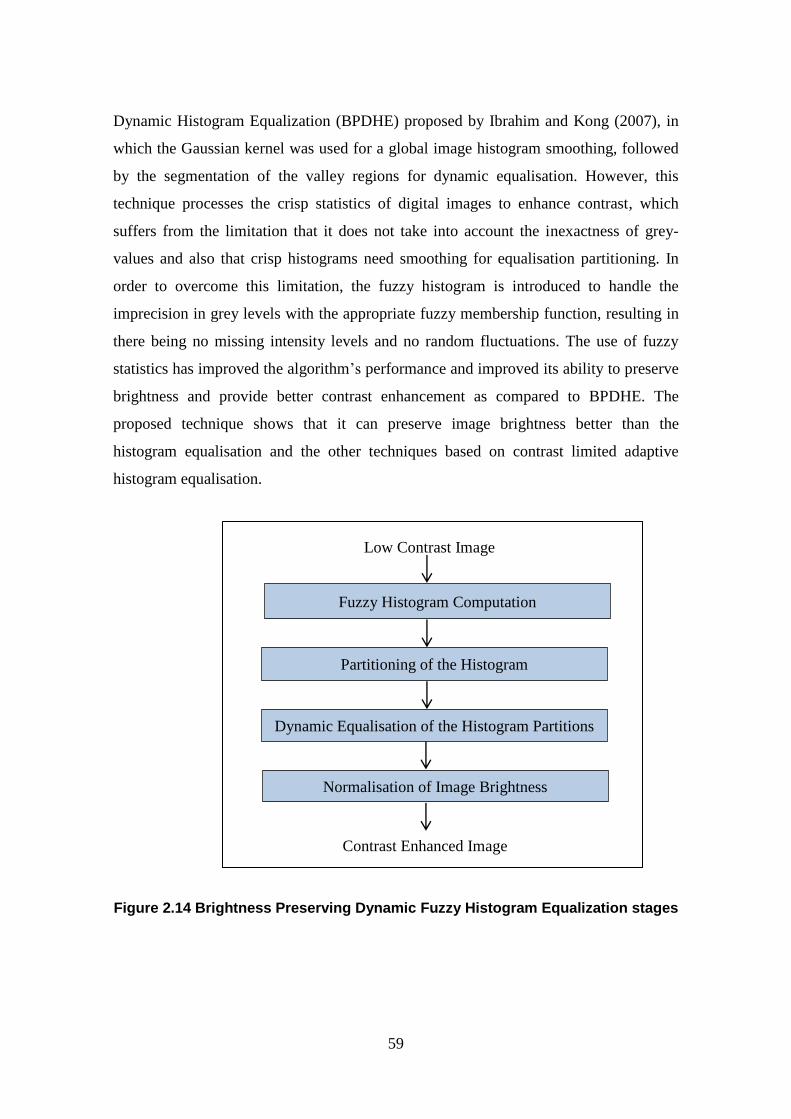
59
Dynamic Histogram Equalization (BPDHE) proposed by Ibrahim and Kong (2007), in
which the Gaussian kernel was used for a global image histogram smoothing, followed
by the segmentation of the valley regions for dynamic equalisation. However, this
technique processes the crisp statistics of digital images to enhance contrast, which
suffers from the limitation that it does not take into account the inexactness of grey-
values and also that crisp histograms need smoothing for equalisation partitioning. In
order to overcome this limitation, the fuzzy histogram is introduced to handle the
imprecision in grey levels with the appropriate fuzzy membership function, resulting in
there being no missing intensity levels and no random fluctuations. The use of fuzzy
statistics has improved the algorithm’s performance and improved its ability to preserve
brightness and provide better contrast enhancement as compared to BPDHE. The
proposed technique shows that it can preserve image brightness better than the
histogram equalisation and the other techniques based on contrast limited adaptive
histogram equalisation.
Figure 2.14 Brightness Preserving Dynamic Fuzzy Histogram Equalization stages
Fuzzy Histogram Computation
Partitioning of the Histogram
Dynamic Equalisation of the Histogram Partitions
Normalisation of Image Brightness
Contrast Enhanced Image
Low Contrast Image
60
Li et al. (2011) proposed a novel fuzzy level set algorithm for medical image
segmentation based on the segmentation obtained by spatial fuzzy clustering. The
proposed algorithm leads to a better segmentation and effectiveness for medical image
segmentation tasks. In addition, fuzzy filter techniques, which aim to detect and remove
the noise from the corrupted image, are proposed in (Toh et al., 2010; Kwan et al.,
2002; Kwan, 2003; Toh et al., 2008). Toh et al. (2008) proposed a new fuzzy switching
median (FSM) filter technique in image processing, which is an extension to the classic
switching median filter through employing a fuzzy mechanism in detecting the noisy
pixel. The proposed filter was able to effectively remove noise while preserving image
details and textures. Later, Toh and others (2010) proposed a novel two-stage noise
adaptive fuzzy switching median (NAFSM) filter for the detection and removal of salt-
and-pepper noise. The first stage, which is the detection stage, uses the histogram of the
corrupted image to identify noise pixels. Meanwhile, the second stage is the noise pixels
filtering. After that, fuzzy reasoning is applied to NAFSM filtering in order to handle
uncertainty present in the extracted local information. The proposed filter is able to
reduce high-density salt-and-pepper noise, as well as preserving fine image details,
edges and textures. Kwan (2002, 2003) proposed seven fuzzy filters for noise reduction
in images, where the fuzzy filters apply a weighted membership function to an image in
order to determine the centre pixel.
Another fuzzy image processing that can be implemented is fuzzy edge detection. An
edge is a boundary between two uniform regions. Therefore, the membership functions
are defined for fuzzy edge detection to state the degree of a pixel whether it represents
an edge or a uniform region. Figure 2.15 shows the membership functions example of
the inputs (image gradients) and outputs (intensity of the edge-detected image) for the
edge detection, while Figure 2.16 shows the output after the edge detection using fuzzy
logic.

61
Figure 2.15 Membership functions of the inputs and outputs (The Mathworks,
Inc., 2016c)
Figure 2.16 Edge detection using fuzzy logic output (The Mathworks, Inc., 2016c)
Original Greyscale Image Edge Detection Image
This item has been removed due to 3rd Party Copyright. The unabridged version of the thesis can be found in the Lancester Library, Coventry
University.
This item has been removed due to 3rd Party Copyright. The unabridged version of the thesis can be found in
the Lancester Library, Coventry University.
This item has been removed due to 3rd Party Copyright. The unabridged version of the thesis can be found in
the Lancester Library, Coventry University.

62
2.8 Summary This chapter reviewed the prevalence of diabetes and diabetic retinopathy, including the
diabetic retinopathy incidence in addition to the signs and features of diabetic
retinopathy. The epidemiology of diabetic retinopathy is also presented to reveal the
severity of diabetic retinopathy disease. This chapter also summarised the classification
of and screening for diabetic retinopathy, in addition to diabetic retinopathy treatment
and the follow up schedule. Image processing was discussed as a tool to diagnose
diabetic retinopathy in a more precise and efficient way. At the close of the chapter,
background information about digital image processing, image analysis and processing
techniques (particularly in diabetic retinopathy detection research) were presented.
Finally, fuzzy image processing techniques were also presented.
The summary of preprocessing techniques, feature extractions methods and machine
learning techniques for classification used in previous diabetic retinopathy screening
research are presented in Table 2.10, Table 2.11 and Table 2.12, respectively.
Meanwhile, the fuzzy image processing techniques are presented in Section 2.7. It can
be concluded that various image preprocessing techniques, feature extractions and
machine learning techniques were proposed in order to produce an efficient and reliable
diabetic retinopathy system. The fuzzy image processing techniques help in generating
better quality of image and enhanced performance. However, fuzzy processing has not
been used during the preprocessing stage for diabetic retinopathy screening system
which involves fundus images. Therefore, this proposed research implements fuzzy
techniques for the image pre-processing part within the microaneurysms and
maculopathy detection.

63
3 RESEARCH METHODOLOGY AND DATA
COLLECTION
This chapter introduces the system design of the proposed research in Section 3.1.
Section 3.2 presents the target population involved in the research and the location of
the research study in Section 3.3. Section 3.4 explains the types of data collected and
the data collection procedure is presented in detail in Section 3.5. An analysis of the
data collected is presented in Section 3.6. Alongside the data collection and analysis
phase, ethical issues should be considered, which are outlined in Section 3.7. Finally, in
addition to the research data set collected, the benchmark public data sets used in the
proposed research are presented in Section 3.8 and followed by the summary of the
research methodology and data collection chapter in Section 3.9.
3.1 Research Design
Generally, there are six steps in the process of research proposed by Creswell (2012)
and they entail: recognising the research problem, review of related literature,
specifying a purpose for research, data collection, and analysis and reporting of data,
and finally, evaluating the research. Awang (2012) presented a flowchart of research
which although similar to Creswell’s is more general in its nature.
In general, the data collection techniques for this research project are as follows:
i. Personal interview: face to face informal interviews with the
ophthalmologists and trained healthcare staff involve in diabetic retinopathy
screening.
ii. Observation: directly observing the process of fundus images capture and its
manual grading by trained health care staff.
iii. Internal sources: extracting the existing patient’s folder from the personal
computer attached to the fundus camera which contains the patient’s details,
fundus images and diagnosis.
Figure 3.1 presents the research design for the development of this research on
‘Automatic Screening and Classification of Diabetic Retinopathy Eye Fundus Images’.


65
3.2 Study Population The study includes both type 1 diabetes mellitus (T1DM) and type 2 diabetes mellitus
(T2DM) patients. It also covers all individuals with diabetes mellitus including adults,
children and adolescents. The diabetes mellitus duration is associated to the prevalence
of diabetic retinopathy and it varies among nations and ethnicity. Therefore, this study
involves individuals from all ethnic groups in Malaysia.
3.3 Location of the Research Study The study area of Melaka state, is one of the fourteen states that make up Malaysia. The
state of Melaka is located in Peninsular Malaysia and is surrounded by Negeri
Sembilan, Johor and also the Straits of Malacca. The data is collected from the main
hospital in the state of Melaka, the Melaka Hospital, a government-funded public
hospital located at Jalan Mufti Haji Khalil, Melaka, Malaysia. It was chosen because its
demographic is diverse in terms of ethnicity-religion and socio-economic groupings in
the southern part of Malaysia. Generally, the Melaka Hospital is a referral hub for
patients from Melaka health centres in addition to other health centres in the north of
Johor and a district in Negeri Sembilan, which is Tampin. Furthermore, very few
studies of the prevalence of diabetes mellitus and diabetic retinopathy have been carried
out in the state. These have mainly focussed on larger urban areas such as Kuala
Lumpur and Putrajaya. Therefore, the study will indirectly reveal the diabetes mellitus
and diabetic retinopathy prevalence throughout the Melaka state, in order to bridge the
prevalence gap with respect to the diabetes mellitus and diabetic retinopathy
epidemiology in Malaysia. Figure 3.2 shows the site of the research: at the Melaka
Hospital, Malaysia.
3.4 Data Collection
This section introduces the types of data collected in this research project, which were
used to response to the research questions and to achieve the objectives. After defining
and identifying the research problem and the research design, the task of data collection
took place. The method of data collection to be used for the study deals with two types
of data: primary and secondary.

66
Main entrance of Melaka Hospital Eye Clinic, Department of Ophthalmology,
Melaka Hospital
Figure 3.2 Research study location
3.4.1 Primary Data
Data which is new, original and collected for the first time is termed as primary data
(Kothari, 2004). The Social Dimensions of the Watershed Planning (2006) defined
primary data as generated and compiled data through interviews, surveys or focus
groups. In addition, the Social Dimensions of the Watershed Planning (2006) also
claimed that those data types are designed in order to address an unavailable issue or
information need in any present sources. Primary data is tailored to provide well-
focused and exclusive support for the decision-makers of organisations, but on the other
hand, the collection and analysing of the data more expensive and time consuming
(Malhotra and Birks, 2006). In order to develop the proposed system for the purpose of
this project, primary data which is information gathered from observation and interview,
has been collected. The detail of the observation strategy is explained in Section 3.5.1,
while the interview strategy is explained in Section 3.5.2.
3.4.2 Secondary Data
Secondary data is defined as data which has been collected by another party and has
undergone a statistical process (Kothari, 2004). Secondary data is also classed as data

67
that has already been collected for some other purpose (Sounders et al., 2009; Malhotra
et al., 2006).
According to Sounders et al. (2009), organisations collect and store a diversity of data
in order to support their operations. Sounders et al. (2009) highlighted some of the
advantages of using secondary data in a research project, and they include having fewer
resource requirements, being inconspicuous, being practical for longitudinal studies and
offering comparative and contextual data. Sounders et al. (2009) however, also revealed
the disadvantages of using secondary data: data collected may not match with need,
access can be difficult or costly, in addition to unsuitable aggregations and definitions.
The secondary data for this research project however are collected from an internal
source, namely fundus images. Section 3.5.3 will describe the details of the secondary
data collection method.
3.5 Collecting Data Procedure
The data collection techniques for the primary data are observations and interviews,
while the secondary data is collected from existing fundus images.
3.5.1 Collecting Primary Data through Observation
Observation is one of the techniques implemented for this study. According to Sounders
et al. (2009), participant observation and structured observation are two types of
observation. Sounders et al. (2009) differentiated between the two kinds of observation
in which participant observation is qualitative and stresses the discovery of meanings
that people attach to their actions. Structured observation however, according to
Sounders et al. (2009), is quantitative and is more concerned with the frequency of
those actions. Kothari (2004) explained that an observation is defined as information
collected by an investigator’s own observation without having interviewed the
respondents. Kothari (2004) also outlined the disadvantages of the observation method:
costs, the provision of limited information and its unsuitability for larger samples.

68
For the proposed research project, an observation method is used that has a direct
understanding of the process by which fundus images involving diabetes mellitus
patients are captured using a fundus camera. It also includes the manual grading process
of the captured fundus images by trained health care staff during the screenings, as
shown in Figure 3.3. The observation is important in order to understand the following:
how the fundus camera works, the process of fundus images capture and the manual
grading of fundus images, which is aimed to be converted into a fully automated
grading process.
Figure 3.3 Fundus images capturing and the grading process
Visual acuity test Fundus camera KOWA VX-10
Fundus camera capture Grading process
This item has been removed due to Data Protection. The unabridged version of the
thesis can be found in the Lancester Library, Coventry University.
This item has been removed due to Data Protection. The unabridged version of the
thesis can be found in the Lancester Library, Coventry University.

69
3.5.2 Collecting Primary Data through Interview
According to Kothari (2004), a personal interview session requires the investigator to
follow a firm procedure and seek answers to a set of predetermined questions. In
additions, Kothari (2004) claimed that an interview is usually performed in an organised
manner and the output produced will be determined by the interviewer’s capability.
Face to face interviews with an ophthalmologist and a medical assistant involved in the
diabetic retinopathy screening are performed for the purposes of this study. A personal
interview with the ophthalmologist is required to gather valuable information about the
ophthalmology field, specifically on diabetic retinopathy, as well as the features of
diabetic retinopathy signs, the diabetic retinopathy screening process and the respective
management of patients with diabetic retinopathy problem. In addition, discussion with
respect to the ground truth from the collected data is held with more experienced
ophthalmologists. The ophthalmologists will determine the types of retinopathy for each
of the data examples based on the retinopathy signs found on the fundus images. The
produced ground truth is important with respect to the system testing phase, where the
manual diabetic retinopathy analysis by several experienced ophthalmologists will be
compared to the results of the automated system developed in this research project.
3.5.3 Collecting Secondary Data through Existing Fundus Images
The most important data for this research study are fundus images which are taken from
the fundus camera located in the screening room. The fundus images from the diabetic
patients are captured by experienced medical staff for screening. For the purposes of
this research, numerous clinical fundus retinal images from the personal computer
attached to the fundus camera are extracted and analysed. The developed system
proposed by this study is tested on both normal and colour fundus images obtained from
patients with diabetes mellitus. Manual diabetic retinopathy diagnosis, carried by an
experienced paramedic is, then compared to the results of the automated system in order
to test and improve the sensitivity and specificity of the proposed grading methods.
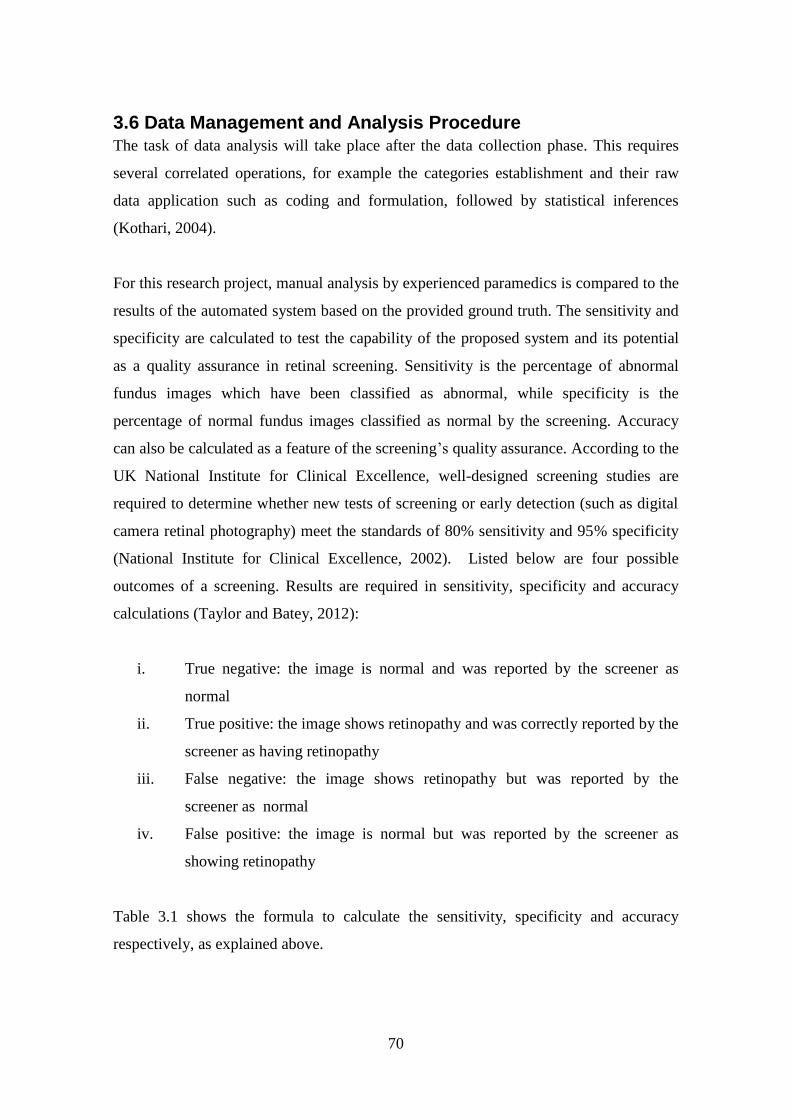
70
3.6 Data Management and Analysis Procedure The task of data analysis will take place after the data collection phase. This requires
several correlated operations, for example the categories establishment and their raw
data application such as coding and formulation, followed by statistical inferences
(Kothari, 2004).
For this research project, manual analysis by experienced paramedics is compared to the
results of the automated system based on the provided ground truth. The sensitivity and
specificity are calculated to test the capability of the proposed system and its potential
as a quality assurance in retinal screening. Sensitivity is the percentage of abnormal
fundus images which have been classified as abnormal, while specificity is the
percentage of normal fundus images classified as normal by the screening. Accuracy
can also be calculated as a feature of the screening’s quality assurance. According to the
UK National Institute for Clinical Excellence, well-designed screening studies are
required to determine whether new tests of screening or early detection (such as digital
camera retinal photography) meet the standards of 80% sensitivity and 95% specificity
(National Institute for Clinical Excellence, 2002). Listed below are four possible
outcomes of a screening. Results are required in sensitivity, specificity and accuracy
calculations (Taylor and Batey, 2012):
i. True negative: the image is normal and was reported by the screener as
normal
ii. True positive: the image shows retinopathy and was correctly reported by the
screener as having retinopathy
iii. False negative: the image shows retinopathy but was reported by the
screener as normal
iv. False positive: the image is normal but was reported by the screener as
showing retinopathy
Table 3.1 shows the formula to calculate the sensitivity, specificity and accuracy
respectively, as explained above.


72
conduct the research and collect medical data from Malaysian health clinics and
hospitals. Patient confidentiality and medical data protection are the important ethical
issues that need to be considered in this case.
3.8 Benchmark Public Data Sets There are several public data sets available for the benchmarking of diabetic retinopathy
detection from digital images. In order to run and test the developed system, firstly,
fundus images from publicly available data sets will be used as a benchmark before
running the system with the fundus images collected from the Melaka Hospital. Some
of the most popular public databases which contain eye fundus images are the Standard
Diabetic Retinopathy Database Calibration Level 0 (DIARETDB0), the Standard
Diabetic Retinopathy Database Calibration Level 1 (DIARETDB1), Methods to
Evaluate Segmentation and Indexing techniques in the field of Retinal Ophthalmology
(MESSIDOR), Digital Retinal Images for Vessel Extraction (DRIVE), STructured
Analysis of the Retina (STARE), the Retinal Vessel Image set for Estimation of Widths
(REVIEW) and the Retinopathy Online Challenge (ROC) database.
One of the more popular data sets containing a combination of normal and diabetic
retinopathy fundus images is the Standard Diabetic Retinopathy Database Calibration
Level 0 (DIARETDB0). The data set consists of 130 colour fundus images of which 20
are normal and the remaining 110 contain signs of diabetic retinopathy, such as hard
exudates, soft exudates, microaneurysms, haemorrhages and neovascularisation. The
original images, sized 1500 x 1152 in PNG format, are captured with a 50 degree field-
of-view digital fundus camera with an unknown camera setting (Kauppi et al., 2006). In
addition to the DIARETDB0, there is another data set developed by the Machine Vision
and Pattern Recognition Research Group at Lappeenranta University of Technology,
Finland, which is the Standard Diabetic Retinopathy Database Calibration Level 1
(DIARETDB1), with 89 colour fundus images, including 84 images with at least mild
non-proliferative signs (microaneurysms) of diabetic retinopathy in addition to five
normal images (Kauppi et al., 2007).

73
The methods to evaluate the segmentation and indexing techniques in the field of retinal
ophthalmology or the MESSIDOR database is another data set, produced by research
funded by the French Ministry of Research and Defence to facilitate studies on diabetic
retinopathy diagnosis (Messidor, 2004). It consists of 1,200 colour fundus images
captured using a colour video 3CCD camera on a Topcon TRC NW6 non-mydriatic
retinograph with a 45 degree field of view. The images acquired by three
ophthalmologic departments have three different sizes: 1440 x 960, 2240 x 1488 and
2304 x 1536 pixels and 8 bits colour representation (Messidor, 2004).
Another retinal images database is from the Digital Retinal Images for Vessel
Extraction (DRIVE) project, which offers both retinal colour images and the results of
the automatic segmentation of blood vessels. The set of 40 images, where 33 do not
show any sign of diabetic retinopathy and seven show signs of mild early diabetic
retinopathy, are captured using a Canon CR5 non-mydratic 3CCD camera with a 45
degree field of view, 8 bits per colour plane and a size of 768 by 584 pixels (Staal et al.,
2004).
The STructured Analysis of the Retina (STARE) project by Dr. Michael Goldbaum at
the University of California, San Diego, funded by the U.S. National Institutes of
Health, is another database with retinal colour images (Hoover et al., 2003). The set of
400 raw images including a list of diagnosis codes and a diagnosis for each image can
be obtained from the STARE database. Blood vessel segmentation work involves 40 of
these images (Hoover et al., 2000), while 80 images are used for optic nerve detection
(Hoover et al., 2003).
The DRIVE and STARE data set are excellent databases of retinal vessel pixel
segmentations; however they do not include width measurements. Therefore, the
Retinal Vessel Image set for Estimation of Widths (REVIEW) data set is presented to
fill this gap. The data set includes 16 images with 193 vessel segments and a variety of
pathologies and vessel types. The database contains accurate width measurements and
four subsets of images, which are categorised in four classes: high resolution, vascular
disease, central light reflex and kick-points. Al-Diri and others (2008) have described

74
the REVIEW data set for retinal vessel and the algorithm used to process the
segmentation in order to produce vessel profiles.
The Retinopathy Online Challenge (ROC) presents an online competition for numerous
methods for the detection of microaneurysms which can be compared using the same
data set (Niemeijer et al., 2010). The images have three different sizes: 768 x 576, 1058
x 1061 and 1389 x 1383. The data set consists of 50 training images of colour fundus
photographs with available reference standards, and 50 test images where the reference
standard was withheld by the organisers. The overall results show that the detection of
microaneurysms has been a challenging task for both automatic methods and human
expertise.
3.9 Developed Data Set In addition to the public data sets presented above, a combination of normal and
Diabetic Retinopathy (DR) fundus images from a novel data set was developed as part
of this research.
The fundus images are collected from the Eye Clinic, in the Department of
Ophthalmology, at the Melaka Hospital, Malaysia. The novel data set consists of 600
colour fundus images collected from 300 patient’s folders. Each of the patient’s folders
has a minimum of two images, at least one for the right side and one for the left side,
where two different angles were captured; with the optic disc and the macula
respectively at the centre. The original images, which are sized 3872 x 2592 in JPEG
format, provide high quality and detail. These were captured with a KOWA VX-10
digital fundus camera. Figure 3.4 shows some examples of the images from the new
developed data set. Three experts from the Department of Ophthalmology at the Melaka
Hospital, Malaysia were involved in order to diagnose the fundus images into ten
retinopathy stages: No Diabetic Retinopathy, Mild DR without maculopathy, Mild DR
with maculopathy, Moderate DR without maculopathy, Moderate DR with
maculopathy, Severe DR without maculopathy, Severe DR with maculopathy,
Proliferative DR without maculopathy, Proliferative DR with maculopathy and
Advanced Diabetic Eye Disease (ADED). An Excel file containing the link to each eye

75
fundus image and the retinopathy stages drop down list, as presented in Figure 3.5 was
provided to each of the experts separately in order to avoid bias. The summary findings
of the three experts are presented in Figure 3.6. The average from the three experts is
used for the overall expert diagnosis, as shown in Figure 3.7. As a result of the analysis
of the experts’ diagnosis, performed using SPSS software, the total number of images in
each class is as follows: normal (no retinopathy) class with 276 images, while the
abnormal or diabetic retinopathy (DR) class can be divided into nine other categories
including mild DR without maculopathy (72), mild DR with maculopathy (27),
moderate DR without maculopathy (85), moderate DR with maculopathy (83), severe
DR without maculopathy (23), severe DR with maculopathy (11), proliferative DR
without maculopathy (6), proliferative DR with maculopathy (10) and, finally, advanced
diabetic eye disease, ADED (7). These are presented in Table 3.2. Meanwhile, the data
analysis procedures of the novel dataset are discussed in Chapter 5 (Overall Results
Analysis and Discussion), together with the system results analysis.
Macula centre
Optic disc centre
Figure 3.4 Examples of images in the dataset
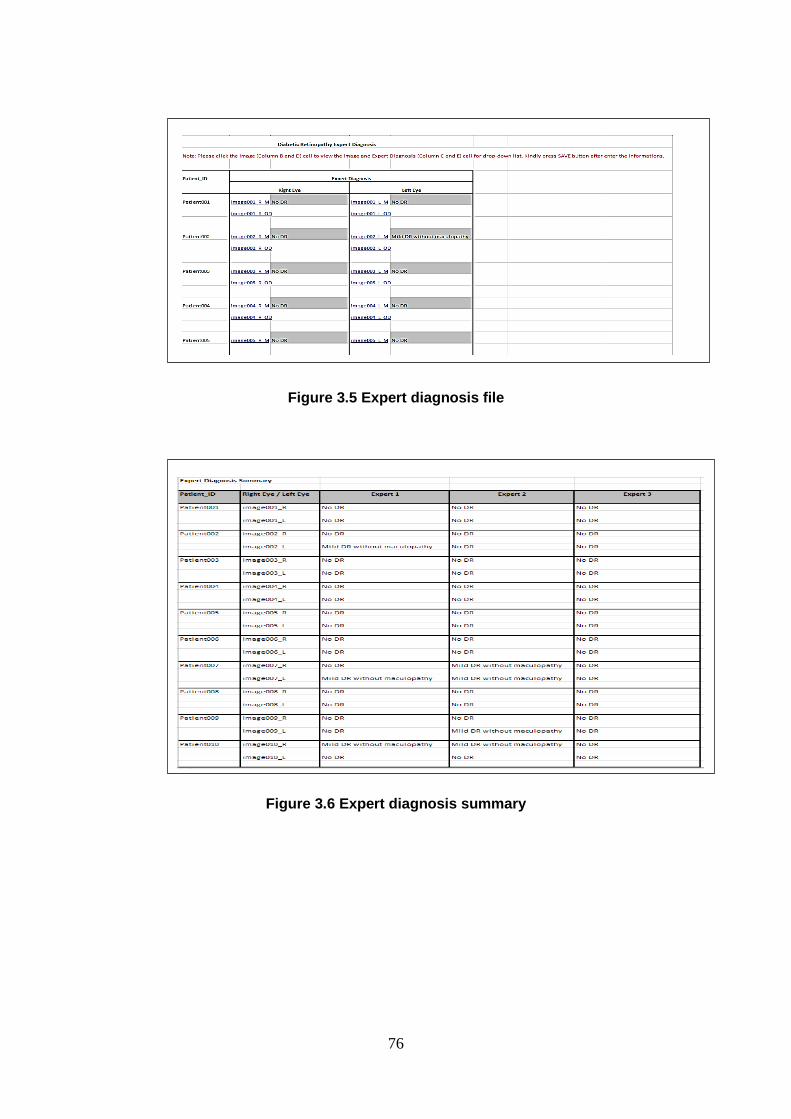
76
Figure 3.5 Expert diagnosis file
Figure 3.6 Expert diagnosis summary

77
Figure 3.7 Expert diagnosis average
Table 3.2 Expert diagnosis summary
Retinopathy Stage No. of Images
No DR 276
Mild DR without maculopathy 72
Mild DR with maculopathy 27
Moderate DR without maculopathy 85
Moderate DR with maculopathy 83
Severe DR without maculopathy 23
Severe DR with maculopathy 11
PDR without maculopathy 6
PDR with maculopathy 10
ADED 7
Total 600
The new dataset is different when compared to the other datasets, presented earlier in
Section 3.8. The data set represents the South East Asian population, particularly
Malaysian, unlike the other datasets, which represent the Caucasian population. It
provides an almost balanced total number of No DR/Normal and DR/Abnormal images.
Typically, in the diagnosis of medical images, it is difficult to find a large number of
normal cases. The imbalanced number of available images poses some problems in the
classification phase; therefore, the balanced number in the new dataset will help
overcome this problem.

78
Moreover, the categorisation of the expert diagnosis followed the standard practice
based on the International Clinical Retinopathy and Diabetic Macula Oedema Disease
Severity Scale. The classification of the data involves maculopathy, which is the yellow
lesion near the macula. This is a very detailed categorisation compared to other data
sets. The detection of maculopathy is very important, as the macula is responsible for
central vision and it represents a sensitive part of the eye. It is vital therefore in
detecting the urgency of a referral. In addition, the novel dataset and the expert
diagnosis may be used separately for both diabetic retinopathy grading and diabetic
maculopathy grading.
In order to make the novel fundus images dataset widely accessible, it has been made
available as an online database. The novel dataset is accessible at
http://creative.coventry.ac.uk/fundus. The webpage of this research contains the novel
dataset with eye fundus images, including the expert diagnosis file and the published
papers related to this research project. Figure 3.8 shows the screenshot of the main page
of the dataset webpage. The aim of this online database is to highlight the research
project development and to promote research on retinal-imaging to enable comparative
studies and, most importantly, to share the eye fundus images with other researchers.
The dataset can be downloaded for research and educational purposes.
Figure 3.8 Main web page for the developed dataset

79
3.10 Summary The chapter discussed the main phases involved in the research development, beginning
with the research design outline which implemented in the study. The data collection
and analysis are important stages in the research design. In this respect, the data
collection instruments were presented focusing on the data collection process design
and management. Ethical issues should also be considered in research, when dealing
with people and organisations. The chapter also provided information on the ethical
considerations involved in this research. Significantly, a high quality of data, i.e.,
fundus images and adequate techniques, can help rise the quality and efficiency of the
developed system, therefore, eye fundus images new dataset which would be beneficial
to researchers and practitioners in the area of retinal imaging was introduced, in addition
to the other public datasets used for the purposes of evaluation.
Table 3.3 shows a mapping table that lists the datasets used for each system
development in this research work. The Standard Diabetic Retinopathy Database
Calibration Level 0 (DIARETDB0) is used for the evaluation of System I, while the
Standard Diabetic Retinopathy Database Calibration Level 1 (DIARETDB1) is used for
System II evaluation. The Retinopathy Online Challenge (ROC) dataset is used for the
evaluation of microaneurysms detection in System III and System IV. The new
developed dataset collected from Melaka Hospital is used for the evaluation of System
VI and System VII, for the maculopathy and diabetic retinopathy detection. In addition
to the justification of the datasets used, Table 3.3 provides the type of the system
detection.

80
Table 3.3 Summary of datasets used for systems development
System I System II System III System IV System V System VI System VII
Dataset Used
Benchmark Public Dataset:
- DIARETDB0 √
- DIARETDB1 √
- MESSIDOR
- DRIVE
- STARE
- REVIEW
- ROC √ √
Developed Dataset:
- Melaka Hospital √ √ √
Type of System
Development
General detection General detection Microaneurysms
detection
Microaneurysms
detection
Maculopathy
detection
Maculopathy
detection
Maculopathy
detection
Justification of Selected
Dataset
- A combination
of normal and
diabetic
retinopathy
fundus images
- Suitable for
general
classification
- Contains
normal fundus
images and
images with
mild NPDR
- Suitable for
general
classification
- ROC presents an online competition
for numerous methods in
microaneurysms detection to
compare with each other on the same
data
- Suitable for the microaneurysms
detection and classification
- New dataset consists of 600 fundus images and experts
diagnosis which diagnose the fundus images into ten
retinopathy stages, following the ophthalmologists
practice
- Suitable for the maculopathy and diabetic retinopathy
detection and classification

81
4 CONTRIBUTIONS TO DEVELOPING SYSTEMS FOR
DIABETIC RETINOPATHY AND MACULOPATHY
DETECTION
Several systems, implementing different methods, have been proposed for diabetic
retinopathy screening in the course of this research. The development of the proposed
systems can be categorised into three types of approach. The first system development
is based on a general detection of diabetic retinopathy (i.e., either normal or with
retinopathy present). Meanwhile, the second type presents several system developments
for the detection of microaneurysms, an important sign of diabetic retinopathy. Finally,
the third type explains the development of two systems in order to detect diabetic
retinopathy alongside maculopathy.
This chapter presents the development and evaluation of each of the proposed types of
system development. They present a combination of techniques, such as different
preprocessing techniques, different feature parameters and different classifiers in a
diabetic retinopathy screening system, which differs from systems proposed by other
researchers. The preliminary screening system (System I) for the general detection of
diabetic retinopathy is presented in Section 4.1. The detection of microaneurysms in
colour fundus images is presented in Section 4.2. The first two systems (System II and
System III) for the detection of microaneurysms, which highlight the use of feature
extraction and classification methods, are explained in Section 4.2.1 and Section 4.2.2,
respectively. The other two proposed systems (System IV and System V) for the
microaneurysms detection, which implement the fuzzy image processing techniques, are
reported in Section 4.2.3 and Section 4.2.4. Section 4.3 presents the two systems
(System VI and System VII) for the detection of diabetic retinopathy alongside the
detection of maculopathy in the eye’s fundus images. Finally, a summary of the chapter
is presented in Section 4.4.

82
4.1 Basic System for General Diabetic Retinopathy Detection
(System I) This section presents a preliminary system for the classification and screening of
diabetic retinopathy using eye fundus images. This is a general detection system of
diabetic retinopathy that classifies images into two main classes: normal and with
diabetic retinopathy. The system is evaluated by using the Standard Diabetic
Retinopathy Database Calibration Level 0 (DIARETDB0), described in Section 3.8,
which consists of 130 colour fundus images (Kauppi et al., 2006).
The system explored and implemented some basic image processing techniques, which
will be used for further developments of the diabetic retinopathy screening system.
Rahim and others (2014) reported the development of such an automatic screening and
classification of diabetic retinopathy fundus images in detail, while exploring the
existing systems and applications related to diabetic retinopathy screening and detection
methods. This system is an automatic system for detecting diabetic retinopathy by
classifying the images into general detection categories, which are normal (no apparent
retinopathy) or abnormal (retinopathy present).
The proposed ophthalmic decision support system consists of an automatic acquisition,
screening and classification of diabetic retinopathy fundus images, which will assist in
the detection and management of diabetic retinopathy. The developed system contains
four main parts, namely the image acquisition, the image preprocessing, the feature
extraction, and the classification using several machine learning techniques.
The proposed screening system has been developed using open source software,
OpenCV (Open Source Computer Vision) and Microsoft Visual C++ 2010. The
OpenCV environment, developed by Willow Garage, is a programming library offered
for real time computer vision (Itseez, 2014). OpenCV includes a collection of
standardised image analysis and machine vision algorithms to be used by developers.
Most work in this area uses tools such as Matlab and SPSS for feature extraction and
analysis, but by using OpenCV it is possible to build more effective systems, with
processing times that are suitable for use in real situations. Using OpenCV also
simplifies the distribution of software due to permissive licensing, and it lowers the cost

83
of development, use and maintenance because there are no purchases or licensing fees.
Finally, OpenCV is portable, meaning that any machine that is able to run C is also
likely to be able to run OpenCV. Furthermore, OpenCV has been used on Windows,
Linux, MacOS and Android systems.
The proposed system starts with the image acquisition process, where images are
selected for further processing. These will undergo preprocessing in order to improve
the image contrast in addition to other enhancements. The preprocessed images will
then be used to extract a number of features, such as the area, the mean and the standard
deviation of on pixels. Four nonlinear classifiers, namely a binary decision tree, a k-
nearest neighbour classifier, and two support vector machines, using radial basis
function and polynomial function kernels respectively, will then be trained on the
training set to find an optimal way to group images into their respective classes. Finally,
in the prediction phase, where the system might ultimately be used to assist the
clinician, the images are classified into two main cases: normal or diabetic retinopathy.
Figure 4.1 presents the block diagram of the proposed system for automating the
screening and classification of diabetic retinopathy.
Figure 4.1 Block diagram of the proposed general automatic screening and
classification of diabetic retinopathy

84
4.1.1 Image Preprocessing
Preprocessing is the process of image data improvement, involving the enhancement of
some image characteristics or features for the next stage of processing. The image
preprocessing techniques involved in the present work include Greyscale Conversion,
Contrast Limited Adaptive Histogram Equalisation, Discrete Wavelet Transform,
Filtering and Morphological Operations.
The first preprocessing technique used is the conversion of the colour fundus image into
a greyscale image, as greyscale is usually a better format for image processing. A
greyscale image has pixels of a single value, namely its intensity information. It is also
known as a “black and white” image. The intensity is calculated by using a common
formula combination of 30% of red, 59% of green and 11% of blue.
The Adaptive Histogram Equalisation (AHE) is a computer image processing technique
for improving the image’s contrast. The difference between the adaptive histogram
equalisation and the ordinary histogram equalisation is that the adaptive histogram
equalisation computes several histograms for different sections of the image, and
subsequently distributes the lightness values. This technique is used to improve local
contrast and enhance more details of the image. However, the adaptive histogram
equalisation has its limitations, as it produces over-amplification of noise in the
homogeneous regions of an image. Therefore, the Contrast Limited Adaptive Histogram
Equalisation (CLAHE) is used in the proposed system in order to prevent the over
amplification of noise. CLAHE functions by clipping the histogram at the predefined
value before computing the cumulative distribution function. Histogram equalisation
processed image is obtained by mapping each pixel with level rk in the input image into
a corresponding pixel with level sk in the output image, as given below (Gonzalez and
Woods, 2002):

85
𝑠𝑘 = 𝑇(𝑟𝑘) = ∑ 𝑝𝑟
𝑘
𝑗=0
(𝑟𝑗)
= ∑𝑛𝑗
𝑛
𝑘
𝑗=0
𝑘 = 0, 1, 2, … , 𝐿 − 1
(4.1)
Discrete wavelet transform is a variant of wavelet transform for which the wavelets are
discretely sampled. The discrete wavelet transform is an O(N) algorithm and it is also
often referred to as the fast wavelet transform. The Haar wavelet is implemented in the
proposed system development as it is a simple wavelet transform and it is currently used
in many methods of discrete image transforms and processing. Discrete wavelet
transforms can be used to reduce the image size without losing much of the resolution.
The implementation of discrete wavelet transform is necessary to overcome the
limitation of the software used, where a warning is generated when the image is too big
to fit on the screen. Therefore resizing of the image is required. Since the fundus images
are of a high resolution and of quite a large size, the use of the Haar wavelet is
recommended. As a result of the implementation of the Haar Wavelet on the proposed
system, the size of the fundus images are reduced by half, from 1500x1152 to 750x576.
Image filtering is used to improve the image quality or to restore a digital image which
has been corrupted by some noise. A comparison of the performance between three
different edge operators, i.e., Sobel, Prewitt and Kirsch has been proposed for the
detection and segmentation of blood vessels in the colour retinal images (Karasulu,
2012). The experimental results show that the edge-based segmentation using the
Kirsch compass templates is far superior to other methods. Moreover, the Kirsch
operator can adjust the related threshold value automatically due to the image
characteristics. Based on these reasons, the Kirsch operator has been chosen as an edge
detection filter technique in the proposed system development. The Kirsch edge
detection uses eight filters (i.e., eight masks for the related eight main directions) that
are applied to a given image in order to detect edges. These eight filters are a rotation of
a basic 3x3 compass convolution filter (i.e., single mask). The Kirsch filter is applied on

86
the wavelet transform image to create the eight filtered output images. The masks are
distinct as given below (Karasulu, 2012):
𝑀0 = [5 5 5
−3 0 −3−3 −3 −3
] , 𝑀1 = [5 5 −35 0 −3
−3 −3 −3] , 𝑀2 = [
5 −3 −35 0 −35 −3 −3
],
𝑀3 = [−3 −3 −35 0 −35 5 −3
] , 𝑀4 = [−3 −3 −3−3 0 −35 5 5
] , 𝑀5 = [−3 −3 −3−3 0 5−3 5 5
],
𝑀6 = [−3 −3 5−3 0 5−3 −3 5
] , 𝑀7 = [−3 5 5−3 0 5−3 −3 −3
]
(4.2)
Morphological operations are used for certain purposes including image preprocessing,
enhancing object structure, segmenting objects from the background and also for the
quantitative description of objects (Sonka et al., 2008). In the proposed system
development, morphology operators involving dilation and erosion are implemented to
extract the blood vessels. A closing operation is defined as dilation followed by the
erosion operator. Joshi and Karule (2012) implemented the closing operation for retinal
blood vessel segmentation, where the disk shaped structuring element for the
morphological operation is used. The dilation operates in greyscale images to enlarge
brighter regions and it closes the small dark regions, while the erosion operator shrinks
the dilated objects back to their original size and shape. As a result, the vessels being
thin dark segments laid out on a brighter background, are closed by the closing
operation. Figure 4.2 (a)-(f) shows the output after each of the preprocessing operations
on a selected image.

87
(a) Original image (b) Greyscale
Conversion
(c) Adaptive
Histogram
Equalisation
(d) Discrete Wavelet
Transform (e) Kirsch Filtering
(f) Morphological
Operators
Figure 4.2 Image preprocessing
4.1.2 Feature Extraction
After performing the preprocessing techniques, feature extraction takes place in order to
obtain the features from the given images. Features can be grouped into shape-based
features, pixel-intensity-based features, Fourier-descriptor-based features and colour-
based features. Within the preliminary system for the classification and screening of
diabetic retinopathy, three basic shape features, including the area of on pixels and the
mean and the standard deviation, are extracted for the purpose of diabetic retinopathy
detection. The three values have been chosen as they are basic features and suitable for
the pre-processed candidate image. These values for both normal and diabetic
retinopathy images are used in order to create a model for training. Table 4.1 presents
the details of the feature extracted including the generated code.

88
Table 4.1 Feature extraction in the proposed system
4.1.3 Classification
The extracted feature values from the step described above have been passed to the
classification stage. The PRTools, a Matlab toolbox for pattern recognition has been
used to implement the classifiers (Duin et al., 2007). Nonlinear classifiers can provide
better classification results compared to linear classifiers. Therefore, four nonlinear
classifiers, namely the binary decision tree classifier, the k-nearest neighbour classifier,
the radial basis function (RBF) kernel based support vector classifier and the
polynomial kernel based support vector classifier have been selected to be trained on
images and to group them into two classes, i.e., normal and diabetic retinopathy
respectively, based on the three extracted features. The decision tree is a classifier in the
form of a tree structure. It classifies instances by starting at the root of the tree and
moving through it until a leaf node is reached. In the k-nearest neighbour classifier, the
object is classified by a ‘majority vote’ of its neighbours, with the object being assigned
to the most common class among its k nearest neighbours. The 1-nearest neighbour rule
(1-NN) is used in the particular implementation of the system. A support vector
machine (SVM) performs the classification by constructing an N-dimensional
hyperplane that optimally separates the data into two categories. The support vector
machine classifier can use various kernel functions, such as linear, polynomial or a
radial basis function. The kernel function transforms the data into a higher dimensional
space in order to be able to perform the separation in the nonlinear region. Two different
Feature Description Snippet Code
Area of
on pixels
Number of grey level pixels on
the black and white image, where
white pixels on are all pixels
above a threshold of 100 pixels
maxS = cvGet2D(gray, y, x);
val = maxS.val[0];
if(val > 100) {
count++;
sum += val; }
Mean Mean value of on pixels mean = sum / count;
Standard
deviation
Standard deviation of on pixels
maxS = cvGet2D(gray, y, x);
val = maxS.val[0];
if(val > 100) {
count++;
val = (mean-val);
sum += val*val; }
sdv = sqrt(sum) / count;

89
types of kernel functions provided in Matlab for SVM classification were used, i.e., the
second order polynomial kernel SVM, svc (ATrain, ‘p’, 2), and the radial basis function
kernel SVM, rbsvc (ATrain). The results show that the RBF kernel outperformed the
results obtained by the second order polynomial kernel.
4.1.4 System Results and Evaluation
Figure 4.3 shows the user interface snapshot of the proposed developed system. The
performance (misclassification error) of the four classifiers is presented in Table 4.2.
Since the dataset is hugely unbalanced, the minority class was oversampled by
duplication in order to balance it. The DIARETDB0 data is split randomly into 90% for
training and the remaining 10% for testing. The process is repeated ten times in a cross-
validation procedure in order to generate unbiased results. The average results on the ten
runs for each of the four classifiers are then reported. The four machine learning
classifiers were chosen to show the variance performance of different categories of
algorithms in machine learning, i.e., clustering, classification and regression. For
example, for the classification category, Support Vector Machines and k-nearest
neighbour were used, and for the regression category, the binary decision tree was used.
For more clarity, in Table 4.2, the confusion matrix for the first out of the ten
experiments is presented, in order to show the relative performance of the four
classifiers. A total of 130 colour fundus images, which consists of 110 normal images
and 20 diabetic retinopathy images, were used initially. Later, the diabetic retinopathy
images were duplicated to contribute the same number as the normal images. As a
result, both normal and diabetic retinopathy classes constitute a total of 220 images,
where each class has 110 images, respectively. A 10% from the 220 images, which total
to 22 images, were used for the testing part, dividing 11 images for the normal class and
another 11 images for the diabetic retinopathy class. The values of true positives, false
negatives, false positives and true negatives can be extracted from the generated
confusion matrix for the calculation of specificity, sensitivity and accuracy of the
system. For example, for the binary decision tree, the value of true positives is 6, false
negatives is 5, false positives is 0 and the true negatives is 11. The classification
performance of the diagnosis system is assessed using the accuracy of the individual
classifiers and also their specificity and sensitivity. The experimental results show that

90
the four classifiers, and especially the k-nearest neighbour, are well able to identify both
classes, i.e., the normal and the diabetic retinopathy (DR) cases. All four classifiers had
more success in identifying the diabetic retinopathy cases, as there were more examples
of such images in the database. As a comparison, the system results proposed by Priya
and Aruna (2011) showed a sensitivity of 99.45%, specificity of 100% and accuracy of
98.92% for the Support Vector Machine classifier. In addition, the experimental results
in (Priya and Aruna, 2012) showed that the results were 98%, 96% and 97.6% for
sensitivity, specificity and accuracy, respectively, for Support Vector Machine, while
for Probabilistic Neural Network the results were 90% for sensitivity, 88% for
specificity and 89.6% for accuracy.
Figure 4.3 Snapshot of the proposed system user interface
Table 4.2 Average results when using the four classifiers
Binary decision
tree
k-nearest
neighbour
RBF kernel
SVM
Polynomial kernel
SVM
Misclassification
error
0.2091 0.01364 0.0909 0.3182
Accuracy 0.7909 0.9864 0.9091 0.6818
Specificity 1 1 1 0.5545
Sensitivity 0.5818 0.9727 0.8182 0.8091
Confusion matrix for
the first experiment
Labels
(1 : Normal, 2: DR)
True | Estimated Labels
Labels | 1 2 | Totals
-----|----------|--------- 1 | 11 0 | 11
2 | 5 6 | 11
----|----------|--------- Totals | 16 6 | 22
True | Estimated Labels
Labels | 1 2 | Totals
----|----------|--------- 1 | 11 0 | 11
2 | 0 11 | 11
------|-----------|--------- Totals | 11 11 | 22
True | Estimated Labels
Labels | 1 2 | Totals
-----|-----------|--------- 1 | 11 0 | 11
2 | 2 9 | 11
------|----------|--------- Totals | 13 9 | 22
True | Estimated Labels
Labels | 1 2 | Totals
------|---------|--------- 1 | 6 5 | 11
2 | 2 9 | 11
-------|---------|--------- Totals | 8 14 | 22
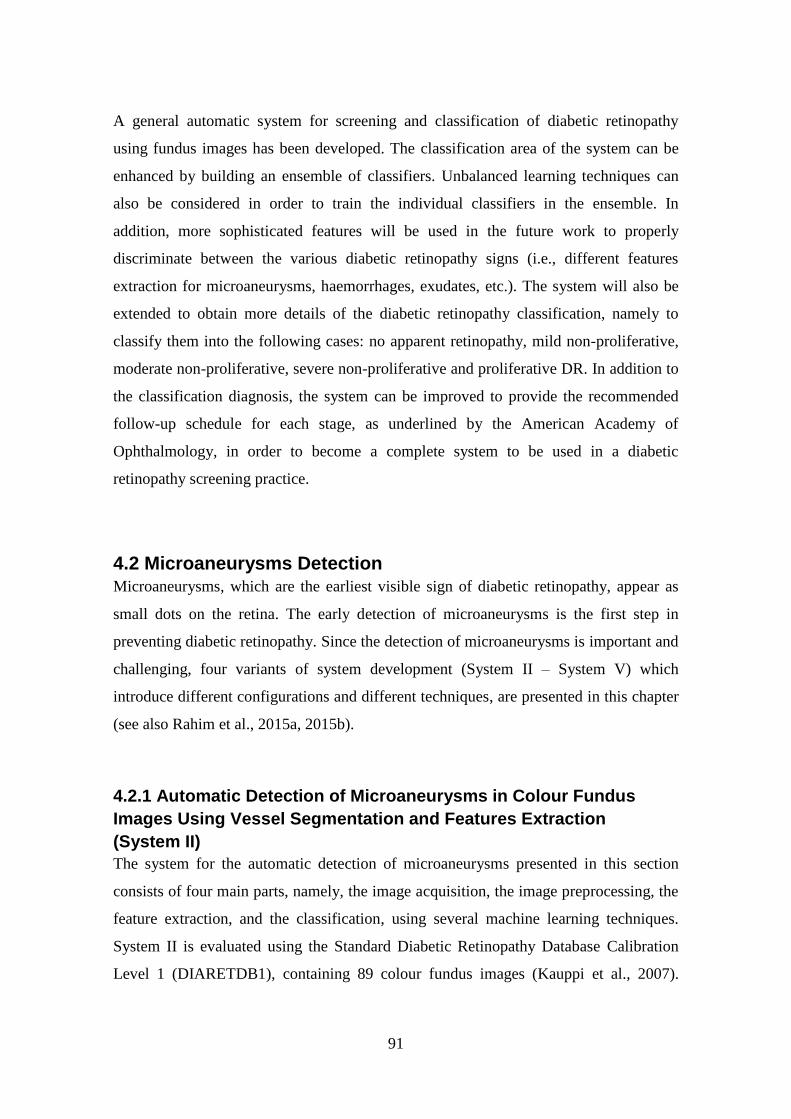
91
A general automatic system for screening and classification of diabetic retinopathy
using fundus images has been developed. The classification area of the system can be
enhanced by building an ensemble of classifiers. Unbalanced learning techniques can
also be considered in order to train the individual classifiers in the ensemble. In
addition, more sophisticated features will be used in the future work to properly
discriminate between the various diabetic retinopathy signs (i.e., different features
extraction for microaneurysms, haemorrhages, exudates, etc.). The system will also be
extended to obtain more details of the diabetic retinopathy classification, namely to
classify them into the following cases: no apparent retinopathy, mild non-proliferative,
moderate non-proliferative, severe non-proliferative and proliferative DR. In addition to
the classification diagnosis, the system can be improved to provide the recommended
follow-up schedule for each stage, as underlined by the American Academy of
Ophthalmology, in order to become a complete system to be used in a diabetic
retinopathy screening practice.
4.2 Microaneurysms Detection Microaneurysms, which are the earliest visible sign of diabetic retinopathy, appear as
small dots on the retina. The early detection of microaneurysms is the first step in
preventing diabetic retinopathy. Since the detection of microaneurysms is important and
challenging, four variants of system development (System II – System V) which
introduce different configurations and different techniques, are presented in this chapter
(see also Rahim et al., 2015a, 2015b).
4.2.1 Automatic Detection of Microaneurysms in Colour Fundus
Images Using Vessel Segmentation and Features Extraction
(System II)
The system for the automatic detection of microaneurysms presented in this section
consists of four main parts, namely, the image acquisition, the image preprocessing, the
feature extraction, and the classification, using several machine learning techniques.
System II is evaluated using the Standard Diabetic Retinopathy Database Calibration
Level 1 (DIARETDB1), containing 89 colour fundus images (Kauppi et al., 2007).

92
There are 75 images with microaneurysms and the remaining 14 images were identified
as showing no signs of microaneurysms.
The initial stage of the proposed system is the image acquisition process, followed by
the preprocessing process. The preprocessed images are then used to extract a number
of features. Four nonlinear classifiers, namely a binary decision tree, a k-nearest
neighbour classifier, and two support vector machines, using radial basis function and
polynomial function kernels respectively, are then trained on the training data to find an
optimal way to group images into their respective classes. Finally, in the classification
phase, the images are classified as to whether microaneurysms are present or not. The
overall process of microaneurysm detection is shown in Figure 4.4.
Figure 4.4 Block diagram of the proposed automatic detection of
microaneurysms
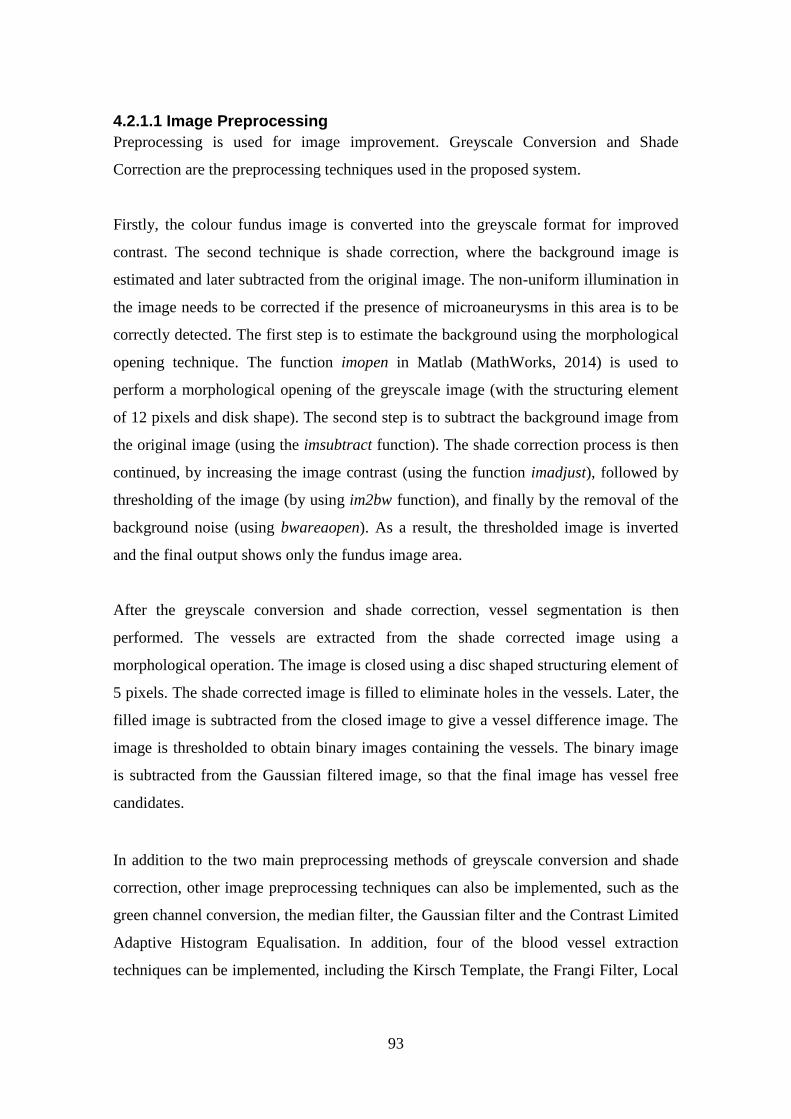
93
4.2.1.1 Image Preprocessing
Preprocessing is used for image improvement. Greyscale Conversion and Shade
Correction are the preprocessing techniques used in the proposed system.
Firstly, the colour fundus image is converted into the greyscale format for improved
contrast. The second technique is shade correction, where the background image is
estimated and later subtracted from the original image. The non-uniform illumination in
the image needs to be corrected if the presence of microaneurysms in this area is to be
correctly detected. The first step is to estimate the background using the morphological
opening technique. The function imopen in Matlab (MathWorks, 2014) is used to
perform a morphological opening of the greyscale image (with the structuring element
of 12 pixels and disk shape). The second step is to subtract the background image from
the original image (using the imsubtract function). The shade correction process is then
continued, by increasing the image contrast (using the function imadjust), followed by
thresholding of the image (by using im2bw function), and finally by the removal of the
background noise (using bwareaopen). As a result, the thresholded image is inverted
and the final output shows only the fundus image area.
After the greyscale conversion and shade correction, vessel segmentation is then
performed. The vessels are extracted from the shade corrected image using a
morphological operation. The image is closed using a disc shaped structuring element of
5 pixels. The shade corrected image is filled to eliminate holes in the vessels. Later, the
filled image is subtracted from the closed image to give a vessel difference image. The
image is thresholded to obtain binary images containing the vessels. The binary image
is subtracted from the Gaussian filtered image, so that the final image has vessel free
candidates.
In addition to the two main preprocessing methods of greyscale conversion and shade
correction, other image preprocessing techniques can also be implemented, such as the
green channel conversion, the median filter, the Gaussian filter and the Contrast Limited
Adaptive Histogram Equalisation. In addition, four of the blood vessel extraction
techniques can be implemented, including the Kirsch Template, the Frangi Filter, Local
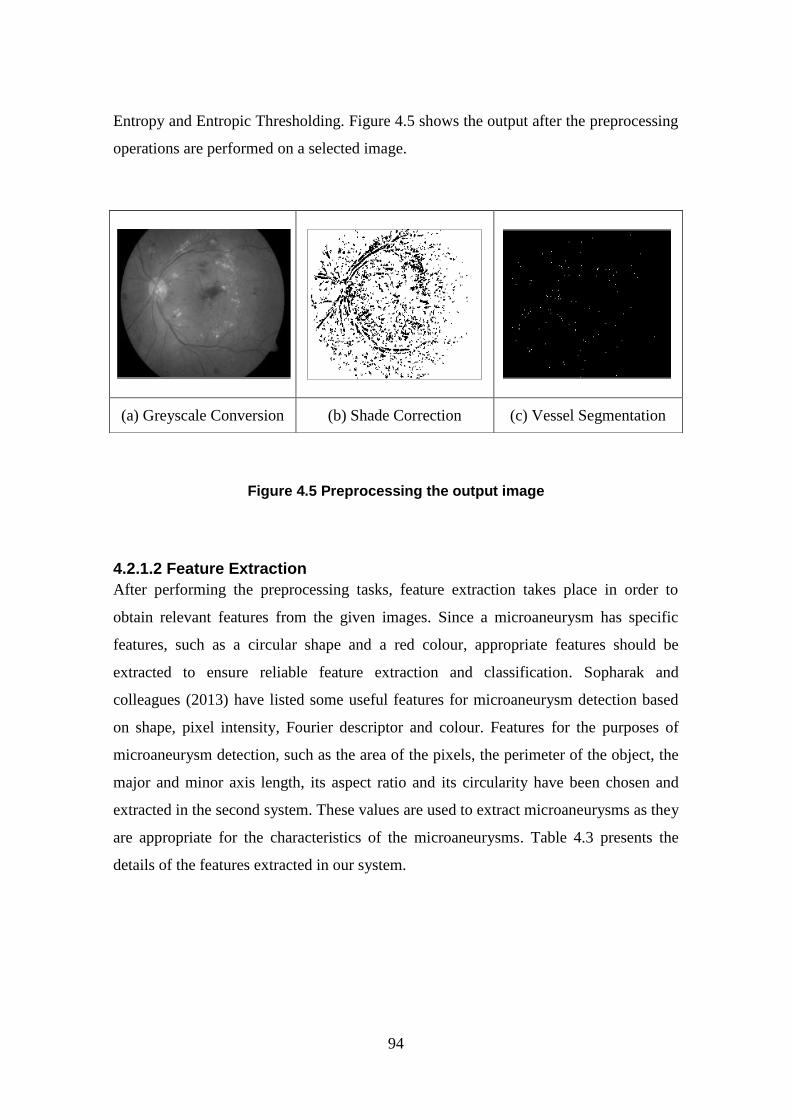
94
Entropy and Entropic Thresholding. Figure 4.5 shows the output after the preprocessing
operations are performed on a selected image.
Figure 4.5 Preprocessing the output image
4.2.1.2 Feature Extraction
After performing the preprocessing tasks, feature extraction takes place in order to
obtain relevant features from the given images. Since a microaneurysm has specific
features, such as a circular shape and a red colour, appropriate features should be
extracted to ensure reliable feature extraction and classification. Sopharak and
colleagues (2013) have listed some useful features for microaneurysm detection based
on shape, pixel intensity, Fourier descriptor and colour. Features for the purposes of
microaneurysm detection, such as the area of the pixels, the perimeter of the object, the
major and minor axis length, its aspect ratio and its circularity have been chosen and
extracted in the second system. These values are used to extract microaneurysms as they
are appropriate for the characteristics of the microaneurysms. Table 4.3 presents the
details of the features extracted in our system.
(a) Greyscale Conversion (b) Shade Correction (c) Vessel Segmentation

95
Table 4.3 Feature extraction in the proposed microaneurysms detection system
Feature Description
Area of pixels in the
candidate object
The actual number of pixels in the region
Perimeter of the object The distance around the boundary of the region
Major Axis Length of the
candidate object
The length (in pixels) of the major axis of the ellipse that
has the same normalised second central moments as the
region
Minor Axis Length of the
candidate object
The length (in pixels) of the minor axis of the ellipse that
has the same normalised second central moments as the
region
Aspect ratio Major Axis Length divided by the Minor Axis Length
Circularity Roundness of the candidate, ((4*pi*Area) / (Perimeter. ^2))
4.2.1.3 Classification
Classification was carried out using the PRTools package (Duin et al., 2007) in Matlab.
In the second system, presented in this section, the classifiers selected and implemented
for image classification purposes were: the binary decision tree classifier, the 1-nearest
neighbour rule (1-NN) classifier, the radial basis function kernel based support vector
classifier and the second order polynomial kernel based support vector classifier.
4.2.1.4 System Results and Evaluation
Figure 4.6 shows the user interface snapshot of the proposed developed system. The
performance (misclassification error) of the four classifiers is presented in Table 4.4.
Since the dataset is imbalanced, containing 75 images with signs of microaneurysms
and only 14 normal images, the minority class was therefore oversampled by one-time
duplication in order to avoid having an overly imbalanced dataset. The DIARETDB1
data is split randomly into 90% for training and the remaining 10% for testing. The
process is repeated ten times in a cross-validation procedure in order to generate
unbiased results. The average results on the ten runs for each of the four classifiers are
then reported.
The accuracy, sensitivity and also the specificity of the individual classifiers are
presented in Table 4.4 to measure classification performance. The accuracy of the four
classifiers i.e., the binary decision tree and the 1-nearest neighbour is 0.9091, while the

96
radial basis function kernel and the second order polynomial kernel based support
vector classifier is 0.7273. The experimental results show that the four classifiers are
able to identify both classes, i.e., the “microaneurysms detected” and the “no
microaneurysms” classes. The binary decision tree and the k-nearest neighbour
classifiers yielded very good results.
Figure 4.6 Snapshot of the proposed system user interface
Table 4.4 Average results when using the four classifiers
Binary
decision tree
k-nearest
neighbour
RBF kernel
SVM
Polynomial kernel
SVM
Misclassification error 0.0909 0.0909 0.2727 0.2727
Accuracy 0.9091 0.9091 0.7273 0.7273
Specificity 1 1 0.3333 0
Sensitivity 0.875 0.875 0.875 1

97
4.2.2 Automatic Detection of Microaneurysms in Colour Fundus
Images Using a Combination of Image Preprocessing Techniques
and Circular Hough Transform (System III)
The third system proposed here is an automatic detection of microaneurysms, which
introduces the combination of the preprocessing techniques and the Circular Hough
Transform for the localisation and detection of microaneurysms in colour fundus
images. For the third proposed systems, 40 fundus images of three different sizes (768 x
576, 1058 x 1061 and 1389 x 1383) have been used for evaluation from the Retinopathy
Online Challenge (ROC) public database (Niemeijer et al., 2010).
The Circular Hough Transform technique has been previously proposed for the
detection of microaneurysms in two types of photography modes, i.e., in retinal
fluorescein angiographic images (Abdelazeem, 2002) and also in digital red-free
photographs (Hipwell et al., 2000). The application of the Circular Hough Transform
for the detection of microaneurysms in the colour mode (another type of fundus
photography mode) was therefore explored. In the colour mode, the retina is illuminated
by white light and examined in full colour. The red-free or monochromatic mode is
where the imaging light is filtered to remove red colours, which helps to improve the
contrast of vessels and other structures. In the angiography mode, vessels are brought
into high contrast by the intravenous injection of a fluorescent dye, which produces a
very high-contrast image of the vessels. The detection of microaneurysms in colour
fundus images is more challenging compared to angiography and red-free types.
The initial stage of the proposed system is the image acquisition process, followed by
the preprocessing process. Following this, the detection of the microaneurysm is
performed using the Circular Hough Transform method. Finally, in order to test the
accuracy of the microaneurysms detection system compared to the ROC annotation,
statistical tests are performed for results analysis. The overall process of microaneurysm
detection is presented in Figure 4.7.

98
Figure 4.7 Block diagram of the proposed automatic detection of
microaneurysms using Circular Hough Transform
4.2.2.1 Image Preprocessing
A combination of preprocessing techniques, i.e., a Greyscale Conversion and Contrast
Limited Adaptive Histogram Equalisation are used in the system development. The
proposed preprocessing techniques are used to help increase the contrast of the colour
fundus images. The uses of colour fundus images are more challenging compared to
other modes of fundus photography examination: angiography and red-free.
Appropriate techniques must therefore be implemented in order to improve the contrast
of the fundus images for improved visualisation and detection.
4.2.2.2 Circular Hough Transform
The Circular Hough Transform (CHT) is implemented in the proposed system to locate
microaneurysms, due to their circular shape. In addition, CHT is also useful in detecting
the optic disc in a diabetic retinopathy screening system. The Hough Transform has
been used for optic disc localisation by Noronha and other colleagues (2006).

99
Meanwhile, the same method was used to detect the early signs of diabetic retinopathy,
represented by microaneurysms (Abdelazeem, 2002).
The Hough Transform can be used to detect lines, circles or other parametric curves. It
can be used to determine a circle when a number of known points fall on the perimeter.
The objective is to find the (a, b) coordinates of the centres at (x, y) on a circle of radius
R. The Hough Transform offers some advantages, such as simplicity, ease of use, the
effective handling of missing and occluded data and the fact that it can be adapted to
many types of forms, other than lines. However, the limitations of the Hough Transform
include the complex computation involved for objects with many parameters, the
detection of one single type of object, difficulty in determining the length and position
of a line segment and finally, that it cannot separate collinear line segments (Solberg,
2009).
Firstly, the radius of the microaneurysm in the fundus images is calculated (using the
function imdistline). Based on the radius range specified, the system will find the circles
in the fundus images using CHT (through the imfindcircles function). Finally, after
finding the circles in the image based on the radius range, a circle is then created on the
current axes (using the function viscircles). The output of the third proposed system in
the localisation and detection of microaneurysms is shown in Figure 4.8.
Figure 4.8 Microaneurysms detection by using the Circular Hough Transform

100
4.2.2.3 System Results and Evaluation
Figure 4.9 shows the user interface snapshot of the proposed developed system. The
performance analysis of the system and the expert annotation are presented in Table 4.5
and Table 4.6, respectively. The number of microaneurysms detected by the expert and
the developed system are calculated and compared. The presence of any number of
microaneurysms is represented as diabetic retinopathy (microaneurysms detected) and if
there is no microaneurysm detected, it is considered as normal (microaneurysm not
detected). Two types of statistical tests were performed to test the system performance
compared to the expert diagnosis. The T-test is used to test the mean differences
between the annotated images and the system output, and the results are presented in
Table 4.5. The fundus images (forty in total) diagnosed by the expert and by the system
were then compared with the T-test analysis. Firstly, a descriptive statistical analysis
was conducted and the results, as shown in Table 4.5, indicate that there is only a small
difference in the mean for the annotated images and that of the system (1.78 and 1.88,
respectively). The inferential statistical analysis (i.e., T-test) result indicates a p-value of
0.253. This shows that the means of the annotated images and the system output are not
significantly different.
Figure 4.9 Snapshot of the user interface of System III
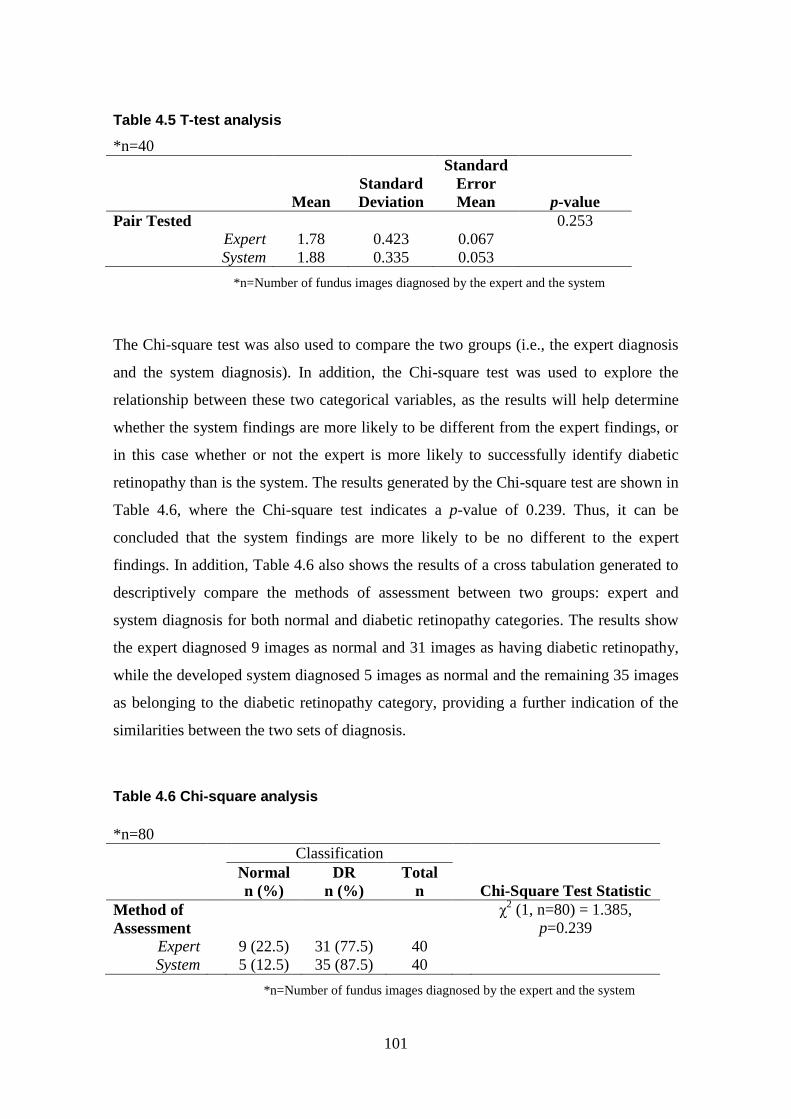
101
Table 4.5 T-test analysis
*n=40
Mean
Standard
Deviation
Standard
Error
Mean p-value
Pair Tested 0.253
Expert 1.78 0.423 0.067
System 1.88 0.335 0.053
*n=Number of fundus images diagnosed by the expert and the system
The Chi-square test was also used to compare the two groups (i.e., the expert diagnosis
and the system diagnosis). In addition, the Chi-square test was used to explore the
relationship between these two categorical variables, as the results will help determine
whether the system findings are more likely to be different from the expert findings, or
in this case whether or not the expert is more likely to successfully identify diabetic
retinopathy than is the system. The results generated by the Chi-square test are shown in
Table 4.6, where the Chi-square test indicates a p-value of 0.239. Thus, it can be
concluded that the system findings are more likely to be no different to the expert
findings. In addition, Table 4.6 also shows the results of a cross tabulation generated to
descriptively compare the methods of assessment between two groups: expert and
system diagnosis for both normal and diabetic retinopathy categories. The results show
the expert diagnosed 9 images as normal and 31 images as having diabetic retinopathy,
while the developed system diagnosed 5 images as normal and the remaining 35 images
as belonging to the diabetic retinopathy category, providing a further indication of the
similarities between the two sets of diagnosis.
Table 4.6 Chi-square analysis
*n=80
Classification
Normal
n (%)
DR
n (%)
Total
n
Chi-Square Test Statistic
Method of
Assessment
χ2 (1, n=80) = 1.385,
p=0.239
Expert 9 (22.5) 31 (77.5) 40
System 5 (12.5) 35 (87.5) 40
*n=Number of fundus images diagnosed by the expert and the system

102
4.2.3 Automatic Detection of Microaneurysms in Colour Fundus
Images Using Fuzzy Image Processing (System IV)
The fourth system applies a fuzzy technique for image preprocessing in the detection of
microaneurysms. As explained in Section 4.2.2.1 above for the third system, the colour
fundus images are more challenging compared to the other modes of fundus
photography examination. Therefore, in order to obtain better visualisation and accurate
detection, contrast enhancement should be implemented.
The fourth system proposes the implementation of a fuzzy preprocessing technique, the
Fuzzy Histogram Equalisation. The fuzzy preprocessing techniques were used for
contrast enhancement in the medical digital images, such as pathology images (Garud et
al., 2011) and also other non-medical images (Sheet et al., 2010). The performance of
the fuzzy preprocessing techniques reported in previous work is promising. Therefore,
the suitability of the fuzzy preprocessing technique for the screening of diabetic
retinopathy using colour fundus images will be investigated and proposed.
Contrast enhancement produces a better image than the original by changing the pixel
intensities (Sheet et al., 2010). There are several contrast enhancement techniques
available: Histogram Equalisation (HE), Contrast Limited Adaptive Histogram
Equalisation (CLAHE), Histogram Stretching and brightness preserving histogram
modification approaches. Histogram equalisation is a technique for adjusting image
intensities in order to enhance contrast, in which the grey-level values are uniformly
distributed. Adaptive histogram equalisation is a more advanced version of histogram
equalisation which divides the image into smaller tiles, applies the histogram
equalisation to each tile, and then interpolates the results. This adaptive histogram
equalisation includes limits on how far the contrast should be changed, namely the
Contrast-Limited Adaptive Histogram Equalisation, CLAHE.
Sheet et al. (2010) proposed a modified technique of the brightness preserving
equalisation called the Brightness Preserving Dynamic Fuzzy Histogram Equalisation
(BPDFHE). This technique is explained at length in Section 2.7. The representation and
processing of images in the fuzzy domain allows the technique to handle the inexactness
of grey level values in a better way in order to improve the overall performance. The

103
technique proposed by Sheet et al. (2010) is used for contrast enhancements in digital
pathology images (Garud et al., 2011). The performance of this technique has been
compared with HE and CLAHE and, as a result, the BPDFHE preserved the image
brightness better than the other two techniques. Good performance of the BPDFHE
technique especially in medical images such as pathology images is reported by Garud
et al. (2011). This technique has been explored as a preprocessing technique for the
proposed detection of microaneurysms in diabetic retinopathy screening.
The first stage of the proposed system is the image acquisition process, the second is
preprocessing process, the third is the detection of microaneurysms using the Circular
Hough Transform method and, finally, in order to test the accuracy of the
microaneurysms detection system with the ROC annotation, the statistical tests are used
for analysis. System IV(a) is similar to the third system presented in Section 4.2.2,
which implemented the Greyscale Conversion, Contrast Limited Adaptive Histogram
Equalisation and Circular Hough Transform. The difference between these systems is
that the third system bases its categorisation of Normal (no microaneurysms detected)
or Diabetic Retinopathy (microaneurysms detected) on the presence of microaneurysms.
System IV on the other hand, categories results into microaneurysms detected or
undetected based on the number of microaneurysms detected between the expert and the
developed system. The overall process of microaneurysms detection is presented in
Figure 4.10.
4.2.3.1 Image Preprocessing
A combination of preprocessing techniques including a Greyscale Conversion and a
Contrast Limited Adaptive Histogram Equalisation (CLAHE) are implemented for the
first system, System IV(a), while for the second system, System IV(b), a combination of
both a Greyscale Conversion and a Fuzzy Histogram Equalisation is proposed. Figure
4.11 shows both the output and the histogram for the intensity of the fundus image after
the preprocessing techniques have been applied, i.e., Greyscale Conversion, CLAHE
and Fuzzy Histogram Equalisation.

104
Figure 4.10 Block diagram of System IV for the automatic detection of
microaneurysms
Figure 4.11 Preprocessing the output image
(a) Greyscale
Conversion
(b) Contrast Limited
Adaptive Histogram
Equalisation
(c) Fuzzy Histogram
Equalisation

105
4.2.3.2 Microaneurysms Detection
The Circular Hough Transform technique is implemented in the fourth system to detect
the microaneurysms, as this technique has a good ability to detect circular shapes. The
background on the Circular Hough Transform technique is presented in Section 4.2.2.2.
4.2.3.3 System Results
Figure 4.12 shows the user interface snapshot of the proposed developed system.
Generally, the interfaces for both systems are similar, but the implementation of the
preprocessing techniques is different, as mentioned in Section 4.2.3.1 above.
The statistical result comparisons for both systems are presented in Table 4.7. The T-
test and the ANOVA test were performed to test the mean differences between the
annotated images and the system results based on the number of microaneurysms
detected by the expert and by the system. The first system, using a combination of
Greyscale Conversion and Contrast Limited Adaptive Histogram Equalisation, shows
that the means of the annotated images (7.48) and the system output (18.98) are
significantly different. On the other hand, the second system, which implemented the
Greyscale Conversion and the Fuzzy Histogram Equalisation, shows that the means of
the annotated images (7.48) and the system (9.33) are not significantly different. The
inferential statistical analysis (i.e., T-test) result indicates a p-value of 0.006 and 0.484
for the first and the second system, respectively. Meanwhile, the results generated by
the ANOVA test are also shown in Table 4.7, where the ANOVA test indicates a p-
value of 0.380 for the first system and 0.961 for the second system. In addition, the first
system (System IVa) produces the sensitivity of 0.8710, the specificity of 0.1111 and
the accuracy of 0.7000. The second system (System IVb) which implemented the Fuzzy
Histogram Equalisation generates better results where the sensitivity is 0.8387, the
specificity increased to 0.5556 and the accuracy is 0.7750. Based on the results
presented, it can be concluded that the implementation of the fuzzy preprocessing
techniques provides better contrast enhancement for fundus images, hence, it greatly
assists in the detection of microaneurysms, providing a more efficient and reliable
performance of the diagnosis system.

106
Figure 4.12 Snapshot of the user interface of System IV
Table 4.7 Summary results for Systems IV(a) and IV(b)
Features System IV(a) System IV(b)
Techniques Greyscale Conversion,
Contrast Limited
Adaptive Histogram
Equalisation, Circular
Hough Transform
Greyscale Conversion,
Fuzzy Histogram
Equalisation, Circular
Hough Transform
Number of fundus
images diagnosed
40 40
Confidence Interval 95% 95%
T-test p-value 0.006 0.484
T-test mean:
Expert
System
7.48
18.98
7.48
9.33
T-test standard
deviation:
Expert
System
10.268
21.021
10.268
11.425
T-test standard error
mean:
Expert
System
1.624
3.324
1.624
1.806
ANOVA test p-value 0.380 0.961

107
4.2.4 Automatic Detection of Microaneurysms Using Fuzzy
Histogram Equalisation, Fuzzy Filtering and Fuzzy Edge Detection
(System V)
Fuzzy image processing is a collection of different fuzzy approaches to the processing
of the images. Fuzzy edge detection, fuzzy histogram equalisation and fuzzy filtering
are among the fuzzy processing techniques that can be performed on images. In addition
to the fuzzy histogram equalisation, which was presented in Section 4.2.3, the fuzzy
filters for image filtering have been proposed by Patil and Chaudhari (2012), Toh
(2010) and also Kwan (2003). In addition to using fuzzy histogram equalisation and
fuzzy filters, fuzzy edge detection can also be performed.
In this section, in order to develop the proposed system, 600 fundus images from a
novel data set, collected from the Melaka Hospital, Malaysia (which is presented in
Section 3.9), have been used for evaluation. The system starts with the image
acquisition process, where the system selects images for further processing. The
selected images undergo preprocessing in order to improve image contrast in addition to
other enhancements. The preprocessed images are then used to locate and detect the
retinopathy signs, i.e., the microaneurysms. The numbers of microaneurysms detected
are displayed. Finally, in the classification phase, the images are classified into two
main cases: microaneurysms detected or microaneurysms not detected, based on the
number of microaneurysms detected. The overall process of microaneurysm detection is
presented in Figure 4.13.
108
Figure 4.13 Block diagram of System V for the automatic detection of
microaneurysms
4.2.4.1 Image Preprocessing
The image preprocessing techniques involved in this present work include Greyscale
Conversion, Adaptive Histogram Equalisation, Fuzzy Histogram Equalisation, Fuzzy
Filtering and Fuzzy Edge Detection.
The first preprocessing technique used is the conversion of the colour fundus image into
a greyscale image, as greyscale is usually the best format for image processing.
Histogram equalisation is a computer image processing technique for improving the
image’s contrast. The proposed preprocessing techniques are used to help increase the
contrast of the colour fundus images. As mentioned in Section 4.2.3.1, for System IV,
the use of colour fundus images is more challenging compared to angiography and red-
free which are the other modes of fundus photography examination. Therefore,
appropriate techniques need to be implemented in order to improve the contrast of the
fundus images for better visualisation and detection. The Brightness Preserving
Dynamic Fuzzy Histogram Equalisation (BPDFHE) technique proposed by Sheet et al.

109
(2010), has been chosen as a preprocessing technique for the proposed detection of
microaneurysms in diabetic retinopathy screening. This is due to its good performance
and proven ability to work well for medical images, such as the pathology images
presented by Garud et al. (2011).
Image filtering is used to improve the image quality or to restore a digital image which
has been corrupted by some noise. The proposed system implemented the median filter
by employing the fuzzy techniques. The Noise Adaptive Fuzzy Switching Median
(NAFSM) filter is an extension to the Fuzzy Switching Median (FSM) filter developed
by Toh and colleagues (2010). It worked well both in removing salt-and-pepper noise
and preserving image details and textures, by incorporating fuzzy reasoning in
correcting the detected noisy pixel. The technique is composed of two modules, which
are the salt-and-pepper noise detection and the fuzzy noise cancellation module. This
technique is explained in Section 2.7, together with the fuzzy histogram equalisation
and fuzzy edge detection.
As outlined in Section 2.7, an edge is a boundary between two uniform regions. The
edge can be detected by comparing the intensity of the neighbouring pixels. However,
since uniform regions are not crisply defined, small differences of intensity between two
neighbouring pixels do not always represent an edge, it might instead represent a
shading effect. Therefore, the use of membership functions would overcome the
problems by defining the degree of pixel as to whether it belongs to an edge or to a
uniform region. The image gradients are created as the inputs of a Fuzzy Inference
System (FIS) for edge detection. For each input, a zero-mean Gaussian membership
function is specified, where if the gradient value for a pixel is 0 (region), then it belongs
to the zero membership function with a degree of 1. Another membership function is
added, which specifies the standard deviation from the zero membership function for
the gradient inputs. As an output of the FIS, which is the intensity of the edge-detected
image, the triangular membership functions (white and black) are specified. The values
of the standard deviation and also the values of the triangular membership functions for
the output can be changed in order to adjust the edge detector performance. Next, the
FIS rules can be specified to make a pixel white if it belongs to a uniform region,

110
otherwise the pixel presents as black. Figure 4.14 shows the membership functions of
the inputs and outputs for the edge detection purpose. For both inputs, which are the
gradient of every pixel on both axes, the parameters for the Gaussian membership
function consists of the central value or mean (0) and the standard deviation (0.1).
Meanwhile, for the outputs of the edge detection, which are the intensities of the edge-
detected image, there are three parameters required for the triangular membership
function. The parameters are the start, peak and end of the triangles of the membership
functions. The triplet parameter values for both white and black are (0.7, 0.9, 1) and (0,
1, 1), respectively. The fuzzy membership functions parameters were obtained by
changing the parameter values until better performance of the edge detector and
increased intensity of detected edges were produced. These parameters influence the
intensity of the detected edges. The Gaussian fuzzy membership function was used due
to the smoothness decision obtained, while the triangular function was chosen due to
simplicity and computational efficiency. The implementation of both fuzzy membership
functions for the edge detection provides better edge detection and more quality output
image. Figure 4.15 shows the output after each of the fuzzy pre-processing operations
on a selected image, as explained previously.
Figure 4.14 Membership functions for inputs and outputs

111
Figure 4.15 Preprocessing the output image with fuzzy approaches
4.2.4.2 Localisation and Detection of Microaneurysms
After performing the preprocessing techniques, both localisation and microaneurysm
detection takes place. In order to detect the circular microaneurysms satisfactorily, the
Circular Hough Transform (CHT) technique is implemented in the proposed system.
The implementation of the Circular Hough Transform uses the imdistline function in
Matlab to calculate the radius of microaneurysms in the fundus images. The viscircles
function that draws circles in the fundus image with a specified centre and radius onto
the current axes is presented in Section 4.2.2.2.
4.2.4.3 Classification
The counting of microaneurysm will then takes place. The presence of any number of
microaneurysms is represented as Diabetic Retinopathy, DR (microaneurysms
detected), and if there is no microaneurysm detected, it is considered as normal or no
retinopathy (microaneurysms not detected). The categorical types of the output whether
Normal/No DR or DR will be used later for the analysis of the system performance. The
categorical types from the expert diagnosis and the system generated are then compared.
The nominal inputs from both expert and system are represented as 1 for Normal/No
DR and 2 for DR. The average from the three experts will be used for the overall expert
diagnosis. Later, the comparison between the overall expert diagnosis and the proposed
system diagnosis will be completed and a statistical analysis of both performances will
then be produced.
(a) Fuzzy Histogram
Equalisation
(b) Fuzzy
Filtering
(c) Fuzzy Edge
Detection

112
4.2.4.4 System Results and Evaluation
Figure 4.16 shows the user interface snapshot of the proposed developed system. The
performance analysis summary of the proposed system, which utilises different
techniques, is presented in Table 4.8. System V(a) implemented the greyscale
conversion, histogram equalisation and Circular Hough Transform (CHT), while
System V(b) proposed the implementation of the Fuzzy Histogram Equalisation in
addition to the greyscale conversion and CHT. System V(c) and System V(d) proposed
the implementation of other fuzzy image processing techniques, such as Fuzzy Filtering
and Fuzzy Edge Detection respectively. Two types of statistical tests were performed to
test the system performance compared to the expert diagnosis. Six hundreds fundus
images diagnosed by the expert and the systems are involved in both tests. The results
generated prove that, within the 95% confidence interval, the means of the annotated
images (1.54) and the system with the fuzzy techniques such as Fuzzy Histogram
Equalisation (1.49) and Fuzzy Edge Detection output (1.59) are not significantly
different. Thus, it can be concluded that the system findings are more likely to be no
different to the expert findings. However, the annotated images and the system with the
fuzzy median filter (with mean 1.43) are significantly different and show the opposite.
The inferential statistical analysis (i.e., T-test) result indicates a p-value of 0.00 (System
V(a)), 0.92 (System V(b)), 0.00 (System V(c)) and 0.73 (System V(d)), respectively.
The Chi-square test indicates a p-value of 0.00, 0.94, 0.00 and 0.81 for the four systems.
In addition, Table 4.8 shows that the results generated compare descriptively to the
methods of assessment between two groups: the expert and the system diagnosis for
both normal and diabetic retinopathy cases. The analysis based on the presented results
concludes therefore, that the implementation of the fuzzy preprocessing technique
provides better contrast enhancement and other improvements for fundus images, hence,
it greatly assists in detecting microaneurysms more efficiently therefore a reliable
performance of the diagnosis system can be produced.

113
Figure 4.16 Snapshot of the proposed system user interface
Table 4.8 Summary results for System V(a), V(b), V(c) and V(d)
System V(a) System V(b) System V(c) System V(d)
Techniques Greyscale,
Histogram
Equalisation,
CHT
Greyscale, Fuzzy
Histogram
Equalisation,
CHT
Greyscale, Fuzzy
Median Filter,
CHT
Greyscale, Fuzzy
Edge Detection,
CHT
T-Test Mean:
Expert
System
1.54
1.67
1.54
1.49
1.54
1.43
1.54
1.59
T-Test p-value 0.00 0.92 0.00 0.73
Chi-Square p-value 0.00 0.94 0.00 0.81
Expert Count:
No DR
DR
276
324
276
324
276
324
276
324
System Count:
No DR
DR
201
399
305
295
343
257
246
354

114
4.3 Maculopathy and Diabetic Retinopathy Detection Maculopathy is represented by yellow lesions near the macula and is a disease of the
macula region of the retina. The macula is the centre of the retina and provides our
central vision. The macula region is a very sensitive area in the centre of which is the
fovea, a tiny area which is responsible for both detailed and colour vision (Taylor and
Batey, 2012). The detection of maculopathy therefore is very important because the loss
of vision at the fovea alone causes blindness. Maculopathy is present when there are any
exudates, haemorrhages or microaneurysms in the macula region. However, the visible
signs of maculopathy are only indirect markers for the possible presence of macula
oedema, which is the swelling of the retina (Taylor and Batey, 2012). The presence or
absence of the maculopathy will determine the need for treatment or referral. The
referral to the ophthalmologist is assigned if maculopathy is present. If maculopathy is
absent referral is not required and the screening will be repeated in one year’s time. The
combined detection of diabetic retinopathy and maculopathy therefore is vital in order
to effectively assist the management of diabetic retinopathy screening.
In order to identify maculopathy, the localisation and the detection of both macula and
fovea are essential, as maculopathy is represented by lesions in the macula region and
the fovea is at the centre of the macula. Kumar et al. (2013) proposed an approach in
detecting the macula by using bit plane decomposition and mathematical morphology
methods. Mubbashar et al. (2011) presented an automated system for the localisation
and detection of the macula in digital retinal images. The centring of the optic disc and
the blood vessel extraction are performed prior to the detection of the macula. This is
achieved by using the centre of the optic disc and by thresholding, followed by vessel
enhancement and then locating the macula as the darkest pixels in the region. In
addition, the detection of the macula is proposed by Akram et al. (2014) along with the
detection of exudates. The system proposed a contrast enhancement, thresholding and
blood vessel segmentation to detect the dark candidate, followed by the classification of
some of the set features for macula detection through the use of a Gaussian Mixtures
Model-based classifier. The localisation of the optic disc and the fovea in retinal fundus
images is also proposed by Sekhar et al. (2008). Morphological operations and the
Hough transform are implemented to locate the optic disc, while the fovea is located via

115
the spatial relationship with the optic disc and also from the spatial distribution of the
macula. They defined the region of interest as an area in a sector that originates at the
optic disc centre at an angle of 30° above and below the line between the optic disc
centre and the centre of the retinal image disc.
Meanwhile, Punnolil (2013) proposed an approach for the grading of diabetic
maculopathy through implementing the detection of retinal structures, such as the optic
disc, the macula and the fovea followed by the detection of lesions including the
exudates, haemorrhages and microaneurysms. These were later graded into classes of
diabetic maculopathy using a multiclass Support Vector Machines (SVM) classifier
based on the extracted features. Tariq et al. (2013) present a similar diabetic
maculopathy grading system starting with the optic disc localisation and the vascular
structure to extract the macula. Next, features such as area, compactness, mean
intensity, mean hue and others are extracted from the exudates detection and used to
classify different stages of maculopathy using a Gaussian Mixture Model-based
classifier. The detection of diabetic maculopathy in retinal images is also investigated
by Vimala and Kajamohideen (2014) through the use of morphological operations. The
detection of macula is generated from the image preprocessing techniques such as green
component extraction, filtering and adaptive histogram equalisation. Morphological
operations are then performed, such as top-hat transform and bottom-hat transform.
Other automatic gradings of diabetic maculopathy systems are proposed by
Siddalingaswamy and Prabu (2010), Hunter et al. (2011) and Chowriappa et al. (2013).
Siddalingaswamy and Prabu (2010) proposed the detection of the optic disc, fovea and
macula region, based on the location and diameter of the optic disc, followed by the
detection of the hard exudates using both clustering and mathematical morphological
techniques. The classification into severity levels of maculopathy, which consist of
mild, moderate and severe levels, is performed based on the location of exudates in the
marked macular region. An automated diagnosis of the maculopathy system is
presented by Hunter et al. (2011). Firstly, the optic nerve head and the fovea are
detected in order to locate the macula region. Candidate lesions are then segmented,
followed by feature extraction and, finally, classification by a multilayer perceptron. An
ensemble selection for the feature-based classification of diabetic maculopathy images

116
is suggested by Chowriappa et al. (2013). This is based on extracting textural features
and then using classifiers such as the hidden Naïve Bayes, Naïve Bayes, sequential
minimal optimisation (SMO) and the tree-based J48 algorithm to classify the features
into disease severity classes.
The detection of maculopathy is vital as it will eventually cause loss of vision if the
affected macula is untreated. Therefore, some researchers are focusing on this
challenging area and suggest several solutions for the detection of maculopathy on
retinal images. However, fuzzy processing has not been implemented during the
preprocessing stage within these previously reported maculopathy detection systems.
Therefore, the proposed system implements a combination of fuzzy techniques for the
image processing area of diabetic retinopathy and maculopathy detection. Two systems
have been proposed for detecting diabetic retinopathy alongside maculopathy in this
research work. The development of the first system (System VI) is explained in detail in
Rahim et al. (2015c), while the second system (System VII) is presented in Rahim et al.
(2016). Both systems have been evaluated with the 600 fundus images from the novel
data set, collected from the Melaka Hospital, Malaysia, which is presented in Section
3.9.
4.3.1 Detection of Diabetic Retinopathy and Maculopathy in Eye
Fundus Images Using Fuzzy Image Processing (System VI)
System VI implements a combination of fuzzy techniques in image preprocessing,
which involves fuzzy filtering, followed by fuzzy histogram equalisation and finally
fuzzy edge detection. System VI is different from System V presented in Section 4.2.4,
as System V proposed individual system variants implementing different fuzzy
processing techniques for the detection of microaneurysms. On the other hand, System
VI proposed a novel detection system for diabetic retinopathy and maculopathy by
combining several consecutive fuzzy image preprocessing techniques in one system,
based on previous encouraging results for the use of fuzzy image processing obtained
by System V. In addition, System VI is following the current practice observed by the
ophthalmologist in the classification and grading of diabetic retinopathy and
maculopathy, which classifies images into ten main classes, as explained in Section 3.9.

117
The system begins with the image acquisition process, where the system selects images
for further processing. The selected images undergo preprocessing in order to improve
the image contrast as well as perform other enhancements, with a combination of
several fuzzy techniques. The preprocessed images are then used for feature extraction,
where three features, namely, the area, the mean and the standard deviation of on pixels
are extracted. Finally, in the classification phase, some machine learning classifiers are
trained using these features to classify the images into their respective classes. Figure
4.17 presents the block diagram of the proposed system for the automatic screening and
classification of diabetic retinopathy and maculopathy using fuzzy image processing
techniques.
Figure 4.17 Block diagram of System VI for the automatic detection of diabetic
retinopathy and maculopathy using fuzzy image processing

118
4.3.1.1 Image Preprocessing
Image preprocessing is the operation of improving the image data quality. Fuzzy
approaches are implemented in this proposed version of the system at the preprocessing
stage. The image preprocessing techniques involved in the present work include
Greyscale Conversion, Fuzzy Filtering, Fuzzy Histogram Equalisation and Fuzzy Edge
Detection. Similar proposed image preprocessing techniques, as in System V, are
implemented due to their good performance. In order to calculate the white pixels from
the edge-detected image, the output image is converted or inversed to produce the black
and white image. Figure 4.18 shows the membership functions of the inputs and outputs
for the edge detection purpose. For both inputs, which are the gradient of every pixel
on both axes, the parameters for the Gaussian membership function consists of the
central value or mean (0) and the standard deviation (0.1). Meanwhile, for the outputs of
the edge detection, which are the intensities of the edge-detected image, there are three
parameters required for the triangular membership function. The parameters are the
start, peak and end of the triangles of the membership functions. The triplet parameter
values for both white and black are (0, 1, 1) and (0, 0.7, 1), respectively. Figure 4.19
shows the output after each of the fuzzy pre-processing operations on a selected image.
Figure 4.18 Membership functions for inputs and outputs

119
Figure 4.19 Preprocessing of the output image
4.3.1.2 Feature Extraction
After performing the preprocessing techniques, feature extraction takes place to obtain
the features from the preprocessed images. Three preliminary features are proposed,
namely, the area of on pixels and the mean and standard deviation which will be
extracted for the purposes of detection. The first feature is the number of white pixels on
the black and white image, while the second and third features are the mean value and
the standard deviation of on pixels, respectively. These three shape-based features are
suitable to be extracted from the edge-detected inversed output image. For example, the
area of on pixels represents the detected maculopathy, which is the purpose of this
developed system. Other more sophisticated features could be extracted in addition to
these three proposed features in order to improve the classification performance.
(a) Original
image
(b) Greyscale
conversion
(c) Fuzzy
filtering
(d) Fuzzy
Histogram
Equalisation
(e) Fuzzy edge
detection
(f) Edge-detected
inversed
image

120
4.3.1.3 Classification
The extracted feature values were used in the classification stage, where the PRTools
Matlab toolbox (Duin et al., 2007) for pattern recognition was employed for this task. In
order to generate a variety of results and a good performance analysis of the system, two
types of classification were considered. First, the images have been classified into two
classes, i.e., normal (276 images) and diabetic retinopathy (324 images). In addition,
with the use of several machine learning classifiers, the images are then classified into
ten classes, which provide more details, i.e., No Diabetic Retinopathy (DR) with 276
images, and the other nine detailed classes of the DR cases, which are: Mild DR without
maculopathy (72 images), Mild DR with maculopathy (27 images), Moderate DR
without maculopathy (85 images), Moderate DR with maculopathy (83 images), Severe
DR without maculopathy (23 images), Severe DR with maculopathy (11 images),
Proliferative DR without maculopathy (6 images), Proliferative DR with maculopathy
(10 images) and Advanced Diabetic Eye Disease (ADED, with only 7 images). Several
machine learning classifiers, such as the binary decision tree classifier and the 1-nearest
neighbour classifier have been selected to train and classify images into these
categories.
4.3.1.4 System Results and Evaluation
Figure 4.20 shows the user interface snapshot of the proposed developed system. The
performance of the proposed system, including the misclassification error, accuracy of
the individual classifiers and also the specificity and sensitivity of the two classifiers for
both categories are presented in Table 4.9, based on the confusion matrix generated.
Since the dataset is hugely imbalanced for some classes including mild DR with
maculopathy, severe DR with and without maculopathy, proliferative DR with and
without maculopathy and Advanced Diabetic Eye Disease (ADED), the minority classes
were oversampled. This was achieved by running the system with images from these
classes replicated several times in order to obtain various extracted feature values and
balance the dataset. The developed dataset is split randomly into 90% for training and
the remaining 10% for testing. The process is repeated ten times in a cross-validation
procedure in order to generate unbiased results. The average results on the ten runs for
each of the two classifiers are reported. The experimental results show that the two

121
classifiers, and especially the k-nearest neighbour, are able to identify well for both
main categories. The two classifiers identified the diabetic retinopathy cases much
better however in the two classes’ case, as there were more examples of such images in
the database compared to other example of the ten classes. The maculopathy can be
seen clearly from the inversed edge-detected image and the area of on pixels will have a
higher value for those images with maculopathy.
Figure 4.20 Snapshot of the proposed system user interface
Table 4.9 Summary results for System VI
Category I : 2 classes Category II : 10 classes
Binary
decision tree
k-nearest
neighbour
Binary
decision tree
k-nearest
neighbour
Misclassification error 0.2539 0.2139 0.4395 0.2975
Accuracy 0.7461 0.7861 0.5605 0.7025
Specificity 0.4536 0.5572 0.4500 0.6500
Sensitivity 0.8403 0.8598 0.5956 0.7297

122
4.3.2 Detection of Diabetic Retinopathy and Maculopathy in Eye
Fundus Images Using Fuzzy Image Processing and Retinal
Structures Segmentation (System VII)
System VII implements a combination of fuzzy techniques for image preprocessing,
such as fuzzy filtering and fuzzy histogram equalisation. In addition, the proposed
system implements the localisation and the detection of four retinal structures, which
are the optic disc, the blood vessels, the macula and the fovea, which are important in
the identification of maculopathy. Furthermore, the system detects diabetic retinopathy
lesions, the exudates, which are vital in the detection of exudative maculopathy. Several
features extracted from the exudates lesions and from the maculopathy are used for
classification. The system is evaluated with a combination of normal and diabetic
retinopathy images, including the maculopathy fundus images from the new dataset
developed, as discussed in Section 3.9.
The proposed diabetic retinopathy and maculopathy detection system has been created
using the Matlab R2014a environment. The system starts with the image acquisition
process, where the system selects images from the folder for further processing. Next,
the image preprocessing task takes place in order to improve the image quality. This
task includes the implementation of the fuzzy image processing techniques and the
retinal structures’ localisation and segmentation. In order to detect the maculopathy, the
lesions called exudates must be identified (where exudates situated in the macula region
represents the exudative maculopathy). Several features are then extracted from the
preprocessed image. Finally, in the classification phase, several machine learning
classifiers, such as the k-nearest neighbour, support vector machines and Naïve-Bayes
classifiers are trained using the generated features in order to classify the images into
their respective classes. Figure 4.21 shows the block diagram of the proposed system for
automatic screening and classification of diabetic retinopathy and maculopathy in
retinal images using fuzzy image processing techniques. The individual stages are
discussed in more detail in the following sections.
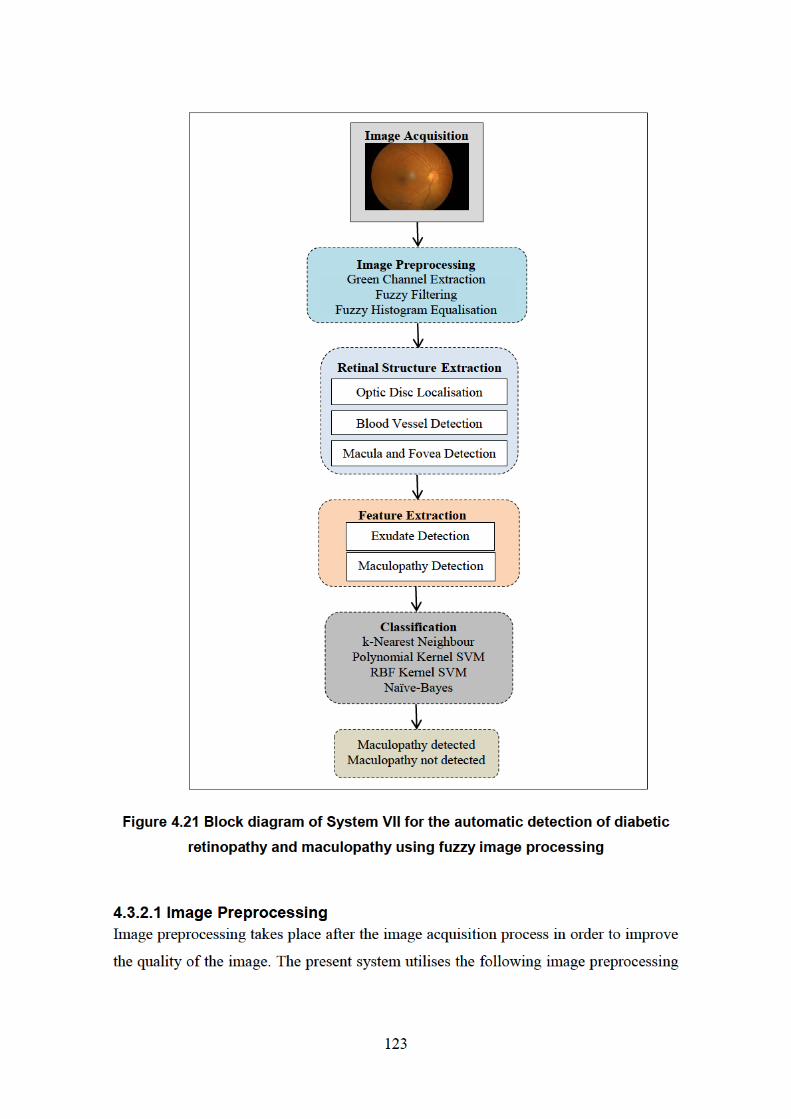

124
techniques: green channel extraction, fuzzy filtering and fuzzy histogram equalisation.
Figure 4.22 shows the output image obtained after the preprocessing stages.
The first preprocessing technique is the extraction of the green channel from the colour
fundus image, which consists of the red, green and blue channels. In the previous
proposed systems (System I – System VI), the colour fundus images are converted into
a greyscale image. In the present system, the green channel extraction is used to
investigate the difference and capability of the green channel format compared to both
the greyscale format and other image colour conversion formats. In most of the research
that has been carried out in diabetic retinopathy screening, the green channel is used for
detecting the diabetic retinopathy lesions such as haemorrhages, vessels and
microaneurysms. The red channel is somewhat saturated while the green channel
contains more structural information. Therefore, it is sensible to use the green channel
for the segmentation or morphological operations, since most of the image processing
tools work for greyscale only. Due to the capability of the green channel, the colour
fundus image is converted into the green plane channel. In addition, the aim of the
conversion is to investigate the ability of colour features, as one of the features to be
used for classification besides shape and intensity features. The next pre-processing
techniques are performed on the green channel image.
Image filtering needs to be implemented to improve the image quality or restore the
digital image which tends to have a variety of noise types. The poor photo quality may
also be due to equipment related factors, such as a dirty lens or a dirty computer screen.
In addition, distractions from the surroundings, such as too bright a room can be a factor
in generating poor quality fundus photographs. The filtering process therefore is
necessary to overcome this problem and to enable the image for further processing and
for effective grading task. The proposed system implements the median filter with fuzzy
techniques described by Toh et al. (2010) termed the Noise Adaptive Fuzzy Switching
Median (NAFSM) filter. Although the proposed technique is not working well as an
individual system variant in System V for microaneurysm detection, the technique has
been working well in System VI for both diabetic retinopathy and maculopathy
detection.

125
After filtering the image from any noise, the third preprocessing technique, the fuzzy
histogram equalisation, is performed on the images. The role of the histogram
equalisation is to improve the contrast of the image. As stated above, colour fundus
images are more challenging compared to angiography and red-free modes of fundus
photography examination. The implementation of the histogram equalisation by
employing fuzzy techniques therefore helps to improve the contrast of the fundus
images for better visualisation and detection. The technique called Brightness
Preserving Dynamic Fuzzy Histogram Equalisation (BPDFHE) proposed by Sheet et al.
(2010) was found to work well on colour fundus images (see System IV- System VI)
and has also been chosen as a preprocessing technique in this proposed system.
Figure 4.22 Preprocessing the output image
4.3.2.2 Retinal Structure Extraction
The extraction of retinal structures assists the diagnosis of eye diseases, through
improving both the detection results and grading for lesions. The detection of retinal
structures for diabetic retinopathy screening therefore, such as the optic disc, blood
vessels, the macula and the fovea are essential in order to produce a reliable screening
system. Figure 4.23 shows the output image with the extraction of retinal structures.
(a) Original image (b) Greyscale
conversion
(c) Green channel
extraction
(d) Green channel
complement (e) Fuzzy filtering
(f) Fuzzy histogram
equalisation

126
The optic disc is the most important retinal structure in the screening of diabetic
retinopathy. The optic disc has the largest high contrast among all the circular shape
areas. The location of the optic disc is of critical importance in retinal image analysis
and is required as a prerequisite stage in detecting lesions, including exudate detection.
Optic disc localisation and segmentation therefore are both performed in the proposed
system in order to improve the overall detection accuracy. The technique used in the
proposed system is based on the circular Hough transform (CHT), to ensure more
reliability in the optic disc detection task. In this case, the Hough transform for circles is
used to locate the optic disc, due to its circular shape. Based on a specified radius range,
the system finds circles in fundus images using CHT with the use of the imfindcircles
function in Matlab. After finding the circles in the image based on the radius range, the
function viscircles in Matlab is then used to create a circle. The function draws circles
with the specified centre and radius onto the current axes on the fundus images. The
CHT technique has also been used for the detection of microaneurysms in Systems III
and V, as this technique is works well in detecting circular shapes. In addition to the
proposed CHT technique, the polygonal Region of Interest (ROI) technique can be
performed on the fundus image to detect the optic disc. A region of interest is a portion
of an image for filtering purposes and also for performing other operation. In order to
implement this method, the roipoly Matlab function is used, which aims to create an
interactive polygon tool associated with the image displayed in the current image,
known as the target image. The function roipoly works by selecting vertices of the
polygon and, as a result, it returns a binary image that can be used for masked filtering.
The function allows moving, deleting or resizing the polygon as well as moving, adding
or deleting a vertex and also changing the colour of the polygon.
After locating the optic disc, another important retinal structure represented by the
blood vessels, is then extracted. There are several vessel extraction techniques
including: morphological operations, the Kirsch filter, the Frangi filter, local entropy
and entropic thresholding. For the proposed system, morphological operations are
implemented for the extraction of the blood vessels. The operation starts where the
fuzzy histogram equalisation output image is opened, using a disc shaped structuring
element. The image background is then removed and the image is thresholded to obtain

127
the binary images containing the vessels. Finally, the morphological open is
implemented using the bwareaopen function to remove any small noise. In order to
generate the elimination of the vessels, the binary image can be subtracted from the
Gaussian filtered image so that the final image has vessel free candidates.
The detection of the optic disc is vital for the detection of macula because its centre can
be used for macula detection. The macula appears as a dark region near the centre of the
image and its location is at a two-disc-diameter distance from the optic disc. The fovea
is the centre of the macula. Once the macula is identified, it is simple to determine the
fovea as its centre. The macular region can then be defined using two clinical
approaches. The first approach uses the Early Treatment Diabetic Retinopathy Study
(ETDRS), which indicates the presence of clinically significant macular edema (CSME)
as any part located within one disc diameter of the centre of the fovea (Wilkinson et al.,
2003). The second approach is based on the anatomical characteristics, where the
macular region is about 5-5.5 mm in diameter. In the proposed system, three methods
for macula detection are implemented. The first method uses the centre of the optic disc
identified by the circular Hough transform. The macula is identified based on the
distance specified from the optic disc. Once again, the circular Hough transform is used
to create a circle for the macula region. The detection of the macula region is proposed
by an angle of 37 degrees above and below the horizontal line crossing the optic disc
centre and with the centre of the macula region situated at 2 disc diameter (2DD)
distance from the optic disc centre. A circle of 1.3 discs diameter (1.3DD) is then
cropped to find lesions in the macula region. Figure 4.23(d) illustrates this process more
clearly. The cropped macula region can be used to locate larger and more appropriate
lesion areas relevant to maculopathy. The poly2mask function can be used to find the
region of interest of the macula region. In addition, the imcrop tool can also be used.
However, the cropping process has its limitations as it can be performed with
rectangular shapes only. This is because images are represented as arrays in Matlab and
arrays are required to be rectangular. The circular region of interest (ROI) cropping can
also be implemented with roicirclecrop function. The function crops the ROI in the
form of a circular shape and with a black background based on two points: the centre
and the radius of the circle.


129
4.3.2.3 Exudate and Maculopathy Detection
In order to detect maculopathy, exudates first need to be detected in the macula region.
The thresholding method is one of the ways to detect the exudate lesions. Thresholding
is used to extract an object from its background by assigning an intensity value
(threshold value) for each pixel, such as whether the pixel is classified either as an
object pixel or a background pixel. In this case, thresholding is used in the system
development as the simplest form of segmentation in order to segment the fundus image
into either an exudate or a background region. In the proposed system, the global
thresholding or fixed thresholding is implemented, as it is one of the more popular
methods. In global thresholding, the threshold value, T, is held constant throughout the
image. Choosing a correct threshold value is quite challenging and it is important to
ensure that the chosen value is neither too low nor too high. In order to find a suitable
threshold value for this system development, software termed ImageJ (ImageJ, 2014) is
used (through using the thresholding slider bar from the Adjust Threshold menu). From
the observations and the threshold value found during the searching process, it is
concluded that a value of 135 is the most appropriate in order to segment both the
exudate regions and the background of the fundus images, obtained after the fuzzy
histogram equalisation task. In addition to global thresholding, Fuzzy C-Means (FCM)
clustering can also be implemented in the system for detecting exudates. Morphological
operations can also be used for the extraction of exudates. The image after the optic disc
localisation and the segmentation of the blood vessels is then generated for the feature
extraction task, which will later be converted into a binary image in order to extract the
features of the exudates. After the detection of the exudates, the maculopathy can be
identified by cropping the area around the macula region. Figure 4.24(a) shows the
exudates extraction with the optic disc overlay, while Figure 4.24(b) shows the
maculopathy output within the proposed macula region.

130
Figure 4.24 Exudates and maculopathy extraction output image
4.3.2.4 Features Extraction
After performing the preprocessing techniques, the retinal structure extraction and also
the exudates detection, feature extraction then takes place in order to obtain the features
from the given images. There are three features selected from the exudates output image
and macula image, respectively. They are the area of on pixels, the mean of on pixels
and the standard deviation of the on pixels for the exudates region. In addition, there are
another three features from the maculopathy region, i.e., the area of on pixels, the mean
of on pixels and the standard deviation of the on pixels for the maculopathy. These
shape-values are chosen as they are suitable for representing the exudate and
maculopathy regions. Since the pre-processing techniques are performed after the
conversion of colour fundus images into the green channel, it can be concluded that the
system also investigated the capability of the colour-based features as well. The
difference between the mean pixel values for the exudate and maculopathy regions and
between the standard deviations of pixel values for the exudate and maculopathy
regions are explored. The features between the exudates region and the maculopathy
region are then compared. The value of the exudates area is higher compared to the area
of the maculopathy value as the maculopathy is located around the macula, and the
diameter of the macula is small.
(a) Exudates detection (b) Maculopathy detection
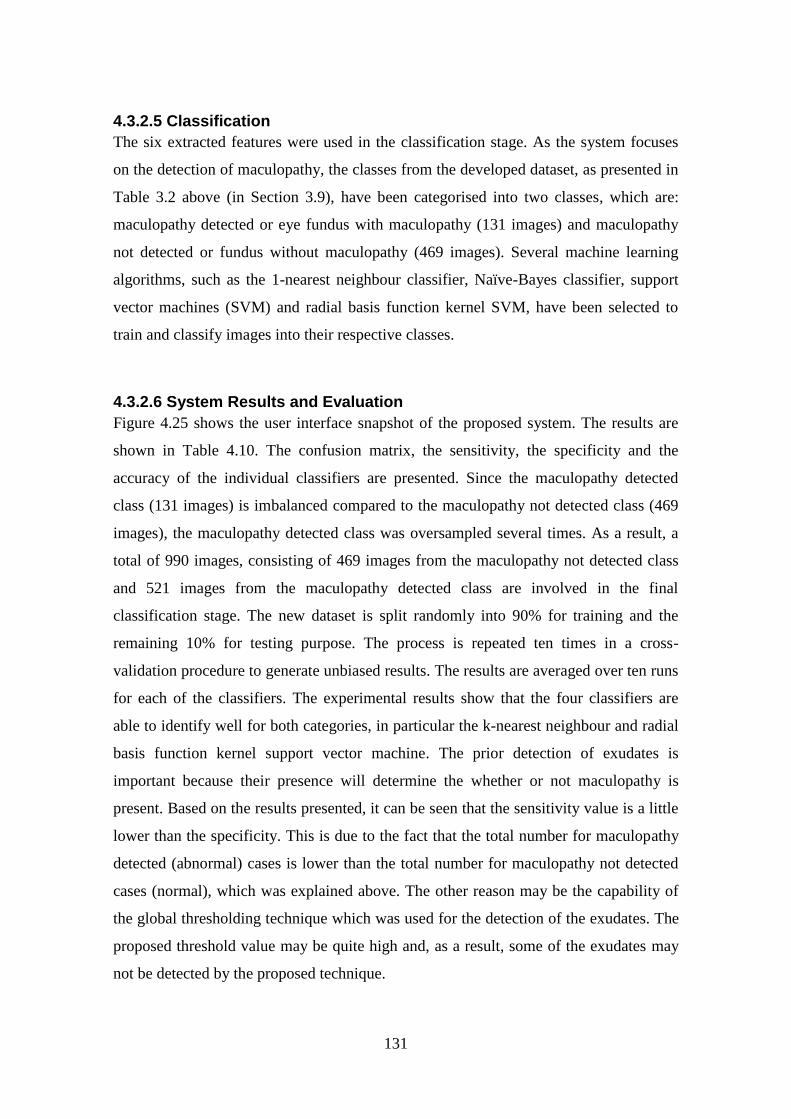
131
4.3.2.5 Classification
The six extracted features were used in the classification stage. As the system focuses
on the detection of maculopathy, the classes from the developed dataset, as presented in
Table 3.2 above (in Section 3.9), have been categorised into two classes, which are:
maculopathy detected or eye fundus with maculopathy (131 images) and maculopathy
not detected or fundus without maculopathy (469 images). Several machine learning
algorithms, such as the 1-nearest neighbour classifier, Naïve-Bayes classifier, support
vector machines (SVM) and radial basis function kernel SVM, have been selected to
train and classify images into their respective classes.
4.3.2.6 System Results and Evaluation
Figure 4.25 shows the user interface snapshot of the proposed system. The results are
shown in Table 4.10. The confusion matrix, the sensitivity, the specificity and the
accuracy of the individual classifiers are presented. Since the maculopathy detected
class (131 images) is imbalanced compared to the maculopathy not detected class (469
images), the maculopathy detected class was oversampled several times. As a result, a
total of 990 images, consisting of 469 images from the maculopathy not detected class
and 521 images from the maculopathy detected class are involved in the final
classification stage. The new dataset is split randomly into 90% for training and the
remaining 10% for testing purpose. The process is repeated ten times in a cross-
validation procedure to generate unbiased results. The results are averaged over ten runs
for each of the classifiers. The experimental results show that the four classifiers are
able to identify well for both categories, in particular the k-nearest neighbour and radial
basis function kernel support vector machine. The prior detection of exudates is
important because their presence will determine the whether or not maculopathy is
present. Based on the results presented, it can be seen that the sensitivity value is a little
lower than the specificity. This is due to the fact that the total number for maculopathy
detected (abnormal) cases is lower than the total number for maculopathy not detected
cases (normal), which was explained above. The other reason may be the capability of
the global thresholding technique which was used for the detection of the exudates. The
proposed threshold value may be quite high and, as a result, some of the exudates may
not be detected by the proposed technique.

132
Figure 4.25 Snapshot of the proposed system user interface
Table 4.10 Average results when using the four classifiers
k-nearest
neighbour
Polynomial
Kernel
SVM
RBF Kernel
SVM
Naïve-Bayes
Misclassification error 0.0700 0.3000 0.0700 0.2500
Accuracy 0.9300 0.7000 0.9300 0.7500
Specificity 1.0000 0.9787 0.9362 0.9149
Sensitivity 0.8679 0.4528 0.9245 0.6038
4.4 Summary A preliminary system for the detection of diabetic retinopathy using a combination of
non-fuzzy techniques is presented in System I. Several individual systems for the
automatic detection of microaneurysms in colour fundus images for diabetic retinopathy
screening are also presented in Systems II to V. System II highlights the automatic
detection of microaneurysms in colour fundus images using segmentation and feature
extraction. Two subsystems for an automatic detection of microaneurysms in colour

133
fundus images using the Circular Hough Transform method for the localisation of
microaneurysms have been proposed, due to the capability of the proposed method to
detect circular shapes. The first subsystem proposed a combination of image processing
techniques and Circular Hough Transform, while the second subsystem presented the
detection of microaneurysms using fuzzy image processing. The first system, which
applies a non-fuzzy technique for image preprocessing is compared to the second
system, which implements a fuzzy image preprocessing technique. Based on the results
obtained, it was concluded that the implementation of fuzzy preprocessing techniques
provides better contrast enhancement for fundus images and in addition it can greatly
assist in detecting microaneurysms. Due to promising results in the implementation of
the fuzzy histogram equalisation technique for the detection of microaneurysms, the
development of the microaneurysms detection system has been enhanced by developing
a new dataset and using other fuzzy techniques for image preprocessing.
The implementation of separate fuzzy filtering and fuzzy edge detection, in addition to
the fuzzy histogram equalisation (as discussed previously), has been proposed for the
automatic detection of microaneurysms in System V. The fuzzy techniques work better
for both fuzzy histogram equalisation and fuzzy edge detection. The analysis shows that
the implementation of the fuzzy preprocessing techniques give better contrast
enhancement in addition to other improvements, such as brightness, and improved
segmentation for fundus images. The use of fuzzy image processing techniques plays an
important role in producing better image quality and improved performance analysis. In
addition, the capability of a combination of different fuzzy image processing techniques
for the detection of diabetic retinopathy and maculopathy in eye fundus images is
investigated in System VI. The proposed system implements a combination of fuzzy
techniques for image preprocessing, which combine fuzzy filtering, followed by the
fuzzy histogram equalisation and fuzzy edge detection. The system then classified
images into two classes including ten additional classes, which provide more detail
about the stages of the disease. The results show better identification of diabetic
retinopathy cases from the two-class-classifiers compared to the ten classes’ case. In
addition, the results show that maculopathy can be seen clearly from the generated
output image. Finally, System VII proposed a novel combination of fuzzy image

134
preprocessing techniques including the localisation of retinal structures (i.e., for the
optic disc, the blood vessels, the macula and the fovea), followed by feature extraction
and, finally, classification with some machine learning algorithms. To conclude, the use
of fuzzy image processing together with retinal structure extraction can help produce a
more reliable screening system for diabetic retinopathy.
Several methods and techniques of image processing were implemented to develop the
diabetic retinopathy screening system, which were presented and contrasted in the
sections above. Different techniques have been implemented for the proposed system in
order to either detect general retinopathy signs (i.e., whether retinopathy is present or
not), or more specific signs of retinopathy, such as microaneurysms, or maculopathy.
Although detection using colour fundus images was challenging, the proposed
techniques were able to improve the image contrast and eventually improve the
performance of the system. In addition, different public data sets have been used, which
contained a variety of colour fundus images. A good quality of available fundus images
can help in the process of the localisation and detection of the signs of retinopathy.

135
5 OVERALL RESULTS ANALYSIS AND DISCUSSION
This research has explored the development of the automatic systems for screening and
classification of diabetic retinopathy. Several systems have been successfully
developed, which contribute to achieve the objectives of this research. In order to
develop the system, eye fundus images are vital as an input. Therefore, sufficient good
quality images are required for both the development and the system performance. A
thorough system analysis and performance of the developed systems, alongside the
novel dataset analysis were presented.
This chapter presents the analysis of the results involving the data and the developed
systems. Section 5.1 discusses the analysis performed on the experts’ diagnosis as a
ground truth, including the descriptive and inferential analysis. The analysis of the
developed systems is presented in Section 5.2, which consists of two types of analysis,
namely the confusion matrix and statistical analysis. Meanwhile, Section 5.3 explains
some important points for further discussion based on the research findings. Finally,
Section 5.4 presents the summary of the chapter.
5.1 Developed Data Set Analysis As presented in Section 3.9, 600 fundus images from 300 patients were selected
together with the provided ground truth by the three experts from the Ophthalmology
Department, Melaka Hospital, Malaysia. The images were classified into ten
retinopathy stages, where the average from the three experts’ findings was used as the
final number of images for each stage. The first stage, which is normal (no retinopathy),
contributes the greatest number of 276 images. The abnormal or diabetic retinopathy
(DR) stage is divided into nine other stages: mild DR without maculopathy (72), mild
DR with maculopathy (27), moderate DR without maculopathy (85), moderate DR with
maculopathy (83), severe DR without maculopathy (23), severe DR with maculopathy
(11), proliferative DR without maculopathy (6), proliferative DR with maculopathy (10)
and finally, advanced diabetic eye disease, ADED (7).

136
The ground truth delivered by the experts can be placed into four categories. Table 5.1
shows the variety of the categorisation which can be used for system testing. The first
categorisation is the original classification made by the experts, which divides into ten
stages of retinopathy. The second categorisation divides into two cases, which are “no
diabetic retinopathy” and “diabetic retinopathy”. Meanwhile, the third categorisation
consists of four cases involving stages of no diabetic retinopathy, non-proliferative
diabetic retinopathy (mild, moderate and severe cases), proliferative diabetic
retinopathy and finally advanced diabetic eye disease. The fourth categorisation is based
on maculopathy detection, which classifies into two cases, namely maculopathy
detected and maculopathy not detected.
Table 5.1 Expert diagnosis summary categorisation
Categorisation I Categorisation II
Retinopathy Stage No. of
Images
Retinopathy Stage No. of
Images
No DR 276 No DR 276
Mild DR without maculopathy 72 DR 324
Mild DR with maculopathy 27
Moderate DR without maculopathy 85
Moderate DR with maculopathy 83
Severe DR without maculopathy 23
Severe DR with maculopathy 11
PDR without maculopathy 6
PDR with maculopathy 10
ADED 7
Total 600 600
Categorisation III Categorisation IV
Retinopathy Stage No. of
Images
Retinopathy Stage No. of
Images
No DR 276 Maculopathy detected 131
Non-Proliferative DR 301 Maculopathy not detected 469
Proliferative DR 16
ADED 7
Total 600 600
Based on the ground truth provided by the experts, several descriptive and inferential
analysis tasks using the SPSS statistical package were performed.

137
i. Boxplot
The boxplot is the first method of assessment performed for our analysis. It is a useful
visualisation of how the data is distributed. In addition, the boxplot is able to display the
distribution of the variable scale and the pinpointing of the outliers. Moreover, the
boxplot shows five statistics, which are the minimum, the first quartile, the median, the
third quartile and the maximum value. Figure 5.1 shows the representation of the
boxplot performed on the ground truth, which involves a total of 1,800 images, i.e., 600
from each expert. It shows that for the first expert, there are several outliers, i.e., the
extreme values, which do not fall within the inner fences. The outliers mean that these
values are not frequent, particularly for the first expert, and that most of the time, these
values are not within the normal range. Meanwhile, the dark line shows the median,
which is the measure of the central tendency. It shows that for the first and third experts,
the median value is 1 (no diabetic retinopathy), while for the second expert the median
generated is 2 (mild diabetic retinopathy without maculopathy). The boxplot also shows
the 25th
percentile, representing 25% of cases or rows that have values below the 25th
percentile, in addition to the 50% of the cases or rows that lie both within the box and
the 75th
percentile.
Figure 5.1 Boxplot assessment

138
ii. Histogram
A histogram is an alternative for a descriptive analysis that can be performed for this
application. It is a visual summary of the distribution of values and it is useful for
showing the distribution of a single scale variable. Figure 5.2 shows the representation
of a histogram, where the 1,800 images, i.e., 600 images from each expert (600 images
from the first expert, 600 images from the second expert and another 600 images from
the third expert) are placed into the ten retinopathy stages. It shows that the majority of
the images are classified in the first stage, which is the “no retinopathy” stage, followed
by the fifth stage which is “moderate diabetic retinopathy with maculopathy”. The
histogram also generated the mean (2.83) and the standard deviation (2.269) for the
1,800 images used for the ground truth.
Figure 5.2 Histogram assessment

139
iii. Oneway ANOVA
The analysis of variance or the ANOVA test is an inferential analysis that can be
performed on the expert diagnosis ground truth. The test produces a one-way analysis of
variance for a quantitative dependent variable by a single factor or independent variable.
The analysis of variance is used to test the hypothesis that several means are equal. The
test generated shows a p-value of 0.000. The post-hoc test is then performed to
determine which means are different. Table 5.2 presents the output of the post-hoc test,
showing the multiple comparisons of the experts’ means. It can be concluded from
Table 5.2, that there are differences between the first expert and the second and third
expert, however there is also similarity between the second and the third expert.
Table 5.2 ANOVA multiple comparisons
iv. Chi-Square
The Chi-square test tabulates a variable into categories and computes a Chi-square
statistic. It compares the observed and expected frequencies in each category in order to
test whether or not all categories contain the same proportion of values. It can also test
that each category contains a user-specified proportion of values. In this case, the Chi-
square is useful for determining if there is a relationship among the experts. Table 5.3
shows the cross tabulation results of the Chi-square test. The inferential statistic with a
p-value of 0.000 indicates that there is no relationship among the three experts. Table
5.3 represents the number of images in each category for the three experts alongside the
percentage within the method of assessment (expert). The given percentage is calculated
by dividing the count for each of the retinopathy stages with the total numbers of
images for each expert – a total of 600 images. It can be seen that the distribution of
counts and percentages for each expert for no diabetic retinopathy stage is not
Method of Assessment p-value
Expert 1 Expert 2 0.001
Expert 3 0.001
Expert 2 Expert 1 0.001
Expert 3 1.000
Expert 3 Expert 1 0.001
Expert 2 1.000

140
significantly different. However, for mild diabetic retinopathy without maculopathy
stage for example, the count and percentage for the third expert (14, 2.3%) show a
significant difference compared to the first expert (55, 9.2%) and the second expert (58,
9.7%).
Table 5.3 Chi-square analysis
Results Method of Assessment
Expert 1 Expert 2 Expert 3
Count % Count % Count %
No DR 326 54.3 267 44.5 314 52.3
Mild DR without maculopathy 55 9.2 58 9.7 14 2.3
Mild DR with maculopathy 21 3.5 12 2.0 31 5.2
Moderate DR without maculopathy 79 13.2 90 15.0 43 7.2
Moderate DR with maculopathy 90 15.0 127 21.2 143 23.8
Severe DR without maculopathy 5 0.8 6 1.0 0 0.0
Severe DR with maculopathy 3 0.5 6 1.0 19 3.2
PDR without maculopathy 6 1.0 9 1.5 2 0.3
PDR with maculopathy 8 1.3 20 3.3 25 4.2
ADED 7 1.2 5 0.8 9 1.5
Total 600 100 600 100 600 100
p-value 0.000
5.2 System Results Analysis The results of the developed systems testing can be categorised into two types of
analysis. A confusion matrix (contingency table) is used to define the classification
model performance of test data. Meanwhile the statistical test is useful in providing a
mechanism for making quantitative decisions about a process or processes.
5.2.1 Confusion Matrix
The confusion matrix is chosen as a way to represent the results to analyse the
capability of the proposed system. The confusion matrix consists of information about
the actual and predicted classifications, namely, true positives, false negatives, false
positives and true negatives, which were explained earlier in Section 3.6 above. These
values will contribute to the calculation of the sensitivity (percentage of abnormal
fundus images classified as abnormal), specificity (percentage of normal fundus images
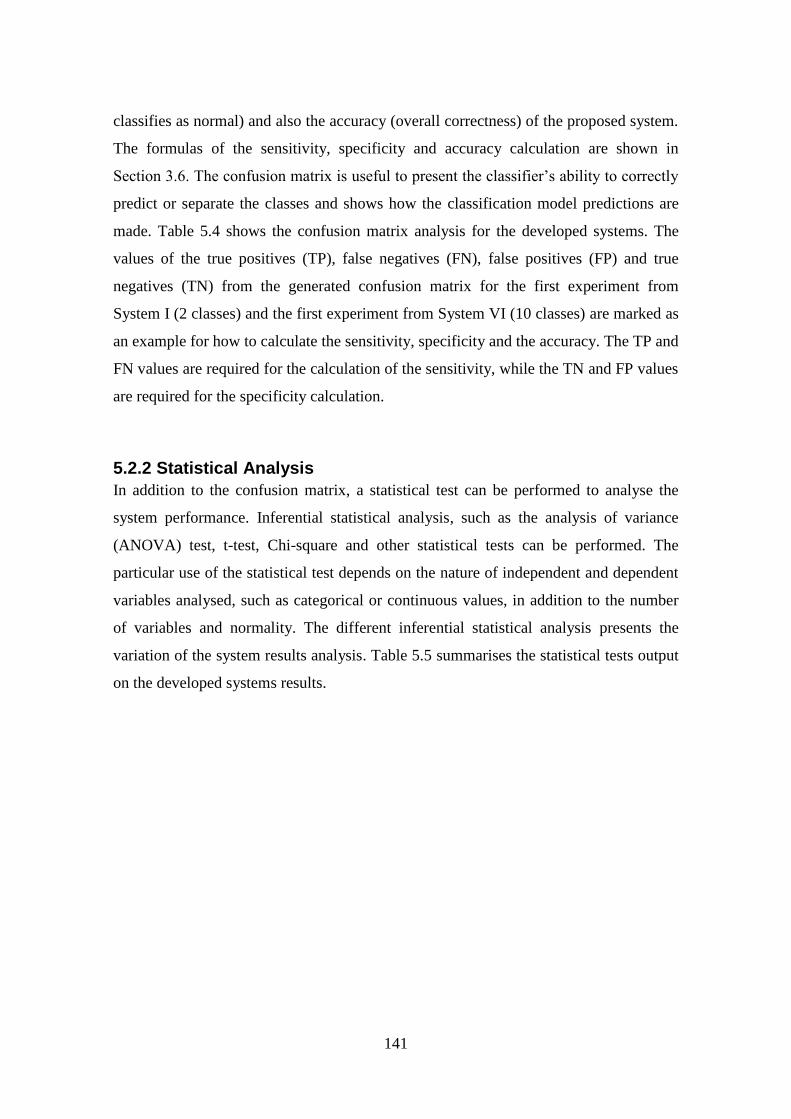
141
classifies as normal) and also the accuracy (overall correctness) of the proposed system.
The formulas of the sensitivity, specificity and accuracy calculation are shown in
Section 3.6. The confusion matrix is useful to present the classifier’s ability to correctly
predict or separate the classes and shows how the classification model predictions are
made. Table 5.4 shows the confusion matrix analysis for the developed systems. The
values of the true positives (TP), false negatives (FN), false positives (FP) and true
negatives (TN) from the generated confusion matrix for the first experiment from
System I (2 classes) and the first experiment from System VI (10 classes) are marked as
an example for how to calculate the sensitivity, specificity and the accuracy. The TP and
FN values are required for the calculation of the sensitivity, while the TN and FP values
are required for the specificity calculation.
5.2.2 Statistical Analysis
In addition to the confusion matrix, a statistical test can be performed to analyse the
system performance. Inferential statistical analysis, such as the analysis of variance
(ANOVA) test, t-test, Chi-square and other statistical tests can be performed. The
particular use of the statistical test depends on the nature of independent and dependent
variables analysed, such as categorical or continuous values, in addition to the number
of variables and normality. The different inferential statistical analysis presents the
variation of the system results analysis. Table 5.5 summarises the statistical tests output
on the developed systems results.


146
Overall, there are seven systems developed for the detection of diabetic retinopathy,
comprising one system for its general detection, four systems for the detection of
microaneurysms and finally, two systems for the detection of maculopathy. Figure 5.3
represents the workflow of all the developed systems, which provides better
visualisation and understanding about the developed systems proposed in this research
work. Firstly, a basic system for the detection of diabetic retinopathy using a
combination of non-fuzzy techniques is proposed. Next, four individual systems for the
automatic detection of microaneurysms in colour fundus images for diabetic retinopathy
screening are developed. The first system highlights the automatic detection of
microaneurysms in colour fundus images using segmentation and feature extraction.
Later, two subsystems for the automatic detection of microaneurysms in colour fundus
images using the Circular Hough Transform method for the localisation of
microaneurysms are proposed, due to the ability of the proposed method to detect
circular shapes. The first subsystem proposed a combination of image processing
techniques and Circular Hough Transform, while the second subsystem presented the
detection of microaneurysms using fuzzy image processing. The first subsystem, which
applies a non-fuzzy technique for image preprocessing, is compared to the second
system, which implements a fuzzy image preprocessing technique. Due to the promising
results in the implementation of the fuzzy histogram equalisation technique in the
detection of microaneurysms, the development of the microaneurysms detection system
is further enhanced by applying other fuzzy techniques in the image preprocessing of a
new dataset developed at Melaka Hospital. The implementation of fuzzy filtering and
fuzzy edge detection separately, in addition to the fuzzy histogram equalisation as
mentioned above, are proposed for the automatic detection of microaneurysms. The
capabilities of a combination of different fuzzy image processing techniques for the
detection of diabetic retinopathy and maculopathy in eye fundus images was
investigated (in System VI and System VII), where the proposed system implemented a
combination of fuzzy techniques in image preprocessing, which combine fuzzy filtering,
followed by the fuzzy histogram equalisation and fuzzy edge detection. The final
system proposed a combination of fuzzy techniques for image preprocessing, in
addition to the localisation and detection of four retinal structures, which are the optic
disc, the blood vessels, the macula and the fovea.

148
5.3 Discussion
The findings of this study, pertaining to the development of the effective diabetic
retinopathy automatic screening and classification using eye fundus images show, some
common issues:
i. Imbalanced dataset
A balanced dataset is an advantage for the purpose of classification. In the field of
medical imaging however, it is difficult to achieve such a balanced dataset as there are
not usually a large number of normal cases. This limitation therefore presents problems
in the classification phase. For diabetic retinopathy diagnosis, this problem of imbalance
also occurs in the available public databases, as stated in Section 3.8. For example, the
popular dataset Standard Diabetic Retinopathy Database Calibration Level 0
(DIARETDB0), offers only 20 normal images compared to 110 images with signs of
diabetic retinopathy. Meanwhile, the Standard Diabetic Retinopathy Database
Calibration Level 1 (DIARETDB1) consists of only five normal images while the
remaining 84 images are diabetic retinopathy case. In order to overcome this limitation,
duplication is required, where the minority class is oversampled several times in order
to avoid the imbalance problem. The ensemble of classifiers is another solution that can
overcome the imbalanced dataset limitation.
As presented in this research work, a new dataset was introduced. The new dataset
managed to overcome this imbalanced data problem, in that it provides 276 normal
images and 324 diabetic retinopathy images; almost a balanced total number of No
DR/Normal and DR/Abnormal images. However, the imbalance problem still occurs
when dealing with the more detailed categorisation, which classifies data into ten cases
(no retinopathy, mild DR without maculopathy, mild DR with maculopathy, moderate
DR without maculopathy, moderate DR with maculopathy, severe DR without
maculopathy, severe DR with maculopathy, proliferative DR without maculopathy,
proliferative DR with maculopathy and advanced diabetic eye disease). The total
numbers of severe and proliferative cases are significantly imbalanced due to the fact
that in severe cases, the patient will be referred directly for laser treatment rather than

149
for the capturing of their fundus images. Another reason is that diabetic retinopathy
takes a long time to progress to the severe stage of diabetes mellitus.
ii. Detection of exudates
As presented in Section 4.3 the localisation of exudates are important aspects to be
considered for detecting maculopathy. The detection of maculopathy is based on the
exudates finding, due to the fact that the maculopathy represents the exudates found in
the macula region. Therefore, the detection of exudates, as an input, is vital to ensure
the efficient detection of maculopathy. In addition, the fovea and the region of macula
detection is another important aspect that should be accounted for.
The research work implemented a thresholding method to detect the exudate lesions in
System VII. Since maculopathy detection depends on the successful location of
exudates, a precise exudate detection method is required. The proposed threshold values
used for the global thresholding should be both suitable and applicable to all the tested
images, as each image consists of different contrast values. An inappropriate threshold
value will result in a poor detection rate for exudates.
iii. Fuzzy techniques combination capability
Several fuzzy techniques have been implemented in the research work used for the
automatic screening and classification of diabetic retinopathy. Among the proposed
fuzzy techniques are the fuzzy histogram equalisation, fuzzy filtering and fuzzy edge
detection. Fuzzy median filtering was proved not to work well individually in the
detection of microaneurysms in System V(c). Fuzzy histogram and fuzzy edge detection
however were proved to work well individually in System V(b) and System V(d),
respectively.
On the other hand, the fuzzy median filter was working well with the combination of
other fuzzy techniques, such as the fuzzy histogram equalisation and fuzzy edge
detection. These combinations of fuzzy techniques were working well for the detection
of diabetic retinopathy and maculopathy as presented in System VI. Other fuzzy
filtering techniques should also be proposed and investigated in order to overcome the

150
limitations of the Noise Adaptive Fuzzy Switching Median (NAFSM) filter, which was
used in the proposed system.
iv. Variety of diabetic retinopathy categorisation
It can be seen that for the diabetic retinopathy and maculopathy detection, there are two
types of classification involved. The first categorisation is based on two cases, which
are termed “normal” and “diabetic retinopathy”. The second categorisation is more
detailed compared to the first as it consists of ten cases, i.e., No Diabetic Retinopathy
(DR) and the other nine detailed cases of diabetic retinopathy: Mild DR without
maculopathy, Mild DR with maculopathy, Moderate DR without maculopathy,
Moderate DR with maculopathy, Severe DR without maculopathy, Severe DR with
maculopathy, Proliferative DR without maculopathy, Proliferative DR with
maculopathy and Advanced Diabetic Eye Disease (ADED). These two types of
categorisation offer a variety of results and performance analysis of the system.
The most important reason for implementing the second categorisation (the ten cases) is
in order to follow the current practice observed by ophthalmologists in the diabetic
retinopathy and maculopathy classification and grading. This detailed categorisation has
been acknowledged by the experts during the data collection and the ground truth
preparation process.
v. Variety of system configurations
A variety of system configurations have been presented in this research work, which
aim to develop an automatic screening and classification system for diabetic
retinopathy, in order to reduce the workload for the screening team. It can be concluded
therefore that all the proposed systems are related. The research work began with the
preliminary system for automatic screening and the classification of diabetic retinopathy
using fundus images. The research work continued with the detection of one of the
diabetic retinopathy important features, which are microaneurysms. Since the detection
of maculopathy is vital for the urgency of referral, the research work has continued with
the detection of diabetic retinopathy and maculopathy based on current practice for

151
ophthalmologists. The earlier proposed techniques are reused for the following system
configurations due to their good performance.
Other researchers focus on the maculopathy detection on the eye fundus images and
suggest several solutions. They have proposed a variety of ways to detect and classify
the fundus images into different stages of maculopathy, such as mild, moderate and
severe maculopathy. However, this research work presented different mechanisms of
maculopathy detection based on ophthalmologists’ practice, which combine the
detection of both diabetic retinopathy and maculopathy, based on the discovery of
diabetic retinopathy signs. The severity level is based on the diabetic retinopathy
features, rather than the severity of the maculopathy. The classification refers to whether
maculopathy is present (with maculopathy) or not (without maculopathy). As a result,
the generated cases are: No Diabetic Retinopathy (DR), Mild DR with/without
maculopathy, Moderate DR with/without maculopathy, Severe DR with/without
maculopathy, Proliferative DR with/without maculopathy and Advanced Diabetic Eye
Disease (ADED). This categorisation is useful as two important aspects can be detected
in just one screening process. Moreover, the urgency of the referral which should
happen within four weeks, as presented in Table 2.14 by the National Institute for
Clinical Excellence, is applied to those who have any form of maculopathy, whether
mild, moderate or severe. The severity of the maculopathy is therefore not significant in
this case, provided that its presence or absence has been determined.
5.4 Summary
To conclude, this chapter has discussed the analysis performed on the developed data.
The overall analyses of the developed systems are also presented. Various techniques
can be used to analyse the data. The confusion matrix is one of the ways to represent the
performance of the classification task. It would also be useful to determine the
performance of the screening system. In addition, statistical analysis is an alternative
way to represent the relationship and capability of the data and the proposed system
results. The chapter also presented some common issues resulting from the findings of
the research.

152
6 CONCLUSIONS AND FUTURE WORK
The development of an automatic diabetic retinopathy screening system is a very
challenging task. The system development involves not only an advanced understanding
of image processing procedures, but also requires essential medical input, including
expert knowledge related to diabetic retinopathy and its screening procedure, in addition
to the eye fundus photography process. Efficient and cost-effective approaches in the
field of digital retinal imaging should be established. Diabetic retinopathy and
maculopathy screening is necessary to identify persons at risk of visual impairment.
Effective screening of diabetic retinopathy therefore is vital for early action, alongside
an effective diabetic complications preventive management.
This chapter concludes the thesis and provides a summary of the research. Section 6.1
reviews the performance of the research work, discusses the research contribution and
further reiterates the advancement offered by this thesis. Section 6.2 presents
suggestions for future research work that can provide further improvements in the field,
in addition to directions for such future research studies. Finally, Section 6.3
summarises and concludes this chapter.
6.1 Review of the Work and Contributions
The automatic grading of diabetic retinopathy is a rising research field aimed to
decrease the workload inherent in the conventional grading process. An automatic
diabetic retinopathy system would enable faster and more efficient diagnosis. Moreover,
preventive action to protect vision can be taken earlier. The output results generated
from the research work have answered the primary research aim detailed in Chapter 1,
where the computer-based imaging tool developed through this research has proven to
be effective in detecting important diagnostic features and classifying individuals into
the correct retinopathy stage.
The research main objective was to develop an automatic system for the diabetic
retinopathy detection and to classify images into retinopathy stages, based on diabetic

153
retinopathy severity standard. In order to achieve this, the research can be summarised
as follows:
i. The development of an automatic diabetic retinopathy screening system for
general detection
ii. The development of an automatic microaneurysms detection system, the first
important signs of diabetic retinopathy.
iii. The development of an automatic diabetic retinopathy and diabetic
maculopathy detection systems.
The introductory chapter of the thesis highlighted the issues of diabetic retinopathy
screening globally and in Malaysia in particular. Based on the objectives previously
presented, the following represent the undertakings and the main contributions of this
research:
The research developed several systems for the automatic diabetic
retinopathy detection, in addition to the identification of features of diabetic
retinopathy and maculopathy lesions (Rahim et al., 2014; 2015a; 2015b;
2015c; 2016)
The developments of the system introduced novel use of image processing
techniques for the fundus images handling in the screening process of
diabetic retinopathy (Rahim et al., 2014; 2015a; 2015b; 2015c; 2016)
A new dataset of fundus images was developed, as an input for the research
development, which is not only beneficial in the screening of diabetic
retinopathy process, but for other retinal disease screenings, such as
cataracts, glaucoma and hypertensive retinopathy among others. The new
dataset is available at http://creative.coventry.ac.uk/fundus (Rahim et al.,
2015b; 2015c; 2016)
A thorough system performance analysis was undertaken, which compared
the performance of automatic systems to the manual diagnosis performed by
the expert
154
Based on the proposed techniques and system configurations, the research
designed a complete process for the automatic diabetic retinopathy
screening, where the proposed system development framework can also be
implemented for the automatic detection of other retinal diseases with only
slightly different features involved
The research developed several automatic detection systems for the
microaneurysms, the earliest visible and most important sign of diabetic
retinopathy (Rahim et al., 2015a; 2015b)
The development of the systems employed fuzzy image processing
techniques as a core contribution to the performance of the research work
(Rahim et al., 2015a; 2015b; 2015c; 2016)
Results from this research will benefit a number of areas; most notably, it will
significantly improve the detectability of human eye diabetic retinopathy. Preventative
action therefore can be taken to decrease the rates of diabetic retinopathy problems, in
addition to the blindness risk. It also aims to assist clinicians to diagnose diabetic
retinopathy at an early stage by using the developed detection techniques. The decision
support system for clinical diagnosis would contribute greatly in assisting with the
management and detection of diabetic retinopathy. The automated system will assist an
ophthalmologist (or optometrist) to detect diabetic retinopathy (and its detailed
classification) in a more efficient and faster way, compared to manual analysis. In
addition to the classification of diabetic retinopathy, the system will indirectly assist in
the provision of recommended follow-up schedules and treatment for each category of
diabetic retinopathy, based on the generated classification. The crucial aim of diabetic
retinopathy is to identify any sight threatening conditions and to make sure prompt
treatment in order to avoid vision loss. Such appropriate ophthalmologist referrals
should therefore be facilitated with the adoption of this system.
Moreover, this research provides a significant contribution to knowledge in the area of
medical image processing. This is achieved by proposing a novel use of image
processing techniques in diabetic retinopathy screening, as listed in Chapter 1 and above
in this chapter. The research proposes the image processing techniques combination for
155
the general diabetic retinopathy detection (System I). In addition, the research proposed
a fuzzy technique-based eye screening system to detect the microaneurysms (System II,
System III, System IV and System VI), one of the most important diabetic retinopathy
signs. The developed system for the detection of microaneurysms could be a benchmark
for the detection of other diabetic retinopathy signs development systems, such as
exudates, haemorrhages and neovascularisation. Furthermore, the research presents a
novel automatic diabetic retinopathy and maculopathy detection in retinal images using
fuzzy image processing (System VI and System VII), which classifies retinopathy into
stages based on the actual practice of the screening team (i.e., drawing from
conventional practices). The proposed fuzzy-based image processing decision support
system will help the screening of diabetic retinopathy and decrease the workload of the
screening personnel.
The development of an online novel dataset, which consists of 600 colour fundus
images, alongside expert diagnosis is another important contribution of the research
(System V, System VI and System VII). The normal and diabetic retinopathy fundus
images combination from a new dataset representing the South East Asian population,
in particular the Malaysian demographic, was a major part of this research work. One
significant attribute of the dataset is that unlike other publicly available datasets, it
represents the Asian population, as large numbers of such data are uncommon. The
developed dataset is useful for researchers in promoting research on the area of retinal-
imaging, particularly in the field of diabetic retinopathy screening.
6.2 Future Work As highlighted in an earlier section, the research work has produced several novelties
that were embedded in the variants of the developed systems. Despite the fact that the
promising results in the several techniques implementation showed in the this study, it
is important to state that there is still room for improvement and some new directions
for future research are listed below.

156
i. Combination of diabetic retinopathy features detection
Diabetic retinopathy screening is a complicated process, as there are various signs of
that need to be identified and detected in order to achieve a complete screening system.
This research study however, concentrated on microaneurysms, the earliest and the most
important diabetic retinopathy signs. Other important diabetic retinopathy features, such
as exudates, haemorrhages, cotton wool spots and neovascularisation also need to be
identified, according to the standard clinical severity scales for diabetic retinopathy. For
each of the diabetic retinopathy features listed above, novel use of techniques should be
proposed for their effective detection. In addition to these features, there are some
exclusion criteria that need to be considered for the task of diabetic retinopathy
detection, for example polyps, bleeding and drusen. The combination of all these
features of diabetic retinopathy into a single system will provide a complete automatic
diabetic retinopathy detection system. The diabetic retinopathy screening process has
immense scope because it involves many features and criteria that need to be taken into
account. The research can be extended to identify the other remaining diabetic
retinopathy features and combine them into a complete screening system. A complete
and accurate system could be used to assist the team of diabetic retinopathy screening to
perform in an improved and more efficient way. As a conclusion, diabetic retinopathy
screening is not an easy task, as many criteria need to be thoroughly examined before
any diagnoses can be made.
ii. Counting constraints for microaneurysms
The counting of microaneurysms by an expert is required for a precise analysis in the
development of the system or model, in order to make a comparison between the system
results and the system counting. The number of microaneurysms given by the expert for
the novel developed dataset is required as an input for the statistical tests, for example
the T-test and Chi-square test. However, according to the expert from the Department of
Ophthalmology, Melaka Hospital, Malaysia, the microaneurysms counting is almost
impossible due to the following constraints. For example, if microaneurysms are
present, they are numerous in number and the counting would no longer be accurate.
This is further complicated when there is some overlapping among the microaneurysms.
Furthermore, another constraint is the fact that microaneurysms could be easily

157
confused with blot haemorrhages of about the same size. A solution would be to group
the microaneurysms into two main classifications, which are “No” for microaneurysms
not detected and “Yes” for microaneurysms detected. For the “Yes” choice, would be
another three sub-choices, i.e., “Low”, “Moderate/Medium” and “Severe”, according to
the approximate microaneurysms number estimated by the expert. If there are just a few
microaneurysms detected, then it is classified as “Low”, if there are several, it is
classified as “Moderate”, and if there are many, then the classification will be “Severe”.
The choice of these three cases is dependent on the threshold value for each class which
can be fixed in advance. Based on the three sub-choices of microaneurysms detected,
fuzzy logic may be used. This approach is an alternative to overcome the constraints to
the accurate counting of microaneurysms. It can be applied to a novel developed
dataset, that can in turn be proposed for future use of an automatic microaneurysms
detection system development.
iii. Combination of other fuzzy image processing techniques
In addition to the proposed techniques of image processing, the research can be
improved by the implementation of other different preprocessing techniques
combinations, including those based on fuzzy approaches. The fuzzy image processing
can be applied to fully explore the variety of fuzzy techniques capabilities. In order to
produce a more reliable screening system, fuzzy image processing in addition to the
extraction of retinal structure can be employed in diabetic retinopathy screening. An
alternative technique for the future detection of optic disc, Fuzzy Circular Hough
Transform, will be implemented.
iv. Widely accessible developed dataset
The research is not merely proposing an automatic diabetic retinopathy screening
detection system, but has also introduced a new dataset of eye fundus images. The new
dataset would be beneficial to researchers and practitioners working in the retinal
imaging area, especially the diabetic retinopathy screening field. For future work, the
online dataset can be made more widely accessible by integrating the dataset with other
popular databases, for example the University of California Irvine (UCI) Machine
Learning Repository, among others.

158
6.3 Summary One of the main health threats is diabetes mellitus, as it leads to a severe and enduring
complications, as well as sight-threatening conditions. Diabetic retinopathy is a diabetes
complication that affects the blood vessels damage inside the retina. Thus, both initial
detection and timely treatment is essential for this retinal problem. Such an effective
diagnosis and the diabetic retinopathy grading can assist in early detection of diabetic
retinopathy and may decrease its prevalence. It is envisaged that a decision support
system for clinical screening would contribute to and greatly assist in the management
as well as the detection of diabetic retinopathy. It is also hoped that the developed
detection technique will assist clinicians to diagnose diabetic retinopathy at an early
stage.
This research project examined the use of fundus images and techniques of image
processing to detect the diabetic retinopathy presence in the eye. This is a particularly
challenging problem and this research has made novel use of image processing
techniques to automatically detect the retinopathy stages. Highly efficient and accurate
image processing techniques must be used in order to produce an effective diagnosis of
diabetic retinopathy. As such, this research proposed a new mechanism that could
provide ophthalmologists with a novel way to identify and treat those who are most
vulnerable to vision loss from diabetic retinopathy. Specific image processing
techniques have been proposed and developed to test the efficiency of this approach
compared to others. As a conclusion, the implementation of fuzzy image processing
techniques play a significant role in generating better quality of image and enhanced
performance. Eventually it can contribute to producing a more reliable screening
system.

REFERENCES
Abdelazeem, S. (2002) ‘Microaneurysm Detection Using Vessels Removal and Circular Hough
Transform’. in Proceedings of the Nineteenth National Radio Science Conference (NRSC 2002).
held 19-21 March 2002 at Alexandria. USA: IEEE, 421-426
Acharya, U. R., Dua, S., Du, X., Sree, V. S., and Chua, C, K. (2011) ‘Automated Diagnosis of Glaucoma
Using Texture and Higher Order Spectra Features’. IEEE Transactions on Information
Technology in Biomedicine 15 (3), 449-455
Adal, K. M., Ali, S., Sidibe, D., Karnowski, T., Chaum, E., and Meriaudeau, F. (2013) ‘Automated
Detection of Microaneurysms Using Robust Blob Descriptors’. SPIE Medical Imaging-
Computer Aided Diagnosis Feb 2013, 8670-22
Adal, K. M., Sidibe, D., Ali, S., Chaum, E., Karnowski, T, P., and Meriaudeau, F. (2014) ‘Automated
Detection of Microaneurysms Using Scale-adapted Blob Analysis and Semi-supervised
Learning’. Computer Methods and Programs in Biomedicine 114, 1-10
Addoor, K. R., Bhandary, S. V., Khanna, R., Rao, L. G., Lingam, K. D., Binu, V. S., Shivaji, S., and
Nandannaver, M. (2011) ‘Assessment of Awareness of Diabetic Retinopathy Among the
Diabetics Attending the Peripheral Diabetic Clinics in Melaka, Malaysia’. Medical Journal
Malaysia 66 (1), 48-52
Ahmad, F. M. H., Izhar, L. I., Venkatachalam, P. A., and Karunakar, T. V. (2007) ‘Extraction and
Reconstruction of Retinal Vasculature’. Journal of Medical Engineering & Technology 31 (6),
435-442
Akram, M. U., Tariq, A., Khan S. A., and Javed, M. Y. (2014) ‘Automated Detection of Exudates and
Macula for Grading of Diabetic Macular Edema’. Computer Methods and Programs in
Biomedicine 114, 141-152
Akram, M. U., Jamal, I., Tariq, A., and Imtiaz, J. (2012) ‘Automated Segmentation of Blood Vessels for
Detection of Proliferative Diabetic Retinopathy’. in Proceedings of IEEE-EMBS International
Conference on Biomedical and Health Informatics (BHI 2012), ‘Global Grand Challenge of
Health Informatics’. held 2-7 January 2012 at Hong Kong and Shenzhen, China. USA: IEEE,
232-235
Akram, M. U., Khalid, S., Tariq, A., Khan, S. A., and Azam, F. (2014) ‘Detection and Classification of
Retinal Lesions for Grading of Diabetic Retinopathy’. Computers in Biology and Medicine 45,
161-171
Akram, M. U., Khalid, S., and Khan, S. A. (2012) ‘Identification and Classification of Microaneurysms
for Early Detection of Diabetic Retinopathy’. Pattern Recognition 46, 107-116
Akram, M. U., Khalid, S., Tariq, A., and Javed, M. J. (2013) ‘Detection of Neovascularization in Retinal
Images Using Multivariate m-Mediods Based Classifier’. Computerized Medical Imaging and
Graphics 37, 346-357
This
item
has bee
n removed
due to
3rd Party Copyright. The unabridged version of the thesis can be found in
the Lancester Library, Coventr
y University.

160
Al-Diri, B., Hunter, A., Steel, D., Habib, M., Hudaib, T., and Berry, S. (2008) ‘REVIEW- A
Reference Data Set for Retinal Vessel Profiles’. in Proceedings of the 30th Annual International
Conference of the IEEE Engineering in Medicine and Biology Society, ‘Personalized Healthcare
through Technology’. held 20-24 August 2008 at Vancouver, Canada. USA: IEEE, 2262-2265
Alipour, S. H. M., Rabbani, H., and Akhlaghi, M. R. (2012) ‘Diabetic Retinopathy Grading by Digital
Curvelet Transform’. Computational and Mathematical in Medicine, 1-11
Al-Rawi, M., Qutaishat, M., and Arrar, M. (2007) ‘An Improved Matched Filter for Blood Vessel
Detection of Digital Retinal Images’. Computers in Biology and Medicine 37, 262-267
American Academy of Ophthalmology Retina Panel (2008) Preferred Practice Pattern Guidelines.
Diabetic Retinopathy. San Francisco: American Academy of Ophthalmology
Antal, B., and Hajdu, A. (2010) ‘Improving Microaneurysm Detection in Color Fundus Images by an
Optimal Combination of Preprocessing Methods and Candidate Extractions’. in Kleijn, B. (ed.)
Proceedings of the 18th European Signal Processing Conference EUSIPCO-2010’. held 23-27
August 2010 at Aalborg, Denmark. Greece: European Association for Signal, Speech and Image
Processing (EURASIP), 1224-1228
Antal, B., and Hajdu, A. (2013) ‘Improving Microaneurysm Detection in Color Fundus Images by Using
Context-aware Approaches’. Computerized Medical Imaging and Graphics 37, 403-408
Aravind, C., Ponnibala, M., and Vijayachitra, S, (2013) ‘Automatic Detection of Microaneurysms and
Classification of Diabetic Retinopathy Images Using SVM Technique’. IJCA Proceedings on
International Conference on Innovations in Intelligent Instrumentation, Optimization and
Electrical Sciences ICIIIOES (11), 18-22
Awang, Z. (2012) Research Methodology and Data Analysis. 2nd edn. Selangor: UiTM Press
Bala, M. P., and Vijayachitra, S. (2012) ‘Computerised Retinal Image Analysis to Detect and Quantify
Exudates Associated with Diabetic Retinopathy.’ International Journal of Computer
Applications 54 (2), 7-12
Bhattacherjee, A. (2012) Social Science Research: Principles, Methods and Practices. Florida: Global
Text Project
Burges, C. J. C. (1998) ‘A Tutorial on Support Vector Machines for Pattern Recognition’. Data Mining
and Knowledge Discovery 2 (2), 121-167
Centre for Eye Research Australia (2013) Diabetic Retinopathy [online] available from
<http://www.cera.org.au/uploads/pdf/FS_DR.pdf> [4 July 2013]
Chowriappa, P., Dua, S., Rajendra, A. U., and Muthu, R. K. M. (2013) ‘Ensemble Selection for Feature-
based Classification of Diabetic Maculopathy Images’. Computers in biology and medicine 2013
43 (12), 2156-2162
Creswell, J. W. (2009) Research Design Qualitative, Quantitative and Mixed Methods Approaches. 3rd
edn. United States of America: SAGE Publications, Inc
Creswell, J. W. (2012) Educational Research Planning, Conducting and Evaluating Quantitative and
Qualitative Research. 4th edn. United States of America: Pearson Education, Inc

161
Duin, R. P. W., Juszczak, P., Paclik, P., Pekalska, E., de Ridder, D., Tax, D. M. J., and Verzakov, S.
(2007) ‘PRTools4.1, A Matlab Toolbox for Pattern Recognition’. Delft University of
Technology
Early Treatment Diabetic Retinopathy Study Research Group (1991) ‘Grading Diabetic Retinopathy
From Stereoscopic Color Fundus Photographs-An Extension of the Modified Airlie House
Classification’. ETDRS report number 10. Ophthalmology 98 (5 Suppl), 786-806
Er, M. J., Wu, S., and Gao, Y. (2003) Dynamic Fuzzy Neural Networks Architecture, Algorithms and
Applications. Singapore: Mc Graw Hill Education
Esmaeili, M., Rabbani, H., Dehnavi, A. M., and Dehgani, A. (2012) ‘Automatic Detection of Exudates
And Optic Disk in Retinal Images Using Curvelet Transform’. IET Image Processing 6 (7),
1005-1013
eyeSmart (2014) What Is Diabetic Retinopathy [online] available from <http://www.geteyesmart.org/
eyesmart/diseases/diabetic-retinopathy/> [10 July 2014]
Fleming, A. D., Philip, S., Goatman, K. A., Olson, J. A., and Sharp, P. F. (2006) ‘Automated
Microaneurysm Detection Using Local Contrast Normalization and Local Vessel Detection’.
IEEE Transactions on Medical Imaging 25 (9), 1223-1232
Gardner, G. G., Keating, D., Williamson, T. H., and Elliot, A. T. (1996) ‘Automatic Detection of Diabetic
Retinopathy Using an Artificial Neural Network: A Screening Tool’. British Journal of
Ophthalmology 80, 940-944
Garud, H., Sheet, D., Suveer, A., Karri, P. K., Ray, A. K., Mahadevappa, M., and Chatterjee, J. (2011)
‘Brightness Preserving Contrast Enhancement in Digital Pathology’. in Siddavatan, R., and
Ghrera, S. P. (ed.) Proceedings of the 2011 International Conference on Image Information
Processing (ICIIP 2011). held 3-5 November 2011 at Himachal Pradesh, India. USA: IEEE, 1-5
Goh, P. P., Elias, H., Norfariza, N., and Mariam, I. (2008) ‘National Eye Database- A Web Based
Surveillance System’. Medical Journal Malaysia (63) Supplement C, 20-23
Goh, P. P. (2008) ‘Status of Diabetic Retinopathy Among Diabetics Registered to the Diabetic Eye
Registry, National Eye Database, 2007’. Medical Journal Malaysia (63), 24-28
Gonzalez, R. C., and Woods, R. E. (2002) Digital Image Processing. 2nd edn. United States of America:
Prentice Hall
Gonzalez, R. C., Woods, R. E., and Eddins, S. L. (2009) Digital Image Processing Using MATLAB.
2nd edn. United States of America: Gatesmark Publishing
Harangi, B., Antal, B., and Hajdy, A. (2012) ‘Automatic Exudate Detection with Improved Naïve-Bayes
Classifier’. in Soda, P. (ed.) Proceedings of the 25th International Symposium on Computer-
Based Medical Systems (CBMS). held 20-22 June 2012 at Rome. USA: IEEE, 1-4
Hassan, S. S. A., and Bong, D. B. L. (2012) ‘Detection of Neovascularization in Diabetic Retinopathy’.
Journal Digital Imaging 25, 437-444

162
Hatanaka, Y., Inoue, T., Okumura, S., Muramatsu, C., and Fujita, H. (2012) ‘Automated Microaneurysm
Detection Method Based on Double-ring Filter and Feature Analysis in Retinal Fundus Images’.
in Soda, P. (ed.) Proceedings of the 25th International Symposium on Computer-Based Medical
Systems, CBMS. held 20-22 June 2012 at Rome. USA: IEEE, 1-4
Health Technology Assessment Unit, Medical Development Division, Ministry of Health Malaysia
(2002) Report Screening for Diabetic Retinopathy. Kuala Lumpur: Ministry of Health Malaysia
Hipwell, J. H., Strachant, F., Olson, J. A., McHardy, K. C., Sharp, P. F., and Forrester, J. V. (2000)
‘Automated Detection of Microaneurysms in Digital Red-free Photographs: A Diabetic
Retinopathy Screening Tool’. Diabetic Medicine 17, 588-594
Hoover, A., and Goldbaum, M. (2003) ‘Locating the Optic Nerve in a Retinal Image Using the Fuzzy
Convergence of the Blood Vessels’. IEEE Transactions on Medical Imaging 22 (8), 951-958
Hoover, A., Kouznetsova, V., and Goldbaum, M. (2000) ‘Locating Blood Vessels in Retinal Images by
Piece-wise Threshold Probing of a Matched Filter Response’. IEEE Transactions on Medical
Imaging 19 (3), 203-210
Hunter, A., Lowell, J. A., Steel, D., Ryder, B., Basu, A. (2011) ‘Automated Diagnosis of Referable
Maculopathy in Diabetic Retinopathy Screening’. in Proceedings of 2011 Annual International
Conference of the IEEE Engineering in Medicine and Biology Society, EMBC 2011. held 30
August- 3 September 2011 at Boston, Massachusetts. USA: IEEE, 3375-3378
Hutchins, E, Coppell, K. J., Morris, A., and Sanderson, G. (2012) ‘Diabetic Retinopathy Screening in
New Zealand Requires Improvement: Results from a Multi-centre Audit’. Australian and New
Zealand Journal of Public Health 36(3), 257-262
Ibrahim, H., and Kong, N. S. P. (2007) ‘Brightness Preserving Dynamic Histogram Equalization for
Image Contrast Enhancement’. IEEE Transactions on Consumer Electronics 53 (4), 1752-1758
ImageJ (2014) ImageJ An Open Platform for Scientific Image Analysis [online] available from
<http://imagej.net/ImageJ> [18 July 2014]
Imandoust, S. B., and Bolandraftar, M. (2013) ‘Application of k-nearest Neighbor (KNN) Approach for
Predicting Economic Events: Theoretical Background’. International Journal of Engineering
Research and Application 3 (5), 605-610
Itseez (2014) OpenCV [online] available from <http://opencv.org> [1 December 2013]
Jaafar, H. F., Nandi, A. K., and Al-Nuaimy, W. (2010) ‘Automated Detection of Exudates in Retinal
Images Using a Split-and-merge Algorithm’. in Proceedings of 18th European Signal
Processing Conference, EUSIPCO-2010. held 23-27 August 2010 at Aalborg. USA: IEEE,
1622-1626
Jakkula, V. (2008) Tutorial on Support Vector Machine (SVM). Pullman: Washington State University
Jimenez, S., Alemany, P., Benjumea, F. N., Serrano, C., Acha, B., Fondon, I., Carral, F., and Sanchez, C.
(2011) ‘Automatic Detection of Microaneurysms in Colour Fundus Images’. Arch Soc Esp
Oftalmol 86 (9), 277-281
Joshi. S., and Karule, P. T. (2012) ‘Retinal Blood Vessel Segmentation’. International Journal of
Engineering and Innovative Technology 1 (3), 175-178

163
Karasulu, B. (2012) ‘Automated Extraction of Retinal Blood Vessels: A Software Implementation’.
European Scientific Journal 8 (30), 47-57
Kauppi, T., Kalesnykiene, V., Kamarainen, J.-K., Lensu, L., Sorri, I., Uusitalo, H., Kalviainen, H., and
Pietila, J. (2006) DIARETDB0: Evaluation Database and Methodology for Diabetic Retinopathy
Algorithms. Finland: Lappeenranta University of Technology
Kauppi, T., Kalesnykiene, V., Kamarainen, J.-K., Lensu, L., Sorri, I., Raninen A., Voutilainen R.,
Uusitalo, H., Kalviainen H. and Pietila, J. (2007) DIARETDB1 Diabetic Retinopathy Database
and Evaluation Protocol. Finland: Lappeenranta University of Technology
Kose, C., Sevik, U., Ikibas, C., and Erdol, H. (2012) ‘Simple Methods for Segmentation and
Measurement of Diabetic Retinopathy Lesions in Retinal Fundus Images’. Computer Methods
and Programs in Biomedicine 107, 274-293
Kothari, C. R. (2004) Research Methodology Methods and Techniques. New Delhi: NewAge
International Publishers
Kumar, T. A., Priya, S., and Paul, V. (2013) ‘A Novel Approach to the Detection of Macula in Human
Retinal Imagery’. International Journal of Signal Processing Systems 1 (1), 23-28
Kwan, H. K. (2003) ‘Fuzzy Filters for Noisy Image Filtering’. in Proceedings of the 2003 International
Symposium on Circuits and Systems, 2003, ISCAS ’03. held 25-28 May 2003 at Bangkok,
Thailand. USA: IEEE, IV-161- IV-164
Lazar, I., and Hajdu, A. (2010) ‘Retinal Microaneurysm Detection Based on Intensity Profile Analysis’
in Proceedings of the 8th International Conference on Applied Informatics. held 27-30 January
2010 at Eger, Hungary. 157-165
Letchuman, G. R., Wan Nazaimoon, W. M., Wan Mohamad, W. B., Chandran, L. R., Tee, G. H.,
Jamaiyah, H., Isa, M. R., Zanariah, H., Fatanah, I., and Ahmad Faudzi, Y. (2010) ‘Prevalance of
Diabetes in the Malaysian National Health Morbidity Survey III 2006’. Medical Journal
Malaysia 65 (3), 173-179
Li, B. M., Chui, C. K., Chang, S., Ong, S. H. (2011) ‘Integrating Spatial Fuzzy Clustering with Level Set
Methods for Automated Medical Image Segmentation’. Computers in Biology and Medicine 41
(1), 1-10
Lichode, R. V., and Kulkarni, P. S. (2013) ‘Automatic Diagnosis of Diabetic Retinopathy by Hybrid
Multilayer Feed Forward Neural Network’. International Journal of Science, Engineering and
Technology Research (IJSETR) 2 (9), 1727-1733
Lim, G, Lee, M. L., Hsu, W., and Wong, T. Y. (2014) ‘Transformed Representations for Convolutional
Neural Networks in Diabetic Retinopathy Screening. Modern Artificial Intelligent for Health
Analytics, 21-25
Lin, A., Hoffman, D., Gaasterland, D, E., and Caprioli, J. (2003) ‘Neural Networks to Identify
Glaucomatous Visual Field Progression’. American Journal of Ophthalmology 135 (1), 49-54
Mafauzy, M., Hussein, Z., and Chan, S. P. (2011) ‘The Status of Diabetes Control in Malaysia: Results of
DiabCare 2008’. Medical Journal Malaysia 66 (3), 175-181

164
Malhotra, N. K., and Birks D. F. (2006) Marketing Research An Applied Approach. 2nd edn. England:
Pearson Education Limited
Mallika, P. S., Lee, P. Y., Cheah, W. L., Wong, J. S., Syed Alwi, S. A. R., Nor Hayati, H., and Tan, A. K.
(2011) ‘Risk Factors for Diabetic Retinopathy in Diabetics Screened Using Fundus Photography
at a Primary Health Care Setting in East Malaysia’. Malaysian Family Physician 2011 6 (2-3),
60-65
Martins, C. I. O., Veras, R. M, S., Ramalho, G. L. B., Medeiros, F. N. S., and Ushizima, D. M. (2010).
‘Automatic Microaneurysms Detection and Characterization Through Digital Color Fundus
Images’. in Proceedings of the International Joint Conference – Brazilian Symposium on
Artificial Intelligence and Brazilian Symposium on Neural Networks – II Workshop on
Computational Intelligence. held 23-28 October 2010 at Salvador, Bahia-Brazil. USA: Lawrence
Berkeley National Laboratory, 1-6
Mathers, C. D., and Loncar, D. (2006) ‘Projections of global mortality and burden of disease from 2002
to 2030’. PLoS Med 3(11), e442
MathWorks (2014) MATLAB [online] available from <http://www mathworks.co.uk/products/matlab/>
[1 November 2013]
Messidor (2004) Messidor: Digital Retinal Images [online] available from <http://messidor.crihan.fr/
index-en.php> [16 January 2014]
Ministry of Health Diabetic Retinopathy Screening Team 2012 (2012a) Diabetes Mellitus and
Complications –Module 2-2012. Putrajaya: Ministry of Health Malaysia
Ministry of Health Diabetic Retinopathy Screening Team 2012 (2012b) Handbook Guide to Diabetic
Retinopathy Screening -Module 5-2012. Putrajaya: Ministry of Health Malaysia
Ministry of Health Diabetic Retinopathy Screening Team 2012 (2012c) Diabetes Mellitus and Diabetic
Retinopathy-An Overview -Module 1-2012. Putrajaya: Ministry of Health Malaysia
Ministry of Health Diabetic Retinopathy Screening Team 2012 (2012d) Introduction to Fundus Camera–
Module 4-2012. Putrajaya: Ministry of Health Malaysia
Ministry of Health Malaysia, Malaysian Society of Ophthalmology and Academy of Medicine of
Malaysia (2011) Clinical Practice Guidelines Screening of Diabetic Retinopathy. Putrajaya:
Ministry of Health Malaysia
Mizutani, A., Muramatsu, C., Hatanaka, Y. (2009) ‘Automated Microaneurysm Detection Method Based
on Double-ring Filter in Retinal Fundus Images’. Medical Imaging 2009 Computer-Aided
Diagnosis, 1-8
Mookiah, M. R. K., Acharya, U. R., Martis, R. J., Chua, C.K., Lim, C. M., Ng, E. Y. K., and Laude, A.
(2013) ‘Evolutionary Algorithm Based Classifier Parameter Tuning for Automatic Diabetic
Retinopathy Grading: A Hybrid Feature Extraction Approach’. Knowledge-Based Systems 39, 9-
22
Mookiah, M. R. K., Rajendra, U. A., Lim, C. M., Petznick, A., and Suri, J. S. (2012) ‘Data Mining
Technique for Automated Diagnosis of Glaucoma Using Higher Order Spectra and Wavelet
Energy Features’. Knowledge-Based Systems 33, 73-82

165
Mubbashar, M., Usman, A., and Akram, M. U. (2011) ‘Automated System for Macula Detection in
Digital Retinal Images’. in Proceedings of the 2011 International Conference on Information
and Communication Technologies, ICICT. held 23-24 July 2011at Karachi. USA: IEEE, 1-5
Murugan, R., Korah, R., Nasreen, F. S., and Ventaka, H. T. (2003) ‘Microaneurysms Detection Methods
In Retinal Images Using Mathematical Morphology’. International Journal of Advances in
Engineering Science and Technology 2 (1), 120-128
Nagaveena, Deepashree, D., and Kumar S. C. P. (2013) ‘Vessels Segmentation in Diabetic Retinopathy
by Adaptive Median Thresholding’. The International Journal of Science & Technoledge 1 (1),
17-22
National Institute for Clinical Excellence (2002) Management of Type 2 Diabetes. Retinopathy-screening
and Early Nanagement. London: NICE
NED Steering Committee Members (2015) The 7th Report of the National Eye Database 2013 [online]
available from <http://www.acrm.org. my/ned/NEDreport/NED_2013.pdf> [14 December 2015]
NHS Choices (2012) Diabetes [online] available from <http://conditions/diabetes/ pages/ diabetes.aspx>
[1 July 2013]
Niemeijer, M., Ginneken, –van B., Staal, J., Suttorp-Schulten, M. S. A., and Abramoff, M. D. (2005)
‘Automatic Detection of Red Lesions in Digital Color Fundus Photographs’. IEEE Transactions
on Medical Imaging 24 (5), 584-592
Niemeijer, M., Ginnerken, -van B., Cree, M. J., Mizutani, A., Quellec, G., Sanchez, C. I., Zhang, B.,
Hornero, R., Lamard, M., Muramatsu, C., Wu, X., Cazuquel, G., You, J., Mayo, A., Li, Q.,
Hatanaka, Y., Cochener, B., Roux, C., Karray, F., Garcia, M., Fujita, H., Abramoff, M. D.
(2010) ‘Retinopathy Online Challenge: Automatic Detection of Microaneurysms in Digital
Color Fundus Photographs’. IEEE Transactions on Medical Imaging 29 (1), 185-195
Noronha, K., Nayak, J., and Bhat, S. N. (2006) ‘Enhancement of Retinal Fundus Image to Highlight the
Features for Detection of Abnormal Eyes’. in Proceedings of the 2006 IEEE Region 10
Conference ,TENCON2006. held 14-17 November 2006 at Hong Kong. USA:IEEE, 1-4
Osareh, A., Mirmehdi, M., Thomas, B., and Markham, R. (2003) ‘Automated Identification of Diabetic
Retinal Exudates in Digital Colour Images’. British Journal of Ophthalmology 87, 1220-1223
Patil, J., and Chaudhari, A. L. (2012) ‘Development of Digital Image Processing Using Fuzzy Gaussian
Filter Tool for Diagnosis of Eye Infection’. International Journal of Computer Applications
51 (19), 10-12
Prakash. J., and Sumanthi, K. (2013) ‘Detection and Classification of Microaneurysms for Diabetic
Retinopathy’. International Journal of Engineering Research and Applications, 31-36
Priya, R., and Aruna, P. (2011) ‘Review of Automated Diagnosis of Diabetic Retinopathy Using the
Support Vector Machine’. International Journal of Applied Engineering Research 1 (4), 844-863
Priya, R and Aruna, P. (2012) ‘SVM and Neural Network Based Diagnosis of Diabetic Retinopathy’.
International Journal of Computer Applications 41 (1), 6-12
Priya, R and Aruna, P. (2013a) ‘Diagnosis of Diabetic Retinopathy Using Machine Learning Techniques’.
Journal on Soft Computing 3 (4), 563-575

166
Priya, R., Aruna, P., and Suriya, R. (2013b) ‘Image Analysis Technique for Detecting Diabetic
Retinopathy’. International Journal of Computer Applications 1, 34-38
Punnolil, A. (2013) ‘A Novel Approach for Diagnosis and Severity Grading of Diabetic Maculopathy. in
Proceedings of the 2013 International Conference on Advances in Computing, Communications
and Informatics. held 22-25 August 2013 at Mysore, India. New York: IEEE, 1230-1235
Quellec, G., Lamard, M., Josselin, P. M., Cazuguel, G., Cochener, B., Roux, C. (2008) ‘Optimal Wavelet
Transform for the Detection of Microaneurysms in Retina Photographs’. IEEE Transactions on
Medical Imaging 27 (9), 1230-1241
Rahim, S, S., Jayne, C., Palade, V., and Shuttleworth, J. (2015a) ‘Automatic Detection of
Microaneurysms in Colour Fundus Images for Diabetic Retinopathy Screening’. Journal of
Neural Computing and Applications 521, 1-16
Rahim, S. S., Palade, V., Jayne, C., Holzinger, A., and Shuttleworth, J. (2015c) ‘Detection of Diabetic
Retinopathy and Maculopathy in Eye Fundus Images Using Fuzzy Image Processing’. in Guo,
Y. et al. (ed.) Proceedings of 8th
International Conference on Brain Informatics and Health, BIH
2015, LNAI 9250. held 30 August-2 September 2015 at London, UK. Switzerland: Springer,
379-388
Rahim, S. S., Palade, V., Shuttleworth, J., and Jayne, C. (2014) ‘Automatic Screening and Classification
of Diabetic Retinopathy Fundus Images’. in Mladenov, V. et al. (ed.) Proceedings of 15th
International Conference on Engineering Applications of Neural Networks, EANN 2014,
Communications in Computer and Information Science 459. held 5-7 September 2014 at Sofia,
Bulgaria. Switzerland: Springer, 113-122
Rahim, S. S., Palade, V., Shuttleworth, J., and Jayne, C. (2016) ‘Automatic Screening and Classification
of Diabetic Retinopathy and Maculopathy Using Fuzzy Image Processing’. in Zhong, N., and
Peng, H. (ed.) Brain Informatics 40708, 1-19
Rahim, S. S., Palade, V., Shuttleworth, J., Jayne, C., and Raja Omar, R. N. (2015b) ‘Automatic Detection
of Microaneurysms for Diabetic Retinopathy Screening Using Fuzzy Image Processing’. in
Iliadis, L., and Jayne, C. (ed.) Proceedings of 16th
International Conference on Engineering
Applications of Neural Networks, EANN 2015, Communications in Computer and Information
Science 517. held 25-28 September 2015 at Rhodes, Greece. Switzerland: Springer, 69-79
Ravishankar, A., Jain, A., and Mittal, A. (2009) ‘Automated Feature Extraction or Early Detection of
Diabetic Retinopathy in Fundus Images’. in Proceedings of the IEEE Conference on Computer
Vision and Pattern Recognition 2009, CVPR 2009. held 20-25 June 2009 at Miami, FL. USA:
IEEE, 210-217
Rhody, H. (2005) Lecture 10: Hough Circle Transform,[online lecture] DIP Lecture 10, 11 October 2005.
Rochester: Rochester Institute of Technology. available from <http://www.cis rit.edu/
class/simg782/ lectures/lecture_10/lec782_05_10.pdf> [30 June 2014]
Rokash, L., and Maimon, O. (2005) Decision Trees. The Data Mining and Knowledge Discovery
Handbook. 1st edn. Springer Science and Business Media: New York
167
Saleh, M. D., and Eswaran, C. (2012) ‘An Automated Decision-support System for Non-Proliferative
Diabetic Retinopathy Disease Based on Mas and HAs Detection’. Computer Methods and
Programs in Biomedicine 108, 186-196
Sanchez, C. I., Hornero, R., Mayo, A., and Garcia, M. (2009) ‘Mixture Model-based Clustering and
Logistic Regression for Automatic Detection of Microaneurysms in Retinal Images’. in
Karssemeijer, N., and Giger, M. L. (ed.) Proceedings of the SPIE 7260, Medical Imaging 2009-
Computer-Aided Diagnosis. held 7 February 2009 at Lake Buena Vista, FL. USA: SPIE
Scanlon, P. H., Wilkinson, C. P., Aldington, S. J., and Matthews, D. R. (2009) A Practical Manual of
Diabetic Retinopathy Management. Chicester, UK: Wiley-Blackwell
Sekhar, S., Al-Nuaimy, W., and Nandi, A. K. (2008) ‘Automated Localisation of Optic Disk and Fovea in
Retinal Fundus Images’. in Proceedings of the 16th European Signal Processing Conference.
held 25-29 August 2008 at Lausanne, Switzerland. USA: IEEE, 1-5
Selvathi, D., Prakash, N. B., and Balagopal, N. (2012) ‘Automated Detection of Diabetic Retinopathy for
Early Diagnosis Using Feature Extraction and Support Vector Machine’. International Journal
of Emerging Technology and Advanced Engineering 2 (11), 762-767
Sheet, D., Garud, H., Suveer, A., Mahadevappa, M., and Chatterjee, J. (2010) ‘Brightness Preserving
Dynamic Fuzzy Histogram Equalization’. IEEE Transactions on Consumer Electronics 56 (4),
2475-2480
Shome, S. K., and Vadali, S. R. K. (2011) ‘Enhancement of Diabetic Retinopathy Imagery Using Contrast
Limited Adaptive Histogram Equalization’. International Journal of Computer Science and
Information Technologies 2 (6), 2694-2699
Siddalingaswamy, P. C., and Prabhu, K. G. (2010) ‘Automatic Grading of Diabetic Maculopathy Severity
Levels’. in Mahadevappa, M. et al. (ed.) Proceedings of the 2010 International Conference on
Systems in Medicine and Biology. held 16-18 December 2010 at Kharagpur, India. New Delhi:
Excel India Publishers, 331-334
Sivaprasad, S., Gupta, B., Crossby-Nwaobi, R., and Evans, J. (2012) ‘Prevalence of Diabetic Retinopathy
In Various Ethnic Groups: A Worldwide Perspective’. Survey of Ophthalmology 57 (4), 347-370
Social Dimensions of Watershed Planning (2006) Conducting a Social Profile [online] available from
<http://www.watershedplanning.illinois.edu/profile_steps/step3. cfm> [16 July 2013]
Solberg, A. (2009) Hough Transform [online lecture] INF 4300, 21 October 2009. Norway: University of
Oslo. available from <http://www.uio no/studier/emner/matnat/ifi/INF4300/h09/
undervisningsmateriale/hough09.pdf> [11 August 2014]
Sonka, M., and Fitzpatrick, J. M. (2000) Handbook of Medical Imaging Volume 2. Medical Image
Processing and Analysis. United States of America: SPIE Press
Sonka, M., Hlavac, V., and Boyle, R. (2008) Image Processing, Analysis, and Machine Vision. United
States of America: Cengage Learning
168
Sopharak, A., New, K.T., Moe, Y. A., Dailey, M. N., and Uyyanonvara, B. (2008) ‘Automatic Exudate
Detection with a Naïve Bayes Classifier’. in Proceedings of the 2008 International Conference
on Embedded Systems and Intelligent Technology. held 27-29 February 2008 at Bangkok,
Thailand. Thailand: IEEE, 139-142
Sopharak, A., Uyyanonvara, B., and Barman, S. (2009a) ‘Automatic Exudate Detection for Diabetic
Retinopathy Screening’. ScienceAsia 35, 80-88
Sopharak, A., Uyyanonvara, B., and Barman, S. (2009b) ‘Automatic Exudate Detection from Non-dilated
Diabetic Retinopathy Retinal Images Using Fuzzy C-means Clustering’. Sensors 2009, 2148-
2161
Sopharak, A., Uyyanonvara, B., and Barman, S. (2013) ‘Automated Microaneurysm Detection
Algorithms Applied to Diabetic Retinopathy Retinal Images’. Maejo International Journal of
Science and Technology 7 (2), 294-314
Sopharak, A., and Uyyanonvara, B. (2006) ‘Automatic Exudates Detection on Thai Diabetic Retinopathy
Patients’ Retinal Images’. in Proceedings of the 2006 International Conference on Electrical
Engineering/Electronics, Computer, Telecommunications and Information Technology (ECTI).
held 10-13 May 2006 at Ubon Ratchathani, Thailand. Thailand: IEEE, 709-712
Sopharak, A., and Uyyanonvara, B. (2007) ‘Automatic Exudates Detection from Non-dilated Diabetic
Retinopathy Retinal Image Using Fuzzy C-means Clustering’. in Proceedings of the 3rd WACBE
World Congress on Bioengineering 2007,WACBE 2007. held 9-11 July 2007 at Bangkok,
Thailand. 1-4
Sopharak, A., Uyyanonvara, B., Barman, S., and Williamson, T. H. (2007) ‘Automatic Exudates
Detection from Diabetic Retinopathy Retinal Image Using Fuzzy C-means and Morphological
Methods’. in Proceedings of the Third IASTED International Conference Advances in Computer
Science and Technology. held 2-4 April 2007 at Phuket, Thailand. Anaheim, CA, USA: ACTA
Press, 359-364
Sopharak, A., Uyyanonvara, B., Barman, S., and Williamson, T. H. (2008) ‘Automated Detection of
Diabetic Retinopathy Exudates from Non-dilated Retinal Images Using Mathematical
Morphology’. Computerized Medical Imaging and Graphics 32, 720-727
Sopharak, A., Uyyanonvara, B., Barman, S., and Williamson, T. H. (2010) ‘Machine Learning Approach
To Automatic Exudate Detection in Retinal Images from Diabetic Patients’. Journal of Modern
Optics 5 (2), 124-135
Sounders, M., Lewis, P., and Thornhill, A. (2009) Research Methods for Business Students. 5th edn.
England: Pearson Education Limited
Staal, J. J., Abramoff, M. D., Niemeijer, M., Viergever, M. A., and Ginneken- van, B. (2004) ‘Ridge
Based Vessel Segmentation in Color Images of the Retina’. IEEE Transactions on Medical
Imaging 23, 501-509
Streeter, L., and Cree, M. J. (2003) ‘Microaneurysm Detection in Colour Fundus Images’. Image and
Vision Computing NZ, 280-285
169
Sujithkumar, S. B., and Vipula, S. (2012) ‘Automatic Detection of Diabetic Retinopathy in Non-dilated
RGB Retinal Fundus Images’. International Journal of Computer Applications 47 (19), 26-32
Sundhar, C., and Archana, D. (2014) ‘Automatic Screening of Fundus Images for Detection of Diabetic
Retinopathy’. International Journal of Communication and Computer Technologies 2 (1), 100-
105
Tajunisah, I., Nabilah, H., and Reddy, S. C. (2006) ‘Prevalence and risk factors for diabetic retinopathy –
A study of 217 Patients from University of Malaya Medical Centre’. Medical Journal Malaysia
61 (4), 451-456
Tariq, A., Akram, M. U., Shaukat, A., Khan, S. A. (2013) ‘Automated Detection and Grading of Diabetic
Maculopathy in Digital Retinal Images’. Journal of Digital Imaging 2013 26 (4), 803-812
Taylor, R., and Batey, D. (2012) Handbook of retinal screening in diabetes: diagnosis and management.
Chichester England: John Wiley & Sons, Ltd
The MathWorks, Inc. (2016a) Support Vector Machines (SVM) [online] available from
<http://uk.mathworks.com/help/stats/support-vector-machines-svm.html> [1 August 2014]
The MathWorks, Inc. (2016b) Naïve Bayes Classification [online] available from
<http://uk.mathworks.com/help/stats/naive-bayesclassification.html?searchHighlight=
naive%20bayes> [1 August 2014]
The MathWorks, Inc. (2016c) Fuzzy Logic Image Processing [online] available from
<http://uk.mathworks.com/help/fuzzy/examples/fuzzy-logic-image-processing html>
[23 February 2015]
Thevi, T., Basri, M., and Reddy, S. C. (2012) ‘Prevalence of Eye Diseases and Visual Impairment Among
the Rural Population- A Case Study of Temerloh Hospital’. Malaysian Family Physician 7 (1),
6-10
Toh, K. K. V., and Mat Isa, N. A. (2010) ‘Noise Adaptive Fuzzy Switching Median Filter for Salt-and-
pepper Noise Reduction’. IEEE Signal Processing Letters 17 (3), 281-284
Verma, K., Deep, P., and Ramakrishnan, A. G. (2011) ‘Detection and Classification of Diabetic
Retinopathy Using Retinal Images’. in Negi, A. et al (ed.) Proceedings of the 2011 Annual IEEE
India Conference ,INDICON-2011, ‘Engineering Sustainable Solutions’. held 16-18 December
2011 at Hyderabad, India. Hyderabad: IEEE, 1-6
Vidyasari, R., Sovani, I., Mengko, T. L. R., and Zakaria, H. (2011) ‘Vessel Enhancement Algorithm in
Digital Retinal Fundus Microaneurysms Filter for Nonproliferative Diabetic Retinopathy
Classification’. in Proceedings of the 2011 2nd International Conference in Instrumentation,
Communication, Information Technology and Biomedical Engineering, ICICI-BME. held 8-9
November 2011 at Bandung, Indonesia. USA: IEEE, 278-281
Vimala, A. G. S. G., and Kajamohideen, S. (2014) ‘Detection of Diabetic Maculopathy in Human Retinal
Images Using Morphological Operations’. Online Journal of Biological Sciences 14,175-180

170
Walter, T., and Klein, J. -C. (2002) ‘Automatic Detection of Microaneurysms in Color Fundus Images of
The Human Retina by Means of the Bounding Box Closing’. in Colosimo, A. et. al. (ed.)
Proceedings of the Third International Symposium on Medical Data Analysis, ISMDA 2002,
LNCS 2526. held 8-11 October 2002 at Rome, Italy. Berlin, Heidelberg: Springer-Verlag, 210-
220
Walter, T., Massin, P., Erginay, A., Ordonez, R., Jeulin, C., and Klein, J. -C. (2007) ‘Automatic Detection
of Microaneurysms in Color Fundus Images’. Medical Image Analysis 11 (6), 555-566
Wilkinson, C. P., Ferris, F. L., Klein, R. E., Lee, P. P., Agardh, C. D., Davis, M., Dills, D., Kampik, A.,
Pararajasegaram, R., and Verdaguer, J. T. (2003) ‘Proposed International Clinical Diabetic
Retinopathy and Diabetic Macula Edema Disease Severity Scales’. American Academy of
Ophthalmology 110 (9), 1677-1682
Wisaeng, K., Hiransakolwong, N., and Pothiruk, E. (2012) ‘Automatic Detection of Exudates in Diabetic
Retinopathy Images. Journal of Computer Science 8 (8), 1304-1313
Wisaeng, K., Hiransakolwong, N., and Pothiruk, E. (2013) ‘Automatic Detection of Exudates in Digital
Retinal Images’. International Journal of Computer Applications 64 (4), 19-26
Wisaeng, K., Hiransakolwong, N., and Pothiruk, E. (2014) ‘Automatic Detection of Optic Disc in Digital
Retinal Images’. International Journal of Computer Applications 90 (50), 15-20
World Health Organization (2005) Prevention of Blindness from Diabetes Mellitus, Report of WHO
Consultation. Geneva: WHO
World Health Organization (2012a) Global status report on noncommunicable diseases 2014. Geneva:
WHO
World Health Organization (2012b) Global data on visual impairments 2010. Geneva:WHO
Yadao, P., Naval, S., and Maheshwari, A. (2014) ‘Blood Vessel Segmentation in Retinal Fundus Images
Using Matched Filter’. Journal of Harmonized Research in Engineering 2(1), 58-61
Zadeh, L. A. (1965) ‘Fuzzy Sets’. Information and Control 8, 338-353
Zhang, B., Wu, X., You, J., Li, Q., and Karray, F. (2009) ‘Hierarchical Detection of Red Lesions in
Retinal Images by Multiscale Correlation Filtering’. in Karssemeijer, N., and Giger, M. L. (ed.)
Proceedings of the SPIE 7260, Medical Imaging 2009-Computer-Aided Diagnosis. held 7
February 2009 at Lake Buena Vista, FL. USA: SPIE
Zhang, B., Zhang, L., Zhang, L., and Karray, F. (2010) ‘Retinal Vessel Extraction by Matched Filter with
First-Order Derivative of Gaussian’. Computers in Biology and Medicine 40, 438-445
Zhang, B., Wu, X., You, J., Li, Q., and Karray, F. (2010) ‘Detection of Microaneurysms Using Multi-
Scale Correction Coefficients’. Pattern Recognition 43, 2237-2248
Zhang, X., and Chutatape, O. (2005) ‘A SVM Approach for Detection of Hemorrhages in Background
Diabetic Retinopathy’. in Proceedings of International Joint Conference on Neural Networks.
held 31 July- 4 August 2005 at Montreal, Canada. USA: IEEE, 2435-2440
Zohra, B. F., and Mohamed, B. (2009) ‘Automated Diagnosis of Retinal Images Using the Support
Vector Machine (SVM)’. Faculte des Science. Department of Informatique, USTO, Algerie

171
APPENDICES
Appendix A Data Collection
A.1 Data Collection Process
Figure A.1 Data collection and diabetic retinopathy screening process
Eye Clinic, Melaka Hospital, Malaysia
Fundus Camera VX-10
Screening Process
This item has been removed due to Data Protection. The unabridged version of the thesis can be found in the
Lancester Library, Coventry University.

172
No Diabetic Retinopathy
Figure A.2 No diabetic retinopathy images
Mild DR without maculopathy
Figure A.3 Mild DR without maculopathy images

173
Mild DR with maculopathy
Figure A.4 Mild DR with maculopathy images
Moderate DR without maculopathy
Figure A.5 Moderate DR without maculopathy images

174
Moderate DR with maculopathy
Figure A.6 Moderate DR with maculopathy images
Severe DR without maculopathy
Figure A.7 Severe DR without maculopathy images

175
Severe DR with maculopathy
Figure A.8 Severe DR with maculopathy images
Proliferative DR without maculopathy
Figure A.9 Proliferative DR without maculopathy images

176
Proliferative DR with maculopathy
Figure A.10 Proliferative DR with maculopathy images
Advanced Diabetic Eye Disease (ADED)
Figure A.11 Advanced diabetic eye disease images


184
Appendix B Online Developed Dataset Screenshots
B.1 Website Screenshots (http://creative.coventry.ac.uk/fundus)
Figure B.1 ‘Home’ page
Figure B.2 ‘About’ page
This item has been removed due to 3rd Party Copyright. The unabridged version of the thesis can be found in the Lancester
Library, Coventry University.
This item has been removed due to 3rd Party Copyright. The unabridged version of the thesis can be found in the Lancester
Library, Coventry University.

185
Figure B.3 ‘Team’ page
Figure B.4 ‘Publications’ page
This item has been removed due to 3rd Party Copyright. The unabridged version of the thesis can be found in the Lancester
Library, Coventry University.
This item has been removed due to 3rd Party Copyright. The unabridged version of the thesis can be found in the Lancester
Library, Coventry University.

This item has been removed due to 3rd Party Copyright. The unabridged version of the thesis can be found in the Lancester
Library, Coventry University.
This item has been removed due to 3rd Party Copyright. The unabridged version of the thesis can be found in the Lancester
Library, Coventry University.

187
Appendix C Research Ethics Approval

188

189

190

191

192

193

194

195