Ultrahigh-Resolution Optical Coherence Tomography of Surgically Closed Macular Holes
Upload
independentCategory
view
2download
0
Accepted for publication in Investigative Ophthalmology and Visual Sciences (IOVS), May 2011
Automatic detection of diabetic retinopathy and age-related macular
degeneration in digital fundus images
Carla Agurto1,2
, Simon Barriga1, Victor Murray
2, Sheila Nemeth
1,3, Robert Crammer
1,4, Wendall Bauman
5, Gilberto
Zamora1, Marios S. Pattichis
2, Peter Soliz
1,6
Purpose. To describe and evaluate the performance of an algorithm that automatically classifies images with
pathologies commonly found in diabetic retinopathy (DR) and age-related macular degeneration (AMD).
Methods. Retinal digital photographs (N=2247) of 3 fields of view (FOV) were collected of the eyes from 822
patients at two centers: The Retina Institute of South Texas (RIST) and The University of Texas Health Science
Center San Antonio (UTHSCSA). Ground truth was provided for the presence of pathologies including:
microaneurysms, hemorrhages, exudates, neovascularization in the optic disc and elsewhere, drusen, abnormal
pigmentation, and geographic atrophy. The algorithm was used to report on the presence or absence of pathology. A
detection threshold was applied to obtain different values of sensitivity and specificity with respect to ground truth
and construct a Receiver Operating Characteristic (ROC) curve.
Results. The system achieved an average area under the ROC curve (AUC) of 0.89 for detection of DR and of 0.92
for detection of sight-threatening DR (STDR). With a fixed specificity of 0.50, the system’s sensitivity ranged from
0.92 for all DR cases to 1.00 for clinically significant macular edema (CSME).
Conclusions. A computer-aided algorithm was trained to detect different types of retinal pathologies. The cases of
hard exudates within 1 disc diameter (DD) of the fovea (surrogate for CSME) were detected with very high accuracy
(sensitivity = 1, specificity = 0.50) whereas mild non-proliferative DR was the most challenging condition
(sensitivity= 0.92, specificity= 0.50). The algorithm was also tested on images with signs of AMD, achieving a
performance of AUC = 0.84 (sensitivity= 0.94, specificity= 0.50).
Diabetic Retinopathy (DR) is a disease that affects up to 80% of diabetics around the world and it is one of the
leading causes of blindness in the U.S. It is the second greatest cause of blindness in the western world1. On the

Accepted for publication in Investigative Ophthalmology and Visual Sciences (IOVS), May 2011
other hand, Age Related Macular Degeneration (AMD) is the leading cause of blindness in people older than 65
years. More than 1.75 million people have AMD in the U.S. and this number is expected to increase to 3 million
people by 20202. Many studies have demonstrated that early treatment can reduce the amount of DR and AMD cases
mitigating the medical and economic impacts of the disease3.
Accurate, early detection of eye diseases is important because of its potential for reducing the number of cases of
blindness around the world. Retinal photography for DR has been promoted for decades for both the screening of the
disease as well as in landmark clinical research studies, such as the Early Treatment Diabetic Retinopathy Study
(ETDRS)4. Although the ETDRS standard fields of view (FOV) may be regarded as the current gold standard
5 for
diagnosis of retinal pathology, studies have demonstrated that the information provided by two or three of these
fields is sufficiently comprehensive to provide an accurate diagnosis of diabetic retinopathy and more than sufficient
for screening6.
In recent years several research centers have presented systems to detect pathology in retinas, some notable ones
having been presented by Larsen7, Abramoff
8, Chaum
9, and Fleming
10,11. However, these approaches must apply
specialized algorithms to detect a specific type of lesion in the retina. In order to detect multiple lesions, the previous
systems generally implement more than one of these algorithms. Furthermore, some of these studies evaluate their
algorithms on a single dataset, which avoided the problems associated with the differences in fundus imaging
devices, such as resolution.
These methodologies primarily employ a "bottom-up" approach in which the accurate segmentation of all the lesions
in the retina is the basis for correct determination. A disadvantage of bottom-up approaches is that they rely on the
accurate segmentation of all the lesions in the retina in order to measure performance. Yet, the development of
specialized segmentation methods can be challenging. In such cases, lesion detection can suffer from the lack of
effective segmentation methods. This is particularly problematic for advanced stages of DR, such as
neovascularization.
A top-down approach, such as the one used in our study, does not depend on the segmentation of specific lesions.
Thus, top-down methods can potentially detect abnormalities not explicitly used in training12
. Our objective here is

Accepted for publication in Investigative Ophthalmology and Visual Sciences (IOVS), May 2011
then to show that this approach is a suitable implementation for eye disease detection with specific consideration to
diabetic retinopathy and age-related macular degeneration.
Methods
1. Data Description
The retrospective images used to test our algorithm were obtained from the Retina Institute of South Texas (RIST,
San Antonio, TX) and the University of Texas Health Science Center in San Antonio (UTHSCSA). Fundus images
from 822 patients (378 and 444 patients from RIST and UTHSCSA, respectively) were collected retrospectively for
this study. The images were taken using a Topcon TRC 50EX camera at RIST and a Canon CF-60uv at UTHSCSA.
Both centers captured 45-degree mydriatic images with no compression. The size of the RIST images is 1888x2224
pixels and the size of the UTHSCSA images is 2048x2392 pixels. Both databases were collected in the South Texas
area where according to the U.S. Bureau of the Census 2009 the ethnicity distribution for this area is, 58.3%
Hispanic, 31.3% white (non-Hispanic), and 7.8% Afro-Americans. For the database provided by the UTHSCSA, no
information about age or sex of the patients was provided. In the case of the RIST database, the data were collected
from July 2005 to February 2010. The distribution of patients is 50.8% females and 49.2% males. Age information is
also provided and it is distributed as follows: 1.1% [0 to 24 years], 6.6% [25 to 44 years], 26% [45 to 64 years] and
66.3% being aged 65 years or older. All the images that presented with cataracts at their early stage, retinal sheen, or
lighting artifacts were considered for this study. We excluded retinal images presenting advanced stages of cataracts,
corneal and vitreous opacities, asteroid hyalosis, and significant eye lashes or eye lids artifacts. The number of
images excluded in this study corresponds to 67 images or 5.8% of the RIST database and 57 images or 5.2% of the
UTHSCSA database.
Fig. 1 shows examples of images from the three FOV found in both databases. Figure 1a is centered in the optic disc
(FOV1). Figure 1b is centered in the fovea (FOV2), and Figure 1c is focused on the superior temporal region of the
retina (FOV3). Each image was graded independently in the following categories: Normal, Non-Proliferative DR
(NPDR), Sight Threatening DR (STDR), and Maculopathy. Table 1 shows the distribution of each subject’s eye in
these categories. In addition, ten retinal pathologies were specified by the graders according to Tables 2 and 3. Seven
pathologies are related to DR: Microaneurysms, hemorrhages, exudates less than one disc diameter away from the

Accepted for publication in Investigative Ophthalmology and Visual Sciences (IOVS), May 2011
fovea, exudates elsewhere, intra-retinal microvascular abnormalities (IRMA), neovascularization on the disc (NVD),
and neovascularization elsewhere (NVE). The three pathologies related to AMD were: Drusen, abnormal
pigmentation, and geographic atrophy.
Figure 1 (a-c) FOVs 1, 2 and 3 of a normal retina from the RIST database; (d-f) FOVs 1, 2 and 3 of an abnormal retina from the
UTHSCSA database.
Table 1 Distribution of the RIST and the UTHSCSA databases
Database
Number
of
Patients
Normal
eyes
Non-
Proliferative
DR eyes
Sight
Threatening
DR eyes
Maculopathy
RIST 378 64 486 158 174
UTHSCSA 444 116 418 292 207
Table 2 Distribution of DR pathologies for the RIST and the UTHSCSA databases
Presence of Lesion
Micro-
aneurysms
Hemorrhages
Exudates
Fovea
Exudates
elsewhere
IRMA NVE NVD
Number of images in the
RIST database
378 511 174 248 80 30 58
Number of images in the
UTHSCSA database
274 316 207 284 70 59 118

Accepted for publication in Investigative Ophthalmology and Visual Sciences (IOVS), May 2011
Table 3 Distribution of AMD pathologies for the RIST and the UTHSCSA databases
Presence of Lesion Drusen Pigmentation Geographic Atrophy
Number of images in the RIST database 343 345 154
Number of images in the UTHSCSA
database
188 86 54
The graders followed the criteria of image quality based on the clarity of vessels around the macula13
. Under these
criteria, images can be classified as excellent, good, fair, and inadequate image quality. Following the criteria, we
removed 193 images, or 16.7% of the RIST database, and 111 images or 10.2% of the UTHSCSA database. Figure 2
shows examples of images not considered for this study due to their low quality.
Figure 2 Examples of the type of images that were not used by our algorithm. (a) Low quality due to advance stage of cataract, (b) Low
Quality due to the reflection of the iris, (c) Inadequate image quality, (d) Inadequate image quality.
2. Image processing
Accepted for publication in Investigative Ophthalmology and Visual Sciences (IOVS), May 2011
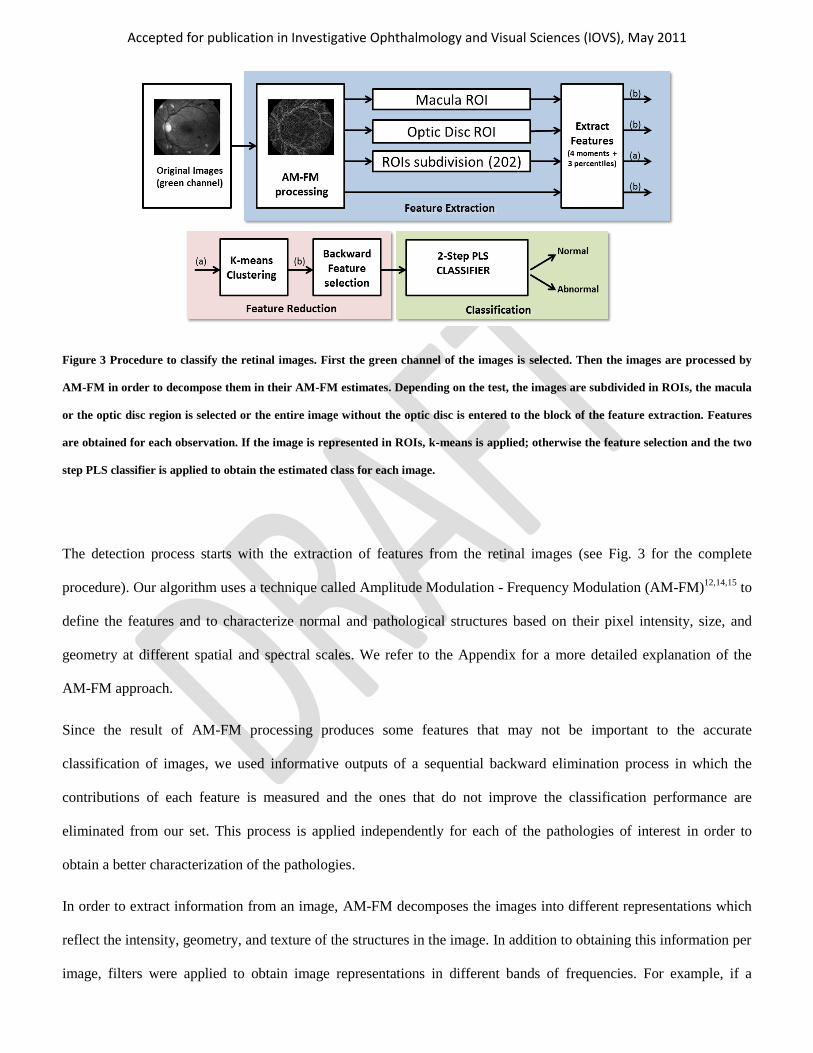
Figure 3 Procedure to classify the retinal images. First the green channel of the images is selected. Then the images are processed by
AM-FM in order to decompose them in their AM-FM estimates. Depending on the test, the images are subdivided in ROIs, the macula
or the optic disc region is selected or the entire image without the optic disc is entered to the block of the feature extraction. Features
are obtained for each observation. If the image is represented in ROIs, k-means is applied; otherwise the feature selection and the two
step PLS classifier is applied to obtain the estimated class for each image.
The detection process starts with the extraction of features from the retinal images (see Fig. 3 for the complete
procedure). Our algorithm uses a technique called Amplitude Modulation - Frequency Modulation (AM-FM)12,14,15
to
define the features and to characterize normal and pathological structures based on their pixel intensity, size, and
geometry at different spatial and spectral scales. We refer to the Appendix for a more detailed explanation of the
AM-FM approach.
Since the result of AM-FM processing produces some features that may not be important to the accurate
classification of images, we used informative outputs of a sequential backward elimination process in which the
contributions of each feature is measured and the ones that do not improve the classification performance are
eliminated from our set. This process is applied independently for each of the pathologies of interest in order to
obtain a better characterization of the pathologies.
In order to extract information from an image, AM-FM decomposes the images into different representations which
reflect the intensity, geometry, and texture of the structures in the image. In addition to obtaining this information per
image, filters were applied to obtain image representations in different bands of frequencies. For example, if a

Accepted for publication in Investigative Ophthalmology and Visual Sciences (IOVS), May 2011
medium or high pass filter is applied to an image, the smaller retinal structures (e.g. MAs, dot-blot hemorrhages,
exudates etc.) will be enhanced. This can be observed in Fig. 4(b) and 4(c), where the different type of red lesions,
exudates and thinner vessels present in the retinal region are captured. On the other hand, if a low pass filter is
applied then larger structures are captured such as wider vessels as shown in Fig. 4(e). By taking the difference of
the two lowest scale representations, smaller vessels can also be captured, as seen in Fig. 4(f). Using these two ways
of processing (AM-FM image representations and output of the filters), more robust signatures of the different
pathologies can be characterized. This means that if we combine the representations of the different scales, we can
obtain signatures for each structure which allow us to detect and uniquely classifying them.
Figure 4 Structures in the retina captured by the AM-FM estimates using high values of the Instantaneous Amplitude (IA, in blue). (a)
Region of a retinal image with pathologies; (b) Image representation using medium frequencies, which captures dark and bright
lesions as well as vasculature; (c) Image representation using high frequencies, notice that this image captures most of the bright
lesions; (d) Region of a retinal image with normal vessel structure; (e) Image representation using a very low frequency filter; (f)
Image representation of (d) obtained by taking the difference between the very low and the ultra-low frequency scales, in this image
the thinner vessels are better represented.

Accepted for publication in Investigative Ophthalmology and Visual Sciences (IOVS), May 2011
In order to facilitate the characterization of early cases of retinopathy in which only a few, small abnormalities are
found; our process divides the images into regions of interest or ROIs. A sensitivity analysis on the size of the ROIs
found that square regions of 140 by 140 pixels were adequate to represent features of small structures that can appear
in the retina such as MAs or exudates. A total of 202 ROIs were necessary to cover the entire image. For
classification, a feature vector was created using a concatenation of the following seven features from each region: a)
the first four statistical moments (mean, standard deviation, skewness and kurtosis) and b) the histogram percentiles
(25th, 50
th and 75
th).
A k-means clustering approach is performed to group the ROIs with similar features using the Euclidean distance
between features. In this way, we avoid the necessity of time consuming process of grading each region by using an
unsupervised algorithm. The resulting clusters become the representative feature vector per image. Once the feature
vectors are extracted, we use them in the classification module (green block in Fig. 3). This module used a Partial
Least Squares (PLS) regression classifier to find the relevant features that classify images as normal or abnormal
according to ground truth.
3. Experimental Design
The following paragraphs describe the experiments performed to assess the accuracy of the system in detecting the
retinal pathologies listed in Tables 2 and 3. These pathologies are characteristic of either DR or AMD. In this section
we describe in detail the approaches taken for assessing the presence of these diseases in the retinal photographs.
A. DR classification
For DR-related cases, the performance of the algorithm was measured by its ability to discriminate DR cases from
normal cases. To do this, we created a mathematical model of the images by training the system using a subset of the
data. This training set produces a model to which the testing images are compared with. If the result of this
comparison is greater than a pre-defined threshold, the image is considered abnormal (or suspect for DR). Images
that fall below the threshold are labeled as normal.

Accepted for publication in Investigative Ophthalmology and Visual Sciences (IOVS), May 2011
Additionally, the algorithm was tested separately on sight threatening DR (STDR) cases, where STDR is defined as
an image presenting with NVE, CSME, or NVD. In the following sub-sections we detail the special properties that
make the AM-FM representations ideally suited for the detection of CSME and NVD.
Clinical Significant Macular Edema (CSME): Previously, investigators have found an association between hard
exudates near the fovea and CSME16,17
. Although hard exudates are one of the most common findings in macular
edema, the presence of hard exudates is not always indicative of edema. Previous research has demonstrated that the
sensitivity of exudates in predicting macular edema is 93.9%18
. Finding exudates near the fovea does not
unequivocally ascertain its presence or absence. Our goal is simply to identify those patients at-risk based on the
presence of hard exudates. For the purposes of this study, the presence of exudates within 1 disc diameter (DD) of the
fovea was considered to be a surrogate for CSME19
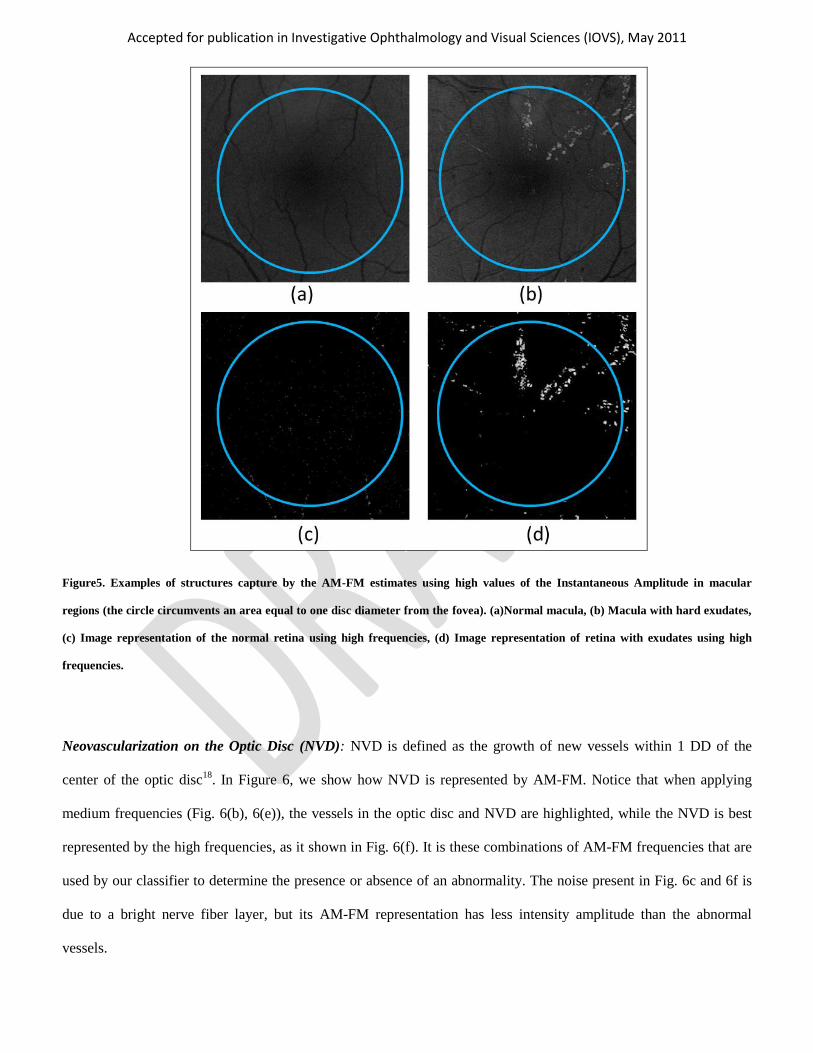
. The Fig. 5 shows an example of how AM-FM highlights the
presence of exudates while minimizing interference from blood vessels. In this figure we see a normal retina (Fig. 5a)
and one containing exudates within 1 DD of the fovea (Fig. 5b). Fig 5c shows the AM-FM decomposition of the
normal retina for the high frequencies. It can be noticed that the representation eliminates all the vessels from the
image and only shows a dark background. In contrast, using the same high frequencies, the AM-FM decomposition
for the abnormal retina clearly highlights the exudates while eliminating the vessels.
Accepted for publication in Investigative Ophthalmology and Visual Sciences (IOVS), May 2011
Figure5. Examples of structures capture by the AM-FM estimates using high values of the Instantaneous Amplitude in macular
regions (the circle circumvents an area equal to one disc diameter from the fovea). (a)Normal macula, (b) Macula with hard exudates,
(c) Image representation of the normal retina using high frequencies, (d) Image representation of retina with exudates using high
frequencies.
Neovascularization on the Optic Disc (NVD): NVD is defined as the growth of new vessels within 1 DD of the
center of the optic disc18
. In Figure 6, we show how NVD is represented by AM-FM. Notice that when applying
medium frequencies (Fig. 6(b), 6(e)), the vessels in the optic disc and NVD are highlighted, while the NVD is best
represented by the high frequencies, as it shown in Fig. 6(f). It is these combinations of AM-FM frequencies that are
used by our classifier to determine the presence or absence of an abnormality. The noise present in Fig. 6c and 6f is
due to a bright nerve fiber layer, but its AM-FM representation has less intensity amplitude than the abnormal
vessels.

Accepted for publication in Investigative Ophthalmology and Visual Sciences (IOVS), May 2011
Figure 6 Examples of structures captured by the AM-FM estimates using high values of the Instantaneous Amplitude for two different
optic discs. (a) Normal optic disc, (d) NVD, (b) and (e) Instantaneous Amplitude of (a),(d) using medium frequencies, (c) and (f) Image
representation of (a),(d) using high frequencies.
B. AMD classification
In addition to testing the images for the presence of DR, three different pathologies related to AMD were analyzed:
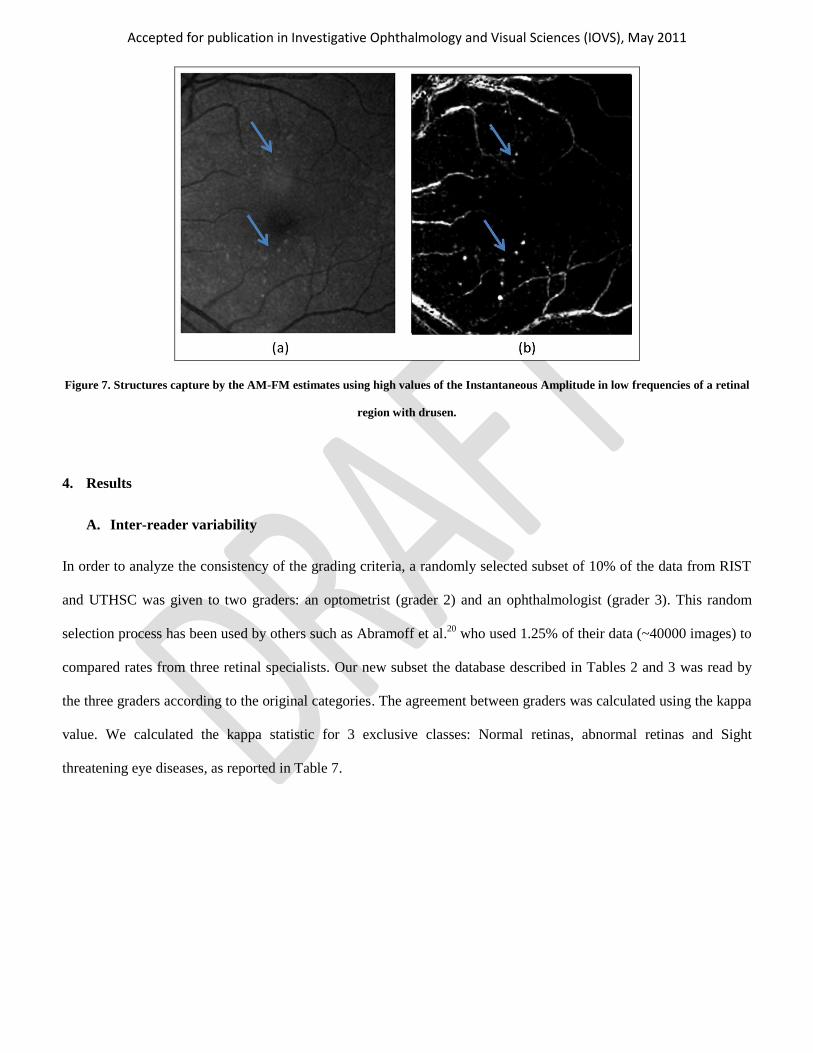
drusen, abnormal pigmentation, and geographic atrophy (GA). Fig. 7 shows an example of a retinal image with
drusen and one of its corresponding AM-FM image representations. As seen in this example, drusen are noticeably
highlighted by AM-FM. We then tested the system in the following scenarios: Normal vs. drusen, normal vs.
abnormal pigmentation, Normal vs. GA, and normal vs. all AMD pathologies. For the drusen experiment, all stages
of presence of drusen where categorized in the same group without distinction of severity, e.g. a few isolated druse
versus large, confluent drusen.
Accepted for publication in Investigative Ophthalmology and Visual Sciences (IOVS), May 2011
Figure 7. Structures capture by the AM-FM estimates using high values of the Instantaneous Amplitude in low frequencies of a retinal
region with drusen.
4. Results
A. Inter-reader variability
In order to analyze the consistency of the grading criteria, a randomly selected subset of 10% of the data from RIST
and UTHSC was given to two graders: an optometrist (grader 2) and an ophthalmologist (grader 3). This random
selection process has been used by others such as Abramoff et al.20
who used 1.25% of their data (~40000 images) to
compared rates from three retinal specialists. Our new subset the database described in Tables 2 and 3 was read by
the three graders according to the original categories. The agreement between graders was calculated using the kappa
value. We calculated the kappa statistic for 3 exclusive classes: Normal retinas, abnormal retinas and Sight
threatening eye diseases, as reported in Table 7.

Accepted for publication in Investigative Ophthalmology and Visual Sciences (IOVS), May 2011
Table 7 Measurement of agreement of 3 readers using the Cohen's kappa value for normal retinas, abnormal retinas and
sight threatening eye diseases.
Comparison Kappa class Kappa value SE 95% CI
Grader 1 vs. Grader 2
Unweighted 0.61 0.058 [0.50 0.73]
Linear Weighted 0.69 0.048 [0.60 0.79]
Grader 1 vs. Grader 3
Unweighted 0.74 0.056 [0.67 0.85]
Linear Weighted 0.79 0.047 [0.70 0.88]
Grader 2 vs. Grader 3
Unweighted 0.62 0.068 [0.49 0.76]
Linear Weighted 0.69 0.059 [0.57 0.80]
B. Automatic Detection Results
Cross validation was used to assess the performance of the algorithm. The ratio between training and testing data was
selected so that 70% of the data was used for training and 30% was used for testing. To get a more robust
classification estimate, the images in the training and the testing sets were randomly selected and the average of 20
runs is presented. This procedure minimizes the possible bias incurred if the training and testing sets were fixed21
. In
order to compare our results with recently published algorithms the specificity was fixed to two values: 0.50 and
0.60. These values of specificity have been previously used to report sensitivity in two large studies9,11
. Figure 8
shows six ROC curves, three for each database for the following experiments: Normal vs. NPDR, Normal vs. STDR
and Normal vs. DR.
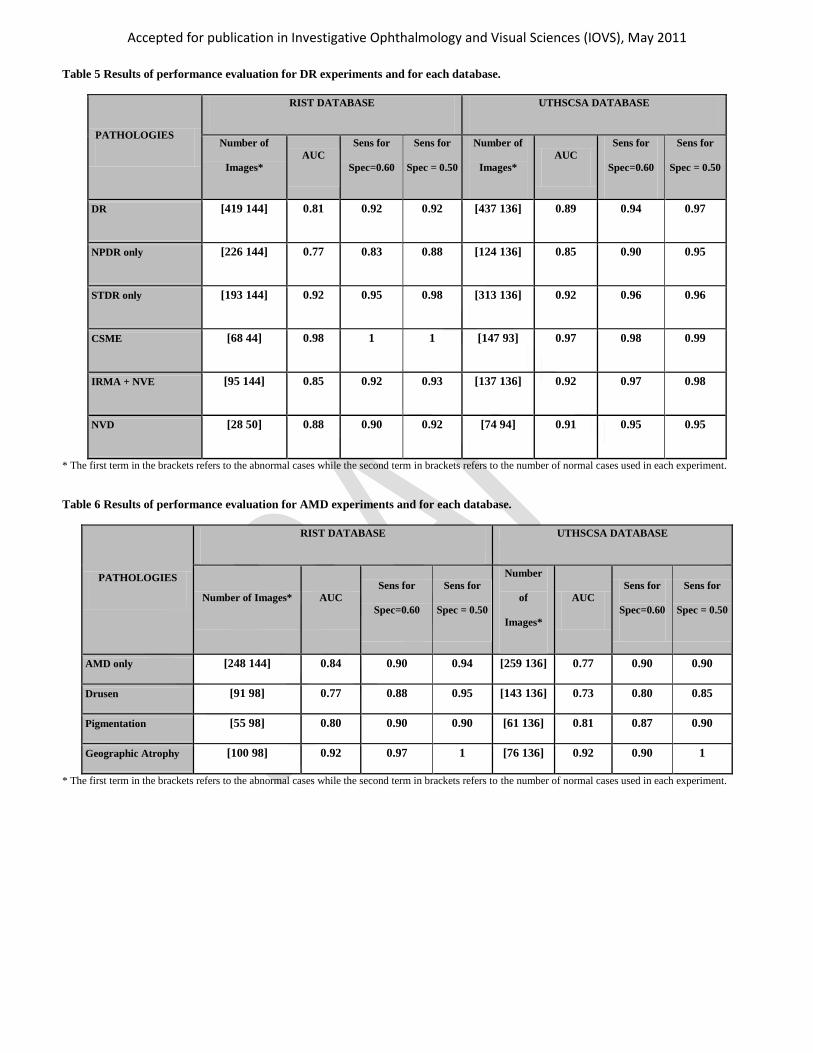
Accepted for publication in Investigative Ophthalmology and Visual Sciences (IOVS), May 2011 Table 5 Results of performance evaluation for DR experiments and for each database.
PATHOLOGIES
RIST DATABASE UTHSCSA DATABASE
Number of
Images*
AUC
Sens for
Spec=0.60
Sens for
Spec = 0.50
Number of
Images*
AUC
Sens for
Spec=0.60
Sens for
Spec = 0.50
DR [419 144] 0.81 0.92 0.92 [437 136] 0.89 0.94 0.97
NPDR only [226 144] 0.77 0.83 0.88 [124 136] 0.85 0.90 0.95
STDR only [193 144] 0.92 0.95 0.98 [313 136] 0.92 0.96 0.96
CSME [68 44] 0.98 1 1 [147 93] 0.97 0.98 0.99
IRMA + NVE [95 144] 0.85 0.92 0.93 [137 136] 0.92 0.97 0.98
NVD [28 50] 0.88 0.90 0.92 [74 94] 0.91 0.95 0.95
* The first term in the brackets refers to the abnormal cases while the second term in brackets refers to the number of normal cases used in each experiment.
Table 6 Results of performance evaluation for AMD experiments and for each database.
PATHOLOGIES
RIST DATABASE UTHSCSA DATABASE
Number of Images* AUC Sens for
Spec=0.60
Sens for
Spec = 0.50
Number
of
Images*
AUC Sens for
Spec=0.60
Sens for
Spec = 0.50
AMD only [248 144] 0.84 0.90 0.94 [259 136] 0.77 0.90 0.90
Drusen [91 98] 0.77 0.88 0.95 [143 136] 0.73 0.80 0.85
Pigmentation [55 98] 0.80 0.90 0.90 [61 136] 0.81 0.87 0.90
Geographic Atrophy [100 98] 0.92 0.97 1 [76 136] 0.92 0.90 1
* The first term in the brackets refers to the abnormal cases while the second term in brackets refers to the number of normal cases used in each experiment.

Accepted for publication in Investigative Ophthalmology and Visual Sciences (IOVS), May 2011
Figure 8. ROC curves for the classification of DR, STDR and NPDR. (a) Curves for RIST database, (b)Curves for UTHSCSA
database.
5. Discussion
A. Inter-Reader Variability
Table 7 shows the kappa values obtained to measure the inter-reader variability. Based on the Landis and Koch
interpretation of kappa values, we obtained substantial agreement (kappa values higher than 0.6) between all three
graders. Further analysis was performed for grading the different sight threatening categories obtaining kappa values
of 0.71 and 0.60 for CSME and NVD, respectively, while for NVE+IRMA cases, a kappa value of 0.55 (moderate
agreement) was obtained. When we analyzed the differences between graders for this last category, we noticed that
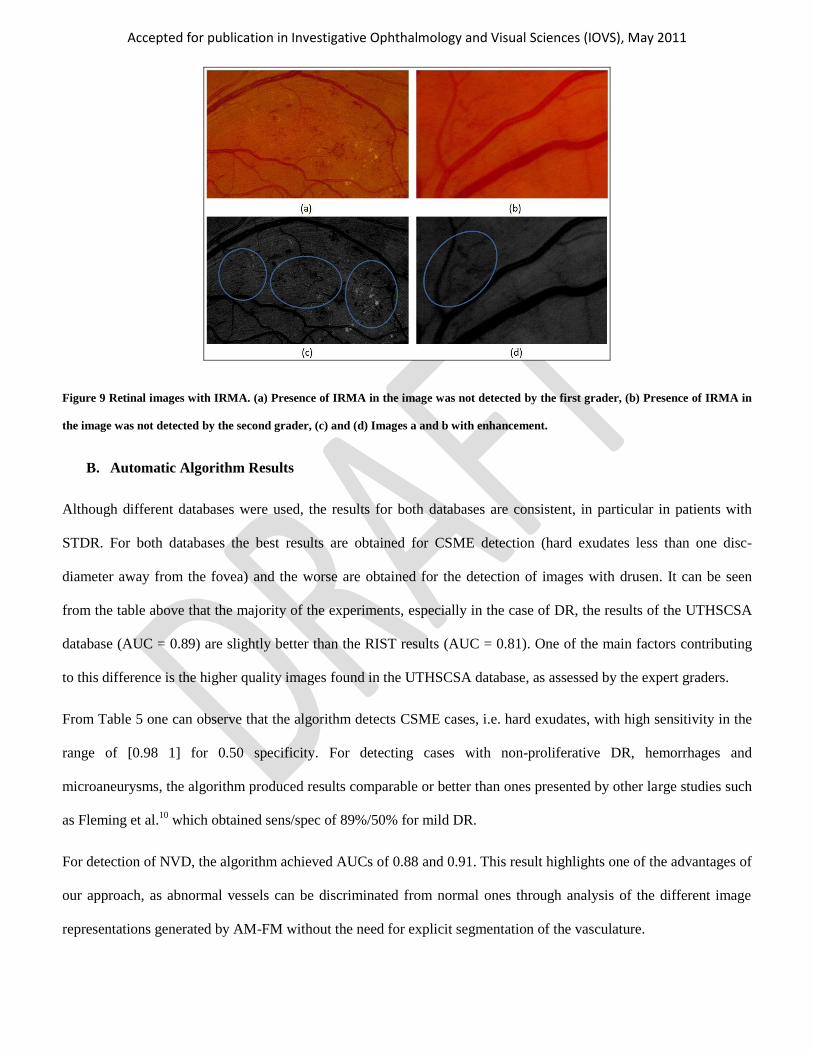
most of the disagreements were present in the detection of IRMA. An illustration of this is shown in Fig. 9. The two
images shown in figures 9a and 9b were presented to the graders again after applying local contrast enhancement and
they agreed that the pathology was present. Lower image quality and blurring on some images are some of the factors
that contributed to the disagreement between graders. In addition, we found that the presence of other pathologies
mask the presence of IRMA as it is shown in Fig 9a.
Accepted for publication in Investigative Ophthalmology and Visual Sciences (IOVS), May 2011
Figure 9 Retinal images with IRMA. (a) Presence of IRMA in the image was not detected by the first grader, (b) Presence of IRMA in
the image was not detected by the second grader, (c) and (d) Images a and b with enhancement.
B. Automatic Algorithm Results
Although different databases were used, the results for both databases are consistent, in particular in patients with
STDR. For both databases the best results are obtained for CSME detection (hard exudates less than one disc-
diameter away from the fovea) and the worse are obtained for the detection of images with drusen. It can be seen
from the table above that the majority of the experiments, especially in the case of DR, the results of the UTHSCSA
database (AUC = 0.89) are slightly better than the RIST results (AUC = 0.81). One of the main factors contributing
to this difference is the higher quality images found in the UTHSCSA database, as assessed by the expert graders.
From Table 5 one can observe that the algorithm detects CSME cases, i.e. hard exudates, with high sensitivity in the
range of [0.98 1] for 0.50 specificity. For detecting cases with non-proliferative DR, hemorrhages and
microaneurysms, the algorithm produced results comparable or better than ones presented by other large studies such
as Fleming et al.10
which obtained sens/spec of 89%/50% for mild DR.
For detection of NVD, the algorithm achieved AUCs of 0.88 and 0.91. This result highlights one of the advantages of
our approach, as abnormal vessels can be discriminated from normal ones through analysis of the different image
representations generated by AM-FM without the need for explicit segmentation of the vasculature.
Accepted for publication in Investigative Ophthalmology and Visual Sciences (IOVS), May 2011
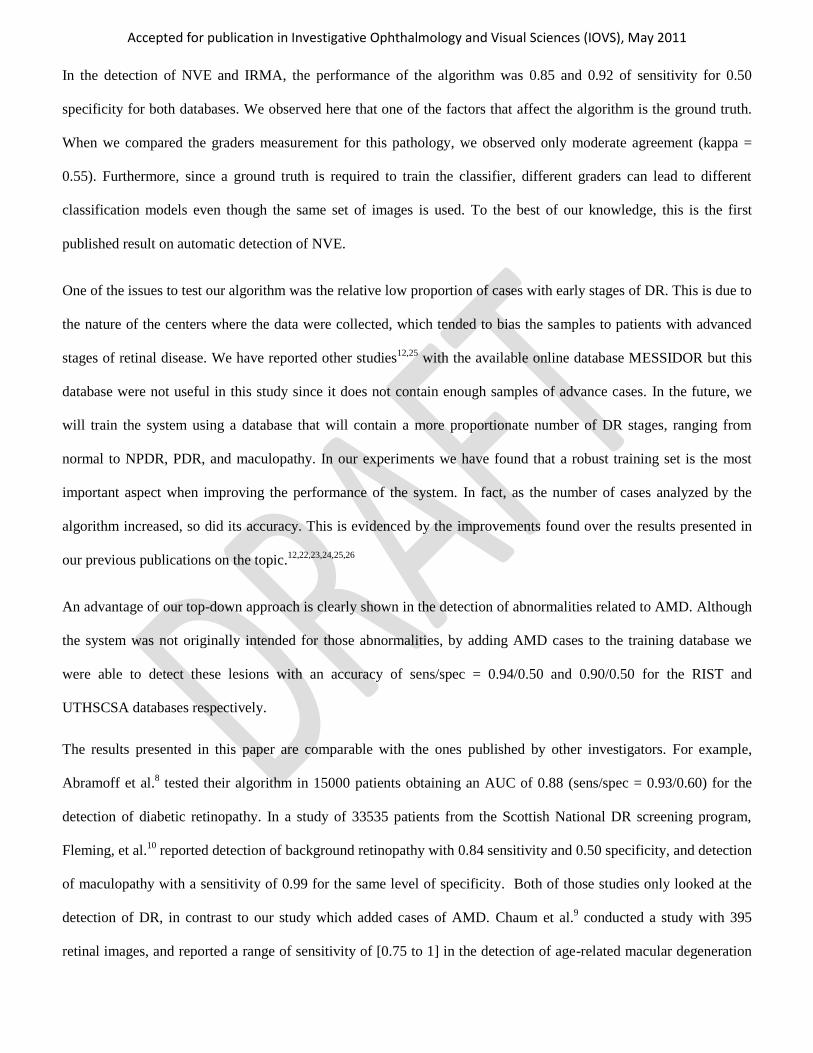
In the detection of NVE and IRMA, the performance of the algorithm was 0.85 and 0.92 of sensitivity for 0.50
specificity for both databases. We observed here that one of the factors that affect the algorithm is the ground truth.
When we compared the graders measurement for this pathology, we observed only moderate agreement (kappa =
0.55). Furthermore, since a ground truth is required to train the classifier, different graders can lead to different
classification models even though the same set of images is used. To the best of our knowledge, this is the first
published result on automatic detection of NVE.
One of the issues to test our algorithm was the relative low proportion of cases with early stages of DR. This is due to
the nature of the centers where the data were collected, which tended to bias the samples to patients with advanced
stages of retinal disease. We have reported other studies12,25
with the available online database MESSIDOR but this
database were not useful in this study since it does not contain enough samples of advance cases. In the future, we
will train the system using a database that will contain a more proportionate number of DR stages, ranging from
normal to NPDR, PDR, and maculopathy. In our experiments we have found that a robust training set is the most
important aspect when improving the performance of the system. In fact, as the number of cases analyzed by the
algorithm increased, so did its accuracy. This is evidenced by the improvements found over the results presented in
our previous publications on the topic.12,22,23,24,25,26
An advantage of our top-down approach is clearly shown in the detection of abnormalities related to AMD. Although
the system was not originally intended for those abnormalities, by adding AMD cases to the training database we
were able to detect these lesions with an accuracy of sens/spec = 0.94/0.50 and 0.90/0.50 for the RIST and
UTHSCSA databases respectively.
The results presented in this paper are comparable with the ones published by other investigators. For example,
Abramoff et al.8 tested their algorithm in 15000 patients obtaining an AUC of 0.88 (sens/spec = 0.93/0.60) for the
detection of diabetic retinopathy. In a study of 33535 patients from the Scottish National DR screening program,
Fleming, et al.10
reported detection of background retinopathy with 0.84 sensitivity and 0.50 specificity, and detection
of maculopathy with a sensitivity of 0.99 for the same level of specificity. Both of those studies only looked at the
detection of DR, in contrast to our study which added cases of AMD. Chaum et al.9 conducted a study with 395
retinal images, and reported a range of sensitivity of [0.75 to 1] in the detection of age-related macular degeneration

Accepted for publication in Investigative Ophthalmology and Visual Sciences (IOVS), May 2011
and sensitivity of [0.75 to 0.947] in the detection of DR. In our approach, by using the information provided in
Tables 5 and 6, we report detection of DR with sens/spec = 0.92/0.60 and 0.94/0.60, detection of CSME with
sens/spec = 1/0.60 and 0.99/0.50 and detection of AMD with sens/spec = 0.90/0.60 and 0.94/0.50). As can be
observed, this approach demonstrates an algorithm that has the capability to detect the presence of pathologies
associated to more than one eye disease.
By observing the ROC curves (Fig. 8), the performance of the algorithm in RIST and UTHSCA databases for the
detection of STDR cases is very high, with sensitivities of 0.96 and 0.98 for a fixed specificity of 0.50 respectively. If
we fix the specificity to 80%, the algorithm achieved sensitivities of 0.92 and 0.85 for the RIST and UTHSCSA
databases, respectively. For the other two experiments, NPDR and DR, we achieved sensitivities in the range of [0.88
0.97] for 0.50 specificity.
In conclusion, this work presents a viable and efficient means to characterize different retinal abnormalities and build
binary classifiers for detection purposes. Although automatic detection of DR has been studied by different groups in
the last decade, few studies used a top-down approach like the one we proposed. In addition to that, to our
knowledge, automatic detection of STDR as well as neovascularization, pigmentation and GA has not been
concurrently addressed at the levels of performance presented in this work.
Appendix: Amplitude Modulation – Frequency Modulation and Feature Extraction
The image representations from which the features are generated are obtained using a technique called AM-FM. In
order to extract information from an image, this technique decomposes the green channel of the images into different
representations which reflect the intensity, geometry, and texture of the structures in the image. The AM-FM
decomposition for an image ),( yxI is given by:
M
n
nn yxyxayxI1
),(cos),(),(
(1)
where M is the number of AM-FM components, ),( yxan denotes instantaneous amplitude estimate (IA) and
),( yxn denotes instantaneous phase. Using the latter, two AM-FM estimates are generated by extracting the

Accepted for publication in Investigative Ophthalmology and Visual Sciences (IOVS), May 2011
magnitude and the angle of its gradient. These estimates are called instantaneous frequency magnitude (|IF|), and
instantaneous frequency angle.
In addition to obtaining this information per image, filters are applied to obtain image representations in different
bands of frequencies. For example, if a medium or high pass filter is applied to an image, the smaller retinal
structures (e.g. MAs, dot-blot hemorrhages, exudates etc.) are enhanced. Using these two ways of processing (AM-
FM image representations and output of the filters), more robust signatures of the different pathologies can be
characterized. At the end of this step, an image has 39 different representations that characterize the different
pathologies found in the retina. A more extensive mathematical description of the AM-FM technique can be found in
a previously published paper12
. In this section we will describe conceptually the way AM-FM represents two
structures commonly found in DR images: retinal vessels and rounded dark lesions. The same analysis to be
presented here can be done for bright lesions, large hemorrhages, and abnormal vessels, among other retinal features.
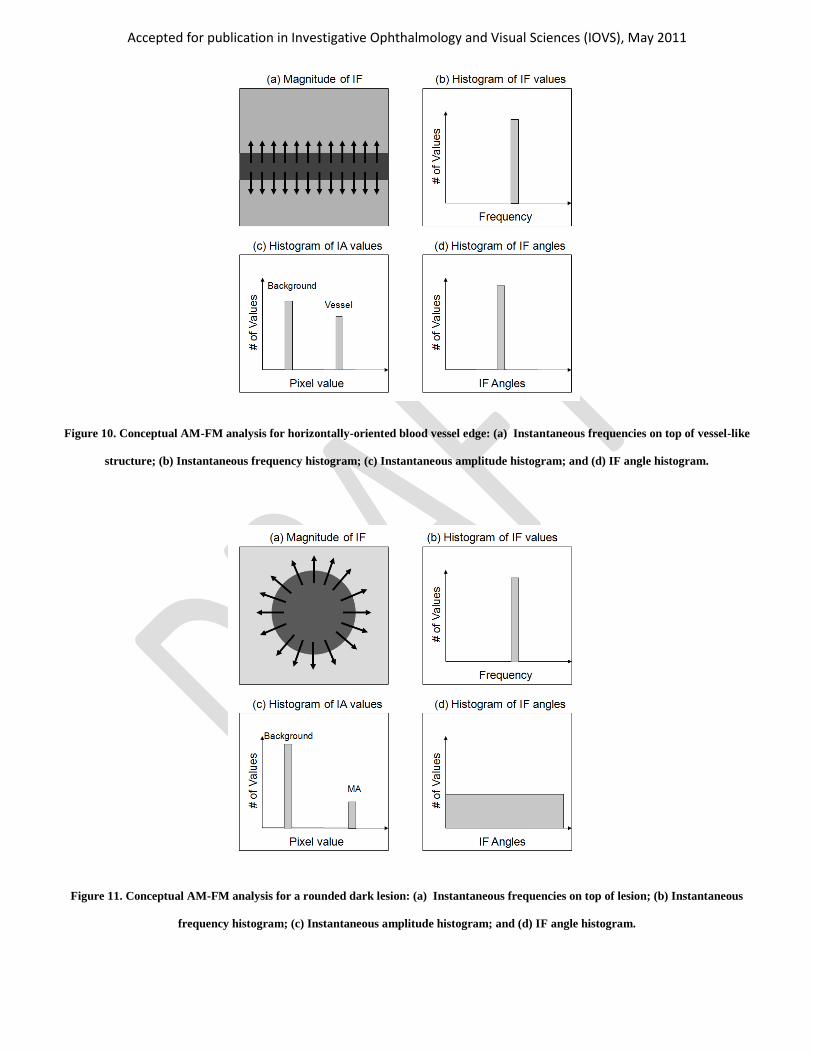
Figure 10 shows the way a horizontally oriented retinal vessel is represented by AM-FM, and the resulting
histograms for the three different AM-FM estimates: Instantaneous amplitude (IA), instantaneous frequency
magnitude (|IF|), and instantaneous frequency angle. The arrows in Fig. 10a show the direction in which the
frequency change is happening, meaning, the way the pixel values are changing from dark (vessel) to bright (retinal
background). The pixels in the background will only have slight changes in intensity, and therefore their frequencies
are close to zero. The only areas generating a frequency response are those in the edge of the vessels and they will
have a very distinctive |IF| as represented in Fig. 10b. The IA will have high values for the areas with higher contrast,
and therefore in the ideal case the histogram of the IA will have two distinctive peaks: One for the retinal background
and one for the edge of the vessels, as seen in Fig. 10c. One of the most distinctive features of vessel-like features is
their directionality, which is captured by the IF angle. The direction of change will be roughly the same for an
elongated structure like a vessel, and therefore the angle of the IF will generate a highly peaked histogram, as seen in
Fig. 10d.
Accepted for publication in Investigative Ophthalmology and Visual Sciences (IOVS), May 2011
Figure 10. Conceptual AM-FM analysis for horizontally-oriented blood vessel edge: (a) Instantaneous frequencies on top of vessel-like
structure; (b) Instantaneous frequency histogram; (c) Instantaneous amplitude histogram; and (d) IF angle histogram.
Figure 11. Conceptual AM-FM analysis for a rounded dark lesion: (a) Instantaneous frequencies on top of lesion; (b) Instantaneous
frequency histogram; (c) Instantaneous amplitude histogram; and (d) IF angle histogram.

Accepted for publication in Investigative Ophthalmology and Visual Sciences (IOVS), May 2011
Figure 11 shows the histogram of the AM-FM representation for a dark rounded region such as MAs or dot-blot
hemorrhages. The lesion is characterized by the IF with large values at the edge of the lesion, and low values inside
and outside the lesion, as depicted in Figure 11a. Just as in the case of the vessels, the resulting |IF| histogram has a
clear peak for the high-frequency values (Figure 11b). The IA histogram contains two peaks, one for the contrast
changes in the background, and one for the contrast changes on the edges of the lesion, as seen in Fig. 11c. This IA
histogram is similar to the one for the vessel, but since MAs are smaller than vessels, the number of pixels with high
contrast will be smaller, and therefore the histogram will have a smaller peak that represent the MAs. Finally, one of
the biggest differences of vessels and MAs is seen on the IF angle. In the ideal case of a perfect circular shape where
all the angles of the IF are represented (as seen in Figure 11a), the histogram for the angles would be uniform (Figure
8d), since all angles of the IF are represented.
These two examples illustrate the way in which AM-FM is able to obtain different signatures for each of the two
analyzed structures. By combining the outputs of the 3 estimates, any structure with different shape, color, and size
can be characterized. We are conscious that retinal images present additional information such as noise or blurring
which is not considered in the ideal cases presented above, but by using appropriate statistical measurements to
represent the AM-FM estimates, high classification accuracy can be obtained, as shown by the results presented in
this paper.
References
1 Zhang X, Saaddine JB, Chou CF et al. Prevalence of Diabetic Retinopathy in the United States 2005-2008. JAMA. 2010;304(6):649-656.
2 The Eye Diseases Prevalence Research Group, Prevalence of Age-Related Macular Degeneration in the United States. Arch Ophthalmol. 2004;122:564-572.
3 Scotland GS, McNamee P, Fleming AD et al. Costs and consequences of automated algorithms versus manual grading for the detection of referable diabetic
retinopathy. Br J Ophthalmol. 2010; 94: 712-719.
4 Early Treatment Diabetic Retinopathy Study Research Group. Grading diabetic retinopathy from sterioscopic color fundus photographs: an extension of the
modified Airlie House classification. ETDRS report 10. 1991;98:786-806.
5 Li HK, Hubbard LD, Danis RP. Digital versus Film Fundus Photography for Research Grading of Diabetic Retinopathy Severity. Invest Ophthal Vis Sci.
2010;51:5846-5852.
6 Scanlon PH, Malhotra R, Thomas G. The effectiveness of screening for diabetic retinopathy by digital imaging photography and technician ophthalmoscopy.
Diabet Med. 2003; 20(6): 467–474.
7 Larsen N, Godt J, Grunkin M, Lund‐Andersen H, Larsen M. Automated detection of diabetic retinopathy in a fundus photographic screening population. Invest
Ophthalmol Vis Sci. 2003; 44(2):767‐71.

Accepted for publication in Investigative Ophthalmology and Visual Sciences (IOVS), May 2011
8 Niemeijer M, Abràmoff MD, van Ginneken B. Information Fusion for Diabetic Retinopathy CAD in Digital Color Fundus Photographs. IEEE Transactions on
Medical Imaging, 2009; 28(5).
9 Chaum E, Karnowski TP, Govindasamy VP, Abdelrahman M, Tobin KW. Automated Diagnosis of Retinopathy By Content-Based Image Retrieval.
Retina:November/December 2008. 2008; 28(10):1463-1477.
10 Fleming AD, Goatman KA, Philip S, Prescott GJ, Sharp PF, Olson JA. Automated grading for diabetic retinopathy: a large-scale audit using arbitration by
clinical experts. Br J Ophthalmol. 2010.
11 Scotland GS, McNamee P, Fleming AD et al. Cost and consequences of automated algorithms versus manual grading or the detection of referable diabetic
retinopathy. Br J Ophthalmol. 2010; 94: 712-719.
12 Agurto C, Murray V, Barriga et al. Multiscale AM-FM Methods for Diabetic Retinopathy Lesion Detection. IEEE Transactions on Medical Imaging. 2010;
29(2): 502-512.
13 Fleming AD, Philip S, Goatman K, Olson J, Sharp P. Automated assessment of diabetic retinal Image quality based on clarity and field definition. Invest
Ophthalmol Vis Sci. 2006; 47:1120–1125.
14 Murray V, Rodriguez P, Pattichis MS. Multi-scale AM-FM Demodulation and Reconstruction Methods with Improved Accuracy. IEEE Transactions on
Image Processing. 2010; 19(5): 1138-1152.
15 Murray-Herrera VM. AM-FM methods for image and video processing. Ph.D. dissertation, University of New Mexico. 2008.
16 Kinyoun J, Barton F, Fisher M, Hubbard L, Aiello L, Ferris F. Detection of diabetic macular edema: ophthalmoscopy versus photography EarlyTreatment
Diabetic Retinopathy Study Report Number 5, The ETDRS Research Group. Ophthalmology. 1989; 96:746–750.
17 Welty CJ, Agarwal A, Merin LM, Chomsky A. Monoscopic versus stereoscopic photography in screening for clinically significant macular edema.
Ophthalmic Surg Lasers Imaging. 2006; 37:524–526.
18 Rudnisky CJ, Tennant MT, de Leon AR, Hinz BJ, Greve MD. Benefits of stereopsis when identifying clinically significant macular edema via tele-
ophthalmology. Can J Ophthalmol. 2006; 41(6):727-32.
19 Automated image detection of retinal pathology, edited by Herbert F. Jelinek, Michael J. Cree. Boca Raton : CRC Press. 2010.
20Abramoff MD, Niemeijer M, Russell SR. Automated detection of diabetic retinopathy: barriers to translation into clinical practice. Expert Review of Medical
Devices. 2010; 7(2): 287–296.
21 Chen W, Gallas BD. Training variability in the evaluation of automated classifers. SPIE Medical Imaging 2010: Computer-Aided Diagnosis. 2010.
22 Agurto C, Barriga S, Murray V, Pattichis M, Davis B, Soliz P. Effects of Image Compression and Degradation on an Automated Diabetic Retinopathy
Screening Algorithm. SPIE Medical Imaging. 2010.
23 Agurto C, Murillo S, and Murray V et al. Detection and Phenotyping of Retinal Disease using AM-FM Processing for Feature Extraction. 42nd IEEE Asilomar
Conference on Signals, Systems and Computers. 2008.
24 Barriga ES, Murray V, Agurto C et al. Multi-scale AM-FM for lesion phenotyping on age-related macular degeneration. IEEE International Symposium on
Computer-Based Medical Systems. 2009.
25 2010: (Agurto, C. et al. IOVS 2010;51: ARVO abstract 1793)
26 Barriga ES, Murray V, Agurto C et al. Automatic System for Diabetic Retinopathy Screening Based on AM-FM, Partial Least Squares, and Support Vector
Machines. IEEE International Symposium on Biomedical Imaging, 2010.
Copyright © 2022 FDOKUMEN