Performance evaluation of several anisotropic diffusion filters for fundus imaging
17
Research Article Automatic Extraction of Blood Vessels in the Retinal Vascular Tree Using Multiscale Medialness Mariem Ben Abdallah, 1 Jihene Malek, 1 Ahmad Taher Azar, 2 Philippe Montesinos, 3 Hafedh Belmabrouk, 1 Julio Esclarín Monreal, 4 and Karl Krissian 4 1 Faculty of Sciences, Electronics and Microelectronics Laboratory, Monastir University, 5019 Monastir, Tunisia 2 Faculty of Computers and Information, Benha University, Benha 13511, Egypt 3 Institute of Mines and Ales, Laboratory of Computer and Production Engineering, 30319 Al` es, France 4 Imaging Technology Center (CTIM), Las Palmas-Gran Canaria University, 35017 Las Palmas de Gran Canaria, Spain Correspondence should be addressed to Mariem Ben Abdallah; [email protected] Received 11 April 2014; Accepted 12 November 2014 Academic Editor: Karen Panetta Copyright © Mariem Ben Abdallah et al. is is an open access article distributed under the Creative Commons Attribution License, which permits unrestricted use, distribution, and reproduction in any medium, provided the original work is properly cited. We propose an algorithm for vessel extraction in retinal images. e first step consists of applying anisotropic diffusion filtering in the initial vessel network in order to restore disconnected vessel lines and eliminate noisy lines. In the second step, a multiscale line-tracking procedure allows detecting all vessels having similar dimensions at a chosen scale. Computing the individual image maps requires different steps. First, a number of points are preselected using the eigenvalues of the Hessian matrix. ese points are expected to be near to a vessel axis. en, for each preselected point, the response map is computed from gradient information of the image at the current scale. Finally, the multiscale image map is derived aſter combining the individual image maps at different scales (sizes). Two publicly available datasets have been used to test the performance of the suggested method. e main dataset is the STARE project’s dataset and the second one is the DRIVE dataset. e experimental results, applied on the STARE dataset, show a maximum accuracy average of around 94.02%. Also, when performed on the DRIVE database, the maximum accuracy average reaches 91.55%. 1. Introduction For decades, retinal images are widely used by ophthalmolo- gists for the detection and follow-up of several pathological states [1–5]. Fundus photographs, also called retinal pho- tography, are captured using special devices called “Charged Coupled Devices” (CCD), which are cameras that show the interior surface of the eye [6–10]. ese images directly pro- vide information about the normal and abnormal features in the retina. e normal features include the optic disk, fovea, and vascular network. ere are different kinds of abnor- mal features caused by diabetic retinopathy (DR) such as microaneurysm, hard exudate, soſt exudate, hemorrhage, and neovascularization. An example of retinal images obtained by fundus photography is given in Figure 1, where two retinal images are shown. e first one does not show any DR sign (Figure 1(a)) and the second one demonstrates advanced- DR signs indicated by color arrows (Figure 1(b)). However, the manual detection of blood vessels is very difficult since the blood vessels in these images are complex and have low level contrast [11]. Also, not all the images show signs of diabetic retinopathy. Hence, a manual measurement of the information about blood vessels, such as length, width, tortuosity, and branching pattern, becomes tedious. As a result, it increases the time of diagnosis and decreases the efficiency of ophthalmologists. erefore, automatic methods for extracting and measuring the vessels in retinal images are needed to save the workload of the ophthalmologists and to assist in characterizing the detected lesions and identifying the false positives [12]. Several works have been proposed for detecting the 2D complex vessel network, such as single scale matched Hindawi Publishing Corporation International Journal of Biomedical Imaging Article ID 519024
-
Upload
independent -
Category
Documents
-
view
1 -
download
0
Transcript of Performance evaluation of several anisotropic diffusion filters for fundus imaging

Research ArticleAutomatic Extraction of Blood Vessels in the Retinal VascularTree Using Multiscale Medialness
Mariem Ben Abdallah1 Jihene Malek1 Ahmad Taher Azar2 Philippe Montesinos3
Hafedh Belmabrouk1 Julio Esclariacuten Monreal4 and Karl Krissian4
1Faculty of Sciences Electronics and Microelectronics Laboratory Monastir University 5019 Monastir Tunisia2Faculty of Computers and Information Benha University Benha 13511 Egypt3Institute of Mines and Ales Laboratory of Computer and Production Engineering 30319 Ales France4Imaging Technology Center (CTIM) Las Palmas-Gran Canaria University 35017 Las Palmas de Gran Canaria Spain
Correspondence should be addressed to Mariem Ben Abdallah mariembenabdallah3gmailcom
Received 11 April 2014 Accepted 12 November 2014
Academic Editor Karen Panetta
Copyright copy Mariem Ben Abdallah et al This is an open access article distributed under the Creative Commons AttributionLicense which permits unrestricted use distribution and reproduction in any medium provided the original work is properlycited
We propose an algorithm for vessel extraction in retinal images The first step consists of applying anisotropic diffusion filteringin the initial vessel network in order to restore disconnected vessel lines and eliminate noisy lines In the second step a multiscaleline-tracking procedure allows detecting all vessels having similar dimensions at a chosen scale Computing the individual imagemaps requires different steps First a number of points are preselected using the eigenvalues of the HessianmatrixThese points areexpected to be near to a vessel axis Then for each preselected point the response map is computed from gradient information ofthe image at the current scale Finally the multiscale image map is derived after combining the individual image maps at differentscales (sizes) Two publicly available datasets have been used to test the performance of the suggested method The main dataset isthe STARE projectrsquos dataset and the second one is the DRIVE datasetThe experimental results applied on the STARE dataset showa maximum accuracy average of around 9402 Also when performed on the DRIVE database the maximum accuracy averagereaches 9155
1 Introduction
For decades retinal images are widely used by ophthalmolo-gists for the detection and follow-up of several pathologicalstates [1ndash5] Fundus photographs also called retinal pho-tography are captured using special devices called ldquoChargedCoupled Devicesrdquo (CCD) which are cameras that show theinterior surface of the eye [6ndash10] These images directly pro-vide information about the normal and abnormal features inthe retina The normal features include the optic disk foveaand vascular network There are different kinds of abnor-mal features caused by diabetic retinopathy (DR) such asmicroaneurysm hard exudate soft exudate hemorrhage andneovascularization An example of retinal images obtained byfundus photography is given in Figure 1 where two retinalimages are shown The first one does not show any DR sign
(Figure 1(a)) and the second one demonstrates advanced-DR signs indicated by color arrows (Figure 1(b)) Howeverthe manual detection of blood vessels is very difficult sincethe blood vessels in these images are complex and havelow level contrast [11] Also not all the images show signsof diabetic retinopathy Hence a manual measurement ofthe information about blood vessels such as length widthtortuosity and branching pattern becomes tedious As aresult it increases the time of diagnosis and decreases theefficiency of ophthalmologistsTherefore automaticmethodsfor extracting and measuring the vessels in retinal images areneeded to save the workload of the ophthalmologists and toassist in characterizing the detected lesions and identifyingthe false positives [12]
Several works have been proposed for detecting the2D complex vessel network such as single scale matched
Hindawi Publishing CorporationInternational Journal of Biomedical ImagingArticle ID 519024
2 International Journal of Biomedical Imaging
(a) Normal retina (b) Abnormal retina
Figure 1 Retinal images [32]
filter [13ndash15] multiscale matched filter [16] adaptive localthresholding [17] single-scale Gabor filters [18] and mul-tiscale Gabor filters [19] Cinsdikici and Aydin [20] putforward a blood vessel segmentation based on a novel hybridmodel of the matched filter and the colony algorithm whichextracts vessels perfectly but the pathological areas can affectthe result In [21ndash23] authors adapted another approachwhich applied mathematical morphological operators Thesuggested method in [21] proved to be a valuable tool forthe segmentation of the vascular network in retinal imageswhere it allowed obtaining a final image with the segmentedvessels by iteratively combining the centerline image with theset of images that resulted from the vessel segmentsrsquo recon-struction phase using the morphological operator Howeverthe inconvenience of this method is when a vessel centerlineismissing so the corresponding segmented vessel is normallynot included in the final segmentation result In [22] theauthors proved that it was possible to select vessels usingshape properties and connectivity as well as differentialproperties like curvatureThe robustness of the algorithm hasbeen evaluated and tested on eye fundus images and on otherimages Gang et al [24] showed that the Gaussian curve issuitable for modeling the intensity profile of the cross sectionof the retinal vessels in color fundus images Based on thiselaboration they proposed the amplitude-modified second-order Gaussian filter for retinal vessel detection whichoptimized thematched filter and improved the successfulnessof the detection Staal et al [25] explained a method foran automated segmentation of vessels in two-dimensionalcolor images The system was based on extracting imageridges that coincide approximately with vessel centerlineswhere the evaluation was done using the accuracy of hardclassifications and the values of soft ones In [26] the authorspresented a hybrid method for an efficient segmentation ofmultiple oriented blood vessels in colour retinal images Therobustness and accuracy of the method demonstrated that itmight be useful in a wide range of retinal images even withthe presence of lesions in the abnormal images Dua et al[27] presented a method for detecting blood vessels whichemploys a hierarchical decomposition based on a quad treedecomposition The algorithm was faster than the existingapproaches In the recent years alternative approaches for anautomated vessel segmentation have used the Hessian-based
multiscale detection of curvilinear structures which has beeneffective in discerning both large and small vessels [28ndash31]
In this paper we propose a multiscale response to detectlinear structures in 2D images We will use the formulationwhich was suggested in [36 37] The presented detectionalgorithm is divided into two steps First we present a flux-based anisotropic diffusion method and apply it to denoiseimages corrupted by an additive Gaussian noise In order toextract only the pixels belonging to a vessel region we usea Gaussian model of the vessels for interpreting the eigen-values and the eigenvectors of the Hessian matrix Then wecompute the multiscale response from responses computedat a discrete set of scales The method has been evaluatedusing the images of two publicly available databases theDRIVE database [34] and the STARE database [33] Priorto analysing fundus images we have used the green channelalone since it gives the highest contrast between the vesseland the background
2 Methodology
21 Preprocessing Technique In the ocular fundus imageedges and local details between heterogeneous regions arethe most interesting part for clinicians Therefore it is veryimportant to preserve and enhance edges and local finestructures and simultaneously reduce the noise To reducethe image noise several approaches have been proposedusing techniques such as linear and nonlinear filtering Inlinear spatial filtering such as Gaussian filtering the contentof a pixel is given by the value of the weighted averageof its immediate neighbors This filtering not only reducesthe amplitude of noise fluctuations but also degrades sharpdetails such as lines or edges so the resulting images appearblurred and diffused [24 38] This undesirable effect canbe reduced or avoided by designing nonlinear filters Themost common technique is median filtering With it thevalue of an output pixel is determined by the median of theneighborhood pixelsThis filtering retains edges but results ina loss of resolution by suppressing fine details [39] In orderto perform this task Perona and Malik (PM) [18] developedan anisotropic diffusionmethod amultiscale smoothing andthe edge detection scheme which were a powerful concept
International Journal of Biomedical Imaging 3
in image processing The anisotropic diffusion was inspiredfrom the heat diffusion equation by introducing a diffusionfunction 119892 which depended upon the norm of the gradientof the image
120597119906
120597119905= div(119892(|nabla119906|) sdot nabla119906) (1)
where nabla and 119906(119909 119905) denote gradient operation and imageintensity respectively div is the divergence operator and| sdot | denotes the magnitude The variable 119909 represents thespatial coordinate while the variable 119905 is used to enumerateiteration steps in the discrete implementation Perona andMalik suggested the following diffusion functions
119892(|nabla119906|) =1
1 + (|nabla119906|119896)2
119892(|nabla119906|) = exp[minus(|nabla119906|119896
)
2
]
(2)
where 119896 is a parameter of the norm gradient In this methodof anisotropic diffusion the norm gradient is used to detectedges or frontiers in the image as a step of intensity discon-tinuity To understand the relation between the parameter 119896and the discontinuity value |nabla119906| 119865(nabla119906) can be defined as thefollowing product 119865(nabla119906) = 119892 times nabla119906 called the flow diffusion
(i) If |nabla119906| ≫ 119896 then 119892(|nabla119906|) rarr 0 and we have a filterpass-all
(ii) If |nabla119906| ≪ 119896 then 119892(|nabla119906|) rarr 1 and we obtain anisotropic diffusion filter (like a Gaussian filter) whichis a low-pass filter that attenuates high frequencies
The one-dimensional discrete implementation of (1) isgiven by
120597119906
120597119905(119909 119905)
=120597
120597119909(119892(119909 119905) sdot nabla (119906) (119909 119905))
asymp120597
120597119909(119892(119909 119905) sdot
1
119889119909(119906(119909 +
119889119909
2 119905) minus 119906(119909 minus
119889119909
2 119905)))
asymp1
1198891199092[119892(119909 +
119889119909
2 119905) sdot (119906 (119909 + 119889119909 119905) minus 119906 (119909 119905))
minus119892(119909 minus119889119909
2 119905) sdot (119906(119909 119905) minus 119906(119909 minus 119889119909 119905))]
asymp 119865right minus 119865left if 119889119909 = 1(3)
where 119865right = 119865(119909 + (1198891199092) 119905) and 119865left = 119865(119909 minus (1198891199092) 119905)The above result is generalized in 119899-dimensional
120597119906
120597119905asymp
119899
sum
119894=1
119865119909+
119894
minus 119865119909minus
119894
(4)
if forall119894 119889119909119894= 1 119865
119909+
119894
= 119865119909119894
(119909 + (1198891199091198942) 119905) and 119865
119909minus
119894
= 119865119909119894
(119909 minus
(1198891199091198942) 119905)
Figure 2 PM anisotropic diffusion
F1F2
120599lowast1
120599lowast2
Figure 3 Directional anisotropic diffusion
Up to now the anisotropic diffusion has been definedas the case where the diffusivity is a scalar function varyingwith the location in the image As described earlier the PMdiffusion (Figure 2) limits the smoothing of an image nearthe pixels with a high gradient magnitude (edge pixels) Asthe diffusion near an edge is very weak the noise smoothingnear the edge is also small To address this diffusions usingmatrices instead of scalars have been put forward [36 4041] where the anisotropic diffusion allows the diffusion tobe different along various directions defined by the localgeometry of the structures in the image (Figure 3) Thusthe diffusion on both sides of an edge can be preventedwhile allowing the diffusion along the edgeThis prevents theedge from being smoothed and then being removed duringdenoising
The 119865 flux of the matrix diffusion (MD) form can bewritten as
div(119863nabla119906) (5)
where 119863 is a positive definite symmetrie matrix that may beadapted to the local image structure which can be written in
4 International Journal of Biomedical Imaging
Table 1 Parameters and results of different filters for vessel image
Filter 119873 119896 120573 120590 119889119905 Neig PSNR (dB) MSEGF mdash mdash mdash 2 mdash 9 times 9 377717 108620MF mdash mdash mdash mdash mdash 5 times 5 386364 89011PM 13 7 mdash mdash 015 mdash 396735 70103DAD 50 7 005 08 005 mdash 404337 58845
terms of its eigenvectors V1and V2and eigenvalues 120582
1and 120582
2
as follows
119863 = [V1 V2] [
1205821
0
0 1205822
][
[
V1198791
V1198792
]
]
(6)
Subsequently the gradient vector field can be written as
nabla119906 = 119906V1
V1+ 119906V
2
V2 (7)
Following the eigenvalues and eigenvectors that we havechosen different matrix diffusions can be obtained [3641] The diffusion matrix proposed by Weickert et al [41]had the same eigenvectors as the structure tensor witheigenvalues that are a function of the norm of the gradient[41 42] In our work we have used a 2D basis (Vlowast
1 Vlowast2) which
corresponds respectively to unit vectors in the directions ofthe gradient and to the minimal curvature of the regularized(or smoothed) version of the image which is the imageconvolved with a Gaussian filter with a standard deviation120590 This basis is of particular interest in the context ofsmall elongated structures such as blood vessels where theminimal curvature holds for the axis direction orthogonalto the gradient These directions are obtained as two of theeigenvectors of the Hessian matrix of the smoothed image119867120590(further details are described in Section 23) Therefore
the eigenvectors are defined as follows
Vlowast1 nabla119906120590
Vlowast2perp nabla119906120590
(8)
where nabla119906120590is the gradient of the image convolved with a
Gaussian filter with a standard deviation 120590 Vlowast2gives an
estimation of the vessel direction and Vlowast1is its orthogonal
Also we have used the eigenvalues in (6) as a diffusionfunction associated to each vector of the basis depending onthe first order derivative of the intensity in this directioninstead of the traditional norm of the smoothed gradientFurthermore the diffusion can be decomposed as a sum ofdiffusions in each direction of the orthogonal basis and thedivergence term can be written as [36]
div(119865) = div(2
sum
119894=1
120601119894(119906Vlowast119894
) sdot Vlowast119894) =
2
sum
119894=1
div(120601119894(119906Vlowast119894
) sdot Vlowast119894) (9)
where 119906Vlowast119894
and 120601119894indicate the first order derivative of the
intensity in the direction V119894and the 119894th diffusion function
respectively Also 1206011can be chosen to be any of the diffusivity
functions from the traditional nonhomogeneous isotropic
diffusion equation which depends on the first order deriva-tive of the intensity in this direction as 120601
1(119906Vlowast1
) = 119906Vlowast1
119890minus(119906Vlowast1
119896)2
and 1206012(119906Vlowast2
) = 120572 sdot 119906Vlowast2
with 0 lt 120572 lt 1 being only a diffusingfunction to allow smoothing in a Vlowast
2direction For further
details the reader could refer to [36 43]As in [36] we use a data attachment term with a
coefficient 120573 which allows a better control of the extent towhich the restored image differs from the original image1199060(at 119905 = 0) and of the result of the diffusion process at
convergence The anisotropic diffusion equation becomes
120597119906
120597119905=
2
sum
119894=1
div(120601119894(119906Vlowast119894
) sdot Vlowast119894) + 120573(119906 minus 119906
0) (10)
In order to evaluate the denoising effects of the directionalanisotropic diffusion (DAD) we have added aGaussianwhitenoise to each of the images in Figure 4 Once the diffusionmethod is applied to these noisy images its effectiveness inreducing the noise is got by calculating the peak signal tonoise ratio (PSNR) relative to the original image as follows
PSNR = 10 sdot log10(
1198892
MSE) (11)
where 119889 = 255 and MSE is the mean-squared error which iswritten as
MSE = 1
119873119872
119873
sum
119894=1
119872
sum
119895=1
(119868original(119894 119895) minus 119868denoised(119894 119895))2
(12)
where 119868original refers to the original image without noise and119868denoised is the image after the denoising process
The higher the PSNR is the better the effect of thedenoising is Note that this measure does not necessarilyimply that an image with a higher PSNR is also more visuallygratifying However based on our experiments using thethree test images with an additive white Gaussian noise wecan draw some observations First all the techniques we havetried have several parameters that must be selected carefullyto obtain the best results Since we have a ldquocleanrdquo originalimage as well as one with noise we can use the increment inthe PSNR value to guide our choice of the parameters Theseparameters and the obtained results are indicated in Tables 12 and 3 where we can observe that for the images corruptedwith an additive Gaussian noise the DAD method performsbetter than the PMmethod It gains a higher PSNR (404337209045 and 333515) and a smaller MSE (58845 5279932and 300557) than the aforementioned three methods
Figure 4 represents some of the best results for the differ-ent methods (GF MF PM and DAD) on the presented three
International Journal of Biomedical Imaging 5
(a) (b) (c) (d) (e) (f)
Figure 4 Original images (a) and the corresponding images with additive Gaussian noise (b) denoised images best result with GF (c) bestresult with MF (d) best result with PM filter (e) and best result with directional anisotropic diffusion filter (f)
Table 2 Parameters and results of different filters for phantom image
Filter 119873 119896 120573 120590 119889119905 Neig PSNR (dB) MSEGF mdash mdash mdash 2 mdash 5 times 5 188731 8428924MF mdash mdash mdash mdash mdash 5 times 5 202437 6147677PM 20 3 mdash mdash 015 mdash 208821 5307294DAD 75 2 005 08 005 mdash 209045 5279932
Table 3 Parameters and results of different filters for Lena image
Filter 119873 119896 120573 120590 119889119905 Neig PSNR (dB) MSEGF mdash mdash mdash 2 mdash 5 times 5 314598 464621MF mdash mdash mdash mdash mdash 5 times 5 2914504 791734PM 10 7 mdash mdash 015 mdash 329911 326562DAD 20 7 005 08 005 mdash 333515 300557
test images (Vessels phantom and Lena) For instance theresults recorded after applying the DAD method show thatthis latter improves much more the visual rendering of theimage compared to othermethods As shown in the images ofthe first row a DAD filter can effectively improves the qualityof a noisy image and also well enhances edges and preservesmore details than other filters Indeed the Gaussian filtersmooths very strongly the planar areas which causes loss ofinformation regarding the fine structures of the image and itblurs the imageTheMedian filter compared to the Gaussianfilter preserves edges but losses details Comparing the resultsof the DAD method to those obtained by the PM diffusionin Figures 5 and 6 we can derive several observations Thedenoising of PM diffusion model is sensitive to the valueof the conductance parameter 119896 and therefore smoothingis performed along ridges but not across a ridge line whichcauses enhancing the desired ridges as well as the noiseTo be compared to the DAD diffusion filter the diffusivity
is a tensor-valued function varying with the location andorientation of edges in an image So when this filter is appliedto a ridge line smoothing is performed along ridges as acrossa ridge line while preserving the details
22 Multiscale Medialness The general approach of multi-scale methods is to choose a range of scales between 119905min and119905max (corresponding to 120590min and 120590max) which are discretizedusing a logarithmic scale in order to have more accuracyfor low scales and to compute a response for each scalefrom the initial image [36 43 47] The user specifies theminimal and maximal radius of the vessels to extract Thusthe computation of the single scale response requires differentsteps First a number of points are preselected using theeigenvalues of the Hessian matrix These points are expectedto be near a vessel axis Then for each preselected point theresponse is computed at the current scale 120590 The responsefunction uses eigenvectors of the Hessianmatrix of the image
6 International Journal of Biomedical Imaging
Figure 5 PM anisotropic diffusion (119896 = 3119873 = 100)
Figure 6 Directional anisotropic diffusion (119896 = 3 119873 = 100 120572 =
05)
to define at each point an orientation 119863(120590 119909) orthogonal tothe axis of a potential vessel that goes through119872 From thisdirection the two points located at an equal distance of119872 inthe direction 119863 noted 119872
1and 119872
2(Figure 7) The response
119877120590(119868) at 119872 is taken as the maximum absolute value among
these two points of the first derivative of the intensity in the119863 direction
119877120590(119909)
= maxnabla120590119868(120590 119909 + 120590 sdot 119889) sdot (+119889) nabla
120590119868(120590 119909 minus 120590 sdot 119889) sdot (minus119889)
(13)
where 119889 is the unitary vector of the direction 119863 that is119889 =
997888rarrV1 and nabla
120590119868 is the gradient of the image at the scale 120590
nabla120590119868 is obtained by the convolution with the first derivative
of a Gaussian function of the standard deviation 120590 wheremultiplying the derivatives by 120590 ensures the scale invarianceproperty and allows comparing the responses obtained fromdifferent scalesThe gradient vectornabla
120590119868 can be computed by a
bilinear interpolation for better accuracy which is especiallyneeded when looking at small vessels [37 39]
A vessel of a radius 119903 is detected at a scale 119905 so we usethe scales corresponding to each radius for the multiscaleprocessing For a fixed scale 119905 we calculate a responseimage 119877
119905(119868) where 119868 is the initial image Then we calculate
nablaI(120590 x + r middot d)
+d
x + r middot d
x
x minus r middot d
minusd
nablaI(120590 x minus r middot d)
Figure 7 Representation of vesselness measure calculation (fromthe point 119909 on the central line 119889 is the unit vector perpendicular tothe main direction of the vessel and 119903 = 120590 is the current scale)
the multiscale response for the image 119877multi(119868) which is themaximum of the responses over scales for each point 119909 isin 119868
and a range [119905min 119905max] of scale
119877multi(119909) = max119905
119877119905(119909) 119905 isin [119905min 119905max] (14)
This response119877multi(119909) can be interpreted as an indicator thatthe point 119909 belongs to the center line of a vessel and119877
119905(119909) can
be interpreted as an indicator that the point 119909 belongs to thecenter line of a vessel with a radius 119905 Finally this responseis normalized to give a multiscale response that combinesinteresting features of each single scale response
One difficulty with the multiscale approach is that wewant to compare the result of a response function at differentscales whereas the intensity and its derivatives are decreasingscale functions So far all considerations have been made ata single scale defined by the scale parameter 120590 In his workabout scale space theory Lindeberg and Fagerstrom [48]showed the need for a multiscale analysis to take the varyingsize of objects into account He also showed the necessity ofnormalizing the spatial derivatives between different scalesThus the normalized vesselness response is obtained by theproduct of the normalization term 120590
120574 and the final vesselness
119877lowast(Σ 120574 119909) = max
120590isinΣ
120590120574sdot 119877(120590 119909) = max
119894=1119899
120590120574
119894sdot 119877(120590119894 119909) (15)
The parameter 120574 can be used to indicate the preference fora particular scale (Figure 8) If it is set to one no scale ispreferred Besides the multiscale response is got by selectingthe maximum response over a set of different scales between120590min and 120590max
23 Extraction of Local Orientations The proposed modelassumes that the intensity profile of the vessels in the crosssection is Gaussian (Figure 9) This is a common assumptionthat it is employed in numerous algorithms [28 35 49]
International Journal of Biomedical Imaging 7
(a) (b) (c)
Figure 8 Influence of the normalization parameter 120574 on multiscale response (a) 120574 = 1 is neutral (b) 120574 gt 1 favors large scales finally (c)120574 lt 1 favors small scales
(a)
160
150
140
130
120
Y
0
50
100
150 X050
100
150
(b)
Figure 9 Example of cross sectional profile of blood vessel from gray scale 2D image (the gray intensities are plotted in a 3D view The 119909 119910axis is the position of the pixel in the 2D plane of the image whereas the 119911-axis is the gray value or intensity of the pixel)
It is also commonly assumed that the intensity does notchange much along vessels [49ndash51] Recently the Hessianmatrix could be used to describe the local shape charac-teristics and orientation for elongated structures [35 52]The eigenvalues of this matrix when the gradient is weakexpress the local variation of the intensity in the directionof the associated eigenvectors Subsequently we assume thatwe want to characterize the dark vessels (low intensity) on awhite background (high intensity)
Let us denote 1205821and 120582
2as the eigenvalues of the Hessian
matrix with 1205821
ge 1205822and 997888rarrV
1 997888rarrV2being their associated
eigenvectors (Figure 10) For a linear model with a Gaussiancross section the vessel direction is defined by the eigenvectorwith the smallest eigenvalue at the center of the vessel but itis less determined at the contours because both eigenvaluesof the Hessian matrix are zero
To summarize for an ideal linear structure in a 2D image
100381610038161003816100381612058221003816100381610038161003816 asymp 0
100381610038161003816100381612058211003816100381610038161003816 gt
100381610038161003816100381612058221003816100381610038161003816
(16)
In retinal images some large vessels may have a whiteline in their center and some elongated and disjoint spots(Figures 11(a) 11(b) and 11(c)) accordingly the vessels donot invalidate the Gaussian profile assumption So such linesare usually lost after the preselection of vessel pixels usingthe Hessian eigenvalue analysis and classified as backgroundpixels Therefore the responses of the gradient magnitudeare a task which is of particular importance in improvingthe detection vessels (Figure 11) The experimental results aredemonstrated in Figure 11 which shows hand labeled ldquotruthrdquoimages and segmented images obtained respectively by theHessian eigenvalue analysis and the gradient magnitudeFrom these results we can deduce that responses based on thegradient magnitude can availably detect white lines as vesselpixels an removes some noise spots
3 Results
In this section the proposed method has been evaluated ontwo publicly available retinal image databases the STAREdatabase [33] and the DRIVE database [25] The STARE
8 International Journal of Biomedical Imaging
(a)
140
130
120
110
100
90
80160 165 170 175 180 185
(b)
Eige
nval
ue
8
6
4
2
0
minus2
minus4
minus6
minus8
Pixel160 165 170 175 180 185
(c)
Figure 10 Eigenvalue analysis (a) vessel cross section (b) intensity distribution (120590 = 455) vessel cross section (c) corresponding eigenvalues
(a) (b) (c)
(d) (e) (f)
(g) (h) (i)
Figure 11 Retinal blood vessel detection (a b and c) original images [33] (dndashg endashh and fndashi) subimage of hand labeled image vessel detectionbased Hessian eigenvalue analysis and improved vessel detection with gradient magnitude
International Journal of Biomedical Imaging 9
(a) (b)
Figure 12 Binary mask of STARE project retinal image [33]
dataset contains twenty fundus colour retinal images ten ofwhich are from healthy ocular fundi and the other ten arefrom unhealthy onesThese images are captured by a TopconTRV-50 fundus camera at a 35 Field Of View (FOV) whichhave digitized with a 24-bit gray-scale resolution and a sizeof 700 times 605 pixels The dataset provides two sets of standardhand-labeled segmentations which are manually segmentedby two eye specialistsWe create for this dataset a binarymaskof the gray channel of the image using a simple thresholdtechnique (Figure 12) We adapt the first eye specialist handlabelled as the ground truth to evaluate our vessel detectiontechnique The DRIVE dataset consists of 40 fundus ocularimages which have been divided into a training set and atest set by the authors of the database These images arecaptured by the Canon CR5 camera at 45 FOV which havebeen digitized at 24 bits with a resolution of 565 times 584 pixelsThe dataset also gives two sets of standard hand-labeledsegmentations by two human experts as a 9-ground truth
The first expert hand labelled segmentation has beenadapted as a ground truth to evaluate segmentation tech-niques on both STARE and DRIVE datasets It is a commonpractice to evaluate the performance of retinal vessel seg-mentation algorithms using receiver operating characteristic(ROC) curves [25 35] An ROC curve plots the fractionof pixels correctly classified as vessels namely the truepositive ra te (TPR) versus the fraction of pixels wronglyclassified as vessels namely the false positive rate (FPR) byvarying the rounding threshold 119879 from 0 to 1 (Figure 13)The closer the curve approaches the top left corner the betterthe performance of the system In order to facilitate thecomparisonwith other retinal vessel detection algorithms wehave selected the value of the area under the curve (AUC)which is 1 for an ideal system
To measure the performance of the proposed enhance-ment filter we ran our multiscale analysis filter with thefollowing set of parameters
(i) 119903min 119903max 119904 and the minimal and maximal radii usedin this application are 119903min = 125 and 119903max = 7 dis-cretized using 119904 = 4 scales
(ii) the parameter 120574 set to one to indicate no scale ispreferred
(iii) the value 119896 is a constant threshold on the norm ofgradient on the image
(iv) 119873 is the number of iterations for the anisotropicdiffusion filter
The computing time of our algorithm for an image of theSTARE database is about 64 seconds including anisotropicdiffusion filtering and about the same time for the DRIVEdatabase The implementation of the filter has been done inMATLAB on a personal computer with a 213 Intel CoreDuo processor and 4GB of memory In the first experimentwe apply a preprocessing task such as filtering data withan anisotropic diffusion version cited above in order toremove or at least reduce noise The DAD filter denoisesthe original image by preserving edges and details To showthat the segmentationworks betterwith anisotropic diffusionFigure 14 presents a segmentation result before and after theapplication of the anisotropic diffusion scheme In this figurewe show the improvements provided by the DAD modelwhich tends to remove noise effects and unfortunatelysmaller objects So it preserves efficiently the vessels whilemaking the background more homogeneous
On the other hand for computing the response it ispossible to retain the mean of the two calculated values (thegradient of the two points located at an equal distance fromthe current point) like in the 3D case proposed by [36] orthe minimal calculated value in the 2D case [37] We preferretaining the maximum of these two values Figure 15 showsa synthetic image which consists of 100 times 100 pixels with an 8-bit resolution We have chosen this image because it containsan object close to the vessel form The latter figure shows thesegmentation results by maximum average and minimumresponse functions We note that for the case of minimum oraverage responses the ring is not completely detected like inthe original image since we can see it has beenmissing pixelsbelonging to the edges in contrast to maximum case wherethe extraction of the ring is complete Table 4 presents theAUC calculatedwith ourmethod for the test set of the STARE
10 International Journal of Biomedical Imaging
(a) (b)
True
pos
itive
rate
(sen
sitiv
ity)
1
09
08
07
06
05
04
03
02
01
00 01 02 03 04 05 06 07 08 09 1
ROC curve AUC = 0907
Conv hull AUC = 0907
Acc(0) = 00973
Max acc 0944
False positive rate (1 minus specificity)
(c)
Figure 13 ROC curve of retinal image (06 testtif) downloaded from DRIVE dataset [34] (a) original image (b) segmented image (c) Roccurve
(a) (b) (c) (d)
Figure 14 Effect of anisotropic diffusion (a) Green channel of the original image downloaded from the STARE project dataset [33] (b)Subimage of the original image rescaled for better visualization (c) segmentation without anisotropic diffusion and (d) segmentation withanisotropic diffusion 119896 = 125 120573 = 005 and119873 = 30
International Journal of Biomedical Imaging 11
Figure 15 Original synthetic image maximum response average response and minimum response 120590 isin 025 05 1 2 4 (left to right-topto bottom)
Table 4 STARE project database [33]
Mean Min MaxAUC 09329 09053 09445
database using the green channel images As given in thetable the experimental results show that themaximummodel(AUC = 09445) performs much better than the average(AUC = 09329) or minimummodel (AUC = 09053)
Figure 16 presents the obtained response image of a realretinal image where four scales have been used for radii ofvessels ranging from 125 to 7 125 222 4 7 This figureshows that small and large vessels can be better distinguishedin the maximum case than the minimum or average ones
Although the contrast is not very high in the originalfigure (Figure 14(a)) the method detects most vessels overa large size range For example in Figure 17 an image ofthe retinal tree vasculature is presented where differentresponses recorded at increasing scales are represented Thelast image shows a quite good performance of the vesselsubtraction Yet Figure 18 proves that it is possible to design asystem that approaches the performance of human observers
In order to evaluate the suggested method experimentresults of the 20-image sets of the STARE database are shownin Table 5 In Table 6 our method is compared to the most
Table 5 ROC curve analysis of STARE project database [33]
Number MAA TPR FPR1 09014 05537 003982 08740 01178 000453 09168 03819 001194 09286 05525 001355 09240 05678 002186 09414 05128 001397 09672 07626 001418 09683 07534 001499 09652 07366 0012310 09420 06171 0018211 09503 06379 0013312 09655 07694 0010513 09864 06992 0018014 09480 06899 0016215 09487 06882 0020716 09226 06788 0021517 09499 07099 0016818 09484 06812 0010219 09585 06058 0011420 09345 06000 00172
AvMAA AvTPR AvFPR09402 06145 00162
12 International Journal of Biomedical Imaging
Figure 16 Real angiography image downloaded from DRIVE dataset [34] average response maximum response and minimum response(left to right-top to bottom)
Table 6 Comparison of vessel segmentation results on STAREproject database [33]
Method MAA TPR FPR2nd humanobserver 09354 08949 00610
Hoover [33 35] 09267 06751 00433Mendonca (green)[21] 09440 06996 00270
Staal [25] 09516 06970 00190Soares [44] 09480 07165 00252Matched filter [13] 09384 06134 00245Martinez-Perez[45] 09410 07506 00431
MF-FDOG [14] 09484 07177 00247Proposed method 09402 06145 00162
recent methods in terms of TPR FPR and maximum accu-racy average (MAA) where the maximal accuracy indicates
how to extract a binary image that matches the vessel imagesto a high degree The accuracy is estimated by the ratio ofthe sum of the number of correctly classified foreground andbackground pixels divided by the total number of pixels inthe image In this latest table the performance measures ofStaal et al [25] Zhang et al [14] Mendonca and Campilho[21] Chaudhuri et al [13] Martinez-Perez et al [45] andHoover et al [35] have been reported by their original papersIn addition these performance results are the average valuesfor the whole set of 20 images except the method of Staal[25] which used 19 out of 20 images of the STARE imagesamong which ten were healthy and nine were unhealthyTable 5 presents our results on all 20 images in the STAREdatabase estimated using the hand-labeled images set ofthe first human expert designated as a ground truth Theestimated experimental results are the average TPR = 06145
corresponding to an FPR of around 00162 and a maximumaverage accuracy MAA = 09402 The results show that ourmethod has a competitive maximum average accuracy valuewhere it performs better than the matched filter [13] andremains close to the others
International Journal of Biomedical Imaging 13
Figure 17 Different responses for different scales of Figure 14(a) (top to bottom) the first four images show the vesselness obtained atincreasing scales The last image is the result after the scale selection procedure (normalized image)
The results of the proposed method are also comparedwith those on twenty images from the DRIVE databaseand the result is depicted in Table 7 The hand-labeledimages by the first human expert have been used as groundtruth The experimental results show an MAA around of09155 Also we have compared the performance of thesuggested technique with the sensitivities and specificities ofthe methods cited in Table 7 It has been found that for theDRIVE database the method has provided a sensitivity of05879 and a specificity of 00166 We have shown that theproposed method performs well with a lower specificity evenin the presence of lesions in the abnormal images
4 Conclusion
The purpose of this work is to detect linear structures inreal retinal images in order to help the interpretation ofthe vascular network We put forward to combining ananisotropic diffusion filter to reduce the image noise with amultiscale response based on the eigenvectors of the Hessianmatrix and on the gradient information to extract vesselsfrom retinal images The main advantage of this techniqueis its ability to extract large and fine vessels at various imageresolutions Furthermore the directional anisotropic diffu-sion plays a vital role in denoising images and in decreasing
14 International Journal of Biomedical Imaging
Figure 18 An image of a retina [35] the segmented image and the hand labeled ldquotruthrdquo images (im0077vk and im0077ah) (left to right-topto bottom) [33]
Table 7 Comparison of vessel segmentation results on DRIVEdatabase [34]
Method MAA TPR FPR2nd humanobserver [34] 09473 07761 00275
Martinez-Perez[45] 09344 07246 00345
Staal [25 34] 09442 07194 00227Mendonca [21] 09452 07344 00236Matched filter [13] 09284 06168 00259Niemeijer [34 46] 09417 06898 00304Proposed method 09155 05879 00166
the difficulty of vessel extraction especially for thin vesselsOur first results show the robustness of the method againstnoise as well as its applicability to detect blood vessels TheMAA is used as a performance measure and the valuesachieved with our algorithm are competitive compared to theexisting methods Therefore from the experimental resultsit can be seen that the number of classified pixels has beenslightly lower compared to the other methods using thesame database mainly due to the weakness of blood vesselscausing missing vessels and also because of lesions resultingin a detection error Also the retinal images suffer fromnonuniform illumination and have a poor contrast Thus
to avoid wrong classified pixels ormiss classified ones causedby an occasional falsemeasurement this system can very wellbe improved in the future with adding for instance somepostprocessing tasks to reachmore accuratemeasurement forblood vessels
Conflict of Interests
The authors declare that there is no conflict of interestsregarding to the publication of this paper
References
[1] R Williams M Airey H Baxter J Forrester T Kennedy-Martin and A Girach ldquoEpidemiology of diabetic retinopathyand macular oedema a systematic reviewrdquo Eye vol 18 no 10pp 963ndash983 2004
[2] R Gupta and P Kumar ldquoGlobal diabetes landscape-type 2diabetes mellitus in South Asia epidemiology risk factors andcontrolrdquo Insulin vol 3 no 2 pp 78ndash94 2008
[3] J Malek M Ben Abdallah A Mansour and R TourkildquoAutomated optic disc detection in retinal images by applyingregion-based active aontour model in a variational level setformulationrdquo in Proceedings of the International Conference onComputer Vision in Remote Sensing (CVRS rsquo12) pp 39ndash44Xiamen China December 2012
[4] J Malek and R Tourki ldquoBlood vessels extraction and classifi-cation into arteries and veins in retinal imagesrdquo in Proceedings
International Journal of Biomedical Imaging 15
of the 10th International Multi-Conference on Systems Signals ampDevices (SSD rsquo13) pp 1ndash6 Hammamet Tunisia March 2013
[5] J Malek and R Tourki ldquoInertia-based vessel centerline extrac-tion in retinal imagerdquo in Proceedings of the InternationalConference on Control Decision and Information Technologies(CoDIT rsquo13) pp 378ndash381 Hammamet Tunisia May 2013
[6] M Al-Rawi M Qutaishat and M Arrar ldquoAn improvedmatched filter for blood vessel detection of digital retinalimagesrdquo Computers in Biology and Medicine vol 37 no 2 pp262ndash267 2007
[7] M E Tyler L D Hubbard K Boydston and A J PuglieseldquoCharacteristics of digital fundus camera systems affecting tonalresolution in color retinal imagesrdquo The Journal of OphthalmicPhotography vol 31 no 1 pp 1ndash9 2009
[8] T W Hansen J Jeppesen S Rasmussen H Ibsen and CTorp-Pedersen ldquoAmbulatory blood pressure and mortality apopulation-based studyrdquo Hypertension vol 45 no 4 pp 499ndash504 2005
[9] T Teng M Lefley and D Claremont ldquoProgress towardsautomated diabetic ocular screening a review of image analysisand intelligent systems for diabetic retinopathyrdquo Medical andBiological Engineering and Computing vol 40 no 1 pp 2ndash132002
[10] M Ben Abdallah J Malek R Tourki J E Monreal andK Krissian ldquoAutomatic estimation of the noise model infundus imagesrdquo in Proceedings of the 10th International Multi-Conference on Systems Signals amp Devices (SSD rsquo13) pp 1ndash5Hammamet Tunisia March 2013
[11] N Patton T M Aslam T MacGillivray et al ldquoRetinal imageanalysis concepts applications and potentialrdquo in Progress inRetinal and Eye Research vol 25 pp 99ndash127 2006
[12] TWalter J-C Klein P Massin and A Erginay ldquoA contributionof image processing to the diagnosis of diabetic retinopathy-detection of exudates in color fundus images of the humanretinardquo IEEE Transactions on Medical Imaging vol 21 no 10pp 1236ndash1243 2002
[13] S Chaudhuri S Chatterjee N Katz M Nelson and MGoldbaum ldquoDetection of blood vessels in retinal images usingtwo-dimensionalmatched filtersrdquo IEEETransactions onMedicalImaging vol 8 no 3 pp 263ndash269 1989
[14] B Zhang L Zhang L Zhang and F Karray ldquoRetinal vesselextraction by matched filter with first-order derivative ofGaussianrdquo Computers in Biology andMedicine vol 40 pp 438ndash445 2010
[15] J Malek A T Azar and R Tourki ldquoImpact of retinal vasculartortuosity on retinal circulationrdquo Neural Computing and Appli-cations 2014
[16] M Sofka and C V Stewar ldquoRetinal vessel extraction usingmultiscalematched filters confidence and edgemeasuresrdquo TechRep Department of Computer Science Rensselaer PolytechnicInstitute 2005
[17] Y Sato S Nakajima N Shiraga et al ldquoThree-dimensionalmulti-scale line filter for segmentation and visualization ofcurvilinear structures in medical imagesrdquoMedical Image Anal-ysis vol 2 no 2 pp 143ndash168 1998
[18] RMRangayyan FOloumi FOloumi P Eshghzadeh-Zanjaniand F J Ayres ldquoDetection of blood vessels in the retina usingGabor filtersrdquo in Proceedings of the 20th Canadi an Conferenceon Electrical and Computer Engineering (CCECE rsquo07) pp 717ndash720 Vancouver Canada April 2007
[19] T Pock C Janko R Beichel and H Bischof ldquoMultiscalemedialness for robust segmentation of 3D tubular structuresrdquo
in Proceedings of the 10th Computer Vision with Workshop TheAustrian Science Fund (FWF) under the grants P17066-N04February 2005
[20] M G Cinsdikici and D Aydin ldquoDetection of blood ves-sels in ophthalmoscope images using MFant (matched fil-terant colony) algorithmrdquo Computer Methods and Programs inBiomedicine vol 96 no 2 pp 85ndash95 2009
[21] A M Mendonca and A Campilho ldquoSegmentation of retinalblood vessels by combining the detection of centerlines andmorphological reconstructionrdquo IEEE Transactions on MedicalImaging vol 25 no 9 pp 1200ndash1213 2006
[22] F Zana and J-C Klein ldquoSegmentation of vessel-like patternsusing mathematical morphology and curvature evaluationrdquoIEEE Transactions on Image Processing vol 10 no 7 pp 1010ndash1019 2001
[23] MM Fraz M Y Javed and A Basit ldquoEvaluation of retinal ves-sel segmentationmethodologies based on combination of vesselcenterlines and morphological processingrdquo in Proceedings ofthe 4th IEEE International Conference on Emerging Technologies(ICET rsquo08) pp 232ndash236 Rawalpindi Pakistan October 2008
[24] L Gang O Chutatape and S M Krishnan ldquoDetection andmeasurement of retinal vessels in fundus images using ampli-tude modified second-order Gaussian filterrdquo IEEE Transactionson Biomedical Engineering vol 49 no 2 pp 168ndash172 2002
[25] J Staal M D Abramoff M Niemeijer M A Viergever andB Van Ginneken ldquoRidge-based vessel segmentation in colorimages of the retinardquo IEEETransactions onMedical Imaging vol23 no 4 pp 501ndash509 2004
[26] P C Siddalingaswamy ldquoAutomatic detection of multiple ori-ented blood vessels in retinal imagesrdquo Journal of BiomedicalScience and Engineering vol 3 pp 101ndash107 2010
[27] S Dua N Kandiraju and H W Thompson ldquoDesign andimplementation of a unique blood-vessel detection algorithmtowards early diagnosis of diabetic retinopathyrdquo in Proceedingsof the IEEE International Conference on Information TechnologyCoding and Computing vol 1 pp 26ndash31 April 2005
[28] A Frangi Three-dimensional model -based analysis of vascularand cardiac images [PhD thesis] Utrecht University UtrechtThe Netherlands 2001
[29] C Lorenz I-C Carlsen T M Buzug C Fassnacht and JWeese ldquoMulti scale line segmentation with automatic esti-mation of width contrast and tangential direction in 2d and3d medical imagesrdquo in Proceedings of the 1st Joint ConferenceComputer Vision Virtual Reality and Robotics in Medicine andMedical Robotics and Computer-Assisted Surgery (CVRMed-MRCAS rsquo97) pp 233ndash242 Springer London UK 1997
[30] J L Federman PGourasH Schubert et al ldquoSystemic diseasesrdquoin Retina and Vitreous Textbook of Ophthalmology S M Podosand M Yano Eds vol 9 pp 7ndash24 Mosby St Louis Mo USA1994
[31] W Huang Automatic Detection and Quantification of BloodVessels in the Vicinity of the Optic Disc in Digital Retinal ImagesUniversity of Waikato 2006
[32] httpreferencemedscapecomfeaturesslideshowretina[33] A Hoover ldquoSTARE databaserdquo httpwwwcesclemsonedusim
ahooverstare[34] M Niemeijer and B van Ginneken 2002 httpwwwisiuunl
ResearchDatabasesDRIVEresultsphp[35] A Hoover V Kouznetsova andM Goldbaum ldquoLocating blood
vessels in retinal images by piecewise threshold probing of amatched filter responserdquo IEEETransactions onMedical Imagingvol 19 no 3 pp 203ndash210 2000
16 International Journal of Biomedical Imaging
[36] K Krissian ldquoFlux-based anisotropic diffusion applied toenhancement of 3-D angiogramrdquo IEEE Transactions onMedicalImaging vol 21 no 11 pp 1440ndash1442 2002
[37] C Blondel Modelisation 3D et 3D + t des arteres coronaires apartir de sequences rotationnelles de projections rayons X [PhDthesis] University of Nice Sophia Antipolis Nice France 2004
[38] M Ben Abdallah J Malek R Tourki and K KrissianldquoRestoration of retinal images using anisotropic diffusion likealgorithmsrdquo in Proceedings of the International Conference onComputer Vision in Remote Sensing (CVRS rsquo12) pp 116ndash121Xiamen China December 2012
[39] K Krissian G Malandain N Ayache R Vaillant and YTrousset ldquoModel-based detection of tubular structures in 3Dimagesrdquo Computer Vision and Image Understanding vol 80 no2 pp 130ndash171 2000
[40] G-H Cottet and L Germain ldquoImage processing throughreaction combined with nonlinear diffusionrdquo Mathematics ofComputation vol 61 no 204 pp 659ndash673 1993
[41] J Weickert ldquoScale-space properties of nonlinear diffusionfiltering with a diffusion tensorrdquo Tech Rep 110 University ofKaiserslautern Kaiserslautern Germany 1994
[42] J Bigun G H Granlund and J Wiklund ldquoMultidimensionalorientation estimation with applications to texture analysisand optical flowrdquo IEEE Transactions on Pattern Analysis andMachine Intelligence vol 13 no 8 pp 775ndash790 1991
[43] M Ben Abdallah M Jihene K Krissian and R Tourki ldquoAnautomated vessel segmentation of retinal images using multi-scale vesselnessrdquo in Proceedings of the 8th International Multi-Conference on Systems Signals amp Devices IEEE 2011
[44] J V B Soares J J G Leandro R M Cesar Jr H F Jelinekand M J Cree ldquoRetinal vessel segmentation using the 2-DGabor wavelet and supervised classificationrdquo IEEE Transactionson Medical Imaging vol 25 no 9 pp 1214ndash1222 2006
[45] M E Martinez-Perez A D Hughes S AThom A A Bharathand K H Parker ldquoSegmentation of blood vessels from red-freeand fluorescein retinal imagesrdquoMedical Image Analysis vol 11no 1 pp 47ndash61 2007
[46] M Niemeijer J Staal B van Ginneken M Loog and M DAbramoff ldquoComparative study of retinal vessel segmentationmethods on a new publicly available databaserdquo in Proceedingsof the SPIEMedical Imaging M Fitzpatrick andM Sonka Edsvol 5370 pp 648ndash656 2004
[47] X Jiang and D Mojon ldquoAdaptive local thresholding byverification-based multithreshold probing with application tovessel detection in retinal imagesrdquo IEEE Transactions on PatternAnalysis andMachine Intelligence vol 25 no 1 pp 131ndash137 2003
[48] T Lindeberg and D Fagerstrom ldquoScale-space with casual timedirectionrdquo in Proceedings of the 4th European Conference onComputer Vision (ECCV rsquo96) pp 229ndash240 Cambridge UKApril 1996
[49] W Changhua G Agam and P Stanchev ldquoA general frameworkfor vessel segmentation in retinal imagesrdquo in Proceedings ofthe International Symposium on Computational Intelligence inRobotics and Automation (CIRA rsquo07) June 2007
[50] X Qian M P Brennan D P Dione et al ldquoA non-parametricvessel detection method for complex vascular structuresrdquoMed-ical Image Analysis vol 13 no 1 pp 49ndash61 2008
[51] L Wang A Bhalerao and R Wilson ldquoAnalysis of retinalvasculature using a multiresolution hermite modelrdquo IEEETransactions onMedical Imaging vol 26 no 2 pp 137ndash152 2007
[52] A P Witkin ldquoScale-space filtering a new apporach to multiscale descriptionrdquo in Proceedings of the IEEE InternationalConference on Acoustics Speech and Signal Processing (ICASSPrsquo84) pp 150ndash153 March 1984
Submit your manuscripts athttpwwwhindawicom
VLSI Design
Hindawi Publishing Corporationhttpwwwhindawicom Volume 2014
International Journal of
RotatingMachinery
Hindawi Publishing Corporationhttpwwwhindawicom Volume 2014
Hindawi Publishing Corporation httpwwwhindawicom
Journal ofEngineeringVolume 2014
Hindawi Publishing Corporationhttpwwwhindawicom Volume 2014
Shock and Vibration
Hindawi Publishing Corporationhttpwwwhindawicom Volume 2014
Mechanical Engineering
Advances in
Hindawi Publishing Corporationhttpwwwhindawicom Volume 2014
Civil EngineeringAdvances in
Acoustics and VibrationAdvances in
Hindawi Publishing Corporationhttpwwwhindawicom Volume 2014
Hindawi Publishing Corporationhttpwwwhindawicom Volume 2014
Electrical and Computer Engineering
Journal of
Hindawi Publishing Corporationhttpwwwhindawicom Volume 2014
Distributed Sensor Networks
International Journal of
The Scientific World JournalHindawi Publishing Corporation httpwwwhindawicom Volume 2014
SensorsJournal of
Hindawi Publishing Corporationhttpwwwhindawicom Volume 2014
Modelling amp Simulation in EngineeringHindawi Publishing Corporation httpwwwhindawicom Volume 2014
Hindawi Publishing Corporationhttpwwwhindawicom Volume 2014
Active and Passive Electronic Components
Hindawi Publishing Corporationhttpwwwhindawicom Volume 2014
Chemical EngineeringInternational Journal of
Control Scienceand Engineering
Journal of
Hindawi Publishing Corporationhttpwwwhindawicom Volume 2014
Antennas andPropagation
International Journal of
Hindawi Publishing Corporationhttpwwwhindawicom Volume 2014
Hindawi Publishing Corporationhttpwwwhindawicom Volume 2014
Navigation and Observation
International Journal of
Advances inOptoElectronics
Hindawi Publishing Corporation httpwwwhindawicom
Volume 2014
RoboticsJournal of
Hindawi Publishing Corporationhttpwwwhindawicom Volume 2014
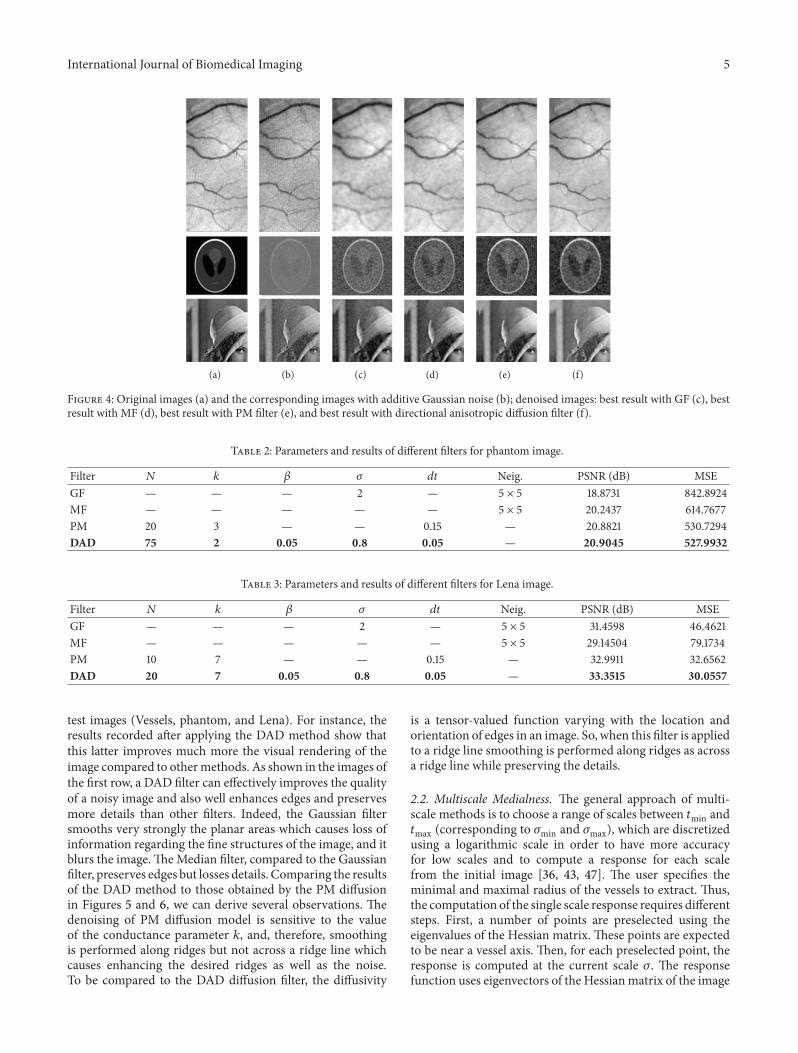
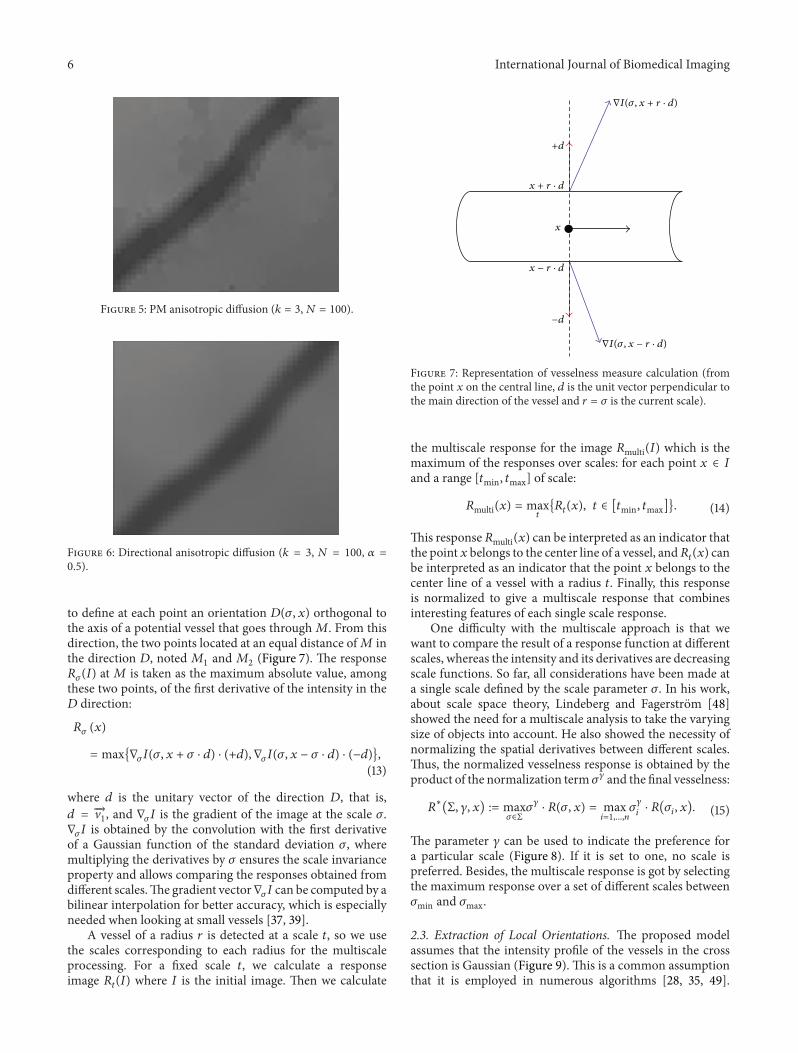
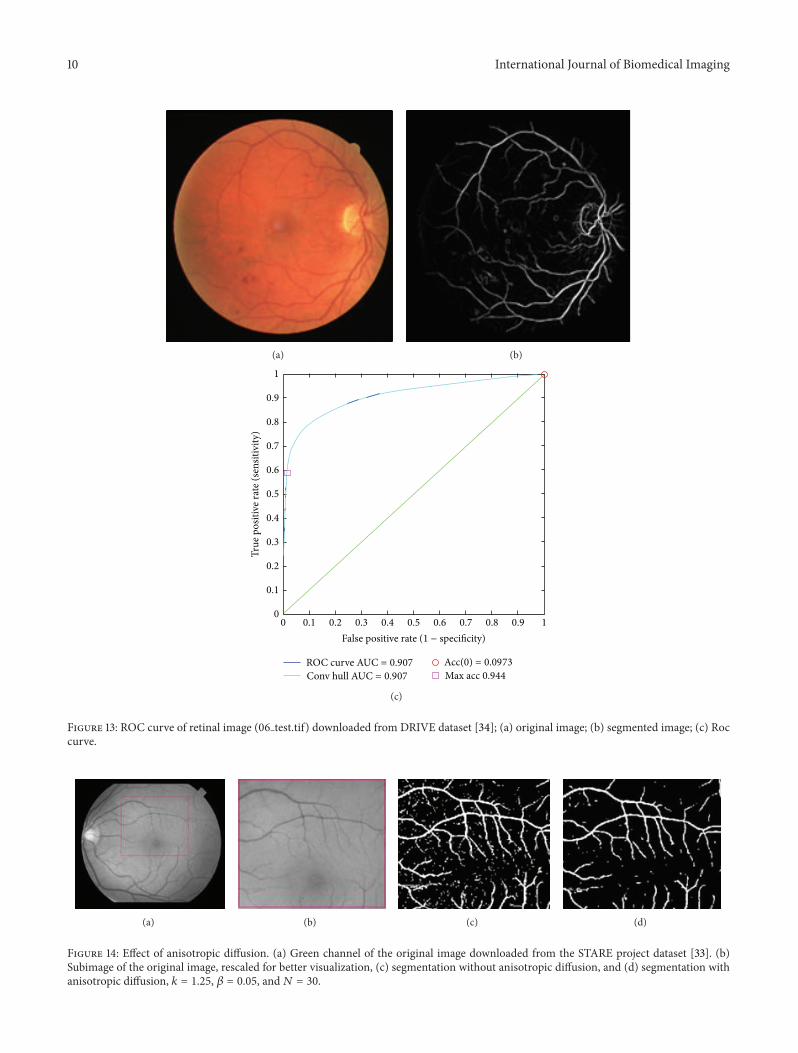
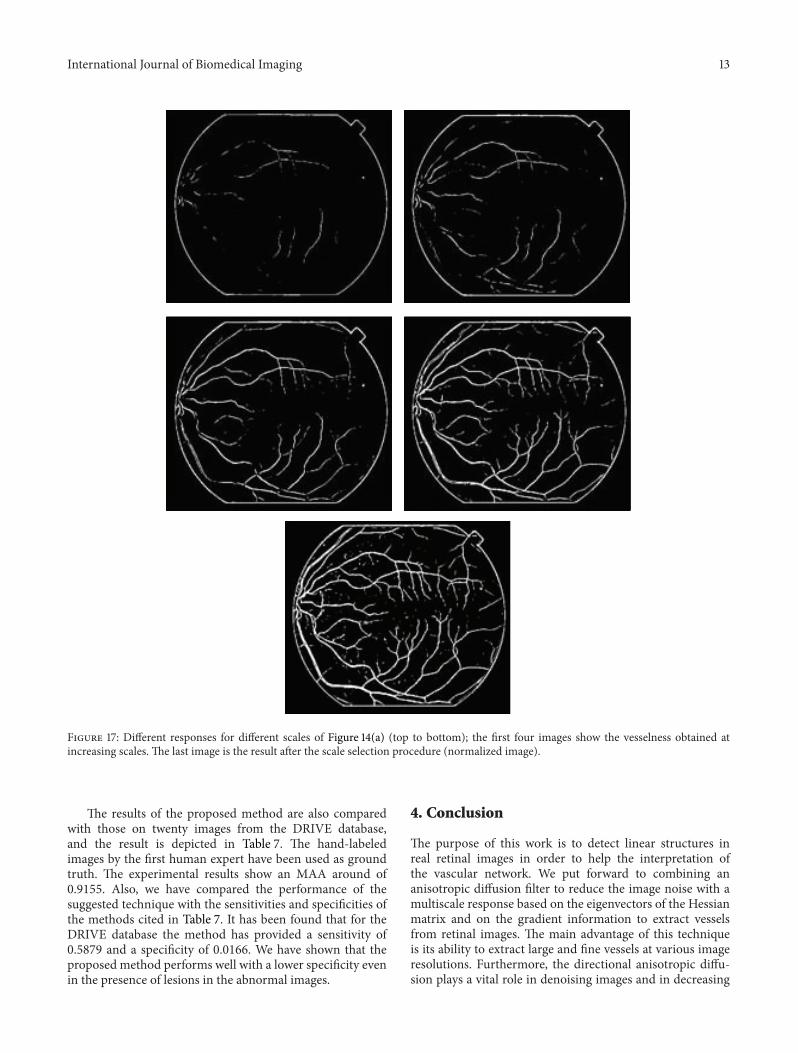