Microglial changes occur without neural cell death in diabetic retinopathy
Upload
independentCategory
view
1download
0
Detection and Classification of Diabetic Retinopathy using Retinal Images
Kanika Verma, Prakash Deep and A. G. Ramakrishnan, Senior Member, IEEE Medical Intelligence and Language Engineering Lab
Department of Electrical Engineering, Indian Institute of Science, Bangalore – 560012, India.
Email: [email protected], [email protected] and [email protected]
Abstract—Diabetes occurs when the pancreas fails to secrete enough insulin, slowly affecting the retina of the human eye. As it progresses, the vision of a patient starts deteriorating, leading to diabetic retinopathy. In this regard, retinal images acquired through fundal camera aid in analyzing the consequences, nature, and status of the effect of diabetes on the eye. The objectives of this study are to (i) detect blood vessel, (ii) identify hemorrhages and (iii) classify different stages of diabetic retinopathy into normal, moderate and non-proliferative diabetic retinopathy (NPDR). The basis of the classification of different stages of diabetic retinopathy is the detection and quantification of blood vessels and hemorrhages present in the retinal image. Retinal vascular is segmented utilising the contrast between the blood vessels and surrounding background. Hemorrhage candidates were detected using density analysis and bounding box techniques. Finally, classification of the different stages of eye disease was done using Random Forests technique based on the area and perimeter of the blood vessels and hemorrhages. Accuracy assessment of the classified output revealed that normal cases were classified with 90% accuracy while moderate and severe NPDR cases were 87.5% accurate.
Keywords- retina, blood vessel, hemorrhages, classification, diabetic retinopathy
I. INTRODUCTION Diabetes is a disease which occurs when the pancreas does
not secrete enough insulin or the body is unable to process it properly. As diabetes progresses, the disease slowly affects the circulatory system including the retina and occurs as a result of long term accumulated damage to the blood vessels, declining the vision of the patient leading to diabetic retinopathy. After 15 years of diabetes about 10% of people become blind and approximately 2% develop severe visual impairment. According to an estimate by WHO, more than 220 million people worldwide have diabetes [1]. It is the sixth largest cause of blindness among the people of working age in India, making it the world’s diabetic capital.
Retinal images acquired through fundal camera with back-mounted digital camera [2] provide useful information about the consequence, nature, and status of the effect of diabetes on the eye. These images assist ophthalmologist to evaluate patients in order to plan different forms of management and monitor the progress more efficiently [3]. The retinal
microvasculature is unique in that it is the only part of human circulation that can be directly visualised non-invasively in vivo, and can be easily photographed for digital image analysis [2].
Earlier, Otsu, (1979) [4] presented a nonparametric and unsupervised method of automatic threshold selection for picture segmentation. This utilises only the zeroth- and the first-order cumulative moments of the gray-level histogram. Chaudhuri et al., (1989) [5] addressed the problem of detecting blood vessels which have usually poor local contrast and emphasises that existing edge detection algorithm yield unsatisfactory results. They proposed an operator for feature extraction based on optical and spatial properties of the object to be recognized. Patton et al., (2006) [2] outlined the segmentation of retinal landmarks upon which retinal digital image analysis is based. Hatanaka et al., (2007) [6] described an improved method for detecting hemorrhages in fundus images. The overall detection scheme consisted of six stages - image digitisation, image normalization, extraction of optic nerve head, detection of hemorrhages candidates, elimination of false positives (FP) in blood vessels, and elimination of FPs by feature analysis. However, the method for elimination of the blood vessels for the successful detection of hemorrhage candidates was not dealt here. Yun et al., (2008) [3] proposed automatic classification of different stages of diabetic retinopathy - mild non-proliferative retinopathy, moderate non-proliferative retinopathy, severe non-proliferative retinopathy and proliferative retinopathy using neural network from six features extracted from the retinal images.
In this work, we propose a new method of blood vessel extraction which is an improvement over the previously developed matched filter, a new method of hemorrhages detection and classify the retinal cases using an advanced non-parametric method with higher classification accuracy. The objectives of this work are: (i) detection of blood vessels, (ii) detection of hemorrhages, and (iii) classification of the detections into normal, moderate non-proliferative diabetic retinopathy (NPDR) and severe NPDR.
The paper is organised as follows: section II discusses the proposed algorithms for blood vessel, hemorrhage detection and a brief discussion on the Random Forest classification. Results of the algorithmic implementation on the data are presented in section III, followed by discussion and conclusions in section IV.

II. MATERIALS AND METHODS
65 retinal images of normal, moderate NPDR, and severe NPDR cases used in this work were downloaded from STARE (Structured Analysis of the Retina) Project database (http://www.parl.clemson.edu/stare/) as detailed in Table I. They were acquired in 24-bits per pixel with a dimension of 576 x 768.
TABLE I. DETAILS OF RETINAL DIABETIC IMAGES
Type Number of cases
Normal 30
Moderate NPDR 23
Severe NPDR 12
A. Blood Vessel Detection
Blood vessels can act as landmarks for localising the optic nerve, the fovea and lesions. As a result of systemic or local ocular disease, the blood vessels can have measurable abnormalities in diameter, color and tortuosity. There are three interesting properties of the blood vessels in retinal images that help in differentiating them from other features:
1) The anti-parallel pairs can be approximated by piecewise linear segments due to small curvatures present in the blood vessels.
2) Vessels have lower reflectance compared to other retinal surfaces, so they appear darker relative to the background. It was observed that these vessels almost never have ideal step edges. Although the intensity profile varies by a small amount from vessel to vessel, it may be approximated by an inverted Gaussian curve as given by (1)
2
2( , ) exp2df x y A kσ
⎧ ⎫⎛ ⎞⎪ ⎪= − −⎨ ⎬⎜ ⎟⎪ ⎪⎝ ⎠⎩ ⎭
(1)
where, d = perpendicular distance between the point (x, y) and the straight line passing through the center of the of the blood vessel in a direction along its length, σ = spread of the intensity profile, A = gray level intensity of the local background, and k = measure of reflectance of the blood vessel relative to its neighbourhood.
3) Although the width of a vessel decreases as it travels radially outward from the optic disk, such a change in vessel caliber is a gradual one. The widths of the vessels are found to lie within a range of 2-10 pixels (36-180 μm).
The matched filter has the same inverted Gaussian response as the gray level profile of the blood vessel. The design of the matched filter is as follows: assuming that all blood vessels are of equal width, the Gaussian curve is truncated at u= 3σ± , u is a point in the rotated coordinate system, the length of piece-wise linear segment L=17, an angular resolution of 7.5º to span
all possible orientations, 25 kernels of the matched filter are generated each oriented at an angle of 7.5º. The rotation matrix is given by (2)
cos sinsin cos
i ii
i i
rθ θθ θ
−⎡ ⎤= ⎢ ⎥⎣ ⎦
(2)
The filter is supposed to be centered at [0, 0]. A set of kernels are applied to fundus image and at each pixel only the maximum of their responses is retained. The corresponding weights in the kernels are given by
2
2( , ) exp2iuk x yσ
⎛ ⎞= − −⎜ ⎟
⎝ ⎠ (3)
Therefore,
( , ) | | 3 ,| |2LN u v u vσ⎧ ⎫= ≤ ≤⎨ ⎬
⎩ ⎭ (4)
If A denotes the total number of points in N then the mean is given by (5):
( , )
i
ii
p N
K x ymAε
= ∑ (5)
where mi is the mean value of the kernel and i is the kernel number. The convolutional mask of the kernel is given by (6):
' ( , ) ( , )i i iK x y K x y m= − (6)
Now, template matching can be employed to detect the blood vessel
For applying the entire algorithm of the matched filter, the G-plane of the image is considered (since it yields better results). After enhancing the contrast of the image, median filter is used to remove the noise. The designed matched filter is applied on the image to detect the blood vessels. Finally, a binarised image is obtained by thresholding. However, a major shortcoming of the whole process is the presence of discontinuous lines in the detections. To improve on this, perception based binarisation was carried out using a new binary detection method. A matrix was generated to store the number of matched filter which was responsible for detecting that particular pixel of the blood vessel. The gray level value of the pixels in a particular direction of detection was multiplied by a factor. The value was then checked to be above threshold level. For 0°, 15° and 180°, pixels in the horizontal direction were checked; for 30°, 45° and 60°, pixels in the 45 degree and 225 degree directions were checked; for 75°, 90° and 105°, pixels in vertical direction and for 120°, 135° and 150°, pixels in 135 degree and 315 degree directions were checked. If gray value multiplied by a factor (say 1.2) was greater than the threshold, then that pixel was counted as blood vessel. Finally, the blood vessels are extracted pixel by pixel.
B. Hemorrhage Detection The detection scheme for hemorrhage candidates consisted
of four stages: 1) image digitisation, 2) detection of

hemorrhage candidates, 3) elimination of FPs (false positive) in blood vessels, and 4) elimination of FPs by feature analysis.
Due to flash light used in the fundus photography, there is a typical change in the colour of the fundus images. The brightness values of the fundus image were transformed by a nonlinear curve in the hue saturation value (HSV) space. In order to emphasise brown regions, the brightness corrected colour fundus images were then subjected to gamma correction on each red, green, and blue (R, G and B) image. The gamma value was empirically set to 1.5. Subsequently, the histograms of each R, G and B image were extended. Finally, the hemorrhage candidates were detected using density analysis. The difference in the pixel values between two smoothened images detected the blood vessels and hemorrhage candidates. The FPs blood vessels were eliminated using bounding box technique The ratio of major axis length and the minor axis length of each segment was calculated as given by (7) and those with higher values were eliminated.
Major axis lengthratio=Minor axis length
(7)
Ratios above 1.57 were eliminated and those below 1.57 were considered as hemorrhages. This concept is valid when hemorrhages are assumed to be near to round shape and the blood vessels exhibit is linear shape.
C. Classification
This involves three stages – (1) training stage: identifying representative training areas and developing a numerical description of the attributes of each class type through training set, (2) classification stage: data set is categorised into the class it most closely resembles, and (3) output stage: the process consists of a matrix of interpreted category types. In this work, an advanced a non-parametric Tree-type classifier – Random Forests (RF) (Breiman, 2001) is used for classification. RF are ensemble methods using tree-type classifiers { }( , ), 1,.....,kh x kΘ = where the{ }kΘ are i.i.d. random vectors and x is the input pattern. They are a combination of tree predictors such that each tree depends on the values of a random vector sampled independently and with the same distribution for all trees in the forest. It uses bagging to form an ensemble of classification tree [7-8]. RF is distinguished from other bagging approaches in that at each splitting node in the underlying classification trees, a random subset of the predictor variables is used as potential variables to define split. In training, it creates multiple Classification and Regression Tree trained on a bootstrapped sample of the original training data, and searches only across randomly selected subset of the input variables to determine a split for each node. RF utilises Gini index of node impurity to determine splits in the predictor variables. For classification, each tree casts a unit vote for the most popular class at input x. The output of the classifier is determined by a majority vote of the trees that result in the greatest classification accuracy. It is superior to many tree-based algorithms, because it lacks sensitivity to noise and does not overfit. The trees in RF are not pruned; therefore, the computational complexity is reduced. As a result, RF can
handle high dimensional data, using a large number of trees in the ensemble. This combined with the fact that random selection of variables for a split seeks to minimise the correlation between the trees in the ensemble, results in error rates that have been compared to those of Adaboost, at the same time being much lighter in implementation. Breiman and Cutler (2005) suggests RF “unexcelled in accuracy among current algorithms”. RF has also outperformed CART and similar boosting and bagging-based algorithm [8]. In the current work, RF has been implemented using a Linux based random forest package, available in R interface (http://www.r-project.org).
D. Accuracy Assessment
The accuracy of the classification was done using sensitivity, specificity, positive prediction value (PPV), negative prediction value (NPV) as given by equations (8-11) based on the four possible outcomes - true positive (TP); false positive (FP), true negative (TN) and false negative (FN).
Sensitivity= TP / (TP + FN) (8)
Specificity= TN / (FP + TN) (9)
PPV = TP / (TP + FP) (10)
NPV = TN / (TN + FN) (11)
The sensitivity measures the proportion of actual positives which are correctly identified. The specificity measures the proportion of negatives which are correctly identified. PPV is the precision of positives that were correctly identified. NPV is the precision of negatives correctly identified.
III. RESULTS
A. Blood Vessel Extraction
In a RGB retinal image, contrast is greater when the green channel alone is utilised in fundal image feature extraction. Adaptive histogram equalisation was used to enhance the contrast of the features of interest against the background. A 3 x 3 median filter was used to remove the random noise as displayed in Fig. 1. Blood vessels were detected (as shown in white pixels against black background in Fig. 2) after applying the designed matched filter. The matched filtered image was converted to binary equivalent with a global threshold value of 0.1490 determined empirically (Fig. 3), where presence of discontinuous lines were observed. Perception based binarisation was carried out by generating a matrix, to store the matched filter number, and then the pixel gray level in that particular direction, multiplied by a factor, was checked for a threshold level.
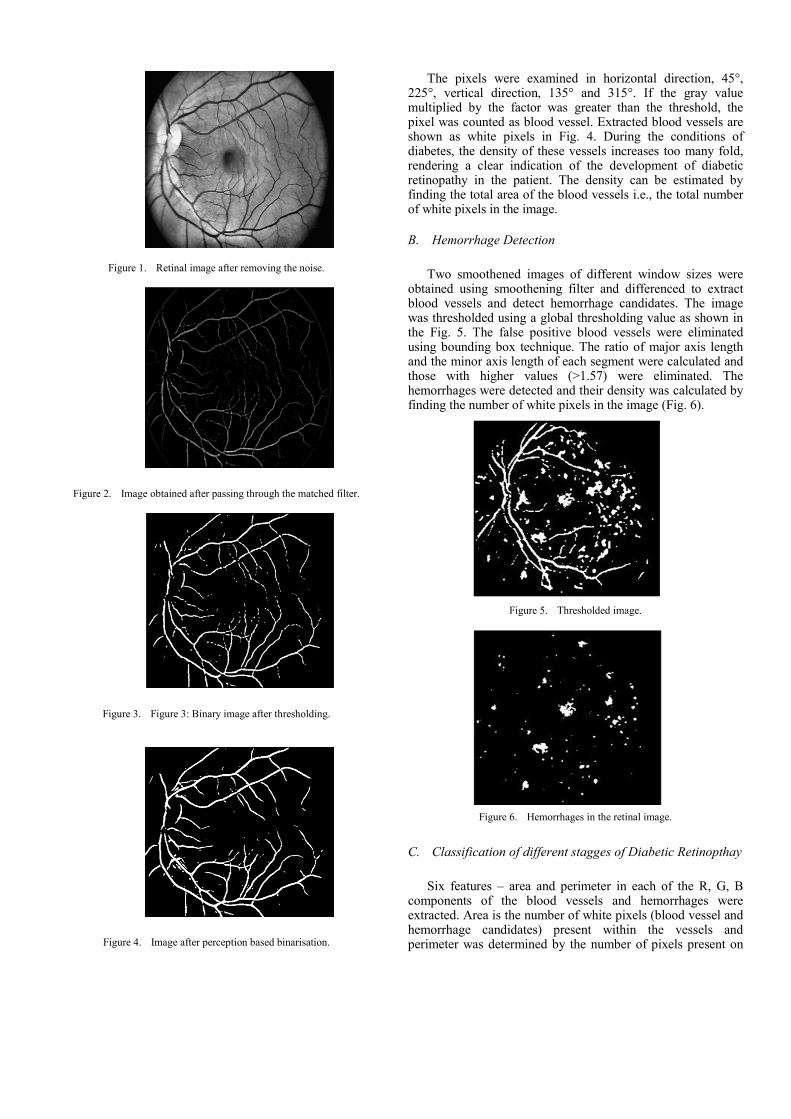
Figure 1. Retinal image after removing the noise.
Figure 2. Image obtained after passing through the matched filter.
Figure 3. Figure 3: Binary image after thresholding.
Figure 4. Image after perception based binarisation.
The pixels were examined in horizontal direction, 45°, 225°, vertical direction, 135° and 315°. If the gray value multiplied by the factor was greater than the threshold, the pixel was counted as blood vessel. Extracted blood vessels are shown as white pixels in Fig. 4. During the conditions of diabetes, the density of these vessels increases too many fold, rendering a clear indication of the development of diabetic retinopathy in the patient. The density can be estimated by finding the total area of the blood vessels i.e., the total number of white pixels in the image.
B. Hemorrhage Detection
Two smoothened images of different window sizes were obtained using smoothening filter and differenced to extract blood vessels and detect hemorrhage candidates. The image was thresholded using a global thresholding value as shown in the Fig. 5. The false positive blood vessels were eliminated using bounding box technique. The ratio of major axis length and the minor axis length of each segment were calculated and those with higher values (>1.57) were eliminated. The hemorrhages were detected and their density was calculated by finding the number of white pixels in the image (Fig. 6).
Figure 5. Thresholded image.
Figure 6. Hemorrhages in the retinal image.
C. Classification of different stagges of Diabetic Retinopthay
Six features – area and perimeter in each of the R, G, B components of the blood vessels and hemorrhages were extracted. Area is the number of white pixels (blood vessel and hemorrhage candidates) present within the vessels and perimeter was determined by the number of pixels present on
the periphery of the vessels. These extracted features were used as inputs to the RF classifier for categorizing the three stages of retinal images. The range of the area and perimeter values of blood vessels and hemorrhages for each stage of the diabetic retinopathy with the different RGB layers are shown in Table II and III.
TABLE II. RANGE OF INPUT AREA FEATURES TO CLASSIFICATION
ALGORITHMS
Classes Area in R layer (µ±σ)
Area in G layer (µ±σ)
Area in B layer (µ±σ)
Normal 9169±1529 8184±1384 8093±1467
Moderate NPDR 1269±1548 12903±1687 13365±1992
Severe NPDR 16075±1596 14879±1380 16156±1760
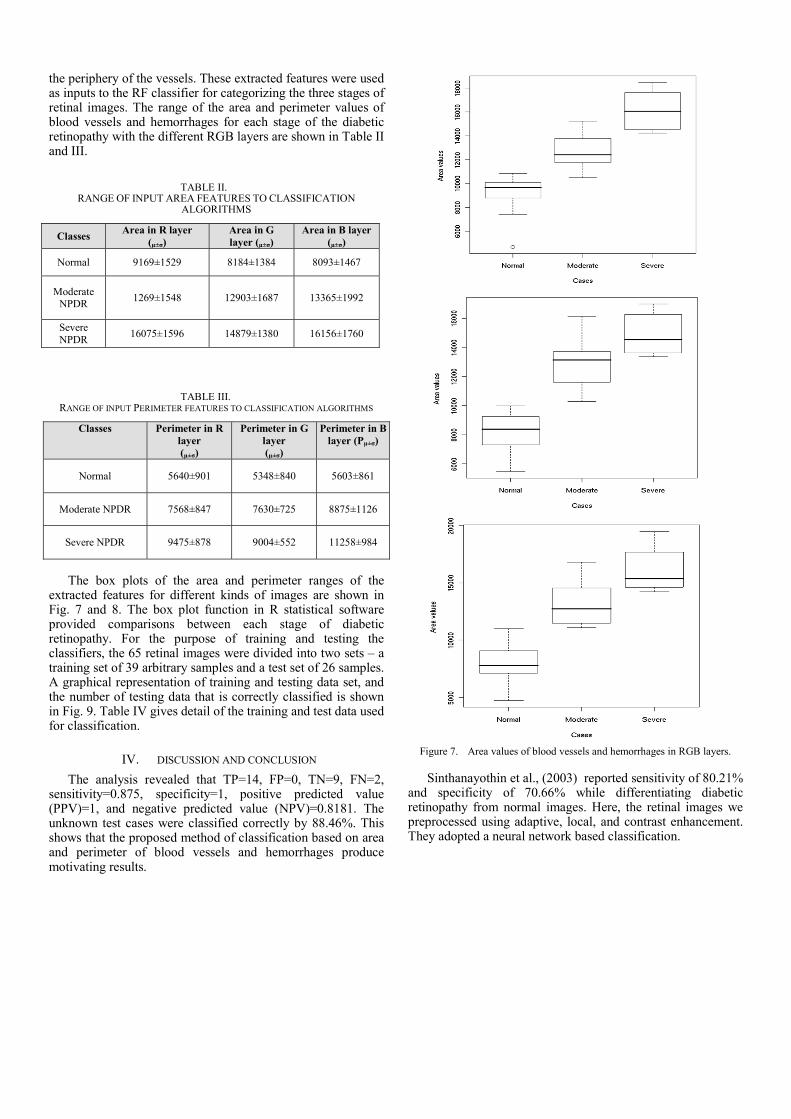
TABLE III. RANGE OF INPUT PERIMETER FEATURES TO CLASSIFICATION ALGORITHMS
Classes Perimeter in R layer (µ±σ)
Perimeter in G layer (µ±σ)
Perimeter in B layer (Pµ±σ)
Normal 5640±901 5348±840 5603±861
Moderate NPDR 7568±847 7630±725 8875±1126
Severe NPDR 9475±878 9004±552 11258±984
The box plots of the area and perimeter ranges of the
extracted features for different kinds of images are shown in Fig. 7 and 8. The box plot function in R statistical software provided comparisons between each stage of diabetic retinopathy. For the purpose of training and testing the classifiers, the 65 retinal images were divided into two sets – a training set of 39 arbitrary samples and a test set of 26 samples. A graphical representation of training and testing data set, and the number of testing data that is correctly classified is shown in Fig. 9. Table IV gives detail of the training and test data used for classification.
IV. DISCUSSION AND CONCLUSION The analysis revealed that TP=14, FP=0, TN=9, FN=2,
sensitivity=0.875, specificity=1, positive predicted value (PPV)=1, and negative predicted value (NPV)=0.8181. The unknown test cases were classified correctly by 88.46%. This shows that the proposed method of classification based on area and perimeter of blood vessels and hemorrhages produce motivating results.
Figure 7. Area values of blood vessels and hemorrhages in RGB layers.
Sinthanayothin et al., (2003) reported sensitivity of 80.21% and specificity of 70.66% while differentiating diabetic retinopathy from normal images. Here, the retinal images we preprocessed using adaptive, local, and contrast enhancement. They adopted a neural network based classification.

Figure 8. Perimeter values of blood vessels and hemorrhages in RGB layers.
TABLE IV. TRAINING AND TEST DATA SET FOR RF
Classes Number of training
data
Number of test data
Number of correct
classification
Percentage of correct
classification
Normal 20 10 9 90
Moderate NPDR
15 8 7 87.5
Severe NPDR
4 8 7 87.5
0
2
4
6
8
10
12
14
16
18
20
Normal Moderate Severe
Train
Test
Correct test
Stages of diabetic retinopathy
Num
ber
of d
ata
Figure 9. Graphical representation of training and testing data set for RF classifiers.
Similar results have been reported by Larsen et al., (2003), where hemorrhages and microaneurysms were detected to diagnose diabetes. Their method had 71.4% specificity and 96.7% sensitivity in detecting diabetic retinopathy. The results obtained from our method of feature extraction and classification scheme revealed that normal cases were classified with 90% accuracy while moderate and severe NPDR cases were 87.5% accurate, which are better in terms of sensitivity, specificity and positive prediction accuracy considering three cases during classification (normal, moderate and severe) compared to the four cases (in Yun et al., 2008) [3] namely, normal, moderate NPDR, severe NPDR and proliferative NPDR. However, the scope and direction for further work are to include more instances of retinal images to construct a robust classifier for detecting different stages of diabetic retinopathy (i.e. for training and testing) to achieve higher accuracy. The efficiency of the correct classification can also be improved by extracting more number of features from the images.
REFERENCES [1] WHO, 2011. http://www.who.int/mediacentre/factsheets/fs312/en/ [2] N. Patton, T. M. Aslamc, M. MacGillivrayd, I. J. Dearye, B. Dhillonb,
R. H. Eikelboomf, K. Yogesana and I. J. Constablea, “Retinal image analysis: Concepts, applications and potential,” Retinal and Eye Research, vol. 25, pp. 99-127, 2006.
[3] L. W. Yun, U. R. Acharya, Y. V. Venkatesh, C. Chee, L.C. Min and E.Y.K. Ng, “Identification of different stages of diabetic retinopathy using retinal optical images,” Information Sciences, vol. 178, pp. 106-121, 2008.
[4] N. Otsu, “A Threshold Selection Method from Gray-Level Histograms,” IEEE Trans. Systems Man and Cybernetics, vol. 9, no. 1, pp. 62-66, 1979.
[5] S. Chaudhuri, S. Chatterjee, N. Katz, N. Nelson and M. Goldbaum, “Detection of Blood vessels in Retinal Images Using Two-Dimensional Matched Filters,” IEEE Trans. Medical Imaging, vol. 8, no. 3, pp. 263-269, 1989.
[6] Y. Hatanaka, T. Nakagawa, Y. Hayashi, Y. Mizukusa, A. Fujita, M. Kakogawa, K. Kawase, T. Hara, H. Fujita, “CAD scheme to detect hemorrhages and exudates in ocular fundus images,” In Proceedings of the 2007 SPIE Symposium, vol. 65142M, 2007.
[7] L. Breiman, “Random Forests,” Machine Learning, vol. 40, pp. 5-32, 2001.
[8] P. O. Gislason, J. A. Benediktsson and J. R. Sveinsson, “Random Forests for land cover classification,” Pattern Recognition Letters, vol. 27, pp. 294-300, 2006.
Copyright © 2022 FDOKUMEN