Software for Reading and Grading Diabetic Retinopathy: Aravind Diabetic Retinopathy Screening 3.0
12
Software for reading and grading Diabetic Retinopathy: ADRES 3.0 Received for publication 3 February 2007 and accepted in revised form 7 May 2007. Running title: Diabetic Retinopathy software: ADRES 3.0 Namperumalsamy Perumalsamy, M.D. 1 , Noela M. Prasad, M.Sc. 1 , Shankar Sathya, B. E. 2 , Kim Ramasamy, M.D. 1 1 Aravind Eye Care System, 2 Eagle Software Correspondence Noela M. Prasad Aravind Eye Care System 1, Annanagar, Madurai 625 020, India. [email protected] Diabetes Care In Press, published online May 16, 2007 Copyright American Diabetes Association, Inc., 2007
-
Upload
independent -
Category
Documents
-
view
3 -
download
0
Transcript of Software for Reading and Grading Diabetic Retinopathy: Aravind Diabetic Retinopathy Screening 3.0

Software for reading and grading Diabetic Retinopathy: ADRES 3.0
Received for publication 3 February 2007 and accepted in revised form 7 May 2007.
Running title: Diabetic Retinopathy software: ADRES 3.0
Namperumalsamy Perumalsamy, M.D.1, Noela M. Prasad, M.Sc.1, Shankar Sathya, B. E.2, Kim Ramasamy, M.D.1
1Aravind Eye Care System, 2Eagle Software
Correspondence Noela M. Prasad
Aravind Eye Care System 1, Annanagar, Madurai 625 020, India.
Diabetes Care In Press, published online May 16, 2007
Copyright American Diabetes Association, Inc., 2007
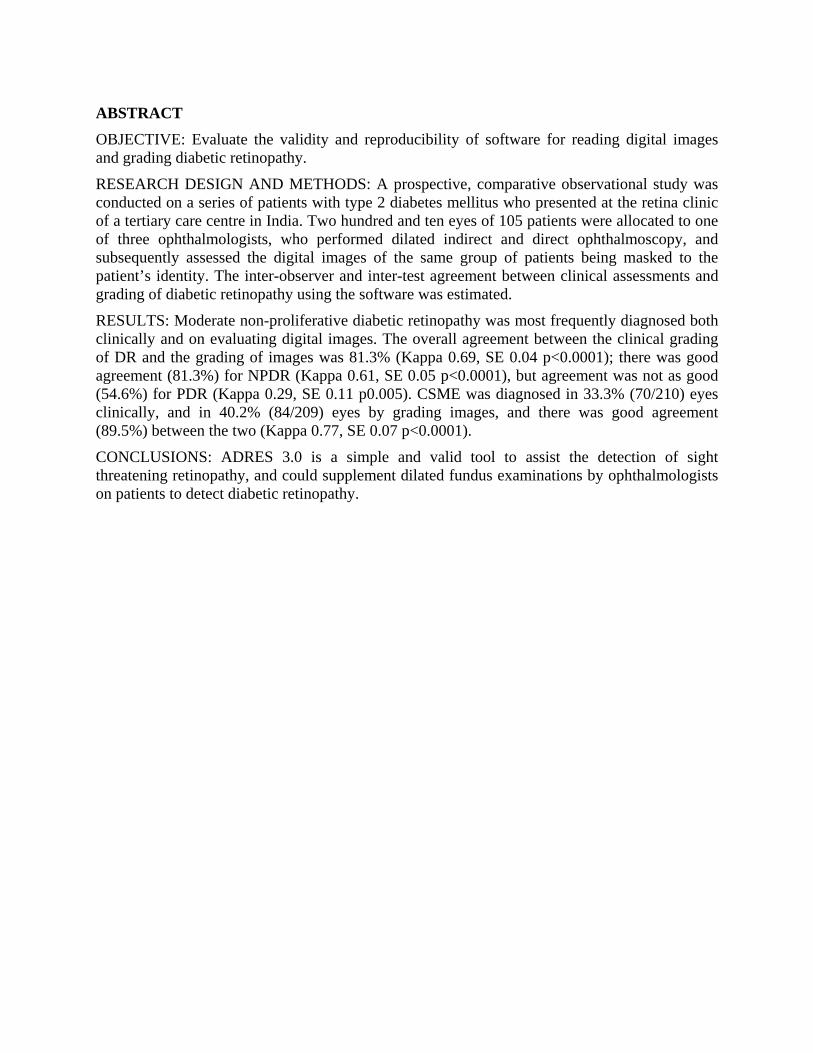
ABSTRACT
OBJECTIVE: Evaluate the validity and reproducibility of software for reading digital images and grading diabetic retinopathy.
RESEARCH DESIGN AND METHODS: A prospective, comparative observational study was conducted on a series of patients with type 2 diabetes mellitus who presented at the retina clinic of a tertiary care centre in India. Two hundred and ten eyes of 105 patients were allocated to one of three ophthalmologists, who performed dilated indirect and direct ophthalmoscopy, and subsequently assessed the digital images of the same group of patients being masked to the patient’s identity. The inter-observer and inter-test agreement between clinical assessments and grading of diabetic retinopathy using the software was estimated.
RESULTS: Moderate non-proliferative diabetic retinopathy was most frequently diagnosed both clinically and on evaluating digital images. The overall agreement between the clinical grading of DR and the grading of images was 81.3% (Kappa 0.69, SE 0.04 p<0.0001); there was good agreement (81.3%) for NPDR (Kappa 0.61, SE 0.05 p<0.0001), but agreement was not as good (54.6%) for PDR (Kappa 0.29, SE 0.11 p0.005). CSME was diagnosed in 33.3% (70/210) eyes clinically, and in 40.2% (84/209) eyes by grading images, and there was good agreement (89.5%) between the two (Kappa 0.77, SE 0.07 p<0.0001).
CONCLUSIONS: ADRES 3.0 is a simple and valid tool to assist the detection of sight threatening retinopathy, and could supplement dilated fundus examinations by ophthalmologists on patients to detect diabetic retinopathy.

INTRODUCTION: Diabetic retinopathy (DR) resulting from microvascular end-organ damage to the retina, is found in 60% (1) of people twenty years after onset of type 2 diabetes mellitus; sight threatening retinopathy is found in 2.0% of persons who have diabetes for less than five years, and in 15.5% of persons who have diabetes for 15 or more years. Identifying these patients is primarily through opportunistic case detection (2) in a country like India (prevalence of retinopathy is 17.6% among urban diabetics above 20 years of age), since a routine screening programme for people known to have diabetes is not a feasible option considering the poor attendance; 11% of new diabetics and 55% of known diabetics attend these camps. (3) The current gold standard for diagnosing DR is through fundus photography; comparing the fundus pathology with that seen on stereoscopic viewing of seven standard photographs for grading retinopathy or through fluorescein angiographic diagnosis. However, even in countries where facilities for close monitoring of diabetes are available, there is no consensus on cost-effective, valid methods to screen for diabetic retinopathy. (4) Telemedicine has resulted in new possibilities such as capturing images at a remote location and transmitting them to a skilled grader at a specialist centre. Though reducing costs while maintaining good quality care, (5) this intensifies the need to validate digital images as a tool for diagnosing diabetic retinopathy and following its progression. This study compares ‘Aravind Diabetic Retinopathy Screening (ADRES 3.0)’ reading and grading system with clinical assessments as the current practice gold standard regarding its validity and reproducibility in the assessment of DR.
RESEARCH DESIGN and METHODS: A prospective, comparative observational study was conducted on a series of patients with type 2 diabetes mellitus who presented for the first time at the retina clinic of a tertiary care centre in India. The patients who consented to participate were enrolled by the clinic coordinator during May and June 2006, and assigned to the grader (one of three trained retina specialists) who was attending to out-patients on the day. Each patient underwent a routine detailed comprehensive ophthalmic examination by any single grader, and digital fundus photographs were taken by a technician through the dilated pupil. The same three clinicians subsequently graded the digital images using the manual software ‘Aravind Diabetic Retinopathy Screening (ADRES 3.0)’ reading and grading system, being masked to the clinical grading assigned to individual patients. For the sake of comparability, all three graders were assigned five consecutive patients on the last day of enrolment, which they assessed independently in the same manner. The eye examination included measurement of Snellen’s visual acuity, slit-lamp biomicroscopy aided with the 3-mirror contact lens when required, dilated fundoscopy using a 60 or 90 Dioptre lens and indirect ophthalmoscopy. Findings from a single visit are used; progressive evaluation of retinopathy in the same patient was not conducted for this study. Clinical grading of diabetic retinopathy and of clinically significant macular oedema (CSME) was based on the Extension of the Airlie House Classification. Images

The single non-simultaneous stereoscopic pair of central images were acquired manually by horizontal translation of the fundus camera, and labelled as A1 and A1’; four equidistant images covering the peripheral areas of the retina were also taken (Figure 1), and were labelled A2, A3, A4 and A5 respectively. A1, and A1'are 45° fields, focused centrally between the temporal margin of the optic disc and the centre of the macula, with the horizontal central line of the image passing through the centre of the disc. Stereoscopic images are obtained by shifting the camera laterally; with a slight delay between the first and the second image may be necessary to allow for adequate pupil mydriasis. A2is a 45°field supero-temporal to the optic disc so that the lower edge of the field is at a tangent to the horizontal line passing through the centre of the optic disc and the nasal edge of the field is at a tangent to the vertical line passing through the centre of the disc. Similar fields in the infero-temporal (A3), supero-nasal (A4) and infero-nasal (A5) quadrants were imaged. Grading Protocol for Diabetic Retinopathy Two sets of images representing each eye were verified for quality (gradability) before commencing grading. The graders entered clinical findings, which were converted to results according to a lesion grading matrix (Table 1), based on established standard practice guidelines such as those of ETDRS and AAO’s document on the International Clinical Diabetic Retinopathy Disease Severity Scale (published October 2002). ADRES system A commercially available non-mydriatic retinal fundus camera optimized for low light level imaging of the retina (TOPCON, TRC-NW100) with capability to provide up to 2.3 million pixel, high quality spatial, contrast
and colour resolution images (Figure1) was used. This fundus camera is light weight and energy efficient, and was optimized for acquiring high quality retinal images in low-light-level conditions with the lowest available flash intensities. It was interfaced with ADRES 3.0, the image capture and telemedicine software developed in-house to acquire standard single-frame digital colour images of the retina. At the acquisition unit, a standard Windows-Intel compatible desktop running Windows XP operating system was used to capture relevant structured and unstructured clinical data which was transmitted after being de-composed to form xml (eXtensible Mark-up Language) structures. Images captured using a USB interface through TWAIN protocol at maximum resolution, were compressed and stored in a DICOM 3 file format along with the other information, enabling each image to be uniquely associated with a patient prior to transmission. Images transmitted to the remote grading centre using a 384 Kbps VSAT connection were filtered, indexed and filed in a robust and reliable RAID-3 Network Attached Storage Unit with a tape backup system. At the Grading station, Windows-Intel compatible Professional desktops were deployed with a high end graphics card (3Dlabs oxygen GVXI) 21 inch 100 MHz refresh rate true colour monitors and 3D Revelator infrared version goggles for stereo viewing. The software enabled the simultaneous reading of patient and Standard images in dual monitors, along with the patient demographics and clinical information, and flexible integrated templates enabled objective online grading of images. Ethical issues:
Patients were counseled about the disease and their informed consent for participation in the validation study was obtained prior to allocation. The study had been presented to and approved by the Research Committee of Aravind Eye Care System. RESULTS: One hundred and five patients were enrolled; the population averaged 53.5 years of age (95% CIs 52.46, 54.51), the duration of diabetes (n=104) averaged 9.3 years (95% CIs 8.2, 10.3). Overall, 13.3% of eyes (28/210) had mild NPDR, 57.1% (120/210) had moderate NPDR, 13.8% (29/210) had severe NPDR and 15.7% (33/210) had PDR on clinical grading; while on grading of the images, one image was ungradeable, and one had no DR. Of the remaining 208 images, 13.8% had mild NPDR, 59.3% had moderate NPDR, 11% had severe NPDR and 15.3% had PDR. The overall agreement between the clinical grading of DR and the grading of images was good (Table 2); there was very good agreement (81.3%) for NPDR, but agreement was not as good (54.6%) for PDR. Clinically significant macular oedema (CSME) was diagnosed on 32.1% (25/78) of eyes by grader 1, on 64.8% (95/142) eyes by grader 2, and on half of the 10 eyes that grader 3 assessed clinically. The corresponding proportions for grading using ADRES for the three graders were 34.5 % (49/142), 27.3 % (21/77), and 36.4% (76/209) respectively. Overall, CSME was diagnosed in 33.3% (70/210) eyes clinically, and in 40.2% (84/209) eyes by grading images, and there was good agreement between the two assessments. Compared to the grading on clinical assessment, 3.6% of mild NPDRs were graded as less advanced disease on assessment of the images, and 21.4% were graded as more advanced disease on the
images. For clinical moderate NPDR, there were 6.7% graded lower on imaging and 5.1% graded higher, and for severe NPDR these proportions were 34.5 and 6.9 respectively. For clinical PDR, 18.2% were graded as having less severe disease on imaging. The inter-observer agreement between the diagnoses made by the three graders on clinical examination of the fundus and that made on manual grading of the fundus images was assessed (Table 2). Agreement between graders 1 and 2 was good for clinical assessment of DR and CSME and for their assessment of images. That of Graders 2 and 3 was poorer for both, the clinical assessment and the assessment of images. Graders 1 and 3 had good agreement for their clinical assessments and for their grading of retinopathy or CSME on the images. The current standard practice is to perform indirect ophthalmoscopy to detect and grade DR and stereoscopic slit-lamp biomicroscopic examination with a magnifying lens to detect CSME; so, we measured the sensitivity and specificity of the manual grading system to detect DR and CSME compared with current practice (Table 3). CONCLUSIONS: ADRES 3.0 is an example of an indigenously developed, user-friendly reading and grading system for diabetic retinopathy. The technology (hardware, software and systems) utilized is simple and relatively inexpensive, though not available yet as a commercial package. The sample population used to validate this software was comparable across graders with regard to the distribution of ‘severity’ of diabetic retinopathy. The proportion of patients with moderate to severe non-proliferative diabetic retinopathy was higher than that of mild DR in this sample, as

opposed to the findings of a recent prevalence study (7) that used clinical examination to grade DR, which found mild NPDR to be the most prevalent form of retinopathy. This could be due to sampling bias; people with more severe forms of retinopathy presenting to hospital, due to the differences in the definitions used, or because of over-diagnosis of more severe forms of retinopathy based on the criteria used for grading. Of the 97 eyes that subsequently underwent laser treatment, half had focal laser (53.6%), 39.2% had panretinal photocoagulation, and 7.2% had both treatments. ADRES 3.0 may have to be validated further against ETDRS Standard photographs in order to determine the extent to which it can serve as a substitute or a replacement for grading DR in the field of telemedicine. Fundus photography and using ADRES 3.0 for reading and grading images proves to be a good screening test for detecting all grades of diabetic retinopathy. The high negative predictive value of this tool in ruling out the presence of sight threatening retinopathy establishes its usefulness in the field situation, where a decision on whether or not to refer to the base hospital can be made by the technician in the mobile van. However, it should be noted that in this study, agreement between clinical and digital imaging assessments was lower for the more advanced levels of retinopathy. The findings of this paper suggest that ADRES 3.0 can be used to assist the detection of diabetic retinopathy, supplementing clinical examination by an ophthalmologist. Its diagnostic value in the hands of a trained technician (non-ophthalmologist) grader needs to be assessed, so as to make its deployment more cost-effective, and its sensitivity to detecting change will have to be studied in order to establish its usefulness in
detecting progression over a long patient follow-up period. The data suggests that ADRES3.0 has good sensitivity across the various stages of DR, but specificity seems to increase in more advanced disease. The images captured at the hospital setting were of good quality, and only one patient (0.5%) had images that were not gradable due to media opacities. The proportion of ungradeable images may be higher when these images are captured from the mobile van and transmitted to a remote grader. This is another area that needs further investigation. Though a non-mydriatic camera is used, the image quality is optimal only if the pupil is at least 4 mm in diameter. The benefit of dilated fundus photography over photography through an undilated pupil also has to be assessed, especially in a country like India where dark irides are predominant and are associated with smaller pupillary apertures. Pupil size is more of an issue in the mobile-van setting, where ambulatory background light levels are relatively high. ADRES 3.0 is a simple and valid tool to assist the detection of both, diabetic retinopathy and clinically significant macular oedema. ACKNOWLEDGEMENTS: We are grateful to Ms. Sooriya, the clinic coordinator, Drs. Chandramohan, Naresh and Anand Rajendran, who examined the eyes of patients for this study and graded images; to Mr. John, the photographer, and to Ms. Mahalakshmi who revised the statistical analysis. Dr. Kim Ramasamy, Dr. Namperumalsamy conceived and initiated this study and Mr. Sathya Shankar developed the technology used for this study. Dr. Noela Prasad was involved in designing the study, data analysis and manuscript preparation. The authors declare no financial, advisory or other dual interests in the conduct of this study.

REFERENCES: 1. Klein R, Klein BE, Moss SE, Davis MD, DeMets DL. The Wisconsin epidemiologic
study of diabetic retinopathy. III. Prevalence and risk of diabetic retinopathy when age at diagnosis is 30 or more years. Arch Ophthalmol. 1984;102(4):527-32.
2. Thomas R, Parikh R, Paul P, Muliyil J. Population-based screening versus case detection. Indian J Ophthalmol. 2002;50(3):233-7.
3. Agarwal S, Mahajan S; Padmaja KR, How High is the Non-Response Rate of Patients Referred for Eye Examination from Diabetic Screening Camps? Ophthalmic Epidemiology 2005;12(6):393-394.
4. Bachmann MO, Nelson SJ. Impact of diabetic retinopathy screening on a British district population: case detection and blindness prevention in an evidence-based model. Bachmann MO, Nelson SJ. J Epidemiol Community Health. 1998;52(1):45-52.
5. Johnston K, Kennedy C, Murdoch I, Taylor P, Cook C. The cost-effectiveness of technology transfer using telemedicine. Health Policy Plan. 2004;19(5):302-9.
6. Bursell SE, Cavallerano JD, Cavallerano AA, Clermont AC, Birkmire-Peters D, Aiello LP, Aiello LM; Joslin Vision Network Research Team. Stereo nonmydriatic digital-video color retinal imaging compared with Early Treatment Diabetic Retinopathy Study seven standard field 35-mm stereo color photos for determining level of diabetic retinopathy. Ophthalmology. 2001;108(3):572-85.
7. Rema M, Premkumar S, Anitha B, Deepa R, Pradeepa R, Mohan V. Prevalence of diabetic retinopathy in urban India: the Chennai Urban Rural Epidemiology Study (CURES) eye study, I. Invest Ophthalmol Vis Sci. 2005;46(7):2328-33.

TABLES Table 1: DR lesion grading matrix for ADRES 3.0 Lesions Images to be assessed Grading Inputs Field not Readable A1, A1', A2, A3, A4, A5 Microaneurysms A1, A1', A2, A3, A4, A5 Present / Absent Haemorrhages A1, A1', A2, A3, A4, A5 Haemorrhages present; compare with standard
photograph 2A, noting whether they are less than in the standard photograph, or more than /equal to that seen in the standard photograph.
Hard exudates A1, A1', A2, A3, A4, A5 Present / Absent Cotton Wool Spots A1, A1', A2, A3, A4, A5 Number of lesions Retinal Thickening A1, A1' Number of areas present of size less than one
disc area, and number equal to or more than one disc area in size. Distance of the retinal thickening from centre of macula in microns (<500, 500-1500, >1500 microns)
Venous beading A1, A1' Number present which are larger than that seen in standard photograph 6A; number of size less than one fourth of the disc area, and number equal to or more than one fourth of the disc area in size
Intra-Retinal Micro Angiopathy A2, A3, A4, A5 Number present which are larger than that seen in standard photograph 8A; number of size less than half disc area, and number equal to or more than half the disc area in size
Neo-Vascularization Disc A1, A1' Present / Absent Neo-Vascularization Elsewhere A2, A3, A4, A5 Present / Absent Disc Oedema A1, A1' Present / Absent Pre-Retinal Hemorrhage A1, A1', A2, A3, A4, A5 Present / Absent Vitreous Hemorrhage A1, A1', A2, A3, A4, A5 Present / Absent Fibrovascular Proliferation Disc A1, A1' Present / Absent Fibrovascular Proliferation Elsewhere A2, A3, A4, A5 Present / Absent Tractional Retinal Detachment A1, A1', A2, A3, A4, A5 Present / Absent Occluded Vessels A1, A1', A2, A3, A4, A5 Present / Absent

Table 2: Inter-observer and inter-test agreement Inter-observer Agreement Kappa (p value) (n) r-squared Grader 1 and Grader 2
Clinical DR 70% 0.57 (0.0002) (10) 0.76 Clinical CSME 90% 0.80 (0.005) (10) 0.67
Images DR 60% 0.33 (0.04) (10) 0.55 Images CSME 90% 0.78 (0.006) (10) 0.64
Grader 2 and Grader 3 Clinical DR 70% 0.50 (0.003) (10) 0.79
Clinical CSME 60% 0.20 (0.3) (10) 0.04 Images DR 85.7% 0.73 (<0.00001) (77) 0.74
Images CSME 79.2% 0.49 (0.09) (77) 0.24 Grader 1 and Grader 3
Clinical DR 60% 0.42 (0.006) (10) 0.63 Clinical CSME 70% 0.40 (0.09) (10) 0.16
Images DR 73.2% 0.59 (<0.00001) (142) 0.73 Images CSME 86.6% 0.7 (<0.00001) (142) 0.53
Inter-test Overall 81.3% 0.69 (<0.0001) (209) 0.69
NPDR 81.3% 0.62 (<0.0001) (176) 0.47 PDR 56.4% 0.29 (0.005) (33) 0.29
CSME 89.5% 0.77 (<0.0001) (209) 0.61

Table 3: Diagnostic value of Image grading compared with Clinical grading by ophthalmologists. Condition Background/
Mild DR Moderate/ severe
NPDR PDR CSME
Proportion 23/28 135/149 27/33 68/73
Sensitivity (95%CIs)
82.1% (63.1, 93.9)
90.6% (84.7, 94.8)
81.8% (64.5, 93)
93.2% (84.7, 97.7)
Proportion 154/182 49/61 172/177 119/136
Specificity (95%CIs)
84.6% (78.5, 89.5)
80.3% (68.2, 89.4)
97.2% (93.5, 99.1)
87.5% (80.7, 92.5)
Likelihood ratio for a positive test (95%CIs)
5.34 (3.64, 7.82)
4.6 (2.77, 7.67)
28.96 (12.03, 69.75)
7.45 (4.76, 11.68)
Positive predictive value (95%CIs)
45.1% (31.1, 59.7)
91.8% (86.2, 95.7)
84.4% (67.2, 94.7)
80% (69.9, 87.9)
Negative predictive value (95%CIs)
96.9% (92.8, 99)
77.8% (65.5, 87.3)
96.6% (92.8, 98.8)
96% (90.8, 98.7)
ROC area (95% CIs)
0.83 (0.76, 0.91)
0.85 (0.80, 0.91)
0.89 (0.83, 0.96)
0.90 (0.86, 0.94)

FIGURES Figure 1: Stereo-photograph pair and four peripheral fields of ADRES 3.0 five 45° field protocol with a sample image.

Figure 2: The ADRES3.0 data input screen.