Prognostic value of multi-focal electroretinography and optical coherence tomography in eyes...
24
Prognostic value of multi-focal electroretinography and optical 1 coherence tomography in eyes undergoing pan-retinal photocoagulation 2 for diabetic retinopathy 3 4 5 Authors: 6 Ying Zhu 1, 2,* , Ting Zhang 1,* , Ke-yan Wang 1,† and Ge-zhi Xu 1,2,3 7 8 1 Department of Ophthalmology, Eye and ENT Hospital of Fudan University, Shanghai, People’s 9 Republic of China 10 2 Shanghai Key Laboratory of Visual Impairment and Restoration, Fudan University, Shanghai, 11 People’s Republic of China 12 3 Institute of Brain Science, Fudan University, Shanghai, People's Republic of China 13 14 *Ying Zhu and Ting Zhang contributed equally to this work. 15 Corresponding author: Ke-yan Wang, Department of Ophthalmology, Eye and ENT Hospital of 16 Fudan University, 83 Fen Yang Road, Shanghai, 200031, People’s Republic of China. Email: 17 [email protected]. 18 19 Text Word Count: 2938 20 Abstract Word Count: 247 21 22 IOVS Papers in Press. Published on August 21, 2014 as Manuscript iovs.14-14704 Copyright 2014 by The Association for Research in Vision and Ophthalmology, Inc.
Transcript of Prognostic value of multi-focal electroretinography and optical coherence tomography in eyes...

Prognostic value of multi-focal electroretinography and optical 1
coherence tomography in eyes undergoing pan-retinal photocoagulation 2
for diabetic retinopathy 3
4
5
Authors: 6
Ying Zhu1, 2,*, Ting Zhang1,*, Ke-yan Wang1,† and Ge-zhi Xu1,2,3 7
8
1 Department of Ophthalmology, Eye and ENT Hospital of Fudan University, Shanghai, People’s 9
Republic of China 10
2 Shanghai Key Laboratory of Visual Impairment and Restoration, Fudan University, Shanghai, 11
People’s Republic of China 12
3 Institute of Brain Science, Fudan University, Shanghai, People's Republic of China 13
14
*Ying Zhu and Ting Zhang contributed equally to this work. 15
Corresponding author: Ke-yan Wang, Department of Ophthalmology, Eye and ENT Hospital of 16
Fudan University, 83 Fen Yang Road, Shanghai, 200031, People’s Republic of China. Email: 17
19
Text Word Count: 2938 20
Abstract Word Count: 247 21
22
IOVS Papers in Press. Published on August 21, 2014 as Manuscript iovs.14-14704
Copyright 2014 by The Association for Research in Vision and Ophthalmology, Inc.

1
Grant information: 1
This work was funded by National Natural Science Foundation of China (81170857), Foundation 2
for Shanghai Key Laboratory of Visual Impairment and Restoration (12DZ2260500), and 3
Foundation for Young Scholars of Shanghai Municipal Health Bureau (2009Y012). 4
5
6
2
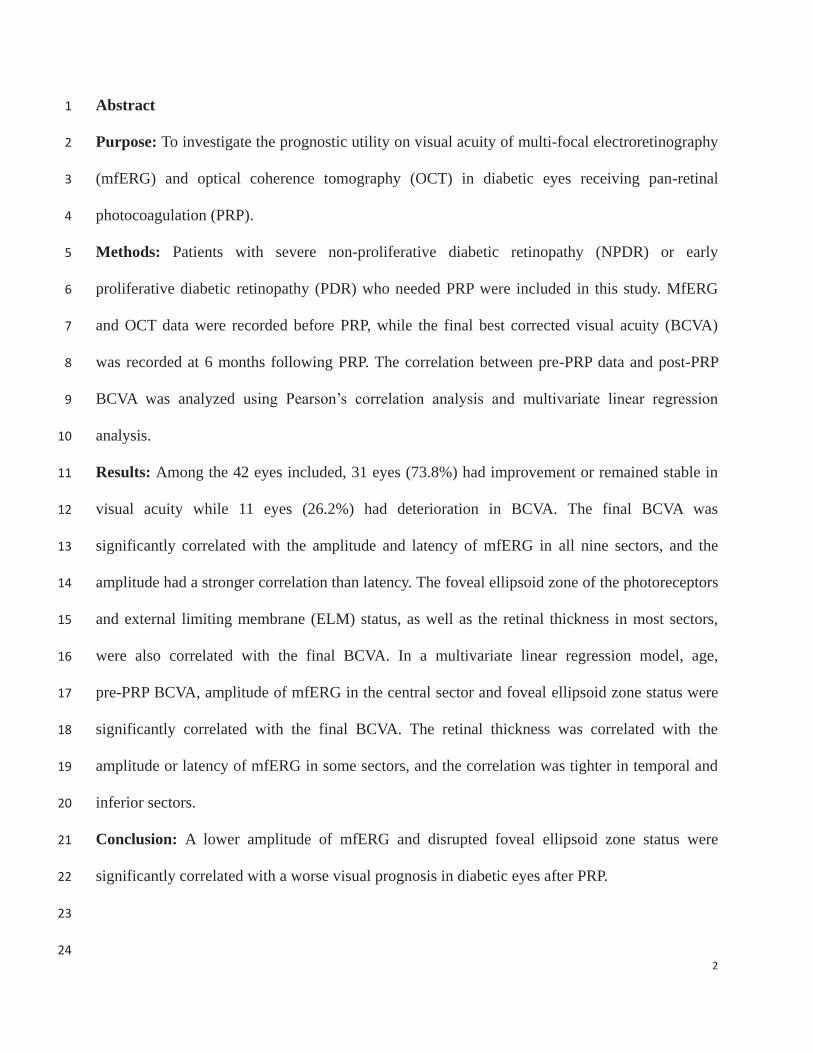
Abstract 1
Purpose: To investigate the prognostic utility on visual acuity of multi-focal electroretinography 2
(mfERG) and optical coherence tomography (OCT) in diabetic eyes receiving pan-retinal 3
photocoagulation (PRP). 4
Methods: Patients with severe non-proliferative diabetic retinopathy (NPDR) or early 5
proliferative diabetic retinopathy (PDR) who needed PRP were included in this study. MfERG 6
and OCT data were recorded before PRP, while the final best corrected visual acuity (BCVA) 7
was recorded at 6 months following PRP. The correlation between pre-PRP data and post-PRP 8
BCVA was analyzed using Pearson’s correlation analysis and multivariate linear regression 9
analysis. 10
Results: Among the 42 eyes included, 31 eyes (73.8%) had improvement or remained stable in 11
visual acuity while 11 eyes (26.2%) had deterioration in BCVA. The final BCVA was 12
significantly correlated with the amplitude and latency of mfERG in all nine sectors, and the 13
amplitude had a stronger correlation than latency. The foveal ellipsoid zone of the photoreceptors 14
and external limiting membrane (ELM) status, as well as the retinal thickness in most sectors, 15
were also correlated with the final BCVA. In a multivariate linear regression model, age, 16
pre-PRP BCVA, amplitude of mfERG in the central sector and foveal ellipsoid zone status were 17
significantly correlated with the final BCVA. The retinal thickness was correlated with the 18
amplitude or latency of mfERG in some sectors, and the correlation was tighter in temporal and 19
inferior sectors. 20
Conclusion: A lower amplitude of mfERG and disrupted foveal ellipsoid zone status were 21
significantly correlated with a worse visual prognosis in diabetic eyes after PRP. 22
23
24

3
INTRODUCTION 1
Designed to provide a topographic measure of retinal electrophysiological activity, a 2
multi-focal electroretinogram (mfERG) is able to record local ERG responses simultaneously 3
from different regions in the central 40˚-50˚ of the retina (20˚–25˚ radius from the fixation 4
point).1 Unlike pattern ERG or focal ERG, which focus on the foveal region, mfERG could also 5
provide information about non-foveal lesions.2 Since its introduction, mfERG has been found to 6
be useful in the assessment of localized retinal dysfunction caused by various acquired or 7
hereditary retinal disorders.3 A few studies have investigated the mfERG response in diabetic 8
eyes4-8 and found that implicit time measures were more sensitive than amplitude changes in 9
detecting retinal dysfunction. Based on the observation that the implicit time was significantly 10
prolonged in diabetic patients without retinopathy and in diabetic eyes the delays became longer 11
with increasing local retinopathy grade,7 Bearse et al. formulated a model based on the mfERG 12
response to predict the development of diabetic retinopathy.9 13
According to the results of the Early Treatment Diabetic Retinopathy Study (ETDRS), 14
Pan-Retinal Photocoagulation (PRP) could be beneficial for severe Non-Proliferative Diabetic 15
Retinopathy (NPDR) and early Proliferative Diabetic Retinopathy (PDR).10 PRP stopped the 16
progression of DR by improving the oxygen supply and subsequently decreasing the production 17
of VEGF, which is responsible for neovascularization. The improved oxygen supply after PRP 18
could be explained in two ways: first, the choriocapillaris is now physically closer to the inner 19
retina, and second, the highly metabolically active photoreceptors are no longer present to absorb 20
oxygen from the choriocapillaris in the area of the laser burns.11 However, the patient response to 21
PRP varies, largely dependent on the pretreatment visual acuity.12, 13 As a vital functional 22
indicator of retinal health, apart from predicting the development of disease, mfERG may also be 23

4
able to reveal the recovery potential of a retina after PRP. Besides, ellipsoid zone of the 1
photoreceptors (previously termed as photoreceptor inner and outer segment junction14) and 2
external limiting membrane (ELM) statuses measured by optical coherence tomography are 3
gaining popularity in determining the prognosis of a variety of diseases.15-19 However, the 4
prognostic value of ellipsoid zone and ELM statuses in diabetic eyes receiving PRP was not 5
reported so far. 6
In this study, we investigated the prognostic value of the pre-treatment mfERG response and 7
OCT images with respect to visual acuity after PRP, as well as the correlation between retinal 8
function and morphology. 9
10
METHODS 11
Subjects 12
This prospective interventional case series recruited patients with severe NPDR or early 13
PDR who needed PRP from August 2012 to April 2013. The study adhered to the tenets of the 14
Declaration of Helsinki and was approved by the institutional review board of Eye and ENT 15
Hospital of Fudan University. Informed consent was obtained from all subjects prior to 16
participation. The staging of diabetic retinopathy and decisions regarding treatment were made 17
by a single retina specialist (KYW) according to the recommendations of the ETDRS.10, 20, 21 18
Patients who had received photocoagulation, intra-vitreal injections of anti-VEGF agents or prior 19
retinal surgery were excluded from the study. For patients with diabetic macular edema (DME), 20
they were excluded from the study if DME involves the fovea. Patients with retinal diseases 21
other than DR (including age-related maclular degeneration (AMD), pathologic myopia, retinal 22
artery occlusion, retinal vein occlusion), glaucoma or a history of ocular trauma or inflammation 23

5
were excluded from the study. To acquire clear OCT imaging, patients with opaque media were 1
also excluded. 2
3
Study Protocol 4
Only one eye from each participant was included in the study. If both eyes met the inclusion 5
criteria, the eye with better visual acuity was included. A single retina specialist (KYW) 6
performed PRP at one-week intervals over a course of 3 to 4 weeks for each participant with the 7
advanced patterned scanning laser system (Pascal; OptiMedica, Santa Clara, California, USA).22 8
Briefly, photocoagulation was applied in a pattern array with a spot size of 200 μm and a pulse 9
duration of 20 ms. A Volk SuperQuad 160 wide-field contact lens (Image Mag 0.5x; Laser Spot 10
2.0x; Volk Optical, Mentor, OH, USA) was used to focus the laser beam on each retina, 11
magnifying the 200-μm-diameter laser spot to approximately 400 μm on the retinal plane. To 12
achieve threshold laser photocoagulation, a mild gray-white burn (between grade 3 to grade 3+) 13
was adopted according to the ETDRS guidelines. Different retinal areas were treated in the 14
following order: inferior, nasal, superior, temporal. On average, a total of 2000 to 2500 laser 15
spots were applied by the end of PRP. Demographic information collected from the patients 16
included age, gender, duration of DM, HbA1c level, presence of hypertension and refractive 17
error. The best-corrected visual acuity (BCVA) was measured using ETDRS charts. Slit-lamp 18
biomicroscopy using a Volk Digital Wide Field (Field of View 103˚/124˚; Volk Optical, Mentor, 19
OH, USA) noncontact lens and BCVA measurement were performed at baseline and 6 months 20
after completion of PRP. Multifocal ERG and OCT were performed before PRP. 21
22
OCT Scan 23

6
SD-OCT images were acquired by Spectralis OCT (Heidelberg Engineering, Heidelberg, 1
Germany). A raster imaging protocol consisting of 31 horizontal scans was adopted, which 2
covered a 30˚×25˚ area centered on the fovea.23 The scans were each 8.4 mm in length and 3
spaced 240 μm apart from each other. All scans were obtained for analysis after 25 frames were 4
averaged using built-in automatic averaging software (TruTrack; Heidelberg Engineering, 5
Heidelberg, Germany). Automated macular thickness maps were generated by the device with 6
the application of an ETDRS macular grid.24 7
8
OCT Analysis 9
The status of the foveal ellipsoid zone and ELM were examined for each eye. For the 10
ellipsoid zone appearance, all eyes were categorized into 3 groups: intact, disrupted and 11
indeterminate. The intact group included eyes with a regular continuation of the hyperreflective 12
line corresponding to the ellipsoid zone. The disrupted group included eyes characterized by 13
hyporeflective discontinuities in the ellipsoid zone line. The indeterminate group included eyes 14
with an unclearly delineated ellipsoid zone due to severe macular edema or poor image quality. 15
The evaluation of ELM status was similar to that of the ellipsoid zone and all eyes were 16
categorized into the 3 groups accordingly. 17
18
mfERG Recording 19
Multifocal electroretinograms were recorded using a visual evoked response imaging system 20
(VERIS 4.3; Electro-Diagnostic Imaging, San Mateo, California, USA). Stimulation and 21
recording of the mfERG responses were performed using the m-sequence technique according to 22
the International Society for Clinical Electrophysiology of Vision (ISCEV) guidelines.25 Briefly, 23

7
after dilation of the pupil and topical anesthesia, a Burian Allen bipolar contact lens electrode 1
(Hansen Ophthalmic, Solon City, Iowa, USA) was applied to the cornea and a ground electrode 2
was attached to the forehead. The fixation was controlled using a fundus camera and illumination 3
with infrared light from the recording electrode, with visualization of the hexagonal elements 4
over the retina. The stimulus array was centered on the fovea and consisted of 103 hexagonal 5
elements covering a visual field of 30° displayed at a 75-Hz frame rate. The sizes of the 6
hexagons were scaled with eccentricity to elicit approximately equal amplitude responses at all 7
locations. The luminance of each hexagon was independently alternated between black (<2 8
cd/m2) and white (200 cd/m2) according to a pseudorandom binary m-sequence. Each recording 9
was taken in 16 segments of approximately 15 seconds each. The fellow eye was covered with an 10
eye patch. 11
12
mfERG Analysis 13
Only the first-order response of the mfERG was analyzed.1 The first negative deflection (N1) 14
and the first positive peak (P1) of the local mfERG response waveforms were identified. The P1 15
amplitude was measured from the trough of N1 to the peak of P1. The P1 latency was measured 16
from the onset of the stimulus flash to the P1 peak. By superimposing the OCT pattern over the 17
mfERG hexagonal pattern, hexagons corresponding to the OCT pattern were identified (Figure 18
1). For each area of the 9 sectors, the responses from the corresponding hexagons were summed 19
for the analysis. 20
21
Statistical Analysis 22
All statistical analyses were performed using SPSS software version 16.0 (SPSS Inc., 23

8
Chicago, Illinois, USA). One-way analysis of variance (ANOVA) was used to determine whether 1
the final BCVA and mfERG values were significantly dependent on ellipsoid zone or ELM status. 2
The correlations between the final BCVA and retinal thickness, amplitude or latency of mfERG 3
responses before PRP were analyzed using Pearson’s correlation test. Multiple linear regression 4
was used to evaluate the influence of each potential factor (including the central foveal thickness, 5
amplitude, latency, initial BCVA, age and duration of DM) on final BCVA. 6
A P value less than 0.05 was considered statistically significant. 7
8
RESULTS 9
A total of 42 patients with diabetic retinopathy who needed PRP were recruited into this 10
study, including 18 males and 24 females. Patient age ranged from 31 to 78 years, with a mean of 11
53.4±10.0 years. All patients were diagnosed with type 2 diabetes, and the duration of diabetes 12
ranged from 2 to 20 years, with a mean of 10.0±4.9 years. The mean HbA1c level was 8.0±1.5%. 13
A total of 16 out of the 42 (38.1%) patients suffered from hypertension and were taking oral 14
medications. The refractive error mean was -0.56±1.60 diopter. The demographics of the 15
participants are listed in Table 1. 16
The mean BCVA increased slightly but not significantly from 62.6±15.0 letters to 64.0±17.8 17
letters at 6 months after PRP. Among the 42 eyes included, 31 eyes (73.8%) showed 18
improvement or remained stable in visual acuity, while 11 eyes (26.2%) showed deterioration in 19
BCVA. Fourteen eyes (33.3%) had extrafoveal DME, however there was no statistically 20
significant difference in BCVA between patients with extrafoveal DME and patients without. 21
Pearson’s correlation analysis was conducted to investigate the correlation between final 22
BCVA and the amplitude or latency of mfERG in all nine sectors. In the central sector 23

9
corresponding to the fovea, the Pearson’s correlation coefficient was 0.585 (P<0.001) between 1
the final BCVA and amplitude and -0.429 (P<0.001) between the final BCVA and latency. A 2
statistically significant correlation between final BCVA and amplitude or latency was also 3
detected in the other eight sectors (Table 2). Generally, good visual prognosis was associated 4
with a larger amplitude or a shorter latency. In most sectors, the ρ2 of latency was larger than that 5
of amplitude, which indicated a stronger correlation between latency and final BCVA. 6
The prognostic value of retinal structure, which was represented by retinal thickness, was 7
analyzed by Pearson’s correlation analysis. A statistically significant correlation between the 8
final BCVA and retinal thickness was detected in all sectors except the inner nasal sector (Table 9
2). 10
The impact of the ellipsoid zone status or the ELM status on visual prognosis was analyzed 11
with ANOVA (Figure 2). Based on the ellipsoid zone status before PRP, 27 eyes had intact 12
ellipsoid zone, 14 eyes had disrupted ellipsoid zone and 1 eye had an indeterminate status. The 13
mean post-PRP BCVA was 69.5±17.0 letters in the intact group and 54.1±15.0 in the disrupted 14
group (P=0.006). The mean P1 amplitude of the central sector was 23.4±12.7 nV/deg2 in the 15
intact group and 10.6±5.9 nV/deg2 in the disrupted group (P=0.001). The mean P1 latency of the 16
central sector was 34.2±2.4 ms in the intact group and 35.7±4.8 in the disrupted group (P=0.182). 17
Based on the ELM status before PRP, 30 eyes had intact ELM, 11 eyes had disrupted ELM and 1 18
eye had an indeterminate ELM status. The mean post-PRP BCVA was 69.6±16.0 letters in the 19
intact group and 49.9±12.9 in the disrupted group (P=0.001). The mean P1 amplitude of the 20
central sector was 21.6±13.1 nV/deg2 in the intact group and 11.7±6.1 nV/deg2 in the disrupted 21
group (P=0.017). The mean P1 latency of the central sector was 33.6±2.2 ms in the intact group 22
and 37.3±4.6 ms in the disrupted group (P=0.001). 23

10
A multiple linear regression model was also built to explore the role of retinal function and 1
structure in the prognosis (Table 3). It turned out that the amplitude of mfERG (P=0.001), foveal 2
ellipsoid zone status (P=0.013), pre-PRP BCVA (P<0.001) and age (P=0.004) were correlated 3
with the final BCVA. 4
The association between retinal structure and retinal function was analyzed by Pearson’s 5
correlation analysis (Table 4). The amplitude of the mfERG response had a statistically 6
significant correlation with retinal thickness in the central (ρ=-0.305, P=0.049), inner temporal 7
(ρ=-0.366, P=0.017), outer temporal (ρ=-0.390, P=0.011) and outer superior (ρ=-0.387, P=0.011) 8
sectors. The latency of the mfERG response was significantly correlated with retinal thickness in 9
the inner inferior (ρ=0.330, P=0.033), outer inferior (ρ=0.376, P=0.014), outer nasal (ρ=0.366, 10
P=0.017), outer temporal (ρ=0.319, P=0.039) and outer superior (ρ=0.370, P=0.016) sectors. 11
Briefly, a thicker retinal thickness was associated with a smaller amplitude or a longer latency, 12
and the correlation was tighter in the temporal and inferior sectors, especially in the outer ring. 13
14
DISCUSSION 15
The present study is the first to demonstrate the prognostic utility on visual acuity of a 16
multifocal electroretinogram in eyes requiring panretinal photocoagulation, as well as to 17
investigate the correlation between mfERG values and OCT features. We found that functional 18
parameters assessed by mfERG and structural parameters assessed by OCT were correlated with 19
the final visual prognosis, and these two assessments correlated well with each other. In all nine 20
sectors, both the amplitude and latency of mfERG were correlated with the final BCVA after PRP. 21
Of the various OCT parameters, foveal ellipsoid zone status and ELM status were tightly 22
correlated with visual prognosis, and retinal thickness in most sectors was also correlated with 23

11
the final BCVA. 1
As a viable tool to evaluate retinal function, mfERG was found to be valuable in predicting 2
the development of diabetic retinopathy9, 26 and diabetic edema.27 In the present study, we 3
demonstrated the prognostic value of mfERG in patients with diabetic retinopathy who 4
underwent PRP. Both the amplitude and latency of mfERG was correlated with final BCVA after 5
PRP, and amplitude remained a key contributor in a multiple linear regression analysis. Unlike 6
previous studies,9, 27, 28 amplitude seemed to be more sensitive than latency in our study. There 7
may be two explanations for this finding: first, there were conflicting results regarding the 8
change in mfERG parameters before and after laser treatment in diabetic patients.29, 30 9
Lovestam-Adrian found that the amplitude decreased significantly and the latency remained 10
unchanged after PRP, while Greenstein found that the latency rather than the amplitude changed 11
significantly after focal laser treatment for DME. PRP, therefore, may have a closer relationship 12
with amplitude than latency. Second, the patients included in our study were at a relatively late 13
stage of diabetic retinopathy, and most of them had severely impaired retinas; thus, some of the 14
mfERG curves were low and flat and it was difficult to identify N1 and P1. The accuracy of 15
latency was affected much more than that of amplitude because amplitude did not vary as much 16
along the curve as did latency. 17
Apart from retinal thickness, ellipsoid zone and ELM statuses are widely used in 18
determining the prognosis of retinal diseases.15-19 Maheshwary31 and Otani32 both demonstrated 19
that the integrity of the ellipsoid zone was crucial to the BCVA of patients with DME. Murakami 20
was the first to demonstrate the relevance of ELM as a representative of visual function in 21
DME.33 Shah proved that ELM and ellipsoid zone integrity correlated well with BCVA after pars 22
plana vitrectomy (PPV) for PDR.34 In patients with DME that was treated successfully with 23

12
intravitreal triamcinolone injection, Shin found that ellipsoid zone and ELM status, rather than 1
central macular thickness, were useful hallmarks for predicting the final BCVA.35 Our results 2
echoed these findings. Both ellipsoid zone and ELM status were correlated with final BCVA after 3
PRP, but not in the same manner. Only ellipsoid zone status remained statistically significant in 4
the multiple linear regression model, whereas ELM status showed a better correlation with 5
mfERG latency. Because ellipsoid zone and ELM reflect different parts of retina,15, 36 the 6
difference was plausible. Future studies are necessary to clarify the mechanism behind the 7
difference. 8
The correlation of OCT and mfERG parameters in our study was statistically significant in 9
most sectors, thus showing the link between retinal function and structure. Yamamoto 10
demonstrated that implicit times were directly correlated with foveal thickness in patients with 11
DME5. Apart from edema, other signs of diabetic retinopathy (including dot hemorrhages, 12
microaneurysms, hard exudates and cotton wool spots) are all associated with abnormalities in 13
mfERG9. Although the exact mechanism remains unknown, hypoxia, perfusion defects, or 14
changes in local metabolism may play a role in the process26, 37 All the signs of diabetic 15
retinopathy indicating disruption of the blood retinal barrier could cause thickening of retina. It’s 16
therefore not surprising that increased retinal thickness correlated with decreased retinal 17
physiologic function by mfERG in most sectors. However, Dhamdbere investigated the 18
association between local neuroretinal function and local retinal thickness, but the correlation 19
was not significant.38 In Dhamdbere’s study, all included patients were diagnosed with diabetes 20
but without diabetic retinopathy, whereas the patients included in the present study were all 21
diagnosed with relatively late stage diabetic retinopathy. The stage of disease played a key role 22
here. In an early stage of diabetes, at least before the onset of diabetic retinopathy, the OCT and 23

13
mfERG results reflected different aspects of the disease. With disease progression, both the 1
structure and function of the retina were severely affected, and the measurements of the two tests 2
echoed each other. 3
The present study had several limitations. Firstly, the number of participants included in the 4
study was small. When it comes to correlation analysis, it’s not easy for a small sample to detect 5
reliable statistically significant results. Secondly, we primarily focused on visual acuity 6
prognosis after PRP and failed to provide detailed information about other visual functions. 7
In conclusion, the present study investigated both the functional and structural parameters 8
for the prognosis of diabetic eyes after PRP. The amplitude of mfERG and the foveal ellipsoid 9
zone status were the most valuable indications. 10
11
12

14
REFERENCES 1
1. Hood DC. Assessing retinal function with the multifocal technique. Prog Retin Eye Res 2000; 19:607-46. 2 2. Hood DC, Odel JG, Chen CS et al. The multifocal electroretinogram. J Neuroophthalmol 2003; 23:225-35. 3 3. Lai TY, Chan WM, Lai RY et al. The clinical applications of multifocal electroretinography: a systematic 4 review. Surv Ophthalmol 2007; 52:61-96. 5 4. Palmowski AM, Sutter EE, Bearse MA, Jr. et al. Mapping of retinal function in diabetic retinopathy using the 6 multifocal electroretinogram. Invest Ophthalmol Vis Sci 1997; 38:2586-96. 7 5. Yamamoto S, Yamamoto T, Hayashi M et al. Morphological and functional analyses of diabetic macular edema 8 by optical coherence tomography and multifocal electroretinograms. Graefes Arch Clin Exp Ophthalmol 2001; 9 239:96-101. 10 6. Klemp K, Larsen M, Sander B et al. Effect of short-term hyperglycemia on multifocal electroretinogram in 11 diabetic patients without retinopathy. Invest Ophthalmol Vis Sci 2004; 45:3812-9. 12 7. Fortune B, Schneck ME and Adams AJ. Multifocal electroretinogram delays reveal local retinal dysfunction in 13 early diabetic retinopathy. Invest Ophthalmol Vis Sci 1999; 40:2638-51. 14 8. Greenstein VC, Holopigian K, Hood DC et al. The nature and extent of retinal dysfunction associated with 15 diabetic macular edema. Invest Ophthalmol Vis Sci 2000; 41:3643-54. 16 9. Bearse MA, Jr., Adams AJ, Han Y et al. A multifocal electroretinogram model predicting the development of 17 diabetic retinopathy. Prog Retin Eye Res 2006; 25:425-48. 18 10. Early photocoagulation for diabetic retinopathy. ETDRS report number 9. Early Treatment Diabetic 19 Retinopathy Study Research Group. Ophthalmology 1991; 98:766-85. 20 11. Bressler NM, Beck RW and Ferris FL, 3rd. Panretinal photocoagulation for proliferative diabetic retinopathy. N 21 Engl J Med 2011; 365:1520-6. 22 12. Kaiser RS, Maguire MG, Grunwald JE et al. One-year outcomes of panretinal photocoagulation in proliferative 23 diabetic retinopathy. Am J Ophthalmol 2000; 129:178-85. 24 13. Bek T and Erlandsen M. Visual prognosis after panretinal photocoagulation for proliferative diabetic 25 retinopathy. Acta Ophthalmol Scand 2006; 84:16-20. 26 14. Staurenghi G, Sadda S, Chakravarthy U et al. Proposed Lexicon for Anatomic Landmarks in Normal Posterior 27 Segment Spectral-Domain Optical Coherence Tomography: The IN*OCT Consensus. Ophthalmology 2014 28 Aug;121(8):1572-8. 29 15. Wakabayashi T, Oshima Y, Fujimoto H et al. Foveal microstructure and visual acuity after retinal detachment 30 repair: imaging analysis by Fourier-domain optical coherence tomography. Ophthalmology 2009; 116:519-28. 31 16. Suh MH, Seo JM, Park KH et al. Associations between macular findings by optical coherence tomography and 32 visual outcomes after epiretinal membrane removal. Am J Ophthalmol 2009; 147:473-480 e3. 33 17. Wakabayashi T, Fujiwara M, Sakaguchi H et al. Foveal microstructure and visual acuity in surgically closed 34 macular holes: spectral-domain optical coherence tomographic analysis. Ophthalmology 2010; 117:1815-24. 35 18. Uji A, Murakami T, Nishijima K et al. Association between hyperreflective foci in the outer retina, status of 36 photoreceptor layer, and visual acuity in diabetic macular edema. Am J Ophthalmol 2012; 153:710-7, 717 e1. 37

15
19. Asai T, Ikuno Y and Nishida K. Macular microstructures and prognostic factors in myopic subretinal 1 hemorrhages. Invest Ophthalmol Vis Sci 2014; 55:226-32. 2 20. Fundus photographic risk factors for progression of diabetic retinopathy. ETDRS report number 12. Early 3 Treatment Diabetic Retinopathy Study Research Group. Ophthalmology 1991; 98:823-33. 4 21. Grading diabetic retinopathy from stereoscopic color fundus photographs--an extension of the modified Airlie 5 House classification. ETDRS report number 10. Early Treatment Diabetic Retinopathy Study Research Group. 6 Ophthalmology 1991; 98:786-806. 7 22. Blumenkranz MS, Yellachich D, Andersen DE et al. Semiautomated patterned scanning laser for retinal 8 photocoagulation. Retina 2006; 26:370-6. 9 23. Chhablani J, Barteselli G, Wang H et al. Repeatability and reproducibility of manual choroidal volume 10 measurements using enhanced depth imaging optical coherence tomography. Invest Ophthalmol Vis Sci 2012; 11 53:2274-80. 12 24. Forooghian F, Cukras C, Meyerle CB et al. Evaluation of time domain and spectral domain optical coherence 13 tomography in the measurement of diabetic macular edema. Invest Ophthalmol Vis Sci 2008; 49:4290-6. 14 25. Hood DC, Bach M, Brigell M et al. ISCEV standard for clinical multifocal electroretinography (mfERG) (2011 15 edition). Doc Ophthalmol 2012; 124:1-13. 16 26. Harrison WW, Bearse MA, Jr., Ng JS et al. Multifocal electroretinograms predict onset of diabetic retinopathy 17 in adult patients with diabetes. Invest Ophthalmol Vis Sci 2011; 52:772-7. 18 27. Harrison WW, Bearse MA, Jr., Schneck ME et al. Prediction, by retinal location, of the onset of diabetic edema 19 in patients with nonproliferative diabetic retinopathy. Invest Ophthalmol Vis Sci 2011; 52:6825-31. 20 28. Kim YM, Lee SY and Koh HJ. Prediction of postoperative visual outcome after pars plana vitrectomy based on 21 preoperative multifocal electroretinography in eyes with diabetic macular edema. Graefes Arch Clin Exp 22 Ophthalmol 2010; 248:1387-93. 23 29. Lovestam-Adrian M, Andreasson S and Ponjavic V. Macular function assessed with mfERG before and after 24 panretinal photocoagulation in patients with proliferative diabetic retinopathy. Doc Ophthalmol 2004; 109:115-21. 25 30. Greenstein VC, Chen H, Hood DC et al. Retinal function in diabetic macular edema after focal laser 26 photocoagulation. Invest Ophthalmol Vis Sci 2000; 41:3655-64. 27 31. Maheshwary AS, Oster SF, Yuson RM et al. The association between percent disruption of the photoreceptor 28 inner segment-outer segment junction and visual acuity in diabetic macular edema. Am J Ophthalmol 2010; 29 150:63-67 e1. 30 32. Otani T, Yamaguchi Y and Kishi S. Correlation between visual acuity and foveal microstructural changes in 31 diabetic macular edema. Retina 2010; 30:774-80. 32 33. Murakami T, Nishijima K, Sakamoto A et al. Association of pathomorphology, photoreceptor status, and retinal 33 thickness with visual acuity in diabetic retinopathy. Am J Ophthalmol 2011; 151:310-7. 34 34. Shah VA, Brown JS and Mahmoud TH. Correlation of outer retinal microstucture and foveal thickness with 35 visual acuity after pars plana vitrectomy for complications of proliferative diabetic retinopathy. Retina 2012; 36 32:1775-80. 37

16
35. Shin HJ, Lee SH, Chung H et al. Association between photoreceptor integrity and visual outcome in diabetic 1 macular edema. Graefes Arch Clin Exp Ophthalmol 2012; 250:61-70. 2 36. Chhablani JK, Kim JS, Cheng L et al. External limiting membrane as a predictor of visual improvement in 3 diabetic macular edema after pars plana vitrectomy. Graefes Arch Clin Exp Ophthalmol 2012; 250:1415-20. 4 37. Bearse MA, Jr., Han Y, Schneck ME et al. Retinal function in normal and diabetic eyes mapped with the slow 5 flash multifocal electroretinogram. Invest Ophthalmol Vis Sci 2004; 45:296-304. 6 38. Dhamdhere KP, Bearse MA, Jr., Harrison W et al. Associations between local retinal thickness and function in 7 early diabetes. Invest Ophthalmol Vis Sci 2012; 53:6122-8. 8 9
10

17
FIGURE LEGENDS 1
2
FIGURE 1. Representative optical coherence tomography (OCT) scans (A, B, C) and multifocal 3
electroretinography (mfERG) images (D, E) from a 60-year-old male who had type 2 diabetes 4
mellitus for 20 years. With the use of 1-3-6 mm ETDRS macular grid (A), the mean retinal 5
thicknesses of the corresponding sectors were automatically calculated by the built-in software 6
(B). The foveal OCT scan was analyzed with caution to determine the status of the ellipsoid zone 7
of the photoreceptors and the external limiting membrane (ELM) (C). By superimposing the 8
OCT pattern over the mfERG hexagonal pattern, hexagons corresponding to the OCT pattern 9
were identified (D). For each sector represented by a different number, the responses from the 10
corresponding hexagons were summed for analysis of amplitude and latency (E). 11
12
FIGURE 2. Final best-corrected visual acuity (BCVA), amplitude and latency of mfERG based 13
on the foveal ellipsoid zone status (A, B, C) or the external limiting membrane (ELM) status (D, 14
E, F). In the group of intact ellipsoid zone, the post-PRP BCVA (A) was significantly better 15
(P=0.006) and the mean P1 amplitude (B) was significantly larger (P=0.001). In the group with 16
intact ELM, the patients had a better post-PRP BCVA (D) (P=0.001), a larger P1 amplitude (E) 17
(P=0.017) and a shorter P1 latency (F) (P=0.001). 18
19

18
TABLE 1. Participant Demographics 1
Age, y 53.4±10.0
Gender: Male/Female, No. 18/24
Duration of DM, y 10.0±4.9
HbA1c, % 8.0±1.5
Hypertension, No. (%) 16 (38.1%)
Refractive Error, diopter -0.56±1.60
Data was presented as mean±SD 2
3

19
TABLE 2. Correlations between Final Best-Corrected Visual Acuity and Amplitude, Latency of 1
Multifocal Electroretinography or Retinal Thickness Before PRP in Different Sectors 2
Amplitude Latency Retinal Thickness
ρ P value ρ P value ρ P value
Central 0.585 <0.001 -0.429 0.005 -0.395 0.010
Inner Superior 0.414 0.006 -0.525 <0.001 -0.360 0.019
Inner Nasal 0.551 <0.001 -0.448 0.003 -0.241 0.125
Inner Inferior 0.311 0.045 -0.571 <0.001 -0.357 0.020
Inner Temporal 0.403 0.008 -0.573 <0.001 -0.339 0.028
Outer Superior 0.368 0.017 -0.652 <0.001 -0.311 0.045
Outer Nasal 0.479 0.001 -0.511 0.001 -0.410 0.007
Outer Inferior 0.416 0.006 -0.653 <0.001 -0.413 0.007
Outer Temporal 0.538 <0.001 -0.569 <0.001 -0.337 0.029
ρ (rho) indicates Pearson’s correlation coefficient 3
4
5

20
TABLE 3. Multiple Linear Regression Analysis for Final Best-Corrected Visual Acuity at Six 1
Months after Panretinal Photocoagulation 2
Β Standardized β P value
Amplitude 0.473 0.328 0.001
Latency -0.099 -0.019 0.512
Central foveal thickness -0.001 -0.009 0.926
Ellipsoid zone 9.013 0.246 0.013
ELM -5.629 -0.145 0.211
BCVA before PRP 0.977 0.824 0.000
Age 0.504 0.283 0.004
Duration of DM -0.398 -0.109 0.534
3
4

21
TABLE 4. Correlations between Retinal Thickness and Amplitude or Latency of Multifocal 1
Electroretinography Response in Different Sectors 2
Amplitude Latency
ρ P value ρ P value
Central -0.305 0.049 0.119 0.451
Inner Superior -0.190 0.228 0.284 0.069
Inner Nasal -0.087 0.585 0.098 0.536
Inner Inferior -0.225 0.152 0.330 0.033
Inner Temporal -0.366 0.017 0.170 0.283
Outer Superior -0.387 0.011 0.370 0.016
Outer Nasal -0.112 0.479 0.366 0.017
Outer Inferior -0.298 0.055 0.376 0.014
Outer Temporal -0.390 0.011 0.319 0.039
ρ (rho) indicates Pearson’s correlation coefficient 3