Can children with Autism read emotions from the eyes? The Eyes Test revisited
18
- Research in Developmental Disabilities (in press) – Online publication complete: 11-MAR-2014 DOI information: 10.1016/j.ridd.2014.01.037 Can children with Autism read emotions from the eyes? The Eyes Test revisited. Fabia Franco a , Shoji Itakura b , Krystyna Pomorska c , Anna Abramowski d , Kozue Nikaido a and Dagmara Dimitriou e a Department of Psychology, School of Health and Education, Middlesex University, London, UK b Department of Psychology, Kyoto University, Japan c University of Social Sciences and Humanities, Warsaw, Poland d City University, London, UK e Department of Psychology and Human Development, Institute of Education, London, UK Corresponding author: Fabia Franco, PhD Department of Psychology, School of Health and Education, Middlesex University, Town Hall, The Burroughs, Hendon, London NW4 4BT United Kingdom Tel. +44 (0) 208 411 5471 E-mail: [email protected] 2 Abstract This study aimed to test two new, simplified tasks related to the eye-test, targeting children with Autism Spectrum Disorder (ASD) and typically developing controls (TD). Test-1 assessed the recognition of emotion/mental states with displays using one word and two eye- pictures, whereas Test-2 presented displays using two words and one eye-picture. Black and white photographs of children were used as materials. A cross-cultural study (Caucasian/East-Asian) with adults was initially carried out to verify generalizability across different ethnic groups. Cross-sectional trajectory analyses were used to compare emotion recognition from the eyes in the two tests. Trajectories were constructed linking performance on both tests either to chronological age or to different measures of mental age (receptive vocabulary based on the BPVS, CARS or ASQ for the ASD group). Performance improved with chronological age in both the ASD and TD groups of children. However, performance in Test-1 was significantly superior in children with ASD, who showed delayed onset and slower rate of improvement than TD children in Test-2. In both the ASD and TD groups the lowest error rate was recorded for the item ‘anger’, suggesting that threat-detection cue mechanisms may be intact in Autism. In general, all children showed good performance on our novel tests, thus making them good candidates for assessing younger children and those with lower general abilities. Keywords: ASD, emotion recognition, eye-test, developmental disorders, Theory of Mind (ToM)
Transcript of Can children with Autism read emotions from the eyes? The Eyes Test revisited
- Research in Developmental Disabilities (in press) –
Online publication complete: 11-MAR-2014 DOI information: 10.1016/j.ridd.2014.01.037
Can children with Autism read emotions from the eyes?
The Eyes Test revisited.
Fabia Francoa, Shoji Itakurab, Krystyna Pomorskac, Anna Abramowskid, Kozue
Nikaidoa and Dagmara Dimitrioue
a Department of Psychology, School of Health and Education, Middlesex University, London, UK
b Department of Psychology, Kyoto University, Japan
c University of Social Sciences and Humanities, Warsaw, Poland
d City University, London, UK
e Department of Psychology and Human Development, Institute of Education, London, UK
Corresponding author:
Fabia Franco, PhD
Department of Psychology,
School of Health and Education,
Middlesex University,
Town Hall, The Burroughs,
Hendon, London NW4 4BT
United Kingdom
Tel. +44 (0) 208 411 5471
E-mail: [email protected]
2
Abstract This study aimed to test two new, simplified tasks related to the eye-test, targeting children
with Autism Spectrum Disorder (ASD) and typically developing controls (TD). Test-1
assessed the recognition of emotion/mental states with displays using one word and two eye-
pictures, whereas Test-2 presented displays using two words and one eye-picture. Black and
white photographs of children were used as materials. A cross-cultural study
(Caucasian/East-Asian) with adults was initially carried out to verify generalizability across
different ethnic groups. Cross-sectional trajectory analyses were used to compare emotion
recognition from the eyes in the two tests. Trajectories were constructed linking performance
on both tests either to chronological age or to different measures of mental age (receptive
vocabulary based on the BPVS, CARS or ASQ for the ASD group). Performance improved
with chronological age in both the ASD and TD groups of children. However, performance in
Test-1 was significantly superior in children with ASD, who showed delayed onset and
slower rate of improvement than TD children in Test-2. In both the ASD and TD groups the
lowest error rate was recorded for the item ‘anger’, suggesting that threat-detection cue
mechanisms may be intact in Autism. In general, all children showed good performance on
our novel tests, thus making them good candidates for assessing younger children and those
with lower general abilities.
Keywords:
ASD, emotion recognition, eye-test, developmental disorders, Theory of Mind (ToM)

3
“Her complexion varied with every emotion of her soul, and her eyes, the heralds of her speech, now beamed with understanding and now glistened with sensibility”
(Mullan, THE 7 June 2012 - Cecilia character in Fanny Burney’s novels, 1782)
1. INTRODUCTION
Since the work of Premack and Woodruff (1979), research on “mind-reading” abilities has
expanded into numerous areas of neuroscience and psychology. Mind-reading refers here to
the propensity to conceptualize and predict the behavior of others in terms of motivational
states, thoughts and beliefs, e.g., “the little girl is skipping down the road because she thinks
the ice-cream van is there and she wants an ice-cream”. Development of such abilities
emphasizes the separability of mind-reading skills from other cognitive factors (Leslie, 1987).
Some evidence comes from studies of high-functioning individuals with autism who failed
simple false-belief tasks (Baron-Cohen, Leslie & Frith, 1985; Baron-Cohen, Tager-Flusberg
& Cohen, 1993; Kaland, Callesen, Møller-Nielsen, Lykke Mortensen & Smith, 2008), while
passing logically-equivalent tasks not involving the thoughts/mental states of another
(Charman & Baron-Cohen, 1992). Subsequent research has acknowledged that many
individuals with autism, and those with other conditions such as traumatic brain injury
(Apperly, Samson, Chaivarino, Bickerton & Humphrey, 2007; Happe, Malhi & Checkley,
2001), schizophrenia (Lee, Farrow, Spence & Woodruff, 2004), sometimes focal epilepsy
(Farrant, Morris, Russell, Elwes, Akanuma, Alarcon & Koutroumanidis, 2005), appear to be
impaired on mind-reading abilities, albeit not completely lacking the capacity to interpret the
behavior of others with respect to desires and beliefs.
Despite the complexity of mind-reading behavior, in terms of interpreting subtle non-verbal
cues and integrating contextual information, finding a way of assessing such abilities to yield
consistent findings in both clinical and non-clinical populations has remained surprisingly
elusive (Apperly & Butterfill, 2009). While recent work has gone some way to address this
4
gap with a revised “reading the mind in films” task for adults and children (Golan et al.,
2006), as well as the earlier revised child “Emotion in the Eyes task”, no study has yet charted
the developmental trajectory of this ability using a child-friendly task in both young children
with ASD and typically developing children (TD).
The present study thus aims to fill this gap by providing a novel and simpler emotion-in-the-
eyes-reading task suitable for very young children and for those with limited vocabulary.
ASD is a common neurodevelopmental syndrome with a strong genetic basis (Abrahams &
Geschwind, 2008), characterised by two core components: social interaction/communication
impairments and stereotypic behaviours. However, there are marked differences in the extent
and quality of the symptoms found in individuals with ASD. However, one of the most
common features of ASD is their striking difficulties with social skills such as understanding
emotions and the mental states of others (Baron-Cohen, 1995).
Amongst the more salient impairments for ASD in the social communication arena is the
failure to process information from the faces of others such as facial expression, eye gaze and
facial recognition which play a significant role in social cognition (Hadjikhani, Joseph,
Snyder, Chabris, Clark et al., 2004; Pellicano, Jeffery, Burr and Rhodes, 2007;
Ramachandran, Mitchell & Ropar, 2010). A number of studies have reported that children
with ASD show greater attention to the mouth rather than to the eye region (e.g., Annaz,
Karmiloff-Smith, Johnson, & Thomas, 2009; Klin, Jones, Schultz, Volkmar, & Cohen, 2002;
Riby, Doherty-Sneddon, & Bruce, 2009). Furthermore, compared to typical controls,
individuals with ASD show reduced looking times to people, and to faces in particular, in
both static and dynamic social scenes (e.g., Annaz, et al., 2010; Annaz, et al., 2012; Klin et
5
al., 2002; Riby & Hancock, 2008). Several functional imaging studies report atypical or weak
activation of the fusiform gyrus in ASD, an area that is activated during face recognition in
typical individuals (Dalton et al., 2005; Schultz et al., 2000), perhaps related to atypical
scanning pathways or reduced attention to the eyes (Dalton et al., 2005).
Individuals with ASD have also been shown to lack the ability to mentalize and gain social
insight into the goals and intentions of other people’s behaviours (Castelli, Frith, Happé, &
Frith, 2002; Hamilton, 2009). Children with ASD experience difficulties with false-belief
tasks, pretend play and representing other people’s mental states (Hamilton, 2009) while they
also show impaired empathizing skills on both cognitive (recognizing other people’s mental
states) and affective levels (emotion reaction deciphered from the person’s mental states)
(Baron-Cohen, Golan, & Ashwin, 2009). For instance, lower performance on the “Reading
the Mind in the Eyes Test” (the Eyes Test henceforth) developed by Baron-Cohen et al.
(1997) and later revised (Baron-Cohen, Wheelwright, Spong, Scahill & Lawson, 2001;
Baron-Cohen, Wheelwright, Hill, Raste, & Plumb, 2001) has been linked to theory of mind
(ToM) or “mentalizing” deficits. This test is thought to reflect the ability of participants to
demonstrate their “mentalizing” abilities, i.e., their understanding of another person’s mental
states such as their emotions, thoughts, desires, beliefs, goals and how they might influence
their behaviour (Peterson, & Slaughter, 2009). Hence, the Eyes Test appeared to be tapping
into a well-known deficit in ASD.
However, several limitations of the Eyes Test require attention. First, the test uses posed
facial expression of emotions thereby lacking a genuine and naturalistic setting (Johnston,
Miles & McKinlay, 2008). Second, initial validation of the task was based on the poorer
scores obtained from high-functioning individuals with Autism or Asperger syndrome relative
6
to matched controls (Baron-Cohen et al., 1997, Baron-Cohen et al., 2001), a result which has
been generally replicated (Back, Ropar & Mitchell, 2007). However, it did not cover children
with more severe expression of autistic traits. Third, it assumed quite a good level of literacy,
advanced vocabulary, and reading skills, since it included low frequency words such as
“incredulous” and “dispirited” (Peterson & Slaughter, 2009). A child version of the Eyes Test
was subsequently devised by Baron-Cohen, Wheelwright, Scahill, Spong, and Lawson
(2001), using somewhat simpler words. However, children were still shown four written
words stimuli (one target word and three foils), resulting in a considerable cognitive load to
retain in memory and calling on good literacy skills (the need to read, for example, words like
“surprised”, “joking”, “sure about something” and “happy” - p.45). Peterson and Slaughter
(2009) modified this test to a “simplified eye-reading” task (SERT) to make it suitable for
children who have not yet learned to read yet, albeit conserving its ability to assess ToM
through observing people’s thoughts and feelings by looking at their eyes. Johnston et al.
(2008) have also pointed out a number of methodological factors limiting the reliability of the
Eyes Test, such as the posed vs. genuine emotion, quality of the images (orientation etc.), lack
of control on the four words used in the test (target vs. foils). Finally, there is still a surprising
lack of data examining children with lower functioning autism, although these individuals
form around 70% of the total diagnosed with ASD (Baird, Simonoff, Pickles, Chandler,
Loucas, Meldrum & Charman, 2006).
The materials developed for the Eyes Test of the present study were derived from naturalistic
pictures of children (rather than adults) and included reduced cognitive demands by showing
children only two eye-pictures with one word (Test-1) or one eye-picture with two words
(Test-2). Since all our participants came from a cosmopolitan multi-ethnic environment, a

7
cross-cultural study (Caucasian/East-Asian) with adults was initially carried out to verify
generalizability across different ethnic groups.
The aim of the current study was twofold: [1] to investigate performance in children with
ASD and TD controls on emotion recognition derived from the eye-region of a face; and [2]
to compare the ASD and TD groups’ performance trajectories on two different tasks (Test-1
and Test-2), with one task relying on language less than the other (Test-1). Based on results
from previous research and our current test modifications, we predicted that primary emotions
would be easier to distinguish than mental states and that children with more advanced
languages skills (based on their BPVS scores) would show better performance on the tests,
particularly with respect to Test-2 (one eye-picture, two words). Comparison of the two tests
will also inform us as to whether the difficulty of the task for children with ASD is more
likely due to their difficulty in processing facial emotions (particularly from the eye region –
e.g., Klin et al., 2002) or to accessing emotionally-loaded linguistic information (e.g., Tager-
Flusberg & Joseph, 2005).
2. METHOD
2.1 Generalisation of the experimental task
The materials were tested cross-culturally (Caucasian/East-Asian) in order to assess
generalisation and level of difficulty of the test. As the data for the main study were collected
in a multi-ethnic city, it was important to control for possible same-race biases, without
increasing the number of items (e.g., representing various ethnicities) or confounding emotion
and ethnicity in the materials for the developmental samples. One cross-cultural comparison
was conducted. Forty university students (50% female), including 20 British participants
(tested in London UK, from a similar multi-ethnic background as the child samples) and 20
8
Japanese participants (tested in Kyoto), took part. The test display included one picture of the
eye-region and two words (one for the target emotion or mental state, one foil) against a dark
background (see 2.3).
Displays contained black and white photos of Caucasian children’s eye region, portraying
either mental states or primary emotions. Care was taken to use facial displays that were
upright and frontal (± 15o from midline). Type of expression and valence were controlled
across the stimuli, including four items in each category for primary emotions and mental
states respectively, with two neutral/positive and two negative valence expressions in each
category. The selection of expressions was chosen following a detailed review of the
literature, which indicated young children’s knowledge of terms referring to emotions or
mental states (e.g., Astington & Jenkins, 1995, 1999; Jenkins & Astington, 1996, 2000). The
expressions included as primary emotions were happy and surprised (positive/neutral
valence), and sad and angry (negative valence), while excited and thinking (positive/neutral
valence), and worried and shy (negative valence) were selected to represent mental states.
Although in most cases it is unknown what the child was actually feeling at the time of taking
the photographs, they were all derived from naturalistic settings (e.g., taken by parents) rather
than being posed specifically for an experiment.
For the test, 56 slides were prepared with each of the eight above-described target
emotion/mental states paired with each of the seven remaining emotion/mental states in the
Caucasian series – see Appendix 1. The displays were randomized across participants and the
positioning of words within the displays (aligned with left/right bottom edge of the picture)
was counterbalanced to avoid spatial bias. In the cross-cultural preliminary study, the 56
Caucasian slides were used, with the addition of an equivalent set of 56 black and white
9
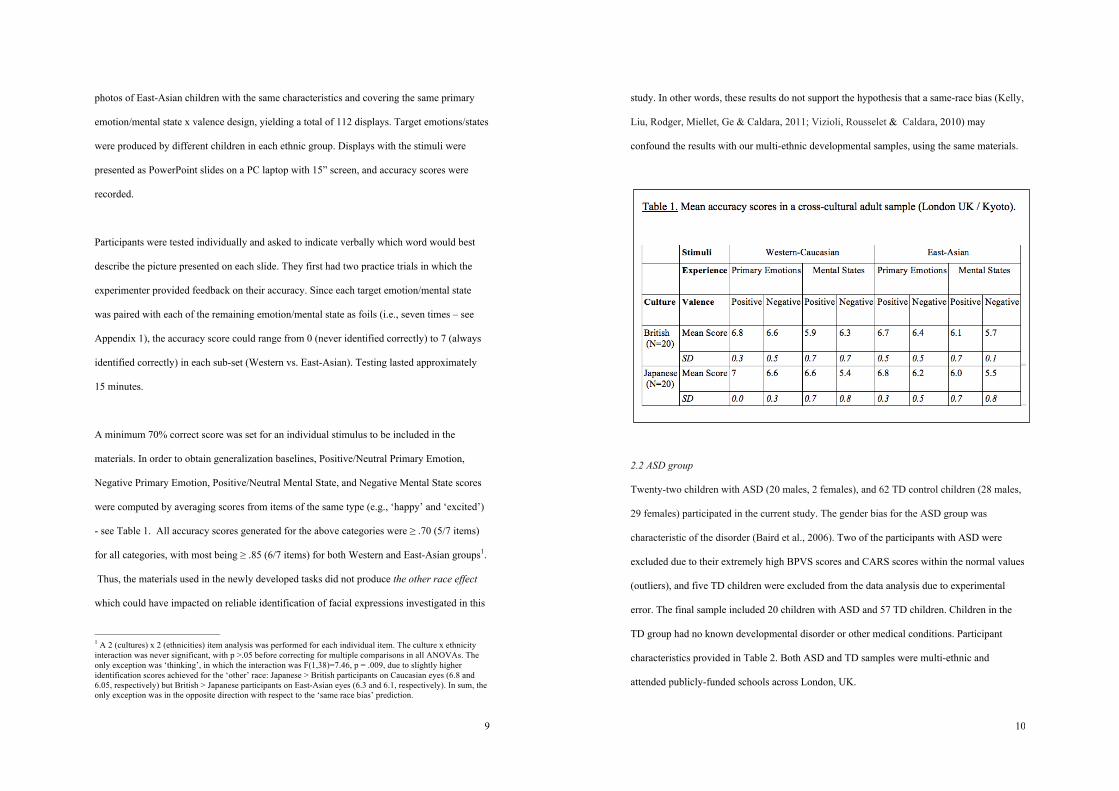
photos of East-Asian children with the same characteristics and covering the same primary
emotion/mental state x valence design, yielding a total of 112 displays. Target emotions/states
were produced by different children in each ethnic group. Displays with the stimuli were
presented as PowerPoint slides on a PC laptop with 15” screen, and accuracy scores were
recorded.
Participants were tested individually and asked to indicate verbally which word would best
describe the picture presented on each slide. They first had two practice trials in which the
experimenter provided feedback on their accuracy. Since each target emotion/mental state
was paired with each of the remaining emotion/mental state as foils (i.e., seven times – see
Appendix 1), the accuracy score could range from 0 (never identified correctly) to 7 (always
identified correctly) in each sub-set (Western vs. East-Asian). Testing lasted approximately
15 minutes.
A minimum 70% correct score was set for an individual stimulus to be included in the
materials. In order to obtain generalization baselines, Positive/Neutral Primary Emotion,
Negative Primary Emotion, Positive/Neutral Mental State, and Negative Mental State scores
were computed by averaging scores from items of the same type (e.g., ‘happy’ and ‘excited’)
- see Table 1. All accuracy scores generated for the above categories were ≥ .70 (5/7 items)
for all categories, with most being ≥ .85 (6/7 items) for both Western and East-Asian groups1.
Thus, the materials used in the newly developed tasks did not produce the other race effect
which could have impacted on reliable identification of facial expressions investigated in this
1 A 2 (cultures) x 2 (ethnicities) item analysis was performed for each individual item. The culture x ethnicity interaction was never significant, with p >.05 before correcting for multiple comparisons in all ANOVAs. The only exception was ‘thinking’, in which the interaction was F(1,38)=7.46, p = .009, due to slightly higher identification scores achieved for the ‘other’ race: Japanese > British participants on Caucasian eyes (6.8 and 6.05, respectively) but British > Japanese participants on East-Asian eyes (6.3 and 6.1, respectively). In sum, the only exception was in the opposite direction with respect to the ‘same race bias’ prediction.
10
study. In other words, these results do not support the hypothesis that a same-race bias (Kelly,
Liu, Rodger, Miellet, Ge & Caldara, 2011; Vizioli, Rousselet & Caldara, 2010) may
confound the results with our multi-ethnic developmental samples, using the same materials.
2.2 ASD group
Twenty-two children with ASD (20 males, 2 females), and 62 TD control children (28 males,
29 females) participated in the current study. The gender bias for the ASD group was
characteristic of the disorder (Baird et al., 2006). Two of the participants with ASD were
excluded due to their extremely high BPVS scores and CARS scores within the normal values
(outliers), and five TD children were excluded from the data analysis due to experimental
error. The final sample included 20 children with ASD and 57 TD children. Children in the
TD group had no known developmental disorder or other medical conditions. Participant
characteristics provided in Table 2. Both ASD and TD samples were multi-ethnic and
attended publicly-funded schools across London, UK.

11
The age range and large group size of the TD children permitted comparisons to be made
between disorder and TD trajectories, either on the basis of chronological age (CA) or on the
basis of verbal mental age (MA), where the ASD group may have lower mental ages.
Children in the ASD group met established criteria for ASD, such as those specified in the
DSM-IV (American Psychiatric Association, 2000) and ADOS (Autism Diagnostic
Observation Schedule) (Lord, Rutter, DiLavore, & Risi, 1999). Verbal mental age was
assessed with the British Picture Vocabulary Scale (BPVS II) (Dunn et al., 1996). Children in
the ASD group were also assessed on the Childhood Autism Rating Scale (CARS)(Schopler
et al., 1993) and ASQ (Autism Screener Questionnaire) (Berument, Rutter, Lord, Pickles &
Bailey, 1999), in order to provide additional screening. Table 2 provides group details,
confirming that children with ASD in this sample scored above the cut-off for ASD.
Children in the ASD group were recruited from specialist schools for children with ASD,
support groups for parents and after-school clubs for children with ASD. TD control children
were recruited from nurseries, schools and play schemes. All individuals in both groups had
normal or corrected-to-normal vision. None of the children had any co-morbid medical or
psychiatric disorders, noted from the children’s records or, if missing, from oral interview
with the parents. All the children had English as their first language.
The Psychology Ethics Committee at Middlesex University approved the experimental
protocol prior to the recruitment of participants. Both parental informed consent and the
child’s assent were obtained before participation.
12
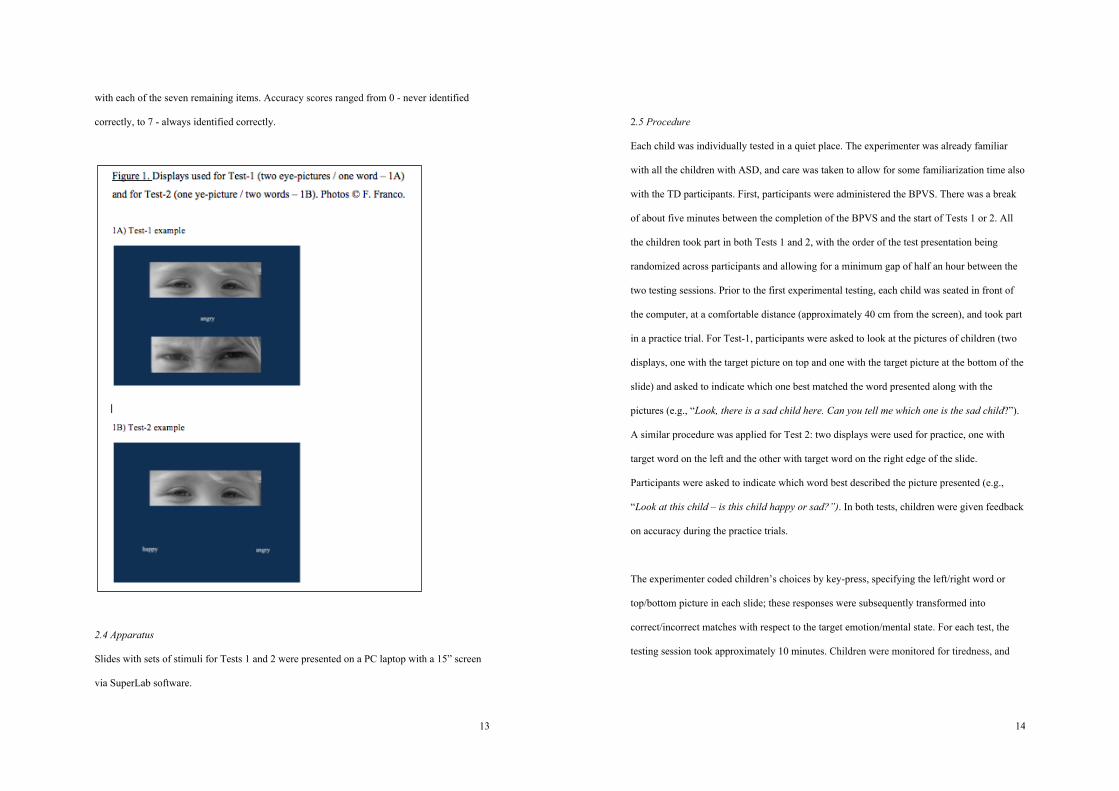
2.3 Design and Materials
Two tasks were used: Test-1 included two photos of the eye-region with one word between
them (one picture for the target emotion or mental state described by the word and one foil),
against a dark background (Figure 1A). In Test-2, one picture with two words underneath was
presented (one for the target emotion or mental state and one foil), also against a dark
background (Figure 1B), as used in the validation study. Primary emotions were contrasted to
mental states with either positive/neutral or negative valence.
For each test, 56 slides were prepared with each target emotion/mental state paired with each
of the remaining emotion/mental states (see 2.1 and Appendix 1). Both Test-1 and Test-2
displays were randomized across participants. Positioning of pictures/words within the
displays was fully counterbalanced, and every target primary emotion/mental state was paired
13
with each of the seven remaining items. Accuracy scores ranged from 0 - never identified
correctly, to 7 - always identified correctly.
2.4 Apparatus
Slides with sets of stimuli for Tests 1 and 2 were presented on a PC laptop with a 15” screen
via SuperLab software.
14
2.5 Procedure
Each child was individually tested in a quiet place. The experimenter was already familiar
with all the children with ASD, and care was taken to allow for some familiarization time also
with the TD participants. First, participants were administered the BPVS. There was a break
of about five minutes between the completion of the BPVS and the start of Tests 1 or 2. All
the children took part in both Tests 1 and 2, with the order of the test presentation being
randomized across participants and allowing for a minimum gap of half an hour between the
two testing sessions. Prior to the first experimental testing, each child was seated in front of
the computer, at a comfortable distance (approximately 40 cm from the screen), and took part
in a practice trial. For Test-1, participants were asked to look at the pictures of children (two
displays, one with the target picture on top and one with the target picture at the bottom of the
slide) and asked to indicate which one best matched the word presented along with the
pictures (e.g., “Look, there is a sad child here. Can you tell me which one is the sad child?”).
A similar procedure was applied for Test 2: two displays were used for practice, one with
target word on the left and the other with target word on the right edge of the slide.
Participants were asked to indicate which word best described the picture presented (e.g.,
“Look at this child – is this child happy or sad?”). In both tests, children were given feedback
on accuracy during the practice trials.
The experimenter coded children’s choices by key-press, specifying the left/right word or
top/bottom picture in each slide; these responses were subsequently transformed into
correct/incorrect matches with respect to the target emotion/mental state. For each test, the
testing session took approximately 10 minutes. Children were monitored for tiredness, and
15
were provided with stickers as rewards during the breaks. For some children, it was necessary
to have a short extra break due to a decrease in attention.
3. RESULTS
3.1 Background measures
There was no difference between the groups on the BPVS raw scores; F(2,2.47) = 29.6, p =
0.1442. Due to the exploratory nature of the test and flexible use of multiple comparisons to
the TD data-points, the developmental trajectories method was employed. A fully factorial
ANCOVA was used with MA (based on verbal BPVS scores) and CA as the covariates and
task transformation (two words / one picture or one word / two pictures) as within-participant
factors (see Thomas, Annaz, Ansari, Scerif, Jarrold, & Karmiloff-Smith, 2009, for more
details of the developmental trajectory method). Test performance was analysed for each
group separately, and then the ASD group was compared to the TD group, by adding a
between-participant factor of group to the design. In addition, we performed two planned
comparisons. These were: (i) to assess each group’s performance on individual
emotion/mental types (Test 1 and Test 2 respectively), (ii) to compare performance on Test-1
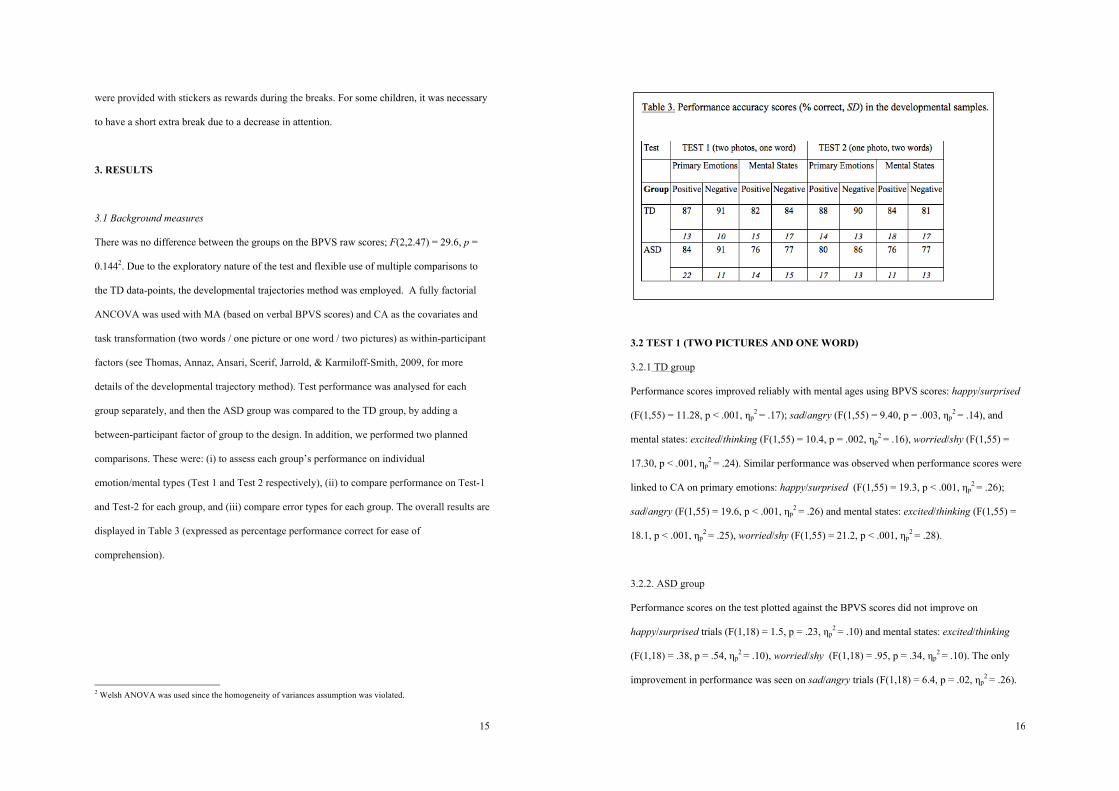
and Test-2 for each group, and (iii) compare error types for each group. The overall results are
displayed in Table 3 (expressed as percentage performance correct for ease of
comprehension).
2 Welsh ANOVA was used since the homogeneity of variances assumption was violated.
16
3.2 TEST 1 (TWO PICTURES AND ONE WORD)
3.2.1 TD group
Performance scores improved reliably with mental ages using BPVS scores: happy/surprised
(F(1,55) = 11.28, p < .001, ηp2 = .17); sad/angry (F(1,55) = 9.40, p = .003, ηp
2 = .14), and
mental states: excited/thinking (F(1,55) = 10.4, p = .002, ηp2 = .16), worried/shy (F(1,55) =
17.30, p < .001, ηp2 = .24). Similar performance was observed when performance scores were
linked to CA on primary emotions: happy/surprised (F(1,55) = 19.3, p < .001, ηp2 = .26);
sad/angry (F(1,55) = 19.6, p < .001, ηp2 = .26) and mental states: excited/thinking (F(1,55) =
18.1, p < .001, ηp2 = .25), worried/shy (F(1,55) = 21.2, p < .001, ηp
2 = .28).
3.2.2. ASD group
Performance scores on the test plotted against the BPVS scores did not improve on
happy/surprised trials (F(1,18) = 1.5, p = .23, ηp2 = .10) and mental states: excited/thinking
(F(1,18) = .38, p = .54, ηp2 = .10), worried/shy (F(1,18) = .95, p = .34, ηp
2 = .10). The only
improvement in performance was seen on sad/angry trials (F(1,18) = 6.4, p = .02, ηp2 = .26).
17
In contrast, performance scores improved reliably with CA on all primary emotions:
happy/surprised trials (F(1,18) = 6.9, p = .017, ηp2 = .30), sad/angry trials (F(1,18) = 16.7, p =
.001, ηp2 = .48), and mental states: excited/thinking (F(1,18) = 7.7, p = .012, ηp
2 = .30) and
worried/shy (F(1,18) = 6.3, p = .022, ηp2 = .26). Lastly, performance scores plotted against
the CARS and ASQ also did not serve as better predictors of performance than CA.
3.2.3 Comparison of ASD to TD group
Children in the ASD group showed a delayed onset and slower rate of improvement with CA
on: happy/surprised (group: F(1,77) = 6.2, p = .015, ηp2 = .10; group x age: F(1,77) = 9.2, p =
.003, ηp2 = .11) and worried/shy (group: F(1,77) = 4.8, p = .032, ηp
2 = .10; group x age:
F(1,77) = 6.2, p = .015, ηp2 = .10). However, this was not the case for sad/angry (group:
F(1,77) = 1.3, p = .26, ηp2 = .024, group x age: F(1,77) = 1.3, p = .257, ηp
2 = .10), and
excited/thinking (group: F(1,77) = 1.3, p = .26, ηp2 = .02; group x age: F(1,77) = 1.0, p = .317,
ηp2 = .10) where the ASD group showed a similar onset and rate of performance increase on
the tasks as the TD group.
3.3 TEST 2 (ONE PICTURE AND TWO WORDS)
3.3.1. TD group
In TD children, performance scores improved reliably with mental age (based on BPVS
scores) on all primary emotions: happy/surprised (F(1,55) = 25.8, p < .001, ηp2 = .32);
sad/angry (F(1,55) = 11.3, p < .004, ηp2 = .17), and mental states: excited/thinking (F(1,55) =
10.4, p = .002, ηp2 = .16), worried/shy (F(1,55) = 18.9, p < .001, ηp
2 = .26). Similar
performance was achieved when examining performance scores with CA: happy/surprised
(F(1,55) = 26.6, p < .001, ηp2 = .33); sad/angry (F(1,55) = 9.1, p < .004, ηp
2 = .14), and mental
18
states: excited/thinking (F(1,55) = 12.1, p < .001, ηp2 = .18), worried/shy (F(1,55) = 13.1, p <
.001, ηp2 = .19).
3.3.2. ASD group
Performance scores of the ASD group improved reliably with CA only on excited/thinking
trials (F(1,18) = 7.7, p = .013, ηp2 = .30). Also when accuracy scores were linked to MA
(based on BPVS scores), CARS and ASQ respectively to ascertain whether these would serve
to normalise the disorder trajectories, none of them turned out to be significant (all p > .1).
3.3.3. Comparison of TD vs. ASD performance
Children in the ASD group were less accurate compared to the TD group on the primary
emotions: happy/surprised (group: F(1,77) = 5.14, p = .034, ηp2 = .11); sad/angry (group:
F(1,77) = 4.01, p = .028, ηp2 = .13). Also, the ASD group had a much slower rate of
improvement on mental states: excited/thinking (effect of group x age: F(1,77) = 4.90, p =
.030, ηp2 = .06), worried/shy (effect of group x age: F(1,77) = 4.45, p = .038, ηp
2 = .057).
3.4. COMPARISON OF TEST-1 AND TEST-2
When we compared performance of each group on Tests 1 and 2, children in the TD group
did not show any differences in performance on the positive emotion recognition trials (all
p>.1). In contrast, children in the ASD group showed better performance on positive emotions
on the Test-1 (main effect of test: F(1,17) = 4.25, p = .05) increasing with CA (test x CA:
F(1,17) = 5.43, p = .03) but not with MA (p >.1). A similar outcome emerged for the primary
negative emotion trials with no difference in performance between the tests for the TD group
(all p>.1). Children in the ASD group achieved marginally better scores on Test-1 (main

19
effect of test: F(1,17)= 3.82, p= .067) which was modulated by CA (interaction of test x CA:
F(1,17)= 6.01, p= .025). For the positive mental states recognition, both groups showed no
difference in performance scores between the Tests 1 and 2 (all p>.1) On the negative mental
states recognition, only children with ASD achieved marginally better scores on Test-1 (main
effect of test: F(1,17)= 3.92, p= .065) which was modulated by CA (interaction of test x CA:
F(1,17)= 5.31, p= .034). Figure 2 summarises the findings.
20
Lastly, since there was an even split of gender in the TD group, each variable was also co-
varied with gender. There were no differences between TD boys and girls on the tests (p >.1).
3.5. ANALYSIS OF ERRORS
In order to gain an insight into the kind of errors committed by children, we conducted an
exploratory item analysis - see Table 4. Binomial tests were computed on each item within
Tests 1 and 2 separately, assessing the distribution of incorrect responses – all tests were
significant at p ≤ .0001, indicating that both groups performed well above chance level.
Remarkably, the negative primary emotion of anger was associated with the lowest
proportion of errors in both groups of children and in both tests. As we have seen from the
quantitative analyses presented in the previous section, mental states were associated with
higher proportions of errors. In Test-1, both groups had the highest error rate on ‘shy’
(negative/mental state), while in Test-2 the highest error rate was seen on ‘worry’ in the ADS
group and ‘excited’ in the TD group.

21
Finally, when considering the nature of confusions (see Appendix 2), the younger TD
children appeared to mistake ‘surprised’ and ‘shy’ for a variety of other displays, while ‘sad’
was only confused with ‘worried’ (and vice versa), ‘excited’ mostly with positive primary
emotions, and ‘think’ equally between ‘sad’, ‘worried’ and ‘shy’, with the distribution of
errors presenting less dispersion across categories in Test-2 than in Test-1. The TD children at
the end tail of the developmental trajectory presented a much more specific confusion matrix,
with less difference between Tests 1 and 2. For example, ‘excited’ was mistaken for ‘happy’
and vice versa, ‘sad’ with ‘worried’ and vice versa, and ‘shy’ with ‘worried’. They thus
tended to make mistakes mostly within affect valence. In contrast, children with ASD made
mistakes across both types of state and valence; for example, ‘surprised’ was confused with
‘worried’ and ‘sad’, ‘thinking’ with ‘worried’ and ‘shy’, and ‘shy’ mostly with ‘angry’ and
‘thinking’ (see also Brennand, Schepman & Rodway, 2011).
4. DISCUSSION
Understanding emotions is one of the most important abilities for social interaction and
human survival. Mixed findings regarding this ability in autism have resulted in a heated
debate. In the current study, we examined the performance of children with ASD and TD
control children on newly-developed emotion recognition tasks targeting the eye-region and
using real children’s naturally occurring emotions on faces and materials tested cross-
culturally. Overall, our results show above-chance correct emotion/mental state match to the
eye-pictures in both groups of children. Thus, the simplification of the Eyes Test was
successful in facilitating performance in children with ASD from a younger age range than
hitherto found in the majority of the studies in this field. As most emotion research has so far
been carried out with high-functioning individuals with ASD and little with children from a
wide range of ASD features, and as performance on our new tasks was similar across the
22
individuals with ASD, the results demonstrate that the simplified tasks created for the present
study are suitable for individuals with lower-functioning autism, a rather neglected group of
individuals on the spectrum. Although no gender effects were found in the present study,
future developments of our methodology would benefit from using gender-matched samples.
Chronological age proved to be, in general, the most sensitive predictor of developmental
trends, with CARS and ASQ scores failing to modulate any performance outcomes in the
ASD group in any of the tasks. Thus, length of experience in a social milieu appears to be
specifically associated with improved performance, consistent with what has been found in
earlier studies (e.g., Annaz et al., 2009).
Based on previous research and current test modifications, we predicted that primary
emotions will be easier to distinguish than mental states, and that children with more
advanced languages skills (based on BPVS scores) would show better performance on the
tests, particularly on Test-2 (one eye-picture, two words). As predicted, children in the ASD
group showed better performance on Test-1, which was less cognitively demanding because it
accessed mainly the visual domain and required less semantic processing. However, it should
be noted that the ASD group was delayed but not impaired in their performance on Test-2,
which is likely to be due to their difficulty in accessing emotionally-loaded linguistic
information (e.g., Tager-Flusberg & Joseph, 2005).
Thus, the type of test significantly differentiated between the two groups (TD/ASD), with
Test-1 (two pictures/one word) being associated with developmental progression in both
groups when considering CA, but Test-2 failing to reveal developmental progression in the
ASD group. Indeed, performance was similar across the two tests for the TD children but was
23
significantly better in Test-1 than in Test-2 for the ASD group. However, when comparing
directly TD and ASD groups in Test-1, children with ASD presented delayed onset and
slower rate of improvement than TD children on a subset of states (positive/neutral primary
emotions: happy/surprised, and negative mental states: (worried/shy).
The two tests were designed to tap into different cognitive demands, presenting the
emotion/state forced choice either visually (as in ‘face in the crowd’ experiments, e.g.,
LoBue, 2009) or verbally (as in the classic Eyes Tests, e.g., Baron-Cohen et al., 1997) thereby
allowing us to examine language vs. face processing deficits across the two tests. Given the
worse performance of children with ASD on Test-2 (one eye-picture, two words), the results
support the view that language deficits in the ASD group may well be responsible for lower
performance or delayed onset and slower improvement with respect to TD children in the eye-
test type of tasks (e.g., Tager-Flusberg & Joseph, 2005).
However, it is also possible that the kind of visual processing elicited in the two tests was
qualitatively different. In Test-1 (visual forced choice), children were asked to match a target
emotion/state word to one of two eye-pictures. In other words, once the word was understood,
the child had to recognise the eye-picture corresponding to the semantic content verbally
accessed (rapid recognition of a pattern of features). However, in Test-2 (verbal forced
choice), not only did children have to process two verbal labels rather than one, but they also
needed to inspect the eye-picture in order to select the word corresponding to the
emotion/state visually depicted. In other words, they needed to understand the eye-picture in
order to decide whether it represented state A or B. It appears therefore that Test-2 may
require visual concentration on a region of the face that is known to be the least
spontaneously looked at by individuals with ASD (reduced looking time at people and faces:
24
Annaz, et al., 2009; Klin et al., 2003; Riby & Hancock, 2008), and presented in a version
(direct gaze) for which several recent studies have highlighted atypical neural responses
already in infancy in the ASD phenotype (Elsabbagh et al., 2009, 2012; Senju & Johnson,
2009).
Finally, it is worth noting that the highest accuracy score in both ASD and TD groups was for
the primary emotion of anger. It might simply be that anger is expressed more strongly or
more unambiguously in the eye region than some of the other emotions tested in the present
study. However, a predisposition to detect anger has been previously reported in Asperger
Syndrome (Ashwin, Wheelwright, & Baron- Cohen, 2006) and in adults with ASD (Krysko &
Rutherford, 2009). Results with adolescents with ASD yield inconsistent outcomes: Rosset et
al. (2001) found an anger superiority effect in a ‘face in the crowd’ experiment but Farran,
Branson & King (2011) failed to replicate such findings. The inconsistency was possibly due
to the different types of materials used: drawings in Rosset et al. (2001) and real faces in
Farran et al. (2011). Our results show that by using simplified tasks with real photos
displaying natural rather than posed emotions, even younger children including individuals
with lower functioning autism show biased sensitivity to the detection of threat-related cues.
Even more importantly, such cues are recognized in our tasks from the eye-region only and in
real (not schematic) peer faces. This bias may be explained by the high evolutionary value of
recognizing anger in others which could be directed to the perceiver. This original bias may
be strengthened or attenuated by other factors, such as experience or phenotype. When
considering a particular type of experience, for example, Camras, Ribordy, Hill, and Martino
(1990) and Pollak, Cicchetti, Hornung and Reed (2000) showed that maltreated children
tended to perform better than controls in the recognition of anger in masked expressions of
emotion, whereas adults with social anxiety disorder performed significantly less well than
25
controls in the recognition of facial expressions of anger (Montagne , Schutters, Westenberg,
Van Honk, Kessels & De Haan, 2006). Difference in RTs between women (faster) and men
was found to be largest for facial expressions of anger in a study by Hampson, van Anders
and Mullin (2006). More importantly, Ackerman et al. (2006) found that, particularly in
conditions in which cognitive resources are limited, the typical in-group homogeneity effect
for face recognition was reversed for angry faces: effective self-protection induces sensitivity
to facial signals that may be particularly relevant for the perceiver’s functional outcomes (Fox
et al., 2000; Maner et al., 2003; Ohman, Flykt & Esteves, 2001; see Schupp et al., 2004 for
ERP evidence). Facilitation in detecting anger over other emotions has been shown also in 5-
year-old TD children (LoBue, 2009) but not in children with Williams Syndrome (Santos,
Silva, Rosset & Deruelle, 2010), consistently with their profile that includes decreased
sensitivity to social threat. Thus, the results from our study contribute to qualify the ASD
profile at younger ages and including lower levels of functioning as displaying an
intact/typical ability to process threat-related cues even when they are detected in conditions
which are not favourable considering known impairments associated with ASD (see above:
face/ eye-region and direct gaze). It is thus possible to speculate that, due to their evolutionary
survival importance, threat-related cues are accessible to individuals with ASD in spite of
documented hypoactivation of the amygdala and its direct modulatory role on the fusiform
face area (FFA) (Schultz, 2005).
Research examining the understanding of emotional recognition in children with low
functioning autism is scant despite the fact that they form over of 70% of those on the autism
spectrum (Baird, Simonoff, Pickles, Chandler, Loucas, Meldrum, & Charman, 2006; see also
Kent, Carrington, Le Couteur, Gould, Wing, Maljaars, Noens, van Berckelaer-Onnes &
Leekam, 2013). The novel tasks developed to test children from a wide range of abilities may
26
contribute to gaining further understanding of all children on the spectrum, rather than merely
the high-functioning ones. Our approach may also help to develop and optimise support
materials and training strategies for educational settings in which children with social
difficulties are identified.

27
5. REFERENCES Abrahams, B.S., & Geschwind, D.H. (2008). Advances in autism genetics: on the threshold of
a new neurobiology. Nature Reviews Genetics, 9 (5), 341-355.
Ackerman, J.M., Shapiro, J.R., Neuberg, S.L., Kenrick, D.T., Becker, V.D., Griskevicius, V.,
Maner, J.K., & Schaller, M. (2006). They All Look the Same to Me (Unless They're Angry):
From Out-Group Homogeneity to Out-Group Heterogeneity. Psychological Science, 17, 836-
840.
Annaz, D, Remington, A., Milne, E., Campbell, R., Coleman, M., Thomas, M.S.C, &
Swettenham, J. (2010). Atypical development of motion processing trajectories in autism.
Developmental Science, 13 (6), 826–838.
Annaz, D, Milne, E., Campbell, R., Coleman, M., & Swettenham, J. (2012). Young children
with autism spectrum disorder do not preferentially orient to biological motion. Journal of
Autism and Developmental Disorders, 42 (3), 401 – 408.
Annaz, D., Karmiloff-Smith, A., Johnson, M. H., & Thomas, M. S. C. (2009). Development
of holistic face recognition in children with Autism, Down syndrome and Williams syndrome.
Journal of Child Experimental Psychology, 102, 456-486
American Psychiatric Association. (1994). Diagnostic and statistical manual of mental
disorders (4th ed.). Washington, DC: Author.
Ashwin, C., Wheelwright, S., Baron-Cohen, S. (2006). Finding a face in the crowd: Testing
the anger superiority effect in Asperger Syndrome. Brain and Cognition, 61, 78–95.
Back, E., Ropar, D., Mitchell, P. (2007). Do the eyes have it? Inferring mental states from
animated faces in autism. Child Development, 78 (2), 397- 411.
Baird, G., Simonoff, E., Pickles, A., Chandler, S., Loucas, T., Meldrum, D., & Charman, T.
(2006). Prevalence of disorders of the autism spectrum in a population cohort of children in
South Thames: the Special Needs and Autism Project (SNAP). The Lancet, 368 (9531), 210-
28
215.
Baron-Cohen, S. (1995). Mindblindness: An essay on autism and theory of mind. Boston:
MIT Press/Bradford Books.
Baron-Cohen, S., Jolliffe, T., Mortimore, C.& Robertson, M. (1997) Another advanced test of
theory of mind: evidence from very high functioning adults with autism or Asperger
syndrome. Journal of Child Psychology and Psychiatry. 38, 813–22.
Baron-Cohen, S., Golan, O., & Ashwin, E. (2009). Can emotion recognition be taught to
children with autism spectrum conditions? Philosophical Transactions of the Royal Society,
364, 3567-3574.
Baron-Cohen, S., S. Wheelwright, J. J. Hill, Y. Raste & I. Plumb (2001). The “Reading the
Mind in the Eyes” Test-Revised version: A study with normal adults, and adults with
Asperger syndrome or high-functioning autism. Journal of Child Psychology and Psychiatry,
42, 241-251.
Baron-Cohen, S., Wheelwright, S.C, Scahill, V., Spong, A., & Lawson, J. (2001). Are
intuitive physics and intuitive psychology independent? A test with children with Asperger
syndrome. Journal of Developmental and Learning Disorders, 5, 47-78.
Berument, S.K., Rutter, M., Lord, C., Pickles, A., & Bailey, A. (1999). Autism Screening
Questionnaire: Diagnostic validity. The British Journal of Psychiatry, 175, 444-451.
Brennand, R., Schepman, A., and & Rodway, P. (2011). Vocal emotion perception in pseudo-
sentences by secondary-school children with Autism Spectrum Disorder. Research in Autism
Spectrum Disorders, 5, 1567-1573.
Burley, J., Dunn, L., Dunn, L. & Whetton, C. (1997). British Picture Vocabulary Scale II. (2nd
ed.). Windsor, Berks, UK: NEFR-Nelson Publishing Company.
Camras, L., Ribordy, S., Hill, J., & Martino, S. (1990). Maternal facial behavior and the
recognition and production of emotional expression by maltreated and nonmaltreated

29
children. Developmental Psychology, 26, 304-312.
Caronna, E.B., Milunsky, J.M., & Tager-Flusberg, H. (2008). Autism spectrum disorders:
clinical and research frontiers. Archives of Diseases in Childhood, 93, 518-523.
Castelli, F., Frith, C., Happé, F., & Frith, V. (2002). Autism, Asperger syndrome and brain
mechanisms for the attribution of mental states to animated shapes. Brain, 125, 1839-1849.
Chawarska, K., Klin, A., & Volkmar, F. (2008). Autism in Infants and Toddlers: Diagnosis,
Assessment and Treatment. Guilford Press, New York, NY.
Dalton, K.M, Nacewicz, B.M, Johnstone, T, Schaefer, H.S, Gernsbacher, M.A, Goldsmith,
H.H, Alexander, A.L & Davidson, R.J. (2005). Gaze fixation and the neural circuitry of face
processing in autism. Nature Neuroscience, 8, 519–526.
Dunn, L.M., Dunn, L.M., Whetton, C., & Burley, J. (1997). British Picture Vocabulary Scale,
Second Edition (BPVS-II). Windsor, Berks, UK: NEFR-Nelson Publishing Company.
Elsabbagh, M., & Johnson, M.H. (2007). Infancy and autism: Progress, prospects, and
challenges. Progress in Brain Research, 164, 355–383.
!
Elsabbagh, M., Volein, A., Csibra, G., Holmboe, K., Garwood, H., Tucker, L., Krljes, S.,
Baron-Cohen, S., Patrick Bolton, P., Charman, C., Baird, G., and Johnson M.H. (2009).
Neural correlates of eye processing in the infant broader autism phenotype. Biological
Psychiatry, 65, 31–38.
Elsabbagh, M., Mercure, E. Hudry, K., Chandler, S., Pasco, G., Charman, T., Pickles, A.,
Baron-Cohen, S., Bolton, P., H. Johnson, M.H. and the BASIS Team (2012). Infant neural
sensitivity to dynamic eye gaze is associated with later emerging autism. Current Biology, 22,
338–342.
Farran, E.K., Branson, A., and & King, B. J. (2011). Visual search for basic emotional
expressions in autism; impaired processing of anger, fear and sadness, but a typical happy
30
face advantage. Research in Autism Spectrum Disorders, 5, 455–462.
Fox, E., Lester, V., Russo, R., Bowles, R.J., Pichler, A., & Dutton, K. (2000). Facial
Expressions of Emotion: Are Angry Faces Detected More Efficiently? Cognition & Emotion,
14, 61-92.
Hadjikhani, N., Jospeh, R.M., Snyder, J., Chabris, C.F., Clark, J., Steele, S., et al. (2004).
Activation of the fusiform gyrus when individuals with autism spectrum disorders view faces.
Neuroimage, 22, 1141-1150.
Hamilton, C. (2009). Research review: goals, intentions and mental states: challenges for
theories of autism. Journal of Child Psychology and Psychiatry, 50 (8), 881-892.
Hampson, E., van Anders, S. M., & Mullin, L. I. (2006). A female advantage in the
recognition of emotional facial expressions: Test of an evolutionary hypothesis. Evolution
and Human Behavior, 27, 401-416.
Happé, F. (1995). The role of age and verbal ability in the theory of mind task performance of
subjects with autism. Child Development, 66, 843-855.
Happé, F., Malhi, G.S. & Checkley, S. (2001) Acquired mind-blindness following frontal
lobe surgery? A single case study of impaired ‘theory of mind’ in a patient treated with
stereotactic anterior capsulotomy. Neuropsychologia, 39 (1), 83 – 90.
Happé, F., Ronald, A., & Plomin, R. (2006). Time to give up on a single explanation for
autism. Nature Neuroscience, 9 (10), 1218-1220.
Kelly, D. J., Liu, S., Rodger, H., Miellet, S., Ge, L., & Caldara, R. (2011). Developing
Cultural Differences in Face Processing. Developmental Science, 14 (5), 1176-1184
Klin, A., Jones, W., Schultz, R.T., Volkmar, F., & Cohen, D.J. (2002). Visual fixation
patterns during viewing of naturalistic social situations as predictors of social competence in
individuals with autism. Archives of General Psychiatry. 59, 809-816.
31
Klin, A., Jones, W., Schultz, R.T. & Volkmar, F.R. (2003). The Enactive Mind - from actions
to cognition: Lessons from autism. Philosophical Transactions of the Royal Society,
Biological Sciences, 358, 345-60.
Krysko, K.M., & Rutherford, M.D. (2009). The face in the crowd effect: Threat-detection
advantage with perceptually intermediate distractors. Visual Cognition, 17 (8), 1205-1217.
Johnston, L., McKinlay, A., & Miles, L. (2008) A critical review of the Eyes Test as a
measure of social-cognitive impairments. Australian Journal of Psychology, 60 (3), 135-141.
Kent, R. G., Carrington, S. J., Le Couteur, A., Gould, J., Wing, L., Maljaars, J., Noens, I., van
Berckelaer-Onnes, I., & Leekam, S.R. (2013). Diagnosing Autism Spectrum Disorder: who
will get a DSM-5 diagnosis? Journal of Child Psychology and Psychiatry (in press).
LoBue, V. (2009). More than just another face in the crowd: superior detection of threatening
facial expressions in children and adults. Developmental Science, 12, 305–313.
Lombardo, M., Chakrabarti, B., & Baron-Cohen, S. (2009). The amygdala in autism: not
adapting to faces? American Journal of Psychiatry, 166 (4), 395-397.
Montagne, B., Schutters, S., Westenberg, H.G.M., van Honk, J., Kessels, R.P.C., and de
Haan, E.H.F. (2006). Reduced sensitivity in the recognition of anger and disgust in social
anxiety disorder. Cognitive Neuropsychiatry, 11 (4), 389-401.
Nikaido, K. (2008). Understanding the mentalistic significance of the eyes as a cue in reading
emotional/mental states in others: Cross-cultural comparisons. BSc Psychology dissertation,
London: Middlesex University.
Pellicano, E., Jeffery, L., Burr, D., & Rhodes, G. (2007). Abnormal adaptive face-coding
mechanisms in children with autism spectrum disorder. Current Biology, 17, 1508-1512.
Öhman, A., Flykt, A., & Esteves, F. (2001). Emotion drives attention: Detecting the snake in
the grass. Journal of Experimental Psychology: General, 130, 466-478.
32
Peterson, C.C., & Slaughter, V. (2009). Theory of mind (ToM) in children with autism or
typical development: Links between eye-reading and false belief understanding. Research in
Autism Spectrum Disorders, 3, 462-473.
Pollak, S.D., Cicchetti, D., Hornung, K., & Reed, A. (2000). Recognizing Emotion in Faces:
Developmental Effects of Child Abuse and Neglect. Developmental Psychology, 36 (5), 679-
688.
Ramachandran, R., Mitchell, P., & Ropar, D. (2010). Recognizing faces based on inferred
traits in autism spectrum disorders. Autism, 14 (6), 605-618.
Riby, D. M. & Hancock, P. J. B. (2008). Viewing it differently: Social scene perception in
Williams syndrome and Autism. Neuropsychologia, 46 (11), 2855-2860.
Rosset, D., Santos, A., Da Fonseca, D., Rondan, C., Poinso, F. & Deruelle, C. (2011). More
than just another face in the crowd: Evidence for an angry superiority effect in children with
and without autism. Research in Autism Spectrum Disorders, 5, 949–956.
Santos, A., Silva, C., Rosset, D., Deruelle, C. (2010). Just another face in the crowd: Evidence
for decreased detection of angry faces in children with Williams syndrome.
Neuropsychologia, 48 (4), 1071-8.
Senju, A., and Johnson, M.H. (2009). The eye contact effect: mechanisms and development.
Trends in Cognitive Sciences, 13 (3) 127-134.
Schupp, H.T., Ohman, A., Junghofer, M., Weike, A.I., Stockburger, J., & Hamm, A.O.
(2004). The Facilitated Processing of Threatening Faces: An ERP Analysis. Emotion, 4, 189-
200.
Tager-Flusberg, H.,& Joseph, R.M. (2005). How Language Facilitates the Acquisition of
False-Belief Understanding in Children with Autism. In J. Wilde Astington and J.A. Baird
(Eds.), Why language matters for theory of mind (pp. 298-318). New York, NY, US: Oxford
University Press.

33
Thomas, M., Annaz, D., Ansari, D., Scerif, G., Jarrold, C. & Karmiloff-Smith, A. (2009).
Using developmental trajectories to understand developmental disorders. Journal of Speech,
Language, and Hearing Research, 52, 336–358.
Wolf, J.M., Tanaka, J.W., Klaiman, C., Cockburn, J., Herlihy, L., Brown, C., et al. (2008).
Specific impairment of face-processing abilities in children with autism spectrum disorder
using the Let’s Face It! skills battery. Autism Research, 1 (6), 329-340.
Appendix 1.
Description of experiment materials: 56 slides, each containing one target and one foil emotion/state.
56 SLIDES FOILS
1 2 3 4 5 6 7
TAR
GET
1. Happy surprised sad angry excited thinking worried shy
2. Surprised happy sad angry excited thinking worried shy
3. Sad happy surprised angry excited thinking worried shy
4. Angry happy surprised sad excited thinking worried shy
5. Excited happy surprised sad angry thinking worried shy
6. Thinking happy surprised sad angry excited worried shy
7. Worried happy surprised sad angry excited thinking shy
8. Shy happy surprised sad angry excited thinking worried

App
endi
x 2.
TE
ST 1
- C
onfu
sion
mat
rix T
D vs.
ASD
gro
up (%
of t
otal
err
ors)
!
TA
RG
ET E
MO
TIO
N
TAR
GET
MEN
TAL
STA
TE
RESPONSE
H
APP
Y
SUR
PRIS
E SA
D
AN
GR
Y
THIN
K
EXC
ITED
W
OR
RR
IED
SH
Y
TD
A
SD
TD
ASD
TD
A
SD
TD
ASD
TD
A
SD
TD
ASD
TD
A
SD
TD
ASD
H
AP
--
-- 20
.6
17.6
7.
04
9.5
11.1
0
15.1
12
36
.5
44
4.6
0 16
.9
12.5
SU
RP
10.8
12
.5
--
-- 7.
04
14.3
11
.1
33.3
13
.9
12
16.3
16
7.
7 26
.7
9.3
6.25
SA
D
13.5
0
13.0
4 11
.8
--
-- 16
.7
0 19
.8
16
10.6
4
35.4
20
15
.2
18.7
5 A
NG
5.
4 0
1.1
0 9.
9 4.
8 --
--
4.6
0 2.
9 8
9.2
20
9.3
9.4
THIN
18
.9
37.5
18
.5
17.6
9.
9 19
.04
5.55
66
.6
--
-- 10
.6
20
13.8
6.
7 16
.1
25
EXC
29
.7
50.0
16
.3
29.4
5.
63
14.3
11
.1
0 16
.3
8 --
--
7.7
13.3
11
.02
9.4
WO
R
10.8
0
18.5
23
.5
40.8
28
.6
16.7
0
16.3
28
11
.5
4 --
--
22.0
3 18
.75
SHY
10
.8
0 11
.96
0 15
.5
9.5
27.8
0
13.9
24
11
.5
4 21
.5
13.3
--
--
TEST
2 -
Con
fusi
on m
atrix
TD
vs.
ASD
gro
up (%
of t
otal
err
ors)
TAR
GET
EM
OTI
ON
TA
RG
ET M
ENTA
L ST
ATE
RESPONSE
H
APP
Y
SUR
PRIS
E SA
D
AN
GR
Y
THIN
K
EXC
ITED
W
OR
RR
IED
SH
Y
TD
A
SD
TD
ASD
TD
A
SD
TD
ASD
TD
A
SD
TD
ASD
TD
A
SD
TD
ASD
H
AP
--
-- 4.
2 0
4.5
0 8.
7 25
8.
43
4.8
30.5
34
.8
7.3
6.9
10.2
0
SUR
P 10
.3
13.3
--
--
12.5
15
8.
7 0
14.4
4.
8 18
.1
21.7
12
.2
6.9
14.3
12
SA
D
4.4
6.7
10.6
21
.05
--
-- 4.
3 12
.5
10.8
9.
5 4.
8 8.
7 23
.2
27.6
10
.2
8 A
NG
7.
3 6.
7 4.
2 0
11.4
5
--
-- 12
.04
9.5
6.7
8.7
9.8
6.9
9.2
36
THIN
14
.7
0 22
.3
15.8
18
.2
20
4.3
12.5
--
--
17.1
4.
3 15
.8
20.7
12
.2
24
EXC
33
.8
46.7
9.
6 15
.8
4.5
5 2.
17
37.5
14
.45
9.5
--
-- 0
6.9
31.6
12
W
OR
13
.2
13.3
27
.6
26.3
27
.3
25
26.1
25
16
.86
9.5
11.4
13
.04
--
-- 12
.2
8 SH
Y
16.2
13
.3
21.3
21
.05
21.6
30
26
.1
0 22
.89
52.4
11
.4
8.7
24.4
24
.1
--
--