Patterns of peripheral retinal and central macula ischemia in diabetic retinopathy as evaluated by...
11
Patterns of Peripheral Retinal and Central Macula Ischemia in Diabetic Retinopathy as Evaluated by Ultra-widefield Fluorescein Angiography DAWN A. SIM, PEARSE A. KEANE, RANJAN RAJENDRAM, MICHAEL KARAMPELAS, SENTHIL SELVAM, MICHAEL B. POWNER, MARCUS FRUTTIGER, ADNAN TUFAIL, AND CATHERINE A. EGAN PURPOSE: To investigate the association between peripheral and central ischemia in diabetic retinopathy. DESIGN: Retrospective, cross-sectional. METHODS: Consecutive ultra-widefield fluorescein angio- graphy images were collected from patients with diabetes over a 12-month period. Parameters quantified include the foveal avascular zone (FAZ) area, peripheral ischemic index, peripheral leakage index, and central retinal thickness mea- surements, as well as visual acuity. The peripheral ischemia or leakage index was calculated as the area of capillary nonperfusion or leakage, expressed as a percentage of the total retinal area. RESULTS: Forty-seven eyes of 47 patients were included. A moderate correlation was observed between the peripheral ischemia index and FAZ area (r [ 0.49, P [ .0001). A moderate correlation was also observed between the peripheral leakage index and FAZ area, but only in eyes that were laser naı ¨ve (r [ 0.44, P [ .02). A thinner retina was observed in eyes with macular ischemia (217 ± 81.8 mm vs 272 ± 36.0 mm) (P [ .02), but not peripheral ischemia (258 ± 76.3 mm vs 276 ± 68.0 mm) (P [ .24). The relationships between different patterns of peripheral and central macular pathology and visual acuity were evaluated in a step-wise multivariable regression model, and the variables that remained inde- pendently associated were age (r [ 0.33, P [ .03), FAZ area (r [ 0.45, P [ .02), and central retinal thickness (r [ 0.38, P [ .01), (R 2 -adjusted [ 0.36). CONCLUSIONS: Ultra-widefield fluorescein angiography provides an insight into the relationships between dia- betic vascular complications in the retinal periphery and central macula. Although we observed relationships between ischemia and vascular leakage in the macula and periphery, it was only macular ischemia and retinal thinning that was independently associated with a reduced visual function. (Am J Ophthalmol 2014;158: 144–153. Ó 2014 by Elsevier Inc. All rights reserved.) D IABETIC RETINOPATHY ENCOMPASSES A GROUP of predominantly vascular anomalies. If left untreated, diabetic retinopathy ultimately results in visual loss, with up to 28 million individuals worldwide affected by vision-threatening diabetic retinopathy. 1 Broadly, the spectrum of disease has been classified accord- ing to the behavior of the retinal vasculature: (1) hyperper- meability (leakage and edema), which results in the development of lesions such as macular edema, peripheral hard exudates, and microaneurysms; and (2) hypoperfusion (ischemia), which results in enlargement of the foveal avas- cular zone (FAZ) in the macula and capillary nonperfusion and retinal neovascularization in the retinal periphery. It is not known what causes the differential regional distri- bution of these vascular lesions (ie, peripheral vs central retina), why they occur in some patients but not others, and how they might affect visual function. Epidemiologic studies have suggested that age may be a key component to the different patterns of diabetic retinopathy observed— that is, the predominance of macular edema in older patients with type 2 and proliferative retinopathy in younger patients with type 1 diabetes. 2,3 Several possible mechanisms have been suggested, including the loss of autoregulation in retinal arterioles, as well as microvascular degeneration in older persons causing capillary leakage with consequent macular edema. In the younger age group, it has been proposed that an intact posterior hyaloid serves as a scaffold for the formation of aberrant neovascularization. 4,5 However, the pathobiology of the different patterns of diabetic retinopathy phenotypes remains unclear. It is unlikely that age alone is solely responsible. The advent of ultra-widefield fluorescein angiography (FA) has for the first time provided the opportunity to visualize both the central and peripheral retina in a single examination. Although widefield imaging of the retina has been in development over the past 80 years, older systems encountered obstacles that precluded its wide application in patients with diabetic retinopathy, such as the require- ment of a contact lens and clear ocular media for the acqui- sition of good peripheral images. 6,7 In recent times, the Optos camera (Optos PLC, Dunfermline, Scotland, UK) has incorporated both a scanning laser ophthalmoscope (which permits imaging through moderate media opacities) and an optical system with an ellipsoid mirror, which allows Accepted for publication Mar 20, 2014. From the National Institute for Health Research, Moorfields Biomedical Research Centre, Moorfields Eye Hospital, London, United Kingdom (D.A.S., P.A.K., R.R., M.K., A.T., C.A.E.); and University College London, Institute of Ophthalmology, London, United Kingdom (D.A.S., P.A.K., R.R., S.S., M.B.P., M.F., A.T.). Inquiries to Dawn A. Sim, Moorfields Eye Hospital, 162 City Road, London EC1V 2PD, United Kingdom; e-mail: [email protected] 144 0002-9394/$36.00 http://dx.doi.org/10.1016/j.ajo.2014.03.009 Ó 2014 BY ELSEVIER INC.ALL RIGHTS RESERVED.
Transcript of Patterns of peripheral retinal and central macula ischemia in diabetic retinopathy as evaluated by...
Patterns of Peripheral Retinal and Central Macula Ischemiain Diabetic Retinopathy as Evaluated by Ultra-widefield
Fluorescein Angiography
DAWN A. SIM, PEARSE A. KEANE, RANJAN RAJENDRAM, MICHAEL KARAMPELAS, SENTHIL SELVAM,MICHAEL B. POWNER, MARCUS FRUTTIGER, ADNAN TUFAIL, AND CATHERINE A. EGAN
� PURPOSE: To investigate the association betweenperipheral and central ischemia in diabetic retinopathy.� DESIGN: Retrospective, cross-sectional.� METHODS: Consecutiveultra-widefieldfluorescein angio-graphy images were collected from patients with diabetesover a 12-month period. Parameters quantified include thefoveal avascular zone (FAZ) area, peripheral ischemic index,peripheral leakage index, and central retinal thickness mea-surements, as well as visual acuity. The peripheral ischemiaor leakage index was calculated as the area of capillarynonperfusion or leakage, expressed as a percentage of thetotal retinal area.� RESULTS: Forty-seven eyes of 47 patients wereincluded. A moderate correlation was observed betweenthe peripheral ischemia index and FAZ area (r [ 0.49,P [ .0001). A moderate correlation was also observedbetween the peripheral leakage index and FAZ area, butonly in eyes that were laser naı̈ve (r [ 0.44, P [ .02).A thinner retina was observed in eyes with macularischemia (217 ± 81.8 mm vs 272 ± 36.0 mm) (P [ .02),but not peripheral ischemia (258 ± 76.3 mm vs 276 ±68.0mm) (P[ .24). The relationships between differentpatterns of peripheral and central macular pathology andvisual acuity were evaluated in a step-wise multivariableregression model, and the variables that remained inde-pendently associated were age (r[ 0.33, P [ .03), FAZarea (r [ 0.45, P [ .02), and central retinal thickness(r[ 0.38, P[ .01), (R2-adjusted [ 0.36).� CONCLUSIONS: Ultra-widefield fluorescein angiographyprovides an insight into the relationships between dia-betic vascular complications in the retinal periphery andcentral macula. Although we observed relationshipsbetween ischemia and vascular leakage in the maculaand periphery, it was only macular ischemia and retinalthinning that was independently associated with a reducedvisual function. (Am J Ophthalmol 2014;158:144–153. � 2014 by Elsevier Inc. All rights reserved.)
Accepted for publication Mar 20, 2014.From the National Institute for Health Research, Moorfields
Biomedical Research Centre, Moorfields Eye Hospital, London, UnitedKingdom (D.A.S., P.A.K., R.R., M.K., A.T., C.A.E.); and UniversityCollege London, Institute of Ophthalmology, London, United Kingdom(D.A.S., P.A.K., R.R., S.S., M.B.P., M.F., A.T.).
Inquiries to Dawn A. Sim, Moorfields Eye Hospital, 162 City Road,London EC1V 2PD, United Kingdom; e-mail: [email protected]
144 � 2014 BY ELSEVIER INC.
DIABETIC RETINOPATHY ENCOMPASSES A GROUP
of predominantly vascular anomalies. If leftuntreated, diabetic retinopathy ultimately results
in visual loss, with up to 28 million individuals worldwideaffected by vision-threatening diabetic retinopathy.1
Broadly, the spectrum of disease has been classified accord-ing to the behavior of the retinal vasculature: (1) hyperper-meability (leakage and edema), which results in thedevelopment of lesions such as macular edema, peripheralhard exudates, and microaneurysms; and (2) hypoperfusion(ischemia), which results in enlargement of the foveal avas-cular zone (FAZ) in the macula and capillary nonperfusionand retinal neovascularization in the retinal periphery.It is not knownwhat causes the differential regional distri-
bution of these vascular lesions (ie, peripheral vs centralretina), why they occur in some patients but not others,and how they might affect visual function. Epidemiologicstudies have suggested that age may be a key component tothe different patterns of diabetic retinopathy observed—that is, the predominance ofmacular edema in older patientswith type 2 and proliferative retinopathy in younger patientswith type 1 diabetes.2,3 Several possible mechanisms havebeen suggested, including the loss of autoregulation inretinal arterioles, as well as microvascular degeneration inolder persons causing capillary leakage with consequentmacular edema. In the younger age group, it has beenproposed that an intact posterior hyaloid serves as ascaffold for the formation of aberrant neovascularization.4,5
However, the pathobiology of the different patterns ofdiabetic retinopathy phenotypes remains unclear. It isunlikely that age alone is solely responsible.The advent of ultra-widefield fluorescein angiography
(FA) has for the first time provided the opportunityto visualize both the central and peripheral retina in a singleexamination. Although widefield imaging of the retina hasbeen in development over the past 80 years, older systemsencountered obstacles that precluded its wide applicationin patients with diabetic retinopathy, such as the require-ment of a contact lens and clear ocular media for the acqui-sitionof goodperipheral images.6,7 In recent times, theOptoscamera (Optos PLC, Dunfermline, Scotland, UK) hasincorporated both a scanning laser ophthalmoscope (whichpermits imaging through moderate media opacities) andan optical system with an ellipsoid mirror, which allows
0002-9394/$36.00http://dx.doi.org/10.1016/j.ajo.2014.03.009
ALL RIGHTS RESERVED.
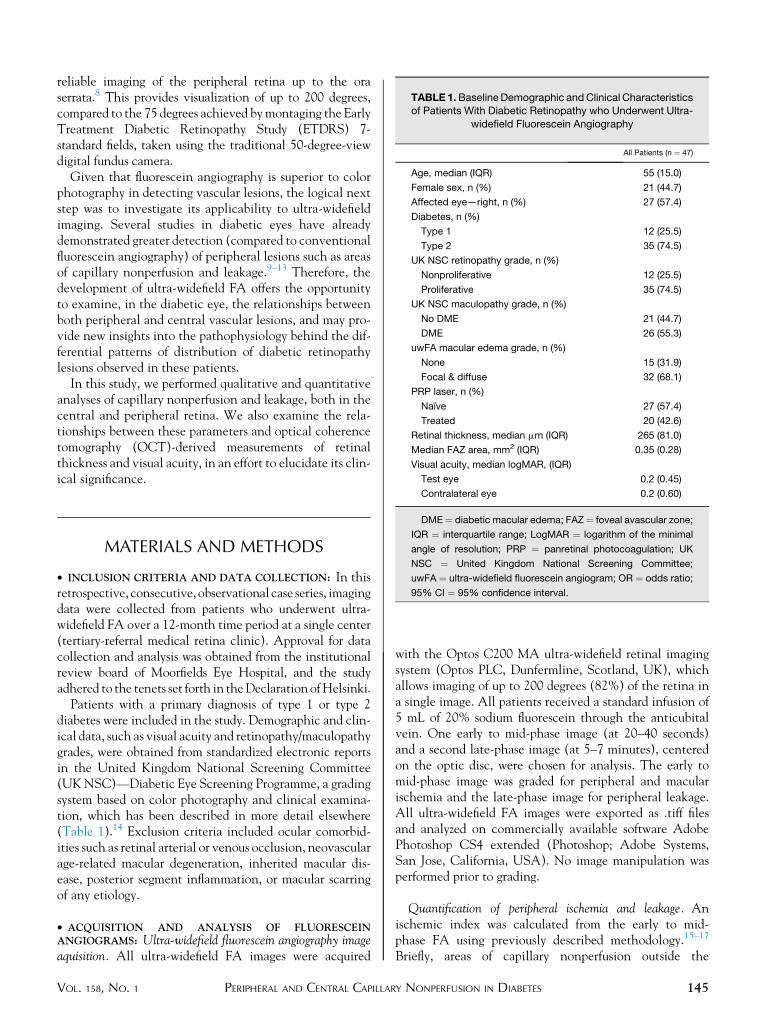
TABLE 1.BaselineDemographic andClinical Characteristicsof Patients With Diabetic Retinopathy who Underwent Ultra-
widefield Fluorescein Angiography
All Patients (n ¼ 47)
Age, median (IQR) 55 (15.0)
Female sex, n (%) 21 (44.7)
Affected eye—right, n (%) 27 (57.4)
Diabetes, n (%)
Type 1 12 (25.5)
Type 2 35 (74.5)
UK NSC retinopathy grade, n (%)
Nonproliferative 12 (25.5)
Proliferative 35 (74.5)
UK NSC maculopathy grade, n (%)
No DME 21 (44.7)
DME 26 (55.3)
uwFA macular edema grade, n (%)
None 15 (31.9)
Focal & diffuse 32 (68.1)
PRP laser, n (%)
Naı̈ve 27 (57.4)
Treated 20 (42.6)
Retinal thickness, median mm (IQR) 265 (81.0)
Median FAZ area, mm2 (IQR) 0.35 (0.28)
Visual acuity, median logMAR, (IQR)
Test eye 0.2 (0.45)
reliable imaging of the peripheral retina up to the oraserrata.8 This provides visualization of up to 200 degrees,compared to the 75 degrees achieved bymontaging the EarlyTreatment Diabetic Retinopathy Study (ETDRS) 7-standard fields, taken using the traditional 50-degree-viewdigital fundus camera.
Given that fluorescein angiography is superior to colorphotography in detecting vascular lesions, the logical nextstep was to investigate its applicability to ultra-widefieldimaging. Several studies in diabetic eyes have alreadydemonstrated greater detection (compared to conventionalfluorescein angiography) of peripheral lesions such as areasof capillary nonperfusion and leakage.9–13 Therefore, thedevelopment of ultra-widefield FA offers the opportunityto examine, in the diabetic eye, the relationships betweenboth peripheral and central vascular lesions, and may pro-vide new insights into the pathophysiology behind the dif-ferential patterns of distribution of diabetic retinopathylesions observed in these patients.
In this study, we performed qualitative and quantitativeanalyses of capillary nonperfusion and leakage, both in thecentral and peripheral retina. We also examine the rela-tionships between these parameters and optical coherencetomography (OCT)-derived measurements of retinalthickness and visual acuity, in an effort to elucidate its clin-ical significance.
Contralateral eye 0.2 (0.60)
DME¼ diabetic macular edema; FAZ¼ foveal avascular zone;
IQR ¼ interquartile range; LogMAR ¼ logarithm of the minimal
angle of resolution; PRP ¼ panretinal photocoagulation; UK
NSC ¼ United Kingdom National Screening Committee;
uwFA ¼ ultra-widefield fluorescein angiogram; OR ¼ odds ratio;
95% CI ¼ 95% confidence interval.
MATERIALS AND METHODS
� INCLUSION CRITERIA AND DATA COLLECTION: In thisretrospective, consecutive, observational case series, imagingdata were collected from patients who underwent ultra-widefield FA over a 12-month time period at a single center(tertiary-referral medical retina clinic). Approval for datacollection and analysis was obtained from the institutionalreview board of Moorfields Eye Hospital, and the studyadhered to the tenets set forth in theDeclaration ofHelsinki.
Patients with a primary diagnosis of type 1 or type 2diabetes were included in the study. Demographic and clin-ical data, such as visual acuity and retinopathy/maculopathygrades, were obtained from standardized electronic reportsin the United Kingdom National Screening Committee(UKNSC)—Diabetic Eye Screening Programme, a gradingsystem based on color photography and clinical examina-tion, which has been described in more detail elsewhere(Table 1).14 Exclusion criteria included ocular comorbid-ities such as retinal arterial or venous occlusion, neovascularage-related macular degeneration, inherited macular dis-ease, posterior segment inflammation, or macular scarringof any etiology.
� ACQUISITION AND ANALYSIS OF FLUORESCEINANGIOGRAMS: Ultra-widefield fluorescein angiography imageaquisition. All ultra-widefield FA images were acquired
VOL. 158, NO. 1 PERIPHERAL AND CENTRAL CAPILLAR
with the Optos C200 MA ultra-widefield retinal imagingsystem (Optos PLC, Dunfermline, Scotland, UK), whichallows imaging of up to 200 degrees (82%) of the retina ina single image. All patients received a standard infusion of5 mL of 20% sodium fluorescein through the anticubitalvein. One early to mid-phase image (at 20–40 seconds)and a second late-phase image (at 5–7 minutes), centeredon the optic disc, were chosen for analysis. The early tomid-phase image was graded for peripheral and macularischemia and the late-phase image for peripheral leakage.All ultra-widefield FA images were exported as .tiff filesand analyzed on commercially available software AdobePhotoshop CS4 extended (Photoshop; Adobe Systems,San Jose, California, USA). No image manipulation wasperformed prior to grading.
Quantification of peripheral ischemia and leakage. Anischemic index was calculated from the early to mid-phase FA using previously described methodology.15–17
Briefly, areas of capillary nonperfusion outside the
145Y NONPERFUSION IN DIABETES
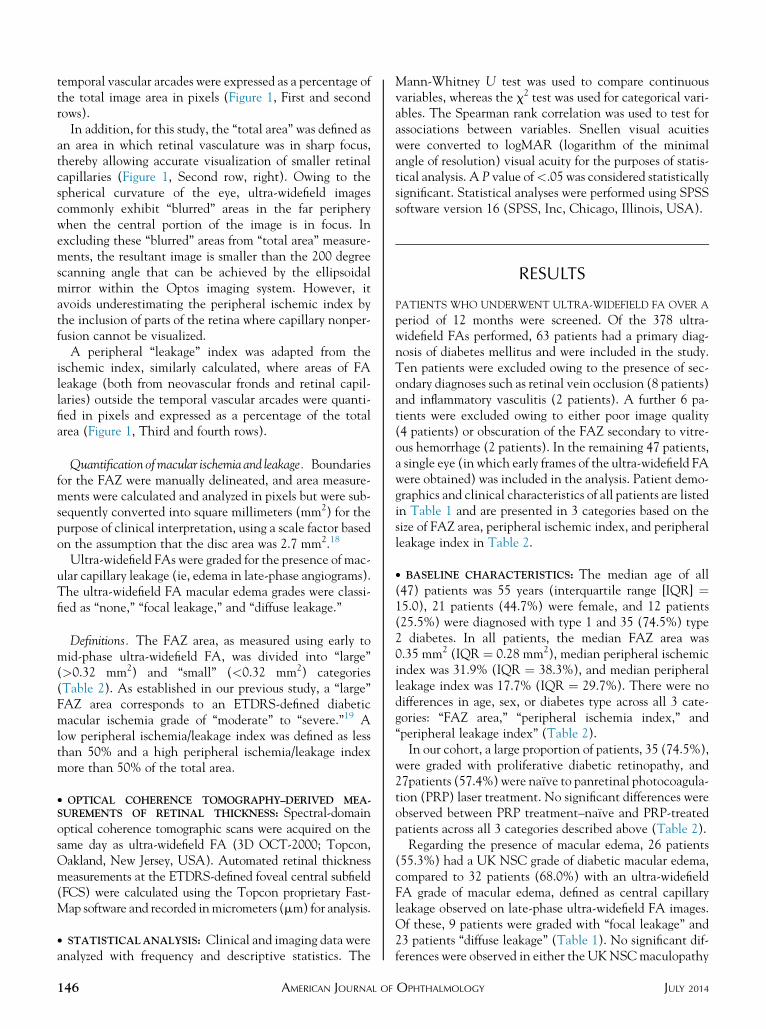
temporal vascular arcades were expressed as a percentage ofthe total image area in pixels (Figure 1, First and secondrows).
In addition, for this study, the ‘‘total area’’ was defined asan area in which retinal vasculature was in sharp focus,thereby allowing accurate visualization of smaller retinalcapillaries (Figure 1, Second row, right). Owing to thespherical curvature of the eye, ultra-widefield imagescommonly exhibit ‘‘blurred’’ areas in the far peripherywhen the central portion of the image is in focus. Inexcluding these ‘‘blurred’’ areas from ‘‘total area’’ measure-ments, the resultant image is smaller than the 200 degreescanning angle that can be achieved by the ellipsoidalmirror within the Optos imaging system. However, itavoids underestimating the peripheral ischemic index bythe inclusion of parts of the retina where capillary nonper-fusion cannot be visualized.
A peripheral ‘‘leakage’’ index was adapted from theischemic index, similarly calculated, where areas of FAleakage (both from neovascular fronds and retinal capil-laries) outside the temporal vascular arcades were quanti-fied in pixels and expressed as a percentage of the totalarea (Figure 1, Third and fourth rows).
Quantification ofmacular ischemia and leakage. Boundariesfor the FAZ were manually delineated, and area measure-ments were calculated and analyzed in pixels but were sub-sequently converted into square millimeters (mm2) for thepurpose of clinical interpretation, using a scale factor basedon the assumption that the disc area was 2.7 mm2.18
Ultra-widefield FAs were graded for the presence of mac-ular capillary leakage (ie, edema in late-phase angiograms).The ultra-widefield FA macular edema grades were classi-fied as ‘‘none,’’ ‘‘focal leakage,’’ and ‘‘diffuse leakage.’’
Definitions. The FAZ area, as measured using early tomid-phase ultra-widefield FA, was divided into ‘‘large’’(>0.32 mm2) and ‘‘small’’ (<0.32 mm2) categories(Table 2). As established in our previous study, a ‘‘large’’FAZ area corresponds to an ETDRS-defined diabeticmacular ischemia grade of ‘‘moderate’’ to ‘‘severe.’’19 Alow peripheral ischemia/leakage index was defined as lessthan 50% and a high peripheral ischemia/leakage indexmore than 50% of the total area.
� OPTICAL COHERENCE TOMOGRAPHY–DERIVED MEA-SUREMENTS OF RETINAL THICKNESS: Spectral-domainoptical coherence tomographic scans were acquired on thesame day as ultra-widefield FA (3D OCT-2000; Topcon,Oakland, New Jersey, USA). Automated retinal thicknessmeasurements at the ETDRS-defined foveal central subfield(FCS) were calculated using the Topcon proprietary Fast-Map software and recorded inmicrometers (mm) for analysis.
� STATISTICALANALYSIS: Clinical and imaging data wereanalyzed with frequency and descriptive statistics. The
146 AMERICAN JOURNAL OF
Mann-Whitney U test was used to compare continuousvariables, whereas the x2 test was used for categorical vari-ables. The Spearman rank correlation was used to test forassociations between variables. Snellen visual acuitieswere converted to logMAR (logarithm of the minimalangle of resolution) visual acuity for the purposes of statis-tical analysis. A P value of<.05 was considered statisticallysignificant. Statistical analyses were performed using SPSSsoftware version 16 (SPSS, Inc, Chicago, Illinois, USA).
RESULTS
PATIENTS WHO UNDERWENT ULTRA-WIDEFIELD FA OVER A
period of 12 months were screened. Of the 378 ultra-widefield FAs performed, 63 patients had a primary diag-nosis of diabetes mellitus and were included in the study.Ten patients were excluded owing to the presence of sec-ondary diagnoses such as retinal vein occlusion (8 patients)and inflammatory vasculitis (2 patients). A further 6 pa-tients were excluded owing to either poor image quality(4 patients) or obscuration of the FAZ secondary to vitre-ous hemorrhage (2 patients). In the remaining 47 patients,a single eye (in which early frames of the ultra-widefield FAwere obtained) was included in the analysis. Patient demo-graphics and clinical characteristics of all patients are listedin Table 1 and are presented in 3 categories based on thesize of FAZ area, peripheral ischemic index, and peripheralleakage index in Table 2.
� BASELINE CHARACTERISTICS: The median age of all(47) patients was 55 years (interquartile range [IQR] ¼15.0), 21 patients (44.7%) were female, and 12 patients(25.5%) were diagnosed with type 1 and 35 (74.5%) type2 diabetes. In all patients, the median FAZ area was0.35 mm2 (IQR ¼ 0.28 mm2), median peripheral ischemicindex was 31.9% (IQR ¼ 38.3%), and median peripheralleakage index was 17.7% (IQR ¼ 29.7%). There were nodifferences in age, sex, or diabetes type across all 3 cate-gories: ‘‘FAZ area,’’ ‘‘peripheral ischemia index,’’ and‘‘peripheral leakage index’’ (Table 2).In our cohort, a large proportion of patients, 35 (74.5%),
were graded with proliferative diabetic retinopathy, and27patients (57.4%) were naı̈ve to panretinal photocoagula-tion (PRP) laser treatment. No significant differences wereobserved between PRP treatment–naı̈ve and PRP-treatedpatients across all 3 categories described above (Table 2).Regarding the presence of macular edema, 26 patients
(55.3%) had a UK NSC grade of diabetic macular edema,compared to 32 patients (68.0%) with an ultra-widefieldFA grade of macular edema, defined as central capillaryleakage observed on late-phase ultra-widefield FA images.Of these, 9 patients were graded with ‘‘focal leakage’’ and23 patients ‘‘diffuse leakage’’ (Table 1). No significant dif-ferences were observed in either the UKNSCmaculopathy
JULY 2014OPHTHALMOLOGY
FIGURE 1. An example of an early- and late-phase ultra-widefield fluorescein angiogram image of a patient with diabetic retinopathycomprising both peripheral and macular capillary nonperfusion. (First row, left) An early-phase ultra-widefield fluorescein angiogram(FA) image, acquired at 20 seconds. (First row, right) A 103magnified early-phase ultra-widefield FA image, centered on the fovealavascular zone. (Second row, left) Annotated solid blue line delineates the boundary of the retina where capillaries are in sharp focus.This area was taken to be the ‘‘total retinal area,’’ which was the denominator as the peripheral ischemic index. Annotated solid greenlines delineate areas of capillary nonperfusion in the retinal periphery. The peripheral ischemic index was calculated as the percentageof the ‘‘total area of capillary nonperfusion’’ over the ‘‘total retinal area.’’ (Second row, right) Annotated solid red line delineates theboundary of the foveal avascular zone area. (Third row, left) A late-phase ultra-widefield FA image, acquired at 6 minutes. (Thirdrow, right) A 103 magnified ultra-widefield FA image, centered on the foveal avascular zone. (Fourth row, left) Annotated solidblue line delineates the boundary of the retina where peripheral vasculature was in sharp focus. This area was also taken to be the‘‘total retinal area’’ for the purpose of calculating the peripheral leakage index. Annotated solid green lines delineate areas of ‘‘vascularleakage’’ in the retinal periphery. The peripheral leakage index was similarly calculated as the percentage of the ‘‘total area of vascularleakage’’ over the ‘‘total retinal area.’’ (Fourth row, right) Annotated solid red arrowheads points to diffuse leakage from the perifovealcapillaries. Ultra-widefield FAs were graded for the presence of macular capillary leakage and classified as ‘‘none,’’ ‘‘focal leakage,’’and ‘‘diffuse leakage.’’
VOL. 158, NO. 1 147PERIPHERAL AND CENTRAL CAPILLARY NONPERFUSION IN DIABETES
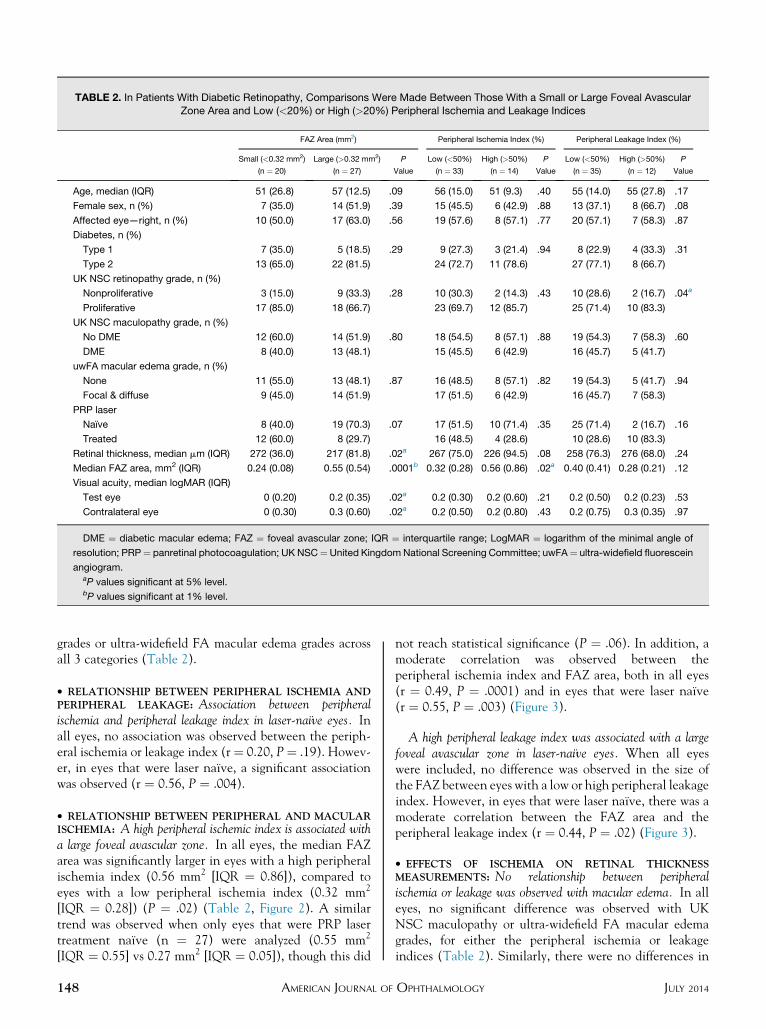
TABLE 2. In Patients With Diabetic Retinopathy, Comparisons Were Made Between Those With a Small or Large Foveal AvascularZone Area and Low (<20%) or High (>20%) Peripheral Ischemia and Leakage Indices
FAZ Area (mm2) Peripheral Ischemia Index (%) Peripheral Leakage Index (%)
Small (<0.32 mm2)
(n ¼ 20)
Large (>0.32 mm2)
(n ¼ 27)
P
Value
Low (<50%)
(n ¼ 33)
High (>50%)
(n ¼ 14)
P
Value
Low (<50%)
(n ¼ 35)
High (>50%)
(n ¼ 12)
P
Value
Age, median (IQR) 51 (26.8) 57 (12.5) .09 56 (15.0) 51 (9.3) .40 55 (14.0) 55 (27.8) .17
Female sex, n (%) 7 (35.0) 14 (51.9) .39 15 (45.5) 6 (42.9) .88 13 (37.1) 8 (66.7) .08
Affected eye—right, n (%) 10 (50.0) 17 (63.0) .56 19 (57.6) 8 (57.1) .77 20 (57.1) 7 (58.3) .87
Diabetes, n (%)
Type 1 7 (35.0) 5 (18.5) .29 9 (27.3) 3 (21.4) .94 8 (22.9) 4 (33.3) .31
Type 2 13 (65.0) 22 (81.5) 24 (72.7) 11 (78.6) 27 (77.1) 8 (66.7)
UK NSC retinopathy grade, n (%)
Nonproliferative 3 (15.0) 9 (33.3) .28 10 (30.3) 2 (14.3) .43 10 (28.6) 2 (16.7) .04a
Proliferative 17 (85.0) 18 (66.7) 23 (69.7) 12 (85.7) 25 (71.4) 10 (83.3)
UK NSC maculopathy grade, n (%)
No DME 12 (60.0) 14 (51.9) .80 18 (54.5) 8 (57.1) .88 19 (54.3) 7 (58.3) .60
DME 8 (40.0) 13 (48.1) 15 (45.5) 6 (42.9) 16 (45.7) 5 (41.7)
uwFA macular edema grade, n (%)
None 11 (55.0) 13 (48.1) .87 16 (48.5) 8 (57.1) .82 19 (54.3) 5 (41.7) .94
Focal & diffuse 9 (45.0) 14 (51.9) 17 (51.5) 6 (42.9) 16 (45.7) 7 (58.3)
PRP laser
Naı̈ve 8 (40.0) 19 (70.3) .07 17 (51.5) 10 (71.4) .35 25 (71.4) 2 (16.7) .16
Treated 12 (60.0) 8 (29.7) 16 (48.5) 4 (28.6) 10 (28.6) 10 (83.3)
Retinal thickness, median mm (IQR) 272 (36.0) 217 (81.8) .02a 267 (75.0) 226 (94.5) .08 258 (76.3) 276 (68.0) .24
Median FAZ area, mm2 (IQR) 0.24 (0.08) 0.55 (0.54) .0001b 0.32 (0.28) 0.56 (0.86) .02a 0.40 (0.41) 0.28 (0.21) .12
Visual acuity, median logMAR (IQR)
Test eye 0 (0.20) 0.2 (0.35) .02a 0.2 (0.30) 0.2 (0.60) .21 0.2 (0.50) 0.2 (0.23) .53
Contralateral eye 0 (0.30) 0.3 (0.60) .02a 0.2 (0.50) 0.2 (0.80) .43 0.2 (0.75) 0.3 (0.35) .97
DME ¼ diabetic macular edema; FAZ ¼ foveal avascular zone; IQR ¼ interquartile range; LogMAR ¼ logarithm of the minimal angle of
resolution; PRP¼ panretinal photocoagulation; UK NSC¼United KingdomNational Screening Committee; uwFA¼ ultra-widefield fluorescein
angiogram.aP values significant at 5% level.bP values significant at 1% level.
grades or ultra-widefield FA macular edema grades acrossall 3 categories (Table 2).
� RELATIONSHIP BETWEEN PERIPHERAL ISCHEMIA ANDPERIPHERAL LEAKAGE: Association between peripheralischemia and peripheral leakage index in laser-naı̈ve eyes. Inall eyes, no association was observed between the periph-eral ischemia or leakage index (r¼ 0.20, P¼ .19). Howev-er, in eyes that were laser naı̈ve, a significant associationwas observed (r ¼ 0.56, P ¼ .004).
� RELATIONSHIP BETWEEN PERIPHERAL AND MACULARISCHEMIA: A high peripheral ischemic index is associated witha large foveal avascular zone. In all eyes, the median FAZarea was significantly larger in eyes with a high peripheralischemia index (0.56 mm2 [IQR ¼ 0.86]), compared toeyes with a low peripheral ischemia index (0.32 mm2
[IQR ¼ 0.28]) (P ¼ .02) (Table 2, Figure 2). A similartrend was observed when only eyes that were PRP lasertreatment naı̈ve (n ¼ 27) were analyzed (0.55 mm2
[IQR ¼ 0.55] vs 0.27 mm2 [IQR ¼ 0.05]), though this did
148 AMERICAN JOURNAL OF
not reach statistical significance (P ¼ .06). In addition, amoderate correlation was observed between theperipheral ischemia index and FAZ area, both in all eyes(r ¼ 0.49, P ¼ .0001) and in eyes that were laser naı̈ve(r ¼ 0.55, P ¼ .003) (Figure 3).
A high peripheral leakage index was associated with a largefoveal avascular zone in laser-naı̈ve eyes. When all eyeswere included, no difference was observed in the size ofthe FAZ between eyes with a low or high peripheral leakageindex. However, in eyes that were laser naı̈ve, there was amoderate correlation between the FAZ area and theperipheral leakage index (r ¼ 0.44, P ¼ .02) (Figure 3).
� EFFECTS OF ISCHEMIA ON RETINAL THICKNESSMEASUREMENTS: No relationship between peripheralischemia or leakage was observed with macular edema. In alleyes, no significant difference was observed with UKNSC maculopathy or ultra-widefield FA macular edemagrades, for either the peripheral ischemia or leakageindices (Table 2). Similarly, there were no differences in
JULY 2014OPHTHALMOLOGY
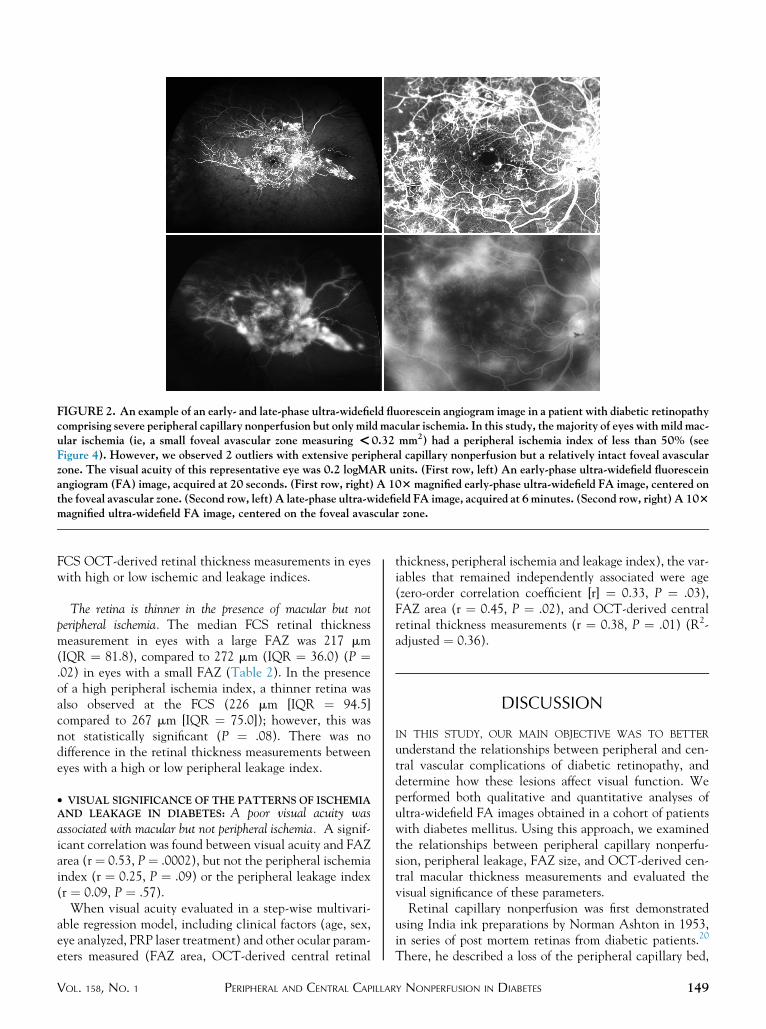
FIGURE 2. An example of an early- and late-phase ultra-widefield fluorescein angiogram image in a patient with diabetic retinopathycomprising severe peripheral capillary nonperfusion but only mild macular ischemia. In this study, the majority of eyes with mild mac-ular ischemia (ie, a small foveal avascular zone measuring <0.32 mm2) had a peripheral ischemia index of less than 50% (seeFigure 4). However, we observed 2 outliers with extensive peripheral capillary nonperfusion but a relatively intact foveal avascularzone. The visual acuity of this representative eye was 0.2 logMAR units. (First row, left) An early-phase ultra-widefield fluoresceinangiogram (FA) image, acquired at 20 seconds. (First row, right) A 103magnified early-phase ultra-widefield FA image, centered onthe foveal avascular zone. (Second row, left) A late-phase ultra-widefield FA image, acquired at 6minutes. (Second row, right) A 103magnified ultra-widefield FA image, centered on the foveal avascular zone.
FCS OCT-derived retinal thickness measurements in eyeswith high or low ischemic and leakage indices.
The retina is thinner in the presence of macular but notperipheral ischemia. The median FCS retinal thicknessmeasurement in eyes with a large FAZ was 217 mm(IQR ¼ 81.8), compared to 272 mm (IQR ¼ 36.0) (P ¼.02) in eyes with a small FAZ (Table 2). In the presenceof a high peripheral ischemia index, a thinner retina wasalso observed at the FCS (226 mm [IQR ¼ 94.5]compared to 267 mm [IQR ¼ 75.0]); however, this wasnot statistically significant (P ¼ .08). There was nodifference in the retinal thickness measurements betweeneyes with a high or low peripheral leakage index.
� VISUAL SIGNIFICANCE OF THE PATTERNS OF ISCHEMIAAND LEAKAGE IN DIABETES: A poor visual acuity wasassociated with macular but not peripheral ischemia. A signif-icant correlation was found between visual acuity and FAZarea (r ¼ 0.53, P¼ .0002), but not the peripheral ischemiaindex (r ¼ 0.25, P ¼ .09) or the peripheral leakage index(r ¼ 0.09, P ¼ .57).
When visual acuity evaluated in a step-wise multivari-able regression model, including clinical factors (age, sex,eye analyzed, PRP laser treatment) and other ocular param-eters measured (FAZ area, OCT-derived central retinal
VOL. 158, NO. 1 PERIPHERAL AND CENTRAL CAPILLAR
thickness, peripheral ischemia and leakage index), the var-iables that remained independently associated were age(zero-order correlation coefficient [r] ¼ 0.33, P ¼ .03),FAZ area (r ¼ 0.45, P ¼ .02), and OCT-derived centralretinal thickness measurements (r ¼ 0.38, P ¼ .01) (R2-adjusted ¼ 0.36).
DISCUSSION
IN THIS STUDY, OUR MAIN OBJECTIVE WAS TO BETTER
understand the relationships between peripheral and cen-tral vascular complications of diabetic retinopathy, anddetermine how these lesions affect visual function. Weperformed both qualitative and quantitative analyses ofultra-widefield FA images obtained in a cohort of patientswith diabetes mellitus. Using this approach, we examinedthe relationships between peripheral capillary nonperfu-sion, peripheral leakage, FAZ size, and OCT-derived cen-tral macular thickness measurements and evaluated thevisual significance of these parameters.Retinal capillary nonperfusion was first demonstrated
using India ink preparations by Norman Ashton in 1953,in series of post mortem retinas from diabetic patients.20
There, he described a loss of the peripheral capillary bed,
149Y NONPERFUSION IN DIABETES
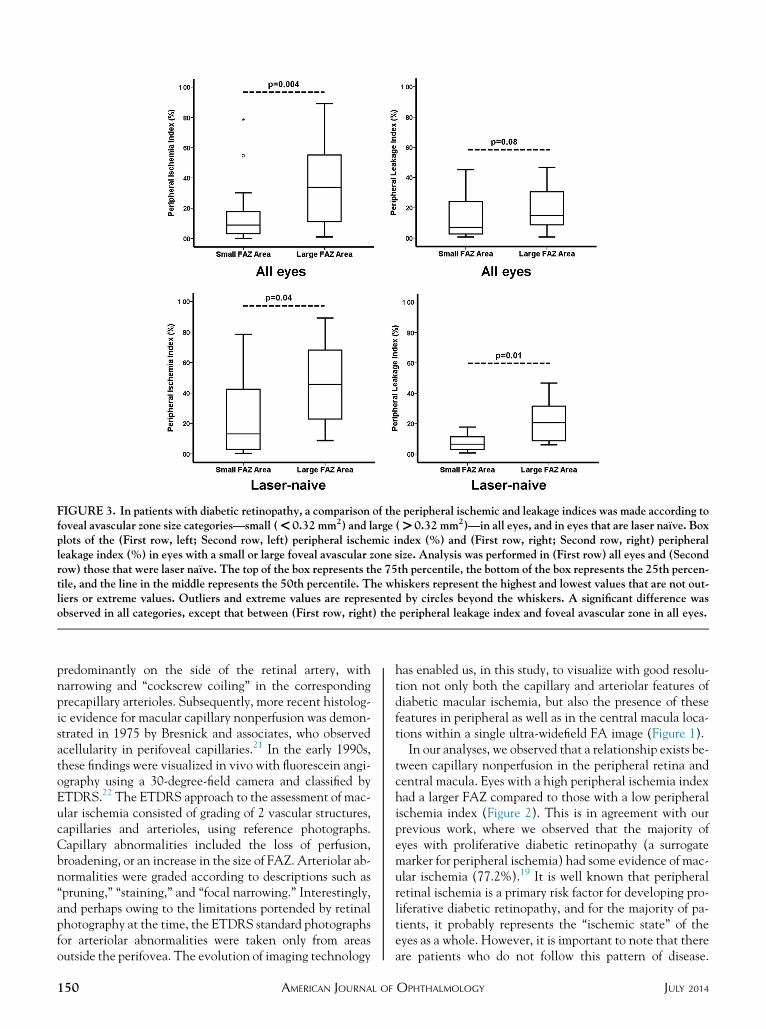
FIGURE 3. In patients with diabetic retinopathy, a comparison of the peripheral ischemic and leakage indices was made according tofoveal avascular zone size categories—small (<0.32 mm2) and large (>0.32 mm2)—in all eyes, and in eyes that are laser naı̈ve. Boxplots of the (First row, left; Second row, left) peripheral ischemic index (%) and (First row, right; Second row, right) peripheralleakage index (%) in eyes with a small or large foveal avascular zone size. Analysis was performed in (First row) all eyes and (Secondrow) those that were laser naı̈ve. The top of the box represents the 75th percentile, the bottom of the box represents the 25th percen-tile, and the line in the middle represents the 50th percentile. The whiskers represent the highest and lowest values that are not out-liers or extreme values. Outliers and extreme values are represented by circles beyond the whiskers. A significant difference wasobserved in all categories, except that between (First row, right) the peripheral leakage index and foveal avascular zone in all eyes.
predominantly on the side of the retinal artery, withnarrowing and ‘‘cockscrew coiling’’ in the correspondingprecapillary arterioles. Subsequently, more recent histolog-ic evidence for macular capillary nonperfusion was demon-strated in 1975 by Bresnick and associates, who observedacellularity in perifoveal capillaries.21 In the early 1990s,these findings were visualized in vivo with fluorescein angi-ography using a 30-degree-field camera and classified byETDRS.22 The ETDRS approach to the assessment of mac-ular ischemia consisted of grading of 2 vascular structures,capillaries and arterioles, using reference photographs.Capillary abnormalities included the loss of perfusion,broadening, or an increase in the size of FAZ. Arteriolar ab-normalities were graded according to descriptions such as‘‘pruning,’’ ‘‘staining,’’ and ‘‘focal narrowing.’’ Interestingly,and perhaps owing to the limitations portended by retinalphotography at the time, the ETDRS standard photographsfor arteriolar abnormalities were taken only from areasoutside the perifovea. The evolution of imaging technology
150 AMERICAN JOURNAL OF
has enabled us, in this study, to visualize with good resolu-tion not only both the capillary and arteriolar features ofdiabetic macular ischemia, but also the presence of thesefeatures in peripheral as well as in the central macula loca-tions within a single ultra-widefield FA image (Figure 1).In our analyses, we observed that a relationship exists be-
tween capillary nonperfusion in the peripheral retina andcentral macula. Eyes with a high peripheral ischemia indexhad a larger FAZ compared to those with a low peripheralischemia index (Figure 2). This is in agreement with ourprevious work, where we observed that the majority ofeyes with proliferative diabetic retinopathy (a surrogatemarker for peripheral ischemia) had some evidence of mac-ular ischemia (77.2%).19 It is well known that peripheralretinal ischemia is a primary risk factor for developing pro-liferative diabetic retinopathy, and for the majority of pa-tients, it probably represents the ‘‘ischemic state’’ of theeyes as a whole. However, it is important to note that thereare patients who do not follow this pattern of disease.
JULY 2014OPHTHALMOLOGY
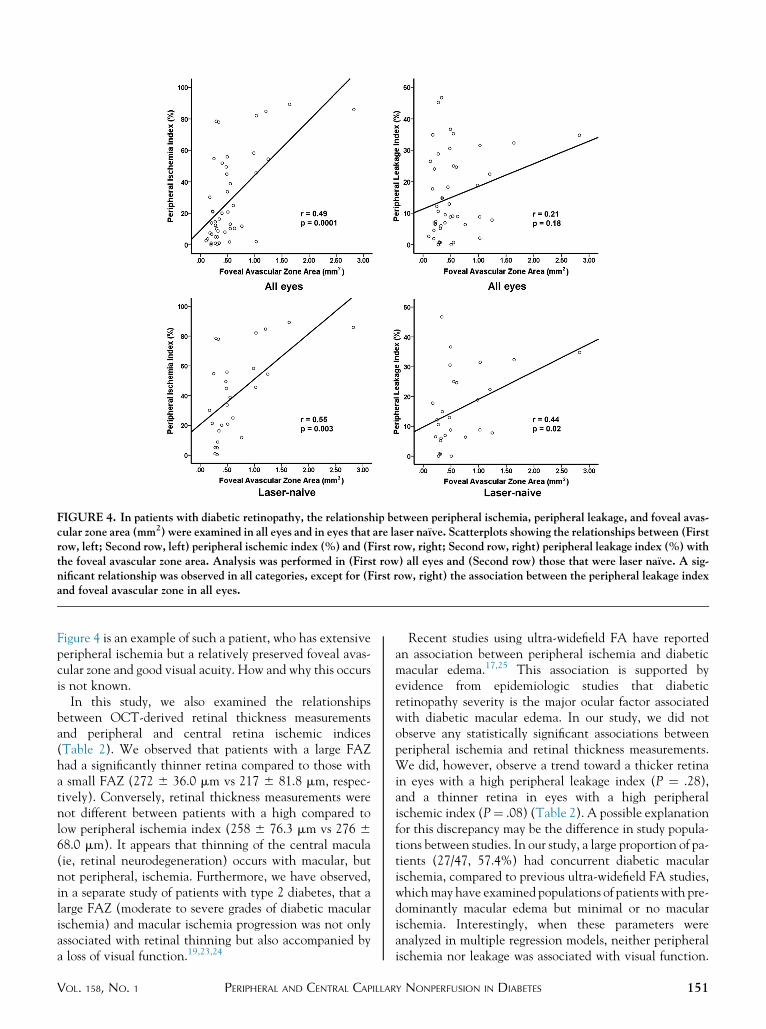
FIGURE 4. In patients with diabetic retinopathy, the relationship between peripheral ischemia, peripheral leakage, and foveal avas-cular zone area (mm2) were examined in all eyes and in eyes that are laser naı̈ve. Scatterplots showing the relationships between (Firstrow, left; Second row, left) peripheral ischemic index (%) and (First row, right; Second row, right) peripheral leakage index (%) withthe foveal avascular zone area. Analysis was performed in (First row) all eyes and (Second row) those that were laser naı̈ve. A sig-nificant relationship was observed in all categories, except for (First row, right) the association between the peripheral leakage indexand foveal avascular zone in all eyes.
Figure 4 is an example of such a patient, who has extensiveperipheral ischemia but a relatively preserved foveal avas-cular zone and good visual acuity. How and why this occursis not known.
In this study, we also examined the relationshipsbetween OCT-derived retinal thickness measurementsand peripheral and central retina ischemic indices(Table 2). We observed that patients with a large FAZhad a significantly thinner retina compared to those witha small FAZ (272 6 36.0 mm vs 217 6 81.8 mm, respec-tively). Conversely, retinal thickness measurements werenot different between patients with a high compared tolow peripheral ischemia index (258 6 76.3 mm vs 276 668.0 mm). It appears that thinning of the central macula(ie, retinal neurodegeneration) occurs with macular, butnot peripheral, ischemia. Furthermore, we have observed,in a separate study of patients with type 2 diabetes, that alarge FAZ (moderate to severe grades of diabetic macularischemia) and macular ischemia progression was not onlyassociated with retinal thinning but also accompanied bya loss of visual function.19,23,24
VOL. 158, NO. 1 PERIPHERAL AND CENTRAL CAPILLAR
Recent studies using ultra-widefield FA have reportedan association between peripheral ischemia and diabeticmacular edema.17,25 This association is supported byevidence from epidemiologic studies that diabeticretinopathy severity is the major ocular factor associatedwith diabetic macular edema. In our study, we did notobserve any statistically significant associations betweenperipheral ischemia and retinal thickness measurements.We did, however, observe a trend toward a thicker retinain eyes with a high peripheral leakage index (P ¼ .28),and a thinner retina in eyes with a high peripheralischemic index (P¼ .08) (Table 2). A possible explanationfor this discrepancy may be the difference in study popula-tions between studies. In our study, a large proportion of pa-tients (27/47, 57.4%) had concurrent diabetic macularischemia, compared to previous ultra-widefield FA studies,whichmay have examined populations of patients with pre-dominantly macular edema but minimal or no macularischemia. Interestingly, when these parameters wereanalyzed in multiple regression models, neither peripheralischemia nor leakage was associated with visual function.
151Y NONPERFUSION IN DIABETES
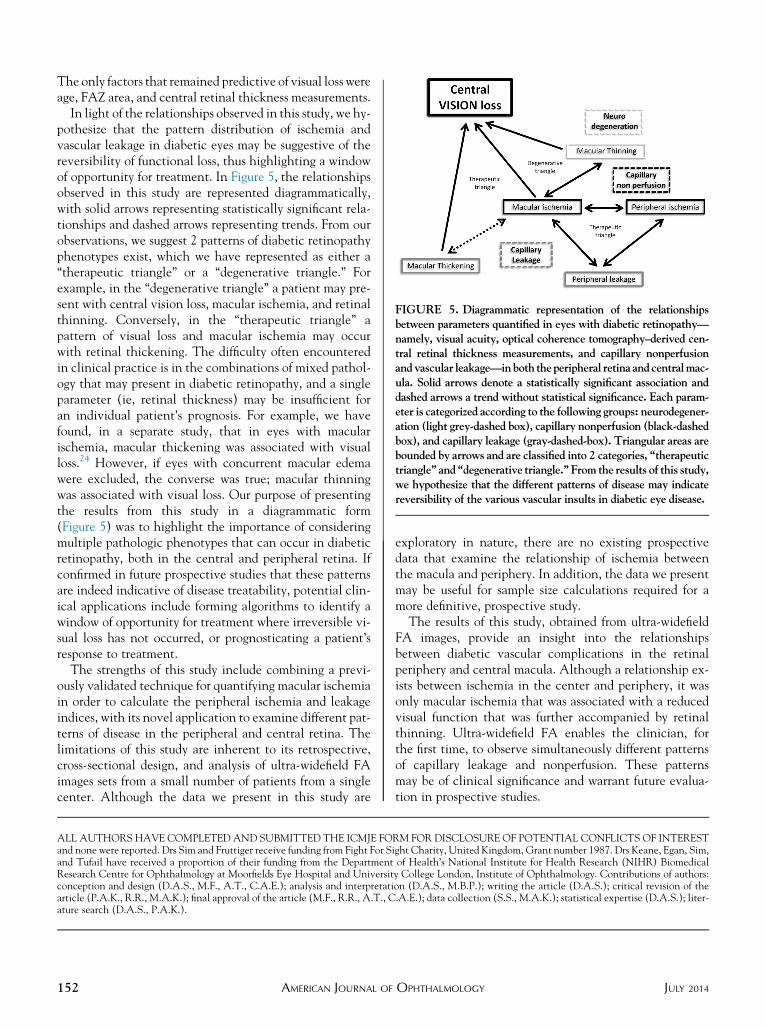
FIGURE 5. Diagrammatic representation of the relationshipsbetween parameters quantified in eyes with diabetic retinopathy—namely, visual acuity, optical coherence tomography–derived cen-tral retinal thickness measurements, and capillary nonperfusionandvascular leakage—inboth theperipheral retina andcentralmac-ula. Solid arrows denote a statistically significant association anddashed arrows a trend without statistical significance. Each param-eter is categorized according to the following groups: neurodegener-ation (light grey-dashed box), capillary nonperfusion (black-dashedbox), and capillary leakage (gray-dashed-box). Triangular areas arebounded by arrows and are classified into 2 categories, ‘‘therapeutictriangle’’ and ‘‘degenerative triangle.’’ From the results of this study,we hypothesize that the different patterns of disease may indicatereversibility of the various vascular insults in diabetic eye disease.
The only factors that remained predictive of visual loss wereage, FAZ area, and central retinal thickness measurements.
In light of the relationships observed in this study, we hy-pothesize that the pattern distribution of ischemia andvascular leakage in diabetic eyes may be suggestive of thereversibility of functional loss, thus highlighting a windowof opportunity for treatment. In Figure 5, the relationshipsobserved in this study are represented diagrammatically,with solid arrows representing statistically significant rela-tionships and dashed arrows representing trends. From ourobservations, we suggest 2 patterns of diabetic retinopathyphenotypes exist, which we have represented as either a‘‘therapeutic triangle’’ or a ‘‘degenerative triangle.’’ Forexample, in the ‘‘degenerative triangle’’ a patient may pre-sent with central vision loss, macular ischemia, and retinalthinning. Conversely, in the ‘‘therapeutic triangle’’ apattern of visual loss and macular ischemia may occurwith retinal thickening. The difficulty often encounteredin clinical practice is in the combinations of mixed pathol-ogy that may present in diabetic retinopathy, and a singleparameter (ie, retinal thickness) may be insufficient foran individual patient’s prognosis. For example, we havefound, in a separate study, that in eyes with macularischemia, macular thickening was associated with visualloss.24 However, if eyes with concurrent macular edemawere excluded, the converse was true; macular thinningwas associated with visual loss. Our purpose of presentingthe results from this study in a diagrammatic form(Figure 5) was to highlight the importance of consideringmultiple pathologic phenotypes that can occur in diabeticretinopathy, both in the central and peripheral retina. Ifconfirmed in future prospective studies that these patternsare indeed indicative of disease treatability, potential clin-ical applications include forming algorithms to identify awindow of opportunity for treatment where irreversible vi-sual loss has not occurred, or prognosticating a patient’sresponse to treatment.
The strengths of this study include combining a previ-ously validated technique for quantifying macular ischemiain order to calculate the peripheral ischemia and leakageindices, with its novel application to examine different pat-terns of disease in the peripheral and central retina. Thelimitations of this study are inherent to its retrospective,cross-sectional design, and analysis of ultra-widefield FAimages sets from a small number of patients from a singlecenter. Although the data we present in this study are
152 AMERICAN JOURNAL OF
exploratory in nature, there are no existing prospectivedata that examine the relationship of ischemia betweenthe macula and periphery. In addition, the data we presentmay be useful for sample size calculations required for amore definitive, prospective study.The results of this study, obtained from ultra-widefield
FA images, provide an insight into the relationshipsbetween diabetic vascular complications in the retinalperiphery and central macula. Although a relationship ex-ists between ischemia in the center and periphery, it wasonly macular ischemia that was associated with a reducedvisual function that was further accompanied by retinalthinning. Ultra-widefield FA enables the clinician, forthe first time, to observe simultaneously different patternsof capillary leakage and nonperfusion. These patternsmay be of clinical significance and warrant future evalua-tion in prospective studies.
ALL AUTHORS HAVE COMPLETED AND SUBMITTED THE ICMJE FORM FOR DISCLOSURE OF POTENTIAL CONFLICTS OF INTERESTand none were reported. Drs Sim and Fruttiger receive funding from Fight For Sight Charity, United Kingdom, Grant number 1987. Drs Keane, Egan, Sim,and Tufail have received a proportion of their funding from the Department of Health’s National Institute for Health Research (NIHR) BiomedicalResearch Centre for Ophthalmology at Moorfields Eye Hospital and University College London, Institute of Ophthalmology. Contributions of authors:conception and design (D.A.S., M.F., A.T., C.A.E.); analysis and interpretation (D.A.S., M.B.P.); writing the article (D.A.S.); critical revision of thearticle (P.A.K., R.R., M.A.K.); final approval of the article (M.F., R.R., A.T., C.A.E.); data collection (S.S., M.A.K.); statistical expertise (D.A.S.); liter-ature search (D.A.S., P.A.K.).
JULY 2014OPHTHALMOLOGY
REFERENCES
1. Yau JW, Rogers SL, Kawasaki R, et al. Global prevalence andmajor risk factors of diabetic retinopathy. Diabetes Care 2012;35(3):556–564.
2. Klein R, Klein BE, Moss SE, Davis MD, DeMets DL. TheWisconsin epidemiologic study of diabetic retinopathy. II.Prevalence and risk of diabetic retinopathy when age at diag-nosis is less than 30 years. Arch Ophthalmol 1984;102(4):520–526.
3. Klein R, Klein BE, Moss SE, Davis MD, DeMets DL. TheWisconsin epidemiologic study of diabetic retinopathy. III.Prevalence and risk of diabetic retinopathy when age at diag-nosis is 30 or more years. Arch Ophthalmol 1984;102(4):527–532.
4. Farkas E, de Vos RA, Donka G, Jansen Steur EN, Mihaly A,Luiten PG. Age-related microvascular degeneration in thehuman cerebral periventricular white matter. Acta Neuropa-thol 2006;111(2):150–157.
5. Tagawa H, McMeel JW, Furukawa H, et al. Role of the vitre-ous in diabetic retinopathy. I. Vitreous changes in diabeticretinopathy and in physiologic aging. Ophthalmology 1986;93(5):596–601.
6. Witmer MT, Kiss S. Wide-field imaging of the retina. SurvOphthalmol 2013;58(2):143–154.
7. Kelly JP, Weiss AH, Zhou Q, Schmode S, Dreher AW. Imag-ing a child’s fundus without dilation using a handheldconfocal scanning laser ophthalmoscope. Arch Ophthalmol2003;121(3):391–396.
8. Friberg TR, Pandya A, Eller AW. Non-mydriatic panoramicfundus imaging using a non-contact scanning laser-based sys-tem. Ophthalmic Surg Lasers Imaging 2003;34(6):488–497.
9. Oliver SC, Schwartz SD. Peripheral vessel leakage (PVL): anew angiographic finding in diabetic retinopathy identifiedwith ultra wide-field fluorescein angiography. Semin Ophthal-mol 2010;25(1–2):27–33.
10. Wessel MM, Aaker GD, Parlitsis G, Cho M, D’Amico DJ,Kiss S. Ultra-wide-field angiography improves the detectionand classification of diabetic retinopathy. Retina 2012;32(4):785–791.
11. Soliman AZ, Silva PS, Aiello LP, Sun JK. Ultra-wide fieldretinal imaging in detection, classification, and managementof diabetic retinopathy. Semin Ophthalmol 2012;27(5–6):221–227.
12. Silva PS, Cavallerano JD, Sun JK, Soliman AZ, Aiello LM,Aiello LP. Peripheral lesions identified by mydriaticultrawide field imaging: distribution and potential impact
VOL. 158, NO. 1 PERIPHERAL AND CENTRAL CAPILLAR
on diabetic retinopathy severity. Ophthalmology 2013;120(12):2587–2595.
13. Kong M, Lee MY, Ham DI. Ultrawide-field fluorescein angi-ography for evaluation of diabetic retinopathy. Korean JOphthalmol 2012;26(6):428–431.
14. Mackenzie S, Schmermer C, Charnley A, et al. SDOCT im-aging to identify macular pathology in patients diagnosedwith diabetic maculopathy by a digital photographic retinalscreening programme. PLoS ONE 2011;6(5):e14811.
15. Prasad PS, Oliver SC, Coffee RE, Hubschman JP,Schwartz SD. Ultra wide-field angiographic characteristicsof branch retinal and hemicentral retinal vein occlusion.Ophthalmology 2010;117(4):780–784.
16. Tsui I, Kaines A, Havunjian MA, et al. Ischemic index andneovascularization in central retinal vein occlusion. Retina2011;31(1):105–110.
17. Patel RD, Messner LV, Teitelbaum B, Michel KA,Hariprasad SM. Characterization of ischemic index usingultra-widefield fluorescein angiography in patients with focaland diffuse recalcitrant diabetic macular edema. Am J
Ophthalmol 2013;155(6):1038–1044.18. Jonas JB, Gusek GC, Guggenmoos-Holzmann I,
Naumann GO. Size of the optic nerve scleral canal and com-parisonwith intravital determination of optic disc dimensions.Graefes Arch Clin Exp Ophthalmol 1988;226(3):213–215.
19. Sim DA, Keane PA, Zarranz-Ventura J, et al. The effects ofmacular ischemia on visual acuity in diabetic retinopathy.Invest Ophthalmol Vis Sci 2013;54(3):2353–2360.
20. Ashton N. Arteriolar involvement in diabetic retinopathy.Br J Ophthalmol 1953;37(5):282–292.
21. Bresnick GH, De Venecia G,Myers FL, Harris JA, Davis MD.Retinal ischemia in diabetic retinopathy. Arch Ophthalmol1975;93(12):1300–1310.
22. Classification of diabetic retinopathy from fluorescein angio-grams. ETDRS report number 11. Early Treatment DiabeticRetinopathy Study Research Group. Ophthalmology 1991;98(5 Suppl):807–822.
23. Sim DA, Keane PA, Zarranz-Ventura J, et al. Predictive fac-tors for the progression of diabetic macular ischemia. Am J
Ophthalmol 2013;156(4):684–692.24. Sim DA, Keane PA, Fung S, et al. Quantitative analysis of
diabetic macular ischemia using optical coherence tomogra-phy. Invest Ophthalmol Vis Sci 2014;55(1):417–423.
25. Wessel MM, Nair N, Aaker GD, Ehrlich JR, D’Amico DJ,Kiss S. Peripheral retinal ischaemia, as evaluated by ultra-widefield fluorescein angiography, is associated with diabeticmacular oedema. Br J Ophthalmol 2012;96(5):694–698.
153Y NONPERFUSION IN DIABETES
Biosketch
Dawn A. Sim, FRCOphth, currently works as a Clinical Research Fellow at Moorfields Eye Hospital, and Institute of
Ophthalmology, University College London, United Kingdom. Dr Sim obtained her medical degree from St George’s
Hospital, University of London, United Kingdom and, prior to her current post, underwent clinical ophthalmology
training in London. Dr Sim’s primary area of interest is the potential use of regenerative medicine in the treatment of
diabetic eye disease.
153.e1 JULY 2014AMERICAN JOURNAL OF OPHTHALMOLOGY