ARTICLE IN PRESS Automated detection of exudates and macula for grading of diabetic macular edema
12
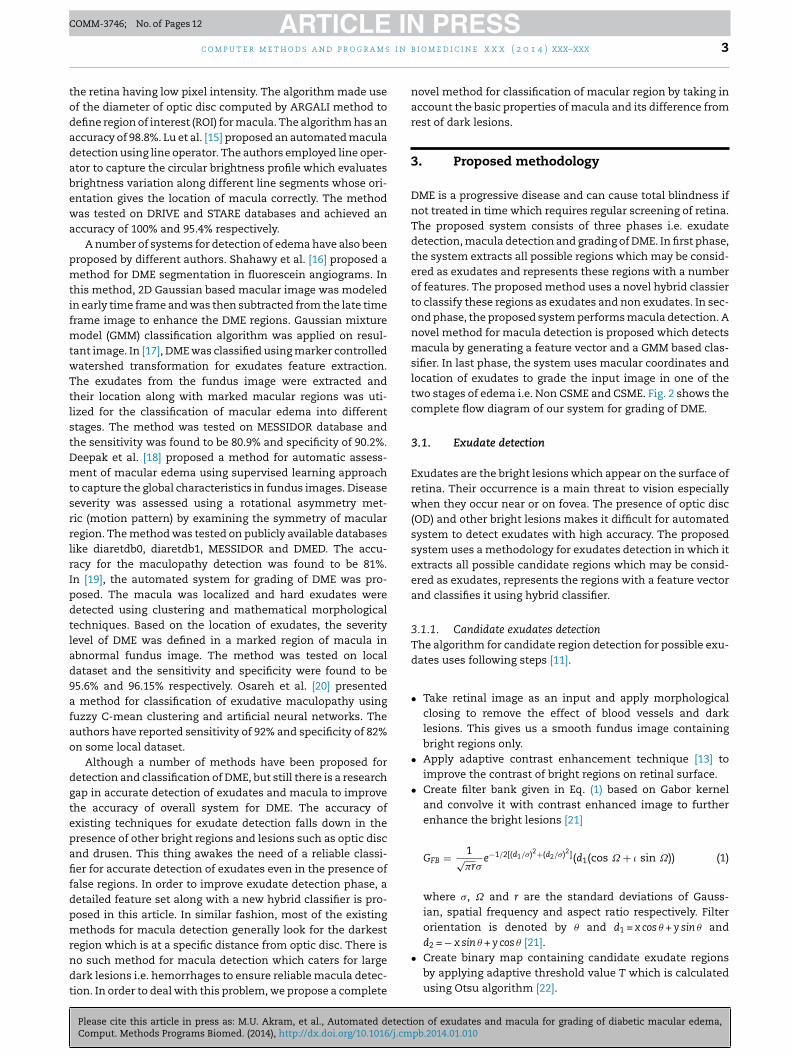
Please cite this article in press as: M.U. Akram, et al., Automated detection of exudates and macula for grading of diabetic macular edema, Comput. Methods Programs Biomed. (2014), http://dx.doi.org/10.1016/j.cmpb.2014.01.010 ARTICLE IN PRESS COMM-3746; No. of Pages 12 c o m p u t e r m e t h o d s a n d p r o g r a m s i n b i o m e d i c i n e x x x ( 2 0 1 4 ) xxx–xxx jo ur nal ho me p ag e: www.intl.elsevierhealt h.com/journals/cmpb Automated detection of exudates and macula for grading of diabetic macular edema M. Usman Akram ∗ , Anam Tariq, Shoab A. Khan, M. Younus Javed Department of Computer Engineering College of E&ME, NUST Peshawar Road, Rawalpindi, Pakistan a r t i c l e i n f o Article history: Received 29 August 2013 Received in revised form 17 November 2013 Accepted 8 January 2014 Keywords: Retinal image analysis Diabetic macular edema Exudates Macula Classification a b s t r a c t Medical systems based on state of the art image processing and pattern recognition tech- niques are very common now a day. These systems are of prime interest to provide basic health care facilities to patients and support to doctors. Diabetic macular edema is one of the retinal abnormalities in which diabetic patient suffers from severe vision loss due to affected macula. It affects the central vision of the person and causes total blindness in severe cases. In this article, we propose an intelligent system for detection and grading of macular edema to assist the ophthalmologists in early and automated detection of the dis- ease. The proposed system consists of a novel method for accurate detection of macula using a detailed feature set and Gaussian mixtures model based classifier. We also present a new hybrid classifier as an ensemble of Gaussian mixture model and support vector machine for improved exudate detection even in the presence of other bright lesions which eventually leads to reliable classification of input retinal image in different stages of macular edema. The statistical analysis and comparative evaluation of proposed system with existing meth- ods are performed on publicly available standard retinal image databases. The proposed system has achieved average value of 97.3%, 95.9% and 96.8% for sensitivity, specificity and accuracy respectively on both databases. © 2014 Elsevier Ireland Ltd. All rights reserved. 1. Introduction The research in medical image analysis is of great significance in this modern era. The study in this field will greatly benefit the health care systems and society. One of the common dis- eases all over the world is diabetes in which the lack of insulin causes high blood sugar in humans. The long term diabetes also affects the human retina resulting in a condition known as diabetic retinopathy (DR) [1]. This condition damages the retinal blood vessels causing them to leak which ultimately leads to blindness. The patients of different types of diabetes develop some form of retinopathy after the twenty years of this chronic disease. DR of any stage develops in nearly all of ∗ Corresponding author. Tel.: +92 3336913921. E-mail addresses: [email protected] (M.U. Akram), [email protected] (A. Tariq), [email protected] (S.A. Khan), [email protected] (M.Y. Javed). the patients having diabetes of type 1 and about 60% of the patients with diabetes of type 2 [1]. DR is normally categorized in different stages such as back- ground or non proliferative DR (NPDR) and proliferative DR (PDR) [2]. NPDR contains initial signs of DR whereas PDR is cat- egorized as advance and severe stage of this retinal disease. In NPDR, different lesions such as microaneurysms, hemor- rhages and exudates appear on the retina and based on their count and location NPDR is classified as mild, moderate or severe NPDR [3]. The central portion of retina which is usu- ally darkest in digital fundus image and rich in cones is called macula (Fig. 1). The macula is accountable for the clear, sharp and detailed vision [3]. The center of macula is called fovea which is responsible for very fine details in the image. When 0169-2607/$ – see front matter © 2014 Elsevier Ireland Ltd. All rights reserved. http://dx.doi.org/10.1016/j.cmpb.2014.01.010
-
Upload
independent -
Category
Documents
-
view
2 -
download
0
Transcript of ARTICLE IN PRESS Automated detection of exudates and macula for grading of diabetic macular edema
C
Af
MD
a
A
R
R
1
A
K
R
D
E
M
C
1
Titecaarldt
m0h
ARTICLE IN PRESSOMM-3746; No. of Pages 12
c o m p u t e r m e t h o d s a n d p r o g r a m s i n b i o m e d i c i n e x x x ( 2 0 1 4 ) xxx–xxx
jo ur nal ho me p ag e: www.int l .e lsev ierhea l t h.com/ journa ls /cmpb
utomated detection of exudates and maculaor grading of diabetic macular edema
. Usman Akram ∗, Anam Tariq, Shoab A. Khan, M. Younus Javedepartment of Computer Engineering College of E&ME, NUST Peshawar Road, Rawalpindi, Pakistan
r t i c l e i n f o
rticle history:
eceived 29 August 2013
eceived in revised form
7 November 2013
ccepted 8 January 2014
eywords:
etinal image analysis
iabetic macular edema
xudates
acula
lassification
a b s t r a c t
Medical systems based on state of the art image processing and pattern recognition tech-
niques are very common now a day. These systems are of prime interest to provide basic
health care facilities to patients and support to doctors. Diabetic macular edema is one of
the retinal abnormalities in which diabetic patient suffers from severe vision loss due to
affected macula. It affects the central vision of the person and causes total blindness in
severe cases. In this article, we propose an intelligent system for detection and grading of
macular edema to assist the ophthalmologists in early and automated detection of the dis-
ease. The proposed system consists of a novel method for accurate detection of macula using
a detailed feature set and Gaussian mixtures model based classifier. We also present a new
hybrid classifier as an ensemble of Gaussian mixture model and support vector machine for
improved exudate detection even in the presence of other bright lesions which eventually
leads to reliable classification of input retinal image in different stages of macular edema.
The statistical analysis and comparative evaluation of proposed system with existing meth-
ods are performed on publicly available standard retinal image databases. The proposed
system has achieved average value of 97.3%, 95.9% and 96.8% for sensitivity, specificity and
on b
macula (Fig. 1). The macula is accountable for the clear, sharp
accuracy respectively
. Introduction
he research in medical image analysis is of great significancen this modern era. The study in this field will greatly benefithe health care systems and society. One of the common dis-ases all over the world is diabetes in which the lack of insulinauses high blood sugar in humans. The long term diabeteslso affects the human retina resulting in a condition knowns diabetic retinopathy (DR) [1]. This condition damages theetinal blood vessels causing them to leak which ultimatelyeads to blindness. The patients of different types of diabetes
Please cite this article in press as: M.U. Akram, et al., Automated detectiComput. Methods Programs Biomed. (2014), http://dx.doi.org/10.1016/j.cm
evelop some form of retinopathy after the twenty years ofhis chronic disease. DR of any stage develops in nearly all of
∗ Corresponding author. Tel.: +92 3336913921.E-mail addresses: [email protected] (M.U. Akram), anam.tariq
[email protected] (M.Y. Javed).169-2607/$ – see front matter © 2014 Elsevier Ireland Ltd. All rights resttp://dx.doi.org/10.1016/j.cmpb.2014.01.010
oth databases.
© 2014 Elsevier Ireland Ltd. All rights reserved.
the patients having diabetes of type 1 and about 60% of thepatients with diabetes of type 2 [1].
DR is normally categorized in different stages such as back-ground or non proliferative DR (NPDR) and proliferative DR(PDR) [2]. NPDR contains initial signs of DR whereas PDR is cat-egorized as advance and severe stage of this retinal disease.In NPDR, different lesions such as microaneurysms, hemor-rhages and exudates appear on the retina and based on theircount and location NPDR is classified as mild, moderate orsevere NPDR [3]. The central portion of retina which is usu-ally darkest in digital fundus image and rich in cones is called
on of exudates and macula for grading of diabetic macular edema,pb.2014.01.010
[email protected] (A. Tariq), [email protected] (S.A. Khan),
and detailed vision [3]. The center of macula is called foveawhich is responsible for very fine details in the image. When
erved.
ARTICLE IN PRESSCOMM-3746; No. of Pages 12
2 c o m p u t e r m e t h o d s a n d p r o g r a m s i n b i o m e d i c i n e x x x ( 2 0 1 4 ) xxx–xxx
f ma ma
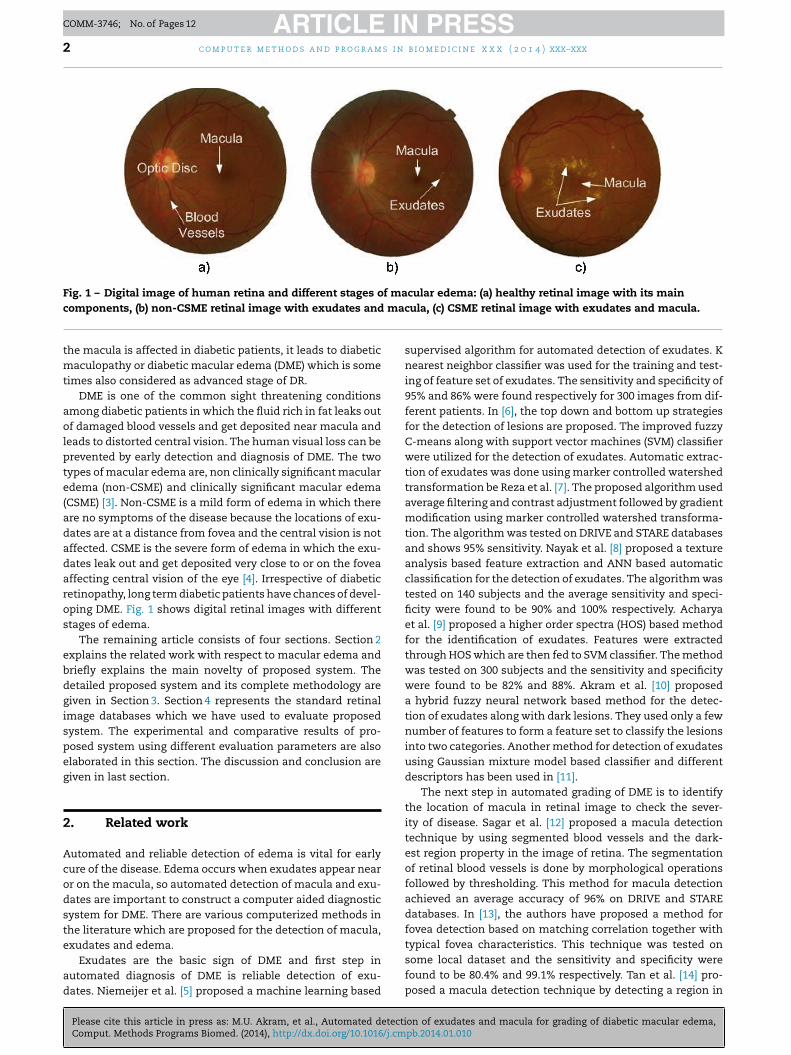
Fig. 1 – Digital image of human retina and different stages ocomponents, (b) non-CSME retinal image with exudates and
the macula is affected in diabetic patients, it leads to diabeticmaculopathy or diabetic macular edema (DME) which is sometimes also considered as advanced stage of DR.
DME is one of the common sight threatening conditionsamong diabetic patients in which the fluid rich in fat leaks outof damaged blood vessels and get deposited near macula andleads to distorted central vision. The human visual loss can beprevented by early detection and diagnosis of DME. The twotypes of macular edema are, non clinically significant macularedema (non-CSME) and clinically significant macular edema(CSME) [3]. Non-CSME is a mild form of edema in which thereare no symptoms of the disease because the locations of exu-dates are at a distance from fovea and the central vision is notaffected. CSME is the severe form of edema in which the exu-dates leak out and get deposited very close to or on the foveaaffecting central vision of the eye [4]. Irrespective of diabeticretinopathy, long term diabetic patients have chances of devel-oping DME. Fig. 1 shows digital retinal images with differentstages of edema.
The remaining article consists of four sections. Section 2explains the related work with respect to macular edema andbriefly explains the main novelty of proposed system. Thedetailed proposed system and its complete methodology aregiven in Section 3. Section 4 represents the standard retinalimage databases which we have used to evaluate proposedsystem. The experimental and comparative results of pro-posed system using different evaluation parameters are alsoelaborated in this section. The discussion and conclusion aregiven in last section.
2. Related work
Automated and reliable detection of edema is vital for earlycure of the disease. Edema occurs when exudates appear nearor on the macula, so automated detection of macula and exu-dates are important to construct a computer aided diagnosticsystem for DME. There are various computerized methods inthe literature which are proposed for the detection of macula,
Please cite this article in press as: M.U. Akram, et al., Automated detectiComput. Methods Programs Biomed. (2014), http://dx.doi.org/10.1016/j.cm
exudates and edema.Exudates are the basic sign of DME and first step in
automated diagnosis of DME is reliable detection of exu-dates. Niemeijer et al. [5] proposed a machine learning based
cular edema: (a) healthy retinal image with its maincula, (c) CSME retinal image with exudates and macula.
supervised algorithm for automated detection of exudates. Knearest neighbor classifier was used for the training and test-ing of feature set of exudates. The sensitivity and specificity of95% and 86% were found respectively for 300 images from dif-ferent patients. In [6], the top down and bottom up strategiesfor the detection of lesions are proposed. The improved fuzzyC-means along with support vector machines (SVM) classifierwere utilized for the detection of exudates. Automatic extrac-tion of exudates was done using marker controlled watershedtransformation be Reza et al. [7]. The proposed algorithm usedaverage filtering and contrast adjustment followed by gradientmodification using marker controlled watershed transforma-tion. The algorithm was tested on DRIVE and STARE databasesand shows 95% sensitivity. Nayak et al. [8] proposed a textureanalysis based feature extraction and ANN based automaticclassification for the detection of exudates. The algorithm wastested on 140 subjects and the average sensitivity and speci-ficity were found to be 90% and 100% respectively. Acharyaet al. [9] proposed a higher order spectra (HOS) based methodfor the identification of exudates. Features were extractedthrough HOS which are then fed to SVM classifier. The methodwas tested on 300 subjects and the sensitivity and specificitywere found to be 82% and 88%. Akram et al. [10] proposeda hybrid fuzzy neural network based method for the detec-tion of exudates along with dark lesions. They used only a fewnumber of features to form a feature set to classify the lesionsinto two categories. Another method for detection of exudatesusing Gaussian mixture model based classifier and differentdescriptors has been used in [11].
The next step in automated grading of DME is to identifythe location of macula in retinal image to check the sever-ity of disease. Sagar et al. [12] proposed a macula detectiontechnique by using segmented blood vessels and the dark-est region property in the image of retina. The segmentationof retinal blood vessels is done by morphological operationsfollowed by thresholding. This method for macula detectionachieved an average accuracy of 96% on DRIVE and STAREdatabases. In [13], the authors have proposed a method forfovea detection based on matching correlation together with
on of exudates and macula for grading of diabetic macular edema,pb.2014.01.010
typical fovea characteristics. This technique was tested onsome local dataset and the sensitivity and specificity werefound to be 80.4% and 99.1% respectively. Tan et al. [14] pro-posed a macula detection technique by detecting a region in
ARTICLE IN PRESSCOMM-3746; No. of Pages 12
i n b
todadabewa
pmtifmtwTtlstDmtsrrlrIpdtlad9afao
dgtepafifdpmrndt
c o m p u t e r m e t h o d s a n d p r o g r a m s
he retina having low pixel intensity. The algorithm made usef the diameter of optic disc computed by ARGALI method toefine region of interest (ROI) for macula. The algorithm has anccuracy of 98.8%. Lu et al. [15] proposed an automated maculaetection using line operator. The authors employed line oper-tor to capture the circular brightness profile which evaluatesrightness variation along different line segments whose ori-ntation gives the location of macula correctly. The methodas tested on DRIVE and STARE databases and achieved an
ccuracy of 100% and 95.4% respectively.A number of systems for detection of edema have also been
roposed by different authors. Shahawy et al. [16] proposed aethod for DME segmentation in fluorescein angiograms. In
his method, 2D Gaussian based macular image was modeledn early time frame and was then subtracted from the late timerame image to enhance the DME regions. Gaussian mixture
odel (GMM) classification algorithm was applied on resul-ant image. In [17], DME was classified using marker controlledatershed transformation for exudates feature extraction.he exudates from the fundus image were extracted and
heir location along with marked macular regions was uti-ized for the classification of macular edema into differenttages. The method was tested on MESSIDOR database andhe sensitivity was found to be 80.9% and specificity of 90.2%.eepak et al. [18] proposed a method for automatic assess-ent of macular edema using supervised learning approach
o capture the global characteristics in fundus images. Diseaseeverity was assessed using a rotational asymmetry met-ic (motion pattern) by examining the symmetry of macularegion. The method was tested on publicly available databasesike diaretdb0, diaretdb1, MESSIDOR and DMED. The accu-acy for the maculopathy detection was found to be 81%.n [19], the automated system for grading of DME was pro-osed. The macula was localized and hard exudates wereetected using clustering and mathematical morphologicalechniques. Based on the location of exudates, the severityevel of DME was defined in a marked region of macula inbnormal fundus image. The method was tested on localataset and the sensitivity and specificity were found to be5.6% and 96.15% respectively. Osareh et al. [20] presented
method for classification of exudative maculopathy usinguzzy C-mean clustering and artificial neural networks. Theuthors have reported sensitivity of 92% and specificity of 82%n some local dataset.
Although a number of methods have been proposed foretection and classification of DME, but still there is a researchap in accurate detection of exudates and macula to improvehe accuracy of overall system for DME. The accuracy ofxisting techniques for exudate detection falls down in theresence of other bright regions and lesions such as optic discnd drusen. This thing awakes the need of a reliable classi-er for accurate detection of exudates even in the presence ofalse regions. In order to improve exudate detection phase, aetailed feature set along with a new hybrid classifier is pro-osed in this article. In similar fashion, most of the existingethods for macula detection generally look for the darkest
Please cite this article in press as: M.U. Akram, et al., Automated detectiComput. Methods Programs Biomed. (2014), http://dx.doi.org/10.1016/j.cm
egion which is at a specific distance from optic disc. There iso such method for macula detection which caters for largeark lesions i.e. hemorrhages to ensure reliable macula detec-ion. In order to deal with this problem, we propose a complete
i o m e d i c i n e x x x ( 2 0 1 4 ) xxx–xxx 3
novel method for classification of macular region by taking inaccount the basic properties of macula and its difference fromrest of dark lesions.
3. Proposed methodology
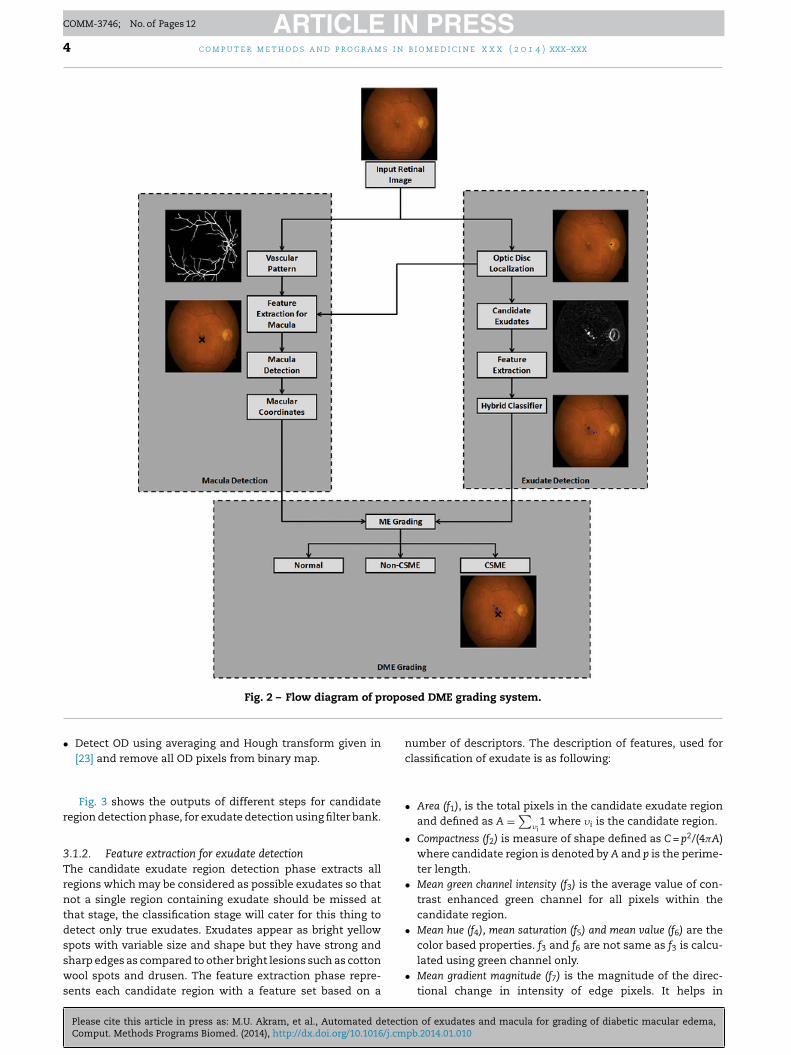
DME is a progressive disease and can cause total blindness ifnot treated in time which requires regular screening of retina.The proposed system consists of three phases i.e. exudatedetection, macula detection and grading of DME. In first phase,the system extracts all possible regions which may be consid-ered as exudates and represents these regions with a numberof features. The proposed method uses a novel hybrid classierto classify these regions as exudates and non exudates. In sec-ond phase, the proposed system performs macula detection. Anovel method for macula detection is proposed which detectsmacula by generating a feature vector and a GMM based clas-sifier. In last phase, the system uses macular coordinates andlocation of exudates to grade the input image in one of thetwo stages of edema i.e. Non CSME and CSME. Fig. 2 shows thecomplete flow diagram of our system for grading of DME.
3.1. Exudate detection
Exudates are the bright lesions which appear on the surface ofretina. Their occurrence is a main threat to vision especiallywhen they occur near or on fovea. The presence of optic disc(OD) and other bright lesions makes it difficult for automatedsystem to detect exudates with high accuracy. The proposedsystem uses a methodology for exudates detection in which itextracts all possible candidate regions which may be consid-ered as exudates, represents the regions with a feature vectorand classifies it using hybrid classifier.
3.1.1. Candidate exudates detectionThe algorithm for candidate region detection for possible exu-dates uses following steps [11].
• Take retinal image as an input and apply morphologicalclosing to remove the effect of blood vessels and darklesions. This gives us a smooth fundus image containingbright regions only.
• Apply adaptive contrast enhancement technique [13] toimprove the contrast of bright regions on retinal surface.
• Create filter bank given in Eq. (1) based on Gabor kerneland convolve it with contrast enhanced image to furtherenhance the bright lesions [21]
GFB = 1√�r�
e−1/2[(d1/�)2+(d2/�)2](d1(cos ̋ + � sin ˝)) (1)
where �, ̋ and r are the standard deviations of Gauss-ian, spatial frequency and aspect ratio respectively. Filterorientation is denoted by � and d1 = x cos � + y sin � and
on of exudates and macula for grading of diabetic macular edema,pb.2014.01.010
d2 = − x sin � + y cos � [21].• Create binary map containing candidate exudate regions
by applying adaptive threshold value T which is calculatedusing Otsu algorithm [22].
ARTICLE IN PRESSCOMM-3746; No. of Pages 12
4 c o m p u t e r m e t h o d s a n d p r o g r a m s i n b i o m e d i c i n e x x x ( 2 0 1 4 ) xxx–xxx
ropo
Fig. 2 – Flow diagram of p• Detect OD using averaging and Hough transform given in[23] and remove all OD pixels from binary map.
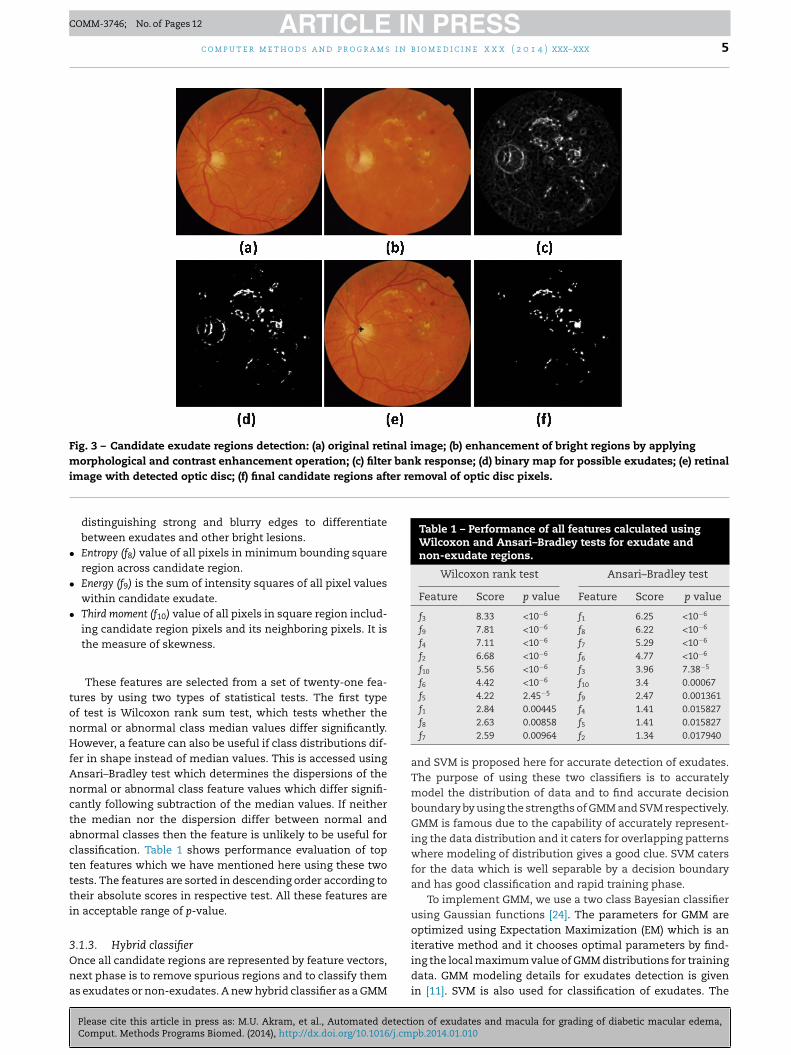
Fig. 3 shows the outputs of different steps for candidateregion detection phase, for exudate detection using filter bank.
3.1.2. Feature extraction for exudate detectionThe candidate exudate region detection phase extracts allregions which may be considered as possible exudates so thatnot a single region containing exudate should be missed atthat stage, the classification stage will cater for this thing todetect only true exudates. Exudates appear as bright yellow
Please cite this article in press as: M.U. Akram, et al., Automated detectiComput. Methods Programs Biomed. (2014), http://dx.doi.org/10.1016/j.cm
spots with variable size and shape but they have strong andsharp edges as compared to other bright lesions such as cottonwool spots and drusen. The feature extraction phase repre-sents each candidate region with a feature set based on a
sed DME grading system.
number of descriptors. The description of features, used forclassification of exudate is as following:
• Area (f1), is the total pixels in the candidate exudate regionand defined as A =
∑�i
1 where �i is the candidate region.
• Compactness (f2) is measure of shape defined as C = p2/(4�A)where candidate region is denoted by A and p is the perime-ter length.
• Mean green channel intensity (f3) is the average value of con-trast enhanced green channel for all pixels within thecandidate region.
• Mean hue (f4), mean saturation (f5) and mean value (f6) are the
on of exudates and macula for grading of diabetic macular edema,pb.2014.01.010
color based properties. f3 and f6 are not same as f3 is calcu-lated using green channel only.
• Mean gradient magnitude (f7) is the magnitude of the direc-tional change in intensity of edge pixels. It helps in
ARTICLE IN PRESSCOMM-3746; No. of Pages 12
c o m p u t e r m e t h o d s a n d p r o g r a m s i n b i o m e d i c i n e x x x ( 2 0 1 4 ) xxx–xxx 5
Fig. 3 – Candidate exudate regions detection: (a) original retinal image; (b) enhancement of bright regions by applyingmorphological and contrast enhancement operation; (c) filter bank response; (d) binary map for possible exudates; (e) retinali er removal of optic disc pixels.
•
•
•
tonHfAnctacttti
3Ona
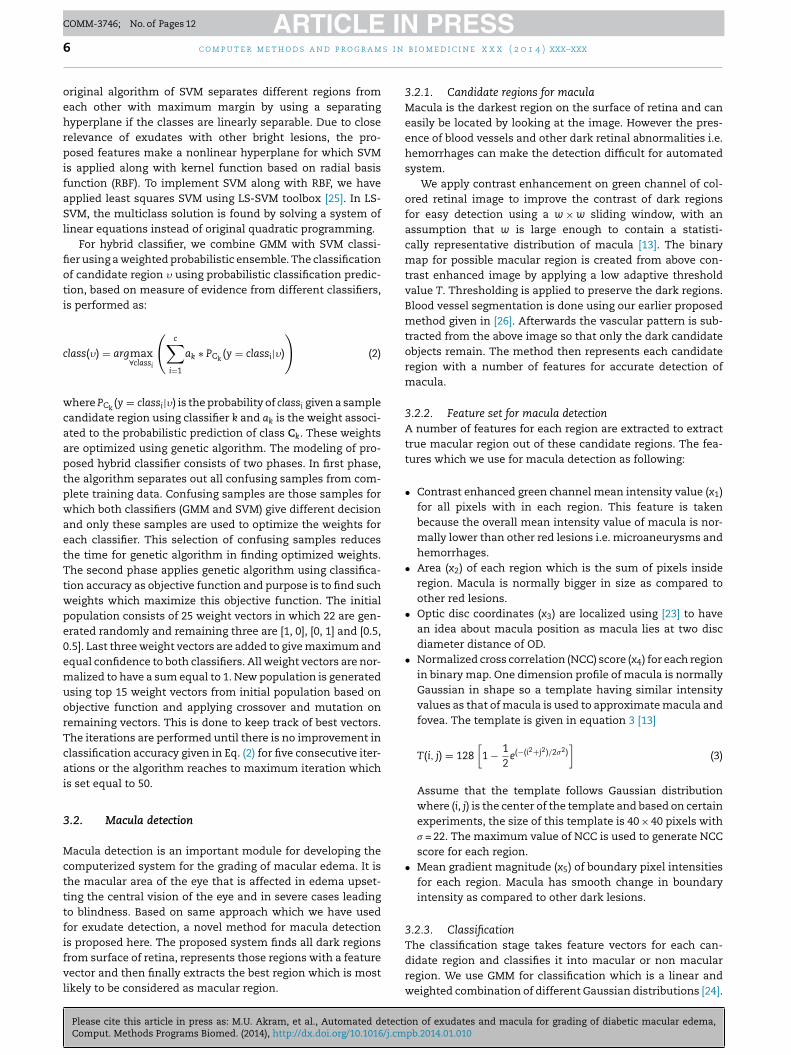
Table 1 – Performance of all features calculated usingWilcoxon and Ansari–Bradley tests for exudate andnon-exudate regions.
Wilcoxon rank test Ansari–Bradley test
Feature Score p value Feature Score p value
f3 8.33 <10−6 f1 6.25 <10−6
f9 7.81 <10−6 f8 6.22 <10−6
f4 7.11 <10−6 f7 5.29 <10−6
f2 6.68 <10−6 f6 4.77 <10−6
f10 5.56 <10−6 f3 3.96 7.38−5
f6 4.42 <10−6 f10 3.4 0.00067f5 4.22 2.45−5 f9 2.47 0.001361
mage with detected optic disc; (f) final candidate regions aft
distinguishing strong and blurry edges to differentiatebetween exudates and other bright lesions.
Entropy (f8) value of all pixels in minimum bounding squareregion across candidate region.
Energy (f9) is the sum of intensity squares of all pixel valueswithin candidate exudate.
Third moment (f10) value of all pixels in square region includ-ing candidate region pixels and its neighboring pixels. It isthe measure of skewness.
These features are selected from a set of twenty-one fea-ures by using two types of statistical tests. The first typef test is Wilcoxon rank sum test, which tests whether theormal or abnormal class median values differ significantly.owever, a feature can also be useful if class distributions dif-
er in shape instead of median values. This is accessed usingnsari–Bradley test which determines the dispersions of theormal or abnormal class feature values which differ signifi-antly following subtraction of the median values. If neitherhe median nor the dispersion differ between normal andbnormal classes then the feature is unlikely to be useful forlassification. Table 1 shows performance evaluation of topen features which we have mentioned here using these twoests. The features are sorted in descending order according toheir absolute scores in respective test. All these features aren acceptable range of p-value.
Please cite this article in press as: M.U. Akram, et al., Automated detectiComput. Methods Programs Biomed. (2014), http://dx.doi.org/10.1016/j.cm
.1.3. Hybrid classifiernce all candidate regions are represented by feature vectors,ext phase is to remove spurious regions and to classify thems exudates or non-exudates. A new hybrid classifier as a GMM
f1 2.84 0.00445 f4 1.41 0.015827f8 2.63 0.00858 f5 1.41 0.015827f7 2.59 0.00964 f2 1.34 0.017940
and SVM is proposed here for accurate detection of exudates.The purpose of using these two classifiers is to accuratelymodel the distribution of data and to find accurate decisionboundary by using the strengths of GMM and SVM respectively.GMM is famous due to the capability of accurately represent-ing the data distribution and it caters for overlapping patternswhere modeling of distribution gives a good clue. SVM catersfor the data which is well separable by a decision boundaryand has good classification and rapid training phase.
To implement GMM, we use a two class Bayesian classifierusing Gaussian functions [24]. The parameters for GMM areoptimized using Expectation Maximization (EM) which is an
on of exudates and macula for grading of diabetic macular edema,pb.2014.01.010
iterative method and it chooses optimal parameters by find-ing the local maximum value of GMM distributions for trainingdata. GMM modeling details for exudates detection is givenin [11]. SVM is also used for classification of exudates. The
ARTICLE IN PRESSCOMM-3746; No. of Pages 12
s i n
6 c o m p u t e r m e t h o d s a n d p r o g r a moriginal algorithm of SVM separates different regions fromeach other with maximum margin by using a separatinghyperplane if the classes are linearly separable. Due to closerelevance of exudates with other bright lesions, the pro-posed features make a nonlinear hyperplane for which SVMis applied along with kernel function based on radial basisfunction (RBF). To implement SVM along with RBF, we haveapplied least squares SVM using LS-SVM toolbox [25]. In LS-SVM, the multiclass solution is found by solving a system oflinear equations instead of original quadratic programming.
For hybrid classifier, we combine GMM with SVM classi-fier using a weighted probabilistic ensemble. The classificationof candidate region � using probabilistic classification predic-tion, based on measure of evidence from different classifiers,is performed as:
class(�) = argmax∀classi
(c∑
i=1
ak ∗ PCk(y = classi|�)
)(2)
where PCk(y = classi|�) is the probability of classi given a sample
candidate region using classifier k and ak is the weight associ-ated to the probabilistic prediction of class Ck. These weightsare optimized using genetic algorithm. The modeling of pro-posed hybrid classifier consists of two phases. In first phase,the algorithm separates out all confusing samples from com-plete training data. Confusing samples are those samples forwhich both classifiers (GMM and SVM) give different decisionand only these samples are used to optimize the weights foreach classifier. This selection of confusing samples reducesthe time for genetic algorithm in finding optimized weights.The second phase applies genetic algorithm using classifica-tion accuracy as objective function and purpose is to find suchweights which maximize this objective function. The initialpopulation consists of 25 weight vectors in which 22 are gen-erated randomly and remaining three are [1, 0], [0, 1] and [0.5,0.5]. Last three weight vectors are added to give maximum andequal confidence to both classifiers. All weight vectors are nor-malized to have a sum equal to 1. New population is generatedusing top 15 weight vectors from initial population based onobjective function and applying crossover and mutation onremaining vectors. This is done to keep track of best vectors.The iterations are performed until there is no improvement inclassification accuracy given in Eq. (2) for five consecutive iter-ations or the algorithm reaches to maximum iteration whichis set equal to 50.
3.2. Macula detection
Macula detection is an important module for developing thecomputerized system for the grading of macular edema. It isthe macular area of the eye that is affected in edema upset-ting the central vision of the eye and in severe cases leadingto blindness. Based on same approach which we have usedfor exudate detection, a novel method for macula detection
Please cite this article in press as: M.U. Akram, et al., Automated detectiComput. Methods Programs Biomed. (2014), http://dx.doi.org/10.1016/j.cm
is proposed here. The proposed system finds all dark regionsfrom surface of retina, represents those regions with a featurevector and then finally extracts the best region which is mostlikely to be considered as macular region.
b i o m e d i c i n e x x x ( 2 0 1 4 ) xxx–xxx
3.2.1. Candidate regions for maculaMacula is the darkest region on the surface of retina and caneasily be located by looking at the image. However the pres-ence of blood vessels and other dark retinal abnormalities i.e.hemorrhages can make the detection difficult for automatedsystem.
We apply contrast enhancement on green channel of col-ored retinal image to improve the contrast of dark regionsfor easy detection using a w × w sliding window, with anassumption that w is large enough to contain a statisti-cally representative distribution of macula [13]. The binarymap for possible macular region is created from above con-trast enhanced image by applying a low adaptive thresholdvalue T. Thresholding is applied to preserve the dark regions.Blood vessel segmentation is done using our earlier proposedmethod given in [26]. Afterwards the vascular pattern is sub-tracted from the above image so that only the dark candidateobjects remain. The method then represents each candidateregion with a number of features for accurate detection ofmacula.
3.2.2. Feature set for macula detectionA number of features for each region are extracted to extracttrue macular region out of these candidate regions. The fea-tures which we use for macula detection as following:
• Contrast enhanced green channel mean intensity value (x1)for all pixels with in each region. This feature is takenbecause the overall mean intensity value of macula is nor-mally lower than other red lesions i.e. microaneurysms andhemorrhages.
• Area (x2) of each region which is the sum of pixels insideregion. Macula is normally bigger in size as compared toother red lesions.
• Optic disc coordinates (x3) are localized using [23] to havean idea about macula position as macula lies at two discdiameter distance of OD.
• Normalized cross correlation (NCC) score (x4) for each regionin binary map. One dimension profile of macula is normallyGaussian in shape so a template having similar intensityvalues as that of macula is used to approximate macula andfovea. The template is given in equation 3 [13]
T(i, j) = 128[
1 − 12
e(−(i2+j2)/2�2)]
(3)
Assume that the template follows Gaussian distributionwhere (i, j) is the center of the template and based on certainexperiments, the size of this template is 40 × 40 pixels with� = 22. The maximum value of NCC is used to generate NCCscore for each region.
• Mean gradient magnitude (x5) of boundary pixel intensitiesfor each region. Macula has smooth change in boundaryintensity as compared to other dark lesions.
3.2.3. Classification
on of exudates and macula for grading of diabetic macular edema,pb.2014.01.010
The classification stage takes feature vectors for each can-didate region and classifies it into macular or non macularregion. We use GMM for classification which is a linear andweighted combination of different Gaussian distributions [24].
ARTICLE IN PRESSCOMM-3746; No. of Pages 12
i n b i o m e d i c i n e x x x ( 2 0 1 4 ) xxx–xxx 7
TtamfiE�
twcb
3
OcnbT
Table 2 – Conditions for grading of macular edema.
Grade Condition Class
0 No exudate present Healthy1 A few exudates present and distance
between Nonmacula and exudates > oneCSME
Fr
c o m p u t e r m e t h o d s a n d p r o g r a m s
he feature vectors consisting of five features are passed tohe GMM. We define two classes such as C1 = {Macular Region}nd C2 = {Non Macular Region}. In our proposed system, GMMakes decision using Bayesian decision rule. We apply EM to
nd the best value � which is number of mixtures in GMM. TheM is an iterative method which chooses the optimal value of
by finding the local maximum value of GMM likelihood forraining data. EM finds such value of � for which mixture of �
eighted Gaussian can represent the data accurately. In ourase the value of � is 3. GMM is used here for classificationecause the feature space is well distributed in this case.
.3. Grading of macular edema
nce the classifiers have detected all exudates and macular
Please cite this article in press as: M.U. Akram, et al., Automated detectiComput. Methods Programs Biomed. (2014), http://dx.doi.org/10.1016/j.cm
oordinates, the system grades the input image as healthy,on CSME and CSME based on the location and distanceetween macula and exudates if present in retinal image.able 2 shows the three conditions which have been used to
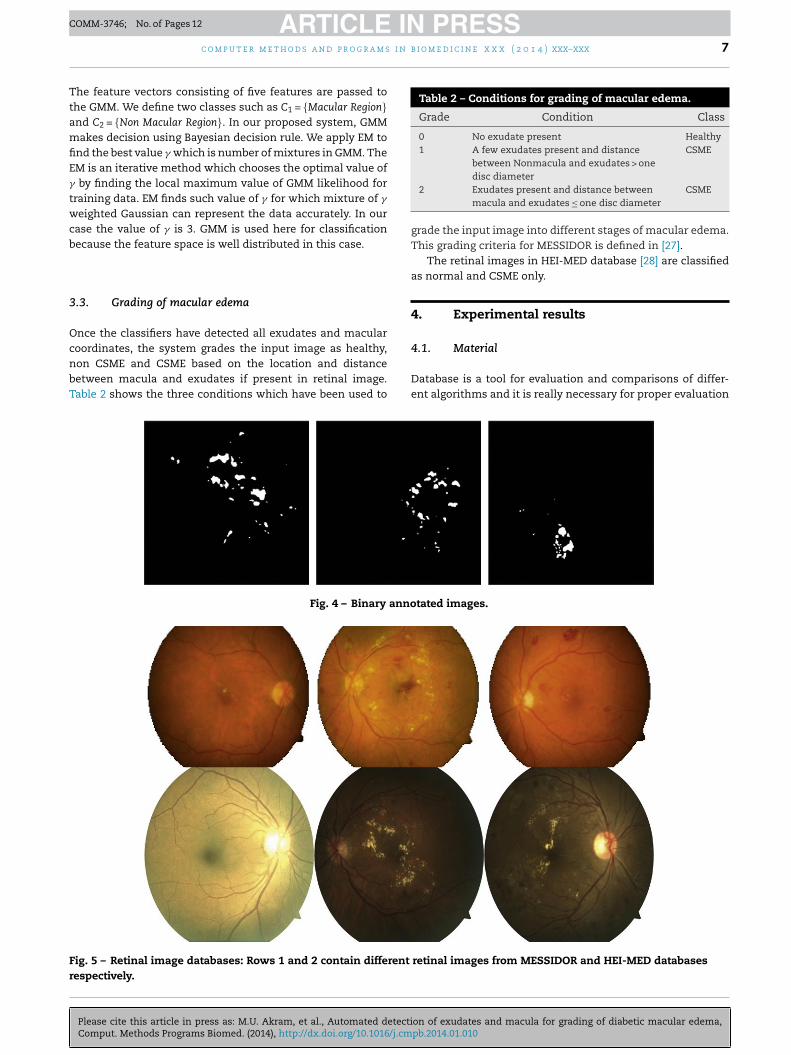
Fig. 4 – Binary anno
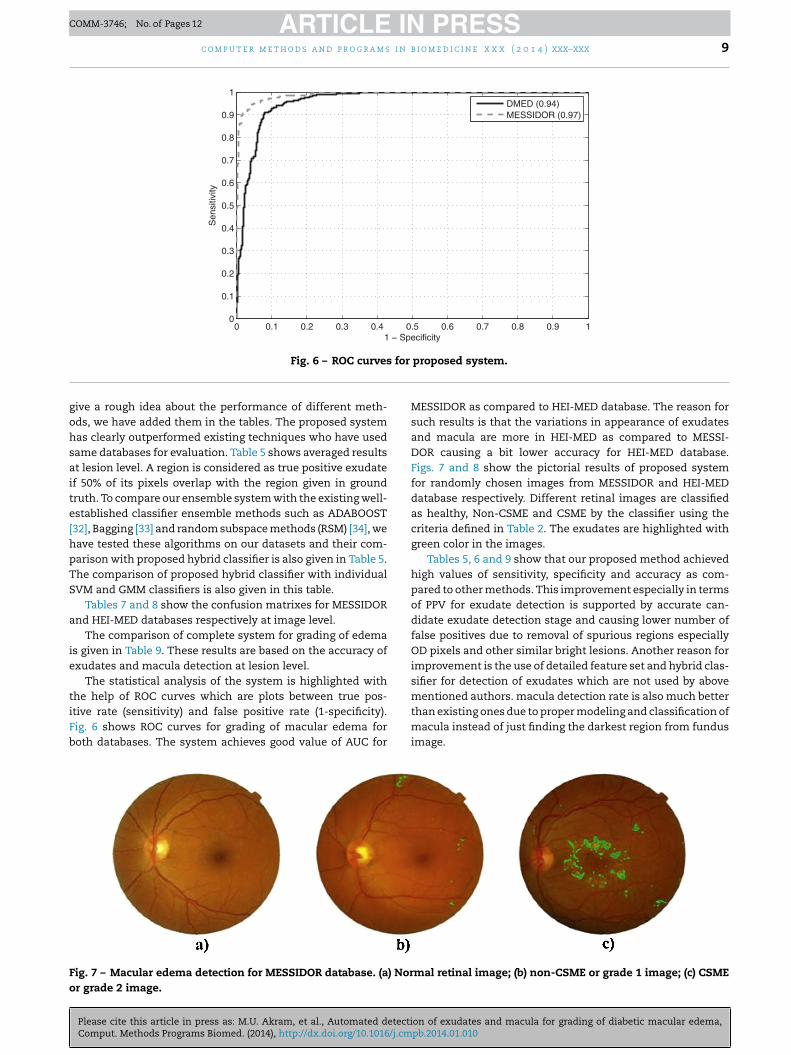
ig. 5 – Retinal image databases: Rows 1 and 2 contain different
espectively.
disc diameter2 Exudates present and distance between
macula and exudates ≤ one disc diameterCSME
grade the input image into different stages of macular edema.This grading criteria for MESSIDOR is defined in [27].
The retinal images in HEI-MED database [28] are classifiedas normal and CSME only.
4. Experimental results
on of exudates and macula for grading of diabetic macular edema,pb.2014.01.010
4.1. Material
Database is a tool for evaluation and comparisons of differ-ent algorithms and it is really necessary for proper evaluation
tated images.
retinal images from MESSIDOR and HEI-MED databases

ARTICLE IN PRESSCOMM-3746; No. of Pages 12
8 c o m p u t e r m e t h o d s a n d p r o g r a m s i n b i o m e d i c i n e x x x ( 2 0 1 4 ) xxx–xxx
Table 3 – Database description related to edema.
Database Images Normal Non-CSME CSME
MESSIDOR 1200 971 75 154
Table 5 – Performance comparison of proposed systemwith existing systems for exudate detection.
Method Sen Spec PPV Acc
Ahmed et al. [7] 94.90 100 92.01 –Akram et al. [11] 96.36 98.25 97.45 97.59Sinthanayothin et al. [13] 88.5 99.7 – –Walter et al. [29] 92.74 100 92.39 –Osareh et al. [30] 93 94.1 – 93.4Haniza et al. [31] 94.25 99.2 78.65Adaboost – – – 93.45Bagging – – – 96.58RSM – – – 96.13GMM 96.04 96.73 95.19 95.81SVM 95.27 94.01 94.31 94.59Proposed method 98.76 99.02 98.63 98.72
Table 6 – Performance evaluation of proposed system ascompared to other methods for detection of macula.
Method Database Images Acc (%)
Tobin et al. [35] MESSIDOR 1200 76Chin et al. [36] MESSIDOR 1200 72.9Proposed method MESSIDOR 1200 97.2
HEIMED 169 98.22
Table 7 – Confusion matrix for MESSIDOR database.
Normal Non-CSME CSME
HEIMED 169 115 – 54
Total 1369 1086 75 208
of medical image processing related algorithms. In order toevaluate algorithms for automated screening and diagnosisof retinal disease, some of benchmark databases are publiclyavailable. The purposes of these databases are to check thevalidity systems and to compare the results with existing tech-niques. We use two main DME databases for evaluation andcomparison of proposed system.
The MESSIDOR is a database which has been establishedto facilitate computer aided DR lesions detection [27]. Thedatabase is collected using TopCon TRC NW6 Non-Mydriaticfundus camera with 45◦ FOV and resolutions of 1440 × 960,2240 × 1488 and 2304 × 1536 with 8 bits per color plane. It con-tains total 1200 images which are divided into three sets of 400images and each set is further divided into 4 parts to facilitatethorough testing. Each set contains an Excel file with medicalfindings which can be use for testing purposes. The imagesare graded into different categories depending on the positionof lesions.
One of the dataset for especially checking macular edemais HEI-MED (Hamilton Eye Institute Macular Edema Dataset)[28]. This database consists of 169 images of high quality.115 images from this database are considered as normal reti-nal images and 54 retinal images are diagnosed with diabeticmacular edema. The images are acquired from patients of dif-ferent ethnicity and age group. Therefore a large variabilityis observed across images in color and tissue pigmentationwhich make it a difficult database for automated systems.
The problem with these databases are that they only con-tain labels at image level for DME based on the criteria given inTable 2. In order to perform detailed evaluation and to checkthe overall confidence of proposed system for exudate detec-tion, lesion region level information is gathered with the helpof two ophthalmologists and an annotation tool designed inMATLAB. The ophthalmologists mark all exudates for com-plete datasets and the annotation tool generated a binaryimage for each input image highlighting exudates with 1 andbackground with 0. This thing helps us a lot in detailed mod-eling of hybrid classifier at lesion level. Fig. 4 shows the binaryannotated images for some randomly selected images fromboth databases.
Fig. 5 shows randomly selected images form thesedatabases which we have used to report the validity of pro-
Please cite this article in press as: M.U. Akram, et al., Automated detectiComput. Methods Programs Biomed. (2014), http://dx.doi.org/10.1016/j.cm
posed system. We have used total 1369 images for evaluationand based on rules given in Table 2, the detailed descriptionabout all databases is given in Table 3.
Table 4 – Best, worst and averaged results for proposedexudate detection method.
Database Best Acc Worst Acc Mean Acc with SD
MESSIDOR 100 97.37 99.31 ± 1.1003HEIMED 99.56 96.49 98.13 ± 1.0952
Normal 968 3 0Non-CSME 3 65 7CSME 0 6 148
4.2. Results
The detailed evaluation of proposed system is performedusing different statistical evaluation parameters such as sen-sitivity (sen), specificity (spec), positive predictive value (PPV),accuracy (acc) and area under receiver operating characteris-tics (ROC) curves (AUC). A total of 1369 retinal images fromtwo different databases with different resolution, lesions andwith a lot of variations are used. The evaluation of proposedsystem is performed for exudate extraction, macula detec-tion and grading of macular edema. The results for each levelare also compared with existing methods for the validity ofproposed system. The modeling of classifiers has been doneat lesion level using randomly selected 70% of data as train-ing and remaining 30% data as testing. The experiments arerepeated 10 times and their average results are given. Table 4shows best, worst and averaged accuracies with standard devi-ation (SD) for exudate detection.
Tables 5 and 6 show the comparison of our proposed sys-tem with existing methods for exudates and macula detection
on of exudates and macula for grading of diabetic macular edema,pb.2014.01.010
respectively at lesion level. It is important to highlight herethat not all the methods for exudate detection have usedsame databases in all these comparison tables but still to
Table 8 – Confusion matrix for HEI-MED database.
Normal CSME
Normal 110 5CSME 3 51
ARTICLE IN PRESSCOMM-3746; No. of Pages 12
c o m p u t e r m e t h o d s a n d p r o g r a m s i n b i o m e d i c i n e x x x ( 2 0 1 4 ) xxx–xxx 9
0 0. 1 0. 2 0. 3 0. 4 0. 5 0. 6 0. 7 0. 8 0. 9 10
0.1
0.2
0.3
0.4
0.5
0.6
0.7
0.8
0.9
1
1 − Specificity
Sen
sitiv
ity
DMED (0.94)MESSIDOR (0.97)
for
gohsaite[hpTS
a
ie
tiFb
Fo
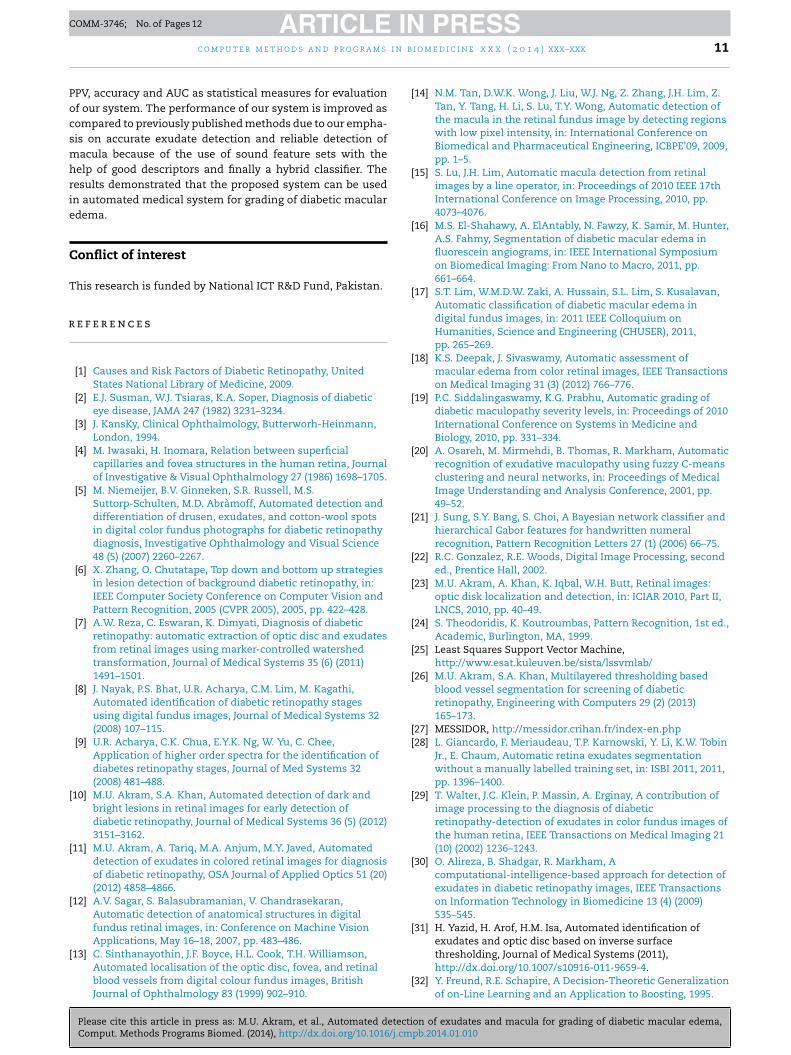
Fig. 6 – ROC curves
ive a rough idea about the performance of different meth-ds, we have added them in the tables. The proposed systemas clearly outperformed existing techniques who have usedame databases for evaluation. Table 5 shows averaged resultst lesion level. A region is considered as true positive exudatef 50% of its pixels overlap with the region given in groundruth. To compare our ensemble system with the existing well-stablished classifier ensemble methods such as ADABOOST32], Bagging [33] and random subspace methods (RSM) [34], weave tested these algorithms on our datasets and their com-arison with proposed hybrid classifier is also given in Table 5.he comparison of proposed hybrid classifier with individualVM and GMM classifiers is also given in this table.
Tables 7 and 8 show the confusion matrixes for MESSIDORnd HEI-MED databases respectively at image level.
The comparison of complete system for grading of edemas given in Table 9. These results are based on the accuracy ofxudates and macula detection at lesion level.
The statistical analysis of the system is highlighted withhe help of ROC curves which are plots between true pos-
Please cite this article in press as: M.U. Akram, et al., Automated detectiComput. Methods Programs Biomed. (2014), http://dx.doi.org/10.1016/j.cm
tive rate (sensitivity) and false positive rate (1-specificity).ig. 6 shows ROC curves for grading of macular edema foroth databases. The system achieves good value of AUC for
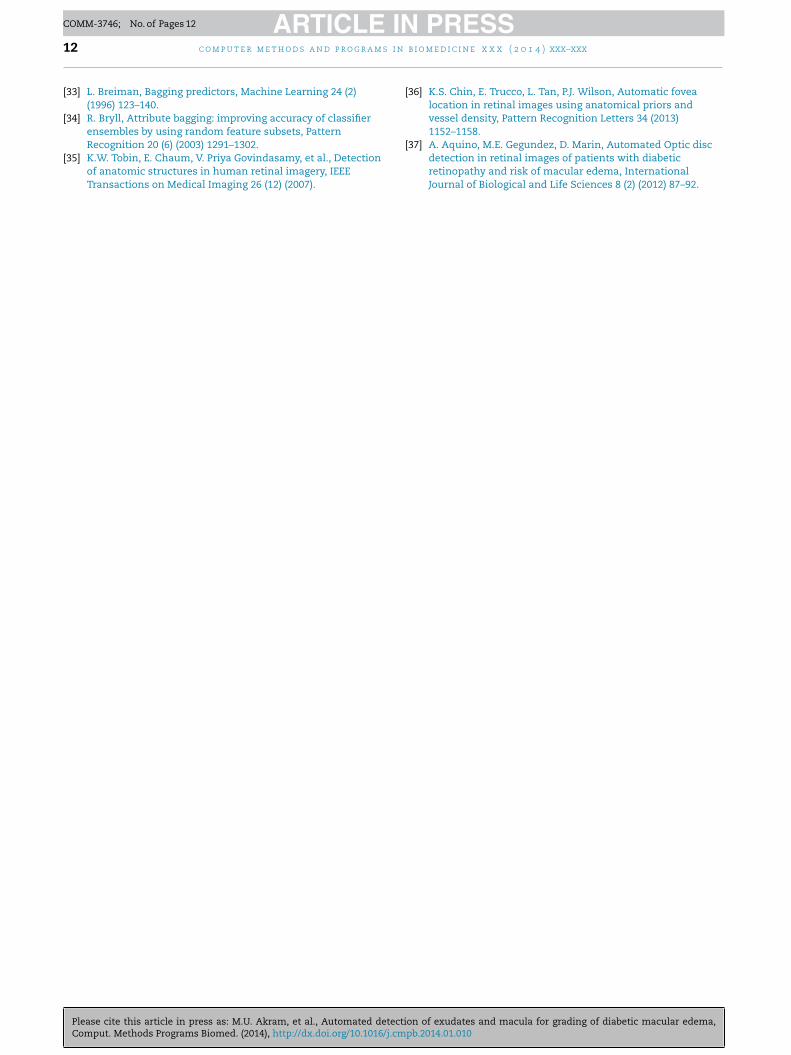
ig. 7 – Macular edema detection for MESSIDOR database. (a) Norr grade 2 image.
proposed system.
MESSIDOR as compared to HEI-MED database. The reason forsuch results is that the variations in appearance of exudatesand macula are more in HEI-MED as compared to MESSI-DOR causing a bit lower accuracy for HEI-MED database.Figs. 7 and 8 show the pictorial results of proposed systemfor randomly chosen images from MESSIDOR and HEI-MEDdatabase respectively. Different retinal images are classifiedas healthy, Non-CSME and CSME by the classifier using thecriteria defined in Table 2. The exudates are highlighted withgreen color in the images.
Tables 5, 6 and 9 show that our proposed method achievedhigh values of sensitivity, specificity and accuracy as com-pared to other methods. This improvement especially in termsof PPV for exudate detection is supported by accurate can-didate exudate detection stage and causing lower number offalse positives due to removal of spurious regions especiallyOD pixels and other similar bright lesions. Another reason forimprovement is the use of detailed feature set and hybrid clas-sifier for detection of exudates which are not used by abovementioned authors. macula detection rate is also much better
on of exudates and macula for grading of diabetic macular edema,pb.2014.01.010
than existing ones due to proper modeling and classification ofmacula instead of just finding the darkest region from fundusimage.
mal retinal image; (b) non-CSME or grade 1 image; (c) CSME

ARTICLE IN PRESSCOMM-3746; No. of Pages 12
10 c o m p u t e r m e t h o d s a n d p r o g r a m s i n b i o m e d i c i n e x x x ( 2 0 1 4 ) xxx–xxx
Table 9 – Comparison of our proposed method with existing techniques for grading of macular edema.
Author Database Sensitivity (%) Specificity (%) Accuracy (%) AUC
Lim et al. [17] MESSIDOR 80.9 90.2 – –
Deepak et al. [18] MESSIDOR 95 90 – –HEI-MED 100 74 – –
Aquino et al. [37] MESSIDOR – – 96.51 –
Giancardo et al. [28] MESSIDOR – – – 0.89HEI-MED – – – 0.93
Proposed method MESSIDOR 98.6 97.2 98.4 0.97HEI-MED 96.1 94.7 95.2 0.94
abas
Fig. 8 – Macular edema detection for HEI-MED dat5. Conclusion
Diabetic macular edema is an advanced level of retinal abnor-malities which may be present in diabetes sufferers. This maycause total blindness if not detected and treated in time. Inthis article, we presented a computerized medical system forautomated grading of macular edema. The proposed systemperformed retinal image analysis for grading of edema usinghybrid classifier. Our proposed system consisted of exudate
Please cite this article in press as: M.U. Akram, et al., Automated detectiComput. Methods Programs Biomed. (2014), http://dx.doi.org/10.1016/j.cm
detection followed by macula detection. We presented a novelmethod for macula detection using feature set and Gaussianmixture model. The exudate detection stage created a binary
e. 1st col.: normal retinal images; 2nd col.: CSME.
map of candidate regions using filter bank. A detailed featureset based on properties of exudates is created for each can-didate region and hybrid classifier detected all true exudateregions. Finally, using coordinates of macula and the distanceof exudates from macula, the system graded the input imageinto three categories i.e. healthy, Non CSME and CSME.
The main contributions of proposed system are devel-opment of novel method for macula detection even in thepresence of a large number of lesions and use of hybrid classi-fier to improve the accuracy of exudate detection in presence
on of exudates and macula for grading of diabetic macular edema,pb.2014.01.010
of other bright lesions. The evaluation of proposed system isdone using two standard retinal image databases for DME i.e.MESSIDOR and HEI-MED. We have used sensitivity, specificity,
ARTICLE IN PRESSCOMM-3746; No. of Pages 12
i n b
Pocsmhrie
C
T
r
c o m p u t e r m e t h o d s a n d p r o g r a m s
PV, accuracy and AUC as statistical measures for evaluationf our system. The performance of our system is improved asompared to previously published methods due to our empha-is on accurate exudate detection and reliable detection ofacula because of the use of sound feature sets with the
elp of good descriptors and finally a hybrid classifier. Theesults demonstrated that the proposed system can be usedn automated medical system for grading of diabetic maculardema.
onflict of interest
his research is funded by National ICT R&D Fund, Pakistan.
e f e r e n c e s
[1] Causes and Risk Factors of Diabetic Retinopathy, UnitedStates National Library of Medicine, 2009.
[2] E.J. Susman, W.J. Tsiaras, K.A. Soper, Diagnosis of diabeticeye disease, JAMA 247 (1982) 3231–3234.
[3] J. KansKy, Clinical Ophthalmology, Butterworh-Heinmann,London, 1994.
[4] M. Iwasaki, H. Inomara, Relation between superficialcapillaries and fovea structures in the human retina, Journalof Investigative & Visual Ophthalmology 27 (1986) 1698–1705.
[5] M. Niemeijer, B.V. Ginneken, S.R. Russell, M.S.Suttorp-Schulten, M.D. Abràmoff, Automated detection anddifferentiation of drusen, exudates, and cotton-wool spotsin digital color fundus photographs for diabetic retinopathydiagnosis, Investigative Ophthalmology and Visual Science48 (5) (2007) 2260–2267.
[6] X. Zhang, O. Chutatape, Top down and bottom up strategiesin lesion detection of background diabetic retinopathy, in:IEEE Computer Society Conference on Computer Vision andPattern Recognition, 2005 (CVPR 2005), 2005, pp. 422–428.
[7] A.W. Reza, C. Eswaran, K. Dimyati, Diagnosis of diabeticretinopathy: automatic extraction of optic disc and exudatesfrom retinal images using marker-controlled watershedtransformation, Journal of Medical Systems 35 (6) (2011)1491–1501.
[8] J. Nayak, P.S. Bhat, U.R. Acharya, C.M. Lim, M. Kagathi,Automated identification of diabetic retinopathy stagesusing digital fundus images, Journal of Medical Systems 32(2008) 107–115.
[9] U.R. Acharya, C.K. Chua, E.Y.K. Ng, W. Yu, C. Chee,Application of higher order spectra for the identification ofdiabetes retinopathy stages, Journal of Med Systems 32(2008) 481–488.
[10] M.U. Akram, S.A. Khan, Automated detection of dark andbright lesions in retinal images for early detection ofdiabetic retinopathy, Journal of Medical Systems 36 (5) (2012)3151–3162.
[11] M.U. Akram, A. Tariq, M.A. Anjum, M.Y. Javed, Automateddetection of exudates in colored retinal images for diagnosisof diabetic retinopathy, OSA Journal of Applied Optics 51 (20)(2012) 4858–4866.
[12] A.V. Sagar, S. Balasubramanian, V. Chandrasekaran,Automatic detection of anatomical structures in digitalfundus retinal images, in: Conference on Machine VisionApplications, May 16–18, 2007, pp. 483–486.
Please cite this article in press as: M.U. Akram, et al., Automated detectiComput. Methods Programs Biomed. (2014), http://dx.doi.org/10.1016/j.cm
[13] C. Sinthanayothin, J.F. Boyce, H.L. Cook, T.H. Williamson,Automated localisation of the optic disc, fovea, and retinalblood vessels from digital colour fundus images, BritishJournal of Ophthalmology 83 (1999) 902–910.
i o m e d i c i n e x x x ( 2 0 1 4 ) xxx–xxx 11
[14] N.M. Tan, D.W.K. Wong, J. Liu, W.J. Ng, Z. Zhang, J.H. Lim, Z.Tan, Y. Tang, H. Li, S. Lu, T.Y. Wong, Automatic detection ofthe macula in the retinal fundus image by detecting regionswith low pixel intensity, in: International Conference onBiomedical and Pharmaceutical Engineering, ICBPE’09, 2009,pp. 1–5.
[15] S. Lu, J.H. Lim, Automatic macula detection from retinalimages by a line operator, in: Proceedings of 2010 IEEE 17thInternational Conference on Image Processing, 2010, pp.4073–4076.
[16] M.S. El-Shahawy, A. ElAntably, N. Fawzy, K. Samir, M. Hunter,A.S. Fahmy, Segmentation of diabetic macular edema influorescein angiograms, in: IEEE International Symposiumon Biomedical Imaging: From Nano to Macro, 2011, pp.661–664.
[17] S.T. Lim, W.M.D.W. Zaki, A. Hussain, S.L. Lim, S. Kusalavan,Automatic classification of diabetic macular edema indigital fundus images, in: 2011 IEEE Colloquium onHumanities, Science and Engineering (CHUSER), 2011,pp. 265–269.
[18] K.S. Deepak, J. Sivaswamy, Automatic assessment ofmacular edema from color retinal images, IEEE Transactionson Medical Imaging 31 (3) (2012) 766–776.
[19] P.C. Siddalingaswamy, K.G. Prabhu, Automatic grading ofdiabetic maculopathy severity levels, in: Proceedings of 2010International Conference on Systems in Medicine andBiology, 2010, pp. 331–334.
[20] A. Osareh, M. Mirmehdi, B. Thomas, R. Markham, Automaticrecognition of exudative maculopathy using fuzzy C-meansclustering and neural networks, in: Proceedings of MedicalImage Understanding and Analysis Conference, 2001, pp.49–52.
[21] J. Sung, S.Y. Bang, S. Choi, A Bayesian network classifier andhierarchical Gabor features for handwritten numeralrecognition, Pattern Recognition Letters 27 (1) (2006) 66–75.
[22] R.C. Gonzalez, R.E. Woods, Digital Image Processing, seconded., Prentice Hall, 2002.
[23] M.U. Akram, A. Khan, K. Iqbal, W.H. Butt, Retinal images:optic disk localization and detection, in: ICIAR 2010, Part II,LNCS, 2010, pp. 40–49.
[24] S. Theodoridis, K. Koutroumbas, Pattern Recognition, 1st ed.,Academic, Burlington, MA, 1999.
[25] Least Squares Support Vector Machine,http://www.esat.kuleuven.be/sista/lssvmlab/
[26] M.U. Akram, S.A. Khan, Multilayered thresholding basedblood vessel segmentation for screening of diabeticretinopathy, Engineering with Computers 29 (2) (2013)165–173.
[27] MESSIDOR, http://messidor.crihan.fr/index-en.php[28] L. Giancardo, F. Meriaudeau, T.P. Karnowski, Y. Li, K.W. Tobin
Jr., E. Chaum, Automatic retina exudates segmentationwithout a manually labelled training set, in: ISBI 2011, 2011,pp. 1396–1400.
[29] T. Walter, J.C. Klein, P. Massin, A. Erginay, A contribution ofimage processing to the diagnosis of diabeticretinopathy-detection of exudates in color fundus images ofthe human retina, IEEE Transactions on Medical Imaging 21(10) (2002) 1236–1243.
[30] O. Alireza, B. Shadgar, R. Markham, Acomputational-intelligence-based approach for detection ofexudates in diabetic retinopathy images, IEEE Transactionson Information Technology in Biomedicine 13 (4) (2009)535–545.
[31] H. Yazid, H. Arof, H.M. Isa, Automated identification ofexudates and optic disc based on inverse surfacethresholding, Journal of Medical Systems (2011),
on of exudates and macula for grading of diabetic macular edema,pb.2014.01.010
http://dx.doi.org/10.1007/s10916-011-9659-4.[32] Y. Freund, R.E. Schapire, A Decision-Theoretic Generalization
of on-Line Learning and an Application to Boosting, 1995.
ARTICLE IN PRESSCOMM-3746; No. of Pages 12
s i n
12 c o m p u t e r m e t h o d s a n d p r o g r a m[33] L. Breiman, Bagging predictors, Machine Learning 24 (2)(1996) 123–140.
[34] R. Bryll, Attribute bagging: improving accuracy of classifierensembles by using random feature subsets, Pattern
Please cite this article in press as: M.U. Akram, et al., Automated detectiComput. Methods Programs Biomed. (2014), http://dx.doi.org/10.1016/j.cm
Recognition 20 (6) (2003) 1291–1302.[35] K.W. Tobin, E. Chaum, V. Priya Govindasamy, et al., Detection
of anatomic structures in human retinal imagery, IEEETransactions on Medical Imaging 26 (12) (2007).
b i o m e d i c i n e x x x ( 2 0 1 4 ) xxx–xxx
[36] K.S. Chin, E. Trucco, L. Tan, P.J. Wilson, Automatic fovealocation in retinal images using anatomical priors andvessel density, Pattern Recognition Letters 34 (2013)1152–1158.
on of exudates and macula for grading of diabetic macular edema,pb.2014.01.010
[37] A. Aquino, M.E. Gegundez, D. Marin, Automated Optic discdetection in retinal images of patients with diabeticretinopathy and risk of macular edema, InternationalJournal of Biological and Life Sciences 8 (2) (2012) 87–92.